
Experimental Study of an Intensity Modulated Fiber-Optic Position Sensor With a Novel Readout System
9
IEEE SENSORS JOURNAL, VOL. 8, NO. 7, JULY 2008 1105 Experimental Study of an Intensity Modulated Fiber-Optic Position Sensor With a Novel Readout System Johan Jason, Hans-Erik Nilsson, Bertil Arvidsson, and Anders Larsson Abstract—An intensity modulated fiber-optic position sensor, based on a fiber to bundle coupling and a readout system using a CMOS image camera together with fast routines for position extraction and calibration, is experimentally demonstrated. Fur- ther, a simulation of the complete sensor system setup is made, and possible sources of error are analyzed experimentally. Our analysis indicates the theoretical limit of the system and identifies the causes of system errors. The results are encouraging for further development of the system setup. Index Terms—Image sensors, intensity modulation, optical fiber transducers, optical position measurement. I. INTRODUCTION S ENSING in many industrial environments may suffer from electromagnetic disturbance, making conventional electronic sensing troublesome. In such environments, optical fiber technology can provide suitable sensor solutions, where measurement and/or signal transmission is performed in the optical domain. Optical fiber sensors for position, displacement, and vibration measurements often rely on micrometer precision, and careful calibration is often needed for optimal performance. Typical ex- amples are intensity-modulated sensors based on coupling be- tween aligned fibers or fibers and integrated waveguides [1]–[3]. Such position sensitive sensors rely on microalignment of the fibers using, for example, etched V-grooves in silicon. Although the sensor principle is very simple and the construction seems cost-effective, the microalignment adds cost and complexity. An alternative solution is to use coupling between a single fiber and a fiber bundle or a multicore fiber, utilizing a CMOS pixel de- tector for read-out, see Fig. 1. In this case, the demand for align- ment is relaxed significantly. Multicore fibers are usually more Manuscript received August 2, 2007; revised December 11, 2007; accepted January 1, 2008. Published July 16, 2008 (projected). This work was supported in part by KK-Stiftelsen (the Knowledge Foundation), Sweden. The associate editor coordinating the review of this paper and approving it for publication was Prof. Jose Lopez-Higuera. J. Jason is with the Department of Information Technology and Media, Mid Sweden University, SE-851 70 Sundsvall, Sweden. He is also with Fiberson AB, SE-824 11 Hudiksvall, Sweden (e-mail: [email protected]). H.-E. Nilsson is with the Department of Information Technology and Media, Mid Sweden University, SE-851 70 Sundsvall, Sweden (e-mail: hans-erik. [email protected]). B. Arvidsson is with the Department of Information Technology and Media, Mid Sweden University, SE-851 70 Sundsvall, Sweden. He is also with Eric- sson Network Technologies AB, SE-824 82 Hudiksvall, Sweden (e-mail: bertil. [email protected]). A. Larsson is with Fiberson AB, SE-824 11 Hudiksvall, Sweden (e-mail: an- ders.larsson@fiberson.se). Digital Object Identifier 10.1109/JSEN.2008.926522 Fig. 1. Schematic configuration of the sensor system setup. The fiber bundle is coupled directly onto the CMOS image sensor of the camera. expensive than standard fibers, but good performance can also be obtained using a standard fiber bundle or a stack of fiber rib- bons. In this case, the pixel structure, i.e., the image of the fiber cores and the fiber geometry at the fiber-to-bundle coupling, is not fully regular and additional image processing is needed. As long as the pixel structure is stable over time, such solutions may though be very cost efficient. The pixel structure is allowed to be different in each end of the fiber bundle and detailed knowledge of the pixel structures at both ends is needed in order to recon- struct the image data. The additional complexity of this system calls for careful calibration and data extraction procedures. This complexity influences the accuracy of the system and simple es- timation of the system performance becomes difficult. A few established techniques might be considered when looking for a lateral position sensing solution, i.e., measure- ment of the position change in a plane perpendicular to the optical axis. Some examples are noncontact methods using a position sensitive detector (PSD) [4] or a charge-coupled device (CCD) camera [5], or fiber-optic techniques using coupling based intensity-modulation, originally designed for vibration measurements [2], [6], [7]. The PSD is photodetector with two gates where the ratio be- tween the currents flowing to the gates is proportional to the position of the light spot. The position measurement of the PSD is thus independent of the intensity of the light. PSDs can be found as components in many industrial position sensing appli- cations. The main advantages of the PSD are the high sampling frequency (10 kHz–10 MHz depending on its size) and high res- olution (1–2 for standard size PSDs) [8]. One disadvantage 1530-437X/$25.00 © 2008 IEEE
-
Upload
independent -
Category
Documents
-
view
0 -
download
0
Transcript of Experimental Study of an Intensity Modulated Fiber-Optic Position Sensor With a Novel Readout System
IEEE SENSORS JOURNAL, VOL. 8, NO. 7, JULY 2008 1105
Experimental Study of an Intensity ModulatedFiber-Optic Position Sensor With
a Novel Readout SystemJohan Jason, Hans-Erik Nilsson, Bertil Arvidsson, and Anders Larsson
Abstract—An intensity modulated fiber-optic position sensor,based on a fiber to bundle coupling and a readout system usinga CMOS image camera together with fast routines for positionextraction and calibration, is experimentally demonstrated. Fur-ther, a simulation of the complete sensor system setup is made,and possible sources of error are analyzed experimentally. Ouranalysis indicates the theoretical limit of the system and identifiesthe causes of system errors. The results are encouraging forfurther development of the system setup.
Index Terms—Image sensors, intensity modulation, optical fibertransducers, optical position measurement.
I. INTRODUCTION
S ENSING in many industrial environments may sufferfrom electromagnetic disturbance, making conventional
electronic sensing troublesome. In such environments, opticalfiber technology can provide suitable sensor solutions, wheremeasurement and/or signal transmission is performed in theoptical domain.
Optical fiber sensors for position, displacement, and vibrationmeasurements often rely on micrometer precision, and carefulcalibration is often needed for optimal performance. Typical ex-amples are intensity-modulated sensors based on coupling be-tween aligned fibers or fibers and integrated waveguides [1]–[3].Such position sensitive sensors rely on microalignment of thefibers using, for example, etched V-grooves in silicon. Althoughthe sensor principle is very simple and the construction seemscost-effective, the microalignment adds cost and complexity. Analternative solution is to use coupling between a single fiber anda fiber bundle or a multicore fiber, utilizing a CMOS pixel de-tector for read-out, see Fig. 1. In this case, the demand for align-ment is relaxed significantly. Multicore fibers are usually more
Manuscript received August 2, 2007; revised December 11, 2007; acceptedJanuary 1, 2008. Published July 16, 2008 (projected). This work was supportedin part by KK-Stiftelsen (the Knowledge Foundation), Sweden. The associateeditor coordinating the review of this paper and approving it for publication wasProf. Jose Lopez-Higuera.
J. Jason is with the Department of Information Technology and Media, MidSweden University, SE-851 70 Sundsvall, Sweden. He is also with Fiberson AB,SE-824 11 Hudiksvall, Sweden (e-mail: [email protected]).
H.-E. Nilsson is with the Department of Information Technology and Media,Mid Sweden University, SE-851 70 Sundsvall, Sweden (e-mail: [email protected]).
B. Arvidsson is with the Department of Information Technology and Media,Mid Sweden University, SE-851 70 Sundsvall, Sweden. He is also with Eric-sson Network Technologies AB, SE-824 82 Hudiksvall, Sweden (e-mail: [email protected]).
A. Larsson is with Fiberson AB, SE-824 11 Hudiksvall, Sweden (e-mail: [email protected]).
Digital Object Identifier 10.1109/JSEN.2008.926522
Fig. 1. Schematic configuration of the sensor system setup. The fiber bundle iscoupled directly onto the CMOS image sensor of the camera.
expensive than standard fibers, but good performance can alsobe obtained using a standard fiber bundle or a stack of fiber rib-bons. In this case, the pixel structure, i.e., the image of the fibercores and the fiber geometry at the fiber-to-bundle coupling, isnot fully regular and additional image processing is needed. Aslong as the pixel structure is stable over time, such solutions maythough be very cost efficient. The pixel structure is allowed to bedifferent in each end of the fiber bundle and detailed knowledgeof the pixel structures at both ends is needed in order to recon-struct the image data. The additional complexity of this systemcalls for careful calibration and data extraction procedures. Thiscomplexity influences the accuracy of the system and simple es-timation of the system performance becomes difficult.
A few established techniques might be considered whenlooking for a lateral position sensing solution, i.e., measure-ment of the position change in a plane perpendicular to theoptical axis. Some examples are noncontact methods using aposition sensitive detector (PSD) [4] or a charge-coupled device(CCD) camera [5], or fiber-optic techniques using couplingbased intensity-modulation, originally designed for vibrationmeasurements [2], [6], [7].
The PSD is photodetector with two gates where the ratio be-tween the currents flowing to the gates is proportional to theposition of the light spot. The position measurement of the PSDis thus independent of the intensity of the light. PSDs can befound as components in many industrial position sensing appli-cations. The main advantages of the PSD are the high samplingfrequency (10 kHz–10 MHz depending on its size) and high res-olution (1–2 for standard size PSDs) [8]. One disadvantage
1530-437X/$25.00 © 2008 IEEE

1106 IEEE SENSORS JOURNAL, VOL. 8, NO. 7, JULY 2008
is the possible impact of stray light on the position measure-ment. However, modified PSDs have solved this problem [9].
The CCD sensor records the light intensity in each pixelby means of charge-coupling, i.e., the charges are transferredto a second bank of photosites before they are sent out foranalog-to-digital conversion. Position measurement can be per-formed through calculation of the center of gravity of the lightdistribution. One of the main advantages is that discriminationof stray light reaching the sensor region outside the light spotcan be made by setting a background level in the data analysis.
Unlike the CCD sensor, the CMOS image sensor is not cou-pled. Instead it has amplifiers and output circuitry connectedto each pixel. The advantages of CMOS image sensors overCCD:s are the combination of auxiliary circuitry on the samechip, lower fabrication cost and less power consumption [10].
A simulation model has been developed for design and per-formance study of a lateral position sensor system based on cou-pling between a transmitting fiber and a receiving fiber bundleand CMOS image sensor. The simulation results achieved haveindicated that high-resolution, large measurement range sensorscan be realized provided the system is stable over time [11]. Thesimulation results have encouraged the setup of an experimentalsystem for evaluation purposes.
In this paper, we describe the sensor system setup, includingsoftwarealgorithmsforautomaticcalibrationanddataextraction.An experimental setup based on standard components is studied,and a model for simulation of the system performance is used forcomparison. Experimental data and simulation results are com-pared and an analysis of the possible error sources and their esti-mated magnitude is made. Furthermore, methods of error correc-tion and performance improvements in the setup are discussed.
II. MODEL OF THE SENSOR SYSTEM
The model of the sensor system setup, see Fig. 1, includescoupling of optical power between the transmitting fiber and theindividual cores of the receiving fiber bundle, as well as detec-tion of the immediate near-field light intensity distribution fromthe cores of the fiber bundle at the CMOS image sensor. An au-tomatic calibration procedure and a fast position extraction algo-rithm used in the experimental readout system are implementedin the simulator. Thus, the model evaluates both the hardwaresetup and the software algorithms and provides an estimate ofthe system performance of the entire sensor solution [11].
A. Coupling of Light From Transmitting Fiber to Fiber BundleCores
Themodeledfiberbundlegeometryisasquarematrixofcores, or a fiber array of cores, separated by a certain dis-tance . Normal, manufacturing-related deviations in the geom-etry are modeled by setting a standard deviation of the core po-sitions in the matrix. The core separation of the fiber bundleis preferably kept to a minimum in order to minimize the needto broaden the power distribution from the transmitting fiber.
A Gaussian expression can be used to describe the modula-tion function, i.e., the coupled power as a function ofthe bundle fiber core center position :
(1)
where are the coordinates of the transmitting fibercenter, the coupled power at zero offset, and the Gaussianwidth, or characteristic radius, of the distribution [11], [12]. Inthis paper, we define as a measure of the radius of the powerdistribution, not to be confused with the radius of the electricfield distribution.
Another possible expression is a model for the near-fieldpower distribution from a graded-index multimode fiber [13]:
(2)
for and for, where is the radius of the intensity spot and
the other parameters as in (1).The model parameters and or are determined experi-
mentally, as described in Section III, using the fibers chosen forthe real application.
B. Detection of Fiber Bundle Core Intensities at the CMOSImage Sensor
The output near-field intensity distributions from the cores ofthe fiber bundle can be described using expressions similar to(1) or (2). Given the positions of the fiber cores at the cameraend (C-end) of the fiber bundle, the intensity values of the pixelswithin a defined search radius from each core center are addedto get the coupled power in each core. A detailed knowledge ofthe near-field power distribution from the bundle fiber cores isnot important; the main objective is that the power distributionis continuously decreasing from the core center and outwards.
C. Calibration Procedure
In order for the extraction procedure to work properly, thecenter positions of the cores at both ends of the fiber bundleneed to be calibrated. This is done by illuminating all cores inthe fiber bundle and recording the image of the opposite end.Further searching for local maxima in the recorded images areperformed and the center position for each core is ex-tracted using a weighted average expressed by
(3)
with and being the image sensor pixel indices, therecorded intensity in pixel , and being thecenter of pixel .
D. Position Extraction Algorithm
The first stage in the position extraction algorithm, see Fig. 2,is to generate a first approximation of the transmitting fiber po-sition . This is made through a weighted average of thepixel intensities in the image of the fiber bundle end using (3).
In the second stage, calculation of the optical power emittedfrom each core in the fiber bundle is performed. For each corethis is done by summing the intensities in all pixels within acertain search radius from the core center. Next, the power ineach core is assigned to the core coordinates of the other end ofthe bundle, the receiving end (R-end). Finally, an unconstrained

JASON et al.: EXPERIMENTAL STUDY OF AN INTENSITY MODULATED FIBER-OPTIC POSITION SENSOR WITH A NOVEL READOUT SYSTEM 1107
Fig. 2. Algorithm flowchart for the position extraction routine.
Fig. 3. Drawing of an encapsulated 12-fiber ribbon, showing the dual coatinglayers and the thin color layers of the fibers, surrounded by the ribbon matrixmaterial. All materials are UV-cured acrylate resins.
nonlinear optimization (UNLO) scheme using a simplex searchmethod [14] is employed to find the transmitting fiber position
from the raw position estimate (3), the recorded powerdistribution at the R-end, and the modeled power distribution (1)or (2) from the transmitting fiber. The search method allows foroptimization with respect to several parameters, which meansthat besides , any of the parameters and or canvary. This makes the model less sensitive to differences in themodulation function between the cores in the fiber bundle.
In the simulation studies reported on earlier [11], theGaussian power model (1) has consequently been used. For thestudy under scope in this paper, also the second model (2) isused in the extraction algorithm in order to study the sensitivityof the system to the choice of extraction model.
III. EXPERIMENTAL SETUP
The sensor system setup, shown in Fig. 1, consists of thefollowing principal hardware components: a continuous lightsource, a transmitting fiber, a fiber bundle, and a CMOS camera.The setup is made on an optical breadboard. The sensor systemis interrogated by a computer with software algorithms forimage acquisition, calibration, and position extraction.
The experimental setup is aimed at study of the movement inthe horizontal direction, i.e., along the axis. In the algorithmsused for position extraction the vertical movement is, therefore,set to zero by default, and extraction of the position only alongthe axis is made.
A. Light Source
The light source used is an Agilent Technologies HFBR-1528transmitter based on a light-emitting diode (LED) with a wave-length of 650 nm, a FWHM of 30 nm and a typical numericalaperture (NA) of 0.5. The LED is operated at normal room tem-perature at a constant forward voltage of 2.1 V resulting in aforward current of 60 mA and a typical coupled output powerof 0.05 mW (200 core fiber with an NA of 0.5).
Fig. 4. Ribbon end geometries for (a) receiving end and (b) camera end.
An LED is chosen since overfilled launch of the transmittingfiber is needed in order to get a broad, uniform and stable powerdistribution over the receiving fiber bundle cores. Furthermore,the LED is to prefer in terms of sensor system cost.
B. Transmitting Fiber
The transmitting fiber is a 5 m long multimode step-indexsilica fiber with a core diameter of 200 , a cladding diameterof 240 , and a numerical aperture of 0.22. The fiber has aHCS (hard clad silica) coating of 260 diameter, surroundedby an ETFE (ethylene tetrafluoroethylene) buffer up to 375 .The fiber ends are stripped, cleaned and cleaved in conventionalways leaving about 5 mm bare ends. One end is inserted into aplastic tube mounted in a connector compatible with the trans-mitter housing, letting the fiber end coming into contact withthe lens in front of the LED. The other end is mounted in a mag-netic fiber holder which is secured firmly on the -translationstage, leaving a free fiber end of about 1 mm outside the holder.The -stage has a digital position readout allowing positionchanges to be made in 1 steps. The transmitting fiber is setinto an axial ( axis) offset of 3000 to the fiber bundle re-ceiving end, thereby increasing the width of the optical field atthe fiber bundle end to reach over several cores.
C. Fiber Bundle
The fiber bundle used is a 5 m long encapsulated 12-fiberribbon (see Fig. 3) containing standard single-mode fiber(ITU/T G.652). The fibers have a typical core diameter of8.3 , a cladding diameter of 125 , and a core-to-coredistance of typically 250 in the ribbon. The ribbon ends arestripped, cleaned, and cleaved using conventional ribbon prepa-ration tools. Cleaving is made so that only about 1 mm barefiber is protruding from the ribbon matrix, and the receiving end(R-end) of the ribbon is mounted in a magnetic holder leavingabout 1 mm of ribbon matrix outside the holder. The holderis secured firmly on a fixed stage opposite the -stage. Theother end (C-end) is mounted in a magnetic ribbon holder justin front of the camera on a stage adjustable in the -direction.The position of the C-end is adjusted so it is in direct contactwith the pixel structure. In order to achieve this, about 5 mm ofribbon is protruding from the holder. The geometries of bothribbon ends, mounted in their holders on the camera stage,are shown in Fig. 4. The core position standard deviation iscalculated using the calibration procedure, see Section IV.

1108 IEEE SENSORS JOURNAL, VOL. 8, NO. 7, JULY 2008
D. CMOS Camera
The camera used in the experimental setup is an ElphelNC333L network camera with a Micron MT9M001 mono-chrome CMOS image sensor, having 1280 pixels 1024pixels of size . The protection window ofthe image sensor has been removed to enable detection of theimmediate near-field optical intensity from the fiber bundlecores. Setting of camera parameters such as gain and shuttertime and activation or deactivation of certain pixels are madefrom the computer, but these features can also be controlledfrom program sequences that are stored in the camera.
A protection cover is used to prevent stray light from reachingthe image sensor. Due to the high sensitivity of the sensor, thegain of the camera is set to 1, corresponding to a gain registerhexadecimal value of 8 [15]. Setting of the shutter time is madeby looking at the intensity profile and the pixel values over thefiber cores at illumination with the transmitting fiber. We havefound that a shutter time register hexadecimal value of 70 givessatisfactory intensity profiles.
For the setup studied a pixel region of 600 pixels 70 pixels,i.e., , is selected from each image. The back-ground contribution, recorded with the light source turned off, issubtracted in order to minimize noise in terms of pixel intensityvalues resulting from defective pixels, i.e., electronic noise, orfrom stray light reaching the image sensor. The selected pixelregion builds the basis for the coordinate system used in thereadout system.
IV. EXPERIMENTS AND RESULTS
The experimental work carried out started with the funda-mental measurement of the modulation function and the cali-bration of core center positions in the fiber ribbon, that wereneeded for the final setup of the system. Further, the system wastested by setting the transmitting fiber into a number of offsetpositions and extracting the positions using the readout system.
A. Measurement of the Modulation Function of the System
In order to be able to use the extraction algorithm, the modu-lation function for the fiber setup must be determined at the axialoffset chosen for the system. This can be made in two ways: ei-ther by using an optical power meter and measuring the powercoupled to a single fiber in the fiber bundle [11], or by using theCMOS camera and performing intensity counting in all pixelsreferring to a single fiber in the fiber bundle. From sensitivitypoint-of-view, the CMOS camera is a better way when small di-ameter fiber cores are involved, since much of the power is lostin the connection between the transmitting fiber and the fiberbundle cores.
The zero position of the transmitting fiber was adjusted formaximum intensity in the receiving fiber. In. Fig. 5, the mod-ulation function measured with the CMOS camera for an axialoffset of 3000 is shown together with curve fits using (1) and(2). The curve fit parameters are listed in Table I. Other fibersin the ribbon acting as the receiving fiber give similar results.It can be seen from Fig. 5 that the polynomial fit using (2) bestfollows the measured data over the whole data range, while theGaussian fit using (1) deviates at higher offsets. Centering ofthe data is included in the fitting procedure. The characteristic
Fig. 5. Measured modulation function with curve fits for an axial offset of3000 �� between the transmitting fiber and the fiber ribbon.
TABLE IMODULATION FUNCTION CURVE FIT PARAMETERS
shoulders that the measured curve exhibits are due to the modedistribution associated with the specific measurement setup. Themodulation curve is however stable and repeatable to a satisfac-tory degree. The shoulder shape has not been included in themodel, since this gives a more complicated extraction algorithmwith more model parameters. A shape-preserving interpolationfunction together with the measured data is an alternative, but toour experience this does not improve the performance. The latteralso means that there are no degrees of freedom in the data fit totake care of any differences in coupling to individual cores.
B. Calibration of Core Positions at Fiber Bundle Ends
In order to calibrate the core positions at each end of the fiberribbon, all cores of the opposite end were illuminated with thetransmitting fiber by increasing the axial offset about 10 mm.After recording images of C-end, R-end, and background, thecalibration procedure described in Section II was used to extractthe coordinates for each core center at both ends of the ribbon.The coordinates were stored for use in the position extractionalgorithm (see Section II) in the experimental setup. An estimateof the core deviation compared to a perfect 12-fiber array wasmade by calculating the standard deviation of the -coordinatesfor each end, resulting in standard deviations of 14 for theR-end and 15 for the C-end.
C. Calibration of Transmitting Fiber Zero Position
The transmitting fiber zero position was extracted using thestandard position extraction routines along both axes. A first ap-proximation was given by the image intensity weighted averageof (3), resulting in a zero position .
The weighted average approximation is satisfactory for thisstudy, but for a more precise value it should be followed bya subsequent position extraction algorithm using the UNLOscheme and the receiving end core positions.
JASON et al.: EXPERIMENTAL STUDY OF AN INTENSITY MODULATED FIBER-OPTIC POSITION SENSOR WITH A NOVEL READOUT SYSTEM 1109
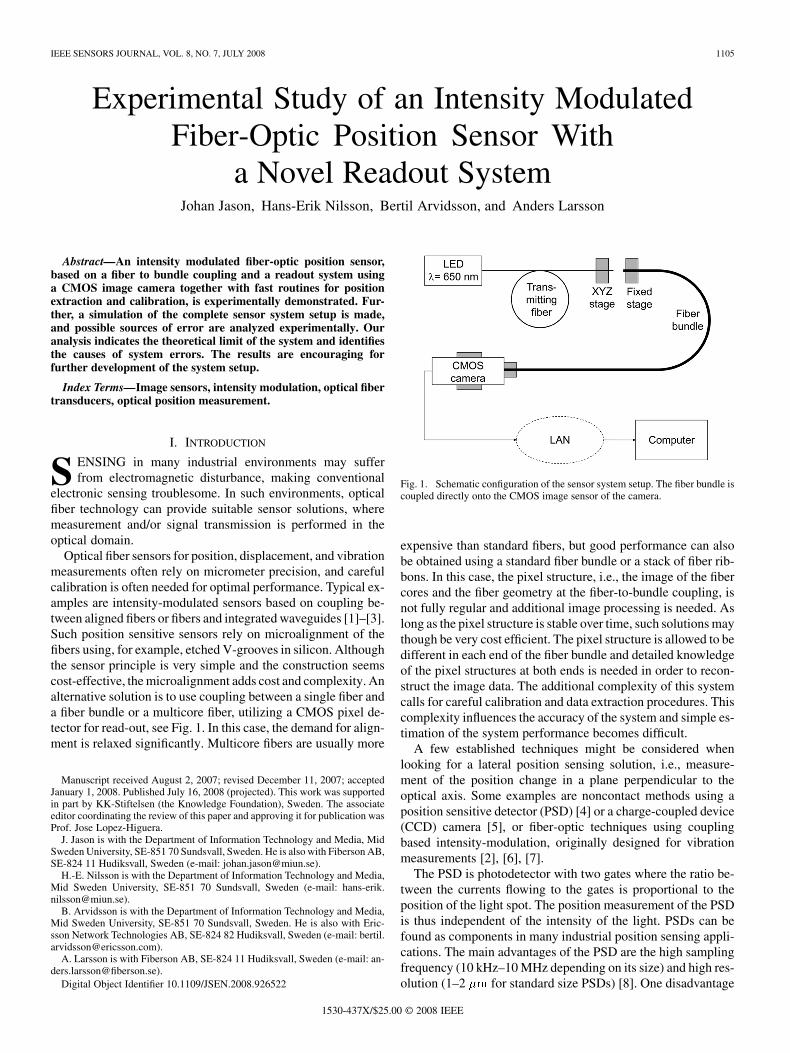
Fig. 6. Intensity image measured at an offset of ���� ��.
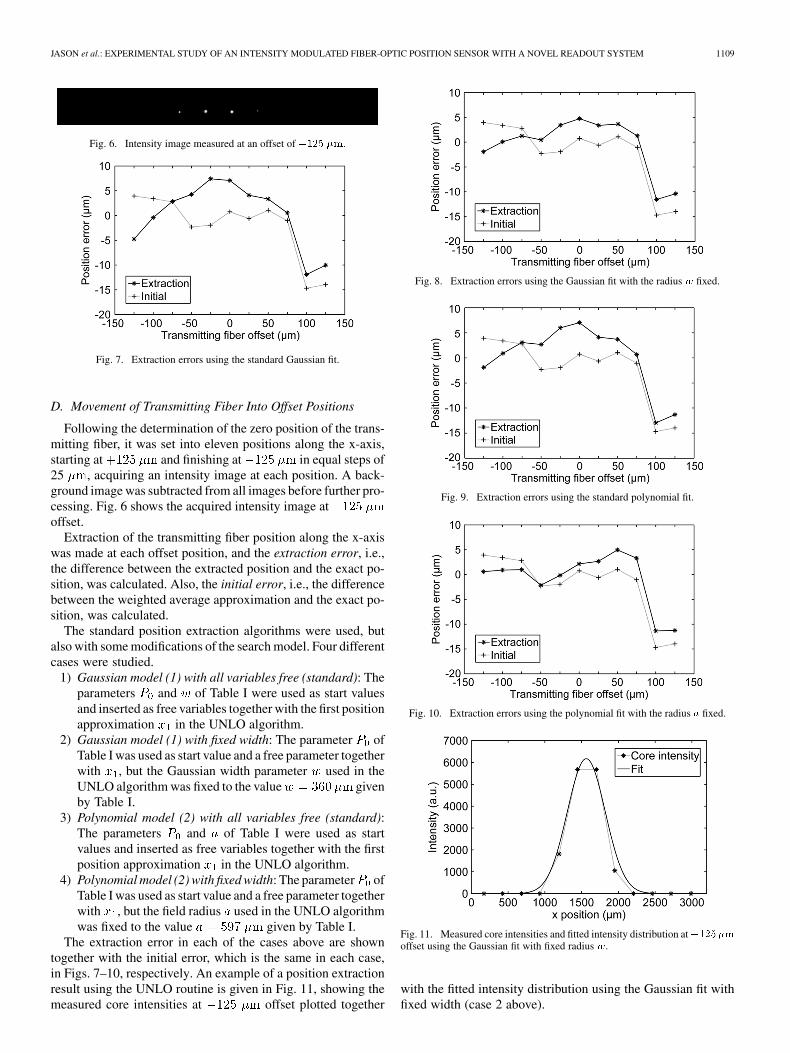
Fig. 7. Extraction errors using the standard Gaussian fit.
D. Movement of Transmitting Fiber Into Offset Positions
Following the determination of the zero position of the trans-mitting fiber, it was set into eleven positions along the x-axis,starting at and finishing at in equal steps of25 , acquiring an intensity image at each position. A back-ground image was subtracted from all images before further pro-cessing. Fig. 6 shows the acquired intensity image atoffset.
Extraction of the transmitting fiber position along the x-axiswas made at each offset position, and the extraction error, i.e.,the difference between the extracted position and the exact po-sition, was calculated. Also, the initial error, i.e., the differencebetween the weighted average approximation and the exact po-sition, was calculated.
The standard position extraction algorithms were used, butalso with some modifications of the search model. Four differentcases were studied.
1) Gaussian model (1) with all variables free (standard): Theparameters and of Table I were used as start valuesand inserted as free variables together with the first positionapproximation in the UNLO algorithm.
2) Gaussian model (1) with fixed width: The parameter ofTable I was used as start value and a free parameter togetherwith , but the Gaussian width parameter used in theUNLO algorithm was fixed to the value givenby Table I.
3) Polynomial model (2) with all variables free (standard):The parameters and of Table I were used as startvalues and inserted as free variables together with the firstposition approximation in the UNLO algorithm.
4) Polynomial model (2) with fixed width: The parameter ofTable I was used as start value and a free parameter togetherwith , but the field radius used in the UNLO algorithmwas fixed to the value given by Table I.
The extraction error in each of the cases above are showntogether with the initial error, which is the same in each case,in Figs. 7–10, respectively. An example of a position extractionresult using the UNLO routine is given in Fig. 11, showing themeasured core intensities at offset plotted together
Fig. 8. Extraction errors using the Gaussian fit with the radius � fixed.
Fig. 9. Extraction errors using the standard polynomial fit.
Fig. 10. Extraction errors using the polynomial fit with the radius � fixed.
Fig. 11. Measured core intensities and fitted intensity distribution at������offset using the Gaussian fit with fixed radius �.
with the fitted intensity distribution using the Gaussian fit withfixed width (case 2 above).

1110 IEEE SENSORS JOURNAL, VOL. 8, NO. 7, JULY 2008
TABLE IIPARAMETERS FOR SIMULATION OF EXPERIMENTAL SETUP
MF = Modulation function used in the model, given by (1).
Fig. 12. Simulated core positions using the parameters of Table II.
V. SIMULATION AND RESULTS
The simulation model has proved to be a powerful tool inmodeling different geometries and setups [11]. By transferringthe hardware parameters of the actual experimental setupinto the model, the theoretical extraction performance can beestimated.
A. Simulation Parameter Settings
The essential parameters for simulating the experimentalsetup are listed in Table II. Geometrical parameters such asthe core-to-core distance , the standard deviation of the corepositions , the selected pixel region , and the pixel size
are necessary to define the coordinate system for the setup.The parameters and , describing the Gaussian model givenby (1) for the modulation function, have the same values as inthe experimental setup. For the position extraction the UNLOalgorithm is used with the Gaussian fit, setting both andas free parameters. For the imaging of the core intensities at thecamera end, an output Gaussian field radius is associatedwith the fiber cores of the ribbon.
B. Simulation Results
With the parameter settings described previously and inTable II, the transmitting fiber was set into the same zero po-sition as in the experimental setup. After the ribbongeometry and the optical field distribution had been created inthe simulator (see Fig. 12), the transmitting fiber was set intoeleven positions along the axis, starting at andfinishing at in equal steps of 25 .
Extraction of the position along the x-axis was made at eachoffset position, and the extraction and initial errors were calcu-lated and plotted. The results are shown in Fig. 13.
VI. ANALYSIS OF POSSIBLE ERROR SOURCES
A. Pixel Value Uncertainty
The extraction result is influenced by pixel value uncertaintyarising from noise in the image sensor. The noise can be mini-
Fig. 13. Extraction errors, using the standard Gaussian fit, for a simulated ver-sion of the experimental setup.
Fig. 14. Distribution of (a) the initial position approximation and (b) the ex-tracted position for 100 images with the transmitting fiber in zero position.
mized by keeping the camera gain low and the shutter time asshort as possible.
The influence of pixel value uncertainty on the position ex-traction for the actual setup was evaluated by taking a largenumber (one hundred) of images with the transmitting fiber ina fixed position. The time interval between each image acquisi-tion was 2 s. For each of the images taken a background imagewas subtracted, based on a mean of one hundred backgroundimages, and the experimental setup extraction routine was usedto extract the position. In Fig. 14, the distributions of the initial(weighted average) and extracted (UNLO algorithm) positionsare shown for the transmitting fiber in the zero position. Thedistributions show the deviation from the mean value. Fig. 15shows the same distributions but for images taken at the trans-mitting fiber offset position .

JASON et al.: EXPERIMENTAL STUDY OF AN INTENSITY MODULATED FIBER-OPTIC POSITION SENSOR WITH A NOVEL READOUT SYSTEM 1111
Fig. 15. Distribution of (a) the initial position approximation and (b) the ex-tracted position for 100 images with the transmitting fiber at ���� �� offset.
The typical standard deviations for the distributions are0.5 , and the maximum error is essentially kept within .
B. Stability of the Core Positions
The perhaps most important parameter for the precision ofthe position extraction is the stability of the core positions inboth ends of the fiber bundle. Position stability means that thecores should maintain their positions in the coordinate systemreferenced by the image sensor pixel structure.
Core position changes can be caused by smaller events suchas temperature and tension changes, especially when bundledfibers, e.g., ribbons are used. The mounting devices used mustalso be designed to keep the fibers firmly in their positions andthe complete bundle itself fixed to the pixel structure.
An experimental analysis of the stability of the core positionswas carried out by repeating the core position calibration pro-cedure on the camera end of the fiber ribbon. The changes inthe horizontal ( ) and the vertical ( ) directions were calculatedat each measurement. In Fig. 16, the position changes for eachcore after 1.5 h, 9 h, and 22 h are plotted for both directions.
The standard deviation of the position change over timeamong the ribbon cores is up to 1.7 in the -direction,and up to 0.7 in the -direction. The maximum changeover time is essentially within in the -direction andwithin in the -direction.
VII. DISCUSSION
The extraction results from the experimental setup(Figs. 7–10) clearly do not match the result from the sim-ulated setup (Fig. 13), especially at the offsets ofand . A closer look into the search sequence howevershow that the UNLO algorithm works well, also does the
Fig. 16. Changes of the ribbon core positions over time in (a) horizontal direc-tion and (b) vertical direction.
weighted average initial approximation, and this indicates thatthe large errors shown are systematic errors. It can be noted thatthe extraction errors are smaller when the width of the powerdistribution model is locked (Figs. 8 and 10) compared to whenit is a free variable in the search routine (Figs. 7 and 9). Thepower model using the polynomial fit (2) seems to give slightlysmaller errors than the model using the Gaussian fit (1), but thedifference is not obvious (Figs. 9 and 10 to be compared withFigs. 7 and 8, respectively).
The error source analysis performed show that the pixel valueuncertainty does not cause any large extraction errors (Figs. 14and 15). The typical standard deviations of 0.5 and the max-imum error essentially within are on a level with thesimulation results shown in Fig. 13. This is also to be expectedsince the pixel noise is the only error source that is modeled inthe simulator.
A more threatening error in the actual setup is the coreposition instability over time, which seems to be larger in the
-direction [Fig. 16(b)] than in the -direction [Fig. 16(a)].This could be explained by the ribbon design, where the fiberssupport each other to be lined up in the -direction. Due tothe breakout feature of the ribbon, intended for simplifiedindividual fiber access, the ribbon matrix material easily splitsduring clamping and unclamping of the cleaved ends, whichaccelerates the position change in the -direction. The standarddeviations (0.7 and 1.7 ) and maximum values (1.5 and2.5 ) of the position change in the - and -directions overtime give radial position changes of up to 3 , or about 2based on standard deviations. These errors clearly have animpact on the measurement setup results shown in Figs. 7–10.

1112 IEEE SENSORS JOURNAL, VOL. 8, NO. 7, JULY 2008
The results discussed lead to the conclusion that the mostprobable cause of the error experienced in the experimentalsetup is any kind of change in the core positions. The presentsetup makes disturbance of the ribbon geometry at the re-ceiving end almost unavoidable. A solution to this could be touse ribbon connectors (MT connectors) in which the fibers arefixed in precise positions. The use of MT connectors, whichhave flat, polished end-faces, also simplifies the handling of theribbon ends and aids firm positioning of the cores relative tothe pixel structure.
It should also be noted that the present experimental setupresults in essentially four cores being illuminated (see Figs. 6and 11). This means that the power distribution in the searchroutine is fitted to four intensity values. Even though the simu-lated version works with this configuration, the extraction in thereal setup would be better if more cores were illuminated. To re-alize this, either the core-to-core distance in the bundle shouldbe smaller, or the width of the optical field from the transmittingfiber should be larger. As mentioned in Section IV, the measuredmodulation function for the actual setup indicates a dependenceof the modal distribution in the setup. Since the extraction al-gorithm searches for the central point of the distribution, this ishowever not a problem for the sensor system as long as the dis-tribution is stable and symmetric.
VIII. CONCLUSION
We have experimentally demonstrated the performance of acoupling-based intensity modulated fiber-optic sensor with anovel readout system using a CMOS camera and fast routinesfor extraction and calibration.
The position extraction performed using the experimentalsetup showed that the extraction routines worked for the exper-imental images, but that the extraction errors were larger in thiscase than for the simulated setup of the system.
Two error sources in the system were identified and analyzedexperimentally: the pixel value uncertainty due to noise in theimage sensor, and the instability of bundle core positions. It wasfound that the pixel value uncertainty could cause errors within1 , which is also shown in the simulations. This error setsthe theoretical limit of the system. The bundle core position in-stability, estimated to be within 3 , is in the long term theerror that prevents the present system from reaching the simu-lated results.
The important conclusion from the above is that the cores ofthe fiber bundle must be kept in a more fixed position with re-spect to the pixel structure. Future work should, therefore, con-centrate on setting up an experimental system where the fibercores are completely fixed in their holders and where the holderscan be placed accurately and firmly in alignment with the pixelstructure.
Another subject to look deeper into is the power transfer be-tween the transmitting fiber and the fiber bundle. The impactof a wider optical field, and thereby more intensity data points,on the extraction results should be tested in the experimentalsetup. Furthermore, it should be investigated if any differencesbetween the fibers, such as mode coupling behavior, may havean impact on the power transfer to individual fibers.
REFERENCES
[1] E. Ollier, P. Labeye, and P. Mottier, “Integrated micro-opto-mechan-ical vibration sensor connected to optical fibres,” Electron. Lett., vol.33, pp. 525–526, 1997.
[2] J. M. López-Higuera, A. Cobo, M. A. Morante, J. Echevarría, J. L.Arce, M. Lomer, and R. López, “New low cost fiber optic accelerom-eter system for stator winding monitoring of hydroelectric generatingmachines,” Proc. SPIE, vol. 2868, pp. 510–515, 1996.
[3] M. Kimura and K. Toshima, “A new type optical fiber vibra-tion-sensor,” in Proc. 1997 Int. Conf. Solid-State Sensors andActuators, Chicago, IL, 1997, pp. 1225–1228.
[4] A. J. Makynen, J. T. Kostamovaara, and R. A. Myllylä, “A high-res-olution lateral displacement sensing method using active illuminationof a cooperative target and a focused four-quadrant position-sensitivedetector,” IEEE Trans. Instrum. Meas., vol. 44, pp. 46–52, Feb. 1995.
[5] X. Liu and Y. Gu, “Design of the integrated sensor system fortwo-dimensional position based on CCD,” Proc. SPIE, vol. 3897, pp.214–222, 1997.
[6] M. A. Morante, A. Cobo, and J. M. López-Higuera, “A biaxial opticalfiber sensor for measuring acceleration in harsh environments,” in Proc.IEEE LEOS Annu. Meeting ’96, Boston, MA, 1996, pp. 240–241.
[7] C. Doyle, “Two-axis optical fiber accelerometer,” J. Mater. Sci. Lett.,vol. 19, no. 11, pp. 959–961, Jun. 2000.
[8] L. Stenberg, The PSD School, Section 1. [Online]. Available: http://www.sitek.se
[9] What’s a PSD, Section NT PSD, SiTek AB. [Online]. Available: http://www.sitek.se
[10] Computer Desktop Encyclopedia The Computer Language Company,Inc., 2007, eeProductCenter. [Online]. Available: http://www.eepro-ductcenter.com/encyclopedia
[11] J. Jason, H.-E. Nilsson, B. Arvidsson, and A. Larsson, “Monte Carlosimulation of the performance of a fiber-optic position sensor,” pre-sented at the 18th Int. Conf. Optical Fiber Sensors (OFS-18), Cancún,Mexico, Oct. 23–27, 2006, ThE48.
[12] J. Jason, H.-E. Nilsson, B. Arvidsson, and A. Larsson, “Modulationfunction study of coupling based intensity-modulated fiber-optic sen-sors,” presented at the SOFM–2006, Boulder, CO, Sep. 19–20, 2006.
[13] C. M. Miller, S. C. Mettler, and I. A. White, Optical Fiber Splices andConnectors. New York: Marcel Dekker, 1986, pp. 103–104.
[14] J. C. Lagarias, J. A. Reeds, M. H. Wright, and P. E. Wright, “Conver-gence properties of the Nelder-Mead simplex method in low dimen-sions,” SIAM J. Optim., vol. 9, pp. 112–147, 1998.
[15] 1/2-Inch Megapixel CMOS Digital Sensor, MT9M001C12STM (Mono-chrome), Technical Data Sheet, Micron Technology, Inc., 2004.
Johan Jason received the M.Sc. degree in engi-neering physics from Lund Institute of Technology,Lund, Sweden, in 1996 with a thesis in optical en-gineering. Since 2005, he has been working towardsthe Ph.D. degree in photonics and electronics at MidSweden University, Sundsvall, Sweden, with mainresearch interests in intensity-modulated fiber-opticsensors, distributed fiber-optic sensing, and fibergrating sensors.
He joined Ericsson Cables AB (later EricssonNetwork Technologies AB), Hudiksvall, Sweden, in
1996, where he worked with optical fiber measurements and development offiber products and process technology. In 2003, he moved on to Fiberson AB,Hudiksvall, as a development engineer in optical fiber sensor technology.
Mr. Jason is a member of the Optical Society of America (OSA).
Hans-Erik Nilsson received the Ph.D. degreein solid-state electronics in 1997 from the RoyalInstitute of Technology, Stockholm, Sweden.
In 1997, he was a Senior Researcher at MidSweden University, Sundsvall, Sweden, focusingon modeling of advanced semiconductor devices.In 2002, he became a Full Professor of ElectronicsDesign and the Head of the Electronics DesignDivision, and since 2007, he is the Head of theDepartment of Information Technology and Media.His research interests include quantum transport
in electron devices, radiation imaging detectors, fiber-optic sensor solutions,RF electron devices, printed RFID antennas, printed sensor technology, andwireless sensor networks.

JASON et al.: EXPERIMENTAL STUDY OF AN INTENSITY MODULATED FIBER-OPTIC POSITION SENSOR WITH A NOVEL READOUT SYSTEM 1113
Bertil Arvidsson received the Ph.D. degree in the-oretical physics from Uppsala University, Uppsala,Sweden, in 1977.
He is an Ericsson Expert in Fiber Optics atEricsson Network Technologies AB, Hudiksvall,Sweden, and has been involved in optical fibertechnique for Ericsson since 1990. He is active instandardization regarding optical fibers, cables andfiber-to-the-home (FTTH). He also holds a positionas Adjungated Professor of Fiber Optics at MidSweden University, Sundsvall, Sweden.
Dr. Arvidsson is a member of IEC, ITU, CENELEC, OSA, the InternationalWire and Cable Symposium (IWCS) Planning Committee, and FTTH Europe:Deployment and Operation Committee.
Anders Larsson received the M.Sc. degree in Elec-trical engineering from the Royal Institute of Tech-nology, Stockholm, Sweden, in 1973.
He worked for more than 23 years for Ericsson asTechnical Manager for Ericsson Cables AB and VicePresident for Ericsson Network Technologies AB inHudiksvall, Sweden. Since 2003, he is the CEO forFiberson AB, Hudiksvall, Sweden.