Machine learning‑assisted non‑destructive plasticizer ... - Nature

Journal of Food Engineering 120 (2014) 248–259
Contents lists available at ScienceDirect
Journal of Food Engineering
journal homepage: www.elsevier .com/locate / j foodeng
In situ quality assessment of intact oil palm fresh fruit bunches usingrapid portable non-contact and non-destructive approach
0260-8774/$ - see front matter � 2013 Elsevier Ltd. All rights reserved.http://dx.doi.org/10.1016/j.jfoodeng.2013.08.011
⇑ Corresponding author. Tel.: +66 2 524 5480; fax: +66 2 524 6200.E-mail addresses: [email protected] (M. Makky), [email protected]
(P. Soni).
Muhammad Makky a,b, Peeyush Soni a,⇑a Agricultural Systems & Engineering, SERD, Asian Institute of Technology, Pathumthani 12120, Thailandb Department of Agricultural Engineering, Andalas University, Padang 25163, West Sumatera, Indonesia
a r t i c l e i n f o a b s t r a c t
Article history:Received 2 May 2013Received in revised form 22 July 2013Accepted 5 August 2013Available online 14 August 2013
Keywords:Oil palmFFBVIS/NIR spectroscopyNondestructiveRipenessOCFFA
The oil palm (Elaeis guineensis Jacq.) fresh fruits bunch (FFB) quality can be determined by its ripeness, oilcontent (OC) and free fatty acid (FFA) level. The change in fruit’s color upon ripening due to biochemicalreactions can be observed through VIS/NIR spectroscopy. In this study, portable VIS/NIR spectrometerwas employed to rapidly measure quality of oil palm FFB on-site, by means of non-contact and non-destructive approach. A mean-normalized method was used in pre-processing the bunch’s spectralreflectance data within 400–1000 nm range using 10 nm intervals. Two statistical analyses are performedto models FFB quality. First, a forward-stepwise method is employed to establish multiple linear regres-sions (FS-MLR), and second, a combination between principal component analyses with multilayer per-ceptron neural network (PCA–MLP). These statistical analyses are employed for predicting the FFBripeness, OC and FFA. Performances of best models were demonstrated by coefficient of determination(R2), standard error of calibration (SEC) and standard error of prediction (SEP), which were respectively0.9688, 0.1782, 0.4258 for ripeness prediction, 0.984, 0.25085, 0.4366 for OC prediction, and 0.9909,0.0917, 0.2367 for FFA prediction model. The application of FS-MLR method for modeling the FFB qualitydelivered better performances, since it introduced more predictor variables.
� 2013 Elsevier Ltd. All rights reserved.
1. Introduction
The oil palm industry in Indonesia significantly contributes toits economy by employing millions of people. Indonesia suppliesmore than 45% of the global demand. With 7.8 million hectaresof plantations and production surpassing 23 million tons of palmoil annually (Makky and Soni, 2013a, 2013b), Indonesia becomesthe largest palm oil producer. Indonesian oil palm industry needsto increase their high quality palm oil production while keepingthe production costs low in order to maintain its competitiveadvantages (Makky et al., 2004). This edible oil is extracted fromits fleshy mesocarp by means of mechanical extraction (Makkyet al., 2012). The fruit’s quality can be determined by its ripeness,oil content (OC) and free fatty acid (FFA) level, that eventuallydetermine the quality of the palm oil produced. In practice, manualripeness assessment is carried out by visual inspection, whilefruit’s oil content and oil’s free fatty acid level are determinedthrough laboratory chemical analysis. These methods are timeconsuming, labor intensive and prone to human error. In additionto being costly, laboratory chemical analysis is usually performedto only a few samples and requires destructive sampling.
Furthermore, it takes time to obtain the results and therefore poseschallenge to the industries. It is necessary to replace these methodswith rapid and non-destructive as well as cost-efficient techniques.
As the fruits ripe, its surface color gradually changes due to bio-chemical reactions in the fruits. The color changes due to variationin carotenoids and chlorophyll pigments ratios in its skin (Ikemef-una and Adamson, 1984), and can be correlated to fruit ripeness le-vel. The chlorophyll is known to be highest in raw fruits, andgradually decreases along with ripening fruit. In contrast, thecarotenoid is low in raw fruits and gradually increases during rip-ening process (Ikemefuna and Adamson, 1984). Therefore, it is pos-sible to measure the ripeness of oil palm fruits or bunches bymeasuring the ratio of chlorophyll to carotenoids, or vice versa,in fruit skin. This condition is observable through spectral reflec-tance analysis, and hence the spectroscopy suits the assessmentrequirements. The advantage of VIS/NIR spectroscopy has been de-scribed as being low cost, low maintenance and chemical-free pro-cess while providing short measuring time with limited samplepreparation (Valous et al., 2010). Another advantage of the tech-nique is that it facilitates a continuous quality evaluation of the ob-ject. Using visible and near infrared spectrum, spectroscopyanalysis can obtain internal properties of fruits and produces resultin rapid and non-destructive manner.
The use of VIS/NIR spectral analysis to assess agriculturalproducts’ quality as a rapid and non-destructive technique has

M. Makky, P. Soni / Journal of Food Engineering 120 (2014) 248–259 249
increased recently (Magwaza et al., 2012; Bertone et al., 2012).Spectroscopy analysis both in visible and near infrared range, hasbeen widely used for classification as well as assessing qualityand internal properties of fruits such as apple (Bertone et al.,2012), blueberries (Sinelli et al., 2008), jujubes (Wang et al.,2010), mandarin (Magwaza et al., 2012), mango (Subedi et al.,2007), tomato (Shao et al., 2007; Sirisomboon et al., 2012), pear(Fu et al., 2007), and plum (Louw and Theron, 2010; Pérez-Marínet al., 2010). This method is well known as a rapid and non-destructive analysis for assessing fruit quality. Nevertheless,among these researches, oil palm fruits receive lack of attention.No research has been reported for studying physical appearanceof FFB and its internal properties using VIS/NIR spectroscopy underactual field operation.
The objective of this study was to use VIS/NIR spectroscopy formeasuring ripeness and internal quality of oil palm fruits. The spe-cific objectives were to analyze relationships between VIS/NIRspectral reflectance characteristics and three important oil palmfruit quality indices (ripeness fraction, OC and FFA level) assessedthrough manual visual inspection and laboratory chemical analy-sis. The FFA level determines the quality of palm oil, because thepresences of high FFA result in poor quality oil. Another advantageof low level FFA is less chemical processing, thus saving productioncost and promoting green and more environmental friendly pro-duction in oil palm industries. These correspond to the require-ments of palm oil industries where greater volume of qualityproduction is desirable, through maximizing output from the oilcontent in the fruits, while minimizing its FFA level.
2. Material and methods
2.1. Samples preparation
The oil palm FFBs were harvested from 7 to 20 year-old treesduring June–July, 2011 at National Plantation Company’s Kertajaya
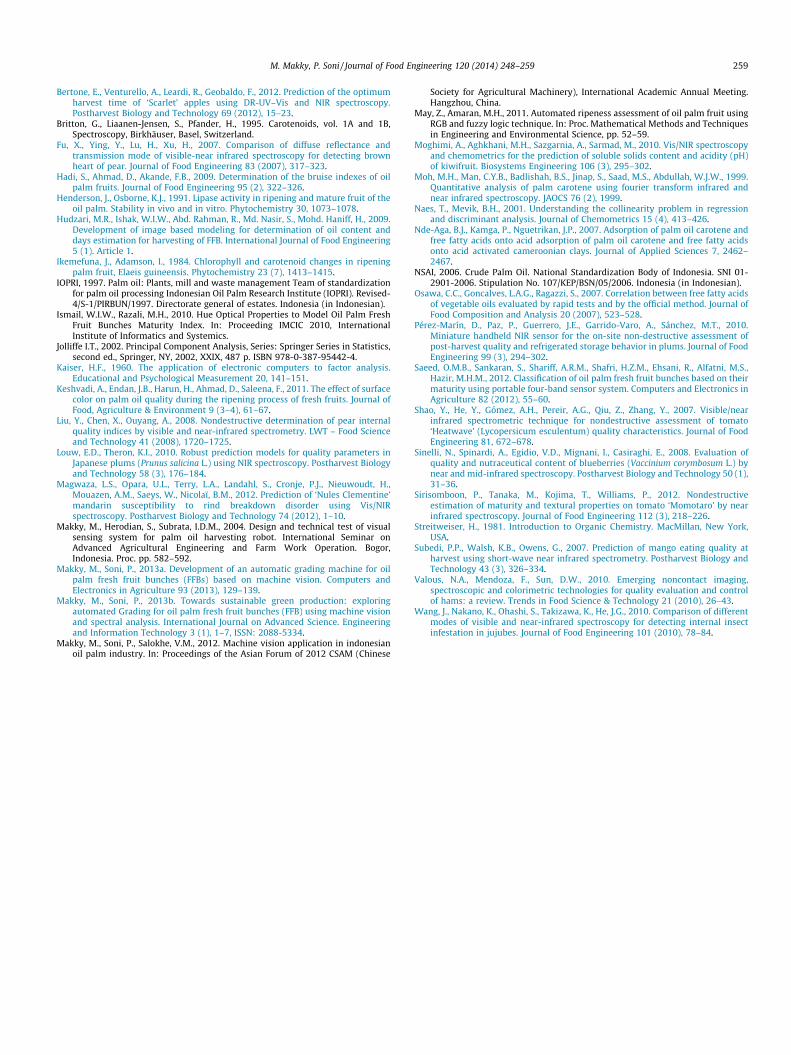
Table 1FFB ripeness fraction classification (IOPRI, 1997).
Ripeness fraction Quality Detached fruitlets
F00 Bad NoneF0 Low Up to 12.5% of outer fruitsF1 Preferable 12.5–25% outer fruitsF2 Preferable 25–50% outer fruitsF3 Preferable 50–75% outer fruitsF4 Low 75–100% outer fruitsF5 Bad Inner fruits start to detachedF6 Worst Most fruits detached
F00 F0
F3 F4
Fig. 1. FFB appearance of diffe
plantations, Banten Province, Indonesia. All plants were of teneravariety, and the FFBs were harvested from eight different ripenessfraction conditions (Table 1), according to Indonesian Oil PalmResearch Institute (IOPRI) standard (IOPRI, 1997). Every ripenessfraction has distinguished properties, including the fruit colorand the number of detached fruitlets (Fig. 1). The FFBs’ sampleswere classified by a panel of three experienced graders using visualassessment. In this research, 96 FFB samples, 12 from each ripenessfraction, were used to be analyzed by spectrophotometry. Infected,bruised or damaged bunches were discarded before these buncheswith good appearance were selected. All containments on thebunch such as dirt, fiber and leaves were removed before measure-ment performed.
Since changes in color of oil palm fruits can be distinguishedduring fruit ripening process, due to the change of chlorophylland carotenoids pigment concentrations in the fruits, measure-ment of spectral reflectance were performed in order to determinethe change in these two pigments’ ratio. Within a bunch, the colorof the fruitlets is usually not uniform, and there exists gradation offruitlets color from the top part of the bunch (apical) to the bottompart of the bunch (basal). Therefore, the measurements were per-formed at the three parts of each bunch, i.e. apical, middle and ba-sal part. Subsequently, measurements were replicated thrice foreach part, located around the equator, with the distance of about120� apart (Fig. 2a).
In this study, the nigrescens fruit type was selected being themajor fruit type popularly grown in Indonesia. As described byCorley and Tinker (2003), these fruits can be distinguished by itspurplish black color at the apex and pale greenish yellow color atthe base during raw or unripe state. Bunches were inspected onsite. For each bunch, measurement and data acquisition took lessthan one minute, and then the bunch was immediately sent tothe laboratory for chemical analysis.
2.2. VIS/NIR reflectance spectra measurements
The spectroscopy measurements were performed using OceanOptic USB2000+VIS–NIR series spectrometer (Ocean optics, USA).The device provided spectral information between 350 and1000 nm with resolution of 1.5 nm. For the light source, HL-2000tungsten halogen light sources (Ocean optics, USA) were used.For measuring the reflectance of oil palm fruits surface, opticalfiber reflection Probes (QR600-7-VIS–NIR, Ocean optics, USA) wereemployed to record diffuse or specular reflectance. The reflectionprobes were coupled to the spectrometer and light source tomeasure reflection. To calibrate the spectrometer, a white reflec-
F1 F2
F5 F6
rent ripeness conditions.

(a) (b)
API
CA
LM
IDD
LE
BA
SAL
120o
120o
120o
MeasurementsPoints
SCANNINGPOINT
REFLECTANCEPROBE
PERPENDICULARTO FRUIT SURFACE
FFB
LIGHT SOURCE(HL-2000, Ocean optics, USA)
SPECTROMETER(USB2000+VIS-NIR, Ocean optics, USA)
Fig. 2. (a) Measurement positions around equator for basal, middle and apical part of FFB, and (b) experimental setup.
250 M. Makky, P. Soni / Journal of Food Engineering 120 (2014) 248–259
tance standard with spectralon was used (WS-1-SL, Ocean optics,USA).
To overcome electrical noise due to light exposure onto thespectrophotometer, a dark correction was performed by turningoff the light source and placing the probe’s end with an opaquecap. The calibrated reflectance was calculated as percentage ofthe reflection of a standard reference material. Immediately, aftereach bunch measurement, the spectrometer was recalibrated anddark correction was repeated to remove the temperature influenceon the equipment. Throughout the measurements, the ambienttemperature varied between 27 �C in the morning and 33 �C inthe noon.
Each spectrum measurement is recorded as an average of 10scans. Recorded signals are pre-processed with a completely mod-ular, Java-based spectroscopy software platform that operates onWindows operating systems (SpectraSuite, Ocean optics, USA).The software interfaces with and controls the spectrometer and de-vice with different acquisition parameters, and provides graphicaland numeric representations of reflectance spectra data from spec-trometer, and also calculates and corrects non-unity for reflectionmeasurements, while displaying x-axis data in nanometers.
For each bunch of oil palm fruit, the reflectance spectral mea-surements were taken at nine different points (Fig. 2a) and theaverage of these spectra was calculated. Each point measurementwas repeated three times and averaged to minimize error in result.In total, 2592 reflectance spectra data were collected from all sam-ples. Experimental set up is described in Fig. 2b. While measuring,the reflectance probe was placed perpendicularly with the fruitsurface in order to prevent ambient light reaching the sensor.
The visible and near-infrared reflectance spectra were acquireddirectly after the bunch harvested. This to ensure the bunch infresh condition and reduce the effect of free fatty acid formationin mesocarp due to lipase enzyme activities that accelerate afterthe bunch was harvested (Henderson and Osborne, 1991). To avoida low signal-to-noise ratio, only the waveband 400 nm to 1000 nmwas considered in the calculations.
2.3. Quality parameters measurement
After spectral measurement, each bunch was taken to labora-tory for analyzing the oil content and its FFA level. Upon arrival,the samples were boiled immediately to inactivate the lipases.The tests were conducted within 24 h after the bunch had beenharvested. Fruitlets were detached from the bunch, and choppedto separate fruit’s mesocarp. Mesocarp was weighed using
analytical balance (Sartorius, BP 160 P, Germany). Samples werethen dried to remove physical water from the mesocarp. The oilin the mesocarp was extracted using soxhlet extractor, with hex-ane as chemical solvent. The remaining fiber and the oil solutionin the thimble were dried to remove the dissolved hexane, andthen cooled in the desiccator. It was then weighed in the analyticalbalance, and the result was recorded for mesocarp oil content cal-culation. This gravimetric procedure was defined by IOPRI (IOPRI,1997) in accordance with standards established by the NationalStandardization Body of Indonesia SNI- 01.2891.1991 (NSAI,2006). The mesocarp oil (Oilm) can be calculated as:
%Oilm ¼W1 �W2
W3� 100% ð1Þ
where W1 is timble and residue weight (g); W2 is empty timbleweight (g); and W3 is mesocarp sample weight (g).
The CPO recovery from the sample FFB was calculated usingequation:
%Oil Content ðOCÞ ¼PMf
MFFB%:Mm%:Oilm ð2Þ
where MFFB is weight of FFB (kg); Mf is Fruitlets weight (kg);% Mm ispercentage of mesocarp weight from fruitlets (%); and % Oilm is per-centage of mesocarp oil (%)
Free fatty acid was considered as an important quality parame-ter for CPO. FFA was formed as the process of oil hydrolysis to be-come acid. Accelerated by light and heat, FFA formed in CPOdecreases the smoking point, and responsible to undesirable fla-vors and aroma (Osawa et al., 2007). FFA in the oil was measuredby titration. The percentage of FFA in CPO was calculated as pal-mitic acid and interpreted as the weight of KOH (in miligrams) re-quired to counteracting acid from 1 g of sample. In this research,FFA was measured using the procedure defined according to SNI01-2901-2006 (NSAI, 2006). This procedure meets the qualificationaccording to the AOCS (American Oil Chemist’s Society) officialmethod Ca 5a-40 (AOCS, 2004).
The percentage of FFA (as palmitic) is expressed as:
% FFA ðas palmiticÞ ¼ 25:6NVW
ð3Þ
where V is volume of KOH (ml); N is titration solution normaliza-tion; W is sample weight (g); and 25.6 is constant (to calculateFFA as palmitic acid).

M. Makky, P. Soni / Journal of Food Engineering 120 (2014) 248–259 251
2.4. Spectral data pre-treatment
During spectral recording, noise, offset and bias are observed inthe spectrum data due to system imperfection. Pretreatment ofspectral data is necessary to improve signal-to-noise ratio, de-nois-ing, and to remove background and increase spectral resolution. Inthis research, prior to calibrating the spectrometer, the spectraldata was pre-treated by smoothing and reducing the number ofvariables by averaging 10 nm spectral resolutions. Previous re-searches (Moghimi et al., 2010; Wu and He, 2006) confirmed thatthe best de-noising method was smoothing spectral data bymoving average. This averaging method was chosen after trials ofseveral different spectral resolutions and found to be adequate.The smoothing was also expected to correct additive and multipli-cative effects in the spectral data, while preserving the importantfeatures of information. Only spectral data within the wavelengthof 400–1000 nm were used in this research to avoid low signal-to-noise ratio.
2.5. Forward stepwise multiple linear regression (FS-MLR) model
Multiple linear regression (MLR) analysis is widely used for cal-ibrating reflectance visible – near infrared spectral analysis model(Liu et al., 2008). Since the samples in this research were less thanthe variables of VIS/NIR spectra data, it was not possible to directlyestablish the MLR mode (Naes and Mevik, 2001) due to collinearly.A forward stepwise method was employed to improve model accu-racy and efficiency by removing collinearity of variables. This algo-rithm improved the prediction accuracy by using less variablescompared to conventional MLR model. The Forward StepwiseMLR model was built using statistical engineering software (IBM,USA). The FS-MLR prediction models were constituted of severalreflectance wavelength segments. Although it is precarious todetermine the importance of each wavelengths segment due tocollinearity problems, the exegesis of the model remain possible.
2.6. Principal component analysis with multilayer perceptron neuralnetwork (PCA–MLP) models
In this study, the principal component analysis (PCA) is used toexplain the variance in the spectral data. This analysis was per-formed by transforming data of spectral variables uncorrelated lin-early into a novel coordinate system, which gave the greatestvariance of data on the consecutive coordinates (Jolliffe, 2002).The PCA removed spectral data variables that had redundancy, dis-tinguished with strong correlation with one another. The principalcomponents have much smaller variable numbers, yet still provideinformation for most of the variance in the observed spectralvariables.
By utilizing obtained principal components as input predictor’svariables, Multilayer perceptron neural network (MLP) modelswere built using statistical engineering software (IBM, USA). TheMLP models were used for approximation estimation of FFB qual-ities (i.e. ripeness, OC and FFA). This procedure was done by train-ing a set of multilayer perceptron, hidden layers and output layer.To ensure models did not over fit upon training and performedpoorly upon validation, the number of hidden layers and process-ing elements were set to be changed automatically by statisticalsoftware.
2.7. Model evaluation
The model performance was evaluated by comparing the pre-diction results and measured values, in the validation sets. Themain performance statistics used for model validation were thecoefficient of determination (R2) (Eq. (4)), the standard error of
calibration (SEC) (Eq. (5)) and the standard error of prediction(SEP) (Eq. (6)).
R2 ¼Pn
i¼1ðyi � yiÞ2Pn
i¼1ðyi � ymÞ2
!ð4Þ
SEC ¼
ffiffiffiffiffiffiffiffiffiffiffiffiffiffiffiffiffiffiffiffiffiffiffiffiffiffiffiffiffiffiPnci¼1ðyi � yiÞ
2
ðnc � 1Þ
sð5Þ
SEP ¼
ffiffiffiffiffiffiffiffiffiffiffiffiffiffiffiffiffiffiffiffiffiffiffiffiffiffiffiffiffiffiffiffiffiffiffiffiffiffiffiffiffiffiffiffiPnvi¼1ðyi � yi � biasÞ2
ðnv � 1Þ
sð6Þ
where n is the number of data sample, nc is the number of data sam-ple for calibration, nv is the number of data sample for validation, yi
is the prediction value, yi is the measured value, ym is mean value.The average differences between predicted and actual values wereconsidered as bias (Eq. (7)).
bias ¼Pnv
i¼1ðyi � yiÞnv
� �ð7Þ
The performance of the model on calibration was highly relatedto the SEC results while upon validation, the SEP results confirmedthe validation of the model. The coefficients of determination (R2)were used both in calibration (R2
c ) and validation (R2v ) process. The
model was considered appropriately accurate when R2 value washigh while SEC and SEP values were low. Another criterion formodel acceptance was having small differences in the value ofSEC and SEP; since it indicates that model calculated minimumlatent variables and noises are not modeled.
Samples were divided into calibrations and cross-validationsdata sets, and distribution of data covered the same range ofripeness fraction, oil content and free fatty acid results. In orderto increase model performance, the spectral reflectance data werepre-processed as described in the previous section. Out of 96 sam-ples, 2/3 (nc = 64) of the data were used for calibrating the models,while the rest 1/3 (np = 32) was used for cross-validations of themodels.
3. Results and discussion
The reflectance spectral data retrieved from the measurementwere within 340 and 1022 nm. However, in the extreme regionsthe signal-to-noise ratios are considerably low, and might affectthe model accuracy. Therefore, only data ranging within 400 nmand 1000 nm considered to have useful information and were usedin the model. This spectral information was employed to generatethe model for predictions of ripeness fraction and chemical param-eters for each bunch.
Fig. 3a shows original average reflectance spectra of oil palmFFBs measured in each ripeness fraction, within the wavelengthrange of 400–1000 nm for normal fruits. Even after trimming theoutliers, noise in the spectrum data is still present. This initial datafrom the spectral acquisition was preprocessed. Average mean-normalized reflectance spectra data of 10 nm interval were usedfor pre-processing, and the result is shown in Fig. 3b.
The relative reflectance data showed that, in general, normalbunch has lower reflectance at lower ripeness fraction comparedto higher ripeness bunch. The results reveal clearly distinguishablespectral characteristics for each fraction, especially within thewavelength of 550–700 nm (Fig. 3b).
The differences of reflectance in the visible range can be corre-lated to the change of color, due to difference of chlorophyll andcarotene concentrations in the bunch at each fraction. Duringripening, the color of the bunch becomes lighter over time and thus

(a) (b)Fig. 3. (a) The average relative reflectance data (%) from each ripeness fraction (F00–F6), and (b) Average mean-normalized reflectance spectra data using 10 nm interval.
Table 2Ripeness model predictors and correlated coefficients.
No. 1 2 3 4 5 6 7 8 9 Intercept
Coefficients �0.1442 �1.6285 �2.5154 2.1905 1.4357 �2.7612 0.8597 0.8086 0.1806 3.0567k (nm) 400 540 560 590 670 800 910 940 1000
252 M. Makky, P. Soni / Journal of Food Engineering 120 (2014) 248–259
the reflectance values within the visible range from its surfacebecame higher. Chlorophyll is known to absorb most blue andred light in the visible spectrum, while reflecting green light.Two main types of chlorophyll, namely a and b, are effective pho-toreceptors and have strong absorption bands in the visible regionsof the spectrum with maximum absorbance at 430 and 662 nm forchlorophyll-a, and 453 and 642 nm for chlorophyll-b (Streitweiser,1981). Carotenoids have absorbance within the visible spectrum of400 and 500 nm. Referring to the Beer’s law, carotenoids’ absor-bance can be correlated to its concentration, and enables toestimate concentration of carotenoid in a sample. In general,carotenoids can be in the forms of b-carotene, a-carotene, lyco-pene, b-crytoxanthin, zeaxanthin, or lutein. Researchers have re-ported differences of carotenoids peak absorbance (Britton et al.,1995) which are a-carotene (422, 445 and 473 nm), b-carotene(425, 450 and 478 nm), b-cryptoxanthin (428, 450 and 478 nm),Lutein (421, 445 and 474 nm), Lycopene (444, 470 and 502 nm),and Zeaxanthin (425, 450, 478 nm). The red color in oil palm fruitis due to the content of red pigment that has been identified as b-carotene, with the absorbance peaks of 444–490 nm (Nde-Agaet al., 2007). However, some researchers have suggested that thecarotenes in the palm oil can be determined by spectrophotometryusing 446 nm wavelength (Moh et al., 1999).
These known properties of both chlorophyll and carotenoids inoil palm fruits were taken into account for modeling the ripenessand quality parameters of fruits using regression of spectral andchemical analysis data.
3.1. Modeling the FFB ripeness
3.1.1. FS-MLR method for FFB ripeness predictionModeling of bunch ripeness using a FS-MLR was done as a sta-
tistical analysis by selecting the suitable wavelengths for ripenessestimation. The forward stepwise multiple linear regressionsmethod for creating the model was chosen. In generating themodels, the number of predictors to be included was taken intoconsideration, since too many latent variables result in noise inthe model. Optimum number of variables that included in thecalculation provided best fit model (highest R2). Different numberof predictors were attempted to achieve highest coefficient of
determination (R2), while keeping number of variables fairlyminimum. The numbers of predictors introduced in the modelwere chosen corresponding to model’s coefficient of determinant,which was the highest when the model included nine predictorvariables.
Thus, the ripeness prediction model can be written as:
F ¼ C þ C1k1 þ C2k2 þ C3k3 þ . . .þ C9k9 ð8Þ
where F is ripeness fraction number, C is constant, Cn is coefficientof nth predictor, and kn is the pre-treated reflectance value of thenth predictor. These nine predictors with its coefficient and oneconstant that introduced in the model are shown in Table 2.
The predictors used in the ripeness model are pre-treatedreflectance data at wavelength of 400, 540, 560, 590, 670, 800,910, 940 and 1000 nm. The variables in the model suggest that sig-nificant differences in ripeness can be determined by using reflec-tance at these wavelengths. In relation to the chlorophyll, thepredictor in the model suggests that the chlorophyll-a, with peakabsorbance near the 670 nm was contributing in the model, whilechlorophyll-b as well as carotenoids were not significantly consid-ered. This result indicated that ripeness model showed a low valueof R2 when calibrating the model with the ratio of chlorophyll tocarotenoids. This may also give an impression that modeling forripeness cannot be simplified by predicting the ratio of chlorophyllto carotenoids alone in the fruits. The wavelength selection in themodel, however, deviates from the previous research, where wave-lengths of 740, 750 and 760 nm (Junkwon) and 570, 670, 750, and870 nm (Saeed et al., 2012) were considered for the ripeness.
The model performance was notably higher when compared toprevious researches (Saeed et al., 2012; May and Amaran, 2011).The performance of the model calibration was acceptable with R2
of 0.9688 and SEC of 0.1782. The performance of model validationwas also acceptable with R2 of 0.9375 and SEP of 0.4258. The cali-bration and validation results are shown in Fig. 4.
Observed misclassification of ripeness fraction of the bunch wasoccurred in over ripe fractions (F4, F5 and F6) due to their similarresemblance that can be seen in their overlapping reflectance char-acteristics. However, this may not affect the model application,since the desired ripeness of oil palm bunches to be processed inthe mills were within fraction 1 to fraction 3 (Table. 1). Variation

(a) (b)Fig. 4. (a) Calibration and (b) validation results for oil palm FFB ripeness prediction model using FS-MLR method with 9 predictors.
(a) (b)Fig. 5. (a) PCA scree test plot, and (b) correlations of principal components to spectral wavelength.
M. Makky, P. Soni / Journal of Food Engineering 120 (2014) 248–259 253
in regression coefficients with predictors’ wavelength for the ripe-ness prediction of oil palm FFBs are shown in Table 2, where peakswere observed at around 560 nm corresponding to the yellow col-or, as well as at around 800 nm corresponding to very nearinfrared.
3.1.2. PCA–MLP method for FFB ripeness predictionTo perform PCA of FFB spectral data, a linear combination of
optimally-weighted observed variables are constructed based oncorrelations among several variables. In general, principal compo-nents can be computed by means ofextraction using equation:
Ci ¼ bi1X1 þ bi2X2 þ . . . bipXp ð9Þ
where Ci is factor score on ith principal component, i is successionnumber of principal component, bip is regression coefficient orweight for pth spectral variable for ith principal component, p issuccession number of spectral variable, and Xp is the value of pthspectral variable.
The regression coefficient or weight values are predeterminedby the statistical software using Eigen-equation. The weights pro-duced by Eigen-equations are the most optimal weights predictedby the software, in such, no other set of value can provide moresuccessfully explained variance in the spectral variables. Althoughthe number of components extracted in this principal componentanalysis is equal to the number of spectral variables, only the mostcomponents that have maximum variance (Eigenvalue >1) are re-tained, interpreted, and used in MLP analyses.
Initially, 61 components are extracted by PCA, equal to thenumber of spectral variables being analyzed. Using eigenvalue-one criterion analysis, only four principal components are selected
for having eigenvalue greater than 1. This analysis, known as theKaiser criterion (Kaiser, 1960), is one of the most commonly usedcriteria for solving the number-of-components to be consideredin PCA. In this case, the selection of components using eigen-value-one criterion analysis provides a confident result since thefourth component displays an eigenvalue of 2.51, which is substan-tially greater than 1, and the next component (5th) displays aneigenvalue of 0.892, which is clearly lower than 1.
The components selection results agreed with the scree plot test(Fig. 5a), indicated significant distinction between fourth and fifthcomponents. The correlation result between selected principalcomponents and spectral variables is presented in Fig. 5b.Component 1 strongly correlated with spectral reflectance of750–960 nm, component 2 correlated with spectral reflectance of570–700 nm, component 3 correlated with spectral reflectance of470–540 nm, and component 4 correlated with spectral reflectanceof 420–440 nm.
The FFB ripeness model developed by means of MLP utilized allfour principal components, obtained from processing the spectraldata into PCA, as covariates. The statistical software constructedMLP analysis by feed-forward neural network (Fig. 6a), consistsof input layer as source neurons, hidden layer as computationalneurons, and output layer of computational neurons. Each layercomprised of nodes connected to every node in subsequent layer.The input layer, consists of four principal components as predictorvariables and one bias, distributes the inputs to hidden layer. Sub-sequently, the hidden layer, consists of four variables and one bias,distributes the inputs to output layer. The output layer itself com-prised of eight variables, each representing the FFB ripeness. Theinput signals are propagated in a forward direction on a layer-

(a) (b)
Bias
PC1
PC2
PC3
PC4
Bias
H1
H2
H3
H4
F00
F0
F1
F2
F3
F4
F5
F6Hidden layer activation function: Hyperbolic tangentOutput layer activation function: Softmax
Synaptic Weight > 0Synaptic Weight < 0
Input Layer Hidden Layer
Output Layer
FFB Ripeness AreaF00 1.000F0 .998F1 .972F2 .982F3 .989F4 .978F5 .947F6 .963
Area Under the Curve
Importance Normalized ImportancePC_1 .216 53.8%PC2 .401 100.0%PC_3 .174 43.4%PC_4 .210 52.5%
Independent Variable ImportanceInput
Fig. 6. (a) MLP network diagram of FFB ripeness model, and (b) model performance using ROC analysis.
Table 3MLP ripeness model summary.
TrainingCross entropy error 102.27R2 0.9393Stopping rule used 1 Consecutive step(s) with no decrease in errora
SEC 0.344N 64TestingCross entropy error 71.063R2 0.9351Bias �0.0853SEP 0.360N 32
a Error computations are based on the testing sample.
254 M. Makky, P. Soni / Journal of Food Engineering 120 (2014) 248–259
by-layer basis. Receiver operating characteristic (ROC) curve isused to assess model performance (Fig. 6b) upon predicting theFFB ripeness. The area under the curve of ROC graph explains theperformance test of the model in the real condition. The FFB modelaccuracy is measured by the area under the ROC curve. An area of 1represents a perfect test; an area of 0.5 represents a worthless test.Given the results, the MLP model for assessing FFB ripeness per-formed exceptionally, particularly upon predicting FFB in Fraction00 (F00) where area under the curve in the ROC graph obtained ascore of 1.
The most importance variable upon model construction isprincipal component 2 (Fig. 6b), which represents the spectral
Table 4Parameter estimates of FFB ripeness model obtained by PCA–MLP method.
Predictor Predicted
Hidden layer 1 Output
H(1:1) H(1:2) H(1:3) H(1:4) F00
Input layer (Bias) 3.044 .879 .950 �.300PC1_1 .123 .636 �3.049 �.616PC2_1 3.491 �.829 �2.522 1.775PC3_1 �.637 .116 �.433 �.148PC4_1 .571 �1.687 .193 �.446
Hidden layer 1 (Bias) �.680H(1:1) �1.261H(1:2) 1.352H(1:3) �4.980H(1:4) �3.381
reflectance variable of 570–700 nm. This suggests that yellow tored color significantly affects the ripeness model, correspondingto the development of FFB color during ripening process. Inaddition both chlorophyll-a and chlorophyll-b also have strongabsorption nature in this wavelength region. The results agreedwith FS-MLR ripeness model, where the most significant variablefor predicting FBB ripeness is reflectance spectral between 580 to680 nm (Table 2). The summary of developed model for FFBripeness prediction using MLP analysis is given in Table 3.
The model coefficient of correlation upon calibration and testare 0.9393 and 0.9351 respectively, with standard error of 0.344for calibration, and 0.36 for prediction. The R2 results for FFB ripe-ness model using PCA–MLP is performed slightly less compared tothe model developed using FS-MLR analysis. The composition ofFFB ripeness model, established through PCA and MLP methods,is described in the Table 4.
3.2. Modeling FFB’s OC
3.2.1. FS-MLR method for FFB OC predictionOil in FFB accumulates until its ripening stage. Once the oil
palm FFB is cut from the tree, no oil content further develops insidethe fruit (Keshvadi et al., 2011). Therefore, the oil content predic-tion model used the spectral data obtained soon after the bunchharvested. For FFBs oil content estimation using FS-MLR analysis,the model was created by removing non significance variablethrough stepwise means and F statistic. Similarly as previous, in
layer
F0 F1 F2 F3 F4 F5 F6
�1.264 1.761 .615 �.698 .222 �.075 �.283�7.651 �.908 �.627 2.844 3.373 2.852 3.300
1.574 3.570 �1.159 �4.127 �2.648 �.223 1.8491.638 .750 3.320 1.780 �2.118 �2.209 .937�2.557 �.096 �2.592 1.858 �1.482 3.374 5.060

M. Makky, P. Soni / Journal of Food Engineering 120 (2014) 248–259 255
generating this model, the numbers of predictors employed werealso taken into consideration, which were 16, in addition to a con-stant value.
The OC model can be written as:
OC % ¼ xþ x1k1 þ x2k2 þ x3k1 þ . . .þ x16k16 ð10Þ
where OC% is oil content prediction value, x is constant, xn is coef-ficient of nth predictor, and kn is the pre-treated reflectance valueof the nth predictor. The coefficients for each predictors as well asthe constant value introduced in the model are shown in Table 5.
The predictors used in the OC model are pre-treated reflectancedata at wavelength of 440, 470, 480, 510, 610, 690, 720, 750, 760,880, 900, 910, 940, 980, 990 and 1000 nm. The variables in themodel suggest that significant differences in oil content of thefruits can be determined by using reflectance at these wavelengths.In regard to the chlorophyll in the fruits, the model suggests nocorrelation of the OC with the chlorophyll concentration in thefruits. In contrast, theselected wavelengths in the model suggestedthat carotenes concentration in the fruits strongly influenced theOC, which has common absorbance within visible spectrum of400 and 500 nm. Previous studies have also revealed that b-caro-tene is the main carotenoid in the oil palm, and it has been foundto have different absorbance peaks. However, the majority of b-carotene in oil palm has the absorbance peak between 440 and480 nm (Britton et al., 1995; Nde-Aga et al., 2007; Moh et al.,1999), which corroborates to the model in this research. Althoughthe model could not clearly distinguish the b-carotene concentra-tions in the fruits, it is believed that as the oil forms in the fruitduring ripening, the concentration of b-carotene pigment in theoil might vary, thus affecting its spectral characteristics whichwas reflected in the model’s wavelength selection.
The OC prediction model showed acceptable performance bothon calibration and validation (Fig. 7). The model’s R2 upon calibra-tion was 0.984 with SEC of 0.25085. While upon validation R2 valuewas 0.9891 and SEP of 0.4366. The model was considered appropri-ate since R2 value both in calibration and validation were high,while SEC and SEP values were low.
In comparison to the previous studies (Keshvadi et al., 2011;Ismail and Razali, 2010; Hudzari et al., 2009), the developedmodel performed better for estimating OC in oil palm FFBs.Variation in regression coefficients with predictor’s wavelengthsfor the OC prediction is shown in Table 5, where peaks were
Table 5Oil content (OC) model predictors and correlated coefficients.
No. 1 2 3 4 5 6 7 8
Coefficients 1.50 �1.57 �5.04 �3.27 �2.14 5.51 �6.33 �5.24k (nm) 440 470 480 510 610 690 720 750
(a)Fig. 7. (a) Calibration and (b) validation results for oil palm FFB oil conte
observed at around 760 nm corresponding to the very near infra-red region.
3.2.2. PCA–MLP method for FFB OC predictionThe second model of FFBs oil content estimation is created
using PCA–MLP method. The input variables used are four principalcomponents obtained in the previous section. The model was con-structed using statistical software employing a feed-forward neu-ral network analysis. The neural network (Fig. 8a) consists ofinput, hidden, and output layers. Five nodes are used as sourceneurons in input layer that consists of four principal componentsas predictor variables and one bias. These nodes are distributedindividually to all nodes in hidden layer, which consists of threearbitrary variables and one bias. Subsequently, all the nodes in hid-den layer distribute the inputs to output layer, providing output forFFB OC prediction.
Two predictor variables gave significant influence on the outputupon model training, i.e. principal components 1 and 3 (Fig. 8b).According to their correlation to the spectral reflectance data(Fig. 5b), these principal components represent spectral variablewavelength of 470–540 nm and 750–960 nm. The first wavelengthspans (470–540 nm) are the area of interest, in which giving indi-cation that there is carotenoids influence for modeling the FFB oilcontent using PCA–MLP method.
The performance of FFB OC model, generated through PCA–MLP method, is demonstrated by the correlation results betweenlaboratory measurements and model predictions of oil content inFFB. Upon calibration, the model’s R2 result is 0.773 (Fig. 9a),while on validation the model’s R2 is 0.7661 (Fig. 9b). In sum-mary, the PCA–MLP model for predicting FFB oil content is pre-sented in Table 6. Compared to FS-MLR model, the FFB OCmodel performance in this method (PCA–MLP) is somewhat lessaccurate, possibly due to the application of PCA in reducing spec-tral reflectance variables, which causes information from the databecomes less detailed. Classification of spectral reflectance datainto four principal components is contrasted to the stepwisemethod that allows the selection of a wider spectral reflectancevariables, allowing the model built with more detailed informa-tion, and thus performed better. The parameter of FFB OC model,established by means of PCA and MLP methods, is described inthe Table 7.
9 10 11 12 13 14 15 16 Intercept
7.41 1.88 2.48 �3.49 �1.40 0.62 �1.12 0.37 25.06760 880 900 910 940 980 990 1000
(b)nt (OC) prediction model using FS-MLR method with 16 predictors.

(a) (b)Fig. 8. (a) PCA–MLP diagram of FFB OC model, and (b) model’s predictor importance.
(a) (b)Fig. 9. (a) Calibration and (b) validation results for oil palm FFB oil content (OC) prediction model using PCA–MLP method with 4 principal components.
Table 6PCA�MLP model performance summary for FFBs oil content prediction.
TrainingSum of squares error 9.625Relative error .219R2 0.773SEC 3.386n 64Stopping rule used 1 Consecutive step(s) with
no decrease in errora
TestingSum of squares error 4.277Relative error .253R2 0.766SEP 2.285Bias 0.118n 32
a Error computations are based on the testing sample.
Table 7Parameter estimates of FFB OC model (PCA�MLP method).
Predictor Predicted
Hidden layer 1 Output layer
H(1:1) H(1:2) H(1:3) Oil content
Input layer (Bias) .402 �.668 �.642PC1_1 �.113 .834 �.328PC2_1 �.163 .139 �.081PC3_1 .743 .083 �.223PC4_1 .130 �.167 .823
Hidden layer 1 (Bias) �.213H(1:1) �.980H(1:2) �1.480H(1:3) .349
256 M. Makky, P. Soni / Journal of Food Engineering 120 (2014) 248–259
3.3. Modeling FFBs FFA
3.3.1. FS-MLR method for FFB FFA predictionFFA in oil palm FFB is formed due to fat hydrolysis process,
where fat in the oil deteriorates and releases the FFA from
triglycerides. This process develops progressively in over ripebunches (Ismail and Razali, 2010) or when the bunch experienceslong delay to be processed in mill. Although fruits’ maturity in thebunch is not uniform, the level of FFA is mostly uniform through-out the bunch. High level of FFA is commonly found in over ripeor rotten bunch as well as bruised or injured bunch (Hadi et al.,2009).

Table 8Free fatty acid (FFA) model predictors and correlated coefficients.
No 1 2 3 4 5 6 7 8 9 10 Intercept
Coefficients �0.0549 1.0774 �3.2194 �1.153 8.111 �4.6086 2.6012 �1.6031 �1.0138 0.1004 2.8438k (nm) 400 480 560 580 590 600 660 670 710 1000
(a) (b)Fig. 10. (a) Calibration and (b) validation results for oil palm FFB free fatty acid (FFA) prediction model using forward-stepwise MLR method with 10 predictors.
(b)(a)
Bias
PC1
PC2
PC3
PC4
Bias
H1
H2
H3
FFA
Synaptic Weight > 0Synaptic Weight < 0
H4Input Layer Hidden Layer Output Layer
Fig. 11. (a) PCA–MLP diagram of FFB FFA model, and (b) model’s predictor importance.
M. Makky, P. Soni / Journal of Food Engineering 120 (2014) 248–259 257
To obtain appropriate model for predicting FFA level in the sam-ples, two methods were used for models creation, the FS-MLR andPCA–MLP. Similarly to the previous sections, the number of vari-ables to be included was taken into consideration to reduce noiseinfluence on the model.
For model creation using FS-MLR method, optimum numbers ofpredictors for highest R2 were obtained as 10, with a constant term.The FFA model can be written as:
FFA % ¼ aþ a1k1 þ a2k2 þ a3k3 þ . . .þ a10k10 ð11Þ
where FFA% is FFA prediction value, a is constant term, an is coeffi-cient of nth predictor, and kn is the pre-treated reflectance value ofthe nth predictor. Coefficients for every predictor and the constantterm used in the model are shown in Table 8.
The predictors included in this FFA model are pre-treated reflec-tance data at wavelength of 400, 480, 560, 580, 590, 600, 660, 670,710 and 1000 nm. The variables in the model suggest that signifi-cant differences in oil content in the fruits can be determined byusing reflectance at these wavelengths.
In relation to the chlorophyll in the fruits, the model suggeststhat there is a correlation between fruit’s FFA with chlorophyll-awith its second peak absorbance within 660 nm to 670 nm
although it is not significant. For the carotenes, model shows nocorrelation between the carotenes to the wavelengths selected inthe model.
The model provides acceptable performance both on calibrationand validation (Fig. 10), with R2 of 0.9909 and SEC of 0.0917 for cal-ibration. In validation, model obtains R2 of 0.9336 and SEP of0.2367. The model is considered appropriate since its R2 valuesboth in calibration and validation are high, while SEC and SEP val-ues are low. Variation in regression coefficients with predictors’wavelength for FFA prediction is shown in Table 8, where peakwas observed at around 590 nm corresponding to the orange color.
3.3.2. PCA–MLP method for FFB FFA predictionThe second model of FFA is created using PCA–MLP method.
Four principal components are used as predictor variables for themodel. Utilizing the statistical software, model employs feed-for-ward neural network analysis. The network diagram (Fig. 11a) con-sists of five nodes on input layer, i.e. four principal components andone bias, as source neurons. The hidden layer comprises of fourarbitrary variables and one bias, while the output layer only hadone node, providing output for FFB FFA prediction. Principal com-ponent 2, as the most influence predictor variable in the model

(a) (b)Fig. 12. (a) Calibration and (b) validation results for oil palm FFB free fatty acids prediction model using PCA–MLP method with 4 principal components.
Table 9PCA–MLP model performance summary for FFBs FFA prediction.
TrainingSum of squares error 5.359Relative error .139R2 0.828SEC 0.189n 64Stopping rule used 1 Consecutive step(s) with no decrease in errora
TestingSum of squares error 5.062Relative error .232R2 0.826SEP 0.181Bias 0.059n 32
a Error computations are based on the testing sample.
Table 10Parameter estimates of FFB FFA model (PCA–MLP method).
Predictor Predicted
Hidden layer 1 Output layer
H(1:1) H(1:2) H(1:3) H(1:4) FFA
Input layer (Bias) �.657 �.982 .039 �.266PC1_1 .023 �.430 .404 �.187PC2_1 �.353 1.147 .040 �.424PC3_1 .092 �.189 .517 .199PC4_1 �.421 �.497 �.256 .261
Hidden layer 1 (Bias) .318H(1:1) �.381H(1:2) 1.278H(1:3) �.455H(1:4) �.172
258 M. Makky, P. Soni / Journal of Food Engineering 120 (2014) 248–259
(Fig. 11b), represents spectral variable wavelength of 570–700 nm.The wavelength region indicates that chlorophyll influenced FFAmodel analysis in PCA–MLP method.
Model performs similarly on calibration (R2 = 0.828) (Fig. 12a),and upon validation (R2 = 0.826) (Fig. 12b). However, overall per-formances of the model (Table. 9) are below par when comparedto similar model obtained through FS-MLR method (Fig. 10). Thesummary of PCA–MLP model for predicting FFB free fatty acids ispresented in Table 10.
4. Conclusion
In this study, a VIS/NIR spectroscopy technique was employedto estimate ripeness, oil content, and free fatty acid of oil palmFFB, using spectral reflectance and chemical analysis, from 96samples of eight ripeness variations. The reflectance data werepre-treated using mean-normalized method with 10 nm interval.To address noise, only reflectances within the wavelength of400–1000 nm were used. The data sets were then compared tothe results of chemical analysis to establish models. Two methodsare used for developing models, first by FS-MLR and secondly byPCA–MLP. Forward stepwise is employed to obtain simpler modeland to remove collinear variables, and thereby enhancing accuracyand reproducibility. Similarly, the PCA is used to extract four prin-cipal components from spectral data. For the FS-MLR method, ripe-ness prediction model employed nine predictors with performance(R2) of 0.9688 and SEC of 0.1782 upon calibration and R2 of 0.9375and SEP of 0.4258 upon validation. The oil content prediction mod-el consisted of 16 predictors, with calibration performance of R2
and SEC as 0.984 and 0.25085 respectively, while validation perfor-mance of R2 and SEP as 0.9891 and 0.4366. For FFA prediction, themodel employed 10 variables with R2 and SEC as 0.9909 and0.0917 respectively, while for validation the R2 was 0.9336 andSEP was 0.2367. For the PCA–MLP method, ripeness model perfor-mances (R2) are 0.9393 and 0.9351 for calibration and validationrespectively, with SEC and SEP of 0.344 and 0.36. On the OC model,the R2 on calibration and validation are 0.773 and 0.7661 respec-tively, and SEC and SEP value are 3.386 and 2.285. As for the FFAmodel, calibration and validation performance (R2) are 0.828 and0.826 respectively, while the SEC and SEP are obtained as 0.189and 0.181. Overall, the models created using FS-MLR methodsperformed better, due to more predictor variables employed.
Acknowledgements
The research was supported by the Asian Institute of Technology,(Thailand) and the General Directorate of Higher Education (DIKTI),(Indonesia). The authors would like to also acknowledge support re-ceived from the Indonesian Oil Palm Company (PTPN VIII).
References
AOCS, 2004, Official methods and recommended practices of the American OilChemists Society. Sampling and analysis of commercial fats and oil. AmericanOil Chemists Society, Champaign, USA.
M. Makky, P. Soni / Journal of Food Engineering 120 (2014) 248–259 259
Bertone, E., Venturello, A., Leardi, R., Geobaldo, F., 2012. Prediction of the optimumharvest time of ‘Scarlet’ apples using DR-UV–Vis and NIR spectroscopy.Postharvest Biology and Technology 69 (2012), 15–23.
Britton, G., Liaanen-Jensen, S., Pfander, H., 1995. Carotenoids, vol. 1A and 1B,Spectroscopy, Birkhäuser, Basel, Switzerland.
Fu, X., Ying, Y., Lu, H., Xu, H., 2007. Comparison of diffuse reflectance andtransmission mode of visible-near infrared spectroscopy for detecting brownheart of pear. Journal of Food Engineering 83 (2007), 317–323.
Hadi, S., Ahmad, D., Akande, F.B., 2009. Determination of the bruise indexes of oilpalm fruits. Journal of Food Engineering 95 (2), 322–326.
Henderson, J., Osborne, K.J., 1991. Lipase activity in ripening and mature fruit of theoil palm. Stability in vivo and in vitro. Phytochemistry 30, 1073–1078.
Hudzari, M.R., Ishak, W.I.W., Abd. Rahman, R., Md. Nasir, S., Mohd. Haniff, H., 2009.Development of image based modeling for determination of oil content anddays estimation for harvesting of FFB. International Journal of Food Engineering5 (1). Article 1.
Ikemefuna, J., Adamson, I., 1984. Chlorophyll and carotenoid changes in ripeningpalm fruit, Elaeis guineensis. Phytochemistry 23 (7), 1413–1415.
IOPRI, 1997. Palm oil: Plants, mill and waste management Team of standardizationfor palm oil processing Indonesian Oil Palm Research Institute (IOPRI). Revised-4/S-1/PIRBUN/1997. Directorate general of estates. Indonesia (in Indonesian).
Ismail, W.I.W., Razali, M.H., 2010. Hue Optical Properties to Model Oil Palm FreshFruit Bunches Maturity Index. In: Proceeding IMCIC 2010, InternationalInstitute of Informatics and Systemics.
Jolliffe I.T., 2002. Principal Component Analysis, Series: Springer Series in Statistics,second ed., Springer, NY, 2002, XXIX, 487 p. ISBN 978-0-387-95442-4.
Kaiser, H.F., 1960. The application of electronic computers to factor analysis.Educational and Psychological Measurement 20, 141–151.
Keshvadi, A., Endan, J.B., Harun, H., Ahmad, D., Saleena, F., 2011. The effect of surfacecolor on palm oil quality during the ripening process of fresh fruits. Journal ofFood, Agriculture & Environment 9 (3–4), 61–67.
Liu, Y., Chen, X., Ouyang, A., 2008. Nondestructive determination of pear internalquality indices by visible and near-infrared spectrometry. LWT – Food Scienceand Technology 41 (2008), 1720–1725.
Louw, E.D., Theron, K.I., 2010. Robust prediction models for quality parameters inJapanese plums (Prunus salicina L.) using NIR spectroscopy. Postharvest Biologyand Technology 58 (3), 176–184.
Magwaza, L.S., Opara, U.L., Terry, L.A., Landahl, S., Cronje, P.J., Nieuwoudt, H.,Mouazen, A.M., Saeys, W., Nicolaï, B.M., 2012. Prediction of ‘Nules Clementine’mandarin susceptibility to rind breakdown disorder using Vis/NIRspectroscopy. Postharvest Biology and Technology 74 (2012), 1–10.
Makky, M., Herodian, S., Subrata, I.D.M., 2004. Design and technical test of visualsensing system for palm oil harvesting robot. International Seminar onAdvanced Agricultural Engineering and Farm Work Operation. Bogor,Indonesia. Proc. pp. 582–592.
Makky, M., Soni, P., 2013a. Development of an automatic grading machine for oilpalm fresh fruit bunches (FFBs) based on machine vision. Computers andElectronics in Agriculture 93 (2013), 129–139.
Makky, M., Soni, P., 2013b. Towards sustainable green production: exploringautomated Grading for oil palm fresh fruit bunches (FFB) using machine visionand spectral analysis. International Journal on Advanced Science. Engineeringand Information Technology 3 (1), 1–7, ISSN: 2088-5334.
Makky, M., Soni, P., Salokhe, V.M., 2012. Machine vision application in indonesianoil palm industry. In: Proceedings of the Asian Forum of 2012 CSAM (Chinese
Society for Agricultural Machinery), International Academic Annual Meeting.Hangzhou, China.
May, Z., Amaran, M.H., 2011. Automated ripeness assessment of oil palm fruit usingRGB and fuzzy logic technique. In: Proc. Mathematical Methods and Techniquesin Engineering and Environmental Science, pp. 52–59.
Moghimi, A., Aghkhani, M.H., Sazgarnia, A., Sarmad, M., 2010. Vis/NIR spectroscopyand chemometrics for the prediction of soluble solids content and acidity (pH)of kiwifruit. Biosystems Engineering 106 (3), 295–302.
Moh, M.H., Man, C.Y.B., Badlishah, B.S., Jinap, S., Saad, M.S., Abdullah, W.J.W., 1999.Quantitative analysis of palm carotene using fourier transform infrared andnear infrared spectroscopy. JAOCS 76 (2), 1999.
Naes, T., Mevik, B.H., 2001. Understanding the collinearity problem in regressionand discriminant analysis. Journal of Chemometrics 15 (4), 413–426.
Nde-Aga, B.J., Kamga, P., Nguetrikan, J.P., 2007. Adsorption of palm oil carotene andfree fatty acids onto acid adsorption of palm oil carotene and free fatty acidsonto acid activated cameroonian clays. Journal of Applied Sciences 7, 2462–2467.
NSAI, 2006. Crude Palm Oil. National Standardization Body of Indonesia. SNI 01-2901-2006. Stipulation No. 107/KEP/BSN/05/2006. Indonesia (in Indonesian).
Osawa, C.C., Goncalves, L.A.G., Ragazzi, S., 2007. Correlation between free fatty acidsof vegetable oils evaluated by rapid tests and by the official method. Journal ofFood Composition and Analysis 20 (2007), 523–528.
Pérez-Marín, D., Paz, P., Guerrero, J.E., Garrido-Varo, A., Sánchez, M.T., 2010.Miniature handheld NIR sensor for the on-site non-destructive assessment ofpost-harvest quality and refrigerated storage behavior in plums. Journal of FoodEngineering 99 (3), 294–302.
Saeed, O.M.B., Sankaran, S., Shariff, A.R.M., Shafri, H.Z.M., Ehsani, R., Alfatni, M.S.,Hazir, M.H.M., 2012. Classification of oil palm fresh fruit bunches based on theirmaturity using portable four-band sensor system. Computers and Electronics inAgriculture 82 (2012), 55–60.
Shao, Y., He, Y., Gomez, A.H., Pereir, A.G., Qiu, Z., Zhang, Y., 2007. Visible/nearinfrared spectrometric technique for nondestructive assessment of tomato‘Heatwave’ (Lycopersicum esculentum) quality characteristics. Journal of FoodEngineering 81, 672–678.
Sinelli, N., Spinardi, A., Egidio, V.D., Mignani, I., Casiraghi, E., 2008. Evaluation ofquality and nutraceutical content of blueberries (Vaccinium corymbosum L.) bynear and mid-infrared spectroscopy. Postharvest Biology and Technology 50 (1),31–36.
Sirisomboon, P., Tanaka, M., Kojima, T., Williams, P., 2012. Nondestructiveestimation of maturity and textural properties on tomato ‘Momotaro’ by nearinfrared spectroscopy. Journal of Food Engineering 112 (3), 218–226.
Streitweiser, H., 1981. Introduction to Organic Chemistry. MacMillan, New York,USA.
Subedi, P.P., Walsh, K.B., Owens, G., 2007. Prediction of mango eating quality atharvest using short-wave near infrared spectrometry. Postharvest Biology andTechnology 43 (3), 326–334.
Valous, N.A., Mendoza, F., Sun, D.W., 2010. Emerging noncontact imaging,spectroscopic and colorimetric technologies for quality evaluation and controlof hams: a review. Trends in Food Science & Technology 21 (2010), 26–43.
Wang, J., Nakano, K., Ohashi, S., Takizawa, K., He, J.G., 2010. Comparison of differentmodes of visible and near-infrared spectroscopy for detecting internal insectinfestation in jujubes. Journal of Food Engineering 101 (2010), 78–84.
Copyright © 2022 FDOKUMEN