In-Situ Assessment of Structural Timber Density Using Non-Destructive and Semi-Destructive Testing
Upload
independentCategory
view
0download
0
X-RAY SPECTROMETRYX-Ray Spectrom. 29, 73–91 (2000)
Use of Microscopic XRF for Non-destructiveAnalysis in Art and Archaeometry
K. Janssens,1* G. Vittiglio, 1 I. Deraedt,1 A. Aerts,1 B. Vekemans,1 L. Vincze,1 F. Wei,1 I. Deryck,1
O. Schalm,1 F. Adams,1 A. Rindby,2 A. Kn ochel,3 A. Simionovici4 and A. Snigirev4
1 Department of Chemistry, University of Antwerp (UIA), Antwerp, Belgium2 Department of Physics, Chalmers University of Technology, Goteborg, Sweden3 Institut fur Angewandte und Anorganische Chemie, Universitat Hamburg, Hamburg, Germany4 Experimental Division, European Synchrotron Radiation Facility, Grenoble, France
The various application possibilities of microscopic x-ray fluorescence and associated methods for thecharacterization and provenance analysis of objects and materials of cultural heritage value are discussedby means of a number of case studies. They include the trace analysis of historic glass, the analysis ofcorroded coins and statues in bronze and silver and the study of inks on historical documents. These studiesare conducted by means of micro-XRF instruments installed at synchrotron beamlines and by means oflaboratory equipment, some of which is easily transportable to the museum or archaeological site where theobjects of interest are located. Copyright 2000 John Wiley & Sons, Ltd.
INTRODUCTION
Modern studies on objects and materials of historicaland/or cultural value usually involve the use of variousanalytical methods and techniques to extract objectiveinformation from these materials; in many cases, thechemical composition (major elements to traces) is theprimary type of information that is needed. The objectsinvolved are often unique in nature (e.g. paintings, stat-ues, utilitarian objects of different shapes and sizes inmetal, glass, wood, stone, ceramics, etc.). They can bein unadorned state or covered with multi-coloured deco-rations, and may be well preserved or in a serious stateof decline.
Studies involving scientific methods may be undertakenwith the aim of elucidating the provenance of the objectunder study. Usually such studies seek to increase theknowledge on the historical context, e.g. the determinationof the composition of bronze-age artifacts from differentperiods and geographical locations may help to eluci-date the early evolution of metallurgical technology andits geographical spread.1 Next to this cultural–historicalperspective, scientific methods may also be employed toassess the state of conservation of a particular material;the information obtained may be used to select the mostappropriate means of conservation or restoration. Simi-larly, objects that have been subjected to a restorationtreatment (in the recent or not so recent past) may beinvestigated to distinguish original from add-on materialsor to evaluate the effectiveness of past treatments. Finally,scientific methods are also used to allow (more) objec-tive authentication of (usually valuable) art and culturalobjects.
* Correspondence to: K. Janssens, Departement Scheikunde, Univer-siteit Antwerpen Universiteitsplein l, B-2610 Antwerp, Belgium.
According to Lahanieret al.,2 an ideal method foranalyzing objects of artistic, historic or archaeologicalnature should be:
(a) non-destructive, i.e. respecting the physical integrity ofthe material/object. Often valuable objects can only beinvestigated when the analysis does not result in any(visible) damage; usually this completely eliminatessampling or limits it to very small amounts;
(b) fast, so that large numbers of similar objects maybe analysed or a single object investigated at variouspositions on its surface; this property is very valuablesince this is the only way of being able to discernbetween general trends in the data and outlying objectsor data points;
(c) universal, so that by means of a single instrument,many materials and objects of various shapes anddimensions may be analysed with minimal sample pre-treatment;
(d) versatile, allowing with the same technique averagecompositional information to be obtained, but alsolocal information of small areas (e.g. millimetre tomicrometre-sized) from heterogeneous materials;
(e) sensitive, so that object grouping and other types ofprovenance analysis can be done not only by meansof major elements but also by means of trace-elementfingerprints; and
(f) multi-elemental, so that in a single measurement,information on many elements is obtained simulta-neously and, more importantly, so that also informa-tion is obtained on elements which were not initiallythought to be relevant to the investigation.
A number of examples of the use of (micro)analyticaltechniques suitable for characterizing archaeological andartistic materials were recently described by Adamset al.3
An extensive overview of the use of proton micro beamsfor analysing a variety of artistic/archaeological materi-als such as (gem)stones, pottery, glass, metallic objects,
CCC 0049–8246/2000/010073–19 $17.50 Received 19 July 1999Copyright 2000 John Wiley & Sons, Ltd. Accepted 20 October 1999

74 K. JANSSENSET AL.
calcified tissues, paper and pigments by means of proton-induced x-ray emission (PIXE) and related techniques isprovided by Malmqvist.4
Since XRF meets a number of the above requirements,analysis of objects of artistic and/or archaeological valuewith conventional XRF is fairly common; it is in fact oneof the most often applied methods for obtaining qualita-tive and semi-quantitative information on the materials ofwhich these objects are made.5,6 On the other hand, theuse of conventional XRF for reliable quantitative analysisis severely hampered by the fact that the irradiated area isusually large. This prevents the separate analysis of detailsof decorations, distinct features, etc. Also, the irradiationgeometry and sample surface are usually non-ideal and/ornot well defined, possibly introducing systematic errors inthe quantification. The use of smaller x-ray beams can cir-cumvent some of these limitations. In such as case, motor-ized sample movement allows the local analysis capabil-ity to be extended towards two-dimensional imaging ofcertain elements on the surface of artifacts. Since manyobjects of artistic and/or archaeological nature are fairlylarge and bulky (e.g. statues, oil paintings, vases, treasuryobjects), instrumentation that can accommodate objectsof various shapes and is able to operate in air atmosphereis very useful. Usually, this implies that the equipmentis laboratory-built as, for reasons of radiation protection,commercially available instruments mostly are equippedwith relatively small, well-shielded sample compartments.
Depending on the nature of the investigation and on thetype of information required, one of the various forms of�-XRF may be employed.
Synchrotron (�-)XRF, offering ppm level detectabilityfor many elements,7 can be used for quantitative fin-gerprint analysis of materials in order to gain a betterunderstanding of their provenance. The use of a micro-scopic beam permits the detailed investigation of the pro-cesses that have altered the surface composition of thematerial. Although suitable for trace-level microanalysisof organic materials (e.g. paper, pigments dispersed in aorganic binder) or for silicate-rich materials such as pot-tery or glass, the high primary intensity of synchrotronmicrobeams is usually not compatible with the analysisof metallic materials (e.g. artifacts made of bronze, iron,silver, gold or alloys of these metals).
However, laboratory�-XRF can be conveniently usedfor this purpose. Another strong point of laboratory�-XRF is the possibility of performing local (quantitative)analysis on objects whose size, shape or nature is incom-patible with the vacuum and the small sample enclosuresemployed by most conventional microanalytical tech-niques such as EPXMA and�-PIXE. In this respect,�-XRF offers similar possibilities to external-beam PIXE,6
but with a better lateral resolution.Even for smaller objects (such as coins), which might
be analysed as a whole in a conventional XRF instrument,the use of a small beam instrument offers advantagesas only a small area of the (altered) surface needs tobe removed in order to expose the underlying originalmaterial. A small x-ray beam obviously also permits theanalysis of an object at various locations, e.g. to verifythat all parts of a statue are made of the same material, orto investigate the homogeneity of the material used. XRFon curved or otherwise non-flat surfaces can lead to errorsin quantification (especially for metallic materials);8 with
a small beam, it is in general easier to select locations onan object which resemble more closely to the ideal, flatand polished surface normally required for reproduciblequantitative measurements.
A recent direction in�-XRF instrument development isthe construction of compact small-beam instruments, con-sisting for example of an air-cooled mini-focus x-ray tube,a compact optical element for beam focusing/collimationand a Peltier-cooled energy-dispersive detector. The avail-ability of such instruments, offering beams of 50–200µmcross-section, will be very useful for thein situ investi-gation of archaeological and artistic materials, i.e. in themuseum, gallery or archaeological site where they are nor-mally located.
In this paper, after briefly describing the instrumentationemployed for the investigations, a number of case studieshighlighting the above-outlined types of investigations areoutlined. Most of there were performed at the authors’laboratories; the results of a number of other studies inthe same field, taken from the literature, are briefly citedin order to complete the overview.
MICRO-XRF EQUIPMENT EMPLOYED FORINVESTIGATIONS IN ART ANDARCHAEOMETRY
Synchrotron micro-XRF instrumentation
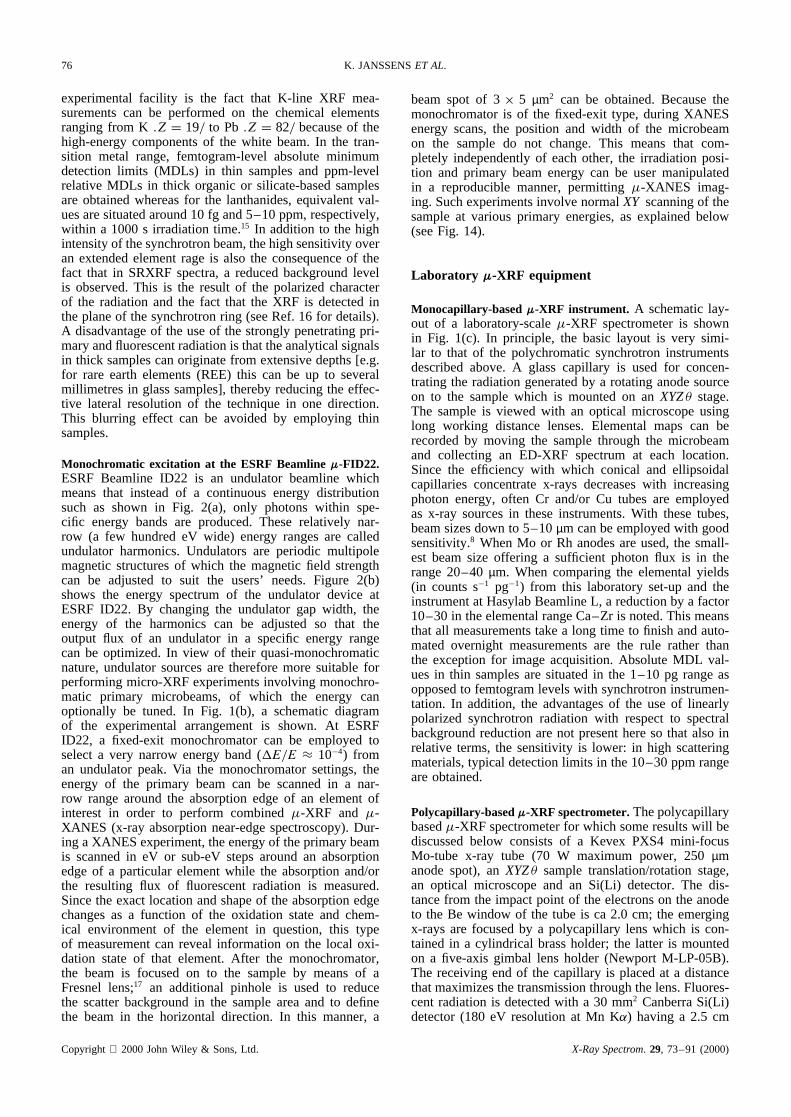
Polychromatic excitation at Hasylab Beamline L.The exper-imental set-up used for synchrotron micro-XRF mea-surements installed at Hasylab Beamline L in depictedschematically in Fig. 1(a). Figure 2(a) shows the energydistribution in the white beam, produced in a bendingmagnet source, as seen through a 10ð 10 µm pinhole,positioned at 20 m from the synchrotron ring. As can beseen in Fig. 2(a), bending magnets of the DORIS storagering produce a white spectrum which contains apprecia-ble amounts of very energetic photons (above 60 keV),which is not the case with many other synchrotron facili-ties, e.g., the NSLS (National Synchrotron Light Source,Upton, NY, USA).
The beam that originates from the storage ring is firstcollimated down to ca 100ð100µm2 by motorized cross-slits before entering the capillary. The latter is mounted ona motorizedXY�ϕ stage for alignment to the beam. Usu-ally, straight borosilicate glass capillaries of 10–50µmi.d. are employed for microbeam formation;9 the capil-lary–sample distance is typically of the order of a fewmillimetres. Through repeated total external reflection onthe inner walls of the tube, x-ray photons are transportedalong the length of the tubes; thus, straight capillaries actas effective apertures over a wide energy range. Sincemetal pinholes or cross-slit systems are not effective incollimating the high-energy portions of the white beam toa micro-spot with well-defined shape, straight capillariesare employed for this purpose. However, these devicesdo not ‘concentrate’ the x-ray beam. If ellipsoidal lead-glass capillaries are employed,10 the capillary is positionedis such a way that its tip is about 0.5–1 mm away fromthe sample surface. Inside ellipsoidal capillaries, the x-rayphotons are subject to only one or a few reflections andpart of the radiation is focused in this manner. The sample
Copyright 2000 John Wiley & Sons, Ltd. X-Ray Spectrom. 29, 73–91 (2000)
XRF NON-DESTRUCTIVE ANALYSIS IN ART AND ARCHAEOMETRY 75
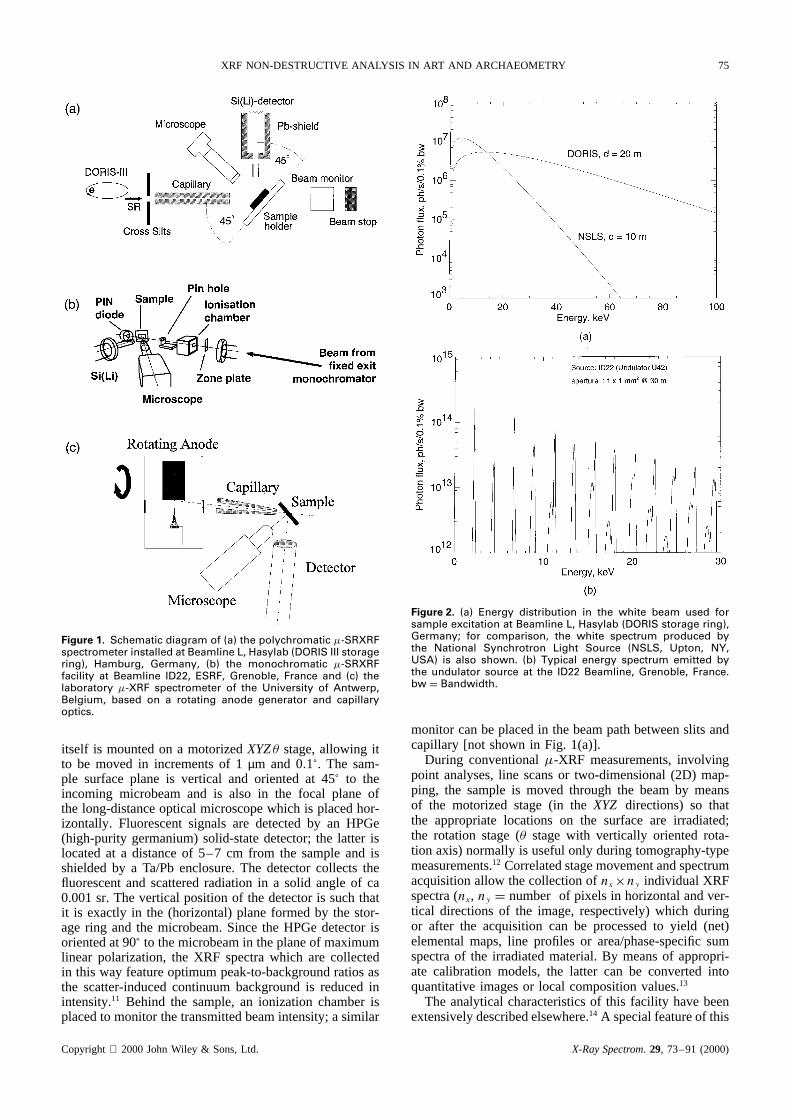
Figure 1. Schematic diagram of (a) the polychromatic �-SRXRFspectrometer installed at Beamline L, Hasylab (DORIS III storagering), Hamburg, Germany, (b) the monochromatic �-SRXRFfacility at Beamline ID22, ESRF, Grenoble, France and (c) thelaboratory �-XRF spectrometer of the University of Antwerp,Belgium, based on a rotating anode generator and capillaryoptics.
itself is mounted on a motorizedXYZ� stage, allowing itto be moved in increments of 1µm and 0.1°. The sam-ple surface plane is vertical and oriented at 45° to theincoming microbeam and is also in the focal plane ofthe long-distance optical microscope which is placed hor-izontally. Fluorescent signals are detected by an HPGe(high-purity germanium) solid-state detector; the latter islocated at a distance of 5–7 cm from the sample and isshielded by a Ta/Pb enclosure. The detector collects thefluorescent and scattered radiation in a solid angle of ca0.001 sr. The vertical position of the detector is such thatit is exactly in the (horizontal) plane formed by the stor-age ring and the microbeam. Since the HPGe detector isoriented at 90° to the microbeam in the plane of maximumlinear polarization, the XRF spectra which are collectedin this way feature optimum peak-to-background ratios asthe scatter-induced continuum background is reduced inintensity.11 Behind the sample, an ionization chamber isplaced to monitor the transmitted beam intensity; a similar
Figure 2. (a) Energy distribution in the white beam used forsample excitation at Beamline L, Hasylab (DORIS storage ring),Germany; for comparison, the white spectrum produced bythe National Synchrotron Light Source (NSLS, Upton, NY,USA) is also shown. (b) Typical energy spectrum emitted bythe undulator source at the ID22 Beamline, Grenoble, France.bw D Bandwidth.
monitor can be placed in the beam path between slits andcapillary [not shown in Fig. 1(a)].
During conventional�-XRF measurements, involvingpoint analyses, line scans or two-dimensional (2D) map-ping, the sample is moved through the beam by meansof the motorized stage (in theXYZ directions) so thatthe appropriate locations on the surface are irradiated;the rotation stage (� stage with vertically oriented rota-tion axis) normally is useful only during tomography-typemeasurements.12 Correlated stage movement and spectrumacquisition allow the collection ofnxðny individual XRFspectra (nx, ny D number of pixels in horizontal and ver-tical directions of the image, respectively) which duringor after the acquisition can be processed to yield (net)elemental maps, line profiles or area/phase-specific sumspectra of the irradiated material. By means of appropri-ate calibration models, the latter can be converted intoquantitative images or local composition values.13
The analytical characteristics of this facility have beenextensively described elsewhere.14 A special feature of this
Copyright 2000 John Wiley & Sons, Ltd. X-Ray Spectrom. 29, 73–91 (2000)
76 K. JANSSENSET AL.
experimental facility is the fact that K-line XRF mea-surements can be performed on the chemical elementsranging from K.Z D 19/ to Pb .Z D 82/ because of thehigh-energy components of the white beam. In the tran-sition metal range, femtogram-level absolute minimumdetection limits (MDLs) in thin samples and ppm-levelrelative MDLs in thick organic or silicate-based samplesare obtained whereas for the lanthanides, equivalent val-ues are situated around 10 fg and 5–10 ppm, respectively,within a 1000 s irradiation time.15 In addition to the highintensity of the synchrotron beam, the high sensitivity overan extended element rage is also the consequence of thefact that in SRXRF spectra, a reduced background levelis observed. This is the result of the polarized characterof the radiation and the fact that the XRF is detected inthe plane of the synchrotron ring (see Ref. 16 for details).A disadvantage of the use of the strongly penetrating pri-mary and fluorescent radiation is that the analytical signalsin thick samples can originate from extensive depths [e.g.for rare earth elements (REE) this can be up to severalmillimetres in glass samples], thereby reducing the effec-tive lateral resolution of the technique in one direction.This blurring effect can be avoided by employing thinsamples.
Monochromatic excitation at the ESRF Beamlinem-FID22.ESRF Beamline ID22 is an undulator beamline whichmeans that instead of a continuous energy distributionsuch as shown in Fig. 2(a), only photons within spe-cific energy bands are produced. These relatively nar-row (a few hundred eV wide) energy ranges are calledundulator harmonics. Undulators are periodic multipolemagnetic structures of which the magnetic field strengthcan be adjusted to suit the users’ needs. Figure 2(b)shows the energy spectrum of the undulator device atESRF ID22. By changing the undulator gap width, theenergy of the harmonics can be adjusted so that theoutput flux of an undulator in a specific energy rangecan be optimized. In view of their quasi-monochromaticnature, undulator sources are therefore more suitable forperforming micro-XRF experiments involving monochro-matic primary microbeams, of which the energy canoptionally be tuned. In Fig. 1(b), a schematic diagramof the experimental arrangement is shown. At ESRFID22, a fixed-exit monochromator can be employed toselect a very narrow energy band (E/E ³ 10�4) froman undulator peak. Via the monochromator settings, theenergy of the primary beam can be scanned in a nar-row range around the absorption edge of an element ofinterest in order to perform combined�-XRF and �-XANES (x-ray absorption near-edge spectroscopy). Dur-ing a XANES experiment, the energy of the primary beamis scanned in eV or sub-eV steps around an absorptionedge of a particular element while the absorption and/orthe resulting flux of fluorescent radiation is measured.Since the exact location and shape of the absorption edgechanges as a function of the oxidation state and chem-ical environment of the element in question, this typeof measurement can reveal information on the local oxi-dation state of that element. After the monochromator,the beam is focused on to the sample by means of aFresnel lens;17 an additional pinhole is used to reducethe scatter background in the sample area and to definethe beam in the horizontal direction. In this manner, a
beam spot of 3ð 5 µm2 can be obtained. Because themonochromator is of the fixed-exit type, during XANESenergy scans, the position and width of the microbeamon the sample do not change. This means that com-pletely independently of each other, the irradiation posi-tion and primary beam energy can be user manipulatedin a reproducible manner, permitting�-XANES imag-ing. Such experiments involve normalXY scanning of thesample at various primary energies, as explained below(see Fig. 14).
Laboratory m-XRF equipment
Monocapillary-basedm-XRF instrument. A schematic lay-out of a laboratory-scale�-XRF spectrometer is shownin Fig. 1(c). In principle, the basic layout is very simi-lar to that of the polychromatic synchrotron instrumentsdescribed above. A glass capillary is used for concen-trating the radiation generated by a rotating anode sourceon to the sample which is mounted on anXYZ� stage.The sample is viewed with an optical microscope usinglong working distance lenses. Elemental maps can berecorded by moving the sample through the microbeamand collecting an ED-XRF spectrum at each location.Since the efficiency with which conical and ellipsoidalcapillaries concentrate x-rays decreases with increasingphoton energy, often Cr and/or Cu tubes are employedas x-ray sources in these instruments. With these tubes,beam sizes down to 5–10µm can be employed with goodsensitivity.8 When Mo or Rh anodes are used, the small-est beam size offering a sufficient photon flux is in therange 20–40µm. When comparing the elemental yields(in counts s�1 pg�1) from this laboratory set-up and theinstrument at Hasylab Beamline L, a reduction by a factor10–30 in the elemental range Ca–Zr is noted. This meansthat all measurements take a long time to finish and auto-mated overnight measurements are the rule rather thanthe exception for image acquisition. Absolute MDL val-ues in thin samples are situated in the 1–10 pg range asopposed to femtogram levels with synchrotron instrumen-tation. In addition, the advantages of the use of linearlypolarized synchrotron radiation with respect to spectralbackground reduction are not present here so that also inrelative terms, the sensitivity is lower: in high scatteringmaterials, typical detection limits in the 10–30 ppm rangeare obtained.
Polycapillary-basedm-XRF spectrometer.The polycapillarybased�-XRF spectrometer for which some results will bediscussed below consists of a Kevex PXS4 mini-focusMo-tube x-ray tube (70 W maximum power, 250µmanode spot), anXYZ� sample translation/rotation stage,an optical microscope and an Si(Li) detector. The dis-tance from the impact point of the electrons on the anodeto the Be window of the tube is ca 2.0 cm; the emergingx-rays are focused by a polycapillary lens which is con-tained in a cylindrical brass holder; the latter is mountedon a five-axis gimbal lens holder (Newport M-LP-05B).The receiving end of the capillary is placed at a distancethat maximizes the transmission through the lens. Fluores-cent radiation is detected with a 30 mm2 Canberra Si(Li)detector (180 eV resolution at Mn K) having a 2.5 cm
Copyright 2000 John Wiley & Sons, Ltd. X-Ray Spectrom. 29, 73–91 (2000)

XRF NON-DESTRUCTIVE ANALYSIS IN ART AND ARCHAEOMETRY 77
Figure 3. Focusing characteristics of a polycapillary lens withoutput focal length of 4.5 cm. The beam width is the smallest (ca150 µm) at a distance of ca 42 mm from the end of the capillarylens.
diameter end-cap. In this case, a polycapillary lens manu-factured by the Institute for Low Energy Physics (BejingNormal University, Beijing, China) was employed. Asshown in Fig. 3, this lens focuses x-rays into a focal spotof ca 150µm at a distance of 4.5 cm from its output end.With lenses with shorter focal lengths (of ca 15 mm), focalspot sizes down to 50µm were obtained. The most strik-ing advantage of using polycapillary lenses is that a largefraction of the cone of radiation that emerges from thex-ray tube is collected by the lens. However, since the lensmostly consists of strongly curved capillary tubes, its effi-ciency is must higher at low energy (below 10–15 keV)than in the range 15–25 keV. Accordingly, this opticalelement strongly influences the excitation spectrum thatfinally impinges on the sample surface.18 In the 5–10 keVregion of the spectrum, this gives rise to a high scatterbackground but also to a high excitation efficiency. As aresult, although a highly intense sub-millimetre beam canbe created in this way, the relative detection limits of thisinstrument for transition metals in glass are situated at the30–100 ppm level. In metallic matrices such as bronze orsilver (strong matrix lines and strong self-absorption), theMDL values are around the 100 ppm level.
TRACE ELEMENT FINGERPRINTING
Trace analysis of ancient glass
Although not so frequently encountered at archaeologicalsites as metallic and stone artifacts, the use of objects insilicate glass has been known since prehistoric times. Spe-cific glass compositions can be associated with particulartime periods and geographical locations.19 It is recom-mended to employ a microanalytical method to determinethe chemical compositions since only a minute piece ofmaterial is required for analysis. If the analyses are per-formed on fragmented objects (as is mostly the case forglass vessels found during excavations), sampling of smallfragments of the material normally does not pose prob-lems. EPXMA can be used for major/minor element an-alysis down to ca 0.1% (w/w) (see, e.g., Ref. 20) but
does not provide information on traces. By performing�-XRF measurements on the same samples, the quantitativetrace element signature of the objects can be determined.In this manner, both techniques are employed in a com-plementary manner since�-XRF is not able to provideinformation on the low atomic number elements such asNa and Mg.
On the other hand, for the analysis of intact (museum)pieces, sampling usually is not possible, desired or permit-ted and non-destructive methods that are able to analyselarge objects with spatial resolution on the sub-millimetrescale are preferable, such as external beam PIXE. Sincemost�-XRF spectrometers operate in ambient air, theycan usually be employed for the local analysis of macro-scopic objects without great difficulty.
Roman glass.Glass from the Roman period (1st–6th cen-turies) has a low magnesium/low potassium soda-limecomposition,21 typically consisting of ca 66–72% SiO2,16–18% Na2O and 7–8% CaO. For Roman glass, themajor element composition can only be used to verifythat a particular fragment or object is genuinely Roman,but usually does not convey other information. The rea-son for this is that all the glass found throughout theRoman Empire from the 1st to the 6th century features anearly identical major element composition. As an exam-ple, Table 1 gives the average composition of a numberof glass fragments found at the Khirbet Qumran site inIsrael;22 in total, about 100 different objects of variousshapes were found at this site and analysed. In Fig. 4the dendrogram obtained by hierarchical cluster analysisof the elemental data is shown. Two large groups maybe discerned, of which the largest may be further subdi-vided. The average composition of the groups is given inTable 1. Comparison of the average compositions revealsa significant difference only in the CaO content (8% forgroup 1 and 5% for group 2), which may be related to theorigin of the natron (an Na2CO3-rich deposit used a rawmaterial for the glass making).
To verify the compositional homogeneity of the glassin both groups, in addition to EPXMA measurements,the trace compositions (down to the 1–10 ppm level) ofthe fragments were determined by�-SRXRF. Details onthe calibration procedure applied and on its accuracy canbe found elsewhere.23 When also the trace concentrationsare employed for performing a cluster analysis, the twogroups previously found are obtained, except that withingroup 1 (Ca-rich), a subgroup containing five objects witha much lower Sb concentration is identified (group 1b).The distinction between groups 1 and 2 can now be madeclearer since in the trace-element fingerprint, significantdifferences in the average concentrations of Cu, Sn, Pband Sb are found. All these elements are associated withthe colour of the glass: Cu, Sn and Pb probably originatefrom bronze chips which may have been intentionallyadded to the glass melt to give it a green colour; Sbwas used to decolorize the glass and give it a clear,transparent appearance. Together, major and trace-elementdata indicate that the entire series of ca 100 glass vesselsfound at the Qumran site originated from one or twoworkshops and were probably purchased together. Thisinformation supports the hypothesis24 that at this siteperfumes and ointments were manufactured on a large
Copyright 2000 John Wiley & Sons, Ltd. X-Ray Spectrom. 29, 73–91 (2000)

78 K. JANSSENSET AL.
Table 1. Compositional categories found in a series ofRoman glass samples from Qumran, Israela
ConstituentConcentration Group 1a Group 1b Group 2(%, w/w) (n D 45) (n D 5) (n D 9)
Na2O 16.38š 0.4 16.28š 0.6 17.2š 0.35MgO 0.23š 0.13 0.07š 0.13 0.01š 0.01Al2O3 2.5š 0.1 2.4š 0.1 2.4š 0.3SiO2 69.5š 0.6 70.9š 1.6 71.7š 0.4P2O5 0.08š 0.04 0š 0 0.02š 0.04SO3 0.16š 0.11 0.2š 0.07 0.17š 0.07Cl 0.82š 0.07 1.06š 0.05 1.16š 0.05K2O 0.84š 0.06 0.61š 0.11 0.58š 0.12CaO 8.41š 0.6 7.54š 0.42 5.52š 0.6TiO2 0.05š 0.04 0.02š 0.02 0.04š 0.04MnO 0.43š 0.06 0.09š 0.09 0.84š 0.13Fe2O3 0.52š 0.06 0.39š 0.13 0.33š 0.04
Concentration (ppm, w/w)
Cr2O3 12š 12 9š 8 23š 27NiO 7š 5 8š 8 15š 7CuO 209š 95 83š 137 50š 43ZnO 35š 19 18š 13 26š 7Br 7š 11 7š 4 8š 7Rb2O 14š 4 13š 3 12š 3SrO 637š 145 570š 137 534š 130Y2O3 9š 2 8š 3 6š 1ZrO2 79š 17 59š 15 63š 16Mo2O3 3š 2 0š 0 3š 1SnO2 113š 49 52š 21 56š 34Sb2O5 354š 190 1š 1 29š 31BaO 234š 127 151š 92 151š 59PbO 156š 64 13š 9 17š 14
a Uncertainties represent the standard deviation of concentrationin each group.
scale, requiring large numbers of small glass vessels ascontainers.
Three hypotheses have been formulated to explain theexceptional chronological and geographical constancy inthe composition of Roman glass:25 – 27
(a) all the Roman glass was manufactured in one or a fewsites (primary workshops) in the Middle East (Syriaor the northern part of Egypt) and shipped in ingotsall over the Empire for remelting and modeling intovarious shapes (secondary workshops);
(b) glass manufacture was strictly controlled and wasalways done with the same (high-quality) raw materi-als; and
(c) extensive recycling of glass took place.
In order to evaluate these hypotheses, a systematic studyinvolving five Roman sites in Belgium (Tongeren, Ouden-burg), The Netherlands (Maastricht), France (Rouen) andGermany (Cologne, Trier) and the analysis of over 250glass fragments was undertaken; see Ref. 28 for details ofthe sites and the analytical results obtained. From thesedata, several conclusions could be drawn:
ž with the exception of minor and trace elements relatedto the colour of the glass (Al, Mn, Fe, Cu, Zn, Pb,Sn, Sb),29 all investigated glass objects show the samecomposition; This indicates that over a period of 600years the glass was always prepared with the same orvery similar raw materials;
ž whereas in the 1st–4th centuries Sb was used as a glassdecolorizer, in later periods it was no longer used andwas replaced by Mn;30,31
ž glass from the later period (5th–6th centuries) in gen-eral contains a higher content of trace constituents thanthe earlier glass;ž at various sites, indications are found of the intentional
use of brass (Cu–Zn) or bronze (Cu–Sn–Pb) or relatedores for colouring the glass.31
These observations in general support hypothesis (a)and disprove hypothesis (b), while in the later centuriesevidence of extensive recycling, together with certainchanges in glass technology, is also found.
In this particular case, the ability of�-SRXRF to extracttrace element data on medium to heavy metals (Fe–Ba)down to the ppm level from minute glass fragments wasfound to be very valuable.
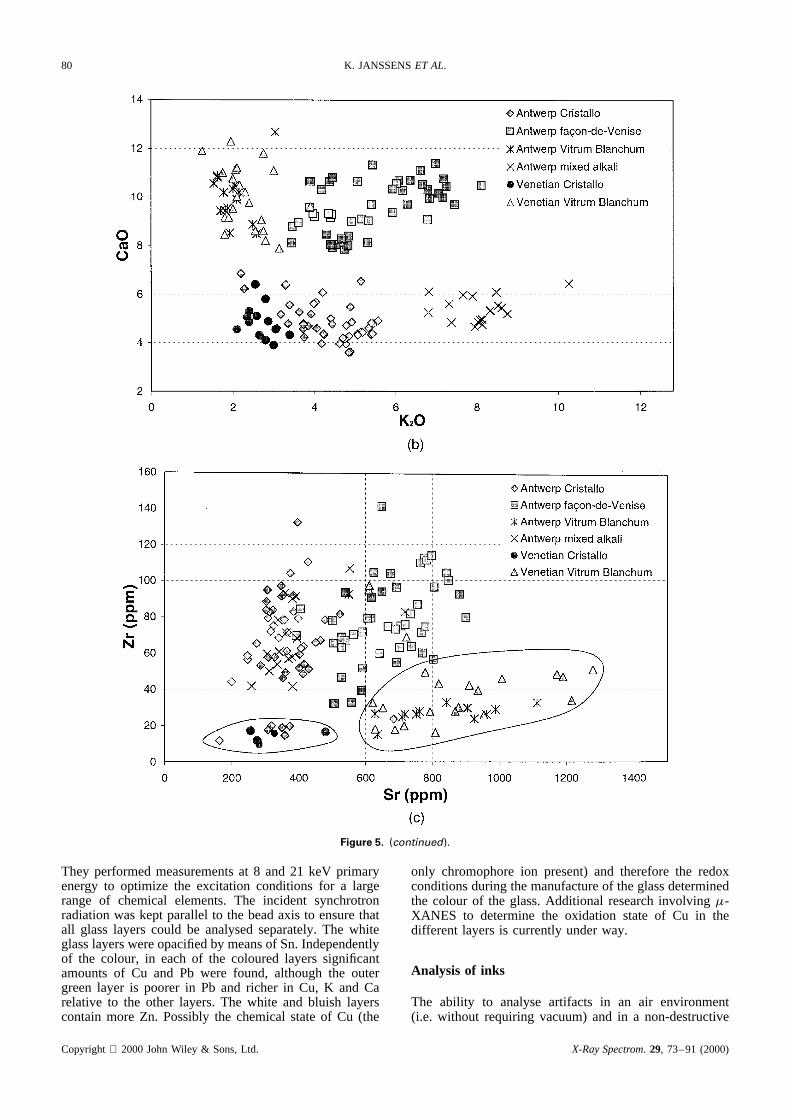
Post-medieval glass.The complementary nature of EPXMAand�-SRXRF is also illustrated in Fig. 5, which showsmajor and trace element scatter plots of a series of dif-ferent 16th–17th century soda-lime glass fragments exca-vated in various sites in the historic centre of Antwerp,Belgium.32 Figure 5(a) shows a few typical shapes of post-mediaeval soda-lime vessels. In contrast to the Romanperiod, during the Mediaeval and post-mediaeval period,glass of widely different composition is used. In additionto (usually colourless) soda-lime glass, green forest glass(containing no Na2O but 20–25% CaO and 5–10% K2O)and yellowish green fern glass (with, e.g., 10–15% K2Oand 10% CaO) are frequently encountered33 in addition tomixtures of the above glass types. Because of these largedifferences in major composition, trace element data arenot directly required to obtain information on the generalorigin of the glass. However, within each of the large com-positional groups, information on minor/trace constituentssuch as Sr, Rb, Zr, Sn, Sb and Pb was found to be use-ful for making more subtle distinctions (see Ref. 32 fordetails). As an example, in Fig. 5(b) the Na2O vs CaOplot of major elements concentrations found in a seriesof 250 post-mediaeval soda-lime vessels excavated inAntwerp reveals five distinct groups. Two groups (labelled‘Antwerp Cristallo’ and ‘Vitrum Blanchum’) show majorcompositions nearly identical with those of establishedglass compositions fabricated in Venice in this period,34
suggesting that these objects might be imported; threeother groups appear to be specific for the Antwerp pro-duction. At first sight, the proportion of the Cristallo andVitrum Blanchum groups appears to be important amongthe Antwerp finds; this is surprising since in other studieson glass fragments excavated in cities such as London andAmsterdam, only very rarely was glass having the specific‘Cristallo’ composition found. In order to investigate ingreater detail whether the Antwerp Cristallo objects wereindeed made with the same raw materials as genuine Vene-tian vessels (very pure silica pebbles and purified ashes ofspecific marine plants), trace analysis of the same minuteglass fragments (previously used for major element analy-sis by EPXMA) was performed by SRXRF at the HasylabBeamline L facility. In addition, a number of glass frag-ments excavated in the Venice Lagoon were put at ourdisposal by M. Verita and P. McCray and also analysed asa reference. Inspection of the trace element data revealed
Copyright 2000 John Wiley & Sons, Ltd. X-Ray Spectrom. 29, 73–91 (2000)

XRF NON-DESTRUCTIVE ANALYSIS IN ART AND ARCHAEOMETRY 79
Figure 4. Dendrogram obtained by clustering the major element data obtained from a number of the Qumran glass artefacts. Twolarge groups (1 and 2) are present; in their major composition, they differ significantly only in Ca content. Sample identificationnumbers and vessel types are shown below the dendrogram.
that especially the Zr content of the glass can be used todistinguish between the glass vessels of Venetian and non-Venetian origin found in Antwerp: whereas the majority ofthe Antwerp finds feature a ZrO2 content between 40 and100 ppm, the truely Venetian fragments and a very limitednumber of Antwerp finds show a significantly lower ZrO2
concentration in the range 10–20 ppm.
The graph in Fig. 5(c) illustrates the usefulness of traceelement data for making subtle compositional distinctionsbetween cultural heritage artifacts of different provenance.
By making use of the LURE microprobe, Figueiredoet al.35 characterized rare Mediterranean elongated glassbeads composed of five identifiable successive concentriclayers of different colours: white, red, green and blue.
Figure 5. (a) Typical shapes, (b) Na2O/CaO (%, w/w) and (c) Zr/Sr concentration scatter plots (ppm) of different types of 15–17th centuryglass objects excavated in Antwerp, Belgium. The relative uncertainty is ca 5% on the major element concentrations is and ca 10% onthe trace concentrations. Circled fields in denote the majority of the genuinely Venetian ‘Cristallo’ and ‘Vitrum Blanchum’ objects.
Copyright 2000 John Wiley & Sons, Ltd. X-Ray Spectrom. 29, 73–91 (2000)
80 K. JANSSENSET AL.
Figure 5. (continued).
They performed measurements at 8 and 21 keV primaryenergy to optimize the excitation conditions for a largerange of chemical elements. The incident synchrotronradiation was kept parallel to the bead axis to ensure thatall glass layers could be analysed separately. The whiteglass layers were opacified by means of Sn. Independentlyof the colour, in each of the coloured layers significantamounts of Cu and Pb were found, although the outergreen layer is poorer in Pb and richer in Cu, K and Carelative to the other layers. The white and bluish layerscontain more Zn. Possibly the chemical state of Cu (the
only chromophore ion present) and therefore the redoxconditions during the manufacture of the glass determinedthe colour of the glass. Additional research involving�-XANES to determine the oxidation state of Cu in thedifferent layers is currently under way.
Analysis of inks
The ability to analyse artifacts in an air environment(i.e. without requiring vacuum) and in a non-destructive
Copyright 2000 John Wiley & Sons, Ltd. X-Ray Spectrom. 29, 73–91 (2000)

XRF NON-DESTRUCTIVE ANALYSIS IN ART AND ARCHAEOMETRY 81
manner makes�-XRF especially suitable for the analy-sis of inks or other types of metal-containing pigmentedmaterials deposited on fragile and easily damaged mate-rials such as paper or parchment.
Trace analysis of early printing inks. Knochel and Haller36
and Mommsenet al.37 compared the concentrations ofCu and Pb in ink of the Gutenberg Bible with that ofother early single leaf copies and books. The pioneeringwork with PIXE by Cahill and co-workers38,39 identifiedthe analysis of ink as a new research tool for the his-tory of early printing (from the second half of the 15thcentury).40,41 It is assumed that each printer/printing officecan be recognized by a specific ink preparation as reflectedin the trace element signature of the dried ink. The recipesfor the ink were kept as a secret; in the 15th century, nota single specification of composition is documented.42
Mommsenet al.37 employed a 0.5ð 1 mm polychro-matic x-ray beam derived from the synchrotron storagering ELSA (Bonn, Germany) for irradiating single leavesof early 15th century printed paper. Ink and paper of 22different works from different locations in Germany, Italyand Switzerland were analysed. The energy deposited inthe paper during the measurements (300 s) was estimatedto be ca 15µW cm�2, i.e. about a factor of 70 lower thanbright sunlight.
Comparison of the spectra from paper and paper–inkcombinations from page II, 316 of the single leaf 42-lineGutenberg Bible revealed that Ni, Cu and Pb are present inthe ink at concentration levels of a few tens ofµg cm�2,whereas K, Ca, Ti, Mn, Fe and Zn originate from thepaper base.
In six of the 22 leaves, printed areas could not be distin-guished from blank areas, suggesting that the correspond-ing inks were prepared from mainly C-bearing materialsuch as lampblack or soot.42 In some of the other inks, inaddition to Ni, Cu and Pb, also K, Ca and Fe were present.On all pages analysed except the Gutenberg leaf, the sameink composition on the recto and verso sides were found.On the recto side of the Gutenberg B-42 leaf, the inkthickness was ca three times larger than on the verso side,although both sides show the same Cu/Pb and Ni/Pb ratios(1.0š 0.5 and 0.007š 0.003, respectively). For the samepage (II, 316) of the Harvard Gutenberg Bible, by meansof PIXE recto and verso Cu/Pb ratios of 1.15š 0.05 and1.44š 0.07, respectively were reported.37 – 40
For three specific printers, the constancy of their inkcomposition over large time intervals was tested byanalysing leaves of several books produced by them. Theyappear to have changed the composition of their inks fairlyfrequently. It therefore appears difficult to establish a def-inite trace element pattern specific for one printer. Whenonly the trace elements which occur in the ink alone (andnot in the paper) are considered, only Pb and Cu con-centrations can be used for distinguishing between earlyprinters.
As a result of this study, Mommsenet al.37 concludedthat a systematic investigation of the ink composition inworks printed 10–15 years after Gutenberg’s first Bibleedition is needed to learn more about the early recipesfor ink preparation and to find specific reasons for thepresence of metallic impurities in the ink. The SRXRFmethod was found to be suitable for non-destructive mea-surements on this fragile type of material and appropriate
for performing the large number of measurements requiredto reveal systematic trends in the composition of paper andinking.37
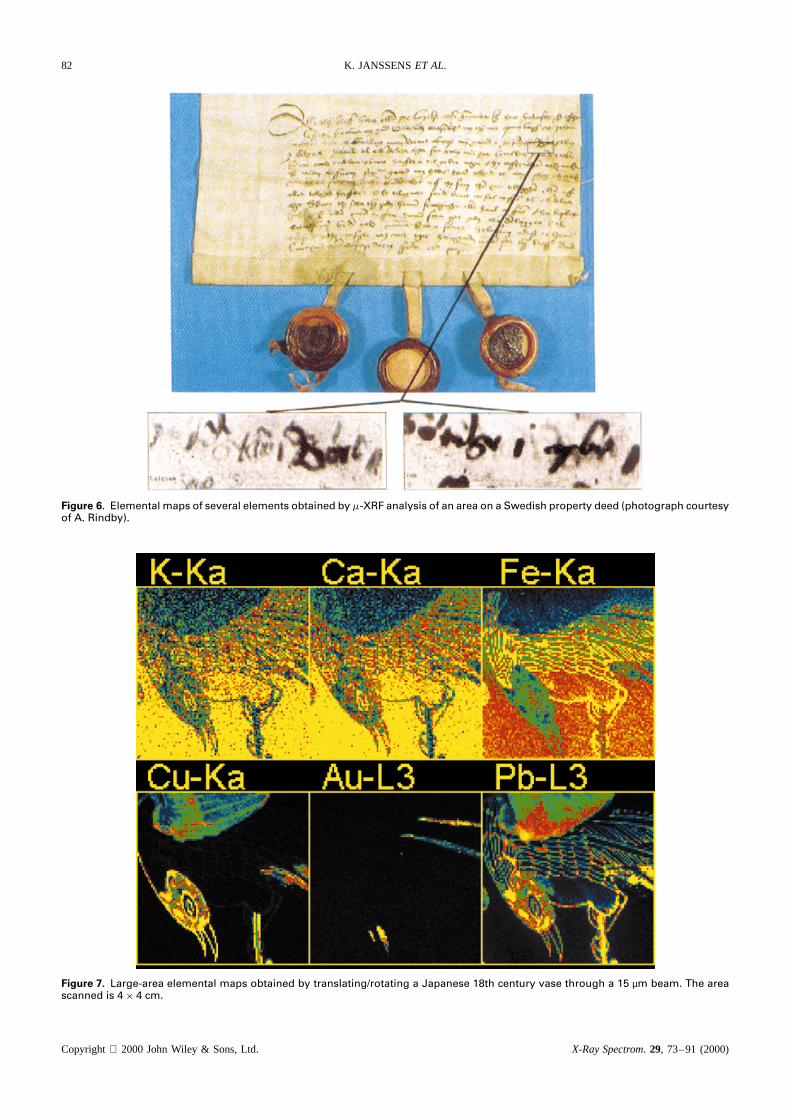
Visualization of invisible handwriting on historic documents.In addition to SR-XRF, laboratory�-XRF is also an excel-lent technique for the analysis of valuable documents, forexample to determine their authenticity. Typically, dif-ferent inks, while having the same visible appearance,will have different chemical compositions. Larsson43 andStocklassa and Nillson44 described analysis by�-XRF ofa 500-year-old Swedish possession letter (dated April l,1499). The document, a sales contract for an estate,showed signs of alterations. It was suspected that the alter-ation was made in the 1530s, when the Swedish kingrestored land back to certain nobles, who previously hadbeen stripped of their estates by an earlier ruler. Althoughalteration was suspected by visual inspection (the origi-nal name of the owner had been removed by scraping),the original text was unreadable. By employing�-XRF-generated Zn maps (a trace constituent of the original ink),the original name could be established, however. In Fig. 6,�-XRF scans of Ca and Zn are shown across a selectedarea of the parchment. In the Ca map, the (falsified) visibletext can be seen, featuring the family name ‘Gasmestad iBore’; in the Zn map of the same area, however, a com-pletely different text reading ‘Bøtinge i Asbo’ becomesvisible. Obviously, the forger used different ink for thealteration, accounting for the change in chemical makeup.
Local analysis of macroscopic objects
Enamel decorations.An area in which authentication ofart objects is of considerable (economical) interest in thatof Oriental china ware. Up to the 17th century, high-quality porcelain was exclusively manufactured in Chinaand Japan and imported china ware was highly valued andexpensive. In the later periods an extensive productionsystem of counterfeit Chinese and/or Japanese porcelainboth in Europe and in Asia came into existence. Someof the reproductions are very sophisticated and cannotbe easily distinguished from the original counterparts byvisual inspection alone.
Objective ways of distinguishing between original pe-riod and more contemporary reproductions have untilnow focused on the porcelain base material itself.34,35
A complementary approach is to consider the composi-tion of the enamel paints used to decorate the objects.In view of the size and shape of the pieces, this typeof analysis is difficult to perform using scanning elec-tron microscopy equipped with energy-dispersive X-raydetection (SEM–EDX), while the intricacy of the deco-ration patterns usually precludes the use of conventionalXRF. However,�-XRF analysis of individual decorationsis feasible.
As detailed earlier,9 by employing a monocapillary-based instrument, it is possible to record large-scale�-XRF maps of these decorations and to determine whichtransition elements (e.g. Mn, Fe, Cu) were employed tocolour the PbO-based enamel paint. As an example, Fig. 7shows large-scale (4ð4 cm) x-ray maps of a painted figureon the vase shown in Fig. 8. To record these images, thevase was mounted on a rotation table so that surface of
Copyright 2000 John Wiley & Sons, Ltd. X-Ray Spectrom. 29, 73–91 (2000)
82 K. JANSSENSET AL.
Figure 6. Elemental maps of several elements obtained by �-XRF analysis of an area on a Swedish property deed (photograph courtesyof A. Rindby).
Figure 7. Large-area elemental maps obtained by translating/rotating a Japanese 18th century vase through a 15 µm beam. The areascanned is 4ð 4 cm.
Copyright 2000 John Wiley & Sons, Ltd. X-Ray Spectrom. 29, 73–91 (2000)

XRF NON-DESTRUCTIVE ANALYSIS IN ART AND ARCHAEOMETRY 83
the object maintained a constant distance to the capil-lary tip and detector. The various types of enamel paint[based on lead oxide as fluxing agent and coloured withtransition metals such as Fe (red), and Cu (green/black)]can be clearly distinguished, in addition to the presenceof decorative gold details. The K and Ca signals from thefeldspar glaze are absorbed by the enamel paint. It appearsthat originally these vases were only decorated with a fewsimple blossoms (see Fig. 8, rightmost flower) but thatlater more decorations were added using enamel paint ofsimilar colour. It was possible to distinguish between orig-inally present and add-on decorations of the same colouron the basis of the local XRF spectra.9
Coins and statues.Brissaudet al.45 compared SRXRF (asimplemented in the LURE�-XRF facility) at 17 and35 keV excitation energy, PIXE and neutron activationanalysis (NAA) for the analysis of gallic coins having aCu–Ag–Sn matrix composition. The aim of the investi-gation was to make a comparison of the data obtainedfrom the surface of the coins with SRXRF and PIXE tothat obtained from the bulk of the samples with NAA. At17 keV, in this matrix, the 1/e penetration depth of x-ray
photons is 30µm and at 35 keV it is 70µm; 2 MeV protonspenetrate about 12µm in this material. Some of the quan-titative data are shown in Fig. 9. Few differences in thesurface concentrations using the three beam methods wereobserved; however, a large discrepancy with the NAAresults was obtained. Compared with the bulk results, avery important enrichment of Ag together with a decreasein Cu can be observed; this effect is especially importantfor the Ag-rich coins.
Next to the Ag-enriched sub-surface layer, on top ofthe upper surface of silver coins dark stains, enriched inCu and other elements such as Fe, S and Cl, can alsooccur. This may be the result of a heat treatment, causingCu from within the bulk to rise to the surface, because ofoxidation of the silver by atmospheric gases leading to theformation of black Ag2S or AgCl precipitates or simplyas a result of mechanical wear and soiling during the useof the coins.
To illustrate this, Fig. 10 shows elemental maps col-lected with the polycapillary-based system from a Belgiansilver coin of 1901, showing a royal portrait in relief. Inthe Compton and Rayleigh maps, showing the variation
Figure 8. Photograph of a Japanese 18th century vase.
Copyright 2000 John Wiley & Sons, Ltd. X-Ray Spectrom. 29, 73–91 (2000)

84 K. JANSSENSET AL.
Figure 9. Quantitative data obtained from three Gallic coins by means of (a) SR-XRF at 17 keV primary energy (hatched bar), (b) at35 keV (striped bar), (c) 2 MeV PIXE (full bar) and (d) neutron activation analysis (empty bar).
Figure 10. Optical photograph (left) and x-ray maps (right) of Cu, Ag and the scatter peak intensities obtained from a 19th centuryBelgian silver coin. The scanned area is 10ð 5 mm. The maps labelled ‘Compton’ and ‘Rayleigh’ show the variation of the scatter peakintensities throughout the scanned area, highlighting the surface topology. Low intensity values are denoted by blue colours, mediumintensities by green and high intensities by red.
Copyright 2000 John Wiley & Sons, Ltd. X-Ray Spectrom. 29, 73–91 (2000)
XRF NON-DESTRUCTIVE ANALYSIS IN ART AND ARCHAEOMETRY 85
of the scatter peak intensity throughout the scanned area,the surface topology is clearly visible. At strongly curvedareas of the coin surface (facial features of portrait), wherethe take-off angle of the radiation towards the detector issmaller than 45°, the absorption path of the scattered radi-ation inside the metal is longer. Accordingly, these areashave a lower intensity in the scatter intensity maps. In theCu maps, an area showing a much higher Cu signal canbe seen; this area corresponds to a blackish stain on thecoin surface. In none of the different areas on the coinhowever, was the correct Cu/Ag ratios found: inside thestain, the ratio is overestimated (too much Cu), while out-side it, an excess of Ag is observed, even when the morepenetrant Ag K radiation is used to determine the Ag con-tent. This necessitates the removal of some of the uppersurface layers to allow analysis of the underlying alloy.
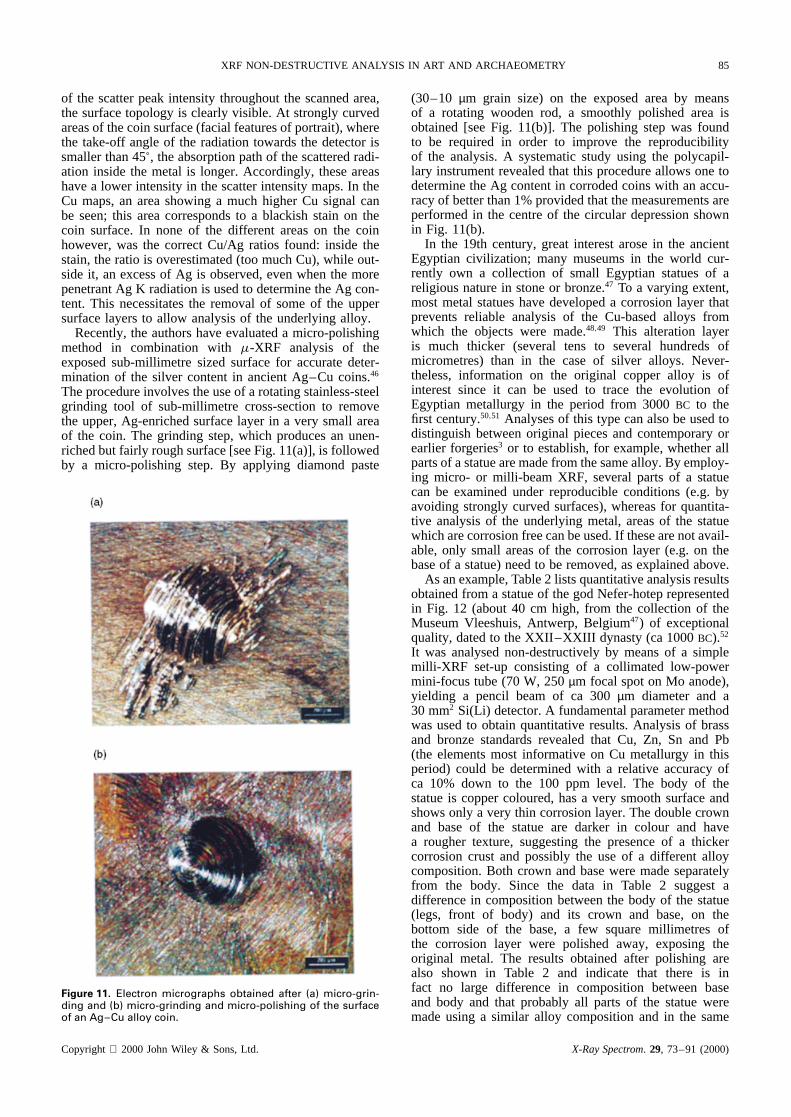
Recently, the authors have evaluated a micro-polishingmethod in combination with�-XRF analysis of theexposed sub-millimetre sized surface for accurate deter-mination of the silver content in ancient Ag–Cu coins.46
The procedure involves the use of a rotating stainless-steelgrinding tool of sub-millimetre cross-section to removethe upper, Ag-enriched surface layer in a very small areaof the coin. The grinding step, which produces an unen-riched but fairly rough surface [see Fig. 11(a)], is followedby a micro-polishing step. By applying diamond paste
Figure 11. Electron micrographs obtained after (a) micro-grin-ding and (b) micro-grinding and micro-polishing of the surfaceof an Ag–Cu alloy coin.
(30–10 µm grain size) on the exposed area by meansof a rotating wooden rod, a smoothly polished area isobtained [see Fig. 11(b)]. The polishing step was foundto be required in order to improve the reproducibilityof the analysis. A systematic study using the polycapil-lary instrument revealed that this procedure allows one todetermine the Ag content in corroded coins with an accu-racy of better than 1% provided that the measurements areperformed in the centre of the circular depression shownin Fig. 11(b).
In the 19th century, great interest arose in the ancientEgyptian civilization; many museums in the world cur-rently own a collection of small Egyptian statues of areligious nature in stone or bronze.47 To a varying extent,most metal statues have developed a corrosion layer thatprevents reliable analysis of the Cu-based alloys fromwhich the objects were made.48,49 This alteration layeris much thicker (several tens to several hundreds ofmicrometres) than in the case of silver alloys. Never-theless, information on the original copper alloy is ofinterest since it can be used to trace the evolution ofEgyptian metallurgy in the period from 3000BC to thefirst century.50,51 Analyses of this type can also be used todistinguish between original pieces and contemporary orearlier forgeries3 or to establish, for example, whether allparts of a statue are made from the same alloy. By employ-ing micro- or milli-beam XRF, several parts of a statuecan be examined under reproducible conditions (e.g. byavoiding strongly curved surfaces), whereas for quantita-tive analysis of the underlying metal, areas of the statuewhich are corrosion free can be used. If these are not avail-able, only small areas of the corrosion layer (e.g. on thebase of a statue) need to be removed, as explained above.
As an example, Table 2 lists quantitative analysis resultsobtained from a statue of the god Nefer-hotep representedin Fig. 12 (about 40 cm high, from the collection of theMuseum Vleeshuis, Antwerp, Belgium47) of exceptionalquality, dated to the XXII–XXIII dynasty (ca 1000BC).52
It was analysed non-destructively by means of a simplemilli-XRF set-up consisting of a collimated low-powermini-focus tube (70 W, 250µm focal spot on Mo anode),yielding a pencil beam of ca 300µm diameter and a30 mm2 Si(Li) detector. A fundamental parameter methodwas used to obtain quantitative results. Analysis of brassand bronze standards revealed that Cu, Zn, Sn and Pb(the elements most informative on Cu metallurgy in thisperiod) could be determined with a relative accuracy ofca 10% down to the 100 ppm level. The body of thestatue is copper coloured, has a very smooth surface andshows only a very thin corrosion layer. The double crownand base of the statue are darker in colour and havea rougher texture, suggesting the presence of a thickercorrosion crust and possibly the use of a different alloycomposition. Both crown and base were made separatelyfrom the body. Since the data in Table 2 suggest adifference in composition between the body of the statue(legs, front of body) and its crown and base, on thebottom side of the base, a few square millimetres ofthe corrosion layer were polished away, exposing theoriginal metal. The results obtained after polishing arealso shown in Table 2 and indicate that there is infact no large difference in composition between baseand body and that probably all parts of the statue weremade using a similar alloy composition and in the same
Copyright 2000 John Wiley & Sons, Ltd. X-Ray Spectrom. 29, 73–91 (2000)

86 K. JANSSENSET AL.
Table 2. Quantitative results (concentration, % w/w) local analysis of different locations on the statue shown in Fig. 12
Body
Crown Base (unpolished) Base (polished)Right HeadElement leg Front band Lower Upper Front Back Bottom A Bottom A Bottom B Bottom C
Fe 0.12 0.14 0.25 0.09 0.09 0.11 0.11 0.15 0.09 0.07 0.08Cu 81.2 82 76.5 72.8 75.8 72.6 70.7 71.4 80 84.9 84.8Ag 0.05 0.04 0.12 0.18 0.13 0.17 0.19 0.13 0.07 0.06 0.06Sn 13.7 12.9 14.8 19.8 17.5 22.3 21.6 21 15.3 12.2 12.2Pb 4.8 4.5 7.6 6.5 6.2 4.3 7 6.7 4.6 2.5 2.5
Figure 12. Photograph of a statue of the god Nefer-hotep(Museum Vleeshuis, Antwerp, Belgium) dated to the XXII orXXIIIth dynasty. The height of the statue is ca 25 cm.
workshop. Patinas of bronze objects of this kind generallyare found to contain less Cu and more Pb and Sn than theoriginal alloy.53 The compositions found after polishingare consistent with literature data on this type of materialand period.
It is clear that the possibilities for non-destructiveanalysis of�-XRF can contribute significantly to a betterunderstanding of ancient metallurgical techniques whilerequiring minimal interventions on the objects themselves.
In the period 1824–1828, Russia issued about 15 tonsof platinum coins of 3, 6 and 12 roubles in an attempt toemploy its Uralian ore resources. These coins are con-sidered to be numismatic peculiarities and have there-fore become collectors’ items. After their withdrawal,
additional mintings took place (called ‘Novodel’ mint-ings) until 1890, and during a long period after that aconsiderable number of falsifications were also made. Tomake the original coins, the natural Pt alloys containingca 75% (w/w) Pt had to be refined to obtain a techni-cally pure platinum powder for forging and minting. ThePt powder also contained irregularities of various naturesuch as gold- and copper-rich inclusions. Aueret al.54
used several analytical techniques such as electron probex-ray microanalysis,�-XRF, conventional WD-XRF andXRD for analysing seven of these coins. Six of the coinswere found to contain considerable quantities of elementsother than Pt, mostly Fe, Ir and Ni. Only one coin, datedto 1828, was found to consist of technically pure Pt. Thiscoin originated from a Novodel minting and was probablystruck at the end of the 19th century. The laboratory-builtmicro-XRF facility at the Institut fur Spectrometrie undAngewandte Spectroskopie (ISAS, Dortmund, Germany)was used to analyse the gold inclusions in a coin mintedin 1838. These inclusions are indicators of some form of‘mechanical dilution’ of the refined platinum with naturalPt alloys prior to its minting, probably indicating fraudu-lent practices.
Beyond compositional microanalysis
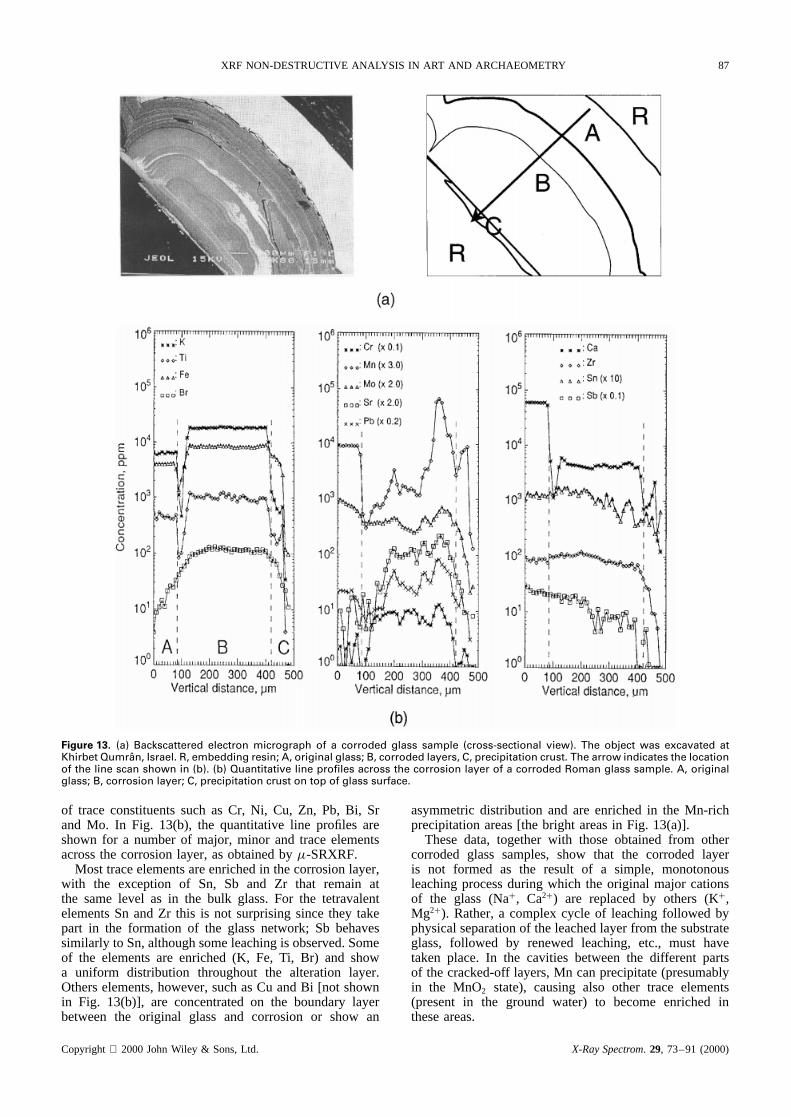
Glass corrosion. In Fig. 13(a), a backscattered electronmicrograph and x-ray maps are shown of a cross-sectionedfragment of one of the Roman glass fragments fromthe Qumran site (see above). It was buried in moistJordanian soil for about 1900 years.22,55 As a result of theinteraction with ground water during this period, a leachedor corroded layer was produced, in which a number of theoriginal cations of the glass (mainly NaC, KC and Ca2C)were replaced by protons and other dissolved cations fromthe groundwater. Owing to a number of other physical andchemical processes that have occurred inside the leachedlayer and in the surface crust on top of the originalsurface, a chemically and physically complex multilayeredstructure was formed. For example, in Fig. 13(a) a parallelcorrosion front next to a hemispherical corrosion body canbe distinguished.
In order to obtain a better understanding of the mech-anisms that led to the formation of these complex struc-tures, the distribution and migratory patterns of various(trace) elements (e.g. Mn, Bi, Sr and Zr) should be deter-mined and correlated with their ionic size and nature oftheir bonding to the glass network structure in the variouslayers.29 A comparison of elemental maps generated by�-XRF and�-PIXE9 indicated that both techniques provideapproximately equivalent information on the distribution
Copyright 2000 John Wiley & Sons, Ltd. X-Ray Spectrom. 29, 73–91 (2000)
XRF NON-DESTRUCTIVE ANALYSIS IN ART AND ARCHAEOMETRY 87
Figure 13. (a) Backscattered electron micrograph of a corroded glass sample (cross-sectional view). The object was excavated atKhirbet Qumran, Israel. R, embedding resin; A, original glass; B, corroded layers, C, precipitation crust. The arrow indicates the locationof the line scan shown in (b). (b) Quantitative line profiles across the corrosion layer of a corroded Roman glass sample. A, originalglass; B, corrosion layer; C, precipitation crust on top of glass surface.
of trace constituents such as Cr, Ni, Cu, Zn, Pb, Bi, Srand Mo. In Fig. 13(b), the quantitative line profiles areshown for a number of major, minor and trace elementsacross the corrosion layer, as obtained by�-SRXRF.
Most trace elements are enriched in the corrosion layer,with the exception of Sn, Sb and Zr that remain atthe same level as in the bulk glass. For the tetravalentelements Sn and Zr this is not surprising since they takepart in the formation of the glass network; Sb behavessimilarly to Sn, although some leaching is observed. Someof the elements are enriched (K, Fe, Ti, Br) and showa uniform distribution throughout the alteration layer.Others elements, however, such as Cu and Bi [not shownin Fig. 13(b)], are concentrated on the boundary layerbetween the original glass and corrosion or show an
asymmetric distribution and are enriched in the Mn-richprecipitation areas [the bright areas in Fig. 13(a)].
These data, together with those obtained from othercorroded glass samples, show that the corroded layeris not formed as the result of a simple, monotonousleaching process during which the original major cationsof the glass (NaC, Ca2C) are replaced by others (KC,Mg2C). Rather, a complex cycle of leaching followed byphysical separation of the leached layer from the substrateglass, followed by renewed leaching, etc., must havetaken place. In the cavities between the different partsof the cracked-off layers, Mn can precipitate (presumablyin the MnO2 state), causing also other trace elements(present in the ground water) to become enriched inthese areas.
Copyright 2000 John Wiley & Sons, Ltd. X-Ray Spectrom. 29, 73–91 (2000)
88 K. JANSSENSET AL.
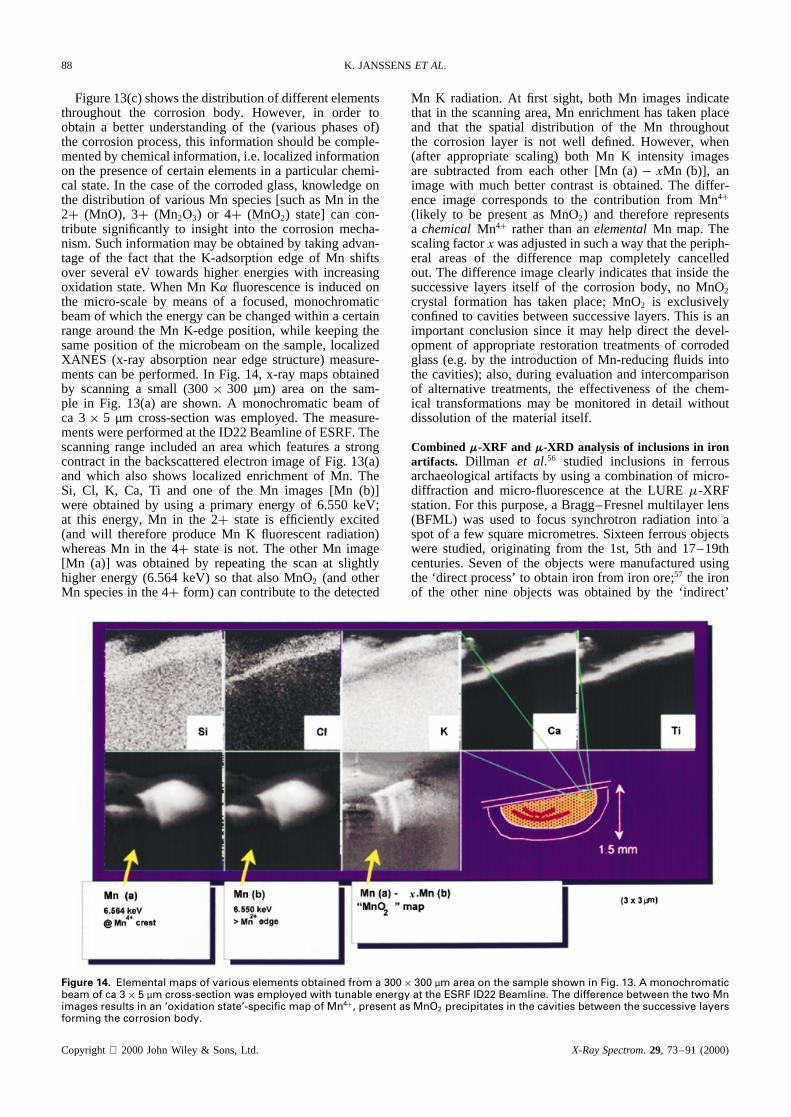
Figure 13(c) shows the distribution of different elementsthroughout the corrosion body. However, in order toobtain a better understanding of the (various phases of)the corrosion process, this information should be comple-mented by chemical information, i.e. localized informationon the presence of certain elements in a particular chemi-cal state. In the case of the corroded glass, knowledge onthe distribution of various Mn species [such as Mn in the2C (MnO), 3C (Mn2O3) or 4C (MnO2) state] can con-tribute significantly to insight into the corrosion mecha-nism. Such information may be obtained by taking advan-tage of the fact that the K-adsorption edge of Mn shiftsover several eV towards higher energies with increasingoxidation state. When Mn K fluorescence is induced onthe micro-scale by means of a focused, monochromaticbeam of which the energy can be changed within a certainrange around the Mn K-edge position, while keeping thesame position of the microbeam on the sample, localizedXANES (x-ray absorption near edge structure) measure-ments can be performed. In Fig. 14, x-ray maps obtainedby scanning a small (300ð 300 µm) area on the sam-ple in Fig. 13(a) are shown. A monochromatic beam ofca 3ð 5 µm cross-section was employed. The measure-ments were performed at the ID22 Beamline of ESRF. Thescanning range included an area which features a strongcontract in the backscattered electron image of Fig. 13(a)and which also shows localized enrichment of Mn. TheSi, Cl, K, Ca, Ti and one of the Mn images [Mn (b)]were obtained by using a primary energy of 6.550 keV;at this energy, Mn in the 2C state is efficiently excited(and will therefore produce Mn K fluorescent radiation)whereas Mn in the 4C state is not. The other Mn image[Mn (a)] was obtained by repeating the scan at slightlyhigher energy (6.564 keV) so that also MnO2 (and otherMn species in the 4C form) can contribute to the detected
Mn K radiation. At first sight, both Mn images indicatethat in the scanning area, Mn enrichment has taken placeand that the spatial distribution of the Mn throughoutthe corrosion layer is not well defined. However, when(after appropriate scaling) both Mn K intensity imagesare subtracted from each other [Mn (a)� xMn (b)], animage with much better contrast is obtained. The differ-ence image corresponds to the contribution from Mn4C
(likely to be present as MnO2) and therefore representsa chemicalMn4C rather than anelementalMn map. Thescaling factorx was adjusted in such a way that the periph-eral areas of the difference map completely cancelledout. The difference image clearly indicates that inside thesuccessive layers itself of the corrosion body, no MnO2
crystal formation has taken place; MnO2 is exclusivelyconfined to cavities between successive layers. This is animportant conclusion since it may help direct the devel-opment of appropriate restoration treatments of corrodedglass (e.g. by the introduction of Mn-reducing fluids intothe cavities); also, during evaluation and intercomparisonof alternative treatments, the effectiveness of the chem-ical transformations may be monitored in detail withoutdissolution of the material itself.
Combined m-XRF and m-XRD analysis of inclusions in ironartifacts. Dillman et al.56 studied inclusions in ferrousarchaeological artifacts by using a combination of micro-diffraction and micro-fluorescence at the LURE�-XRFstation. For this purpose, a Bragg–Fresnel multilayer lens(BFML) was used to focus synchrotron radiation into aspot of a few square micrometres. Sixteen ferrous objectswere studied, originating from the 1st, 5th and 17–19thcenturies. Seven of the objects were manufactured usingthe ‘direct process’ to obtain iron from iron ore;57 the ironof the other nine objects was obtained by the ‘indirect’
Figure 14. Elemental maps of various elements obtained from a 300ð 300 µm area on the sample shown in Fig. 13. A monochromaticbeam of ca 3ð 5 µm cross-section was employed with tunable energy at the ESRF ID22 Beamline. The difference between the two Mnimages results in an ‘oxidation state’-specific map of Mn4C, present as MnO2 precipitates in the cavities between the successive layersforming the corrosion body.
Copyright 2000 John Wiley & Sons, Ltd. X-Ray Spectrom. 29, 73–91 (2000)

XRF NON-DESTRUCTIVE ANALYSIS IN ART AND ARCHAEOMETRY 89
process. One of the investigated objects was a girder fromthe Eiffel Tower in Paris.
The direct process of iron reduction was employedin low shaft furnaces in which the melting temperatureof the iron is not reached. The resulting iron or steelcontains many non-metallic inclusions; from the 10thcentury onwards, the ‘indirect process’ was developed, inwhich the iron ore is heated to a much higher temperatureso that iron reduction takes place in the liquid phase; thisalso introduces carbon into the iron. In a second stage,the resulting cast iron (an alloy of Fe, Si and C) can berefined by oxidation of the carbon.
The study of the inclusions trapped in the iron matrixallows the identification of the type of reduction processemployed and complements historic and iconographic dataon the evolution of these techniques.58
For the�-XRF and�-XRD measurements, the inclu-sions were separated from the iron matrix in a multi-stepprocess.56 In Table 3, an overview is presented of the min-eral phases that were identified in the inclusions of eachartifact; some of the inclusions were as small as 20µm indiameter.
In the materials obtained via the direct process, in all ca-ses, aluminium-containing phases such as (Mg,Al)Fe2O4,hyrcinite or galaxite are encountered in the inclusions.Fayalite (Fe2SiO4) and wustite were also found. Thelatter minerals were also detected in the inclusions of thematerials obtained by means of the indirect process.
Dillman et al.56 suggested that the presence of the Alminerals may be used to discriminate between the directand the indirect processes. When the direct process isemployed, Al can enter into the iron from the ore (up
to a few percent only) or from the clay lining of thefurnace. On the other hand, Al is known to be lower inconcentration in cast iron which is obtained by means ofthe ‘indirect’ process.
Towards in situ m-XRF investigations
Conventionally, ED-XRF is performed on relatively small-scale but still stationary instruments. In direct excitationinstruments, the major reason for the size and station-ary nature of the instrument is the presence of a bulkyDewar vessel for cryogenic cooling of the solid-statedetector. In the last 5 years, various efforts have beenmade to develop non-liquid nitrogen equivalents of theSi(Li) detector; a comprehensive review of these devel-opments was given by Elliset al.59 Some of these devicesare being used in commercially available or laboratory-built compact XRF devices which may be used for on-siteinvestigations of archaeological and/or artistic materials.60
Specific examples are the HgI2 detector which is incorpo-rated into a radioisotope-based portable XRF instrument(TN9000, Thermo Unicam, Cambridge, UK)61,62 and anSi-PIN detector (Amptek, Bedford, MA, USA).63 Withsome of the devices, small beams (of ca 1 mm2 cross-section) may also be generated for local analysis.
Secondary target instruments. Cesareoet al.64 describedthe use of different source–detector combinations for per-forming in situ analyses of works of art and illustratedthe capabilities of these instruments with analysis resultsderived from bronze and gold objects, ceramics, faience
Table 3. Identified phases in inclusions of ferrous artifacts
Phases identifiedArtifact Date Type Fayalite Wustite Magnetite Others
Iron ingot 1 1939 Indirect x x Mn-fayaliteScrew 1878 Indirect x x Fe9O8PO4
Nut 1878 Indirect x Fe9O8PO4
Girder 1 1878 Indirect Troilite FeSGirder 2 1888 Indirect x x x Hematite,
Fe9O8PO4
Mining tool 1 19th C. Indirect x xMining tool 2 18th C. Indirect x x xMining tool 3 17th C. Indirect x x x Goethite,b
quartzIron rod 17th C. Indirect x x x TroiliteIron ingot 2 5th C. Direct x x x (Mg,Al)Fe2O4
Iron ingot 3 5th C. Direct x x x Hercynite,(Mg,Al)Fe2O4
Iron ingot 4 1st C. Direct x x xIron chunk 1st C. Direct x x x GalaxiteIron ingot 5 1995 Directa x x x Alumine,
hercynite,quartz,hematite
Iron bloom 1 1995 Directa x x x Alumine,hercynite,(Mg,Al)Fe2O4
Iron bloom 2 1995 Directa x x Galaxite,hematite,(Mg,Al)Fe2O4
a Modern laboratory reconstruction.b Present due to internal corrosion.
Copyright 2000 John Wiley & Sons, Ltd. X-Ray Spectrom. 29, 73–91 (2000)

90 K. JANSSENSET AL.
and porcelains and pigmented materials on illuminatedmanuscripts. Measurements were performed in the Museodi Villa Guilia (Rome, Italy), the Museo Sanna (Sassari,Italy), the Museo de Antropologia and the Museo delTemplo Major (Mexico City, Mexico) and the Museo dela Ciudad (Havana, Cuba). Most of the instruments con-sisted of a W-anode x-ray tube (Radiolight, 20–80 kV,5 mA), equipped with Ba or Mo secondary targets andeither a liquid nitrogen-cooled Si(Li) or HPGe detectoror a compact Peltier-cooled Si-PIN or HgI2 detector. Theauthors claimed that since the heaviest element of interestin archaeometric investigations is Ba (Ba K˛ at 32 keV),the reduced quantum efficiency of the Si-PIN (of only300µm thickness) does not present serious limitations. Anenergy resolution for the latter two detectors of 280 and200 eV, respectively, was reported. They also describedthe use of a collimated direct excitation set-up, consist-ing of a low-power tube operated typically at 35 kV and0.3–0.5 mA of which the outgoing radiation is collimatedby a 2.5 mm diameter aperture. The use of this typeof device, sometimes in combination with near-infraredreflectometry for non-destructive pigment identification infrescoes from the Roman and Renaissance period (includ-ing Michelangelo’sLast Judgementin the Sistine Chapel,Rome) has been described by various authors.65 – 67
Lu et al.68 constructed a small-beam XRF spectrometerfor the assay of precious metals in jewellery that utilizes a0.5–1 mm2 collimated beam from a low-power x-ray tubecoupled to a high efficiency proportional counter detector.
Use of compact focusing optics.One step towards the real-ization of the use of small (i.e. sub-millimetre) beamsin compact, low-power set-ups is to use equally com-pact x-ray lenses. With 50 W tubes and apertures, theprimary beam needs to have a cross-section of at least300–500µm to allow for measurements within reason-able counting times (500–1000 s per point). The fact thatsome polycapillaries only produce beams of 50–100µmdiameter does not present a limitation in investigationswhere mostly sub-millimetre sized (or larger) features ofmacroscopic objects are analysed. The marked advantageof polycapillary lenses over monocapillary concentratorsresides with the fact that they form a focal spot at a con-siderable distance (several centimetres) from the end ofthe lens whereas with monocapillaries the smallest beamdiameters are reached at the point where the beam leavesthe capillary. This allows for a completely non-contact,non-destructive kind of investigation and makes polycap-illary lenses ideal for local analysis of sensitive, preciousand/or unique objects of macroscopic size such as statues,miniature paintings, coins, utilitarian objects in glass ormetal (goblets, vases, etc.) and the (often multi-coloured)decorations which are applied to them. Vekemanset al.69
described the use of such devices for the local analysis
of enamel paints on Chinese porcelain and for the quan-titative analysis of genuine and counterfeit Indian brassstatues from the 16th century. By using the lenses insteadof an equivalent collimator, an increase in intensity by afactor 7–20 was obtained. For the measurements, an Morotating anode, operated at relatively low power (10 mA,50 kV) was employed. These results indicate that in com-bination with a 50 W mini-focus tube (where these lensescan capture a much larger fraction of the total flux thatexits from the tube) sub-millimetre beams of high inten-sity can be readily obtained. Carpenter and co-workers.70
reported a factor of 44 intensity gain when a monolithicpolycapillary device was used to optimize the�-XRFinstrument at the Oak Ridge Center for ManufacturingTechnology.
CONCLUSIONS
In this paper, the current possibilities and future potentialof �-XRF for the analysis and characterization of archae-ological artifacts and objects of art have been discussedand illustrated with a number of selected examples. Theapplications listed are not intended to be exhaustive; thereis a bias in the examples that were selected from the fieldof experience of the laboratory of the authors.
In general, it is important to point out that the applica-tion of analytical methods in the field of archaeology isaimed at answering one or more questions derived fromhuman history or the history of art. Present-day conceptsin this particular field are very often based on theories thatare lacking any real experimental proof.
As in many other ‘problem-solving’ areas of research,there exists no unique and fail-safe method that can beapplied for tackling such problems. Rather, a plethora ofanalytical methods should be considered for exploitation,each of which has its own specific advantages and lim-itations for the problem at hand. In particular, all thesemethods take into account the specific drawbacks involvedin sampling and analysis of archaeological samples. Themost important drawback in this area of analysis is thatvery often the samples are unique or too valuable to bedestroyed or altered by sampling. This is a major rea-son for the predilection for microanalytical methods inthis area. The other and more fundamental reason for theemphasis on microanalysis is that very often the samplewhich needs to be selected for analysis is microscopicallysmall, or the problem that needs to be addressed concernsa microscopic or extremely small volume.
In this respect,�-XRF offers a unique set of charac-teristics for solving many of the problems that arise. Themethod is completely non-destructive, can be applied tominute sample amounts, sensitive, versatile and applicableto many materials.2
REFERENCES
1. P. T. Craddock and N. D. Meeks, Archaeometry 29, 187
(1987).
2. Ch. Lahanier, G. Amsel, Ch. Heitz, M. Menu and H. H. Ander-
sen, Nucl. Instrum. Methods Phys. Res. B 14, 1 (1986).
3. F. Adams, A. Adriaens, A. Aerts, I. De Raedt, K. Janssensand O. Schalm, J. Anal. At. Spectrom. 12, 257 (1997).
4. K. G. Malmqvist, in Particle Induced X-Ray Emission Spec-trometry (PIXE), edited by S. A. Johansson, J. L. Campbelland K. G. Malmqvist, Chapt. 7. Wiley, Chichester (1995).
Copyright 2000 John Wiley & Sons, Ltd. X-Ray Spectrom. 29, 73–91 (2000)

XRF NON-DESTRUCTIVE ANALYSIS IN ART AND ARCHAEOMETRY 91
5. S. A. Johansson and J. L. Campbell, PIXE: A Novel Techniquefor Elemental Analysis. Wiley, Chichester (1988).
6. A. M. Pollard and C. Heron, Archaeological Chemistry. RoyalSociety of Chemistry, Cambridge (1996).
7. F. Adams, K. Janssens and A. Snigirev, J. Anal. At. Spectrom.13, 319 (1998).
8. M. Milazo and C. Cicardi, X-Ray Spectrom. 26, 211 (1997).9. K. Janssens, B. Vekemans, L. Vincze, F. Adams and
A. Rindby, Spectrochim. Acta, Part B 51, 1161 (1996).10. K. Janssens, L. Vincze, B. Vekemans, F. Adams, M. Haller
and A. Knochel, J. Anal. At. Spectrom. 13, 339 (1998).11. L. Vincze, K. Janssens, F. Adams and K. W. Jones,
Spectrochim. Acta, Part B 50, 1481–1500 (1995).12. L. Vincze, K. Janssens, B. Vekemans and F. Adams, J. Anal.
At. Spectrom. 14, 529–533 (1999).13. K. Janssens, L. Vincze, A. Aerts, F. Adams and J. Hertogen,
X-Ray Spectrom. 26, 333 (1997).14. A. Knochel and M. Haller, J. Trace Microprobe Tech. 14, 461
(1996).15. K. Janssens, L. Vincze, B. Vekemans, C. T. Williams,
M. Radtke, M. Haller and A. Knochel, Fresenius’ J. Anal.Chem. 363, 413–420 (1998).
16. L. Vincze, K. Janssens, B. Vekemans and F. Adams,Spectrochim. Acta B 54, 1711 (1999).
17. B. Lai, B. Yun, D. Legnini, Y. Xiao, J. Chrzas, P. J. Vicaro,V. White, S. Bajikar, D. Denton, F. Cerrina, E. Di Fabrizio,M. Gentili, L. Grella and M. Baciocchi, Appl. Phys. Lett. 61,1877–1879 (1992).
18. N. Gao and D. Gibson, X-Ray Spectrom. 28, 75 (1999).19. E. V. Sayre and R. W. Smith, Science 133, 1824 (1961).20. K. Janssens, I. Deraedt, O. Schalm and J. Veeckman,
Microchim. Acta. Suppl. 15, 253 (1998).21. B. Velde and G. Sennequier, Annales du 9 Congres de
l’Association pour l’Histoire du Verre, 127–147 (1985).22. R. Donceel and P. Donceel-Voute, Ann. N. Y. Acad. Sci. 772,
1 (1994).23. A. Aerts, K. Janssens, F. Adams and L. Wouters, J. Arch. Sci.
26, 883 (1999).24. P. Donceel-Voute, Archeologia 298, 24 (1994).25. B. Velde and C. Gedron, Archaeometry 22, 182 (1980).26. B. Velde, Oxford J. Archaeol. 9, 105 (1990).27. P. Hoffmann, Fresenius. J. Anal. Chem. 349, 320 (1994).28. A. Aerts, PhD Thesis, University of Antwerp, (1998).29. R. G. Newton, Glass Technol. 21, 173 (1980).30. E. V. Sayre, in Advances in Glass Technology, edited by
F. R. Matson and G. E. Rindone, Vol. 2, p. 263–282. PlenumPress, New York (1963).
31. B. Velde and A. Hochuli, Annales du 13 Congres del’Association International pour l’Histoire du Verre, 185–192(1995).
32. K. Janssens, I. Deraedt, O. Schalm and J. Veeckman,Microchim. Acta, Suppl. 15, 253 (1998).
33. K. H. Wedepohl, Die Herstellung Mittelalterlicher undAntiken Glaser. Steiner, Stuttgart (1993).
34. M. Verita and T. Tonianto, Riv. Staz. Sperimentale Vetro(Murano) 20, 169 (1990).
35. M. O. Figueiredo, J. P. Veiga and T. Pereira da Silva, Proceed-ings of the 6th International Conference on ‘Non-destructiveTesting and Microanalysis for the Diagnostics and Conser-vation of the Cultural and Environmental Heritage,’ Rome,May 17–20, 1999, pp. 1769–1779 (1999).
36. A. Knochel and M. Haller, J. Trace Microprobe Tech. 14, 461(1996).
37. H. Mommsen, Th. Beier, H. Dittmann, D. Heimermann,A. Hein, A. Rosenberg, M. Boghardt, E.-M. Manebutt-Benzand H. Halbey, Archeometry 38, 347 (1996).
38. T. Cahill, B. Kusko and R. N. Schwab, Nucl. Instrum.Methods. Phys. Res. B 181, 205 (1981).
39. T. Cahill, B. Kusko, R. A. Eldred and R. N. Schwab,Archaeometry 26, 3 (1984).
40. R. N. Schwab, Library Trends 36, 53 (1987).41. R. N. Schwab, T. A. Cahill, B. H. Kusko, R. A. Eldred, G. Moller
and D. Dutschke, Pap. Bibliogr. Soci. Am. 8, 305 (1986).42. C. H. Bloy, A History of Printing Ink, Balls and Rollers
1440–1850. Buttersworth, London (1967).43. S. Larsson, Thesis, Department of Physics, Chalmers Uni-
versity of Technology, Goteborg. Bibliotekets ReproService,Goteborg (1991).
44. B. Stocklassa, G. Nillson, N. Paulson, paper presented at theEuropean Conference on EDXRS, Myconos, Greece, May30–June 6, (1992).
45. I. Brissaud, J. X. Wang and P. Chevallier, J. Radioanal. Nucl.Chem. 131, 399 (1989).
46. I. Deryck and K. Janssens, Spectrochim. Acta, submitted forpublication.
47. A. Oost (ed), Egypte Onomwonden. Catalogue of EgyptianArtefacts of the Museum ‘Vleeshuis’, Antwerp (1995); (inDutch).
48. L. Robbiola, I. Queixalos, L. P. Hurtel, M. Pernot andC. Volfovsky, Stud. Conserv. 33, 205 (1988).
49. L. Robbiola and C. Fiaud, Ed. Rev. Metall. 6, 156 (1993).50. M. Wuttmann, in Proceedings of the First International
Conference on Ancient Egyptian Mining and Metallurgy andConservation of Metallic Artefacts, FIFAO, Cairo (1996).
51. M. Wuttmann, in Balat I, Le Mastaba de Medoe-Nefer,Annexe III: Analyse et Etude du Metal Cuivreux de CertainsObjets, edited by M. Valloggia, 215–220. FIFAO 31/1, Cairo(1986).
52. G. Vittiglio, K. Janssens, B. Vekemans, F. Adams and A. Oost,Spectrochim. Acta, Part B 54, 1697 (1999).
53. J. Tate, Nucl. Instrum. Methods. Phys. Res. B 14, 20 (1986).54. E. Auer, Th. Rehren, A. von Bohlen, D. Kirchner and
R. Klockenkamper, Metalla (Bochum) 5, 71 (1998).55. K. Janssens, A. Aerts, L. Vincze, F. Adams, C. Yang,
R. Utui, K. Malmqvist, K. W. Jones, M. Radkte, S. Garbe,F. Lechtenberg, A. Knochel and H. Wouters, Nucl. Instr.Methods Phys. Res. B 109/110, 690 (1996).
56. P. Dillman, P. Populus, P. Chevallier, P. Fluzin, G. Berangerand A. Firsov, J. Trace Microprobe Tech. 15, 251 (1997).
57. G. Magnusson (ed). The Importance of Iron Making, Techni-cal Innovation and Social Change, Parts I and II. Proceedingsof the Norberg Conference, May 8–13, 1995. JernkontorestBergshistoriska Utskott, Stockholm (1995).
58. D. Starley, in The Importance of Iron Making, Technical Inno-vation and Social Change, Parts I and II. Proceedings of theNorberg Conference, May 8–13, 1995, edited by G. Mag-nussen. Jernkontorest Bergshistoriska Utskott, Stockholm(1995).
59. A. T. Ellis, P. J. Potts, M. Holmes, G. J. Oliver, C. Streli andP. Wobrauschek, J. Anal. At. Spectrom. 12, 461R (1997).
60. R. Cesareo, G. E. Gigante, I. S. Iwanczyk and A. Dabrowski,Nucl. Instrum. Methods. Phys. Res. A 380, 440 (1996).
61. P. J. Potts, P. C. Webb, O. Williams-Thorpe and R. Kilworth,Analyst 120, 1273 (1995).
62. P. J. Potts, P. C. Webb and O. Williams-Thorpe, J. Anal. At.Spectrom. 12, 769 (1997).
63. A. C. Huber, J. A. Pantazis and V. T. Jordanov, in Proceedingsof International Conference on Application of Acceleratorsin Research and Industry, Denton TX, 1994.
64. R. Cesareo, G. E. Gigante, A. Castellano, M. A. Rosales,M. Aliphat, F. De La Fuente, J. J. Meitin, A. Mendoza,J. S. Iwanczyk and J. A. Pantazis, J. Trace Microprobe.Tech. 14, 711 (1996).
65. G. Fronterotta, S. Sciuti and M. Vendittelli, Proceedings ofthe 6th International Conference on ‘Non-Destructive Test-ing and Microanalysis for the Diagnostics and Conservationof the Cultural and Environmental Heritage,’ Rome, May17–20, 1999, pp. 257–270 (1999).
66. S. Sciuti, in Proceedings of the 6th International Conferenceon ‘Non-Destructive Testing and Microanalysis for the Diag-nostics and Conservation of the Cultural and EnvironmentalHeritage,’ Rome, May 17–20, 1999, pp. 401–415, (1999).
67. N. Gabrielli and F. Morresi, in Proceedings of the 6thInternational Conference on ‘Non-Destructive Testing andMicroanalysis for the Diagnostics and Conservation of theCultural and Environmental Heritage,’ Rome, May 17–20,1999, pp. 2133–2139, (1999).
68. R. Lu, A. Le, Y. Gu, G. Wu and J. Zhu, Nucl. Instrum. Methods.Phys. Res. B 104, 595 (1995).
69. B. Vekemans, K. Janssens, G. Vittiglio, F. Adams, L. Andongand Y. Yiming, Adv. X-Ray Anal. 41, 278 (1998).
70. N. Gao, I. Ponomarev, Q. F. Xiao, W. M. Gibson andD. A. Carpenter, Adv. X-Ray Anal. 39, 81 (1996).
Copyright 2000 John Wiley & Sons, Ltd. X-Ray Spectrom. 29, 73–91 (2000)
Copyright © 2022 FDOKUMEN