04/11/10 - The mass properties of a hybrid's liquid propellant
Upload
khangminh22Category
view
2download
0
March 22, 2018
MASTER THESIS
NON-DESTRUCTIVETESTING OF SOLIDPROPELLANTROCKET MOTORS
Floor Beugelss1202960
Faculty of Engineering TechnologyDynamics Based Maintenance
Exam committee:University of Twenteprof.dr.ir. Tiedo Tingadr.ir. Richard Loenderslootdr.ir. Ton BorTNOir. Peter Hooijmeijer
Documentnumber ET.18/TM-5816


ContentsSummary iii
1 Introduction 1
1.1 Energetic Materials . . . . . . . . . . . . . . . . . . . . . . . . . . . . . 1
1.2 Solid propellant missiles . . . . . . . . . . . . . . . . . . . . . . . . . . 1
1.3 Research Plan . . . . . . . . . . . . . . . . . . . . . . . . . . . . . . . . 2
1.4 Solid propellants . . . . . . . . . . . . . . . . . . . . . . . . . . . . . . 3
1.5 Degradation of propellants . . . . . . . . . . . . . . . . . . . . . . . . . 3
1.6 Loads on propellants . . . . . . . . . . . . . . . . . . . . . . . . . . . . 4
1.7 Failure Modes . . . . . . . . . . . . . . . . . . . . . . . . . . . . . . . . 4
1.8 Inspection methods . . . . . . . . . . . . . . . . . . . . . . . . . . . . . 4
1.8.1 Currently used inspection methods . . . . . . . . . . . . . . . . 5
1.8.2 Alternative inspection methods . . . . . . . . . . . . . . . . . . 6
1.9 Research question . . . . . . . . . . . . . . . . . . . . . . . . . . . . . . 8
2 Theory of ultrasonic wave propagation 11
2.1 Generation of ultrasonic waves . . . . . . . . . . . . . . . . . . . . . . 11
2.2 Wave propagation in solid propellant material . . . . . . . . . . . . . . 12
2.3 Mode conversion . . . . . . . . . . . . . . . . . . . . . . . . . . . . . . 13
2.4 Attenuation . . . . . . . . . . . . . . . . . . . . . . . . . . . . . . . . . 14
2.5 Reflection . . . . . . . . . . . . . . . . . . . . . . . . . . . . . . . . . . 14
2.6 Viscoelasticity and dispersion . . . . . . . . . . . . . . . . . . . . . . . 15
3 Experimental Setup 17
3.1 Inert solid propellant samples . . . . . . . . . . . . . . . . . . . . . . . 17
3.1.1 Accelerated ageing . . . . . . . . . . . . . . . . . . . . . . . . . 19
3.2 Experimental setup and instrumentation . . . . . . . . . . . . . . . . . 20
i

3.3 Results and conclusions feasibility experiments . . . . . . . . . . . . . 22
3.4 Follow-up experiments . . . . . . . . . . . . . . . . . . . . . . . . . . . 25
4 Experimental Results and Interpretation 27
4.1 Hardness . . . . . . . . . . . . . . . . . . . . . . . . . . . . . . . . . . 27
4.2 Ultrasonic measurements . . . . . . . . . . . . . . . . . . . . . . . . . . 28
4.2.1 Extra surface reflection . . . . . . . . . . . . . . . . . . . . . . 29
4.2.2 Change in velocity . . . . . . . . . . . . . . . . . . . . . . . . . 30
4.2.3 Change in frequency content . . . . . . . . . . . . . . . . . . . 34
4.2.4 Influence of metal casing . . . . . . . . . . . . . . . . . . . . . . 35
4.3 Implications for ultrasonic signals due to hardness measurements . . . 37
4.4 Summary experimental results . . . . . . . . . . . . . . . . . . . . . . 37
5 Conclusions 39
6 Recommendations 41
Bibliography 43
A Method: mixing inert solid propellant material 49
B Methods for analyzing frequency dependent attenuation 51
B.1 Frequency dependent attenuation . . . . . . . . . . . . . . . . . . . . . 51
B.2 Attenuation and phase velocity dispersion estimation . . . . . . . . . . 53
ii

SummaryA lot of missiles used by the armed forces have a solid propellant rocket motor.The ageing of this solid propellant is an oxidative crosslinking process. This processstarts and propagates from the free surface of the propellant material and forms adeteriorated layer.
Solid propellant missiles are used in all parts of the armed forces, this means thatmissiles are subjected to a wide range of handling, storage and deployment conditions.Assessment of the condition of the propellant is done on a random sample from thebatch and at the moment there is no non-destructive method to assess material prop-erties of the ageing propellant. This means expensive weapon systems are sacrificedand conclusions about the state of the material are drawn from a small number ofassessed rocket motors.
This thesis investigates possibilities for vibration based non-destructive testing meth-ods for characterizing ageing in solid propellant material and zooms in on one promis-ing method: ultrasonic testing. The remainder of the study consists of a feasibilitystudy on the use of ultrasound for characterizing ageing in solid propellant material.
Samples of inert HTPB (hydroxyl-terminated polybutadiene) based propellant areaged and experiments are conducted to research the effects of ageing on the ultrasonicsignal, the frequency content of the pulses and the sound velocity. Although anexpected reflection off the interface between pristine and aged material is not observed,it is found that an increase in sound velocity is measurable, which indicates a risein Young’s modulus of the material. This suggests that ultrasound is a promisingtechnique for assessing the ageing of solid propellant.
iii

iv

1. IntroductionTNO is an independent research organization, conducting research in nine differentthemes. As part of the Defence, Safety and Security focus area, the Energetic Ma-terials department researches a wide range of topics. Theoretical, model-based andexperimental research for the development, processing, use and behaviour of energeticmaterials is conducted at the TNO locations in Rijswijk and Ypenburg.In this chapter a short introduction on the topic of research is given as well as theresearch goal and relevant theory for formulating the research question.
1.1 Energetic MaterialsEnergetic materials are substances that store a high amount of chemical energy. Oncethis energy is released by a chemical reaction, the reaction can sustain itself, withoutthe help of external sources like oxygen. These materials are used in for examplepyrotechnics, high explosives and gun and rocket propellants. Characterization of theageing of the latter will be the main topic of this research project.Solid propellant missiles are used in every part of the military. Rocket motors propelmissiles used by the Air Force, Navy and Army. A lot of the motors in the inventoryof the ministry of Defense have been there for quite some time. Making sure thatthese missiles are safe to keep in storage and are still safe to use is very important. Toensure safety, missile propellants are disassembled and mechanical tests are performedon small parts of the propellant material. This means that frequently a couple of veryexpensive missiles are dismantled and sacrificed for these tests. As one may noticefrom this testing procedure, a couple of missiles are taken as a sample from a batch.This sample is assumed to be representative for the state of the batch, but does notshow the state of every individual missile. This is even more important consideringthe different environments (e.g. temperatures, humidity) the missiles are stored induring their lifetime and the differences in operating conditions like hanging under anF16 aircraft compared to missiles in storage. This means the tests are very expensive,and the results applied to all missiles can have a too large safety factor for large partsof a batch.
1.2 Solid propellant missilesIn figures 1.1 and 1.2a a schematic representation of a solid propellant missile is shown.It consists of a combustion chamber (fig. 1.2a section C-D) and a nozzle (M-C). Inthe combustion chamber an igniter is present (O), which can ignite the solid propel-lant (Kr). The propellant grain is cast, molded or extruded into a cylindrical shapewith a hole in the middle. The grain is embedded in a metal or composite materialcasing. The open end of the missile is the nozzle. When the propellant is ignited,the exposed surface of the material starts to burn. The propellant can sustain theburning without the need of external sources such as oxygen, so the propellant burnsup via the free surface. The combustion gases build up in the combustion chamberand when the pressure is high enough, the gases are exhausted via the nozzle. Thisresults in a thrust and a force propelling the missile forward. Once the propellant isignited it cannot be extinguished and reignited [1, 2].
1

Figure 1.1: Schematic of a guided missile with the solid propellant located in thepropulsion section [3]
The force resulting from the pressure build-up inside the missile can be somewhatregulated up front by choosing a specific shape for the propellant. Different graingeometries have different initial burning surfaces and surfaces throughout the burningprocess as shown in figure 1.2b. This way the amount of combustion gases, thrust andthus the amount of force is regulated by the initial shape of the propellant. There area couple of different thrust patterns: Neutral, which keeps a constant burning surfaceand the same amount of thrust along the burn. Progressive, which has an increasingamount of burning surface and thus an ascending thrust curve. Lastly, regressive,which has decreasing amount of burning surface and thus a descending thrust curve.Next to these, there are thrust patterns which have peaks at different moments of theburn. The geometry of the propellant grain can vary throughout the length of thecombustion chamber as well as the type of solid propellant. This way, different partsof the rocket motor can have different functions, for example a booster engine and aflight engine [4].
(a) Schematic of a solid propellant missile [1](b) Various shapes of solid propellants withcorresponding thrust patterns [4]
Figure 1.2: Schematics of interior of solid propellant missiles
1.3 Research PlanTo minimize the current issues with assessing the degradation of solid propellantmissiles, non-destructive testing (NDT) would be a very good alternative. With non-destructive testing methods, as the name implies, one can evaluate the ageing of amissile without sacrificing one. At the moment the only non-destructive method usedfor assessing solid propellant rocket motors is X-ray, which is very helpful for findingfailures like cracks, holes or delaminations, but it cannot describe degradation of the
2

material properties of the propellant material.
The main goal in this research area is to find a non-destructive method to assessthe ageing of solid propellant missiles. The question posed by TNO is therefore‘Which non destructive testing methods are useful for characterizing ageing in solidpropellant rocket motors?’
The main research question for this project will be formulated in section 1.9, which isbased on this question and will be specified on vibration and propagating wave basedmethods.In order to formulate this research question a relevant introduction on solid propel-lants is given. The remainder of this introduction covers degradation of propellants,loads on propellants, failure modes and inspection methods.
1.4 Solid propellantsThe two main ingredients of solid propellants are an oxidizer and a fuel. Togetherwith a binder this is mixed and cured as a solid propellant. Other possible ingredientsare stabilizers, catalysts to accelerate or decelerate the burning rate or plasticizers.These adjust the physical properties of the solid propellant and can be used as a sec-ond type of fuel or curing agents which cross link molecules and thus have an effecton the flexibility of the cured product.There are a lot of different mixtures for solid propellants, but two main types can bedistinguished: homogeneous and heterogeneous solid propellants. In a homogeneousmixture the fuel and oxidizer are generally in the same molecule. The mixture has nomolecules larger than macro-level. Homogeneous solid propellants can be categorizedas single-base or double-base. In single-base propellants there is one type of propel-lant base, usually nitrocellulose. In double-base propellants there are two types ofmolecules in the propellant base, usually nitrocellulose and nitroglycerin.Heterogeneous, or composite, propellants consist of different substances as fuel andoxidizer. The most common used combination is ammonium perchlorate (AP) as theoxidizer and powdered aluminium as the fuel [2, 5].
1.5 Degradation of propellantsIdeally, solid propellants that have been mixed and formed into their final shape wouldshow no more chemical or physical changes after they have cured. However, in reality,the propellant will keep changing chemically and thus the mechanical properties keepchanging too. This change in mechanical properties is mainly due to the degradationof the binder which in most cases is hydroxyl-terminated polybutadiene (HTPB). Thecontrolling factor in this ageing process is oxidative crosslinking of the HTPB bindermolecules, a diffusion process [6]. In this process the polymer chains of the binder linkto each other, forming so called cross-links as shown in figure 1.3. This continuouscrosslinking hardens the binder and eventually makes the material brittle and thusless flexible. In the case of HTPB the crosslinking is oxidation-induced, which meansthe chemical reaction is due to the presence of oxygen [7, 8]. Oxygen is present atthe inner surface of the propellant as can be seen in figure 1.2. Because the oxidativecrosslinking occurs at the inner surface, a growing band of stiffer, brittle propellantis present at the inner surface. While the Young’s modulus E increases, the densityρ does not change considerably during this process. This layer of aged propellant hasdifferent mechanical properties than the non-aged propellant and has a higher chanceof cracking and damaging of the material because of the higher stiffness and lowerultimate strength.
3

Figure 1.3: Cross links (red) between polymer chains A, B and C
1.6 Loads on propellantsSolid propellant missiles are used in all parts of the armed forces, which means thatmissiles are subjected to a wide range of handling, storage and deployment conditions.Missiles that are stored in Northen and Central Europe encounter a small amount oftemperature changes during the day and during the year, while missiles stored at abase in the Middle East endure large temperature changes (up to more than 65°C).When a missile has been deployed on a jet airplane it has endured temperaturesmuch lower than on the ground (as low as -50°C). These temperature changes causeinternal stresses and strains in the material. Next to this different thermal expansioncoefficients of the metal casing and the solid propellant can induce debonding betweenthe layers [9]. Temperature is also the main load for the degradation process. Thehigher the temperature, the faster the degradation process proceeds.Transport and handling of the missiles cause mechanical loads on the solid propellantin the form of vibrations and shock loads. Missiles transported over rough roads bytrucks endure a lot of vibrations which can cause cracks in the propellant material.Missiles that are handled with less care endure shock loads, also causing cracks ordeformations [2].
1.7 Failure ModesThe two most common failure modes are cracking of the propellant material anddebonding between the casing and the propellant material. Cracking can occur as aresult of too high stresses and strains, repetitive stresses and strains that weaken thematerial, (air) pockets due to the fabrication process in the material or other factorsthat locally weaken the propellant.Debonding is the process of detaching of two layers. This happens due to the differencein thermal expansion of the two layers, but can also occur due to vibrations, shockloads or air bubbles [9].Both of these failure modes are undesirable because they both locally increase thefree surface to burn. This means that once the fire front has reached this spot, thereis a sudden increase in free surface to burn, resulting in more combustion gases anda higher pressure inside the motor. If this pressure is too high, the engine couldburst and explode. In reality, these (severe) cracks and debondings are not observedvery frequently while assessing the propellant rocket motors of missiles still in use.Without indicators of failed propellant material, visible as cracks or debondings, it ishard to assess the state of the solid propellant material without sacrificing a missileand estimate the remaining lifespan of the missile. This means that ideally the nondestructive tests should focus more on the material ageing and the change in materialproperties rather than look for cracks and debondings if one wants to assess the lifeexpectancy of a propellant rocket motor.
1.8 Inspection methodsInspecting weapon systems to determine the state of the material is very importantbecause of the high risk materials that are present. Various methods to detect flaws
4
in the materials or material properties are used, as described in this section.
1.8.1 Currently used inspection methodsCurrently solid propellant rocket motor testing is done with random samples froma batch of motors. As mentioned in section 1.5, the environmental loading can varya lot from missile to missile. Missiles in storage have a different ageing process thanmissiles used in (out of area) missions. This means that it is far from ideal to usetesting methods which forces one to use random samples from a batch because oftime, usage or monetary limitations. Results of multiple tests are combined to cometo a substantiated life expectancy for the batch with a large enough safety factor. Inthis section a few of the at the moment most frequently used techniques are described,after which options for a new technique are discussed.
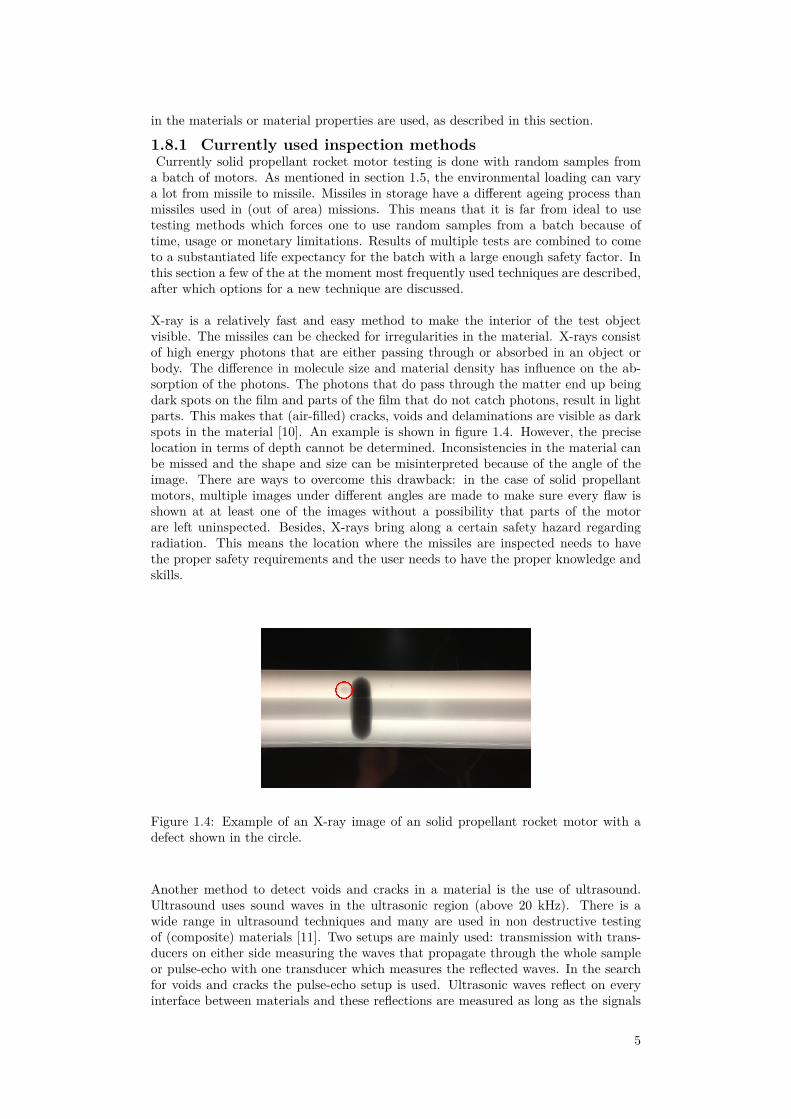
X-ray is a relatively fast and easy method to make the interior of the test objectvisible. The missiles can be checked for irregularities in the material. X-rays consistof high energy photons that are either passing through or absorbed in an object orbody. The difference in molecule size and material density has influence on the ab-sorption of the photons. The photons that do pass through the matter end up beingdark spots on the film and parts of the film that do not catch photons, result in lightparts. This makes that (air-filled) cracks, voids and delaminations are visible as darkspots in the material [10]. An example is shown in figure 1.4. However, the preciselocation in terms of depth cannot be determined. Inconsistencies in the material canbe missed and the shape and size can be misinterpreted because of the angle of theimage. There are ways to overcome this drawback: in the case of solid propellantmotors, multiple images under different angles are made to make sure every flaw isshown at at least one of the images without a possibility that parts of the motorare left uninspected. Besides, X-rays bring along a certain safety hazard regardingradiation. This means the location where the missiles are inspected needs to havethe proper safety requirements and the user needs to have the proper knowledge andskills.
Figure 1.4: Example of an X-ray image of an solid propellant rocket motor with adefect shown in the circle.
Another method to detect voids and cracks in a material is the use of ultrasound.Ultrasound uses sound waves in the ultrasonic region (above 20 kHz). There is awide range in ultrasound techniques and many are used in non destructive testingof (composite) materials [11]. Two setups are mainly used: transmission with trans-ducers on either side measuring the waves that propagate through the whole sampleor pulse-echo with one transducer which measures the reflected waves. In the searchfor voids and cracks the pulse-echo setup is used. Ultrasonic waves reflect on everyinterface between materials and these reflections are measured as long as the signals
5

is not fully damped. From the measured pattern it can be concluded if there is forexample an air-filled void in the material [10]. Ultrasound is mostly used on solid pro-pellant motors for the detection of delaminations between the casing and the innerlayers and propellant. This is because it can be difficult for the signal to overcomethe metal-propellant boundary and penetrate into the sample material.
Both X-ray and ultrasound are methods that can help discovering voids and de-laminations in the engine. However, as mentioned in section 1.5, these failure modesdo not occur very often in engines that are still in use. This means that the ageing ofthe propellant is detectable in the change in material properties, mostly the stiffnessof the inner surface of the cylinder. Measuring stiffness can be done with several me-chanical tests like a simple tensile test. Tensile specimens are cut from the propellantgrain and from the slope of the stress-strain curve (in the linear elastic regime) theYoung’s modulus E is calculated.
Table 1.1 shows the above described methods with their advantages and disadvan-tages. It is clear that at the moment none of the used tests can non-destructivelyassess failures in the material and the change in stiffness of the material at the sametime. In the next section vibration and propagating wave based NDT methods aredescribed and their use for solid propellant rocket motors is discussed.
Table 1.1: Advantages and disadvantages of current testing methods. (De-lam.:Delaminations, Non-dest.:Non destructive)
Ability to assessTesting method Speed Ease of use Stiffness Crack Delam. Non-dest. SampleX-ray + - - + + + -Ultrasound + ± - ± + + ±Mechanical - - + - - - -
1.8.2 Alternative inspection methodsThe way that objects respond to (forced) vibrations is specific for every individualobject. Specific eigenfrequencies induce mode shapes when the object is driven inthis frequency. Normally it is undesirable for objects or structures to be driven intheir eigen- or resonance frequencies. This is because the amplitude response is thenvery high due to resonance as shown in figure 1.5. Objects or structures withoutappropriate damping can start to oscillate violently and be damaged.
Despite this disadvantage, eigenfrequencies and mode shapes can also provide veryhelpful information. Because the eigenfrequencies are specific for every individualobject or structure, they can be used to detect changes or damages in the structure.The input and response data of a driven vibrating or rotating structure contains alot of information which can be obtained by analyzing the frequency content of thedisplacement, velocity or acceleration data. Resonance frequencies and even modeshapes can be made visible by processing the data this way. By comparing the eigen-frequencies of the pristine structure with the (possibly) damaged structure conclusionscan be drawn whether there are changes in the object, visible as frequency shifts anddifferences in mode shapes. Beside these basic classifiers a variety of classifiers in thefrequency and modal domain have been developed [12,13].
A disadvantage of the described methods is that they work very well for relativelysimple, linear structures. It is harder to distinguish accurate eigenfrequencies of morecomplex, combined structures. For relatively simple structures like beams or platesone can predict some mode shapes and attach sensors at sensible locations. However,
6

if these mode shapes are harder to predict, one should use a lot of sensors on theobject to avoid the possibility of misinterpreting mode shapes due to spatial aliasing.When the object does not have enough sensors, the vizualization of the mode shapedoes not approach reality accurately [13,14]. Another difficulty that arises when onewould use the above mentioned methods with solid propellant missiles in use, is thatany frequency shift or classifier that points to the presence of damage most probablycannot be directly related to a specific type or location failure inside the missile.
Figure 1.5: The effect of the driving frequency on the amplitude response [15]
Next to these methods, which can be named traditional methods, new vibration basedmethods are in development. These are methods in which artificial intelligence andself-learning networks are used. Artificial Neural Networks (ANNs) are trained withinput and output data of vibration tests on objects with structural damage. Thedata can be from experimental results or from numerical simulations of the struc-ture. When the Neural Network is trained sufficiently, it can supply informationabout the location and severity of the damage from experimentally measured vibra-tion data [16,17]. The use of ANNs is promising in the field of NDT, but the theoryand application of this method are outside the scope of this study.
(Ultra)sound waves are made up of vibrations that can be used for non destructivetesting. When using ultrasound, one is not interested in the response of the object asa whole on the input vibrations, but more on the properties of the material that havean influence on the way that vibrations propagate inside the material. Ultrasoundcan be used to locate delaminations in solid propellant rocket motors, but it may alsobe used to determine whether the inner ring of the propellant material has aged, asdescribed in section 1.5. The layer of aged propellant has different mechanical proper-ties like stiffness and hardness, which have an effect on the propagation of vibrationsthrough the material.
Besides the conventional use of ultrasonic waves in which the pulse-echo methodis used to detect flaws in homogeneous materials, there are other uses of ultrasonicwaves. One of those focuses on identifying the stiffness of the material. This methodis under development for medical application and is called Ultrasonic Elastography.As the name states, it is a method to identify the elasticity, or stiffness of a material.There is a number of different elastography methods, but generally they consist oftwo steps: (1) distort the material at a certain depth and (2) measure the responsedue to the distortion. There are multiple ways to accomplish both steps. The earlydeveloped methods, called strain imaging, mechanically compress the material on thesurface and ultrasound images made before and after the deformation are compared.The amount of deformation is a measure of the stiffness of the tissue. Another wayto distort the material is forming a ‘push’ inside the material with acoustic radiation
7

force (ARF). This uses high intensity sound waves which distort tissue on a certaindepth [18]. By measuring the shear wave velocity vs and density ρ the elasticitymodulus E can be calculated:
E = 2G(1 + ν) (1.1)
vs =
√G
ρ(1.2)
with shear modulus G, Poisson’s ratio ν(0.5 for incompressible materials).
Ultrasonic Elastography is now widely researched and used for medical applications,but has not been developed for NDT applications yet. In medical applications it ismostly used in cases with tissues having a very different stiffness like a tumor in softtissue [19–21].
However, the idea of measuring a certain layer of the solid propellant material whichhas developed different (mechanical) properties than the original material with ul-trasound is not new. Applications in the field of inspecting a layer of deterioratingconcrete have been proven to be suitable. In this case ultrasonic waves are used toreflect on the surface of the deteriorated material layer. This way three different re-flections can be distinguished in the received signal as shown in figure 1.6 [22]. Thepurple wave is passed on through the interfaces, while the blue arrows indicate thepart of the signal energy that is reflected from each interface. The same techniquemay work for inspecting a deteriorating layer in solid propellants. Assuming there isa sharp enough interface between non-aged and aged solid propellant material, ultra-sonic waves that propagate inside the material and reach the interface of the pristineand the aged material give a reflection visible in a pulse-echo measurement.
Figure 1.6: Three reflection interfaces. First reflection: Surrounding material-Undamaged material(1). Second reflection: Undamaged material(1)-Deterioratedmaterial(2). Third reflection: Deteriorated material(2)-Surrounding material.
1.9 Research questionThe vibration based NDT techniques mentioned in this chapter could all be usefulfor characterizing the ageing of solid propellant rocket motors. However, the use oftraditional (frequency and mode shape shift based) methods have some difficultieswhen used for the subject of solid propellant rocket motors. More complex objectsconsisting of multiple parts make it difficult to measure (at) the right data (points)and the specificity of the damage data is low.
It can be concluded that the use of ultrasound is promising for characterizing the
8

ageing of solid propellant rocket motors provided that the ultrasonic waves can pen-etrate the material far enough and reflect off the surface of the deteriorated materiallayer. Therefore, the remainder of this research will try to answer the question:
Can ultrasonic signals be used to characterize ageing in solidpropellant rocket motors?
As already mentioned in section 1.8.1, there are a number of theoretical and practicalproblems such as the damping inside the material and the metal-propellant transition.In order to give a substantiated answer to the main research question the followingsub questions will be discussed:
How are ultrasonic signals affected by damping in solid propel-lant material?
How do ultrasonic signals propagate through pristine and agedsolid propellant material?
How are ultrasonic signals affected by the transition over themetal-solid propellant interface?
9

10

2. Theory of ultrasonic wave propa-gation
This chapter discusses the theory of generation of ultrasonic waves, wave propagationand attenuation of ultrasonic waves in solid propellant material as a foundation foran experimental design.
2.1 Generation of ultrasonic wavesUltrasonic (US) waves can be generated and collected by piezoelectric transducers.Piezoelectric materials generate an electric charge in response to a mechanical stressapplied on the material and vice versa. Piezoelectric materials have a crystallinestructure, an example is shown in figure 2.1. The atoms with different charges ensure astable situation when no pressure is applied. When pressure is applied to the material,the structure deforms, changes shape and both sides of the crystalline structure arecharged. This ensures the flow of an electric current. When the pressure is applied inthe other direction, i.e. compression instead of tension, the charges and correspondingcurrent flow change direction. In this manner an alternating current is generated byalternating the strain applied on the material.
Figure 2.1: Piezoelectric material example. Green arrow in direction of the currentflowing [23]
The opposite is also true: A mechanical strain is generated in the material whenan electric field is applied across the material. This results in a vibrating motion ofthe element and the generation of (ultra)sound waves due to the oscillating pressurechanges. When short pulses are desired, the element should be excited in its naturalfrequency. This way a short pulse with maximum amplitude is generated. Dampingbacking material in the transducer makes sure the pulse is damped out shortly aftergeneration [11,24].
(Unfocused) transducers do not have a single point source of the ultrasound waves,the transducers commonly have a circular surface the waves originates from. Becausethe waves originate from multiple points on the transducers surface, the pressurewaves amplify or reduce in intensity due to interference when crossing paths. Thisresults in large intensity fluctuations near the transducers face. The region wherethese fluctuations are present is called the near field. As shown in figure 2.2, behindthe near field, the far field starts, in which the beam also starts to spread and theintensity decreases gradually. Due to the intensity changes in the near field, it can bevery hard to accurately detect flaws in this region. The point at which the near fieldhas ended and the far field starts is the point with the highest intensity, also calledthe natural focus point. Flaws that are at the depth N (m), the natural focus point,will have optimal detectability due to the maximum strength of the sound waves at
11

depth N [10, 23,25]. The length N of the near field is defined by:
N = D2
4λ (2.1)
in which D is the diameter of the transducer and λ the wavelength.
Figure 2.2: Intensity fluctuations in the near field of a transducer [25]
2.2 Wave propagation in solid propellant materialSound waves propagate in air through the compression and rarefaction of particles,called longitudinal waves. In longitudinal waves, particles vibrate in the same direc-tion as the wave propagation. Molecules of solid materials are capable of vibrating inother directions, resulting in various other waveforms. In the case of ultrasonic appli-cations, the two most used waveforms are longitudinal and shear (transverse) waves.In the latter, particles vibrate perpendicular to the wave direction. Both waves areshown in figure 2.3 [26].
Figure 2.3: Shear (transverse) waves and longitudinal waves with the particle motionrelative to the propagation direction
Shear and longitudinal waves have different wave velocities vs and vl defined by:
vs =
√G
ρ(2.2)
vl =
√K + 4
3G
ρ≈
√E
ρ(2.3)
12

with G the shear modulus, K the bulk modulus, E the elasticity modulus and ρ thedensity.
As shown in equation (2.3) vl depends on both the bulk and shear modulus, so thematerials response to (uniform) pressure and the materials response to shear stress.However, the shear and bulk modulus are related to the elasticity modulus, it canbe approximated by replacing the numerator by E. vs only depends on the shearmodulus. The shear wave velocity vs is generally lower than longitudinal velocityvl [27]. Every material has its own sound velocity and changing material propertieslike stiffness and density directly influence the sound velocity. Degraded solid propel-lant material has a higher stiffness than pristine material, causing the sound velocityvl to be higher. Sound velocity can be calculated from the time between two backreflections (time of flight) and the thickness of the sample.
Next to the longitudinal and transverse waveforms other more complex forms arepossible, for example due to elliptical vibrations of particles. This study focuses onthe longitudinal waveform as shown in figure 2.3 to create an understanding of thepropagation of ultrasonic signals in solid propellant material, so these more complexwaveforms are not considered.
2.3 Mode conversionAs mentioned and shown in figure 1.6 ultrasonic waves partly reflect when crossingan interface of two materials with different acoustic properties (acoustic impedancemismatch). In addition, the waves refract when the surface is hit at an angle. Refrac-tion is the change of the angle of a wave when passing on to a next material havinga different sound velocity. The part of the wave in the second material is moving ata different speed than the part of the wave in the first material, causing the wave toproceed at a different angle.
Another energy conversion can take place when a wave hits an interface of two mate-rials at an angle. Waves are based on particle movement and if a longitudinal wavehits the interface at an angle, particle movement may also occur in the transversedirection, causing shear waves. The wave separates in a faster traveling longitudinalwave and a slower traveling shear wave inside the material, this is shown in figure 2.4.
Figure 2.4: Snell’s Law for refraction of waves when crossing an interface with differentsound velocities [11]
In this figure also Snell’s Law for refraction of waves is illustrated. Snell’s Law isdefined by:
sin θ1
vL1
= sin θ2
vL2
= sin θ3
vS1
= sin θ4
vS2
(2.4)
13

where vL1 and vL2 are the longitudinal wave velocities in material 1 and 2 and vS1
and vS2 the shear wave velocities in material 1 and 2. When this mode conversionhappens to waves at every interface in a (small) sample, the resulting waves are addedand the signal can become complicated [11].
2.4 AttenuationUltrasonic waves decrease in intensity while traveling through material and this de-creasing intensity is visible as a loss of wave amplitude. This phenomenon is known asattenuation and is besides spreading of the beam due to various mechanisms, includ-ing absorption, scattering and dispersion. Of these, absorption is the most significantcause. The ultrasound energy is absorbed by the material and converted to otherforms of energy, mainly heat.
Attenuation of ultrasonic signals is a function of frequency. Higher frequency sig-nals are generally damped in less distance than lower frequency signals. Vibratingparticles at a higher rate (higher frequency) require more energy. More vibration mayalso cause more energy to be lost due to heat generation. The amplitude of ultrasonicsignals typically shows an exponential decay defined by:
A = A0e−α(f)z (2.5)
with A the amplitude, A0 the initial amplitude, f the frequency and z the distancetraveled. α (f) is normally fitted to attenuation data as a linear, quadratic or powerlaw function. For viscoelastic materials, the power law function is used most often asdefined by:
α (f) = α0 + α1|f |y (2.6)
with constants α0 and α1. α0 is often set to 0 and y between 0 and 2 for most mate-rials (empirically found) [28].
When specifically interested in the contribution of dispersion an imaginary term β (f)can be added to the exponent of equation (2.5) [28–31]. Deriving the frequency depen-dent attenuation and dispersion terms from attenuation data can be done in severalways. Two of them are elaborated on in appendix B.
2.5 ReflectionWhen an ultrasonic wave comes across an interface it reflects off these interfaces asshown in figure 1.6. In doing so, part of the energy is reflected and the remainderpropagates through the other material. The part of the energy that is reflected canbe calculated with the reflection coefficient, defined by:
R =(Z2 − Z1
Z2 + Z1
)2· 100% (2.7)
Z = ρv (2.8)
with Z1 the acoustic impedance of the first material and Z2 the acoustic impedanceof the second material. Acoustic impedance is a material property dependent on den-sity ρ and acoustic velocity vl. R multiplied by 100% yields the reflected energy asa percentage of the initial wave energy [10]. The remainder of the energy is trans-mitted to the next material as shown in figure 2.5. Water and steel differ a lot inacoustic impedance. From this figure it is clear that most of the energy is reflected ateach water-steel interface. In the end, the back reflection of the steel consist of only1.3% of the initial energy and can be collected by the transducer. Measurements aredone submerged in water or with a coupling liquid between the transducer and thesample, because the low acoustic impedance of air makes it virtually impossible to
14

transmit the waves from and to liquid or solid materials. Even when a transducer ispressed onto the sample, air will be trapped between the transducer and the sample.Water and coupling liquid will provide an (air)tight coupling and have an acousticimpedance more in the region of a solid material, making sure more energy will betransmitted from the (metal) transducer into the material. Figure 2.5 shows a setupin which the transitions from one material to another are very well defined and sharp.When a transition is not as well defined and more diffuse, the ultrasonic signal maynot reflect.
Figure 2.5: Example of energy division between reflection and transmission [32]
Besides these reflections, scattering causes the sound to be reflected in other directionsthan the original direction of the propagating wave. This occurs when the wave comesacross particles smaller than the wavelength. The ultrasound scatters in all directionscreating multiple echoes with smaller amplitudes from the particle.
2.6 Viscoelasticity and dispersionSolid propellants are viscoelastic materials. This means that the material exhibitsboth viscous as well as elastic material behaviour. Viscous materials have a timedependent strain rate, they resist strain linearly with time. Water has a relativelylow viscosity, resulting in a high flow. Honey has a relatively high viscosity, resistingflow (deformation).
Elasticity is a measure of the ability of a material to resist deforming due to a forceon the body and to return to its original shape and size when the force is removed.Viscoelastic materials exhibit material behaviour of both viscous as elastic materialtypes. The viscous component of the viscoelasticty could result in a temperatureand time dependent strain rate. Hysteresis, stress relaxation and creep are all typi-cally observed in viscoelastic materials. These phenomena have the time dependentstress-strain behaviour as shown in figure 2.6. A loading and unloading cycle dueto hysteresis is shown in figure 2.6a. In this stress-strain curve it is shown that theloading and unloading cycle are not, as in elastic materials, the same. A viscoelasticmaterial loses energy when a load is applied and the removed. The area within the
15

loop is the energy that is dissipated in one cycle. Figure 2.6b shows that a viscoelasticmaterial experiences a decrease in the amount of stress while subjected to a constantstrain known as stress relaxation. Figure 2.6c shows that these materials experience atime dependent increase in strain. When the constant stress is removed, the materialreforms the amount of initially gained strain (ε0), which is elastic material behaviour,and then resumes to decrease in a nonlinear way to a residual strain [2, 5, 27]. Somenon-Newtonian fluids also exhibit viscoelastic properties. They behave like fluids(flow) or solids (bounce or break) depending on strain rate.
(a) Hysteresis as present in astress-strain curve of a viscoelas-tic materials
(b) Stress relaxation as presentin viscoelastic materials
(c) Creep as presentin viscoelastic materials
Figure 2.6: behaviour commonly present in viscoelastic materials, σ=stress, ε=strain
In summary, viscoelastic materials are materials with a ‘memory’. Due to this timedependent behaviour, these materials may show acoustic dispersion when being sub-jected to (ultra)sonic waves. Dispersion means that a pulse, which is made up of acenter frequency component and some (smaller) side frequency components, is sep-arated into its different frequency components. This is because the velocities of thedifferent wave components change while propagating through the material, with lowerfrequencies traveling faster than the higher frequencies. As shown in figure 2.3, acous-tic waves are carried by vibrating particles. When an acoustic wave is put on a mate-rial, a force vibrates the particles. In a viscoelastic material the time dependent strainbehaviour may alter the vibrations, resulting in a non-elastic response and a changein speed. When the speed of the vibrations is altered depending on the frequency ofthe vibrations, it means that the material is dispersive. Dispersion is also present inlight waves, visible as a light bundle separating into a spectrum of light waves withdifferent frequencies after passing through a dispersive material.
16

3. Experimental SetupIn the previous chapters a theoretical background is given on ultrasound and itsapplications in the field of non destructive testing. It is expected that ultrasoundis able to help characterize ageing in solid propellant materials. Before conductingthe follow-up experiments, feasibility experiments are done to test some variables.The follow-up experiments are designed and tuned with the results of the feasibilityexperiments. The feasibility experiments will be pulse-echo measurements and testthe following variables:
1. Which frequency range is optimal to use so the attenuation of the US signal isminimum?
Attenuation is frequency dependent, finding the optimal frequency range makessure that back reflections are well defined and distinguishable.
2. Which sample thickness is useful in the current set-up?
Attenuation is traveling depth dependent. It is expected that the solid propellantmaterial damps the ultrasonic signal a lot, so it is examined which thicknessstill gives a usable number of back reflections.
3. Do the inert samples exhibit the same acoustic behaviour as active solid pro-pellant material?
Inert propellant samples are used in the experiments for safety reasons. Thismeans that some reactive ingredients are substituted for inert ingredients whichmay alter the acoustic behaviour. This is done by comparing empirically con-ceived acoustic material properties of inert samples with values found in litera-ture of active propellant material.
4. Do the samples within one batch exhibit the same acoustic behaviour?
The mixing process is a manual process with its accompanying risks of differ-ences within a batch of samples.
Because it was expected that the inert propellant material damps the ultrasonic sig-nal considerably, samples with a small thickness (5-30 mm) were created. The setupof all experiments will be a pulse-echo setup. This setup is chosen because in thedesired application of assessing solid propellant rocket motors, pulse-echo measure-ments would also be used. It is not possible to place transducers on the inside of themotor for a transmission measurement and transmission measurements over the fulldiameter of the engine are impossible due to the cavity (bore hole) in the middle ofthe engine.The feasibility experiments were used to test which frequency range is best to use andif the thicknesses used provide enough back reflections for further analysis. Based onthe experience of the first mixing process and the results of the feasibility experimentsa second batch of samples have been produced for the follow-up experiments.
3.1 Inert solid propellant samplesSamples of inert propellant material were produced for the feasibility and follow-upexperiments. Inert material is used because safety regulations prohibit non-certified
17

persons to work with reactive samples or transport them.In the absence of a standard recipe, an experimental method is conceived and modi-fications are made during the production process if needed. The full method can befound in Appendix A, a summary addressing important issues is described here.
Two batches of samples were produced. The first batch includes samples withouta container and were used in the feasibility experiments. The second batch includessamples with a container and were used in the follow-up experiments. The samplesfor the follow-up experiments were aged in a stove to mimic years of natural ageing.
To mimic the composition of hydroxyl-terminated polybutadiene (HTPB) based pro-pellant material the reactive (solid) particles that are bound by HTPB are substitutedby inert solid particles, in this case potassium sulfate. The binder, HTPB and aux-iliary substances, and potassium sulfate are mixed in a ratio of 85:15. This ratioensures that the mixture cures properly and the solid particles do not migrate andcollect at the bottom, which results in non-homogeneous samples.The ingredients are mixed in a Resonant Acoustic Mixer (RAM). This mixer usesthe natural frequency of the mixing pot and its content so that the content is mixedto a homogeneous mixture. The RAM can also put the contents of the pot undervacuum, in order to remove air from the mixture to reduce or prevent the occurrenceof bubbles. Due to the vibrations of the mixer, the mixture heats up. In this casea beneficial side effect, because the final mixture is very viscous. Heating up themixture makes it less viscous and easier to pour into the final containers or molds.It is hard to pour the mixture in the containers without causing air bubbles to betrapped in the mixture. However, during curing at 60°C the bubbles migrate to thesurface of the samples and burst before the sample is fully set.
Table 3.1 shows the samples that were used in the feasibility experiments. Becausethere were doubts if the samples with a thickness more than ±15 mm cured properlyin the this batch, these were not used in the experiments.
Table 3.1: Samples produced for feasibility experiments
Sample ID Thickness1.1 8.4mm1.2 8.6mm1.3 11.4mm1.4 13.0mm1.5 13.3mm
Table 3.2 includes the samples of the second batch, produced after the feasibilityexperiments were done. The containers, as shown in figure 3.1, in which the sampleswere cured were made by the workshop of TNO Rijswijk and can be closed air tightby a lid. This was done because the samples can now be sealed when not in use, whichmakes sure there is no air pollution around the samples. With the sample materialin a container, all samples have one surface exposed to air, so the oxygen inducedageing process will proceed from this surface only. Also, the ultrasonic measurementscan now be done through the bottom of the container. This resembles the setup ina solid propellant rocket motor: the ageing proceeds from one surface exposed to airand pulse-echo measurements have to be done through a casing layer.Reference samples were produced to be used in hardness measurements, because thecontainers do not fit in the setup used for these measurements. These referencesamples have a mold of thick aluminum foil. The ultrasonic measurements were donefrom the free surface of the reference samples and not through the bottom layer ofaluminum foil. Figure 3.2 shows the setup for the ultrasonic measurements for both
18

types of samples.
Table 3.2: Samples produced for the experiments in batch 2
Sample Thickness (mm) Container Aging temp.P1 17.05 Plastic 60°CP2 17.90 Plastic 70°CP3 16.65 Plastic 60°CM1 9.30 Stainless steel 60°CM2 15.70 Stainless steel 60°CM3 20.40 Stainless steel 70°CR1 12.00 Aluminum foil 1mm 60°CR2 14.25 Aluminum foil 1mm 70°CS1 24.80 Aluminum foil 1mm 60°CS2 22.95 Aluminum foil 1mm 70°C
Figure 3.1: Containers for the second batch of samples. Red arrow shows the directionof the ultrasonic signal
Figure 3.2: Setup for ultrasonic measurements, left: reference samples with aluminumfoil mold, right: samples in containers of plastic or metal
3.1.1 Accelerated ageingThe ageing of the inert propellant samples for the follow-up experiments (batch 2) isaccelerated in a stove at 60°C and 70°C. At these temperatures ageing is relativelyfast, but still safe for the sample material. Any higher temperature would increase thechance of other, possibly dangerous, processes to start. To convert the storage time
19

at high temperatures to the storage time at 18°C the Arrhenius equation is used [33]:
t = tref · e
EactR
( 1Tcal
−1
Tref
)(3.1)
with t the ageing time in weeks, tref the corresponding time in weeks at 18°C, Ethe activation energy which is 70 kJ/mol in this case, R the universal gas constant,Tcal the temperature for which the ageing time is calculated and Tref the referencetemperature 18°C.
When equation (3.1) is applied to a number of different reference temperatures andreference ageing times a simple graph shows the accelerated ageing. Figures 3.3aand 3.3b show the accelerated ageing. It is clear that the accelerated ageing time(weeks in stove) plotted against the natural ageing time (years at 18°C) has a linearrelation. As a rule of thumb, every 10°C increase in temperature means that theageing is progressing twice as fast. Part of the inert propellant samples are aged at60°C and the remaining samples at 70°C. The samples have been aged in stoves for 6weeks. This means that the corresponding ageing for the 60°C samples is equivalentto storage for 4.4 years and for the 70°C 9.3 years.
(a) Accelerated ageing time at different reference times (b) Accelerated ageing time at different reference tempera-tures
Figure 3.3: Arrhenius equation applied to different reference temperatures and ageingtimes at 18°C
To monitor the accelerated ageing of the samples, twice a week the hardness of thereference samples is measured. Hardness measurements are non invasive and non de-structive and although there is no analytic relation between the indentation hardnessand for example the Young’s modulus, an approximate relation between the Shorehardness and the Young’s modulus has been established [34]. An increasing Shorehardness reading indicates an increasing Young’s modulus. Hardness readings areonly compared within the same sample, so it is assumed that when the hardnessreadings increase the ageing process is making the sample material stiffer.
3.2 Experimental setup and instrumentationThe instruments used are a ITE Ultimo 2000 pulser-receiver (fig. 3.4) and Panametricstransducers. Based on expert opinion, 1 MHz and 500 kHz transducers are used onthe samples in the feasibility experiments. This is chosen because the material hasmechanical properties comparable to rubbers and plastics. For these types of materialstransducers with a frequency range around 500kHz - 1MHz are normally used [35].
20

Figure 3.4: ITE Ultimo 2000 pulser-receiver
The input signal can be tuned to two different shapes with the setup as used in theseexperiments: square wave and spike excitation. The most commonly used shape is asquare wave with a length of half the transducers frequency period. With this exci-tation signal, the piezo element is excited at its resonance frequency. An excitationperiod shorter than this would result in a lower amplitude than possible and an ex-citation period longer than this would distort the oscillation. In this case the lengthof the square input signal is 500ns or 250ns, which is half the wavelength of a 1MHz(1µs) or 500kHz (0.5µs) wave respectively. The spike excitation signal has a very fastrise and an exponential decay. It generates a broadband pulse and the duration doesnot have to be tuned to the transducer. Because the square wave input signal canbe tuned to have optimal amplitude, these signals generally have a greater energyoutput. Square wave input signals are used in the feasibility experiments.
The samples from batch 1 have various thicknesses between 8 mm and 14 mm (seetable 3.1) and are used for the feasibility experiments. They are used to examinethe uniformity and homogeneity. In addition, propagation speed and attenuation insamples of different thickness are examined. The experiments are all done at 21°C.A coupling liquid is used to transfer the ultrasonic pulse in the material.
Setups in which a transmission signal with a sending transducer on one side anda receiving transducer on the other side will have less attenuation of the signal than apulse-echo setup. Pulse-echo setups work with one transducer that alternates sendinga pulse and receiving the signal that reflects off of the interfaces within a sample.For applications where the objective is to find for example the sound velocity in thematerial, transmission measurements are preferred. When the ultrasound is used tofind the thickness of a sample or flaws in the material, reflections are needed andthe pulse-echo measurements are preferred. When the setup prohibits a transmissionmeasurement, a pulse-echo setup can also be used to examine properties like the soundvelocity. In pulse-echo setups the intensity of the signal should be increased, becauseof the longer distance the signal has to travel. Although transmission measurementsare preferred because of the shorter distance the signal has to travel, pulse-echo mea-surements are done to resemble the set-up in a actual solid propellant rocket motorwhere the transducer must be used on the outside of the casing. In the setup with anrocket motor the ultrasonic signal reflects off the propellant-air interface at the insidesurface of the propellant material, which can be seen in figure 3.5. In the follow-up experiments measurements are carried out by sending ultrasonic signals throughthe bottom of the containers, which can be difficult because the casing and sample
21

material have very different acoustic impedances.
Figure 3.5: Schematic of a solid propellant missile with air filled bore hole (yellow) inthe middle of solid propellant material and a transducer (blue) and ultrasonic signals(red). Adapted from [1]
The hardness measurements are done with a Zwick Roell Shore A analog hardnesstester as shown in figure 3.6. Three measurements are done per sample and the valuesare averaged. For proper readings the measurement is filmed and the Shore A valueis read at 1, 3, 5 and 10 seconds after the probe touches the sample material.
Figure 3.6: Zwick Roell Shore A analog hardness tester [36]
3.3 Results and conclusions feasibility experimentsFigure 3.7 shows the ultrasonic signals of a pulse-echo signal of sample 1.1. Noticethat the signal in the first 0.1 · 10−4 seconds is not a back reflection received bythe transducer, but a transducer-dependent signal that is always present even whenmeasuring in air. Five back reflections, with the first around 0.15 · 10−4 seconds, areindicated by red arrows. It can be seen that in the 1MHz signal, five back reflectionsare nicely separated, while in the 500kHz signal, there is a lot of noise and the backreflections are not always clearly distinguishable. For the experiments, it will beimportant to distinguish the back reflections, so therefore the experiments will bedone with the 1 MHz transducer.
22

(a) US signal sample 1.1, 1MHz (b) US signal sample 1.1, 500kHz
Figure 3.7: Ultrasonic signals of sample 1.1 with 1 MHz and 500 kHz, back reflectionsare indicated with a red arrow.
Figure 3.8a shows the envelope (in blue) around the ultrasonic signal (in red) offigure 3.7a. It is important to pinpoint the maximum magnitude of the signal. Withthe envelope this peak is found and the attenuation in the material can be fitted byfitting an exponential curve through the peaks, as shown in figure 3.8b. The first peakis the signal that is sent into the material and is not taken into account for the fit,because it was cut off by the window (peak to peak) in the measurements. It is nowclear that the samples fit an exponential decay as described in section 2.4. Besides, itcan now be checked if the acoustic behaviour (in terms of attenuation) of ultrasoundis the same in all samples to check the homogeneity of the batch. Figure 3.9a showsthe mean and standard deviation of the exponential fits of the ultrasonic signals ofall 5 samples at 1MHz and 500kHz. Figure 3.9b shows an exponential fit through allback reflection peaks. The fit for 1MHz has an R2 of 0.9371, the fit for 500kHz has anR2 of 0.9311. An R2 close to 1 indicates that the data points are close to the fit, so itis assumed that the acoustic behaviour in samples of the same batch is comparable.
(a) Envelope (blue) on US signal(red) (b) Exponential fit through envelope on US signal
Figure 3.8: Envelope (blue) and exponential fit (red), sample 1.1, 1 MHz
23

(a) Mean and standard deviations of the fits through backreflection peaks of all five samples
(b) Fit through all back reflection peaks of all five samples
Figure 3.9: Average curve of all fits through back reflection peaks of five samples
The sound velocity, density and acoustic impedance of the material can be calculatedwith:
v = 2dtr
(3.2)
ρ = m
V(3.3)
Z = ρv (3.4)
with d the thickness of the sample, tr the time between two back reflections (alsoknown as time of flight), m the mass of the sample and V the volume of the sam-ple. Table 3.3 shows the sound velocity, calculated density and calculated acousticimpedance of the samples of batch 1. These are calculated with measurements ofdimensions and weight taken with a digital caliper and digital scale. The mean µand standard deviation σ are calculated with Matlab, the coefficient of variation isdefined by:
CV = σ
µ(3.5)
The coefficients of variation are below 5%, which confirms the homogeneity withinthe batch.
One remark on table 3.3 is that although the sound velocity v is in the expectedrange of 1510 to 1650 m/s, the same as active solid propellant [35], the mean densityρ of the inert HTPB based propellant material is not in the same range as active solid
24

propellant. The binder of this material is the same as in active propellant material asis the ratio in which the binder and solid particles are mixed. However, the solid par-ticles used are not alike. This results in different densities, the density is 528 kg/m3
while the density of active HTPB based propellant is around 1700 kg/m3 [37]. Con-sequently, there is a difference in density related material properties like the Young’smodulus E (equation (2.3)) and acoustic impedance Z (equation (3.4)). Ei of theinert material is about 1.3GPa compared to Ea of active material of 4.4GPa. This isin line with Young’s moduli reported in literature [38,39].
The acoustic impedance Z is also directly related to the density of the material.Knowing that the sound velocity is alike in inert and active propellant material [35],this means there is a difference in Z between inert and active propellant. Zi of inertmaterial is approximately 8.53·105 Rayl, while Za of active material is approximately27·105 Rayl. This will play a role when trying to reflect off of a internal interface be-tween aged and non-aged propellant material because the amount of energy reflectedis dependent on the difference in value for Z of both layers. However, it is assumedthat the difference in Z in the aged and non-aged inert material is not much differentthan in active material. This is because the change in material properties is due tothe degrading binder HTPB and not a change in the solid particles. This would meanthat the same kind of degradation is present in both materials and the change inthe value of Z would most probably be comparable. This means that the amountof reflected energy R is also comparable, because R mainly relies on the differencebetween Z1 and Z2.
Table 3.3: Sound velocity v, density ρ and acoustic impedance Z of the samples inbatch 1. µ: mean, σ: standard deviation, CV: coefficient of variation σ
µ
v (m/s) ρ (kg/m3) Z (·105Rayl)1.1 1518 531.3 8.061.2 1684 523.6 8.821.3 1566 519.6 8.131.4 1672 524.4 8.771.5 1637 541.3 8.86µ 1615 528.0 8.53σ 63.95 7.621 0.35CV 3.96% 1.44% 4.14%
A couple of conclusions can be drawn from the feasibility experiments. The frequencybest to use is in this setup is 1MHz, because the back reflections are nicely separated.Samples with a thickness smaller than 15mm give good results, enough back reflectionsare received for further analysis. The inert propellant samples have a sound velocity inthe same range as active solid propellant and the samples are homogeneous throughoutthe batch.
3.4 Follow-up experimentsThe feasibility experiments were carried out successfully. The goal of the follow-upexperiments is to detect ageing in solid propellant material with ultrasound. Ageingis a change of the material properties of the surface exposed to oxygen as describedin section 1.5. It is expected that ultrasound behaves differently in aged material ina number of ways.
1. An additional surface reflection from the added interface between non-aged andaged material.
25

As mentioned in section 2.4, ultrasonic waves do not reflect on interfaces thatare too diffuse. Because the degradation process of solid propellant material isa diffusion process, this may be the case. If the interface is too diffuse, no extrareflection will be visible in the signal.
2. A change in reflection time.
A change in reflection time indicates a change in sound velocity in the ma-terial, which points to a change in material properties. It is expected that theelasticity modulus E will increase over time with ageing, so this would meanthat the sound velocity v defined by:
v =
√E
ρ(3.6)
will also increase.
3. A change in frequency content of the back surface reflection.
Due to dispersion (see section 4.2.2) the pulse is separated into its differentfrequency components and the resulting pulse will therefore have a different fre-quency content. Because of the viscoelastic material, it is expected that disper-sion will contribute to the attenuation of the ultrasonic signal in this case.
The experiment designed to examine if the mentioned changes will be visible in theultrasound data are elaborated on in this section.
26

4. Experimental Results and Inter-pretation
This chapter discusses the results of the follow-up experiments, showing the hardnessevolution over time and testing the hypotheses about the ultrasonic signals posed inthe previous chapter. The first measurements were done on January 11th (week 0)and the experiments were continued until February 22nd (week 6).
4.1 HardnessShore A hardness is measured two times a week. Figures 4.1a and 4.1b show theevolution of the Shore A hardness values. Looking at thin reference samples (R1 andR2), it can be observed that they have had an relatively fast increase in hardnessvalue in the first days, whereafter the hardness value decreases again to increase at aslower rate. The same can be seen in the thick reference samples (S1 and S2), but theincreasing of the hardness value takes a little longer. The increase is again followedby a decrease, after which the hardness values start increasing again. This peak inthe beginning of the graphs may be explained by a phenomenon called post-curing, aprocess in which the material hardness rises fast after which it settles again. It can beobserved that the two thinner samples (R1 and R2) and the two thicker samples (S1and S2) both show the same beginning of the curve (post-curing process). However,after this initial peak the two samples that are aged at 60°C (R1 and S1) and the twosamples that are aged at 70°C (R2 and S2) show the same behaviour. This is shownin figures 4.2a and 4.2b, in which a linear curve is fitted through the data after theinitial post-curing process. The linear regressions are as follows:
R1 (60°C) : y = 0.76x+ 24.42, R2 = 0.8909R2 (70°C) : y = 1.60x+ 26.31, R2 = 0.9116S1 (60°C) : y = 0.94x+ 23.64, R2 = 0.8664S2 (70°C) : y = 1.62x+ 29.71, R2 = 0.9024
It is clear that the slopes of the R1 and S1 curve are similar and the slopes of theR2 and S2 curve are almost identical. The rule of thumb, that every 10°C increaseresults in a twice as fast ageing also holds when looking at the mean slopes of thelinear regressions of the samples aged at 60°C and 70°C, i.e. 0.85 vs. 1.61 /wk.It can be concluded that the post-curing process takes longer for the thicker samples,but after this process has settled, the thickness difference of the samples does notinfluence the hardness value as much as the difference in temperature does.
It must be noted that these measurements are surface indentation measurements.This means that the hardness is measured only at the surface, which shows a linearincrease in hardness. The way that the ageing process, and with that the hardnessincrease, progresses into the material will most probably not be a linear process. Thismeans that with these hardness measurements only the ageing at the surface is moni-tored, but no conclusions on the depth of the ageing process can be drawn from thesemeasurements.
The samples are cut after the 6th week of measurements. Hardness measurementsare done on the cross section to gain a rough insight on the thickness of the degradedlayer.
27

(a) Shore A hardness values of reference sample R1 and R2 (b) Shore A hardness values of reference sample S1 and S2
Figure 4.1: Shore A hardness values of the reference samples at 60°C and 70°C
(a) Reference sample R1 and R2 (b) Reference sample S1 and S2
Figure 4.2: Linear regression fits through Shore A hardness values of the referencesamples at 60°C(a) and 70°C(b) from moment post-curing has ended.
4.2 Ultrasonic measurementsAn ultrasonic measurement of sample R1 is shown as an example in figure 4.3. Thebeginning of the signal, till 1.3 · 10−5s, is a transducer and input signal specific part.It is the direct reaction of the transducer on the input signal that it sends. The firstback reflection is visible around 1.9 · 10−5s (marked in green). Two more back reflec-tions are visible around 3.8 · 10−5s and 5.7 · 10−5s. Around 2.9 · 10−5s and 4.6 · 10−5sa small reflection is also noticeable (marked in yellow). This could be due to a smallair bubble or another pollution in the material.
A remark on the comparison of the signals of one sample between different weeksis that the amplitude should not be compared. A contact layer between the trans-ducer and the sample should be formed with the use of a coupling liquid, so no airis trapped between the transducer and sample and the ultrasonic signal is passed onthrough the sample. The position of the transducer on the sample is optimized with
28

a real-time ultrasonic signal and the contact layer is produced by applying pressureto the transducer. When sufficient amplitude (comparable to preceding weeks) ofthe back reflections is reached on the real-time signal, the pressure is lifted off thetransducer and after 30 seconds without pressure 200 measurements are taken. Thismeans the measurements are comparable on shape and reflection time, but not di-rectly comparable based on amplitude.
In the remaining subsections, the changes in the signals will be studied, focusingon respectively extra reflections, change in sound velocity and changes in frequencycontent. Also the effect of the metal casing on the signals will be studied.
Figure 4.3: Ultrasonic signal of reference sample R2 in week 0, with red the trans-ducer and input signal specific part, in green the back reflections and in yellow theunexpected reflection of presumably a pollution in the material
The following sections discuss the results of the ultrasonic signals of the follow-upexperiments. As hypothesized in section 3.4, three phenomena will be discussed: anadditional surface reflection, a change in reflection time and a change in frequencycontent. Lastly the influence of a metal casing layer on the ultrasonic signal is dis-cussed.
4.2.1 Extra surface reflectionAn extra surface reflection should be detected by inspection of the shape of the ul-trasonic signal. An extra reflection, caused by a possibly present interface betweenpristine and degraded material, should be visible as a reflection with a higher fre-quency (but lower amplitude) than the back reflections. Figure 4.4 shows the signalsof week 0 and week 6. However, it can be observed that there is no demonstrable dif-ference in shape between week 0 and week 6. This may be because the ageing processof solid propellant materials is a diffusion process. The aged material is visible asan individual layer, but on microscopic level, the transition may be too diffuse. Theultrasonic waves will not experience the transition as such because the transition is
29

‘smeared out’ over a longer distance and the changes in the acoustic properties willbe gradual along this distance. Another explanation is that the transition is sharpenough, but the acoustic properties of the non-aged and aged propellant material aretoo similar. If the acoustic impedance Z of both layers is very similar, the amountof energy that is reflected off of the interface is very low and the reflection will benon-detectable in the signals measured.
Figure 4.4: Ultrasonic signal of reference sample R2 in week 0 and week 6
4.2.2 Change in velocityAn envelope of the measured signal is created and the time between peaks (tr or timeof flight) in this envelope is calculated to detect a change in velocity of the signal inthe material. The signal of reference sample R2 is taken as an example. The measuredsignal of week 0 and its envelope are shown in figure 4.5. Peaks are located with thefindpeaks function in Matlab. Per signal the back reflections of the sample materialare located and it is determined how many back reflections are usable. In the case ofsample R2, the first three back reflections are included for calculating the velocity. Asshown in figure 4.5, four back reflections are indicated by the blue arrows, the fourthis omitted due to low signal to noise ratio.
30

Figure 4.5: Ultrasonic signals of reference sample R2 and its envelope in week 0
Table 4.1: Location on time-axis (·10−5s) of peaks as shown in figure 4.5 and timebetween peaks: ∆ti = ti+1 − ti
week 0 week 1 week 2 week 3 week 4 week 5 week 6t1 1.16 1.14 1.13 1.12 1.11 1.10 1.08t2 2.94 2.90 2.88 2.85 2.83 2.81 2.78t3 4.74 4.67 4.65 4.60 4.57 4.52 4.48t4 6.57 6 .45 6.43 6.31 6.30 6.17 6.09∆t1 1.78 1.76 1.75 1.73 1.73 1.72 1.71∆t2 1.80 1.77 1.77 1.76 1.71 1.71 1.70∆t3 1.83 1.78 1.78 1.71 1.74 1.65 1.61mean difference 1.80 1.77 1.77 1.73 1.73 1.69 1.67
The locations on the time-axis of the peaks t1 to t4 and amount of time betweentwo peaks ∆t1 to ∆t3 are shown in table 4.1 for week 0 to week 6, as is the meandifference. It can be seen that the mean difference between the peaks, representingthe average time of flight, decreases over time. This trend of a decreasing ∆ti, or timeof flight (tof) between back reflections, and thus an increasing velocity, is also seen infigures 4.6 to 4.8. These show the mean time of flight between back reflections for thesamples in plastic containers (P1,P2 and P3) and the reference samples (R1,R2,S1and S2), respectively. It is visible that every sample shows an decreasing trend in thetime of flight between back reflections over (ageing) time. The sound velocity vl isapproximated by:
vl =
√E
ρ(4.1)
An increase in vl indicates an increase in elasticity modulus E or a decrease in den-sity ρ or a combination. The ageing of solid propellant material is due to oxidativecrosslinking of binder molecules. In this process ρ does not change considerably, sothis means that the value for E must increase in order to have an increase in vl asshown in .
31

Figure 4.6: Mean time of flight of samples in plastic container over 6 weeks
Figure 4.7: Mean time of flight of thin reference samples over 6 weeks
Figure 4.8: Mean time of flight of thick reference samples over 6 weeks
The slopes of the linear regression and corresponding R2 values are in table 4.2. It isshown that although every linear regression has a negative slope a, not every linearregression has a good fit (R2). The samples in plastic containers show a relativelyhigh R2 value in comparison with the reference samples, which have an outer layer
32

of aluminum foil. This is with an exception of sample R2, which actually shows thehighest slope value as well as the highest R2 value. An explanation for the lower R2
values of the reference samples could be that in these the pulse-echo measurement isdone on the sample material surface. The hardness measurements are also done atthis surface and this creates small distortions on the surface of the sample. Measuringthrough these distortions may result in changes in the ultrasonic signals.Another observation from table 4.2 is that the slope value a of the samples aged at60°C are between the values of −0.0029 and −0.0038, whereas the slope value a ofthe samples aged at 70°C are much higher, with the exception of sample S2. This islogical because the higher temperature causes more material degradation (increase ofE), causing the sound velocity to increase more.
The actual change in propagation velocity of the signal can be calculated using thetime of flight when the thickness of the samples is measured. The samples are cutin half to measure the exact thickness of the samples. These results are also shownin table 4.2. It is shown that in every sample, a measurable difference is found withvalues between 10.16 m/s and 79.60 m/s. As mentioned samples aged at 70°C havea higher change in velocity than the samples aged at 60°C, which is also logical dueto the faster ageing at higher temperature. The smallest differences are seen in thethickest samples (S1, S2), which was expected. The change in velocity however is dueto the aged part of the material only and the percentage change therefore depends onthe thickness of the sample. The overall change in velocity in a thinner sample willbe more pronounced than in a thicker sample with the same amount of aged materialpresent. It may be possible to relate the change in overall velocity to the thickness ofthe aged material if the ageing process into the material is known. For clarificationfigure 4.9 shows the material condition as function of the depth in a sample, assumingthe material degradation follows an exponential function. The change in velocity isonly due to the degraded part, shown in red on the x-axis.
Table 4.2: Slope (tof = ax(ageing time in weeks)+b) and R2 values of trendlines asshown in figures 4.6 to 4.8 at different temperatures
Sample Temp. Slope a R2 Thickness v w0 (m/s) v w6 (m/s) v change (m/s) % changeP1 60°C -0.0029 0.6667 17.05 mm 1614 1630 15.43 0.96P2 70°C -0.0075 0.8820 17.90 mm 1586 1622 35.92 2.26P3 60°C -0.0034 0.9401 16.65 mm 1588 1603 15.28 0.96R1 60°C -0.0038 0.2708 12.00 mm 1514 1558 44.25 2.92R2 70°C -0.0137 0.9842 14.25 mm 1594 1674 79.60 4.99S1 60°C -0.0036 0.1812 24.80 mm 1582 1592 10.16 0.64S2 70°C -0.0029 0.3516 22.98 mm 1574 1584 10.85 0.69
Hardness measurements were done on the cut section to gain a rough insight on thethickness of the degraded layer. It was expected that the hardness would increasewith thickness (bottom up) because of the stiffer layer that would form at the freesurface. However, the hardness values are inconclusive and it is not possible to derivea thickness of a degraded layer from the hardness measurements. A visual inspectiondoes also not give insight in the thickness of the degraded layer. Small amounts ofspilled material are brittle and show a color change. In the sample no color changeis visible. The samples aged at 70°C do have a darker color than the samples agedat 60°C, but this is throughout the whole sample. This suggests that the degradedpart does not have a sharp transition and the material properties doe not change verymuch.
33

Figure 4.9: Material condition assuming an exponential ageing shape as function ofthe depth in the sample
4.2.3 Change in frequency contentDispersive media change the velocity of waves traveling through the material, in otherwords change the frequency content of the signal. The aged propellant material isexpected to be a dispersive medium. It may be the case that the aged material ismore or less dispersive than non-aged material. To create smooth fast Fourier trans-forms (FFT’s), only the first back reflection is taken from the signals. Using theFFT method on the complete signal does not give good results and the multiples ofthe back reflections have been damped too much resulting in sparsity of informationin the back reflections. The multiples would provide more information on how thematerial changes the frequency content of the signal, because these reflections are theresult of the signal that has traveled through the material for a longer period.
The main contributing frequency in the back reflection is between 0.5-1MHz. Be-cause the FFT is done on a very short time window (101 points ·5 · 10−8s, samplingfrequency 2·107Hz), the frequency spacing is very high, 156kHz. To create a betterfrequency resolution zero padding is applied to the signal. A frequency resolution of153Hz is achieved by zero padding the signal to 990 times the signal length. This willgive sufficiently specific results for determining differences. Differences that could ap-pear are a change in frequency of the main peak(s), a change in the number of peaksin the FFT or a change in the full bandwidth of the FFT.
Figure 4.10 shows the cut-outs of the first back reflections and their FFT’s. Thereis a difference of 11.14kHz between the peaks in the FFT’s. This is a considerabledifference and suggests that aged material indeed has a different frequency contentthan non-aged material. The number of peaks stays the same and the bandwidth ofthe FFT’s is very similar.
Figure 4.10: Left: first back reflection of US signals of sample R2 in week 0 and week6. Right: FFT’s of first back reflections with maximum frequency values indicated.
34

The change in frequency content cannot be directly attributed to dispersion, sinceonly a small part of the signal is used. Cutting the signal at a specific locationleads to different in- or exclusion of information. It is sub optimal to manually cutback reflection from the signal, because it is hard to pinpoint the exact beginningand ending of the reflection. In appendix B a method is discussed for assessing thefrequency dependent damping of ultrasonic signals in a material and for characterizingfrequency changes and dispersion.
4.2.4 Influence of metal casingThe most realistic setup for ultrasonic measurements on solid propellant rocket motorswould be pulse-echo measurements from the outside of the casing to the bore hole inthe middle and back, see figure 3.5. However, the metal casing and solid propellanthave a large difference in acoustic impedance Z. Stainless steel has a value Zs of46 · 106 Rayl, where solid propellant has a value Zp of 8.53 · 105 Rayl (see table 3.3).This acoustic impedance mismatch results in a large amount of energy that is reflectedat the interface between metal and propellant:
R =(Zp − ZsZp + Zs
)2· 100% = 92.85%
This means only 7.15% is passed on to the inert solid propellant material to propagatethrough. When the wave reaches the propellant-metal boundary for the second time,in opposite direction, again only 7.15% of what is left of the signal after propagatingthrough the sample material is passed on to the metal and then back to the trans-ducer. Though the reflected energy is 92.85% at the metal-inert propellant interface,the acoustic impedance mismatch between metal and active solid propellant will beless due to the higher density of active propellant material. The calculated Za wasapproximately 27·105 Rayl, which results in a R of 78.74%, passing 21.26% of thesignal through the interface. The result is that when doing these experiments withactive propellant material, the signal will improve.
Besides the energy loss at the metal-propellant interface, a high frequency ‘noise’is present in the signal because of the high sound velocity vsteel in steel (5800 m/s).These signals are the reflections of the ultrasound signal in the metal bottom of thecontainer and are visible in figure 4.11. Sample M1 and M3 show the same behaviour,with an increase in intensity between 0.2-0.3·10−4 s and between 0.5-0.6 ·10−4 s. Theseare exactly the locations where a back reflection of the sample material is expectedand at the same position where samples with a plastic casing show back reflectionsas shown in figure 4.12. Sample M2 does not show the same behaviour. It can beconcluded that for two of the three samples with a metal casing, the back reflectionsare visible. However, for determining the time of flight, it is necessary that the samemoment of the peak is located on every back reflection, e.g. the origin, the maximumor the end of the pulse. Using an envelope gives the opportunity to get the t relatedto the maximum of the pulse. In the signals of M1 and M3, an envelope would not beable to locate this maximum accurately and consequently. Different envelope methodsor settings give different values for the t location of the maximum of the pulse(backreflection).
35

Figure 4.11: US signals of samples in metal containers in week 0
Figure 4.12: Comparison of location of back reflections in samples with the samethickness with plastic(P2) and metal(M3) casing in week 0. Small difference explainedby small thickness difference and difference in sound velocity in the casing materials.
Processing the signal with for example a low pass filter would remove the high fre-
36

quency contributor, but would again result in a signal where the actual peak of theback reflection cannot be determined accurately enough for further analysis, an ex-ample is shown in figure 4.13. The high frequency signal is partly removed, but thesignal to noise ratio drops, which makes the back reflections hard to distinguish.
Figure 4.13: Raw data and (low-pass) filtered signal of sample M1, week 0
4.3 Implications for ultrasonic signals due to hard-ness measurements
The hardness measurements done to monitor the ageing of the samples are Shore Aindentation measurements. This means that a small probe is pushed in the materialand the resistance the material has to this indentation is measured. In this process thematerial is slightly damaged on the surface. This means that measurements cannotbe done in the exact same position every time. Besides, this means that the referencesamples, for which is measured on the surface have small defects on the same surfaceas where the ultrasonic measurements are done. This can have an influence on theresults and the comparison of signals over the weeks. It was observed that as theweeks passed it got harder to get the same amplitude as the previous week. Thiswas especially the case for the reference samples. This could be due to the damagepresent on the surface as a result of the indentation hardness measurements. But itcould also be as a result of the increased stiffness. The increased stiffness makes itharder to achieve a good contact layer between the transducer and the sample.
4.4 Summary experimental resultsThe results of the hardness measurements for monitoring the ageing process show anexpected increase in surface indentation hardness. This can be related to an increasein Young’s modulus. In addition, the rule of thumb: every 10°C increase of ageingtemperature corresponds with twice the ageing rate, is confirmed by the hardnessvalues.
None of the ultrasonic measurements show an extra surface reflection, which canbe related to an aged layer of propellant material. However, an increase in propaga-tion velocity of the ultrasound is observed in every sample. A higher velocity relatesto an increase in Young’s modulus. Although it does not provide information on thethickness or exact value of material properties of the degraded layer yet, the resultsgive reason for further research.
37

Although the frequency contents of the first back reflections hint to a change infrequency content of the signal, conclusions cannot be drawn from this. The signal asobtained by these experiments was not sufficient for analyzing the frequency contentin detail, but it gives reason for further research on this topic.
The metal container causes a large loss of signal that propagates through the samplematerial and results in a high frequent signal caused by reflections in the metal layer.However, back reflections are recognizable in the pulse-echo signal.
38

5. ConclusionsTo conclude this research project the sub questions and research question as posed insection 1.9 are answered below.
How are ultrasonic signals affected by damping in solid propel-lant material?
Solid propellant is a highly damping material. A decent amount of back reflectionsis visible when using thin (15mm) samples. However, this may give rise to challengeswhen using ultrasonic signals in the desired application of the larger solid propellantrocket motors, which generally have a thickness larger than 100mm. The largestsample in this thesis had a thickness of 24.8mm, which gave two useful back reflections.Since one back reflection is needed to calculate the time of flight (given the inputsignal is well defined) the thickness could be increased while maintaining sufficientinformation.
How do ultrasonic signals propagate through pristine and agedsolid propellant material?
Aged solid propellant has a higher Young’s modulus than pristine material, whichcauses the ultrasonic signals to propagate with higher velocity in aged solid propellantmaterial. The increase in velocity was especially visible in the samples acceleratedaged at 70°C, which is comparable to 9.3 years of natural aging at 18°C. Samples agedat 60°C (4.4 years) also show an increase in sound velocity, but not as decisive. Thismeans that there is a considerable difference in propagation (velocity) of ultrasonicsignals between pristine and aged solid propellant material.
How are ultrasonic signals affected by the transition over themetal/solid propellant boundary?
The metal-propellant boundary results in a major reflected signal intensity (∼ 93%) atthe interface. A high frequent signal is present in the signal because of the high soundvelocity in metal. However, in two of the three samples used, the back reflections aredistinguishable. These back reflections are not yet accurate enough to calculate thesame change in velocity as in the samples with no container or plastic container. Sincethe acoustic impedance mismatch of the metal-propellant interface is less in the caseof active propellant material, it is expected that the signal will improve considerablyin measurements with active material. This could make it possible to accuratelycalculate a time of flight and thus a sound velocity (increase) in solid propellantrocket motors.
Can ultrasonic signals be used to characterize ageing in solidpropellant rocket motors?
The whole of this research project serves as a feasibility study on using ultrasound forcharacterizing ageing in solid propellant rocket motors. Ageing is characterized byan increase in Young’s modulus of the material exposed to oxygen, which is reflected
39

in a higher sound velocity. A change in sound velocity between pristine and agedsample material is directly related to a change in Young’s modulus. This changeis measurable in the sample material used in this thesis. Although there are somepractical limitations to implement the method on solid propellant rocket motors, thisthesis shows that ultrasonic measurements are a promising method to pursue forfurther research.
40

6. RecommendationsFrom the results and conclusions follow some recommendations for further research.These include recommendations on how to improve ultrasonic results, recommenda-tions on which aspects should be revisited and a future outlook for practical imple-mentation of the method on solid propellant rocket motors.
Method changes to improve ultrasonic signalIt is assumed that the expected extra reflection of the interface between aged andnon-aged material will be fairly low in amplitude to the relatively small change inacoustic impedance Z between the two layers. It is therefore important to optimizethe ultrasonic signal as much as possible to be able to observe this extra reflection. Inthe setup that was used the backwall reflections were actually in the near field of thetransducer, which makes it likely that the amplitude of the pulse is not at its maxi-mum at the location of the expected interface between the non-aged and aged layer.This can be improved by placing a stand-off pad or block with the same acousticimpedance as the coupling liquid. This ensures that the near field intensity changesare inside this block instead of in the aimed depth of the sample.
In this study square input signals are used in the measurements. Other input signals,for example sine waves, might improve the quality of the signal. When it is clearwhich frequency (transducer) gives the optimal results for the material, the inputsignal can be tuned to this frequency and less noise is present in the measurements,which makes observing extra surface reflections easier.It can also be that different wave forms, like shear waves with particle movement per-pendicular to the wave direction or waves with elliptical vibration patterns of particlesimprove the signal quality for the desired application.
In depth analysis of attenuationThe general fit for the amplitude decay data of ultrasonic signals in (visco-elastic)materials is given in section 2.4 as:
A = A0e−α(f)z (6.1)
with A the amplitude, A0 the initial amplitude, z the distance traveled and α (f)fitted to a power law function defined by:
α (f) = α0 + α1|f |y (6.2)
with α0 often 0 and y between 0 and 2 for most materials.In this study, equation (6.1) is used to fit attenuation data with α constant for the fre-quency of the transducer used to determine the homogeneity of the batch. However,an in depth analysis of the frequency dependent attenuation behaviour would be help-ful to understand which ultrasonic methods are best to use and at which frequencythe attenuation is minimal. It is possible to research the contribution of dispersion byadding an imaginary term iβ (f) to the exponent of equation (6.1). Raisutis’ methodexplains how to characterize the ultrasonic attenuation and the phase velocity disper-sion assumed that the phase velocity and attenuation coefficients are not independent,but are interrelated and each can be determined according to the other [40].The Acoustics and Sonar department of TNO has also developed a method for ana-lyzing the frequency dependent attenuation of materials. Initially it was developedfor small clay and rubber samples, but it could be used with solid propellant materialas well. Both methods are elaborated on in appendix B. Both methods are limitedby the frequencies of the transducers, so broadband transducers should be used for
41

optimal results. With these frequency sweep input signals can be used to cover alarge bandwidth. For further research on using ultrasound for characterizing ageingin solid propellant rocket motors it would be helpful to first analyze and understandmore of the mechanisms that contribute to the attenuation of the ultrasonic signals.
Insight in degradation processNeither hardness measurements on the cut section nor visible inspection on colorchange gives insight in the degradation process in the samples. It was expected thata degraded layer would be visible and hardness measurements would confirm thosevisual changes. However, this is not the case and suggests that the ageing may havenot progressed as expected. Gaining more insight on the ageing process is essentialfor interpreting results of ultrasonic testing. Measuring stiffness at different depthsin degraded material can give insight in the ageing process and help with interpretingresults.
Correlation with other testsAssuming ultrasonic testing will be developed in the future to be a useful NDT tech-nique for characterizing ageing in solid propellant rocket motors, it would be impor-tant to correlate the outcomes of ultrasonic testing with other data. For validation,the data should first be correlated with the tests that are in use for characterizingageing and lifetime assessment right now: (destructive) mechanical tests that assessthe material properties.
Future outlook: Possible setup in solid propellantrocket motorsThe measurements that were done in this research were on small samples. Solid pro-pellant material is a highly attenuating medium. The samples used in this research allhave a very small thickness compared to actual solid propellant rocket motors. Pulse-echo measurements in the samples with a plastic casing gave two or three workableback reflection multiples. This means that in thicker material, in which the distancethe signal travels is much larger, it is quite possible that the signal will be dampedout completely and no back reflection can be observed in the received signal.It was shown that a plastic casing does not pose large problems, however metal cas-ings are more problematic. rocket motors are cylindrical and have a metal casingand an air filled void in the middle. This means that the ultrasonic techniques areoptimized to propagate through a metal-solid propellant interface, pulse-echo mea-surements from outside the casing to the middle of the rocket motor would be thesimplest setup as shown in figure 6.1a.However, it is more likely that the metal-propellant barrier will remain a challenge.This means that it would be more logical to place small ultrasonic transducers in-side the casing, in direct contact with the propellant material, for transmission mea-surements as shown in figure 6.1b. Using ultrasonic techniques that assess materialproperties, the results of signals that propagate near the middle of the material canbe compared to signals that have propagated more superficially to characterize theageing, as shown by the blue pathways in figure 6.1b. Another option would be toplace a transducer on the surface of the propellant material in the air filled cylinder todo pulse-echo measurement from there directly on the propellant material. Lookingat the fabrication process and use of the rocket motor, it may be more logical to putthe ultrasonic elements at the inside of the casing rather than in the middle void.During the fabrication process the propellant material is poured into the casing andis cured inside the casing, which would make it easy to attach the elements on theinside of the casing before pouring the propellant material in. This way there is also avery small chance of the elements detaching or moving. With the elements immersedin the propellant material, no coupling material has to be used to make sure there
42

is an airtight fit. During the ignition of the propellant material, the material startsto burn on the free surface on the inside of the propellant material. It seems logicalthat any possible pollution or decelerator of the burn pattern is more critical at thisearly stage of the ignition than in the last stage, when the burn surface has reachedthe casing.
(a) Setup for a pulse-echo measurementfrom outside thecasing
(b) Setup for a trans-mission measurementfrom inside the casing
Figure 6.1: Different setups for ultrasonic experiments on a cylindrical solid propellantrocket motor
43

44

Bibliography[1] E. Lindeijer, “1. Raketmotor en Stuwstof 2. Stuwstoffen voor raketten,” no. 19,
1961.
[2] G. P. Sutton and O. Biblariz, Rocket Propulsion Elements, 7th ed., 2001.
[3] J. Pike and R. Sherman, “M39 Army Tactical Missile System (Army TACMS),”2016. [Online]. Available: www.fas.org
[4] P. G. Hill and C. R. Peterson, Mechanics and thermodynamics of propulsion, ser.Addison-Wesley series in aerospace science. Addison-Wesley Pub. Co., 1965.
[5] F. A. Williams, M. Barrere, and N. C. Huang, “Fundamental Aspects of SolidPropellant Rockets (AGARDograph, No. 116),” no. Copyright (C) 2015 Ameri-can Chemical Society (ACS). All Rights Reserved., p. 791 pp., 1969.
[6] S. C. E. L. R. Neviere, “Effects of the Diffusion Processes in the Modelling ofComposite Propellant Ageing,” no. September, pp. 23–26, 2002.
[7] S. Cerri, M. a. Bohn, K. Menke, and L. Galfetti, “Ageing Behaviour of HTPBBased Rocket Propellant Formulations,” Central European Journal of EnergeticMaterials, vol. 6, no. 2, pp. 149–165, 2009.
[8] C. van Driel and W. de Klerk, “Ageing effects on the ignition and burning pro-cess of small and medium calibre propellants and resulting performance of theammunition,” Tech. Rep. TNO 2012 R11260, 2013.
[9] O. Yilmaz, “Service Life Assessment of Solid Rocket Propellants ConsideringRandom Thermal and Vibratory Loads,” 2012.
[10] W. J. P. Vink, Niet-destructief onderzoek. Delft: Delfste Universitaire Pers,1995.
[11] NDT Education Resource Center, “Ultrasonic Testing,” 2014. [Online].Available: www.nde-ed.org
[12] K. Worden, C. R. Farrar, G. Manson, and G. Park, “The fundamental axioms ofstructural health monitoring,” Proceedings of the Royal Society A: Mathematical,Physical and Engineering Sciences, vol. 463, no. 2082, pp. 1639–1664, 2007.
[13] R. Loendersloot, “Structural Health & Condition Monitoring - Lecture Notes,”Enschede, 2016.
[14] S. W. Doebling, C. R. Farrar, and M. B. Prime, “A Summary Review ofVibration-Based Damage Identification Methods,” Journal of Applied Mechanics,vol. 111, no. 2, pp. 270–78, 1998.
[15] Mini Physics, “Natural Frequency,” 2018. [Online]. Available: www.miniphysics.com
[16] Y. J. Yan, L. Cheng, Z. Y. Wu, and L. H. Yam, “Development in vibration-based structural damage detection technique,” Mechanical Systems and SignalProcessing, vol. 21, no. 5, pp. 2198–2211, 2007.
[17] C. Y. Kao and S. L. Hung, “Detection of structural damage via free vibrationresponses generated by approximating artificial neural networks,” Computers andStructures, vol. 81, no. 28-29, pp. 2631–2644, nov 2003.
45

[18] B. Giammarinaro, A. Zorgani, and S. Catheline, “Shear-Wave Sources for SoftTissues in Ultrasound Elastography,” IRBM, feb 2018.
[19] J. Y. Kwak and E.-K. Kim, “Ultrasound elastography for thyroid nodules: recentadvances,” Ultrasonography, vol. 33, no. 2, pp. 75–82, apr 2014.
[20] P. N. T. Wells and H.-D. Liang, “Medical ultrasound: imaging of soft tissuestrain and elasticity,” Journal of The Royal Society Interface, vol. 8, no. 64, pp.1521 LP – 1549, nov 2011.
[21] J. Ophir, I. Céspedes, H. Ponnekanti, Y. Yazdi, and X. Li, “Elastography: Aquantitative method for imaging the elasticity of biological tissues,” UltrasonicImaging, vol. 13, no. 2, pp. 111–134, apr 1991.
[22] H. H. Delgadillo, R. Loendersloot, R. Akkerman, and D. Yntema, “Developmentof an inline water mains inspection tech nology,” in 2016 IEEE InternationalUltrasonics Symposium (IUS), sep 2016, pp. 1–4.
[23] Piezotechnics GmbH, “Fundamentals of Piezo Stack Actuator.” [Online].Available: www.piezotechnics.com
[24] M. Lach, M. Platte, and A. Ries, “Piezoelectric materials for ultrasonic probes,”1996. [Online]. Available: www.ndt.net
[25] OLYMPUS CORPORATION, “Beam Characteristics,” 2018. [Online]. Available:www.olympus-ims.com
[26] Z. Nazarchuk, V. Skalskyi, and O. Serhiyenko, “Propagation of Elastic Waves inSolids,” in Acoustic Emission, 2017, vol. i, ch. 2.
[27] D. C. Giancoli, Physics for Scientists & Engineers with Modern Physics, 4th ed.Pearson Education, 2009.
[28] T. Szabo, “Time-Domain Wave-Equations for Lossy Media Obeying a FrequencyPower-Law,” Journal of the Acoustical Society of America, vol. 96, no. 1, pp.491–500, 1994.
[29] T. L. Szabo, “Causal theories and data for acoustic attenuation obeying a fre-quency power law,” The Journal of the Acoustical Society of America, vol. 97,no. 1, pp. 14–24, 1995.
[30] T. Szabo and J. Wu, “A model for longitudinal and shear wave propagation inviscoelastic media,” The Journal of the Acoustical Society of America, vol. 107,no. 5 Pt 1, pp. 2437–46, 2000.
[31] W. Chen and S. Holm, “Modified Szabo’s wave equation models for lossy mediaobeying frequency power law,” The Journal of the Acoustical Society of America,vol. 114, no. 5, p. 2570, 2003.
[32] Structural Diagnostics Inc., “Ultrasonic Testing,” 2018. [Online]. Available:www.sdindt.com
[33] M. C. Mortier, “AOP-48 (Edition 2) - Explosives, Nitrocellulose-based Propel-lants, Stability Test Procedures and Requirements Using Stabilizer Depletion,”NATO North Atlantic Council, Tech. Rep., 2007.
[34] A. N. Gent, “On the Relation between Indentation Hardness and Young’s Mod-ulus,” Rubber Chemistry and Technology, vol. 31, no. 4, pp. 896–906, 1958.
[35] M. Kohga, R. A. Frederick Jr., and M. D. Moser, “Ultrasonic properties of pro-pellant ingredients,” J. Propul. Power, vol. 20, no. 1, pp. 135–140, 2004.
46

[36] Zwick Roell, “Shore hardness testers - analog and digital.” [Online]. Available:www.zwick.com
[37] F. P. Weterings and G. Reeling Brouwer, “TNO closing report of the French-Dutch collaborative programme AT19 on service lifetime,” TNO Technical Sci-ences, Rijswijk, Tech. Rep., 2012.
[38] N. Gligorijević, S. Zivković, S. Subotić, B. Pavković, M. Nikolić, S. Kozomara,and V. Rodić, “Mechanical properties of HTPB composite propellants in theinitial period of service life,” Scientific Technical Review, vol. 64, no. 4, pp. 8–16,2014.
[39] P. Bose and K. M. Pandey, “Desirability and assessment of mechanical strengthcharacteristics of solid propellant for use in multi barrel rocket launcher,” In-ternational Journal of Chemical Engineering and Applications, vol. 3, no. 2, pp.114–124, 2012.
[40] R. Raišutis, R. Kažys, and L. Mažeika, “Application of the ultrasonic character-ization methods for highly attenuating plastic materials,” NDT and E Interna-tional, vol. 40, no. 4, pp. 324–332, 2007.
[41] A. Volker, “Measurement Plan Rubber Characerization,” TNO, Den Haag, Tech.Rep., 2017.
47

48

A. Method: mixing inert solid pro-pellant material
Appendix A describes the method that was developed to mix, pour and cure a smallbatch of inert solid propellant samples. This method is applicable for a mixture of ±350 gram total weight, which is the maximum volume for one large RAM container.
IngredientsBinder ingredientsHTPB (Hydroxyl-terminated polybutadiene) Prepolymer 69.000%IDP (Isodecyl Pelargonate) Plasticizer 25.000%IPDI (Isophorone diisocyanate) Harder 5.320%Flexzone 6H Antioxidant 0.670%FeAA Catalyst 0.001%
Binder (above) Binder 15.00%Potassium sulfate Solid particles 85.00%
Method1. Sieve potassium sulfate with a 1 mm sieve, removing clumps from the powder
2. Prepare molds with thick aluminum foil when the samples will not be kept intheir containers afterwards
3. Mix HTPB and IDP in a seperate container
4. Add potassium sulfate to the RAM container and indent the middle for theHTPB/IDP mixture
5. Add HTPB/IDP in the indenture in the potassium sulfate
6. Add IDPI, Flexzone and FeAA
7. RAM in intervals with increasing intensity, see table A.1
8. RAM at 100% intensity until homogeneous and the container starts to feel warm
9. RAM with vacuum at 100% intensity until air bubbles disappear
10. When mixture is warm enough to be poured out of container, pour into moldsin a fume cupboard
11. Leave in a 60oC stove to cure for one week
12. When cured, aluminum foil can be peeled away
49

Step Time(s) % Intensity1-4 30 50-70-90-100 Each step 30 seconds5 120 1006 300 1007 120 100 Vacuum alternating on/off8 300 100 Vacuum on
Table A.1: RAM steps for a large container with 350 gram ingredients
50

B. Methods for analyzing frequencydependent attenuation
B.1 Frequency dependent attenuationThe method described below is taken from a method created by A.W.F. Volker forTNO [41]. Most of the explanation is taken from this document and some changesand additions in the form of text and figures are made for further clarification.
To characterize frequency dependent attenuation in clay and rubber samples, a methodhas been developed to to this with a setup with two transducers and two identicalPMMA walls. The setup is shown in figure B.1. The sample is placed between thetwo parallel walls and transducers are placed on opposite sites on the walls. Thisway the transducers can be used for pulse-echo as well as transmission measurements.By doing all four measurements the transducer specific parts of the signal (transmitand receive transfer functions) can be filtered from the signals and only the actualattenuation by the sample material remains.
Figure B.1: Setup with the sample clamped between two PMMA walls
The signals of transmission and pulse-echo experiments can be represented in thefrequency domain as a multiplication of transfer functions. A transmission experimentwhere transducer 1 transmits and transducer 2 receives can be described by:
V T2 = D2 ·W2 · T1L→2 ·WL · T1→L ·W1 · S1 (B.1)
Where V T2 is the signal measured at transducer 2 (in the frequency domain), D2 is thereceive transfer function of transducer 2, W2 describes the propagation through wall2, TL→2 is the transmission coefficient belonging to the interface between the sampleand wall 2, WL describes the propagation through the sample over distance L and isthe frequency dependent variable that helps characterizing the frequency dependentattenuation, T1→L is the transmission coefficient belonging to the interface betweenwall 1 and the sample, W1 describes the propagation through wall 1 and S1 is thetransmit transfer function of transducer 1.In the same way the transmission experiment where transducer 2 transmits and trans-ducer 1 receives is described by:
V T1 = D1 ·W1 · TL→1 ·WL · T2→L ·W2 · S2 (B.2)
where V T1 is the signal measured by transducer 1(in the frequency domain), D1 the re-ceive transfer function of transducer 1, TL→1 is the transmission coefficient belongingto the interface between the sample and wall 1, T2→L is the transmission coefficient
51

belonging to the interface between wall 2 and the sample and S2 is the transmit trans-fer function of transducer 2.
A pulse-echo experiment with transducer 1 transmitting and receiving the reflectionof the interface between wall 1 and sample is described by:
V Pe1 = D1 ·W1 ·R1→L ·W1 · S1 (B.3)
where V Pe1 is the signal measured by transducer 1 (in the frequency domain), andR1→L is the reflection coefficient between wall 1 and sample.The pulse-echo measurement with transducer 2 is described by:
V Pe2 = D2 ·W2 ·R2→L ·W2 · S2 (B.4)
where V Pe2 is the signal measured by transducer 2 (in the frequency domain), andR2→L is the reflection coefficient between wall 2 and the sample.
By multiplying equations (B.1) and (B.2) and dividing by equations (B.3) and (B.4)the following is obtained:
V T2 · V T1V Pe2 · V Pe1
= TL→1 · TL→2 · T1→L · T2→L
R1→L ·R2→L·W 2
L (B.5)
by eliminating D1, D2, S1, S2, W1 and W2 from the equation. The influence of boththe transducers and the walls are eliminated from the equation. Equation (B.5) onlyconsists of the received signals and reflection and transmission coefficients, which canbe calculated and are frequency independent. The only unknown left is W 2
L, whichdescribes the propagation through the sample.
One sent pulse is used in the method. The ultrasound pulses, either the signal thathad passed through the setup or the first back reflection of the wall-sample interface,must be cut from the measured signal in the time domain with a window, for examplea rectangle or Hamming window. Figure B.2 shows an (ideal) example of a pulse-echomeasurement and a Hamming window around the pulse. Because convolution in thetime domain is the same as multiplication in the frequency domain, the left hand sideof equation (B.5) can be done by convolution in the time domain before conversionto the frequency domain by Fourier transform.
Figure B.2: Hamming window (red) around received pulse signal (black)
The difference in sound attenuation (αdif ) can be calculated as follows from the signalsmeasured:
αdif =20log10
(|W 2
L|)
L(B.6)
52

The attenuation difference can be plotted against frequency and the graph will givean idea about which frequencies will damp the signal maximally and minimally.
B.2 Attenuation and phase velocity dispersion esti-mation
The method described here is a short summary of a method described by Raisutis etal. [40]. It is created to predict back surface reflections of highly attenuating plastics.Solid propellant material has similar properties as plastics, so is expected this methodcould be applied to solid propellant material too.
Figure B.3 shows the setup for this method. It is a pulse-echo setup immersed inwater with air behind the sample. This way the ultrasonic signal will reflect off oftwo surfaces resulting in an ultrasonic signal ur (t) reflected by the back surface andu0 (t) reflected by the front surface of the sample. u0 (t) is the reference signal, whichhas not traveled through the sample and ur (t) is the signal that has changed due toattenuation and dispersion after propagating through the sample material.
Figure B.3: Submerged pulse-echo setup
Prediction of the signal ur (t) can be done if the complex transfer function H (iω, x)of the sample is known:
ur (t) = iFFT [U0 (iω)H (iω, x)] (B.7)
where H (iω, x) is the complex transfer function in a pulse-echo mode of the objectwith an arbitrary thickness x and U0 (iω) the Fourier transform of the reference signalu0 (t). iFFT denotes the inverse Fourier transform. The complex transfer functioncan be found from pulse-echo measurements using a sample of thickness x0:
H (iω, x) = Ur (iω, x)U0 (iω) (B.8)
with Ur (iω, x) the Fourier transform of the reflected signal ur (t).The complex transfer function H (iω, x) can be presented in terms of real part R (ω)and imaginary part X (ω):
H (ω, x) = K (R (ω) + iX (ω)) (B.9)= Hatt (ω, x)Hdisp (iω, x) (B.10)
with
Hatt (ω, x) = K0e−α(ω)x (B.11)
Hdisp (iω, x) = eiβ(ω)x (B.12)
K takes into account signal losses and distortions caused by interfaces of the testobject and the surrounding medium, K = 1/K0, K0 is the reflectivity coefficient,
53

α (ω) is the attenuation coefficient, β (ω) is the propagation constant which is relatedto the phase velocity vp by β (ω) = ω/vp (ω).In general the phase velocity dispersion and attenuation are interrelated. This meansthat the attenuation of the material is known, the phase velocity dispersion could bedetermined from that. The full elaboration of the method to do this with the helpof the Kramers-Kronig relation connecting the real and imaginary parts of complexfunctions is described in [40].
54
Copyright © 2022 FDOKUMEN