Non-Destructive Testing of Aircraft Structures Using Microwire ...
14
applied sciences Article Non-Destructive Testing of Aircraft Structures Using Microwire-Based Tensile Stress Sensor Miroslav Šmelko , Katarína Draganová * , Pavol Lipovský , Karol Semrád, Monika Blišt’anová and Patrik Kašper Faculty of Aeronautics, Technical University of Košice, Rampová 7, 041 21 Košice, Slovakia; [email protected] (M.Š.); [email protected] (P.L.); [email protected] (K.S.); [email protected] (M.B.); [email protected] (P.K.) * Correspondence: [email protected]; Tel.: +421-55-602-6153 Received: 19 October 2020; Accepted: 19 November 2020; Published: 20 November 2020 Featured Application: The developed microwire-based tensile stress sensor represents an original solution which can be used for the tensile stress measurement of various types of materials, including aircraft structures. The main advantage of the designed sensor is that the measurement can be contactless and the sensitive part of the sensor (microwire) can be embedded directly into the composite material. Abstract: The development of non-destructive methods for material testing and diagnostics has been, in the last few decades, focused mainly on optical, infrared, thermography, ultrasonic, acoustic or X-ray principles. This article deals with the possibility of adaptation of magnetic sensors for the diagnostics of aircraft structures. The developed sensors are based on the enhanced induction method, allowing contactless diagnostics of the material structure. In the role of the sensing element, amorphous magnetic microwires were used. Thanks to their dimensions, microwires can either be placed on the material surface or be embedded directly into the composite material without structural violations. In the article, the measurement principles of the developed microwire-based tensile stress sensors, together with the experimental measurements with the sensors originally tested in the aircraft wing, are presented. Keywords: non-destructive testing (NDT); tensile stress; microwire; magnetic sensor 1. Introduction Periodic monitoring and testing of materials and structures is very important for many industrial applications. Considering the aviation industry, namely regarding the fatigue of aircraft structures, prevention is particularly important, because cracks and damage can lead to dangerous situations, even to aircraft accidents. This is particularly true for the composite materials that are nowadays commonly used in aviation, where, due to the structure of composite materials consisting of two or more layers, produced from different materials with dissimilar chemical and physical properties, which are merged together, dangerous detachments of the layers can occur suddenly. The increased use of advanced composite materials in primary aircraft structures has initiated a discussion of how such structures perform under repeated loading, since there are many clear differences between composite and metal materials. This is the reason that multiple methodologies associating a specific design and loading scenario with an accurately predicted number of cycles to failure with an associated reliability level and considering the particularities of degradation of structural properties in composite materials, together with enhanced methods, have been developed. Research in the area of NDT (Non-Destructive Testing) has been mainly focused on the need to monitor their state in order to prevent critical damage. Appl. Sci. 2020, 10, 8218; doi:10.3390/app10228218 www.mdpi.com/journal/applsci
-
Upload
khangminh22 -
Category
Documents
-
view
0 -
download
0
Transcript of Non-Destructive Testing of Aircraft Structures Using Microwire ...
applied sciences
Article
Non-Destructive Testing of Aircraft Structures UsingMicrowire-Based Tensile Stress Sensor
Miroslav Šmelko , Katarína Draganová * , Pavol Lipovský , Karol Semrád,Monika Blišt’anová and Patrik Kašper
Faculty of Aeronautics, Technical University of Košice, Rampová 7, 041 21 Košice, Slovakia;[email protected] (M.Š.); [email protected] (P.L.); [email protected] (K.S.);[email protected] (M.B.); [email protected] (P.K.)* Correspondence: [email protected]; Tel.: +421-55-602-6153
Received: 19 October 2020; Accepted: 19 November 2020; Published: 20 November 2020 �����������������
Featured Application: The developed microwire-based tensile stress sensor represents an originalsolution which can be used for the tensile stress measurement of various types of materials,including aircraft structures. The main advantage of the designed sensor is that the measurementcan be contactless and the sensitive part of the sensor (microwire) can be embedded directly intothe composite material.
Abstract: The development of non-destructive methods for material testing and diagnostics hasbeen, in the last few decades, focused mainly on optical, infrared, thermography, ultrasonic, acousticor X-ray principles. This article deals with the possibility of adaptation of magnetic sensors forthe diagnostics of aircraft structures. The developed sensors are based on the enhanced inductionmethod, allowing contactless diagnostics of the material structure. In the role of the sensing element,amorphous magnetic microwires were used. Thanks to their dimensions, microwires can either beplaced on the material surface or be embedded directly into the composite material without structuralviolations. In the article, the measurement principles of the developed microwire-based tensile stresssensors, together with the experimental measurements with the sensors originally tested in the aircraftwing, are presented.
Keywords: non-destructive testing (NDT); tensile stress; microwire; magnetic sensor
1. Introduction
Periodic monitoring and testing of materials and structures is very important for many industrialapplications. Considering the aviation industry, namely regarding the fatigue of aircraft structures,prevention is particularly important, because cracks and damage can lead to dangerous situations,even to aircraft accidents. This is particularly true for the composite materials that are nowadayscommonly used in aviation, where, due to the structure of composite materials consisting of twoor more layers, produced from different materials with dissimilar chemical and physical properties,which are merged together, dangerous detachments of the layers can occur suddenly. The increased useof advanced composite materials in primary aircraft structures has initiated a discussion of how suchstructures perform under repeated loading, since there are many clear differences between compositeand metal materials. This is the reason that multiple methodologies associating a specific design andloading scenario with an accurately predicted number of cycles to failure with an associated reliabilitylevel and considering the particularities of degradation of structural properties in composite materials,together with enhanced methods, have been developed. Research in the area of NDT (Non-DestructiveTesting) has been mainly focused on the need to monitor their state in order to prevent critical damage.
Appl. Sci. 2020, 10, 8218; doi:10.3390/app10228218 www.mdpi.com/journal/applsci
Appl. Sci. 2020, 10, 8218 2 of 14
This article is focused on non-destructive testing, which means that the material properties aremeasured and determined without causing damage. In this area of non-destructive diagnostics,many techniques and methods have been developed [1–5]. The development of the technique includesthe sensor design, integration (contact, contactless, built-in) and signal processing together withthe evaluation of the obtained measurement results. In general, they are based on the principlesof optical analysis, infrared thermography, ultrasonic scans, X-ray observations or electromagneticprinciples, but each of these techniques has some limitations, involving, for example, the materialtype, dimensions or shape of the inspected area, resolution, duration, price, etc. Therefore, they areoften integrated.
Optical imaging methods including coherent imaging, speckle interferometry and holographicinterferometry are also used for defect detection. These techniques show some limits in the caseof in-field application, when large structures must be analyzed. They are often used, for example,in combination with ultrasonic [6] or laser-ultrasound [7] methods.
On the other hand, thermography is based on the experimental observation of local variations inthe thermal resistance of the structure caused by cracks or delimitations. A disadvantage is that onlyin the most recent and costly systems is the spatial resolution sufficient to allow reliable analysis ofdamages with small dimensions. The cooled or uncooled infrared sensors and corresponding techniquesare also commonly used and improved [8], for example, from the signal-to-noise ratio point of view [9].Moreover, many other enhanced thermography techniques have been developed [10–12]. Some ofthem are based on deep learning techniques [13] or on the active thermography approach [14–16],which involves a heat source and an infrared camera mounted to a mobile part of the system.
X-ray radiography is based on the particular X-ray transparency of an object, which producesan image of the defect, but there is a safety hazard due to X-ray exposure, the costs are usually high,and the analysis of large surfaces is very difficult [17]. Therefore, it is usually used, for example,in combination with ultrasonic methods [18].
Ultrasonic and acoustic techniques can be used to characterize the presence of various typesof defects for a complete analysis of the state of a composite component [19] but, in several cases,the performed tests can be time-consuming, must be performed in the arrays [20] and are often suitableonly for plate-like structural components, such as composite aircraft fuselage and wing panels [21].Attention is also paid to the guided wave methods and analysis of the wave propagation amongthe composite layers [22], even using laser ultrasonic scanning [23] or lamb-wave depth characterizationof acoustic emission sources [24].
Other methods involving, for example, vibration-based monitoring [25], the 3D shape shearographytechnique [26] or resonance techniques [27] can be mentioned.
Another interesting perspective seems to be also the utilization of unmanned aerial vehicles fornon-destructive structural monitoring [28,29].
From the electromagnetic principles [30–33], the eddy current principle [34–37], magnetoresistivesensors [38] or the piezoelectric principle [39] have been the subject of research.
Our research performed at the Department of Aviation Technical Studies is focused on the researchand development of magnetic sensors for various aviation and industrial applications [40]. Utilizationof magnetic microwires as sensing elements of sensors seems to be very promising also in the areaof non-destructive testing in aviation. The development of these advanced magnetic materials withimproved physical, magnetic and magneto-transport properties and with reduced dimensions ispresented in [41–45].
2. Materials and Methods
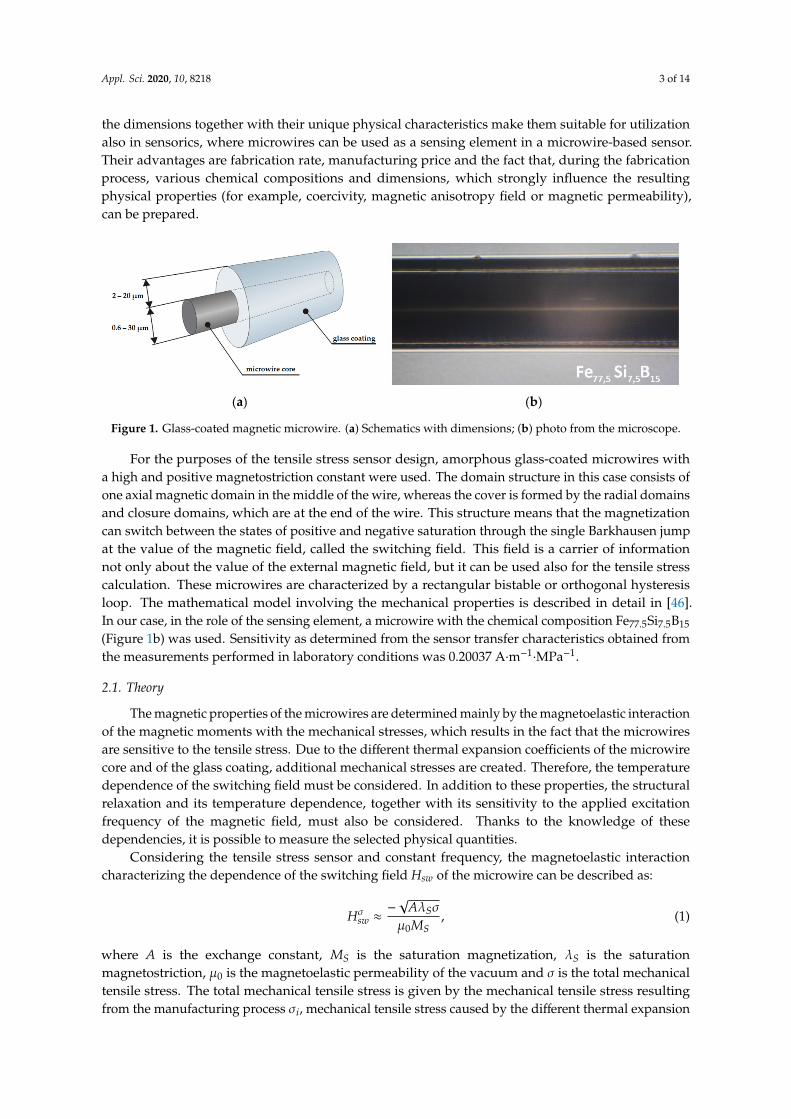
Research in the area of microwires is very extensive, especially that conducted during the last fewdecades. Due to their mechanical, electrical and magnetic properties, they have various applicationpossibilities. Considering the amorphous glass-coated magnetic microwires with a metallic corediameter of 0.6–30 µm covered by a glass coating with a thickness of 2–20 µm, shown in Figure 1a,
Appl. Sci. 2020, 10, 8218 3 of 14
the dimensions together with their unique physical characteristics make them suitable for utilizationalso in sensorics, where microwires can be used as a sensing element in a microwire-based sensor.Their advantages are fabrication rate, manufacturing price and the fact that, during the fabricationprocess, various chemical compositions and dimensions, which strongly influence the resultingphysical properties (for example, coercivity, magnetic anisotropy field or magnetic permeability),can be prepared.
Appl. Sci. 2020, 10, x FOR PEER REVIEW 3 of 14
for utilization also in sensorics, where microwires can be used as a sensing element in a microwire-based sensor. Their advantages are fabrication rate, manufacturing price and the fact that, during the fabrication process, various chemical compositions and dimensions, which strongly influence the resulting physical properties (for example, coercivity, magnetic anisotropy field or magnetic permeability), can be prepared.
(a) (b)
Figure 1. Glass-coated magnetic microwire. (a) Schematics with dimensions; (b) photo from the microscope.
For the purposes of the tensile stress sensor design, amorphous glass-coated microwires with a high and positive magnetostriction constant were used. The domain structure in this case consists of one axial magnetic domain in the middle of the wire, whereas the cover is formed by the radial domains and closure domains, which are at the end of the wire. This structure means that the magnetization can switch between the states of positive and negative saturation through the single Barkhausen jump at the value of the magnetic field, called the switching field. This field is a carrier of information not only about the value of the external magnetic field, but it can be used also for the tensile stress calculation. These microwires are characterized by a rectangular bistable or orthogonal hysteresis loop. The mathematical model involving the mechanical properties is described in detail in [46]. In our case, in the role of the sensing element, a microwire with the chemical composition Fe77.5Si7.5B15 (Figure 1b) was used. Sensitivity as determined from the sensor transfer characteristics obtained from the measurements performed in laboratory conditions was 0.20037 A·m–1·MPa–1.
2.1. Theory
The magnetic properties of the microwires are determined mainly by the magnetoelastic interaction of the magnetic moments with the mechanical stresses, which results in the fact that the microwires are sensitive to the tensile stress. Due to the different thermal expansion coefficients of the microwire core and of the glass coating, additional mechanical stresses are created. Therefore, the temperature dependence of the switching field must be considered. In addition to these properties, the structural relaxation and its temperature dependence, together with its sensitivity to the applied excitation frequency of the magnetic field, must also be considered. Thanks to the knowledge of these dependencies, it is possible to measure the selected physical quantities.
Considering the tensile stress sensor and constant frequency, the magnetoelastic interaction characterizing the dependence of the switching field Hsw of the microwire can be described as:
, (1)
where A is the exchange constant, MS is the saturation magnetization, λS is the saturation magnetostriction, µ0 is the magnetoelastic permeability of the vacuum and σ is the total mechanical tensile stress. The total mechanical tensile stress is given by the mechanical tensile stress resulting from the manufacturing process σi, mechanical tensile stress caused by the different thermal expansion coefficients of the microwire core and of its coating σΔ and finally by the external mechanical tensile stress σa:
Figure 1. Glass-coated magnetic microwire. (a) Schematics with dimensions; (b) photo from the microscope.
For the purposes of the tensile stress sensor design, amorphous glass-coated microwires witha high and positive magnetostriction constant were used. The domain structure in this case consists ofone axial magnetic domain in the middle of the wire, whereas the cover is formed by the radial domainsand closure domains, which are at the end of the wire. This structure means that the magnetizationcan switch between the states of positive and negative saturation through the single Barkhausen jumpat the value of the magnetic field, called the switching field. This field is a carrier of informationnot only about the value of the external magnetic field, but it can be used also for the tensile stresscalculation. These microwires are characterized by a rectangular bistable or orthogonal hysteresisloop. The mathematical model involving the mechanical properties is described in detail in [46].In our case, in the role of the sensing element, a microwire with the chemical composition Fe77.5Si7.5B15
(Figure 1b) was used. Sensitivity as determined from the sensor transfer characteristics obtained fromthe measurements performed in laboratory conditions was 0.20037 A·m−1
·MPa−1.
2.1. Theory
The magnetic properties of the microwires are determined mainly by the magnetoelastic interactionof the magnetic moments with the mechanical stresses, which results in the fact that the microwiresare sensitive to the tensile stress. Due to the different thermal expansion coefficients of the microwirecore and of the glass coating, additional mechanical stresses are created. Therefore, the temperaturedependence of the switching field must be considered. In addition to these properties, the structuralrelaxation and its temperature dependence, together with its sensitivity to the applied excitationfrequency of the magnetic field, must also be considered. Thanks to the knowledge of thesedependencies, it is possible to measure the selected physical quantities.
Considering the tensile stress sensor and constant frequency, the magnetoelastic interactioncharacterizing the dependence of the switching field Hsw of the microwire can be described as:
Hσsw ≈−√
AλSσ
µ0MS, (1)
where A is the exchange constant, MS is the saturation magnetization, λS is the saturationmagnetostriction, µ0 is the magnetoelastic permeability of the vacuum and σ is the total mechanicaltensile stress. The total mechanical tensile stress is given by the mechanical tensile stress resultingfrom the manufacturing process σi, mechanical tensile stress caused by the different thermal expansion

Appl. Sci. 2020, 10, 8218 4 of 14
coefficients of the microwire core and of its coating σ∆ and finally by the external mechanical tensilestress σa:
σ = σi + σ∆ + σa. (2)
2.2. Measurement Method
The measurement is based on the enhanced induction methodology, where, for the excitation,the triangular-shaped magnetic field generated by the excitation coil is used. The sensing part isrepresented by the sensing coil used for the detection of the induced voltage peak caused by the domainwall motion. The microwire is alternately excited to the positive and negative values of the excitationmagnetic field, which must be large enough to overcome the switching field of the microwire inthe local field, e.g., the minimum is twice the local stationary Earth’s magnetic field magnitude generally.In the moment when the local magnetic field achieves the switching field value, the domain wall ispropagated, and it travels from one end of the microwire to the other through the whole volume ofthe microwire. This domain wall motion causes the creation of a voltage peak in the sensing coil andthe process is repeated with the opposite polarity—see Figure 2.
Appl. Sci. 2020, 10, x FOR PEER REVIEW 4 of 14
= + ∆ + . (2)
2.2. Measurement Method
The measurement is based on the enhanced induction methodology, where, for the excitation, the triangular-shaped magnetic field generated by the excitation coil is used. The sensing part is represented by the sensing coil used for the detection of the induced voltage peak caused by the domain wall motion. The microwire is alternately excited to the positive and negative values of the excitation magnetic field, which must be large enough to overcome the switching field of the microwire in the local field, e.g., the minimum is twice the local stationary Earth’s magnetic field magnitude generally. In the moment when the local magnetic field achieves the switching field value, the domain wall is propagated, and it travels from one end of the microwire to the other through the whole volume of the microwire. This domain wall motion causes the creation of a voltage peak in the sensing coil and the process is repeated with the opposite polarity—see Figure 2.
Figure 2. Measurement principle of the tensile stress sensor based on the magnetic microwire.
The main enhancement of this method is in the measurement of the time intervals T+ and T− as the carriers of information about the measured tensile stress, when the voltage peaks occur (during the positive and negative magnetization process, respectively). Although the time can be measured with high accuracy, in this way, it is possible to obtain much more precise measurement results.
For the value of the switching field, the following relationship can be written: = – − 1 , (3)
where HM is the maximum value of the intensity of the switching field and T is the half period of the excitation field.
The intensity of the external magnetic field H0 can be determined according to the following relationship: = − . (4)
From these relationships and from Figure 2, it is obvious that measurement of the time intervals T+ and T− can be used for the determination of the microwire switching field Hsw and also for the intensity of the external magnetic field H0. Therefore, the described principle can be applied for the measurement of multiple physical quantities. Considering the mechanical tensile stress measurement, the measurement of the Hsw is crucial.
For the tensile stress measurement, the electronics based on the VEMA 040 magnetometer was used. This is a four-channel vector relaxation magnetometer with simultaneous sampling using the time interval measurement for the determination of the measured physical quantity manufactured
Figure 2. Measurement principle of the tensile stress sensor based on the magnetic microwire.
The main enhancement of this method is in the measurement of the time intervals T+ and T− asthe carriers of information about the measured tensile stress, when the voltage peaks occur (duringthe positive and negative magnetization process, respectively). Although the time can be measuredwith high accuracy, in this way, it is possible to obtain much more precise measurement results.
For the value of the switching field, the following relationship can be written:
Hsw = HM
(T+ + T–
T− 1
), (3)
where HM is the maximum value of the intensity of the switching field and T is the half period ofthe excitation field.
The intensity of the external magnetic field H0 can be determined according to the followingrelationship:
H0 = −HM(T+− T−)T
. (4)
From these relationships and from Figure 2, it is obvious that measurement of the time intervalsT+ and T− can be used for the determination of the microwire switching field Hsw and also forthe intensity of the external magnetic field H0. Therefore, the described principle can be applied

Appl. Sci. 2020, 10, 8218 5 of 14
for the measurement of multiple physical quantities. Considering the mechanical tensile stressmeasurement, the measurement of the Hsw is crucial.
For the tensile stress measurement, the electronics based on the VEMA 040 magnetometer wasused. This is a four-channel vector relaxation magnetometer with simultaneous sampling using the timeinterval measurement for the determination of the measured physical quantity manufactured bythe EDIS vvd company, through which the applied research performed at the Department of AviationTechnical Studies has been launched in the industry. The control electronics is based on a CPLD(Complex Programmable Logical Device) with a resolution of 10 ns. For the microwire excitation andfor the microwire response sensing, the coil system involving the excitation and sensing coils was used.Thanks to the special design of these coils, it is possible to place them in the proximity of the sensingelement and to sense the microwire response contactlessly. There is no necessity to place the inspectedcomponent into the cylindrical coil system, as is usually the case [42–45]. The measurement blockdiagram can be seen in Figure 3.
Appl. Sci. 2020, 10, x FOR PEER REVIEW 5 of 14
by the EDIS vvd company, through which the applied research performed at the Department of Aviation Technical Studies has been launched in the industry. The control electronics is based on a CPLD (Complex Programmable Logical Device) with a resolution of 10 ns. For the microwire excitation and for the microwire response sensing, the coil system involving the excitation and sensing coils was used. Thanks to the special design of these coils, it is possible to place them in the proximity of the sensing element and to sense the microwire response contactlessly. There is no necessity to place the inspected component into the cylindrical coil system, as is usually the case [42–45]. The measurement block diagram can be seen in Figure 3.
Figure 3. Measurement block diagram.
3. Results and Discussion
Tensile stress measurements using magnetic microwires were, for the first time, used outside of laboratory conditions directly in the composite construction. The goal of the measurements was to verify the proposed methodology in real practice. Therefore, a tensile stress sensor based on a magnetic microwire was, for the first time, used in an aircraft, with the primary structural components made from composite materials.
The microwire samples were prepared using the Taylor–Ulitovsky method at the University of P. J. Safarik in Kosice (Figure 4a); the chemical composition of the microwire was Fe77.5Si7.5B15. These samples, with a length of 2 cm, were placed on the top layer at the upper side of the main beam of the aircraft wing and covered by one layer of the glass fiber fabric, as can be seen in Figure 4b.
(a) (b)
Figure 4. Glass-coated magnetic microwire (a) fabrication process; (b) implementation into the glass fiber fabric.
The longitudinal axis of the microwire had the same direction as the main beam. For the attachment, epoxi resin L285 with the hardener H285 was used. Since as the tensile stress sensor was implemented in the aircraft structure additionally and was not a construction part of the aircraft, the
Figure 3. Measurement block diagram.
3. Results and Discussion
Tensile stress measurements using magnetic microwires were, for the first time, used outside oflaboratory conditions directly in the composite construction. The goal of the measurements was toverify the proposed methodology in real practice. Therefore, a tensile stress sensor based on a magneticmicrowire was, for the first time, used in an aircraft, with the primary structural components madefrom composite materials.
The microwire samples were prepared using the Taylor–Ulitovsky method at the Universityof P. J. Safarik in Kosice (Figure 4a); the chemical composition of the microwire was Fe77.5Si7.5B15.These samples, with a length of 2 cm, were placed on the top layer at the upper side of the main beamof the aircraft wing and covered by one layer of the glass fiber fabric, as can be seen in Figure 4b.
The longitudinal axis of the microwire had the same direction as the main beam. For the attachment,epoxi resin L285 with the hardener H285 was used. Since as the tensile stress sensor was implementedin the aircraft structure additionally and was not a construction part of the aircraft, the sensing partwas hardened only in the hangar environment. These experiments were performed in co-operationwith the Incoff Aerospace company, which provided for the experiments its Shark UL aircraft,which is an ultralight aircraft owned by this company. The placement of the sensing element withthe disproportionate width marked by the green line can be seen in Figure 5b.
Thanks to thisuniquemeasurement technology, it ispossible toconnect thesensingdeviceandtoperformcontactless defectoscopy during the standard aircraft ground inspection. The real-time measurementscan be visualized through the built-in IPC (Industrial Personal Computer) at the oscilloscope screen.The experimental measurement workstation is shown in Figure 6.

Appl. Sci. 2020, 10, 8218 6 of 14
Appl. Sci. 2020, 10, x FOR PEER REVIEW 5 of 14
by the EDIS vvd company, through which the applied research performed at the Department of Aviation Technical Studies has been launched in the industry. The control electronics is based on a CPLD (Complex Programmable Logical Device) with a resolution of 10 ns. For the microwire excitation and for the microwire response sensing, the coil system involving the excitation and sensing coils was used. Thanks to the special design of these coils, it is possible to place them in the proximity of the sensing element and to sense the microwire response contactlessly. There is no necessity to place the inspected component into the cylindrical coil system, as is usually the case [42–45]. The measurement block diagram can be seen in Figure 3.
Figure 3. Measurement block diagram.
3. Results and Discussion
Tensile stress measurements using magnetic microwires were, for the first time, used outside of laboratory conditions directly in the composite construction. The goal of the measurements was to verify the proposed methodology in real practice. Therefore, a tensile stress sensor based on a magnetic microwire was, for the first time, used in an aircraft, with the primary structural components made from composite materials.
The microwire samples were prepared using the Taylor–Ulitovsky method at the University of P. J. Safarik in Kosice (Figure 4a); the chemical composition of the microwire was Fe77.5Si7.5B15. These samples, with a length of 2 cm, were placed on the top layer at the upper side of the main beam of the aircraft wing and covered by one layer of the glass fiber fabric, as can be seen in Figure 4b.
(a) (b)
Figure 4. Glass-coated magnetic microwire (a) fabrication process; (b) implementation into the glass fiber fabric.
The longitudinal axis of the microwire had the same direction as the main beam. For the attachment, epoxi resin L285 with the hardener H285 was used. Since as the tensile stress sensor was implemented in the aircraft structure additionally and was not a construction part of the aircraft, the
Figure 4. Glass-coated magnetic microwire (a) fabrication process; (b) implementation into the glassfiber fabric.
Appl. Sci. 2020, 10, x FOR PEER REVIEW 6 of 14
sensing part was hardened only in the hangar environment. These experiments were performed in co-operation with the Incoff Aerospace company, which provided for the experiments its Shark UL aircraft, which is an ultralight aircraft owned by this company. The placement of the sensing element with the disproportionate width marked by the green line can be seen in Figure 5b.
(a) (b)
Figure 5. Shark UL (a) before the placement of the sensing element; (b) after the placement of the sensing element.
Thanks to this unique measurement technology, it is possible to connect the sensing device and to perform contactless defectoscopy during the standard aircraft ground inspection. The real-time measurements can be visualized through the built-in IPC (Industrial Personal Computer) at the oscilloscope screen. The experimental measurement workstation is shown in Figure 6.
Figure 6. Shark UL aircraft with the prototype of the measurement workstation during the tests.
The series of measurements was performed on the ground. One of the experimental measurements can be seen in the Figure 7. In this case, the aircraft was swung manually around the longitudinal axis by a single worker. This movement induced the maximum tensile stress in the main wing beam. During the measurements, a sampling frequency of 500 Hz was used. The ambient temperature was 30 °C and, from the measurement output, the ambient magnetic field was subtracted, as shown in Equation (2). Therefore, the deviation from the Earth’s magnetic field did not affect the measurement and only the deviation from the initial state representing no applied tensile stress is shown in Figure 7.
Figure 5. Shark UL (a) before the placement of the sensing element; (b) after the placement ofthe sensing element.
Appl. Sci. 2020, 10, x FOR PEER REVIEW 6 of 14
sensing part was hardened only in the hangar environment. These experiments were performed in co-operation with the Incoff Aerospace company, which provided for the experiments its Shark UL aircraft, which is an ultralight aircraft owned by this company. The placement of the sensing element with the disproportionate width marked by the green line can be seen in Figure 5b.
(a) (b)
Figure 5. Shark UL (a) before the placement of the sensing element; (b) after the placement of the sensing element.
Thanks to this unique measurement technology, it is possible to connect the sensing device and to perform contactless defectoscopy during the standard aircraft ground inspection. The real-time measurements can be visualized through the built-in IPC (Industrial Personal Computer) at the oscilloscope screen. The experimental measurement workstation is shown in Figure 6.
Figure 6. Shark UL aircraft with the prototype of the measurement workstation during the tests.
The series of measurements was performed on the ground. One of the experimental measurements can be seen in the Figure 7. In this case, the aircraft was swung manually around the longitudinal axis by a single worker. This movement induced the maximum tensile stress in the main wing beam. During the measurements, a sampling frequency of 500 Hz was used. The ambient temperature was 30 °C and, from the measurement output, the ambient magnetic field was subtracted, as shown in Equation (2). Therefore, the deviation from the Earth’s magnetic field did not affect the measurement and only the deviation from the initial state representing no applied tensile stress is shown in Figure 7.
Figure 6. Shark UL aircraft with the prototype of the measurement workstation during the tests.

Appl. Sci. 2020, 10, 8218 7 of 14
The series of measurements was performed on the ground. One of the experimental measurementscan be seen in the Figure 7. In this case, the aircraft was swung manually around the longitudinalaxis by a single worker. This movement induced the maximum tensile stress in the main wing beam.During the measurements, a sampling frequency of 500 Hz was used. The ambient temperature was30 ◦C and, from the measurement output, the ambient magnetic field was subtracted, as shown inEquation (2). Therefore, the deviation from the Earth’s magnetic field did not affect the measurementand only the deviation from the initial state representing no applied tensile stress is shown in Figure 7.Appl. Sci. 2020, 10, x FOR PEER REVIEW 7 of 14
Figure 7. Record of the microwire switching field deviation during the aircraft swing movement.
From the results of the spectral analysis, it can be clearly seen that the dominant frequency is around 1 Hz. It corresponds to the expected natural frequency of the aircraft. For a better visualization, only the detail of the FFT (Fast Fourier Transform) analysis in the frequency range from 0 Hz to 5 Hz is shown in Figure 8.
Figure 8. FFT (Fast Fourier Transform) analysis of the signal obtained during the aircraft swing movement.
Due to the fact that the scope of the study was to perform dynamic tests in which the deviation from the steady state is determining, the recorded data were centered and filtered by applying a low-pass FIR (Finite Impulse Response) filter with a cut-off frequency of 15 Hz. We suppose that not only the natural frequency but also all of the performed mechanical movements are below this cut-off frequency.
The dominant frequency of the swing movement is surrounded by the frequencies caused by the amplitude modulation of the movement deviation. From Figure 8, it can be seen that the signal generated during the swing movement achieved a frequency ranging from 0.8 to 1.3 Hz.
Figure 7. Record of the microwire switching field deviation during the aircraft swing movement.
From the results of the spectral analysis, it can be clearly seen that the dominant frequency isaround 1 Hz. It corresponds to the expected natural frequency of the aircraft. For a better visualization,only the detail of the FFT (Fast Fourier Transform) analysis in the frequency range from 0 Hz to 5 Hz isshown in Figure 8.
Appl. Sci. 2020, 10, x FOR PEER REVIEW 7 of 14
Figure 7. Record of the microwire switching field deviation during the aircraft swing movement.
From the results of the spectral analysis, it can be clearly seen that the dominant frequency is around 1 Hz. It corresponds to the expected natural frequency of the aircraft. For a better visualization, only the detail of the FFT (Fast Fourier Transform) analysis in the frequency range from 0 Hz to 5 Hz is shown in Figure 8.
Figure 8. FFT (Fast Fourier Transform) analysis of the signal obtained during the aircraft swing movement.
Due to the fact that the scope of the study was to perform dynamic tests in which the deviation from the steady state is determining, the recorded data were centered and filtered by applying a low-pass FIR (Finite Impulse Response) filter with a cut-off frequency of 15 Hz. We suppose that not only the natural frequency but also all of the performed mechanical movements are below this cut-off frequency.
The dominant frequency of the swing movement is surrounded by the frequencies caused by the amplitude modulation of the movement deviation. From Figure 8, it can be seen that the signal generated during the swing movement achieved a frequency ranging from 0.8 to 1.3 Hz.
Figure 8. FFT (Fast Fourier Transform) analysis of the signal obtained during the aircraft swing movement.

Appl. Sci. 2020, 10, 8218 8 of 14
Due to the fact that the scope of the study was to perform dynamic tests in which the deviation fromthe steady state is determining, the recorded data were centered and filtered by applying a low-pass FIR(Finite Impulse Response) filter with a cut-off frequency of 15 Hz. We suppose that not only the naturalfrequency but also all of the performed mechanical movements are below this cut-off frequency.
The dominant frequency of the swing movement is surrounded by the frequencies caused bythe amplitude modulation of the movement deviation. From Figure 8, it can be seen that the signalgenerated during the swing movement achieved a frequency ranging from 0.8 to 1.3 Hz.
For the verification and confirmation of the results obtained from the spectral analysis, anotherexperiment using the ELMA DT178A 3-axis acceleration and vibration datalogger was conducted.In this case, the experiment was performed so that the end of the aircraft wing was pushed down andreleased. The initial impulse was created by the 20 cm deviation at the end of the wing. The dynamicresponse of the system until the steady state was achieved was recorded and analyzed.
The main purpose of this experiment was to simulate the step change of the input signal inthe mechanical system represented by the aircraft. From the theory of cybernetics, it is knownthat to obtain the frequency response of the system, it is necessary to apply the step change asthe input signal of the system. In this way, it is possible to obtain the natural frequency, which isthe frequency at which the system tends to oscillate in the absence of any driving or damping force.It is the frequency at which the structure will tend to vibrate when subjected to certain external forces.These frequencies are dependent on the way in which the mass and stiffness are distributed withinthe material structure. The flight envelope of any aircraft is determined by the resonant frequencies ofthe wings and airframe structure; this was the main reason that the tests specified above were usedfor the verification of the tensile stress measurement. If the aircraft moves too fast, the aerodynamicforces can excite the natural frequencies, causing a resonance, which, in an aircraft, is called flutter.Resonance is a phenomenon in which a dynamic force drives a structure to vibrate at its naturalfrequency. When a structure is in resonance, a small force can produce a large vibration responsewith the high amplitude. These oscillations can cause damage to the aircraft structure. This analysishelps to explain the reasons for vibrations, which can cause structural damage during the aircraftconstruction, and to propose solutions regarding how to reduce them—for example, by the mass orstiffness modification or damping changes.
In Figure 9, the FFT analysis of the accelerometer signal can be seen. For comparison, in thiscase, the same detail of the FFT analysis in the frequency range from 0 to 5 Hz is shown. It is obviousthat the bandwidth of the aircraft response was not changed. In this case, it was from 1 to 1.5 Hz.The frequency shift of the response will be the subject of further research. Since these measurementswere performed in October with the ambient temperature of 5 ◦C, we supposed that the shift wasmainly caused by the temperature dependence of the Young modulus.
Appl. Sci. 2020, 10, x FOR PEER REVIEW 8 of 14
For the verification and confirmation of the results obtained from the spectral analysis, another experiment using the ELMA DT178A 3-axis acceleration and vibration datalogger was conducted. In this case, the experiment was performed so that the end of the aircraft wing was pushed down and released. The initial impulse was created by the 20 cm deviation at the end of the wing. The dynamic response of the system until the steady state was achieved was recorded and analyzed.
The main purpose of this experiment was to simulate the step change of the input signal in the mechanical system represented by the aircraft. From the theory of cybernetics, it is known that to obtain the frequency response of the system, it is necessary to apply the step change as the input signal of the system. In this way, it is possible to obtain the natural frequency, which is the frequency at which the system tends to oscillate in the absence of any driving or damping force. It is the frequency at which the structure will tend to vibrate when subjected to certain external forces. These frequencies are dependent on the way in which the mass and stiffness are distributed within the material structure. The flight envelope of any aircraft is determined by the resonant frequencies of the wings and airframe structure; this was the main reason that the tests specified above were used for the verification of the tensile stress measurement. If the aircraft moves too fast, the aerodynamic forces can excite the natural frequencies, causing a resonance, which, in an aircraft, is called flutter. Resonance is a phenomenon in which a dynamic force drives a structure to vibrate at its natural frequency. When a structure is in resonance, a small force can produce a large vibration response with the high amplitude. These oscillations can cause damage to the aircraft structure. This analysis helps to explain the reasons for vibrations, which can cause structural damage during the aircraft construction, and to propose solutions regarding how to reduce them—for example, by the mass or stiffness modification or damping changes.
In Figure 9, the FFT analysis of the accelerometer signal can be seen. For comparison, in this case, the same detail of the FFT analysis in the frequency range from 0 to 5 Hz is shown. It is obvious that the bandwidth of the aircraft response was not changed. In this case, it was from 1 to 1.5 Hz. The frequency shift of the response will be the subject of further research. Since these measurements were performed in October with the ambient temperature of 5 °C, we supposed that the shift was mainly caused by the temperature dependence of the Young modulus.
Figure 9. FFT analysis of the accelerometer signal obtained during the aircraft wing step movement.
This assumption was also analytically confirmed by the performed simulations based on the idealized simplified CAD/CAE (Computer Aided Design/Computer Aided Engineering) model of the aircraft wing connected to the fuselage. The CAD model of the whole aircraft was created in the Creo Parametric software and the consequent simulations, calculations and analyses were performed in the Creo Simulate software. In Figure 10, the simulation model and the results of the modal analysis can be seen. For the first mode of deformation, which is visualized in Figure 10, the calculated natural frequency of the aircraft construction was 1.289 Hz. After the initial modal simulation, the static simulation involving the temperature change from 5 to 30 °C was performed, which created a
Figure 9. FFT analysis of the accelerometer signal obtained during the aircraft wing step movement.
Appl. Sci. 2020, 10, 8218 9 of 14
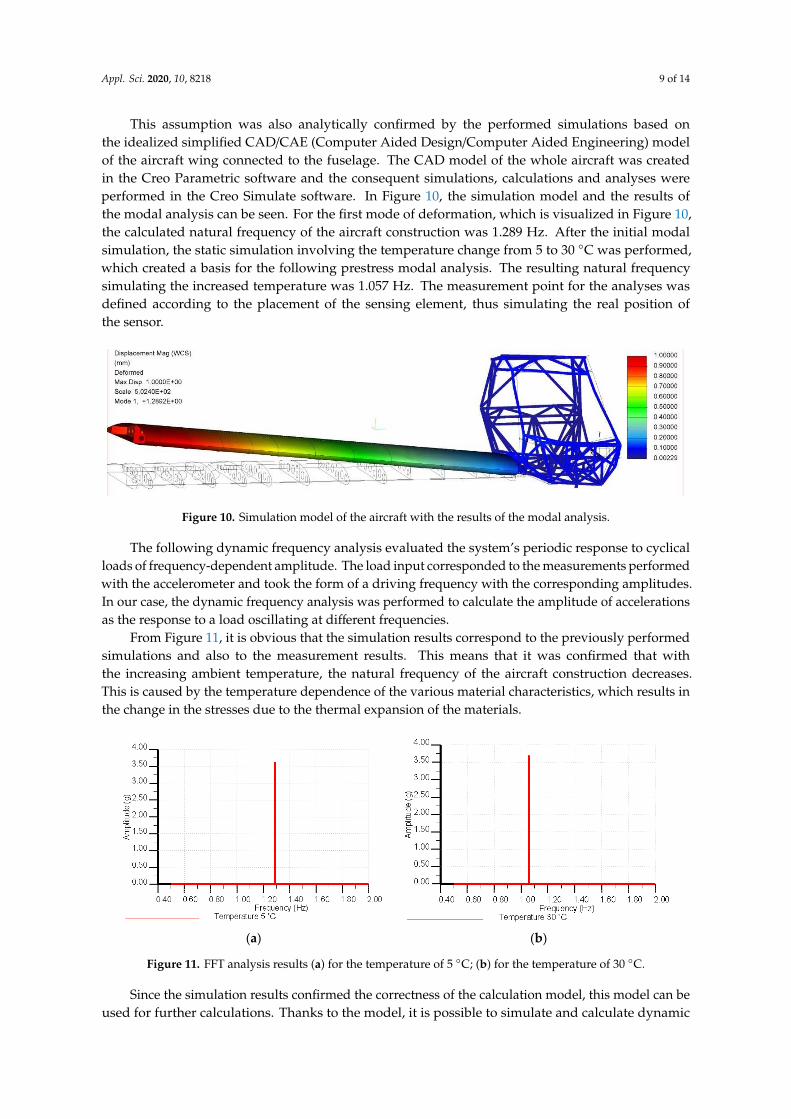
This assumption was also analytically confirmed by the performed simulations based onthe idealized simplified CAD/CAE (Computer Aided Design/Computer Aided Engineering) modelof the aircraft wing connected to the fuselage. The CAD model of the whole aircraft was createdin the Creo Parametric software and the consequent simulations, calculations and analyses wereperformed in the Creo Simulate software. In Figure 10, the simulation model and the results ofthe modal analysis can be seen. For the first mode of deformation, which is visualized in Figure 10,the calculated natural frequency of the aircraft construction was 1.289 Hz. After the initial modalsimulation, the static simulation involving the temperature change from 5 to 30 ◦C was performed,which created a basis for the following prestress modal analysis. The resulting natural frequencysimulating the increased temperature was 1.057 Hz. The measurement point for the analyses wasdefined according to the placement of the sensing element, thus simulating the real position ofthe sensor.
Appl. Sci. 2020, 10, x FOR PEER REVIEW 9 of 14
basis for the following prestress modal analysis. The resulting natural frequency simulating the increased temperature was 1.057 Hz. The measurement point for the analyses was defined according to the placement of the sensing element, thus simulating the real position of the sensor.
Figure 10. Simulation model of the aircraft with the results of the modal analysis.
The following dynamic frequency analysis evaluated the system’s periodic response to cyclical loads of frequency-dependent amplitude. The load input corresponded to the measurements performed with the accelerometer and took the form of a driving frequency with the corresponding amplitudes. In our case, the dynamic frequency analysis was performed to calculate the amplitude of accelerations as the response to a load oscillating at different frequencies.
From Figure 11, it is obvious that the simulation results correspond to the previously performed simulations and also to the measurement results. This means that it was confirmed that with the increasing ambient temperature, the natural frequency of the aircraft construction decreases. This is caused by the temperature dependence of the various material characteristics, which results in the change in the stresses due to the thermal expansion of the materials.
(a) (b)
Figure 11. FFT analysis results (a) for the temperature of 5 °C; (b) for the temperature of 30 °C.
Since the simulation results confirmed the correctness of the calculation model, this model can be used for further calculations. Thanks to the model, it is possible to simulate and calculate dynamic characteristics for any measurement point of the construction. Furthermore, the obtained model will serve as a basis for further sensor development, including the calibration of the sensor output. For this purpose, the calibration results can be compared to the results of the CAE analysis.
This article presents the latest results of the long-term ongoing research in the area of contactless tensile stress measurement based on the microwire sensors embedded into the composite materials. For the first time, we performed the measurements outside the laboratory facility. For this purpose, we had to re-build the laboratory prototype [47] into the battery-powered [48] defectoscopy prototype. As our goal was to perform flight tests, this prototype was modified. We tried to achieve this goal after the ground tests performed in the hangar during the same day. However, during the flight test, the prototype electronics was affected by the vibrations generated by the aircraft engine and the propeller. During these in-flight measurements, blackouts of the system occurred. Our further research will be therefore focused on the solution to this problem. One of the main advantages
Figure 10. Simulation model of the aircraft with the results of the modal analysis.
The following dynamic frequency analysis evaluated the system’s periodic response to cyclicalloads of frequency-dependent amplitude. The load input corresponded to the measurements performedwith the accelerometer and took the form of a driving frequency with the corresponding amplitudes.In our case, the dynamic frequency analysis was performed to calculate the amplitude of accelerationsas the response to a load oscillating at different frequencies.
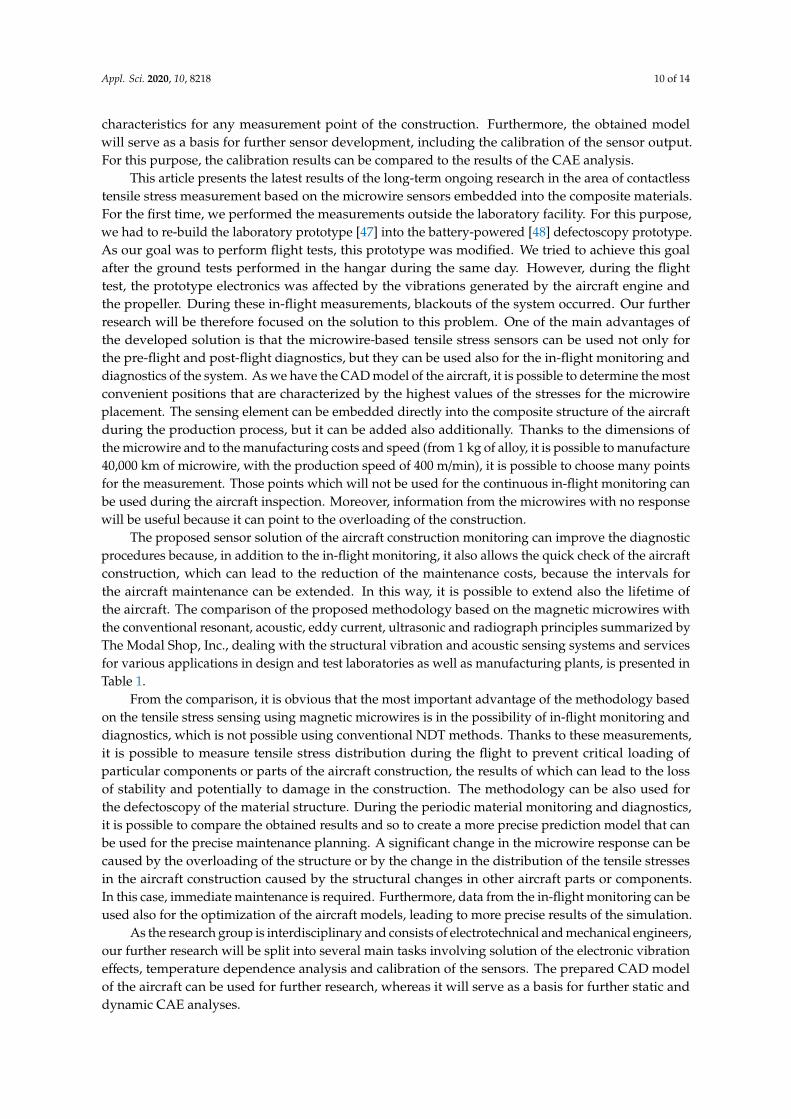
From Figure 11, it is obvious that the simulation results correspond to the previously performedsimulations and also to the measurement results. This means that it was confirmed that withthe increasing ambient temperature, the natural frequency of the aircraft construction decreases.This is caused by the temperature dependence of the various material characteristics, which results inthe change in the stresses due to the thermal expansion of the materials.
Appl. Sci. 2020, 10, x FOR PEER REVIEW 9 of 14
basis for the following prestress modal analysis. The resulting natural frequency simulating the increased temperature was 1.057 Hz. The measurement point for the analyses was defined according to the placement of the sensing element, thus simulating the real position of the sensor.
Figure 10. Simulation model of the aircraft with the results of the modal analysis.
The following dynamic frequency analysis evaluated the system’s periodic response to cyclical loads of frequency-dependent amplitude. The load input corresponded to the measurements performed with the accelerometer and took the form of a driving frequency with the corresponding amplitudes. In our case, the dynamic frequency analysis was performed to calculate the amplitude of accelerations as the response to a load oscillating at different frequencies.
From Figure 11, it is obvious that the simulation results correspond to the previously performed simulations and also to the measurement results. This means that it was confirmed that with the increasing ambient temperature, the natural frequency of the aircraft construction decreases. This is caused by the temperature dependence of the various material characteristics, which results in the change in the stresses due to the thermal expansion of the materials.
(a) (b)
Figure 11. FFT analysis results (a) for the temperature of 5 °C; (b) for the temperature of 30 °C.
Since the simulation results confirmed the correctness of the calculation model, this model can be used for further calculations. Thanks to the model, it is possible to simulate and calculate dynamic characteristics for any measurement point of the construction. Furthermore, the obtained model will serve as a basis for further sensor development, including the calibration of the sensor output. For this purpose, the calibration results can be compared to the results of the CAE analysis.
This article presents the latest results of the long-term ongoing research in the area of contactless tensile stress measurement based on the microwire sensors embedded into the composite materials. For the first time, we performed the measurements outside the laboratory facility. For this purpose, we had to re-build the laboratory prototype [47] into the battery-powered [48] defectoscopy prototype. As our goal was to perform flight tests, this prototype was modified. We tried to achieve this goal after the ground tests performed in the hangar during the same day. However, during the flight test, the prototype electronics was affected by the vibrations generated by the aircraft engine and the propeller. During these in-flight measurements, blackouts of the system occurred. Our further research will be therefore focused on the solution to this problem. One of the main advantages
Figure 11. FFT analysis results (a) for the temperature of 5 ◦C; (b) for the temperature of 30 ◦C.
Since the simulation results confirmed the correctness of the calculation model, this model can beused for further calculations. Thanks to the model, it is possible to simulate and calculate dynamic
Appl. Sci. 2020, 10, 8218 10 of 14
characteristics for any measurement point of the construction. Furthermore, the obtained modelwill serve as a basis for further sensor development, including the calibration of the sensor output.For this purpose, the calibration results can be compared to the results of the CAE analysis.
This article presents the latest results of the long-term ongoing research in the area of contactlesstensile stress measurement based on the microwire sensors embedded into the composite materials.For the first time, we performed the measurements outside the laboratory facility. For this purpose,we had to re-build the laboratory prototype [47] into the battery-powered [48] defectoscopy prototype.As our goal was to perform flight tests, this prototype was modified. We tried to achieve this goalafter the ground tests performed in the hangar during the same day. However, during the flighttest, the prototype electronics was affected by the vibrations generated by the aircraft engine andthe propeller. During these in-flight measurements, blackouts of the system occurred. Our furtherresearch will be therefore focused on the solution to this problem. One of the main advantages ofthe developed solution is that the microwire-based tensile stress sensors can be used not only forthe pre-flight and post-flight diagnostics, but they can be used also for the in-flight monitoring anddiagnostics of the system. As we have the CAD model of the aircraft, it is possible to determine the mostconvenient positions that are characterized by the highest values of the stresses for the microwireplacement. The sensing element can be embedded directly into the composite structure of the aircraftduring the production process, but it can be added also additionally. Thanks to the dimensions ofthe microwire and to the manufacturing costs and speed (from 1 kg of alloy, it is possible to manufacture40,000 km of microwire, with the production speed of 400 m/min), it is possible to choose many pointsfor the measurement. Those points which will not be used for the continuous in-flight monitoring canbe used during the aircraft inspection. Moreover, information from the microwires with no responsewill be useful because it can point to the overloading of the construction.
The proposed sensor solution of the aircraft construction monitoring can improve the diagnosticprocedures because, in addition to the in-flight monitoring, it also allows the quick check of the aircraftconstruction, which can lead to the reduction of the maintenance costs, because the intervals forthe aircraft maintenance can be extended. In this way, it is possible to extend also the lifetime ofthe aircraft. The comparison of the proposed methodology based on the magnetic microwires withthe conventional resonant, acoustic, eddy current, ultrasonic and radiograph principles summarized byThe Modal Shop, Inc., dealing with the structural vibration and acoustic sensing systems and servicesfor various applications in design and test laboratories as well as manufacturing plants, is presented inTable 1.
From the comparison, it is obvious that the most important advantage of the methodology basedon the tensile stress sensing using magnetic microwires is in the possibility of in-flight monitoring anddiagnostics, which is not possible using conventional NDT methods. Thanks to these measurements,it is possible to measure tensile stress distribution during the flight to prevent critical loading ofparticular components or parts of the aircraft construction, the results of which can lead to the lossof stability and potentially to damage in the construction. The methodology can be also used forthe defectoscopy of the material structure. During the periodic material monitoring and diagnostics,it is possible to compare the obtained results and so to create a more precise prediction model that canbe used for the precise maintenance planning. A significant change in the microwire response can becaused by the overloading of the structure or by the change in the distribution of the tensile stressesin the aircraft construction caused by the structural changes in other aircraft parts or components.In this case, immediate maintenance is required. Furthermore, data from the in-flight monitoring can beused also for the optimization of the aircraft models, leading to more precise results of the simulation.
As the research group is interdisciplinary and consists of electrotechnical and mechanical engineers,our further research will be split into several main tasks involving solution of the electronic vibrationeffects, temperature dependence analysis and calibration of the sensors. The prepared CAD modelof the aircraft can be used for further research, whereas it will serve as a basis for further static anddynamic CAE analyses.

Appl. Sci. 2020, 10, 8218 11 of 14
Table 1. Comparison of non-destructive testing methods.
Method ResonantAcoustic
EddyCurrent Ultrasonic Radiography Magnetic
Microwires
Defect/Issue
Cracks 1 1 1 2 1Material Properties 1 3 3 2 3Structural Integrity 1 1 1 1 1
Product Lot Variation 2 2 1 1 1
Defect Location
Surface (External) 1 1 1 3 1Internal 1 3 1 1 1
Brazing/Bonding/Welding 1 3 2 2 3
Speed/Cost
Time Demands 1 2 1 3 2Inspection Costs 1 2 3 3 2
Automation Capacity
Quantitative Results 1 3 2 3 2Ease of Automation 1 2 3 3 2
Monitoring/Diagnostics
Pre-Flight/Post-Flight 3 3 3 3 1In-Flight 3 3 3 3 1
1—excellent; 2—fair; 3—poor.
4. Conclusions
Early detection of changes in the material structures which are not visible during the visualinspection or with the conventional inspection methods is, for many applications, very important.For aircraft structures, the monitoring and diagnostics is especially important because structural damagecan lead to aircraft accidents. Therefore, many diagnostic methods with a focus on non-destructivetesting have been developed. Research at the Faculty of Aeronautics of the Technical University ofKosice and of the cooperating institutions dealing with academic research, together with the innovativeSME EDIS vvd company in the area of NDT, is focused on the non-destructive material testingmethod using the developed microwire-based tensile stress sensors. The sensing element of thesesensors is an amorphous magnetic microwire which is sensitive not only to the magnetic field butalso to the applied tensile stress. Measurement of the tensile stress can be performed either onthe material surface or inside of the material because microwires, thanks to their small dimensions,can be easily integrated into the tested construction without structural violations and changes inmaterial characteristics. For this purpose, the original induction method with the excitation and sensingcoils placed outside the sensing microwire has also been developed. Using this method, the materialdiagnostics can be absolutely contactless.
Microwire-based tensile stress sensors can be used, for example, for construction, structural healthand operational load monitoring, fatigue testing or crack detection. In the article, the original researchresults from the initial tests performed directly in an aircraft are presented. Thanks to the performedmeasurements with the microwire-based sensors and verification measurements with the accelerometerwith different external temperatures, the temperature dependence of the natural frequency of the aircraftwas also analyzed. It was also analytically confirmed that with the increasing temperature, the naturalfrequency decreases. The prepared simulation CAD/CAE model will serve as a basis for further sensordevelopment, optimization and calibration.

Appl. Sci. 2020, 10, 8218 12 of 14
The main advantages of microwire-based sensors are their small dimensions, weight and manufacturingcosts, which make them promising for utilization in many applications, including their utilization directly inthe aircraft, as well as the possibility of being utilized on unmanned aerial vehicles.
Author Contributions: Methodology, M.Š. and P.L.; validation, P.L. and K.S.; formal analysis, M.B.; data curation,P.K.; writing—original draft preparation, K.D.; writing—review and editing, K.S. and M.B.; visualization, K.D.,M.Š. and K.S. All authors have read and agreed to the published version of the manuscript.
Funding: This research was funded by the Slovak Research and Development Agency, grant numberAPVV-18-0248 and grant number APVV-17-0184, Cultural and Educational Grant Agency of the Ministryof Education, Science, Research and Sport of the Slovak Republic, grant number KEGA 052TUKE 4/2018 and grantnumber KEGA 058TUKE-4/2018 and the Research Agency, ITMS code number 313011T557.
Acknowledgments: We would like to acknowledge the Incoff Aerospace, Inc. company for the opportunity to usethe aircraft for testing and especially to Peter Ostromecký and Jaroslav Svatik for the assistance during the testsand to the Tuli, Inc. company for the assistance during the sensor implementation.
Conflicts of Interest: The authors declare no conflict of interest.
References
1. Towsyfyan, H.; Biguri, A.; Boardman, R.; Blumensath, T. Successes and challenges in non-destructive testingof aircraft composite structures. Chin. J. Aeronaut. 2020, 33, 771–791. [CrossRef]
2. Vyas, J.; Kazys, R.J. A review on nondestructive techniques and characteristics of composite materials forthe aerospace system. MATEC Web Conf. 2018, 233, 3. [CrossRef]
3. Asif, M.; Khan, M.A.; Khan, S.Z.; Choudhry, R.S.; Khan, K.A. Identification of an effective nondestructivetechnique for bond defect determination in laminate composites—A technical review. J. Compos. Mater. 2018,52, 3589–3599. [CrossRef]
4. Katunin, A.; Dragan, K.; Dziendzikowski, M. Damage identification in aircraft composite structures: A casestudy using various non-destructive testing techniques. Compos. Struct. 2015, 127, 1–9. [CrossRef]
5. Marušic, Ž.; Bartulovic, D.; Makovic, B. Methods to detect and prevent fatigue in ageing aircraft structures.Teh. Vjes. 2015, 22, 793–803. [CrossRef]
6. Wronkowicz, A.; Dragan, K. Damage evaluation based on ultrasonic testing of composite aircraft elementsand image analysis methods. MATEC Web Conf. 2018, 204, 6003. [CrossRef]
7. Pelivanov, I.; Buma, T.; Xia, J.; Wei, C.-W.; O’Donnell, M. NDT of fiber-reinforced composites with a newfiber-optic pump-probe laser-ultrasound system. Photoacoustics 2014, 2, 63–74. [CrossRef]
8. Farmaki, S.; Exarchos, D.A.; Tragazikis, I.K.; Matikas, T.E.; Dassios, K.G. A novel infrared thermographysensing approach for rapid, quantitative assessment of damage in aircraft composites. Sensors 2020, 20, 4113.[CrossRef]
9. Deane, S.; Avdelidis, N.P.; Ibarra-Castanedo, C.; Zhang, H.; Nezhad, H.Y.; Williamson, A.A.; Mackley, T.;Maldague, X.; Tsourdos, A.; Nooralishahi, P. Comparison of cooled and uncooled ir sensors by means ofsignal-to-noise ratio for ndt diagnostics of aerospace grade composites. Sensors 2020, 20, 3381. [CrossRef]
10. Poelman, G.; Hedayatrasa, S.; Segers, J.; Van Paepegem, W.; Kersemans, M. Adaptive spectral band integrationin flash thermography: Enhanced defect detectability and quantification in composites. Compos. Part B-Eng.2020, 202, 108305. [CrossRef]
11. Deane, S.; Avdelidis, N.P.; Ibarra-Castanedo, C.; Zhang, H.; Yazdani Nezhad, H.; Williamson, A.A.; Mackley, T.;Davis, M.J.; Maldague, X.; Tsourdos, A. Application of NDT thermographic imaging of aerospace structures.Infrared Phys. Technol. 2019, 97, 456–466. [CrossRef]
12. Bates, D.; Smith, G.; Lu, D.; Hewitt, J. Rapid thermal non-destructive testing of aircraft components.Compos. Part. B-Eng. 2000, 31, 175–185. [CrossRef]
13. Bang, H.-T.; Park, S.; Jeon, H. Defect identification in composite materials via thermography and deeplearning techniques. Compos. Struct. 2020, 246, 112405. [CrossRef]
14. Hill, M.; Faupel, B. A Robotized Non-destructive Quality Device for the Inspection of Glue Joints by ActiveThermography. J. Nondestruct. Eval. 2020, 39, 72. [CrossRef]
15. Meng, X.; Wang, Y.; Liu, J.; He, W. Nondestructive inspection of curved clad composites with subsurface defectsby combination active thermography and three-dimensional (3D) structural optical imaging. Infrared Phys.Technol. 2019, 97, 424–431. [CrossRef]

Appl. Sci. 2020, 10, 8218 13 of 14
16. Ciampa, F.; Mahmoodi, P.; Pinto, F.; Meo, M. Recent advances in active infrared thermography fornon-destructive testing of aerospace components. Sensors 2018, 18, 609. [CrossRef]
17. Dilonardo, E.; Nacucchi, M.; De Pascalis, F.; Zarrelli, M.; Giannini, C. High resolution X-ray computedtomography: A versatile non-destructive tool to characterize CFRP-based aircraft composite elements.Compos. Sci. Technol. 2020, 192, 108093. [CrossRef]
18. Katunin, A.; Wronkowicz-Katunin, A.; Dragan, K. Impact damage evaluation in composite structures basedon fusion of results of ultrasonic testing and x-ray computed tomography. Sensors 2020, 20, 1867. [CrossRef]
19. Zhang, Y.; Wang, X.; Yang, Q.; Xue, R.; Zhang, J.; Sun, Y.; Xu, D.; Krishnaswamy, S. Research on epoxy resincuring monitoring using laser ultrasonic. Measurement 2020, 158, 107737. [CrossRef]
20. Matuda, M.Y.; Buiochi, F.; Adamowski, J.C. Experimental analysis of surface detection methods fortwo-medium imaging with a linear ultrasonic array. Ultrasonics 2019, 94, 50–59. [CrossRef]
21. Capriotti, M.; Lanza di Scalea, F. Robust non-destructive inspection of composite aerospace structures byextraction of ultrasonic guided-wave transfer function in single-input dual-output scanning systems. J. Intell.Mater. Syst. Struct. 2020, 31, 651–664. [CrossRef]
22. Lugovtsova, Y.; Bulling, J.; Boller, C.; Prager, J. Analysis of guided wave propagation in a multi-layeredstructure in view of structural health monitoring. Appl. Sci. 2019, 9, 4600. [CrossRef]
23. Park, B.; An, Y.-K.; Sohn, H. Visualization of hidden delamination and debonding in composites throughnoncontact laser ultrasonic scanning. Compos. Sci. Technol. 2014, 100, 10–18. [CrossRef]
24. Dubuc, B.; Ebrahimkhanlou, A.; Livadiotis, S.; Salamone, S. Inversion algorithm for Lamb-wave-based depthcharacterization of acoustic emission sources in plate-like structures. Ultrasonics 2019, 99, 105975. [CrossRef][PubMed]
25. Carden, E.P.; Fanning, P. Vibration Based Condition Monitoring: A Review. Struct. Health Monit. 2004, 3,355–377. [CrossRef]
26. Anisimov, A.G.; Serikova, M.G.; Groves, R.M. 3D shape shearography technique for surface strainmeasurement of free-form objects. Appl. Opt. 2019, 58, 498–508. [CrossRef]
27. Bhaurkar, V.P.; Thakur, A.G. Investigation of crack in beams using anti-resonance technique and FEAapproach. J. Eng. Des. Technol. 2019, 17, 1266–1284. [CrossRef]
28. Tzitzilonis, V.; Malandrakis, K.; Zanotti Fragonara, L.; Gonzalez Domingo, J.A.; Avdelidis, N.P.; Tsourdos, A.;Forster, K. Inspection of aircraft wing panels using unmanned aerial vehicles. Sensors 2019, 19, 1824.[CrossRef]
29. Papa, U.; Ponte, S. Preliminary design of an unmanned aircraft system for aircraft general visual inspection.Electronics (Switzerland) 2018, 7, 435. [CrossRef]
30. Zhao, Q.; Zhang, K.; Xu, H.; Avila, J.R.S.; Zhao, L.; Wang, M.; Han, Y.; Zhang, Z.; Yin, W. Measurementof CFRP surface crack based on electromagnetic measuring system. In Proceedings of the 2019 IEEEInternational Instrumentation and Measurement Technology Conference (I2MTC), Auckland, New Zealand,20−23 May 2019. [CrossRef]
31. Nunes, S.; Pimentel, M.; Carvalho, A. Non-destructive assessment of fibre content and orientation in UHPFRClayers based on a magnetic method. Cement Concrete Comp. 2016, 72, 66–79. [CrossRef]
32. Abry, J.C.; Choi, Y.K.; Chateauminois, A.; Dalloz, B.; Giraud, G.; Salvia, M. In-situ monitoring of damage inCFRP laminates by means of AC and DC measurements. Compos. Sci. Technol. 2001, 61, 855–864. [CrossRef]
33. Witos, M.; Szymanski, M.; Oravec, M.; Bogucki, K. Magnetic state observer in NDT and SHM studies.In Proceedings of the 10th International Workshop NDT in Progress, Prague, Czech Republic, 7−9 October2019.
34. García-Martín, J.; Gómez-Gil, J.; Vázquez-Sánchez, E. Non-destructive techniques based on eddy currenttesting. Sensors 2011, 11, 2525–2565. [CrossRef] [PubMed]
35. He, Y.; Luo, F.; Pan, M.; Weng, F.; Hu, X.; Gao, J.; Liu, B. Pulsed eddy current technique for defect detection inaircraft riveted structures. NDT&E Int. 2010, 43, 176–181. [CrossRef]
36. Janovec, M.; Smetana, M.; Bugaj, M. Eddy current array inspection of Zlin 142 fuselage riveted joints.Trans. Res. Proc. 2019, 40, 279–286. [CrossRef]
37. Faraj, M.A.; Abdalla, A.N.; Samsuri, F.B.; Rifai, D.; Ali, K. Construct Coil Probe Using GMR Sensor for EddyCurrent Testing. MATEC Web Conf. 2018, 225, 2021. [CrossRef]

Appl. Sci. 2020, 10, 8218 14 of 14
38. Zhaoyuan, L.; Chan, L.; Walters, N.; Clarke, J.; Holmes, W.; Hayes, S. Structural health monitoring usingmagnetostrictive sensors. In Proceedings of the 2018 IEEE International Magnetic Conference (INTERMAG),Singapore, 23−27 April 2018. [CrossRef]
39. Na, W.S.; Baek, J. Piezoelectric impedance-based non-destructive testing method for possible identificationof composite debonding depth. Micromachines 2019, 10, 621. [CrossRef]
40. Praslicka, D.; Blazek, J.; Hudak, J.; Mikita, I.; Moucha, V. Industrial Applications of Magnetometry. J. Electr.Eng. 2015, 66, 190–192.
41. Varga, R.; Klein, P.; Sabol, R.; Richter, K.; Hudak, R.; Polacek, I.; Praslicka, D.; Šmelko, M.; Hudak, J.; Mikita, I.;et al. Magnetically bistable microwires: Properties and applications for magnetic field, temperature,and stress sensing. In High Performance Soft Magnetic Materials; Zhukov, A., Ed.; Springer: Cham, Switzerland,2017; Volume 252, pp. 169–212.
42. Ziman, J.; Onufer, J.; Kladivová, M. Dynamics of domain wall depinning from closure domain structure atthe end of bistable glass coated microwire. J. Magn. Magn. Mater. 2020, 514, 167233. [CrossRef]
43. Duranka, P.; Ziman, J.; Onufer, J.; Kardoš, S. Magnetoelastic Anisotropy in Glass-Coated Microwires Studiedusing SAMR Method. Acta Phys. Pol. A 2020, 137, 868–871. [CrossRef]
44. Richter, K.; Thiaville, A.; Varga, R. Magneto-optical study of the surface reversal process in amorphousglass-coated Microwires with positive magnetostriction. IEEE Trans. Magn. 2014, 50, 1–4. [CrossRef]
45. Fecova, L.; Richter, K.; Varga, R. Domain Wall Dynamics of Wires in Perpendicular Magnetic Field. Acta Phys.Pol. A 2020, 137, 849–851. [CrossRef]
46. Spodniak, M.; Semrád, K.; Šmelko, M.; Fözö, L.; Andoga, R.; Draganová, K.; Szabo, S. Estimation of MagneticMicrowire Mechanical Properties by FEM Modeling. Acta Phys. Pol. A 2020, 137, 674–676. [CrossRef]
47. Šmelko, M.; Praslicka, D.; Draganová, K.; Lipovský, P.; Kán, V.; Bajús, J. Wireless strain gauge for compositematerials. U.P.B. Sci. Bull. Ser. D 2016, 78, 59–66.
48. Kašper, P.; Šmelko, M. Accumulator suply for defectoscopy system. Acta Avion. 2018, 1, 18–23.
Publisher’s Note: MDPI stays neutral with regard to jurisdictional claims in published maps and institutionalaffiliations.
© 2020 by the authors. Licensee MDPI, Basel, Switzerland. This article is an open accessarticle distributed under the terms and conditions of the Creative Commons Attribution(CC BY) license (http://creativecommons.org/licenses/by/4.0/).