General analysis of inductive sensor based systems for non destructive testing
Upload
khangminh22Category
view
4download
0
•ННГ Vol .11 i Proceedings of a S y m p o s i u m , Bucharest , 17-21 May 1966 non-destructive testing
nuclear I technology


NON-DESTRUCTIVE TESTING IN NUCLEAR TECHNOLOGY
VOL. II

The following States aie Members of the International Atomic Energy Agency:
AFGHANISTAN ALBANIA ALGERIA ARGENTINA AUSTRALIA AUSTRIA BELGIUM BOLIVIA BRAZIL BULGARIA BURMA BYELORUSSIAN SOVIET
SOCIALIST REPUBLIC CAMBODIA CAMEROON CANADA CEYLON CHILE CHINA COLOMBIA CONGO, DEMOCRATIC
REPUBLIC OF COSTA RICA CUBA CYPRUS CZECHOSLOVAK SOCIALIST
REPUBLIC DENMARK DOMINICAN REPUBLIC ECUADOR EL SALVADOR ETHIOPIA FINLAND FRANCE
FEDERAL REPUBLIC OF GERMANY
GABON GHANA GREECE GUATEMALA HAITI HOLY SEE HONDURAS HUNGARY ICELAND INDIA INDONESIA IRAN IRAQ ISRAEL ITALY IVORY COAST JAPAN KENYA REPUBLIC OF KOREA KUWAIT LEBANON LIBERIA LIBYA LUXEMBOURG MADAGASCAR MALI MEXICO MONACO MOROCCO NETHERLANDS NEW ZEALAND NICARAGUA
NIGERIA NORWAY PAKISTAN PARAGUAY PERU PHILIPPINES POLAND PORTUGAL ROMANIA SAUDI ARABIA SENEGAL SOUTH AFRICA SPAIN SUDAN SWEDEN SWITZERLAND SYRIA THAILAND TUNISIA TURKEY UKRAINIAN SOVIET SOCIALIST
REPUBLIC UNION OF SOVIET SOCIALIST
REPUBLICS UNITED ARAB REPUBLIC UNITED KINGDOM OF GREAT
BRITAIN AND NORTHERN IRELAND
UNITED STATES OF AMERICA URUGUAY VENEZUELA VIET-NAM YUGOSLAVIA
The Agency's Statute was approved on 23 October 1956 by the Conference on the Statute of the IAEA held at United Nations Headquarters, New York; it entered into force on 29 July 1957. The Headquarters of the Agency are situated in Vienna. Its principal objective is "to accelerate and enlarge the contribution of atomic energy to peace, health and prosperity throughout the world".
Printed by the IAEA in Austria October 1965

PROCEEDINGS SERIES
NON-DESTRUCTIVE TESTING IN NUCLEAR TECHNOLOGY
PROCEEDINGS OF A SYMPOSIUM ON NON-DESTRUCTIVE TESTING IN NUCLEAR TECHNOLOGY
HELD BY THE INTERNATIONAL ATOMIC ENERGY AGENCY
IN BUCHAREST, 17 -21 MAY 1965
In two volumes
VOL.II
INTERNATIONAL ATOMIC ENERGY AGENCY VIENNA, 1965

Symposium on Non-Destructive Testing in Nuclear Technology, Bucharest, 17 - 21 May 1965.
Proceedings . . . held by the International Atomic Energy Agency . . . Vienna, the Agency, 1965.
2 vols. (IAEA Proceedings series)
620 .179 .1 (063) "1965 " (063)620 .179 .1 "1965" 621. 039 :620 .179 .1
NON-DESTRUCTIVE TESTING IN NUCLEAR TECHNOLOGY, IAEA, VIENNA, 1965
STI /PUB/105

FOREWORD
The Symposium on Non-Destructive Testing in Nuclear Technology was convened by the International Atomic Energy Agency and held, at the invitation of the Romanian People's Republic, in Bucharest from 17 to 21 May 1965.
This was the first large IAEA symposium on this topic and was arranged with the help of the Romanian Institute of Atomic Physics. Over 100 partici-pants from 20 countries and two international organizations presented 46 papers.
The development of non-destructive testing techniques has increased considerably in recent years, particularly in the nuclear field. Non-destructive testing methods such as ultrasonic and radiographic testing are proving increasingly useful for ensuring that reactor materials and compo-nents will stand up to prolonged and rigorous use. Such methods are used to test for flaws, to check dimensions such as tube-wall thickness, and to determine the location and distribution of uranium fuel in a fuel element.
Speakers stressed that these methods were invaluable for providing ex-tensive and detailed data on the physical structure and condition of materials and the effects of fabrication processes. Among aspects of non-destructive testing that were discussed were the use of automation; assistance at the design stage for attaining higher strength-to-weight ratios; the testing of welds in reactor containment vessels; and the testing of sintered materials.
The important information presented at the Symposium and the extensive discussions among scientists demonstrated the desire to accelerate solutions to various problems connected with non-destructive testing techniques.
The IAEA wishes to express gratitude to the Romanian Government and the Romanian Institute of Atomic Physics for their generous hospitality and co-operation.

EDITORIAL NOTE
The papers and discussions incorporated in the proceedings published by the International Atomic Energy Agency are edited by the Agency's edi-torial staff to the extent considered necessary for the reader's assistance. The views expressed and the general style adopted remain, however, the responsibility of the named authors or participants.
For the sake of speed of publication the present Proceedings have been printed by composition typing and photo-offset lithography. Within the limi-tations imposed by this method, every effort has been made to maintain a high editorial standard; in particular, the units and symbols employed are to the fullest practicable extent those standardized or recommended by the competent international scientific bodies.
The affiliations of authors are those given at the time of nomination. The use in these Proceedings of particular designations of countries or
territories does not imply any judgement by the Agency as to the legal status of such countries or territories, of their authorities and institutions or of the delimitation of their boundaries.
The mention of specific companies or of their products or brand-names does not imply any endorsement or recommendation on the part of the Inter-national Atomic Energy Agency.
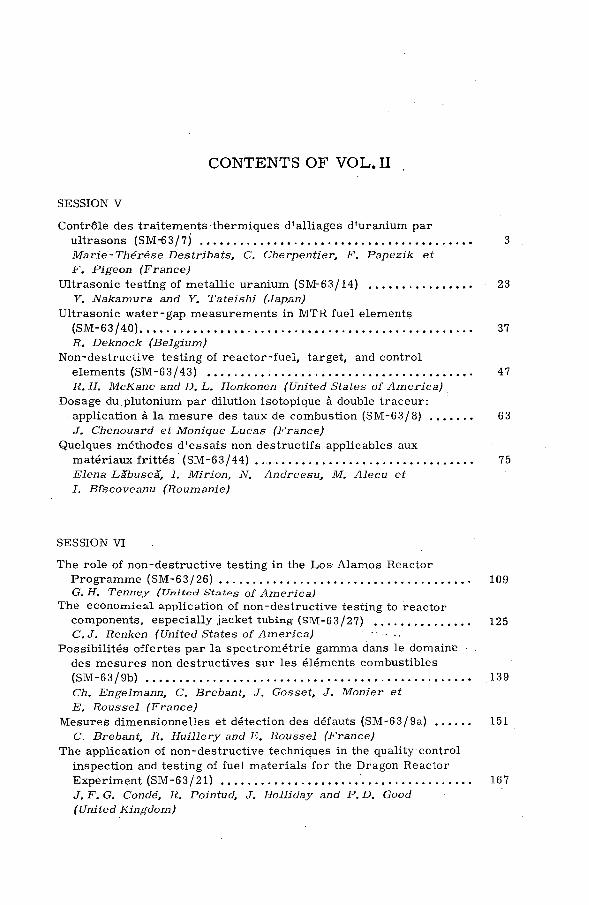
CONTENTS OF V O L . II
SESSION V
Contrôle des traitements thermiques d'alliages d'uranium par ultrasons (SM-63/7) 3 Marie-Thérèse Destribats, C. Cherpentier, F. Papezik et F. Pigeon (France)
Ultrasonic testing of metallic uranium (SM-63/14) 23 Y. Nakamura and Y. Tateishi (Japan)
Ultrasonic water-gap measurements in MTR fuel elements (SM-63/40) 37 R. Deknock (Belgium)
Non-destructive testing of reactor-fuel, target, and control elements (SM-63/43) 47 R. H. McKane and D. L. Honkonen (United States of America)
Dosage du plutonium par dilution isotopique à double traceur: application à la mesure des taux de combustion (SM-63/8) 63 J. Chenouard et Monique Lucas (France)
Quelques méthodes d'essais non destructifs applicables aux matériaux frittes '(SM-63/44) 75 Elena LSbusca, I. Mirion, N. Andreesu, M. Alecu et I. Bfscoveanu (Roumanie)
SESSION VI
The role of non-destructive testing in the Los Alamos Reactor Programme (SM-63/26) 109 G.H. Tenney (United States of America)
The economical application of non-destructive testing to reactor components, especially jacket tubing (SM-63/27) 125 C.J. Renken (United States of America) "•---.
Possibilités offertes par la spectrométrie gamma dans le domaine • . des mesures non destructives sur les éléments combustibles (SM-63/9b) 139 Ch. Engelmann, C. Brebant, J. Gosset, J. Monier et E. Roussel (France)
Mesures dimensionnelles et détection des défauts (SM-63/9a) 151 C. Brebant, R. Huillery and F,. Roussel (France)
The application of non-destructive techniques in the quality control inspection and testing of fuel materials for the Dragon Reactor Experiment (SM-63/21) 167 J. F. G. Condé, R. Pointud, J. Holliday and P. D. Good (United Kingdom)

Eddy-current testing of thin-walled cladding tubes (SM-63/41) G. Verstappen, 11. Dcknock, R. Ncidcr, M. Brabers and P. de Meester (Belgium)
195
SESSION VII
Limits to the recognizability of flaws in non-destructive testing steam-generator tubes for nuclear-power plants (SM-63/25) . . . . 213 A. Kuhlmann and !•'. -J. Adamsky (Federal Republic of Germany)
High-volume non-destructive test applications at the Hanford atomic products operation (SM-63/28) 225 D.C. Worlton (United States of America)
Non-destructive testing techniques for research and process control (SM-63/29) 247 D. A. Douglas, Jr., 11. W. ATcClung, B.E. Foster and С. V. Dodd (United States of America)
Assessment of end-plug welding of fuel elements (SM-63/15) 265 Y. Nakamura and T. Aoki (Japan)
Non-destructive examination of the heat-affected zone of welded Zr-Nb alloy (SM-63/38) 277 R. F. Hanstock and D. С. B. Walker (United Kingdom)
New frontiers for non-destructive testing in the nuclear age (SM-63/32) 285
. D. W. Ballard (United States of America)
SESSION VIII
Measurement of internal friction on nuclear materials (SM-63/16) . . 307 R. R. Hasiguti, N. Igata, R. Tonomae, Y. Nakamura, N. Sasao and K. Domoto (Japan)
The role of non-destructive testing in test-reactor operation at the National Reactor Testing Station ( S M - 6 3 / 3 0 ) 331 W. C. Francis, E. S. Brown, E. E. Burdick, G. W. Gibson and F. H. Tingey (United States of America)
The develoDm°*»t'°i flaw-detection techniques at Harwell (SM-63/36) 351 R. sr. Sharpe (United Kingdom)
The non-destructive testing of fuel elements and their components for the United Kingdom power-reactor development programme (SM-63/39) 365 C.A. Mann and I.C. Campsie (United Kingdom)
SESSION IX
A fast test for excessive U235 concentrations in enriched fuel elements (SM-63/3) 387 A. D. McEachern (Canada)

The non-destructive determination of burn-up by means of the Pri44 2 .18-MeV gamma-activity (SM-63/12) 399 R. S. Forsyth and W. H. Blackadder (Sweden)
Fuel location, homogeneity and amount in flat and tubular configu-rations (SM-63/42) 413 P. de Meester (Belgium)
Chairmen of Sessions and Secretariat 437 List of Participants 438 Author Index 445


SESSION V
i.

1*
CONTRÔLE DES TRAITEMENTS THERMIQUES D'ALLIAGES D'URANIUM PAR ULTRASONS
M A R I E - T H E R E S E - D E S T R I B A T S , C . C H E R P E N T I E R , F . P A P E Z I K
E T M . P I G E O N
C E N T R E D ' É T U D E S N U C L É A I R E S D E S A C L A Y , F R A N C E
A b s t r a c t — R é s u m é — А н н о т а ц и я — R e s u m e n
ULTRASONIC INSPECTION FOLLOWING HEAT TREATMENT OF URANIUM ALLOYS. To improve the behaviour of low uranium alloys in reactors it is often necessary to reduce grain size by heat treatment. It has proved essential to provide for inspection of the whole element and the entire output in order to discover the exact quality of the fuel used. This inspection cannot be made by micrography because of the time required and the fact that the data obtained are incomplete.
The inspection system adopted is based on the principle of absorption of ultrasonic waves by materials. This absorption depends on the structure of the medium. If X is small in relation to grain size G, absorption is low; whereas if G is of the order of X./2, absorption is very high.
The tests were made first in air, using the multiple-echo system, then by measuring the height of the first echo, and finally by transmission in water, the height of the transmitted echo being compared with that of the initial signal.
In industrial use, the amplitude of the echo transmitted by the material is compared with the echo obtained from a standard of the same characteristics and shape. Inspection takes place in a special machine in which the materials are rotated by rollers and adjustable transducers move over the element.
The helicoidal scanning is carried out with a pitch of less than 5 mm. The ultrasonic generator includes a control system ensuring a constant reference echo.
The paper quotes a series of records showing thé results obtained with various alloys and in particular the faults observed in elements treated by induction upon linear displacement. The arrangement can detect faulty treatment zones of less than 1 cm2.
The system is at present used to inspect all low alloy uranium fuels of the G2.EL3, EDF1, EDF2 and INCA reactors, i . e . rods and tubes with diameters between 20 and 95 mm.
CONTRÔLE DES TRAITEMENTS THERMIQUES D'ALLIAGE D'URANIUM PAR ULTRASONS. Afin d'obtenir une meilleure tenue des alliages d'uranium faiblement alliés dans les réacteurs, un affinage du grain par traitements thermiques est souvent nécessaire. Il s'est avéré indispensable de pouvoir effectuer un contrôle sur l'ensemble de l'élément et la totalité d'une production afin de connaître exactement la qualité du com-bustible utilisé. Ce contrôle ne pouvait être envisagé par micrographie en raison de la durée trop longue des opérations et de leurs résultats partiels.
Le contrôle auquel les auteurs ont procédé est basé sur le principe de l'absorption des ultrasons par les matériaux. L'absorption est fonction de la structure du milieu. Si X est petit par rapport à la taille du grain G, elle est faible; si G est de l'ordre de Л/2, elle est très grande.
Les tout premiers essais ont été faits dans l'air, par échos multiples, puis en mesurant la hauteur du premier écho, ensuite par transmission dans l'eau, en comparant la hauteur de l 'écho transmis à celle de l 'écho initial.
Dans le contrôle industriel, on compare l'amplitude de l'écho transmis par le matériau à l'écho obtenu avec un étalon bien traité de même nuance et de même forme géométrique. L'examen se fait dans une machine spéciale; les matériaux sont entraînés en rotation par des galets et les traducteurs orientables se déplacent le long de l'élément. L'exploration hélicoïdale s'effectue avec un pas inférieur à 5 mm. Le générateur d'ultrasons comporte un système de régulation qui maintient l'écho de référence constant.
On montrera une série d'enregistrements obtenus sur divers alliages, en particulier des défauts observés sur les éléments traités par induction au défilé. Des zones mal traitées inférieures à 1 cm2 sont détectées.
Actuellement, on contrôle ainsi tous les combustibles en uranium faiblement alliés des divers réacteurs G2, EL3, EDF1, EDF2 et INCA, c'est-à-dire des barres et tubes de diamètre compris entre 20 et 95 mm.
3

4 MARIE-THÉRÈSE DESTRIBATS
КОНТРОЛЬ ТЕРМИЧЕСКОЙ ОБРАБОТКИ УРАНОВЫХ СПЛАВОВ С ПОМОЩЬЮ УЛЬ-Т Р А З В У К А . Чтобы добиться лучшего режима работы реакторов, в которых используются с л е г -ка легированные сплавы урана, ч а с т о возникает н е о б х о д и м о с т ь измельчать зерна т е р м и -ческой обработкой . При э т о м оказалось необходимым осуществлять контроль за всеми э л е -м е н т а м и и за в с е м п р о и з в о д с т в о м , ч т о б ы точно знать к а ч е с т в о и с п о л ь з о в а н н о г о топлива . Э т о т контроль н е в о з м о ж н о о с у щ е с т в л я т ь через микрографию, так как он занимает м н о г о времени и не дает полных р е з у л ь т а т о в .
К о н т р о л ^ п р и н я т ы й в ядерном центре , основан на принципе поглощения у л ь т р а з в у к о в материалами .
Данное поглощение связано с о структурой с р е д ы . Если значение Xмало по сравнению с величиной зерна G , т о поглощение с л а б о е , а если G с о с т а в л я е т порядка Х / 2 , т о поглощение очень с и л ь н о е .
В с е первые опыты проводили в в о з д у х е на о с н о в е анализа многократных э х о и з а т е м измеряли в ы с о т ы п е р в о г о э х а . Далее измерение проводили в в о д е . При э т о м сравнивали в ы с о т ы пропущенного и первоначального э х а .
При промышленном контроле сравнивается амплитуда э х а , пропущенного ч е р е з м а т е -риал, с э х о м , полученным на хорошо обработанном эталоне т о г о же типа и той же г е о м е т -рической ф о р м ы . Испытание проводили в специальной у с т а н о в к е , когда материалы з а п у с -кали в ротацию с помощью роликов, а направляемые преобразователи перемещали вдоль э л е -мента .
Винтовое скеннирование осуществляли при шаге менее 5 м м . В ультразвуковом г е н е -раторе имеется с и с т е м а регулирования,которая поддерживает контрольное э х о .
Приводится серия записей по различным с п л а в а м , и в ч а с т н о с т и г о в о р и т с я о д е ф е к -т а х , н а б л ю д а е м ы х у э л е м е н т о в , к о т о р ы е были о б р а б о т а н ы индукцией во время п р о х о ж д е -ния. О б н а р у ж и в а ю т с я плохо о б р а б о т а н н ы е у ч а с т к и р а з м е р о м м е н е е 1 с м 2 .
В настоящее время подобным о б р а з о м о с у щ е с т в л я е т с я контроль за всеми типами т о п -лива в виде слегка легированных урановых сплавов, применяемых в реакторах G2 E L 3 , E F 1 E d F 2 и I N C A , иными с л о в а м и , контролируются в с е стержни и трубки с д и а м е т р о м м е ж д у 20 и 95 м м .
CONTROL ULTRASONICO DE LOS TRATAMIENTOS TERMICOS DE ALEACIONES DE URANIO. Con el fin de aumentar en los reactores la estabilidad de las aleaciones con bajo contenido de uranio resulta a menudo necessario afinar el grano mediente tratamientos térmicos. Para conocer la calidad del combustible utilizado se considera indispensable controlar el conjunto del elemento y la totalidad de la producción. Este control no puede realizarse por micrograffa debido al tiempo prolongado que ésta requiere y a sus resultados de carácter parcial.
El método de control adoptado se basa en el principio de la absorción de ondas ultrasónicas por los distintos materiales. Dicha absorción es función de la estructura del medio. Si \ es pequeña en comparación col el tamaño del grano G, la absorción resultará débil mientras que si G es del orden de X/2, la absorción será muy considerable.
Los primeros ensayos se efectuaron en aire, utilizando ecos múltiples y midiendo la altura del primer eco; los siguientes se realizaron por transmisión en agua, comparando la altura del eco transmitido con la del inicial.
En el control industrial, se compara la amplitud del eco transmitido por el material con la del obtenido usando una probeta patrón sometida al tratamiento correcto, de la misma composición y de igual forma geo-métrica. La inspección se realiza en una máquina especial; los materiales se hacen girar mediante roldanas y los transductores orientables se desplazan a lo largo del elemento.
La exploración helicoidal se lleva a cabo con un paso inferior a 5 mm. El generador de ondas ultra-sónicas comprende un sistema de regulación que mantiene constante la intensidad del eco de referencia.
Se presenta una serie de registros obtenidos con diversas aleaciones y, en particular, defectos observados en elementos tratados por inducción durante el avance lineal. Se detectan zonas de tratamiento deficiente, de área inferior a 1 cm2 .
En la actualidad se controlan de esta manera todos los combustibles aleados de bajo contenido de uranio destinados a los reactors G2, EL3, EDF1, EDF2 e INCA, es decir, barras y tubos con diámetros comprendidos entre 20 y 95 mm.
CONTRÔLE DES TRAITEMENTS THERMIQUES 5
1. INTRODUCTION
Il est souvent indispensable de procéder à des traitements thermiques pour obtenir un affinage du grain et une meilleure stabilité dimensionnelle des alliages d'uranium faiblement allié utilisés dans les réacteurs nucléaires.
Ces traitements thermiques sont effectués - soit par trempe directe, - soit par trempe étagée.
suivant la nature de l'alliage. Dans certains cas le traitement est fait dans une machine semi-automatique, dans laquelle chaque barreau est traité in-dividuellement; ce procédé porte le nom de trempe au défilé [1].
Ce procédé, malgré ses avantages certains, présente le risque d'une trempe irrégulière provenant d'un déréglage de la machine. Il est donc ap-paru nécessaire de procéder, sur les barreaux traités de la sorte, à un con-trôle général de chacun des barreaux, contrôle suffisamment rapide et simple pour être applicable à l'ensemble d'une production et permettre de connaître exactement la qualité du combustible utilisé. En outre, en procédant à ce contrôle immédiatement après la trempe, il est possible de suivre de près la qualité de la fabrication et d'y apporter rapidement les corrections nécessaires.
Lorsque la trempe se fait suivant un autre procédé que le procédé au défilé, l'intérêt d'une méthode de contrôle rapide persiste, surtout si la trempe au bain de sels est faite barreau par barreau. L'examen micro-graphique deviendrait alors rapidement inapplicable en raison du grand nombre d'échantillons; les renseignements que l'on pourrait en tirer ne seraient d'ailleurs que partiels.
Nous nous sommes donc orientés, pour vérifier l'homogénéité de la structure du combustible, vers le contrôle par ultrasons, qui seul peut per-mettre de contrôler, dans un délai acceptable, la totalité d'un production.
Le principe du contrôle par ultrasons que nous avons utilisé est simple: une onde ultrasonore traversant un milieu polycristallin subit une absorption qui est fonction de la taille des grains du matériau et de la longueur d'onde utilisée. L'absorption est importante pour des longueurs d'onde de l'ordre de deux à trois fois le diamètre des grains. Elle est faible quand ce dernier est petit par rapport à la longueur d'onde [2].
Les tout premiers essais ont commencé en juin 1960; dès novembre 1961 le contrôle suivant le principe indiqué ci-dessus était pratiqué à l'échelle industrielle pour le combustible du réacteur G2 (graphite-gaz). Ce com-bustible était un alliage d'uranium faiblement allié, le sicral Fj, obtenu par fusion sous vide et traité en bain de sels ou trempé au défilé. Ses te-neurs en éléments d'addition étaient les suivantes, en % en poids:
Fe : 0,02 à 0,04, Cr : 0,005 à 0,015, Si : 0,005 à 0,015, Al : 0,05 à 0,09. Les barreaux avaient les dimensions suivantes: diamètre : 30 mm, longueur: 300 mm.

6 MARIE-THÉRÈSE DESTRIBATS
2. DIVERSES TECHNIQUES ÉTUDIÉES
Lorsque nous avons commencé nos essais en juin 1960, ce mode de contrôle n'avait pas encore été utilisé à notre connaissance à l'échelle industrielle. Comme références bibliographiques nous ne connaissions que les travaux de Grossman.
Nous avons donc dû, au début, procéder à de nombreux essais afin de définir une technique convenable et facilement transposable à l'échelle in-dustrielle; ces premiers essais ont eu lieu sur du laiton, puis sur des pas-tilles d'uranium.
Le générateur d'ultrasons employé pour ces premiers essais était un appareil courant du commerce: le «Met'alloradar type RV» de la Société Réalisations ultrasoniques, Meaux (S. -et-M.) , France. Cet appareil per-met de travailler aux fréquences de 0,5, 1, 2, 3, 5 et 10 MHz avec des puis-sances, sensibilités et temps d'impulsion variables. Les palpeurs en titanate de baryum sont excités par des impulsions de 0,5 us de durée totale.
Les premiers essais ont été faits successivement dans l'air, puis dans l'eau, par échos multiples, par réflexions multiples et enfin par mesure de la hauteur du premier écho, à toutes les fréquences disponibles dans l'appareil. Pour les essais dans l'air, le traducteur était placé en contact avec la pièce, le couplage se faisant par un film d'huile. Par contre lors des essais dans l'eau, le traducteur avait une position fixe par rapport à la pièce, le ou les traducteurs et la pièce étant immergés.
2.1. Essais par échos multiples
Un train d'ondes ultrasonores est envoyé sur l'échantillon à examiner; sa propagation est fonction de la structure de celui-ci. Le nombre des ré-flexions successives de ce train d'ondes est caractéristique de la taille des grains pour une fréquence donnée, et de l'homogénéité du matériau examiné.
Il s'agit donc essentiellement de chiffrer le nombre de réflexions appa-raissant sur l'écran du tube cathodique. On observe d'autant moins d'échos que la structure est plus grossière.
2. 2. Essais par réflexions multiples
La méthode par réflexions multiples est dérivée de la précédente. Elle consiste à examiner la totalité des échos observables sur l'écran, c'est-à-diï-e le décrément. On compare alors la distance entre le dernier écho d'amplitude non nulle et l'écho initial des divers échantillons. Plus la longueur de réflexion est grande et plus le grain est fin.
A noter que, dans ces deux méthodes, les résultats peuvent être com-plètement faussés par la présence de cavités dans les échantillons examinés; c'est ainsi qu'un échantillon à structure grossière peut paraître fin, les échos obtenus étant dus aux défauts.
2. 3. Essais par mesure de la hauteur du premier écho
Le principe de cette méthode est le même que celui de la méthode par échos multiples, mais on mesure cette fois la hauteur du premier écho.

CONTRÔLE DES TRAITEMENTS THERMIQUES 7
L'échantillon qui absorbe le moins d'énergie a le grain le plus fin. Les signaux sont examinés sur l'écran d'un oscilloscope afin d'avoir
une amplification linéaire. A noter que l'écho dont on mesure la hauteur est le premier lorsqu'on procède dans l'air et le second lorsqu'on procède dans l'eau, le premier écho correspondant alors à la face d'entrée.
2. 4. Essais par transmission
Dans cette méthode on installe de part et d'autre du matériau à examiner deux traducteurs; l'un de ces traducteurs transmet l'énergie ultrasonore au matériau, l'autre fonctionne comme récepteur. On mesure la hauteur du premier écho de la deuxième face. L'énergie transmise est d'autant plus grande que le matériau a une structure plus fine et homogène. Comme pré-cédemment, les mesures sont faites sur l'écran d'un oscilloscope.
Les essais effectués par transmission dans l'eau sont de loin les plus reproductibles, et les seuls enregistrables.
3. PREMIERS RÉSULTATS OBTENUS ,
Après avoir décrit rapidement les principes des méthodes utilisées, nous décrirons ci-après les résultats obtenus en laboratoire avec différents matériaux.
3. 1. Résultats obtenus sur le laiton
Nous avons utilisé de petits cylindres en laiton de 80 ±0 ,5 mm de longueur et de 35 mm de diamètre. Les échantillons dont nous disposions avaient subi divers traitements thermiques; leur structure était homogène et les diamètres des grains variaient entre 0,025 et 0,140 mm.
Les mesures effectuées par les différentes méthodes que nous venons d'indiquer ont montré que la transmission de l'énergie ultrasonore devient quasiment constante dès que le rapport de la longueur d'onde utilisée à la taille du grain est de l'ordre de 50. Par contre la transmission est très variable dès que ce même rapport est inférieur à 1/10 (fig. 1).
3. 2. Résultats obtenus sur des pastilles en sicral Fj
Nous avons eu de grosses difficultés à nous" procurer des échantillons de structure homogène et possédant des grains de tailles différentes. Nous avons pu néanmoins disposer de cinq pastilles de 30 mm de diamètre et de 19 mm d'épaisseur ayant des grains de diamètres variant entre 0,125 et 0,450 mm.
Les essais effectués suivant les différentes méthodes donnent des ré-sultats similaires (fig. 2). On remarquera que la meilleure sensibilité est obtenue pour une fréquence de 3 MHz, le rapport de la longueur d'onde au diamètre du grain variant entre 2 et 10. Par contre la sensibilité est très mauvaise pour la fréquence de 1 MHz, le rapport de la longueur d'onde au diamètre du grain étant alors compris entre 3 et 8 (fig.3).

8 MARIE-THÉRÈSE DESTRIBATS
Figure 1
Laiton - Absorption suivant les diverses méthodes utilisées en fonction de X/G.
X = longueur d'onde utilisée, G= taille moyenne du grain, gif amplitude de l'écho initial, gi= amplitude de l'écho traversant l'échantillon.
Figure 2
Sicral F[ - Absorption ultrasonore en fonction de X/G.
X = longueur d'onde utilisée, G= taille moyenne du grain,
go= amplitude de l'écho initial, gi= amplitude de l'écho traversant l'échantillon.

CONTRÔLE DES TRAITEMENTS THERMIQUES 9
FRÉQUENCE (MHz) FRÉQUENCE (MHz)
Figure 3
Sicral Fi - Absorption ultrasonore de divers échantillons utilisés, en fonction de la fréquence.
3. 3. Choix d'une méthode de contrôle industriel
Ces essais à l'échelle du laboratoire ont permis de déterminer une mé-thode de contrôle industriel, dite par transmission et immersion totale. Cette méthode présente en effet, par rapport aux autres méthodes envisa-gées, l'avantage d'être reproductible et facilement mécanisable. Le con-trôle industriel se fait par comparaison des résultats de mesure avec ceux d'un étalon semblable au matériau utilisé, et sur lequel le contrôle a égale-ment été fait par micrographies. Chaque fois que cela est possible, on ré-alise un étalon présentant une variation lente de la taille du grain sur toute sa longueur, afin de pouvoir apprécier par comparaison la dimension du grain de l'élément examiné (fig. 4).
4. MATÉRIEL DE CONTRÔLE UTILISÉ
Un certain nombre de problèmes d'ordre technique ont dû être résolus: - réalisation d'un générateur d'ultrasons d'une grande stabilité;

10 MARIE-THÉRÈSE DESTRIBATS
Figure 4
Etalon de sicral Ft (diamètre: 66 X 83 mm; fréquence: 3 MHz) présentant une variation lente de la taille du grain.
- détermination d'un système d'enregistrement d'amplitude d'échos; - réalisation d'une cuve satisfaisant aux conditions suivantes:
- possibilité d'examen en rotation de tubes ou de barres de diamètres com-pris entre 30 et 160 mm et de longueurs comprises entre 200 et 1500 mm;
- maintien des traducteurs animés d'un mouvement de translation en posi-tion fixe par rapport au matériau examiné.
4. 1. Banc d'examen de contrôle
4 . 1 . 1 . Caractéristiques mécaniques
La cuve a été construite en tôle d'acier inoxydable soudée de 1 mm d'épaisseur. Elle repose sur un socle formé de deux profilés U soudés donnant une grande rigidité à l'ensemble (fig. 5 - 5 bis). Entre la cuve et • le socle sont placés un joint d'étanchéité en néoprène serré par vis et une couche de résine résistant aux détergents et produits chlorés. Les faces latérales de la cuve sont maintenues par une armature en profilé carré soudé avec interposition de tampons en caoutchouc. Sur le socle a été rapportée une table en acier inoxydable sur laquelle vient se fixer la queue d'aronde supportant les mécanismes d'entraînement des barres.
L'entraînement des barres en rotation est assuré par quatre blocs galets dont la position est réglable et qui se déplacent sur un arbre cannelé. Le chariot porte-traducteurs est entraîné en translation par une vis à billes associée à un joint de Holdam procurant un mouvement exempt de vibrations. Trois supports de traducteurs à position et orientation réglables permettent des réglages fins et reproductibles. Toutes les pièces immergées sont en acier inoxydable ou en bronze.

CONTRÔLE DES TRAITEMENTS THERMIQUES 11
Figure 5
Vue d'ensemble de l'installation de contrôle au laboratoire.
4 . 1 . 2 . Caractéristiques électriques
Les mouvements de rotation et de translation sont obtenus par des mo-teurs à courant continu de type shunt. Les vitesses de translation sont com-prises entre 200 mm/min et 2,2 m/min. Celles de rotation sont comprises entre 4 et 40 m/min. Ces vitesses sont directement lues en m/min sur les cadrans de contrôle.
Les différentes commandes, de translation, de rotation, de l'éclairage, de la pompe, ainsi que l'affichage des vitesses sont réunis sur un pupitre de commande.
Une pompe à fort débit permet la vidange de la cuve et la récupération par filtre des déchets composés principalement d'uranium et de graphite sous forme de particules en suspension dans l'eau.

12 MARIE-THÉRÈSE DESTRIBATS
I _ Joint d'étanchéité Armatu re
3_Oueue d'aronde 4_ Mécanismes d entraînement en rotation 5 _ ,Arbre cannelé 6_ Chariot porte . transducteurs 7_ v is à Ы le
8_ Supporcs de transducteurs 9_ Cadrans de contrôle
Figure 5 bis
Cuve de contrôle (détail).
4. 2. Equipement électronique
4 . 2 . 1 . Générateur d'ultrasons
L'ensemble électronique a été modifié spécialement pour le contrôle des traitements thermiques, ü est composé d'un émetteur-récepteur de type classique («Metalloradar R6») ayant une alimentation stabilisée et deux sélecteurs d'échos avec possibilité d'enregistrement.
L'originalité de l'ensemble réside dans le système de régulation auto-matique d'amplitude des échos, nécessaire pour un contrôle en série où la constance de l'étalonnage est indispensable. Le système régulateur d'am-plitude agit sur le gain de l'amplificateur-récepteur en fonction de l ' infor-mation donnée par un jeu de traducteurs identiques aux traducteurs de m e -sure. Toute cause, qu'elle soit électronique ou physique (température, ins-tabilité de l'électronique), entraine une variation d'amplitude de l'écho de référence. Cette variation est corrigée par la régulation (modification auto-matique du gain); l'amplitude de l'écho de référence demeure constante. Il est ainsi toujours possible de comparer les échantillons aux étalons.

CONTRÔLE DES TRAITEMENTS THERMIQUES 13
Elimination des cavités importantes (modification de la sensibilité).
4 . 2 . 2 . Enregistreur
Une difficulté notable se présente pour l'enregistrement et le contrôle automatique des éléments. Elle résulte du fait qu'un élément présentant des cavités, retassures, etc. non gênantes pour la bonne marche du réacteur a l'apparence d'un élément mal traité. On peut évidemment lever l'ambigu'ité en procédant à un second traitement ou en faisant une gammagraphie.
Il n'en demeure pas moins que cette difficulté interdit, dans les condi-tions actuelles, d'envisager un système de tri automatique. Seul est pos-sible un enregistrement sur papier, il permet de connaître la qualité du barreau sur toute la longueur; le diagramme accompagne ensuite la fiche signalétique du barreau.
On procède à l'enregistrement de la manière suivante: par l'intermédi-aire d'un sélecteur, l 'écho choisi est enregistré après mise en forme et amplification sur un enregistreur à plume. L'amplificateur a un gain, un seuil et un temps de réponse variables. La variation du temps de réponse ou de la sensibilité permet en particulier de minimiser les effets dus à la flèche et aux faibles aspérités et cavités (fig. 6). Ce mode d'enregistrement à été retenu en raison de son faible coût d'exploitation et de sa robustesse.

14 MARIE-THÉRÈSE DESTRIBATS
5. RÉSULTATS
La méthode que nous venons d'examiner est actuellement appliquée pour le contrôle de tous les éléments en uranium faiblement allié, quelles que soient leurs dimensions. Pour les barres pleines on procède à un examen diamétral, le faisceau d'ultrasons étant perpendiculaire à l'axe de la barre. Pour les éléments annulaires l'examen se fait suivant une corde, le faisceau étant tangent à la surface interne. Dans tous les cas le pas d'examen est inférieur à 5 mm.
5. 1. Fréquences d'examen utilisées
Les fréquences d'examen sont variables selon les alliages:
Matériau Fréquence Taille moyenne du grain
U non allié 2 MHz 0,5 mm
sic ral 3 MHz 0,3 mm
sicral F2 3 MHz 0,2 mm
(Fe 0,03; Al 0,08; Cr 0,02; Si 0,035)
U Si Fe 3 MHz 0,25 mm (Si 0,1; Fe 0,03)
U Cr 5 MHz 0,1 mm
(Cr 0,1)
5. 2. Différents défauts observés
En décembre 1961, plus de 4000 barreaux du type G2 en sicral Fx ont été examinés en laboratoire avant que les usines de production soient équipées pour effectuer ce contrôle.
Les réglages utilisés étaient tels que l'on avait une réponse nulle de l'enregistreur pour une barre brute de fusion et une hauteur d'enregistre-ment de 30 mm pour un élément bien traité (fig. 7).
Des défauts de différentes natures ont été observés au cours de ces examens: - un abaissement brutal de l'amplitude de l'enregistrement dans une zone
du tube, dû au fait que celle-ci n'a pas été traitée par suite d'un manque d'eau ou d'un glissement dans l'inducteur (fig. 8);
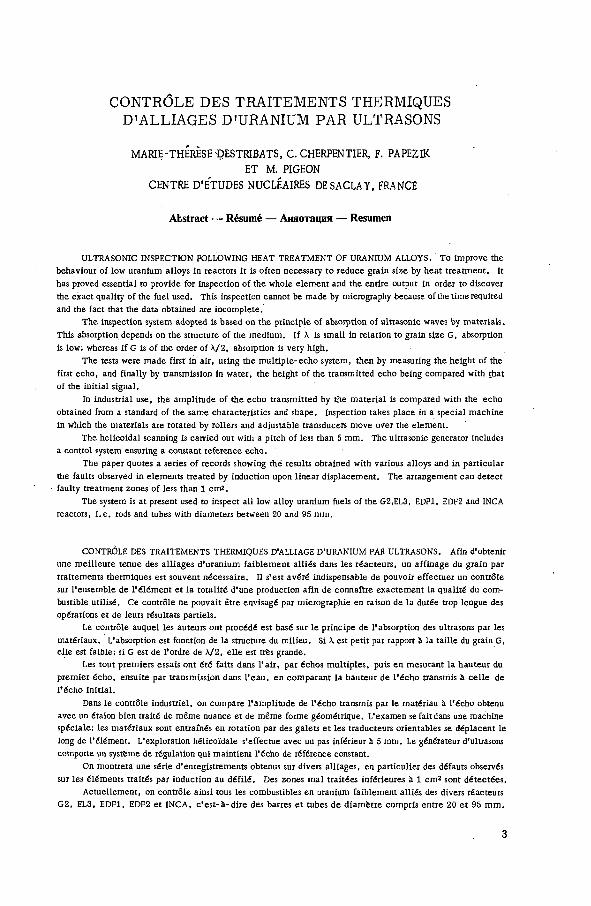
- une variation très nette de l'absorption de l'énergie ultrasonore sur une extrémité ou sur la totalité du barreau, résultant d'une durée de .trans-fert du bain de sels à la trempe trop longue (fig. 9);
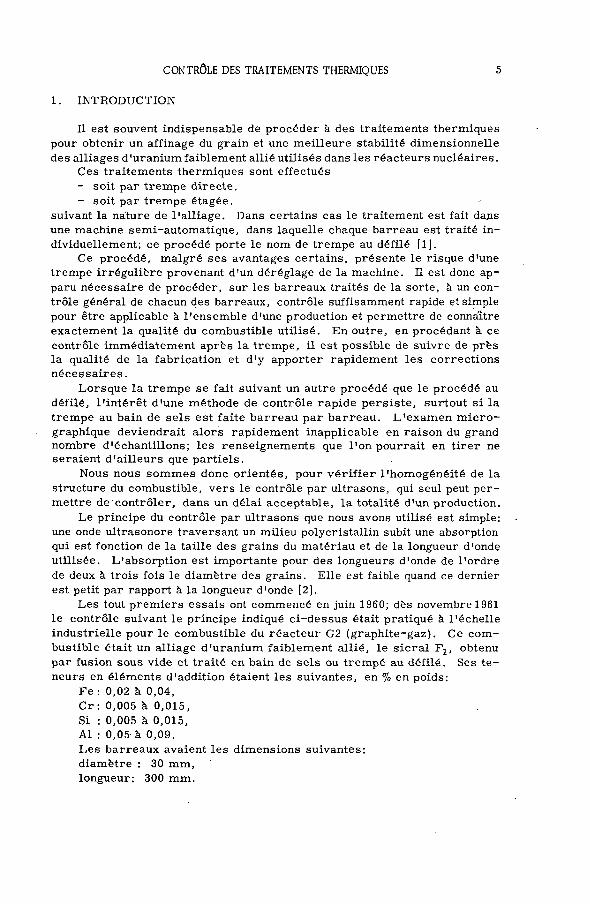
- la formation d'une couronne de gros grains qui augmente l'absorption ultrasonore et qui a son origine dans une insuffisance du chauffage des extrémités (fig. 10);

CONTRÔLE DES TRAITEMENTS THERMIQUES 15
Т Г Г Т Т Т T Y Г ^ l \ \ i v • \ \ ; A Y ; Д УЛ: \ \ V l ~ r ^ T ' r j s i s ; ! \ ^ [ 1 j \ \ \ - y V Д,
Ш
n* hi
; 1 _ 4 J - . „ -j "A - - •
i
? Г/ j J J 4 -4 J il n ¡
Non traité Вюп irait»
Щк ВЦ,
• H I
шт
Mal traite
Ш я Ш ШЯЁЁИРШШШ^ ̂ Г
- " хЗ
v \ \" v v 1 П \ ) 1
\ \ i 1
—
i ч - i
¡ —
i ч - i
i -. i. • i 1 h) i
! L L U L LU / 7 1
Figure 7
Barreau de sicral F t (diamètre: 30 mm; fréquence: 3 MHz) non traité - bien traité - mal traité.
- tous les contrôles étant faits sur des barres brutes de fusion, il peut se former à la surface de l'élément, s'il est poreux et mal mouillé, un nuage de bulles qui modifie la transmission ultrasonore (fig. 11);
- la réponse ultrasonore peut également être perturbée, même si l'élément est bien traité, lorsque ce dernier présente de nombreuses microporosités (fig. 12).
5. 3. Mise au point d'une machine de trempe au défilé
Le contrôle ultrasonore suivant la méthode décrite plus haut a servi à la mise au point d'une machine semi-automatique de trempe au défilé pour

16 MARIE-THÉRÈSE DESTRIBATS
^ ^ f e s l i l
Figure 8
Barreau de s icral Fi ( d i a m è t r e : 30 m m ; f réquence : 3 MHz)
Tra i tement au d é f i l é - incident d e trempe.
des éléments annulaires de 20 à 35 kg et de diamètres intérieur et extérieur de 54 et 70 mm, 66 et 83 mm, 70 et 95 mm respectivement.
Diverses améliorations ont pu être apportées rapidement, notamment sur les points suivants, qui permettent de corriger des déficiences de la machine qui auraient été difficilement repérables par les seuls examens micrographiques : - il est apparu dans certains cas que des tubes entiers ou une partie des
tubes n'avaient pas été portés à une température suffisante pour atteindre le point de transformation |3 (fig. 13a); l'enregistrement ultrasonore donnait alors une réponse nulle sur la totalité ou sur une partie du tube.
- de la même manière une insuffisance de la trempe provenant d'un mauvais réglage du collier douche est facilement observable.
- des réponses nulles sur les enregistrements peuvent traduire des frotte-ments anormaux de glissement ou des accrochages résultant d'un mauvais centrage du tube (fig. 13b).
- l'hétérogénéité de la taille des grains le long d'une génératrice (fig. 14) entraîne des oscillations anormales sur l'enregistrement; ce l les -c i peuvent également être dues à un excentrement du tube.
CONTRÔLE DES TRAITEMENTS THERMIQUES 17
© CD Figure 9
Barreau de sicral F! (diamètre: 30 mm; fréquence: 3 MHz) Traitement en bain de sels - incident de trempe.
5.4. Conclusion
Nous étions placés en 1960 devant la nécessité de mettre au point un contrôle rapide portant sur la totalité de l'élément combustible. Seule une méthode par ultrasons pouvait permettre d'atteindre ce résultat.
Nous avons donc été amenés à mettre au point dans le courant du se -cond semestre de 1961 un appareillage approprié avec lequel nous avons ob-tenu une bonne concordance avec les examens micrographiques.
Depuis 1962, les usines de productions d'éléments se sont équipées avec ce matériel. Une de ces usines dispose actuellement d'une machine semi-automatique de contrôle dérivée de la machine que nous avons mise au point. Les manipulations de mise en place des éléments sous le faisceau ultrasonore se trouvent simplifiées, la cadence de contrôle augmentée et la main d'œuvre réduite.
18 MARIE-THÉRÈSE DESTRIBATS
x5
Figure 10
Barreau de sicral Fi (diamètre: 30 mm; fréquence: 3 MHz) Défauts d'extrémité.
x5
2*

A v a n f m o u i l l a g e
Figure 11
Barreau de sicral Fi (diamètre: 30 mm; fréquence: 3 MHz) Influence de l'état de surface.
x 5
Figure 12
Barreau de sicral F¡ (diamètre: 30 mm; fréquence: 3 MHz) Influence des porosités.

20 MARIE-THÉRÈSE DESTRIBATS
? i « . *-ut i «Tf r- , ^
q/ChauFFage insuffisant-
Ь/ M a u v a i s e a l i m e n t a r o n en eau
Figure 13
T u b e d e s i c r a l ' F ! ( d i a m è t r e : 6 6 x 83 m m ; f réquence : 3 MHz),
a) c h a u f f a g e insuffisant; b ) mauvaise a l imentat ion en eau.
Figure 14
T u b e d e s icral Fi ( d i a m è t r e : 6 6 x 83 m m ; f réquence : 3 MHz).
Hétérogéné i t é d e la ta i l l e du grain l e long d 'une génératrice .

CONTRÔLE DES TRAITEMENTS THERMIQUES 21
B I B L I O G R A P H I E
AUBERT, H. , DESTRIBATS, M. "T. ,et LANIESSE, J. , Contrôle ultrasonore et macrographique d'éléments annulaires 66X 83 ou sicral Fx fabriqué par la CERCA, DMT RMA 64-11 (27 mars 1964).
R É F É R E N C E S
[1] LANIESSE, J. et AUBERT, H. , Alliages d'uranium à faible teneur pour éléments combustibles, CEA R 25-84 (1964) Ea.
[2] MASON, W. P. and McSKIMIN, H.J. , Energy Losses of Sound Waves in Metals due to Scattering, J. appl. Phys. 19 (1948) 940-6.
D I S C U S S I O N
V. V. GORSKY: Could you draw the ultrasonic diagrams for inspection of solid and tubular cores?
M. -T . DESTRIBATS:
Diametral Inspection Inspection along a core
V. V. GORSKY: Did you use different ultrasonic frequencies for de-tecting defects and for core structure measurements?
M . - T . DESTRIBATS: Only one frequency was used. Gamma radio-graphy was used for detecting defects such as cracks and porosity.
R. SHARPE: Have you considered presenting the ultrasonic information on a two-dimensional recorder? We have tried this and found that it can give a considerable amount of detailed information about the grain structure in uranium.
M.-T. DESTRIBATS: No, we have not been able to try this, as we have no two-dimensional recorder.


ULTRASONIC TESTING OF METALLIC URANIUM
Y. NAKAMURA AND Y. TATEISHI TOKAI REFINERY, ATOMIC FUEL CORPORATION,
JAPAN
(Presented by T. AOKI)
A b s t r a c t — R é s u m é — А н н о т а ц и я — R e s u m e n
ULTRASONIC TESTING OF METALLIC URANIUM. The development of ultrasonic testing and the results of routine inspection on cast billets and rolled rods for JRR-3 fuel-elements are described. The reactor is a
domestic made, heavy-water-moderated and cooled, research reactor of 10 MW capacity, with aluminium-clad metallic uranium fuel-elements.
Cast billets of 3-in diam. were rolled to rods of 1- in diam. Ultrasonic testing was applied for de-tecting internal voids and cracks and for evaluating random orientation and grain size after heat treatment. The ultrasonic testing of uranium was very difficult because of its high acoustic impedance, and the high sensiti-vity of the transducers and special beam mask were necessary for the water-immersed transmission method. A set of brass billets with artificial defects was used as the standard. During the development of these standards, several kinds of Cu-Zn alloy were examined for their acoustic properties.
Any internal defects greater than 2 mm and 0 .5 mm equivalent diameter were rejected in the case of billets and rolled rods respectively. • Two billets which included typical voids were rolled to size, and ultra-sonic testing and radiography with Betatron were carried out at several stages to find the behaviour of the voids during fabrication.
The attenuation of ultrasonic waves is affected by the grain size, and is particularly large if the ultra-sonic wave-length is comparable to the grain size.- This was used for the detection of unsatisfactory heat treat-ment. The ultrasonic wave-speed is different in the parallel and perpendicular rolling directions in as-rolled state. This difference decreased as the temperature of heat treatment is increased; however, a small difference was observed in a beta-quenched specimen, and real acoustic isotropy was obtained by gamma-quenching.
ESSAI PAR ULTRASONS DE L'URANIUM MÉTALLIQUE. Les auteurs décrivent la mise au point d'une méthode d'essai par ultrasons et donnent les résultats du contrôle routinier de billettes moulées fondues et de barreaux laminés pour les éléments combustibles du réacteur JRR-3. П s'agit d'un réacteur de recherche japonais, d'une puissance de 10 MW, ralenti et refroidi & l'eau lourde, qui utilise des éléments combustibles en uranium métallique sous gaine d'aluminium.
Des billettes moulées de 76 mm de diamètre sont transformées par laminage en barreaux de 25 mm de diamètre. On procède à des essais par ultrasons pour détecter les vides et les fissures internes ainsi que pour évaluer l'orientation aléatoire et la dimension des grains après traitement thermique. L'inspection par ultrasons de l'uranium est très difficile à cause de l'impédance acoustique élevée de ce métal; des traducteurs extrêmement sensibles et un masque spécial du faisceau sont nécessaires pour la méthode de transmissibn en immersion dans l'eau. On utilise comme étalon un jeu de billettes en loiton avec des défauts artificiels. Au cours de la mise au point de ces étalons, on a étudié les propriétés acoustiques de plusieurs alliages cuivre-zinc.
On a rejeté toutes les billettes et tous les barreaux présentant des défauts internes de plus de 2 mm et 0 ,5 mm de diamètre, respectivement. Deux billettes qui présentaient des vides caractéristiques ont été laminées normalement; on les a contrôlées, à divers stades des opérations, par ultrasons et par radiographie à l'aide d'un betatron, pour déterminer le comportement des vides.
L'atténuation des ondes ultrasonores dépend de la dimension des grains; elle est particulièrement accusée si la longueur d'onde des ultrasons est comparable à la dimension du grain. Cette particularité est utilisée pour déterminer si le traitement thermique n'était pas défectueux. La vitesse de l'onde ultrasonoie est différente, après laminage, suivant qu'il s'agit de la direction parallèle ou de la direction perpendiculaire au laminage. Cette différence diminue lorsque la température du traitement thermique augmente; toutefois, on a observé
23

24 Y. NAKAMURA and Y. TATEISHI
une légère différence dans un spécimen ayant subi une trempe aux rayons bêta; on a obtenu une isotropie acoustique parfaite par la trempe aux rayons gamma.
П Р О В Е Р К А МЕТАЛЛИЧЕСКОГО УРАНА С ПОМОЩЬЮ УЛЬТРАЗВУКА. Описываются разработка м е т о д а проверки с помощью ультразвука и результаты обычной проверки литых з а г о т о в о к и катаных стержней для топливных элементов реактора J R R - 3 . Этот и с с л е д о в а -тельский реактор установленной мощностью 10 м г в т является реактором отечественного про-и з в о д с т в а . В к а ч е с т в е замедлителя и теплоносителя в нем и с п о л ь з у е т с я тяжелая в о д а , а в к а ч е с т в е топлива —металлический уран в алюминиевой о б о л о ч к е .
Литые з а г о т о в к и д и а м е т р о м 3 дюйма были прокатаны в стержни д и а м е т р о м 1 д ю й м . Для обнаружения внутренних п у с т о т и трещин и для оценки беспорядочной ориентировки и р а з м е р о в зерен после т е р м о о б р а б о т к и применили у л ь т р а з в у к . Контроль урана с помощью ультразвука является очень трудным делом, так как уран имеет большое акустическое с о п р о -тивление, и м е т о д проверки прохождения звука в погруженном в воду состоянии потребовал очень чувствительных датчиков и специальной защиты от пучка. В качестве стандарта и с -пользовали набор б р о н з о в ы х з а г о т о в о к с и с к у с с т в е н н ы м и д е ф е к т а м и . В ходе р а з р а б о т к и этих стандартов были исследованы акустические свойства нескольких видов сплава C u — Z n .
В с е з а г о т о в к и и катаные стержни с внутренними д е ф е к т а м и , эквивалентный диаметр к о т о р ы х превышал 2 мм и 0,5 м м с о о т в е т с т в е н н о , были з а б р а к о в а н ы . Две з а г о т о в к и , с о -держащие типичные п у с т о т ы , были прокатаны до т р е б у е м о г о размера , и на нескольких с т а -диях их испытали с помощью ультразвука и радиографии с помощью б е т а т р о н а , чтобы в ы -явить поведение п у с т о т в п р о ц е с с е изготовления стержней .
На ослабление у л ь т р а з в у к о в ы х волн о к а з ы в а е т влияние р а з м е р зерен , и оно о с о б е н н о велико в т о м с л у ч а е , если длина у л ь т р а з в у к о в о й волны сравнима с р а з м е р о м з е р е н . Э т о было использовано для обнаружения неудовлетворительной т е р м о о б р а б о т к и . В прокатанном состоянии с к о р о с т ь ультразвуковой волны неодинакова при прокатке в параллельном и п е р -пендикулярном направлениях. Эта разница уменьшается при повышении температуры т е р м о -о б р а б о т к и , однако была отмечена небольшая разница в образце , прошедшем б е т а - з а к а л к у , а при г а м м а - з а к а л к е была получена действительная акустическая изотропия .
ENSAYO ULTRASONICO DEL URANIO METALICO. Se describe el perfeccionamiento del método ultra-sónico de ensayo y los resultados de la inspección comente del metal en lingotes colados y de las varillas laminadas que se destinan a los elementos combustibles del reactor japonés de investigación № 3 (JRR-3). Este reactor de investigación de 10 MW construido en el Japón, es moderado y refrigerado por agua pesada, y sus elementos combustibles consisten en uranio metálico revestido de aluminio.
Con el laminado se reduce a 1 pulg el diámetro de los lingotes colados, que asciende inicialmente de 3 pulg. El ensayo ultrasónico se aplica para localizar los huecos internos y las grietas, y para evaluar la orientación aleatoria y el tamaflo del grano tras el tratamiento térmico. El ensayo ultrasónico del uranio es muy diffcil a causa de su alta impedancia acústica; por ello, para aplicar el método de inmersión en agua, es preciso utilizar transductores de alta sensibilidad y un diafragma especial para limitar el haz. Como patrón se ha empleado una serie de lingotes de latón con defectos introducidos deliberadamente. Durante la pre-paración de los patrones, se estudiaron las propiedades acústicas de varias clases de aleaciones de cobre y cinc.
Se rechazaron los lingotes y varillas laminadas que tenfan defectos internos de un diámetro equivalente a más de 2 mm y 0 ,5 mm respectivamente. Dos de los primeros, con fallas tfpicas, se laminaron al tamaño adecuado y se sometieron en diversas fases al ensayo ultrasónico y radiográfico con Betatrón para observar la evolución de los defectos durante el proceso de fabricación.
El tamaüo de grano influye en la atenuación de las ondas ultrasónicas, que resulta particularmente intensa si la longitud de onda es comparable al tamaílo del grano. Esta propiedad se aprovecha para detectar un trata-miento térmico defectuoso. En el metal laminado, la onda ultrasónica se propaga con diferente velocidad según sea paralela o perpendicular a la dirección del laminado. Esa diferencia disminuye a medida que aumenta la temperatura del tratamiento térmico; no obstante, se observa una pequeña diterencia en las muestras enfriadas en fase beta, y se consigue una auténtica isotropfa acústica por enfriamiento en fase gamma.
INTRODUCTION
Japan Research Reactor-3 (JRR-3) is a heavy-water-moderated and -cooled research reactor of 10 MW capacity, with aluminium-clad metallic

ULTRASONIC TESTING OF METALLIC URANIUM 25
uranium fuel elements. Since thè reactor was the first domestic reactor in Japan, it was necessary to develop fuel fabrication techniques as well as non-destructive testing in order to get satisfactory fuel elements.
The Atomic Fuel Corporation, one of the government establishments, supplied cast billets to private companies for rolling, and inspected their products on behalf of JAERI where the reactor is installed.
Owing to the limits in the rolling mills, the size of the billets was relatively small, namely 68 mm and 63 mm in diameter and 730 mm long and there were some difficulties in the casting operation. A suitable in-spection technique was required for the quality control in the metal-production plant.
Ultrasonic testing was applied for the detection of internal voids and cracks in the routine production of cast billets. This technique was also applied to the inspection of rolled rods and for the evaluation of random crystal orientation and grain size after the heat treatment.
INSPECTION OF CAST BILLETS
General
As metallic uranium has a large volume change and a small latent heat during solidification, high solubilities of gas in liquid state, and high density, it is very apt to include casting defects such as shrinkage cavity and porosity. It was very important to reject unsound billets, as the total reduction during fabrication was small because of the small size of billets. Uranium is one of the most difficult metals for ultrasonic testing because of its high density, low elastic modulus, large grain size and- resultant high acoustic impedance as shown in Table I.
A high-sensitive lithium sulphate transducer and a foamed polystyrene beam mask was necessary to obtain good resolution of internal defects, though the mask reduced the sonic energy as shown in Table II.
Testing method
Test results of the water-immersion transmission method were recorded through an alarm circuit and a electro-discharge recorder to get a defects pattern. The rotation of the specimen was recorded in a horizontal direction and the received sonic energy, greater than pre-set attenuation level, re-sulted in a solid plotted line. A block diagram of the equipment system is shown in Fig. 1 and a typical result is shown in Fig. 2.
Routine inspection was conducted according to the following conditions: (1) Cast billet (63 mm diam. or 68 mm diam., machined surface),
Test method : water-immersion transmission method, Scanning : rotating specimen at 20 rpm longitudinally,
moving transducer system at 120 mm/min, Overlap area : 60%, Transducer : quartz-crystal emitter lithium sulphate
receiver,

26 Y. NAKAMURA and Y. TATEISHI
TABLE I
P R O P E R T I E S OF S E V E R A L M E T A L S AND A L L O Y
Aluminium 70 /30 brass Lead Uranium
Density ( g / c m 3 ) 2. 69 8 . 5 11 .3 19
Sonic speed ( cm/s ) 6 .35 X 10 s 4. 64 X 10 s 2 .26 X 10 s 3.43 X 10⁵
Attenuation ( d b / c m ) at 2 . 2 5 M c 0. 02 2 . 0 _ 2 . 0
Acoustic impedance 1 .71 x 106 3. 96 X 106 2 .25 X 106 6. 52 X 10»
Ejection fraction of sonic energy from water fifc) 28 13 20 10
TABLE II
SONIC SENSITIVITY OF THE TESTING SYSTEM
Transmitter Receiver Mask Sensitivity difference
(db)
Quartz crystal Quartz crystal Without 0
Quartz crystal Quartz crystal With - 3 - - 5
Quartz crystal Lithium sulphate Without +18 — +20
Quartz crystal Lithium sulphate With + 1 3 - +15
Beam mask : foamed polystyrene with a window of 5 mm X 15 mm.
Test frequency : 2. 25 megacycles Pre-set attenuation level : 20 and 25 db below the maximum received
energy along the whole specimen. (2) Cast rod (25 mm diam., machined surface)
Same as above, but the evaluation was done at the pre-set attenuation level of 15 and 20 db.
(3) Wrought rod (25 mm diam., machined surface rolled rod or extruded rod) Test frequency : 5 megacycles Pre-set attenuation level : 3 and 5 db; other conditions were same as
( 1 ) . Testing was done at two pre-set attenuation levels as described above,
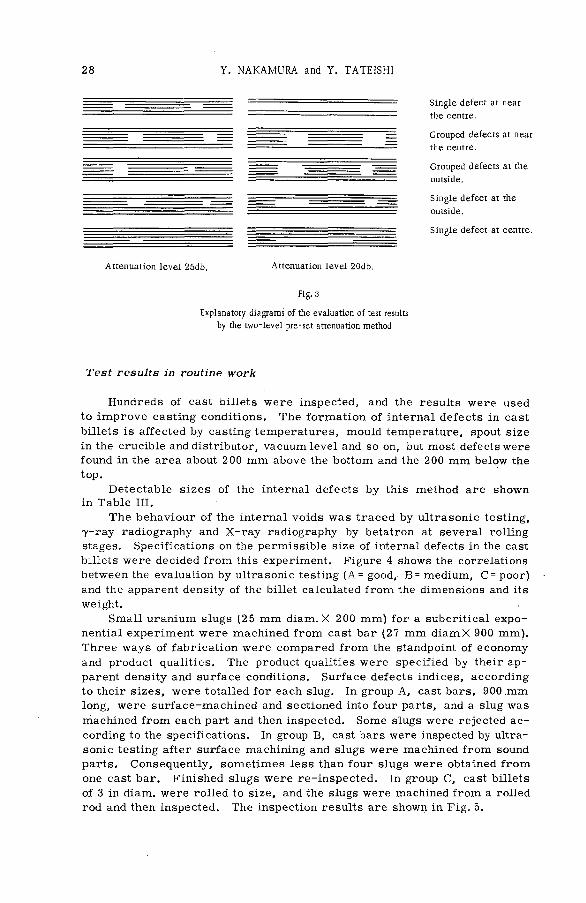
and careful observation of the two defect patterns gave information about the defects as shown in Fig. 3.

U L T R A S O N I C T E S T I N G OF M E T A L L I C U R A N I U M 27
Recorder
р ц Send Transducer (Quirty c i rstal )
( ) — Specimen
Receiver Transducer
(Lithium sulphate)
Attenuater
F i g - 1
Block, diagram of the testing system
Defect 5
Defect 4
Defect 3
Defect 2
Defect 1
25 d b
— Defect 5 — De fec t 4 — De fec t 3 — De fec t 2 — De fec t I
Fig-2
A typical result of ultrasonic testing on a cast billet
28 Y. NAKAMURA and Y. TATEISHI
S i n g l e d e f e c t at n e a r
t h e c e n t r e .
G r o u p e d d e f e c t s at n e a r
t h e c e n t r e .
G r o u p e d d e f e c t s a t t h e
o u t s i d e .
S i n g l e d e f e c t a t t h e
o u t s i d e .
S i n g l e d e f e c t at c e n t r e .
A t t e n u a t i o n l e v e l 2 5 d b . A t t e n u a t i o n l e v e l 2 0 d b .
F i g . 3
E x p l a n a t o r y d i a g r a m s o f t h e e v a l u a t i o n o f test results
b y the t w o - l e v e l p r e - s e t a t t e n u a t i o n m e t h o d
Test results in routine work
Hundreds of cast billets were inspected, and the results were used to improve casting conditions. The formation of internal defects in cast billets is affected by casting temperatures, mould temperature, spout size in the crucible and distributor, vacuum level and so on, but most defects were found in the area about 200 mm above the bottom and the 200 mm below the top.
Detectable sizes of the internal defects by this method are shown in Table III.
The behaviour of the internal voids was traced by ultrasonic testing, •y-ray radiography and X-ray radiography by betatron at several rolling stages. Specifications on the permissible size of internal defects in the cast billets were decided from this experiment. Figure 4 shows the correlations between the evaluation by ultrasonic testing (A= good, B= medium, C= poor) and the apparent density of the billet calculated from the dimensions and its weight.
Small uranium slugs (25 mm diam. X 200 mm) for a subcritical expo-nential experiment were machined from cast bar (27 mm diamX 900 mm). Three ways of fabrication were compared from the standpoint of economy and product qualities. The product qualities were specified by their ap-parent density and surface conditions. Surface defects indices, according to their sizes, were totalled for each slug. In group A, cast bars, 900 .mm long, were surface-machined and sectioned into four parts, and a slug was machined from each part and then inspected. Some slugs were rejected ac-cording to the specifications. In group B, cast bars were inspected by ultra-sonic testing after surface machining and slugs were machined from sound parts. Consequently, sometimes less than four slugs were obtained from one cast bar. Finished slugs were re-inspected. In group C, cast billets of 3 in diam. were rolled to size, and the slugs were machined from a rolled rod and then inspected. The inspection results are shown in Fig. 5.

ULTRASONIC TESTING OF METALLIC URANIUM
T A B L E I I I
DETECTABLE SIZES OF THE INTERNAL DEFECTS
29
Detectable defect
Mask size (mm)
Pre-set level (db) Single defect
(mm diam.) Group defect (mm diam.)
Cast billet 5X15 20, 25 2. 0 0 .8
Cast bar 5 x 1 5 15, 20 2 . 0 0.8
Cast and heat-treated bar 5X15 5, 7 1. 5 0 . 3
Rolled rod (diam. ) 4 . 0 3, 5 0 . 3 0 .1
1 9 . 0 0
1 8 . 9 0
Carbon : More than 600 ppm
Grade of Ultrasonic Inspection
1 9 . 0 0 -
1 i L A B C
Grade of U l t rason i c Inspect ion
F i g . 4
C o m p a r i s o n o f u l t r a s o n i c t e s t i n g v e r s u s a p p a r e n t d e n s i t y o f b i l l e t
In this particular case the specifications for the product were not so severe, and final fabrication was conducted according to A, but В might be preferable if the specifications were much more severe.

30 Y. NAKAMURA and Y. TATEISHI
3 0
20
10
Г- S я LO C4| о -a to CO Cvl CO CO CNJ
CO -̂J" LO со г- OO CD О - CNi o o «d- ю г - c o c o en) CD с- t—со со m СО*— — OJ CxlCO ^ jo lo npnc;itv СО CCI coco. СО OO COCO CD CD о~> СП>. СО СП) <Г).СП> t>CIIOlt_y со* с о о о о о <хЗ с о с о ' о о * со* со* со" с о о о с о о о о о с о
F i g . 5
I n s p e c t i o n results o f u r a n i u m slugs
Preparation of the test standard
A test standard which contains some artificial or pre-determined defects is desirable in routine ultrasonic testing. However, the machining of uranium to reach such a standard was very difficult. Attempts were made to get a model or stand-in instead of uranium. As shown in Figs. 6 and 7, 70/30 brass was found to be similar acoustically to uranium.
Four sections of this material, in whose interface several artificial defects were machined, were put together with thin films of soft solder as shown in Fig. 8. The acoustic resistance through this film was 2 - 3 db.

ULTRASONIC TESTING OF METALLIC URANIUM 31
Forged •—• ferpendicular
direction *-* Parallel
direction
2.0 4.0 6.0 8j0
Frequency ( M c )
e Ж 6.0
5.0
о ao
<u <c 10
Annea l 6 5 0 "С 1 h r
2.0 4.0 6 0 8.0 10.0
Frequency ( M c ) 9 0 Attenuation m e a s u r e m e n t of l ]Q B r a s s
2.0 4.0 6.0 8.0 Ю.0
A t t e n u a t i o n m e a s u r e m e n t of ^ ^ q Brass
_L _L 2.0 4.0 60 8.0 1.0 12.0
8.0 7.0 6.0 5.0 4.0 3.0 2.0 1.0
xY
-L. 2.0 4.0 6.0 8.0 10.0
A t t e n u a t i o n m e a s u r e m e n t of ^/¿Q B r a s s
5.0 4.0 3.0 2.0 1.0
ec Attenuat ion m e a s u r e m e n t of / 3 5 B r a s s
2.0 4.0 60 8.0 10.0
Fig. 6
Acoustic properties of copper-zinc alloys

32 Y. NAKAMURA and Y. TATEISHI
4100
4500
-o 4300 (u >
Forged •—• ftrpendiculí
direction Parallel
direction
10 80 90 Co pper content ( % ]
4700
4500
4300 A»neal 650 "C 1 br-
io 80 30
Copper content {%)
Fig. 7
Acous t i c properties o f c o p p e r - z i n c a l loy
Depth Depth Depth 5.0mm diam.x5mm 8.0mm diam. x 8mm 14.0mmdiam.x 14mm
f I ' 1 Ю 1 1 _J .
1 s r a
- t -ю
1 I ___J
s о t ! f
i i i i
t Solder Brazing
i. s о
я "V) - — "7Л _ ¡U " iU m m /и
— i. ! U
Fig. 8
T e s : standard b l o ck
EXAMINATION OF ISOTROPY IN URANIUM BY ULTRASONIC TESTING
A random crystal orientation is required to avoid preferential irradiation growth, and this state is obtained by heat treatment after rolling. A 20X 20X 20-mm specimen was sectioned from alpha-rolled rod. Sonic speed was measured in the parallel and perpendicular directions against rolling direction by an ultrasonic thickness meter. Grain-orientation measurement by X-ray and metallography were conducted on the specimen. The specimen was heated for half-an-hour at various temperatures step by step and after-wards quenched in water and measured by ultrasonic testing, X-ray and

ULTRASONIC TESTING OF METALLIC URANIUM 33
Fig. 9
Acous t i c properties o f the heat - t reated spec imen
microscopy. The results are shown in Figs. 9 and 10. As shown in these Figures, the acoustic isotropy is obtained by heat treatment at 7 50°C, and it has a good correspondence in X-ray analysis, but no difference was ob-served by metallography on the surfaces of the two directions in the specimen that was heat-treated at temperatures higher than 450°C. This testing was used for evaluating the heat-treatment quality.
EXAMINATION OF URANIUM GRAIN-SIZE BY ULTRASONIC TESTING
Several uranium specimens of different grain size were tested ultra-sonically with various frequencies. The results are shown in Fig. 11. The sonic attenuation becomes remarkable at the frequency where the wave-length inside the specimen is close to its grain size.
This phenomenon was used for detecting faulty heat treatment of the rods. It was rather easy to detect the part of a rod which had a small grain size 50 /um), or a very large one (larger than 500 jum), but the de-termination of grain size within this range failed because of the local hetero-genity of grain size, or their non-uniform grain forms as shown in Table IV.
3

3 4 Y . N A K A M U R A and Y . T A T E I S H I
(110)
501»
40 -
30 -
2 0 -
1 0 -
50
40
30
20
10
100 200 300 400 500 600 100 y \ (0025
100 200 300 400 500 600 700 6 • (111)
_j i L_ 100 200 300 400 500 600 1 00
С 021 )
100 200 300 400 500 600 700 H e a t — t r e a t m e n t temperature ( °C )
Fig. 10
X-ray analysis of the specimen
3*

ULTRASONIC TESTING OF METALLIC URANIUM 35
Frequency ( M c )
Fig. 11
Attentuation o f ultrasonic wave in spec imens o f d i f ferent grain size
T A B L E IV
A T T E N U A T I O N OF ULTRASONIC WAVE IN SPECIMENS OF D I F F E R E N T GRAIN SIZE
Temperature Holding time Attenuation Grain size (•С) (min) (db) (|im)
100 10 12 180
716 10 8 270
730 10 6. 5 180
730 5 7 . 0 230
735 10 6 . 0 190
735 5 12. 5 190
740 10 7 . 5 170
740 10 7 . 0 170
800 10 24 .0 190


ULTRASONIC WATER-GAP MEASUREMENTS IN MTR FUEL ELEMENTS
R. D E K N O C K
M E T A L L U R G Y D E P A R T M E N T , S. С . К . / С . E. N . ,
M O L , B E L G I U M
(Presented by P. de MEESTER)
A b s t r a c t — R é s u m é — А н н о т а ц и я — R e s u m e n
ULTRASONIC WATER-GAP MEASUREMENTS IN MTR FUEL ELEMENTS. The high thermal fluxes, which are usual in the latest materials testing reactors, impose suitable paths for uniform heat transfer and a reliable heat removal avoiding bulk-vapour formation. Furthermore, to control the over-all swelling and reactor fuel behaviour, water-gap measurements will also be performed in post-irradiation experiments on spent fuel elements. For that purpose, a probe for measuring the 3-mm water-gap of the BR-2 fuel element over a 1-m length, based on the principle of ultrasonics, has been developed. In the case of post-irradiation experiments, the measuring probe should operate in a fuel element by being immersed in a water pool at a depth of at least 6 m. The probe can withstand prolonged immersion in water and is not affected by normal gamma-irradiation doses.
Although operating on the usual pulse-reflection method, the system allows emitted and reflected pulses to be separated by a 10-MHz ferro-electric crystal with high inherent energy dissipation.
Oscilloscope read-out can be used, whereby the time is displayed on the horizontal axis, the scanning speed being adjusted to bear a direct relation to the velocity of wave propagation, i . e . the gap distance.
This type of read-out Is satisfactory where the number of measurements is restricted, but chart recorder read-out is obviously desirable. In this case, emitted and reflected pulses are shaped and fed to a time-voltage converter using transistor logic techniques. The instrument allows continuous adjustment of output zero for any arbitrary gap distance between 2 and 4 mm thereby permitting zero-centre recording. Furthermore, any desired 100-/im gap distance variation can give a stable 1-V output voltage to a recorder. An accuracy of 5-¡im gap-distance variation is easily obtained. Several fuel elements have been measured. The results and reproducibility were very satisfactory.
MESURE PAR ULTRASONS DES ESPACES INTERCALAIRES DANS LES* ELEMENTS COMBUSTIBLES DES RÉACTEURS D'ESSAI DE MATÉRIAUX. Etant donné que dans les plus récents réacteurs d'essai de matériaux les flux thermiques sont généralement élevés, il est indispensable de prévoir un transfert de chaleur uniforme et un refroidissement régulier empêchant toute formation massive de.vapeur. En outre, pour déterminer le gonflement et le comportement général du combustible dans le réacteur, il faudra mesurer les espaces inter-calaires dans les éléments combustibles au cours de contrôles après irradiation. A cette fin, on a mis au point • une sonde fondée sur le principe des ultrasons, qui permet de mesurer les espaces intercalaires de 3 mm sur 1 m de long dans les éléments combustibles du réacteur BR-2. Lorsqu'on procède à des expériences après irra-diation, la sonde doit pouvoir fonctionner dans un élément combustible immergé dans un réservoir d'eau à une profondeur de 6 m au minimum. La sonde peut résister â une immersion prolongée dans l'eau et n'est pas endommagée par une irradiation gamma à des doses normales.
Bien que le système soit fondé sur la méthode classique de la réflexion des impulsions, il permet de séparer les impulsions émises des impulsions réfléchies au moyen d'un cristal ferroélectrique de 10 MHz à pouvoir élevé de dispersion de l'énergie.
Les résultats des mesures peuvent être lus directement sur un oscilloscope: le temps est indiqué sur l'axe horizontal et la vitesse d'exploration est réglée de manière à se trouver en relation directe avec la vitesse de propagation de l'onde, c'est-à-dire avec la distance intercalaire.
Ce mode de lecture est satisfaisant lorsqu'on procède à un nombre limité de mesures, mais il est évi-demment préférable d'enregistrer les résultats sur un graphique. Dans ce cas, les impulsions incidentes et les impulsions réfléchies sont transmises à un convertisseur temps-tension au moyen d'un circuit logique transistorisé. Cet appareil permet un ajustement continu du zéro de sortie pour toute distance intercalaire
37

38 R. DEKNOCK
choisie arbitrairement entre 2 et 4 mm, grâce à quoi on peut obtenir un enregistrement autour d'un axe zéro. En outre, toute variation de 100 jjm de la distance intercalaire fournit a un enregistreur une tension stable de sortie de 1 V. П est facile de mesurer les variations des distances intercalaires avec une précision de 5 /jm. Les mesures ont été faites pour plusieurs éléments combustibles. Les résultats et la reproductibilité sont très satisfaisants.
ИЗМЕРЕНИЯ В О Д Я Н О Г О ЗАЗОРА В ТЕПЛОВЫДЕЛЯЮЩИХ Э Л Е М Е Н Т А Х ДЛЯ М А -ТЕРИАЛОВЕДЧЕСКОГО Р Е А К Т О Р А С ПОМОЩЬЮ УЛЬТРАЗВУКА. Сильные потоки тепло-вых нейтронов, которые обычно возникают в новейших реакторах для испытания материалов, являются подходящим с р е д с т в о м равномерной теплопередачи и надежного отвода тепла, с
помощью к о т о р о г о можно и з б е ж а т ь образования пара в больших о б ъ е м а х . Кроме т о г о , в целях контроля над общим распуханием и поведением реакторного топли-
ва измеряют водяной з а з о р при экспериментах после облучения с отработанными т е п л о в ы -деляющими э л е м е н т а м и .
С этой целью был разработан зонд для измерения 3 - м м водяного зазора тепловыделяю-щего элемента испытательного реактора B R - 2 длиной более 1 м , в основу к о т о р о г о положен принцип ультразвука . При экспериментах после облучения измерительный зонд должен д е й -с т в о в а т ь в тепловыделяющем э л е м е н т е , погруженном в б а с с е й н на глубину не м е н е е 6 м . Зонд может выдержать погружение в воду продолжительный период времени, и он не п о д в е р -г а е т с я воздействию обычных доз г а м м а - о б л у ч е н и я .
Хотя с и с т е м а действует на основе обычного метода отражения импульсов , она п о з в о -ляет разделять испускаемые и отраженные импульсы с помощью 10 Мгц ферроэлектричес -к о г о кристалла, которому свойственно большое рассеяние энергии.
Можно использовать запись показаний осциллоскопа, в котором время регистрируется на горизонтальной о с и , с к о р о с т ь скеннирования подбирается в с о о т в е т с т в и и с о с к о р о с т ь ю распространения волны, т , е . с величиной з а з о р а .
Такая запись показаний является удовлетворительной в отношении ограниченного числа измерений, однако явно целесообразно иметь запись показаний с а м о п и с ц а . В э т о м случае и с п у с к а е м ы е и отраженные импульсы ф о р м и р у ю т с я и п о д а ю т с я в п р е о б р а з о в а т е л ь в р е м я -напряжение с помощью логической схемы с использованием транзистора . С помощью э т о г о прибора можно непрерывно подбирать нулевое значение выхода для любой произвольной в е -личины зазора между 2 и 4 м м , что позволяет использовать нулевой м е т о д записи. Кроме т о г о , п у т е м л ю б о г о ж е л а т е л ь н о г о изменения величины з а з о р а на 100 мк м о ж н о получить у с т о й ч и в о е выходное напряжение 1 вольт для р е г и с т р а т о р а . Можно л е г к о контролировать ' изменение величины зазора с т о ч н о с т ь ю до 5 м к .
Измерено несколько тепловыделяющих э л е м е н т о в . Р е з у л ь т а т ы и в о с п р о и з в о д и м о с т ь являются в е с ь м а удовлетворительными.
MEDICION ULTRASONICA DE LA CAPA DE AGUA EN ELEMENTOS COMBUSTIBLES PARA REACTORES DE ENSAYO DE MATERIALES. Los elevados flujos térmicos que suelen alcanzarse en los recientes reactores de ensayo de materiales, exigen recorridos adecuados para lograr una transmisiún uniforme de calor y una disipación segura del mismo, evitando asf la formación de vapor en la masa.
Además, a fin de controlar el hinchamiento y el comportamiento del combustible en el reactor, también debe medirse la capa de agua en experimentos realizados después de la irradiación, con elementos c o m -bustibles agotados.
A tal efecto se ha diseñado una sonda ultrasónica destinada a medir, en una longitud de 1 m el espesor de 3 mm de agua correspondiente al elemento combustible BR-2. En el caso de los experimentos posteriores a la irradiación, es necesario trabajar con el elemento combustible sumergido en un tanque de agua, a pro-fundidad no menor de 6 m . La sonda puede resistir una prolongada inmersión en agua, y no le afectan las dosis normales de radiación gamma.
Aunque proyectado conforme al método usual de reflexión de impulsos, el sistema permite separar pulsos emitidos y reflejados, usando un cristal ferro-eléctrico de 10 MHz, con elevada disipación inherente de energfa.
Puede usarse un osciioscopio para la lectura, en cuyo caso el tiempo se representa en el eje horizontal, regulándose la velocidad de barrido de manera que sea directamente proporcional a la velocidad de propagación de la onda, es decir, al espesor de la capa de agua.
Este tipo de representación da resultados satisfactorios cuando setrata de un número limitado de medi-ciones, pero sin duda resulta más conveniente el registro gráfico. En este caso, se da a los impulsos emitidos y reflejados la forma deseada y se les inyecta en un convertidor tiempo-tensión con circuitos lógicos tran-sistorizados. El instrumento permite un ajuste continuo del cero para cualquier espesor-arbitrario de la capa

ULTRASONIC WATER-GAP MEASUREMENTS 39
de agua entre 2 y 4 mm, con lo cual posibilita un registro con el cero en el centro de la escala. Además, cualquier intervalo deseado de 100 (jm puede dar una tensión estable de 1 V a la salida para accionar un registrador. Se puede medir fácilmente cualquier variación en el espesor del agua con una precisión de 5 jjm. Se han medido con este método varios elementos combustibles, y los resultados y la reproducibilidad fueron muy satisfactorios.
INTRODUCTION ~
The high thermal fluxes, which are usual in the latest materials testing reactors, impose suitable paths for uniform heat transfer and a reliable heat removal avoiding bulk vapour formation. The heat output of a BR-2 element, consisting of six co-axial cylindrical fuel tubes, 970 mm long, is evacuated by a pressurized water-flow through a gap of about 3 mm be-tween the cylinders. A slight bowing or eccentricity of the cylinders may reduce this gap. Therefore, the radial distances between the successive fuel tubes of a BR-2 element are subjected to a severe inspection technique. Furthermore, to control the over-all swelling and reactor-fuel behaviour, water-gap measurements will also be done in post-irradiation experiments on spent fuel elements. In the latter case, the measuring probe should oper-ate in a fuel element immersed in a water pool at a depth of at least 6 m.
A survey of several gauging systems for water-gap measurement has been given elsewhere [1]. Of the different devices discussed, the ultrasonic one seems the most reliable, especially for post-irradiation measurements.
Fig. l a and l b
The probe assembly

40 R. DEKNOCK
PRINCIPLE OF MEASUREMENT
One of the more common ultrasonic techniques, which is readily adap-table to the inspection of the radial distance between two successive tubes of a BR-2 fuel element, is the pulse-echo method. The probe consists of a piezo-electric plate mounted on a long steel blade acting as the insertion handle and pressed against one of the cylinder walls by springs (Fig. 1).
The plate is energized by the discharge of a capacitor and controlled by firing a silicon controlled rectifier. The resulting ultrasonic energy is directed to the other cylinder wall and the reflected energy received by the plate is re-converted into an electric signal. The significant parameter for distance measurements is the time interval during transmission and reception of the acoustic energy. As the speed of propagation of the wave through the medium involved is constant and accurately known, the time interval is directly proportional to the gap.
Oscilloscope read-out can be used, whereby the time is displayed on the X-axis, the scanning speed being adjusted to bear a direct relation to the velocity of wave propagation, i .e . the gap distance. The emitted and reflected pulses are presented to the Y-plates of the cathode-ray tube. This type of read-out is satisfactory in a restricted number of measurements, but chart recorder read-out is obviously desirable. In this case emitted and reflected pulses are shaped and fed to a time-voltage convertor.
REQUIREMENTS FOR THE PROBE AND THE INSTRUMENTATION
Each piezo-electric material is particularly efficient for the conversion of electrical energy into mechanical energy, and is further efficient for the reverse transformation. For given energizing, transmitting and re-flecting conditions, the output received from crystals of one material rela-tive to another is given by the loop gain. The loop gain determines the in-herent sensitivity of the crystal and also indicates the damping, which may be tolerated before the over-all sensitivity becomes too low. In the prac-ticed case of a 3 -mm gap, reduced by the probe thickness, the choice of a piezo-electric material relative to this loop gain is not critical, since the inverse square reduction of the intensity versus the distance may be neglected. Furthermore, the acoustical impedance of the water medium (1. 5X10⁶ kg/m2s) and the aluminium wall reflector (17X106 kg/m2 s) are sufficiently different to ensure enough reflection.
If a plate of piezo-electric material is shock-excited, the pulses of me-chanical energy leaving the slab consist of a damped wave-train at the na-tural frequency of the slab. To separate the electric pulses from the closely-spaced transmitting and reflecting mechanical wave-trains, the ringingtime must be short, so that the crystal is quiescent when it receives the reflected echo. The ringing time is reduced by increasing the damping of the probe crystal. A greater damping widens the bandwidth. This improves the res-ponse of the crystal to pulses having a fast rise-time. The position of the pulse is therefore accurately defined. Since external loading of the crystal is almost impossible, a crystal with a large capacity for dissipating the vibrational energy is required. This requirement excludes the use of quartz,

ULTRASONIC WATER-GAP MEASUREMENTS 41
since the energy dissipation per cycle is very small. The ferro-electric ceramics have a much larger energy dissipation than quartz.
The energizing pulse circuit should have a very low output-impedance so as to feed a long (at least 10 m) low-impedance coaxial cable. Also, this low output impedance should carry out an electrical damping of the trans-mitted pulse; this also assists in shortening the pulse length.
In the case of irradiated material the ferro-electric material should not be affected by the radiation of spent fuel during post-irradiation mea-surements, and it must withstand prolonged immersion in water without deterioration of its properties.
DESIGN OF PROBE AND INSTRUMENTATION
A plate of lead zirconate, P. 1. 60 ferro-electric ceramic*, is a suitable material for use in the combined transmitter-receiver probe. Some of its properties are given in Table I.
TABLE I
P R O P E R T I E S O F THE P . 1. 60 F E R R O - E L E C T R I C CERAMIC
Density 7. 25 g / cm 3
Dielectric constant К 1200
Curie temperature (Maximum operating temperature)
325°C
Young's modulus 6. 2X10¹⁰ N/cm 2
Poisson's coef f ic ient 0. 3
Velocity of sound 3. 3 x 10³ m/s
Acoustic impedance 23. 9X 10s kgAn2- s
Input impedance/m2 radiation surface 4 2x10⁵ (j MHz
Inherent damping (theoretical) 2*Уо dissipation per cyc le .
The ceramic is not affected by normal irradiation [2] and it withstands prolonged immersion in water without complete encapsulation of the crystal.
A section of the probe assembly is shown in Fig. 2. The crystal has a thickness of 0. 195 mm corresponding to a natural resonance frequency of 10 MHz. It is cemented to a thin base of brass which serves as the earth electrode. The other electrode at the radiation face of the crystal is a rec-tangular (8X2 mm2) nickel foil of 10 д т thickness. Base and crystal are
* M a n u f a c t u r e d by " Q u a r t z et S i l i c e " , Paris.

42 R. DEKNOCK
Fig. 2
Section o f the crystal mounting
• CHARGING SUPPLY VOLTAGE
CHARGING RESISTOR
S .C.R
GATE PULSE IN
С, = 100 pf
T
* PROBE
COAXIAL CABLE Z . =52 Л
Fig .3
Basic pulse c ircuit
mounted on a curved steel blade. A rim of Araldite is provided around the edge of the crystal and the base. Two nipples of Araldite on the crystal shield it against eventual wear during insertion of the probe in the fuel ele-ment. The total thickness is approximately 1. 15 mm so that the initial gap of 3 mm is reduced to 1. 85 mm. Since the velocity of sound in water in 1.49X10³ m / s the maximum time between the transmitted and reflected pulse should be approximately 2 .4 us.
The energy supplied to the crystal is obtained from the discharge of the capacitor Ci (Fig. 3). The discharge is initiated by the firing of a silicon controlled rectifier. (S. C. R. ) The pulses required to open the gate of the

ULTRASONIC WATER-GAP MEASUREMENTS 43
S. C. R. are obtained from an asymmetrical cathode-coupled multivibrator generating square waves at a repetition frequency of 100 kHz. This pulse-repetition rate is high enough to give sufficient discrimination between dif-ferent gap distances when a chart recorder read-out is used. An emitter-follower stage provides the current necessary to drive the gate of the S. C. R.
The mechanical energy generated by the crystal is dependent on the electrical energy supplied to it, i. e. on the capacitance of Ci and on the charging potential of Ci. To obtain short transmission pulses, the time constant of the discharge circuit is low (Rx = 52 Í2 and C-y = 100 pF (Fig. 3). A charging voltage of 300 V is used. Electrical damping of the transmitted pulse is performed by R^ The pulses of mechanical energy from the crystal transducer then consist of a damped wave-train at the natural frequency of the transducer, say 10 MHz at a repetition rate of 100 kHZ. The ultrasonic energy reflected from the wall to the probe is converted into electrical vol-tage pulses having a wave-form similar to the exciting wave-form. These signals are presented directly to the Y-plates of an oscilloscope whose time base is triggered by the starting pulse, the scanning speed being adjusted so as to have a direct relation with the gap distance. As a chart recorder read-out is desired the signal is amplified, shaped and presented to a time-voltage convertor. Figure 4 gives a block diagram of the apparatus.
Fig. 4
Block diagram of the apparatus
Since the exciting pulse is negative, and the acoustic impedance of the aluminium wall is higher than that of the water medium, there is no phase reversal, and the reflected wave-form starts with a negative-going half-cycle (Fig. 5). The amplitude of this first half-cycle is very small in rela-tion to the maximum amplitude, and its position is not well defined. A greater damping would enable a better definition of the wave starting-point.

44 R. DEKNOCK
START EXCITING REFLECTED PULSE PULSE
Fig. 5
Driver and ref lected wave- forms
Therefore, in the practical case the first position half-cycle is taken into account.
PERFORMANCE OF THE PROBE
As the speed of the wave propagation through the medium is constant, the time interval is directly proportional to the gap distance, and the cali-bration curve by oscilloscope read-out over the range of 2. 4 to 3. 4 mm is evidently linear. The discrimination between different gap distances de-pends largely on the horizontal scanning speed of the oscilloscope. Speeds up to 100 mm/jus are easily available and a 5-jjm gap-distance variation is therefore still noticeable.
Theoretical inaccuracy of the gap distance measurement is only due to temperature variations in the water medium. Measurements of the tem-perature dependence of the propagation velocity of sound in water have been made. The apparent distance variation seems to be 5 jum/°C. Errors can also result from non-linearity in scanning speed of the oscilloscope. How-ever, this is not inherent to the measurement principle.
CONCLUSIONS
Preliminary measurements with the actual device are quite satisfactory. The probe, however, requires further development. A thinner crystal with a higher natural frequency results in a shorter length of the transmitting pulse. As a consequence, the pulse-repetition frequency could be raised to obtain a greater oscilloscope or chart-recorder discrimination between several gap-distances. Also a reduced length of the transmitting pulse allows a greater external damping (e. g. by using a lead mounting base), because the total probe thickness can be increased. On the other hand, a thinner crystal is not conducive to facilitating the assembling of the probe. Finally, inaccuracy of the measurement by temperature gradient along the

ULTRASONIC WATER-GAP MEASUREMENTS 45
fuel element could be obviated by a temperature-sensing element with low heat capacity placed close to the crystal.
A C K N O W L E D G E M E N T S
The contributions from colleagues in the Non-Destructive Testing group are gratefully acknowledged. Thanks are due in particular to G. Verstappen. I also wish to thank J. -J. Huet, M. Brabers and P. de Meester for their encouragement.
R E F E R E N C E S
[1] de MEESTER, P., DEKNOCK, R. and VERSTAPPEN, "A Survey of Devices to Measure Fuel Element Coolant Channels", to be published in Materials Evaluation.
L2j LUMB, R. F., "Ultrasonic Wall Thickness Measurement on a Highly Active Process Vessel", Brit. I. NDT. 6. 2 (1964) .
D I S C U S S I O N
D. BALLARD: Your illustrations only show one probe size. Do you not have to use a larger number of probes of various sizes to match the va-rious curvatures of the cylindrical shells?
: P. de MEESTER: The crystal size itself is the same for the different shells, but complete probes exist for each intertube. Actually, the complete apparatus developed is a complex scanning device consisting of 13 different probes, three for each larger intertube and two for the smaller ones. Using a switching disc it is thus possible to measure the complete fuel element in three scans, at 120° to each other.
R. H. McKANE: What is "Araldite1', mentioned in Fig. 2, and is it important?
P. de MEESTER: Araldite is a plastic material, an epoxy resin,which is used as an encircling material for the crystal. With an appropriate cata-lyst it can be cured at room temperature. Araldite is commonly used in ultrasonic transducer techniques as a constituent of backing materials which contain metal powders. It is certainly important for the manufacture of the probe.
P. KNUDSEN: Did you make measurements on irradiated fuel ele-ments? And what was the total gamma dose to which your probes were exposed?
P. de MEESTER: We have not yet performed measurements on ir-radiated BR-2 fuel elements, though some preliminary tests have been per-formed under gamma irradiation conditions. The gamma irradiation fa-cility of BR-2 (G. I. F.) was used with spent fuel elements and probes were exposed to about 107 rad.
J. DORY: At the repetition frequency of 100 kHz were you not bothered by interference between the echoes from successive emissions?
P. de MEESTER: We have had no trouble with such interference be-cause of the strong attenuation of the secondary echoes returning from the opposite wall. The emission itself only lasts for a few oscillations.

46 R. DEKNOCK
J. DORY: What i s the duration of the a c o u s t i c pu lse e m p l o y e d ? P. de MEESTER: About 0. 7 /us. W. FRANCIS: Have you attempted to use this equipment for measuring
deflection and vibration of plates under flowing conditions? I am thinking of hydraulic testing, simulating in-pile conditions.
P. de MEESTER: No, our programme only covers pre-irradiation and post-irradiation measurements under static conditions. The technique you mention is very interesting, and I think it should be tried. However, the discontinuity in water flow, caused by the probe, may present a diffi-culty in this experiment.

NON-DESTRUCTIVE TESTING OF REACTOR-FUEL, TARGET,
AND CONTROL ELEMENTS
R . H . M c K A N E A N D D . L . H O N K O N E N
E N G I N E E R I N G A S S I S T A N C E S E C T I O N , S A V A N N A H R I V E R P L A N T ,
E . I . d u P O N T D E N E M O U R S A N D C O M P A N Y , A I K E N , S . C . ,
U N I T E D S T A T E S O F A M E R I C A
A b s t r a c t — R é s u m é — А н н о т а ц и й — R e s u m e n
NON-DESTRUCTIVE TESTING OF REACTOR-FUEL, TARGET, AND CONTROL ELEMENTS. At the Savannah River Plant (a production facility of the United States Atomic Energy Commission), tuel, target, and control elements are non-destructively tested before and after irradiation in reactors. Design and per-formance of unique instruments - used for measuring physical soundness, nuclear properties, and dimensions -are described.
A nickel thickness gauge, utilizing the Hall effect in a magnetic field, is used to measure the thickness of nickel layers on uncanned uranium cores. A similar instrument is used after cores have been diffusion-bonded to aluminium cladding to determine that each core has a layer of residual nickel, and that the end cap is sufficiently thick.
Ultrasonic instruments are used (1) to measure uranium grain size to determine whether the cores were properly heat-treated, and (2) to detect unbonded areas between cladding and core.
The Nuclear Test Gauge (NTG), a small subcritical assembly of U235-A1 alloy slugs in an H20-moderated lattice, is used to determine the fuel (U23s) or absorber (Li6) content of reactor elements. These determinations, made from changes in neutron multiplication, have a 1-sigma precision of about ± 0.5% for fuel elements containing up to 250 g U a 5 / 3 0 . 5 cm (1 ft), and about ± 1% for target and control elements containing up to 4 g Li6 /30.5 cm (1 ft).
Compared to the more commonly used large.critical test pile, the NTG costs about 1/20 as much; measures fuel or absorber content in about one minute vs. ten minutes; and measures the axial distribution of fuel or absorber which the test pile cannot do.
Irradiated fuel elements are measured under water with (1) differential transformers that can measure diameter and length to an accuracy of ± 0.05 cm (0.002 in), and (2) simple mechanical linkages with dial indicators above water that can measure inside diameter and warp. By keeping the elements submerged in water, personnel are shielded from radiation, and the elements do not undergo the dimensional changes that would occur from self-heating in air.
ESSAIS NON DESTRUCTIFS DES ÉLÉMENTS CÇMBUSTIBLES DE LA CIBLE ET DES ÉLÉMENTS DE COMMANDE. A la centrale de Savannah River (exploitée pour le compte de la Commission de l'énergie atomique des Etats-Unis), le combustible, la cible et les éléments de commande sont soumis à des essais non destructifs avant et après irradiation en pile. Les auteurs décrivent les caractéristiques et les performances d'instruments inédits, utilisés pour mesurer la qualité, les propriétés nucléaires et les dimensions.
Une jauge d'épaisseur du nickel, fondée sur l 'effet Hall dans un champ magnétique, sert à mesurer l'épaisseur de couches de nickel sur des éléments combustibles en uranium sans gainage. Après liaison par diffusion de l'uranium à sa gaine d'aluminium, on a recours à un instrument similaire pour vérifier que chaque élément est revêtu d'une couche de nickel résiduel et que le bouchon de fermeture est suffisamment épais.
Des instruments utilisant les ultrasons servent: a) à mesurer la dimension des grains d'uranium, en vue de déterminer si les éléments combustibles ont subi un traitement thermique approprié; b) à déceler les zones de liaison imparfaite entre la gaine et-l'uranium.
La jauge d'essai des propriétés nucléaires, qui est un petit assemblage sous-critique de barreaux en alliage 235 U-Al dans un réseau ralenti à l'eau légère, est utilisée pour déterminer la teneur des éléments en combustible ( 235 U) ou en absorbeur (6Li). Ces déterminations, faites à partir des variations de la multipli-cation des neutrons, ont une précision 1-sigma d'environ ± 0,5% pour les éléments combustibles contenant
47

48 R. H. McKANE and D. L. HONKONEN
jusqu'à 250 g de 23su par 30,5 cm et d'environ ± 1% pour la cible et les éléments de commande contenant jusqu'à 4 g de 6 Li par 30,5 c m .
Par rapport à la grande pile d'essais critiques plus généralement utilisée, la jauge décrite présente les avantages suivants: elle coûte environ 20 fois moins cher; elle permet de mesurer la teneur en combustible ou en absorbeur en 1 min environ, contre 10 min pour la pile; elle mesure la distribution axiale du c o m -bustible ou de 1*absorbeur, ce que la pile ne peut pas faire.
On mesure, en immersion, les éléments combustibles irradiés avec: a) des transformateurs différentiels qui peuvent mesurer le diamètre et la longueur avec une précision de ± 0 ,05 cm; b) de simples raccords mécaniques, avec des indicateurs au-dessus de la surface de l 'eau, qui peuvent mesurer le diamètre intérieur et la déformation. En maintenant les éléments immergés dans l'eau, on met le personnel à l'abri des rayonne-ments et les éléments ne subissent pas les variations dim ens ion ne lies que créerait 1* auto- échauffement dans l 'air.
Н Е Д Е С Т Р У К Т И В Н О Е ИСПЫТАНИЕ Я Д Е Р Н О Г О ТОПЛИВА, МИШЕНИ И У П Р А В Л Я -ЮЩИХ С Т Е Р Ж Н Е Й . На заводе Саванна-Ривер (предприятие Комиссии по атомной энергии США) топливо, мишень и управляющие стержни испытываются без разрушения до и после о б -лучения в р е а к т о р а х . Описываются конструкции и эксплуатационные качества уникальных приборов , к о т о р ы е и с п о л ь з у ю т с я для измерения физической надежности , ядерных с в о й с т в и р а з м е р о в .
Для измерения толщины слоев никеля на урановых сердечниках без оболочки используют измеритель толщины никелирования, действующий на о с н о в е эффекта Холла в магнитном п о -л е . Аналогичный прибор применяют после диффузионного сцепления стержней с алюмини-евой оболочкой с целью установить наличие слоя о с т а т о ч н о г о никеля на каждом сердечнике, а также толщину нижнего наконечника.
У л ь т р а з в у к о в ы е приборы используют для измерения р а з м е р а урановых зерен , ч т о -бы определить, подвергнуты ли сердечники достаточной термообработке , а также для обнару-жения у ч а с т к о в , не имеющих сцепления между оболочкой и сердечником.
Прибор для б ы с т р о г о измерения реактивности топливных э л е м е н т о в , представляющий с о б о й небольшую подкритическую сборку стержней из сплава уран-235-алюминий в решетке с водным замедлителем, и с п о л ь з у ю т для определения топливного ( уран -235 ) или а б с о р б ц и о н -ного (литий-6) содержания реакторных элементов . Эти определения, сделанные на основе изме-нений в размножении нейтронов, имеют 1 - с и г м а точности , которая составляет приблизитель-но ± 0,5% для тепловыделяющих элементов , содержащих до 250г урана-235 на 1 фут (30 ,5см) , и приблизительно ± 1 % д л я мишени и управляющих с т е р ж н е й , содержащих до 4г л и т и я - 6 на 1 фут ( 3 0 , 5 с м ) .
По сравнению с обычно и с п о л ь з у е м ы м крупным критическим испытательным р е а к т о -р о м прибор для б ы с т р о г о измерения р е а к т и в н о с т и топливных э л е м е н т о в и м е е т следующие п р е и м у щ е с т в а : с т о и т приблизительно в 20 раз дешевле ; и з м е р я е т содержание топлива или поглотителя в течение приблизительно одной минуты в м е с т о 10 минут; измеряет о с е в о е р а с -пределение топлива или поглотителя , ч е г о нельзя сделать с помощью испытательного реак -тора .
Облученные тепловыделяющие элементы измеряются под водой с помощью дифференциаль-ных трансформаторов , способных измерять диаметр и длину с точностью ± 0,05 см (0,002 дюй-ма) , а также с помощью п р о с т о г о механического сцепления с установленными над водой инди-каторами с о шкалой, способными измерять внутренний диаметр и искривление. За счет того , что элементы о с т а ю т с я погруженными в воду, персонал защищен о т радиации, а размеры эле -ментов не подвергаются изменениям, которые произошли бы при самонагревании на воздухе.
ENSAYO NO DESTRUCTIVO DE COMBUSTIBLES, BLANCOS Y ELEMENTOS DE CONTROL PARA REACTORES. En la planta de Savannah River (establecimiento industrial perteneciente a la Comisión de Energía Atómica de los Estados Unidos) los combustibles, blancos y elementos de control se someten a ensayos no destructivos, antes y después de su irradiación en reactores. Se describen en la presente memoria el diseño y rendimiento de algunos aparatos de características especiales, empleados para medir la integridad física, las propiedades nucleares y las dimensiones de dichos elementos.
Para medir el espesor de las capas de níquel aplicadas a barras de uranio, se usa un calibrador basado en el efecto Hall en campos magnéticos. Un instrumento similar se utiliza después que las barras poseen un revestimiento de aluminio aplicado por difusión, a fin de determinar.que cada baria cuenta con una capa de níquel residual y que el casquete extremo tiene espesor suficiente.

REACTOR-FUEL,TARGET, AND CONTROL ELEMENTS 49
Se utilizan instrumentos ultrasónicos: a) para medir el tamaño de grano del uranio y determinar sí las barras han recibido el tratamiento térmico adecuado: b) para detectar zonas en que el revestimiento no está unido a la barra.
El Nuclear Test Gage (NTG) constituye un pequeño montaje subcrftico de barras de aleación 235 u - A l en un reticulado moderado por H¿0; se utiliza para determinar el contenido de combustible ( 235U) o de ab-sorbente (6Li) en los elementos de reactor. Estas determinaciones, basadas en la variación de la multiplicación neutrónica, permiten alcanzar una precisión de aproximadamente ± 0, Ь°1о (1 o) para elementos combustibles que contienen como máximo 250 g de ^ s u por cada 30 ,5 cm (1 pie) de longitud; la precisión es de ± 1% para blancos y elementos de control que contienen como máximo 4 g de «Li por cada 30 ,5 c m (1 pie) de longitud.
Comparado con el montaje crftico de gran tamaño corrientemente usado para ensayos, el NTG presenta las siguientes ventajas: su costo es alrededor de la vigésima parte; permite medir el contenido de combustible absorbente en 1 min, mientras se requieren 10 min con el montaje crftico; y permite medir la distribución axial del combustible o absorbente, lo que escapa a las posibilidades del montaje crftico.
Los elementos combustibles irradiados se miden bajo agua, empleando: a) transformadores diferenciales capaces de medir diámetros y longitudes con precisión del orden de ± 0,05 mm (0, 002 pulg); b) conexiones mecánicas sencillas, con cuadrantes indicadores sobre'el nivel del agua, que permiten medir diámetros internos y alabeo. Manteniendo los elementos sumergidos en agua, se protege al personal contra la radiación y se evitan los cambios dimensionales que se producirían debido al autocalentamiento en el aire.
1. INTRODUCTION
Fuel, target, and control elements used in production reactors at the Savannah River Plant are non-destructively tested before irradiation to avoid failures in the reactors and to assure proper nuclear properties. Fuel ele-ments are measured after irradiation to assess the effects of element-manufacturing and reactor-operation variables on dimensional stability during irradiation.
2. PRE-IRRADIATION TESTING
The general design of metallic uranium fuel elements tested by the equipment to Бе discussed is shown in Fig. 1. The tubular core is plated with nickel, then the aluminium cladding is bonded to the core by the application of heat and pressure, forming U-Ni intermetallic compounds on one side of the nickel layer and Al -Ni compounds on the other. The nickel-plating and bonding processes must be controlled so that a discrete layer of nickel remains between core and cladding. In addition to being tested for the pre-sence of nickel and continuity of bonding, the elements are reactivity-tested before charging to the reactors.
Uranium-aluminium alloy fuel tubes and lithium-aluminium alloy target and control rods are also reactivity-tested before charging to the reactors. A fuel tube is a 16-ft-long, 3-in-diameter №35 -Al tube clad with aluminium. A target or control rod is either a continuous core clad with aluminium or a column of short sections of rod individually clad and contained in an alu-minium tube.
2.1. Nickel gauge
Since the uranium core, aluminium cladding, and intermetallic com-pounds of U-Ni and A l - N i are non-magnetic compared to metallic nickel,

50 R. H. McKANE and D. L. HONKONEN
F i g . l
Uranium fuel element
the nickel plate thickness can be measured using the Hall effect. The Hall effect device,1 a small, flat crystal of indium arsenide, is mounted on a small permanent magnet (Fig. 2). With a constant "control" current through the crystal, a Hall voltage is generated proportional to the magnetic field strength in the crystal, which in these applications is a function of the thick-ness and proximity of the nickel layer.
The inner and outer surfaces of the plated cores are scanned simul-taneously with test equipment arranged as shown in Fig. 3. A Hall device and magnet are mounted in each probe, along with a temperature-sensitive resistor2 to compensate for changes in crystal characteristics caused by temperature changes. To minimize variations in probe-to-core spacing, the contact faces of the probes are machined to the contour of the surfaces being examined and the probes are spring-loaded to maintain contact with the surfaces.
The accuracy and reproducibility of the gauge were determined by sec-tioning the cores through gauged areas and measuring the nickel-plate thick-ness microscopically. Results obtained are shown in Table I.
2. 2. Nickel detector
This instrument is similar to the nickel gauge but is used on clad ele-ments to determine if metallic nickel remains after the bonding process. It will detect a layer as thin as 0.05 mil under a 40-mil-thick aluminium cladding. It is used on a "Go, No-Go" basis; no attempt is made to measure the thickness of the residual layer.
2. 3. End-cladding: thickness gauge
The cladding thickness on the element ends is determined by finding the • intersection of the nickel plate on the outer cylindrical and flat end surfaces
of the core by means of a small, pointed magnet mounted on a pivoted shaft (Fig. 4). As this magnet seeks the relatively thick nickel plate at the inter-
1 "Hall-Рак", F. W. Bell, Inc. , Columbus, Ohio. 2 "Sensitor", Texas Instruments, Inc. , Dallas, Texas.
4'

REACTOR-FUEL,TARGET, AND CONTROL ELEMENTS 51
F i g . 2
N i c k e l t h i c k n e s s g a u g e
F i g . 3
F u e l - e l e m e n t test a r r a n g e m e n t
section, another magnet mounted on the opposite end sweeps across a Hall effect crystal, resulting in a voltage which is an indication of magnet p o -sition (end thickness). The instrument is calibrated by using elements with known cap thicknesses. The element is positioned against the end stop, and

52 R. H. McKANE and D. L. HONKONEN
H A L L E F F E C T C R Y S T A L
N I C K E L P L A T E
« g . 4
E n d - ç a p t h i c k n e s s g a u g e
the output meter is adjusted to indicate end-cladding thickness directly in mils. . By the destructive examination of a series of elements, the accuracy of the gauge was determined to be about ±8.0 mi l* when gauging a cap nomi-nally 150 mil thick.
2. 4. Grain-size tester
Before cladding is applied, the grain size of the uranium cores is d e -termined by measuring the attenuation of ultrasound transmitted through the core , using a test arrangement as shown in Fig. 3. In this application the test is per formed underwater to couple acoustically the probes to the core ; therefore, the probes need not be in contact with the core . This through-transmission method avoids the rigorous spacing and directional problems of refraction techniques.
A ^- in -d iam. lead zirconate-titanate crystal continuously generates a signal of 2000 pulses/s of 5.0-Mc sound which is received by a similar c rys -tal after passing through the core wall. The received signal is amplified, detected, and integrated to produce a direct-current signal inversely p r o -portional to the average size of grains traversed.
The probes traverse longitudinally 1/4 in for each revolution of the core, to that there is a continuous scan of overlapping spiral increments. The time-constant of the integrating circuit is adjusted so that the core is r e -jected if, during any one-third revolution of the core , the average grain size is found to be outside preset l imits. A separate circuit accumulates signals to indicate the average grain size for the entire core .
The electronic circuits are composed completely óf solid-state components; 9 transistors, 17 diodes, and 2 magnetic amplif iers. The pulse de-modulator
1 mil = 0.001 in

REACTOR-FUEL,TARGET, AND CONTROL ELEMENTS 53
circuit, made up of a "Unitunnel" diodea and a resistor, is particularly-simple and reliable and has inherent temperature compensation.
2. 5. Non-bond detector
Aluminium cladding is required to protect the core f rom corros ion by the coolant. Interfaces res ist heat transfer and must be minimized by a sound metallurgical bond between core and cladding.
Unbonded areas are detected by measuring the attenuation of ultrasound. As in the grain-size tester, a through-transmission, hydraulically coupled test arrangement is used (Fig. 3), but in this case the probes are contoured and spring-loaded to maintain contact with the element surfaces because the nickel-detector crystals are mounted in the same probes and the two tests are made simultaneously.
The lead zirconate-titanate crystals emit and rece ive pulses of 1 - M c sound. The crystals are coupled to the water by epoxy resin windows 0.20 in in diam. The test pulses, 30f¿s in duration, are emitted 4000 t imes per second while the probes are translated 0.10 in per revolution as the element rotates at 960 rpm. At a frequency of 1 Mc, variations in uranium grain size have no appreciable effect on sound transmission but mechanical gaps do. The receiver crystal output, 900 mV for a bonded element, is fed to a low-level pulse discriminator which is linear over the range from 100 to 1000 mV. The crystal output signal is reduced anywhere from 5% to nearly 100% by non-bonds, depending on their type and area. For each sound pulse that is below a preset level, the discriminator generates an electrical pulse. These pulses are totalled by an electronic counter. A recorder output is available to "map" unbonded areas if required for special tests.
Since the water-bath temperature varies enough to affect the strength of the transmitting crystal signal, an automatic calibration circuit is provided. When the probes are retracted, a preset percentage of the receiving crystal signal is switched to a servo amplifier that drives a motorized potentiometer to adjust the discriminator to the proper trigger level.
2. 6. Nuclear test gauge (NTG) [1 ]
Before fuel, target and control elements are charged to the reactors , they are tested for reactivity in the NTG (Fig. 5), a l ight-water-moderated subcritical pile of small critical mass (approximately 4 kg U235). The cen -tral lattice tank contains a hexagonal array of 39-in-long tubes, 83 of which contain two U235-A1 slugs (1-in diam. X 12-in long) at the centre with plastic plugs at each end. The tubes extend through the lattice tank for easy access to the fuel slugs. The tank is surrounded by a 2-ft-thick concrete wall, con-taining an ac cess hole at each end of the lattice. For radiation shielding, these access holes contain removable water-f i l led shielding tanks in front of which are placed lead-f i l led loading doors . The 4- in-diam. test hole at the centre of the lattice contains the samples being tested. Adapters are used as required to test various elements.
• H o f f m a n E l e c t r o n i c s C o r p o r a t i o n , El M o n t e , C a l i f o r n i a .
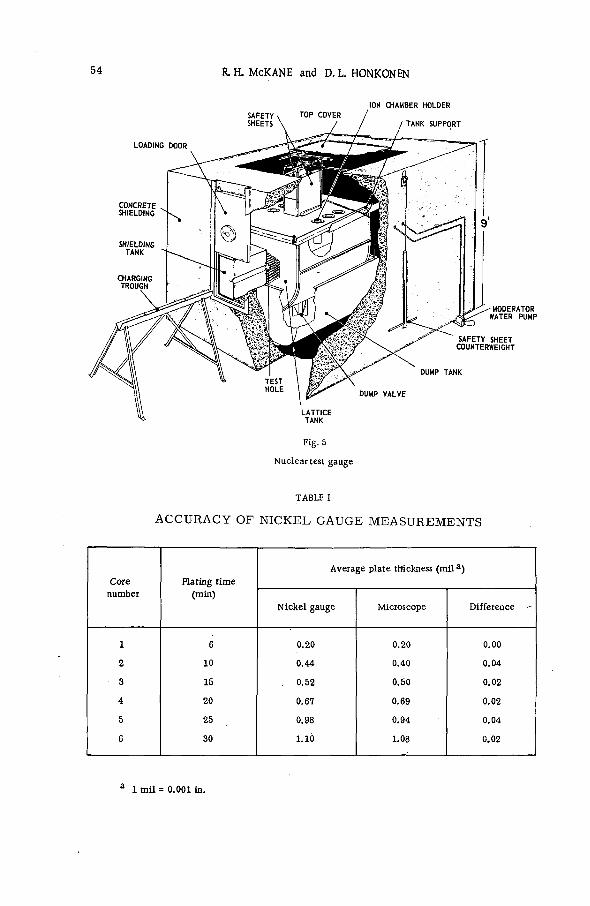
54 R. H. McKANE and D. L. HONKONEN
LOADING DOOR
CONCRETE SHIELDING
SHIELDING TANK
SAFETY \ TOP COVER SHEETS
ION CHAMBER HOLDER
TANK SUPPORT
SAFETY SHEET COUNTERWEIGHT
DUMP TANK
DUMP VALVE
Fig. 5
N u c l e a r test g a u g e
TABLE I
ACCURACY OF NICKEL GAUGE MEASUREMENTS
C o r e M a t i n g t i m e
A v e r a g e p l a t e th ickness ( m i l 3 )
n u m b e r ( m i n ) N i c k e l g a u g e M i c r o s c o p e D i f f e r e n c e
1 6 0 . 2 0 0 . 2 0 0 . 0 0
2 10 0 . 4 4 0 . 4 0 0 . 0 4
3 15 0 . 5 2 0 . 5 0 0 . 0 2
4 20 0 . 6 7 0 . 6 9 0 . 0 2
5 25 0 . 9 8 0 . 9 4 0 . 0 4
6 30 1 . 1 0 1 .08 0 . 0 2
a 1 mi l = 0.001 in.

REACTOR-FUEL,TARGET, AND CONTROL ELEMENTS 55
A 5 -Ci Ra-Be source , centred in one of the tubes, emits 7X lO1 n / s . between about 20 and 100.
The testing sensitivity can also be increased (with no corresponding in-crease in testing time) by increasing the neutron source strength, S, and decreasing the critical mass of the assembly, m c . Both of these parameters were given primary consideration in the design; i . e . , S = 7X 10⁷ n /s and m c
is slightly in excess of 4.0 kg U235 .
2 . 6 . 4 . Testing procedures
An element is tested by measuring the asymptotic chamber current produced when the element is centred in the test hole. This current is c o m -pared with the current produced by a standard having approximately the same dimensions as the test element. Elements more than 2 ft long are tested at different positions along their length to detect composition variations.
Inserting a fuel element into the NTG increases M; inserting a target or control element decreases M. The resulting decrease in testing sens i -tivity for target or control elements is avoided by inserting in the test hole a fuel tube containing U235 as an adapter, and testing the target or control element inside this adapter. One adapter was modified to permit measure-ments of individual 10-in-long Li-Al slugs inside control rods. This adapter contains two cadmium tubes positioned inside the fuel tube to leave a 10-in gap at the centre.
2 . 6 . 5 . Testing characteristics
A wide variety of elements has been successfully tested in the NTG. The characteristics of the NTG for some of these tests are shown in Table П. During the tests of natural uranium slugs and high-purity materials , the testing time was lengthened to increase the prec is ion.
3. POST-IRRADIATION EXAMINATION
Selected irradiated fuel elements are visually examined and measured under 10 ft of water in gauging stations to compare their physical condition before and after irradiation. Volume change is measured by weighing the e lements in a ir and water b e f o r e irradiat ion and in water a f t e rwards .
3.1. Outside -diameter measurement
The fuel element is placed on a tubular stage having the nominal OD and ID dimensions. This stage, which is also a gauging standard, is mounted on a column of three hydraulic cylinders (Fig. 6) which are actuated in suc -cession to measure, in turn, the outside diameter of the standard and that of the element at its centre and 1 in from each end. The measurements are made by two sets of probes mounted on diametrically opposed, hydraulically actuated differential t ransformers , 90° apart. The probes are retracted during any movement of the element to prevent mechanical damage to the

56 R. H. McKANE and D. L. HONKONEN
T A B L E II
NTG TESTING TIME AND PRECISION
N T G m u l t i p l i c a t i o n A v e r a g e
C o m p o s i t i o n b e f o r e a n d a f t e r
i n s e r t i o n
o f e l e m e n t
P r e c i s i o n
( l o )
t i m e p e r
r e a d i n g
( m i n )
U 2 3 5 - A l 10 g u 2 3 5 / f t 1 0 ; 1 2 0 . 0 4 g U 2 3 5 / f t 0 . 9 f u e l t u b e s
2 5 g U 2 3 5 / f t 1 0 ; 18 0 . 1 1 g U 2 3 5 / f t 0 . 8
1 0 0 g U 2 3 5 / f t 1 0 ; 6 0 0 . 1 1 g и 2 3 5 / f t 1 . 4
2 0 0 g U 2 3 5 / f t 7 ; 2 0 0 . 4 g U 2 3 5 / f t -
L i - A l 0 . 6 g L i 6 / f t 2 2 ; 17 0 . 0 0 5 g L i 6 / f t 0 . 5
c o n t r o l rods 2 . 5 g Li 6 / f t 2 2 ; 16 0 . 0 6 2 g L i 6 / f t 0 . 5
N a t u r a l
u r a n i u m e l e m e n t s 0 . 7 1 w t . % U 2 3 5 9 2 ; 5 6 0 . 0 0 0 3 4 w t . T o U 2 3 5 3 . 5
S m a l l
s a m p l e s o f
h i g h - p u r i t y v £ a = 0 . 0 3 t o m a t e r i a l s 0 . 2 2 c m 2 1 5 0 ; 1 5 0 0 . 0 0 7 c m 2 3 . 6
element and to minimize build-up of oxide on the probes. Electrical signals f rom the transformers are fed to a balancing transformer connected to a mechanical counter which displays, on the operating console, the difference between the di'ameter of the element and that of the standard. Periodic checks with dummy elements indicate an accuracy of about ±3 mil. These neutrons are multiplied by the lattice fuel and by any fuel which may be in the test hole. At a neutron multiplication, M, of 100 (an effective multiplication constant, K, of 0.990), the maximum thermal neutron flux in the test hole is 5X 10⁶ n / cm 2 s .
Six ionization chambers, three on each side of the fuel lattice, convert this neutron flux into an electric current of the order of 10"8 A per chamber. Four chambers are connected in parallel and feed either a strip-chart r e -corder or áutomatic print-out equipment. Each of the other two chambers is connected to a separate safety circuit.
2 . 6 . 1 . Nuclear safety
At a preset M of less than 200, each of the safety circuits independently activates two fail-safe shutdown devices. The primary shutdown device is a pair of Boral (a dispersion of boron carbide in aluminium) safety sheets, either of which would stop a reactivity excursion within 0.5 s. Each safety sheet is held above the lattice by an electromagnet and when released falls

REACTOR-FUEL,TARGET, AND CONTROL ELEMENTS 57
F i g . 6
O u t s i d e - d i a m e t e r a n d l e n g t h g a u g e s
by gravity into the lattice. The other shutdown device is an air-operated dump valve which opens an 8-in-diam. hole at the bottom of the lattice tank. The water drops to the lattice midplane 5 s after the preset multiplication is reached.
The NTG lattice contains 166 fuel slugs for testing fuel tubes containing up to 150 g U235 / ft and 154 fuel slugs for testing tubes containing up to 250 g U235 / f t . The shutdown devices might not react fast enough to prevent a serious nuclear accident if a fuel tube containing as much as 200 g LR 0 / f t or more were rapidly inserted into the 166-slug lattice. To avoid such'a nuclear accident, each fuel tube is always mechanically driven into the test hole at a safe speed. Moreover, the drive motor is de-energized when the multiplication reaches a preset level less than 200.
2 .6 .2 . Radiation control
No radiation from the NTG is detected outside the concrete shielding except for a 100 mrem gamma-plus-neutron beam from both ends of the test hole. Since there is virtually no shielding (other than the self-shield of the lattice tank) at the top of the NTG, the gamma-plus-neutron activity at the centre of the top cover is 150 mrem.

58 R. H. McKANE and D. L. HONKONEN
Fuel tubes have a maximum gamma activity of 600 mr at 3 in immediately after discharge from the NTG. In 20 min this activity has decayed to 20 mr at 3 in.
2 . 6 . 3 . Operating characteristics [2]
After a change in neutron multiplication, the neutron flux asymptotically approaches an equilibrium value, which is reached in about 1 min f o r M = 100. For greater values of M, the time required to reach equilibrium increases exponentially. However, testing sensitivity (i. е . , the change in neutron flux for a given change.in the U235 content of a test piece) increases directly as M2 . A reasonable compromise can be obtained by using an M
3. 2. Inside-diameter measurement
The inside diameter is measured with a manually operated gauge (Fig. 7) that is lowered into the bore of the element while it is in the gauging station (Fig. 6). At the lower end of the actuating rod, a conical tip f o r c e s three spring-loaded probes against the surface of the element. The vertical p o -sition of the actuator rod is measured by a dial indicator above water and shows, within ±2 mil, the difference between the inside diameter of the e l e -ment and that of the standard. The lifting and actuating handles are arrangéd to retract the probes before the gauge is moved, to avoid damage to probes and element.
3. 3. Length measurement
Length is measured by a differential transformer in a cup-shaped mount-ing, manually placed over the element in the gauging station (Fig. 6). The cup lip rests on a re ference surface on the guide tube. After calibration with a dummy element, the transformer system displays, on the conso le -mounted counter, the di f ference in length between the dummy and the i r -radiated elements within ±2 mi l .
3. 4. Warp measurement
Warp can be measured by a pantograph arrangement in which a dial in-dicator mounted on an arm above water follows the movement of a similar arm underwater (Fig. 8). As the element - supported between two conical live centres - is rotated, the roller-tipped lower arm follows any diametral deviation of the middle of the element. Accuracy is about ±3 mil. For ribbed elements, the lower arm is lifted over the ribs by a cam and fo l lower on the rotating shaft.
A C K N O W L E D G E M E N T
The information contained in this article was developed during the course of work under Contract A T ( 0 7 - 2 ) - l with the United States Atomic Energy Commiss ion .

REACTOR-FUEL,TARGET, AND CONTROL ELEMENTS 59
F i g . 7
I n s i d e - d i a m e t e r g a u g e
ROTATING AND R E T R A C T I N G
F i g . 8
W a r p g a u g e

60 R. H. McKANE and D. L. HONKONEN
R E F E R E N C E S
[ 1 ] PARKINSON, T . F. e t a l . , U S A E C R&D Report D P - 1 4 7 ( 1 9 5 6 ) . [ 2 ] A X T M A N N , R . C . , DESSAUER, G. and PARKINSON, T . F. , U S A E C R&D Report D P - 4 8 ( 1 9 5 5 ) .
D I S C U S S I O N
R. NEIDER: What advantage does the Hall device have for measuring the Ni thickness over an eddy—current probe or a beta back-scattering device?
R.H. McKANE: Simplicity of the electronic circuitry. R. NEIDER: What accuracy is obtained in measurement of Ni layers
with the Hall device? R.H. McKANE: From examination of metallurgically prepared spec i -
mens, we believe the nickel detector will respond to nickel plate as thin as 0.00005 in. On the same basis, the accuracy of the nickel gauge appears to be ±0.00005 in.
R.S. SHARPE: Are you satisfied that your ultrasonic non-bond tester locates all areas that are significant for reactor service? Are you not con-cerned that very narrow gaps between fuel and cladding are not detected by your ultrasonic method?
R.H. McKANE: This non-bond detector responds only to gross defects. There is a great need for a better test. I had hoped to learn of one at this symposium.
P. de MEESTER: Are the non-bond areas which were not detected really non-bonds, or poor or pseudo-bonds?
R.H. McKANE: Stud weld tests and metallographic examinations in -dicate that the areas were actually not bonded.
P. de MEESTER: Could you tell us what heat fluxes per unit area are involved with these elements? You reported that several elements with non-bond areas were irradiated. What size were these areas? We are working with high-flux fuel elements under heat-flux conditions of 400 to 600 W/cm2
and we impose a maximum non-bond tolerance of a few square millimetres; these figures, however, are based on calculations and no experience supports this specification.
R.H. McKANE: I am afraid your specific question, like the general question what degree of non-bonding is acceptable, is outside the scope of my presentation.
I. PURICA: You mentioned reactivity tests in the NTG sub-critical as -sembly. Are these tests only for the purpose of assessing the reactivity that the different rods can introduce into a reactor, i . e . the total quantity of fuel, or is the purpose to assess the distribution of uranium along the rod?
R.H. McKANE: Normally, successive 2-ft-long sections of elements are tested. This is one of the advantages of the NTG.
I. PURICA: If I understood correctly, you use a standard for each con-centration of uranium. Does the precision given in Table II of your paper refer to a value relative to the standard or to an absolute value in grams of Ц 2 3 5 ?
R.H. McKANE: The precision refers to an absolute value.

REACTOR-FUEL,TARGET, AND CONTROL ELEMENTS 61
A.D. McEACHERN: We have used an identical non-bond test for our NRU.fuel elements, and we found extensive areas of indicated bond on un-plated elements where destructive examination showed very little bond. The most troublesome areas were those where the uranium cores oxidized heavily before cladding so that there was a heavy layer of vjranium oxide between the cladding and the core . We were not able to explain this, but perhaps somebody else can.
Our experience with these unplated areas was bad, and we later switched to nickel-plated elements, which were normally completely bonded. We do not consider the ultrasonic bond test to be capable of protecting the reactor from a poor production process. It has, however, been very useful for control of the production process. We have also always used statistical quality control based on the destructive stud-weld bond test.
R.H. McKANE: The Savannah River Plant also used statistical sampling and destructive metallographic examination for production quality control. As I indicated, the ultrasonic test will find only relatively gross production errors .
D .C . WORLTON: Hanford applies a bond test utilizing a pulse-echo technique, which we believe gives a somewhat better performance than the through transmission method.
R. H. McKANE: Savannah River Plant would be very interested in r e -ceiving data, obtained from testing elements clad with 4team-autoclaved cans.
R .S . SHARPE: Do the infra-red methods now being developed show promise of providing us with a more sensitive technique for non-bond inspection?
R.H. McKANE: I hope so. The method appears to measure directly the variable (heat transfer) in which we are interested. I had hoped that there would be papers on the subject at this symposium.


DOSAGE DU PLUTONIUM PAR DILUTION ISOTOPIQUE A DOUBLE TRACEUR.'
APPLICATION A LA MESURE DES TAUX DE COMBUSTION
J . C H E N O U A R D E T M O N I Q U E L U C A S
C E N T R E D ' É T U D E S N U C L É A I R E S D E S A C L A Y , F R A N C E
A b s t r a c t — R é s u m é — А н н о т а ц и я — R e s u m e n
D E T E R M I N A T I O N OF P L U T O N I U M BY D O U B L E - T R A C E R I S O T O P I C D I L U T I O N : A P P L I C A T I O N T O
BURN-UP MEASUREMENTS. T h e p luton ium c o n t e n t o f irradiated fuels c a n b e d e t e r m i n e d by i s o t o p i c d i lut ion
using a solution conta in ing both u r a n i u m - 2 3 3 and p l u t o n i u m - 2 4 2 . T h e paper describes the measurement method ,
its ca l ibra t i on , the solut ion preparation techniques , and analysis by mass spec t rometry .
T h e c h e m i c a l t r e a t m e n t i n v o l v e s a v a l e n c e c y c l e w h i c h should g i v e h o m o g e n e o u s d is t r ibut ion o f t h e
isotopes in the t r a c e r - s a m p l e mixtures and a suitable U / P u separat ion. T h e presence o f excess uranium great ly
c h a n g e s the p l u t o n i u m r e d o x k i n e t i c s . I m p r o v e m e n t s in o p e r a t i n g t e c h n i q u e h a v e e n a b l e d us to m a k e t h e
v a l e n c e c y c l e e f f e c t i v e , thereby i m p r o v i n g the U / P u separat i on . T h e stabi l i ty o f the t h e r m o - i o n i c e m i s s i o n
o f Pu in r e l a t i o n to t h e a m o u n t o f r e s i d u a l u r a n i u m is thus i m p r o v e d , r e su l t ing in m o r e a c c u r a t e a n a l y s e s .
I so top i c c o n t a m i n a t i o n is e l i m i n a t e d t o the m a x i m u m e x t e n t . T h e tracer is ca l i b ra ted using a standard
so lut ion prepared f r o m w e i g h e d quant i t i es o f p l u t o n i u m and uranium o f known c h e m i c a l pur i ty .
T h e use o f a n e l e c t r o n i c c o m p u t e r shortens the c a l c u l a t i o n s and s i m p l i f i e s t h e c h e c k i n g o f r esu l t s .
T h e u r a n i u m - 2 3 5 burn-up in the fue l is measured by i so top i c analysis o f the m e t a l converted into uranium h e x a f l u o r i d e . T h e p l u t o n i u m c o n t e n t is d e t e r m i n e d with an a c c u r a c y o f 2<7o. T h e U 2 3 5 d e p l e t i o n is measured to within ± 5 x 1 0 - 4 .
D O S A G E DU P L U T O N I U M PAR D I L U T I O N I S O T O P I Q U E A DOUBLE T R A C E U R : A P P L I C A T I O N A LA
MESURE DES T A U X DE C O M B U S T I O N . La teneur en p lu ton ium d ' u n c o m b u s t i b l e i rradié peut ê tre d é t e r m i n é e
par d i lu t i on i s o t o p i q u e à l ' a i d e d ' u n e so lu t i on c o n t e n a n t à la fo is d e l ' u r a n i u m - 2 3 3 et du p l u t o n i u m - 2 4 2 . La
m é t h o d e d e m e s u r e , son é t a l o n n a g e , les t e chn iques d e préparat ion des solutions et l ' a n a l y s e par s p e c t r o m é t r i e
d e masse sont décr i t s .
L e t r a i t e m e n t c h i m i q u e c o m p o r t e un c y c l e d e v a l e n c e q u i d o i t p e r m e t t r e d ' o b t e n i r u n e r é p a r t i t i o n h o m o g è n e des isotopes dans les m é l a n g e s t r a c e u r - é c h a n t i l l o n e t une séparat ion U / P u c o n v e n a b l e . La présence d ' u n e x c è s d 'uran ium m o d i f i e p r o f o n d é m e n t la c i n é t i q u e d ' o x y d o - r é d u c t i o n du p l u t o n i u m . U n e a m é l i o r a t i o n d e la t e c h n i q u e opéra to i re a permis d e rendre e f f i c a c e l e c y c l e d e v a l e n c e e t d ' a m é l i o r e r de c e fait la séparation U / P u ; la s tabi l i té de l ' é m i s s i o n thermo ion ique du P u . l i é e à la quantité d 'uranium résiduel a é té en conséquence a m é l i o r é e , conduisant à des analyses plus préc i ses .
Les c o n t a m i n a t i o n s i sotop iques ont é t é é l i m i n é e s au m a x i m u m . L ' é t a l o n n a g e du traceur se fa i t à l ' a i d e d ' u n e so lut ion é t a l o n p r é p a r é e par p e s é e d e p lu ton ium e t d ' u r a n i u m d e pureté c h i m i q u e c o n n u e .
L 'ut i l i sat ion d ' u n e c a l c u l a t r i c e é l e c t r o n i q u e p e r m e t d ' abréger les c a l c u l s e t d e s i m p l i f i e r la v é r i f i c a t i o n des résultats.
La c o n s o m m a t i o n d e l ' u r a n i u m - 2 3 5 du c o m b u s t i b l e est mesurée par l ' ana lyse isotopique du m é t a l convert i e n h e x a f l u o r u r e d ' u r a n i u m . La teneur e n p l u t o n i u m est d é t e r m i n é e a v e c u n e préc i s i on d e 2°fc. L 'appauvr isse -m e n t en й 5 и est mesuré à ± 5 . 1 0 " 4 .
О П Р Е Д Е Л Е Н И Е П Л У Т О Н И Я М Е Т О Д О М И З О Т О П Н О Г О Р А З Б А В Л Е Н И Я С Д В О Й Н Ы М И Н Д И К А Т О Р О М П Р И И З М Е Р Е Н И И Г Л У Б И Н Ы В Ы Г О Р А Н И Я . С о д е р ж а н и е п л у т о н и я в о б -л у ч е н н о м т о п л и в е м о ж н о у с т а н о в и т ь м е т о д о м ^ з о т о п н о г о р а з б а в л е н и я с п о м о щ ь ю р а с т в о р а , к о т о р ы й о д н о в р е м е н н о с о д е р ж и т у р а н - 2 3 3 и п л у т о н и й - 2 4 2 . П р и в о д и т с я о п и с а н и е м е т о д а и з -м е р е н и я , е г о к а л и б р о в а н и я , т е х н и к и и з г о т о в л е н и я р а с т в о р о в и а н а л и з а с п о м о щ ь ю м а с с -с п е к т р о м е т р и и .
Х и м и ч е с к а я о б р а б о т к а в к л ю ч а е т ц и к л в а л е н т н о с т и , к о т о р ы й п о з в о л я е т п о л у ч и т ь г о м о -г е н н о е р а с п р е д е л е н и е и з о т о п о в в с м е с я х и н д и к а т о р а и о б р а з ц а , а т а к ж е с о о т в е т с т в у ю щ е е р а з д е л е н и е у р а н / п л у т о н и й . Н а л и ч и е и з л и ш к а у р а н а с и л ь н о и з м е н я е т к и н е т и к у о к и с л и т е л ь н о -
63

64 , J. CHENOUARD ET MONIQUE LUCAS
в о с с т а н о в и т е л ь н о г о п р о ц е с с а п л у т о н и я . У с о в е р ш е н с т в о в а н и е п р и м е н я е м о г о м е т о д а п о з в о -л и л о с д е л а т ь ц и к л в а л е н т н о с т и э ф ф е к т и в н ы м и в с в я з и с э т и м у л у ч ш и т ь р а з д е л е н и е у р а н / п л у т о н и й ; у с т о й ч и в о с т ь т е р м о и о н н о г о и з л у ч е н и я п л у т о н и я , с в я з а н н а я с к о л и ч е с т в о м о с т а т о ч -н о г о у р а н а , о к а з а л а с ь в с л е д с т в и е э т о г о л у ч ш е й и д а л а в о з м о ж н о с т ь п р о в о д и т ь б о л е е т о ч н ы е а н а л и з ы .
И з о т о п и ч е с к о е з а г р я з н е н и е б ы л о с в е д е н о к м и н и м у м у . К а л и б р о в а н и е и н д и к а т о р а п р о -и з в о д и л о с ь с п о м о щ ь ю э т а л о н н о г о р а с т в о р а , и з г о т о в л е н н о г о п о м е т о д у в з в е ш и в а н и я п л у т о н и я и у р а н а и з в е с т н о й х и м и ч е с к о й ч и с т о т ы .
П р и м е н е н и е э л е к т р о н н о й в ы ч и с л и т е л ь н о й м а ш и н ы п о з в о л и л о с о к р а т и т ь р а с ч е т ы и у п р о -с т и т ь п р о в е р к у р е з у л ь т а т о в .
В ы г о р а н и е у р а н а - 2 3 5 в т о п л и в е и з м е р я е т с я с п о м о щ ь ю и з о т о п и ч е с к о г о а н а л и з а м е т а л л а , п р е о б р а з о в а н н о г о , в ш е с т и ф т о р и с т ы й у р а н . С о д е р ж а н и е п л у т о н и я о п р е д е л я е т с я с т о ч н о с т ь ю д о 2 7 » . О б е д н е н и е в у р а н е - 2 3 5 и з м е р я е т с я д о t 5 - 1 0 " 4 .
DETERMINACION DE GRADOS DE COMBUSTION POR VALORACION DE PLUTONIO MEDIANTE DILUCION ISOTOPICA CON DOBLE INDICADOR. La c o n c e n t r a c i ó n d e p luton io en un c o m b u s t i b l e i n a d i a d o p u e d e med i r se p o r d i l u c i ó n i s o t ó p i c a c o n a y u d a d e una s o l u c i ó n q u e c o n t e n g a s i m u l t á n e a m e n t e гззи y 242Pu. s e desc r iben e n la presente m e m o r i a e l m é t o d o d e m e d i c i ó n , la c a l i b r a c i ó n , las t é c n i c a s d e preparac i ón d e las so luc i ones y e l análisis m e d i a n t e e s p e c t r o m e t r í a d e masas .
El t r a t a m i e n t o q u í m i c o i n c l u y e un c i c l o d e v a l e n c i a des t inado a asegurar una d i s t r ibuc ión h o m o g é n e a d e l os i s ó t o p o s e n las m e z c l a s i n d i c a d o r - m u e s t r a y u n a s e p a r a c i ó n a d e c u a d a d e U / P u . La p r e s e n c i a d e un e x c e s o de uranio m o d i f i c a pro fundamente la c i n é t i c a de la ox idor reducc i ón de l p lutonio . Un p e r f e c c i o n a m i e n t o d e la t é c n i c a o p e r a t i v a ha p e r m i t i d o tornar e f i c i e n t e e l c i c l o d e v a l e n c i a y m e j o r a r c o n e l l o la s e p a r a c i ó n d e U / P u ; p o r c o n s i g u i e n t e se ha a u m e n t a d o la e s t a b i l i d a d d e l a e m i s i ó n t e r m i ó n i c a d e l Pu , v i n c u l a d a a l a c a n t i d a d d e u r a n i o r e s i d u a l , y e l l o ha c o n d u c i d o a anál i s i s d e m a y o r p r e c i s i ó n .
Las c o n t a m i n a c i o n e s i so tóp i cas se han a m i n o r a d o c o n s i d e r a b l e m e n t e . El ind i cador se ca l i b ra por m e d i o d e una s o l u c i ó n patrón preparada por g r a v i m e t r í a de Pu y U de p u r e z a q u í m i c a c o n o c i d a .
El e m p l e o d e una c a l c u l a d o r a e l e c t r ó n i c a p e r m i t e abrev iar los c á l c u l o s y s i m p l i f i c a r l a v e r i f i c a c i ó n d e l os resu l tados .
El c o n s u m o d e 23s и d e l c o m b u s t i b l e se m i d e p o r anál i s i s i s o t ó p i c o d e l m e t a l t r a n s f o r m a d o e n h e x a -f luorure d e u r a n i o . El c o n t e n i d o d e Pu se d e t e r m i n a c o n una p r e c i s i ó n d e l 2°/o, m ient ras q u e e l e m p o b r e c i -m i e n t o e n 235u se m i d e c o n una p r e c i s i ó n d e ± 5 • 1 0 " 4 .
1. INTRODUCTION
La détermination préc ise du plutonium dans un combustible nucléaire peut être effectuée par dilution isotopique.
Cette méthode présente de l'intérêt par sa sélectivité et sa grande sensi-bilité. Si le combustible est homogène, quelques milligrammes seulement d'échantillon sont nécessa ires pour mesurer des teneurs en plutonium de l ' o rdre de 0, 01 à 0, 5%.
Elle peut servir de référence pour des essais non destructifs pratiqués sur les combustibles nucléaires, notamment la mesure des sections efficaces d'échantillons fissiles par oscillation [1, 2].
2. DOSAGE DU PLUTONIUM PAR DILUTION ISOTOPIQUE
2.1. Principe de la dilution isotopique
Pour doser dans un échantillon un élément possédant plusieurs isotopes, on utilise un « t raceur» , c ' e s t -à -d i re un composé où l 'élément a doser est présent en quantité connue,dans le même état chimique que dans l'échantillon;

DOSAGE DU PLUTONIUM 65
la composition isotopique de l'élément contenu dans le traceur est choisie très différente de celle de l'élément présent dans l'échantillon.
La méthode consiste à mélanger, en proportions connues, l'échantillon et le traceur. Après homogénéisation de la répartition des isotopes, la com-position isotopique du mélange dépendra:
a) des quantités d'élément respectivement présentes dans l'échantillon et le traceur;
b) des proportions dans lesquelles le mélange a été effectué; c) des compositions isotopiques de l'élément dans le traceur et l'échan-
La composition isotopique du mélange sera intermédiaire entre celle de l'échantillon et celle du traceur.
Il est fondamental en dilution isotopique d'obtenir une répartition phy-sicochimique homogène des divers isotopes, quelle que soit leur origine : échantillon ou traceur. Cette condition est réalisée par un traitement chi-mique convenable; si celui-ci n'apporte pas de fractionnement isotopique, il n'est pas indispensable de récupérer intégralement les masses initiales mises en oeuvre, ni de rechercher la pureté absolue de l'élément à doser, ce qui est l'un des intérêts de la méthode.
La masse de l'élément présent dans l'échantillon est aisément calculable. Si P M , PT et PE sont les concentrations isotopiques pondérales* d'un des isotopes de l'élément, respectivement dans le mélange, le traceur et l'échan-tillon, et si m j et mE sont les masses de l 'élément dans le traceur et l'échantillon, la loi des mélanges permet d 'écr i re
т т est connu; Рм, Рт et PE sont déterminés par spectrométrie de masse. Dans le cas où l'échantillon est disponible sous forme de solution, si
Cx et CE sont les concentrations chimiques de l'élément exprimées en masse
* Les rapports i s o t o p i q u e s sont mesurés par s p e c t r o m é t r i e d e m a s s e , c ' e s t - à - d i r e q u e p o u r l ' i s o t o p e к d ' u n é l é m e n t à n i s o topes , on m e s u r e d e s c o u r a n t s d ' i o n s d ' i n t e n s i t é p r o p o r t i o n n e l l e au n o m b r e d ' a t o m e s d e l ' i s o t o p e к présent dans l ' é c h a n t i l l o n .
Par d é f i n i t i o n : la c o n c e n t r a t i o n i s o t o p i q u e a t o m i q u e d e l ' i s o t o p e к est
tillon.
P j j l m j + т т ) =Pf Шх+РЕ 111 E
d'où
(1)
Ak = V V1 1k • k=l
La c o n c e n t r a t i o n i s o t o p i q u e en p o i d s e x p r i m é e e n rapport d e m a s s e est
k=n Р к = М к 1 к / E M k I k ,
k=l
M k é tant la m a s s e a t o m i q u e d e l ' i s o t o p e k.
5

66 J. CHENOUARD ET MONIQUE LUCAS
par unité de volume, V j et VE les volumes mélangés de traceur et de solution échantillon
V J P T - P M VE M ^E
2. 2, Dilution isotopique avec un traceur double [3]
Si l 'on désire seulement déterminer le rapport des masses de deux é lé -ments en solution (exemple : U/Pu) on peut utiliser un traceur double conte-nant les deux éléments correspondants. La dilution isotopique a lieu simul-tanément pour U et pour Pu au moment où l 'on mélange la masse unique du traceur double à l'échantillon. Les compositions isotopiques des deux é lé -ments seront modifiées par le mélange, mais de façon telle que la relation existant entre le rapport des masses des éléments dans l 'échantillon et la composition isotopique des éléments dans le mélange sera indépendante des masses mélangées, ce qui permet d'éviter la mesure précise des quantités d'indicateur et d'échantillon que l 'on utilise.
Le traceur double employé pour déterminer le rapport U/Pu contient: de l'uranium-233, isotope n'existant pas dans l'uranium naturel, qui est obtenu par irradiation neutronique du thorium-232; du plutonium-242 préparé par irradiation prolongée (plusieurs années) de plutonium-239 dans un réacteur à haut flux. Chaque essai nécessite 0, 2 ug de '¿i'¿Pu; 1 mg de 2i'¿Pu est une quantité suffisante pour 5 000 déterminations.
Dans ces conditions, on calcule le rapport U/Pu de l'échantillon au moyen de la formule suivante, dans laquelle les rapports isotopiques sont exprimés en atomes:
/ 238иЛ / 2 3 8 и \ 2 3 8 ц \ / м з д Х V 2 3 3 и У м 1 2 3 3 и Л
239 P u l Д 2 4 2 р и у ) f 2 3 9 Р г Д / 2 3 9 р ц ^ • ( 3 )
V 2 4 2 P > J M ~ V 2 4 2 P U / T
2. 3. Etalonnage du traceur double
Le rapport (233и/242Pu) doit être connu avec précision; il ne peut être mesuré directement par pesée des éléments car on dispose en général de trop faibles quantités de'233U et de 242Pu et leur pureté chimique n'est pas connue.
La détermination précise de ce rapport est obtenue par dilution isotopique à l 'aide d'une solution synthétique dite « é ta lon» préparée par pesée d'uranium naturel et de plutonium de pureté chimique connue.
De la relation (3) on t ire la valeur de ce rapport :
2 3 3 и \ / 2 3 8 П \ \ 2 4 2 P u 7 м V 2 4 2 P U 2 4 2 p u J = ( 2 3 9 p u ] / M 8 U N / 2 3 8 ^
2 3 9 p u \ / 2 3 9 p u
E t a l o n ' " 2 3 3 7 7
(4)
T
5'

DOSAGE DU PLUTONIUM 67
Le rapport du nombre d'atomes d'uranium-238 au nombre d'atomes de plutonium-239 contenus dans l'étalon est calculé à partir des concentrations pondérales [U] et [Pu] à l'aide de la relation
dans laquelle les nombres hors parenthèses sont exprimés en unités de masse. Le rapport (233U/242pu) et les rapports isotopiques relatifs au traceur
étant mesurés lors de l'étalonnage, il résulte que la détermination du rapport U/Pu d'un échantillon inconnu d'après la relation (3) se ramène à la mesure de deux rapports isotopiques dans le mélange échantillon-traceur.
3. APPLICATION DE LA MÉTHODE AUX COMBUSTIBLES NUCLÉAIRES
3.1. Traitement chimique [4, 5, 6, 7]
Le plutonium se trouvant à l'état très dilué dans les combustibles nuclé-aires, les rapports U/Pu fréquemment rencontrés varient entre 200 et 10 000.
La mise en solution par l 'acide nitrique concentré a lieu en boîte à gants ou en boîte à pinces, avec protection de plomb si l 'échantillon contient des produits de f ission.
A partir de telles solutions, on détermine le rapport U/Pu par dilution isotopique, ainsi que la composition isotopique du plutonium présent et éven-tuellement celle de l'uranium.
L'analyse isotopique du plutonium par spectrométrie de masse ne peut être pratiquée avec les appareils de type courant sans une séparation chimi-que préalable de l'uranium. Une séparation U/Pu totale n'est pas indispen-sable, mais la quantité d'uranium résiduel doit être suffisamment faible (rapport U/Pu de l ' o rdre de 25) pour qu'on obtienne une émission thermô-ionique du Pu stable et pour permettre la séparation correcte des masses 239 (Pu) et 238 (U).
Le rôle du traiteme nt chimique est très important, car outre une s é -paration uranium-plutonium convenable, son but est d'obtenir une répartition homogène des isotopes dans les mélanges traceur-échantillon.
La méthode mise au point à cette fin utilise les résines échangeuses d'ions; sur résine anion, les complexes nitriques de Pu™ sont fixés sé lec -tivement et-peuvent ainsi être séparés de l'uranium et des produits de fission; une réduction ultérieure du plutonium à la valence III par le chlorhydrate d"hydroxylamine permet d 'éluer le plutonium de la résine.
Cette technique, dont le schéma fait l'objet du tableau Д, présente deux phases principales:
a) Le cycle de valence destiné à amener la totalité du Pu à la valence IV, afin de permettre sa fixation ultérieure sur résine. Le Pu pouvant exister en solution à des valences supérieures à IV, on pratique d'abord une réduction de tous les ions Pu à la valence III par le chlor-
(5)

68 , J. CHENOUARD ET MONIQUE LUCAS
T A B L E A U I
SCHÉMA DU TRAITEMENT CHIMIQUE
S o l u t i o n d ' a t t a q u e d e l ' é c h a n t i l l o n
(U + Pu+ produits d e f i ss ion)
C y c l e Г R é d u c t i o n Pu en P u I I I
d e j v a l e n c e [_ O x y d a t i o n m é n a g é e P u ' 4 en
P u I V
D i l u t i o n d ' u n e
a l i q u o t e ( 0 , 1 c m 3 )
par N 0 3 H 0 , 2 Ц
pour a n a l y s e i s o t o -
p i q u e U
2 3 3 J . M
T r a c e u r
+ ( 2 3 3 ц + 242 p u )
M i l i e u n i t r ique
+ HC1
C h l o r h y d r a t e h y d r o x y l a m i n e ( é v a p o r a t i o n s )
+ N O 3 H 8 N ( é v a p o r a t i o n s )
HC1 + C h l o r h y d r a t e d ' h y d r o x y l a m i n e
Elution d e Pu
f i x é sur la
rés ine
U + Produits d e
f iss ion é l i m i n é s
par l a v a g e a v e c
N O 3 H 8 N
+ N 0 3 H 8 Ü ( é v a p o r a t i o n s
pour é l i m i n e r HC1)
S o l u t i o n d e Pu pour a n a l y s e
i s o t o p i q u e , c o n c e n t r a t i o n :
2 ( i g / m l I
2 3 9 2 4 2
M
hydrate d'hydroxylamine, puis une réoxydation ménagée à la valence IV par l 'ac ide nitriquej ce cyc le doit assurer l 'homogénéisation isotopique.
b) Le passage sur résine anion comprenant - la fixation du P u w , - le lavage servant à él iminer U et les produits de f ission, - l 'élution du Pu, sous f orme de Pu111 , au moyen d'une solution
réductr ice .

DOSAGE DU PLUTONIUM 69
Les quantités de plutonium utilisées pour cette séparation chimique sont de l ' ordre de 2 • 10"B g par essai, ce qui correspond à des quantités initiales de combustible variant de 0, 5 à 20 mg selon la valeur du rapport U / P u .
3. 2. Mesure dee rapporte ie otopique в par epectrométrie de тавве [8]
Les rapports isotopiques sont mesurés à l 'aide d'un spectromfetre de masse destiné à l 'analyse des sol ides (MS 5 de Assoc iated E lec t r i ca l In -dustries, Grande-Bretagne).
Cet appareil est équipé d'une source à thermoionisation constituée de deux parties distinctes :
- la source d' ions proprements dite, - le pied de source où sont disposés trois filaments; deux d'entre eux
sont utilisés indifféremment pour déposer l'échantillon et sont placés de part et d'autre du filament central où s'effectue l 'ionisation. Ce pied de source, aisément amovible, est changé à chaque analyse. Le filament central ionisant en rhénium est chauffé à 2 500° С environ. La température des filaments latéraux où s 'effectue l 'évaporation varie selon la nature du produit à ana-lyser ; cette technique à filaments multiples permet d 'accroître l 'eff icacité de l ' ionisation en élevant la température sans évaporer trop rapidement l 'échantillon. La quantité de plutonium déposée sur le filament latéral en rhénium est de l ' ordre de 2 • 10 - 8 g.
Les dépôts d'uranium (2 • 10 g) sont effectués sur filaments de tantale ; l'utilisation de tels filaments a permis d 'améliorer la sensibilité et la s ta -bilité de l ' émiss ion thermoionique. Un appareil a été spécialement étudié pour obtenir des dépôts de très faibles quantités d'échantillon, qui soient reproductibles. Des comptages a sont d'ailleurs effectués sur les filaments pour contrôler la quantité de plutonium qui s'y trouve déposée.
La détection des courants d'ions est faite au moyen d'un multiplicateur d'électrons. Apres amplifications, les intensités des courants d'ions relatifs à chaque masse sont enregistrées sur papier. Avec un multiplicateur possé-dant un gain de 5 000, on obtient aisément des courants stables d'intensités comprises entre 10~12 (pic principal) et 10~lfi A.
La tension d 'accé lérat ion des ions restant constante, le balayage du spectre par masses croissantes et décroissantes est obtenu par variation du champ magnétique.
Les mesures sont faites sur une série de dix enregistrements successifs du spectre considéré ; les moyennes des hauteurs de pics relatifs à un i s o -tope sont utilisées pour le calcul.
Une calculatrice électronique (IBM 7094) effectue très rapidement un calcul d ' erreur statistique pour chaque isotope, à partir des écarts entre les valeurs individuelles des hauteurs de pics et la valeur moyenne. Il lui est demandé, de plus, de donner les valeurs individuelles présentant des écarts supérieurs à une valeur donnée; cette valeur est fonction de la p r é -cision relative recherchée. Ceci permet d'attirer l'attention sur une valeur individuelle aberrante et d'en déceler rapidement l'origine : erreur de lecture des hauteurs de pics ou instabilité de l'appareil.

70 , J. CHENOUARD ET MONIQUE LUCAS
4. DISCUSSION DE LA MÉTHODE
4.1. Sélectivité
Le dosage du plutonium par dilution isotopique n'est pas sensible aux interférences d ' ions étrangers, sauf s ' i l s 'agit d 'é léments possédant des isotopes de même masse : américium-241; ou de masse très voisine: urani-um-23b. Le traitement chimique décrit précédemment élimine totalement 2 4 1Am et la majeure partie de 2 3 8 U; la quantité d'uranium résiduel peut, de plus, être diminuée par un préchauffage de la source d' ions dans le s p e c -tromètre, la température de vaporisation de l'uranium étant plus basse que celle du plutonium.
4.2. Précision
Une étude détaillée des diverses causes d 'erreur est nécessaire pour évaluer la précision de la méthode. Il faut distinguer en effet les erreurs statistiques inhérentes à la dilution isotopique, les e r reurs de nature chimique et les erreurs instrumentales introduites par la spectrométr ie de masse .
4 . 2 . 1 . Erreurs statistiques
En différenciant l 'équation générale (1)
d m K _ d m T , J ( P T - P M ) , ¿ ( Р М ~ Р Е ) P T P M P M P E
nous voyons que nous obtenons une précision d'autant meilleure que Px ~Рм et P M - P E sont plus grands, с ' e s t - a - d i r e lorsque P T est t rès différent de PE . Cette condition est réalisée puisque le traceur est constitué d'isotopes de Pu et d'U n'existant pas dans l 'échantillon. D'autre part l'utilisation du traceur double, évitant la mesure préc ise des quantités d'échantillon et de traceur mélangées, élimine les erreurs pouvant résulter d'une telle déter -mination.
Un choix judicieux de ces quantités permet d'ailleurs de réduire au maxi-mum l 'erreur sur m j .
4. 2. 2. Erreurs chimiques
Le traitement chimique ne doit pas introduire d 'erreurs systématiques. Il faut s 'assurer notamment :
- que l'attaque de l 'échantillon est complète et conduit à une solution homogène,
- que le mélange échantillon-traceur est parfaitement réalisé, - que le traitement chimique n'apporte pas de fractionnement isotopique. Une étude particulière du. cyc le de valence a mis en évidence le rô le
de l'uranium sur la cinétique d'oxydo-réduction du plutonium; la technique opératoire a été amél iorée en vue d'obtenir dans le même état de valence Íes isotopes du plutonium provenant de l 'échantillon et du traceur .

DOSAGE DU PLUTONIUM 71
Nous avons véri f ié , d'autre part, que la composition isotopique d'une solution de plutonium n'était pas modifiée par les opérations chimiques utili-sées: cycle de valence - passage sur résine échangeuse d'ions.
La précis ion de la méthode dépend aussi de la pureté de l 'uranium et du plutonium utilisés pour préparer la solution «étalon» servant à étalonner le traceur. L'analyse spectrographique préalable des impuretés contenues dans ces métaux a permis d'admettre une pureté d 'environ 99, 95%. Les pesées ont fait l 'objet de précautions particulières, celle du plutonium étant effectuée en atmosphère inerte. Précision relative : 2 • 10"3 pour la pesée du plutonium,
3 • 10"4 pour la pesée de l'uranium.
4. 2. 3. Erreurs instrumentales
Les effets de mémoire sont très rares dans les spectromètres à source thermoionique. Les phénomènes de discrimination de masse peuvent être évités en étalonnant lê traceur par dilution isótopique ; la solution de référen-ce étant choisie de composition isotopique voisine de celle de la solution à étudier.
Les courants d'ions parasites: fond continu d'hydrocarbures; impuretés contenues dans les filaments etc. sont considérablement réduits par un pré -chauffage des filaments. L'emploi d'un multiplicateur d'électrons introduit toutefois une correction de bruit statistique qui peut être cause d'une légère erreur (2%o environ).
En résumé, avec les spectromètres de masse de ce type, nous obtenons une précis ion relative de 0, 5 à 1% sur la mesure d'un rapport isotopique. L'expérience montre qu'en analyses de routine, la détermination de la teneur en plutonium d'un combustible, qui résulte d'un ensemble de mesures, est connue avec une précision de 2%.
4.3. Sensibilité
La grande sensibilité de la méthode permet d 'opérer sur quelques m i l -l igrammes seulement de combustible, donc de travai l ler avec un niveau d'activité y faible qui n'impose pas de protection de plomb. Le traitement chimique des solutions et la préparation des dépôts sont effectués en boîte à gants. La fixation du pied de source dans le spectromètre se fait dans une petite boîte à gants qui équipe la partie supérieure de l 'appareil.
4.4. Reproductibilité
Lors d'analyses de série, la manipulation en boîte à gants de nombreuses solutions tres diluées, mais de composition isotopique différente, risque d 'amener rapidement des contaminations isotopiques qui nuisent à la r e -productibilité des résultats.
La nature de ces pollutions peut être variée : origine atmosphérique, contaminations dues aux réactifs ou a dés manipulations défectueuses. Nous nous sommes e f f o r cés d 'y remédier par un mode opératoire rationnel et l ' emplo i d'un matériel spécialement étudié.

72 , J. CHENOUARD ET MONIQUE LUCAS
Les évaporations sont effectuées de façon a éviter la présence de vapeurs sa-turantes à l ' intérieur des boîtes a gants. Le matériel qui ne peut être r e -nouvelé à chaque opération est soigneusement nettoyé à chaque changement d'échantillons.
5. RÉSULTATS
5 .1. Etalonnage du traceur
Nous avons, à titre indicatif, groupé dans le tableau II les résultats des diverses déterminations entreprises pour étalonner le traceur.
T A B L E A U II
QUANTITÉ PRÉSENTE DANS LA SOLUTION (ATOMES %) a ) S o l u t i o n é t a l o n
' U r a n i u m 1 8 6 , 8 ± 0 , 0 5 g / 1
C o m p o s i t i o n c h i m i q u e
P l u t o n i u m 1 0 2 ± 0 , 2 m g / 1
I s o t o p e 239 p u 240 p u 241 p u 242 P u
Q u a n t i t é
p r é s e n t e
d a n s l a 9 7 , 1 9 ± 0 , 0 5 2 , 6 8 ± 0 , 0 2 0 , 1 3 ± 0 , 0 0 5
s o l u t i o n
I s o t o p e 2 3 4 U 235 y 238 U
Q u a n t i t é
p r é s e n t e 0 , 0 0 5 5 ± 0 , 0 0 0 1 0 , 7 2 0 ± 0 , 0 0 5 9 9 , 2 8 ± 0 , 0 1
s o l u t i o n
b ) T r a c e u r
Г U r a n i u m & 5 g / l
C o m p o s i t i o n c h i m i q u e a p p r o x i m a t i v e л
V. P l u t o n i u m 1 m g / 1
I s o t o p e 239 p u 240 p u 241 p u 242 P u
Q u a n t i t é
p r é s e n t e 1 , 3 1 ± 0 , 0 1 6 , 5 5 ± 0 , 0 6 4 , 0 3 ± 0 , 0 4 8 8 , 1 ± 0 , 1
d a n s l a 1 , 3 1 ± 0 , 0 1 6 , 5 5 ± 0 , 0 6 4 , 0 3 ± 0 , 0 4
s o l u t i o n
I s o t o p e 2 3 3 и 234 и 235 и 238 y
Q u a n t i t é
p r é s e n t é 9 9 , 5 4 ± 0 , 0 1 0 , 4 2 0 ± 0 , 0 0 5 - 0 , 0 4 ± 0 , 0 0 5
d a n s l a 9 9 , 5 4 ± 0 , 0 1 0 , 4 2 0 ± 0 , 0 0 5
s o l u t i o n

DOSAGE DU PLUTONIUM 73
Les analyses isotopiques des mélanges ef fectués à partir de 0, 2 ml de traceur et de 0, 02 ml de solution étalon ont donné les valeurs figurant au tableau III; le rapport R a été calculé à partir des relations (4) et (5).
• T A B L E A U III
ANALYSE ISOTOPIQUE DES MÉLANGES
( 2 3 8 U / 2 3 3 U ) M ( 239 p u / 2 4 2 p u ) M r = ( 2 3 3 U / Z 4 2 P u ) t
I 3 , 5 4 g ± 0 , 0 2 9 , 6 1 ± 0 , 0 9 5 0 8 0
II 3 , 5 5 ± 0 , 0 2 * 9 , 6 1 ± 0 , 0 9 5 0 7 3
9 , 6 I 5 ± 0 , 0 9 5 0 7 6
III 3 , 5 2 5 ± 0 . 0 2 9 , 5 4 5 ± 0 . 0 9 5 0 7 4
I V 3 , 3 8 ± 0 , 0 2 ' 9 , 2 2 è 0 , 0 9 5 1 1 2
-1 9 , 0 8 ± 0 , 0 9 5 0 3 5
. 9 , 1 1 ± 0 , 0 9 5 0 5 0
V a l e u r m o y e n n e d e R : x = 5 0 7 2
Le calcul statistique montre que, pour une probabilité de 95%, la valeur moyenne vraie est comprise entre les l imites ï ± 25, ce qui donne une préc is ion relative de 0, 5%.
5. 2. Echanges analytiques entre le CEA et l'UKAEA
Quatre échantillons de solutions obtenues à partir d'alliage uranium-plutonium ont été analysés simultanément à Windscale (UKAEA) et à Saclay (CEA) par la méthode de dilution isotopique. Le tableau IV donne, pour chaque échantillon, les résultats de chacune des mesures indépendantes du rapport Pu/U, la moyenne de ces mesures et l 'écart relatif entre les moyen-nes de l'UKAEA et du CEA.
On peut noter de part et d'autre la faible dispersion (1% au maximum) des mesures indépendantes sur un même échantillon et surtout l 'excellent accord entre les résultats des deux laboratoires.
6. CONCLUSION
La méthode décrite procure les éléments nécessaires au calcul du taux de combustion d'un réacteur de puissance.
Sur un même échantillon de combustible, elle rend possible la déter -mination de
- la quantité totale de plutonium f o r m é au c o u r s de l ' i r rad ia t i on , - la compos i t ion isotopique de ce plutonium, - la composition isotopique de l 'uránium permettant de connaître la
quantité de 235u détruit pendant la f iss ion.

74 , J. CHENOUARD ET MONIQUE LUCAS
T A B L E A U IV
ÉCHANGES CEA - U K A E A
E c h a n t i l l o n 7 1 . 0 5 . 0 6 . O P / 1 2 2 . 3 5 . 0 8 . O P / 5 FE1 ' F E I I
103 • P u / U 0 , 4 1 5 3 , 4 0 2 , 4 7 6 5 , 0 7
( p o i d s ) 0 , 4 2 1 3 , 3 9 5 2 , 5 0 5 . 1 3 3
C E A 0 , 4 1 8 5
0, 4 1 5
3 , 4 0 5 2 , 4 7 5 , 1 3 2
m o y e n n e 0 , 4 1 7 4 3 , 4 0 2 , 4 8 2 5 . 1 1 2
103 . P u / u 0 , 4 2 1 7 3 , 3 9 2 2 , 4 7 0 5 , 1 3 5
( p o i d s ) 0 , 4 1 9 g 3 , 3 8 ц 2 , 5 0 4 5 . 1 2 6
U K A E A
m o y e n n e 0 , 4 2 0 g 3 , 3 8 7 2 , 4 8 7 5, 1 3 1
U K A E A
C E A
C7°)
+ 0 , 8 - 0 , 4 + 0 , 2 + 0 , 4
R É F É R E N C E S
[ 1 ] T R E T I A K O F F , О . , Phys ique d e s c o m b u s t i b l e s i r rad iés , A c t e s 3 e C o n f . int . u t i l . EAFP, G e n è v e ( 1 9 6 4 ) P / 7 7 .
[ 2 ] V I D A L , R . , TRETIAKOFF, О . et ROBIN, M . , « Mesure des s e c t i o n s e f f i c a c e s e f f e c t i v e s d ' é c h a n t i l l o n s fissiles par une m é t h o d e d ' o s c i l l a t i o n dans les assemblages c r i t i q u e s » , Exponential and Cr i t i ca l Experiments III A1EA,Vienne (1964) 141.
[ 3 ] C H E N O U A R D , I . e t L U C A S , M . , D o s a g e d u p l u t o n i u m par d i l u t i o n i s o t o p i q u e dans l e s c o m b u s t i b l e s i rradiés , Rapports C E A R - 2 5 6 3 - R - 2 5 6 4 ( 1 9 6 4 ) .
[ 4 ] A I K I N , A . M . , A n Ion E x c h a n g e Process f o r t h e R e c o v e r y o f Pu f r o m Irradiated Fuels , S e c o n d N u c l e a r E n g i n e e r i n g and S c i e n c e C o n f e r e n c e , P h i l a d e l p h i e ( 1 9 5 7 ) .
[5] WEBSTER, R. K . , SMALES. A. A . , DANCE, D. F. and SLEE, L .J . , AERE R 3327-R3378 (1960). [ 6 ] T h e D e t e r m i n a t i o n o f the P l u t o n i u m / U r a n i u m Rat io on the Feed So lu t i on o f the W i n d s c a l e Pr imary S e p a -
rat ion Plant ( 1 9 6 2 ) .
[ 7 ] PREVOT, I . , CORPEL, J. and REGÑAUT, P . , Final T r e a t m e n t o f P luton ium at the End o f the F o n t e n a y -a u x - R o s e s Pi lo t Plant, Proc . 2nd UN Int. C o n f . PUAE 17 ( 1 9 5 8 ) 9 6 - 1 0 6 .
[ 8 ] JONES, R . J . , S e l e c t e d M e a s u r e m e n t M e t h o d s f o r P l u t o n i u m and U r a n i u m in t h e N u c l e a r F u e l C y c l e , T I D - 7 0 2 9 - U S A E C ( 1 9 6 3 ) .
\

QUELQUES MÉTHODES D'ESSAIS NON DESTRUCTIFS APPLICABLES AUX MATÉRIAUX FRITTÉS
E L E N A L Â B U J C Â , I . M I R I O N , N . A N D R E E S C U ,
M . A L E C U E T I . B Î S C O V E A N U
I N S T I T U T D E P H Y S I Q U E A T O M I Q U E , B U C A R E S T , R O U M A N I E
A b s t r a c t — R é s u m é — А н н о т а ц и я — R e s u m e n
SOME N O N - D E S T R U C T I V E T E S T I N G M E T H O D S APPLICABLE T O SINTERED M A T E R I A L S . Bear ing in m i n d the s p e c i f i c granular structure o f s intered m a t e r i a l s p r o d u c e d f r o m p o w d e r s , w h o s e c o m p a c t i o n p r o c e s s is l inked with the sintering t r e a t m e n t , w e h a v e e x p e r i m e n t e d with methods o f c h e c k i n g the d e g r e e o f sintering and cer ta in other propert ies . T h e n o n - d e s t r u c t i v e methods used i n c l u d e :
( 1 ) Examinat ion o f the crysta l l ine structure o f sol id sinters, using meta l l ography and e l e c t r o n m i c r o s c o p y . T h e s e m e t h o d s show the h o m o g e n e i t y o f the structure, the grain s i z e and o r i e n t a t i o n , the presence o f various flaws such as inc lus ions and pores , and the a c t u a l course o f the s intering process , i n c l u d i n g crysta l f o r m a t i o n , grain g rowth , e t c . In c e r t a i n cases the m i c r o s c o p i c e x a m i n a t i o n c a n b e c o m b i n e d with m i c r o - h a r d n e s s tests. Th is e x a m i n a t i o n o f the m i c r o c r y s t a l l i n e structure is o n e o f the p r i n c i p a l m e t h o d s o f c h e c k i n g the q u a l i t y o f s intered m a t e r i a l s , and is i r r e p l a c e a b l e b y any o ther m e t h o d .
( 2 ) T h e d e g r e e o f c o m p a c t i o n , w h i c h is the m a i n fac tor in determining the qual i ty o f sintered mater ia ls , c a n a lso b e c h e c k e d b y m e a s u r i n g c e r t a i n proper t i e s such as e l e c t r i c a l and t h e r m a l c o n d u c t i v i t y in r e l a t i o n t o d e n s i t y , s i n c e f o r s intered m a t e r i a l s c o n d u c t i v i t y is d i r e c t l y p r o p o r t i o n a l to the d e g r e e o f s in ter ing . W e h a v e a lso tested and f ound s a t i s f a c t o r y a m e t h o d f o r c h e c k i n g p o r o s i t y , and h a v e o b t a i n e d interest ing e x -p e r i m e n t a l d a t a , e s p e c i a l l y o n f r e e p o r o s i t y , w h i c h is s u s c e p t i b l e t o g a s e o u s i n c l u s i o n s .
T h e p a p e r g i v e s e x p e r i m e n t a l data o n t h e a p p l i c a t i o n o f these m e t h o d s t o c e r t a i n s intered m a t e r i a l s
o f i m p o r t a n c e in n u c l e a r t e c h n o l o g y .
QUELQUES M É T H O D E S D'ESSAIS N O N DESTRUCTIFS APPLICABLES A U X M A T É R I A U X F R I T T É S . En tenant c o m p t e d e la structure s p é c i f i q u e granula i re des m a t é r i a u x fr i t tés , é l a b o r é s à part ir de poudres , pour lesquels l e procès de conso l idat ion é v o l u e en f o n c t i o n du tra i tement de fr i t tage , on a expér imenté des méthodes d e c o n t r ô l e du d e g r é d e f r i t tage et de q u e l q u e s propr ié tés . P a r m i les m é t h o d e s non destruct ives ut i l i sées , les auteurs c i t e n t les suivantes :
1 . E x a m e n d e l a structure c r i s t a l l i n e des c o r p s s o l i d e s f r i t tés , à l *a ide d e la m é t a l l o g r a p h i e e t d e l a m i c r o s c o p i e é l e c t r o n i q u e . C e s m é t h o d e s m e t t e n t en é v i d e n c e l ' h o m o g é n é i t é d e la structure, les d i m e n s i o n s e t l ' o r i e n t a t i o n des grains , la p r é s e n c e d e défauts divers ( i n c l u s i o n s , pores ) et l ' é v o l u t i o n m ê m e du processus d e f r i t t a g e , y c o m p r i s la f o r m a t i o n des c r i s t a u x , la c r o i s s a n c e g r a n u l a i r e , e t c . Dans q u e l q u e s c a s , o n p e u t c o m b i n e r l ' e x a m e n m i c r o s c o p i q u e a des essais de m i c r o d u r e t é . C e t e x a m e n d e la structure m i c r o c r i s t a l l i n e représente l ' u n e des m é t h o d e s pr inc ipa les d e c o n t r ô l e qua l i ta t i f des matér iaux frittés, et ne peut être r e m p l a c é par aucun autre m o y e n d ' inves t i ga t i on .
2 . C o n t r ô l e du d e g r é d e c o n s o l i d a t i o n , qu i d é t e r m i n e e s s e n t i e l l e m e n t la q u a l i t é des m a t é r i a u x fr ittés . C e c o n t r ô l e est e f f e c t u é par la mesure d e q u e l q u e s propr ié tés , t e l l es q u e l a c o n d u c t i b i l i t é é l e c t r i q u e e t ther -m i q u e , en cor ré la t i on a v e c la dens i té , é tant donné q u e la c o n d u c t i b i l i t é des matér iaux frittés est d i r e c t e m e n t p o r p o r t i o n n e l l e au d e g r é d e f r i t t a g e . On a essayé aussi une m é t h o d e a d é q u a t e d e c o n t r ô l e d e la poros i t é : o n a o b t e n u des d o n n é e s e x p é r i m e n t a l e s intéressantes , surtout au p o i n t d e v u e d e la poros i t é l i b r e , l a q u e l l e est s u s c e p t i b l e aux inc lus ions g a z e u s e s .
Le m é m o i r e c o n t i e n t des données e x p é r i m e n t a l e s c o n c e r n a n t l ' a p p l i c a t i o n d e c e s m é t h o d e s d e c o n t r ô l e à que lques m a t é r i a u x frittés intéressants pour la t e c h n o l o g i e n u c l é a i r e .
Н Е К О Т О Р Ы Е М Е Т О Д Ы Н Е Д Е С Т Р У К Т И В Н Ы Х И С П Ы Т А Н И И , П Р И М Е Н И М Ы Е К С П Е -Ч Е Н Н Ы М М А Т Е Р И А Л А М . С у ч е т о м с п е ц и ф и ч н о й з е р н и с т о й с т р у к т у р ы с п е ч е н н ы х м а т е р и а -л о в , р а з р а б о т а н н ы х н а о с н о в е п о р о ш к о в , д л я к о т о р ы х п р о ц е с с у п л о т н е н и я з а в и с и т о т с п е к а -н и я , и с п о л ь з о в а л и с ь м е т о д ы к о н т р о л я з а с т е п е н ь ю с п е к а н и я и з а н е к о т о р ы м и с в о й с т в а м и . И с п о л ь з о в а л и с ь с л е д у ю щ и е м е т о д ы б е з р а з р у ш е н и я :
75
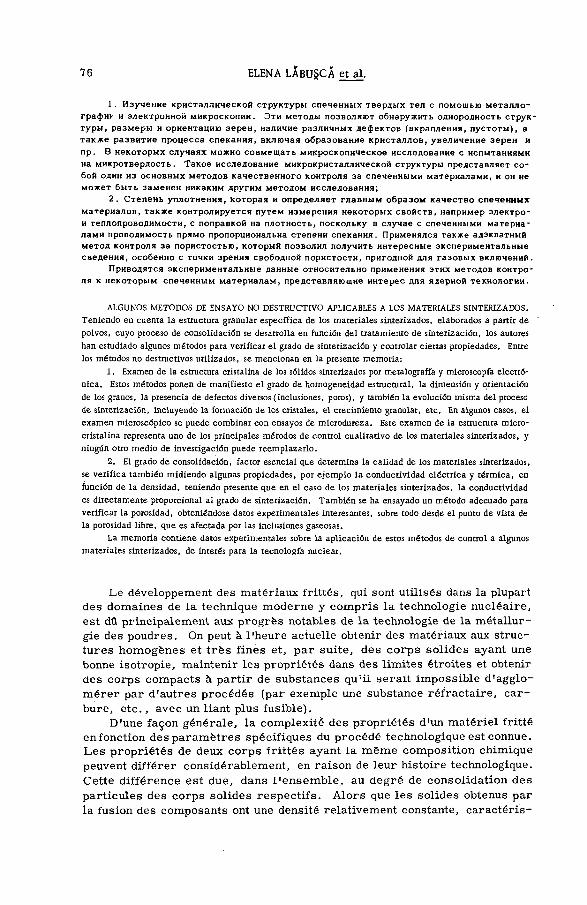
76 ELENA LÁBUgCÁ et al.
1 . И з у ч е н и е к р и с т а л л и ч е с к о й с т р у к т у р ы с п е ч е н н ы х т в е р д ы х т е л с п о м о щ ь ю м е т а л л о -г р а ф и и и э л е к т р о н н о й м и к р о с к о п и и . Э т и м е т о д ы п о з в о л я ю т о б н а р у ж и т ь о д н о р о д н о с т ь с т р у к -т у р ы , р а з м е р ы и о р и е н т а ц и ю з е р е н , н а л и ч и е р а з л и ч н ы х д е ф е к т о в ( в к р а п л е н и я , п у с т о т ы ) , а т а к ж е р а з в и т и е п р о ц е с с а с п е к а н и я , в к л ю ч а я о б р а з о в а н и е к р и с т а л л о в , у в е л и ч е н и е з е р е н и п р . В н е к о т о р ы х с л у ч а я х м о ж н о с о в м е щ а т ь м и к р о с к о п и ч е с к о е и с с л е д о в а н и е с и с п ы т а н и я м и на м и к р о т в е р д о с т ь . Т а к о е и с с л е д о в а н и е м и к р о к р и с т а л л и ч е с к о й с т р у к т у р ы п р е д с т а в л я е т с о -б о й о д и н и з о с н о в н ы х м е т о д о в к а ч е с т в е н н о г о к о н т р о л я з а с п е ч е н н ы м и м а т е р и а л а м и , и о н н е м о ж е т б ы т ь з а м е н е н н и к а к и м д р у г и м м е т о д о м и с с л е д о в а н и я ;
2 . С т е п е н ь у п л о т н е н и я , к о т о р а я и о п р е д е л я е т г л а в н ы м о б р а з о м к а ч е с т в о с п е ч е н н ы х м а т е р и а л о в , т а к ж е к о н т р о л и р у е т с я п у т е м и з м е р е н и я н е к о т о р ы х с в о й с т в , н а п р и м е р э л е к т р о -и т е п л о п р о в о д и м о с т и , с п о п р а в к о й на п л о т н о с т ь , п о с к о л ь к у в с л у ч а е с с п е ч е н н ы м и м а т е р и а -л а м и п р о в о д и м о с т ь п р я м о п р о п о р ц и о н а л ь н а с т е п е н и с п е к а н и я . П р и м е н я л с я т а к ж е а д э к в а т н ы й м е т о д к о н т р о л я з а п о р и с т о с т ь ю , к о т о р ы й п о з в о л и л п о л у ч и т ь и н т е р е с н ы е э к с п е р и м е н т а л ь н ы е с в е д е н и я , о с о б е н н о с т о ч к и з р е н и я с в о б о д н о й п о р и с т о с т и , п р и г о д н о й д л я г а з о в ы х в к л ю ч е н и й .
П р и в о д я т с я э к с п е р и м е н т а л ь н ы е д а н н ы е о т н о с и т е л ь н о п р и м е н е н и я э т и х м е т о д о в к о н т р о -л я к н е к о т о р ы м с п е ч е н н ы м м а т е р и а л а м , п р е д с т а в л я ю щ и е и н т е р е с д л я я д е р н о й т е х н о л о г и и .
ALGUNOS M E T O D O S DE ENSAYO NO DESTRUCTIVO APLICABLES A LOS MATERIALES SINTERIZADOS.
T e n i e n d o e n c u e n t a la estructura granular e s p e c í f i c a d e los m a t e r i a l e s s i n t e t i z a d o s , e l a b o r a d o s a part ir d e
p o l v o s , c u y o p r o c e s o d e c o n s o l i d a c i ó n se desarro l la e n f u n c i ó n d e l t r a t a m i e n t o d e s i n t e r i z a c i ó n , los autores
han es tud iado a lgunos m é t o d o s para v e r i f i c a r e l g r a d o d e s i n t e r i z a c i ó n y contro lar c iertas p r o p i e d a d e s . Entre
los m é t o d o s n o destruct ivos u t i l i z a d o s , se m e n c i o n a n en la presente m e m o r i a :
1 . Examen d e la estructura cristal ina de los só l idos s interizados por m e t a l o g r a f í a y m i c r o s c o p í a e l e c t r ó -
n i c a . Estos m é t o d o s p o n e n de m a n i f i e s t o e l g rado de h o m o g e n e i d a d estructural , la d i m e n s i ó n y o r i e n t a c i ó n
de los granos , la presenc ia d e d e f e c t o s diversos ( in c lus i ones , poros ) , y también la e v o l u c i ó n m i s m a de l proceso
d e s i n t e i i z a c i ó n , i n c l u y e n d o la f o r m a c i ó n d e los cr istales , e l c r e c i m i e n t o granular, e t c . En algunos casos , e l
e x a m e n m i c r o s c ó p i c o se p u e d e c o m b i n a r c o n ensayos de m i c r o d u r e z a . Este e x a m e n d e la estructura m i c r o -
c r i s ta l ina representa u n o d e los p r i n c i p a l e s m é t o d o s d e c o n t r o l c u a l i t a t i v o d e los m a t e r i a l e s s i n t e r i z a d o s , y
n ingún o t ro m e d i o d e i n v e s t i g a c i ó n p u e d e r e e m p l a z a r l o .
2 . El g r a d o d e c o n s o l i d a c i ó n , f a c to r e s e n c i a l q u e d e t e r m i n a la c a l i d a d d e los m a t e r i a l e s s in ter i zados ,
se v e r i f i c a t a m b i é n m i d i e n d o a lgunas p r o p i e d a d e s , p o r e j e m p l o l a c o n d u c t i v i d a d e l é c t r i c a y t é r m i c a , e n
f u n c i ó n d e l a d e n s i d a d , t e n i e n d o p r e s e n t e q u e e n e l c a s o d e l os m a t e r i a l e s s i n t e r i z a d o s , l a c o n d u c t i v i d a d
es d i r e c t a m e n t e p r o p o r c i o n a l a l g rado d e s i n t e r i z a c i ó n . T a m b i é n se ha e n s a y a d o un m é t o d o a d e c u a d o para
v e r i f i c a r la p o r o s i d a d , o b t e n i é n d o s e datos e x p e r i m e n t a l e s interesantes , sobre t o d o desde e l punto d e vista de
la poros idad l i b r e , q u e es a f e c t a d a por las inc lus i ones gaseosas .
La m e m o r i a c o n t i e n e datos e x p e r i m e n t a l e s sobre la a p l i c a c i ó n d e estos m é t o d o s d e c o n t r o l a a lgunos
m a t e r i a l e s s i n t e r i z a d o s , d e interés para la t e c n o l o g í a n u c l e a r .
Le développement des matériaux frittés, qui sont utilisés dans la plupart des domaines de la technique moderne y compris la technologie nucléaire, est dû principalement aux progrès notables de la technologie de la métallur-gie des poudres. On peut à l'heure actuelle obtenir des matériaux aux struc-tures homogènes et très fines et, par suite, des corps solides ayant une bonne isotropie, maintenir les propriétés dans des limites étroites et obtenir des corps compacts à partir de substances qu'il serait impossible d'agglo-mérer par d'autres procédés (par exemple une substance réfractaire, car -bure, etc . , avec un liant plus fusible).
D'une façon générale, la complexité des propriétés d'un matériel fritté enfonction des paramètres spécifiques du procédé technologique est connue. Les propriétés de deux corps frittés ayant la même composition chimique peuvent différer considérablement, en raison de leur histoire technologique. Cette différence est due, dans l 'ensemble, au degré de consolidation des particules des corps solides respectifs. Alors que les solides obtenus par ia fusion des composants ont une densité relativement constante, caractéris-

MATÉRIAUX FRITTÉS 77
tique de leur composition chimique, les corps solides frittés ayant la même composition peuvent présenter une gamme étendue de densités, en fonction du degré de consolidation obtenu. Ce degré de consolidation dépend de toute une série de paramétres spécifiques importants, tels que la structure et la granulation des poudres, la pression d'agglomération," la température et la durée du frittage, etc.
Les matériaux frittés ont des propriétés très sensibles à la modification de tout détail technologique. On peut donc faire varier largement ces pro -priétés, en faisant varier les différents paramètres technologiques. La métallurgie des poudres présente ainsi des avantages notables, mais elle pose en même temps des problèmes très sérieux de reproductibilite des caractéristiques et d'homogénéité de la qualité.
Pour cette raison nous sommes obligés de considérer pour l'étude des matériaux frittés deux types de propriétés. - propriétés découlant de la nature (composition) des corps frittés, - propriétés spécifiques déterminées par la technologie métallo-céramique.
Etant donné la complexité des influences subies par un matériel fritté en cours de fabrication, il est nécessaire d'effectuer un contrôle rigoureux des propriétés à différentes étapes. Le contrôle final est également indis-pensable et nous considérons que c'est la connaissance du degré de frittage qui permet le mieux de déterminer les propriétés, dans des conditions ex -périmentales données.
Le mémoire donne quelques exemples de méthodes non destructives dë contrôle des corps frittés. Ces méthodes sont généralement des méthodes de référence servant à vérif ier les méthodes de contrôle destructives et pouvant les remplacer dans une certaine mesure, ou même complètement, lorsqu'on veut éviter de détruire le corps étudié. Ces méthodes non des-tructives exigent cependant que certains principes soient respectés dans la corrélation des données expérimentales; on doit également tenir compte du procédé de préparation du corps et des conditions dans lesquelles il sera utilisé.
EXAMEN AU MICROSCOPE
L'étude granulométrique et de la structure à l'aide d'un microscope op-tique et d'un microscope électronique est l'une des principales méthodes de contrôle qualitatif non destructif; méthode qui ne peut être remplacée, dans ce cas, par aucun autre moyen d'investigation. Elle est considérée généralement comme une méthode de référence servant à vérifier les p r o -cédés moins directs [1]. Nous avons considéré trois étapes principales du contrôle microscopique des matériaux frittés:
1. L'étude de la structure des poudres utilisées pour préparer les corps frittés - nécessaire pour mieux déterminer et conditionner les propriétés finales. La microscopie permet de déterminer la forme et la grandeur des grains et leur distribution granulométrique [2]. On utilise la microscopie optique ou électronique selon la dimension des grains. Les figures 1 à 3 montrent des images obtenues, à l 'aide d'un microscope électronique, de particules ayant des formes d'aiguilles (fig. l a et l b ) , des formes po ly -

78 ELENA LÁBUgCÁ et al.
édriques (fig. 2) ou des formes irrégulières (fig. 3). La microscopie peut être également utilisée pour l'étude du mécanisme de formation de quelques poudres; nous donnons quelques exemples (fig. 4) de la formation du graphite par cristallisation en forme d'aiguilles. Au microscope électronique on peut même distinguer (fig. 4c) la croissance en spirale de ces aiguilles et la formation des filaments de graphite [3].
2. Le processus de consolidation des poudres et de cristallisation est également mis en évidence par la microscopie [4, 5, 6, 7]. On peut ainsi identifier a) la croissance des grains en fonction de la température de frit-tage, (fig. 5); b) la forme spécifique des cristaux (fig. 6); с) l'orientation de la structure en fonction du procédé technologique (fig. 7); d) la présence de deux ou plusieurs phases (fig. 8); e) l'apparition des défauts divers, tels que des dislocations (fig. 9), et f) l 'homogénéité ou la non homogénéité de la granulation (fig. 10). Généralement, on met aussi en évidence des défauts tels que pores, inclusions, déformation des cristaux, etc.
3. Les modifications de la structure dues à l'irradiation présentent un très grand intérêt, surtout pour les matériaux nucléaires, et peuvent être mises en évidence nettement à l'aide de la microscopie électronique. Nous donnons quelques exemples de structures obtenues après irradiation des matériaux oxydiques par des flux de l 'ordre de 1018 n /cm 2 [8]. On peut ainsi suivre les diverses étapes de destruction de la structure des cristaux (fig. l i a à 11m).
Les méthodes de préparation des échantillons pour l'examen m i c r o s -copique varient en fonction de la nature des matériaux. Généralement nous avons utilisé des répliques en deux couches. Pour la corrosion super-ficielle des échantillons, on utilise la corrosion chimique ou thermique, on peut aussi utiliser la corrosion par bombardement ionique [9], cette d e r -nière méthode pouvant apporter des avantages notables, lorsqu'elle est appliquée de façon rigoureuse.
Nous mentionnons ici la possibilité de coupler l'examen microscopique avec des essais de microdureté. L'essai normal de dureté est destructif; néanmoins, on peut le considérer comme non destructif, si l'on tient compte du fait que la sollicitation mécanique est très limitée (valeur et zone d 'ap-plication). Cette méthode met en évidence, par exemple, la différence de dureté entre les deux phases d'un échantillon, et la variation de la m i c r o -dureté en fonction de la composition chimique qui est très intéressante, surtout pour les cermets.
DÉTERMINATION DE QUELQUES PROPRIÉTÉS PHYSIQUES
Le degré de consolidation, qui détermine essentiellement la qualité des matériaux frittés, est aussi contrôlé par les mesures non destructives de quelques propriétés physiques, parmi lesquelles nous avons retenu en parti-culier* les mesures de la densité, des propriétés magnétiques, de la con-ductibilité électrique et thermique, et de la porosité libre des corps frittés.

MATÉRIAUX FRITTÉS 79
1. La mesure des propriétés magnétiques fournit des indications très in-téressantes sur les matériaux ferromagnétiques. Lorsque cette méthode est applicable, les données expérimentales obtenues sont très utiles, par exemple, pour constater les effets de l'irradiation; les propriétés magnétiques sont en effet généralement très sensibles. En vue de l'utilisation éventuelle de quelques matériaux magnétiques oxydiques frittés dans des champs de radi-ations, nous avons étudié les propriétés magnétiques avant et après irradia-tion, en mettant en évidence la sensibilité de quelques types de ferrites (PGM) pour lesquels on a constaté un accroissement allant jusqu'à 50% de la perméabilité par rapport aux valeurs avant irradiation (fig. 12a). Pour d'autres types de ferrites (PB), on a mis en évidence, par contre, un décroissement de la perméabilité magnétique allant jusqu'à 30 à 3t>%(fig. 12b). Pour d'autres types encore, notamment pour les ferrites à cycle d'hystérésis rectangulaire, on a mis en évidence une bonne stabilité [8].
L'influence de l'irradiation croit avec le flux de neutrons, qu'il s'agisse d'un accroissement ou d'un décroissement de la perméabilité magnétique (fig. 12c).
2. Conductibilité électrique. Pour déterminer la conductibilité électrique, nous avons adopté une méthode appropriée à l'étude des corps frittés ayant des dimensions relativement réduites et une résistivité électrique comprise entre 1,5 • 10"6 et 106 £2 • cm. La méthode diffère des procédés usuels en ce sens qu'on utilise quatre électrodes de contact disposées symétriquement (fig. 13). Nous avons utilisé des échantillons, soit en forme de disque d'une épaisseur uniforme (fig. 13a), soit prismatiques (fig. 13b), et des électrodes très pointues, pour réaliser un contact intime dans toute l 'épaisseur. Si nous établissons, àl 'aide des contacts A et В (fig. 13),: un courant électrique IAB traversant l'échantillon, nous obtenons entre les contacts D et С une tension électrique Цх; • Lorsque les contacts A, В, С et D sont disposés symétriquement [10], on peut écrire la relation
où d représente l 'épaisseur de l'échantillon et RAB.DC = U D C / I A B •
La méthode présente les avantages suivants: a) П est facile d'assurer un bon contact par une faible pression des quatre
électrodes, notamment pour des échantillons de faible épaisseur. b) La relation de calcul de la résistivité ne comprend qu'une seule di -
mension géométrique de l'échantillon, ce qui élimine une source d 'erreur. c) Le montage des échantillons entre les contacts est facile et permet
l'application de la méthode à des essais en série. Le désavantage de la méthode consiste dans le fait que des erreurs
peuvent apparaître par suite d'un arrangement non symétrique de l 'échan-tillon entre "les électrodes de contact. L'importance de ces erreurs peut diminuer si les dimensions des échantillons mesurés consécutivement dif -fèrent peu, et si les contacts sont soigneusement fixés.
En utilisant pour la mesure de UDC ~ selon les matériaux étudiés -, soit un microvoltmètre à résistance intérieure minime (20 £2), soit un potentio-mètre couplé à un galvanomètre de 5 • 10"a A/div avec une résistance in -

80 ELENA LÁBUgCÁ et al.
térieure équivalant à 400 M£2, nous sommes parvenus à effectuer les essais avec des erreurs inférieures à 4 à 5%, et même 1 à 2%.
Les mesures de résistivité ont montré l'utilité de la méthode, notamment a) Pour des matériaux du type cermet, dont la résistivité varie sen-
siblement en fonction du degré d'agglomération, de la température de f r i t -tage et de la teneur en oxyde (fig. 14).
b) Pour le contrôle en série des briques de graphite; la méthode est appropriée, car elle révèle la présence des défauts intérieurs (f issures, pores, etc . ) et, selon nous, elle indique aussi les différences du degré de graphitisation. Dans la figure 15 nous donnons l'exemple d'une courbe nor-male de variation de la résistivité en fonction de la densité, déterminée pour un type de graphite. Lorsque les briques mesurées ont des défauts intérieurs, on obtient, pour les mêmes densités, des valeurs plus grandes pour la-résistivité, valeurs qui peuvent dépasser d'un ordre de grandeur les v a -leurs normales. Pour quelques briques avec défauts, nous avons indiqué les valeurs obtenues dans la partie supérieure de la figure 15.
c) Pour les matériaux oxydiques frittés tels que I ' U O Î ; on a mis en évi-dence des différences très sensibles de résistivité d'échantillons ayant la même histoire technologique, différences dues aux défauts de structure ou à quelque influence locale, que reflète bien la variation de la résistivité.
3. Détermination de la surface spécifique des poudres et des porosités ouvertes. On a aussi étudié la surface spécifique des poudres initiales dé -terminée par la méthode de Lea et Nurse fondée sur la théorie de
- Kozeny et sur les recherches de Carman [1], c 'est-à-dire la méthode dite fluométrique, adéquate sur certains points. Dans la figure 16 nous donnons un exemple de variation de la résistance mécanique à la flexion et de la den-sité en fonction de là surface spécifique, pour ÂI2U3 fritté.
En se fondant sur la même méthode, on a déterminé la perméabilité aux gaz ainsi que la surface totale des pores libres (ouverts), valeurs qui donnent une bonne image du comportement des matériaux dans des milieux fluides.
La figure 17 donne un exemple de variation de la surface des pores libres et de la perméabilité aux gaz en fonction de la porosité.
CONCLUSIONS
En se fondant sur les résultats expérimentaux décrits ci-dessus, on peut conclure que* entre autres méthodes non destructives, l'examen micros -copique et la mesure de propriétés physiques telles que densité, conducti-bilité électrique, propriétés magnétiques, surface spécifique et perméabilité aux gaz, peuvent donner des indications précieuses. Д faut mentionner que, pour chaque type de matériau,il est nécessaire d'établir à partir d'essais destructifs des diagrammes de la variation des propriétés en fonction des paramètres qui peuvent être déterminés à l'aide d'un ou de plusieurs essais non destructifs; à l 'aide de ces données de référence, on peut déduire les propriétés, par l'étude non destructive seulement.

MATÉRIAUX FRITTÉS 81
R É F É R E N C E S
[ 1 ] L 'HERMITE, R . , M é t h o d e s généra les d ' e ssa i et d e c o n t r ô l e I , Paris ( 1 9 5 9 ) .
[ 2 ] DALLAVALLE, J. M . , M i c r o m e r i t i c s - T h e T e c h n o l o g y o f f i n e par t i c l es , London ( 1 9 4 8 ) .
[ 3 ] L A B U S C Â , E . , TEODORESCU, I. and MIRION, I . , T h e Study o f Carbon Block Graphit isation, Rev. Phys.
Bucuregti, V I 1 ( 1 9 6 1 ) .
L4] HUGI , W . , Le m i c r o s c o p e é l e c t r o n i q u e a p p l i q u é i l ' é t u d e des m a t é r i a u x , Rev . BBC 4 9 1 1 / 1 2 ( n o v . -
d é c . 1962 ) . . '
[ 5 ] S U M I N O , K . , K A W A S A K I , Y . e t a l . , E lectron M i c r o s c o p i c a l Study , A c t a m e t a l l . U II (nov*. 1963 ) .
[ 6 ] TRILLAT, J. J. et SAULNIER, A . , Le m i c r o s c o p e é l e c t r o n i q u e et la m é t a l l u r g i e m o d e r n e , Nucleus , Paris
3 ( m a i - j u i n 1 9 6 2 ) ; 4 ( j u i l l e t - a o u t 1962) .
[ 7 ] LABUgCA, E . , TEODORESCU, I. et MIRION, I . , Rev. Phys. , Bucurejt i V 2 ( 1 9 6 0 ) ; Rev. Roum. Méta l l .
V I 2 (1961 ) .
18j LABUSCA, E. , ANDREESCU, N. et M O T O C , C. , « E f f e t s d e l ' i r radiat ion aux neutrons sur la structure et
l e s propr ié tés m a g n é t i q u e s d e s ferr i tes d e m a n g a n è s e e t d e l i t h i u m à g r a n d e p e r m é a b i l i t é » , Rad iat i on
D a m a g e in So l ids , Щ AIEA, V i e n n e ( 1 9 6 3 ) 1 0 3 ; Rev. Phys. Bucure j t i IX 4 ( 1 9 6 4 ) .
[93 T E O D O R E S C U , I. , Ef fets d u b o m b a r d e m e n t i o n i q u e sur l a c o r r o s i o n d e s sur faces m é t a l l i q u e s , T h è s e
1 9 6 5 (à para î t re dans Rev . P h y s . , Bucurest i ) .
I lOJ P A U W , L. J. v a n d u , , Rev . t e c h . Phi l ips 2 0 8 ( 1 9 5 9 ) .
I l l ] VASILIU, S . , M é t h o d e d e m e s u r e d e l a c o n d u c t i v i t é t h e r m i q u e des é c h a n t i l l o n s d e pet i tes d i m e n s i o n s ,
( à paraître dans Studi i si C e r c e t a r i d e F i z i c a , Ed. A c a d . R. P. R o m i n e ( 1 9 6 5 ) .

1644 ELENA LÁBUgCÁ et al.
b )
Figure 1
Poudre m é t a l l i q u e à particules en f o r m e d ' a i g u i l l e s (x 18000 ) .
( réduite de 25"7o à l ' impression)
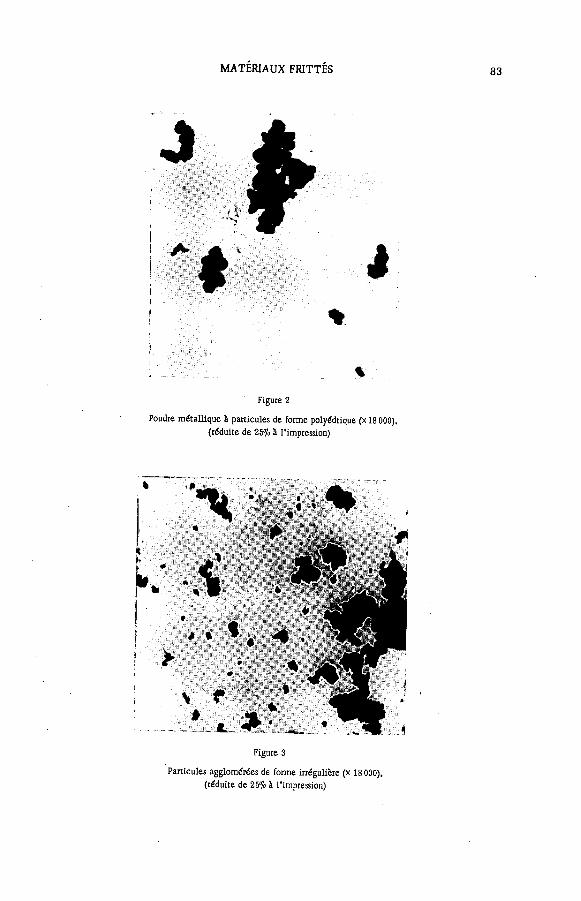
MATÉRIAUX FRITTÉS 1645
J
* i
F i g u r e 2
P o u d r e m é t a l l i q u e à p a r t i c u l e s d e f o r m e p o l y é d r i q u e ( x 1 8 0 0 0 ) .
( r é d u i t e d e 2 5 % à l ' i m p r e s s i o n )
F i g u r e 3
P a r t i c u l e s a g g l o m é r é e s d e f o r m e i r r é g u l i è r e ( x 1 8 0 0 0 ) .
( r é d u i t e d e 2 5 % à l ' i m p r e s s i o n )

1646 ELENA LÁBUgCÁ et al.
J
C r o i s s a n c e g r a n u l a i r e d u g r a p h i t e , e n f o r m e d ' a i g u i l l e s : a ) , b) ХЗОО-,
( r é d u i t e d e 25<ï> à l ' i m p r e s s i o n )

MATÉRIAUX FRITTÉS 1647
с)
F i g u r e 4 ( s u i t e )
с ) ( x 1 8 0 0 0 )
( r é d u i t e d e 4 0 % à l ' i m p r e s s i o n )

ELENA LÁBU§CÁ et al.
a)
b)
F i g u r e 5
C r o i s s a n c e g r a n u l a i r e d e s o x y d e s m é t a l l i q u e s e n f o n c t i o n d e l a t e m p é r a t u r e de fr i ttage
( X 900-, a) 1 2 0 0 e C ' , b) 1 4 0 0 ° C ) .
( r é d u i t e d e 2 5 % à l ' i m p r e s s i o n )

MATÉRIAUX FRITTÉS 1649
b) F i g u r e 6
F o r m a t i o n d e s c r i s t a u x d e A 1 2 0 3 f r i tté : d é t a i l s d e structure (X 1 8 0 0 0 ) ,
( r é d u i t e d e 2 5 % à l ' i m p r e s s i o n )

ELENA LÁBU§CÁ et al.
Figure 7
Orientation des grains et des défauts , dé terminée par le l aminage d 'un matérie l méta l l ique (X900) .
(réduite d e 25% à l ' impression)

MATÉRIAUX FRITTÉS 89
a)
t
b)
Figure 8
Structure des matér iaux d e type c e r m e t à deux phases distinctes
( o x y d e + méta l ) ( X 9 0 0 ) .
( réduite de 2 5 % à l ' impress i on )

1652 ELENA LÁBUgCÁ et al.
. Ь)
Figure 9
Dis locat ions dans A l A fritté (X 1 8 0 0 0 ) .
( réduite d e 2 5 % à l ' impression)

MATÉRIAUX FRITTÉS 91
b )
Figure 10
Matériau o x y d i q u e fritté à granulation a) h o m o g è n e , et b) discontinue ( x 18000 ) .
( réduite d e 4 0 % à l ' impress ion) .

ELENA LÁBU§CÁ et al.
a)
Ь)
Figure 11
Structure d 'un matériau oxyd ique fritté (x 1 8 0 0 0 ) .
a) cristal à f o r m e par fa i te , avant irradiation b) c o u c h e s l ame l la i res de croissance d 'un cr istal , avant irradiation
(réduite de 25% à l ' impression)

MATÉRIAUX FRITTÉS 93
с)
Figure l l ( s u i t e )
с ) à m ) défauts d ' irradiat ion aux neutrons
c ) dé f o rmat ion des cristaux
(réduite de 25% à l ' impression)

1656 ELENA LÁBUgCÁ et al.
d)
Figure 11 (suite)
d ) , e ) inf i l trat ion d e la phase vitreuse à l ' intérieur des cristaux
( e ) réduite de 4 0 % à l ' impression)

MATÉRIAUX FRITTÉS 95
0
g )
Figure 11 (suite)
f ) , g) destruction de la structure l a m e l l a i r e et apparition de la structure granulaire
(réduite d e 25% à l ' impression)

1658 ELENA LÁBUgCÁ et al.
h)
i )
Figure 11 (suite)
h ) , i) structures fibreuses
( r é d u i t e de 25% ï l ' impression)

MATÉRIAUX FRITTÉS 97
Г " t.. HEP f
» A
/ i i
(
% W
f т / i ''У
i I » л
к)
Figure 11 (suite)
j ) , к) bouc les de dis locat ions
(réduite d e 4 0 % à l ' impression)
Í t • .. t >

ELENA LÁBU§CÁ et al.
m)
Figure 11 (suite)
1) , m ) défauts c o m p l e x e s , dis locat ions
(réduite de 25% à l ' impression)

MATÉRIAUX FRITTÉS 1661
Figure 12
Variat ion d e la p e r m é a b i l i t é magnét ique des ferrites après irradiation aux neutrons.
a) accro i ssement d e la p e r m é a b i l i t é
1) avant irradiation,
2 ) après irradiation,
3) variation re la t ive
b ) décro i ssement d e la p e r m é a b i l i t é ;

100 ELENA LÂBUSCÀ et al.
с ) variat ion d e
Figure 12 ( su i te )
la p e r m é a b i l i t é en fonct ion du flux de neutrons.

MATÉRIAUX FRITTÉS 1663
AB
Í , D
A I С
В
<Z3-
b)
F i g u r e 1 3
S c h é m a d e la m é t h o d e d e mesure d e la résistivité. a ) échant i l l ons cy l indr iques ; b ) échant i l l ons prismatiques.
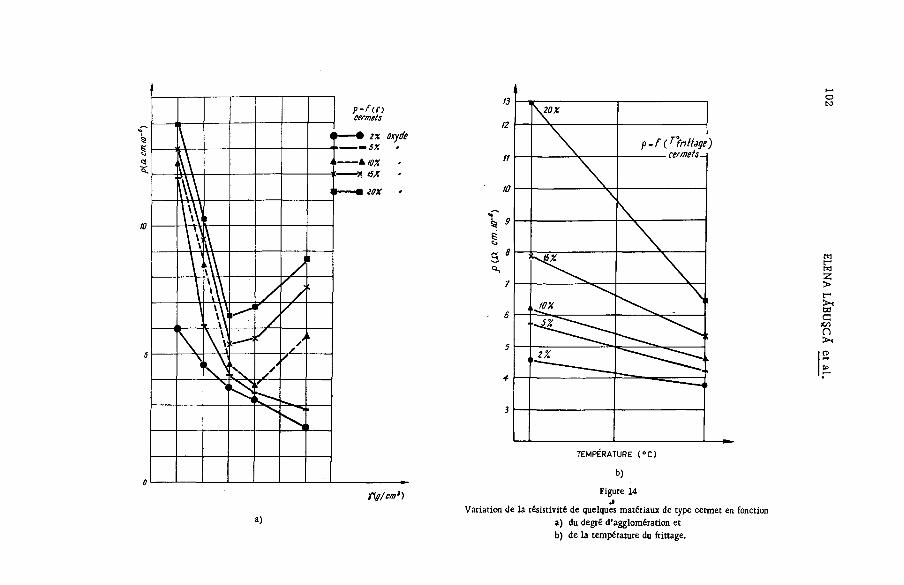
a)
о t \ 3
M Z > с-1 >< со G JCO П >< re
TEMPERATURE ( ° C )
Ь) Figure 14 j
Variation de la résistivité de quelques matériaux de type cermet en fonction a) du degré d'agglomération et b) de la température du frittage.

MATÉRIAUX FRITTÉS 103
Figure 15
Variation de la résistivité des briques de graphite en fonction de la densité.

104 ELENA LÂBUSCÀ et al.
Surface sp¿afí¡t/e{cm*/g)
Figure 16
Variation de la résistance mécanique de AI2O3 fritté, en fonction de la surfa.ce spécifique des poudres.

MATÉRIAUX FRITTÉS 105
Parositi (#)
F i g u r e 1 7
Variat ion d e la surface spéc i f i que des pores ouverts
et d e la p e r m é a b i l i t é aux g a z en fonct ion d e la porosité.
к A A l u m i n i u m m é t a l l i q u e pressé
• • А1г03 fritté

106 ELENA LÂBUSCÀ et al.
D I S C U S S I O N
J. GÉRARD: Do you think it is possible to determine sinterability completely from the physical characteristics of the powders alone? Which do you think are the most interesting parameters to examine?
E. LÂBUÇCÂ: With sintered material for which there is already a well-established technology in respect of all the technical parameters (pressures, temperatures, durations, sintering atmosphere etc. ) the sinterability can be estimated with good accuracy f rom the characteristics of the powders alone. Of these characteristics I think the most representative and the most important to determine are: (1) the structure of the powder particles (shape); (2) the grain dimensions; (3) the specific surface; (4) the volume before and after compression. For a given powder, prepared under the same con-ditions, it is only necessary to control the dimensions and the specific sur-face to determine the quality.
G. TENNEY: What metal was used for the shadow-casting technique? E. LÀBUgCÂ: Gold, silver and chromium. G. TENNEY: Since the scale was not shown I should like to ask what
is the magnification. E. LÂBUSCÂ: The magnification for each photograph is indicated in
the paper. For electron microscopy it wasX18 000. G. TENNEY: What kilovoltage was used for the electron beam? E. LÀBUgCÂ: 30-50 kV. G. TENNEY: Do you have a hot stage? E. LÀBU§CÀ: We have not yet done any microscopic studies at high
temperature. P. de MEESTER: Since the magnification of the electron microscope
photos was only X18 000 do you regard the black lines shown in your last figure as simple dislocations or complex defects?
E. LÀBUgCÂ: We regard the structures obtained after irradiation as agglomerations of dislocations, bearing in mind also that they are obtained for strongly irradiated materials. In other words, to use the terminology generally employed in specialized works, yes, we do regard them as " com-plex defects".

SESSION VI


THE ROLE OF NON-DESTRUCTIVE TESTING IN THE LOS ALAMOS REACTOR PROGRAMME *
G . H . T E N N E Y
U N I V E R S I T Y O F C A L I F O R N I A , L O S A L A M O S S C I E N T I F I C L A B O R A T O R Y ,
L O S A L A M O S , N . M E X . , U N I T E D S T A T E S O F A M E R I C A
A b s t r a c t — R é s u m é — А н н о т а ц и я — R e s u m e n
THE ROLE OF N O N - D E S T R U C T I V E T E S T I N G IN THE LOS A L A M O S REACTOR PROGRAMME. T h e Los A l a m o s s c i e n t i f i c L a b o r a t o r y , o p e r a t e d by m e Univers i ty o t C a l i f o r n i a tor m e u n i t e d s ta tes A t o m i c Energy C o m m i s s i o n , has been a c t i v e for m o r e than twenty years in d e v e l o p i n g , designing, and building nuclear reactors o f four genera l types: research, p o w e r , rocket propuls ion, and c r i t i ca l assembly .
T h e N o n - d e s t r u c t i v e T e s t i n g Group serves p r a c t i c a l l y a l l the a c t i v i t i e s and p r o j e c t s o f the Laboratory ; this p a p e r descr ibes s o m e o f the u n i q u e n o n - d e s t r u c t i v e testing t e chn iques and a p p l i c a t i o n s d e v e l o p e d for and used in the r e a c t o r p r o g r a m m e .
LAPRE (Los A l a m o s P o w e r R e a c t o r E x p e r i m e n t ) was b a s e d o n t h e use o f a u r a n i u m p h o s p h a t e s o l u t i o n at h i g h t e m p e r a t u r e . T h i s s o l u t i o n is v e r y c o r r o s i v e , and a l l parts in c o n t a c t w i t h i t w e r e c l a d w i t h g o l d . S p e c i a l r a d i o g r a p h i c t e c h n i q u e s w e r e used t o i n s p e c t the g o l d during t h e p r o c e s s o f p r o d u c i n g r o l l e d s h e e t f r o m c a s t i n g o t . T h e w e l d e d s e a m s w e r e s i m i l a r l y i n s p e c t e d . A n e l e c t r o d e - p o t e n t i a l i n s p e c t i o n m e t h o d was d e v e l o p e d f o r c h e c k i n g the g o l d sur faces f o r i m b e d d e d i m p u r i t i e s .
T h e f u n d a m e n t a l c o n c e p t o f LAMPRE (Los A l a m o s M o l t e n P l u t o n i u m R e a c t o r E x p e r i m e n t ) is t h e use o f l i q u i d - rather than sol id - p l u t o n i u m m e t a l as f u e l . T a n t a l u m capsules c o n t a i n e d the f u e l . N o v e l n o n -des t ruc t ive test ing m e t h o d s w e r e used to c h e c k the soundness o f base m e t a l and we lds during the p r o d u c t i o n o f the c a p s u l e s , and t o study t h e p l u t o n i u m - l o a d e d c a p s u l e s b e f o r e , d u r i n g , and a f ter m e l t - f r e e z e tests. A m o l t e n p lu ton ium p u m p e x p e r i m e n t was f o l l o w e d with rad iographic t e chn iques , inc luding a g a m m a - r a y c l o sed t e l e v i s i ó n c i r c u i t .
For UHTREX (Ul tra High T e m p e r a t u r e Reactor E x p e r i m e n t ) , n o w under cons t ruc t i on , m i c r o r a d i o g r a p h i c and e l e c t r o n m i c r o s c o p i c studies h a v e b e e n m a d e on 1 5 0 - j j m - d i a m . p y r o c a r b o n - c o a t e d uranium carb ide beads, to e v a l u a t e uran ium m i g r a t i o n as a f u n c t i o n o f t e m p e r a t u r e . T h e a m o u n t , and u n i f o r m i t y , o f t h e u r a n i u m l oad ing in the UHTREX graphi te e l e m e n t s are de termined with s p e c i a l l y des igned sc int i l la t ion counters . About 907° ot the work on this sub jec t has not b e e n prev ious ly pub l i shed .
RÔLE DES ESSAIS N O N D E S T R U C T I F S D A N S LE P R O G R A M M E DE'RÉACTEURS DE LOS A L A M O S . L e Laborato ire s c i e n t i f i q u e de Los A l a m o s , e x p l o i t é par l 'Univers i té de C a l i f o r n i e pour la C o m m i s s i o n de l ' énerg i e a t o m i q u e des Etats-Unis , s ' o c c u p e depuis plus de v ingt ans d e l ' é t u d e , de la mise au po int e t de la construct ion d e q u a t r e t y p e s d e réac teurs n u c l é a i r e s : r éac teurs d e r e c h e r c h e , r éac teurs d e p u i s s a n c e , r é a c t e u r s p o u r la p r o p u l s i o n des fusées e t a s s e m b l a g e s c r i t i q u e s .
Le G r o u p e des essais n o n destruct i fs c o l l a b o r e à presque tous l es pro je ts et t ravaux du L a b o r a t o i r e . Le m é m o i r e décr i t q u e l q u e s - u n e s des m é t h o d e s inédites d 'essais non destructifs qu i y ont é t é mises au point et sont app l iquées dans l e c a d r e du p r o g r a m m e de réacteurs .
Le r é a c t e u r d e p u i s s a n c e e x p é r i m e n t a l LAMPRE est f o n d é sur l ' u t i l i s a t i o n d ' u n e s o l u t i o n d e p h o s p h a t e d 'uran ium à haute t e m p é r a t u r e . C e t t e so lut ion est très c o r r o s i v e et toutes les parties en c o n t a c t a v e c e l l e ont un r e v ê t e m e n t e n o r . O n a eu recours à des t e c h n i q u e s rad iographiques s p é c i a l e s pour c o n t r ô l e r l ' o r pendant l e processus d e l a m i n a g e d ' u n l i n g o t c o u l é . O n a p r o c é d é d e la m ê m e m a n i è r e à l ' i n s p e c t i o n des soudures . U n e m é t h o d e d ' i n s p e c t i o n f o n d é e sur les var ia t i ons d e p o t e n t i e l aux é l e c t r o d e s a é t é m i s e au p o i n t , p o u r la d é t e c t i o n d ' i m p u r e t é s sur l es sur faces d ' o r .
Le réacteur e x p é r i m e n t a l au p luton ium fondu LAPRE est f o n d é sur l 'ut i l i sat ion de p lutonium m é t a l l i q u e , sous f o r m e l i q u i d e p l u t ô t q u e sous f o r m e s o l i d e , c o m m e c o m b u s t i b l e . Le c o m b u s t i b l e est c o n t e n u dans des c a p s u l e s e n t a n t a l e . O n a e u recours à des m é t h o d e s non des t ruc t i ves pour v é r i f i e r l e b o n é ta t du m é t a l d e b a s e e t des soudures p e n d a n t l a f a b r i c a t i o n des c a p s u l e s , a insi q u e p o u r c o n t r ô l e r l e s c a p s u l e s r e m p l i e s d e
* Work supported by the United States Atomic Energy Commission.
109

110 G. H. TENNEY
p l u t o n i u m a v a n t , p e n d a n t e t après l e s essais d e f u s i o n e t s o l i d i f i c a t i o n . L ' e s s a i d ' u n e p o m p e à p l u t o n i u m
f ondu a é t é su iv i par des m é t h o d e s r a d i o g r a p h i q u e s , e n ut i l i sant n o t a m m e n t u n c i r c u i t f e r m é d e t é l é v i s i o n
à rayons g a m m a .
Pour l e réac teur e x p é r i m e n t a l a très h a u t e t e m p é r a t u r e U H T R E X , a c t u e l l e m e n t e n c o n s t r u c t i o n , o n a
é t u d i é par m i c r o r a d i o g r a p h i e e t au m o y e n d e m i c r o s c o p e s é l e c t r o n i q u e s des g ra ins d e c a r b u r e d ' u r a n i u m
enrobés d e carbone pyro ly t ique , d 'un d iamètre de 150 ( jm, pour évaluer la translocation de l 'uranium en fonct ion
d e l a t e m p é r a t u r e . O n d é t e r m i n e la q u a n t i t é e t l ' u n i f o r m i t é d e l a c h a r g e d ' u r a n i u m dans l e s é l é m e n t s au
g r a p h i t e d ' U H T R E X au m o y e n d e c o m p t e u r s à s c i n t i l l a t i o n s p é c i a l e m e n t c o n ç u s . Environ 9 0 % des t ravaux
e f f e c t u é s à c e su je t n ' o n t e n c o r e f a i t l ' o b j e t d ' a u c u n e p u b l i c a t i o n .
Р О Л Ь Н Е Д Е С Т Р У К Т И В Н Ы Х И С П Ы Т А Н И Й М А Т Е Р И А Л О В В Л О С - А Л А М О С С К О Й Р Е -А К Т О Р Н О Й П Р О Г Р А М М Е . Л о с - А л а м о с с к а я н а у ч н а я л а б о р а т о р и я , р у к о в о д с т в о к о т о р о й о с у -щ е с т в л я е т К а л и ф о р н и й с к и й у н и в е р с и т е т д л я К о м и с с и и п о а т о м н о й э н е р г и и С Ш А , в т е ч е н и е б о л е е д в а д ц а т и л е т а к т и в н о з а н и м а е т с я р а з р а б о т к о й , п р о е к т и р о в а н и е м и с т р о и т е л ь с т в о м я д е р н ы х р е а к т о р о в ч е т ы р е х о б щ и х т и п о в : и с с л е д о в а т е л ь с к и х , э н е р г е т и ч е с к и х , р е а к т о р о в д л я р а к е т н ы х д в и г а т е л е й и к р и т и ч е с к и х с б о р о к .
- Г р у п п а н е д е с т р у к т и в н ы х и с п ы т а н и й м а т е р и а л о в о к а з ы в а е т у с л у г и н а п р а к т и к е в с е м в и д а м д е я т е л ь н о с т и и п р о е к т а м л а б о р а т о р и и ; в э т о м д о к л а д е о п и с ы в а ю т с я н е к о т о р ы е и з у н и к а л ь н ы х м е т о д о в и с п ы т а н и й б е з р а з р у ш е н и я и п р и е м о в , р а з р а б о т а н н ы х д л я р е а к т о р н о й п р о г р а м м ы и и с п о л ь з у е м ы х в н е й .
Л А Э Р Э ( Л о с - А л а м о с с к и й э н е р г е т и ч е с к и й р е а к т о р н ы й э к с п е р и м е н т ) о с н о в а н н а и с п о л ь -з о в а н и и р а с т в о р а ф о с ф а т а у р а н а п р и в ы с о к о й т е м п е р а т у р е . Э т о т р а с т в о р я в л я е т с я о ч е н ь к о р р о з и й н ы м , п о э т о м у в с е ч а с т и , н а х о д я щ и е с я в к о н т а к т е с н и м , б ы л и п о к р ы т ы з о л о т о м . С п е ц и а л ь н ы е р а д и о г р а ф и ч е с к и е м е т о д ы п о з в о л я л и к о н т р о л и р о в а т ь з о л о т о в о в р е м я п р о ц е с с а п р о и з в о д с т в а п р о к а т а н н о г о л и с т а и з с л и т к а . О с у щ е с т в л я л с я т а к ж е к о н т р о л ь з а с в а р н ы м и ш в а м и . Б ы л р а з р а б о т а н м е т о д п р о в е р к и п о т е н ц и а л а э л е к т р о д а д л я к о н т р о л я з о л о т ы х п о -в е р х н о с т е й д л я о б н а р у ж е н и я с о д е р ж а щ и х с я з а г р я з н е н и й .
О с н о в н а я к о н ц е п ц и я Л А Р Э Р П ( Л о с - А л а м о с с к и й р е а к т о р н ы й э к с п е р и м е н т с р а с п л а в л е н -н ы м п л у т о н и е м ) з а к л ю ч а е т с я в и с п о л ь з о в а н и и в к а ч е с т в е т о п л и в а с к о р е е ж и д к о г о , ч е м т в е р -д о г о м е т а л л и ч е с к о г о п л у т о н и я . Т а и т а л о в ы е к а п с у л ы с о д е р ж а л и т о п л и в о . Б ы л и и с п о л ь з о в а н ы н о в ы е м е т о д ы к о н т р о л я б е з р а з р у ш е н и я д л я п р о в е р к и п р о ч н о с т и о с н о в н о г о м а т е р и а л а и с в а -р о к в о в р е м я п р о и з в о д с т в а к а п с у л , а т а к ж е д л я и з у ч е н и я к а п с у л , з а п о л н е н н ы х п л у т о н и е м д о , в о в р е м я и п о с л е к о н т р о л я м е т о д о м о х л а ж д е н н о й п л а в к и . З а э к с п е р и м е н т о м п о п е р е к а ч к е р а с п л а в л е н н о г о п л у т о н и я н а б л ю д а л и с п о м о щ ь ю р а д и о г р а ф и ч е с к и х м е т о д о в , в к л ю ч а я г а м м а -л у ч и , с в я з а н н ы е с к о н т у р о м т е л е в е д е н и я .
Д л я Р Э У В Т ( Р е а к т о р н ы й э к с п е р и м е н т п р и у л ь т р а - в ы с о к о й т е м п е р а т у р е ) , к о т о р ы й в н а -с т о я щ е е в р е м я н а х о д и т с я в с т а д и и с т р о и т е л ь с т в а , б ы л и п р о в е д е н ы м и к р о р а д и о г р а ф и ч е с к и е и э л е к т р о н н о - м и к р о с к о п и ч е с к и е и с с л е д о в а н и я н а ш а р и к а х д и а м е т р о м 1 5 0 м и к р о н и з к а р б и д а у р а н а , п о к р ы т ы х п и р о у г л е р о д о м , д л я о ц е н к и м и г р а ц и и у р а н а к а к ф у н к ц и я т е м п е р а т у р ы . К о -л и ч е с т в о и о д н о р о д н о с т и у р а н о в о й з а г р у з к и в г р а ф и т о в ы х э л е м е н т а х Р Э У В Т о п р е д е л я ю т с я с п о м о щ ь ю с п е ц и а л ь н о с к о н с т р у и р о в а н н ы х с ц и н т и л л я ц и о н н ы х с ч е т ч и к о в .
П р и м е р н о 9 0 % р а б о т ы п о э т о й т е м е р а н е е н е б ы л о о п у б л и к о в а н о .
PAPEL DE LOS M E T O D O S DE E N S A Y O N O D E S T R U C T I V O EN EL PROGRAMA DE REACTORES DE LOS A L A M O S . El Labora tor i o C i e n t í f i c o d e Los A l a m o s , e x p l o t a d o p o r l a Un ivers idad d e C a l i f o r n i a p o r e n c a r g o d e la C o m i s i ó n d e Energfa A t ó m i c a d e los Estados U n i d o s , v i e n e o c u p á n d o s e desde h a c e m á s d e v e i n t e años de l p r o y e c t o , d iseño y c ons t rucc i ón d e reactores nucleares de cuatro tipos genera les ; a saber, d e invest igac ión , d e p o t e n c i a , de propuls ión e spac ia l y para conjuntos c r f t i c o s .
El l l a m a d o G m p o d e e n s a y o s n ó d e s t r u c t i v o s c o l a b o r a p r á c t i c a m e n t e e n t odas las a c t i v i d a d e s y p r o -y e c t o s d e l l a b o r a t o r i o . En l a presente m e m o r i a se e x p o n e n a lgunos d e l os m é t o d o s de e n s a y o no d e s t r u c t i v o y sus a p l i c a c i o n e s , e s t a b l e c i d o s para uso e n e l p r o g r a m a d e r e a c t o r e s .
El p r o g r a m a LAPRE (Los A l a m o s P o w e r R e a c t o r E x p e r i m e n t ) se basa e n e l e m p l e o d e u n a s o l u c i ó n d e fos fato de uranio a alta temperatura . La so luc ión es m u y corrosiva y todas las p iezas que entren en c o n t a c t o c o n e l l a deben ir revestidas d e o r o . Durante e l proceso d e p r o d u c c i ó n de chapa de oro laminada a partir d e l ingotes , s e han u t i l i z a d o p r o c e d i m i e n t o s r a d i o g r á f i c o s e s p e c i a l e s para i n s p e c c i o n a r e l m e t a l . Las juntas so ldadas se e x a m i n a r o n d e l m i s m o m o d o , y a d e m á s se e s t a b l e c i ó u n m é t o d o para c o m p r o b a r l a p r e s e n c i a d e i m p u r e z a s incrustadas e n l a s u p e r f i c i e d e la c h a p a d e o r o .
El c o n c e p t o f u n d a m e n t a l e n q u e se basa e l p r o g r a m a LAMPRE (Los A l a m o s M o l t e n P luton ium R e a c t o r Exper iment ) es la u t i l i z a c i ó n c o m o c o m b u s t i b l e d e p l u t o n i o m e t á l i c o l f t u i d o en v e z d e s ó l i d o . El c o m b u s t i b l e

ROLE OF NON-DESTRUCTIVE TESTING 111
está e n c e r r a d o en cápsulas d e t á n t a l o , y durante la f a b r i c a c i ó n d e éstas se ap l i caron nuevos m é t o d o s d e ensayo
n o d e s t r u c t i v o para v e r i f i c a r la i n t e g r i d a d d e l m e t a l b á s i c o y d e las s o ldaduras . T a m b i é n se a p l i c a r o n esos
m é t o d o s durante los ensayos d e fus ión y e n f r i a d o y después d e és tos . En un e x p e r i m e n t o r e a l i z a d o c o n una
b o m b a m e c á n i c a d e p l u t o n i o f u n d i d o , se u t i l i z a r o n p r o c e d i m i e n t o s r a d i o g r á f i c o s , e n t r e e l l o s un c i r c u i t o d e
t e l e v i s i ó n industrial d e rayos g a m m a .
Para e l p rograma UHTREX (Ultra High T e m p e r a t u r e Reactor Exper iment ) a c t u a l m e n t e en curso de e j e c u -
c i ó n , se e f e c t u a r o n estudios m i c r o r r a d i o g r á f i c o s y a l m i c r o s c o p i o e l e c t r ó n i c o d e las perlas de carburo d e uranio
reves t idas d e c a r b o n o p i r o l f t i c o , d e 1 5 0 / im d e d i á m e t r o , c o n e l f in d e e v a l u a r l a m i g r a c i ó n d e l u r a n i o e n
f u n c i ó n d e l a t e m p e r a t u r a . La m a s a y l a u n i f o r m i d a d d e l a c a r g a d e u r a n i o e n l os e l e m e n t o s d e g r a f i t o d e l
p r o g r a m a UHTREX se d e t e r m i n a n m e d i a n t e c o n t a d o r e s d e c e n t e l l e o e s p e c i a l e s .
INTRODUCTION
The University of California's Los Alamos Scientific Laboratory was established on 1 January 1943 to develop the first nuclear weapons. Despite this specific mission, the reactor development programme started only one year later, resulting in the development and construction of the world's first homogeneous reactor, the Water Boiler, and the, world's first fast reactor, Clementine [1] . The reactor activities of the Laboratory then expanded into four distinct fields:
(1) Research reactors; (2) Power reactors; (3) Critical assemblies; (4) Development of a reactor capable of propelling a rocket.
The Nondestructive Testing Group gives service to practically all the activities and projects of the laboratory. In this presentation are described some of the unique non-destructive testing techniques and applications de-veloped for and used in the reactor programme.
THE LOS ALAMOS POWER-REACTOR EXPERIMENT (LAPRE)
In the mid-1950's, two reactors in the LAPRE series were constructed and operated at high temperatures with a uranium phosphate solution. This completely new concept, at that time, in nuclear-power reactor design al-lowed a homogeneous reactor to operate at temperatures and pressures far greater than those previously considered. At the same time, it was realized that this liquid fuel was highly corrosive. All reactor parts which were in contact with the uranium phosphate had to be gold cladded.
The reactor vessel was thoroughly radiographic ally inspected to guaran-tee the soundness of the walls in every respect (see Fig. 1, bottom,). Be-cause of the weight ^nd the wall thickness of the vessel, a specially designed scaffold had to be constructed to hold the vessel at the same height f rom the floor as the horizontal X - ray beam emanating from the doughnut of the 24-MeV Allis-Chalmers Betatron. By using a 5-t crane, the vessel could -be rotated about its axis, thereby making it possible to cover radiographi-cally the entire circumference of the object under investigation [2] .

112 G. H. TENNEY
F i g . l
T o p : Go ld sheet radiography for reactor l iner
Bottom: Betatron and c o b a l t - 6 0 radiography o f LAPRE reactor vessel
Whenever permissible and possible, a cobalt-60 source was inserted along the axis of the vessel and radiographs taken of an entire 360° band of its cyclindrical portion [3, 4] .
The gold to be used for cladding was rolled to size by the Metallurgy Department of the Laboratory. It was important to ascertain that no dust or debris infiltrated the gold during the rolling process. Two types of non-destructive inspection were therefore performed:
A. Radiography of the gold sheet after each rolling (see Fig. 1, top). The gold sheets were transported and kept in plastic containers. Lowest possible X - ray energies and fine-grain films were used to obtain highest radiographic contrast and quality.

ROLE OF NON-DESTRUCTIVE TESTING 113
Fig.2
Electrode potential tester
Top: Schematic cross-section of the tester Bottom: Tester applied to gold slab
В. Electrode potential testing [5] . Since the gold sheets were rolled from a 1-in-thick slab down to a thickness of 0.015 inch, many rollings had to be performed. Despite extreme care and cleanliness during the rolling operation, it was impossible to prevent the pick-up of inclusions large enough to penetrate the finished product completely.
The^Electrode Potential Tester (see Pig. 2) was developed by members of the Nondestructive Testing Group. The principle of this tester is based on the knowledge that one could detect an electric current or field produced by the action of an electrolyte in the region of a surface inclusion or pinhole. It is presupposed that the inclusion and matrix materials will pass in ionic form into the electrolyte and that the two reactions do not produce equal potential differences.

114 G. H. TENNEY
The first prototype tester, as illustrated in Fig. 2, consisted of a stan-dard vacuum tube voltmeter, the DC probe of which was inserted into a Lucite holder. In it were embedded an electrolyte reservoir, and electrolyte feed channel, a gold wire electrode, and a ^-in-diam.- sponge used to confine the electrolyte (in this case НС1-НгО-НАс, 2 : 2 : 1) on the test specimen. The tester was manually operated, as is seen in Fig. 2 (bottom).
This electrode potential scan of the gold sheet was applied after each rolling reduction to determine if pickling was necessary. Pickling oper-ations of sufficient duration to dissolve all possible inclusions would have taken a prohibitively long time; therefore, the tester was used after each pickling cycle to determine if inclusions had been removed. By applying this tester, the estimated processing time with the prescribed pickling after each reduction was shortened from three months to two weeks.
THE LOS ALAMOS MOLTEN-PLUTONIUM EXPERIMENT (LAMPRE)
This experiment is based on the idea of using metallic plutonium as a fuel in the liquid rather than in the solid state. It was part .of the concept of a fast-breeder reactor to produce power and at the same time manufacture more new fissionable material than it consumes.
Capsules of tantalum metal were used to contain the fuel in the core. Heat was removed from the fissioning fuel by a circulating stream of molten sodium. The operating temperature was about 950°F with a design power level of 1000 kW.
Some of the interesting non-destructive test methods developed for and applied to this reactor experiment are described in the following paragraphs.
Tantalum bar stock and thimbles
The bar stock was ultrasonically inspected for internal cracks. A Curtiss-Wright Immerscope was used for this purpose. The axis of the ultrasonic beam emanating from a line-focused lithium sulphate transducer was directed at the centre of the bar. A frequency of 5 Mc was used in this case.
The thimbles were impact-extruded from this bar stock to a wall thick-ness of about 0.030 in and a diameter of about 0.430 in. These thimbles could not contain any scores, pits, galls, and cracks, because of the danger of rapid corrosion when in contact with molten sodium.
Three types of non-destructive inspection were therefore developed for this purpose.
(1) Radiographic inspection
Three views were taken of each thimble (0°, 60°, and 120°) with its axis parallel to the film. 1000-kVP X-rays were utilized to penetrate both walls of the specimens. By using fine-grain films (double-film technique) and 0. 005-in lead intensifying screens in vacuum cassettes, a radiographic reso-lution of 0.004 in was obtained.
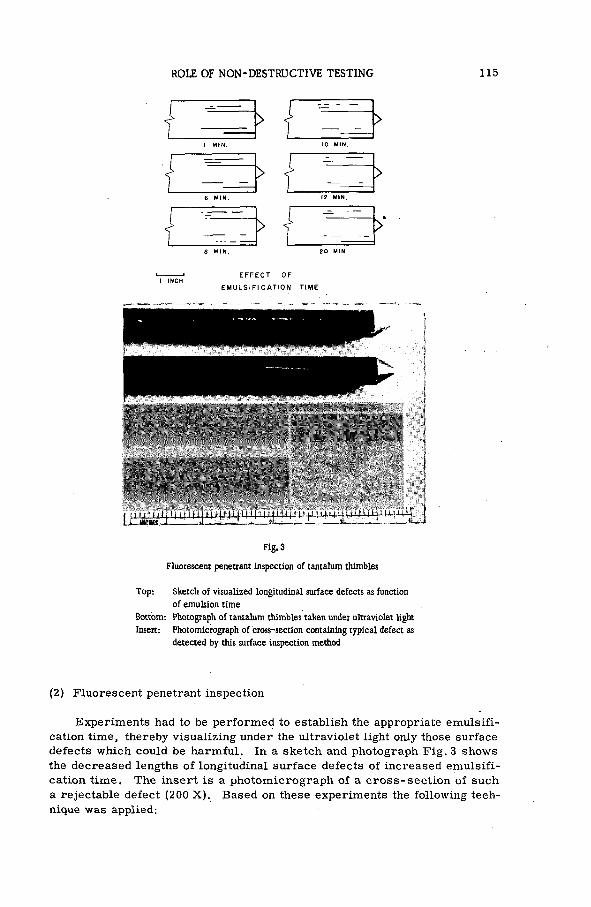
ROLE OF NON-DESTRUCTIVE TESTING 115
Fig.3
Fluorescent penetrant inspection of tantalum thimbles
Top: Sketch of visualized longitudinal surface defects as function of emulsion time
Bottom: Photograph of tantalum thimbles taken under ultraviolet light Insert: Photomicrograph of cross-section containing typical defect as
detected by this surface inspection method
(2) Fluorescent penetrant inspection
Experiments had to be performed to establish the appropriate emulsifi-cation time, thereby visualizing under the ultraviolet light only those surface defects which could be harmful. In a sketch and photograph Fig. 3 shows the decreased lengths of longitudinal surface defects of increased emulsifi-cation time. The insert is a photomicrograph of a cross-section of such a resectable defect (200 X). Based on these experiments the following tech-nique was applied:

116 G. H. TENNEY
Penetrant: ZL- 22 for 20 min Emulsifier: Z E - 2 for 20 min Washing time using automatic
rotary washer: 6 min at 95 to 100°F Drying time: 10 min at 115 to 1 4 C ? Developer: Z P - 4 for at least 10 min
i Most of the surface defectr uncovered by this fluorescent penetrant in-spection could not be detected by visual or radiographic means.
(3) Electromagnetic method to measure wall thicknesses of thimbles
The thimble wall was inserted between two coaxial coils mounted on the ends of a U-shaped yoke. The variations in the wall thickness caused a li-near phase shift in the signal induced in the receiving coil. This shift was displayed on an oscilloscope which was calibrated against known tantalum thicknesses. By moving the coils axially along the thimble and rotating the thimble, the minimum and maximum wall thicknesses and their locations could be obtained. The frequency range for this investigation was between 200 and 300 kc, depending upon the thickness range of the walls of the thimbles.
Highly-radioactive tantalum capsulée filled with plutonium
Betatron radiography was used to ascertain the physical condition of these capsules after they were removed from the reactor (see Fig. 4). Re-motely controlled handling devices were used for personnel safety reasons. A finite object-to-film distance utilizing the inverse-square law decreased the amount of undesirable radiation emanating from the specimen and ex-posing the film, thereby contributing to an increased radiographic contrast.
Molten-plutonium pump experiment [в]
This experiment was a subcritical mock-up of a reactor core in which a plutonium-iron alloy was circulated by means of a sodium lift pump. This type of circulation would permit continuous flushing of fission gases gener-ated, and would create the potential for fuel re-processing during operation. Sodium for the lift pumping was circulated by an E. M. pump in an isothermal loop at 500°C. The purpose of this test was to study pump characteristics, instrumentation, sodium-fuel separation, and fuel-transfer systems.
Special non-destructive inspection methods were developed to observe the operational characteristics of the core and the fuel-transfer systems. Figure 5 illustrates the set-up of this experiment and a radiograph of the core showing the catch pan and the liquid plutonium level.
Radiographs were taken to study the test assembly involving static and steady-state conditions such as float location, fuel level, sodium in the lift pump annulus while pumping etc. Iridium-192 and cobalt-60 were the two sources of gamma radiation which lent themselves very successfully for this investigation. Iridium, because of its lower energy, produced better radio-graphic definition and contrast. The iridium sources were contained in tung-

ROLE OF NON-DESTRUCTIVE TESTING 117
Fig. 4 Left: Radiographic set-up for inspecting highly-radioactive tantalum
capsules filled with plutonium using the 24-MeV betatron Right: Radiograph of such a capsule
sten collimators and exposed by removing the front plug. The shielding and collimation were sufficient to allow personnel to remain in the area behind the source during exposure.
The entire experimental set-up located behind the board was painted on the front, as is seen in the photograph. This painted sketch made it pos-sible to place the isotope in the desired position to radiograph the area of interest. A gamma alarm was placed behind the test section; it activated a red light visible to the operators whenever the sources were exposed.
In addition to taking radiographs, a gamma-ray TV system was de-veloped which made it possible to study on the screen the various events as they were taking place. The varying fuel flow, the starting of pump action, the fuel levels, and fuel-transfer operations could be readily observed. Movies were also taken of the TV screen, thereby permanently recording the various phases of this experiment.
THE ULTRA-HIGH-TEMPE RATURE REACTOR EXPERIMENT (UHTREX)
This experiment now under construction at Los Alamos will use unclad highly refractory fuel in a gas-oooled reactor [7] . The fuel elements .will be a mixture of "Triplex" pyrocarbon-coated UC2 beads, with average dia-

118 G. H. TENNEY
Fig. 5
Top: Photograph of the molten-plutonium pump experiment Bottom: Radiograph of the core showing the liquid plutonium level
meters of 350 /лт , and graphite. They will have cylindrical shapes with a diameter of about 1.2 in, and will be extruded and graphitized to size.
Again, various non-destructive test methods were developed and applied in order to study the behaviour of these beads when exposed to various temperatures. It is important to determine the degree of uranium migration through the pyrocarbon coatings as a function of temperature and time.
Figure 6 illustrates microradiography of such beads as received from the manufacturer and after heat treatment for 4 h at 2300°C. These radio-graphs were taken under dark-room conditions by placing the beads directly on the photographic emulsion of spectrographs plates. Soft X -rays with an energy of about 6 kVP were utilized in a helium atmosphere. The X-rays penetrated the pyrocarbon layer and visualized clearly the migrated uranium after heat treatment.

ROLE OF NON-DESTRUCTIVE TESTING 119
So/i
и — — • I H H B M R Ü á A •••••¡•••••и
ШЁШЯЁШШШ. ;
— l
«fe
Ч Я И И
м и
Fig. 6
Microradiographs of pyrocarbon-coated UC2 beads, average diam. 350 (J m
Top: Radiograph of bead as received Bottom: Radiograph of bead after heat treatment for 4 h at 2300 °C
Some of these beads were sectioned and metâllographic photographs taken, .as seen in Fig. 7. Again, uranium migration could be observed as a result of heat treatment.
To study these phenomena in greater detail and beyond the range of opti-cal microscopy, replicas were made of the sectioned surfaces of these beads. These replicas were then shadow-casted and transmission electron micro-graphs were taken. Figure 8 illustrates these 5500X electron micrographs. The boundaries between the UC2 core and the surrounding pyrocarbon con-taining migrated uranium can be clearly seen.
The manufactured fuel elements must be inspected for uranium loading and homogeneity of uranium distribution. Ring-type sodium-iodide thalium-activated scintillators are used for this purpose. Figure 9 shows the model

120 G. H. TENNEY
50^
Fig. 7
Metallographic photographs of sectioned pyrocarbon UC2 beads
Top: Bead as received Bottom: Bead after heat treatment for 4 h at 2300°C
of such a scintillation counter with one segment removed. The other half of this Figure shows the entire gamma-counting instrument with automatic read-out equipment. Data are recorded on punch tapes and fed into compu-ters for final evaluation.
DISCUSSION
This paper has given a brief review of some of1 the various activities of the Nondestructive Testing Group of the Los Alamos Scientific Laboratory. To be of service to all the projects, many factors must be taken into con-sideration. Close communication and co-operation are the basis of success-ful service. The problems must be crystallized and discussed. All possible

ROLE OF NON-DESTRUCTIVE TESTING 121
J-*--...
РуС
Fig. 8
Electron-micrographs of interface between UC2 core and pyrocarbon coating of beads (5500X)
Top: Interface of bead as received Bottom: Interface of bead after heat treatment for 4 h at 2300 °C
and probable non-destructive test methods, and especially their limitations, have to be fully understood. Last, but not least, the data obtained have to be analysed and evaluated to determine their usefulness with regard to estab-lishing respective specifications.
A C K N O W L E D G E M E N T S
The content of this paper is the result of the work of many members of the Nondestructive Testing Group over many years. They all deserve the credit. In addition, the progressive atmosphere of the Los Alamos

122 G. H. TENNEY
Fig. 9
Scintillation-counting equipment to determine uranium loading of fuel elements
Top: Model of scintillation counter with one segment removed Bottom: Scintillation-counting instrument with automatic read-out equipment
Scientific Laboratory created and stimulated these evolutionary and fruit-ful activities.
R E F E R E N C E S
[ 1 ] Nuclear Reactors, Los Alamos Scientific Laboratory, March (1964). [ 2 ] STEELY, J, P. and MILLER, N.C. , "Some Experimental Findings and Operating Practices in Betatron
Radiography", Nondestructive Testing, XI. No. 8 (1953) 35-40. [ 3 ] TENNEY, G. H . , "Survey of Radiation Techniques", from Symp, on Nondestructive Tests in the Field
of Nuclear Energy, ASTM Special Technical Publication No. 223 (1958). [ 4 ] DUTLI, J.W. and TENNEY, G.H. , "A Preliminary Investigation of the Radiographic Visualization of
Cracks", Nondestructive Testing, _XH , No .2 , (1954) 13-15. [ 5 ] BENDER, J. H. Jr., DUTLI, J.W. and EDWARDS, P. D. , "Electrode Potential Testing", Nondestructive
Testing, March-April (1960).

ROLE OF NON-DESTRUCTIVE TESTING 123
[ 6 ] DEVERALL, J.E. and CALDWELL, G. L. , "Molten Plutonium Pump Experiment" , Los Alamos Scientific Laboratory, Los Alamos, New Mexico, LA-2761, December (1962).
[ 7 ] Quarterly Status Reports on UHTREX, Los Alamos Scientific Laboratory, Los Alamos, New Mexico, LAMS-2623 , 20 August (1961); and LÂ-3190-MS, 20 September (1964).
D I S C U S S I O N
Z . PAWLOWSKI: What was the wall thickness of the reactor vessel which you tested radiographically? What kinds of defect did you look for?
G.H. TENNEY': The wall thickness ranged from about 1 to 4.5 in. The radiographic sensitivity was between 0.020 and 0.080 in. We wished to avoid cracks and voids of about 0.080 to 0.090 in in diameter.
Z . PAWLOWSKI: Did you also use ultrasonic inspection? It would be very interesting to have a comparison of the two methods and to know their limitations.
G.H. TENNEY: No, we didn't use ultrasonic inspection, seeing that we had the 24-MeV betatron and Co60 available. We preferred radiography because of the importance of the inspection and the consequent need to ob-tain permanent records.
Z . PAWLOWSKI: Did you try to use the Lamb waves or any other waves for testing gold sheets after rolling?
G.H. TENNEY: Yes, we did, especially for inspecting the welds of the gold sheets.
Z . PAWLOWSKI: What were the criteria for rejecting tantalum bars tested by means of the fluorescent penetrant method? What defects could be seen as harmful and why?
G. H. TENNEY: I described the types of defects in my paper. I should like particularly to refer to the insert to Fig. 3, showing the metallographic photograph.;- The specifications were established on the basis of corrosion rate studies.
O. A. KELLERMANN: In Figs. 6, 7 and 8 you have shown us excellent photographs of coated particles for the UHTREX. The importance of the coating for retaining fission products is well known. Do you perform tests in Los Alamos Laboratory to ensure the diffusion coefficients specified?
G.H. TENNEY: Yes, in Los Alamos, but not in the Nondestructive Test-ing Department. Therefore I can give no details.
P. de MEESTER: I would also like to ask a question on tlje UHTREX coated fuel particles. Could you tell us what was the fuel loading in the cylindrical elements in weight % ? And what precision could you obtain in determining the amount of uranium? I assume that the fuel is highly enriched?
G.H. TENNEY: Yes , the element is highly enriched. The loading is 110-150 mg/cm3 of uranium. The elements are made of these particles embedded in graphite. They are extruded and graphitized to size. The pre-cision is ± 1.5%, bearing in mind that the width of the crystal is 3 / 4 in.


THE ECONOMICAL APPLICATION OF NON-DESTRUCTIVE TESTING TO
REACTOR COMPONENTS, ESPECIALLY JACKET TUBING*
C . J . R E N K E N
M E T A L L U R G Y D I V I S I O N
A R G O N N E N A T I O N A L L A B O R A T O R Y
A R G O N N E , I L L . , U N I T E D S T A T E S O F A M E R I C A
(presented by D. С. WORLTON)
A b s t r a c t — R é s u m é — А н н о т а ц и я — R e s u m e n
THE ECONOMICAL APPLICATION OF NON-DESTRUCTIVE TESTING TO REACTOR COMPONENTS, ESPECIALLY JACKET TUBING. The ideal reactor design, in addition to its other desirable characteristics, would require no non-destructive testing. This ideal, like others, will probably never be attained. In any reactor design where cost is an important factor, the question of whether components can be economically tested should be proposed at the same time that questions of fabricability are being considered. Some develop-ment of these points as well as a discussion of the importance of non- destructive tests in specification writing is included in this section. Responsibility also rests on the fabricator to use the help provided by non-destructive testing in maintaining quality in the product through various stages in the fabrication process, and to use the test results to indicate those steps in thé process most likely to introduce defects in the component. Often it develops that non-destructive testing in earlier stages of component fabrication cannot be replaced economi-cally, if at all, by inspection of the component in finished or semi-finished form. Examples are cited to illustrate this point, particularly with regard to tubing for fuel jacket and heat-exchanger applications. The application of various non-destructive tests during a tube-fabrication development programme is described in some detail. The fabrication and inspection costs for some tubing used for jacket applications by Argonne National Laboratory are compared.
Although component inspection in finished form can be minimized by these procedures, it cannot in all cases be eliminated entirely.
The economical testing of plates and tubes, especially the latter, is discussed in detail. The discussion is centred around components of stainless steel, Zircaloy, and certain refractory metal alloys. It is shown through various examples that although the use of radiography and penetrants may be useful or even essential steps in the testing, critical inspection of thin-wall tubing must usually be made by either an ultrasonic or an electro-magnetic method for technical as well as economic reasons. The optimum area of application of these two methods is explained as well as the large area of overlap where results produced by well- designed and properly operated equipment of both types are essentially equivalent. Spurious defect indications contri-bute directly to increased component costs, so an evaluation of these effects for both the ultrasonic and the electromagnetic test methods is included for several commonly encountered sources of spurious defect signals. The experience in the application of these methods at Argonne National Laboratory on relatively large quantities of tubing from various sources are recounted from the standpoint of the lowest possible inspection cost per unit-length of tubing. This section also summarizes experience gained at Argonne with the newer pulsed electro-magnetic test methods. The critical but generally unappreciated role of tube diameter and wall thickness on tube inspection cost is discussed. Since the question of economical inspection is closely related to allowable defect levels, defect levels and standards in use at Argonne are covered. Finally, the practical and theoretical barriers to reduced component inspection costs are enumerated and a projection of what possible reductions in cost might be attainable in the future with the ultrasonic and electromagnetic test methods is attempted.
* Work performed under the auspices of the United States Atomic Energy Commission.
125

126 С J . RENKEN
AVANTAGES ECONOMIQUES DU CONTROLE NON DESTRUCTIF DES PIECES DE RE ACTEURS, NOTAMMENT DES TUBES DE GAINAGE. Le réacteur idéal aurait entre autres caractéristiques celle de ne pas exiger de contrôles non destructifs. Cet idéal, comme tant d'autres, ne sera probablement jamais atteint. Dans l'étude de tout réacteur pour lequel le prix de revient constitue un facteur important, il faudrait envisager la question de savoir si les pièces de ce réacteur pourront être essayées de façon économique en même temps que l 'on examine les possibilités de fabrication. Cette partie du mémoire contient quelques considérations à ce propos ainsi qu'un exposé de l'importance des essais non destructifs dans l'établissement des spécifications. Il incombe aussi au fabricant de tirer parti des avantages que présentent les essais non destructifs pour maintenir la qualité du produit au cours des divers stades de fabrication, et d'utiliser les résultats des essais pour déterminer les stades ой l'apparition de défauts est le plus probable. Il arrive tréquemmennt que des essais non destructifs au début des opérations de fabrication ne puissent pas être remplacés, économiquement ou non, par une in-spection du produit fini ou semi-fini. L'auteur cite des exemples à l'appui de cette considération, notamment en ce qui concerne les tubes de gainage du combustible et les circuits caloporteurs. Il décrit de façon assez détaillée l'application des divers essais non destructifs au cours de la mise au point de gaines et de canaux. H compare les coûts de fabrication et d'inspection de plusieurs modèles de gaines de combustible utilisés par le Laboratoire national d'Argonne.
Bien que le contrôle du produit fini puisse être réduit à un minimum à la suite de ces essais, il ne peut pas être éliminé entièrement dans tous le cas.
L'auteur discute en'détail, du point de vue des économies, les essais des plaques et des tubes, particu-lièrement des seconds. Son examen porte principalement sur les pièces en acier inoxydable, en Zircaloy et en certains métaux réfractaires. Il montre, par divers exemples, que si la radiographie et l 'emploi de liquides pénétrants peuvent constituer des mesures utiles ou même essentielles au cours des essais, l'inspection critique des tubes % paroi mince doit être effectuée habituellement, soit par les ultrasons, soit par une méthode électromagnétique, pour des raisons à la fois techniques et économiques. L'auteur décrit le domaine optimum d'application de ces deux méthodes ainsi que la vaste gamme dans laquelle les résultats obtenus avec des instruments ultrasonores et électromagnétiques bien conçus et convenablement utilisés sont pratiquement équi-valents. Des indications erronées de défauts contribuent directement à l'accroissement du prix de revient des pièces; c 'est pourquoi le mémoire contient une évaluation de ces effets pour les méthodes ultrasonores et électromagnétiques en ce qui concerne plusieurs sources fréquentes d'indications erronées. L'auteur expose l 'expérience acquise au Laboratoire national d'Argonne dans l'application de ces méthodes à des quantités relativement importantes de tubes d'origines diverses, du point de vue du prix minimum du contrôle parunité de longueur de tube. Cette partie du mémoire résume également l'expérience acquise au Laboratoire d'Argonne avec les méthodes électromagnétiques & impulsions les plus récentes. L'auteur discute l'influence primordiale, mais généralement trop négligée, du diamètre et de l'épaisseur du tube sur le prix de revient du contrôle. Comme la question de l 'économie du contrôle est étroitement liée & celle des défauts admissibles, l'auteur expose les normes appliquées à cet égard au Laboratoire d'Argonne. Enfin, il énumère les obstacles pratiques et théoriques qui empêchent de réduire le prix de revient du contrôle des pièces et il s'efforce de faire une prévision des réductions possibles de c e prix grâce aux méthodes ultiasonores et électromagnétiques.
Э К О Н О М И Ч Е С К О Е ПРИМЕНЕНИЕ Н Е Д Е С Т Р У К Т И В Н Ы Х ИСПЫТАНИЙ ДЛЯ Р Е -АКТОРНЫХ КОМПОНЕНТОВ, В ЧАСТНОСТИ ОБОЛОЧЕЧНЫХ Т Р У Б . Идеальная конструк -ция реактора , помимо других желательных для нее характеристик, не п о т р е б у е т проведения испытаний без разрушения оболочки образца . Т а к о г о идеала, как и многих других, вероятно, никогда не д о б и т ь с я . При любом проектировании реактора , когда затраты являются важным ф а к т о р о м , в о п р о с о т о м , м о г у т ли е г о компоненты и с п ы т ы в а т ь с я э к о н о м и ч е с к и в ы г о д н о , с л е д у е т в ы д в и г а т ь о д н о в р е м е н н о с р а с с м о т р е н и е м в о п р о с о в и з г о т о в л е н и я . В настоящий раздел включены некоторые моменты разработки этих вопросов, а также обсуждение важности проведения испытаний б е з разрушения оболочки образца в письменных спецификациях. На изготовителя также ложится о т в е т с т в е н н о с т ь использовать помощь, предоставляемую п р о -ведением испытаний без разрушения оболочки для сохранения качества продукта на различ-ных стадиях процесса изготовления, а также использование результатов испытание для т о г о , ч т о б ы определить т е м о м е н т ы , к о т о р ы е вероятнее в с е г о в ы з о в у т дефекты в компоненте в процессе изготовления. Чаще в с е г о получается так, что испытание без разрушения оболочки в начальных с т а д и я х изготовления компонента не м о ж е т б ы т ь з а м е щ е н о экономически в ы -годно иначе,если вообще э т о возможно , как только путем обследования компонента в виде г о т о -в о г о продукта или полуфабриката. Приводятся примеры для иллюстрации этой точки зрения, о с о -

ECONOMICAL APPLICATION OF NON-DESTRUCTIVE TESTING 127
бенно в отношении с и с т е м ы т р у б для применения оболочки т е п л о в ы д е л я ю щ е г о элемента и применений в теплообменниках. Применение различных испытаний без разрушения оболочки образца подробным о б р а з о м о п и с ы в а е т с я в п р о г р а м м е р а з р а б о т о к по и з г о т о в л е н и ю т р у б . Дается сравнение расходов на изготовление и обследование некоторых с и с т е м труб , и спол ь -з о в а в ш и х с я А р г о н н с к о й национальной л а б о р а т о р и е й для п о к р ы т и я э т и х т р у б о б о л о ч к о й .
Хотя обследование компонента в окончательном виде может ьыть сведено до минимума посредством таких процедур, однако нельзя все эти случаи устранить целиком.
Подробным о б р а з о м о б с у ж д а е т с я э к о н о м и ч е с к о е проведение испытаний пластинок и т р у б , в о с о б е н н о с т и последних . Обсуждение в е д е т с я главным о б р а з о м о к о м п о н е н т а х из нержавеющей стали , циркаллоя и н е к о т о р ы х огнеупорных металлических с п л а в а х . На р а з -личных примерах п о к а з ы в а е т с я , ч т о хотя использование радиографии и смачивающих р е а -г е н т о в м о ж е т о к а з а т ь с я в е с ь м а п о л е з н ы м , а м о ж е т быть даже и н е о б х о д и м ы м делом при проведении испытаний, однако о б я з а т е л ь н о , как правило, следует проводить тщательное о б -следование тонкостенных труб с помощью либо ультразвука , либо электромагнитного метода как с точки зрения технических , так и экономических а с п е к т о в . Объясняется оптимальная о б л а с т ь применения э т и х двух м е т о д о в , а также перекрываемая ими о б л а с т ь , г д е полученные результаты благодаря хорошей конструкции и точно работающему оборудованию обоих видов я в л я г т с я в значительной степени эквивалентными. Ложные указания на дефекты ведут н е -посредственно к удорожанию компонентов , поэтому как при ультразвуковом так и при электро -магнитном м е т о д е у ч и т ы в а е т с я целый ряд обычно встречающихся источников сигналов л о ж -ных д е ф е к т о в . Опыт по применению э т и х м е т о д о в в Аргоннской национальной лаборатории в отношении сравнительно б о л ь ш о г о количества с и с т е м т р у б из различных источников и з -л а г а е т с я подробно с точки зрения наименьших возможных затрат на проверку единицы длины т р у б . В настоящем разделе также в кратце и з л а г а е т с я о п ы т , приобретенный в А р г о н н е с помощью с а м ы х новых м е т о д о в испытаний электромагнитной пульсации. О б с у ж д а е т с я к р и -т и ч е с к а я , но , как правило, нежелательная роль диаметра т р у б и толщины с т е н о к в в о п р о с е затрат при обследовании т р у б . Посхольку вопрос э к о н о м и ч е с к о г о обследования н е п о с р е д -с т в е н н о связан с уровнями д о п у с т и м ы х д е ф е к т о в , з а т р а г и в а е т с я также в о п р о с о б у р о в н я х д е ф е к т о в и стандартах , и с п о л ь з у е м ы х в А р г о н н е . И, наконец, перечисляются практические и т е о р е т и ч е с к и е барьеры для снижения з а т р а т , связанных с о б с л е д о в а н и е м к о м п о н е н т о в , и у к а з в а ю т с я перспективы в о з м о ж н о г о снижения р а с х о д о в , к о т о р ы х можно д о б и т ь с я в б у д у -щем с помощью у л ь т р а з в у к о в ы х и электромагнитных м е т о д о в испытаний.
APLICACION EN CONDICIONES ECONOMICAS DE ENSAYOS NO DESTRUCTIVOS A LAS PIEZAS DE LOS REACTORES, EN ESPECIAL A LOS TUBOS DE REVESTIMIENTO. Además de las características que debe reunir el modelo ideal de reactor, hay que aplicarle métodos de ensayo que no tengan carácter destructivo. Como otros ideales, es probable que éste no se alcance nunca. Para cualquier modelo en el que el costo sea un factor importante, la cuestión de la posibilidad de ensayar las piezas en condiciones económicas debe plantearse al mismo tiempo que la de la posibilidad de fabricación. En la presente memoria se resellan algunas observaciones al respecto y se examina la importancia que ha de atribuirse a los métodos de ensayo no de-structivo al establecer las especificaciones correspondientes. El fabricante además es responsable de la utili-zación de métodos de ensayo no destructivo para mantener la calidad del producto durante las diversas etapas del proceso y de indicar, a base de los resultados obtenidos, en cuáles de esas etapas es más probable que la pieza adquiera defectos. A menudo ocurre que el ensayo no destructivo de la pieza en las primeras etapas de su fabricación no puede sustituirse, por la inspección de dicha pieza en forma acabada o semiacabada. Para demostrarlo se citan ejemplos, sobre todo relativos a los tubos para revestimiento del combustible y a las aplicaciones de los intercambiadores de calor. Se expone, en forma bastante circunstanciada, la aplicación de los diversos métodos de ensayo no destructivo durante el desarrollo de un programa de producción de tubos, y se comparan los costos de fabricación y de inspección de algunas clases de tubos utilizadas para revestimiento por el Argonne National Laboratory.
Aunque con esos procedimientos la inspección de las piezas acabadas tiene una importancia secundaria, no siempre puede eliminársela enteramente.
Se examina detenidamente el método económico de ensayo de placas y tubos, en especial de estos últimos, refiriéndose sobre todo a las piezas de acero inoxidable, zircaloy y ciertas aleaciones de metales refractarios. Con varios ejemplos queda demostrado que si bien el uso de la radiografía y de los agentes de penetración puede ser títil o incluso constituir una parte imprescindible del ensayo, en general, por razones de Indole técnica o económica, es preciso proceder a una inspección crítica de los tubos delgados, ya sea

128 С J. RENKEN
por métodos ultrasónicos o electromagnéticos. Se explica el campo de aplicación de esos dos métodos en con-diciones óptimas y también la amplia zona de superposición en que los resultados obtenidos con equipo de ambas clases, bien concebido y manejado, son esencialmente equivalentes. La indicación falsa de defectos con-tribuye directamente a aumentar el costo de la pieza; por el lo , se incluye una evaluación de ese efecto pernicioso de varias fuentes indicadoras de falsos defectos que seuelen existir tanto cuando se aplican los métodos ultrasónicos como los electromagnéticos. La experiencia adquirida en la aplicación de esos dos métodos por el Argonne National Laboratory a cantidades relativamente grandes de tubo de diversas procedencias se estudia desde el punto de vista del costo más bajo posible a que pueda efectuarse la inspección por unidad de longitud del tubo de que se trate. En la presente sección se expone además en forma concisa la experiencia adquirida en Argonne con los modernos métodos de impulsos electromagnéticos. Se examina la influencia crítica, pero generalmente inapreciada, que tienen en el costo de la inspección el diámetro y el espesor de pared del tubo. Teniendo en cuenta que el problema de la inspección en condiciones económicas guarda una estrecha relación con el número medio de defectos admisibles, se estudian asimismo los promedios y las normas que se aplican en Argonne. Por último, se enumeran los obstáculos de orden teórico y práctico para reducir el costo de la inspección de piezas sobre esa base, y se evalúan las posibles reducciones de costo que podrían lograrse en lo futuro aplicando los métodos de ensayo ultrasónicos y electromagnéticos.
THE APPLICATION OF NON-DESTRUCTIVE TESTING TO REACTOR COMPONENTS
The ideal reactor design, in addition to its other desirable character-istics, would require no non-destructive testing. In any reactor design in which cost is an important factor, the question of whether components can be economically tested should be considered at the same time that questions of fabricability are being considered. Inevitably, those designs which ap-proach any type of limit, whether it be of temperature, life-time, mechani-cal strength, or lowest possible cost, require some form of non-destructive testing to ensure that the material or component under test does in fact pos-sess the characteristics which the designer assumed. The required quality level and perhaps even the non-destructive testing method might ideally be written as part of the design specification. Of course, this would demand specialized knowledge on the part of the designer that he probably does not possess. In this case his only course of action would be to do the same thing that he does when he encounters problems in materials, or heat transfer for example, that he cannot answer, and that is to seek the most expert ad-vice which is available to him. This procedure would avoid the impasses which still occasionally occur; a design has been completed, materials are on order, fabrication is underway and suddenly it develops that the necessary non-destructive testing technique or method is either simply not available, or is unexpectedly expensive.
The application of non-destructive testing during fabrication
The constructor also bears a responsibility to use the help provided by non-destructive testing in maintaining quality in the product through vari-ous stages in the fabrication process, and to use the test results to indicate those steps in the fabrication process most likely to introduce defects in the component. Often it develops that non-destructive testing in earlier stages of component fabrication cannot be replaced economically, if at all, by inspection of the component in finished or semi-finished form. For ex-

ECONOMICAL APPLICATION OF NON-DESTRUCTIVE TESTING 129
ample, it is very difficult to make high-quality tubing from defective extrusion blanks. One radiograph of such a blank could save a great deal Of testing on the finished product as well as the time expended reducing the blank to finished tube size. These procedures, which are so obvious, are' far from being universally used, even in those firms serving the nuclear industry in the United States of America. Moreover, it often develops that the organization buying the component has no direct control over the tests the fabricator chooses to apply to the product other than the quality require-ments written in the specifications applying to the finished product. There still exists an unfortunate state of ignorance on part of the industrial com-munity (at least in the United States of America) regarding the methods and capabilities of the non-destructive testing field. Firms coming into contact with the nuclear industry for the first time are often dismayed to find a literal interpretation of specifications relating to quality prevalent, and the methods available to disclose deviations from the specified quality. It might be suspected that contracts awarded on the basis of price are often won by those organizations most ignorant of non-destructive testing be-cause, as will be discussed shortly, non-destructive testing costs can amount to a significant portion of the price of some types of components.
The inspection of tubing
From the standpoint of quality control, tubing for jacket and heat-exchanger applications represents one of the more critical components in many reactor designs. Tubing is a popular geometrical form for fuel-element cladding, and in most reactors it is highly desirable to maintain the integrity of this cladding throughout the life of the fuel element. Tube integrity in heat exchangers is nearly as important and in some cases, for instance sodium-to-water heat exchangers, absolutely essential. The nuclear industry pioneered the requirement of really high-quality tubing in consider-able quantity. Since that time, the cost of tubing inspection has become an important consideration in the cost of the tubing itself. For the purposes of this discussion, interest will be centred about tubing with a wall thickness of 2 mm or less, and about the materials zirconium and its alloys, various alloys of steel, especially the austenitic stainless steels, and certain re -fractory metal alloys.
DEFECT SPECIFICATIONS
It has been the practice at Argonne National Laboratory to write allow-able defect specifications on the basis of the maximum allowable defect depth expressed as a percentage of the tube wall. A defect is then defined as any undesirable reduction in effective wall thickness. Defect specifications have ranged from a maximum allowable defect of from 20% to depending upon the application. When standards are covered in a specification, some mention of defect length must be made, but in a statement of maximum allow-able reduction in effective wall thickness, the length is not mentioned, the presumption being that this length will be the minimum that the test equip-

130 C.J. RENKEN
ment can detect. The 10% level is most commonly used. There is some evidence indicating that the effect of defects of less than 10% of the wall upon tube strength is small enough to be obscured by other factors [1].
THE METHODS AVAILABLE FOR TUBE TESTING
The methods available for non-destructive testing of tubing to the stand-ards prevalent in the nuclear industry are the following: radiography, mag-netic particle, penetrant, ultrasonics, and electromagnetic methods. Radio-graphy is both more effective and cheaper in these applications than might be assumed. The electro-machined notches often used as standards for the ultrasonic and electromagnetic tests are invariably visible on good quality radiographs, even the 5% notches. An analysis of the cost per metre of tubing shows that radiographic inspection can often be accomplished for only slightly more than the cost of ultrasonic inspection. Deep, but very short defects and inclusions, which are a problem to the ultrasonic and electro-magnetic methods, are easily detectable on radiographs, so much so that radiography makes an ideal supplement to the former methods. It cannot be used alone, however, because the method is not capable of detecting fine cracks in many cases if they intersect the tangent to the point on the tube surface where the crack terminates at a shallow angle. The magnetic par-ticle and the penetrant methods cannot be in general considered applicable in those situations where the tests must in some degree be quantitative; in addition, the difficulty of checking the inside surface of small diameter tu-bing, the fact that most tubing used in the applications we are discussing (for the magnetic method) is not ferromagnetic, and that the penetrant method is totally incapable of detecting defects not open to a surface, remove the need for detailed comment on these two methods as applied to the inspection of large quantities of thin-walled tubing.
Both the ultrasonic method and the electromagnetic method are well adapted to production testing of large quantities of tubing. The electromag-netic (eddy-current) method is generally considered to have a great advantage in speed.
THE INFLUENCE OF NOISE AND INTERFERENCE ON ECONOMICAL INSPECTION
Inspection of tubing to the standards often specified in the nuclear in-dustry became practical by ultrasonic and electromagnetic methods when the problem of suppression of spurious defect signals was brought under control. This was accomplished in the former, and more recently in the latter method by reducing the geometrical area being scanned at a given instant to the same order of magnitude as the area of the defects themselves and incorporating a form of time discrimination against spurious signals. Inevitably, this led to a reduction in the rate of inspection. Commercial eddy-current tube-test equipment of the phase sensitive-encircling coil type produced both in Europe and the United States of America is capable of in-specting tubing at 2 m / s . With this type of equipment, there is no economic
9"

ECONOMICAL APPLICATION OF NON-DESTRUCTIVE TESTING 131
problem involved in the inspection of tubing, unless the equipment produces spurious defect signals. Tubes, which are rejected because of defects which do not exist, contribute directly to inspection cost. We will now examine the factors relating to the computation of inspection costs.
THE COMPUTATION OF COMPARATIVE INSPECTION COSTS
The direct inspection cost will be defined as the sum of the direct labour cost of the inspection plus the cost of the tubing which is wasted because of inadequacies of the test system. For reasons of simplicity we will dis-regard capital equipment costs 2 , maintenance, the value of the scrap, scheduling and, in fact, many other factors. Suppose that the indicated re-ject rate produced by a certain system is x, with a probability of a given defect indication being correctly indicated p. We assume that the test sys-tem will find every defect that exceeds the maximum allowable, or at least that it will invariably detect the standard. The problem is that it also pro-duces spurious defect indications. The probability that a defect indication is spurious is (1-p).
If the component being inspected is tubing, the amount that must be in-spected to get 100 m of good tubing is then 100/1-х m. Of this quantity, 100/1-х (1-p) metres will be wasted because of bogus defect indications as-suming a large amount of tubing is being inspected. If the tube cost (up to the point of inspection) is c / m , and if the direct inspection labour charge per hundred metres is S, tota] inspection cost is сX ( l -p) (100 / l -x )+ 100/ l -xS per hundred metres. As an example, we will compute the cost of inspect-ing austenitic stainless-steel tubing of 10-mm-diam. and 0 . 5 - m m wall-thickness by two different methods, one an ultrasonic shear-wave test which is slow but quite reliable, (p ~ 1), the other very fast. By using a very fine ultrasonic beam size and an extremely short pulse, one can obtain a test of high reliability, b,ut the longitudinal advancement of the tube passing the ultrasonic transducer may be on the order of 0. 2 mm per revolution [2]. The inspection rate will be about 0. 37 m/min, and at the labour rates pre-vailing in the United States, the direct labour cost will be about $0 .2Ó/m. The other inspection method uses commercial eddy-current test equipment, inspecting at 2 m / s [3J. Compared to the ultrasonic method this system is so fast that labour costs are negligible.
The cost of welded tubing of this diameter can be expected to be about $ 1. 5 0 / m . The amount of material that must be scrapped per defect will of course depend upon the lengths in which the tubes must be used, but for purposes of this example, we will assume that 5 m / 1 0 0 must be scrapped for defects. This figure in based upon the testing of about 1000 m of this material at the 10% level is approximately 3. 3 - m lengths with a finished length of 1 m. By use of the formula, a cost of inspection of $ 21. 00/100 m is calculated for the shear-wave method. It might be asked how reliable must the eddy-current method be to be economically competitive. For the eddy-current method,
Ф The purchase price for new electromagnetic, ultrasonic and radiographic inspection systems are all of the same order of magnitude.

132 С J. RENKEN
xp = 0. 05 S = 0 с = $ 1.50 p = ?
Since X! pi = x2p2 , where the subscripts refer to the two different methods, it is possible to calculate p = 0. 3. So, if in this case the eddy-current equip-ment is correct 30% of the time, it will be economically competitive. It is probably not necessary to point out that the true reject rate is most likely not related to the indicated reject rate by a simple constant. The quantity p is useful only in comparing the costs of two test systems. It is determined upon the basis of metallographic examination of allegedly defective compo-nents or by comparison with a system of known reliability. Evaluation of the performance of the test system itself sometimes proves to be a signifi-cant expense. Obviously such factors as the value of the scrap, expendable items, such as radiographic film, the cost of cutting out indicated defects, maintenance etc. could easily be included in the formula. The example il-lustrates that the most economical application of non-destructive testing . may favour neither the most reliable or the fastest method. As material costs rise, the most economic method will shift toward the most reliable, and as labour costs rise, the opposite becomes true. In addition, scheduling or material shortages may override all economic considerations.
THE REDUCTION OF INTERFERENCE IN ELECTROMAGNETIC TESTING
A detailed description of the causes of the interference is beyond the scope of this article, but interference can be defined as any condition in the sample which is being tested which produces a signal which can confuse, or be mistaken as a signal produced by those conditions defined in the speci-fications as "defects " . (Of course, electromagnetic methods are not the only methods plagued by interference. ) Various methods have been used to reduce the interference in electromagnetic testing. Among these are phase discrimination and filtering [4]. Another approach has been similar to that used in ultrasonic methods; that is to reduce the area being actively scanned to as small a volume as possible. This has been done by shorter encircling coils, smaller probe coils or in the approach incorporated into the electromagnetic test equipment in use at Argonne Laboratory, the fields are restricted to small cross-sectional areas by means of masks [5]. This of course reduces the. speed of the method.to the same range as that obtained by the ultrasonic method. But it also increases the reliability and discrimi-nation of this equipment to the same level as generally attained by carefully applied ultrasonic shear-wave testing. In fact, in tubing sizes and m a -terials where both methods are applicable, results obtained with the two methods correlate almost exactly [6]. The choice between the two is ba«ed upon considerations of wall thickness, conductivity, and ultrasonic propa-gation characteristics of the material. Tubes with wall thickness greater than 0. 75 mm are generally tested with ultrasonics, and those with wall thicknesses less than 0. 5 mm are tested using the pulsed electromagnetic method. Usually, either method can be used between these two limits un-less special conditions are present. In addition, on tubes with outer dia-meters less than about 0. 6 cm and walls less than 0. 75 mm, the electro-
ECONOMICAL APPLICATION OF NON-DESTRUCTIVE TESTING 133
magnetic method is used because it results in a simplification of mechanical problems such as maintaining the proper entrance angle etc.
PULSED ELECTROMAGNETIC METHODS
Pulsed fields have found little application in electromagnetic testing, probably because their use seemed to complicate the theory and instrumen-tation unnecessarily. However, the pulsed field equipment in use at Argonne has a bearing on the economical non-destructive inspection of tubing because of the simplicity and ease of application of the equipment. Its operation is briefly as follows: a strong pulsed induction field is generated in an en-closure constructed of copper or another high-conductivity material, near an aperture through which some of the flux passes. Typical aperture cross-sectional areas are in the range of 2 mm'"1. This field impinges upon the tube. A small pick-up coil is used to detect the field reflected from the test specimen. The voltage developed across a pick-up coil in the presence of a tube is then a function of the field reflected from the metal surface and in-terior. Line drawings of two types of mask-aperture assemblies are shown in Fig. 1.
The diffusion rate of current into a good conductor is relatively slow, so that an apparent delay can be detected between the surface reflection from the outer surface of the tube and the reflections from inside, including the inside surface reflection. By sampling the voltage pulse developed by the reflected field at appropriate times during its duration, it is possible to enhance or suppress information from conditions at various depths in the metal. This amplitude sampling in the time domain is one of the simplest methods of extracting information from a broadband signal, and works par-ticularly well in the case of defect detection in tubing. A block diagram of the test system is shown in Fig. 2. The amplified pulse from the pick-up is applied to the sampling circuit which permits independent amplitude sampling of the reflected pulse attwo separate instants of time. The pulse length of these sampling points is usually chosen at some time early in the duration of the reflected pulse. This point provides a signal primarily sensitive to aperture-to-metal spacing, and so can be used to adjust automatically the sensitivity of the system for changes in this spacing. The other sampling pulse can be moved about over the duration of the reflected pulse to a point in time which provides the best sensitivity to whatever condition is to be detected. A voltage proportional to the amplitude of the reflected pulse at the sampling point is applied to a filter system which has become a common feature of nearly all eddy-current tube test equipment. The output of the filter section is available for whatever type of read-out device is to be used.
This type of equipment was used to inspect several hundred metres of stainless-steel tubing of 9. 55 mm O.D. and 0. 508 mm wall, much like that cited in an earlier example. Using only one mask aperture assembly, in-spection was at a rate of 4 m/min. The standard was an I .D . longitudinal notch, 10% of the wali in depth and approximately 0. 6 mm long. By means of adjustment of the sampling pulse, equal sensitivity to O .D. and I .D. notches could be attained. About one defect every 100 m of tubing was de-tected. Some of these defects were small indentations on the inner surface.

134 С J. RENKEN
TUBE UNDER
Fig. l
Two types of mask-aperture assemblies
probably from chips being pressed into the surface by the mandrel. Direct labour costs for this inspection amounted to about $ 0. 03/m, for tubing which costs in the neighbourhood of $ 1. 50 /m. The cost of the inspection equip-ment would be about the same as for ultrasonic equipment of comparable capability. Many thousands of metres of stainless-steel tubing of O.D. 4 .46 mm and wall 0. 229 mm were tested to the same standard at a number of different rates, but the optimum rate appeared to be about 10 m/min with the probability of being correct (p) of 0. 75. Many of the defect indication areas which were sectioned and did not prove to be actual 10% reductions in the effective wall thickness were themselves deleterious, such as mill scale, projections on the inner surface caused by a pitted mandrel etc. The indicated reject rate was about 12%. This application of equipment of mod-erate speed and moderate reliability provided a very economical test even compared to the relatively low tubing costs of about $ 1. 20 /m.
THE QUESTION OF STANDARDS
The selection of standards for tube inspection depends upon the type of defect one wishes to detect, and this of course depends upon the type of ser-vice for which the tube will be used. If conditions which would reduce the effective wall strength and integrity are to be detected, and this is common in fuel-element and jacket applications, the electro-machined notch [7J is generally the most satisfactory standard. Its chief disadvantage is the ex-

ECONOMICAL APPLICATION OF NON-DESTRUCTIVE TESTING 135
MASK-APERTURE ASSEMBLY
Fig. 2
Block diagram of a pulsed electromagnetic test system
pense. It is also possible to punch narrow notches in some types of tubing which approximate the notches obtained by electro-machining [8]. This is not possible when the tube is extremely hard, or brittle, as for example some types of refractory alloys. The notch depth and length should prefer-ably be the result of a carefully planned and executed programme of long-and short-term creep and burst tests designed to simulate in-service con-ditions as closely as possible. This is practically never done. As a result the selection of standards boils down to selection of the type of artificial defect necessary to ensure fulfilment of an arbitrary specification. It is generally cheaper to test the tubing to a tighter specification than is really necessary than to execute the experiments necessary to obtain a reasonable idea of what is really required. Despite this ambiguous situation, there really is no excuse for using the long shallow I . D . and O . D . 60" notches used for so long as ultrasonic standards. These notches represent a very favourable situation compared to many natural defects, and about the only thing that can be said about tubing tested to a 1 -cm-long 60° notch is that it probably does not contain any 1-cm-long 1*0% 60° notches. This same type of notch is often used on the outer surface of the tube as an eddy-current reject standard. This is worse, considering the excess sensitivity of most

136 С J. RENKEN
eddy-current test equipment to surface defects. This is the type of standard in use by many tubing manufacturers, that is to say, those who are equipped at all. If this type of artificial defect produces too many defect signals, a practice known as "testing to the natural defect level" is initiated. This has been discussed before [9], and so will not be denounced here again. These practices will probably continue until equipment of greater discrimination between real defects and spurious signals can be obtained. There is no harm done unless the customer thinks he is buying a better test than he is in fact getting.
The discrimination and sensitivity of non-destructive tube-testing equip-ment has improved drastically within the past few years, mainly due to the use of focused transducers on ultrasonic equipment and filtering on electro-magnetic test equipment. It appears that tubing testing could be reduced significantly in cost by an increased repetition rate of commercially available equipment. Significant cost reductions in testing by present-day commercial eddy-current test equipment must be by an increase in discrimination (the factor p must approach closer to unity). Non-destructive tubing-inspection costs are not a significant item in many reactor designs. For instance, for a relatively expensive material like the zirconium alloys, with tubing costs for the 1 -cm O . D . X 0. 75-mm wall-size, currently being quoted at about $ 10/m, it hardly seems worth while to reduce the cost of the non-destructive inspection. For reactors in which cheaper material, such as stainless steel, costing in the neighbourhood of $ 0. 50/m, is used, reduced inspection costs would be beneficial, particularly if the reactor runs at a power level which makes frequent refuelling necessary.
R E F E R E N C E S
[ 1 ] KIRBY, R.F., GEAP-4095, General Electric Company, San Jose, California (1962). [ 2 ] ZUETSCHEL. M.F . and DIXON, N . E . , HW-81957, Hanford Atomic Products Operation, Richland,
Washington (1964) . [ 3 ] FORSTER, F . , Uber Fortschritte der zerstôrungsfreien Materialprüfung mit elektromagnetischen Ver-
fahren, Materialprüf., Bd.4, Nr. 11, Düsseldorf, (1962) 397-444. L4] Ibid. [ 5 ] RENKEN, C .J . , ANL-6728, Argonne National Laboratory, Argonne, Illinois (1964) . [ 6 ] RENKEN, C.J. and SELNER, R.H. , Refractory Metal Tubing Inspection Using Ultrasonic and Pulsed Eddy
Current Methods, Materials Evaluation (to be published). [ 7 ] BOWMAN, H.J. , "A Standard for Eddy Current Tests", Metal Progress, 82 1 (1962) 78-79. [ 8 ] ZUETSCHEL, M.F . and DIXON, N .E . , HW-81957, Hanford Atomic Products Operation, Richland.
Washington (1964) 5. [ 9 ] HOLT, R . C . , "Eddy Current Testing of Small Diameter Tubing," Proc. of the Third Ann. Symp. on
Non-destructive Testing of Aircraft and Missile Components (1962).
D I S C U S S I O N
R . S . SHARPE: The specification states that a defect is defined as any undesirable reduction in effective wall thickness. This suggests that the defect shape is not taken into consideration. Is this justified when consider-ing fuel cans for reactor service, where cycling of thermal or mechanical stresses may occur during the life of the fuel element?

ECONOMICAL APPLICATION OF NON-DESTRUCTIVE TESTING 137
D.C . WORLTON: Certainly, the shape of a defect affects its degree, of seriousness. The above definition is for convenience in preparing written specifications.
Z . PAWLOWSKI: Are the defect specifications based on purely geo-metrical considerations, or also on observations of the operational behaviour?
D . C . WORLTON: They are written in terms of defect geometry.


. POSSIBILITÉS OFFERTES PAR LA SPECTROMÉTRIE GAMMA DANS LE DOMAINE
DES MESURES NON DESTRUCTIVES SUR LES ÉLÉMENTS COMBUSTIBLES
C h . E N G E L M A N N , C . B R E B A N T , J . G O S S E T , J . M O N I E R E T E . R O U S S E L
C E N T R E D ' É T U D E S N U C L É A I R E S ,
S A C L A Y , F R A N C E
A b s t r a c t — R é s u m é — А н н о т а ц и я — R e s u m e n
POTENTIALITIES OF GAMMA-SPECTROMETRY IN NON-DESTRUCTIVE MEASUREMENTS ON FUEL ELEMENTS. For several years past we have been studying the application of gamma spectrometry to the problems of non-destructive determination of the burn-up of irradiated fuels. Research shows: (1) That Pri". the daughter element of Ce114 with a half-life of 290 d, can be particularly recommended for determining the number of fissions ascribable to U235. Its gamma radiation, of very high energy, is such that it can easily be detected in the presénce of other fission products after a short cooling period. (2) That in the same conditions, taking into account the fission yields, Rh106, the daughter of Ru106 with half-life 370 d, can be used to measure the fissions characteristic of Pu239. Thus, simultaneous measurement of the y-ray intensities of Pr144 and Rh106 would make it possible to determine the burn-up of U235; and the pu239 content of the fuel.
The reasons which led to the choice of the two gamma emitters mentioned are discussed in the paper. The equipment which has been installed is described. An account is also given of the results already obtained, and of the practical possibilities and the limitations of the method. •
POSSIBILITÉS OFFERTES PAR LA SPECTROMÉTRIE GAMMA DANS LE DOMAINE DES MESURES NON DESTRUCTIVES SUR LES ÉLÉMENTS COMBUSTIBLES. Depuis plusieurs années déjà, les auteurs étudient l'application de la spectrométrie y aux problèmes de détermination non destructive des taux de combustion des combustibles irradiés. De leurs recherches, il découle que: a) 144Pr, produit de filiation de 1 4 4Ce, avec une période de 290 j , est particulièrement indiqué pour les déterminations du nombre de fissions imputables â l'uranium-235. Son rayonnement y de très grande énergie est tel qu'il peut être détecté aisément en présence des autres produits de fission émetteurs après une courte période de refroidissement. b) Dans les mêmes conditions, compte tenu des rendements de fission, 106Rh, produit de filiation de 106Ru, avec une période de 370 j , peut être utilisé pour mesurer les fissions caractéristiques du plutonium-239. Il s'ensuit que des mesures simultanées des intensités des raies de ш Prêt de 106Rh pourraient permettre de déterminer la combustion en uranium-235 et la teneur du combustible en plutonium-239.
Dans le mémoire, les auteurs discutent les raisons qui ont guidé leur choix sur les deux émetteurs y précités. Ils décrivent les équipements réalisés. Ils exposent les résultats déjà obtenus, les possibilités pratiques et les limitations de la méthode.
ВОЗМОЖНОСТИ, О Т К Р Ы В А Е М Ы Е Г А М М А - С П Е К Т Р О М Е Т Р И Е Й В О Б Л А С Т И Н Е -Д Е С Т Р У К Т И В Н О Г О КОНТРОЛЯ ТОПЛИВНЫХ Э Л Е М Е Н Т О В . В течение нескольких лет исследовали применение гамма-спектрометрии к проблемам недеструктивного контроля глу -бины в ы г о р а н и я о б л у ч е н н ы х топливных э л е м е н т о в . И с с л е д о в а н и я привели « ' в ы в о д а м :
1. Празеодим-144 , являющийся продуктом распада церия-144 с периодом 290 дней особенно указывает на определение количества делений, приходящихся на уран 235. Его гам-ма-излучение с очень большой энергией таково, что оно может быть легко обнаружено в при-сутствии других излучателей, которые являются продуктами деления после короткого периода охлаждения.
2. В тех же самых условиях, с учетом выхода продуктов деления родий-106, являющийся продуктом деления рутения-106, с периодом 370 дней может быть использован для измерения характерных количеств делений плутония-239.
139
140 Ch. ENGELMANN et al.
Таким о б р а з о м , одновременные измерения интенсивностей лучей празеодина-144 и родия-106 могли бы позволить определить выгорание урана - '¿'ЛЬ и содержание плутония-'^ЗУ в топливе .
В докладе о б с у ж д а ю т с я причины, приведшие к в ы б о р у двух в ы ш е у п о м я н у т ы х г а м м а -и з л у ч а т е л е й . Д а е т с я описание с о з д а н н о г о о б о р у д о в а н и я . Приводятся полученные р е з у л ь -т а т ы , практические в о з м о ж н о с т и , а также пределы применения н о в о г о м е т о д а .
POSIBILIDADES DE LA ESPECTROMETRIA GAMMA EN LA MEDICION NO DESTRUCTIVA DE ELEMENTOS COMBUSTIBLES. Desde hace varios aflos se viene estudiando en este Centro la aplicación de la espectro-metría gamma a la determinación no destructiva del grado de combustión de combustibles irradiados. De esos estudios, se desprenden las siguientes conclusiones: 1. El 144Pr, descendiente del ш С е , de período 290 días, es particularmente indicado para determinar el número de fisiones atribuible al 235 U.
Su-radiación gamma de muy alta energía se puede detectar fácilmente en presencia de otros productos de fisión emisores gamma después de un breve período de enfriamiento. 2. En iguales condiciones, y teniendo en cuenta los rendimientos de fisión, las fisiones características del ¡39PU pueden medirse con ayuda del 106Rh, descendiente.del 106 Ru de período 370 días. Así, pues, midiendo-simultáneamente la intensidad de los rayos gamma del 144Рг y del 106Rh, podría determinarse el grado de combustión del S 5 U y la proporción de 239 Pu contenida en el combustible.
En la memoria se discuten los motivos a que obedece la selección de los dos emisores de rayos gamma arriba mencionados. Se describen los experimentos realizados; además, se exponen los resultados obtenidos, las posibilidades prácticas y las limitaciones del método.
1. INTRODUCTION
En technologie nucléaire les méthodes d'analyse non destructives sont certainement plus avantageuses encore que dans toutes les autres branches scientifiques ou industrielles.
Cela se conçoit quand on considère les très grande^ activités radio-actives mises en jeu et, par conséquent, les difficultés introduites par les-opérations de prélèvements systématiques de petits échantillons.
D'autre part, et cela est plus important encore, les méthodes non des-tructives sont aptes à fournir des données sur toute une cartouche sans la détruire, de sorte qu'il est toujours possible de mesurer périodiquement le degré de consommation de matière fissile d'un élément combustible.
Rappelons que le taux de combustion d'un élément ne doit atteindre en aucun endroit une valeur supérieure à une limite imposée par des considé-rations métallurgiques. Si le gradient du taux de combustion le long de l'élé-ment n'est pas négligeable, le rendement d'exploitation économique de l 'élé-ment se trouve diminué. Il est donc essentiel que la répartition du taux de combustion tout au long d'un élément soit uniforme, de façon qu'on puisse en tirer le maximum d'énergie.
Il est bien évident que dans un réacteur le flux de neutrons n'est pas le même partout, de sorte que certains éléments peuvent être irradiés dans des conditions très peu avantageuses.
Ainsi le fait qu'on puisse déterminer le gradient du taux de combustion le long d'une cartouche par des méthodes non destructives est très intéres-sant. En effet, en examinant systématiquement toutes les cartouches on peut les changer de place dans le réacteur en fonction des résultats de mesure obtenus, de façon que le taux de combustion soit partout le même, d'où une meilleure exploitation des barreaux de combustible.

SPECTROMÊTRIE GAMMA 141
D'ailleurs on pourra même éventuellement dessiner, d'après ces mesures, de nouveaux éléments, afin que ces conditions primordiales sur le plan énergétique et économique soient satisfaites.
On comprend ainsi que de tels équipements de mesure soient indispen-sables auprès de chaque installation nucléaire de recherche et de puissance.
2. APERÇU THÉORIQUE
La production totale de chaque produit de fission tout au long du séjour de l'élément dans le réacteur est directement proportionnelle à la consom-mation de matière fissile. De sorte que cette grandeur, donc le taux de combustion, peut se déduire de la mesure de la quantité totale produite pen-dant l'irradiation d'un produit de fission.
Dans le cas particulier, qui seul est intéressant d'ailleurs, où le produit de fission considéré est obtenu directement, ou en équilibre radio-actif avec son ascendant, l'aspect mathématique du problème peut se résu-mer dans la relation suivante:
e i F - X¡ Ni - <MN,). (1)
où dNi/dt est la vitesse de formation de l'espèce i; a ¡ son rendement de fission; X; sa constante de désintégration; Nj le nombre d'atomes présents à l'instant considéré; ^¡(N¡) un terme correctif qui tient compte de la disparition de l'espèce i
par capture neutronique (pour les nucléides dont les sections effi-caces sont inférieures à une centaine de Permis, il peut être absolument négligé, ce qui est pratiquement le cas pour ceux qui nous intéressent);
F est le nombre de fissions par seconde.
2.1. Principe du calcul du nombre de fissions en première approxima tion
Le cas le plus simple est évidemment celui où a¡ et F sont supposés constants tout au long de l'irradiation. De sorte que si l'on néglige le terme ipi (Nj), l'intégration de (1) donne
NiT = ^ j - F [ l - e x p ( - X ¡ t ) ] e x p ( - X Í T ) . (2)
t est la durée d'irradiation; T celle de refroidissement; N1T le nombre d'atomes de l'espèce i présents à l'instant T. N iT peut se mesurer, puisque l'activité radioactive qui s'y rattache est
NIT X¡. Comme toutes les grandeurs figurant dans (2) sont connues sauf F, cette relation permet de calculer F, et par conséquent le nombre de fissions F X t.

142 Ch. ENGELMANN et al.
2. 2. Cas général
La relation (2) ci-dessus ne peut être qu'approximative, pour diverses raisons. Tout d'abord F n'est jamais constant tout au long de la vie d'un élément dans le réacteur. Indépendamment des fluctuations locales de flux de neutrons, F varie en fonction de la combustion même. Mais la variation la plus importante est indiscutablement liée aux déplacements que peuvent subir les diverses cartouches dans le réacteur au cours de leur utilisation. Enfin le rendement de fission o¡ dépend du spectre de neutrons; il varie donc avec l'évolution de ce dernier. Comme pour F, a ¡ dépend aussi de l'endroit du réacteur où est placée la cartouche. Néanmoins ses variations peuvent être négligées si l'on choisit convenablement le produit de fission sur lequel portent les mesures.
La relation simplifiée (2) doit donc être remplacée par l'expression plus générale
N i T = (M^F, tJexpt-XjT). (3)
Le calcul du nombre total de fissions devient alors très complexe. Le régime de fonctionnement du réacteur doit être connu. De toute façon ce calcul, s ' i l est possible, n'a de sens que dans la mesure où la durée d ' ir -radiation n'excède pas deux à trois périodes du nucléide déterminé.
Si cette période est très supérieure au temps de séjour dans le réacteur (à un facteur 10 près, ou moins) l 'expression (3) se simplifie et devient
N iT = J a t F dt exp(- X ¡T), (4) о
de sorte que si l'on peut considérer or i comme constant pendant la durée d'irradiation, le nombre total de fissions est donné par la relation
t
f F d t = NiX exp (X i T ) . (5) J 0
- 3. CRITÈRES INTERVENANT DANS LE CHOIX DU PRODUIT DE FISSION A DÉTERMINER QUANTITATIVEMENT
D'après les considérations développées ci-dessus, il faut que le produit de fission à choisir satisfasse aux conditions suivantes: a) Section efficace de capture neutronique très faible. b) Rendement de fission a¡ très grand et très peu variable en fonction du
spectre de neutrons. c) Période de décroissance très grande. Les calculs sont d'autant plus
simplifiés et exacts que les durées d'irradiations sont petites par rapport à la période.

SPECTROMÊTRIE GAMMA 143
d) Sa diffusion dans l'élément combustible et dans la gaine doit être très faible en fonction du temps, pour la température de fonctionnement exis-tante. S'il migre vers des endroits privilégiés, les valeurs apparentes de taux de combustion ainsi déterminées peuvent être très différentes des valeurs réelles.
e) L'énergie du rayonnement y émis doit être très élevée, d'une part pour que le pic photoélectrique sur lequel portent les mesures soit tou-jours nettement visible en présence des activités des autres produits de fission, d'autre part pour que l'absorption dans l'élément combustible lui-même du rayonnement à détecter ne soit pas trop importante. Quand on considère l'ensemble des produits de fission, on s'aperçoit
que les conditions impératives ci-dessus ne sont satisfaites pratiquement que pour deux éléments: 1 4 4Pr, descendant de m* Ce (période 290 j) et i°6Rh descendant de 106Ru (période 370 j).
Le tableau I résume les principales caractéristiques nucléaires de ces isotopes. Ces constantes sont extraites de 11]. Deux spectres y, de 106 Ru - io6Rh et de i44Qe- i44pr respectivement, ont été obtenus à partir de préparations particulièrement pures (fig. 1 et 2).
Ces valeurs montrent que le pic de I44pr à 2, 18 MeV peut convenir aussi bien pour les combustibles à base d'uranium-235 que pour ceux à base de plutonium-239.
De toute façon une chose est évidente, d'après ces constantes et les spectres y donnés, c'est que 106Rh ne peut en aucune façon interférer avec 144pr.
Par contre, le fait que les rendements de fission de i°6Ru sont très dif-férents pour l'uranium et le plutonium pourrait être exploité pour mettre au point des méthodes de mesures sélectives. En effet 10SRu étant plus spéci-fique de la fission du plutonium, de sa mesure et de celle dei44pr on pourrait déduire a) pour un combustible à uranium naturel ou peu enrichi, lé taux de com-
bustion de l'uranium-235 et celui dû au plutonium-239 formé pendant l'irradiation, de sorte que de cette dernière détermination découle la quantité de plutonium existant dans le combustible;
b) pour un combustible mixte contenant à la fois de l'uranium-235 et du plutonium-239, les taux de combustion individuels imputables à chaque type de matière fissible. Afin de délimiter exactement le champ d'application des méthodes pro-
posées ci-dessus, nous poursuivons actuellement des expériences relatives à des combustibles irradiés à des taux de combustion croissants, à base d'uranium et de plutonium avec des taux respectifs d'enrichissement divers.
4. DISPOSITIFS DE COMPTAGE
Les installations que nous avons utilisées dans nos études préliminaires sur les cartouches EL3 sont décrites dans une publication [2].
Rappelons brièvement que le barreau est introduit dàns un château comp-teur spécial et défile devant un système de diaphragmes constitué par trois fentes de largeurs réglables disposées entre la zone mesurée du combustible et le compteur. Entre la deuxième et la dernière fente, des écrans amovibles
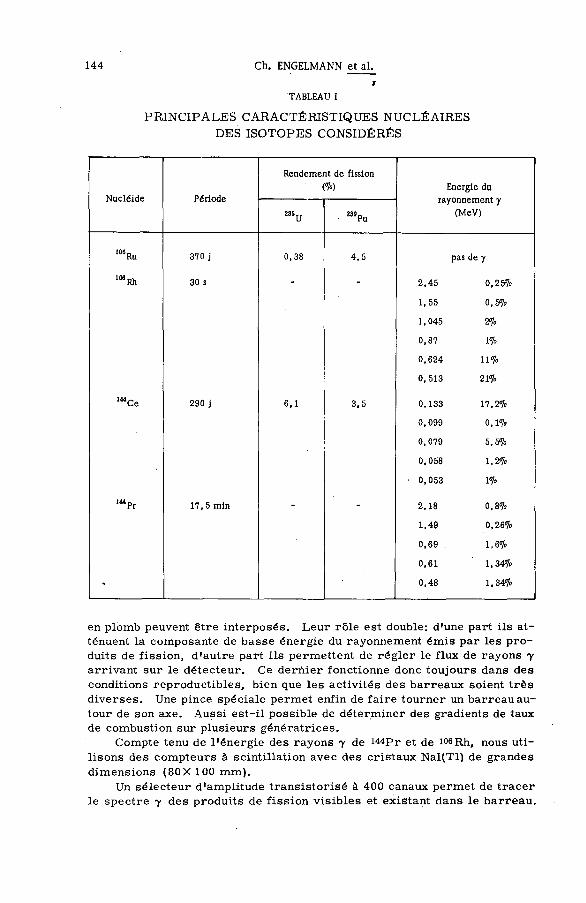
1 4 4 C h . E N G E L M A N N e t a l .
г TABLEAU I
PRINCIPALES CARACTÉRISTIQUES NUCLÉAIRES DES ISOTOPES CONSIDÉRÉS
Nucléide Période
Rendement de fission (%)
"Pu
Energie du rayonnement y
(MeV)
"Ru
Rh
Ce
•Pr
370 j
30 s
290 j
17, 5 min
0,38 4 , 5
6,1 3,5
pas de y
2 ,45 0,25%
1,55 0,5%
1,045 2%
0,87 1%
0,624 11%
0,513 21%
0,133 17,2%
0,099 0,1%
0,079 5,5%
0,058 1,2%
0,053 1%
2,18 0,8%
1,49 0,26%
0,69 1,6%
0,61 1,34%
0,48 1,34%
en plomb peuvent être interposés. Leur rôle est double: d'une part ils at-ténuent la composante de basse énergie du rayonnement émis par les pro-duits de fission, d'autre part ils permettent de régler le flux de rayons y arrivant sur le détecteur. Ce dernier fonctionne donc toujours dans des conditions reproductibles, bien que les activités des barreaux soient très diverses. Une pince spéciale permet enfin de faire tourner un barreau au-tour de son axe. Aussi est-il possible de déterminer des gradients de taux de combustion sur plusieurs génératrices.
Compte tenu de l'énergie des rayons y de i44pr et de io6Rh, nous uti-lisons des compteurs à scintillation avec des cristaux Nal(Tl) de grandes dimensions (80X 100 mm).
Un sélecteur d'amplitude transistorisé à 400 canaux permet de tracer le spectre y des produits de fission visibles et existant dans le barreau.

SPECTROMÊTRIE GAMMA 145
Figure 1
Spectre g a m m a du 1 0 6Ru+ 1 0 6Rh.
Enfin son utilisation en fonctionnement multi-échelle est particulièrement appréciable pour la détermination automatique des gradients, le défilement mécanique du barreau étant en synchronisme avec le déplacement des ca-naux. Il est bien entendu qu'un dispositif de sélection précède l'enregistre-ment, afin que les mesures portent sur le radionucléide prédéterminé.
Deux nouvelles installations sont en cours de réalisation, l'une au LECI à Saclay, la seconde au LECA à Cadarache. Leurs points communs sont les suivants: a) Les mesures sont faites dans des cellules de très haute activité con-
ventionnelles. Un tunnel percé dans la porte arrière contient lé sys -tème de fentes et d'écrans absorbants. Le compteur placé au bout de ce tunnel est donc hors cellule.
b) Les barreaux défilent devant les diaphragmes à l'intérieur de la cellule. Il est donc possible de suivre la position du barreau à travers les vitres blindées en même temps que s'enregistre le taux de combustion.
c) Les barreaux peuvent se déplacer linéairement suivant deux directions
v 1 0

146 Ch. ENGELMANN et al.
F i g u t e 2
Spectre gamma du 144Ce + 144Pr.
perpendiculaires X Y . Ils peuvent également tourner autour de leur axe. La possibilité de faire tourner le barreau pendant son déplacement longitudinal est très précieux puisque, à partir de ce mouvement héli-coïdal, la courbe de répartition, du taux de combustion obtenue est très représentative du taux de combustion global de l'élément,
d) Ces nouveaux dispositifs sont prévus avec deux systèmes de fentes ré-glables et perpendiculaires. Des mesures pontuelles sont donc possibles. L'appareillage peut également servir pour des mesures de taux de com-bustion sur des échantillons de petites dimensions. Ainsi, avec ces installations qui possèdent de par leur construction un
caractère d'emploi universel, il est possible de mesurer les gradients de tous les combustibles actuellement existants. En outre, puisque des mesures ponctuelles sont envisagées, il sera également possible de déterminer le gradient radial d'un barreau cylindrique en découpant des rondelles aux en-

SPECTROMÊTRIE GAMMA 147
droits intéressants. Ce genre d'expérience présente un intérêt évident. On' sait en effet que dans un combustible à uranium naturel déjà, les couches superficielles font écran aux neutrons. Par ce mécanisme le taux de com-bustion doit passer par un minimum sur l'axe du cylindre si l'élément a cette symétrie. Cet effet est d'autant plus important que le taux d'enrichissement est plus élevé. Par conséquent des mesures du gradient radial deviennent indispensables, ne serait-ce que pour connaître avec précision la grandeur de la dépression de flux au coeur des éléments.
5. ÉTALONNAGE DES INSTALLATIONS
Deux types d'étalonnages peuvent être considérés: a) Tout d'abord celui que nous utilisons couramment et qui consiste à dé-
couper une rondelle dans un barreau préalablement mesuré. Cette rondelle, pesée avec précision, est dissoute dans une solution acide et une analyse ab-solue de la quantité de i44Ce ou d'un autre produit de fission est effectuée. L'efficacité de détection du dispositif s'en déduit. En faisant intervenir le rendement de fission a ¡ , on peut étalonner l'installation pour des con-ditions d'irradiation et de refroidissement données, directement en taux de combustion. Ce type d'étalonnage repose évidemment sur la validité des calculs, et surtout sur la bonne connaissance de o ¡ .
b) On peut aussi, et cela nous semble beaucoup plus rationnel, découper une rondelle après une première mesure, et, par spectrométrie de masse, déterminer la baisse de teneur en uranium-235 et éventuelle-ment l'enrichissement en plutonium. Les activités mesurées avec le dispositif peuvent donc être reliées directement aux grandeurs qui nous intéressent. Les expériences en cours reposent exclusivement sur cette dernière
méthode d'étalonnage.
6. CONCLUSION
La spectrométrie y sur des produits de fission comme H4Pr et i06Rh est donc apte à fournir aux spécialistes intéressés des renseignements très utiles sur l'irradiation des éléments combustibles. Les études complé-mentaires en cours nous permettront de montrer dans quelles conditions des mesures simultanées des pics de I44pr et de ^ p e u v e n t servir au calcul de l'appauvrissement en uranium-235 et de l'enrichissement en plutonium-239, par des méthodes non destructives.
Les méthodes de mesure proposées seront encore beaucoup plus inté-ressantes dans quelque temps, en raison du développement des détecteurs à semi-conducteur.
L'utilisation de dispositifs à anticoincidence appliqués exclusivement au problème des mesures sur éléments combustibles [3] permettra de dé-terminer simultanément plusieurs produits de fission, compte tenu de la très haute résolution qui caractérise ces détecteurs.

148 Ch. ENGELMANN et al.
Ces nouvelles techniques de mesure sont prévues pour l'exploitation des cellules dont nous avons esquissé le principe, conjointement avec le dé-pouillement automatique des résultats de mesure par calculateur électronique.
R É F É R E N C E S
[ 1] MALET, G. , Rapport CEA n° 2226 (1962). [2 ] ENGELMANN, Ch. et PETIT, J.F. , Rapport CEA n° R 2542 (1964). [ 3 ] HOLM, D.M. and SANDERS, W.M., «ASemiconductor AnticoincidenceDetectorSystem», Radiochemical
Methods of Analysis II, IAEA, Vienna (1965) 81.
D I S C U S S I O N
P. de MEESTER: What width of electron window do you use in order to avoid the influence of other peaks?
C. ENGELMANN: Before taking any measurement, we make a y — spectrum with a multichannel selector. The single-channel selector which forms part of this equipment is then adjusted to the peak of the isotope con-cerned. The movement of the fuel rod is synchronized with the displace-ment of the channels of the selector working as a multichannel unit. The form of the burn-up profile along the length of the fuel element is thus di-rectly recorded in the memory of the electronic apparatus.
P. de MEESTER: Is the measurement of the caesium peak representa-tive of the burn-up distribution, in view of migration effects?
C. ENGELMANN: It is quite probable that Cs*37 cannot be used to de-termine burn-up distribution, owing to the importance of migration, which itself depends on the temperature of the fuel element in the reactor. For this reason we use above all Pri4 4 , the daughter element of Ce144, which is reputed to diffuse only to a small extent. It is incidentally part of the purpose of the present experiments to demonstrate this diffusion of Cs*3 3
and make apparent the difficulties involved in using this isotope for non-destructive measurement of burn-up, especially for elements operating at high temperature,
P. de MEESTER: I believe the Commissariat à l 'Energie Atomique is also carrying out radiographic tests on burn-up distribution. Have you compared the relative advantages of the two method?
C. ENGELMANN: I do not know the method you mention, and in fact do not see how radiography can be used to determine burn-up distribution.
R. S. FORSYTH: Did you notice any increase in the Pri44 peak due to pile-up of other gammas, say, the Zr 9 5 0.7 5-MeV activity?
C. ENGELMANN: As I explained in my paper, between the scintillator and the fuel element we insert, if necessary, lead absorbing screens, so that the radiation entering the Nal(Tl) crystal is filtered. Thus in the pre-sence of very high activity of isotopes giving -y-rays of energy less than about 1 MeV, it is possible to attenuate this component of the radiation selectively in favour of the high-energy component containing the Pr1 4 4 . Since the sum-mation pulses are produced solely in the counting equipment, the filtering

SPECTROMÊTRIE GAMMA 149
by the lead screens practically eliminates this effect if the activities become too considerable.
R. S. FORSYTH: What was the width of slit collimator used? C. ENGELMANN: Our equipment is designed to permit continuous vari-
ation of the slit width from 0.1 mm to about 10 mm. This is done very accu-rately by a micrometer control.


MESURES DIMENSIONNELLES ET DÉTECTION DES DÉFAUTS
С . B R E B A N T , R . H U I L L E R Y E T E . R O U S S E L
C E N T R E D ' É T U D E S N U C L E A I R E S D E S A C L A Y , F R A N C E
A b s t r a c t — R é s u m é — А н н о т а ц и я — R e s u m e n
DIMENSIONAL MEASUREMENTS AND FLAW DETECTION. Non-destructive tests on Irradiated fuels are carried out in concrete cells in the very high- activity laboratories at Saclay and Cadarache. The equipment in use can be used for all types of fuel. .
The cells used for these tests contain the following equipment: Radiographic equipment scanning either around or along the sample; leak-testing equipment; observation
equipment; and standard róetrological equipment. Radiography and leak testing are discussed. For the rotary scanning equipment, the slugs are X-rayed with a Philips Majorix-300 projector and the
films are introduced into the X-ray beam via an aperture in the rear door. The fiim exposure time is regulated by a rocker. The slug is placed in the beam by heavy remote-handling equipment. Several emulsions are available, the one most suited to the specific activity of the fuel being selected.
The results obtained to date are excellent, and it is hoped that they can be improved still further by the adoption of a new type of equipment scanning along the sample, whose operation is described in the paper.
The leak test is carried out in a transparent vessel which may contain either ethylene glycol or white spirit. Leaks are detected by progressive evacuation. Surface bubbling is éliminated by various methods of treating the surface of the slugs. For detecting microleaks the fuel is previously pressurized in a bath of helium at 35 kg(cm2). This equipment is satisfactory, and makes it possible to produce photographic record locating the leak.
MESURES DIMENSIONNELLES ET DÉTECTION DES DÉFAUTS. Les essais non destructifs sur combustibles irradiés sont effectués en cellule de béton dans les laboratoires de très haute activité de Saclay et de Cadarache. Les appareils utilisés s'adressent à tous les types de combustibles.
Les cellules réservées à ces essais contiennent les appareils suivants: un appareil de radiographie par basculement ou par défilement; un appareil de test d'étanchéité; des appareils d'observation; un outillage de métrologie de type classique.
Les auteurs traitent dans le mémoire la radiographie et le test d'étanchéité. Pour les appareils par basculement, la radiographie des cartouches est faite à l'aide d'un projecteur
Philips Majorix 300 et les films sont introduits dans le faisceau X par une ouverture de la porte arrière. Le temps d'exposition du film est réglé par un basculeur. La cartouche est placée dans le faisceau par télé-manipulateur lourd. On dispose de plusieurs émulsions dans lesquelles ont choisit celle convenant à l'activité spécifique du combustible.
Les résultats obtenus actuellement sont excellents et on espère les améliorer par l'adoption d'un nouvel appareil par défilement, dont le principe est décrit dans le mémoire.
Le test d'étanchéité est réalisé dans un récipient transparent pouvant contenir, soit de Гéthyl-glycol, soit du white spirit. Les fuites sont détectées par mise sous vide progressive. Les inconvénients des débullages parasites sont éliminés par divers tráitements de surface des cartouches. Lorsqu'il importe de détecter des microfuites, on pratique la pressurisation préalable du combustible dans un bain d'hélium à 35 kg (cm2). Cet appareil est satisfaisant et permet la prise de documents photographiques localisant la fuite.
КОНТРОЛЬ Р А З М Е Р О В И ОБНАРУЖЕНИЕ ДЕФЕКТОВ. Испытания б е з разрушения образцов облученного топлива проводились в бетонной камере горячих лабораторий в Сакле и Кадараше. Использованные в процессе работы приборы предназначались для в с е х видов топлива.
В камерах, которые были отведены для этих опытов, имелись следующие приборы: при-бор для радиографии при вращательном и плавном перемещении образцов; прибор для испы-тания на герметичность ; приборы наблюдения; метрологическая аппаратура обычного типа.
151

152 С. BREBANT et-al.
Мы р а с с м а т р и в а е м з д е с ь радиографию и испытания на г е р м е т и ч н о с т ь . В отношении приборов скеннирования с помощью вращения,радиография топливных э л е -
ментов производится проектором Филипс Маджорикс 300 , когда пленки пропускают под пуч-ком рентгенолучей через о т в е р с т и е в задней дверце. Время облучения пленки регулируется опрокидывателем. Топливный элемент вводится в пучок тяжелым дистанционным манипуля-т о р о м . И с п о л ь з у е т с я несколько э м у л ь с и й , из числа к о т о р ы х выбирается такая , которая с о -о т в е т с т в у е т удельной активности топлива . Полученные р е з у л ь т а т ы являются отличными, однако е с т ь в о з м о ж н о с т ь их улучшить с помощью н о в о г о прибора, который о п и с ы в а е т с я в докладе .
Опыт п р о в о д и т с я в прозрачной е м к о с т и , которая м о ж е т с о д е р ж а т ь либо этилгликоль , либо спирт . Утечки обнаруживаются в результате постепенного создания вакуума. Помехи, связанные с вредными выделениями пузырьков , у с т р а н я ю т с я в р е з у л ь т а т е различной о б р а -ботки поверхности топливных э л е м е н т о в . Для обнаружения микроутечек используют пред -варительный наддув топлива с давлением 35 кг ( см 2 ) в гелиевой ванне. Э т о у с т р о й с т в о я в -л я е т с я у д о в л е т в о р и т е л ь н ы м и позв оляет получать ф о т о д о к у м е н т ы с локализацией у т е ч к и .
MEDIDAS DIMENSIONALES У DETECCION DE FALLAS. Los ensayos no destructivos de combustibles irradiados se llevan a cabo en celdas de hormigón, en los laboratorios de muy alta actividad de Saclay y de Cadarache. Los aparatos èn servicio se utilizan para todos los tipos de combustible.
Las celdas reservadas para estos ensayos contienen .os siguientes dispositivos: un aparato de radiografía por rotación o por avance lineal: un aparato para prueba de estanqueidad: aparatos de observación; instru-mentos de medición del tipo clásico.
Esta parte de la memoria se refiere a la radiografía y a la estanquidad. En los aparatos por rotación, la radiografía de los elementos combustibles se realiza con ayuda de un
proyector Philips Majorix 300 y las películas se introducen en el haz de rayos X por una abertura de la puerta trasera. El tiempo de exposición de la película se regula mediante un contrapeso. El elemento se coloca en el haz con ayuda de un manipulador a distancia, del tipo pesado. Se dispone de varias emulsiones, entre las cuales se elige la que más se adapte a la actividad especifica del combustible.
Los resultados obtenidos hasta la fecha son satisfactorios y se espera mejorarlos afin más adoptando un nuevo aparato de avance lineal, cuyo principio se describe en la memoria.
La prueba de estanquidad se realiza en un tanque transparente que puede contener eti l -gl icol , o bien esencia de trementina artificial. Los escapes se ponen de manifiesto aumentando gradualmente el vacío . Los inconvenientes derivados del desprendimiento de burbujas parásitas se eliminan mediante diversos trata-mientos aplicados a la superficie de los elementos. Cuando se trata de detectar microescapes, se somete previamente el elemento combustible a una presión de35kg(cm2), en bailo de helio. Este aparato da resultados satisfactorios y permite tomar fotografías a fin de localizar los escapes.
I. RADIOGRAPHIE
1. Equipement de radiographie du LECI (fig. 1)
Principe • ' • • •
Il s'agit d'une projection èonique. La source de rayons X, l'objet et le film sont fixes pendant la radiographie.
Description de l'appareillage
a) A l'intérieur de la cellule La source de rayons X est constituée par un Majorix 300. L'objet à
radiographier est posé sur un chariot mobile permettant de le mettre en position. Le film, placé dans une cassette, est introduit dans la cellule par la porte arrière. La cassette est placée à cet endroit sur un basculeur,

MESURES DIMENSIONNELLES 153
a)
Figure 1
Cellule de radiographie LECI.

154 С. BREBANT et-al.
derrière une forte épaisseur de plomb qui la protège du rayonnement émis par l'objet. Le basculeur amène le film à proximité de l'objet et actionne simultanément un contact électrique qui provoque l'effacement de l'obturateur de la source de rayons X. La radiographie terminée, le retour du basculeur est commandé soit par une minuterie, soit par l'opérateur.
b) A l'extérieur de la cellule Nous avons placé à l'extérieur tous les appareillages annexe:
- les générateurs, - la pompe à huile de refroidissement, - le pupitre de commande du tube de rayons X, - le pupitre de commande des déplacements du chariot.
С aractéristique s
- Tube Majorix 300: petit foyer = 4 mA, 300 kV, grand foyer = 10 mA, 300 kV,
- Dimensions des foyers: petit foyer = 1 ,5X 1,5 mm. grand foyer = 4 X 4 mm,
- Distance foyer-film: 600 à 900 mm, - Distance film-objet: 60 à 105 mm.
Types de films utilisés
Jusqu'à ce jour nous avons utilisé trois types de films: - Structurix D 2 (Gevaert), - JR 175-3 (Kodak), - DX 685 (Kodak).
Le structurix D 2 est d'un emploi courant dans la radiographie ordinaire. Il est cependant utilisé avec succès jusqu'à des activités de 10 000 R/h et des temps de pose de l'ordre de 10 s. Au-delà, il est nécessaire d'utiliser des films dont la sensibilité au rayonnement y est diminuée. Ce sont les films JR 175-3 et DX 685. Les temps de pose sont alors beaucoup plus longs (plusieurs minutes), mais les résultats sont bons. L'expérience que nous avons ne nous a pas permis de définir les limites exactes de ces films, mais on peut penser que le DX 685 permet de bonnes radiographies d'objets ayant une activité voisine de 40 000 R/h dans les conditions de notre appareillage.
Ces fi lms peuvent être utilisés avec ou sans écrans renforçateurs. Remarque: La firme Kodak continue ses recherches sur ce type de film et a déjà obtenu des résultats pour la radiographie d'objets ayant des activités supérieures à celles indiquées ci-dessus.
2. Equipement de radiographie du LECA (fig. 2)
Nous avions au LECA une installation analogue, que nous avons rem-placée par une radiographie de défilement.
Dans ce dispositif, le film, placé en canette, défile en même temps qu'un barreau combustible; ils sont placés de part et d'autre d'une protec-tion 7 , devant une source X . Une fente étroite, placée verticalement dans

MESURES DIMENSIONNELLES 155
Figure 2
Radiographie par défilement.
1. Elément radioactif 6. Fenêtre à ouverture réglable 2. Berceau 7. Cassette 3. Bloc mécanisme à deux sorties 8. Générateur de rayons X 4. Tringlerie 9. Chariot 5. Ecran en dénal 10. Commande manuelle
la protection y et située dans l'axe des X , laisse passer ceux-ci pour im-pressionner le film.
Caractéristiques principales
- Source X: 0 à 10 mA, 0 à 300 kV, - Foyer de 1 , 5 X 1 , 5 mm ou 4 X 4 mm, - Distance des X à l'axe du combustible: 400 à 1200 mm, - Distance du film à l'axe du combustible: 170 mm, - Epaisseur de la protection: 100 mm, - Largeur de fente: de b à 10 mm.
La fenêtre peut s'ouvrir jusqu'à 100 mm pour permettrel'examenradios-copique à l'aide d'un écran fluorescent et d'un périscope. La vitesse de défilement est d'environ 10 à 15 min pour un élément de 600 mm. Le barreau est réglable en hauteur sur son support.
3. A vantages et inconvénients des deux procédés
La radiographie globale par basculement laisse l'élément fixe sur son support. La prise de la photo radiographique est rapide. L'inconvénient

156 С. BREBANT et-al.
majeur est la projection conique du barreau sur le film. Les déformations vont croissant de part et d'autre de l'axe des X .
La radiographie par défilement nécessite la translation simultanée dans un rapport de vitesse constant du barreau et du film, ce qui est réalisé par une liaison mécanique. Le flou de défilement est donné par le rapport des distances, source d'X à f i lm/source d ' X à barreau. Le flou géométrique est fonction des dimensions du foyer. Le temps d'exposition est plus long.
On obtient par ce dispositif des films radiographiques sur lesquels l'on peut mesurer correctement des longueurs. Théoriquement la précision de la mesure est limitée par la valeur totale du flou, soit en moyenne 0, 3 mm. En réalité, la réflexion et la diffraction des X sur les arêtes du métal lourd du barreau peuvent amener un grandissement optique de l 'image de 1 à 3 /10 de mm.
4. Conclusion
Pour diminuer le flou et améliorer la finesse de l'image, on a intérêt à avoir un générateur X à très petit foyer et une distance barreau-film ré -duite, donc à prendre pour écran y un métal très lourd.
Il semble que la précision de mesure peut varier de 1 à 3 / 1 0 m m .
II. TEST D'ÉTANCHtílTÉ (fig. 3)
1. Test d'étanchéité du LECI
But
Nous désirons détecter et plus particulièrement localiser les fuites qui se produisent accidentellement sur les montages étanches.
Principe
Le montage est introduit dans un liquide au-dessus duquel nous créons une dépression. Le gaz contenu dans le montage s'échappe par la fissure sous forme d'un chapelet de bulles.
Equipement
a) A l'intérieur de la cellule L'équipement est très simple. Il est essentiellement constitué par un
récipient cylindrique transparent muni d'un couvercle dont la fermeture est assurée par un joint torique. Ce récipient, placé verticalement, peut à volonté tourner ou être bloqué au cours de l'opération, ce qui permet à l'opé-rateur de faire une observation complète du montage testé. Cet équipement intérieur peut être complété ou non par un piège à azote, selon le liquide utilisé.

MESURES DIMENSIONNELLES 157
Manomètre
Figure За
Test d'étanchéité - LECI.
Figure 3b
Chambre de pression hélium - LECI.

158 С. BREBANT et-al.
b) A l 'extérieur de la cellule Nous avons placé une pompe à vide primaire équipée d'un robinet manuel
de mise à la pression atmosphérique. Ceci permet à l'opérateur de faire varier la dépression dans le récipient de façon progressive et d'éviter par-fois la présence de bulles parasites autour du montage.
c) Cuve de mise sous pression hélium (fig. 3b) Pour augmenter la sensibilité de cet équipement nous avons aménagé
à l'intérieur de la cellule une cuve permettant de placer les montages à tester dans l'hélium, sous une pression de 35 kg/cm* pendant 24 h ou48h.
Résultats
Cet équipement ne permet pas de détecter les fuites avec la même sen-sibilité que les dispositifs à ressuage d'hélium couramment utilisés pour tester les éléments combustibles avant utilisation dans les réacteurs .
11 permet avant tout de localiser le défaut. La possibilité de détecter les fuites est liée à un ensemble de facteurs qui favorisent ou non la sortie du gaz contenu dans le montage: - surface de la fuite, - forme de la fuite, - pression résiduelle des gaz à l'intérieur du montage, - liquide utilisé.
Jusqu'à ce jour, nous avons pu localiser les défauts de tous les mon-tages ayant donné un signal DRG au cours de l'irradiation.
2. A utre modèle
Un nouveau modèle d'appareil (fig. 4) pouvant basculer à l'horizontale permet dès le début de l'opération de pompage, et lorsque l'on commence à voir apparaître les bulles de fuite, de placer le barreau dans la meilleure position pour l'observation. Les bulles dues au dégagement de surface ne brouillent plus l 'émission détectée.
III. APPAREILLAGE D'OBSERVATION
1. Périscope binoculaire SRPI (fig. 5)
But
Observation et photographie des matériaux radioactifs à l'intérieur des cellules.
Description générale
Ce périscope se compose de trois tubes: - le premier, situé dans la cellule, peut être placé soit horizontalement
(grossissement 2 ou 4), soit verticalement (grossissement 7 ou 14);

MESURES DIMENSIONNELLES 159
Figure 4
Test d'étanchéité de cartouche basculante.
- le deuxième est horizontal et traverse la paroi de protection à environ 2, 60 m du sol;
- le troisième est vertical, à l'extérieur de la cellule. Il porte à la partie inférieure les diverses commandes et le dispositif photographique.
Emploi en observation visuelle
La vision binoculaire est obtenue par dédoublement du faisceau lumi-neux à l'aide d'un prisme semi-transparent. L'écartement des oculaires est réglable. La mise au point est obtenue par le déplacement d'une lentille située dans le tube extérieur. Un micromètre comportant une graduation millimétrique (champ: 38 mm) est placé dans le plan d'une image réelle, située dans le tube horizontal. Pour que le micromètre et l'image soient, à la même échelle, il est nécessaire que le tube intérieur soit vertical. Pour obtenir les quatre grossissements, il faut utiliser deux jeux d'oculaires.

1745
—. • . ' . . . . - -r-.—r-r . . t .v. • • , , - ,•. . . .. » 7T1
Commande du bras mobile Commande de mise au point Commande du miroir inférieui Commande des diaphragmes Raccord de l'appareil Hasselblad Bouton de blocage de l'appui front
G= 1 Г 1 objectif, f= 591 2 e objectif, f= 591 1 e r miroir fixe Glace de fermeture Glace de fermeture Plan image [micromètre, Ф 38 mm] 3 e objectif, f = 591
Glaces de l'équerre optique ] G = 1 à la position 4 e objectif mobile, f = 591J moyenne de 18 Miroir inférieur mobile Prisme séparateur semi-transparent [oculaire droit] Prisme à réflexion totale Miroir de l'oculaire Oculaire G7, f = 36 mm Oculaire G14, f = 18 mm Objectif G 1 / 3 , 5 , f= 312 mm
; 1 f oculaire gauche
A P P A R E I L H A S S E L B L A D
О os S ra > 5 5 H
O B J E C T A E X A M I N E R fi 133 G = 2 fi 70 G = 4 fi 3 8 G = 7 fi 2 0 G = 1 4
F i g u r e 5
Périscope binoculaire SRPI pour cellules à haute énergie radioactive.

MESURES DIMENSIONNELLES 161
1er tube horizontal 1 e r tube vertical
1 e r jeu d'oculaires 2 e jeu d'oculaires
grossissement 2 grossissement 7 I! 14
Remarque: Si l'on observe simultanément le micromètre et l'objet lorsque le tube intérieur est horizontal, l'image et le micromètre sont dans le rap-port 1/3 , 5.
Le champ et le diamètre de l'anneau oculaire correspondant à chaque grossissement sont les suivants: grossissement 2 4 7 14 champ en mm 133 70 38 20 diamètre de l'anneau oculaire 4, 2 2, 1 4, 2 2, 1
Emploi en photographie
Le périscope est prévu pour recevoir une chambre photographique Hasselblad 6X6 rétlex type 500c sur la partie inférieure droite du tube ex-térieur. Au niveau des oculaires, un miroir mobile permet de diriger les rayons lumineux soit vers les oculaires, soit vers là chambre photographique.
Lorsque le tube intérieur est vertical, la photographie de l'objet est à l'échelle 1. S'il est horizontal, l'image de la pièce est diminuée dans le rapport 1/3 , 5.
Pour faire varier la profondeur de champ, on a prévu cinq diaphragmes commandés par un bouton situé à la base du tube extérieur, ayant des dia-mètres de l , 2, 3, 4 et 7 cm respectivement. Les profondeurs de champ ob-tenues sont 6, 3, 2, 1,5, et 1mm respectivement, pour G= 1; et 72, 36, 24, 18 et 12 mm respectivement, pour G = 1/3 , 5.
2. Périscope stéréoscopique MONE
L'appareil est constitué par deux chemins optiques parallèles traversant le mur de la cellule. Il n'y a pas de coude dans le parcours. Les yeux de l'observateur sont protégés des rayonnements gamma par un jeu de deux chicanes avec pr ismes et une protection en plomb entre l e s chicanes.
A l'intérieur de la cellule, un miroir et un prisme sur chaque tube re-portent l'axe de visée des objectifs à un écartement de 180 mm.
Du côté de l'observateur une disposition semblable amène les axes op-tiques dans les deux oculaires d'un appareil ZOOM à grossissement continu de 6 à 24. Au grossissement 6, le champ d'observation est de 20 mm de diamètre. La distance optimale entre l'objet et les objectifs est de 400 mm. Un appareil photographique stéréo permet de prendre un couple de photos.
IV. OUTILLAGE DE METROLOGIE
1. Banc de mesure d'éléments gainée à ailettes (fig. в)
Il est destiné à relever le profil dans le fond des ailettes, le long d'une génératrice du barreau. Le barreau est maintenu dans deux mandrins qui
M а

162 С. BREBANT et-al.
• •
• и ж и и ш ш ю и
Figure 6
Banc de mesure pour élément gainé à ailettes.
matérialisent l 'axe de référence. Parallèlement à celui-ci, un équipage mobile se déplace en entraînant un bras « porte-stylet » . Ce bras est arti-culé dans deux plans suivant deux axes perpendiculaires (horizontal et verti-cal). Le stylet suit le profil du fond d'ailettes et fait osciller le bras suivant les deux axes. Les mouvements sont captés par deux goniographes qui trans-mettent les valeurs aux enregistreurs.
Dans le déplacement de l'équipage, la mesure de translation est donnée en comptant le nombre de tours de la vis de précision qui l'entraîne. Ce compteur asservit le déroulement du papier des enregistreurs. On obtient ainsi le relevé en X, Y, Z du profil.
Précision obtenue: en long ± 0, 03 mm pour 800 mm; en X et Y: ± 0, 01 m.
2. Banc de mesure de l'épaisseur de barreaux tubulaires (fig. 7)
A près dégainage et ouverture des extrémités d'un barreau tubulaire, on veut mesurer les déformations et variations de l'épaisseur suivant une génératrice.
Le barreau est fixé verticalement sur un support. Au-dessous de celui-ci, un cïiassis porte une glissiere sur laquelle se déplacé verticalement un équipage de mesure. Cet équipage ést constitué par deux tiges légèrement plus longues que le barreau. Celles-ci pivotent à leur base d'un angle faible autour de la verticale. L'extrémité supérieure des tiges "est munie d'un stylet en carbure.
L'équipage est placé en position haute, une tige à l'intérieur du tube, l'autre à l'extérieur et dépassant le niveau supérieur du tube.
Dans cette position, on procède àl'étalonnage enplaçant un calibre entre les deux stylets. On descend alors lentement l'équipage. Les stylets suivent les profils intérieur et extérieur, car les deux tiges appuient légèrement sur la génératrice du barreau grâce à un ressort. Les mouvements d'oscillation des tiges sont enregistrés par un compteur à induction et transmis à un en-

MESURES DIMENSIONNELLES 163
Figure 7
Banc de mesure d'épaisseur de barreau.
registreur. Le déroulement du papier de l'enregistreur est lui-même asser-vi à la vitesse de descente de l'équipage de mesure.
Précision obtenue = en long: ± 0, 2 mm; en épaisseur: ± 0, 01 mm.
3. Banc de métrologie pour lee gros éléments combustibles dégainée et lee grappes (fig. 8)
a) Principe de la mesure On mesure une dimension de l'élément placé horizontalement entre les
palpeurs de deux comparateurs opposés dont les axes horizontaux sont con-fondus, puis on la compare à la mesure d'une pige de dimension connue.

164 С. BREBANT et-al.
Figure 8
Banc de mesure pour gros éléments,
Nous préférons utiliser deux comparateurs opposés plutôt qu'un seul comparateur et une surface de référence pour les mesures de longueur et de diamètre, pour les raisons suivantes: - Dans le premier cas nous savons exactement entre quels points s'effectue
la mesure. - Dans le deuxième cas, nous ignorons quel est le point en contact avec la
surface de référence. De plus, si la surface de l'élément qui repose sur les vis-supports est rugueuse, nous ne sommes pas sûrs d'avoir un bon contact entre l'élément combustible et la surface de référence.
Les comparateurs sont de grande dimension, leur lecture est facile à travers un hublot de cellule.
b) Composition du banc Le banc comprend une poutre horizontale ayant une rainure à la partie
supérieure dans laquelle reposent et coulissent les vis-supports. A une extrémité se situe un guidage vertical permettant de monter et descendre un comparateur. Derrière le banc, sur un guidage horizontal parallèle à la rainure, se déplace un chariot. Ce dernier porte sur un guidage vertical deux comparateurs, l'un horizontal, l'autre vertical. A la base du guidage vertical fixe se situe un logement pyramidal qui permet de placer, soit un bras support horizontal perpendiculaire à l'axe du banc, soit une surface de référence verticale.

MESURES DIMENSIONNELLES 165
с) Possibilités de ce banc de mesure - Mesure de longueur d'un élément entre deux points situés sur une même horizontale. - Mesure de la planéité de l'extrémité d'un élément (pastille ou bouchon). - Détermination de l'équerrage de l'extrémité des grappes du type EL4 en utilisant la surface de référence verticale. Nous sommes ainsi assurés, lorsque la grappe appuie contre la surface de référence, que chaque point reste dans un plan vertical lorsque la grappe tourne autour de son axe horizontal. - Mesure des déplacements des crayons sur les grappes du type E L 4 . - Mesure de la flèche: L'élément repose horizontalement sur deux vis placées à ses extrémités. Nous plaçons le comparateur vertical en contact avec l'élément dans la section où l'on désire mesurer la flèche. L'élément ayant effectué un tour complet, la moitié du déplacement indiqué par le com-parateur représente la flèche. - Mesure des diamètres: L'élément étant disposé sur le bras support per-pendiculaire à l'axe du banc, nous plaçons les deux comparateurs horizontaux dans un plan diamétral. - Mesure du parallélisme, de la planéité ou de l'épaisseur de certains cons-tituants des éléments combustibles (bouchons de magnésium, pastilles d'alu-minium, grilles des grappes).
La pièce à mesurer repose sur un marbre horizontal placé sur la rainure du banc. Les mesures se font à l'aide du comparateur vertical.
D I S C U S S I O N
V . V . GORSKY: The method of checking the hermeticity of fuel elements which you have described is not in my opinion suitable for detecting cracks in the cans of fuel elements in which there are no unfilled spaces. What do you think?
E. ROUSSEL: We have not tested such elements. However, the first attempts at detecting defects by the helium penetrant inspection method, made on fuel elements in which all the space was occupied, gave good results, so there may be grounds for thinking that the hermeticity test can also be applied to elements of the type you mention. Further tests will be necessary to confirm this.
J .C . JANSEN: What voltage were the exposure curves of the selective films drawn for? Do you foresee considerable variations over the voltage range?
E. ROUSSEL: For 80 kV. No, we do not. J .C. JANSEN: We have noticed that certain selective films showed, with
the same total dose, blackening varying with the rate of irradiation (in r/min). Do the new films you have mentioned show any improvement in this respect?
E. ROUSSEL: This particular point does not arise, because of the way we use the films. I think these are defects which should disappear as the films are perfected.

166 С. BREBANT et-al.
D. BALLARD: For wall-thickness measurements, were the feelers part of a hydraulic, mechanical dial indicator, or of an electromagnetic system?
E. ROUSSEL: An electromagnetic system. D. BALLARD: Have you attempted to use helium mass spectrometry
after the high-pressure testing with helium penetration? E . ROUSSEL: Not yet. W e want above all to localize the defect. R .S . SHARPE: We have also been working with British film manufac-
turers on the supply of experimental emulsions for "hot radiography". Have you any information on how these special characteristics are achieved, and whether further improvements can be expected?
E. ROUSSEL: We cannot yet give the characteristics of these films, as they are still a trade secret. I gather from my conversations with senior members of the Kodak Laboratory that the limit of the films has not yet been reached.
G .H. TENNEY: The emulsion sensitivity during the first moments of exposure is indeed a function of the radiation intensity if no additives to the emulsion are used. EK films which are not sensitive to this phenomenon are at present on the market in the USA.
The bubble technique is, I think, not satisfactory for determining the size of cracks in porous materials. I should be interested to know the stand-ards used in this test.
E. ROUSSEL: I stated in my oral presentation that this test does not allow determination of the area or importance of the defect in the cladding. I simply expressed the wish that this test should be used in conjunction with helium penetrant inspection. I also said that the best procedure is to local-ize the defect by this test, and to study it by micrographie analysis.
P. BONNET: Could you tell me your cycle of operations when dealing with the EL4 cluster? I dot not imagine you perform radiography of the cluster.
E. ROUSSEL: We begin with visual inspection, followed by measurement and finally by radiography of the pencils if we feel it is necessary. We never perform radiography of the whole cluster, since the overlapping of the pencils on the photograph would make analysis considerably more difficult.

THE APPLICATION OF NON-DESTRUCTIVE TECHNIQUES IN THE QUALITY CONTROL INSPECTION
AND TESTING OF FUEL MATERIALS FOR THE DRAGON REACTOR EXPERIMENT
J . F . G . C O N D É , R . P O I N T U D , J . H O L L I D A Y A N D P . D . G O O D
A . E . E . W I N F R I T H , D O R C H E S T E R , D O R S E T , E N G L A N D
A b s t r a c t — R é s u m é — А н н о т а ц и я — R e s u m e n
THE APPLICATION OF NON-DESTRUCTIVE TECHNIQUES IN THE QUALITY CONTROL INSPECTION AND TESTING OF FUEL MATERIALS FOR THE DRAGON REACTOR EXPERIMENT. The O . E . C . D . high-temperature gas-cooled reactor experiment. Dragon, is graphite-moderated and helium-cooled and employs fission product-retaining fuel of the coated-particle type. The development and use of this new type of fuel have required the application of a variety of non-destructive techniques for quality control, inspection and testing. This paper describes certain of the methods which are employed in the inspection of fuel materials both in the development phase and subsequently in production. Physical methods of analysis are used for control of the chemical analysis of fuel cartridges and assessment of fuel contamination of fuel-particle coatings, and particular gamma spectrometric and alpha-scintillation counting techniques are described. The general quality of coated particles is assessed and metrology of coatings performed by means of micro-radiography with the X-ray projection microscope; the procedure is outlined and typical results are presented. Fuel cartridges which consist of fuel particles in a graphite matrix are inspected for homogeneity of fuel distribution and freedom from defects by fluoroscopy and panoramic slit-scanning radiography. Colour radiography is also employed to a limited extent and the various techniques are presented together with illustrative examples of the results obtained. The fuel elements are fabricated almost entirely irom various grades of graphite, and eddy-current non-destructive testing techniques are being developed to permit inspection of raw materials and finished machined components for freedom from significant defects. A brief description of these techniques is given.
APPLICATION DES METHODES NON DESTRUCTIVES AU CONTRÔLE DE LA QUALITÉ A L'INSPECTION ET A L'ESSAI DES COMBUSTIBLES DESTINÉS AU RÉACTEUR EXPÉRIMENTAL DRAGON. Le réacteur ex-périmental Dragon de l'OCDE est un réacteur à haute température, ralenti au graphite et refroidi à l'hélium, qui utilise un combustible en capsule retenant bien les produits de fission. La mise au point et l'utilisation de ce nouveau type de combustible ont impliqué le recours à toute une gamme de méthodes non destructives pour le contrôle de la qualité, l'inspection et les essais. Le mémoire décrit certaines 4 es méthodes appliquées dans l'inspection du combustible, tant dans la phase de mise au point que dans celle de la production. Des méthodes physiques d'analyse permettent de vérifier l'analyse chimique des cartouches de combustible et d'evaluer la contamination des capsules de combustible par les produits de fission retenus; les auteurs décrivent des méthodes spéciales de spectrométrie gamma et de scintillation alpha. La microradiographie au moyen du microscope à rayons X permet d'évaluer la qualité générale des particules encapsulées et ¿ e faire la métro-logie des capsules; les auteurs expliquent la procédure et présentent des résultats caractéristiques. Les cartouches de combustible, composées de particules sous capsule enrobées dans une matrice en graphite, sont inspectées par fluoroscopic et radiographie panoramique pour déterminer l'homogénéité de la distribution du combustible et l'absence de défauts. La radiographie en couleur est également utilisée dans une mesure limitée; les auteurs décrivent les diverses techniques et donnent des exemples qui illustrent les résultats obtenus. Les cartouches de combustible sont faites presque entièrement en graphite de diverses qualités; on met au point des méthodes non destructives, fondées sur les courants de Foucault, pour contrôler l'absence de défauts dans les matières premières et les pièces fabriquées; les auteurs donnent une brève description de ces méthodes.
ПРИМЕНЕНИЕ МЕТОДА НЕДЕСТР'УКТИВНОГО АНАЛИЗА ДЛЯ ПРОВЕРКИ КАЧЕСТ-ВА ТОПЛИВНЫХ ЭЛЕМЕНТОВ ДЛЯ ПРОВЕДЕНИЯ ЭКСПЕРИМЕНТОВ НА РЕАКТОРЕ "ДРА-ГОН" . Высокотемлературный реактор "Драгон" с газовым охлаждением, представляет собой реактор с графитовым замедлителем и гелиевым теплоносителем, который использует топли-
167

168 J.F.G. CONDÉ et al.
во , удерживающее продукты деления, в виде отдельных частиц с покрытием . Р а з р а б о т к а и использование э т о г о нового вида топлива потребовали применения различных методов контро-ля качества и испытания материалов без их разрушения.
Описываются некоторые м е т о д ы , которые использованы при инспекции топливных м а т е -риалов в фазе разработки и в производстве . И с п о л ь з у ю т с я физические м е т о д ы анализа для контроля химического анализа тепловыделяющих элементов и для оценки загрязнения покрытия топливных частиц, о п и с ы в а ю т с я конкретные г а м м а - с п е к т р о м е т р и ч е с к и е и а л ь ф а - с ц и н т и л -дяционные методы с ч е т а . Производится оценка общего качества покрытых частиц и о с у щ е с т в -лена метрология покрытий с помощью микрорадиографии, с использованием р е н т г е н о в с к о г о проекционного микроскопа; излагается процедура, представлены типичные результаты. Тепло-выделяющие элементы, которые с о с т о я т из топливных частиц в графитовых матрицах, подвер-г а ю т с я проверке в отношении г о м о г ^ н т н о с т и распределения топлива и свободы от дефектов с помощью флюроскопии и панорамной щелевидной радиографии развертывания. Применяется также цветная-радиография в ограниченной степени, представлены различные методы в м е с т е с помощью флюроскопии и панорамной щелевидной радиографии развертывания. Применяется также цветная радиография в ограниченной степени, представлены различные методы вместе с иллюстративными примерами полученных результатов . Топливные элементы изготовляются из различных с о р т о в г р а ф и т а , р а з р а б а т ы в а ю т с я м е т о д ы н е д е с т р у к т и в н о г о контроля, чтобы дать возможность контролировать строительные материалы и производить проверку механичес-ких компонентов с целью выявления значительных д е ф е к т о в . Дается краткое описание этих м е т о д о в .
APLICACION DE TECNICAS N0 DESTRUCTIVAS AL CONTROL DE CALIDAD, INSPECCION Y ENSAYO DE COMBUSTIBLES DESTINADOS AL REACTOR EXPERIMENTAL DRAGON. El reactor experimental Dragon, de la OCFE, de alta temperatura y refrigerado por gas, utiliza grafito como moderador, helio como refrigerante y partículas combustibles con revestimiento para retener los productos de fisión. El desarrollo y uso de este nuevo tipo de combustible exigió aplicar diversas técnicas no destructivas para proceder al control de calidad, inspección y ensayo. El presente trabajo describe algunos métodos empleados para inspeccionar materiales combustibles, tanto en la etapa de desarrollo como en la subsiguiente de producción. Se emplean métodos físicos para verificar los resultados del análisis químico de los elementos combustibles y evaluar la conta-minación sufrida por el revestimiento de las partículas de combustible; se describen técnicas especiales de espectrometría gamma y métodos para recuento de partículas alfa por centelleo. Se evalúa la calidad general de las partículas revestidas y se mide el espesor de los revestimientos mediante microrradiograffa en el micro-scopio de proyección de rayos X ; se describe el procedimiento en líneas generales y se presentan algunos resultados característicos. Empleando fluoroscopia y radiografía con exploración mediante colimador panorá-mico, se verifican la homogeneidad de la distribución del combustible y la ausencia de defectos en elementos formados por partículas de combustible en una matriz de grafito. Se emplea también, en grado limitado, la radiografía cromática; las diversas técnicas se presentan juntas, con ejemplos ilustrativos de los resultados obtenidos. Los elementos combustibles se fabrican casi totalmente con diversas calidades de grafito; se desarrollan en la actualidad técnicas no destructivas de ensayo con corrientes de Foucault, a fin de inspeccionar las materias primas y los componentes terminados, y verificar la ausencia de defectos importantes. Se presenta una breve descripción de estas técnicas.
1. INTRODUCTION
The Dragon Reactor Experiment is a 20-MW high-temper ature gas-cooled reactor and has been constructed as a joint O. E. C. D. Project at the U. К. A. E. A. , Atomic Energy Establishment, Winfrith, Dorset, England. The reactor is graphite moderated and helium cooled; graphite is also used for the structural and cladding material of the fuel elemënts.
The fuel for the reactor is in the form of carbide and the core is homo-geneous, both the fuel and moderator being incorporated in the fuel elements. The fuel elements are designed so that the whole core, including the graphite moderator and the top and bottom reflectors is removable and is replaced when the fuel is changed.

NON-DESTRUCTIVE TECHNIQUES FOR DRAGON REACTOR EXPERIMENT 169
In the initital design concept of Dragon it was anticipated that the fuel would release a significant proportion of its fission products and the fuel elements would have a purge system to remove fission products from inside the fuel rods. The original objective of the purge system was to de-poison the fuel and to maintain the activity in the coolant circuit-at an acceptable level. The fuel elements are also suitable for testing fission-product-retaining fuels and the rapid development of coated particle fuels of this type both within the Project laboratories and elsewhere has led to the use of these fuels for the first core of the reactor.
The reactor charge consists of 37 fuel elements of the type shown in Fig. 1. Each of the elements consists of 7 fuelled rods, the rods being of tubular form and machined from low permeability graphite. The fuelled portion of each rod is 1600 mm (63 in) long and the fuel is contained in 30 cartridges each a right hollow cylinder approximately 53. 5 mm (2. 1 in) X 44 min (1. 7 in) outer diameter X 23 mm (0. 9 in) bore.
The fuel is in the form of approximately spherical coated particles of 500 to 700 /iim total diameter including the coating which is about 100 jum thick. The fuel elements are arranged within the reactor to form a two-zone core, the inner zone being fuelled with thorium/uranium carbide (Th/U ratio 10: 1 by atoms) and the outer annular zone with zirconium/uranium carbide (Zr/U ratio 8 : 1 by atoms).
The fuel particles are manufactured by a powder metallurgical process giving sintered kernels of controlled density and approximate sphericity. The coating for fission-product retention is applied by afluidizedbedprocess. The zirconium-containing fuel is coated with a multi-layer pyrolytic carbon coating and the thorium fuel with a triplex pyrocarbon, silicon carbide, pyrocarbon coating. The coated particles are incorporated into a matrix consisting substantially of graphite by mixing and warm pressing in a die. The resulting cartridges are then heat-treated and out-gassed by high-temperature vacuum treatment.
The development and use of coated-particle fuel materials have required the evolution and application of a variety of non-destructive techniques for quality control, inspection and testing. This paper describes briefly certain of the methods which are used in the evaluation of fuel materials both in the development phase and subsequently in production for the reactor fuel elements.
2. PHYSICAL METHODS OF FUEL ASSAY
2.1. Gamma-epectrometric analysis
2 . 1 . 1 . General
Physics requirements for the fuel loading of the Dragon reactor limited variations in the U235 content of the fuel to ± 5% from the theoretical values. Furthermore, the rate of fuel production required at least three uranium analyses per day for purposes of process control and fissile material move-ment. The radiometric method which is easy, rapid and non-destructive and of sufficient accuracy for the physics requirements has been applied.

F i g . l
Fuel element fot the Dragon reactor
1. Nut 9. Outer Fuel Rod Assembly 2. Spacer 10. Centre Fuel Rod Assembly 3. Guard 11. Thermocouple Connector Type 'A ' 4. Inner Core Assembly 12. Locking Sleeve 5. Outer Core Assembly 13. Locking Washer 6. Fairing 14. Fuel Tube Bolt Subassembly 7. Locker Tab Washer 15. Top Block Subassembly 8. Hollow Screw 16. Bellows

NON-DESTRUCTIVE TECHNIQUES FOR DRAGON REACTOR EXPERIMENT 171
2. 1. 2. Basis of method
A typical composition of a 93%-enriched uranium is as follows:
U235 = 9 3 % ; и2 3 8 = 5. 5%; U234 = 1. 2%; U236 = 0. 25%; and U232 = 5X101%.
The examination of the gamma-ray spectra of the different uranium isotopes, taking into account their relative proportions, shows that U235 is the main source of gamma radiation, particularly at the 184-keV energy level. Even if thorium is mixed with the enriched uranium up to an atomic ratio Th/U2?5 = 10, there is no significant interference with the 184-keV photopeak of U235 and this has been used to measure the uranium content of the samples.
2 . 1 . 3 . Method of measurement
The gamma detector (Fig. 2) is a counting assembly consisting of a 44. 5-mm X 50-mm Nal (Tl) crystal and photomultiplier tube feeding a type-1430A amplifier followed by a single-channel pulse-height analyser, type 1168B. A Honeywell-Brown recorder, type Í387A, enables the complete spectrum to be plotted and a selection of the required photopeak. Figures 3 and 4 show respectively typical spectra obtained on an enriched uranium and a thorium sample.
A timer-type 2041 and a scaler-type 2112 allow comparison of the gamma activities in a sample with that of a standard of the same shape, weight and approximately similar composition. These identities between sample and standard avoid the need for corrections for self-absorption and geometrical variations. For analysis the pulse-height analyser is set to (184 ± 1 5 ) keV to cover about 68% of the photopeak. Counting times are maintained such that the relative error made in the ratio of the gamma activity of the sample to the gamma activity of the standard is less than 1. 5% at the 3a level of confidence.
When testing cartridges, a centralizing jig mounted on top of the Nal crystal ensures accurate positioning. A standard cartridge is tested every 12 cartridges (the test duration for one cartridge being. 100 s) to allow for drift of the photopeak due to input voltage and temperature variation effects on the components of the gamma detector.
2. 1. 4. Precision of method
The results of two series of gamma measurements made seven days apart on the same cartridges are given in Table I. The data indicate that the relative error in comparing the uranium content of the test samples with that of the standard was always less than 1. 5%.
However, the actual quantity of U235 contained in the standard is known with a relative error of about 1. 7% which implies that in the test sample this quantity will be known with a relative error of 3. 2% at the 3a level of confidence. In practice this relative error has been found to be better them 2. 5%.

Fig. 2
Gamma-spectrometer with lead castle containing sodium iodide crystal and photomultiplier
2. 1. 5. Extension of the method to thorium
A similar method can be applied for determining the thorium content in samples by using the complex 581-MeV photopeak displayed by T120S, a daughter product of Th232. However, this method has limitations because of the volatility of the Th232 daughter products at high temperatures. Thus, a delay of at least one month after each heat treatment is necessary before any measurements can be made. This delay allows the Tl208 to reach its equilibrium activity.
2. 2. Alpha scintillation
2 . 2 . 1 . General
The aim of the coated-particle fuel in the Dragon reactor is to retain fission products. The retention properties of these coated particles can be impaired by the presence of uranium atoms, as impurities, in the pyrolytic coating. It is necessary therefore to detect the level of such pollution.

NON-DESTRUCTIVE TECHNIQUES FOR DRAGON REACTOR EXPERIMENT 173
ENERGY
Fig.3
Gamma-spectrum of enriched uranium (93%)
Fig. 4
Gamma-spectrum of thorium
2. 2. 2. Basis of the method
If the 93% enriched uranium composition given in section 2. 1. 3 is con-sidered, it may be seen that 97. 5% of the alpha activity is given by the U234 isotope; the remainder being due to U235. Even in a mixture of uranium

174 J.F.G. CONDÉ et al.
and thorium with ал atomic ratio Th/U2 3 5 = 10, the contributions of thorium to the alpha activity will vary from 1. 3% to 8% according to the ageing of the thorium. Therefore, the alpha activity represents mainly the activity of U234 and hence of the enriched uranium as a whole.
In spherical particles the fraction of alpha particles recoiling out of the sphere is given by. [1] :
where X is the range of the alpha particles in the medium constituting the sphere (here pyrocarbon) and r is the radius of the sphere.
The range of alpha particles in pyrocarbon is 3 .10 mg/cm 2 for alpha particles of energy 4. 70 MeV (corresponding to the U2 3 4 alpha emission) or about 17 ц т for a pyrocarbon of 1 . 8 - g / c m 3 density. Thus the alpha-scintillation test is able to detect alpha particles coming from the outer 15 to 20-цт layer of the pyrocarbon coating. In fact because of self -absorption the main contributions to the alpha activity which is detected will be from surface contamination.
2. 2. 3. Method of measurement
The alpha detector shown in Fig. 5 is a counting assembly consisting of a ZnS alpha-scintillation counter, type 1588A, followed by an automatic scaler EKCO, type N 530G. A schematic diagram of the equipment is given in Fig. 6. The coated particles are poured into an aluminium sample holder of 2-cm-diam. and 1. 5-mm depth. The sample holder is shaken gently and levelled up giving a plane surface of hexagonally ordered spheres. The counting time is kept to 1000 s to record at least 200 to 300 counts and hence decrease the relative statistical error of counting.
2. 2. 4. Precision of the method
The reproductibility of the counts recorded on the same sample is within the 3a level of confidence. However, it is not possible to obtain an accurate correlation between the alpha-counts recorded and the actual uranium pollution owing to the fact that the source is very thick and hence it is diffi-cult to account for self-absorption. Accordingly alpha-counting can be used only as a method for comparing the contamination level of different batches of coated particles.
2 . 2 . 5 . Limitations
When coated particles are treated at high temperature, mobile daughter products of Th232 and U232 diffuse from the kernel to the pyrocarbon coating
with

NON- DESTRUCTIVE TECHNIQUES FOR DRAGON REACTOR EXPERIMENT 175
TABLE I
G A M M A - S P E C T R O M E T R I C ANALYSIS O F THE F U E L C A R T R I D G E S
Cartridge No.
Mean U Content Compared to Standard
No. 8
U Content Deviation ±
4413 0.95s 0.00, 4430 0.96j 0.00 4431 4432
0.97„ 0 0.968
o.oo2
o.oo1
-i-iii 0 .94, o.oo4
4447 0.93, o.oo3
4450 0.946 o.oo2
4455 0.955 o.oo3
4459 0.96g o.oo4
4460 0.96, 0.00 4461 0.972 O.Ol' 4462 0.968 O.OO3
4463 0.953 o.oo1
4464 0.954 0.00 4465 0.96J o.oo6
4466 0.97,. o.oo1
4467 0.96, o . oo ' 4469 0.972 o.oo4
4470 0.966 o.oo6
'4471 0.96, o.oo4
4472 0.990 o.oo4
4473 0.98, o.oo4
4474 0.948 o.oo1
4475 0.978 o.oo2
4476 0.96, o.oo6
4477 0.954 0.00° 4478 0.98 l o.oo s
4479 0.972 o.oo2
4480 0.97, o.oo1
4481 0.956 0.00 4482 0.981 o.oo3
4483 0.91j 0.971
o.oo1
4484 0.91j 0.971 0.00
o.oo1 4485 0.97t
0.00 o.oo1
4486 0.96g 0.00° 4487 0.94, 0.00
0.00 4488 0.950
0.00 0.00
4489 0.970 o.oo1
4490 0.968 0.00 4491 0.960 0.00 4492 0.961 o.oo4
4493 0.94, 0.00 4494 0.94j 0.01 4495 0.961
0.97, o.oo1
4496 0.961
0.97, o . o i ' 4497 0.96, 0.011
3 Maximum permissible scatter - 0.01 5

1745
i í
F i g . 5
A l p h a s c i n t i l l a t i o n a p p a r a t u s s h o w i n g s a m p l e i n p o s i t i o n i n drawer
faster than uranium or thorium atoms. The alpha activity detected is there-fore mainly due to these daughter products and a delay of at least one month is necessary to detect the true alpha activity due to uranium and thorium pollution. Two decay curves illustrating the effect are shown in Fig. 6.

NON-DESTRUCTIVE TECHNIQUES FOR DRAGON REACTOR EXPERIMENT 177
•n. Zinc Sulphide (Scintillation)
Photomultiplier
Negative High Voltage
Supply Discriminator
l l>|T|s|*|| 1И 1 3 1 5 1 7 II
Scaler Timer
(T) Cotortot» Лео* C*r<t at cooU4 por tk ln {tip«nm«nto) t M t t vith tt*or«tico! tcolUrt
Cotartotcd dtcor « n i of (ta tramporud Яо224 pollution ond daughter product* of Ka224
Q) CokuloUd pollution by Th ond U ond «ouahur-tquHibrhjtn wtMi Th
® Sam* o » Q • (xptnmtnioi rnutt* with thtortticol «cotur»
Ooy> ofttr (M (nd о1 cooting ap«retion . » ALPHA DECAY FOR COATED PARTICLES
WITH TIME AFTER COATING
F i g . 6
E s t i m a t i o n o f u r a n i u m p o l l u t i o n b y a l p h í s c i n t i l l a t i o n
2. 3. Alpha-spectrometry and alpha autoradiography
Alpha-spectrometry and alpha autoradiography have been used as com-plementary techniques to enable interpretation of the results of alpha-scintillation counting. Alpha-spectrometry permits the determination of the energy of alpha particles and thus the identification of the atoms under-going alpha decay. This test has been found useful in the instance of alpha activity due to Th232 and U232 daughter products.
12

178 J.F.G. CONDÉ et al.
The alpha spectrum is obtained using a s i l icon semiconductor as an alpha-radiation detector followed by a hundred-channel analyser. The spectrum obtained from a thin source is shown in Fig. 7 while Fig. 8 i l lu-strates the deformed spectrum of a thick source simulating a coated-particle sample. In spite of a resolution loss it is still possible to separate the alpha activity resulting from U232 daughter products.
Alpha autoradiography permits the nature of the pollution, e .g . uranium diffusion, dust pollution, cracked particles e t c . , to be determined from the patterns obtained from coated particles.
About 2000 part ic les are laid, in a mono - layer , on an AR-10 Kodak photographic plate and left for a period of days dependent on the alpha acti-vity of the coated particles. Five days are sufficient exposure for an alpha activity corresponding to 120 cpm/g of coated particles.
Examples of the effect produced by dust contamination are shown in Fig. 9.
3. THE INSPECTION AND METROLOGY OF COATED-PARTICLE FUELS BY PROJECTION X-RAY MICROSCOPY
3.1. Description
The X-ray projection microscope provides a quick and precise method for the non-destructive examination of the interned structure of coated particles and metrology of particles, kernels and coatings. A commercial instrument [2], see Fig. 10, based on the COSSLETT and NIXON [3] design is used, and consists of two magnetic lenses which focus a stream of electrons, produced by an electron gun, on to a transmission target. Vacuum pumps maintain a pressure of - less than 3 X 10"5 T o r r in the m i c r o s c o p e column. The electron-beam accelerating potential can be varied from 4. 5 to 30 kV, the electron gun being raised or lowered to suit the conditions. The tube current is controlled and can be biased to cut-of f by a potential applied to the bias cup of the electron gun.
Samples are placed above the target on 15-/um-thick aluminium holders. A photographic plate is mounted over the sample on a support the height of which, together with the target sample distance, determines the magnifi-cation of the image. The plate is surmounted by a lead glass disc to reduce back-scatter, and the whole volume around the target and plate is enclosed in a light-tight lead box which also provides biological shielding.
3. 2. Operating conditions
Work on X-ray microscopy of coated particles, by SHARPE at Harwell [4] was carried out using copper targets at 10 kV. This was very suitable for carbon coatings, but radiographs of duplex pyrocarbon-si l icon-carbide coatings could not be printed satisfactorily owing to the contrast limitations of photographic paper [4] . To avoid making separate prints to show the two coatings of different densities, it was decided to adopt aluminium targets
12*

NON- DESTRUCTIVE TECHNIQUES FOR DRAGON REACTOR EXPERIMENT 179
Mev F i g . 7 '
A l p h a - s p e c t r u m o b t a i n e d f r o m t h i n s o u r c e
and thereby reduce the density difference in the X-ray negative. Operating at the low tube potential necessary to excite monochromatic aluminium К radiation gave rise to exposure times of unacceptable length, and high ab-

180 J. F. G. CONDÉ et al.
Mcv F i g . 8
A l p h a s p e c t r u m o b t a i n e d f r o m t h i c k s o u r c e
sorption of X-rays in air and hence the accelerating potential was increased to 10 or 15 kV according to the subject. As the total magnification of samples rarely exceeds 100X the resulting deterioration in resolution is of little importance.

NON- DESTRUCTIVE TECHNIQUES FOR DRAGON REACTOR EXPERIMENT 181
F i g . 9
A u t o r a d i o g r a p h s s h o w i n g dust c o n t a m i n a t i o n o n s u r f a c e s o f c o a t e d p a r t i c l e s
The targets are made of 9-/um aluminium foil of 99. 2% purity. The sample holders are also made of similar material, and give an even back-ground to the plates. Recently, much thicker silicon-carbide coatings have been deposited, and the tube potential has been increased to 20 kV to reveal the underlying pyrocarbon coatings. In these cases a copper target has been used because the tube potential is close to that necessary to excite the copper KΠradiation, and also to take advantage of the better resolution due to the smaller penetration of electrons in the copper target.
In all work the tube current is maintained at 35 to 40 цА, and with a target-to-photographic-plate distance of 50 mm, the exposures vary between 30 s and 3 min according to the type and thickness of the coatings on the

182 J. F. G. CONDÉ et al.
FILAME. NJT SUPPLY
F i g . 1 0
X - r a y p r o j e c t i o n m i c r o s c o p e
fuel particles. The initial magnification is not increased beyond about 14X as this would entail correspondingly longer exposures.' It has been the aim to radiograph, p r o c e s s and evaluate a sample within 40 min. It is then possible to check the deposition rate of pyrocarbon in a fluidized bed several t imes during the coating p r o c e s s . This procedure provides valuable in-formation during proving runs to establish coating parameters .
Radiographs have been recorded on 50-mm-square Ilford Special Con-trasty Lantern plates which are developed for one minute in Johnson's F. F. Contrast Developer.
3. 3. Metrology of coatings
All sample holders have a strip of 500 lines per inch (20 l i n e s / m m ) mesh adhesive bonded to the surface of the aluminium foil . This enables the magnification of the sample to be established. The plates are projected
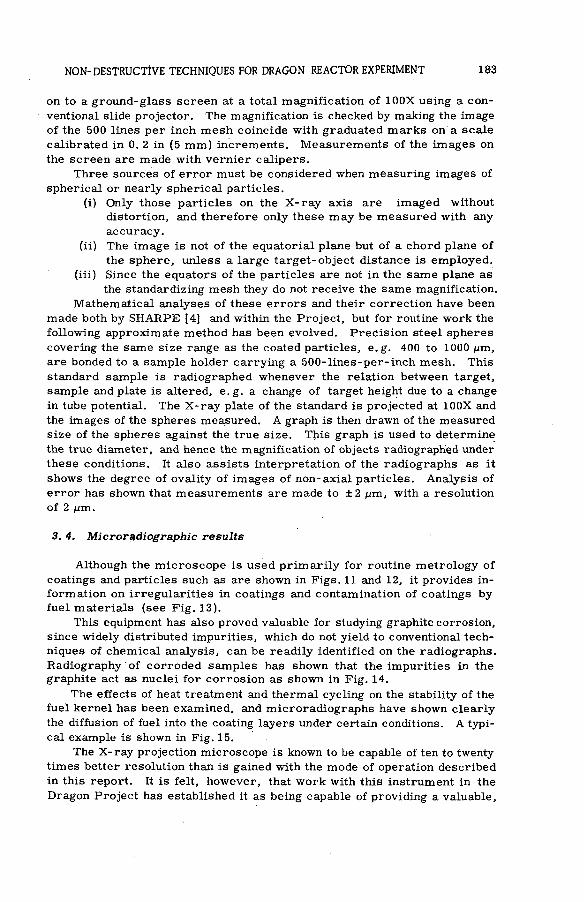
NON- DESTRUCTIVE TECHNIQUES FOR DRAGON REACTOR EXPERIMENT 183
on to a ground-glass screen at a total magnification of 100X using a con-ventional slide projector. The magnification is checked by making the image of the 500 lines per inch mesh coincide with graduated marks on a scale calibrated in 0. 2 in (5 mm) increments. Measurements of the images on the screen are made with vernier cal ipers .
Three sources of error must be considered when measuring images of spherical or nearly spherical particles.
(i) Only those particles on the X - r a y axis are imaged without distortion, and therefore only these may be measured with any accuracy.
(ii) The image is not of the equatorial plane but of a chord plane of the sphere, unless a large target-object distance is employed.
(iii) Since the equators of the particles are not in the same plane as the standardizing mesh they do not receive the same magnification.
Mathematical analyses of these e r rors and their correct ion have been made both by SHARPE [4] and within the Project, but for routine work the following approximate method has been evolved. Prec is ion steel spheres covering the same size range as the coated particles, e .g . 400 to 1000 ц т , are bonded to a sample holder carrying a 500- l ines-per- inch mesh. This standard sample is radiographed whenever the relation between target, sample and plate is altered, e. g. a change of target height due to a change in tube potential. The X - ray plate of the standard is projected at 100X and the images of the spheres measured. A graph is then drawn of the measured size of the spheres against the true size. This graph is used to determine the true diameter, and hence the magnification of objects radiographed under these conditions. It also assists interpretation of the radiographs as it shows the degree of ovality of images of non-axial partic les . Analysis of e r ror has shown that measurements are made to ±2 /um, with a resolution of 2 fjm.
3. 4. Microradiography results
Although the m i c r o s c o p e is used pr imari ly for routine metro logy of coatings and particles such as are shown in Figs. 11 and 12, it provides in-formation on irregularit ies in coatings and contamination of coatings by fuel materials (see Fig. 13).
This equipment has also proved valuable for studying graphite corrosion, since widely distributed impurities, which do not yield to conventional tech-niques of chemical analysis, can be readily identified on the radiographs. Radiography of corroded samples has shown that the impurities in the graphite act as nuclei f or corros ion as shown in Fig. 14.
The effects of heat treatment and thermal cycling on the stability of the fuel kernel has been examined, and microradiographs have shown c learly the diffusion of fuel into the coating layers under certain conditions. A typi-cal example is shown in Fig. 15.
The X-ray projection microscope is known to be capable of ten to twenty times better resolution than is gained with the mode of operation described in this report. It is felt, however, that work with this instrument in the Dragon Project has established it as being capable of providing a valuable,

F i g . l l
M i c r o r a d i o g r a p h o f f u e l p a r t i c l e s c o a t e d w i t h p y r o c a r b o n l a y e r s o f d i f f e r e n t d e n s i t y
F i g . 1 2
M i c r o r a d i o g r a p h o f t y p i c a l D r a g o n u r a n i u m / t h o r i u m c a r b i d e f u e l p a r t i c l e s c o a t e d
w i t h P y C / S i c / P y C c o a t i n g

NON- DESTRUCTIVE TECHNIQUES FOR DRAGON REACTOR EXPERIMENT 185

186 J. F. G. CONDÉ et al.
Ш^ШЁЯШиШЁЁЁЯШШ В'- а а б ^ Ж;:л»
L -ш ш
1111 И JIB
W l
--JÎÈIIÊm
i l i l l I n — _
• И Д У Щ И Е ' . Д И В » m i i H
МДмД»?
я •••И • В » ТВИИ
в К Ш н Jг ШшЁшШ
•ц И И
• •В В
Fig. 15
Diffusion of UC2 fuel into a duplex pyrocarbon coating after 200 h at 1600°C
non-destructive method for the quality and p r o c e s s control of batch p r o -duction of coated-partic le fuel materials .
4. RADIOGRAPHY AND FLUOROSCOPY OF FUEL CARTRIDGES
4. 1. General
In the Dragon fuel element the fuel cartridge, owing to its high fuel-particle loading contains relatively little matrix material . Provided that the original mixing batch of fuel particles plus matrix is homogeneous and remains so during pressing, gross inhomogeneity is unlikely to occur in the pressed fuel cartridge after its final heat treatment. However, in view of the need to demonstrate that segregation did not occur either in mixing or during subsequent pressing and to investigate the relative e f f i c ienc ies of different mixing and pressing procedures it was considered necessary to carry out a 100% non-destructive examination of all fuel cartridges pro -duced to check their homogeneity.
In addition, it was also desirable to examine the fuel cartr idges for freedorti from flaws such as cracks, voids, inclusions, or changes in den-sity. A radiographic method was selected for this purpose, and a develop-ment of the original panoramic slit-scanning technique developed at A.E.R.E. , Harwell, England was used.

NON- DESTRUCTIVE TECHNIQUES FOR DRAGON REACTOR EXPERIMENT 187
Fig .16
Multiple slit- scanning technique
As it was expected that up to 100 fuel cartridges per day would have to be examined, it was necessary to radiograph as many cartridges at one time as was possible. The slit-scanning technique, was suitably engineered and modified, to test one heat-treatment batch (45 cartridges), and to cope with up to 135 fuel cartridges per day.
4. 2. The panoramic slit-scanning apparatus
A lead shield is mounted on an arc of 760 mm radius from the focus of a 360° beam rod-anode X - ray tube. Twelve slits 1 mm in width by 310 mm long are machined at regular intervals through the lead shield as shown in Fig. 16. The constant potential rod anode. X - r a y tube is electrostatically focused, is rated at 150 kV 15 m A and has a 5 -mm focal spot.
Twelve cylindrical cassettes of 24-SWG aluminium tubing to fit within the bore of the fuel cartridges are mounted over the slit. Within each cassette is a brass rod 13 mm in d iam. , which acts both as a mounting spindle and beam trap. The X-ray film specially cut to size, is loaded into each cassette, so that being coiled it naturally assumes a position in contact with the aluminium tube walls, with about 6 mm of film overlapping. Each cassette will take four fuel cartridges; thus a total of 48 fuel cartridges cam be mounted for each loading. The cassettes are rotated through a train of

188 J. F. G. CONDÉ et al.
gears driven by an electric motor suitably geared to give a speed range of 0-5 rpm. When loaded with fuel cartridges there is about 1 mm clearance f rom the lead shield, thus minimizing the r isk of scatter f rom the co l l i -mated X-ray beam. Each cassettë mounting bearing is spring-loaded, and thus loading and unloading of the equipment is simple and only about 3 min are necessary to load or unload the 12 cassettes. The whole equipment is contained in a shielded cabinet, the X-ray tube entry point and the lid being electrically interlocked to the control console so that accidental exposure of the operator to X-radiation when the lid is open, is impossible. Another important advantage of the panoramic slit-scanning method is that the cartridge wall-thickness is scanned continuously to give s ingle- image ex-posure to the film moving past the slit. The brass rod (beam trap) passing through the centre of the cassette absorbs the X-rays , preventing double-image exposure of the film on the opposite diameter of the cassette. Figure 17 shows the top of the equipment within its shielding cabinet and the cassette assembly is illustrated in Fig. 18.
4 . 2 .1 . Evaluation
After the exposed f i lms are processes and dried they are removed for examination on a viewing screen, to evaluate the degree of homogeneity and to detect the presence of flaws. To simplify reporting, an arbitrary scale of values has been used to assess the degree of homogeneity, and to include details of any flaws which may be present. The grading system in use is set out in Table II.
Over a period of months several thousand fuel cartridges have been produced and tested by this method. The results of the homogeneity evalu-ations are shown in Tables III and IV.
It is interesting to note that out of more than 8000 cartr idges so far examined those of Grade "C" do not exceed 2. 5% and the greatest proportion tested are Graded A- .
During the production of the Dragon First- Fuel Charge an average of 90 cartridges per day were radiographed, evaluated and fully reported upon without difficulty over a period of months. Occasionally 135 cartridges per day or three furnace batches were dealt with.
The results obtained so far have shown that this is a reliable and com-paratively inexpensive test enabling full X -ray inspection to be carried out on a production basis. The detection of flaws and evaluation of homogeneity has shown a high degree of sensitivity and quite small defects are easily observed. This is partly because of a low degree of unsharpness, long full focal distance (F. F. D), and small focus, together with short exposure of the film. Early tests with D. I. N. penetrameters showed that the 0. 05-mm wire was clearly seen, and the 0. 025-mm wire could be clearly seen when the total F. F. D. exceeded 660 m m . At the normal working F. F. D. of 760 mm, the 0. 025-mm wire was very c learly seen.
4. 3. Fluoroscopic examination
In addition to the radiographic slit-scanning technique described above, each cartridge was subjected to an X - r a y fluoroscopic examination. This

NON- DESTRUCTIVE TECHNIQUES FOR DRAGON REACTOR EXPERIMENT 189
F i g . 1 7
Multiple slit-scanning radiographic equipment
F i g . 1 8
C a s s e t t e a s s e m b l y
examination is a useful adjunct to the panoramic radiography in that it acts as a double check on the radiographic technique, and in itself is a rapid test to carry out. It takes less than 30 s to examine a cartridge by this tech-nique, even when using an image intensifier. If the normal viewing screen is used (i. e. no image intensifier) then the testing time is about 15 s per cartridge.
The equipment used is a Seifert 150-kVP X-ray tube having dual focal spots, the available power being:

190 J. F. G. CONDÉ et al.
TABLE II
GRADING S Y S T E M
Grade Evaluation
A+ Very good fuel dispersion, no defects of any consequence.
A Good fuel dispersion, may have very slight variations in density.
A- Fair fuel dispersion. Could contain cracks, cavitation, porosity, variable density, segregation all in minor forms.
B Moderate fuel dispersion. Could contain major cavities, cracks, porosity, clumps of fuel, density variation.
С Poor fuel dispersion. Would contain very large clumps of fuel with possibly severe 360° cracks. Large cavities etc.
TABLE III
H O M O G E N E I T Y O F U R A N I U M / Z I R C O N I U M F U E L C A R T R I D G E S
Grade №)
A+ 3.29
A 18.14
A- 54.69
B 21.38
С 2 .5
TABLE IV
H O M O G E N E I T Y O F U R A N I U M / T H O R I U M F U E L C A R T R I D G E S
Grade (W
A+ 0.29
A 4.1
A- 54.4
B 38.95
С 2.26

NON- DESTRUCTIVE TECHNIQUES FOR DRAGON REACTOR EXPERIMENT 191
150 kV at 3 mA on the 0. 4 -mm focal spot, or 150 kV at 12 mA on the 2. 5 -mm focal spot.
The X - r a y tube is housed in a shielded f luoroscopic viewing cabinet, having a 380-mm-square viewing window. In addition a 130-mm Mullard Image Intensifier is installed on the face of the unit. The X-ray tube window has double-acting shutters which may be moved by power drive, at right angles to each other, and hence the X-ray beam may be collimated at source to any rectangular or square form.
4. 4. Colour radiography
A satisfactory colour radiographic technique has been developed along lines suggested by work at A. E. R. E . , Harwell, England [5]. At first Ekta-colour Print Film was used, but more recently Ektachrome "В" sheet film, has been employed as being much faster . It is , however, slightly m o r e expensive than the print f i lm. The technique of X - r a y exposure is fairly simple, and insofar as fuel cartridges are concerned the exposure time is increased by a factor of four, assuming that the kV, mA and F. F. D. remain constant. Thus a thorium/uranium-fuelled cartridge requiring a normal exposure of 3 min, at say 95 kV and 3 mA at 760 mm F. F. D . , using load screens and normal black and white X - r a y f i lm, will require 12 to 15 min using Kodak Ektacolour Print Film. The f i lm-processing technique is nor-mally the Kodak-five Bath C. 22 process as recommended by PARRISH and PULLEN [5]. It was found, however, that Kodak Process P. 122 gave better colour contrast and had certain advantages over the C. 22 process. If Ekta-chrome " В " film is used, then the X - r a y exposure time is no greater than for black and white, unfortunately the co lour p r o c e s s (Kodak E2, E3) is rather s lower and rather offsets the advantage of the faster f i lm, except that the X-ray tube running time is appreciably less. For colour panoramic radiography the X-ray exposure time using Ektacolour Print is prohibitively long and for this technique Ektachrome "В" f i lm and the E2, E3 colour process is recommended. (SeeTable V for exposure and processing changes).
4. 5. Colour fluorography
The poor contrast obtained from black-and-white fluorography of fuel cartridges led to the need to develop a colour fluorographic technique. A pair of wide-angle Schneider Lenses-Xenon 1 : 2/75 and 1 : 1. 5/55 was sub-stituted for the binoculars in the Mullard-Image intensifier. The lens system was linked to a 35-mm Robot camera, mounted on an adjustable precision platform attached to the image intensifier as shown in Fig. 19. The f i lm finally chosen for this work was Ektachrome "В" . This colour film is very sensitive to the green fluorescent light as seen through the image intensifier, and photographs may be taken at speeds of up to 1/250 s with very good results. The effective film speed can be increased still further by altering the exposure and processing as follows. The normal film speed (A. S. A. ) is 125.
The colour processing time of 58 min is rather slow but up to 60 fluoro-graphs -may be processed at one time.

192 J. F. G. CONDÉ et al.
F i g . 1 9
Robot camera in position on image intensifier
Colour is advantageous particularly when there is a need to look for minor changes in density or variations in fuel loading. Colour fluorography is cheap, rapid and provides an easy method of preparing a permanent re-cord, e. g. a colour transparency, and is easier to evaluate than its black-and-white counterpart.
5. EDDY-CURRENT INSPECTION OF GRAPHITE FUEL-ELEMENT COMPONENTS
The structural components of the fuel element are machined from low-permeability graphite and, in vie"w of the cost of the machining operations and the need for high integrity, it is desirable to test the material at various stages to ensure that the material is free from cracks and other defects which might lead to failure during final machining, assembly or in service.
A variety of inspection methods including radiography, ultrasonic, and eddy-current techniques have been investigated with the object of establishing an acceptable non-destructive procedure. Radiography was found to be too expensive and time-consuming and ultrasonic methods were abandoned be-cause of the difficulty of using a non-liquid coupling medium which would not be absorbed in the pores of the graphite. A method of eddy-current in-spection of graphite.core rods and fuel tubes has been developed under extra-mural contract by the non-destructive testing group at A. E. R. E. , Harwell. The method is known as "Eddyfax" inspection. A coil built into a probe is spring-loaded against the graphite surface. The axis of the sample is

t NON-DESTRUCTIVE TECHNIQUES FOR DRAGON REACTOR EXPERIMENT 193
TABLE V
EXPOSURE AND PROCESSING CHANGES
Exposure Effective film speed (B.S. arithmetical)
1st developer
Time min
Addition to colour developer per litre
1 stop under 320 13 2.1 cm3 of 20% sulphuric acid
2 stops under 640 16 1.0 crrf of 20% sulphuric acid
scanned by the probe while the test sample is being rotated. A "Mufax" facsimile re corder is mechanically linked to the scanning speed and thus provides a r e c o r d of the signals rece ived . At present this work is in an early stage, but prel iminary results suggest that the method is suitable for the detection of structural flaws in graphite.
The method is being adopted experimentally as a technique for inspecting the structural graphite components for the fuel elements of the second charge of the Dragon reactor . It is hoped to corre late the results of inspection with irradiation behaviour since at present no absolute standards of signifi-cance can be attached to various types of defect and hence the formulation of inspection standards must depend, to a large extent, on trial and error .
6. CONCLUSION
The inspection methods which have been described constitute a selection of the non-destructive techniques which are used for process control, eva-luation and provision of data for correlat ion with post- irradiation exami-nation. With the exception of the eddy-current inspection of graphite com-ponents the methods described utilize the propert ies of various types of radiation, i . e . alpha, gamma and 'X' radiation. In certain tests the characterist ic decay propert ies of the f i ss i le and fert i le mater ials have been used to provide relatively simple testing procedures . All the tech-niques have proved to be suitable for routine application in batch-production processes .
A final assessment of the e f f i c iency of such techniques in evaluating fuel quality will only be possible when the irradiation behaviour of the fuel materials is established f rom per formance in the reactor c o r e and post -irradiation examination. The methods of evaluation which have been employed will be kept under review in the future with a view to determining the minimum standard of testing necessary to define fuel of acceptable quality. It is the objective to establish those parameters which character ize fuel having adequate f iss ion-product retention at high burn-up.
12

194 J. F. G. CONDÉ et al.
A C K N O W L E D G E M E N T S
Acknowledgement is made to Mr. C. A. Rennie, Chief Executive, Dragon Project for permission to present this paper and to Mr. R. A. U. Huddle, under whose direction the work was carried out, for constant encouragement and support. The assistance of all those members of the staff of Dragon Project and associated organizations who have contributed to the programme of work is cilso gratefully acknowledged.
R E F E R E N C E S
[ 1 ] M c D O L E , C . J . , " E s c a p e o f F i s s i o n P r o d u c t s f r o m S l u r r y P a r t i c l e s " , W C A P - 2 7 7 ( 1 9 5 6 ) .
[ 2 ] E l e c t r o n - P h y s i c a l I n s t r u m e n t L t d . , H e n d o n , L o n d o n , E n g l a n d .
[ 3 ] C a v e n d i s h L a b o r a t o r y , C a m b r i d g e U n i v e r s i t y , E n g l a n d .
[ 4 ] S H A R P E , R . S . , " X - r a y M i c r o s c o p y A p p l i e d to t h e E x a m i n a t i o n o f C o a t e d N u c l e a r F u e l P a r t i c l e s " , R e a c t o r
S c i e n c e a n d T e c h n o l o g y , 1 7 , N o s . 1 1 / 1 2 , D e c e m b e r ( 1 9 6 3 ) .
[ 5 ] P A R R I S H , R . W . a n d P U L L E N , D . A . W . , B r i t . J . n o n - d e s t . T e s t . 6 , N o . 4 .
D I S C U S S I O N
R. NEIDER: I would like to ask what advantage colour radiography has over black and white radiography? Would not a somewhat less contrasting black and white film do the same job?
J. F. G. CONDE: I am not advocating the use of colour radiography for general applications, only giving examples of some of the techniques which are employed. It has certain advantages, particularly in colour fluoro-graphy, where the results in conjunction with an image intensifier are superior to black and white.

EDDY-CURRENT TESTING OF THIN-WALLED CLADDING TUBES
C . V E R S T A P P E N , R. D E K N O C K , R. N E I D E R , M . BRABERS A N D P. d e M E E S T E R
S T U D I E C E N T R U M V O O R K E R N E N E R G I E , M O L , B E L G I U M
A b s t r a c t — R é s u m é — А н н о т а ц и я — R e s u m e n
E D D Y - C U R R E N T T E S T I N G O F T H I N - W A L L E D C L A D D I N G T U B E S . I n v i e w o f a n e x t e n d e d p r o g r a m m e
o n t h e e v a l u a t i o n o f p r o p e r t i e s a n d d e f e c t s o f s t a i n l e s s - s t e e l a n d Z i r c a l o y t h i n - w a l l e d t u b e s , a b a s i c s t u d y
h a s b e e n m a d e o f t h e o p t i m u m t e s t c o n d i t i o n s for a p p l y i n g e d d y - c u r r e n t t e s t m e t h o d s .
A n e l e c t r o n i c a p p a r a t u s h a s b e e n b u i l t t o d e f i n e t h e s e c o n d i t i o n s f o r a g r e a t v a r i e t y o f t e s t p r o b l e m s .
T h e r e f o r e , i t w a s n e c e s s a r y t o h a v e t h e p o s s i b i l i t y o f c h a n g i n g t h e f r e q u e n c y o v e r a w i d e r a n g e a n d to m e a s u r e
t h e t w o c o m p o n e n t s o f t h e c o m p l e x i m p e d a n c e o f t h e t e s t c o i l s e p a r a t e l y . T h i s h a s t h e a d v a n t a g e o v e r a
m e a s u r e m e n t o f t h e a b s o l u t e v a l u e o f t h e i m p e d a n c e c h a n g e s i n c e t h i s v a l u e h a s l i t t l e m e a n i n g i n v i e w o f
t h e c h a n g e o f t h e p r o p e r t i e s o f t h e test o b j e c t . T h e a c t u a l a p p a r a t u s a l l o w s t h e p r e c i s e a n d s e n s i t i v e m e a s u r e -
m e n t o f t h e r e a l a n d i m a g i n a r y c o m p o n e n t s o f a n y t e s t c o i l i n a f r e q u e n c y r a n g e f r o m 0 . 1 - 5 0 0 k H z . A
s p e c i a l t y p e o f m o d u l a t i o n d e v i c e h a s b e e n d e v e l o p e d . T h e a p p a r a t u s i s n o t c o n s i d e r e d a s a n a c t u a l t e s t i n g
a p p a r a t u s ; b y d e t e r m i n i n g o p t i m u m c o n d i t i o n s f o r e a c h c a s e , - i t e n a b l e s a r e l a t i v e l y s i m p l e a n d s p e c i f i c
a p p a r a t u s to b e b u i l t .
U p t o n o w , a d e t a i l e d s t u d y o f r e l a t i o n s h i p s b e t w e e n p h y s i c a l a n d e l e c t r i c a l p r o p e r t i e s o f a s p e c i m e n
a n d t h e t e s t - c o i l i m p e d a n c e h a s b e e n p e r f o r m e d f o r t u b u l a r f u e l - c l a d d i n g m a t e r i a l s . F r e q u e n c y a n d c o i l
c o n f i g u r a t i o n s a r e e s t a b l i s h e d for w a l l - t h i c k n e s s m e a s u r e m e n t s a n d a p a r t i c u l a r a p p a r a t u s h a s b e e n c o n s t r u c t e d ;
t h e a c c u r a c y i s b e t t e r t h a n 1 % a n d c h a n g e s b e t w e e n i n n e r a n d o u t e r d i a m e t e r v a r i a t i o n s c a n b e d i s c r i m i n a t e d .
O t h e r s p e c i f i c a p p a r a t u s a r e s t u d i e d a n d p r o p o s e d .
C O N T R Ô L E P A R C O U R A N T S D E F O U C A U L T D E S T U B E S D E G A I N A G E A P A R O I M I N C E . D a n s l e c a d r e
d ' u n v a s t e p r o g r a m m e v i s a n t à é v a l u e r l e s p r o p r i é t é s e t d é f a u t s d e s t u b e s d e g a i n a g e à p a r o i m i n c e , e n a c i e r
i n o x y d a b l e e t Z i r c a l o y , o n a p r o c é d é à u n e é t u d e f o n d a m e n t a l e p o u r d é t e r m i n e r l e s m e i l l e u r e s c o n d i t i o n s
d ' a p p l i c a t i o n d e s m é t h o d e s d e c o n t r ô l e p a r c o u r a n t s d e F o u c a u l t .
O n a c o n s t r u i t u n a p p a r e i l é l e c t r o n i q u e p e r m e t t a n t d e d é f i n i r c e s c o n d i t i o n s p o u r u n e g r a n d e v a r i é t é
d e p r o b l è m e s d e c o n t r ô l e . A c e t e f f e t , i l f a l l a i t p o u v o i r m o d i f i e r l a f r é q u e n c e d a n s u n e g a m m e é t e n d u e d e
v a l e u r s e t m e s u r e r s é p a r é m e n t l e s d e u x c o m p o s a n t e s d e l ' i m p é d a n c e c o m p l e x e d e l a b o b i n e d ' e s s a i . C e p r o c é d é
e s t p r é f é r a b l e à c e l u i q u i c o n s i s t e à m e s u r e r l a v a l e u r a b s o l u e d e l a v a r i a t i o n d e l ' i m p é d a n c e , c e t t e v a l e u r
a b s o l u e é t a n t p e u r e p r é s e n t a t i v e d u f a i t d e s m o d i f i c a t i o n s q u e s u b i s s e n t l e s p r o p r i é t é s d e l ' o b j e t e x a m i n é .
L ' a p p a r e i l e n q u e s t i o n p e r m e t d e m e s u r e r a v e c p r é c i s i o n e t u n e g r a n d e s e n s i b i l i t é l e s c o m p o s a n t e s r é e l l e s
e t i m a g i n a i r e s p o u r t o u t e b o b i n e d ' e s s a i d a n s u n e g a m m e d e f r é q u e n c e s d e 0 , 1 - 5 0 0 k H z . O n a m i s a u p o i n t
u n d i s p o s i t i f d e m o d u l a t i o n d ' u n t y p e s p é c i a l . C e l u i - c i n ' e s t p a s c o n s i d é r é c o m m e u n a p p a r e i l d e c o n t r ô l e
p r o p r e m e n t d i t ; m a i s , e n d é t e r m i n a n t l e s c o n d i t i o n s o p t i m a l e s pour c h a q u e c a s , i l p e r m e t d e c o n s t r u i r e u n a p p a r e i l
r e l a t i v e m e n t s i m p l e , s p é c i a l e m e n t a d a p t é a u c a s c o n s i d é r é .
J u s q u ' à p r é s e n t , o n a p r o c é d é à u n e é t u d e d é t a i l l é e d e s r e l a t i o n s e n t r e l e s p r o p r i é t é s p h y s i q u e s e t é l e c t r i -
q u e s d ' u n s p é c i m e n e t l e s m o d i f i c a t i o n s d e l ' i m p é d a n c e d e l a b o b i n é d ' e s s a i p o u r l e s m a t é r i a u x s e r v a n t a u
g a i n a g e t u b u l a i r e d u c o m b u s t i b l e . O n a é t a b l i l a f r é q u e n c e e t l e s c o n f i g u r a t i o n s d e s b o b i n e s p o u r l a m e s u r e
d e l ' é p a i s s e u r d e s p a r o i s ; u n a p p a r e i l s p é c i a l a é t é c o n s t r u i t à c e t e f f e t ; l a p r é c i s i o n e s t s u p é r i e u r e à 1 % e t
i l e s t p o s s i b l e d e d é c e l e r d e s é c a r t s e n t r e l e s v a r i a t i o n s d u d i a m è t r e i n t é r i e u r e t c e l l e s d u d i a m è t r e e x t é r i e u r .
L e s a u t e u r s é t u d i e n t e t p r o p o s e n t d ' a u t r e s a p p a r e i l s s p é c i a l i s é s .
И С П Ы Т А Н И Е Т О Н К И Х Т Р У Б Ч А Т Ы Х О Б О Л О Ч Е К С П О М О Щ Ь Ю Т О К О В Ф У К О . В с в я -
з и с р а с ш и р е н н о й п р о г р а м м о й о п е н к и с в о й с т в и д е ф е к т о в т о н к и х т р у б о к и з н е р ж а в е ю щ е й с т а -
л и и ц и р к а л л о я и з у ч е н ы о п т и м а л ь н ы е у с л о в и я и с п ы т а н и й д л я п р и м е н е н и я м е т о д о в и с п ы т а н и й
с п о м о щ ь ю т о к о в Ф у к о .
Б ы л и з г о т о в л е н э л е к т р о н н ы й а п п а р а т д л я о п р е д е л е н и я э т и х о п т и м а л ь н ы х у с л о в и й п р и -
м е н и т е л ь н о к с а м ы м р а з н о о б р а з н ы м п р о б л е м а м и с п ы т а н и й . П о э т о м у б ы л о н е о б х о д и м о и м е т ь
в о з м о ж н о с т ь и з м е н е н и я ч а с т о т ы в ш и р о к о м д и а п а з о н е , а т а к ж е и з м е р и т ь о т д е л ь н о д в а к о м п о -
н е н т а и м п е д а н с а п р о б н о й к а т у ш к и . Э т о и м е е т п р е и м у щ е с т в о п е р е д и з м е р е н и е м а б с о л ю т н о й
195

196 G. VERSTAPPEN et al.
в е л и ч и н ы и м п е д а н с н о г о и з м е н е н и я , п о с к о л ь к у э т а в е л и ч и н а и м е е т н е б о л ь ш о е з н а ч е н и е в в и д у
и з м е н е н и я с в о й с т в и с п ы т у е м о г о о б ъ е к т а . С о в р е м е н н ы й а п п а р а т п о з в о л я е т п р о и з в е с т и т о ч н о е
и ч у в с т в и т е л ь н о е и з м е р е н и е д е й с т в и т е л ь н ы х и м н и м ы х к о м п о н е н т о в л ю б о й п р о б н о й к а т у ш к и
в д и а п а з о н е ч а с т о т о т 0 , 1 д о 5 0 0 к г ц . Б ы л о р а з р а б о т а н о с п е ц и а л ь н о е м о д у л я ц и о н н о е у с т р о й -
с т в о . А п п а р а т н е р а с с м а т р и в а е т с я в к а ч е с т в е д е й с т в и т е л ь н о г о и с п ы т а т е л ь н о г о у с т р о й с т в а ;
о п р е д е л я я о п т и м а л ь н ы е у с л о в и я д л я к а ж д о г о с л у ч а я , м о ж н о и з г о т о в и т ь с р а в н и т е л ь н о п р о с т о й
а п п а р а т с п е ц и а л ь н о д л я д а н н о г о с л у ч а я .
В п л о т ь д о н а с т о я щ е г о в р е м е н и п о д р о б н о и з у ч а е т с я с в я з ь м е ж д у ф и з и ч е с к и м и и э л е к т р и -
ч е с к и м и с в о й с т в а м и о б р а з ц а и и м п е д а н с н ы м и и з м е н е н и я м и к а т у ш к и п р и м е н и т е л ь н о к м а т е р и -
а л а м д л я т р у б ч а т ы х о б о л о ч е к , н а п р и м е р к н е р ж а в е ю щ е й с т а л и и ц и р к а л л о ю .
Ч а с т о т а и к о н ф и г у р а ц и и к а т у ш к и у с т а н а в л и в а ю т с я д л я и з м е р е н и й т о л щ и н ы о б о л о ч к и ;
б ы л и з г о т о в л е н с п е ц и а л ь н ы й а п п а р а т . Т о ч н о с т ь и з м е р е н и я с о с т а в л я е т м е н е е 1 % , и м о ж н о
о п р е д е л и т ь и з м е н е н и я в с о о т н о ш е н и я х м е ж д у в н у т р е н н и м и и в н е ш н и м и д и а м е т р а м и . П р е д л а -
г а ю т с я и д р у г и е с п е ц и а л ь н ы е а п п а р а т ы , к о т о р ы е н а х о д я т с я в с т а д и и и з у ч е н и я .
E N S A Y O D E V A I N A S D E L G A D A S M E D I A N T E C O R R I E N T E S D E F O U C A U L T . C o m o p a r t e d e u n p r o g r a m a
a m p l i a d o d e e v a l u a c i ó n d e l a s p r o p i e d a d e s y d e f e c t o s d e l o s t u b o s d e l g a d o s d e a c e r o i n o x i d a b l e y z i r c a l o y ,
s e h a e f e c t u a d o u n e s t u d i o p r e l i m i n a r d e l a s c o n d i c i o n e s ó p t i m a s p a r a l a a p l i c a c i ó n d e m é t o d o s d e e n s a y o
b a s a d o s e n l a s c o r r i e n t e s d e F o u c a u l t .
S e h a c o n s t r u i d o u n a p a r a t o e l e c t r ó n i c o q u e p e r m i t e d e t e r m i n a r l a s c o n d i c i o n e s m á s f a v o r a b l e s p a r a
e l e s t u d i o d e m u c h o s d e l o s p r o b l e m a s q u e p l a n t e a e l e n s a y o d e m a t e r i a l e s . P a r a e l l o , e r a n e c e s a r i o p o d e r
v a r i a r l a f r e c u e n c i a e n u n a m p l i o m a r g e n y m e d i r p o r s e p a r a d o l o s d o s c o m p o n e n t e s d e l a i m p e d a n c i a d e
l a b o b i n a d e e n s a y o . E s p r e f e r i b l e e s e m é t o d o a l q u e c o n s i s t e e n m e d i r e l v a l o r a b s o l u t o d e l a v a r i a c i ó n
d e i m p e d a n c i a c a u s a d a p o r e l o b j e t o q u e s e e n s a y a , p o r q u e l a m o d i f i c a c i ó n d e l a s p r o p i e d a d e s d e l o b j e t o
r e s t a I m p o r t a n c i a a e s e v a l o r . E l a p a r a t o p e r m i t e m e d i r c o n p r e c i s i ó n y s e n s i b i l i d a d l o s c o m p o n e n t e s r e a l e s
0 i m a g i n a r i o s d e l a i m p e d a n c i a d e c u a l q u i e r b o b i n a , e n u n a g a m a d e f r e c u e n c i a s q u e a b a r c a d e 1 0 k H z a
1 M H z . S e h a c o n s t r u i d o u n d i s p o s i t i v o d e m o d u l a c i ó n d e t i p o e s e n c i a l . A u n q u e e s e a p a r a t o n o c o n s t i t u y e
p r o p i a m e n t e u n i n s t r u m e n t o d e p r u e b a , a l d e t e r m i n a r l a s c o n d i c i o n e s ó p t i m a s e n c a d a c a s o , p e r m i t e c o n s t r u i r
u n o r e l a t i v a m e n t e s e n c i l l o q u e s e a e l a d e c u a d o .
H a s t a a h o r a , e l e s t u d i o d e t a l l a d o d e l a r e l a c i ó n e n t r e l a s p r o p i e d a d e s e l é c t r i c a s y o t r a s c a r a c t e r í s t i c a s
f f s i c a s d e u n a m u e s t r a , y l a s v a r i a c i o n e s d e i m p e d a n c i a d e l a b o b i n a s e h a r e a l i z a d o ú n i c a m e n t e p a r a c i e r t o s
m a t e r i a l e s d e r e v e s t i m i e n t o , c o m o e l a c e r o i n o x i d a b l e y e l z i r c a l o y . A d a p t a n d o l a f r e c u e n c i a y l a e s t r u c t u r a
d e * l a b o b i n a a l a m e d i c i ó n d e e s p e s o r e s d e p a r e d se h a c o n s t r u i d o u n a p a r a t o e s p e c i a l . E l error e n l a m e d i c i ó n
e s i n f e r i o r a 1 % , y p u e d e n d i s t i n g u i r s e l a s d i f e r e n c i a s e n l a v a r i a c i ó n d e l d i á m e t r o i n t e r i o r y d e l e x t e r i o r .
L o s a u t o r e s p r o p o n e n y e s t u d i a n o t r o s a p a r a t o s e s p e c i a l e s .
1. INTRODUCTION
In the scope of a non-destructive testing programme on cladding ma-terials of the fuel elements of the BR3 power reactor a study has been made with the aim of investigating the range of utility and the possibilities of eddy-current testing methods.
The general theory and several detailed studies of specific test methods by eddy-currents are well known and have been described in the literature [1-5] .
In a basic study on thin-walled cladding tubes, which aims at a critical examination of fabrication specifications, tolerances imposed and their necessity for safe fuel-element operation, several problems arise. A better accuracy is needed than for mere quality control on a given fabrication, and one should obtain as much information as possible to know and understand the physical properties and anisotropy involved in the assay of the materials and the manufactured products. The economic interest of such studies is evident, especially with the increasing number of pressurized water-power reactors.

EDDY-CURRENT TESTING OF THIN-WALLED'CLADDING TUBES 197
A part of this study concerns eddy-current testing, which is performed in the laboratories of S. С. К. /С . E. N. - Mol, and is described in this paper. The improvements to be made resulted f rom the measurements with an apparatus of c lassical design. The range of application with a newly built apparatus has been explored.
2. TOTAL IMPEDANCE MEASUREMENTS
2.1. Principle
Since the impedance of a coi l is influenced by the test object it will be possible to regard the total impedance change as the quantity to be measured for quite a number of cases of non-destructive testing. It is well known, however, that different material parameters will influence the total impedance in the same way. So, the total impedance change measurements caused by a specific parameter can only be of use if all other factors are known or can be controlled. In one of our early cases, namely wall-thickness inspection of stainless-steel tubes, the impedance change of the coi l permitted an ac-curate thickness measurement, since in that case the ef fect of poss ible changes in diameter and in conductivity of the tube could be neglected. In general, however, these parameters cannot be considered as known.
2. 2. Apparatus and results
The apparatus former ly used in our laboratory is of c lassical design; it measures the relative impedance variations of two feed-through coils which are incorporated in a bridge circuit. One of the coils contains a reference tube, while the tube to be tested is passed through the second one.
Figure 1 shows a recording of a standard tube with several well-defined wall-thickness reductions on the external side of the stainless -stee l tube as obtained with this method. These reductions in thickness Have been arti-ficially made by electrochemical milling. The wall thickness deviates some 5 to 15 д т from the originalwall thickness of 500 ц т . The results obtained with this apparatus permit measurements of the thickness fluctuation within 1% of the total wall thickness.
2. 3. Limitations of this method
The principle of total impedance measurements which has worked satis-factorily in the case of wall-thickness measurements of a given fabrication batch of tubes is unfortunately not suited for a wide general-purpose application.
From theory as well as f rom actual experimental results it is known that several disturbing side ef fects influence the co i l impedance and thus inhibit a clear distinction between these side effects and the actual quantity to be measured 15] .
To determine the optimum test conditions for a specif ic eddy-current testing apparatus, it is possible to re fer to theoretical treatments and to a quantity of published curves. However, it should be noted that most of these curves have been calculated and are not always representative for actual test
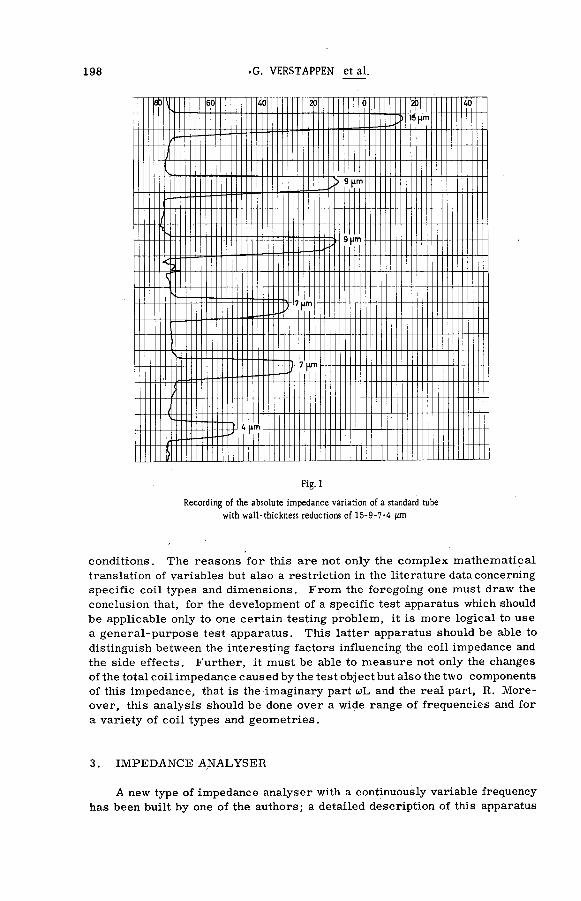
198 • G. VERSTAPPEN et al.
60 40 Ж 1ЦГТ1
40
9 рт
9рт
S.
' [am
' |jm
|im
F i g . 1
R e c o r d i n g o f the a b s o l u t e i m p e d a n c e v a r i a t i o n of a standard tube
w i t h w a l l - t h i c k n e s s r e d u c t i o n s o f 1 5 - 9 - 7 - 4 ¡ i m
conditions. The reasons for this are not only the complex mathematical translation of variables but also a restriction in the literature data concerning specific coil types and dimensions. From the foregoing one must draw the conclusion that, for the development of a specific test apparatus which should be applicable only to one certain testing problem, it is more logical to use a general-purpose test apparatus. This latter apparatus should be able to distinguish between the interesting factors influencing the coil impedance and the side effects. Further, it must be able to measure not only the changes of the total coil impedance с aus ed by the test obj ect but also the two components of this impedance, that is the imaginary part uL and the real part, R. More-over, this analysis should be done over a wide range of frequencies and for a variety of coil types and geometries.
3. IMPEDANCE ANALYSER
A new type of impedance analyser with a continuously variable frequency has been built by one of the authors; a detailed description of this apparatus

EDDY-CURRENT TESTING OF THIN-WALLED'CLADDING TUBES 199
is given in Ref. 16] . A block diagram of this apparatus is represented in Fig. 2. A brief description of its principle of operation follows.
The output voltage of a sinusoidal oscillator is fed to the primary of a transformer T r l . The secondary is floating and is loaded by the test coil
i _ ©
Fig. 2
Block diagram of eddy-current test-coil impedance analyser
in series with the heater resistance R of a vacuo-junction thermocouple. The thermocouple EMF controls the voltage at the primary of the trans-former so as to keep a constant current through the test coi l . Since the feedback loop contains an integrator, the apparent internal current resistance is, as measured, greater than 200 MÍ2.
Two single-ended voltages are available from the secondary of the trans-former (Fig. 3): the voltage IR(PA) in phase with the current I through the coil, and a voltage IZC (PB) where Zc is the absolute value of the complex test-coil impedence Z c = R,. + j X c . These two voltages have a relative phase shift ф, and are applied to a highly degenerative differential amplifier witfi a single-ended output. The gain is stabilized and within 1% of unity over a frequency range of 500 to 0.1 kHz. The output voltage equals the vector difference of the two input voltages. By phase reversal of the vector IR(Pb) and proper attenuation of its amplitude to a value equal to the resistive com-ponent IRC of the coil voltage (PC), this vector difference reaches a minimum (ВС) which is equal to the imaginary component IXc of the coil voltage.
As seen in Fig. 3, manual adjustment and readjustment of PC = IRc for

200 G. VERSTAPPEN et al.
F i g . 3
C i r c u i t o f t h e t e s t - c o i l a n d v e c t o r d i a g r a m s
minute phase and/or amplitude variations of the co i l impedance are very cumbersome and inaccurate (the ratio ДСВ/ДРС is generally very small) . Therefore, an automatic adjustment of the exact IRC value is necessary, and has been developed in our laboratory. The principle is not widely known and could be original.
A chopper relay operated at power-line frequency switches alternately the IR input terminal of the differential amplif ier between a | 2 PC | level (PC"in Fig. 3) and ground potential. In this manner, the vector difference at the output of the differential amplifier respectively equals ВС" and BP = 1^. If PC is adjusted to a value equal to the resistive component of the coil, (ВС") equals (BP) and no amplitude modulation appears at the output of the differen-tial amplif ier . Also, a change in amplitude and/or phase of the tes t - co i l impedance produces a square-wave-modulated carrier . After demodulation, the resulting square wave is AC-coupled to a servo-ampli f ier , the output of which controls the two-phase induction motor Ml . The shaft position of the motor determines the attenuation of the voltage IR. This voltage is reversed in polarity and doubled.
To measure the imaginary component of the coi l voltage, the chopped voltage PC = IRC and the co i l voltage are applied to a second identical dif -ferential ampli f ier . The output voltage is also a square-wave-modulated carr ier and a minimum-voltage detector was needed since the voltage ВС = IXC
is always smaller than the test -coi l voltage PB.
EDDY-CURRENT TESTING OF THIN-WALLED'CLADDING TUBES 201
4. PRELIMINARY RESULTS WITH THE IMPEDANCE ANALYSER
4. 1. General procedure
The procedure followed for developing an appropriate apparatus for a well-defined testing problem will be demonstrated by means of a problem for cladding materials, namely the determination of wall thickness of thin tubes.
The influence of a change in wall thickness on the imaginary and real component of the impedance is measured for a series of variable coil types in a certain range of frequencies. The effect of possible interfering pa-rameters is investigated, such as variable fill factor, lift-off and conducti-vity changes. The results obtained are then summarized in the normalized impedance plane ( X / X 0 and R - R Q / X Q ) . From these curves it may be con-cluded which requirements the apparatus for the problem should meet .
4.2. Coils
For determining the tube wall-thicknesses, two different types of coils may be used: the feed-through coil and the probe coil .
The theory and the applications of feed-through coils has been thoroughly reported in the literature 11, 2, 5] and this type of coil is extensively used in many eddy-current test apparatuses. Figure 4 shows the normalized im-pedance plane for the frequency range 3-60 kHz of a stainless-steel tube for three different fill factors. According to the theory, wall-thickness vari-ations at constant outer diameter move along these curves. Experimental results, however, have shown that at constant inner diameter the wall thick-ness causes the impedance to deviate from these curves. This makes it possible to distinguish between variations in wall thickness at constant inner diameter and at constant outer diameter.
The feed-through coils have an intrinsic disadvantage; namely, the in-formation obtained is determined by the complete cross-section of the tube. In practice, application of the feed-through coil is still possible for wall-thickness measurements if the sensitivity of the apparatus is sufficiently high to detect deviations from the nominal value, which are smaller than the tolerances set by fabrication processes of tubes.
If the expected deviations from the normal properties of the material permit application of the feed-through coil, this is a rapid and efficient way of non-destructive testing.
On the other hand, the probe coil permits wall-thickness measurements onapart of the tube circumference. Figure 5 shows the measured impedance plane of a probe coil (d/h =1.9; d = medium coil diam., h = coil height) for stainless-steel plates of 0.5; 1.0 and 2.0 mm thickness. Each measured value corresponds to a certain frequency, and sheet thickness as indicated. For one certain frequency the point with the smallest X /X 0 value corresponds to the greatest sheet thickness. According to theory the limit frequency fg should be proportional to
1 o.Hiel . D. A.

202 G. VERSTAPPEN et al.
F i g . 4
N o r m a l i z e d i m p e d a n c e p l a n e o f a f e e d - t h r o u g h c o i l for v a r i o u s f i l l factors.
T e s t o b j e c t : s t a i n l e s s s t e e l ( I . D . 6 m m ; O . D . 1 0 m m ) .
2 0 k H z
2 5 k H z
3 0 k H 2
4 0 k H z
5 0 к Н г
6 0 k H z
where a : electrical conductivity of the tested material, m/f2mm; D : thickness of the material in cm; Mrei : relative magnetic permeability of the sheet; A : factor depending on the coil 'geometry.

EDDY-CURRENT TESTING OF THIN-WALLED'CLADDING TUBES 203
F i g . 5
N o r m a l i z e d i m p e d a n c e p l a n e o f a p r o b e c o i l ( d / h = 1 , 9 ) for v a r i o u s
s h e e t t h i c k n e s s e s ( 0 . 5 1 a n d 2 m m ) of s t a i n l e s s s t e e l .
d : p l a t e t h i c k n e s s
0. 5 - 1 - 2 m m
S T A I N L E S S - S T E E L 3 0 4
d / h = 1 . 9
A
•
3 k H z
5 k H z
1 0 k H z
1 5 k H z
2 0 k H z
2 5 k H z
3 0 k H z
5 0 k H z

204 G. VERSTAPPEN et al.
Thus, it is clear that the ratio f / fg increases with increasing sheet thickness D and vice versa. The accuracy of a measured point in Fig. 5 was determined to be 3%.
The measurements by means of probe coils are very much affected by a variation of the distance between coil and test object, namely the well-known lift-off effect. This is clearly shown in Fig. 6, where the variations in the impedance are plotted for lift-off values of 0.5, 1 and 2 mm at constant sheet thickness (2-mm stainless steel). The lift-off has an effect on both compo-nents uL and R for all frequencies. The value of this effect is frequency dependent.
Figure 7 shows the lift-off effect as a function of the frequency for dif-ferent lift-off values. Measurements are relative to the value at 0 mm lift-off. It is seen that the effect is pronounced at low frequencies (<10 kHz). At higher frequencies the lift-off effect is nearly constant. It is remarkable that for low frequencies the value of L decreases below the value of L for 0-mm lift-off as found in experimental results. The generally known fact that a small lift-off causes a large variation in L and R components and'that the influence of lift-off decreases with increasing lift-off values is clearly shown in these curves. At a frequency of 30 kHz/0.5-mm lift-off causes an R variation (with respect to 0-mm lift-off) of 18%, and a 2-mm lift-off causes an R deviation of only 24%.
From these experimental values it may be concluded that, when probe coils are used, it is desirable to apply a certain lift-off in spite of the fact that this reduces the sensitivity. Reduction in sensitivity is shown in Fig. 8 and one can see that the effect is most pronounced on the R component of the impedance.
These orientating measurements have been carried out in the case of probe coils on flat plates of the material to be tested, to avoid undesirable effects of a wrong centring of the tube with respect to the coil, resulting in a kind of lift-off. •
Because the finite dimensions of the coil used with respect to the tube diameter, the published curves cannot directly be applied to tubes. In Fig. 9 the effect of the transition from plate to tube with tubes of decreasing diameters is shown in the normalized impedance plane. The effect is to be attributed to a partial lift-off. A certain value for the ratio of coil diameter to tube diameter must exist for optimum test conditions. This value, how-ever, has not yet been determined.
5. CONCLUSIONS
A general-purpose eddy-current test apparatus with a wide frequency range and an accuracy of better than 3% permits the precise analysis of the impedance as measured with different coil types and under a variety of test conditions. This prototype is used to develop other eddy-current test equip-ment for specific practical problems. The empirical method for determining the optimum test conditions has a great advantage over the theoretical method. The influence of different interrelated parameters, which are not revealed by a purely theoretical examination, can be determined.
The effect of the coil type on the measured impedance has been investi-

EDDY-CURRENT TESTING OF THIN-WALLED'CLADDING TUBES 205
0.05 0.1 0.15 R - R „
F i g . 6
N o r m a l i z e d i m p e d a n c e p l a n e o f a probe c o i l w i t h v a r i o u s l i f t - o f f factors
( 0 . 5 , 1 a n d 2 m m ) a t a c o n s t a n t - s h e e t t h i c k n e s s o f 2 - m m s t a i n l e s s s t e e l .
L I F T - O F F V A L U E S
A 0 m m
В 0. 5 m m
С 1 m m
D 1 . 5 m m
A 3 k H z
О 5 k H z
• 1 0 k H z
+ 1 5 k H z
X 2 0 k H z
• 2 5 k H z
О 3 0 k H z

206 G. VERSTAPPEN et al.
F i g . 7
E f f e c t o f l i f t - o f f a s a f u n c t i o n o f t h e f r e q u e n c y for d i f f e r e n t l i f t - o f f v a l u e s
( 0 . 5 a n d 2 m m ) a t a c o n s t a n t s h e e t t h i c k n e s s of 2 - m m s t a i n l e s s - s t e e l .
M e a s u r e m e n t s a r e r e l a t i v e to 0 - m m l i f t - o f f .
L I F T - O F F V A L U E S
В 0 . 5 m m
D 2 m m
gated for the case of wall-thickness measurements of cladding materials. An eddy-current apparatus using a feed-through coil has been constructed, par-ticularly for wall-thickness determination. The measurements are accurate within 1% of the total wall thickness. However, probe coils offer more possi-bilities than feed-through coils. The lift-off effect inherent to probe coils has been investigated. The results indicate the requirements for an electro-nic circuit adapted to a probe coil.

EDDY-CURRENT TESTING OF THIN-WALLED'CLADDING TUBES 207
F i g . 8
I n f l u e n c e o f a 2 - m m l i f t - o f f o n t h e s e n s i t i v i t y
a s a f u n c t i o n o f f r e q u e n c y .
д к = r ( 2 m m sheet) " R , ( l m m s h e e t ) m m l i f t - o f f )
A R ' = r ( 2 m m s h e e t ) * R ' ( l m m sheet) < 2 m m l i f t - o f f )
a n a l o g o u s for Д Х a n d Д Х '
A C K N O W L E D G E M E N T S
The authors are grateful to Mr. Huet for his encouragements and for supplying the means for this work. One of the authors (R. N. ) thanks S. С. K. for making his stay at S .C.K. possible and the Bundesminister für Wissen-

208 G. VERSTAPPEN et al.
0 ) R - R n Ko
F i g . 9
N o r m a l i z e d i m p e d a n c e p l a n e of a p r o b e c o i l ( d / h = 1 . 9 )
a t t h e t r a n s i t i o n f r o m p l a t e to t u b e w i t h d e c r e a s i n g t u b e d i a m e t e r s .
A = p l a t e
В = t u b e w i t h 3 1 - m m d i a m .
С = t u b e w i t h 2 0 - m m d i a m .
Л 3 k H z
• 5 k H z
+ 1 5 k H z
X 2 0 k H z
À 2 5 k H z
• 3 0 k H z

EDDY-CURRENT TESTING OF THIN-WALLED'CLADDING TUBES 209
schaftliche Forschung, Bad Godesberg, Federal Republic of Germany, for financial support. They acknowledge the technical assistance of Messrs . M. Van Doorslaer and F. Vreys. Thanks are also due to Mrs. Heylen and Mr. Boddou for providing the electrochemically milled standards.
R E F E R E N C E S
[ 1 ] F Ô R S T E R , F . , H a n d b u c h d e t W e r k s t o f f p m f u n g , Erster B a n d S p r i n g e r V e r l a g B e r l i n / G S t t i n g e n / H e i d e l b e r g
( 1 9 5 8 ) .
B e i t r S g e i n Z . ftlr M e t a l l k d e .
[ 2 ] H O C H S C H I L D , R . , " E d d y C u r r e n t T e s t i n g b y I m p e d a n c e A n a l y s i s " , N o n - d e s t r . T e s t . 1 2 , N 0 . 3 ( 1 9 5 4 ) .
[ 3 ] D O D D , С . V . a n d D E E D S , W . E . , E d d y C u r r e n t C o i l I m p e d a n c e C a l c u l a t e d b y a R e l a x a t i o n M e t h o d ,
P a p e r p r e s e n t e d a t t h e S y m p . of P h y s . a n d N o n - d e s t r u c t i v e T e s t i n g , T e x a s ( 1 9 6 3 ) .
[ 4 ] R E N K E N , C . J . , P r o g r e s s R e p o r t o n N o n - d e s t r u c t i v e T e s t i n g b y E l e c t r o m a g n e t i c M e t h o d s . A N L - 6 4 1 4 .
[ 5 ] M c M A S T E R , C . , N o n - d e s t r u c t i v e T e s t i n g H a n d b o o k , _ И , E d d y C u r r e n t T e s t i n g P r i n c i p l e s S e c 3 6 - 4 0 ,
N e w Y o r k , T h e R o n a l d P r e s s C o m p a n y ( 1 9 5 9 ) ,
[ 6 ] D E K N O C K , R . , A n E d d y C u r r e n t T e s t C o i l I m p e d a n c e A n a l y s e r , ( t o be p u b l i s h e d i n E l e c t r o n i c E n g i n e e r i n g ) .
DISCUSSION
V. GERASIMOV: Did you set up any definite apparatus to measure the thickness of tube walls, or just experimental laboratory equipment for measuring changes in coil impedance?
G. VERSTAPPEN: We have one apparatus for measuring industrial wall-thickness variations in stainless-steel tubes, using feed-through coils. The second apparatus we built enables us to look for the right measuring conditions to be applied in a wide range of eddy-current test problems. For this reason it has to be very versatile, with an especially wide frequency range, from 100 Hz to 500 kHz, and a high accuracy.
V. GERASIMOV: Did you use single-coi l or two-coi l probes? G. VERSTAPPEN: In the first apparatus we have differential measure-
ment with two feed-through coils. The measurements with the impedance analyser were carried out with feed-through coils and pick-up coi ls .
V. GERASIMOV: What is the fill factor? G. VERSTAPPEN: The fill factor is given by:
D = diameter of tube d = mean coil diameter
M


SESSION VII

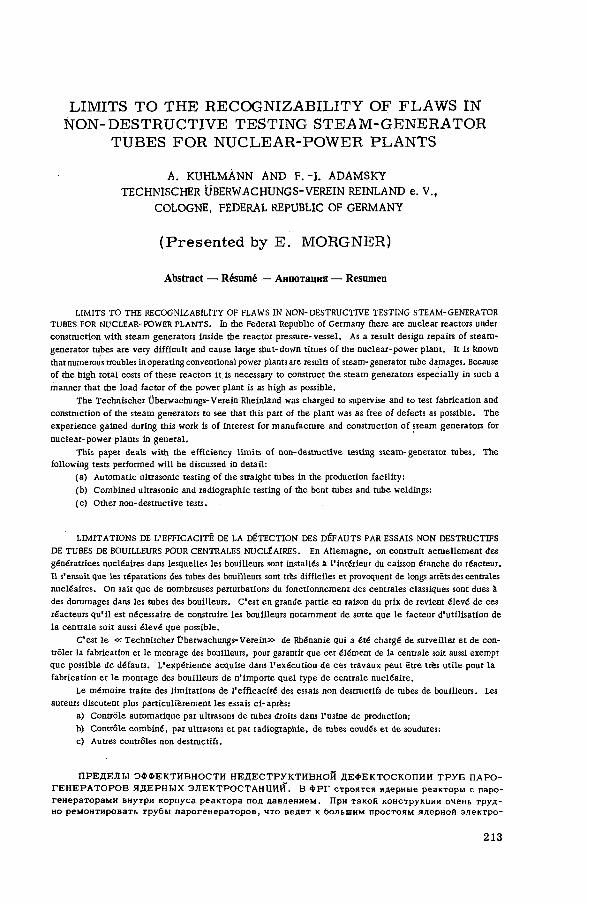
LIMITS T O THE RECOGNIZABILITY OF FLAWS IN NON-DESTRUCTIVE TESTING S T E A M - G E N E R A T O R
TUBES F O R N U C L E A R - P O W E R PLANTS
A . K U H L M À N N A N D F . - J . A D A M S K Y
T E C H N I S C H E R Ü B E R W A C H U N G S - V E R E I N R E I N L A N D е . V . ,
C O L O G N E , F E D E R A L R E P U B L I C O F G E R M A N Y
(Presented by E . MORGNER)
A b s t r a c t — R é s u m é — А н н о т а ц и я — R e s u m e n
L I M I T S T O T H E R E C O G N I Z A B I L I T Y O F F L A W S I N N O N - D E S T R U C T I V E T E S T I N G S T E A M - G E N E R A T O R
T U B E S F O R N U C L E A R - P O W E R P L A N T S . I n t h e F e d e r a l R e p u b l i c o f G e r m a n y t h e r e a r e n u c l e a r r e a c t o r s u n d e r
c o n s t r u c t i o n w i t h s t e a m g e n e r a t o r s i n s i d e t h e r e a c t o r p r e s s u r e - v e s s e l . A s a r e s u l t d e s i g n r e p a i r s o f s t e a m -
g e n e r a t o r t u b e s a r e v e r y d i f f i c u l t a n d c a u s e l a r g e s h u t - d o w n t i m e s o f t h e n u c l e a r - p o w e r p l a n t . I t i s k n o w n
t h a t n u m e r o u s t r o u b l e s i n o p e r a t i n g c o n v e n t i o n a l p o w e r p l a n t s a r e results o f s t e a m - g e n e r a t o r t u b e d a m a g e s . B e c a u s e
o f t h e h i g h t o t a l c o s t s o f t h e s e r e a c t o r s i t . i s n e c e s s a r y to c o n s t r u c t t h e s t e a m g e n e r a t o r s e s p e c i a l l y i n s u c h a
m a n n e r t h a t t h e l o a d f a c t o r o f t h e p o w e r p l a n t i s as h i g h a s p o s s i b l e .
T h e T e c h n i s c h e r U b e r w a c h u n g s - V e r e i n R h e i n l a n d w a s c h a r g e d t o s u p e r v i s e a n d t o t e s t f a b r i c a t i o n a n d
c o n s t r u c t i o n o f t h e s t e a m g e n e r a t o r s t o s e e t h a t t h i s p a r t o f t h e p l a n t w a s a s f r e e o f d e f e c t s as p o s s i b l e . T h e
e x p e r i e n c e g a i n e d d u r i n g t h i s w o r k i s o f i n t e r e s t f o r m a n u f a c t u r e a n d c o n s t r u c t i o n o f s t e a m g e n e r a t o r s f o r
n u c l e a r - p o w e r p l a n t s i n g e n e r a l .
T h i s p a p e r d e a l s w i t h t h e e f f i c i e n c y l i m i t s o f n o n - d e s t t u c t i v e t e s t i n g s t e a m - g e n e r a t o r t u b e s . T h e
f o l l o w i n g t e s t s p e r f o r m e d w i l l b e d i s c u s s e d i n d e t a i l :
( a ) A u t o m a t i c u l t r a s o n i c t e s t i n g o f t h e s t r a i g h t t u b e s i n t h e p r o d u c t i o n f a c i l i t y ;
( b ) C o m b i n e d u l t r a s o n i c a n d r a d i o g r a p h i c t e s t i n g o f t h e b e n t t u b e s a n d t u b e w e l d i n g s ;
( c ) O t h e r n o n - d e s t r u c t i v e t e s t s .
L I M I T A T I O N S D E L ' E F F I C A C I T É D E L A D É T E C T I O N D E S D É F A U T S P A R E S S A I S N O N D E S T R U C T I F S
D E T U B E S D E B O U I L L E U R S P O U R C E N T R A L E S N U C L É A I R E S . E n A l l e m a g n e , o n c o n s t r u i t a c t u e l l e m e n t d e s
g é n é r a t r i c e s n u c l é a i r e s d a n s l e s q u e l l e s l e s b o u i l l e u r s sont i n s t a l l é s à l ' i n t é r i e u r d u c a i s s o n é t a n c h e d u r é a c t e u r .
I l s ' e n s u i t q u e l e s r é p a r a t i o n s des t u b e s d e s b o u i l l e u r s sont très d i f f i c i l e s e t p r o v o q u e n t d e l o n g s arrêts des c e n t r a l e s
n u c l é a i r e s . O n s a i t q u e d e n o m b r e u s e s p e r t u r b a t i o n s d u f o n c t i o n n e m e n t d e s c e n t r a l e s c l a s s i q u e s s o n t d u e s à
d e s d o m m a g e s d a n s l e s t u b e s d e s b o u i l l e u r s . C ' e s t e n g r a n d e p a r t i e e n r a i s o n d u p r i x d e r e v i e n t é l e v é d e c e s
r é a c t e u r s q u ' i l e s t n é c e s s a i r e d e c o n s t r u i r e l e s b o u i l l e u r s n o t a m m e n t d e s o r t e q u e l e f a c t e u r d ' u t i l i s a t i o n d e
l a c e n t r a l e s o i t a u s s i é l e v é q u e p o s s i b l e .
C ' e s t l e « T e c h n i s c h e r O b e r w a c h u n g s - V e r e i n » d e R h é n a n i e q u i a é t é c h a r g é d e s u r v e i l l e r e t d e c o n -
t r ô l e r l a f a b r i c a t i o n e t l e m o n t a g e des b o u i l l e u r s , p o u r g a r a n t i r q u e c e t é l é m e n t d e l a c e n t r a l e soit a u s s i e x e m p t
q u e p o s s i b l e d e d é f a u t s . L ' e x p é r i e n c e a c q u i s e d a n s l ' e x é c u t i o n d e c e s t r a v a u x p e u t ê t r e t r è s u t i l e p o u r l a
f a b r i c a t i o n e t l e m o n t a g e d e s b o u i l l e u r s d e n ' i m p o r t e q u e l t y p e d e c e n t r a l e n u c l é a i r e .
L e m é m o i r e t r a i t e d e s l i m i t a t i o n s d e l ' e f f i c a c i t é d e s e s s a i s n o n d e s t r u c t i f s d e t u b e s d e b o u i l l e u r s . L e s
a u t e u r s d i s c u t e n t p l u s p a r t i c u l i è r e m e n t l e s e s s a i s c i - a p r è s :
a ) C o n t r ô l e a u t o m a t i q u e p a r u l t r a s o n s d e t u b e s d r o i t s d a n s l ' u s i n e d e p r o d u c t i o n ;
b ) C o n t r ô l e c o m b i n é , p a r u l t r a s o n s e t p a r r a d i o g r a p h i e , d e t u b e s c o u d é s e t d e s o u d u r e s ;
c ) A u t r e s c o n t r ô l e s n o n d e s t r u c t i f s .
П Р Е Д Е Л Ы Э Ф Ф Е К Т И В Н О С Т И Н Е Д Е С Т Р У К Т И В Н О Й Д Е Ф Е К Т О С К О П И И Т Р У Б П А Р О -
Г Е Н Е Р А Т О Р О В Я Д Е Р Н Ы Х Э Л Е К Т Р О С Т А Н Ц И Й . В Ф Р Г с т р о я т с я я д е р н ы е р е а к т о р ы с п а р о -
г е н е р а т о р а м и в н у т р и к о р п у с а р е а к т о р а п о д д а в л е н и е м . П р и т а к о й к о н с т р у к ц и и о ч е н ь т р у д -
н о р е м о н т и р о в а т ь т р у б ы п а р о г е н е р а т о р о в , ч т о в е д е т к б о л ь ш и м п р о с т о я м я д е р н о й э л е к т р о -
213

214 A. KUHLMANN and F -J. ADAMSKY
с т а н ц и и . И з в е с т н о , ч т о м н о г о ч и с л е н н ы е н е и с п р а в н о с т и , в с т р е ч а ю щ и е с я н а о б ы ч н ы х э л е к т р о -
с т а н ц и я х , я в л я ю т с я р е з у л ь т а т о м п о в р е ж д е н и й т р у б п а р о г е н е р а т о р о в .
В в и д у в ы с о к и х о б щ и х з а т р а т н е о б х о д и м о с т р о и т ь п а р о г е н е р а т о р ы т а к , ч т о о ы з а г р у з -
к а и х п о в о з м о ж н о с т и б ы л а в ы с о к о й .
О б ъ е д и н е н и ю т е х н и ч е с к о г о к о н т р о л я Р е й н л а н д п о р у ч е н о о с у щ е с т в л я т ь н а б л ю д е н и е и к о н т -
р о л ь з а и з г о т о в л е н и е м п а р о г е н е р а т о р о в , ч т о б ы э т а ч а с т ь э л е к т р о с т а н ц и й б ы л а , п о в о з -
м о ж н о с т и , с в о б о д н а о т к а к и х - л и б о н е д о с т а т к о в . П о л у ч е н н ы й п р и о с у щ е с т в л е н и и э т о й р а б о -
т ы о п ы т п р е д с т а в л я е т в о б щ е м и н т е р е с д л я п р о и з в о д с т в а и с т р о и т е л ь с т в а п а р о г е н е р а т о р о в
д л я я д е р н ы х э л е к т р о с т а н ц и й .
Д о к л а д к а с а е т с я п р е д е л о в э ф ф е к т и в н о с т и к о н т р о л я т р у б п а р о г е н е р а т о р о в б е з и х р а з -
р у ш е н и я . О б с у ж д а ю т с я в д е т а л я х с л е д у ю щ и е в ы п о л н е н н ы е в и д ы к о н т р о л я :
а ) а в т о м а т и ч е с к а я у л ь т р а з в у к о в а я п р о в е р к а п р я м ы х т р у б н а п р о и з в о д я щ е й у с т а н о в к е ;
б ) к о м б и н и р о в а н н а я у л ь т р а з в у к о в а я и р а д и о г р а ф и ч е с к а я п р о в е р к а г н у т ы х т р у б и с в а р о к
т р у б ;
в ) д р у г и е в и д ы н е д е с т р у к т и в н о г о к о н т р о л я .
L I M I T E S P A R A D I S T I N G U I R L O S D E F E C T O S E N E L E N S A Y O N O D E S T R U C T I V O D E T U B O P A R A G E N E R A -
D O R E S D E V A P O R D E S T I N A D O S A C E N T R A L E S N U C L E A R E S . E n l a R e p ú b l i c a F e d e r a l d e A l e m a n i a s e e s t á n
c o n s t r u y e n d o r e a c t o r e s n u c l e a r e s c o n g e n e r a d o r e s d e v a p o r s i t u a d o s e n e l i n t e r i o r d e l t a n q u e d e p r e s i ó n . L a s
c a r a c t e r í s t i c a s d e e s t e m o d e l o d i f i c u l t a n c o n s i d e r a b l e m e n t e l a r e p a r a c i ó n d e l o s tubos d e l g e n e r a d o r q u e p u e d e
l l e g a r a p a r a l i z a r l a c e n t r a l n u c l e a r p o r l a r g o s p e r í o d o s . C o m o e s b i e n s a b i d o , m u c h a s d e l a s d i f i c u l t a d e s
p a r a m a n t e n e r e n f u n c i o n a m i e n t o l a s c e n t r a l e s n u c l e a r e s d e t i p o c l á s i c o p r o v i e n e n d e a v e r í a s e n l o s t u b o s d e l
g e n e r a d o r d e v a p o r . P o r e l l o , y t e n i e n d o t a m b i é n e n c u e n t a c o m o r a z ó n n o m e n o s i m p o r t a n t e e l e l e v a d o
c o s t o t o t a l d e esos r e a c t o r e s , e s p r e c i s o c o n s t r u i r l o s g e n e r a d o r e s d e v a p o r d e t a l m a n e r a q u e e l f a c t o r c a r g a
d e l a c e n t r a l s e a l o m á s e l e v a d o p o s i b l e .
E l T e c h n i s c h e r Ü b e r w a c h u n g s - V e r e i n R h e i n l a n d s e e n c a r g a d e d i r i g i r e i n s p e c c i o n a r l a f a b r i c a c i ó n
y l a c o n s t r u c c i ó n d e g e n e r a d o r e s d e v a p o r p a r a q u e e s a p a r t e d e l a s i n s t a l a c i o n e s c a r e z c a e n l o p o s i b l e d e
d e f e c t o s . L a e x p e r i e n c i a a d q u i r i d a a e s e r e s p e c t o o f r e c e a d e m á s i n t e r é s p a r a l a f a b r i c a c i ó n y c o n s t r u c c i ó n d e
l o s g e n e r a d o r e s d e v a p o r q u e s e d e s t i n a n a l a s c e n t r a l e s n u c l e a r e s e n g e n e r a l .
E n l a p r e s e n t e m e m o r i a s e e x a m i n a n l o s l i m i t e s d e r e n d i m i e n t o d e l e n s a y o n o d e s t r u c t i v o d e l o s t u b o s
p a r a g e n e r a d o r e s d e v a p o r . S e d e s c r i b e n m i n u c i o s a m e n t e l o s s i g u i e n t e s e n s a y o s :
a ) e n s a y o u l t r a s ó n i c o a u t o m á t i c o d e l o s t u b o s r e c t o s e n l a f á b r i c a m i s m a ;
b ) e n s a y o c o m b i n a d o , u l t r a s ó n i c o y r a d i o g r á f i c o , d e l o s t u b o s c u r v a d o s y d e l a s s o l d a d u r a s ;
c ) o t r o s e n s a y o s n o d e s t r u c t i v o s .
If the steam generator of a nuclear-power plant is located inside the reactor pressure-vessel , the design will be so compact that accessibility and replaceability are limited only to a very small degree. The risk of ex-pensive repairs and long down-times justifies the requirements for a better quality of the structural members, particularly for flawless tubes and their connections - and evidence of lack of flaw through a thorough inspection.
The Technischer Überwachungs-Verein Rheinland was authorized to inspect and to supervise the manufacture and the assembly of a steam genera-tor, sited in a very narrow space. The inspection was carried out within time limits whereby expenses were not narrowed down. This paper deals with the applied test methods, the limits of their statements and the ex-periences gained in rejecting flaws, because this is of general interest for the fabrication and the assembly of such steam generators.
The way to maximum operating reliability begins in the design stage, which must above all consider the manufacturing methods which will result from the design. The tube manufacturers and constructors must apply their simplest and most reliable methods of manufacturing. The assembly must be carried out by trained experts who bear aTarge share of the responsi-
LIMITS TO THE RECOGNIZABILITY OF FLAWS 215
bility because, when the steam generator is installed, a qualitative flaw check is no longer possible, either during operation or in an integral test.
The many tests and examinations interspersed in the whole manufacturing process must be planned by persons who have a well-founded ability to judge, based on a thorough knowledge of the manufacturing methods and the demands made on the unit in operation. Those examinations which serve to assess the durability by supplying numerical values (e .g . tensile strength, pressure test, leakage test) are easy to judge and will not cause misunderstandings even for laymen, since the results need only be compared with the reference values laid down in the regulations or standards. Even the extremely subjec-tive mode of judgement applied in visual inspection or in the ring-drifting test will only rarely cause serious differences of opinion. The same is to be applied to the surface-testing methods (dye penetration and magnetic powder methods), and in fact for all testing methods which furnish a reliable illus-tration of the flaw and reserve the possibility of a simple control check.
This is also true for the ultrasonic test as long as it is used as a mea-suring unit only (wall thickness). However, this method is to be used for locating flaws, and for sorting out the usables and the rejects, with the aim of obtaining the highest degree of flawlessness, after which a number of concessions may be made in regard to the recognizability of flaws and es-pecially to the rejections during testing. For the eddy-current test, the same applies within its range of application. Both these methods are real mass-testing methods when applied to tube testing. Both methods do not give an actual illustration of the flaw, and their indicating sensitivity depends considerably on the location-and nature of the flaw. Confirming tests can only be made occasionally as spot checks. In the case of internal flaws, this requires expensive macro-ground sections, which nevertheless can only give an incomplete demonstration of the flaw since it will only become visible in one cross-sect ional plane. It will only very rarely be possible to make several c losely-spaced cuts through the flaw.
X-ray testing occupies a special position. While this method will supply the experienced tester with a real illustration of the flaw, misinterpretations are also possible with this method when the quality requirements are in-creased. It is known that X-ray tests have a low sensitivity for unfavourably located separations. If the flaw lies inside the tested cross-section of the material, only the ultrasonic method can be used as a check test.
It is not surprising that even today, after many years' experience with the various non-destructive testing methods, long discussions still ensue, particularly among experts, about the interpretation of flaw indications. This could be avoided if the principle were always followed of using the testing methods, not only because of their applicability, but more important, ac-cording to their ability to indicate flaws which experience has shown to occur during the various manufacturing steps. The more reliable the test result is to be, the higher will also be the frequent- apparently unjustified rejections during testing. What is justified in such a case can be decided only by the value of the object and by the consequences which may possibly result from an undetected flaw.
If we examine the possibilities one by one, the manufacture and con-sequently the testing of steam generators can be divided into three main sections:

216 A. KUHLMANN and F -J. ADAMSKY
(1) Straight pipe (Manufacture) (2) Pipe bends (Fabrication) (3) Welding seams (Assembly)
In the fo l lowing, these three sec t ions wi l l be d i s c u s s e d s u c c e s s i v e l y .
1. Straight pipe
Testing of the straight pipe is aimed at detecting flaws which run pre -dominantly in a longitudinal direction. It is inherent in the nature of the manufacturing process that the greatest flaw frequency lies in this direction. In view of the numerous pipes to be tested, only those methods can be con-sidered which permit a high speed in testing, otherwise such mass testing could not be carr ied out economically. Two testing methods are suitable: ultrasonic testing in immersion technique and the eddy-current testing method. The latter has by far the highest testing speed, but with the limited experience available up to now, this method is applicable with sufficient reliability only to the smal ler pipe dimensions. Besides , this method has not yet been proven sufficiently in practice, and is therefore not yet universally applicable.
In the Federal Republic of Germany, two different systems for ultrasonic testing in immers ion technique are at present being applied. In both, the bundle of ultrasonic waves is introduced into the pipe simultaneously in both circulating directions in order to be able to detect flaws located unfavourably in relation to the ultrasonic direction. However, the two systems di f fer basically in their design and construction. In one case, a testing block in which are mounted two probe pairs in two testing levels, connected in T / R circuit (separate transmitter and detector), rotates around the pipe at 3000 rpm; the pipe is moved through the testing equipment in such a manner that it is spirally probed over its whole length. The probes are tightly imbedded in the testing block.
In the second method, three probes are mounted in a testing block ad-justable parallel to their own axis and vertically to the pipe axis. The testing block is spring-mounted. The pipe is moved through the testing block in a rotating manner. The probes operate on the impulse-reflection system, i. e. they are at the same time transmitter and detector. Two of the three probes are arranged for the emission of transverse waves directed at the pipe circum-ference, while the third probe emits surface waves, also directed at the pipe c i r cumference . With a sufficiently good pipe surface , this arrangement makes it p o s s i b l e to dist inguish between external and internal f l a w s .
In both testing*methods, adjustable monitors permit an automatic signal evaluation. These monitors control spray guns which mark the flaw on the pipe. As a check for the operator of the testing plant, an acoustical signal is given in addition to the light signal on the monitor whenever an indication exceeds the pre-set tolerance level.
The sensitivity setting is made with the aid of a test flaw with defined outer and inner grooves. The use of such a test flaw for checking the sensi-tivity is the only possibility for reproducibly testing larger quantities of pipes of one dimension at the same sensitivity level.
F o r testing the pipes of our steam generator, the second method was used. The sensitivity level was increased to such an extent that in many

LIMITS TO THE RECOGNIZABILITY OF FLAWS 217
cases the normal surface roughness of the pipe, caused during the manufac-turing process , gave indications above the tolerance level . Therefore , a large part of the pipes had to be surface-ground before the final ultrasonic test could be made.
Radial external longitudinal flaws of 0.1 mm depth could usually be de-tected with sufficient reliability. Through the examination of numerous ground samples it was shown that an internal flaw located in radial direction had to have a slightly greater depth to give the same indication as the external flaw. However, dish-shaped flaws located at an angle in the pipe wall r e -quired a multiple of this borderline depth if they were tobe reliably indicated. The radial flaw will be sure to reflect the ultrasonic wave bundle from both sides. The flaw located around under about 45° to the pipe wall will reflect the wave bundle from one side only. For this reason, ultrasonic testing of tubes must always be made in both directions. A flaw having a very shallow course will hardly be detectable, since the wave bundle will be reflected off one side and will peter out from the other side without giving an echo.
Equally difficult to detect - and frequently not detectable at all - are flaws located at an angle or vertically to the pipe axis. Fortunately, serious flaws of this type o c cur only singly. If they are major f laws, s ome indi-cation of them will usually be given in one of the other tests made. In this steam generator, one such flaw, slanted at about 45° to the pipe axis, was discovered by a helium leakage test which was interposed during the as -sembly, when the faulty pipe had already been installed. The pipe could not be removed again without endangering the neighbouring pipes, so that exami-nation was not possible. The corresponding length of pipe was by-passed.
If such flaws are to be eliminated, then this dead area must also be subjected to inspection through the arrangement of additional probes. This increases the installation costs and also increases the complexity of the testing equipment but it will, in the final analysis, yield more complete test results. The final uncertain factor which would remain would be the dish-shaped flaw lying at an angle in the pipe wall, apart, of course , f r om in-cidental e rrors and disturbances in the testing equipment itself. The con-clusion drawn from all this is that even with a refined method for ultrasonic testing of pipes, a complete test result cannot be expected in every respect.
2. Pipe bends
because of the generally required close packing of tubes in steam generators for nuclear-power plants, very small bending radii usually result, depending on the design. In the present case, pipe bends with a radius/diameter ratio of about 1.0 were used.
Since pipe dimensions of 28 to 42 .5-mm outer diam. and 3.5 to 4 - m m wall thickness were used, cold-bending was out of the question f o r these tight-bending radii. To stay within the required limits of pipe ovality, the bends had to be made in several steps, in part with sand filling. The final bend shape was obtained by a final pressing in a die. Then the complete bend was normalized. The scale caused by the hot-bending and the annealing was to be removed by simultaneous internal and external pickling of the pipes.
'It is understandable that, with such a large number, almost 6000, reversing bends f o r this o rder and with such an extreme deformation, a large flaw

218 A. KUHLMANN and F -J. ADAMSKY
occurrence was to be expected. The tests to be carried out were planned with this in mind.
First, a wall-thickness measurement was taken with ultrasonic waves over the whole drawn bend zone. The measurement was made with a trans-mitter-receiver probe which permitted determination of the wall thickness to within ± 0.1 mm. All bends, which were below a certain minimum wall thickness, were rejected. Such a measurement with the tolerance given can be designated as reliable, since the tester checked the calibration of the testing unit after each bend by comparing it with a reference piece whose wall thickness was known. The tolerance range of the unit was compensated by being adding on to the required minimum wall thickness.
More difficult was a test of the bend for separations created during the bending operation, a distinct possibility in view of the large amount of de-formation taking place and the difficulty of proper heat application during the bending operation. Because of its shape, the compressed inner side of the bend cannot be ultrasonically tested. The curves of the saddle-shaped surface are too tight to permit a positive guiding of the probe and sufficiently good coupling. But this examination could be justifiably dispensed with since separations are not expected to occur in the compression zones.
In the drawn area of the bend, i. e. from the neutral grain to the drawn outer grain, such an examination can, however, not be dispensed with. But this zone could not be covered by one single testing operation. The all-in-planes curved surface of the pipe bends required the use of various differently ground probes to obtain sufficient coupling.
Eàsiest to test was the outer grain, since the probe ground to fit this surface could be moved along the longitudinal direction of the bend without hindrance. More difficult was the testing of the zones pointing towards the neutral grain. Here, in every case there were unfavourable coupling condi-tions because of the almost linear contact of the probe.
The testing unit adjustment was such that a 0.5-mm-deep rectangular cut on the inside of the bend at a distance of 30 mm from the angle-probe showed a fu l l - scree deflection on the viewing screen. It was agreed that all indications which exceeded half the screen height at this setting should be followed up by subjecting the corresponding bends to c loser examination.
At first such a sensitive setting of the testing unit caused difficulties; especially with the 42.5-mm-outer-diam. pipe which, because of its radius/ diam. ratio of less than 1.0, had to be bent with sand filling. Many signi-ficant indications were found, but c loser examination revealed that they were caused by scale which tightly adhered to the inner-pipe surface. A separation of these indications from true flaw indications proved most dif-ficult. The removal of the scale was not only necessary for proper testing, but had already been ordered previously with a view to trouble-free operation Because of a partial sintering of a layer of bending sand to the inner surface, of the bend, the annealing scale acquired a glazed consistency which re-sisted compljete removal through pickling. The only remedy was to change the signalled points through mechanical treatment (sandblasting of the inside, jogging or hammering from the outside) in such a way that a clear conclusion could be drawn concerning their origin. A check test was the X-ray examination which, with a correspondingly good picture quality, under

LIMITS TO THE RECOGNIZABILITY OF FLAWS 219
certain circumstances makes the recognition of scale deposits on the inside of the pipe possible.
One X-ray examination had already been made before the ultrasonic test in one direction (vertically to the bend plane) to remove the uncertainties of the ultrasonic test in regard to the neutral zone. This revealed short but very deep individual breaks in three bends; the flaws were located radially and started on the inner surface of the pipe. After a thorough examination they were recognized as breaks due to copper diffusion which came into being because of copper traces which happen to be present in the bending sand. F r o m the character ist i cs of such breaks it could be concluded that these were probably individual cases . Because of their natural depth, a fairly certain recognition on X - r a y examination could be assumed.
During the ultrasonic tests, a se r i es of smal l separations were d i s -covered on the bend surface which had a depth of only a few tenths of a mil -limetre. These flaws were corroborated by the magnetic powder test. After grinding out these flaws, under continuous check through the magnetic powder test, the remaining wall thickness was re-measured ultrasonically.
For the sake of completeness, it should also be mentioned that during the X - r a y examinations a ser ies of internal flaws were distinctly indicated. An inspection with suitable internal viewing units also showed an alarming flaw picture. But when macro-ground sections were made of some of these spots, it was found that the flaw depth was a maximum 0.1 mm and were thus acceptable.
The final test was an internal water -pressure test with only 1.1-fold safety against the cold yield point of the pipe material . The purpose was to remove uncertainties which might still have existed after completion of the other tests . No flaws were discovered with this test. To summarize, the following can be said regarding the testing of pipe bends:
The flaws which were found, particularly the deep, very short internal c r o s s - t e a r s caused by copper diffusion, have shown that such a thôrough examination was n e c e s s a r y . It is understandable that, when f laws w e r e found, the examination was even more thorough. The testing costs were very high, since only a manual examination of each individual piece could be made. But it is this very fact which makes the completeness of the test result very strongly dependent on the thoroughness of the tester. Fatigue and waning attention to work cannot be excluded when so many parts must be examined. No doubt the Water-pressure test at high interned pressure has supported the reliability of the tests, but it is questionable if it has removed all doubts. It is a known fact'that pipes with serious flaws can sometimes withstand tests of unbelievably high internal pressures. It must also be kept in mind that this is a static stress, which can never fully replace the varying stresses occurring in actual operation.
3. Welding веатв
The non-destructive testing of welding seams has always posed certain problems. It is well-known that, as far as fusion leaks and fine tears are concerned, the X - r a y examination is a poorer indicator than the ultrasonic test, while it has distinct advantages in the demonstration of other faults.

220 A. KUHLMANN and F -J. ADAMSKY
When applied to a search for flaws with more serious consequences, the ultrasonic test may thus be considered the more sensitive testing method. But, on the other hand, it causes some uncertainties, particularly in that it very easily gives excessively strong indications for unimportant form echos (root sagging, final run). This is particularly true when the method is applied to welding seams on thin-wall thicknesses, where surface indi-cations are more difficult to distinguish from really serious faults because of the slight differences in the sound-path length. In the round welding seams on the pipes of the steam generator to be tested, there were a few factors present which could cause some uncertainty. The accessibility for X-ray examination was often poor, and the pipe wall thickness was within a range of only a few millimetres. Therefore, it was necessary at the very beginning to remove the hindrances existing under normal conditions for non-destructive testing.
It is known that a welding seam on such pipe dimensions as in this case can only be considered completely X-ray examined if it has been X-rayed from various directions, taking into consideration the location of the seam flanks. Only then can a lack of fusion be reliably shown on the film. This, however, results in very high testing costs because, among other reasons, such an examination can only be made outside the normal working hours be-cause of the radiation danger. An examination in this thorough manner was not possible because, for construction reasons, it was impossible to create the necessary accessibility to the welding seams. Because of the poorer picture quality, the use of radioactive isotopes was out of the question. Thus, it only remained to apply ultrasonic testing by excluding, as far as possible, the particularly pronounced interference echos to be expected with this wall thickness.
To obtain a smooth root sagging, all welding seams (about 5000) were made with the tungsten inert gas method, the pipe being filled with inert gas. Even with this welding method, a certain amount of training of the welders to make such a test-acceptable root was necessary, the more so as care had to be taken that, when gas-welding the covering beads, the root would after all sag through to the inside. The final run was ground to create the best possible conditions for ultrasonic testing.
At first efforts were made to record the ultrasonic tests, which could only be carried out manually, on a recording strip. But this soon turned out to be impractical, since, for example, at the high sensitivity level of the unit small double indications in the range of the monitor shutter added up and caused a reading above the tolerance level, which led to the unjustified rejection of that particular welding seam.
The whole examination went off rather smoothly in that the ultrasonic test was carried out f irst. If indications resulted, then the possible flaw at thatpointwas examined more closely by means.of a well-aimed X-ray . In addition, welding seams without ultrasonic indications were X-rayed from one constant direction. Of course, in line with the value of the object, the standard of judgement was set very high. After a certain time, the welders became used to the increased demands and the rejects stayed within ac-ceptable limits. Thus, in this case everything possible was done from the design and construction side to make a complete test result possible. Of course, also in this case the previously mentioned uncertainties inherent in

LIMITS TO THE RECOGNIZABILITY OF FLAWS 221
the manual ultrasonic testing method were present. But the ultrasonic tests were always immediately followed by the X-ray examination.
The greatest value must be placed on the importance of the direct time -sequence of manufacture, testing and check-test, in view of the educational effect, which cannot be over-emphasized. Summing up, it must be said that it is very difficult to achieve the stipulated complete freedom from flaws on s j ch a complicated and poorly accessible construction as the above-cited steam generator. However, through the carefully planned use of the non-destructive testing methods throughout the manufacturing process, and with consciously chosen extremely severe standards, an optimurp can be achieved which would, as far as can be judged, seem to warrant the safety of the construction.
Below is a short sketch about how the high testing costs required for a largely trouble-free steam generator are to be evaluated from an economic viewpoint.
Based on our experience and adjusted to the conditions prevalent in the Federal Republic of Germany, we have shown in Fig. 1 the additional testing costs (curve a) for a steam generator as a function of the electrical output of an atomic-power plant. These costs are the difference between the normal testing costs for steam generators of conventional boiler construction and the increased expenditures for atomic-power-plant steam generators. Of course, curve a is valid only in the case where the steam required for generating electric power is obtained totally f rom steam generators. Our analysis showed that the essential part of the testing costs for steam generators is practically proportional to the length of pipe installed. In a second curve с we have plotted the break-down costs per day as a function of the electrical output. As an average of various statements received, we have calculated at a rate of 0.03 DM/kWh for the costs engendered through a breakdown in current generation. The relationship between curves a and с is also shown in Fig. 1 and states how many breakdown days must be saved during the life of the installation to cover the additional testing costs . It will be evident from the chart that, for electrical outputs of above 100 MW, this relationship is fairly constant and amounts to only about two to three days.
It should be realized that, at a theoretical operating time of 7000 h /yr and an assumed life of the atomic-power plant of 10 yr, i . e . 70 000 h, a breakdown for three days influences the degree of availability of the plant by only about 0.1%.
Figure 2 shows the relationship between the additional testing costs and the costs of the installation as a function of the electrical output. Within the range of accuracy possible here, this relationship is also constant and amounts to about 0.1 to 0.2%.
Summing up, we would like to conclude from these figures, which under-standably are only approximately correct , that the high testing costs for steam-generator pipes seems quite justified from an economic point of view. Our experience has shown that, owing to the extensive testing procedure, quite a number of flaws were discovered which cannot be detected with less extensive tests, and can then lead to considerable breakdown periods for an atomic-power plant.
The statement made in the preceding paragraph seems justified because generally, in atomic power plants, damage through poor quality of the coolant.

2 2 2 A. KUHLMANN and F -J. ADAMSKY
S V» Q
0
V<Vi
<00 5 0 0 rtrctricat output [Ml^
F i g . 1
A d d i t i o n a l t e s t i n g c o s t ( a ) , lost g e n e r a t e d p o w e r c o s t p e r d a y ( c ) a n d
r a t i o o f a d d i t i o n a l t e s t i n g c o s t to l o s t g e n e r a t e d p o w e r c o s t p e r d a y versus
e l e c t r i c a l o u t p u t o f a n u c l e a r - p o w e r p l a n t
u WO 200 300 < 0 0 5 0 0
ttfctrical output w\ -F i g . 2
R a t i o o f a d d i t i o n a l t e s t i n g c o s t ( a ) to p l a n t c o s t ( b ) v e r s u s
e l e c t r i c a l o u t p u t o f a n u c l e a r - p o w e r p l a n t
localized overheating of the steam-generator pipes, o r other influences favouring corros ion , are not to be expected. As a rule, damage can only be expected on such pipes o r pipe connections, which already have a flaw which originated in the manufacturing o r construction p r o c e s s .
It was stated that, in spite of all test requirements, it still would not be possible to exclude all material flaws on steam generators . F o r this reason, among others, we are therefore inclined to conclude that large atomic -power plants should be so designed that the steam generator and atomic reactor are separated f rom each other and ample possibil it ies f or repairs are provided.
The results of our tests have also shown that, in the case of compact reactor construction, which may be desirable for small outputs and mobile

LIMITS TO THE RECOGNIZABILITY OF FLAWS 223
units, the steam generator can be built with sufficient safety against break-downs if a sufficiently extensive testing procedure is followed, and that the expenditure for such extensive testing is quite justifiable economical ly .
D I S C U S S I O N
Z. PAWbOWSKI: For checking the pipe bends, what was the frequency of the ultrasonic shear waves used, and what was the refraction angle of the probe?
E. MORGNER: The frequency was 4 MHz and the refraction angle of the probe was 45°. This angle was used because of the higher sensitivity in detecting cracks which begin in the inner or outer surface of the tube bends.
Z. PAWbOWSKI: What was the refraction angle of the probe for checking the welded seams, and what was the wall thickness of the tube?
E. MORGNER: The wall thickness of the tubes was 3.5 to 4 mm, and the refraction angle of the probe was 60°.
Z . PAWbOWSKI: Did you not find that probes with this angle have poor sensitivity for crack detection?
E. MORGNER: We agree with you that the sensitivity for detecting cracks with the 60° angle is not the best in general. We selected this angle for two reasons. The sensitivity level was very high, and therefore we could expect that even with a 60° angle cracks would be detected. This was esta-blished in previous tests. Also, welding preparations lead to the assumption that lack of fusion will appear at an angle of 30° to the radial direction. Hence the 60° refraction angle was the best for detecting this severe welding fault.


HIGH-VOLUME NON-DESTRUCTIVE TEST APPLICATIONS AT THE
HANFORD ATOMIC PRODUCTS OPERATION
D . C . W O R L T O N
P A C I F I C N O R T H W E S T L A B O R A T O R Y ,
B A T T E L L E M E M O R I A L I N S T I T U T E ,
R I C H L A N D , W A S H . , U N I T E D S T A T E S O F A M E R I C A
A b s t r a c t — R é s u m é — А н н о т а ц и я — R e s u m e n
H I G H - V O L U M E N O N - D E S T R U C T I V E T E S T A P P L I C A T I O N S A T T H E H A N F O R D A T O M I C P R O D U C T S
O P E R A T I O N . S a f e t y a n d e f f i c i e n c y of c r i t i c a l H a n f o x d p r o c e s s e s a r e a s s u r e d w i t h r a p i d , r e l i a b l e , a n d a u t o -
m a t i c n o n - d e s t r u c t i v e tests . H i g h - s e n s i t i v e e d d y - c u r r e n t a n d u l t r a s o n i c i n s p e c t i o n s y s t e m s a r e i n r o u t i n e u s e
i n t h e f i e l d a n d i n m a n u f a c t u r i n g p r o d u c t i o n p r o c e s s e s to p r o v i d e m a x i m u m q u a l i t y a s s u r a n c e o f l a r g e v o l u m e s
o f m a t e r i a l i n m i n i m u m i n s p e c t i o n t i m e .
T h i s p a p e r d e s c r i b e s i n s p e c t i o n s y s t e m s b e i n g Used to e n s u r e q u a l i t y o f H a n f o r d ' s p r o d u c t i o n n u c l e a r - f u e l
m a n u f a c t u r i n g p r o c e s s e s . O p e r a t e d a s r e g u l a r i n - l i n e m a n u f a c t u r i n g e q u i p m e n t , t h e s e s y s t e m s e m p l o y u l t r a -
s o n i c a t t e n u a t i o n m e a s u r e m e n t s t o m o n i t o r g r a i n s t r u c t u r e o f b a r e u r a n i u m f u e l c o r e s , u l t r a s o n i c a n d e d d y -
c u r r e n t t e c h n i q u e s to e n s u r e a d e q u a t e b o n d i n g a n d t h i c k n e s s o f 0 . 0 4 0 i n a l u m i n i u m c l a d d i n g o n c a n n e d e l e m e n t s ,
a n d n o v e l w i d e - b a n d , h i g h - r e s o l u t i o n u l t r a s o n i c i n s p e c t i o n t e c h n i q u e s to d e t e c t d e f e c t s i n t h e f u e l e n d - w e l d
c l o s u r e s . C o m b i n e d e d d y - c u r r e n t a n d u l t r a s o n i c tests a r e a p p l i e d s i m u l t a n e o u s l y t o p e r f o r m a c o m p l e t e f u e l -
e l e m e n t i n s p e c t i o n o n a n i n e - s e c o n d c y c l e ; d e f e c t i v e e l e m e n t s a r e a u t o m a t i c a l l y s e g r e g a t e d f r o m t h e p r o c e s s
s t r e a m .
E m p h a s i s i s g i v e n to a d v a n c e d u l t r a s o n i c test m e t h o d s o f i n s p e c t i n g t h i n - w a l l e d , f u e l - s h e a t h t u b i n g . S p e c i a l
h i g h l y f o c u s e d t r a n s d u c e r s a r e u s e d w i t h w i d e - b a n d c i r c u i t r y t o g e n e r a t e p u r e s h e a r w a v e s i n 0 . 0 1 5 - i n - t h i c k
w a l l t u b i n g . L a m b a n d o t h e r c o m p l i c a t e d w a v e m o t i o n s a r e e x c l u d e d so t h a t t e s t s r e s u l t s a r e r e a d i l y i n t e r -
p r e t e d a n d r e p r o d u c e d . N o v e l , e c o n o m i c a l m e t h o d s o f p r o d u c i n g d e f e c t s t a n d a r d s h a v e b e e n d e v e l o p e d , a s
h a v e c r i t i c a l l y i m p o r t a n t m e t h o d s o f e n s u r i n g u n i f o r m o p e r a t i n g c h a r a c t e r i s t i c s o f t h e t r a n s d u c e r s t h e m s e l v e s .
A u t o m a t i c t u b i n g i n s p e c t i o n e q u i p m e n t h a s b e e n d e v e l o p e d , a n d r e s u l t s o f i t s r o u t i n e u s e i n t e s t i n g s o m e
3 0 0 0 0 f t o f t u b i n g a r e s u m m a r i z e d .
F i n a l l y , e d d y - c u r r e n t t e c h n i q u e s d e v e l o p e d s p e c i f i c a l l y f o r i n s p e c t i n g i n s t a l l e d h e a t - e x c h a n g e r t u b i n g
a r e r e v i e w e d . T h e t e c h n i q u e e m p l o y s n o v e l r e a d - o u t f e a t u r e s w h i c h p l o t d e f e c t i n d i c a t i o n s a s o s c i l l o s c o p e
p a t t e r n s w h o s e s i z e a n d s h a p e r e v e a l d e f e c t m a g n i t u d e , l o c a t i o n w i t h i n t h e t u b e w a l l , a n d d e p t h . Probe w o b b l e
a n d h a r m l e s s t u b e k i n k s a n d b e n d s a r e p l o t t e d w i t h a c h a r a c t e r i s t i c p a t t e r n r e a d i l y d i s t i n g u i s h a b l e f r o m g e n u i n e
d e f e c t s . R e s u l t s o f a p p l y i n g t h e test to 7 5 0 0 0 0 ft o f i n s t a l l e d t u b i n g u n d e r d i f f i c u l t f i e l d c o n d i t i o n s a r e s u m m a r i z e d .
A P P L I C A T I O N S I N D U S T R I E L L E S D E S E S S A I S N O N D E S T R U C T I F S A L ' É T A B L I S S E M E N T N U C L É A I R E D E
H A N F O R D . O n a r e c o u r s à d e s e s s a i s n o n d e s t r u c t i f s — r a p i d e s , sûrs e t a u t o m a t i q u e s - pour assurer l a s é c u r i t é
e t l ' e f f i c a c i t é d e s o p é r a t i o n s c r i t i q u e s à H a n f o r d . O n u t i l i s e c o u r a m m e n t d e s m é t h o d e s d e c o n t r ô l e très s e n s i -
b l e s , f o n d é e s sur l e s c o u r a n t s d e F o u c a u l t e t l e s u l t r a s o n s , pour v é r i f i e r a v e c l e m a x i m u m d ' a s s u r a n c e et d a n s l e
m i n i m u m d e t e m p s l a q u a l i t é d ' i m p o r t a n t s v o l u m e s d e m a t i è r e s e t p r o d u i t s .
L e m é m o i r e d é c r i t l é s a p p a r e i l s d e c o n t r ô l e u t i l i s é s p o u r s ' a s s u r e r d e l à q u a l i f e d e l a f a b r i c a t i o n d e s
c o m b u s t i b l e s n u c l é a i r e s a H a n f o r d . C e s a p p a r e i l s , q u i f o n t p a r t i e i n t é g r a n t e d e l ' é q u i p e m e n t d e f a b r i c a t i o n ,
a p p l i q u e n t l e p r i n c i p e d e l ' a t t é n u a t i o n d e s o n d e s u l t r a s o n o r e s pour c o n t r ô l e r l a s t r u c t u r e g r a n u l a i r e d e b a r r e a u x
d ' u r a n i u m n o n g a i n é , l e s u l t r a s o n s e t l e s c o u r a n t s d e F o u c a u l t p o u r c o n t r ô l e r l a l i a i s o n e n t r e l ' u r a n i u m e t s a
g a i n e e n a l u m i n i u m a i n s i q u e l ' é p a i s s e u r d e c e t t e d e r n i è r e ( 1 m m ) , e t u n e n o u v e l l e m é t h o d e u l t r a s o n o r e ( l a r g e
b a n d e , h a u t e r é s o l u t i o n ) p o u r l a d é t e c t i o n d e s d é f a u t s d a n s l e s s o u d u r e s a u x e x t r é m i t é s d e s c a r t o u c h e s d e c o m -
b u s t i b l e . D e s m é t h o d e s c o m b i n é e s ( c o u r a n t s d e F o u c a u l t e t u l t r a s o n s ) s o n t a p p l i q u é e s s i m u l t a n é m e n t p o u r
l ' i n s p e c t i o n c o m p l è t e d ' u n é l é m e n t c o m b u s t i b l e e n n e u f s e c o n d e s ; l e s é l é m e n t s d é f e c t u e u x s o n t r e j e t é s
a u t o m a t i q u e m e n t .
L e m é m o i r e e x p o s e e n d é t a i l l e s m é t h o d e s u l t r a s o n o r e s p e r f e c t i o n n é e s p o u r l e c o n t r ô l e d e s g a i n e s d e
c o m b u s t i b l e & p a r o i s m i n c e s . D e s t r a d u c t e u r s s p é c i a u x à forte f o c a l i s a t i o n sont u t i l i s é s a v e c u n c i r c u i t à b a n d e
225

226 D. С. WORLTON
l a r g e p o u r p r o d u i r e d e s o n d e s d e r o t a t i o n p u r e s d a n s u n t u b e d e 0 , 3 7 m m d ' é p a i s s e u r . L e s o n d e s d e L a m b e t
a u t r e s m o u v e m e n t s o n d u l a t o i r e s c o m p l e x e s s o n t e x c l u s , d e s o r t e q u e l e s r S s u l t a t s p e u v e n t ê t r e f a c i l e m e n t
i n t e r p r é t é s e t r e p r o d u i t s . O n a m i s a u p o i n t d e s m é t h o d e s n o u v e l l e s e t é c o n o m i q u e s d e p r o d u c t i o n d ' é t a l o n s
d e d é f a u t s , a i n s i q u e d e s m é t h o d e s p e r m e t t a n t d e d o n n e r a u x t r a d u c t e u r s e u x - m ê m e s d e s c a r a c t é r i s t i q u e s
u n i f o r m e s d e f o n c t i o n n e m e n t . O n a é g a l e m e n t m i s a u p o i n t u n a p p a r e i l d ' i n s p e c t i o n a u t o m a t i q u e d e s t u b e s ;
l e m é m o i r e r é s u m e l e s r é s u l t a t s d e l ' u t i l i s a t i o n c o u r a n t e d e c e t a p p a r e i l p o u r c o n t r ô l e r q u e l q u e 1 0 0 0 0 m d e
t u b e s .
E n f i n , l e m é m o i r e p a s s e e n r e v u e l e s m é t h o d e s f o n d é e s sur l e s c o u r a n t s d e F o u c a u l t q u i ont é t é m i s e s a u
p o i n t s p é c i a l e m e n t p o u r l ' i n s p e c t i o n d e s t u b e s d e s é c h a n g e u r s d e c h a l e u r a p r è s m o n t a g e . O n a r e c o u r s a u n
s y s t è m e i n é d i t d e l e c t u r e q u i e n r e g i s t r e g r a p h i q u e m e n t l e s i n d i c a t i o n s d e d é f a u t s d e l a m ê m e m a n i è r e q u ' u n
o s c i l l o g r a p h e : l ' a m p l i t u d e e t l a f o r m e d u s i g n a l i n d i q u e n t l ' i m p o r t a n c e d u d é f a u t , s o n e m p l a c e m e n t d a n s l a
p a r o i d u t u b e e t s a p r o f o n d e u r . L e s p e t i t s m o u v e m e n t s d e l a s o n d e e t l e s d é f o r m a t i o n s sans i m p o r t a n c e d e l a
s u r f a c e d u t u b e s o n t e n r e g i s t r é s s e l o n u n e c o u r b e c a r a c t é r i s t i q u e , f a c i l e à d i s t i n g u e r d e c e l l e q u e p r o d u i s e n t
l e s v é r i t a b l e s d é f a u t s . L e m é m o i r e r é s u m e l e s r é s u l t a t s d e c e m o d e d e c o n t r ô l e p o u r 2 5 0 0 0 0 m d e t u b e s
i n s t a l l é s .
П Р О В Е Д Е Н И Е Б О Л Ь Ш О Г О Ч И С Л А Н Е Д Е С Т Р У К Т И В Н Ы Х И С П Ы Т А Н И И В " Х Е Н Ф О Р Д
А Т О М И К П Р О Д А К Т С О П Е Р Е И Ш Е Н " . Б е з о п а с н о с т ь и э ф ф е к т и в н о с т ь к р и т и ч е с к и х п р о ц е с -
с о в Х е и ф о р д а г а р а н т и р у е т с я б ы с т р ы м , н а д е ж н ы м и а в т о м а т и ч е с к и м с п о с о б о м и с п ы т а н и я
о б р а з ц о в б е з р а з р у ш е н и я о б о л о ч к и . В ы с о к о ч у в с т в и т е л ь н ы е т о к и Ф у к о и у л ь т р а з в у к н а х о -
д я т с в о е о б ы ч н о е п р и м е н е н и е в э т о й о б л а с т и и в п р о ц е с с а х и з г о т о в л е н и я и з д е л и й д л я т о г о ,
ч т о б ы о б е с п е ч и т ь м а к с и м а л ь н у ю г а р а н т и ю к а ч е с т в а б о л ь ш и х к о л и ч е с т в м а т е р и а л а з а м и н и -
м а л ь н ы й п е р и о д в р е м е н и .
О п и с ы в а ю т с я с и с т е м ы , и с п о л ь з у е м ы е д л я т о г о , ч т о б ы о б е с п е ч и т ь к а ч е с т в е н н о с т ь п р о -
ц е с с о в Х е н ф о р д а п о и з г о т о в л е н и ю и з д е л и й я д е р н о г о т о п л и в а . Д е й с т в у ю щ и е к а к о б ы ч н о е о б о -
р у д о в а н и е э т и с и с т е м ы и с п о л ь з у ю т и з м е р е н и я у л ь т р а з в у к о в о г о з а т у х а н и я д л я т о г о , ч т о б ы
п р о к о н т р о л и р о в а т ь с т р у к т у р у з е р н а а к т и в н ы х з о н н е э к р а н и р о в а н н о г о у р а н о в о г о т о п л и в а , а
у л ь т р а з в у к о в о й м е т о д и м е т о д т о к о в Ф у к о д л я т о г о , ч т о б ы о б е с п е ч и т ь с о о т в е т с т в у ю щ у ю п о -
л о с н о с т ь и т о л щ и н у 0 , 0 4 0 д ю й м а а л ю м и н и е в о г о п о к р ы т и я э л е м е н т о в в к а с с е т а х , и н о в ы й ш и р о -
к о п о л о с н ы й м е т о д с в ы с о к о р а з р е ш а ю щ е й с п о с о б н о с т ь ю у л ь т р а з в у к о в о г о о б с л е д о в а н и я д л я
о б н а р у ж е н и я д е ф е к т о в в с в а р н ы х ш в а х н а с т ы к а х о б о л о ч к и . О б ъ е д и н е н и е и с п ы т а н и й с п о м о -
щ ь ю у л ь т р а з в у к а и т о к о в Ф у к о п р и м е н я е т с я о д н о в р е м е н н о д л я т о г о , ч т о б ы п р о в е с т и п о л н о е
о б с л е д о в а н и е т о п л и в н о г о э л е м е н т а в д е в я т и с е к у н д н о м ц и к л е . Э л е м е н т ы с д е ф е к т о м а в т о м а -
т и ч е с к и у д а л я ю т с я с п о т о ч н о й л и н и и п р о и з в о д с т в а . О с о б ы й у п о р д е л а е т с я н а у с о в е р ш е н с т в о -
в а н н ы е м е т о д ы и с п ы т а н и й с п о м о щ ь ю у л ь т р а з в у к а п о о б с л е д о в а н и ю т о н к о с т е н н ы х о б о л о ч -
н ы х т р у б д л я т о п л и в н ы х э л е м е н т о в . И с п о л ь з у ю т с я с п е ц и а л ь н ы е п р е р ы в а т е л и с в ы с о к о й ф о к у -
с и р о в к о й в м е с т е с ш и р о к о п о л о с н о й с х е м о й д л я т о г о , ч т о б ы п о л у ч и т ь ч и с т ы й с р е з в о л н ы в
т р у б а х т о л щ и н о й 0 , 0 1 5 д ю й м а . П р о с т е й ш и е и б о л е е с л о ж н ы е в о л н о в ы е д в и ж е н и я и с к л ю ч а ю т с я ,
п о с к о л ь к у р е з у л ь т а т ы и с п ы т а н и й л е г к о и с т о л к о в ы в а ю т с я и в о с п р о и з в о д я т с я . Р а з р а б о т а н ы
н о в ы е э к о н о м и ч е с к и е с п о с о б ы п о л у ч е н и я с т а н д а р т о в п о д е ф е к т а м , п о с к о л ь к у и м е ю т с я ч р е з -
в ы ч а й н о в а ж н ы е м е т о д ы , о б е с п е ч и в а ю щ и е е д и н о о б р а з и е д е й с т в у ю щ и х х а р а к т е р и с т и к с а м и х
п р е о б р а з о в а т е л е й . Р а з р а б о т а н п р и б о р п о а в т о м а т и ч е с к о м у о б с л е д о в а н и ю т р у б , и в к р а т ц е
и з л а г а ю т с я р е з у л ь т а т ы е г о о б ы ч н о г о и с п о л ь з о в а н и я п о и с п ы т а н и ю т р у б , о б щ е й д л и н о й п о ч -
т и 3 0 т ы с . ф у т о в .
И , н а к о н е ц , р а с с м а т р и в а е т с я м е т о д т о к о в Ф у к о , р а з р а б о т а н н ы й с п е ц и а л ь н о д л я о б с л е -
д о в а н и я у с т а н о в л е н н ы х т р у б т е п л о о б м е н н и к а . Э т о т м е т о д н е с е т в с е б е н о в ы е о с о б е н н о с т и ,
о н р е г и с т р и р у е т у к а з а н и я о д е ф е к т а х н а ш к а л е о с ц и л л о г р а ф а , р а з м е р ы и к о н ф и г у р а ц и я к о т о -
р о г о в с к р ы в а ю т в е л и ч и н у д е ф е к т а , е г о р а с п о л о ж е н и е в с т е н к е т р у б ы и г л у б и н у . Н а д и а г р а м м е
р е г и с т р и р у ю т с я к о л е б а н и я щ у п а и н е о п а с н ы е п е т л и т р у б и и з г и б ы в м е с т е с х а р а к т е р н ы м о б -
р а з ц о м , ч е т к о о т л и ч а ю щ и м с я о т н а с т о я щ и х д е ф е к т о в . В к р а т ц е и з л а г а ю т с я р е з у л ь т а т ы п р и -
м е н е н и я э т и х и с п ы т а н и й д л я т р у б о б щ е й д л и н о й 7 5 0 т ы с ф у т о в , у с т а н о в л е н н ы х в т р у д н ы х п о -
л е в ы х у с л о в и я х .
E N S A Y O S N O D E S T R U C T I V O S E N G R A N E S C A L A A P L I C A D O S E N H A N F O R D . L a s e g u r i d a d y l a e f i c i e n c i a
d e l a s o p e r a c i o n e s c r í t i c a s e f e c t u a d a s e n H a n f o r d se l o g r a n por m e d i o d e e n s a y o s n o d e s t r u c t i v o s r á p i d o s , seguros
y a u t o m á t i c o s . T a n t o i n s i t u c o m o e n l o s p r o c e s o s d e f a b r i c a c i ó n se e m p l e a n n o r m a l m e n t e s i s t e m a s d e i n -
s p e c c i ó n d e a l t a s e n s i b i l i d a d , u l t r a s ó n i c o s y p o r c o r r i e n t e s d e F o u c a u l t , que aseguran la c a l i d a d máxima d e
g r a n d e s c a n t i d a d e s d e m a t e r i a l e n u n t i e m p o d e i n s p e c c i ó n m f n i m o .
L a m e m o r i a d e s c r i b e l o s s i s t e m a s d e i n s p e c c i ó n q u e se e m p l e a n e n H a n f o r d p a r a m a n t e n e r l a c a l i d a d d e
l o s p r o c e s o s d e f a b r i c a c i ó n d e c o m b u s t i b l e s n u c l e a r e s . E s t á n i n t e r c a l a d o s e n l a c a d e n a d e p r o d u c c i ó n y e m p l e a n

HIGH-VOLUME NON-DESTRUCTIVE TEST APPLICATIONS 227
m e d i c i o n e s d e a t e n u a c i ó n u l t r a s ó n i c a p a r a c o m p r o b a r l a e s t r u c t u r a g r a n u l a r d e b a r r a s d e u r a n i o s i n r e v e s t i -
m i e n t o , t é c n i c a s u l t r a s ó n i c a s y d e c o r r i e n t e s d e F o u c a u l t p a r a v e r i f i c a r l a c o r r e c t a u n i ó n y e l e s p e s o r ( 0 , 0 4 0 p u l g )
d e l r e v e s t i m i e n t o d e a l u m i n i o d e otros e l e m e n t o s c o m b u s t i b l e s , y u n n u e v o s i s t e m a d e i n s p e c c i ó n d e b a n d a
a n c h a y e l e v a d a r e s o l u c i ó n q u e e m p l e a u l t r a s o n i d o s p a r a d e t e c t a r f a l l a s e n las s o l d a d u r a s q u e c i e r r a n los e l e m e n -
tos c o m b u s t i b l e s . L o s e n s a y o s por c o r r i e n t e s d e F o u c a u l t y u l t r a s o n i d o s se c o m b i n a n a p l i c á n d o l o s s i m u l t á n e a -
m e n t e p a r a e f e c t u a r u n a i n s p e c c i ó n c o m p l e t a d e l e l e m e n t o c o m b u s t i b l e e n u n c i c l o d e 9 s ; l o s e l e m e n t o s
d e f e c t u o s o s se r e t i r a n a u t o m á t i c a m e n t e d e l a c a d e n a d e p r o d u c c i ó n .
L a m e m o r i a d e s t a c a los m é t o d o s a v a n z a d o s d e e n s a y o u l t r a s ó n i c o p a r a i n s p e c c i o n a r tubos d e r e v e s t i m i e n t o
d e p a r e d e s d e l g a d a s . S e e m p l e a n t r a n s d u c t o r e s d e a l t o e n f o q u e , c o n c i r c u i t o s d e b a n d a a n c h a , p a r a g e n e r a r
o n d a s t r a n s v e r s a l e s p u r a s e n t u b o s d e 0, 0 1 5 p u l g d e e s p e s o r d e p a r e d . S e e x c l u y e n l a s o n d a s d e L a m b y o t r a s
o n d a s c o m p l i c a d a s , d e m a n e r a q u e es f á c i l i n t e r p r e t a r y r e p r o d u c i r l o s r e s u l t a d o s d e l o s e n s a y o s . S e h a n p e r -
f e c c i o n a d o m é t o d o s n u e v o s y e c o n ó m i c o s p a r a p r o d u c i r d e f e c t o s t i p o , a s f c o m o m é t o d o s d e i m p o r t a n c i a f u n -
d a m e n t a l p a r a a s e g u r a r l a u n i f o r m i d a d d e l a s c a r a c t e r í s t i c a s d e f u n c i o n a m i e n t o d e l o s t r a n s d u c t o r e s m i s m o s .
S e h a c o n s t r u i d o e q u i p o p a r a l a i n s p e c c i ó n a u t o m á t i c a d e t u b o s y l a m e m o r i a r e s u m e l o s r e s u l t a d o s o b t e n i d o s
e n e l e n s a y o d e u n o s 1 0 0 0 0 m d e t u b e r f a . Por ú l t i m o , l a m e m o r i a r e v i s a l a a p l i c a c i ó n d e l a s c o r r i e n t e s d e
F o u c a u l t q u e se h a n d e s a r r o l l a d o e s p e c í f i c a m e n t e p a r a i n s p e c c i o n a r t u b o s y a m o n t a d o s e n i n t e r c a m b i a d o r e s
d e c a l o r . E m p l e a n u e v o s m é t o d o s d e l e c t u r a q u e e n u n o s c i l o s c o p i o i n d i c a n l o s d e f e c t o s c o m o p e r f i l e s c u y o
t a m a ñ o y f o r m a r e v e l a l a m a g n i t u d , l a p o s i c i ó n d e n t r o d e l a p a r e d d e l t u b o y l a p r o f u n d i d a d a q u e se e n c u e n t r a
e l d e f e c t o . L a s i n e s t a b i l i d a d e s d e l a p r o b e t a y l a s d e f o r m a c i o n e s y p l i e g u e s i n o f e n s i v o s d e l o s tubos a p a r e c e n
c o n u n p e r f i l c a r a c t e r í s t i c o q u e se d i s t i n g u e n e t a m e n t e d e l o s d e f e c t o s r e a l e s . L a m e m o r i a r e s u m e los resultados
o b t e n i d o s c o n e s t e m é t o d o d e e n s a y o , q u e s e h a a p l i c a d o e n c o n d i c i o n e s d i f í c i l e s a 2 5 0 0 0 0 m d e t u b e r f a
i n s t a l a d a . -
INTRODUCTION
Industrial applications of non-destructive testing are most economically profitable when they can be applied to large volumes of material under rapid, reliable and routine operation. For maximum benefit, tests must be applied in the field or in a competitive manufacturing process where l a -boratory conveniences do not exist. The need for inspection techniques with these capabilities has promoted the growth of X-ray, fluorescent penetrant, magnetic particle, and similar methods even though they are-intrinsically slow and difficult to automate. The newer electronic methods, such as eddy current and ultrasonic, while being extremely fast and readily adapted to automatic operation, are hampered by their susceptibility to instrument drift and faulty calibration, necessity for skilled data interpretation, sensi-tivity to trivial specimen parameters and other factors. These tests have thus been slow to be applied in those areas where they of fer the greatest potential - the routine inspection of large quantities of material under dif -ficult field conditions.
At the Hanford Operations of the United States Atomic Energy Commission (USAEC), a major effort has been devoted over the past several years to a c -celerate transition of these tests from laboratory to field use. This paper describes results in two major areas: The inspection of thin-wall tubing, and the automatic inspection of nuclear fuel.
I. THIN-WALLED TUBING TESTS
Modern technology uses tubing with diameters less than one inch and wall thickness less than 0.050 inch in tremendous quantities. The heat-

228 D. С. WORLTON
exchanger system of one Hanford nuclear installation alone uses about a million feet of this material. Typically, the quality of the tubing must be high, necessitating careful non-destructive inspection before installation. During operation, the tubing is normally subjected to rigorous environments. Since efficiency and safety of major installations is often critically dependent upon the continued integrity of its installed tubing, periodic inspection of this tubing is essential.
Tests are therefore necessary for the inspection of tubing both before and after installation. At Hanford, eddy-current tests have been developed for the inspection of installed tubing, and ultrasonic tests are used for the inspection of as-fabricated tubing. Each is discussed below.
1. Eddy-current test
The eddy-current test is particularly useful for inspecting installed tubing having restricted access. It readily scans with an internal probe the inside surface of long tubes where only the ends are accessible. It can also be readily adapted to a scan of the outside surface in instances where this is more convenient [1].
Its novelty with respect to existing tests l ies in the increased in fo r -mation it provides regarding the defects which it detects, and the convenient manner in which this information is displayed. In essence, its principle of operation is based upon two key points: The impedance locus of a coil in motion with respect to a defect is a curve rather than a straight line, and the shape of this locus uniquely describes (to a first approximation) the nature of the defect, i. e . , its- position with respect to the outer and inner tube sur-face, its depth, and its size. An important related point is that probe wobble and its associated "l i ft-off" signal has, with proper instrument adjustment, a unique and readily identifiable characteristic locus.
These concepts are readily demonstrated experimentally. The impe-dance of a coil approaching a tubing irregularity varies non-linearly because of the apparent change of wall thickness and the difference in phase of the eddy currents with distance from the coil . It follows that two concentric differentially connected coils, one slightly displaced to the other, will provide an output which varies in magnitude and phase as the two coils pass over an irregularity.
The vectors shown in F ig . l demonstrate that these vector signals pro -vide information regarding the nature of the defect. Here the vectors r e -present the peak output of two differentially connected 130-turn, 0.5-in-diam. coils as the coils move past various irregularities in a 5/8-in outside dia-meter (O.D.) 304 stainless-steel tube with 0.054-in wall. The coils are spaced 1/10 in apart and are driven at 200 kc. It is apparent that inner-surface flaws are readily distinguishable from outer flaws by the vector po-sition, and that the vectors rotate as the defects increase in depth. It is noted that the probe wobble, or lift of signal, so troublesome to many eddy-current tests, has its own characteristic position easily distinguishable from the defect signals.
Useful application of these results requires the data be put in a form readily observed and interpreted by unskilled operators. This is accomplished by displaying the information as Lissajou patterns on a cathode-ray tube.
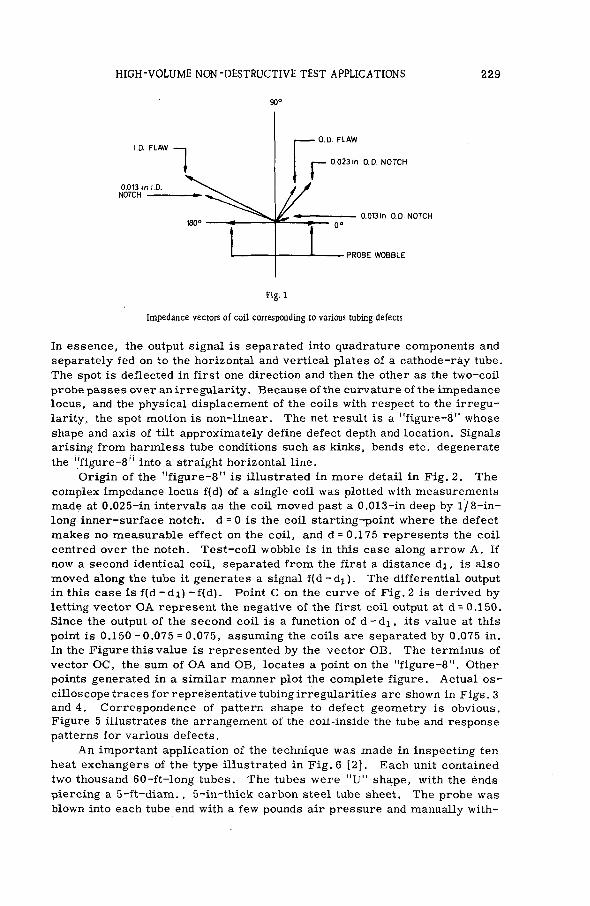
HIGH-VOLUME NON-DESTRUCTIVE TEST APPLICATIONS 229
90°
I
Г
O.D. FLAW I.D. FLAW
0.023 in O.D. NOTCH
0.013.On I .D. NOTCH
0.013in O.D. NOTCH 1 8 0 ° 0 °
PROBE WOBBLE
F i g - 1
I m p e d a n c e v e c t o r s o f c o i l c o r r e s p o n d i n g to v a r i o u s t u b i n g d e f e c t s
In essence, the output signal is separated into quadrature components and separately fed on to the horizontal and vertical plates of a cathode-ráy tube. The spot is deflected in first one direction and then the other as the two-coil probe passes over an irregularity. Because of the curvature of the impedance locus, and the physical displacement of the coils with respect to the irregu-larity, the spot motion is non-linear. The net result is a "figure-8" whose shape and axis of tilt approximately define defect depth and location. Signals arising from harmless tube conditions such as kinks, bends etc. degenerate the "figure-8" into a straight horizontal line.
Origin of the " f igure-8" is illustrated in more detail in Fig. 2. The complex impedance locus f(d) of a single coil was plotted with measurements made at 0.025-in intervals as the coil moved past a 0.013-in deep by 1 /8- in-long inner-surface notch, d = 0 is the coil starting-point where the defect makes no measurable effect on the coil , and d = 0.175 represents the coil centred over the notch. Test-coi l wobble is in this case along arrow A. If now a second identical coil, separated from the first a distance d j , is also moved along the tube it generates a signal f ( d - d j ) . The differential output in this case is f ( d - d i ) - f ( d ) . Point С on the curve of Fig. 2 is derived by letting vector OA represent the negative of the first coil output at d = 0.150. Since the output of the second coil is a function of d - d i , its value at this point is 0.150-0.075 = 0.075, assuming the coils are separated by 0.075 in. In the Figure this value is represented by the vector OB. The terminus of vector ОС, the sum of OA and OB, locates a point on the "figure-8". Other points generated in a similar manner plot the complete figure. Actual o s -cilloscope traces for representative tubing irregularities are shown in Figs.3 and 4. Correspondence of pattern shape to defect geometry is obvious. Figure 5 illustrates the arrangement of the coil-inside the tube and response patterns for various defects.
An important application of the technique was made in inspecting ten heat exchangers of the type illustrated in Fig. 6 [2]. Each unit contained two thousand 60-ft-long tubes. The tubes were "U" shape, with the ends piercing a 5- f t -d iam. , 5-in-thick carbon steel tube sheet. The probe was blown into each tube end with a few pounds air pressure and manually with-
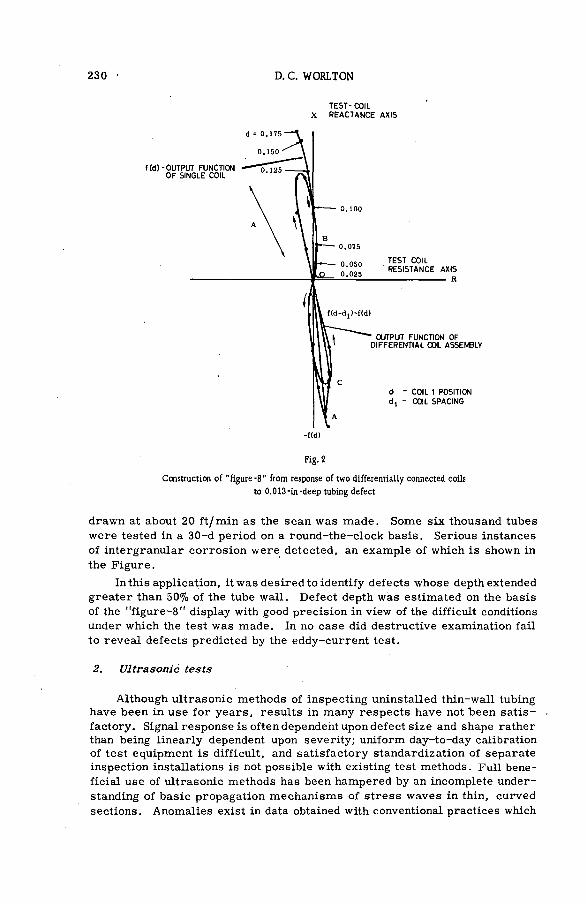
230 D. С. WORLTON
T E S T - C O I L X R E A C T A N C E A X I S
F i g . 2
C o n s t r u c t i o n o f " f i g u r e - 8 " f r o m response o f t w o d i f f e r e n t i a l l y c o n n e c t e d c o i l s
to 0 . 0 1 3 - i n - d e e p t u b i n g d e f e c t
drawn at about 20 f t /min as the scan was made. Some six thousand tubes were tested in a 30-d period on a round-the-clock basis. Serious instances of intergranular corrosion were detected, an example of which is shown in the Figure.
In this application, it was desired to identify defects whose depth extended greater than 50% of the tube wall. Defect depth was estimated on the basis of the "f igure-8" display with good precision in view of the difficult conditions under which the test was made. In no case did destructive examination fail to reveal defects predicted by the eddy-current test.
2. Ultrasonic tests
Although ultrasonic methods of inspecting uninstalled thin-wall tubing have been in use for years, results in many respects have not Ъееп sat is -factory. Signal response is often dependent upon defect size and shape rather than being linearly dependent upon severity; uniform day-to-day calibration of test equipment is difficult, and satisfactory standardization of separate inspection installations is not possible with existing test methods. Full bene-ficial use of ultrasonic methods has been hampered by an incomplete under-standing of basic propagation mechanisms of stress waves in thin, curved sections. Anomalies exist in data obtained with conventional practices which

HIGH-VOLUME NON-DESTRUCTIVE TEST APPLICATIONS 231
( c )
F i g . 3
T y p i c a l s i g n a l patterns
(a ) Probe w o b b l e
( b ) 0 . 0 1 3 - i n I . D . n o t c h
( c ) S h a l l o w I . D . r i n g
clearly demonstrate inadequacies of simple theories. Lamb-wave concepts are approximately valid for waves propagating in a direction parallel to the longitudinal axis of the tube, but are involved when curvature is taken into account for waves travelling in a circumferential direction. Complexity of the latter case is reflected in the fact that its mathematical solution has not been developed, so far as is known.
At Hanford, long-range research efforts have developed improved ultra-sonic inspection techniques and have provided strengthened understanding of their technical operation. Very briefly, a major contribution of this study has been to side-step complete solution of the theoretical problem by d e -veloping experimental techniques which extend validity of simple shear-wave theories to the thin-wall case (wall thickness greater than 0.012 in). Com-plicated wave motions which resonate the tube wall, distort signal response depending upon defect orientation and shape, and make test results critically dependent upon incident beam angle and ultrasonic frequency, are avoided by

232 D. С. WORLTON
( a )
(b)
Û1
F i g . 4
T y p i c a l s i g n a l patterns
( a ) 0 . 0 2 3 - i n I . D . n o t c h
(b) 0 , 0 4 0 - i n d i a m . d r i l l h o l e
( c ) 0 . 0 2 3 - i n O . D . n o t c h
use of small, highly focused, transducers whose diameters are less than one-half of the wall thickness. 3 /16-in-diam. transducers with 0.008-in focused beam diameters are commonly used. Frequency band-widths are made as wide as possible; a 15-Mc centre frequency is employed, although this value is not critical [3].
Figure 7 illustrates the key point in the experimental approach. The data demonstrate that, under the given experimental conditions, shear waves only propagate in the tube wall in an uncomplicated zig-zag manner entirely analogous to the way shear waves travel in thicker sections. Waves i m -pinge upon the inner- and outer-tube surfaces at discrete points only. Res-ponse amplitude to standard defects increases linearly as the discontinuity approaches the beam entry point. These data were obtained with the in -

HIGH-VOLUME NON-DESTRUCTIVE TEST APPLICATIONS 233
NOTCH 0.013 in DEEP x 1/8 in LONG x 0.004 in WIDE ON INNER SURFACE NOTCH 0.023In DEEPx 1/8 In LONG x 0 .004 in WIDE ON OUTER SURFACE NOTCH 0.013in DEEPx 1/8 i n LONG x 0 .004 in WIDE ON OUTER SURFACE HOLE 0 .040 in DIAM. THROUGH TUBE WALL DENT IN TUBE TUBE SUPPORT
EDDY-CURRENT TEST-PROBE WOBBLE
INDICATION DUE TO INTERGRANULAR CORROSION
F i g . 5
S t e a m - g e n e r a t o r t u b i n g - t e s t e d d y - c u r r e n t tester a r r a n g e m e n t
F i g . 6
E d d y - c u r r e n t t e s t i n g N - r e a c t o r s t e a m generators

234 D. С. WORLTON
I N C I D E N T - i / w ' ANGLE 26.8° | /T\
S H E A R - W A V E P R O P A G A T I O N . 4 5 • / 1 D 1
A N G L E
G A T E D A R E A
OD, 9 0 " E N D W f t L l
(a) A X I A L N O T C H T E S T
3 / 1 6 - D I A M . F O C U S E D CRYSTAL
8 - M I L - D I A M . B E A M
ODj OD2 OD3
i w y ID, ID2 I D ,
G A T E D A R E A
( Ы C I R C U M F E R E N T I A L N O T C H T E S T
9 0 ° E N D W A L L
O . D . A N D NOTCH
AS fit/cm I. D. N O T C H
0.0. NOTCH
Surf.i ID, OD,iry OD2 ID3 ODj I ( : : - ( о " Г " " - - - T R A N S D U C E R A L I G N M E N T A N D
G A T E D A R E A R E S P O N S E TO F L A W S
F i g . 7
E x p e r i m e n t a l a r r a n g e m e n t o f u l t r a s o n i c t u b i n g test
cident beam, angle purposely set to exclude the generation of longitudinal waves.
Data-defect-signal response as a function of defect-depth location with respect to inner and outer surface, and incident beam angle are shown in

HIGH-VOLUME NON-DESTRUCTIVE TEST APPLICATIONS 235
LEGEND-• -1,2 AMDS-MIL 1.0. NOTCHES ANDEND WALL
О -1 ,2 AND 3 -MIL CXD.NOTCrtES AND END WftLL
LEGEND' • - I D. R E S P O N S E o - O.D.RESPONSE
29° INCIDENT ANGLE ( W S H E A R ) 8 -MIL BEAM SIZE
35» 40° 45° 50° 55° CALCULATED SHEAR ANGLE
/
/
NOTCH DEPTH. MIL HOLE DIAM., MIL 18.5° 21.5° 29. Í 31.5°
INCIDENT ANGLE
AXIAL NOTCHES, CIRCUMFERENTIAL PROPAGATION AXIAL NOTCHES, CIRCUMFERENTIAL PROPAGATION
F i g . 8
S i g n a l r e s p o n s e as o f d e f e c t d e p t h ,
p o s i t i o n a n d i n c i d e n t b e a m a n g l e for 0 . 0 1 2 - i n - t h i c k Z i r c a l o y t u b i n g
Fig. 8 for axially-oriented defects in 0.012-in-thick Zircaloy tubes. Data from defects oriented in a perpendicular direction are essentially identical. It is noted that response increases with defect depth, and that notches located on the inner and outer surface respond with nearly equal amplitude. Sen-sitivity is capable of detecting notches 0.001 in deep, and amplitude response is not critically dependent upon incident beam angle. The important con-clusion to be drawn from these data is that wide-band electronic circuitry, small transducers, and highly-focused beams make possible the inspection of thin-wall tubing with the same confidence and readily interpreted results as are obtained on thicker sections. This fact guided the development of equipment for routine inspection of fuel-sheath tubing. Summarized in Table I are extensive data which define optimum test procedures for tubing of various geometries and materials.
We proceed to a description of the equipment ultimately developed with a review of work done in evaluating transducer performance and the possible importance of transducer variables on the quality of test results achieved [4]. It was observed early that test-data anomalies were often traceable to inconsistencies in the transducers themselves. Supposedly identical trans-ducers operating in a given experimental arrangement did not necessarily give equivalent results. A study made to explain these effects has led to the development of a novel method of measuring transducer frequency, efficiency,

236 D. С. WORLTON
T A B L E I
GENERAL TUBING TEST DATA
T u b e
m a t e r i a l
W a l l
t h i c k n e s s
D i a m e t e r - t o -
t h i c k n e s s
r a t i o
M i n i m u m
n o t c h d e p t h a n d
o r i e n t a t i o n
E n t r y
a n g l e
B e a m
s i z e
P i t c h
Z i r c a l o y 1 2
1 2
3 1 1 a x i a l
1 c i r c u m f e r e n t i a l
2 9 *
2 9 *
8
8
6
6
S t a i n l e s s 1 2
1 2
3 1 2 a x i a l
2 c i r c u m f e r e n t i a l
2 2 *
2 2 *
8
8
6
6
A l u m i n i u m 1 2
1 2
3 1 1 a x i a l
1 c i r c u m f e r e n t i a l
2 2 *
2 2 *
8
8
6
6
Z i r c a l o y 1 7
1 7
3 5 1 a x i a l
1 c i r c u m f e r e n t i a l
2 6 . 8 *
2 6 . 8 *
8
8
6
6
Z i r c a l o y 2 5
2 5
1 5 1 a x i a l
1 c i r c u m f e r e n t i a l
2 6 . 8 *
2 6 . 8 *
8
8
6
6
S t a i n l e s s 2 5
2 5 -
1 5 2 a x i a l
2 c i r c u m f e r e n t i a l
1 8 "
1 9 . 9 '
8
8
6
6
A l u m i n i u m 2 5
2 5
1 5 1 a x i a l
1 c i r c u m f e r e n t i a l
1 8 *
1 9 . 9 *
8
8
6
6
Z i r c a l o y 4 5
4 5
4 5
1 0
2 c i r c u m f e r e n t i a l
1 a x i a l
1 c i r c u m f e r e n t i a l
2 6 . 8 *
2 4 *
2 6 . 8 *
2 0
2 0
8
' 1 5
1 5
6
S t a i n l e s s 4 5
4 5
1 0 2 a x i a l
2 c i r c u m f e r e n t i a l
1 7 *
1 9 . 9 *
2 0 .
8
1 5
6
A l u m i n i u m 4 5
4 5
1 0 2 a x i a l
1 c i r c u m f e r e n t i a l
1 7 '
1 9 . 9 '
2 0
8
1 5
6
A l u m i n i u m 6 5
6 5
7 . 7 1 a x i a l
2 c i r c u m f e r e n t i a l
1 6 *
1 9 . 9 *
2 0
2 0
1 5
1 5
Z i r c a l o y 6 5
6 5
7 . 7 1 a x i a l
1 c i r c u m f e r e n t i a l
2 1 . 5 *
2 6 . 8 '
2 0
8
1 5
6
S t a i n l e s s 6 5
6 5
7 . 7 2 a x i a l
1 c i r c u m f e r e n t i a l
1 6 *
1 9 . 9 *
2 0
8
1 5
6
A l u m i n i u m 6 5
6 5
7 . 7 2 a x i a l
1 c i r c u m f e r e n t i a l
1 6 °
1 9 . 9 *
2 0
8
1 5
6
N o t e : A l l d i m e n s i o n s i n m i l s u n l e s s o t h e r w i s e s t a t e d .
damping factor, focal length and radiated beam profile. Obviously, each of these parameters affects transducer performance. Unfortunately, however, subtle transducer irregularities affect this performance in a way that is not

HIGH-VOLUME NON-DESTRUCTIVE TEST APPLICATIONS 237
readily observable from use of the transducers in regular test equipment, yet markedly degrades quality of results obtained. Existence of such i r -regularities was found to be not uncommon in the commercial transducers examined.
Figure 9 illustrates an experimental arrangement especially designed to measure the transducer parameters listed above. As applied to small
Fig. 9
Experimental arrangement for measuring transducer parameters
highly-focused units, 0.025-in ball reflector is translated through the focal point in two perpendicular directions designated X and Y. Motion of the ball in either direction rotates a potentiometer which generates a linearly increasing voltage. Fed on to the horizontal plates of an oscilloscope, this voltage deflects a spot across the face of the scope in one-to-one corres -pondence with reflector displacement. A broad frequency-band electronic system excites the transducer with a sharp voltage spike, receives and amplifies pulse echoes returning from the reflector, and displays them on the vertical plates of the oscilloscope.
Results obtained from a well-made 15-MHz, spherically focused, com-mercial transducer are shown in Fig. 10. The one exception to the excellent performance of this unit is that its actual frequency is 17 MHz instead of the rated 15 MHz - an acceptable deviation for this application. The radiated beam profile shown in the lower two wave traces are very important, how-ever. The amplitude of each half-cycle of radiated energy is shown as a function of X in the middle photograph, and as a function of Y in the lower photograph. It is noted that the profile is approximately equal in width in both directions. These curves also show that the radiated energy is sym-metrical about the midpoint. A'damping factor of three (defined as the num-ber of positive half-cycles greater in amplitude than the first half-cycle) is measured. Transducers with these characteristics readily reproduce

238 D. С. WORLTON
FREQUENCY 1 Mc FOCAL LENGTH 19 [is BEAM DIMENSIONS
X 8 MIL Y 8 MIL
DAMPING FACTOR 3
17.5 Mc 34.9 ps
FREQUENCY FOCAL LENGTH BEAM DIMENSIONS
X 17.1 MIL Y 16.5 MIL
DAMPING FACTOR 2
4. 5 mil / c m
Fig.10
Ultrasonic transducer characteristics
data earlier reported in Fig. 8 and provide consistent results in practical application.
The same measurements applied to a supposedly equivalent transducer reveal typical manufacturing imperfections shown in the lower half of Fig. 10. In this case the actual frequency is 17.5 MHz and the damping factor is 2. The beam profile width in both the X and Y directions is nearly twice as broad as the former case, revealing reduced sensitivity to small defects. The lower two waveforms are not symmetrical, showing that the focusing lens is improperly aligned on the transducer face. Attempts to use this practical tube-testing equipment would give erratic results. Similar tests applied to an extensive number of units have revealed that regions of faulty bonding between crystal and backing member, density variations of the backing, and faulty alignment of the focusing lens, are readily apparent. On the basis of these tests, specifications have been developed to insure accurate and reproducible results when applied to routine tubing inspection.

HIGH-VOLUME NON-DESTRUCTIVE TEST APPLICATIONS 239
These specifications are as follows:
Centre frequency + 1 0 % - 0 % of specified value (normally 15 MHz) Damping factor 3.5 ± 0 . 5 Beam width 0.008 ±0.001 in (at 3-db points) Beam symmetry Peak amplitude of each half-cycle within
0.004 in of beam centre Focal point 19 ± 1 /us
An important outgrowth of this activity has been a general upgrading of the quality of transducers marketed in the United States of America. At least one leading vendor has adopted the practice of inspecting each unit manufactured with an arrangement equivalent to Fig. 9 as a final step in its manufacture. Transducers made to the specifications prescribed above have thus became available for the first time.
Equipment for inspection of thin-walled tubing has been developed and put to routine use [5]. In practice, two transducers are used; one sends a beam circumferentially around the tube, the other is directed down the longi-tudinal axis of the tube. This ensures the detection of defects regardless of their orientation, and eliminates the necessity for repeat tests as is some-times required. As shown by the sketch in Fig. 11, the arrangement passes the tubes through a 6 inX 8- in "weir " tank which is translated along the tube as the scan is made. Water is continuously filtered and circulated through weir tank. Special bearing design permits free passage of the tube through the tank without appreciable wear to the tube or the bearing.
Tubes rotate at 1800 rpm, pulse repetition rate is 10 kc, and one foot of tubing is inspected per minute. The equipment shown was developed under the United States/Canadian Co-operative Programme on Heavy-Water R e -actors, and is at present applied to the inspection of nuclear-fuel-sheath tubing in Canada. Similar equipment has been in routine one and two-shift use at Hanford for the past two years inspecting United States fuel-sheath tubing.
II. AUTOMATIC FUEL TESTING
Hanford's nuclear-fuel inspection practices are a good example of the beneficial returns that result from the use of non-destructive methods in routine, automatic production lines. Here the high cost of charging failure-prone fuel into a reactor makes it essential that the quality of each element is non-destructively ensured before use.
Hanford has had automatic test equipment operating in fuel-manufacturing lines for a number of years. While at the time of their development these test techniques were novel and in the forefront of NDT technology - at this time they are more representative of well-accepted practices. For this reason, the following discussion gives the main emphasis to the automatic features of the equipment rather than to the physics of the tests themselves. More detailed information on the latter subject is available from numerous references [6-9].

240 D. С. WORLTON
• н *
WÊÊÊÊÊÊÊÊÊÊÊÊÊÊÊÊÊÊÊÊÊÊÊÊÊÊÊM •ш • I
— Fig. 11
Ultrasonic tubing tester
Fully-automatic ultrasonic and eddy-current inspection systems have been developed to ensure the integrity of Hanford production fuel elements on a routine, production line, basis. The uranium-fuel cores are cylindrical in shape, roughly 1 - 1/3 in in diam. by 8 in long, with a 3/8-in hole down the central axis. The cores are clad in a 0.030-in aluminium jacket with an aluminium silicon braze alloy which metallurgically bonds the jacket to the core. The fuel elements are closed with aluminium end-caps which are Heli-arc welded to the side jacket at one end and a central aluminium spine at the other.
Three separate systems have been developed to inspect the bare uranium core, the cladding, and the closure. In each system, fuel is brought to the test station, submerged in the test tank, separated into acceptable and un-acceptable categories on the basis of the non-destructive test performed, and transferred down a continuous production line by automatic conveyor.
Uniform grains of the correct average diameter are ensured in the bare fuel cores by a 5-Mc through-transmission ultrasonic test. Unacceptable grains which are too large or too small incorrectly attenuate the beam and thereby provide an identifying signal. The bases of the test are shown in the extreme right of Fig. 12. Correspondence of grain size to wave attenuation is graphically illustrated in the right centre photograph.

HIGH-VOLUME NON-DESTRUCTIVE TEST APPLICATIONS 241
REDUCE REACTOR FUEL FAILURES BY INSPECTING
EDDY-CURRENT
ULTRASONIC MAPPING
UNBONDS RESTRICT HEAT F L O W Al Si PENETRATIONS REDUCE CORROSION RESISTANCE
CLOSURE DEFECTS ARE POTENTIAL LEAK-AGE R4THS FROM COOLANT TO CORE
GRAIN SIZE LARGE GRAINS CAUSE SURFACE BUMPING; SMALL GRAINS DISTORT CORE - i d
Fig. 12
Principle of operation of automatic fuel testers
Defects in the weld closure offer potential leakage paths for the reactor coolant to contact the fuel core. Such defects between the core and the ex-treme ends are detected with an ultrasonic system of high defect resolution capabilities. As illustrated in the upper centre diagram, tests are s i -multaneously applied to both weld closures. Sensitivity is sufficient to de -tect a hairline crack or 0.020-in-diam. porosity 0.020 in below the surface. Electronic memory techniques distinguish continuous from scattered defects.
Combined ultrasonic and eddy-current tests ensure that cladding braze porosity is within acceptable limits, and that the cladding is free from erosion penetrations of its under surface by the braze alloy. Both tests are simultaneously applied to the inner and outer surface. The inner probe uses a send-and-receive transducer to generate what are presumed to be Lamb
t6

242 D. С. WORLTON
AUTOMATIC FUEL T£ST€R$
\ ¥ *
! HI
Te»t simultan«ou»ly applied to internal and external surfacet-
5 completed in 9 seconde. j Defective elements automatically rejected f rom process s t ream.
Ultrasonic Lamb Wove Eddy C u r r e n t ^ ^
INTERNAL CLADDING PROBE
сет probe
Utrosoníe l o n g i t u d i n a l Wove
= = CLOSURE PROBE
w 4 Ultrasonic Send-Receive
Fig.13
Automatic fuel-test station

HIGH-VOLUME NON-DESTRUCTIVE TEST APPLICATIONS 243
UT-10 NON-DESTRUCTIVE TESTING OF IRRADIATED
R E A C T O R - F U E L ELEMENTS
External Cladding-Core Bond Test and Clad
Thickness Measurement
Fig. 14
Inspection of irradiated fuel
waves in unbonded regions of the cladding. The external bond test uses a conventional 20-Mc pulse-echo technique. Braze porosity or non-bond defects as small as 0.030 in are reliably detected, and AISi penetrations reaching within 0.015 in of the surface are revealed by the eddy-current test. The eddy-current test operates at 20 kc with each probe consisting of a primary and secondary winding. In the external eddy-current test, a thin film of plastic tape is continuously passed between the test coil and the rotating fuel element. Its purpose is to eliminate wear of the probe and to minimize variation in the spacing of probe and fuel surface. Typical AISi penetrations with their corresponding detecting signal are shown in the centre of Fig. 12. Also shown is an ultrasonic map of typical unbond defects with autoradio-graph results of the same element. The under surface of the cladding after destructive removal from the element is also shown.
All systems rotate the fuel cores at about 1000 rpm with a complete scan completed in a few seconds. Figure 13 shows the automatic test station incorporating ultrasonic and eddy-current tests for the fuel cladding. As the external and internal fuel surfaces are inspected simultaneously, each

244 D. С. WORLTON
station includes two ultrasonic and two eddy-current tests. A close-up of an element under test is shown in the lower right of the upper photograph. The lower photograph illustrates the various ultrasonic probes used by the fuel-inspection equipment.
Although not applied to such large numbers, non-destructive tests have also been developed for the inspection of irradiated fuel after reactor ex-posure. For this application, techniques similar to the unirradiated case are employed, except that provision for remotely conducting the test are necessary. At Hanford, tests are applied approximately 20 ft under water. Figure 14 sketches tests applied to radiated fuel of different design in the upper right. Fuel properties inspected are identified in the sketch. Equip-ment used to mechanically support the fuel and transducers and provide the necessary scanning motions are shown in the two lower photographs. A fuel element under test is shown in the upper left.
R E F E R E N C E S
[1] LIBBY. H. L . , An Improved Eddy-Current Test, HW-81780, May 7 (1964). [2] CHOCKIE, L. J. , Nondestructive Testing Nuclear Steam Generators After Installation, HW "SA-3245,
October 21 (1963). [3] ZEUTSCHEL, M. F . , Thin-Walled Tubing Test Using Ultrasonic Shear Waves, Part II Production Test
Equipment: Its Operation and Test Results, HW-81957, June 30 (1964). 14] ZEUTSCHEL, M. F., The Measurement of Ultrasonic Transducer Characteristics, HW -81955, June (1964). [5] ZEUTSCHEL, M. F., Thin Walled Tubing Test Using Ultrasonic Shear Waves, Part I Theory of Ultrasonic
Waves Propagation, Experimental Data and Standard Fabrication, HW-81956, June 12(1964). [6] FREDERICK, C. L. , Ultrasonic Grain Size Testing of Hanford Fuel Elements, HW-64971, May 11 (1960). [7] LIBBY, H. L. , Electromagnetic Detection of AISi Penetrations, HW-29730, October 23 (1953). [8] WORLTON, D. C. , An Ultrasonic Method for Bond Testing Reactor Fuel Elements, HW-47017, November 27
(1956). L9J ZEUTSCHEL, M. F. and HUNTER, D. O. . UT-4 - An Automatic Ultrasonic Tester for Closures of Hanford
I & E Fuels, HW-74625, May (1963).
D I S C U S S I O N
A . D . McEACHERN: During the discussion of Mr. McKane's paper* in which he mentioned some apparent limitations of ultrasonic bond testing, you indicated that Hanford had a better method. Could you now give us some details?
D . C . WORLTON: We use a 20-MHz wide-band pulse-echo system. The higher frequency provides higher sensitivity to non-bond defects and eliminates variations in the uranium core. This system is satisfactory for the Hanford canning process, but it is not certain that it would be better for other canning processes.
A . D . McEACHERN: In your oral presentation you brought up a very important point about the unpredictable characteristics of commercial ultra-sonic transducers. Can you comment on whether the time is coming when
* These proceedings, (SM-63/43).
HIGH-VOLUME NON-DESTRUCTIVE TEST APPLICATIONS 245
we will be able to order a specific type of transducer and expect to get what we order?
D.C. WORLTON: Our system of analysing transducers has been adopted by commercial transducer manufacturers, and the quality of their trans-ducers has thereby been improved. I think that is all I can say at the moment.
R.S . SHARPE: I would like to support your move to provide more pre-cise data on the characteristics of your ultrasonic transducers. I would suggest, however, that you should also measure the frequency of the wave in the medium (for example by a Schlieren method).
D .C . WORLTON: The measurement you suggest would be an excellent one for basic study, but we have not performed it.
Z . PAWLOWSKI: You showed two patterns obtained with the device for testing piezoelectric transducers (crystals). The first was symmetrical, i . e . the transducer was good, while the other was asymmetrical, which you interpret as bad.
Could you say a little more about the possible reasons for "good" and "bad" behaviour of the transducers.
Also, did you measure the displacement pattern on the surface of the transducer?
D . C . WORLTON: The main difficulties with commercial transducers are variations in bonding between crystal and its backing member and bonding between crystal and lens, and improperly mounted lenses.
No, we have not measured the displacement pattern. R. NEIDER: I would like to ask two questions on the eddy-current
measurement of fuel-element cladding material. Could you please ex-plain the construction and material of the fuel elements tested?
D . C . WORLTON: The cladding is bonded to the uranium core with a braze alloy which melts at lower temperatures than the aluminium jacket. Serious defects occur in those cases when this alloy has eroded the under side of the aluminium jacket, thus reducing its thickness.
R. NEIDER: Did you use a feed-through coil, and did you measure the absolute impedance or make an impedance analysis?
D . C . WORLTON: No, a point coil was used. We made a phase ana-lysis, and also a relative, not absolute, impedance measurement. Variation in impedance was correlated with the defect being detected.
F .H . WELLS: In the case of the eddy-current testing of heat-exchanger tubes, for how long is the Lissajou figure derived from a defect available for view on the oscilloscope?
D.C . WORLTON: The probe passes the irregularity at about 20 ft/min. The data are also recorded on a strip chart recorder.
V. GERASIMOV: For what detectors did you obtain amplitude phase characteristics of the " f igure-8" type, and how did.you use them for defect inspection?
D . C . WORLTON: In the eddy-current inspection of installed tubes the complex impedance of a coil moving past an irregularity varies non-linearly. That is, the locus is a curve. By differentially connecting two coils one obtains a "figure-8 "-shaped curve, whose shape and orientation are used to give additional information.

246
W. FINNOIS: How do you get the eddy-current probe around the tube • bend in the heat-exchanger tube, and how did you correlate the defect lo -cation with the position along the tube?
D . C . WORLTON: We did not inspect around the bend of the tube.

NON-DESTRUCTIVE TESTING TECHNIQUES FOR RESEARCH AND PROCESS CONTROL*
D . A . D O U G L A S , J r . , R . W . M c C L U N G , В . E . F O S T E R A N D C . V . D O D D
M E T A L S A N D C E R A M I C S D I V I S I O N ,
O A K R I D G E N A T I O N A L L A B O R A T O R Y , O A K R I D G E , T E N N . ,
U N I T E D S T A T E S O F A M E R I C A
A b s t r a c t — R é s u m é — • А н н о т а ц и я — R e s u m e n
NON-DESTRUCTIVE TESTING TECHNIQUES FOR RESEARCH AND PROCESS CONTROL. Non-destructive test methods have been used primarily for the detection of defects and the rejection of faulty materials. The Oak Ridge National Laboratory has found it valuable to employ special non-destructive testing techniques as aids in materials research, component development, and process control. This paper gives three recent examples of the evolution of non-destructive testing techniques from research to process control.
A current fuel-element design contains fuel pins filled with vibratorily compacted uranium and thorium oxide powder. A gamma-attenuation technique was developed to allow the homogeneity of fuel loading to be measured and was used to aid the development of fabrication techniques and equipment. Later an inspection device was built to operate remotely in a hermetically sealed and shielded facility and used for production process control.
Another fuel element required fuel plates containing a uranium oxide-aluminium dispersion core with a programmed variation in the fuel loading across the width. A continuous scanning, X-ray attenuation tech-nique was developed and used to measure fuel inhomogeneities and conformity to design contour. The technique assisted the development for both core pressing and plate-rolling practices. A system was constructed for rapid automatic evaluation of production fuel plates.
These fuel plates were pressed into involute shape and assembled with alternate cooling channels. Stringent heat-transfer requirements imposed a tight tolerance on the channel dimensions. A unique eddy-current device using the "l i ft -off" characteristic was invented to insert in the very narrow channel and allow recording of dimensions both during fabrication development and actual manufacture.
Another approach to fuel elements is the use of minute fuel-bearing particles coated with pyrolytic carbon to retain the fission products. Of concern are the core diameter, coating thickness and integrity, and presence ot tuel in the coating. Development ot microradiographic techniques has provided a powerful tool to evaluate the many variables in the coating process for optimum fabrication. Further application allows the evaluation of the effects of service including heat treatment and in-reactor testing. Results of these studies assist the realistic evaluation of production lots and the recycle of information to correct discrepancies.
MÉTHODES D'ESSAIS NON DESTRUCTIFS APPLIQUEES DANS LA RECHERCHE ET DANS LE CONTROLE DE LA FABRICATION. On a recours aux essais non destructifs principalement pour la détection de défauts et le rejet des matières et produits défectueux. Le Laboratoire national d'Oak Ridge a constaté qu'ils sont égale-ment précieux dans la recherche de nouveaux matériaux, la mise au point de pièces et le contrôle de la fabri-cation. Le mémoire expose trois exemples récents de l'évolution des méthodes d'essais non destructifs, du stade de la recherche à celui du contrôle de la fabrication.
Un modèle courant d'éléments combustibles est constitué d'aiguilles de combustible en poudre d'oxyde d'uranium et d'oxyde de thorium compressée par vibration. On a mis au point une méthode fondée sur l'atté-nuation gamma pour mesurer l'homogénéité du combustible; elle a été appliquée au cours de la mise au point des procédés et du matériel de fabrication. On a construit ensuite un appareil de contrôle télécommandé, devant fonctionner dans un dispositif hermétiquement scellé et blindé; il est utilisé pour le contrôle de la fabrication.
Un autre type d'élément combustible est constitué de plaques de combustible avec une âme en oxyde d'uranium en dispersion dans de l'aluminium, la teneur en combustible variant de manière pré-établie dans la
* Research sponsored by the United States Atomic Energy Commission under contract with the Union Carbide Corporation.
247

248 D. A. DOUGLAS, Jr. et al.
largeur de l 'élément. ' On a mis au point une méthode d'exploration continue, fondée sur l'atténuation des rayons X, pour vérifier si la répartition du combustible est conforme aux prévisions.- Cette méthode de contrôle a facilité la mise au point1 des procédés de compression du combustible et de laminage des plaques. On a. construit un appareil pour l 'évaluation automatique rapide des plaques de combustible fabriquées.
On a donné par emboutissage à ces plaques de combustible une forme involutée et on les a assemblées en ménageant entre elles des canaux de refroidissement. Les exigences sévères du transfert de chaleur impo-saient une très faible tolérance pour les dimensions des canaux. On a inventé un appareil à courants de Foucault, fondé sur la caractéristique du «déc rochement» ,qu i peut être inséré dans ces canaux très étroits pour mesurer les dimensions, aussi bien au stade de la mise au point qu'au stade de la fabrication.
Un autre type d'élément combustible consiste en petites pastilles de combustible enrobées de carbone pyrolytique retenant bien les produits de fission. Le diamètre de la pastille de combustible, l'épaisseur et l'intégrité du revêtement et la présence de combustible sous le revêtement présentent une grande importance. La mise au point de méthodes de microradiographie a été un excellent moyen d'évaluer les nombreuses vari-ables des procédés de revêtement des pastilles, en vue d'une fabrication optimum. Une autre application consiste â évaluer les effets d'opérations telles que le traitement thermique et l'essai en pile. Les résultats de ces études renforcent l'évaluation réaliste des produits fabriqués et permettent de rectifier les erreurs éven-tuelles des contrôles antérieures.
ТЕХНИКА НЕДЕСТРУКТИВНЫХ ИСПЫТАНИЙ ДЛЯ ИССЛЕДОВАТЕЛЬСКИХ И ПРОИЗ-ВОДСТВЕННЫХ ЦЕЛЕЙ. Методы испытаний б е з разрушения оболочки использовались ,глав-ным образом,для определения дефектов и отсортировки бракованных материалов . Окридж-ская национальная лаборатория нашла в е с ь м а ценным применение н е д е с т р у к т и в н ы х м е т о -дов испытаний в к а ч е с т в е дополнительного с р е д с т в а при исследовании м а т е р и а л о в , р а з р а -б о т к е компонентов и процесса контроля. В докладе приводятсятри последних примера р а з -вития э т и х . м е т о д о в для исследовательских и производственных целей.
Существующая конструкция топливных э л е м е н т о в с о с т о и т из тепловыделяющих э л е -ментов в виде тонкого стержня, заполненного ураном и порошком окиси тория, которые уплот -няются вибраторами . Был разработан м е т о д ослабления г а м м а - л у ч е й для т о г о , чтобы и з -мерить однородность топливной загрузки, и он использовался для т о г о , чтобы оказать содей -с т в и е р а з р а б о т к е изготовления аппаратуры и о б о р у д о в а н и я . п о з д н е е б ы л о п о с т р о е н о о б -следующее у с т р о й с т в о , м о г у щ е е д е й с т в о в а т ь на расстоянии в г е р м е т и ч е с к и закупоренном и экранированном помещении и к о т о р о е можно и с п о л ь з о в а т ь для контроля п р о и з в о д с т в е н -н о г о п р о ц е с с а .
Другой топливный элемент потребовал топливные пластинки, содержащие в с е б е а к т и в -ную зону с диспергированным ураном и окисью алюминия с помощью запрограммированного разнообразия в з а г р у з к е топливом по ширине. Был разработан с п о с о б затухания р е н т г е -н о в с к о г о луча и непрерывного скеннирования для измерений неоднородности топлива и при наметке контура. Э т о т м е т о д пригодился как в разработке прессовки активной зоны, так и при прокатке пластин. С и с т е м а конструировалась для быстрой автоматической оценки ка -чества изготовления топливных пластин.
Эти пластины сложных форм собирались и прессовались в м е с т е с чередующимися к а -налами для охлаждения. С т р о г и е требования теплопередачи повлекли за с о б о й жесткий д о -пуск в р а з м е р а х канала. Уникальное у с т р о й с т в о с применением т о к о в Фуко , и с п о л ь з у ю -щее характеристику " л и ф т - о ф ф " , было приспособлено для помещения в с а м ы й узкий канал, чтобы контролировать размеры деталей в п р о ц е с с е изготовления и п о с л е .
Другим решением проблемы контроля топливных э л е м е н т о в я в л я е т с я использование частиц покрытых пиролитическим у г л е р о д о м . Интерес представляют размер активной зоны, толщина и ц е л о с т н о с т ь ' п о к р ы т и я и наличие топлива в покрытии. Р а з р а б о т к а микрорадио -графических с п о с о б о в дала сильное с р е д с т в о для оценки м н о г и х вариаций в п р о ц е с с е п о -крытия топливных э л е м е н т о в о б о л о ч к о й . Дальнейшее применение позволило с д е л а т ь о ц е н -ку эффективности с п о с о б а , включая тепловую обработку и проведение испытаний в реакторе . Результаты этих исследований повышают-реальную ценность м а с с о в о г о производства и дают новый толчок сведениям для соответствующих поправок.
TÉCNICAS DE ENSAYO NO DESTRUCTIVO PARA LA INVESTIGACION Y EL CONTROL DE PROCESOS DE FABRICATION. Los métodos de ensayo no destructivo se vienen empleando en primer lugar para la detección de tallos y para rechazar materiales defectuosos. El laboratorio nacional de Oak Ridge ha encontrado ütil emplear técnicas especiales de ensayo no destructivo como ayuda en las investigaciones sobre materiales,

RESEARCH AND PROCESS CONTROL 249
¿n el perfeccionamiento de componentes y en el control de los procesos industriales. La memoria expondrá tres ejemplos recientes de la evolución de las técnicas de ensayo no destructivo desde la fase de investigación hasta su empleo en el control de los procesos.
Uno de ios tipos de elementos combustibles de uso corriente consiste en agujas rellenas de óxidos de uranio y de torio en polvo, compactados por vibración. Se desarrolló una técnica de atenuación gamma que permite medir la homogeneidad de la carga combustible y que contribuyó al perfeccionamiento de los procedimientos y del equipo que se emplea en la elaboración. Más adelante, se construyó un dispositivo de inspección que se maneja a distancia en un recinto herméticamente cerrado y blindado, y que sirve para controlar el proceso de producción.
Otro elemento requiere placas de combustible con un alma de óxido de uranio disperso en aluminio, en las que la carga de combustible varfa transversalmente según valores prestablecidos. Se desarrolló una técnica de exploración continua por atenuación de rayos X que se emplea para medir la heterogeneidad del combustible y comprobar si su distribución es correcta. Esta técnica se utilizó para perfeccionar los procedimientos de preparación de las almas por prensado o por laminado de placas. Se construyó un sistema para evaluar rápida y automáticamente la elaboración de placas de combustible.
Estas placas se prensan en formas complejas y se montan alternando con canales de refrigeración. Las prescripciones para la transmisión de calor son muy estrictas y admiten muy poca tolerancia en las dimensiones de los canales. Se inventó un dispositivo especial de corrientes de Foucault que se inserta en el estrechísimo canal y registra las dimensiones durante todo el proceso de fabricación en escala experimental e industrial.
Otro tipo de elemento emplea pequeñas partículas de combustible revestidas de carbono pirolftico que retienen los productos de fisión. En este caso es fundamental medir el diámetro del alma, el espesor y la inte-gridad del revestimiento y la presencia de combustible en el mismo. Las técnicas microrradiográficas son sumamente útiles para medir las múltiples variables del proceso de revestimiento y contribuyen a la obtenición de un producto óptimo. Otras aplicaciones permiten evaluar los efectos del desgaste durante el empleo o en ensayos por tratamiento térmico y en el reactor. Los estudios confirman la utilidad objetiva de los métodos empleados en el control industrial y reafirman la importancia de emplear datos registrados en ocasiones ante-riores para corregir posibles discrepancias.
INTRODUCTION
Non-destructive test methods have been used primarily for the detection of defects and rejection of faulty materials. There is a growing trend to-ward the application of these methods to monitor the quality of manufactured products and use the information obtained in turn to modify or control the manufacturing process. The Oak Ridge National'Laboratory (ORNL) has found it valuable to develop and use special non-destructive testing tech-niques as aids in materials and research and component'development for nuclear-power reactors. Frequently the data obtained from these techniques could not be derived in any other way. After serving to obtain basic "informa-tion and assisting in the determination of optimum fabrication procedures, the techniques can frequently be adapted for process control and product evaluation during actual manufacture.
The non-destructive test development programme at ORNL encompasses many methods. Examples of recently completed work include gamma-ray attenuation techniques for examining homogeneity in fuel rods. X-ray atten-uation to measure the content and distrubtion of uranium in fuel plates, eddy-current devices for fuel-element coolant-channel spacing, and a low-voltage microradiography approach to the evaluation of minute fuel particles. In each cited case the programme started with materials research and com-ponent development and continued into the support of a manufacturing process.
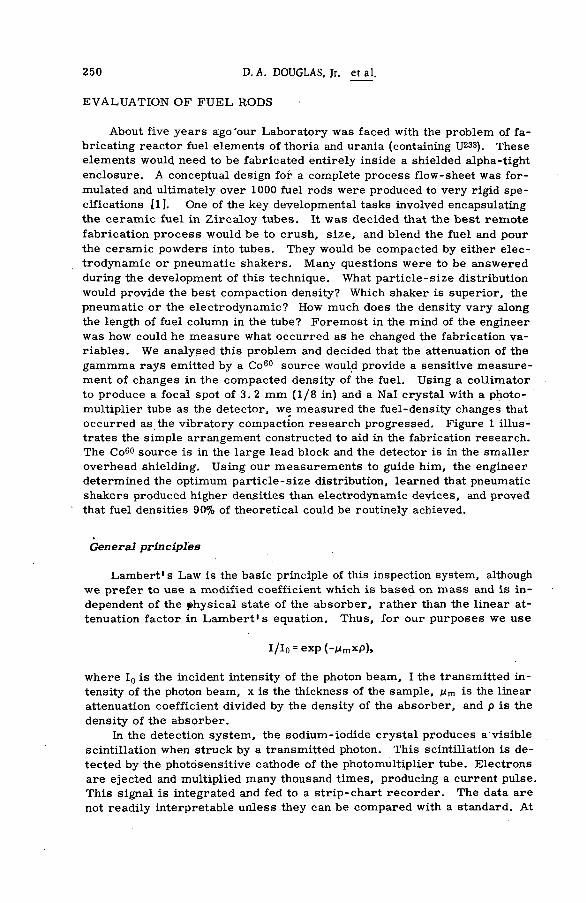
250 D. A. DOUGLAS, Jr. et al.
EVALUATION OF FUEL RODS
About five years ago'our Laboratory was faced with the problem of fa-bricating reactor fuel elements of thoria and urania (containing U233). These elements would need to be fabricated entirely inside a shielded alpha-tight enclosure. A conceptual design for a complete process flow-sheet was for-mulated and ultimately over 1000 fuel rods were produced to very rigid spe-cifications [1]. One of the key developmental tasks involved encapsulating the ceramic fuel in Zircaloy tubes. It was decided that the best remote fabrication process would be to crush, size, and blend the fuel and pour the ceramic powders into tubes. They would be compacted by either elec-trodynamic or pneumatic shakers. Many questions were to be answered during the development of this technique. What particle-size distribution would provide the best compaction density? Which shaker is superior, the pneumatic or the electrodynamic? How much does the density vary along the length of fuel column in the tube? Foremost in the mind of the engineer was how could he measure what occurred as he changed the fabrication va-riables. We analysed this problem and decided that the attenuation of the gammma rays emitted by a Co60 source would provide a sensitive measure-ment of changes in the compacted density of the fuel. Using a collimator to produce a focail spot of 3. 2 mm (1 /8 in) and a Nal crystal with a photo-multiplier tube as the detector, we measured the fuel-density changes that occurred as the vibratory compaction research progressed. Figure 1 illus-trates the simple arrangement constructed to aid in the fabrication research. The Co60 source is in the large lead block and the detector is in the smaller overhead shielding. Using our measurements to guide him, the engineer determined the optimum particle-size distribution, learned that pneumatic shakers produced higher densities than electrodynamic devices, and proved that fuel densities 90% of theoretical could be routinely achieved.
General principles
Lambert's Law is the basic principle of this inspection system, although we prefer to use a modified coefficient which is based on mass and is in-dependent of the physical state of the absorber, rather than the linear at-tenuation factor in Lambert 's equation. Thus, for our purposes we use
I/Io = exp ("MmxP)>
where I0 is the incident intensity of the photon beam, I the transmitted in-tensity of the photon beam, x is the thickness of the sample, ц m is the linear attenuation coefficient divided by the density of the absorber, and p is the density of the absorber.
In the detection system, the sodium-iodide crystal produces a visible scintillation when struck by a transmitted photon. This scintillation is de-tected by the photosensitive cathode of the photomultiplier tube. Electrons are ejected and multiplied many thousand times, producing a current pulse. This signal is integrated and fed to a strip-chart recorder. The data are not readily interpretable unless they can be compared with a standard. At

RESEARCH AND PROCESS CONTROL 251
I
F i g . l
Gamma-attenuation device used to assist fabrication development of fuel rods
first, an exact quantitative measurement of the density was not needed, so we calibrated the system with a gold foil whose thickness was calculated to provide an attenuation equivalent to a 2% change in density.
Procese control
Once the fabrication engineers had fixed their parameters, the second phase of the work commenced. One specification was that no single rod should deviate in average fuel density by more than 2% from the mean density of the total lot. The mean density was selected as 89%. A stricter require-ment was that no area along the length of the fuel column should deviate by more than 2% in density from the average for the rod. To meet these re -quirements a scanner was obviously needed, as part of the process line.
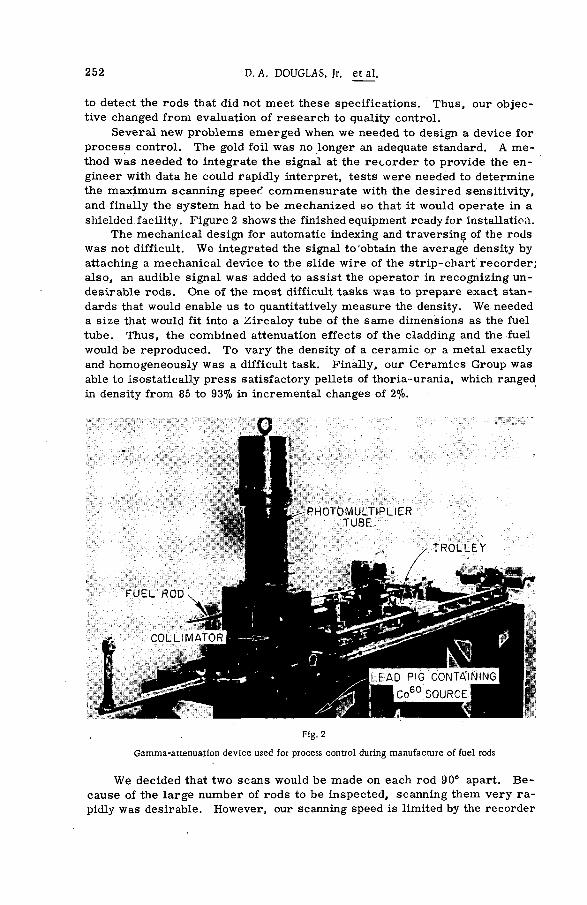
252 D. A. DOUGLAS, Jr. et al.
to detect the rods that did not meet these specifications. Thus, our objec-tive changed from evaluation of research to quality control.
Several new problems emerged when we needed to design a device for process control. The gold foil was no longer an adequate standard. A me-thod was needed to integrate the signal at the recorder to provide the en-gineer with data he could rapidly interpret, tests were needed to determine the maximum scanning speech commensurate with the desired sensitivity, and finally the system had to be mechanized so that it would operate in a shielded.facility. Figure 2 shows the finished equipment ready for installation.
The mechanical design for automatic indexing and traversing of the rods was not difficult. We integrated the signal to'obtain the average density by attaching a mechanical device to the slide wire of the strip-chart recorder; also, an audible signal was added to assist the operator in recognizing un-desirable rods. One of the most difficult tasks was to prepare exact stan-dards that would enable us to quantitatively measure the density. We needed a size that would fit into a Zircaloy tube of the same dimensions as the fuel tube. Thus, the combined attenuation effects of the cladding and the fuel would be reproduced. To vary the density of a ceramic ùr a metal exactly and homogeneously was a difficult task. Finally, our Ceramics Group was able to isostatically press satisfactory pellets of thoria-urania, which ranged in density from 85 to 93% in incremental changes of 2%.
Fig. 2
Gamma-attenuation device used for process control during manufacture of fuel rods
We decided that two scans would be made on each rod 90° apart. Be-cause of the large number of rods to be inspected, scanning them very ra-pidly was desirable. However, our scanning speed is limited by the recorder

RESEARCH AND PROCESS CONTROL 253
response time and by the beam intensity at\the detector. The latter is the most serious restriction, particularly in this case, because approximately 1. 3 cm (0. 5 in) of very dense material was the absorber. The statistical accuracy "of the system for any spot on the rod is related to the accumulated radiation as determined by the dwell time and the intensity of the transmitted beam. One technique we used to increase the effective scanning speed was to enlarge the collimator and make a rectangular slot 3. 2X9 . 5 mm ( 1 / 8 X 3 / 8 in). This smoothed out many of the irregularities produced by variations in fuel-particle size but did not appear to reduce the sensitivity. Nevertheless, we had to.limit the speed to 10 cm/min (4 in/min) to achieve an over-all accuracy of 1%.
The scanner operated very successfully for over a year as one unit of quality control in the process. The only operational difficulty occurred when the photomultiplier tube rapidly lost sensitivity over a period of only a few weeks. We thought that the level of gamma activity in the cell might have curtailed its life. However, when we substituted the same type of tube used in our laboratory machine no further difficulty was encountered.
The use of our simple laboratory device for density measurement helped the engineer solve his fabric ation problems. It also provided us with suf-ficient knowledge to optimize the design of a quality control machine with very little extra development. The production unit demonstrated its worth in routinely determining the quality of compacted fuel rods.
FUEL HOMOGENEITY IN DISPERSION-CORE FUEL PLATES
During fabrication development for the High Flux Isotope Reactor (HFIR) fuel element [2] we studied, developed, and applied several non-destructive testing methods to the evaluation of various fuel-element properties. The basic fuel-bearing unit is a 0.127X61-cm by approximately 10 -cm(0 .050X24X4 in) plate with a non-symmetrical fuel-bearing section as shown in Fig. 3. The fuel is in the form of minute particles of U3Og interspersed with aluminium. This core section is then completely encased and bonded within an aluminium frame and cladding. Each fuel plate is formed into an involute in the width direction and 540 of these plates are assembled into two annular assemblies. This fuel element, designed to develop a very intense neutron flux in the centre of the core, will generate approximately 100 MW of thermal power. Because of this large rate of heat production^ one of the requirements for a non-destructive testing technique was to give assurance that the generation of heat would be uniform, thus enhancing the reliability of the reactor core. During fabrication development, a number of variables could affect the achieved fuel homogeneity. These included the particle-size distribution, the particle blending, the die top design, techniques for filling the die and pressing a core, and the detailed practices for rolling the finished plate. Again we chose a radiation attenuation method [31, as the optimum approach to evaluate the effect of each of these variables and assist the selection of the proper fabrication procedure. The homogeneity evaluation required on the HFIR fuel plates included inspections to ensure that no 2 - m m - (5/64-in) diam. spot exceeded the nominal fuel loading by more than 30% as well as to ensure that the average fuel loading within any 2 - m m - (5/64-in) wide by

254 D. A. DOUGLAS, Jr. et al.
Fig.3
Cross-section of the High Flux Isotope Reactor fuel plate
1. 3 - c m - (1/2-in) long section along the core length did not deviate from the nominal by more than ±10%. This stringent homogeneity requirement for such a small area, 3. 1 щт 2 (0 , 0048 in2) far exceeded that of any other known specification. The necessity for 100% inspection of numerous plates each day demanded a rapid inspection method.
Theory
As noted earlier. X-rays transmitted through a material are attenuated in accordance with the relation:
I = I0 exp(-jumpx).
The mass attenuation coefficient, ц т , increases with increasing atomic number and, in general, decreases with increasing X-ray energy. Under constant operating conditions, therefore, as the amount of high atomic number material (uranium) in the dispersion core changes, the intensity of the transmitted radiation will change. Appropriate calibration techniques allow correlation of intensity change to fuel concentration change.
Equipment
We used industrial X-ray equipment for the irradiation source. Careful control of all operating conditions resulted in a very stable and reproducible operation. The detection system for monitoring the X-ray intensity changes consisted of a Nal(Tl) crystal optically coupled to a photomultiplier tube. Figure 4 shows the system.
The collimator array restricts the primary beam to an appropriate spot size on the specimen and prevents scattered radiation from reaching the detector. Thus, as either the fuel concentration or the thickness of the specimen changes, a corresponding fluctuation in the amount of transmitted radiation is detected, amplified, and recorded.

RESEARCH AND PROCESS CONTROL 255
X - R A Y T U B E
F U E L P L A T E ^ C R Y S T A L
PHOTOMULTI PLIER
D A T A R E A D - O U T D A T A R E A D - O U T I N S T R U M E N T A T I O N I N S T R U M E N T A T I O N
^^COLLIMATORS
•Fig. 4
Block diagram of the gamma-scintillàtion detection system
Fig. 5
Mechanical scanning system for inhomogeneity measurement in fuel plates
Mechanical X - Y scanning of the plate was necessary t o evaluate the entire surface area. Figure 5 shows the system that we designed and as-sembled to mount the radiation source and detector and to allow the hori-zontal plate to be driven longitudinally through the radiation beam. Trans-

256 D. A. DOUGLAS, Jr. et al.
verse indexing was automatically programmed at the end of each longitudinal scan.
Of course, the useful longitudinal scanning speeds are limited by the instrumentation-response time and the beam intensity that can be accurately sensed by the detector. The latter is a major consideration in the deter-mination of the statistical accuracy. Fuel plates have been scanned for go-no-go inspections at a linear speed as high as 6. 1 m/min (240 in/min), but for strip-chart recording with full response for all 2 - m m - (5 /64 - in) diam. variations, the scanning speed has been approximately 1. 6 m / m i n (64 in/min). We selected wide-chart instruments despite their slower res-ponse because of the need for extreme sensitivity over the wide range of fuel concentration.
Calibration and standards
As is true with most non-destructive tests, the measurement of inhomo-geneity required special standards to establish and calibrate the technique. We had to establish a quantitative relationship between changes in fuel con-centration and X-ray attenuation. Pressed compacts of U3O8-AI were rolled into thin foils of different thickness having various amounts of U^Os per unit area. We then combined these foils with an appropriate thickness of alu-minium to simulate total thickness of a fuel plate at discrete points across the fuel-concentration gradient in the core. Although these standards were not completely homogeneous, extensive scanning and integration of attenua-tion values coupled with chemical analyses produced a relatively smooth curve relating fuel content to instrument response. The fuel-concentration gradient of the HFIR plate, the concomitant requirement for re-calibration at each integral position across the width of the plate, and the need for single-point standardization for go-no-go inspections demanded the use of materials for standards that were very homogeneous and readily machinable. We investigated several materials including tool steel, Al-13% U alloy and 6061-T6 aluminium. The aluminium was selected because of its good homo-geneity, its ease of machining and the relaxed machining tolerances that resulted from increased thicknesses for equivalent atténuation. Each Standard, since it was related to the changing values of attenuation across the width of the fuel plate, had a contour that resembled the non-symmetrical core shown in Fig. 3. These standards which were fabricated to be equi-valent in attenuation to the respective fuel concentrations of nominal and + 30% and ± 10% from nominal, were placed by each end of the fuel plate. Thus, immediately before each successive scan was made, the attenuation value for the go-no-go conditions was recorded on the strip chart and/or used to set an alarm circuitry. Then direct comparisons could be made between the reference levels and the actual values on the plate.
Results
We used the scanning system throughout the latter stages of the develop-ment of the fuel plates, where it proved quite useful in evaluating the effect of changes in the fabrication procedure. The system was instrumental in

RESEARCH AND PROCESS CONTROL 257
altering the fabrication technique to reduce the excessive accumulation of fuel at the ends of the finished fuel plate. The effect of changing the particle size was graphically illustrated. The system was used to obtain the values necessary to correct the die tops in which the fuel cores are pressed. The scanner is also used for rapid location of any fuel that is outside the maxi-mum core outline.
Frequent checks with primary attenuation standards and occasional comparison of predicted fuel content with chemical analyses indicate a sys-tem accuracy of approximately ± 1%. The design criteria that we developed on the versatile laboratpry model enabled the building of one pilot and two production scanners for an evaluation of the HFIR production cores. These latter three scanners incorporated X - Y plotters to allow a recording of out-of-tolerance conditions on a plan view.
COOLANT-CHANNEL SPACING
Another problem facing the fabrication engineer on the HFIR fuel ele-ment was the assembly of the large number of plates while maintaining care-ful control on the coolant-channel space between plates. If this spacing de-viates excessively from the intended value, it would affect the coolant flow and could cause excessive fuel-plate temperature and possible failure. We selected an eddy-current approach [4, 5] as being best for this measurement.
Principles
When an electrical coil is excited by a high-frequency alternating cur-rent, it produces an electromagnetic field. This field will induce the flow of eddy currents in nearby electrical conductors. The eddy-current flow, which is influenced by the electrical properties of the specimen and the coil-to-specimen distance, will be a factor in determining the electrical impe-dance of the eddy-current coil. Thus, as the coil-to-specimen spacing changes, the coil impedance changes correspondingly. Figure 6 shows a cross-sectional view of the probe designed to use this principle for the mea-
. sûrement of coolant-channel spacing. The coil is mounted on a long thin metal strip which serves as the insertion handle. Attached to the end of the tape is a metal leaf spring, which is curved so that it overhangs the coil. When inserted in a channel as thin as 0. 875 mm (0. 035 in), the tape presses against one surface and the spring pushes against the opposing surface. The electrical excitation of the coil generates the eddy currents in the spring. Thus, as the channel spacing varies, the movement of the leaf spring towards or away from the coil will generate a change in the coil impedance that can be calibrated in terms of the channel thickness.
Application
We used elementary hand-held probes throughout fabrication develop-ment for measuring experimental fuel elements to reveal poor dimensional control and to assist corrective measures. Figure 7 shows a probe being
17

258 D. A. DOUGLAS, Jr. et al.
Fig. 6
Probe for measuring coolant-channel spacing between fuel plates
Fig. 7
Measuring probe inserted in coolant channel of prototype High Flux Isotope Reactor fuel core
inserted into a channel of a prototype HFIR fuel core. For dimensional con-trol on production cores a motor-driven inspection station was built con-taining five probes for simultaneous multipoint measurement and continuous recording in a channel cross-section. The accuracy of measurement is a function of the total range of measurements but has been demonstrated to be better than 0. 025 mm (0. 001 in) in this particular application.
17* '

RESEARCH AND PROCESS CONTROL 259
MICRORADIOGRAPHY O F MINUTE F U E L P A R T I C L E S
Another approach to fue l e l e m e n t s is the u s e of minute f u e l - b e a r i n g par t i c l e s that have been coated with pyro ly t i c c a r b o n to retain the f i s s i o n produc ts . T h e s e m a t e r i a l s s e e m v e r y p r o m i s i n g to the nuc l ear industry b e c a u s e of their h i g h - t e m p e r a t u r e capabi l i t ies and good neutron e c o n o m y . T y p i c a l d imens ions f o r such a s p e c i m e n are a 0. 1 5 - m m (0. 006- in ) c o r e and a 0. 0 5 - m m (0. 002- in ) coat ing t h i c k n e s s . The coat ing i s intended to prevent the f i s s i o n p r o d u c t s p r o d u c e d during r e a c t o r operat ion f r o m e s -caping into the coo lant . T o es tab l i sh the o v e r a l l quality of these minute part ic les , new non-destruct ive testing techniques were necessary f or evalu-ating the coating thickness , fue l -par t i c l e shape, p r e s e n c e of .fuel in the coating, and integrity of both coating and c o r e . A microrad iograph i c t e ch -nique [6, 7] has been shown to be a powerful tool f o r this. We have used the method to inspect fabr i cated par t i c l e s f o r acceptabi l i ty and to evaluate the resu l ts of changes in manufacturing procedure and of thermal and radiation proo f - tes t ing .
General principles
The application of radiography to the evaluation of v e r y s m a l l coated par t i c l e s r equ i red extensive modi f i cat ion of conventional techniques . The rad iographic method r e c o r d s on f i l m the variat ion in radiation absorpt ion (which is energy dependent) a c r o s s a spec imen. To be useful the absorption m u s t v a r y enough f o r an in terpre tab le c ont ras t of dens i ty to be ach ieved on the f i lm or other detector . The very small dimensions of the coated part-i c l e s and thé low absorption of radiation by the pyro lyt ic carbon coating r e -quired the use of l o w - e n e r g y ( low-vol tage) radiation.
Equipment and materiede
In the p r o g r a m m e we u s e d c o m m e r c i a l rad iograph i c instrumentat ion m o d i f i e d to p r o v i d e be t ter c o n t r o l o v e r X - r a y e n e r g y and e x p o s u r e t i m e . The use of v e r y l o w - e n e r g y X - r a y s made the p r e s e n c e of a b s o r b e r s other than the spec imen m o s t undes irable . T h e r e f o r e , we needed to r e m o v e all extraneous mater ia l that could cause absorption, scattering, o r uneven f i l -tration of the soft X - r a y beam between the target and the detector f i lm. The r a d i a t i o n - a b s o r b i n g m a t e r i a l was r e m o v e d by u s e of an X - r a y tube head containing a b e r y l l i u m window only 0. 2 m m thick and a h e l i u m - f i l l e d c h a m b e r between the X - r a y head and the s p e c i m e n , s i n c e even a i r e f f e c -t ive ly attenuates the X - r a y s at the energy l eve l requ i red . The hel ium was retained in the chamber by 0. 0125-mm (0. 0005-in) polyethylene diaphragms, which had no measurable e f fec t on the X - r a y transmiss ion . Figure 8 shows the 1 0 7 - c m - (42 - ih ) high c h a m b e r that we used in the p r o g r a m m e . With the 1. 5 - m m (0. 06- in) f o c a l spot, the e f f e c t ive penumbral shadow contr ibu-t ion to unsharpness i s a p p r o x i m a t e l y 0. 3 цта. L a t e r we m a d e a 4 7 - c m -(18. 5 - i n ) high c h a m b e r that r e d u c e d the e x p o s u r e t i m e to o n e - f o u r t h but increased the penumbral shadow only to 0. 6 ц ш . A l s o we reduced unneces -s a r y absorpt ion by the u s e of b a r e photographic plates (without c a s s e t t e s

260 D. A. DOUGLAS, Jr. et al.
Fig . 8
E q u i p m e n t a r r a n g e d f o r m i c r o r a d i o g r a p h y o f c o a t e d p a r t i c l e s . ' N o t e h e l i u m c h a m b e r
o r f i l m h o l d e r s ) . This change necess i tated the use of d a r k r o o m exposure techniques .
We evaluated s e v e r a l d i f ferent detec tors and showed that the optimum was high-resolution plates coated with an emulsion having a reported reso lu -tion capability of 1500 l i n e s / m m (38 000 l ines / in ) . We viewed radiographs on these plates at magni f icat ions up to 500X with little di f f iculty caused by emuls ion g r a i n - s i z e .
Of the s e v e r a l h igh - contras t f ine -g ra ined developing solutions tested f o r the h igh-reso lut ion plates , we found the standard X - r a y f i l m deve loper to be as good as o r better than any other solution tested and to have the added advantage of being near the X - r a y exposure r o o m . Considerable care was e x e r c i s e d in handling and drying the h igh - reso lu t i on plates to prevent un-des i rab le art i facts caused by contamination.
Procedure
The p a r t i c l e s w e r e p laced d i r e c t l y on the r a d i o g r a p h i c plate beneath the helium chamber. The helium atmosphere was maintained in the chamber

RESEARCH AND PROCESS CONTROL 261
with a v e r y slight posit ive internal pressure retained by the thin diaphragm. Since the spec imens and f i lm were in the r o o m outside the helium chamber , they w e r e eas i ly changed b e f o r e and after exposure without disturbing the hel ium in the chamber . With the available X - r a y exposure f ie ld , samples f r o m a number of batches could be radiographed simultaneously. The energy l e v e l s used f o r par t i c l e evaluation v a r i e d up to about 10 k V P . A typ i ca l exposure included the following values: 10-kVP, 30-mA, 50 - cm (20-in) f i lm-t o - f o c u s d is tance , and 1 5 - m i n e x p o s u r e t i m e . F o r the s m a l l s p e c i m e n s and penumbra l shadow, we f e e l that the detai l o r r eso lu t i on in the p lates is l imited by e lectron diffusion in the emulsion, which is rated at about 1 jum at the energy level being used.
Transmitted light m i c r o s c o p y is used f o r viewing the radiographs and f o r prepar ing photomicrographs .
Resulte
The technique has b e c o m e a vital link in the development of fuel particle technology. It is now regularly used in the evaluation of as - fabr icated part-i c l e s f o r coating thickness and c o r e d iameter with an a c c u r a c y better than 1 (im. Qualitative in format ion is obtained about the shape and integrity of the c o r e and coatings and whether fuel has migrated into the coating during fabr icat ion . F igure 9 i s a m i c r o r a d i o g r a p h of p a r t i c l e s s e l e c t e d to show many of these c h a r a c t e r i s t i c s . When partic le 's a re evaluated during and immed ia te ly a f ter manufac ture , the d e s i r e d in f o rmat i on i s u s e d t o m a k e appropriate c o r r e c t i o n to c oa t ing -gas mixture , the coating t i m e , o r t e m -p e r a t u r e . T h i s has b e e n p a r t i c u l a r l y va luab le when p a r t i c l e s have b e e n made with l a y e r s of coating of di f ferent densit ies . Other applications have inc luded the evaluation of all p a r t i c l e s intended f o r i n - p i l e test ing. T h e y are examined to assure the r e m o v a l of all i m p e r f e c t part i c les to give added assurance of a s u c c e s s f u l test . ' The technique has a lso ass i s ted in d e t e r -mining the e f fects of s e rv i ce testing such as heat treatment or in-pile testing. F igure 10 shows fuel migrat ion detected after heat treatment in a batch of par t i c l e s .
Several fuel partic les that had undergone as much as 6 at. % burn-up were m i c r o r a d i o g r a p h e d . Thé radiat ion l e v e l s at contact w e r e as high as 3000 r / h of beta and 120 r / h of g a m m a . Slight modi f i ca t i on of the stan-dard technique a l lowed valuable evaluation with only s l ight l o s s of detai l on these highly r a d i o a c t i v e p a r t i c l e s .
CONCLUSIONS
The p r o j e c t s that have been d i s c u s s e d show s o m e of the bene f i t s that have been obtained at O R N L through the u s e of s p e c i a l l y d e v e l o p e d n o n -destruct ive techniques. The valuable information der ived during the ear ly stages of mater ia l r e s e a r c h and the ass i s tance p rov ided in r e v e a l i n g the e f f ec ts of p r o c e s s variat ion in prototype component development make this techno logy indispensable in r e s e a r c h and deve lopment . In addition t h e r e i s usually much destruct ive analysis during p r o c e s s developiment that can

262 D. A. DOUGLAS, Jr. et al.
F i g . 9
M i c r o r a d i o g r a p h o f c o a t e d p a r t i c l e s s e l e c t e d t o show d i f f e r e n t q u a l i t i e s o f i n t e r e s t
F i g . 1 0
Microgradiograph of fuel particles showing fuel migration after heat treatment
RESEARCH AND PROCESS CONTROL 263
b e c o r r e l a t e d with n o n - d e s t r u c t i v e tes t r e s u l t s . T h e r e f o r e , when t h e s e t e s t s are adapted f o r product ion c o n t r o l , the c o r r e l a t i o n wi l l a l low m o r e intel l igent interpretat ion of data. A s n e w e r test m e t h o d s a r e d e v e l o p e d , these bene f i t s wi l l b e c o m e even m o r e apparent in the future .
R E F E R E N C E S
[ 1 ] HAWS, C. C . , MATHERNE, J. L . , MILES, F. W. and VANCLEVE, J. E . , Summary o f the Kilorod P r o j e c t -
A S e m i r e m o t e 1 0 - k g / d a y D e m o n s t r a t i o n o f » s U 0 2 - T h 0 2 Fuel E l e m e n t Fabr i cat ion b y the ORNL S o l - G e l
V i b r a t o r y - C o m p a c t i o n M e t h o d , ORNL 3681 ( 1 9 6 4 ) .
[ 2 ] M A R T I N , M . M . , ERWIN, J. H. and LEITTEN, C . F . , J r . , F a b r i c a t i o n D e v e l o p m e n t o f the I n v o l u t e -
Shaped High Flux I so tope R e a c t o r Fuel Plates, Research Reactor Fue l E l e m e n t C o n f e r e n c e , S e p t e m b e r
1 7 - 1 9 , 1962, Gat l inburg , T e n n . , Т Ю - 7 6 4 2 ( 1 9 6 2 ) 2 6 8 - 2 8 9 .
[ 3 ] FOSTER, B. E . , SNYDER, S. D. and McCLUNG, R. W . , Continuous Scanning X - R a y Attenuation Technique
for Determining Fuel Inhomogene i t i e s in Dispersion Core Fuel Plates, ORNL-3737 (1965) ,
[ 4 ] D O D D , C . V . and M c C L U N G , R. W . , Fue l E l e m e n t C o o l a n t C h a n n e l and Other S p a c i n g M e a s u r e m e n t s
by E d d y - C u r r e n t T e c h n i q u e s , O R N L - T M - 1 2 9 ( M a r c h 1 9 6 2 ) .
[ 5 ] D O D D , C . V . , Des ign and Cons t ruc t i on o f E d d y - C u r r e n t C o o l a n t C h a n n e l S p a c i n g Probes, ORNL 3 5 8 0
( 1 9 6 4 ) .
[ 6 ] G a s - C o o l e d R e a c t o r P r o g r a m Q u a r t e r l y Progress Report M a r c h 3 1 , 1 9 6 2 , O R N L - 3 3 0 2 ( 1 9 6 2 ) 1 6 5 - 1 6 7 .
[ 7 ] M c C L U N G , R. W . , BOMAR, E. S. and G R A Y , R. J . , Use o f M i c r o r a d i o g r a p h y C o m b i n e d with M e t a l l o -
graphy for Evaluat ion o f C o a t e d Part ic les , O R N L - 3 5 7 7 ( 1 9 6 4 ) .
D I S C U S S I O N
P . KNUDSEN: Why was the e d d y - c u r r e n t method p r e f e r r e d to other techniques ( for example, u l trasonics , air gauge, strain gauge) f o r m e a s u r -ing coolant-channel spacing?
R. W. McCLUNG: F o r f our r e a s o n s . We did not think that we could readily mount an ultrasonic probe in the very narrow (0.035 in) curved channels; the wide range of p o s s i b l e d imensions during development (0 .035-0 .075 in) prec luded air gauging; u s e r s of strain gauges f o r s imi lar purposes found the ease of breakage of the p r o b e s inconvenient; and our e x p e r i e n c e with eddy currents made us confident that this was a reasonable approach. Later exper i ence with this type of p r o b e on a number of p r o j e c t s has c o n f i r m e d our dec i s i on .
P . de M E E S T E R : At what voltage did you work when m e a s u r i n g the fuel homogenei ty by X - r a y absorpt ion?
R . W. M c C L U N G : The vo l tage w a s 50-kV constant potent ia l . P . de MEESTER: Did you not have trouble with fuel-content evaluation,
caused by variations in enrichment f r o m one bath to another? R. W. McCLUNG: The last ca l ibrat ion curve f o r the manufacture of
r e f e rence standards was prepared by making a chemical analysis of inspected sect ions of fuel plates containing the same enrichment as the manufactured p lates . We did not f ee l that the sl ight change in attenuation due to m i n o r changes in i s o t op i c enr i chment would be s igni f i cant when c o m p a r e d with the potential inac curac i e s in the production test equipment. The accuracy of our laboratory sys tem was found to be approximately 1%. It is felt that the a c c u r a c y of the production scanner may be about 2%.

264 D. A. DOUGLAS, Jr. et al.
P. de MEESTER: What was the activity of your Собо source? R. W. McCLUNG: A one-curie source of Co^0 was used in the labora-
tory device, and a two-curie source of Co60 for the production "scanner". J. GÉRARD: Is there any difficulty involved in using the coil designed
for measuring the space between fuel-element plates to measure the space between tubular fuel pencils in a cluster?
R. W. McCLUNG: The same type of probe has been used at Oak Ridge National Laboratory for measuring tube-to-tube spaces both in concentric annular (coaxial) arrangements and in parallel arrays. The shape of the probe head may need to be changed according to the specific problem.
R. NEIDER: Did you not have difficulties with instability of output of the X - r a y tube used to measure the fuel plates? If so, how did you cir -cumvent these difficulties?
R. W. McCLUNG: We used an external voltage regulator on a com-merical X-ray machine and operated the machine at the milliamperage found to offer the most stable operation. We were pleasantly surprised at the stability. For the production scanners, special high-stability X-ray equip-ment was designed and built.
R. S. SHARPE: We were also discouraged from using an X-ray tube as the source of transmitted radiation, owing to voltage variation and focal spot shift. How often do you find you need to recalibrate against your standards? (
R. W. McCLVVG: For the evaluation of the HFIR fuel plates, with the standards at each end of the fuel plates, re-standardization is performed before each linear scan of the fuel plate. At production speeds this is every 10-15 s. Of course, this was necessary because of the variable fuel gradient across the plate width. In practice we have found that our equipment can operate for several hours without need for recalibration.
In the beginning of our work we were not sure that our stability would be adequate. However, we knew that we could use a secondary radiation detector to monitor the initial radiation and correct our instrument response. As is evident, this was not needed.
V. GERASIMOV: What was the accuracy you obtained with the coil probe, and by what was it limited?
R. W. McCLUNG: We used a commercial eddy-current instrument containing a bridge circuit. The accuracy of our measurements on the HFIR fuel assembly was approximately 0. 0005 inches. As this was adequate, no attempt was made to improve upon it.
In the simplest case (where a meter on the face of the instrument is read), the accuracy is a percentage of the total range of measurements. For instance, the accuracy will be better if all measurement values cover only a very small range.
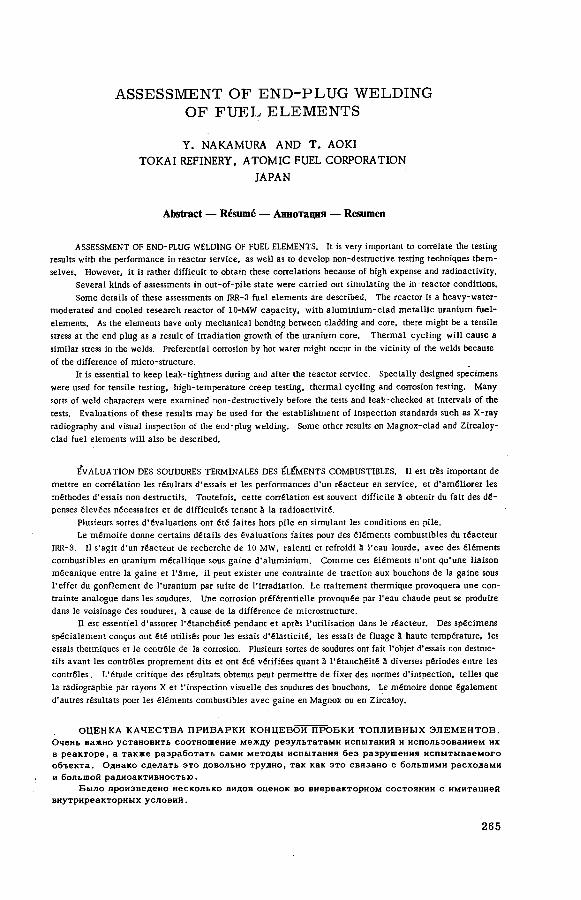
ASSESSMENT OF END-PLUG WELDING OF FUEL ELEMENTS
Y . N A K A M U R A A N D T . A O K I
T O K A I R E F I N E R Y , A T O M I C F U E L C O R P O R A T I O N
J A P A N
A b s t r a c t — R é s u m é — А н н о т а ц и я — R e s u m e n
ASSESSMENT OF END-PLUG WELDING OF FUEL ELEMENTS. It is very important to correlate the testing results with the performance in reactor service, as well as to develop non-destructive testing techniques them-selves. However, it is rather difficult to obtain these correlations because of high expense and radioactivity.
Several kinds of assessments in out-of-pile state were carried out simulating the in-reactor conditions. Some details of these assessments on JRR-3 fuel elements are described. The reactor is a heavy-water-
moderated and cooled research reactor of 10-MW capacity, with aluminium-clad metallic uranium fuel-elements. As the elements have only mechanical bonding between cladding and core, there might be a tensile stress at the end plug as a result of irradiation growth of the uranium core. Thermal cycling will cause a similar stress in the welds. Preferential corrosion by hot water might occur in the vicinity of the welds because of the difference of micro-structure.
It is essential to keep leak-tightness during and after the reactor service. Specially designed specimens were used for tensile testing, high-temperature creep testing, thermal cycling and corrosion testing. Many sorts of weld characters were examined non-destructively before the tests and leak-checked at intervals of the tests. Evaluations of these results may be used for the establishment of inspection standards such as X-ray radiography and visual inspection of the end-plug welding. Some other results on Magnox-clad and Zircaloy-clad fuel elements will also be described.
EVALUATION DES SOUDURES TERMINALES DES ELEMENTS COMBUSTIBLES. Il est très important de mettre en corrélation les résultats d'essais et les performances d'un réacteur en service, et d'améliorer les méthodes d'essais non destructifs. Toutefois, cette corrélation est souvent difficile S obtenir du fait des dé-penses élevées nécessaires et de difficultés tenant S la radioactivité.
Plusieurs sortes d'évaluations ont été faites hors pile en simulant les conditions en pile. Le mémoire donne certains détails des évaluations faites pour des éléments combustibles du réacteur
JRR-3. Il s'agit d'un réacteur de recherche de 10 MW, ralenti et refroidi 3 l'eau lourde, avec des éléments combustibles en uranium métallique sous gaine d'aluminium. Comme ces éléments n'ont qu'une liaison mécanique entre la gaine et l'âme, il peut exister une contrainte de traction aux bouchons de la gaine sous l'effet du gonflement de l'uranium par suite de l'irradiation. Le traitement thermique provoquera une con-trainte analogue dans les soudures. Une corrosion préférentielle provoquée par l'eau chaude peut se produire dans le voisinage des soudures, â cause de la différence de microstructure.
Il est essentiel d'assurer l'étanchéité pendant et après l'utilisation dans le réacteur. Des spécimens spécialement conçus ont été utilisés pour les essais d'élasticité, les essais de fluage â haute température, les essais thermiques et le contrôle de la corrosion. Plusieurs sortes de soudures ont fait l'objet d'essais non destruc-tifs avant les contrôles proprement dits et ont été vérifiées quant à l'étanchéité à diverses périodes entre les contrôles. L'étude critique des résultats obtenus peut permettre de fixer des normes d'inspection, telles que la radiographie par rayons X et l'inspection visuelle des soudures des bouchons. Le mémoire donne également d'autres résultats pour les éléments combustibles avec gaine en Magnox ou en Zircaloy.
ОЦЕНКА К А Ч Е С Т В А ПРИВАРКИ КОНЦЕВОЙ ПРОБКИ ТОПЛИВНЫХ ЭЛЕМЕНТОВ. Очень важно установить соотношение между результатами испытаний и использованием их в реакторе , а также разработать сами м е т о д ы испытания б е з разрушения и с п ы т ы в а е м о г о объекта . Однако сделать э т о довольно трудно, так как э т о связано с большими расходами и большой радиоактивностью.
Было произведено несколько видов оценок во внереакторном состоянии с имитацией внутриреакторных условий.
265

266 Y. NAKAMURA and T . AOKI
Описываются некоторые детали этих оценок в отношении топливных элементов исследо -в а т е л ь с к о г о реактора J K K - 3 . В э т о м р е а к т о р е установленной м о щ н о с т ь ю 10 м г в т с т я ж е -лой водой в к а ч е с т в е замедлителя и теплоносителя и с п о л ь з у ю т с я топливные э л е м е н т ы из металлического урана с алюминиевым покрытием. Поскольку в элементах между покрытием и сердцевиной с у щ е с т в у е т только механическая с в я з ь , концевая пробка м о ж е т испытывать растягивающее напряжение в р е з у л ь т а т е увеличения облучения урановой сердцевины. Т е м -пературные колебания в ы з о в у т аналогичное напряжение в сварных швах. Вследствие неодно-родности микроструктуры вблизи сварных швов там может произойти усиленная коррозия под воздействием горячей воды.
Во время работы реактора и после е го остановки необходимо обеспечить герметичность . Для проведения испытаний на прочность на р а з р ы в , испытаний на п о л з у ч е с т ь при в ы с о к о й т е м п е р а т у р е , испытаний т е м п е р а т у р н ы х колебаний и коррозии были разработаны специаль -ные о б р а з ц ы . Многие характеристики сварных швов были изучены б е з разрушения и с п ы т ы -ваемого образца до проведения испытаний и проверены на герметичность в промежутках м е ж -ду испытаниями. Эти р е з у л ь т а т ы м о г у т б ы т ь использованы для установления с т а н д а р т о в проверки, таких как р е н т г е н о в с к а я радиография и визуальная проверка к а ч е с т в а приварки концевой пробки. Будут также описаны некоторые другие результаты, полученные по топлив-ным элементам , покрытым магноксом или циркаллоем.
INSPECCION DE LA SOLDADURA DEL TAPON TERMINAL DE LOS ELEMENTOS COMBUSTIBLES. Es muy importante establecer una correlación entre los resultados de los ensayos y el rendimiento en los reactores en servicio, asf como perfeccionar los correspondientes métodos de ensayo no destructivo. Ahora bien, resulta algo diffcil lograr la correlación indicada a causa de los elevados gastos qué ello supone y de la intensa radiactividad.
Se han efectuado varios estudios fuera del reactor simulando las condiciones que reinan en el interior de éste.
En el presente documento se exponen algunos datos sobre los ensayos con elementos combustibles del reactor japonés de investigación N1 3 (JRR-3). Ese reactor de 10 MW es moderado y refrigerado por agua pesada, y tiene elementos combustibles de uranio metálico revestidos de aluminio. Como entre el revestimiento y el alma hay solamente una unión mecánica, puede producirse una tensión en el tapón terminal como resultado del crecimiento del alma de uranio debido a la irradiación. El c iclo térmico produce tensiones análogas en las soldaduras. Como resultado de la diferencia de microestructura, las proximidades de éstas que dan especial-mente expuestas a la corrosión producida por el agua caliente.
Mientras el reactor está en servicio, es imprescindible asegurar su estanqueidad. Se han utilizado pro-betas especiales para estudiar la resistencia a la tracción, la fluencia a alta temperatura, los efectos del ciclo térmico y la corrosión. Antes de hacer esos ensayos, y periódicamente durante su realización, se sometieron a examen no destructivo muchas clases de soldaduras y se verificó si había escapes. La evaluación de los resul-tados obtenidos puede servir para establecer normas de inspección, por ejemplo, mediante radiografía y examen visual de la soldadura del tapón. En la memoria se describen algunos otros resultados de ensayos efectuados con elementos combustibles revestidos de Magnox y Zircaloy.
1. INTRODUCTION
It is very important to correlate testing results of welding techniques on reactor fuel elements with the performance in reactor service, as well as to develop non-destructive testing techniques themselves. However, it is difficult to obtain these correlations because of high expense and diffi-culties of handling radioactive materials.
Several kinds of assessments of end-plug welding techniques for reactor fuel elements were made in out-of-pile tests, simulating reactor conditions.
Helium leak testing is used for the final check in the fabrication of fuel elements and its specifications can be decided according to the permissible

END-PLUG WELDING OF FUEL ELEMENTS, 267
radioactivity released from the defects into the reactor coolant. However, inspection standards for visual inspection and radiography on the welds is difficult. No leakage should occur during and after the designed service in the reactor even if the fuel element is leak tight in the as-fabricated state. However, in economic and routine production there are no fuel elements with-out any indications of defects in visual inspection and radiography. There-fore it is necessary to assess the qualities of the welding by such indications.
There will be a tensile stress at the end-plug welding as a result of ir -radiation growth of the uranium core and the different elongations of core and cladding, and thermal cycling will give some accumulative action on the welds. Corrosion will be accelerated in the vicinities of the welds because of uneven micro-structures. The welds should maintain leak tightness under these stresses and reactions.
2. ALUMINIUM END-PLUG WELDING
Specially designed specimens were used for the assessment. Many samples of various weld qualities were examined non-destructively in the as-fabricated state and separated into several classes.
The fuel element of the Japan Research Reactor (JRR-3), which is a heavy-water-moderated and cooled research reactor of 10 MW capacity, is metallic uranium mechanically clad with aluminium by drawing, and may be susceptible to the tensile stress at the welds. The fuel element is shown in Fig. 1 and test specimen is shown in Fig. 2. X-ray radiography was con-ducted according to following conditions
Equipment: Focus size: X-ray film: Lead foil: Distance: X-ray tube voltage: X-ray tube current: Exposure time: Penetrameter: Correction block: Film developing:
Miiller-type MG 150 with béryllium window 0. 7 mm diam. SAKURA R none on front, back 0. 03 mm 600 mm 62 к VP 4 mA 5 min detectable 0. 2 mm diam. of aluminium wire aluminium masking CONIDOL, 20°C, 5 min
Aluminium masking and X-ray protective barrier liquid (ASL) were ef -fective to improve the detectable limit, as shown in Table I.
The results of radiography on welds were classified into the following five groups.
defects of 0. 1 - 0. 3 m m equivalent in diameter defects of 0 . 4 - 0 . 6 m m equivalent in diameter defects of Ô. 7 - 1. 2 m m equivalent in diameter defects of 1. 3 - 2 . 0 m m equivalent in diameter total defect index 0 - 2 total defect index 3 - 9 total defect index 1 0 - 1 9 total defect index 2 0 -tungsten spots
Defect index 1 Defect index 3 Defect index 10 Defect index 20 Group A Group В Group С Group D Group E

268 Y. NAKAMURA and T. AOKI
A 2S Al B. Nat. U
F i g . l
JRR-3 fuel element

END-PLUG WELDING OF FUEL ELEMENTS, 269
A 2S A1 С He Gas
Fig. 2
End-plug welding specimen (aluminium)
Tensile stress was induced gradually until the specimen was broken. Helium and glycol leak tests were applied at many intervals of stress. Eva-luation of the results was done at the stress level that is calculated from the designed permissible elongation of the fuel element; for instance, the permissible elongation of a JRR-3 fuel element, which consists of three fuel rods in one line,is 50 mm in a total length of 2650 mm, and then the critical loading to the specimen was calculated to be 400 kg from the mechanical properties of the cladding.
. The loading for creep testing was selected to obtain a local elongation of 2% in 1000 h at the designed maximum temperature at the inside surface of.thfe cladding. Some acceleration testing was also conducted. In both cases

270 Y. NAKAMURA and T. AOKI
TABLE I
C O M P A R I S O N O F MASKING E F F E C T ON X - R A Y R A D I O G R A P H Y
Items
Methods\ of
masking
Conditions of exposure Developing conditions of film Film
density at the centre
Figure quality
Items
Methods\ of
masking
Type of
film
Tube voltage
(kVP)
Lead foil
Developing conditions of film Film
density at the centre
Figure quality
Items
Methods\ of
masking
Type of
film
Tube voltage
(kVP)
Lead foil
Temperature (•С)
Time (min)
Film density at the centre
Figure quality
Items
Methods\ of
masking
Type of
film
Tube voltage
(kVP) front (mm)
back (mm)
Temperature (•С)
Time (min)
Film density at the centre
Figure quality
Aluminium masking
Fuji 70 no 0. 03 20 5 1. 56 good
ASL liquid masking
Sakura R 78 0. 03 0. 03 20 6 1.60 good
Without masking
Sakura 78 0.03 0. 03 20 6 1.70 poor
ieak testing was carried out at several intervals during the test. The maxi-mum temperature in the thermal cycling test was selected to cause re -crystallization in the cladding rather than the maximum design temperature of the reactor. The specimens were leak tested at several intervals of the cycling. Corrosion testing was carried out at a higher temperature in a simulated environment of the reactor c.oolant.
Leak testing was applied at various times during the corrosion test.
Results of tensile testing
Fifty-five specimens were tested, and none caused leakage until the loading was increased to 400 kg. Average rupture of the specimen occurred at a loading of 1530 kg and some specimens, which contained poor welding quality, leaked at a loading of 1000 kg or 1200 kg. The results are listed in Table II.
Results of creep testing
Four specimens each from group А, С and D were tested at 150°С with 700 kg loading for 1000 h, but none of them leaked. Further creep testing was continued at 150°C with 910-kg loading for an additional 1000 h.
One specimen of group A ruptured at a total of 1284 h. Two of group С caused leakage at 1200 and 1209 h. All the specimens of group D ruptured at 1263, 1366, 1412 and 1724 h.

END-PLUG WELDING OF FUEL ELEMENTS, 271
TABLE II
R E S U L T S O F L E A K T E S T UNDER T E N S I L E LOADING ON THE S P E C I M E N S WITH KNOWN D E F E C T S IN THE W E L D
Class No. of specimens tested
No. of specimens which leaked
Class No. of specimens tested
11 21 ,31
A 10 8 2 0
В 11 3 7 12
С 13 ' 4 7 2s
D 12 4 6 2*
E 9 6 3 0
1 Group 1: Leaked only when the specimen ruptured Group 2: Leaked just before rupture Group 3: Leaked at low loading
2 1000 kg 3 1000 kg, 1200 kg 4 1000 kg, 1350 kg
Results of thermal cycling
Thermal cycling tests were carried out between room temperature and 220°C with 12 specimens (four each from group A, C, and D). No leakage was observed after 500 cycles. Furthermore the cycle was continued be-tween room temperature and 500° C, but no leakage was observed after an additional 500 cycles.
Results of corrosion testing
Hot-water immersion corrosion testing was conducted at 100-117°C for 50 d with 29 specimens (A-8, C - 9 , D -6 , E~6). No leakage was observed after the test.
Conclusion
It may be concluded that: (1) The probability of leakage at the weld by the tensile stress increases
with the decreased weld quality. (2) There is no difference of the probability of leakage caused by
thermal cycling and corrosion with different qualities of the welds. (3) Welding qualities of group A and В and even С will be leak-proof
during actual operation conditions of the reactor, but group A and В are recommendable for routine application.
(4) The results suggest further reduction of welding specifications if the element-fabrication method is improved to include metallic bonding.
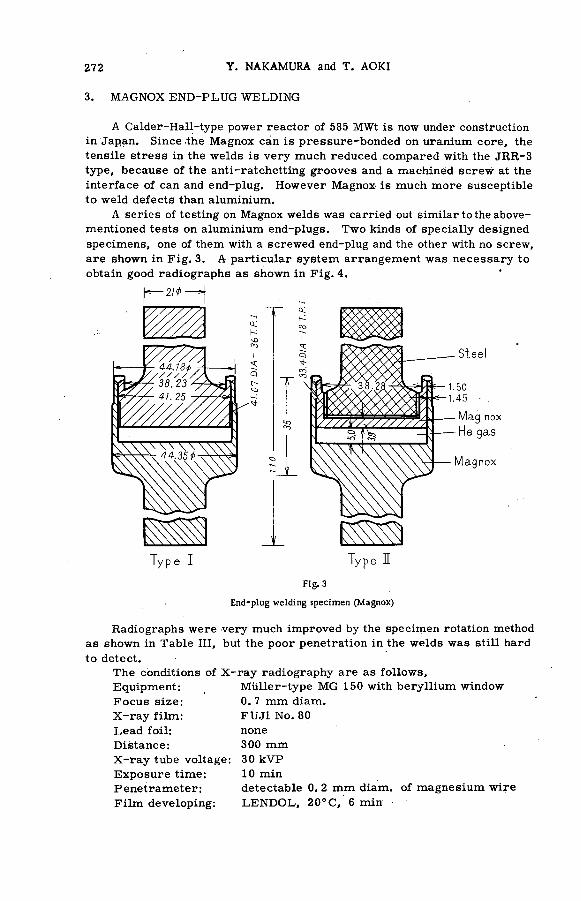
272 Y. NAKAMURA and T. AOKI
3. MAGNOX END-PLUG WELDING
A Calder-Hall-type power reactor of 585 MWt is now under construction in Japan. Since the Magnox can is pressure-bonded on uranium core, the tensile stress in the welds is very much reduced compared with the JRR-3 type, because of the anti-ratchetting grooves and a machined screw at the interface of can and end-plug. However Magnox is much more susceptible to weld defects than aluminium.
A series of testing on Magnox welds was carried out similar to the above-mentioned tests on aluminium end-plugs. Two kinds of specially designed specimens, one of them with a screwed end-plug and the other with no screw, are shown in Fig. 3. A particular system arrangement was necessary to obtain good radiographs as shown in Fig. 4.
Steel
Mag nox He gas
Magnox
Fig .3
End-plug welding specimen (Magnox)
Radiographs were very much improved by the specimen rotation method as shown in Table III, but the poor penetration in the welds was still hard to detect.
The conditions of X-ray radiography are as follows, Equipment: Focus size: X -ray film: Lead foil: Distance: X -ray tube voltage: Exposure time: Penetrameter: Film developing:
Müller-type MG 150 with beryllium window Ô. 7 mm diam. FUJI No. 80 none 300 mm 30 к VP 10 min detectable 0. 2 mm diam. of magnesium wire LENDOL, 20° C, 6 min •

END-PLUG WELDING OF FUEL ELEMENTS, 2 7 3
. / X - r a y b e a m
S l i t of l e a d s h e e t
X - r a y f i l
— : r o t a t i o n
Fig. 4
s p e c i m e n Location of rotatory X-ray radiography
TABLE 111
C O N D I T I O N S O F X - R A Y R A D I O G R A P H Y A N D T H E I R R E S U L T S
X- ray radiography test condition X-ray film
No. X-ray beam wide
(mm)
Tube voltage (kVP)
Exposure time (min)
Filter Penetrameter 0.1 mm-diam. Al
Sharpness of image
1 4 30 2. 5 no _ i х г
2 2 30 5 no ± A
3 1 30 10 no + 0
4 0 .5 30 20 no + 9
5 0.5 25 56 no + @
6 1 25 28 no + 0
7 1 35 5 no + о
8 1 40 3 no è A
9 1 30 14 Al 0.5 mm + 0
10 1 35 7 Al 0.5 mm + 0
Other test conditions:
1 - : no detection 1 ® ! excellent
Л > medium
F. F. D. i 300 mm Rotatiom 6 rpm Tube current: 4 mA + : detectable o ¡ good
.x Í poor

274 Y. NAKAMURA and T. AOKI
The classification of weld quality is similar to that for the aluminium welds.
Resulte of tensile testing
The tests were carried out with six of type I (with end-plug screw) and ten of type II (without end-plug screw) at 250°C and 450°C. The results are shown in Table IV.
TABLE IV
RESULTS OF TENSILE TESTING
No, Type of
specimen Welding quality
Penetration of welds
Test temperature
CQ
Load where leakage was found
(kg)
1 I В good 250 915
2 I В good 250 965
3 И В poor 250 780
4 II В poor 250 665
• 5 II В poor 250 775
6 II С good 250 800
7 II С good 250 850
8 II D good 250 « 600
9 В good 450 360
10 I В good 450 350
11 I В poor 450 200
12 С good 450 240
13 II В good 450 250
14 II В poor 450 220
15 II в poor 450 225
16 II с good 450 206
Results of creep testing
Six specimens of type II were'creep-tested with the loading of 10 kg at 450°C in CO2 atmosphere. Each one of welding quality A and В did not leak in 1000 h. Poor penetration and welding quality reduced the duration until the leakage was found.

END-PLUG WELDING OF FUEL ELEMENTS, 275
Reeulte of thermal cycling
The testing was carried out with 12 type-I specimens of В welding quality in argon atomosphere. The cycling was done between room temperature and 500°C. Four specimens did not leak until 500 cycles, but five specimens leaked before 100 cycles, three of which were found to contain a poor pene-tration of the welds.
Reeulte of corrosion testing
Nineteen specimens were heated to 450+25°C in СОг gas with a pressure of 20+2 kg/cm2 for 90 d. One specimen, which had poor penetration, showed a leakage of the order of 10"5 jus after 30 d. Twenty-two specimens were corroded in hot water (pH 1 0 - 1 2 , added CI ion 2 ppm, 60°C) for 90 d. One specimen which had poor penetration leaked after 60 d.
Conclusion
As the testings are time-consuming and the numbers tested are limited, it is difficult to make a conclusion, but the results suggest that:
(1) X-ray radiography is much improved by the specimen rotation method, but it takes a longer exposure time to get the finest radio-graph, andfurtherimprovementwillbenecessaryformassproduction.
(2) Magnox is more susceptible to weld defects than aluminium, and a higher specified grade of welding quality will be required.
(3) Since poor penetration of the welds is difficult to detect by radio-graphy, process controls of welding are particularly important.
(4) A screw of the end-plug is effective to maintain leak-tightness. Similar experiments are being planned with Zircaloy and stainless-steel
end-plug weldings.
D I S C U S S I O N
V. V. GORSKY: Did the X-ray photographs show unfused sections in the joints due to the presence of a film of aluminium oxide?
R. H. McKANE: If I may comment on the question, many welds of this type are made at the Savannah River plant, and we have been unable to find oxide films in the welds by means of X -rays , particularly when the f i lms are normal to the X -ray beam.
T. AOKI: I agree with Mr. McKane. We were also unable to detect the aluminium oxide by metallography.
P. BONNET: I can give further details. In argon arc welds on SAP (sintered aluminium powder) fuel-element pencils, when an aluminium ring is placed between the plug and the can, it is impossible to detect the difference between SAP and Al on the radiographs. N
I also have a question. Was the choice of test temperature (e. g. 480°С in the case of Magnox) guided by the normal operating temperature, or by the possible temperature of the hottest point of the pencil in the pile?

276 Y. NAKAMURA and T. AOKI
T. AOKI: The test temperature was selected for maximum operating conditions or for accelerktive conditions. The maximum operating tempera-tures are about 80° С on the surface of the aluminium can (JRR-3-fuel elements) and about 450°С on the end-plugs of the Magnox- (Calder Hall-type reactor of the Japan Atomic Power Company).

i }' t
NON-DESTRUCTIVE EXAMINATION OF THE HEAT-AFFECTED ZONE OF WELDED Zr-Nb ALLOY
i i s R . F . H A N S T O C K A N D D . C . B . W A L K E R
U . K . A . E . A . R E A C T O R M A T E R I A L S L A B O R A T O R Y ,
C U L C H E T H , U N I T E D K I N G D O M
A b s t r a c t — R é s u m é — А н н о т а ц и я — R e s u m e n
NON-DESTRUCTIVE EXAMINATION OF THE HEAT-AFFECTED ZONE OF WELDED Zr-Nb ALLOY. An alloy of zirconium, ¡¡i% niobium has advantages for pressure containment in water-moderated reactors owing to the strength attainable by heat treatment. The corrosion resistance of the alloy under reactor operating conditions is also sensitively affected by heat treatment and zones of low corrosion resistance may be produced in the heat-affected zones of fusion welds. The zones susceptible to corrosion may be identified by autoclave treatment but this is not convenient when extensive pressure circuits are being assembled by welding. It has been found that heat-affected zones susceptible to corrosion can be detected non-destructively by measuring the thermo-electric potential between a heated metallic point probe in contact with particular regions of the weld and adjacent metal. The construction of the thermo-electric probe is similar to one devised by the British Non-ferrous Metals Research Association for measuring plating thickness on metal substrates and a commer-cially available instrument incorporating this type of probe is, with simple modification, suitable for testing welds in Zr-Nb alloys. An example is given of the variation of probe response across the heat-affected zones of a weld and is compared with an autoclave test for corrosion.
CONTROLE NON DESTRUCTIF DE LA ZONE D'UN ALLIAGE Zr-Nb AFFECTEE PAR LA CHALEUR LORS DU SOUDAGE. Un alliage zirconium-niobium â 2, 5% Nb présente des avantages pour les circuits sous pression des réacteurs ralentis par de l'eau, du fait de la résistance mécanique que l'on peut obtenir par traitement thermique. La résistance à la corrosion de l'alliage dans les conditions de fonctionnement du réacteur est sensiblement affectée par le traitement thermique et des zones de faible résistance à la corrosion peuvent se produire au voisinage des soudures par fusion. On peut identifier ces zones par traitement en autoclave, mais cette méthode n'est pas applicable dans le cas de longs circuits sous pression que l'on assemble par soudage. On a constaté que les zones affectées par la chaleur qui sont susceptibles de corrosion pouvaient être décelées par contrôle non destructif, en mesurant le potentiel thermoélectrique aux bornes d'une sonde métallique chauffée, en contact avec des parties déterminées de la soudure et le métal adjacent. La sonde thermoélectrique est similaire à celle mise au point par l'Association britannique de recherches sur les métaux non ferreux en vue de mesurer l'épaisseur des revêtements de plaques de métal; un instrument en vente sur le marché et muni de ce type de sonde peut être utilisé, après une légère modification, pour le contrôle des soudures dans les alliages Zr-Nb. Le mémoire donne un exemple de la variation de la réponse de la sonde dans des zones affectées par la chaleur lors du sondage; les résultats sont comparés à ceux d'un examen en autoclave.
НЕДЕСТРУКТИВНОЕ ИСПЫТАНИЕ ЗОНЫ СВАРНОГО ШВА ИЗ ЦИРКОНИЙ-НИОБИЙ СПЛАВА, КОТОРЫЙ ПОДВЕРЖЕН ТЕПЛОВОМУ ВЛИЯНИЮ. Использование сплава из цир-кония и 2,5% ниобия для оболочки в ы с о к о г о давления в реакторах с водным замедлителем имеет ряд преимуществ , связанных с прочностью э т о г о сплава благодаря т е р м о о б р а б о т к е . Термообработка также чувствительно влияет на коррозионную с т о й к о с т ь сплава в условиях работы реактора, и в зонах сварки плавлением, которые подвержены тепловому влиянию, могут появиться зоны низкой коррозионной стойкости. Зоны, подверженные коррозии, можно у с т а -новить путем обработки в автоклаве . Однако э т о т м е т о д является неудобным в тех случа-ях, когда путем сварки собираются крупногабаритные контуры высокого давления. Пришли к выводу, что зоны теплового воздействия, чувствительные к коррозии, можно обнаружить путем измерения термоэлектрического потенциала между нагретым металлическим т о ч е ч -ным зондом, контактирующимся с определенными областями сварного шва, и примыкающим к нему металлом. Термоэлектрический зонд изготавливается так же, как зонд, который с о з -дан Британской ассоциацией по исследованиям цветных металлов для измерения толщины покрытия металлических субстратов . Имеющийся в продаже прибор, который включает такой
277
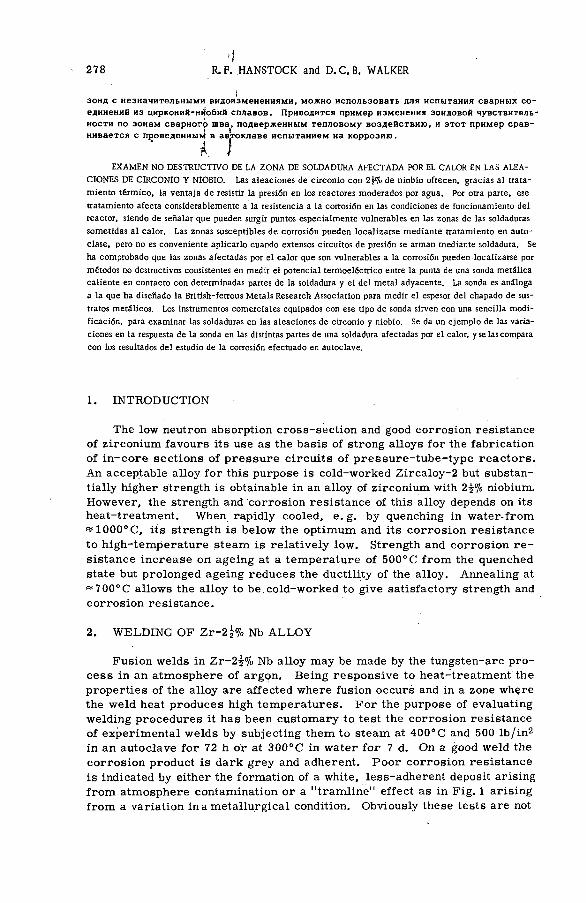
278 R. F. HANSTOCK and D.C.B. WALKER
зонд с незначительными видоизменениями, можно использовать для испытания сварных с о -единений из цирконий-ниобий сплавов . Приводится пример изменения зондовой чувствитель -ности по зонам с в а р н о г о шва, подверженным т епловом у в о з д е й с т в и ю , и э т о т пример с р а в -нивается с проведенным в автоклаве испытанием на к о р р о з и ю .
К I EXAMEN NO DESTRUCTIVO DE LA ZONA DE SOLDADURA AFECTADA POR EL CALOR EN LAS ALEA-
CIONES DE CIRCONIO Y NIOBIO. Las aleaciones de circonio con 2fflo de niobio ofrecen, gracias al trata-miento térmico, la ventaja de resistir la presión en los reactores moderados por agua. Por otra parte, ese tratamiento afecta considerablemente a la resistencia a la corrosión en las condiciones de funcionamiento del reactor, siendo de seüalar que pueden surgir puntos especialmente vulnerables en las zonas de las soldaduras sometidas al calor. Las zonas susceptibles de corrosión pueden localizarse mediante tratamiento en auto-clase, pero no es conveniente aplicarlo cuando extensos circuitos de presión se arman mediante soldadura. Se ha comprobado que las zonas afectadas por el calor que son vulnerables a la corrosión pueden localizarse por métodos no destructivos consistentes en medir el potencial termoeléctrico entre la punta de una sonda metálica caliente en contacto con determinadas partes de la soldadura y el del metal adyacente. La sonda es análoga a la que ha diseüado la British-ferrous Metals Research Association para medir el espesor del chapado de sus-tratos metálicos. Los instrumentos comerciales equipados con ese tipo de sonda sirven con una sencilla modi-ficación, para examinar las soldaduras en las aleaciones de circonio y niobio. Se da un ejemplo de las varia-ciones en la respuesta de la sonda en las distintas partes de una soldadura afectadas por el calor, y se las compara con los resultados del estudio de la corrosión efectuado en autoclave.
1. INTRODUCTION
The low neutron absorption cross-section and good corrosion resistance of zirconium favours its use as the basis of strong alloys for the fabrication of in-core sections of pressure circuits of pressure-tube-type reactors. An acceptable alloy for this purpose is cold-worked Zircaloy-2 but substan-tially higher strength is obtainable in an alloy of zirconium with niobium. However, the strength and corrosion resistance of this alloy depends on its heat-treatment. When rapidly cooled, e. g. by quenching in water-from *?1000°C, its strength is below the optimum and its corrosion resistance to high-temperature steam is relatively low. Strength and corrosion r e -sistance increase on ageing at a temperature of 500°С from the quenched state but prolonged ageing reduces the ductility of the alloy. Annealing at « 7 0 0 ° C allows the alloy to be cold-worked to give satisfactory strength and corrosion resistance.
2. WELDING OF Zr-2|% Nb ALLOY
Fusion welds in Zr-2^% Nb alloy may be made by the tungsten-arc pro-cess in an atmosphere of argpn. Being responsive to heat-treatment the properties of the alloy are affected where fusion occurs and in a zone where the weld heat produces high temperatures. For the purpose of evaluating welding procedures it has been customary to test the corrosion resistance of experimental welds by subjecting them to steam at 400°C and 500 lb/in2
in an autoclave for 72 h or at 300°C in water for 7 d. On a good weld the corrosion product is dark grey and adherent. Poor corrosion resistance is indicated by either the formation of a white, less-adherent deposit arising from atmosphere contamination or a "tramline" effect as in Fig. 1 arising from a variation in a metallurgical condition. Obviously these tests are not
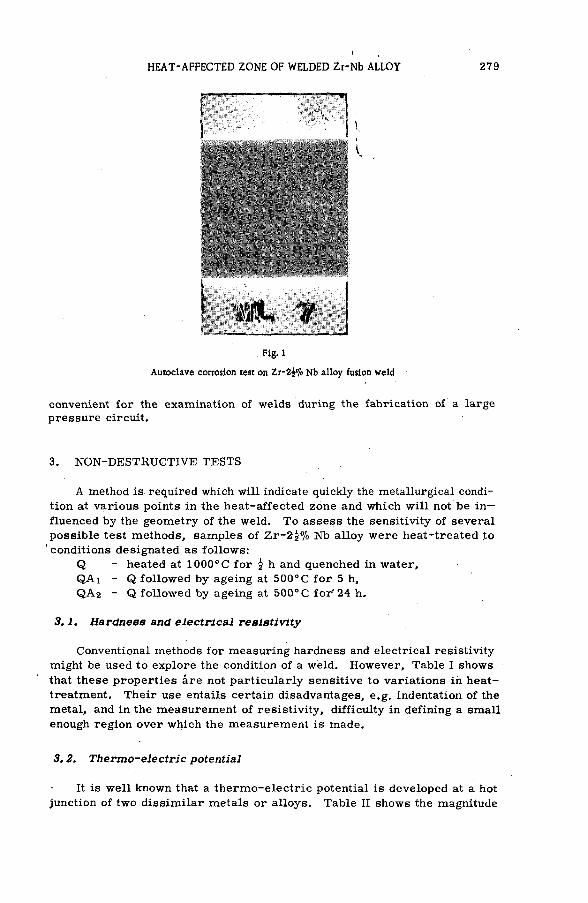
HEAT-AFFECTED ZONE OF WELDED Zr-Nb ALLOY 279
¡ Ш , it
. Fig. 1
Autoclave corrosion test on Zr-2^0 Nb alloy fusion weld
convenient for the examination of welds during the fabrication of a large pressure circuit.
3. NON-DESTRUCTIVE TESTS
A method is required which will indicate quickly the metallurgical condi-tion at various points in the heat-affected zone and which will not be i n -fluenced by the geometry of the weld. To assess the sensitivity of several possible test methods, samples of Z r - 2 f % Nb alloy were heat-treated to
'conditions designated as follows: Q - heated at 1000° С for i h and quenched in water, QAi - Q followed by ageing at 500°C for 5 h, QA 2 - Q followed by ageing at 500°С for '24 h.
3.1. Hardneee and electrical reeietivity
Conventional methods for measuring hardness and electrical resistivity might be used to explore the condition of a weld. However, Table I shows that these properties are not particularly sensitive to variations in heat-treatment. Their use entails certain disadvantages, e.g. indentation of the metal, and in the measurement of resistivity, difficulty in defining a small enough region over which the measurement is made.
3. 2. Thermo-electric potential
It is well known that a thermo-electric potential is developed at a hot junction of two dissimilar metals or alloys. Table II shows the magnitude
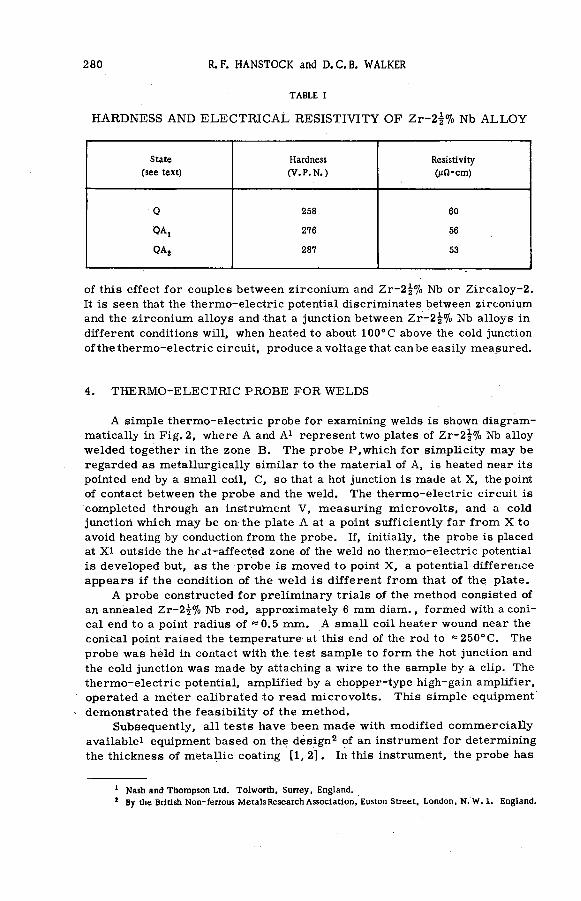
280 R. F. HANSTOCK and D.C.B. WALKER
TABLE I
HARDNESS A N D E L E C T R I C A L RESISTIVITY O F Z r - 2 Í % Nb A L L O Y
State Hardness Resistivity (see text) ( V . P . N . ) ((jO-cm)
Q 258 60
OA, 276 56
QAj 287 53
of this effect for couples between zirconium and Zr-2^% Nb or Zircaloy-2. It is seen that the thermo-electric potential discriminates between zirconium and the zirconium alloys and that a junction between Zr -2^% Nb alloys in different conditions will, when heated to about 100° С above the cold junction of the thermo-electric circuit, produce a voltage that canbe easily measured.
4. THERMO-ELECTRIC PROBE FOR WELDS
A simple thermo-electric probe for examining welds is shown diagram-matically in Fig. 2, where A and A1 represent two plates of Zr-2^% Nb alloy welded together in the zone B. The probe P,which for simplicity may be regarded as metallurgically similar to the material of A, is heated near its pointed end by a small coil, C, so that a hot junction is made at X, the point of contact between the probe and the weld. The thermo-electric circuit is completed through an instrument V, measuring microvolts, and a cold junction which may be on the plate A at a point sufficiently far from X to avoid heating by conduction from the probe. If, initially, the probe is placed at XI outside the hf it-affected zone of the weld no thermo-electric potential is developed but, as the probe is moved to point X, a potential difference appears if the condition of the weld is different f rom that of the plate.
A probe constructed for preliminary trials of the method consisted of an annealed Zr-2^% Nb rod, approximately 6 mm diam., formed with a coni-cal end to a point radius of ^0 .5 mm. A small coil heater wound near the conical point raised the temperature-at this end of the rod to «250°Ç . The probe was held in contact with the test sample to form the hot junction and the cold junction was made by attaching a wire to the sample by a clip. The thermo-electric potential, amplified by a chopper-type high-gain amplifier, operated a meter calibrated to read microvolts. This simple equipment
-- demonstrated the feasibility of the method. Subsequently, all tests have been made with modified commercially
available1 equipment based on the design2 of an instrument for determining the thickness of metallic coating [1, 2] . In this instrument, the probe has
1 Nash and Thompson Ltd. Tolworth, Surrey. England. * By the British Non-ferrous Metals Research Association, Euston Street, London, N. W. 1. England.

HEAT-AFFECTED ZONE OF WELDED Zr-Nb ALLOY 281
TABLE II
T H E R M O - E L E C T R I C P O T E N T I A L S B E T W E E N Z I R C O N I U M A N D A L L O Y S
Material Zirconium
Zirconium 2|<7° Niobium
Zircaloy-2 Material Zirconium
Annealed QAj QA, Q
Zircaloy-2
Thermo-electric potential MV/degC
0 1.38 1. 62 2.16 2. 66 4.33
1-
I I I I-I i
! ==. С
x ' X , / A В
* (
Fig. 2
Principle of the thermo-electric probe
a steel point about 0.5 mm radius and a large thermo-electric potential is developed when this is placed in contact with zirconium alloy. Thus it is necessary to apply a backing-off potential to obtain a zero reading on the alloy away from the weld in order to be able to amplify the smaller potential difference that arises when the probe is moved into the weld zone. A sche-matic design of the probé and a block diagram of the measuring circuit is shown in Fig. 3. The thermal capacity associated with the probe tip is suf-ficiently large for its temperature, about 100°C above ambient, to be rela-tively unaffected by the small heat leak through the point contact on the test weld. The heat transferred at the weld by the point probe produces a very localized hot spot without increasing the general temperature of the weld metal. The response of the probe is moderately sensitive to the contact pressure. A helical spring compressed to a constant amount limited by the contact of a thermally insulating end-cap with the weld surface ensures a reproducible pressure. The measuring circuit of the instrument has been modified by replacing the normal voltage backing circuit provided for zero setting by a more accurate potential divider and by the addition of a potentio-meter for measuring this backing voltage. This allows the thermo-electric

282 R. F. HANSTOCK and D.C.B. WALKER
Fig.3
Thermo-electric probe and associated circuits •
potentials to be measured when scanning across a weld. For a quick assess-ment of the weld condition the out- of-balance of the meter, after setting the zero on the plate material, is sufficient for routine tests.
5. WELD TESTS
The thermal probe is very simple to use, the only precaution necessary being to ensure that the weld is clean and free from electrically insulating oxide. Before use, the probe must be allowed enough time to reach tempera-ture equilibrium, after which potential readings may be made quickly, allow-ing a few seconds to elapse between each reading.
The results of the examination of some fusion welds of Zr -2§% Nb alloy are shown in Fig. 4, curves A and B. The weld to which curve A refers was produced by fusing together the abutting edges of two pieces of 1 . 1 0 - m m -thick plate by means of a tungsten arc in an enclosure filled with argon at about atmospheric pressure. The plates were cold-rolled with 207o reduction from the annealed condition and had a thermo-electric potential slightly less than that of material in the state QA2 as defined in section 3. The variation of thermo-electric potential across the heat-affected zone, Curve A, shows that the metallurgical condition of the weld approaches but does not reach the state QAi . It was concluded that this weld would have good corrosion resistance and this was confirmed by the autoclave test. It is interesting to note that the nearest approach to the state QAX is at the outer boundaries

HEAT-AFFECTED ZONE OF WELDED Zr-Nb ALLOY 283
Fig. 4
Thermo-electr ic potential in heat-affected zones of welds in Zr-2^% Nb alloy
of the heat-affected zone, where the rate of cooling of the weld by the un-heated parts of the plate is highest.
The weld to which Fig. 4, Curve B, refers was produced by fusing abutt-ing edges of two pieces of 3.2-mm-thick plate which had been heat-treated to the state QA 2 . The variation of the thermo-electric potential across the heat-affected zone shows that the quenching effect of the cold parts of the plates was very severe at the boundaries of the zone and produced regions which have a metallurgical condition corresponding approximately to the Q state. These regions would be expected to have low corrosion resistance and a subsequent autoclave test produced the "tramline" effect in positions corresponding to the peaks in Curve B. The width of the heat-affected zone of weld В made in 3. 2 - m m plate is considerably greater than that in weld A made in 1. 1 - m m plate, presumably because more heat input is required to weld the thicker plate. In a weld where a filler rod is used to fill a gap between abutting plates the heat input required to fuse the filler and the plate edges is also higher than in a simple fusion weld. Curve С in Fig. 4 shows the variation of thermo-electric potential across a filler-type weld between plates of the same thickness and condition as those used in producing weld A. It is seen that the heat-affected zone is wider in the filler-type weld. In

284 R. F. HANSTOCK and D.C.B. WALKER
applying the test to filler-type welds it is necessary to ensure that the filler rod is of the same composition as the plate material since it is evident from Table II that the thermo-electric potential is sensitive to composition as well as to heat-treatment.
6. CONCLUSIONS
The use of a thermo-electric probe to measure variations of thermo-electric potentials in fusion welded Zr-2^% Nb alloy is a simple and practical non-destructive technique for defining the heat-affected zone. If the thermo-electric potential at any point in the zone is near to that of the alloy in the state induced by rapid quenching from 1000°C, then the weld is likely to have unsatisfactory corrosion resistance in steam environment.
A C K N O W L E D G E M E N T S
The assistance of Messrs. F .S . Dickinson, P. Lees and C.P.Pennington in the preparation of welds and autoclave testing is gratefully acknowledged. The authors also wish to thank Mr. J. M. Hutcheon, Head of the Keactor Materials Laboratory and Mr. R.V. Moore, Managing Director of the Reactor Group, U. К. A. E. A. for approval to contribute this paper to the Symposium,
R E F E R E N C E S
[1 ] HEATH, A. R., Metal Finishing J. 1 (New Series) (1955) 145-50. [ 2 ] British Patents 768,448 and 858,345.
4

NEW FRONTIERS FOR NON-DESTRUCTIVE TESTING
IN THE NUCLEAR AGE
D . W . B A L L A R D
S A N D I A L A B O R A T O R Y
A L B U Q U E R Q U E , N . M E X . ,
U N I T E D S T A T E S O F A M E R I C A
A b s t r a c t — R é s u m é — А н н о т а ц и я — R e s u m e n
NEW FRONTIERS FOR NON-DESTRUCTIVE TESTING IN THE NUCLEAR AGE. Much of the fantastic growth in non-destructive testing since World War II can be attributed to the more demanding quality require-ments for highly reliable components in the nuclear industry. System complexity and overall costs of service failures have become so great that it is imperative that more effective non-destructive test methods be de-veloped and used throughout the "cradle-to-grave" product cycle.
While the capabilities of well-known test methods such as radiography, ultrasonics, and electromagnetic testing are being greatly extended in an attempt to satisfy the accelerating technical demands for perfection, new testing concepts are being developed specifically to test both static and dynamic performance requirements. These high-speed, high-resolution methods are truly "new frontiers" for non-destructive testing and constitute the basis for this paper.
Among the newer test methods to be discussed are the use of infra-red testing for determining the integrity of weldments. Cineradiographic testing of structures during vibration testing to examine their dynamic behaviour is covered. Another area of extreme importance to obtaining reliable reactor fuel is effective leak detection. A method for inspecting canned components is discussed which uses a radioactive gas and which is capable of measuring leak rates as low as 10 "12 cirf/s or 1 cm3 leakage in 500 yr.
In-motion radiography at high magnifications using X-ray sensitive vidicon tubes is another valuable new tool. A similar new method (cinesonography) using ultrasonic imaging rather than radiography is covered.
Finally, there is a discussion of the next generation of fully automatic, high-speed equipment that must be developed for rapid scanning applications. Such systems will incorporate several non-destructive test methods applied simultaneously. Infra-red, electromagnetic, and microwave test methods coupled with tape-controlled scanning will be adapted to produce output images suitable for remote television displays and recording. Test parameters, display capabilities, and continuous monitoring systems are discussed. These possibilities have . already been demonstrated in laboratory testing and their use must be extended to production testing if a new level of reliability of components in the nuclear industry is to be achieved. , •
PERSPECTIVES DES ESSAIS NON DESTRUCTIFS A L'ERE NUCLEAIRE. On peut attribuer en grande partie l'extraordinaire développement des essais non destructifs depuis la deuxième guerre mondiale aux spécifications extrêmement strictes imposées aux matériaux et produits de l'industrie nucléaire. La complexité des installa-tions et de leurs éléments et les incidences financières des arrêts de fonctionnement ont atteint des proportions telles qu'il est impérieux de mettre au point des méthodes plus efficaces d'essais non destructifs et de les appli-quer tout au long de la durée de vie des produits, depuis leur mise en fabrication jusqu'à leur déclassement.
En même temps que, pour tenter de satisfaire aux impératifs techniques de perfection, on développe considérablement les possibilités offertes par des méthodes d'essais confirmées, comme la radiographie, les ultrasons et l'électromagnétisme, on met au point de nouveaux principes d'essais destinés expressément au contrôle des performances statiques et dynamiques. Le mémoire porte sur ces méthodes particulièrement rapides et sensibles qui ouvrent vraiment de nouvelles perspectives aux essais non destructifs.
Au nombre des méthodes d'essais les plus récentes discutées dans le mémoire figure le contrôle par les infra-rouges de l'intégrité des soudures. Le contrôle cinéradiographique des structures au cours des essais de vibration, pour étudier leur comportement dynamique, est également traité. La détection des fuites est extrêmement importante pour assurer la qualité des éléments combustibles. Le mémoire décrit une méthode de contrôle des éléments combustibles sous gaine, qui est fondée sur l'utilisation d'un gaz radioactif et qui permet de mesurer des fuites de l'ordre de 10~12ст3Д, soit 1 cm3 en 500 a.
285

286 D. W. BALLARD
La c i n é r a d i o g r a p h i e à fort gross issement , au m o y e n d e tubes V i d i c o n à rayons X , const i tue un nouveau
p r o c é d é fort ut i le . Le m é m o i r e décr i t aussi une nouve l l e méthode s imilaire ( c inésonographie ) , dans laquel le la
f o rmat i on de l ' i m a g e est f o n d é e sur les ultrasons et non sur la radiographie .
Enfin, l ' auteur é t u d i e la p r o c h a i n e g é n é r a t i o n d ' appare i l s e n t i è r e m e n t automat iques et à grande vitesse
q u ' i l faudra met t re au po int pour p r o c é d e r à des exp lorat ions rapides . Ces apparei ls permettront l ' a p p l i c a t i o n
s imul tanée de plusieurs m é t h o d e s non destruct ives . Il faudra adapter des méthodes d 'essais par les infrarouges,
Г é l e c t r o m a g n é t i s m e et les m i c r o - o n d e s à l ' e n r e g i s t r e m e n t c o n t i n u dés résultats, d e m a n i è r e à o b t e n i r des
i m a g e s pouvant être retransmises par t é l év i s i on et k inescopées . Le m é m o i r e discute les paramètres des essais,
l e s possibi l i tés d e transmission des résultats et les possibi l i tés de c o n t r ô l e en cont inu. Ces possibi l i tés ont dé jà
é t é démontrées au cours d 'essais en labora to i re ; il faudra en tirer profit sur le plan industriel si l ' on veut at te in-
dre un niveau encore plus é l e v é de la qual i té dans l ' industrie nuc léa ire .
" Н О В Ы Е Р У Б Е Ж И " Н Е Д Е С Т Р У К Т И В Н Ы Х ИСПЫТАНИЙ В ЯДЕРНЫЙ В Е К . После второй мировой войны к о л о с с а л ь н о в о з р о с л о число м е т о д о в н е д е с т р у к т и в н ы х испытаний что можно в значительной степени объяснить т е м , ч т о в ядерной промышленности предъяв-ляются все более с трогие требования к качеству и надежности оборудования. Сложность с и с -темы и общие р а с х о д ы , связанные с повреждениями, настолько возросли , что с у щ е с т в у е т на* стоятельная необходимость в разработке более эффективных методов недеструктивных испы-таний, а также в их использовании на всем протяжении производственного цикла.
В настоящее время значительно расширяются возможности применения хорошо и з в е с т -ных методов испытаний, например с помощью радиографии, ультразвука и электромагнитных колебаний, для удовлетворения все возрастающих требований технического усовершенствова -ния. Одновременно разрабатываются новые принципы испытаний специально для т о г о , ч т о -бы проверить те требования, которые предъявляются к статическим и динамическим характе -ристикам. Эти быстродействующие методы с высокой разрешающей с п о с о б н о с т ь ю , являю-щиеся поистине "новыми рубежами" недеструктивных испытаний, положены в основу н а с т о -ящей р а б о т ы .
В число новейших м е т о д о в , которые рассматриваются в докладе, входит использование инфракрасных лучей для определения прочности сварных соединений. Рассматривается испы-тание структур м е т о д о м кинорадиографии во время вибрационного испытания с целью изуче -ния их динамического поведения. Другой областью, которая имеет исключительно важное зна-чение для получения надежного реакторного топлива, является эффективное нахождение места течи. Р а с с м а т р и в а е т с я м е т о д проверки заключенных в оЬолочку компонентов , при котором используется радиоактивный г а з и который позволяет измерять с к о р о с т и утечки, с о с т а в л я -ющие 10"1^см 3 / сек , или 1'см® в течение 500 л е т .
Другим ценным м е т о д о м является радиография в движении при больших увеличениях с использованием видиконов, ч у в с т в и т е л ь н ы х к р е н т г е н о в с к и м л у ч а м . О с в е щ а е т с я новый аналогичный м е т о д (киносонография) , при котором используется не радиография, а у л ь т р а -звуковое изображение. В заключение работы рассматривается новый вид полностью а в т о м а -тического быстродействующего оборудования, разраЬатываемого для использования при б ы с т -ром скеннировании. Такие системы будут включать несколько методов недеструктивных испыта-ний, которые применяются одновременно . Приборы использующие инфракрасные лучи, электро -магнитные колебания и токи в ы с о к о й ч а с т о т ы в сочетании с о скеннирующими у с т р о й с т в а м и , управляемые с помощью магнитной пленки, с о о т в е т с т в у ю щ и м о б р а з о м приспасабливаются для получения выходных изображений, которые пригодны для дистанционного телевизионного воспро-изведения и записи. Рассмотрены испытательные параметры, воспроизводящие способности и не-прерывные с и с т е м ы контроля. Эти возможности уже выявлены в ходе лабораторных испыта-ний и их с л е д у е т также использовать и при заводских испытаниях, если мы хотим добиться большей надежности оборудования в ядерной промышленности.
NUEVAS POSIBILIDADES DE LOS ENSAYOS NO DESTRUCTIVOS EN LA ERA NUCLEAR. El extraordinario desarro l l o de los ensayos no destructivos que se ha registrado desde la segunda guerra mundia l puede atribuirse en gran parte a las m a y o r e s e x i g e n c i a s en cuanto a la c a l i d a d d e l mater ia l que , en la industria nuclear , ha de o f r e c e r un a l t o n i v e l d e seguridad. La c o m p l e j i d a d d e las ins ta lac iones y los gastos q u e en g e n e r a l entrañan las f a l l a s en su f u n c i o n a m i e n t o han a u m e n t a d o d e tal f o r m a q u e se i m p o n e e s t a b l e c e r m é t o d o s más e f i c a c e s d e e n s a y o n o d e s t r u c t i v o , a p l i c a b l e s a l m a t e r i a l d e s d e q u e s a l e d e l a f á b r i c a hasta q u e q u e d a e n d e s u s o .
A l m i s m o t i e m p o que se procura atender las ex igenc ias cada v e z mayores de per fecc i ón técn ica mejorando los m é t o d o s de ensayo c o n o c i d o s , por e j e m p l o los radiográf i cos , ultrasónicos y e l e c t romagnét i cos , se establecen otros nuevos para c o m p r o b a r si e l e q u i p o retine los requisitos necesar ios tanto en e l aspec to estát i co c o m o en e l

NEW FRONTIERS FOR NON-DESTRUCTIVE TESTING 287
dinámico. Esos métodos ultrarrápidos y de elevado poder de resolución constituyen en realidad las nuevas fronteras del ensayo no destructivo, y a ellos se refiere fundamentalmente la presente memoria .
Entre los modernos métodos de ensayo que se estudian se cuenta el uso de rayos infrarrojos para verificar el estado de las soldaduras y la inspección cinematorradiográfica de las estructuras durante los ensayos de vibra-ción para verificar su comportamiento dinámico. Hay que tener también muy en cuenta la importancia de una localización eficaz de los escapes para que el combustible de los reactores pueda utilizarse en condiciones de seguridad. Se examina un método de inspección de piezas revestidas, basado en el empleo de gas radiactivo, con el que se pueden medir fugas de incluso 10~1¿ cmJ/s, esto es, de 1 cmJ cada 500 años.
Otro medio eficaz que puede utilizarse actualmente es la radiografía dinámica con gran ampliación, basada en el uso de tubos vidicón sensibles a los rayos X. Se estudia asimismo un nuevo método análogo al indicado, (cinesonograffa) ; con este método, la obtención de imágenes se realiza por medios ultrasónicos y no radiográficos.
Para terminar, se procura estudiar el equipo totalmente automático y ultrarrápido que habrá de pre-pararse para exploración a gran velocidad. Ese equipo supone la aplicación simultánea de varios métodos de ensayo no destructivo. Los métodos basados en el empleo de rayos infrarrojos, los electromagnéticos y los de microondas combinados con la exploración gobernada por cinta magnética se utilizan para obtener imágenes de la producción; esas imágenes pueden ser televisadas o registradas a distancia. Se examinan los parámetros de ensayo, las posibilidades de indicación y los sistemas de comprobación continua. Esas posibilidades se han estudiado ya en laboratorio y ahora hay que aplicarlas a la producción si se quiere lograr un mayor nivel de seguridad en el empleo-del equipo nuclear.
1. INTRODUCTION
In October 1965, the American Society for Nondestructive Testing will celebrate its silver anniversary as a technical society. Twenty-five years ago the significant impact that non-destructive testing was to have on every-one's life was not foreseen when a group of nine technicians met in Boston to exchange some early experiences in industrial radiography.
Non-destructive testing (NDT) is now playing a critical and widely recognized role in the quality control operations of modern industry. Tests such as radiography, ultrasonics, magnetic particle and electromagnetic testing have earned their reputation on the production lines as vital tools which help to ensure the reliability of products [1].
Much of the tremendous growth of non-destructive testing since World War II can be directly attributed to the more demanding quality requirements imposed on military ordnance and, more recently, for more reliable space and nuclear components [2] .
If these dynamic advances are to continue we must consider the needs of the rapidly changing world of ten to twenty years hence. As we enter the second quarter-century of NDT in the United States of America, it is ap-propriate to speculate about the "new frontiers" for non-destructive testing in the nuclear age.
This paper presents seven predictions of new frontiers for non-destructive testing that should represent a distinct challenge to those now engaged in this profession.
These predictions are based on my experiences during the past seven years that I have served as a National Director and Officer of the American Society for Nondestructive Testing. It is hoped that this review will en-courage each of the members of this distinguished audience to consider his own use of NDT methods as related to these new frontiers.

288 D. W. BALLARD
2. NEW FRONTIERS FOR NON-DESTRUCTIVE TESTING
As the emphasis on reliability of parts, equipment and systems con-tinues to grow, the tools of non-destructive testing will be modified or re -fined to meet the challenge of the following six new fields.
Material properties testing; Research and development tools; Dynamic NDT applications; Multiple non-destructive testing; Electronic component and systems testing; and infra-red and micro-wave tests.
Each of these fields deserves closer study: Examples will be used in the following sections to reinforce each prediction.
3. MATERIAL PROPERTIES TESTING
3.1. Identification with defect detection
By nature of their conception and development, most established non-destructive tests have been concerned solely with detecting material dis -continuities [3]. This almost universal identification with defect detection and inspection has had the unfortunate effect of creating artificial and r e -strictive boundaries of non-destructive testing. While defect detection is obviously important, information on material properties and structural uni-formity should receive equal emphasis [4].
Non-destructive testing will, therefore, undergo a re-direction with the emphasis on quantitative properties measurements.
Already, examples of current applications are appearing in the literature on non-destructive material property testing. For example, the March 1965 issue of Materials Evaluation featured the following: ''Ultrasonic attenuation test for improper heat treatment of steels" [5], "Radiography for metal-lurgical troubleshooting" [6]; and "Ultrasonic velocity for ultimate tensile strength of resin-ceramic heat shield" [7].
3. 2. Ultrasonic hardness tester
Another example of the application of NDT methods to material property testing is a recently announced ultrasonic hardness tester for steel which gives a direct read-out in three seconds of Rockwell С 10 to 70 range with a claimed accuracy of ± 1 point [8].
3. 3. Ultrasonic attenuation tests
SHARPE [9, 10] of Harwell has reported the use of ultrasonics for study-ing the coarse microstructure of uranium bars as well as for accurate wall-thickness measurements of stainless-steel fuel-element sheeting.
3. 4. Electromagnetic conductivity test
Eddy-current measurements of conductivity of the newer alloy steels have shown a closer correlation with tensile strength than does the tra -ditional hardness testing.

NEW FRONTIERS FOR NON-DESTRUCTIVE TESTING 289
3. 5. Guide for test selection
CARLTON H. HASTINGS [11], a past-president of SNT, gave the fol-lowing guide for selecting the proper tests for physical properties: "if you want to measure a list of properties, the first step is to translate them to a list of independent material variables. The next step is to determine what kind of test energy to use". Applying these guides led to the layout of Table I.
4. RESEARCH AND DEVELOPMENT TOOLS
4.1. Basis for prediction
Closely related to the previous application is the predicted increased usage of NDT methods as important tools for the design stages [12]. The designer's problems have increased enormously in recent years. Examples include the need to design for higher strength-to-weight ratios, ability to withstand split-second shock loading, radiation and thermal stresses .
4. 2. Benefits to designers
Proper use of NDT techniques during development will provide the de-signer with five major benefits, all of which are related to a better under-standing of the capabilities and limitations of his design, and to a higher degree of assurance in the performance of his product during production. Specifically, these benefits of an active non-destructive testing programme to the designer are as follows:
(a) Valid correlation: Provides a valid basis for correlating design prove-in tests with subsequent acceptance tests during production.
(b) More information: Allows the designer to derive more useful in-formation on destructive and/or environmental tests with very little additional cost.
(c) Fewer expensive tests: Reduces the number of expensive destruc-tive tests.
(d) New source of data: Provides a source of unique information that often cannot be obtained by other test methods.
(e) Better designs: Permits better design by earlier "trouble-shooting" and justifiable reduction of design safety factors.
4. 3. Possible savings
At the beginning of the design programme, a definite effort should be made to correlate the findings of non-destructive tests with the destructive tests that are so essential to the development of a design satisfactory to the customer. Formulating the acceptance criteria for production tests during the design stage can save many frustrating man-hours for both the produc-tion and quality control departments. Valid correlation studies also enable the designer to work closer to the true yield and ultimate stresses of his materials. An estimate of $150 000 penalty for each additional pound of
19

290 D.W. BALLARD
TABLE I
NON-DESTRUCTIVE TEST PARAMETERS M A T E R I A L INTERACTIONS
NDT Technique Interaction Related Material
variables
1. Ultrasonics (a) Velocity Stress-wave
Propagation A .
Elasticity Density/porosity Crystal structure Grain size Anisotropy
(b) Attenuation Energy scattering A plus flaw content and less density
(c) Flaw detection Reflection at impedance mismatch
Elasticity Density Flaw content Anisotropy
(d) Thickness resonance
Stress-wave Propagation
Elasticity Density/porosity Crystal structure Grain size Composition/purity Flaw content Anisotropy
2. Radiography Absorption/scattering Density/porosity Crystal structure Composition/purity Flaw content
3. Electrical (a) Resistivity
(b) Conductivity
Resistance to • current flow
Resistance to eddy currents
Porosity Crystal structures Composition/purity
Flaw content Anisotropy
4. Thermal (a) Infra-red scan Heat-absorptivity
Diffusion Velocity of heat-pulse
transmission Radiation (emissivity)
•
Density/porosity Crystal structure Composition/purity Flaw content Anisotropy
(b) Thermal comparitor Conductivity
19'

NEW FRONTIERS FOR NON-DESTRUCTIVE TESTING 291
weight on one space vehicle of the 1960's strikingly underlines the need for a more definitive design.
5. DYNAMIC NON-DESTRUCTIVE TESTING
5. 1. Indirect static testing
Non-destructive testing has been limited in the past because most of the available methods gave only indirect qualitative results which were dif-ficult to correlate with product serviceability or function [13]. Moreover, these tests were invariably applied to static structures not under service stresses.
5. 2. Direct dynamic testing
More recently, these severe limitations have been studied and I predict that dynamic non-destructive testing will be a strong new frontier of our profession. Nearly all our classified NDT methods, including even liquid penetrant testing, have been collated for valid cross comparison of data and retention of test observation [14]. Moreover, stroboradiography, ultra-sonic inspection of on-stream pipe lines as hot as 1200°F, in-motion radio-graphy, combined vibration/fluoroscopy, and infra-red measurements of energized components under actual stress demonstrate the practicability of this new frontier. I personally feel that the inherent advantages of NDT will not be fully utilized until our ability to perform dynamic testing rather than static bench testing is demonstrated.
5.3. Cineradiography
An example of a dynamic non-destructive test set-up is shown in Fig. 1. Vibration is applied to a structure or component while undergoing simul-taneous examination by fluoroscopy. This cirieradiographic technique has enabled the designer to study frame by frame the behaviour of their compo-nents during vibration simulating service conditions [15].
5. 4. Leak detection
Dynamic leak detection is another example of a non-destructive test method that has been virtually ignored. Ironically, the prime inpetus in the leak-detection field was generated by the need to manufacture atomic fuel elements [16]. Recently, the need for even tighter environmental con-trols on nuclear-reactor components has brought about more rigid leak-detection requirements. This environmental control can best be achieved by hermetic sealing, and the adequacy of this seal under service conditions must be measured.

292 D. W. BALLARD
- ч I f&l * -&'.*. iS^.^SatdÉ ш
Fig 1
D y n a m i c c ine - rad iography system
IBHH
Fig . 2
Precision l eak de tec t i on using krypton-85 ¡
5. 5. Radioactive gas testing
Grading of leakage rates from sealed components before and subsequent to simulated service Environments has been used to set valid leak-test cri -teria for production acceptance. Figure 2 shows a relatively new precision leak detector which utilizes a radioactive gas (Krypton-85) under pressure to infiltrate hermetically-sealed components through any microscopic leak-age path. After the sealed part is decontaminated to remove surface count, a detector is used to measure leakage rates as low as 10"12 cm 3 / s , or 1 cm3
leakage in 500 yr. This is truly a dynamic NDT method with quantitative information [17].
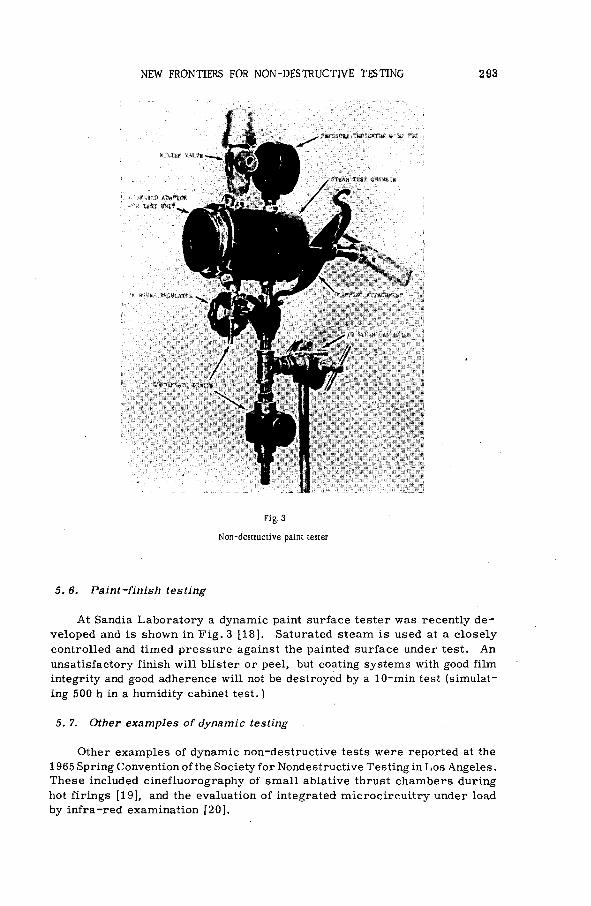
NEW FRONTIERS FOR NON-DESTRUCTIVE TESTING 293
5. 6. Paint-finish testing
At Sandia Laboratory a dynamic paint surface tester was recently de-veloped and is shown in Fig. 3 [18]. Saturated steam is used at a closely controlled and timed pressure against the painted surface under test. An unsatisfactory finish will blister or peel, but coating systems with good film integrity and good adherence will not be destroyed by a 10-min test (simulat-ing 500 h in a humidity cabinet test. )
5. 7. Other examples of dynamic testing
Other examples of dynamic non-destructive tests were reported at the 1965 Spring Convention of the Society for Nondestructive Testing in Los Angeles. These included cinefluorography of small ablative thrust chambers during hot firings [19], and the evaluation of integrated microcircuitry under load by infra-red examination [20].

294 D. W. BALLARD
6. MULTIPLE NON-DESTRUCTIVE TESTING
6. 1. Basis for prediction
Another new field for non—destructive testing will involve the simul-taneous or successive exposure of the object being examined by multiple NDT methods. This development, which has been slow in coming, reflects a growing maturity of our profession. Even the most enthusiastic radio-grapher (or ultrasonics practitioner) has been forced to recognize the in-herent as well as staterof-the-art limitations of his speciality. Sacrifices in sensitivity, time and cost are inevitable if attempts are made to use one test method exclusively. Therefore, I predict a large increase of multiple test set-ups with the NDT methods selected to optimize the sensitivity of the test of each parameter.
6. 2. Examples of multiple testing
The testing of thick-wall weldments by ultrasonics and radiography"is a well-known example of multiple NDT usage. The use of thermal, radio-graphy and ultrasonics for inspecting canned reactor fuels has been widely documented.
One recently reported combination test, "CEBM", included corona dis-charge, eddy-current, beta-ray backscattering and micro-wave testing -all applied simultaneously when inspecting a composite structure [21]. Eâch NDT method was tailored to provide optimum information on such parameters as dimensions, dielectric constants and internal defects.
7. ELECTRONIC COMPONENTS AND SYSTEMS TESTING
7.1. Background
Any survey of present non-destructive test methods reveals one out-standing and seemingly self-imposed limitation - the almost total absorbtion in the detection of discontinuities and flaws in structural parts. Probably 90% of our testing costs are applied to structures, whereas considerable statistical evidence proves that the mechanical structures are inherently the most reliable parts of an over-all product, whether it be a reactor, aeroplane or automobile. The vast majority of failures of components and systems have occurred in those elements of the product for which non-destructive testing has been minimal, namely electronic and electromechanical com-ponents and sub-systems.
7.2. Prediction
A major re-evaluation of the use of non-destructive testing is underway to solve the very serious reliability problems of electronic components and entire systems. This is another major new field for the foreseeable future.

NEW FRONTIERS FOR NON-DESTRUCTIVE TESTING 295
7. 3. Examples of electronic NDT methods
Amplification systems: Many of the older NDT methods have been e x -tended to new sensitivities and capabilities in an attempt to provide better information on crit ical electronic components. For example, in-motion radiography of components at 30X to 50X with detail resolution of 10 (im is now feasible by using X-ray-sensit ive vidicon tubes. As shown in Fig. 4, the components are viewed on a 19-in closed-circuit television monitor. This method has demonstrated its effectiveness for the examination of tran-sistors and diodes, printed-circuit electronic assemblies, thin-wall weld-ments and brazed honeycomb structures [22]. A similar test method (cine-sonography), using ultrasonic imaging rather than radiography, was an -nounced recently [23] and is shown in F ig . 5.
Extension of present tests: Eddy-current tests have been used to locate butt welds in insulated electrical wiring that must be weld-free for critical system interconnections. Pulsed X - r a y systems have been packaged for safe use on the production line with Polaroid Type 52 film. Figure 6 shows a unit used for quality control testing of semiconductors and printed-circuit sub-assemblies.
Radio frequency fault detection: A new technique for locating incipient malfunctions and intermittent electronic faults in entire systems is being effectively used [24]. The technique is based on the discovery that imper -fections in solder joints and minute breaks or discontinuities in internal com-ponent connections generate a radio-frequency (FR) noise which is super -imposed on the regular power-supply voltage. Most of the RF energy occurs at 25 Mc, where it is 5 to 40 db higher than the steady-state background noise of the circuit. This RF noise method has been used to discover and screen out faulty components in a group of amplif ier-demodulator circuits which had successfully passed normal acceptance testing. The systems would have failed under exposure to mechanical and thermal shocks.
Infra-red detection: The use of infra-red surveillance testing of e l e c -tronic components from resistors to complete sub-systems is being rapidly expanded. The directness of this technique is a real advantage; see section 8. 7 for additional information.
Leak detection: Virtually all sealed components are now being non-destructively tested for seal integrity. Test methods range f rom simple a i r -pressure and soap-bubble tests to mass -spectrography testing with he l ium-gas t racers and to radioactive isotope testing; see sect ion 5. 5.
8. INFRA-RED AND MICRO-WAVE TESTING
8.1. Basis for prediction
Two exciting new fields for non-destructive testing, involving the use of infra-red and micro-wave techniques are in the early stages of develop-ment. The potential applications of these two methods (which are at the same stage of development as ultrasonics in 1942) for materials testing will affect almost everyone in the process industries.

296 D. W. BALLARD
Fig. 4
I n - m o t i o n radiography and high magni f i cat ions
F O C U S I N G A N D D E F L E C T I O N CIRCUITS
P I E Z O E L E C T R I C
T A R G E T OF
PICKUP TUBE
Fig. 5
C ine - sonography test se t -up
As shown in Fig. 7, micro-waves and infra-red occupy the electromag-netic spectrum at frequencies between those of radio waves and visible light. Thirty years ago, this portion of the spectrum was mostly regarded as a curiosity, studied by a few individuals in the USA and Europe. During World

NEW FRONTIERS FOR NON-DESTRUCTIVE TESTING 297
Fig. 6
Portable radiographic system using polaroid f i l m
F R E Q U E N C Y ( c p s ) , . 3 5 7 9 10 10 10
11 RADIO I
LWAVEJ5 _ '
Ю11 1013 1015 Ю17 1019 1021 1023 1025
. — ' - - . у — M N F R A l ' ' U L T R A -' RED ! ¿¡VIOLET!
I _J ., В f x - R A Y S l L <--,
'MICRO ' ¡WAVES J
" A M M A ; AYS
10° 10"2 10"A 10~6
Щ - .
10"8 10"10 10"12 10"M 10"16 ГТ
10" 10
WAVE LENGTH (METERS) Fig. 7
E lec t romagnet i c spectrum
War II, micro-wave technology expanded enormously in the development of radar and telemetry. More recently, attention has been focused on the use of micro-waves and infra-red for the non-destructive testing of m a -terials and components.
8.2. Micro-wave testing
Common micro-wave test procedure is to direct a narrow beam of micro-waves - 10 Gc is a popular test frequency - at the test object and,

298 D. W. BALLARD
with suitable instrumentation, analyse the reflected beam for information regarding the material parameter for which the test was designed.
8. 3. Materials for micro-wave testing
Essentially all solid and liquid non-metals can be tested, e.g. plastics, ceramics, rubber, fibreglass, wood, petroleum etc. Information about the structure, composition, physical properties, moisture content, thickness and other dimensions can be obtained. Under certain conditions, micro-waves may also be used for flaw detection [25].
8. 4. Micro-wave thickness testing
While it is beyond the scope of this paper to discuss all the possible applications of micro-waves, one example will demonstrate the versatility of this new NDT method. A typical micro-wave thickness gauge for a non-metallic application is shown in Fig. 8. This set-up operates on the through-transmission principle. Similar thickness gauges can operate on the pulse-reflection principles. It is interesting to note that while all metals are opaque to micro-waves, metal-thickness gauging may develop into one of the most important applications for micro-waves. This anomalous appli-cation depends on the use of two sensing heads which beam micro-waves from set distances apart to the metal sheet being measured. Standing wave patterns are produced by the reflections. The instrumentations measure both the path lengths of the standing waves, add: them electronically and then subtract them from the known total distance between the two sensing heads. The difference is the thickness of the piece of metal.
8. 5. Advantages of micro-wave testing
The micro-wave thickness gauges described offer six decided advantages, namely:
Wide range: A single gauge can cover a thickness range from a fraction of a millimetre to 25 cm or more.
Constant accuracy: Accuracy is riot dependent on thickness - a 25-cm plate can be measured to the same over-all accuracy as one which is only a millimetre thick.
Variety of metals: Metals of all types can be gauged with the same in-strumentation since micro-waves do not penetrate the metal.
Safety: Micro-wave radiation at the level used (mW) is harmless. Instant response: Response speed is essentially instantaneous with the
ability to record chatter even at material speeds of 5000 ft/min. Adaptive control: Micro-wave gauges are readily adaptable to auto-
matic process control which will be so vital on future production lines.
8. 6. Extent of prediction
In the foreseeable future,, micro-waves may control some part of the manufacture and inspection, not only of critical materials such as those used
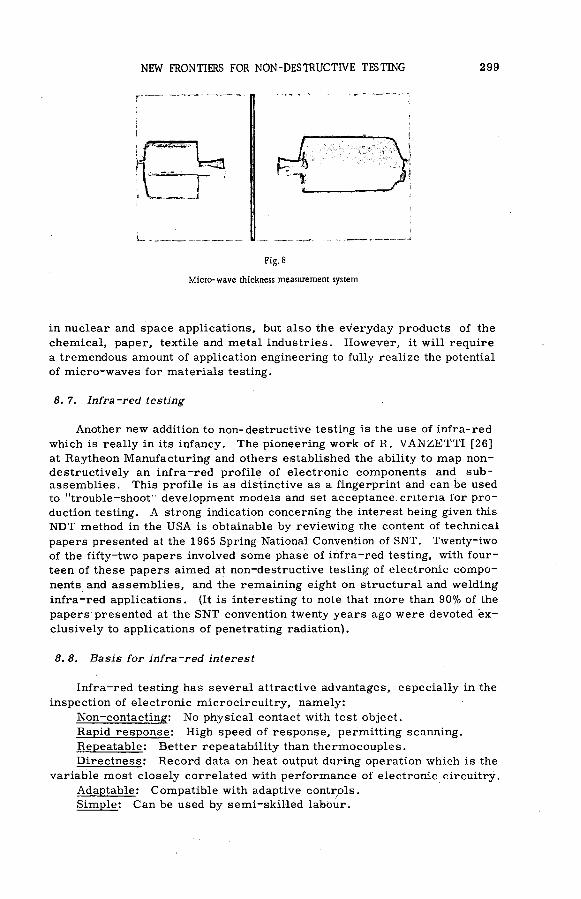
NEW FRONTIERS FOR NON-DESTRUCTIVE TESTING 299
L
Fig. 8
Micro- wave thickness measurement system
in nuclear and space applications, but also the everyday products of the chemical, paper, textile and metal industries. However, it will require a tremendous amount of application engineering to fully realize the potential of micro-waves for materials testing.
8. 7. Infra-red testing
Another new addition to non-destructive testing is the use of infra-red which is really in its infancy. The pioneering work of R. VANZETTI [26] at Raytheon Manufacturing and others established the ability to map non-destructively an infra-red prof i le of e lectronic components and sub-assemblies. This profi le is as distinctive as a fingerprint and can be used to "trouble-shoot" development models and set acceptance criteria for p r o -duction testing. A strong indication concerning the interest being given this NDT method in the USA is obtainable by reviewing the content of technical papers presented at the 1965 Spring National Convention of SNT. Twenty-two of the fifty-two papers involved some phase of infra-red testing, with four-teen of these papers aimed at non-destructive testing of electronic compo-nents and assembl ies , and the remaining eight on structural and welding infra-red applications. (It is interesting to note that more than 90% of the papers presented at the SNT convention twenty years ago were devoted e x -clusively to applications of penetrating radiation).
8.8. Basis for infra-red interest
Infra-red testing has several attractive advantages, especially in the inspection of electronic microc ircuitry , namely:
Non-contacting: No physical contact with test object. Rapid response: High speed of response, permitting scanning. Repeatable: Better repeatability than thermocouples. Directness: Record data on heat output during operation which is the
variable most closely correlated with performance of electronic circuitry. Adaptable: Compatible with adaptive contrpls. Simple: Can be used by semi-skil led labour.
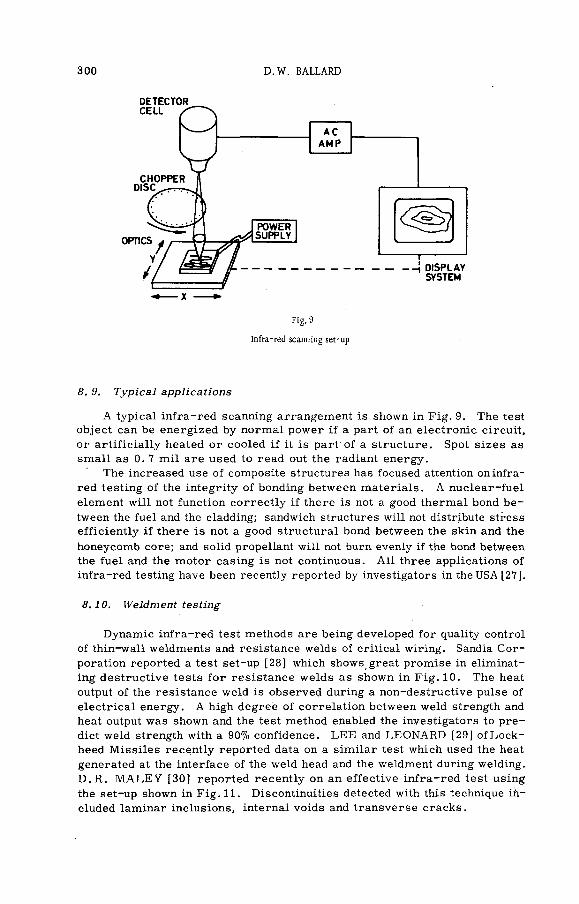
300 D. W. BALLARD
DETECTOR CELL
AC A M P
OP
DISPLAY SYSTEM
Fig. 9
Infra-red scanning set-up
8. 9. Typical applications
A typical infra-red scanning arrangement is shown in Fig. 9. The test object can be energized by normal power if a part of an electronic circuit, or artif icially heated or cooled if it is part of a structure. Spot s izes as small as 0. 7 mil are used to read out the radiant energy.
The increased use of composite structures has focused attention on infra-red testing of the integrity of bonding between materials . A nuclear-fuel element will not function correct ly if there is not a good thermal bond b e -tween the fuel and the cladding; sandwich structures will not distribute stress efficiently if there is not a good structural bond between the skin and the honeycomb core; and solid propellant will not burn evenly if the bond between the fuel and the motor casing is not continuous. All three applications of infra-red testing have been recently reported by investigators in the USA [27].
8.10. Weidment testing
Dynamic infra-red test methods are being developed for quality control of thin-wall weldments and resistance welds of critical wiring. Sandia C o r -poration reported a test set-up [28] which shows great promise in eliminat-ing destructive tests f or resistance welds as shown in F ig . 10. The heat output of the resistance weld is observed during a non-destructive pulse of electrical energy. A high degree of correlation between weld strength and heat output was shown and the test method enabled the investigators to p r e -dict weld strength with a 90% confidence. LEE and LEONARD [29] o f L o c k -heed Missi les recently reported data on a similar test which used the heat generated at the interface of the weld head and the weidment during welding. D . R . MALEY [30] reported recently on an effective in fra-red test using the set-up shown in Fig. 11. Discontinuities detected with this technique in-cluded laminar inclusions, internal voids and transverse cracks.

NEW FRONTIERS FOR NON-DESTRUCTIVE TESTING 301
Fig. 10
Set-up for infra-red testing of microwelds
-4 X
Fig. 11
Scan heat technique
8.11. Infra-red fibre optics
Infra-red transmitting glass fibres are being actively investigated. The piping of heat indications without l osses f r om deep inside a sealed or e n -capsulated component would open new vistas for quality control and s u r -veillance. Fibres transmitting infra-red in the 6 to 1 0 - д т frequency (25°C to 225°C) have defied fabrication so far, although some success has been reported by American Optical Company [31] and Simms of Optics Technology [32] with arsenic tri -sulphide glass (AS2S3). Additional significant i m -
302 D. W. BALLARD
provements in usable infra-red light pipes are anticipated in the not-tcra-distant future.
CONCLUSION
Today's pressing demands for higher product reliability make it i m -perative that the most effective test methods be used throughout the product-development cycle. Tomorrow's increasing demands will make it mandatory. Each of the six predicted new frontiers for non-destructive testing discussed in this paper present unique opportunities for increasing our contributions to product reliability in the nuclear age.
R E F E R E N C E S
[1] Time Magazine, 81, No. 26, p. 77. [2] McMASTER, R C . , "Nondestructive Testing", Proc. ASTM (1952) 52. [3] SHARPE, R.S., "Nondestructive Testing in Perspective", Brit.J. non-destr. Test. 5, N0.3 (1963) 83-89. [4] JUDGE, John F., "Nondestructive Testing Fundamental to Advanced Materials Development", Missiles
and Rockets Magazine, February 22 (1965) 27-32. [5] PAPADATIS, E. P., "Ultrasonic Nondestructive Test for the Detection of Improper Heat Treatment of
Steel, Materials Evaluation XXIII. No. 3. (1965) 136-139. [6] PETERS, B.F., "Radiography for Corrosion Evaluation", Materials Evaluation XXIII, No.3 (1965) 129-135. [7] LOCKYER, G.E., "Evaluafion of a Resin-Ceramic Heat-Shield Material by Ultrasonic Methods", Materials
Evaluation, XXIII, No. 3 (1965) 144-148. [8] Branson Instruments Bulletin 4-101, "Ultrasonic Hardness Tester", U.S. Patent 3153338, March (1965). [9] Ref. [3] . p. 85
[10] Ref. [3], p. 84 [11] Ref. [4], p. 30 [12] BALLARD, D. W. , "Nondestructive Testing's Role in Reliability Programs", Proc. 11th Nat. Symp. on
Reliability and Quality Control, January 12-14 (1965) IEEE. [13] Ref. [2] pp 8-9 . [14] THOMAS, W.E., "An Analytic Approach to Penetrant Performance", Proc. 4th Int. Conf. Nondestructive
Testing, September (1963) 1-15. [15] ARMSTRONG, J. H. , "A Stroboscopic X-Ray Photographic System Undergoing Evaluation", SpringCon-
vention of SNT, February (1965). [16] KING, J. G . , "Production Leak Testing of Large Pressure Vessels", 1961 Tran. of the Eighth Vacuum
Symp. and Second Int. Cong. (1961) 1100-1105. [17] Ref. [12], pp 8-9 . [18] ARNOLD, V. E., "Accelerated Testing for Humidity Resistance of Paint Films - A Nondestructive Method",
Sandia Report SC-TM-64-1656, February (1965). [19] HAGEMAIER, D.J. , "Cinefluorography of Small Ablative Thrust Chambers During Hot Firing", Spring
Convention of SNT, February (1965). [20] COLLINS, D.J . , Evaluation of Infrared for Integrated Circuit Reliability by Detection and Rejection
of Potential Early Failures", Spring Convention of SNT, February (1965). [21] Plastics Design and Processing, September (1963). [22] McMASTER, R .C . , "New Techniques in Aerospace Nondestructive Testing", 1963 Annual Air Transport
Association Engineering and Maintenance Conference, Washington, D . C . , October 30 (1963) [23] JACOBS, J. E., BERGER, H. and COLUS, W.J., "An Evaluation of an Ultrasonic Inspection System Employ-
ing Television Techniques, 1У63 SNT .National Convention, Cleveland, Ohio, October (1963). L24] MAKI, C.E. and HAGERT, F.W. , "Radio Frequency Fault Detection Techniques", 1963 SNT National
Convention, Cleveland, Ohio, October (1963). [25] HOCHSCHELD, R., "Principles and Applications of Microwaves in Materials Testing", Fall Convention
of SNT, October (1964).

NEW FRONTIERS FOR NON-DESTRUCTIVE TESTING 303
126] VANZETTI, R., "Infrared-Another .Medium of Evaluation", Quality Assurance 2, No. 12 (1963) 25-28. [27] McGONNACLE, W. and PARK, F., "Nondestructive Testing". Materials Evaluation XXII, No. 12 (1964)
561-574. [28] KLAMERUS, L.J., "Development of a Nondestructive Test for Resistance Welds", Spring Convention
of SNT, March (1964). [29] LEE, J. K.S. and LEONARD, S., "Evaluation of the Resistance Micro-welding Process by Infrared Energy
Measurements", Spring Convention of SNT, February (1965). [30] MALEY, D.R., "Two Thermal Nondestructive Testing Techniques", Spring Convention of SNT, February
(1965). [31] EISNER, L., "Infrared: What's Ahead", Electron. Products, 7, No. 9, (1965) p.F23. [32] SIMMS, J., "Infrared Fiber Optics and Infrared Nondestructive Testing", Spring Convention of SNT,
February (1965).
DISCUSSION
C .A . MANN: Is the use of the concept of redundancy not an alternative to the search for 100% reliability, which is strictly unattainable?
D. BALLARD: Yes, in fact we are using redundancy a good deal in our electronics now just because of the electronics ''reliability problem". This solution may not be acceptable for aerospace components because of the weight problem.
R.S. SHARPE: When introducing new non-destructive testing equip-ment, one must be careful to ensure that its characteristics and capabilities are well known to those who have to use it and interpret the results.
The ultrasonic hardness tester may lead to ambiguity, now that it is possible to measure hardnesses over such small areas of surface.
D. BALLARD: I agree, but should like to point out that care should be exercised in this respect in all hardness testing, since we can only sample the area being tested.
P. de MEESTER: I have been most impressed by the wide new frontiers you have described, and feel in the light of what we have heard that inter-national meetings such as the present one will become increasingly neces-sary in order to co-ordinate effort.
It seems in fact highly desirable to bring production people, quality control experts and reactor operators together to discuss points such as the type and nature of specifications (too many aspects are unknown and may be over-stressed), what tests are necessary and sufficient, and what ac -curacy is required. An extensive international programme on the irradi-ation of defective or suspect fuel elements might prove useful in this respect.


SESSION VIII
20


MEASUREMENT OF INTERNAL FRICTION ON NUCLEAR MATERIALS
R . R . H A S I G U T I , N . I G A T A A N D R . T O N O M A E
U N I V E R S I T Y O F T O K Y O
A N D
Y . N A K A M U R A , N . S A S A O A N D K . D O M O T O ,
T O K A I , R E F I N E R Y , A T O M I C F U E L C O R P O R A T I O N , J A P A N
A b s t r a c t — R é s u m é — А н н о т а ц и я — R e s u m e n
MEASUREMENT OF INTERNAL FRICTION ON NUCLEAR MATERIALS. The internal friction measurement is applicable to the inspection of metallic uranium, uranium-diodixe pellets and zirconium alloys. This is because of its great sensitivity to the concentration of point defects and impurity atoms, to the density of dis-locations and also to the micro-structure of crystals.
We found a relaxation peak at about lOO'C from internal friction measurements of as-cast uranium, at various temperatures with free decaying method. The peak height increases by quenching and decreases by annealing after quenching. The peak temperature is almost the same in commercial and in high-purity uranium, but it shifts a little to higher temperature by the addition of a small amount of aluminium, and much more by the addition of 1% molybdenum.
The amplitude dependent internal friction of uranium was also measured. As the Granato-LUcke relation is satisfied in this case, we can calculate the dislocation density and the dislocation loop length. These quanti-ties were obtained, as the uranium specimens were cold-rolled, annealed and quenched.
The internal friction measurements of U02 pellets were performed using ultrasonic attenuation in the region of maximum concentration. From the temperature dependence of internal friction, a new relaxation peak was observed at low temperatures.
In the measurements on zirconium alloys, the snoek peak of hydrogen was found. Above are some examples which are applicable to the inspection of nuclear materials, and now we
intend to apply these methods to the study of the structural changes of irradiated or fission-damaged materials.
MESURE DE LA FRICTION INTERNE DANS LES MATIERES NUCLEAIRES. La mesure de la friction interne intervient dans Г inspection de l'uranium métallique, des pastilles en bioxyde d'uranium et des álliages de zirconium, en raison de sa grande sensibilité â la concentration des défauts ponctuels et des impuretés, 3 la densité des dislocations et à la microstructure des cristaux.
Au cours de mesures de la friction interne dans des spécimens d'uranium moulé, â différentes températures, par la méthode de la libre désintégration, les auteurs ont observé un pic de relaxation aux alentours de 100'C. La hauteur du pic augmente après la trempe et diminue si la trempe est suivie d'un recuit. La température de pic est pratiquement la même pour l'uranium de pureté commerciale et l'uranium de pureté nucléaire, mais elle augmente légèrement après addition d'une petite quantité d'aluminium et augmente plus sensiblement après addition de 1% de molybdène.
Les auteurs ont également mesuré la friction interne de l'uranium en fonction de l'amplitude. Etant donné que dans ce cas la relation de Granato-Liicke est satisfaite, on peut calculer la densité de dislocation et la longueur de la boucle de dislocation. Ils ont obtenu ces données avec de l'uranium laminé à froid, recuit et trempé.
La friction interne de pastilles de IIO? a été mesurée par la méthode de l'atténuation des ultrasons dans la région de la concentration maximum. En faisant varier la température, on a observé un nouveau pic de relaxation à basse température.
En effectuant des mesures sur des alliages de zirconium, on a observé un pic secondaire pour l'hydrogène. Les auteurs donnent quelques exemples d'applications au contrôle de matières nucléaires. Ils se proposent
d'appliquer les mêmes méthodes à l'étude des changements de structure dans les matières irradiées ou endom-magées par la fission.
307

308 R. R. HASIGUTI et al.
ИЗМЕРЕНИЕ ВНУТРЕННЕГО ТРЕНИЯ В ЯДЕРНЫХ М А Т Е Р И А Л А Х . Измерение внут-реннего тренчя можно использовать для прверки металлического урана, таблеток из двуоки-си урана и циркониевых с п л а в о в . Э т о объясняется е г о большой ч у в с т в и т е л ь н о с т ь ю к кон-центрации точечных д е ф е к т о в и а т о м о в примесей , к плотности дислокаций, а также к микро -структурам кристаллов .
Обнаружен п.'к релаксации примерно в точке 100" С путем измерения внутреннего трения кованого урана при различных температурах м е т о д о м свободного , затухания. В ы с о т а пика увеличивалась при закалке и уменьшалась при отжиге после закалки. Пиковая температура почти одинакова для промышленного урана и урана высокой чистоты , но она сдвигается н е м -н о г о в с т о р о н у увеличения при добавлении небольшого количества алюминия и значительно сильнее сдвигает ся при добавлении одного процента молибдена.
Было также измерено зависящее от амплитуды внутреннее трение урана. Поскольку для данного случая подходит отношение Г р а н а т о - Л у к е , мы можем р а с с ч и т ы в а т ь плотность дислокации и длину петли дислокации. Эти характеристики были получены после х о л о д -ной прокатки, о т ж и г а и закалки образца урана .
Для измерения внутреннего трения таблеток из TJOç оыло и с п о л ь з о в а н о о слаоление ультразвука в мегагерцевой области . На основании температурной зависимости внутренне-г о трения был получен новый пик релаксации при низких температурах .
Выше мы привели несколько примеров, которые м о г у т быть использованы для провер -ки ядерных материалов , а теперь мы намереваемся использовать эти м е т о д ы для изучения структурных изменений в облученных или поврежденных делением материалах .
MEDIDA DE LA FRICCION INTERNA EN MATERIALES NUCLEARES. El procedimiento de medida de la fricción interna es utilizable para la inspección del uranio metálico, pastillas de dióxido de uranio y aleaciones de circonio, debido a su gran sensibilidad a la concentración de defectos puntiformes y átomos impureza, a la densidad de las dislocaciones y a la microestructura cristalina.
Midiendo a varias temperaturas por el método de la atenuación libre la fricción interna del uranio fun-dido, el máximo de relajación se encontró a 100'C. Ese máximo aumenta por enfriamiento y disminuye por recocido ulterior. La temperatura máxima es casi la misma en el uranio comercial que en el de alta pureza, pero aumenta ligeramente añadiendo aluminio en baja proporción y mucho más si se agrega 1% de molibdeno.
También se ha medido la fricción interna del uranio, que depende de la amplitud. Como en ese caso se cumple la relación de Granato-Lücke, puede calcularse la densidad de la dislocación y la longitud de ciclo de la misma. Esas cifras se obtuvieron al laminar en frfo, recocer y enfriar bruscamente probetas de uranio.
La medida de la fricción interna de las pastillas de U02 se efectuó mediante atenuación ultrasónica en la banda del megaciclo. Como la fricción interna depende de la temperatura, pudo observarse un nuevo máximo de relajación a baja temperatura.
En la medida de aleaciones de circonio se halló un máximo correspondiente al hidrógeno. Se han citado algunos ejemplos aplicables a la inspección de materiales nucleares, y ahora se procura
aplicar los métodos correspondientes al estudio de las alteraciones estructurales del material irradiado o dañado por fisión.
1. INTRODUCTION
Most nuclear materials are used under irradiation. As the irradiation effect itself is an atomic process , the inspection of the atomic structure becomes very important, apart from the ordinary inspection methods. Re-cently much development has been made in the field of internal friction stu-dies. The authors tried to develop its application to non-destructive testing because of its great sensitivity to failure in the atomic structure, for in-stance, minor interstitial solute impurity atoms, point defects or disloca-tions, and also because of the possibility it gives of measuring the elastic module and yield stresses very accurately, which are directly connected to the mechanical properties of materials. This method would become in-

MEASUREMENT OF INTERNAL FRICTION 309
creasingly important as the physical meaning of the atomic structure to the strength of materials becomes clear.
2. EXPERIMENTAL METHOD AND SPECIMEN
In the internal friction measurements different kinds of apparatus are now developed in accordance with the required temperature ranges, f r e -quency and strain amplitude. Among these the authors used two kinds, i. e. the automatic measurement apparatus for transverse (or longitudinal) v i -bration and the "ultrasonic comparator" of the pulse-echo method. A block diagram of these is shown in Figs . 1 and 2.
Driv ing
e lectrode
F i g . l
Block diagram of internal-friction measurement apparatus of transverse vibration method
In Fig. 1 the specimen is supported with thin metallic wires on the two nodal points so as to vibrate in the fundamental mode. An electrostatic method is used* for driving and detecting the vibration. The control of the strain amplitude is performed with the attenuater. The counter circuit is driven with the timer for measuring the resonant frequency f o, and with the reference voltage for measuring the half-decay wave-numbers, n. Young's modulus E and internal friction Д of the specimen are derived from the following equations:
/ \ 3
E = 0. 96535 X 10"8 ( ^ j I (kg /mm 2 ) (1)
and
Д = in2 /n , (2)
* In the larger strain amplitude region, an electro-magnetic method is used.

310 R. R. HASIGUTI et al.
where i , a and b are the specimen length, thickness and width, respectively, and g is the weight of the specimen.
In Fig. 2, a quartz crystal is attached with silcone grease to the speci-men. The sound waves are transferred to the specimen using the piezo-electricity of the quartz. A multi-pulse echo can be detected through the same quartz. The sound velocity v is measured from the interval of the multi-reflected echo on the cathode-ray tube. The attenuation a is measured
Fig. 2
Block diagram of "ultrasonic comparator"
from the exponential decay curve of the multi-reflected echo. Young's mo-dulus E and internal friction Д are obtained from the following equations for the isotropic materials:
2 (1 + g) (1 - 2o) „ 2 . ,„. E = vep = 2vt p ( l+f f )p (3)
and
A = aX = ffv/f, (4)
where v e is the sound velocity of longitudinal wave (in the case of X-cut quartz), vt is that of transverse wave (in the case of Y-cut quartz), p is the density, g is the Poisson's ratio, X is the wave-length, f is the frequency of sound wave and a is expressed by the following equations:
<* = l0g ( ¿ È nePer/cm = 2(S^ji l0g10 ( i £ ) d b / c m ' (5)
where An and A m are the pulse height of nth and mth reflected waves respectively.

MEASUREMENT OF INTERNAL FRICTION 311
Temperature dependence is measured, in both methods, in the cryostat between room temperature and liquid-nitrogen temperature, in a vacuum of 10-3-10-4 mm Hg. The strain amplitude е т а х is calculated by using the Eq. (6) from the vibrational amplitude h, which is calibrated by the detector circuit (Fig. 1), or by an optical microscope,
- !R\ Cmax- 4jC2 '
where d and i are the thickness and length of the specimen. Frequency deT
pendence is measured using higher harmonics of the sound wave induced in the quartz crystal.
Nuclear materials, which were measured, are uranium, uranium alloys, UO2 and Zircaloy-2 , whose compositions are shown in Table I. The spe-cimen sizes, the type of internal friction and the methods and ranges of the measurements are summarized in Table II. •
3. SIGNIFICANCE OF THE EXPERIMENTS
Internal friction is phénoménologie ally divided into three categories, i . e . relaxation, resonance and hysteresis. The internal friction due to re-r laxation is expressed by the following equation:
where T is the relaxation time, w is the angular frequency of vibration. When the relaxation is assisted by a thermally activated process , for instance with atomic diffusion or dislocation motion over the barriers, it is written by the Arrhenius equation as follows:
T = т0 exp H/kT, (8)
where H is the activation energy of the process and к is Boltzman's constant. Thus, the relaxation peak is observed in the temperature dependence of the internal friction. As WT = 1 must be satisfied at the peak maximum, the activation energy of the peak process is obtained from the peak shift from Ti to T2 using Eq. (9), if the measurements are performed at two ' f re -quencies, wj and w2 :
The mechanism of a relaxation can be identified from the activation energy, the time constant т in Eq. (8) and/or the behaviour of the peák.' When'the mechanism is clarified, we understand the atomic behaviour of impurities or the crystal defects in the materials. From thé relaxátion measurement,

312 R. R. HASIGUTI et al.
TABLE I
COMPOSITIONS OF MATERIALS USED
Materials Treatment Compositions (Impurities (ppm))
Ni: 27, A l : 13, С : 50, Fe: 45, N: 10 , U I Derby
Si: 8 , Cu: 3 , Сг: 8, Mn: 3 , H: 9
N: 67 , Al : 12, С: 605, Fe: 160, Si: 39, и П Ingot
Cu: 55, Сг: 8, Mn: 3 .5 , H: 6.8
Ag: < 0 . 2 , Al : 12, В: < 0 . 1 , Cd: < 1 . 2 ,
• Cr: < 8 , Cu: < 3 , Fe: 62 , Mn: < 3 , Mg: < 2 и Ш Derby
Ni: 11, Si: < 1 0 , V: < 1 0 , Zn: < 10, C: 152,
N: 26
Ag : <0 .2 , Al : < 1 0 , B: < 0 . 1 , Cd: < 0 . 2 ,
Cr: < 8 , Cu: 4 , Fe: 74, Mn: < 3 , Mg: < 2 . U IV Rolled
Ni: 13, Si: 27 , V: < 1 0 , Zn: < 1 0 , C: 700,
N: 30
U - M o I as-cast Mo 1 .2 wt.%
U - M o II as-cast Mo 4.5 wt.
Pellets Ag : < 0 . 2 , Al : 48 , B: 0 . 1 3 , Cd: < 0 . 2 , Со: < 5 ,
U O j Sintered Cr: < 8 , Cu: < 3 , Fe: < 1 0 , Mg: 4 , Mn: 3 ,
(I and II) O /U = 2 .016 Ni: < 1 0 , Si: 10, V: < 1 0 , Zn: < 5 0 , Ca: 10
p = 10.55 Cl : < 5 , N: 7
Rolled Sn: 1 .40 wt .% , Fe: 0 .119 wt.^o, Cr: 0 .112 wt.fo.
Zi i ca l oy -2 and Ni: 0 .063 wt. <7°, Al : 68, C: 20 , Hf: 57, N: 21 ,
annealed Sample: I H : 100
Sample II H : 300
important information is received about the diffusion constant, the solubility limit and the content of minor solute impurity atoms or point defects, and further the barriers of dislocation motion which have direct connections to the mechanical properties of the materials.
•Now the internal friction due to hysteresis, which is observed in amplitude-dependent internal friction, comes from the hysteresis motion

TABLE II
SPECIMEN SIZES, TYPES OF INTERNAL FRICTION, METHODS AND RANGES OF THE MEASUREMENTS
Materials Specimen size •Type of internal
Type of method Range
Materials (mm) friction
Type of method .Temperature Frequency Amplitude
U I U II
2.5 X 10 .0 X 110.0 relaxation transverse vibration
room-temp. ~ 3 0 0 ° C
600 ~700 Hz
~ i o ; 7
U III U IV
ibid. hysteresis ibid. room - temp. ~700 Hz 10" 6
~ 5 X 1 0 " 4
U - M o I U - M o II ibid. relaxation ibid.
room - temp. ~ 3 0 0 ° C
600 ~700 Hz
~ 1 0 " 7
uo 2
diam. : ' 12 .50
length : 10.380
relaxation
reasonance
pulse-echo method
room - temp. ~ - 1 9 0 ° C room - t e m p .
5 ~ 35 Mc ~ 1 0 " 6
Zirca loy -2 relaxation
hysteresis
transverse vibration
room - temp. 190 °C
room - temp. ~ 500 Hz 1 0 " 5 - 1 0 " 3
S 52
s ra z H о "Ч Z H га
S n H о z
u H* со

314 R. R. HASIGUTI et al.
of dislocations. The crit ical s tress amplitude, at which internal friction begins to increase, gives the microscopic yield-point. The amplitude-dependent internal friction AH was analysed by GRANATO and LUCKE [1] with the string model of dislocations and some more assumptions. Accord-ing to the Granato-Lücke theory Eq. (10) is derived:
ÍÍALN Ktja f-Kr)a\ А н = Tí i f • I Ü ; • e x p f e r > <10)
where Д н is amplitude-dependent part of Д, and Q is the orientation factor, Л is the dislocation density, L c is the mean length of dislocation segments pinned with impurity atoms or point defects, LN is the length between nodes of dislocation network, К is the strength for unpinning, r¡ is the misfit factor of pinning atoms or point defects, a is the inter-atomic distance, and e0 is the strain amplitude. Eq. (10) shows
a e
o1
• (11)
When Eq. (11) (Granato-Lücke relation) is satisfied, we can obtain the information on the dislocation density, the dislocation loop length or the pin-ning of dislocation which are directly connected with the pre-yield process [2] and the yield process .
Finally, the internal friction due to resonance Ai is expressed by the following equation:
¿ ' : A » 1 + U2T2 . (12)
where тг is the constant for the resonance mechanism. This can be measured in the frequency-dependent internal friction. Granato and Lücke also analysed the resonance damping of dislocations assuming the string-like motions of dislocation segments pinned down with impurity atoms o r point defects. When the frequency at Д т а х is denoted by u r , in the region of id <=C ur , the Eq. (13) is derived:
(13)
where the notations Q, Л and L c are the same as in Eq. (10), ti is the constant which is determined f rom the distribution of dislocation loop-lengths, В is the frictional constant, and С is the force constant of line tension of dislo-cations. Eq. (13) shows that
Д oc w. (14)
This relation is very important in the interpretation of internal friction. When Eq. (14) is satisfied, information is obtained on the dislocation density, the dislocation loop-length and the frictional force of dislocations under some

MEASUREMENT OF INTERNAL FRICTION 315
assumptions, which are also directly connected to the pre -y ie ld p r o c e s s and the yield p r o c e s s .
Thus,from the atomic standpoint, information is obtained on impurity atoms, point defects or dislocations from the measurements of internal fr ic -tion. This is why this method is powerful f or the non-destructive testing of nuclear materials .
The correlation between the atomic structure and the irradiation effects such as swelling, irradiation growth, irradiation creep, irradiation brittle-ness and release of f ission-gas products is the most important problem to be solved in the future.
4. EXPERIMENTAL RESULTS AND DISCUSSIONS
Uranium and uranium alloys
(a) Relaxation
The temperature dependence of the internal friction of U I, U II, U-Mo I and U-Mo II specimens are observed between room temperature and 300°C. Figure 3 shows the result on U I after the treatments of /3-quenching and
Д X ICf3
4 . 0
С 600 °C 5 h>- 10"3mm Hg ) (4) Quenching ( 3 ) from Beta.
П) Derb>
(2) Derby — Beta Quench
(3) Derby —Beta Quench — Anneal С ftnn°P SU» 1П"3 UUl
3 . 0 r e g i o n s . (2)
2.0
1.0
0 100 ) 200
"" temperature
300 CC)
Fig.3
Temperature dependence of internal friction of U I before and after 8-quenching

316 R. R. HASIGUTI et al.
annealing. The peak is reached around 100°C and it is found that this peak is independent of strain amplitude. The peak height increases with J3-quenching and decreases with annealing at 600°C. Figure 4 shows the effect of successive a?-quenching after /З-quenching. The peak height increases
450'C
"" temperature Fig. 4
Temperature dependence of internal friction of U I a-quenched after 8 -quenching
with the quenching temperature. The change of the peak height by succes-sive a-quenching following /З-quenching is shown in Fig. 5. The height de-creases with time and seems to saturate. The straining of 1-3% before and after a-quenching does not affect the peak height, and the peak does not ap-pear by the straining of annealed specimens.
With U II the peak height is larger than with Ü I after the same treat-ment. The peak temperature shifts with the vibrational frequency. The activation energy, that is obtained from the peak shift, is 21 kcal/mol, which is about half that of self-diffusion, and the frequency factor is about 1014/s. The effect of hydrogen on this peak was investigated, but the result showed

MEASUREMENT OF INTERNAL FRICTION 317
Fig. 5
Temperature dependence of internal friction of U II S-quenched and successive a-quenching
that the peak behaviour was independent of hydrogen content. From the above results, the mechanism of this peak would be the diffusion of interstitial impurity atoms, of which the solute concentration would be changed by or-quenching.
With U-Mo I and U-Mo II a similar peak is observed at a little higher temperature as shown in Figs. 6 and 7. When the specimens are quenched from 800°C, no peak was found between room temperature and about 400°C, instead of which the rise of internal friction was observed near room temperature in the case of U-Mo I, and near room temperature and 220°C in the case of U-Mo II.
(b) Hysteresis
The amplitude dependence of internal friction is observed between the strain amplitudes of 10"6 and 5X10"4 on the specimens of U III and U IV under

Fig. 6
Temperature dependence of internal friction of U-Mo I as cast
oo
0 100 200 300 400
t t temperature
Fig. 7
.Temperature dependence of internal friction of U-Mo II as cast

MEASUREMENT OF INTERNAL FRICTION 319
various conditions of straining, annealing and quenching. These results are shown in Figs. 8, 9 and 10.
The break-away strain increases with the degree of cold-work, and upon annealing and quenching it increases a little at a low annealing temperature
strain amplitude 6
Fig. 8
Amplitude dependence of internal friction of U III before and after cold-work
and decreases as the annealing or quenching temperature becomes higher. As the Granato-Lücke relation, viz. Eq. (11), is satisfied, dislocation den-sities and dislocation loop-lengths L c are obtained from Eq. (10), assuming the values of constant f¿, К and r¡. The number of pinning points along dis-location lines is also calculated from dislocation densities and dislocation loop-lengths L c . These values are shown in Figs. 11-13, corresponding to Figs. 8-10 respectively. Dislocation densities increase with the degree of cold-work and decrease with annealing or quenching temperature except for
quenching. Dislocation loop-length decreases with the degree of cold-work, but both on annealing and quenching it decreases a little at about 200°C and increases at higher temperatures. The decreases of dislocation loop-length corresponds to the increase of the break-away strain in both annealing and quenching. This is an example of low-temperature hardening. The num-ber of pinning points along dislocations increases with the degree of cold-work, which shows the production of point defects in plastic deformation, and it recovers with annealing. That the number of pinning points rather decreases with the quenching temperature shows that the quenching is not complete owing to the low thermal diffusivity of uranium.

Д xKf1 15 -
2 200t 1 hr ANNEALINGСinlOmmHg) 3 300t 4 400°C « 5 500t *
0| 6 600t io~6 io"5 га4
S T R A I N A M P L I T U D E E
Fig. 9
Amplitude dependence of internal driction of U III before and after annealing
со to о
1 DERBY 2 QUENCHING FROM IOO'C 3 « 200'C 4 * 300'C 5 400°C 6 * 500°C
Holding time 30 min
5 °
Я > сл О G H
-L.
s t r a i n amplitude 6
Fig. 10
Amplitude dependence of internal friction of U IV before and after quenching
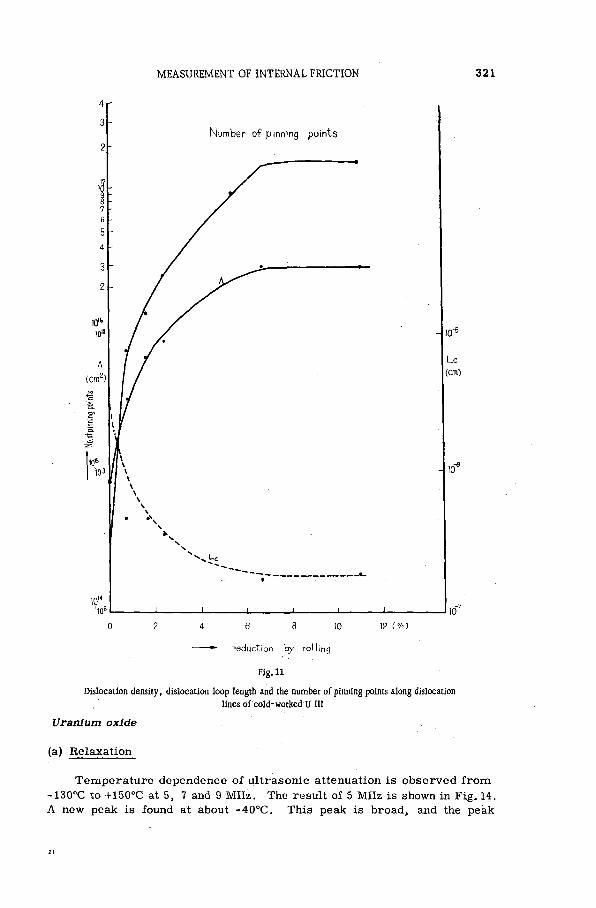
MEASUREMENT OF INTERNAL FRICTION 321
Dislocation density, dislocation loop length and the number of pinning points along dislocation lines of cold-worked U III
Uranium oxide
(a) Relaxation
Temperature dependence of ultrasonic attenuation is observed f r o m -130°C to +150°C at 5, 7 and 9 MHz. The result of 5 MHz is shown in Fig. 14. A new peak is found at about -40°C. This peak is broad, and the peak
21

3 2 2 R. R. HASIGUTI et a l .
Number of p inning p o i n t s
Annealing temperature G
Fig. 12
Dislocation density, dislocation loop length and the number of pinning points along dislocation lines of annealed U III
temperature is not observed clearly in some cases. Therefore, the activa-tion energy of this peak is not determined exactly, but seems to be below 0.1 eV. As the activation energy is very small and the frequency factor is smaller than the Debye frequency, the mechanism of this peak is not con-sidered to be due to the diffusion of any point defects including impurity atoms, but may be considered to be due to the dislocation relaxation such as that observed in magnesium oxide or in other metal oxides.
2 t *
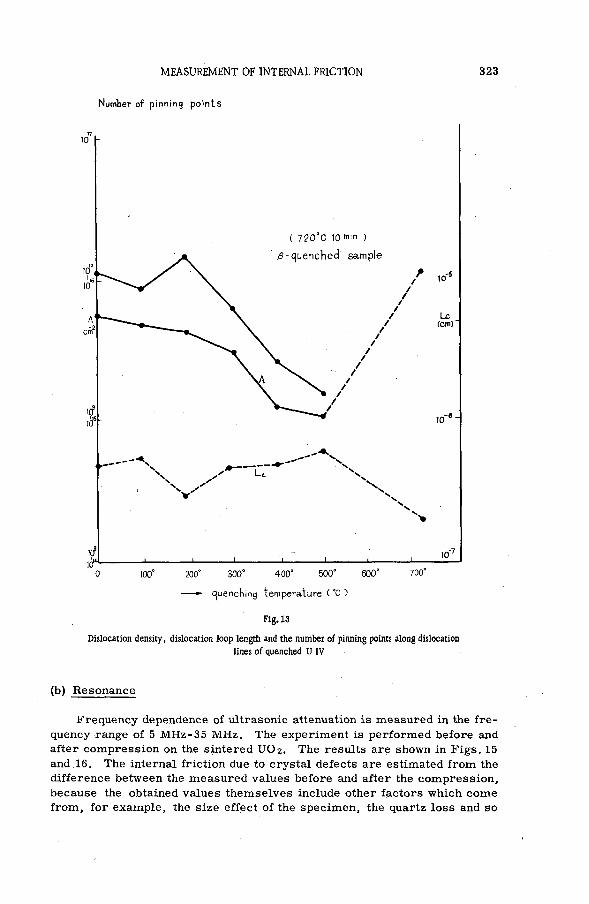
MEASUREMENT OF INTERNAL FRICTION 323
Number of pinning points
»• quenching temperature ( °C )
Fig. 13
Dislocation density, dislocation loop length and the number of pinning points along dislocation lines of quenched U IV
(b) Resonance
Frequency dependence of ultrasonic attenuation is measured in the fre -quency range of 5 MHz-35 MHz. The experiment is performed before and after compression on the sintered UO2. The results are shown in Figs. 15 and 16. The internal friction due to crystal defects are estimated from the difference between the measured values before and after the compression, because the obtained values themselves include other factors which come from, for example, the size effect of the specimen, the quartz loss and so

324 R. R. HASIGUTI et al.
5 Me
heating ra te IV/1.7 min
-100 -50 о
— t e m p e r a t u r e C°0)
Fig. 14 Temperature dependence of ultrasonic attenuation of U 0 2 1
on. This differential value is shown in Figs. 17 and 18, in which it is seen that the internal friction increases with the vibrational frequency, overlapped by the peak around 15 MHz, which is interpretated as the relaxation peak observed at -40°C at 5 MHz (Fig. 15). In Fig. 18 the over-damped region (the decrease of internal friction with the vibrational frequency) was ob-served as with LiF. This is an exact evidence of resonance of dislocations as was predicted by GRANATO and LlJCKE [1] .
The proportion of this internal friction to the vibrational frequency shows that this difference is due to the string-like motion of dislocation which is suggested by the Granato-Lücke theory, because another mechanism which is proportional to the frequency, for example electronic or electromagnetic contribution, is excluded in this experimental condition. If this is the case, this method is very sensitive for detecting minor plastic deformation at room temperature, which is directly connected to the strength of U02 .
Zircaloy-2
(a) Relaxation
The internal friction of Zircaloy-2, which is hydrogen charged, is measured between room temperature and liquid-nitrogen temperature by a transverse vibration-free decaying method. In an annealed specimen, relax-ation peaks are observed at 250-260°K and at about 160°K, and when quenched

MEASUREMENT OF INTERNAL FRICTION 325
frecjuenpy NWr
Fig. 15
Frequency dependence of ultrasonic attenuation of UOj I before and after compression
from 300°C, the height of 260°K peak increases. These results are shown in Fig. 19 and in Table I. After quenching the 260°K peak becomes higher as the hydrogen content increases. This peak is of single relaxation and the activation energiés, which are obtained from the peak width and from the peak temperature, coincide very well and its value is almost the same as the BUNGARDT et al. [3] results on pure zirconium.
For the above reasons this peak is believed to be Snoek's peak of hy-drogen which comes from the stress-induced diffusion of hydrogen between

326 R. R. HASIGUTI et al.
f requency MHz
Fig. 16
Frequency dependence of ultrasonic attenuation of U 0 2 I I before and after compression
tetrahedral and octahedral sites. Such a peak is also observed in hydrogen-charged titanium [4] . This peak may be used for inspecting hydrogen pick-up.
(b) Hysteresis
The amplitude dependence is also observed here. In this case the Granato-Liicke relation is satisfied in the higher amplitude region, but it deviates in the lower amplitude region. The values of dislocation densities and dis-location loop-lengths are calculated from the higher amplitude region, and are shown in Fig. 20. This shows that the dislocation density increases with

MEASUREMENT OF INTERNAL FRICTION 327
NO. 1 Sample 6 5 . 0 ty/mm2 C o m p r e s s i o n
in I 1 1 1 1 lu 5 10 20 30 MHz
frequency Fig. 17
The differential internal friction versus vibrational frequency of compressed UQ I
hydrogen content, which would be connected to the hydrogen brittleness of Zircaloy-2.
5. CONCLUSIONS
From experimental results in part 4, it is concluded that the internal friction measurements are applicable to the non-destructive testings of nu-clear materials for the following cases:
(i) The change of solute impurity concentration.brought forth by quench-ing in uranium and uranium alloys.
(ii) Dislocation density and dislocation loop-length of cold-worked, an-nealed and quenched uranium.
(iii) Dislocation behaviour in UO2 . (iv) Detection of minor plastic deformation of UO2 at room temperature. (v) Solute hydrogen in Zircaloy-2.
(vi) Dislocation density and dislocation loop-length in Zircaloy-2.
Thus, these atomic measurements would be useful for inspecting-nuclear materials. The authors intend to investigate the irradiation proces-ses of nuclear materials the near future.

3 2 8 R. R. HASIGUTI et al.
£ io"3
Ю
No. 2 Sample 52.8k9/mm ! compression
J L б r 10 20 30 MHz
frequency
Fig. 18
The differential internal friction versus vibrational frequency of compressed U02 П
(10) i о
Z i r c a l o y - 2 ; ЗООррт A quenched from 400°G
• annealed
-J I L_ 150 160 170 180 190 200 210 220 230 240 250 260 270 280 290
^-temperature (°K)
Fig. 19
Temperature dependence of internal friction of Zircaloy-2 II quenched from 350 °C

MEASUREMENT OF INTERNAL FRICTION 329
Fig. 20
Dislocation density and dislocation loop length of Zircaloy-2 I and П versus hydrogen content
R E F E R E N C E S
[ 1 ] GRANATO, A. and LOCKE, K . , J. appl. Phys. 27 (1956) 583, 789. [ 2 ] HASIGUTI, R. R . , IGATA, N. and UEKI, M. (to be published). [ 3 ] BUNGARDT, K. and PREISENDANZ, H . , Z . Metallk. 51 (1960) 280. [ 4 ] KBSTER, W . , Z . Metallk. 47 (1956) 564.
D I S C U S S I O N
A. VAN DER LINDE: I have three questions concerning Fig. 20 of your paper, showing the logarithm of the dislocation density of Zircaloy-2 as a function of hydrogen content in ppm. Is the curve valid for quenched or an-nealed Zircaloy-2?
N. SASAO: It is valid for quenched Zircaloy-2. A. VAN DER LINDE: The shape of the log. Л curve is such that at about
500 ppm hydrogen content a saturation value can be expected. Can such a saturation condition be explained theoretically?
N. SASAO: I think that the saturation condition is due to the formation of hydrogen compounds.
A. VAN DER LINDE: Is there a theoretical explanation of the minimum in the Lc curve ?
N. SASAO: We cannot explain it at present because there are only a few measured points:
F.H. WELLS: In the electrostatic method of measuring resonance fre-quency (Fig. 1) is any special surface preparation or conductive coating needed on the specimen?
N. SASAO: No, none at all.


THE ROLE OF NON-DESTRUCTIVE TESTING IN TEST-REACTOR OPERATION AT THE
NATIONAL REACTOR TESTING STATION*
W . C . F R A N C I S , E . S . B R O W N , E . E . B U R D I C K , G . W . G I B S O N A N D F . H . T I N G E Y
P H I L L I P S P E T R O L E U M C O M P A N Y . A T O M I C E N E R G Y D I V I S I O N ,
I D A H O F A L L S , I D A H O ,
U N I T E D S T A T E S O F A M E R I C A
A b s t r a c t — R é s u m é — А н н о т а ц и я — R e s u m e n
THE ROLE OF NON-DESTRUCTIVE TESTING IN TEST-REACTOR OPERATION AT THE NATIONAL REACTOR TESTING STATION. The huge investment (well over $100 000 000) in the Nuclear Test Reactors at the National Reactor Testing Station and the need to operate them safely requires the highest order of quality control for reactor and test components, especially for fuel and control elements. Non-destructive testing has, therefore, assumed a very vital role in establishing the quality of these components before their use in the Test Reactors. Although many of these non-destructive tests follow well-established procedures, many unique techniques have been developed and new uses made of conventional equipment.
Ultrasonic techniques have long been used at this site for detecting voids, non-bonding and internal cracking. More recently this work has been extended to the automated scanning of curved plates and to the inspection of irradiated fuel plates in the storage canals. A very interesting work has been the application of the ultrasonic technique to the detection of brittle core fracture which may occur in forming operations.
A gamma-scanning technique to establish the U™ content of fuel elements has proved so reliable that it is the basis for assessing financial penalties for out-of-specification material. Radiographs of fuel plates provide core dimensions and, with densitometer scans, determine fuel distribution. Radiographing of welds is standard procedure for reactor and test loop components.
Burnup of fuel and poison in test specimens may be determined each reactor cycle by the use of the Advanced Reactivity Measurement Facility (ARMF). A somewhat unusual application for a critical facility is the measurement of the boron content of fuel in the Engineering Test Reactor Critical Facility (ETRC).
Eddy-current and mechanical probing of fuel-plate spacing and eddy-current gauging of oxide film thickness (corrosion) on irradiated plates have given excellent results. Additional techniques, which have proved valuable, include liquid penetrant inspection and liquid nitrogen tests for surface cracks, thermal anneal tests for blistering, and gamma-scanning of irradiated plates. Hydraulic testing of statistical sampling of fuel elements is used to confirm structural integrity, particularly the fuel plate-side plate-joint strength. A continu-ous effort is made to improve existing techniques and to develop new non-destructive inspection procedures.
RÔLE DES ESSAIS NON DESTRUCTIFS DANS L'EXPLOITATION DES RÉACTEURS D'ESSAI AU CENTRE NATIONAL D'ESSAIS DE RÉACTEURS. Les investissements très importants (plus de 100 millions de dollars) consacrés âux réacteurs d'essai du Centre national d'essais de réacteurs et la nécessité d'exploiter ces réacteurs en toute sécurité exigent un contrôle extrêmement strict de la qualité des réacteurs et de leurs parties constitu-tives, notamment des éléments combustibles et du dispositif de commande. Les essais non destructifs ont donc joué un rôle essentiel dans le contrôle de la qualité de ces pièces avant leur utilisation dans les. réacteurs d'essai. Bien qu'un grand nombre de ces essais non destructifs soient exécutés selon des procédures bien établies, on a mis au point de nombreuses méthodes inédites et introduit de nouvelles utilisations du matériel classique.
On applique depuis longtemps au Centre d'essais les méthodes ultrasonores pour la détection des cavités, des défauts de liaison et des craquelures internes. Récemment, on a étendu ces méthodes à l'exploration automatique des plaques courbes et S l'inspection des éléments combustibles irradiés dans les canaux de stockage. Des travaux très intéressants ont permis d'appliquer la méthode des ultrasons â la détection des fractures qui peuvent se produire dans l'âme lors du façonnement.
* Work performed under the auspices of the United States Atomic Energy Commission.
331

332 W.C. FRANCIS , et al.
Une méthode d'exploration par rayons gamma, pour déterminer la teneur d'éléments combustibles en Z35U, s'est révélée tellement fiable qu'elle a été adoptée pour calculer les pénalisations financières pour les articles non conformes aux spécifications. Les radiographies de plaques de combustible donnent les dimensions de l'âme et, associées aux explorations'i l'aide d'un densimètre, permettent de déterminer la distribution du combustible. On a habituellement recours à la radiographie des soudures pour les parties constitutives des réacteurs et des boucles d'essai.
Le dispositif perfectionné de mesure de la réactivité (Advanced Reactivity Measurement Facility, ARMF) permet de déterminer, pour chaque cycle de réacteur, l'irradiation du combustible et l'empoisonnement dans des spécimens. Une application assez peu courante pour un assemblage critique est la mesure de la teneur en bore du combustible dans l'assemblage critique d'essai en genie des réacteurs (Engineering Test Reactor Critical Facility, ETRC).
Le contrôle par courants de Foucault et par des procédés mécaniques de l'espacement des plaques de combustible et la mesure par courants de Foucault de l'épaisseur de l'oxydation (corrosion) sur les plaques irradiées ont donné d'excellents résultats. Des méthodes complémentaires qui ont fait leurs preuves sont l'in-spection par liquide pénétrant et les essais î l'azote liquide pour les craquelures superficielles, les essais par recuit thermique pour les souitlures et l'exploration par rayons gamma des plaques irradiées. On a recours à l'essai hydraulique d'un échantillon statistique d'éléments combustibles pour vérifier l'intégrité structurale, notamment la résistance de la liaison entre les plaques de combustible et la gaine. Des efforts constants sont déployés pour améliorer les méthodes actuelles et mettre au point de nouveaux procédés de contrôle non destructif.
РОЛЬ Н Е Д Е С Т Р У К Т И В Н Ы Х ИСПЫТАНИЙ ПРИ ЭКСПЛУАТАЦИИ ИСПЫТАТЕЛЬНЫХ Р Е А К Т О Р О В НА НАЦИОНАЛЬНОЙ СТАНЦИИ ПО ИСПЫТАНИЯМ Р Е А К Т О Р О В . Большие капиталовложения (более 100 млн. долл. ) в ядерные опытные реакторы при Национальной л а б о -ратории по испытанию реакторов и необходимость эксплуатировать их безопасно требуют в ы с о -кокачественного контроля за реакторами и опытными компонентами в особенности за топли-вом и управляющими стержнями. П о э т о м у недеструктивные испытания играют очень важную роль в определении к а ч е с т в а э т и х компонентов до т о г о , как они и с п о л ь з у ю т с я на опытных р е а к т о р а х . Хотя многие из этих о п ы т о в проводятся по хорошо о т р а б о т а н н ы м п р о г р а м м а м , т е м не менее было разработано м н о г о уникальных с п о с о б о в и широко используется обычное оборудование .
Д о л г о е время использовались у л ь т р а з в у к о в ы е м е т о д ы в целях обнаружения раковин, недиффузиозности тепловыделяющих э л е м е н т о в и внутренних трещин. В последнее время эта работа была распространена на автоматическое скеннирование кривых пластин и для о б -следования облученных топливных пластин в каналах для хранения. Весьма интересная работа была проведена в деле применения ультразвука для обнаружения разрыва хрупких активных зон , который м о ж е т возникнуть в прцессе изготовления .
М е т о д гамма-скеннирования для определения содержания урана-235 в топливных э л е -м е н т а х о к а з а л с я н а с т о л ь к о надежным, ч т о он является о с н о в о й для п о д с ч е т а финансовых затрат на материал, числящийся вне спецификации. Рентгеновские снимки топливных пласти-нок дают размеры активных зон и с помощью развертки денситометра определяют распреде -ление топлива. Р е н т г е н о в с к а я съемка сварных швов является стандартной процедурой для реакторов и компонентов опытных петель . .
Выгорание топлива и отравление в опытных образцах может быть определено в каждом цикле реактора путем использования усовершенствованного у с т р о й с т в а по измерению р е а к -тивности ( A R M F ) . В к а к о й - т о степени необычное применение для критического у с т р о й с т -ва является измерение содержания бора в топливе на критической у с т а н о в к е по технологии испытательных р е а к т о р о в ( Е Т Н С ) .
Токи Фуко и механическое зондирование расстояния топливных пластинок и измерение толщины окиси пленки (коррозия) с помощью токов Фуко облученных пластинок дали о т л и ч -ные р е з у л ь т а т ы . Дополнительные с п о с о б ы , к о т о р ы е оказались в е с ь м а ценными, включают обследование жидких проникновений и опыты по жидкому а з о т у для трещин на поверхностях , опыты по тепловому отжигу для окалин и г а м м а - скеннирование облученных пластин. Г и д -равлическое испытание стабильных образцов топливных элементов используется для т о г о , чтобы подтвердить структурную целостность , в о собенности , силу соединения.топливных пластинок. В е д у т с я дальнейшие р а б о т ы по улучшению с у щ е с т в у ю щ и х м е т о д о в и по р а з р а б о т к е н о в ы х н е д е с т р у к т и в н ы х м е т о д о в о б с л е д о в а н и я .
PAPEL DE LOS METODOS NO DESTRUCTIVOS EN LA EXPLOTACION DE LOS REACTORES DE LA NA-TIONAL REACTOR TESTING STATION. Los reactores de ensayo de la National Reactor Testing Station suponen

NON-DESTRUCTIVE TESTING IN TEST-REACTOR OPERATION 333
una enorme inversión (superior a 100 millones de dólares) y la necesidad de explotarlos en condiciones de seguridad obliga a proceder a un control de calidad muy estricto de los componentes nucleares y de ensayo, especialmente en lo que respecta a los elementos combustibles y de control. Por tanto, los métodos no. destruc-tivos son fundamentales para determinar la calidad de estos componentes antes de emplearlos en los reactores. Aunque muchos de estos ensayos no destructivos se efectúan según procedimientos bien establecidos, se han desarrollado numerosas técnicas especiales y se ha encontrado aplicaciones originales para diversos instrumentos clásicos.
Desde hace tiempo se vienen aplicando técnicas ultrasónicas a la detección de cavidades, uniones defec-tuosas y grietas internas. Más recientemente, estos trabajos se han ampliado a la exploración automática de placas curvas y a la inspección de placas combustibles irradiadas que se encuentran en los canales de almace-namiento. Particular interés reviste la aplicación de técnicas ultrasónicas para detector fracturas en núcleos frágiles que se pueden producir durante las operaciones de conformado.
Se ha observado que la técnica de exploración con rayos gamma para determinar el contenido en uranio-235 de los elementos combustibles es tan precisa que puede emplearse como la base para determinar la cuantfa de las indemnizaciones que se han de pagar por materiales que no cumplan ciertas especificaciones. Las radiografías de las placas combustibles indican las dimensiones del núcleo, y si se exploran densitométricamente, la distri-bución del combustible. La radiografía de soldaduras constituye un procedimiento corriente para comprobar las piezas del reactor y de los circuitos de ensayo.
El grado de combustión de las especies fisionables y de los venenos en las muestras a ensayar se pueden determinar en cada ciclo del reactor empleando la Advanced Reactivity Measurement Facility (ARMF). Una aplicación poco corriente para una instalación crftica es la medición del contenido de boro del combustible en el Engineering Test Reactor Critical Facility (ETRQ.
Se han obtenido excelentes resultados con la aplicación de corrientes de Foucault y del sondeo mecánico para determinar el espaciamiento de las placas combustibles, así como en el calibrado del espesor de las películas de óxido (corrosión) de placas irradiadas empleando corrientes de Foucault. Otras técnicas que han demostrado su utilidad son la inspección por penetración de líquidos, los ensayos con nitrógeno líquido para detector grietas superficiales, los ensayos de recocido térmico para determinar ampollas, y la exploración gamma de placas irradiadas. Muestras de elementos combustibles tomadas estadísticamente se ensayan por métodos hidráulicos para confirmar su integridad estructural, especialmente la estabilidad de la unión entre la placa combustible y la placa lateraL Constantemente se intenta mejorar las técnicas actuales y perfeccionar nuevos procedimientos de inspección de carácter no destructivo.
The nuclear test reactors at the National Reactor Testing Station (NRTS) represent a capital investment of well over $ 100 000 000. The annual fuel costs and the value of the hundreds of experiments in the reactors would add many millions more to this total. When the Advanced Test Reactor comes on-stream later this year it is expected that the three test reactors will con-sume an average of 115 fuel elements each month. It is essential, therefore, that the quality control of initial and replacement components, especially of fuel and control elements and of test samples, be of the highest order. Non-destructive testing of these components before their use in the test reactors assumes a very vital role in establishing the quality and providing important pre-irradiation data. It is the purpose of this paper to describe some of the non-destructive testing techniques in use at the NRTS and especially to present some of the more unique developments and applications which have evolved through extensive experience.
1. USE OF ULTRASONICS
Ultrasonic techniques have been used at the NRTS for over eight years for pre-irradiation inspection of specimens for voids, non-bonding, and

334 W.C. FRANCIS , et al.
internal cracking. These procedures have also been used for inspecting irradiated fuel plates as well as for scanning fu l l - s ize Materials Testing Reactor (MTR) fuel plates which had been formed to the final curved con -figuration. The purchase specifications for the Advanced Test Reactor (ATR) fuel elements now require that the plates be ultrasonically scanned by the manufacturer to detect undesirable imperfections.
1.1. Description of equipment
A Model 424-A " immerscope" manufactured by the Curtiss-Wright Cor -poration has been the basic instrument for this work. Most items are in-spected by through-transmission techniques in a water medium. A choice of frequencies f rom 2 to 25 MHz is available, pulsed at 100-500 Hz.
The information thus obtained was originally displayed on a 7-in cathode-ray tube as "pips" . A flaw-alarm control on the instrument made it possible to trigger a circuit which would operate a light or pen when the "pip" height, dropped below an arbitrarily chosen value. To provide permanent records of the ultrasonic scans the " I m m e r s c o p e " was combined with an X - Y r e -corder . To do this, two electrical measuring and balancing systems were used: one system operates the pen travel on the horizontal axis (X-axis ) , the other operates the chart movement on the vertical axis (Y-axis) . The alarm circuit of the "Immerscope" was used to actuate a solenoid-operated pen lifter in the recorder. The record is produced on a strip chart and pro-vides a X 9|"in record which is easily detached for filing. Provision is made for changing the recorder magnification so that scans of ful l -s ize (3 inX24 in) fuel plates may be recorded on the 9 - l / 2 X 9 - l / 2 - i n chart space.
1.2. Pre-irradiation inspection of samples
Under the Reactor Fuels and Materials P r o g r a m m e conducted at the NRTS, small specimen fuel-plates of a variety of compositions are fabr i -cated, inspected, irradiated, and examined. These plates range in thickness from 0. 030 - 0. 150 in. As part of the pre-irradiation inspections, theplates are ultrasonically scanned.
1. 3. Automated scanning of curved plates
Since the fuel plates used in the MTR and the ATR-type fuel elements are curved it was necessary to provide a means of inspecting these plates after forming to ensure that this operation had not disrupted the metallurgi-cal bond between the fuel-plate core and cladding. A special fuel-plate scanner was designed and built for this purpose.
In this scanner a pair of transducers are passed longitudinally down the plate. The fuel-plate holder is automatically rotated after each-pass of the transmitting-receiving crystal pair. This procedure keeps the sur -face of the plate always perpendicular to the sound beam. Fig . 1A shows the ultrasonic scanning tank together with the transducer crystals and the holder for the inspection of curved plates. The electrical linkages between the crystals scanning the plates, the plate-rotating mechanism, and the r e - '

NON-DESTRUCTIVE TESTING IN TEST-REACTOR OPERATION 335
corder pen are adjusted so that the scans can be recorded on the 9 - 1 / 2 X 9-1/2-in chart area. An example of a very practical application of this auto-mated scanner for curved plates is given in the following section.
1.4. Detection of brittle core fracture in forming
By making use of an interesting concept involving the dispersion of fuelled glass fibres in an aluminium matrix, the Clevite Corporation [1] de-veloped a potentially useful reactor fuel. Fabrication development, mecha-nical property studies, and irradiation of test samples, all substantiated the promise of this material and led to the fabrication of an MRT prototype fuel element. The element satisfactorily passed all acceptance tests, which had included blister testing of the fuel plates, and was awaiting insertion in the MTR when an extra fuel plate which had been provided along with the prototype element was given an ultrasonic inspection. This plate had been blister-tested after hot-rolling and then was cold-rolled to final thickness and cold-formed to MTR curvature. Since no ultrasonic scanner was avail-able at the time for curved plates the ultrasonic test was, at best, somewhat crude. However, areas of especially poor sound transmission were sus-pected as indicating unbonded or void areas and the plate was examined metallographically to reveal cracks similar to those shown in Fig. 1С. Since flat plates prepared for irradiation and mechanical property measurements had indicated some brittleness but no cracking, it was concluded that the cracks observed in the small plate were initiated by the shear forces a s -sociated with curving of the plates. Because of concern for the in-pile per-formance or the prototype element, should its plates also have similar se-parations in the cores, it was decided to disassemble the element and ultra-sonically scan each plate. The transducers used for both transmitting and receiving were 10-MHz Li 2 S0 4 crystals with 0. 56-in focal lengths. The standard used for simulating flaws in the plates was a pair of lead washers. Some typical scans of plates in which flaws were indicated are shown in Fig. IB. A composite photomicrograph of the "flaw" area of Plate No. 3 is shown in Fig. 1С. A pronounced separation in the core is visible at the top edge and a smaller crack is observed at the lower edge of the core.
In working with very brittle materials such as this fibreglas fuel e le-ment it is possible, by ultrasonic means, to detect not only the soundness of the finished plate but also to determine if the forming operation is causing brittle cracking.
1.5. Irradiated inspection
The ultrasonic inspection equipment has also been adapted for use in the inspection of irradiated fuel plates. The only major change in the equip-ment required for this use was to construct a pair of 10-ft-long search tubes. No appreciable changes were noted in the operating conditions of the trans-ducers used for this application after exposure ranging up to 120 h.
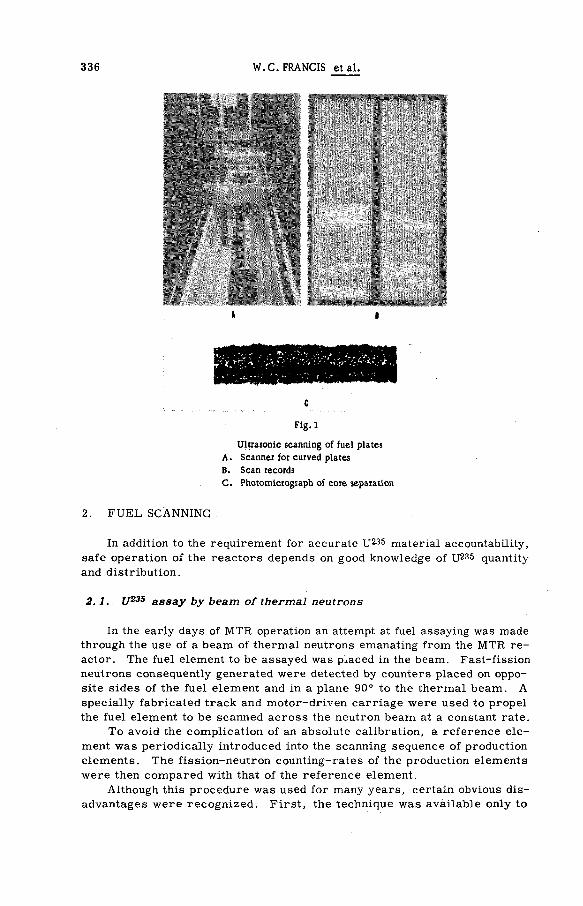
336 W.C. FRANCIS , et al.
* I
î
Fig.l
Ultrasonic scanning of fuel plates A. Scanner for curved plates B. Scan records C. Photomicrograph of core separation
2. FUEL SCANNING
In addition to the requirement for accurate U235 material accountability, safe operation of the reactors depends on good knowledge of U235 quantity and distribution.
2. 1. ц235 assay by beam of thermal neutrons
In the early days of MTR operation an attempt at fuel assaying was made through the use of a beam of thermal neutrons emanating from the MTR re -actor. The fuel element to be assayed was placed in the beam. Fast-fission neutrons consequently generated were detected by counters placed on oppo-site sides of the fuel element and in a plane 90° to the thermal beam. A specially fabricated track and motor-driven carriage were used to propel the fuel element to be scanned across the neutron beam at a constant rate.
To avoid the complication of an absolute calibration, a reference ele-ment was periodically introduced into the scanning sequence of production elements. The fission-neutron counting-rat es of the production elements were then compared with that of the reference element.
Although this procedure was used for many years, certain obvious dis-advantages were recognized. First , the technique was available only to

NON-DESTRUCTIVE TESTING IN TEST-REACTOR OPERATION 337
Fig. 2
Fuel scanner and typical profiles

338 W.C.FRANCIS et al.
those who had generous supplies of thermal neutrons, namely reactor oper-ators, and only then when the reactor was operating. Second, in our appli-cation, the neutron beam used for scanning emanated f r o m the top of the MTR reactor and consequently the scanning equipment interfered with the ' insertion and removal of experiments. Third, and probably most important, the reproducibility of results was extremely sensitive to the density of neu-trons in the beam, and thus even small perturbations in the reactor flux during operation tended to make the data difficult to interpret.
2. 2. Natural gamma-activity counting
In a large measure many of these problems were solved by use of a non-destructive assaying device fabricated by the Westinghouse Elec tr i c Corporation [2]. The apparatus is illustrated in Fig . 2.
The complete system employs four complementary methods of non-destructive assay: counting of natural gamma activity, thermal neutron at-tenuation measurements, epithermal neutron absorption, and weight and volume measurements. Our experience has been "mainly with the f irst method; limited work in neutron absorption has not produced results c o m -parable to the reactivity measurements discussed in a later section.
Since U235 emits gamma radiation, the measurement of the gamma rays emitted by a fully-enriched fuel element provides information on the amount of fuel contained. To use this method for an accurate determination of U235
in rather dense objects such as fuel elements, it is necessary to minimize the effects of counting geometry, self-absorption within the materials and the non-uniform uranium distribution. The basic procedure employed in the natural radioactivity device is to scan the element between a pair of Nal(Tl) scintillation counters and compare the resultant count with that from "standard" elements whose U235 contents are known and bracket that of the unknown. Linear interpolation with reference to the U'zao content of thè' standards provides a measure of the U235 content of the element. This method is used for assaying fuel plates as well as fuel elements. Different detection geometr ies are needed for plate and for element assays to compensate in part for the different amounts of self -absorption.
F o r the fuel plates, the configuration consists of two opposed l X 3 - i n rectangular scintillation crystals which scan the fuel plate at a constant rate. The plate-assay system is modified for the assay of elements by r e -tracting the detectors and inserting col l imators which effectively reduce the crystals to l X l - 3 / 4 - i n rectangles. Elements are scanned one direction, rotated 90° and scanned back, and the sum of the counts determined. Typical scans of acceptable and unsatisfactory plates are shown in Fig. 2. The de-tection efficiency of this system would be independent of position within the element if there were no attenuation. However, the attenuation is consider-ably greater along the centre of an element than along the edges. This non-uniformity is compensated by the insertion of the gamma collimator so that the crystals " see " the edges of the elements less effectively.
The principal sources of variation which contribute totheovei—all un-certainty of this assay method are the electronic drift of the instrument, variation, in aluminium content of elements, and error in uranium values
22*

NON-DESTRUCTIVE TESTING IN TEST-REACTOR OPERATION 339
assigned to the standards. The effect of variation in aluminium and instru-ment drift is minimized through the use of a filter made of 20-mil cadmium sheet which covers the 1-in slit in the coll imator. For the particular geo -metry employed, aluminium contributes a net loss of counts in the high (> 180-keV) and the low(< 60-keV) energy ranges and a net gain in counts through the medium energy range. By setting the "window" discriminator to accept pulse heights only in the energy 60 keV to 250 keV, and by the use of the filter, variations in aluminium content must be considerably larger than one would expect f rom the fabrication tolerances to be of any consequence.
To date we have individually assayed through gamma scanning the following:
800 MTR elements; 2000 Engineering Test Reactor (ETR) elements; 420 ETR control -rod fuel sections;
50 Advanced Reactivity Measurement Facility (ARMF) elements; and 8500 Miscellaneous plates.
From an analysis of all pertinent e rrors , both random and systematic, to be associated with this technique of assay, it is estimated that the uncer -tainty (95% confidence limit) on an individual item determination does not exceed 1.0%.
Use is made of the data obtained in the fuel assay both with regard to f issi le material accountability and payment for fabrication services. Con-tractually, off-loaded elements and plates are purchased at a sliding scale price keyed to the amount off-loaded and the resultant utility of the item to Phillips. (Off-loaded elements require special handling and can only be used in certain locations in the reactor). It is interesting to note that, as a result of this provision, fuel-fabrication services sub-contracts have been penalized in excess of $ 100 000 over the past three years.
2. 3. Gamma scanning of irradiated fuel plates
Gamma scanning of irradiated fuel plates from both the MTR and ETR . has been accomplished by passing the plate at a controlled rate in front of a 1/8- in opening in a plug through a hot-cell wall. The relative gamma in-tensities through the opening are recorded and correlated with distance along the plate. Calibration is accomplished by means of a Cs 1 3 7 source. The discrimination voltage is set to accept only energies above 0.7 MeV. A photographic reduction of a typical ETR plate scan is shown in Fig. ЗА. This scan veri f ies that the peak flux remains somewhat below the reactor c o re midplane for most of the cycle and that there is indeed some effective peaking of f ission rate at the fuel ends; but appreciably l ess than the flux peaking measured by wires in the water channels. Corroboration of the gamma-scan results was obtained by punching specimens f rom the plate and analysing them for U235 content. A typical plot of 2% iso-burnup contours is shown in F ig . 3B. This Figure shows the distribution skewed towards one edge and towards the lower half of the plate.
Gamma scanning as a non-destructive technique has also found consider-able application to improve homogeneity of fuel c o r e s during fabrication. Vendors supplying fuel elements for the test reactors currently gamma scan

340 W.C. FRANCIS , et al.
Fig.3
Gamma scan of irradiated ETR fuel plate and corresponding burnup contours
the punched or compacted cores before assembling in the picture frame and cover plates for roll bonding. This results in improving the distribution of uranium in the finished fuel plates and reduces reject or re -work material after final rolling.
3. RADIOGRAPHY
3. 1. Description of equipment
Fuel-plate radiography at the NRTS is used to determine fuel-plate core dimensions and location, and hot stripes, segregation and "dogboning" which may affect the heat-transfer conditions of the plate.
The basic equipment consists of a 200-kVP, 5-mA ANDREX X-ray set, a darkroom for development of fi lm under controlled conditions suggested by the film manufacturer, and a Photovolt Transmission Densitometer Model 501-A and Photometer.
The X-ray set is generally used for the non-destructive testing of welds and sample fuel plates fabricated for fuel-element development. Radiographs of production fuel plates are furnished by the fuel-element vendor.
The densitometer and photometer are used to determine film densities of radiographs by measuring the light transmission through the radiograph.
3. 2. Fuel-plate inspection - core outline and homogeneity
The core outline is distinctly observed by a visual inspection of the radiograph and thus provides a reliable method of determining whether or not the core location within each plate is within the specified tolerances.
Fuel concentration and/or segregation is also determined from the same radiographs used in determining the co re outline. F i lm density readings

NON-DESTRUCTIVE TESTING IN TEST-REACTOR OPERATION 341
are taken using the densitometer. These readings are then used in deter-mining the difference in uranium content between two locations on the film. It has been found that there can be a marked difference in density readings of different radiographs taken of the same fuel plate. It has also been de-termined that there may be a significant variation in readings taken several inches apart even though the uranium content may be uniform (one reason for this is because of the variation in X-ray beam intensity). Because of these variables, a single densitometer reading cannot be used to determine the uranium content. Therefore, a uniform method has been established to determine the per cent variation between two locations of a single radio-graph. A brief outline of this procedure is as follows.
Variations in fuel concentration are usually of three types: streaking, spot concentration, and "dogboning" — thickening at the ends of the core caused in the rolling process . The radiograph is first visually inspected for non-uniformity. A density reading is then taken at the worst spot; and within 2 or 3 in, an average reading is taken across the plate. To reduce the "beam" effect caused by the variation in X-ray intensity when the radio-graph was taken, two additional readings are taken along the aluminium edge adjacent to the core readings. The difference between these two "edge" readings is used in correcting the final values of the core readings. The difference in uranium content is then read from a calibration curve obtained from a variety of Al-U plate samples of known fuel density. The percent difference in uranium content between the two locations can thus be deter-mined, using the nominal fuel concentration called out in the specifications.
Fuel-element assembly specifications now used at the NRTS require that the range of light transmission through plate radiographs, using a densitometer with a 1/16-in-diam. aperture, s*hall not exceed 10% of the average for all core locations of any plate.
At present a method is being investigated which may eliminate the beam-effect consideration in film-density measurements and also allow the de-termination of the uranium content of a point in the plate directly. This would be done by radiographing alongside the fuel plate an aluminium strip the length of the plate. If the thickness of the strip corresponded to a plate of known uranium content, then the difference in densitometer readings at a particular level of the strip and plate would correspond to a difference between a plate of known fuel concentration and that of the plate in question. If the X-ray conditions were well controlled, a maximum allowable differ-ence in the film density between the strip and plate could be established which would correspond to the maximum fuel-density variation allowable by the specification.
4. EDDY-CURRENT INSPECTION
Eddy-current inspection techniques have been applied to three very im-portant operations at the NRTS: (1) That of measuring channel thickness between plates in fuel elements, (2) determining cladding and coating thick-ness, and (3) identifying temper in metal alloys.

342 W.C. FRANCIS , et al.
4.1. Channel-thickness measurements
Fuel-element plate-spacing measurements are obtained by the use of a probe developed by the Oak Ridge National Laboratory [3] and a commer-cial instrument (Dermitron) which furnishes thé high-frequency current to the coil in the probe and in turn measures the effect of the eddy-current-induced magnetic field which opposes the inducing current. Such a test ar -rangement is shown in Fig. 4. Long probes of the type illustrated are capable of measuring the fuel channel in our longest element. Rapid mea-surements can be made on a go-no-go basis with the high and low limits set to correspond to the required specifications. These limits are set by use of accurately machined test blocks. It is also conceivable that the indicated response could be converted to a recorder for automated scanning. To date our work involving these measurements has been confined primarily to static measurements. Channel-spacing measurements, using this system under dynamic conditions (flowing water at temperatures up to 200°C), have not been successful because of probe failure.
4. 2. Cladding and coating thickness
Using the same instrument described in the preceding section, but with a commercially manufactured probe shown in the insert to Fig. 4, measure-ments are made of aluminium cladding over uranium fuel cores and of ano-dized coatings on aluminium. An interesting evolution of the anodized coating measurements, however, came about when it was observed that these coat-ings under reactor test conditions underwent considerable change — both increasing in thickness and spalling (film stripping). To measure these changes a Dermitron probe was set up in the hot cell and connected to the instrument outside the cell through long lead wires emerging through a hot-cell plug. Very accurate measurements were then taken over the entire sur-face of the plate. The measurements so obtained have been verified through extensive dimensional measurements before and after stripping and by metallography.
These measurements are also adaptable to corrosion determinations. Eddy-current measurements of corrosion film, by means of the Dermitron instrument, on fuel samples being tested for the ATR were an outstanding success.
4. 3. Temper determination in aluminium
Preliminary work has indicated another potentially important application of the eddy-current technique for non-destructive testing of metal alloy temper. Fuel specifications for the test reactors call for cold-worked fuel plates and solution heat-treated and artificially aged (T6) side plates. Be-cause of the structure and thinness of the plates, it is almost impossible to obtain good hardness measurements by superficial testers to check on the condition of these items once assembled. The electrical conductivity of these materials is dependent on the temper (and alloy composition) and, therefore, should be amenable to eddy-current measurements. By use of

NON-DESTRUCTIVE TESTING IN TEST-REACTOR OPERATION 343
¥
Fig.4
Eddy-current inspection of fuel-element channels and coating thickness
a suitable 6061-T6 aluminium standard, several fuel-element side plates have been measured with the Dermitron. Good correlations have been ob-tained in this manner. Obviously this technique has a potentially much wider application and further work along these lines is in progress.
5. CRITICAL FACILITIES FOR NON-DESTRUCTIVE TESTING
5.1. Advanced reactivity-measurement facilities (ARMF-I and ARMF-II)
ARMF-I and ARMF-II [4] are nearly identical critical facilities and are used almost exclusively for measuring reactor physics parameters, such as reactor-spectrum cross-sections and resonance integral cross-sections. These facilities are swimming-pool-type reactors having light-water -moderated cores made up of plate-type fuel elements containing fully-enriched U235 .
One ARMF ability, which is somewhat unique and highly beneficial, is that of non-destructively determining the macroscopic cross-sect ions (or quantity) of both fuels and poisons combined in a single sample. Measure-ments of this nature have been conducted to determine the U235 and boron content of ETR fuel-element core-alloy samples [5, 6] and to determine fuel and boron burnup after high-flux irradiations in a fuel-element' development programme [7].
Simultaneous assaying of fuels and poisons in a single sample is possible because the ARMF-I loading is arranged so that it contains several experi-

344 W.C. FRANCIS , et al.
mental positions (see Fig. 5) in which the relative importance of fission and thermal neutrons are markedly different. Determination of the fuel and poison content of a specimen'is accomplished by measuring it in two of these positions. For each position the reactivity effect of the specimen can be written in a simplified form as follows:
• P, = W f iE f + Wp iEp
where Wf and Wp are the weighting functions for fuel and poison, Ef and Ep the macroscopic cross-sect ions for fuel and poison present in the sample, and i identifies the experimental position. A simultaneous solution of the equations for measurements made in the two positions yields the values of Ef and Ep which in turn can be converted to mass of fuel and boron, or boron equivalence if the poison is other than boron.
The weighting functions used in the equation are determined experimen-tally. For small quantities (approximately 2 cm2) of materials this is straight forward and can be accomplished with a small number of calibrating samples because the reactivity response is nearly a linear function of ma-terial content. However, for larger quantities the calibration becomes more complex because particle self-shielding and neutron-flux-perturbation effects are experienced. Of significance, is the fact that the weighting function of one material is dependent on the quantity of the other material. It is con-ceivable that the accurate assaying of specimens with widely diverse quanti-ties of fuels and poisons would require calibrating standards with one hundred different combinations of fuels and poisons. Some work 18J has been done to attain analytical expressions which describe the interacting effects. When completed this work should minimize the number of ca l i -brating standards required.
Because the ARMF is a precision instrument (error for a single 4. 5-min measurement is 10-7 дк/к) , the accuracy of an assay measurement is prin-cipally limited by the accuracy of the calibrating standards but is capable of assays accurate to better than a milligram of each material.
5. 2. Engineering Test Reactor Critical-Facility boron determination
Beginning with the first fuel elements fabricated for the ETR, consider-able difficulty has been encountered by all fabricators in controlling the amount of boron included in the elements. Consequently, it has been neces-sary to assay the elements for boron to maintain reactivity control of ETR core loadings. All boron assaying has been done in the ETR Critical Facility (ETRC) [9]. The ETRC is a low-power, swimming-pool-type reactor, which is a full-scale nuclear duplicate of the core and reflector of its parent r e -actor, the ETR.
Assuming that the U'2Bi> content is the same in all elements the boron content of an element can be determined from its reactivity worth relative to elements with known boron contents. The relative reactivity worths are determined from the position of a shim rod which is manually adjusted to make the reactor critical. The calibration is accomplished by plotting a curve of shim position versus fuel-element boron-content from data obtained

NON-DESTRUCTIVE TESTING IN TEST-REACTOR OPERATION 345
Regulating Rod
[ Level Na2\ \ CIC / \ J Safety Rod-
(^У*—Reflector Measuring Position
Unfueled grid position -
NOTE: Numbers on elements are grams of U -235 Total U -235 Mass -5126 g Numbers^^designate
. experimental position
Servo CIC
LCR F.C.
Fig. 5
ARMF-I core loading (2-26)
-Fuel Element (3 26l"aquore)
- S h i m
Log N CIC
in m e a s u r e m e n t s on f u e l - e l e m e n t standards containing known amounts of boron. These standards consist of unborated elements with boron-impregnated polyethylene tape distributed uniformly in their coolant channels.
Because the shim and safety rods need to be inserted each time to ensure reac tor safety, the t ime required to make a measurement is 30 min. This is equivalent to a cost of $ 50. Although this cost is high no other l e s s e x -pensive method has proved sat is factory .
There are a number of factors which affect the accuracy of boron-content assays . The method does not permit an absolute determination if the boron is s egregated such that par t i c l e s e l f - s h i e l d i n g ex i s t s . With segregat i on , which tends to be the c a s e with the al loying technique of fabr i cat ion , the c r i t i ca l fac i l i ty assay g ives only an e f f e c t ive boron content. This p r o v e s to be an advantage, h o w e v e r , when the a s s a y is to be used in conjunct ion with reactivity control of ETR fuel loadings. Systematic e r r o r s , which can a r i s e f r o m the b o r o n in the tapes not being equivalent to the boron in the fuel plates, are avoided or corrected through careful distribution of the tapes and disadvantage factor c o r r e c t i o n s (3%). Sources of e r r o r which are ran-dom and cannot be c o r r e c t e d ar i se f r o m uncertainties in U2 3 5 contents and non-reproduc ib i l i ty of s h i m - r o d posit ion at c r i t i ca l i ty . B e c a u s e U2 3 S un-certainties aré only ± 2 g and its weighting function (expressed in grams) is only 1 /50 that of boron , the U235 uncertainty contr ibutes a smal l e r r o r to the boron assay . This e r r o r combined with s h i m - r o d non-reproduc ib i l i ty y ie lds a net e r r o r of ± 0.1 g f o r boron assaying in the E T R C . ETRC measurements "of boron fuel e lements have resulted in vendor penalties on about 40% of the ETR elements r e c e i v e d .

346 W.C. FRANCIS , et al.
6. HYDRAULIC TESTS
A statistical sampling plan is used to select representative fuel elements from each batch of elements received from the vendor. These elements are hydraulically tested, one at a time, in a facility capable of producing flow rates of 140% of the normal reactor operating flow rate through a fuel e le-ment (Fig. 6A). This 140% test effectively doubles the pressure differentials acting on the various areas of the element. An analysis of fuel-element-failure distribution provides the assurance that an element which success-fully passes such a flow test has a probability of failure in the reactor of 0.000. The hydraulic test helps to establish the maximum operating limits for new elements or modifications to existing elements and thus in turn to establish adequate acceptance test criteria. In addition, it has proved a sensitive test to disclose poorly assembled elements, especially in the strength of the fuel plate-side plate joint. Examples of failed elements due to faulty brazing and roll-swaging are shown in Fig. 6B and C. In the past
Fig. 6
Hydraulic test facility and examples of failed elements

NON-DESTRUCTIVE TESTING IN TEST-REACTOR OPERATION 347
three years of this type of testing, 2595 MTR and ETR elements-have been received of which 421 have been hydraulically tested; 18 have failed. Since the cause of failure was poor swaging of fuel plates into the side plates, the vendor was required to make restitution. This penalty clause is now a stand-ard part of ail MTR and ETR fuel specifications.
7. OTHER NON-DESTRUCTIVE TESTS
Several other tests are routinely used to ensure that irradiation samples as well as reactor fuel plates are. safe for use.
All aluminium-clad reactor fuel-element plates and irradiation speci-mens are blister-tested by heating for one hour at 500°C. Irradiation samples and welds have been inspected by the well-known liquid-penetrant inspection procedures. Liquid-nitrogen leak-testing is frequently used for inspecting irradiation specimens before insertion into the reactor. In this procedure 110] the samples are immersed in a bath of liquid nitrogen until the bubbling of the nitrogen has stopped. The sample is then quickly trans-ferred to a bath of alcohol. Bubbles of nitrogen gas streaming from the test piece indicate imperfections.
R E F E R E N C E S
[ 1 ] BASKEY, R .H . , Fuel Bearing Fibetglas in Aluminium-Base Fuel Elements Final Report, TID-16847, June (1962).
£2] BABCOCK, R.V. and RUBY, S .L . , Phase II Nuclear Materials Control System. The Fuel Assay Scanner i "A Device lor the Non-Destructive Assay ot Highly Enriched Fuel Elements", WCAP-6039, February 1 (1960).
[ 3 ] DODD, C . V . , Design and Construction ot Eddy-Current Coolant-Channel Spacing Probes, ORNL-3580, April. (1964).
L4J BURDICK, E.E. , Fast, E. and KNIGHT, D . W . , The Advanced Reactivity Measurement Facilities, IDO-17005, October (1964) .
[ 5 ] FAST, E. et a l . , "Use of the RMF for Non-destructive Assay of Fuel-Bearing Samples", Reactor Fuel Measurement Techniques Symposium, TID-7560, June 18-20 (1968) 139-152.
[ 6 ] KNIGHT, D .W. and FAST. E . , "Simultaneous Nondestructive Analysis of Engineering Test Reactor Core Samples for Boron and U-235 in the Reactivity Measurement Facility", Trans. Amer. nucl. Soc. 1 No. 1, June (1958) 38.
[ 7 ] GIBSON, G . W . and FRANCIS, W . C . , Annual Progress Report on Fuel Element Development, IDO-16799, August (1962) 81.
[ 8 ] MILLSAP, D. A. and NISLE, R . G . , "Analysis of Reactivity Measurements", MTR-ETR Technical Branches Quarterly Report, IDO-16977, October 1-December 31 (1963) 14-18.
[ 9 ] DeBOISBLAND, D.R. et a l . , The Engineering Test Reactor Critical Facility Hazards Summary Report, IDO-16332, March (1957).
[10 ] WATSON, M . B . , "The Assembly and Testing of Experimental Fuel Elements for Irradiation Testing", Chalk River, Ontario, AECL-1288, April (1961) .
D I S C U S S I O N
J. GERARD: In gamma counting on complete elements do you inter-polate the results linearly with respect to one standard, or do you use several standards to plot a curve?

348 W.C. FRANCIS , et al.
W.FRANCIS: We use standards bracketing the desired value and inter-polate between them. There are, of course, different standards for MTR, ETR and ATR. Arriving at these standards is quite an elaborate process: many plates are scanned, one is selected, and many are dissolved chemi-cally to establish the true uranium content versus the scan count. - Plates are then built up in a loose-leaf array to establish the fuel content of the assembly.
J. GERARD: In ultrasonic inspection of plates for ETR elements, what is the actual dimension of the unacceptable defect?
W. FRANCIS: We can "see" a 0. 0625-in defect and we specify that any defects of this size, or larger, should entail rejection
D. HORVAT: You mentioned that the range of light transmission through plate radiographs should not exceed 10% of the average for all core locations of any plate. Do you not think that is a dangerous specification, because the density differences in the plate radiographs depend on various factors such as the gradation of the emulsion, the energy of the radiation applied, the ratio of primary to secondary radiation, etc? I very much doubt whether these parameters would be held constant, even with very strict definitions of the technique to be used.
W. FRANCIS: Yes, I agree. We carefully specify film type and ex-posure, yet we find variation over the radiograph which does not represent a difference in fuel content. By scanning the radiograph across the short dimension and using a statistical approach for the difference in density (maximum minus minimum) we obtain a corresponding différence in fuel content — not absolute values.
A. VAN DER LINDE: What is the measuring range and accuracy of the Dermitron instrument you used for measuring the coating and corrosion film thickness on aluminium-clad fuel plates?
W. FRANCIS: The accuracy of measurement is about 10% of the coating thickness i . e . 0.2 to 0.3 mil in the range of 2. 0 to 3. 0 mil. For very thin corrosion films, of course, the accuracy is not so good.
P. KNUDSEN: Your paper describes various kinds of inspection of plate elements. Are these tests performed by the fuel-element vendor, or do you perform them yourselves at the cost of the- vendor?
W. FRANCIS: I believe all the tests I have described are performed by us at the National Reactor Testing Station. Generally, we specify a c -ceptance criteria but do not say how the vendor shall meet them. For example, most vendors do not have fuel scanners or ultrasonic equipment. However, for ATR fuel we are specifying an ultrasonic test by the vendor.
I. PURICA: I have two questions on the method you use with the Ad-vanced Reactivity Measurement Facility. Firstly, do you only use the danger coefficient method, that is reactivity measurements, or do you also use the oscillation method?
W. FRANCIS: Just the reactivity measurements. At one time we con-sidered using a pile oscillator, or more precisely a sample oscillator, but this has not been found necessary. The_accuracy of 10-7 is perfectly a c -ceptable for our work.
I. PURICA: What is the sensitivity of the method you use to separate the effects of fuel and absorbent? In other words, what are the minimum

NON-DESTRUCTIVE TESTING IN TEST-REACTOR OPERATION 349
amounts of fuel and absorbent that you can measure with the reported sensi-tivity of 10-7 for reactivity measurements?
W.FRANCIS: Perhaps I can answer that best by saying that for the ARMF we consider that the poison statistical weight is 2. 8X10"2 ôk/k per gram of natural boron. The equivalent number for U235 is 6. 36X10"4 .
Z . PAWLOWSKI: Your paper states that by means of ultrasonics.it was not only possible to detect the soundness of the finished plate but also to determine whether the forming operation is causing "brittle cracking". Are you thinking of detection of fine cracks caused by the forming operation or do you mean that you can predict the tendency of the material to brittle fracture? If so, what testing technique did you use?
W. FRANCIS: As higher fuel loadings and reactors of higher power den-sity come into use, we become more concerned about the brittleness of the core material. Originally, this was not a problem but it becomes one with the use of cermet cores. It is, therefore, not sufficient to scan the flat plate ultrasonically after rolling; it is necessary to examine the plate after form-ing to the required curvature. This technique is really a final acceptance test. If we found that cracking was occurring we would initiate a develop-ment programme and use other means, such as bend tests and "pre-post irradiation" examinations, to determine the nature of the brittleness.


THE DEVELOPMENT OF FLAW-DETECTION TECHNIQUES AT HARWELL
R . S . S H A R P E
M E T A L L U R G Y D I V I S I O N ,
U K A E A R E S E A R C H G R O U P ,
A T O M I C E N E R G Y R E S E A R C H E S T A B L I S H M E N T ,
H A R W E L L , U N I T E D K I N G D O M
A b s t r a c t — R é s u m é — А н н о т а ц и я — R e s u m e n
THE DEVELOPMENT OF FLAW-DETECTION TECHNIQUES AT HARWELL. In the context of materials inspection a flaw demands a definitive interpretation. It should be taken to signify any structural deviation that can impair or modify the performance of a component. With this reference point established the significance and scope of the subject can be more perspectively portrayed. This paper draws on Harwell experience to emphasize the value and importance of a strong research and development programme in support of materials inspection in the nuclear-power industry.
New and improved non-destructive testing techniques are continually being demanded. They are essential to ensure the maintènance of quality and conformity in production components and they can also usefully be introduced to provide data to assist in design and development. At an earlier stage they are called upon to assist in categorizing and standardizing materials, and to ensure material uniformity in irradiation experiments. During laboratory research they can be designed to monitor physical properties so that structural variables likely to affect the service performance of nuclear components can be more precisely evaluated.
In the field of radiography, attention at Harwell recently has been directed towards high-speed techniques, methods of dealing with highly active components and X-ray microscopy. Panoramic radiography, projection fluoroscopy, and a radiopaque penetrant technique have been developed to meet the particular needs of reactor components.
The characteristics of an image converter system for radiography are described and the results of applying a novel design of ultrasonic converter tube to fuel-plate bond evaluation are illustrated. Other ultrasonic tech-niques described have been developed for detecting structural and dimensional flaws in thin-walled fuel sheathing.
It is shown how emphasis has been placed on improving inspection techniques by concentrating attention on data presentation. Facsimile recording of test signals has been widely applied to ultrasonic and eddy-current methods of inspection. By a novel form of signal processing (quantizing) it is shown how these recordings have been made considerably more informative.
DÉVELOPPEMENT DES MÉTHODES DE DÉTECTION DES DÉFAUTS A HARWELL. Dans le contrôle des matériaux, tout défaut décelé doit être interprété de façon sflre. Il faut considérer que l'on se trouve en pré-seifce d'un défaut lorsqu'il y a modification structurelle de nature à réduire ou altérer les performances d'une pièce. Sur la base de cette définition, on peut mieux délimiter la signification et la nature du problème. Se fondant sur l'expérience acquise 3 Harwell, l'auteur met en évidence la valeur et l'importance d'un pro-gramme rigoureux de recherche et de développement pour le contrôle des matériaux dans l'industrie nucléaire.
Il faut sans cesse créer des méthodes plus perfectionnées^d'essais non destructifs. Elles sont indispensables pour assurer le maintien de la qualité et de la conformité des pièces fabriquées et elles peuvent également être utiles pour fournir des données aux bureaux d'études. A un stade préliminaire, elles servent à classer et à normaliser les matériaux et à assurer l'uniformité des matières dans les expériences d'irradiation. Dans la recherche en laboratoire, elles peuvent servir à contrôler les propriétés physiques, ce qui permettra d'évaluer avec davantage de précision les variables structurelles pouvant affecter les performances des pièces.
En matière de radiographie, on s'est récemment attaché à Harwell aux méthodes à grande vitesse d'exé-cution, aux méthodes de contrôle des matières fortement radioactives et à la microscopie aux rayons X. Pour résoudre les problèmes particuliers que posent les pièces de réacteur, on a mis au point des méthodes de radio-graphie panoramique, de fluoroscopie par projection et de pénétration de fluides radio-opaques.
Le mémoire décrit les caractéristiques d'un convertisseur d'image pour la radiographie et expose les résultats obtenus avec un type nouveau de convertisseur ultrasonore dans l'évaluation de la liaison des plaques
351

352 R. S, SHARPE
de combustible. D'autres méthodes ultrasonores, décrites dans le mémoire, ont été mises au point pour déceler des défauts structurels et dimensionnels dans des gaines de combustible î paroi mince.
Le mémoire montre comment on s'est attaché à perfectionner les méthodes de contrôle en accordant la plus grande attention â la présentation des données. L'enregistrement fac-similaire des signaux a été largement utilisé dans les méthodes de contrôle par les ultrasons et les courants de Foucault. Grâce à une forme nouvelle de traitement des signaux (quantification), les enregistrements donnent des informations très supérieures.
Р А З Р А Б О Т К А М Е Т О Д О В ДЕФЕКТОСКОПИИ В Х А Р У Э Л Л Е . В связи с проверкой м а -териалов т р е б у е т с я дать определенное объяснение т о м у или иному дефекту . Это объяснение необходимо для опенки л ю б о г о структурного отклонения, которое может ухудшить или и з м е -нить рабочую характеристику компонента. Только с у ч е т о м э т о г о можно с большей перспек-тивой определить значение и рамки данного в о п р о с а . В публикуемой р а б о т е и с п о л ь з у е т с я . опыт Харуэлла для т о г о , чтобы подчеркнуть значение, которое имеет эффективная программа исследований и разработок для проверки материалов в атомной энергетике .
С у щ е с т в у е т постоянная необходимость в новых и усовершенствованных методах н е д е с т -руктивных испытаний. Они нужны для обеспечения качества и соответствия компонентов про-дукции и могут также найти полезное применение для получения данных, которые содействуют решению в о п р о с о в , связанных с конструкцией и р а з р а б о т к а м и . На более ранней стадии они должны содействовать распределению материалов по категориям и их стандартизации, а также обеспечить однородность материалов в экспериментах по облучению. Во время лабораторных исследований они м о г у т служить для измерения физических с в о й с т в , так ч т о с т р у к т у р н ы е п е р е м е н н ы е , к о т о р ы е , в е р о я т н о , повлияют на эксплуатационные к а ч е с т в а ядерных к о м п о -нентов . можно б у д е т оценить с большей т о ч н о с т ь ю . •
В Харуэлле недавно стали уделять внимание б ы с т р о д е й с т в у ю щ и м м е т о д а м , м е т о д а м , связанным с высокоактивными компонентами и р е н т г е н о в с к о й микроскопией . Были р а з р а -ботаны панорамная радиография, проекционная флуороскопия и м е т о д проникновения жидкости, непроницаемой для излучения, в целях удовлетворения определенных требований, предъяв-ляемых к реакторным к о м п о н е н т а м .
Дается характеристика э л е к т р о н н о - о п т и ч е с к о г о преобразователя для радиографии и ил-люстрируются результаты применения новой конструкции у л ь т р а з в у к о в о г о преобразователя к оценке сцепления сердечника с оболочкой. Другие описанные ультразвуковые методы р а з -работаны для обнаружения структурных д е ф е к т о в и отклонений р а з м е р о в в тонких топлив4-ных оболочках .
Показывается , каким образом был сделан упор на улучшение методов проверки за счет т о г о , что главное внимание уделялось представлению данных. Точная запись изображений сигналов испытаний широко применялась к проверке методами ультразвука и вихревых т о -ков. С помощью н о в о г о вида обработки сигналов (квантование) показывается , каким о б р а -зом в этих записях содержится значительно больше информации.
TECNICAS DE DETECCION DE FALLAS DESARROLLADAS EN HARWELL. En la inspección de materiales, toda falla exige una interpretación definitiva; debe considerarse falla toda desviación estructural capaz de menoscabar o modificar el comportamiento de un componente de reactor. Establecido este criterio de referen-cia, es posible definir con mayor objetividad la significación y el alcance del tema.
La presente memoria se basa en la experiencia adquirida en Harwell para subrayar el valor y la importan-cia de un programa intenso de investigación y desarrollo que sirva de base a la inspección de materiales en la industria de la energfa nuclear.
Existe una demanda continua de nuevas y mejores técnicas de ensayo no destructivo. Estas técnicas son esenciales para mantener la calidad y uniformidad de los componentes, siendo también posible uttilizarlas con provecho para reunir datos útiles en los trabajos de proyecto y desarrollo. En una etapa anterior, esas técnicas pueden contribuir a la clasificación y normalización de materiales, c omo también a asegurar la uniformidad del material en experimentos de irradiación. Durante las investigaciones de laboratorio, se las puede aplicar para medir propiedades físicas y de esa manera evaluar con precisión las variables estructurales susceptibles de ejercer intluencia sobre el comportamiento de los componentes nucleares en servicio.
En la estera de la radiografía, durante los últimos tiempos se ha prestado atención en Harwell a las técnicas de alta velocidad, al manejo de componentes muy radiactivos, y a la microscopía con rayos X. Para satisfacer las necesidades particulares en materia de componentes de reactores, se han desarrollado métodos de radiografía panorámica, fluoroscopfa por proyección y una técnica con agentes penetrantes radiopacos.
Se describen las características de un sistema convertidor de imágenes para radiografía y se ilustran los resultados obtenidos al aplicar un nuevo diseño de tubo convertidor ultrasónico a la evaluación de la union

DEVELOPMENT OF FLAW-DETECTION TECHNIQUES 353
entre placas de combustible. Otras técnicas ultrasónicas descritas en el presente trabajo se han desarrollado para descubrir defectos estructurales y dimensionales en vainas de pared delgada.
El autor hace hincapié en el mejoramiento de las técnicas de inspección y dedica especial atención a la presentación de los datos. El registro facsimilat de seüales de ensayo se ha aplicado ampliamente a los métodos clásicos de inspección por ondas ultrasónicas y corrientes de Foucault. Mediante una nueva forma de sistematización de la señal ( « cuantización») se pone de manifiesto la información considerablemente mayor contenida en estos registros.
1. INTRODUCTION
A section of the Metallurgy Division at Harwell is devoted to development work in non-destructive testing. The bias of the work is closely aligned to the inspection requirements of the United Kingdom Atomic Energy Authority (U.K. A. E. A . ) reactor programme. However, since Harwell is in the Authority's Research Uroup, emphasis is placed on the study and understand-ing of basic physical principles, on the assessment of new ideas, new ins-truments and new techniques and on the development of inspection procedures to anticipate possible future Authority requirements.
The purpose of this paper is to review progress made in this Section at Harwell in recent years and show how the various facets of the programme fit into a logical pattern when the scope of flaw detection is realistically defined. A list of references at the end of the paper covers the published work of the Section.
2. THE SCOPE OF FLAW DETECTION
In any industry, the overriding purpose of introducing non-destructive tests is to ensure that each and every component has achieved a certain stan-dard of quality, so that they will perform satisfactorily over the period of service, and under the conditions of service, for which they were designed. The level of confidence written into the specification will depend, in a com-plex way, on such factors as the consequences of premature failure, the design factors-of-safety, manufacturing economics and commercial prestige. A very high level of confidence has been demanded for the nuclear-power industry and this has led to the development of more sensitive and more selective tests than are generally considered necessary in other industries.
Structural variations or defects of one sort or another may be introduced at various stages during component fabrication. Any variation, or defect, that will impair service performance constitutes a flaw in the context of quality inspection and the ability to detect flaws of one kind or another is the common factor demanded of all non-destructive tests. The majority of interest is generally directed towards dimensional flaws (metrology) and the more obvious structural flaws (crack detection). The fact is sometimes overlooked that the more insidious variations in microstructure that can occur may also constitute flaws of comparable significance under particu-lar conditions of service.
There are three reasonably distinct stages in fuel-element manufacture where flaws-detection techniques need to be applied if the fullest use is to be made of non-destructive testing procedures.
23

354 R. S. SHARPE
(a) In the laboratory, the techniques can be incorporated into programmes of materials research to complement those that required destructive means to prepare suitable specimens. For example, in the examination of coated fuel particles, non-destructive X-ray microscopy is providing the type of structural information that tends to be destroyed or masked during sur-face preparation for optical microscopy.
Non-destructive methods of studying microstructural uniformity are still generally regarded as laboratory techniques. Elastic-wave propagation is the basis for a wide range of such techniques. Attenuation is influenced by a number of microstructural features such as grain-size distribution, po-rosity and dislocation loop length, whilst velocity measurements can be used to monitor elastic constants, preferred orientation and internal stress. By means of such techniques potential flaws, arising from structural hetero-geneity, can be pin-pointed at a very early stage in fuel-element design. Being non-destructive, sequential studies can be made on the same sample so that the tests can, if necessary, be extended to include a progressive study of irradiation behaviour.
(b) in the development and pre-production stages, fiaw-detectron techniques can help to categorize materials and compare equivalent or com-petitive products. The data can be used to feed information back to manu-facturers concerning any material or structural non-uniformity. This can usually provide a basis for imprqving the final product. For product assess-ment in this way to be effective, maximum information is required from the tests, calling for particular emphasis to be placed on data recording and information analysis. These detailed, and often painstaking, studies (closely supported by destructive tests) are also required to classify defects likely to occur in a given product so that more objective decisions can be taken on flaw levels and specifications. These preliminary investigations can then be used to design and set up suitable inspection procedures to cope with the subsequent production requirements. It is to these particular aspects of flaw detection that many of the Harwell programmes are primarily directed.
(c) The third field of application of flaw detection is the production ins-pection of components. This calls for carefully engineered installations, test simplicity, clear and simple data presentation and complete unambiguity in flaw interpretation. In general, this application to full-scale production is beyond the terms of reference of the Harwell N.D. T. (non-destructive testing) programme and is not discussed in this paper. The allied problems of post-irradiation component inspection have received some attention at Harwell. The aim here is to devise procedures to duplicate, where necessary, production inspection techniques so that material deterioration and the behaviour of "defects" can be directly studied after reactor service.
Looking forward, there is a further objective in any industry where automated production methods are envisaged. Instead of using non-destructive testing in a purely passive role to detect flaws and reject scrap , the tech-niques should be designed as monitoring procedures at a point in the pro-duction line where corrective action can be automatically initiated to avoid scrap. For example, the continuous non-destructive monitoring of micro-structures might be developed to control heat treatments in the same way that feed-back from radiation thickness gauges is being used to control roll pressures in sheet production.
23*

DEVELOPMENT OF FLAW-DETECTION TECHNIQUES 355
In defining the scope and objectives of non-destructive testing it is easy to foster an impression that it has blossomed into a subject standing in its own right. It should not, of course, be considered in isolation in this way and in order to develop fully must be recognized and accepted as a conjunc-tive theme to the over-all plattern of component design development and pro-duction [1,2, 3] .
3. TECHNIQUES BASED ON X-RAYS AND y-RAYS
The attenuation of photon radiation by electron interaction in passing through materials has led to the widespread use of radiography to detect flaws. Techniques have been developed to pin-point cracks and porosity, locate regions of non-homogeneous distribution in multi-phase systems and measure internal dimensions non-destructively. Work at Harwell has been directed to various problems of this type with the underlying aims pf improv-ing the range of applications, sensitivity, resolution and-radiographic con-trast. The special problems presented by post-irradiation radiography have also led to a variety of methods for discriminating against high levels of ambient gamma radiation that would otherwise tend to mask the image detail.
3. 1. High definition radiography
A number of factors contribute to the unsharpness of a radiographic image. The predominant factor with conventional X-ray equipment is usually the penumbra attributable to the finite size of the X-ray focal spot. By fo -cusing the electron beam before it impinges on the anode an X-ray micro -scope design has been perfected and equipment is now commercially avai-lable1 with a focal spot size as small as 1/Jm. With a thin-foil transmission anode the sample can be brought very close to the source of X-rays and, by a combination of image projection and subsequent photographic enlargement, magnifications are possible to make the fullest use of a resolution down to 1 Mm [4] .
Applications to which the X - r a y microscope has been put at Harwell include the examination of coated nuclear-fuel particles, the distribution of the fissile constituent in fuel plates, the study of micro-cavitation in fuel cans and a comparison of pore-size distributions in reactor graphites. The fact that the microradiographic image is obtained by projection has enabled post-irradiation studies of fuel particles to be made and hot-stage sequential studies of the progression of catalytic oxidation in graphite [5, 6, 8].
When single-crystal specimens are examined in the same way Kossel line diffraction conics are superimposed on the microradiograph. These can be indexed in terms of lattice planes and used to determine accurate unit-cell dimensions [ 7 ] .
In the present equipment up to 1 W is dissipated in the 2-jum-thickmetal-foil target, corresponding to a focal spot loading of 10-100 kW/mm2 at the
1XM30 X-ray Microscope, Hilger& Watts Ltd. (EPI Sales Division).

356 R. S, SHARPE
surfg.ce. A modified design of micro - focus X-ray source is now under test at Harwell with a solid ref lection target capable of dissipating 15 W on a slightly degraded focal spot2 . The uprated output of this equipment opens up a completely new field of conventional radiography where the highest de-finition and resolution are required without the need for the high magnification necessary for microstructural observation. The target assembly is rotatable in vacuum and is constructed of different metals so that a range of mono-chromatic radiations is available for analysing constitutent elements in alloy specimens by a differential absorption technique .
3. 2, Direct-view X-ray techniques
When a permanent photographic record is not essential; when production-line f i lm radiography is uneconomic,or when a moving subject needs to be examined radiographically, direct-image viewing techniques are an attractive alternative.
images can be viewed directly on a fluorescent screen although the image unsharpness is greater than with f i lm recording because of the finite size of the fluorescent crystals and the diffuse spreading of the fluorescent light. By using an X - r a y equipment with an 0 .2 -mm focal spot a projection f luoro-scopic technique has been developed capable of resolving 80-mesh brass gauze L1 Oj. This equipment was engineered at Harwell to provide an inspec-tion procedure for locating cores in M. T. R. fuel plates to a positional ac -curacy of ± 0. 02 in.
More recently, solid-state electro-luminescent screens have been made available3 which retain a useful fluorescent image for about 15 min, with slowly decaying intensity. This provides a cheap alternative to f i lm radio-graphy for detecting the alignment and positioning of internal components and leads in rigs and assemblies [2].
Direct viewing by the use of an electronic image converter largely over-comes the limitation set by f luorescent screen unsharpness. The system being investigated at Harwell uses a selenium-layer image-converter tube that is now commercially available4 . The high inherent definition and the image magnification with the TV monitor presentation makes the system ideally suited to applications such as the inspection of fuel-element end-welds. The converter tube requires radiation dose-rates of 200-400 r /min. at the tube face to produce sufficient image contrast. This unfortunately limits the range of application of the technique by restricting the materials and section thickness that can be examined [2J. A method of increasing the effective contrast by introducing c ircuitry to quantize the video signal i s currently being examined and this might be expected to overcome some of the present difficulties. Penumbral unsharpness is also a problem because of the small focus-to-sample distances that are required to obtain an adequate radiation dose-rate at the sensitive face plate of the converter tube. Initial tests , however, indicate that the output of the uprated X-ray microscope previously
2 Variable Target XM30 Unit. Hilger & Watts Ltd. (ЕИ Sales Division). 3Thorn Electrical Industries Ltd. Enfield, Middlesex. 4Dynamicon ML589. The Machlett Laboratories Inc. Stamford, Conn.

DEVELOPMENT OF FLAW-DETECTION TECHNIQUES 357
re ferred to (section 3 .1) is sufficient to operate the converter tube. The specimen can then be brought up very close to the X - ray source without in-troducing any detectable unsharpness.
'•i. 'd Quantitative radiography
Interpreting data f rom radiographs is usually limited to a visual appraisal of detail, using the image of a stepped or wire image-quality indicator as a reference standard. The attenuation processes in materials, however, are sufficiently well defined to warrant a more detailed analysis of radiographic density in terms of structural homogeneity. A particularly relevant appli-cation of this quantitative approach is the use of transmission radiography to check the uniformity of fuel loading in the c o r e s of nuclear- fuel plates.
The technique of scintillography has been developed at Harwell in which a facsimile record of the isodose contours of radiation transmitted through a fuel plate are obtained. The scanning beam is a 2 -mm narrowly collimated pencil of radiation f r o m an Am2 4 1 source which is mechanically scanned over the whole surface of the plate [14, 15J.
By virtue of the attenuation processes the transmitted radiation contains essential information concerning the point-by-point variation in the uranium loading of the core . The radiation is collected in a scintillation counter linked to the source-scanning mechanism. To facilitate data analysis the integrated count-rate is quantized into predetermined levels which are presented on a facsimile recorder in discrete shades of grey. By suitable calibration the quantized levels can be directly linked to the tolerance levels of uranium content defined in the fuel-plate specif ication.
This radiation-scanning technique is not likely to improve the radiogra-phic detection of discrete structural defects such as cracks or weld porosity. However, it extends the range of radiography into areas of inspection that are beyond what is normally considered to be the scope of f i lm recording.
4. Contrast enhancing techniques
Two inspection problems have arisen where straight-forward radiography provides insufficient contrast to reveal adequate detail.
In the first case, the heterogeneous nature of 1-in-square graphite struts gave a radiographic background pattern in which it was diff icult to detect fine cracks. Carbon tetrachloride was found to be a very suitable liquid to use as a radiopaque penetrant. By dipping the graphite struts into the liquid for a few seconds immediately before radiography, preferential absorption into cracks opening to the surface greatly increased the radiographic con-trast [13 j . The carbon tetrachloride evaporates away completely after the exposure and has no deleterious effect on the graphite. The absorption c o -efficient of carbon tetrachloride also makes it a suitable radiopaque pene-trant for beryllium, beryllia and magnesium samples and it has been shown that it can successfully be used to accentuate detail and study surface profiles in thin microradiographic samples [18].

358 R. S, SHARPE
In the second case, the inspection of graphite-compacted coated fuel particles f or layered segregation in HTR fuel sleeves presented problems of image superposition when radiographed in the normal way across a dia-meter. By threading the fuel sleeves on to cylindrical cassettes and rotating them over narrow slits in a lead mask, through which the X-rays pass,single-tube panoramic radiographs of the fuel tubes were obtained. This greatly enhanced contrast and enabled the uniformity of fuel loading to be assessed without diff iculty and provided the basis f o r a product ion- inspect ion procedure |Д2].
3. 5. Post-irradiation radiography
The main problem with in - ce l l radiography of active specimens is that of overcoming autoradiation blackening of the recording film. Work in this field at Harwell originally stemmed f r o m the requirement in 1949 to inspect the prof i les of uranium fuel bars f rom the BEPO reactor to detect distortion and growth. The technique developed used lead shutters and a lead masking strip to reduce the level of background radiation.
When the emphasis changed to the radiography of active irradiation rigs, their construction and more highly concentrated activities led to the develop-ment of a panoramic technique in which the rig and film were synchronously moved in parallel paths on opposite sides of a 9-in lead shielding block. The block had a central 2 - m m slit in it through which the X-rays were directed to produce the radiographic image [ l l ] .
Use can be made of the energy dependence of f i lm emulsions to d i scr i -minate to a certain extent against the higher energy background gamma radiation. The spectral sensitivity of a wide range of emulsions has been determined at Harwell and in one case (an experimental Kodak emulsion V6035) the sensitivity to 100-kVcp X-rays was found to be 100 times greater than that to Coé0 y -rays [17]. With this emulsion test radiographs have been obtained when the superimposed background gamma radiation dose at the f i lm was as high as 400 r. This implies that, with simple projection, a suitable choice of emulsions and perhaps some form of image recovery after processinga very wide range of active specimens can be radiographed without the need for complex installations.
Electronic methods of energy discrimination using pulse-height analysis has also been used to differentiate between high-energy background radiation and the lower-energy radiation used for the radiographic exposure. A prac-tical system of building up a panoramic radiograph with a scanning scintil-lation counter has already been referred to (section 3. 3) and with this equip-ment an X-ray scintillograph has been obtained of an encapsulated Ir*92 source using a single-channel analyser to process the counts and, in this way, to reject the radiation emitted by the iridium source 15J .
Fine-focus field emission X-ray tubes are now commercially available5
and experiments are being conducted with them at Harwell with a view to developing a radiographic technique for extremely active specimens where
sFexitron X-ray equipment. Field Emission Corporation. McMinnville, Ore, United States of America.

DEVELOPMENT OF FLAW-DETECTION TECHNIQUES 359
other methods are inadequate [16]. It is necessary to use salt intensifying screens with the films because of the comparatively low X-ray dose from each pulse and the salt-screen/film combination will tolerate only a low dose of background radiation. Since, however, the exposures are made in 0. 05-0. IAIS, the film or object may be moving at high speed during the exposure. In this way, the background dose at the film can be kept very small during an exposure.
4. ULTRASONIC AND EDDY-CURRENT TECHNIQUES
Ultrasonic and eddy-current methods of inspection can complement radiography in detecting flaws 1.28] . Ultrasonic energy suffers less attenua-tion than X-rays and consequently, far thicker sections of metals can be examined. In addition, both ultrasonic and eddy-current techniques are sensitive to the finer types of crack and laminations that are not readily detected by X-rays. However, as generally applied, the presentation of the information is less direct than with radiography and interpretation of test signals is open to greater ambiguity. Consequently much of the Harwell effort has been directed towards methods of improving data presentation so as to provide a basis for more reliable and more informative inspection techniques. As well as their ability to detect the discontinuity type of flaw, both ultrasonic and eddy-current techniques can be designed to monitor a number of microstructural deviations which are also liable to constitute a flaw. Work along these lines is in progress although this is an aspect of flaw detection where there is considerable potential for further development.
4. 1. Tube inspection
In a pre-production assessment of reactor-grade tubing for fuel-element sheathing the inadequacies of eddy-current testing became apparent [23J. Because of interference from high background signals caused by slight va-riations in wall thickness, the technique failed to detect fine surface cracks and, in addition, tended to reject tubing unnecessarily. Ultrasonic flaw-detection techniques were found to be more sensitive and more selective, although at the expense of speed of inspection. It was also shown that the use of artificial flaws as calibration standards for the ultrasonic test were not a satisfactory compromise and that efforts should be made to locate suitable natural defects as standards. The ultrasonic test should be supported by a visual examination of the tubing. On the outer surface this is best carried out with the aid of a fluorescent penetrant and. for the bore, a special 360" Borescope was developed that was subsequently found to be satisfactory for production inspections.
A wall-thickness variation can constitute a dimensional flaw in fuel-element sheathing. A very sensitive ultrasonic'micrometer has been devel-oped at Harwell that is capable of measuring wall thicknesses over 1 mm2 of surface [22]. A 50-/us pulse of ultrasound is focused, through a water coup-
d e v e l o p e d by Mr. C. F. Smith, Wood End Close, Farnham Common, Bucks. UK.

360 R. S, SHARPE
lant, on to the surface of the tubing. By adjusting the frequency of the ultra-sound in the pulses, values can be found where there is zero reflection back to the probe over the central portion of the pulse. The effect occurs at f re -quencies very close to the fundamental and harmonic resonances of the tube wall and it is suggested that at these frequencies- the energy is transferred along the tube away from the incident point as slowly propagating Lamb-wave modes, which rapidly re-radiate in a non-normal direction [35J. The ac -curacy by which these reflection nulls can be set is equivalent to wall-thickness variations of approximately 0, 5дш.
F o r the measurement of a wall thickness of hollow uranium fuel tubes with a 0. 35-in wall, a commerc ia l precision ultrasonic pulse-echo instru-ment has been used which is capable of resolving individual cyc les of the ultrasonic pulse1 . The transit time of the pulses across the wall is approxi-mately 5 /us and it was found possible to measure this with an accuracy of 1%. To avoid e r r o r s due to variations in water-couplant path-length a gating system was used so that the time measurement could be initiated by the front surface echo and terminated by the arrival of the back wall echo. Since individual measurements of wall thickness are possible with each pulse, 2000 measurements a second could be achieved which provided an extremely high inspection speed [24].
The uniformity of tube bore is important in sheathing into which fuel pellets must be loaded with a minimum resultant peripheral clearance. Air gauges are accurate, but have a poor response time. Work at Harwell has been directed towards improved forms of capacitance gauge, and probe beads have been designed to reduce errors arising from lateral movements of the capacitance probe about the tube axis during the spiral scan through the tube The possibility of using a porous metal plug to act as an internal air bearing for a capacitance probe is currently being examined [24J.
4. 2. Quantized facsimile recording
It is obviously an advantage to have the faciUty to record test data as comprehensively as possible. With the quantized facsimile recording system developed at Harwell, signal strengths can be recorded as discrete and pre-determined shades of grey at points on a facsimile record that automatically define two positional co-ordinates in the sample L21, 27J . In ultrasonic testing this has enabled the shapes of individual defects to be examined and the pat-tern of scatter f rom anisotropic microstructures to be studied [ l 9 j . In ad-dition, scanning with a small received probe in the vicinity of an immersed ultrasonic transducer has enabled contoured polar diagrams to be produced f rom which the radiation characteristics of the transducer can be seen at a glance [20]. All of this is of value in the laboratory and development stages of non-destructive testing application and should help to provide a more basic understanding of materials,, test equipment and inspection procedures.
With eddy currents, quantized facsimile recording can help to improve the selectivity of the tests. With graphite and stainless steel, where exces-sive "noise" is often a problem, a facsimile presentation can f o r m a r e c o g -
7 Microradar Unit. Réalisations Ultrasoniques, Meaux, France.

DEVELOPMENT OF FLAW-DETECTION TECHNIQUES 361
nizable pattern f r o m the background no i se against which s ignals f r o m discrete defects are readily distinguished [24J. The two-dimensional method of r e c o r d i n g e d d y - c u r r e n t s ignals has a l s o been used to d i sp lay the exact s i ze and locat ion of vo ids in the sodium inter layer o r i rradiat ion capsules . This has provided a technique to enable the mechan i sm of sodium fil l ing to be studied and the var iab les contro l led [25 ] .
4. 3. The ultrasound camera
I m a g e - c o n v e r t e r tubes are of interest in a number of f i e lds and w o r k has been in p r o g r e s s at Harwel l f o r a number of y e a r s to t r y to per fec t an inspect ion s y s t e m based on an ultrasonic i m a g e - c o n v e r t e r tube L29, 30, 31J. A converter-tube design has been developed using a 1. 5 - in-d iam. quartz face plate resonant at 4 MHz [32J. The sequence of operation i s that the quartz plate is f i r s t brought to earth potential . A p i ëzoe l e c t r i c charge pattern i s then built up on it by virtue of the ultrasound image thrown on it by an acous -t ic lens in the inspec t i on tank. The charged plate i s then scanned with a l o w - v e l o c i t y e l e c t r o n beam and the pattern of deposited e l e c t r o n s induces a corresponding charge pattern on an adjacent signal plate which is connected through a f i l ter and ampl i f i e r to a T V moni tor d isplay . The sur face is then restored to earth potential by residual ion bombardment and the operating sequence repeated.
In this way a d i rec t -v i ew facs imi le type of presentation is obtained, but because of the speed of the operating sequence theobject can be moved during inspection. The fa ir ly c o a r s e scan pitch also provides a more rapid rate of inspection than the conventional probe-scanning technique.
The system suf fers f r o m aberrations and has still not been transformed into a fully engineered inspection equipment. However, it shows promise as a m e a n s of scanning fue l p lates f o r unbonded a r e a s between the c o r e and cladding. The sensit ivity appears to be super ior to probe scanning and the speed of inspection i s m o r e compatible with production rates [33, 34J. As a result the w o r k at Harwel l i s being d i rec ted p r i m a r i l y with this part icular application in mind.
5. CONCLUSIONS
This paper has purposely not attempted to highlight any particular f law-detection technique. Instead, as a rev iew, it has provided the Harwel l in -te rpre ta t i on of the range and s c o p e of n o n - d e s t r u c t i v e f law detect ion and served as a means of summarizing the programmes and published reports of recent years .
R E F E R E N C E S
The fol lowing list of r e f e r e n c e s c o v e r s all the unclassi f ied publications deal ing with the N. D. T . deve l opment w o r k of the Meta l lurgy D i v i s i o n at Harwe l l .

3 6 2 R. S, SHARPE
General review articles
il] SHARPE, R. S., Future Developments in Non-Destructive Testing, Brit. J. non-destr. Test. 3(1961)
111 . [2] SHARPE, R. S „ Non-Destructive Testing in Perspective, Brit. J. non-destr. Test. 5 (1963) 83.
[3] SHARPE, R. S., The Physicists Approach to Non-Destructive Testing, Bull. Inst. Phys. 15 (1964) 223.
Microraaiograpny
[4] SHARPE, R. S., X-Ray Microscopy, Progr. in non-destr. Test. 3 (1961) 191.
[5] SHARPE, R. S., S o m e Applications of Microradiography to Fuel Element Inspection, Fuel Element
Fabrication 2, IAEA, Vienna (1960) 45.
[ 6] SHARPE, R. S., X-Ray Microscopy applied to the Examination of Coated Nuclear Fuel Particles,
Harwell Report AERE - R. 4252 March 1963, and React. Sci. Tech. А/В Г^ (1963) 505.
17] SHARPE, R. S., Divergent B e a m X-ray Diffraction and its Application to Irradiated M g O , Harwell
Report AERE - R. 4452 October 1963, and Appl. Mat. Res. April 1965 (to be published).
L8] SHARPE, R. S., Divergent Beam X-ray Microscopy and Crystal Analysis, Proc. 4th Symp. on Physics and
N D T (1963) (published by S.W. Research Institute) 193.
Radiographic techniques
[9] THEWLIS, J. and DERBYSHIRE,R. T . P., Neutron Radiography, AERE M T / N 37. July 1956, and Progr.
in non-destr. Test. I (1958) 113.
[10] THEWLIS, J. and DERBYSHIRE, R. T P., Non-Destructive Testing of Fuel Elements for DIDO, J. Amer.
Soc. non-destr. Test. 16 (1958) 154.
[11] DERBYSHIRE, R. T . P., Radiological Examination of Highly Active Specimens, E.A.N.S. Symp. on
reactor materials, Paper U K 26 (1959).
[ 12] DERBYSHIRE, R. T . P., A Multiple Panoramic Apparatus for Radiographic Examination of H . T . R. Fuel
Sleeves, Harwell Report AERE - R. 3855 Dec. (1961).
[ 13] COTTERELL, K. and SHARPE, R. S., The Use of Carbon Tetrachloride as a Radiopaque Penetrant.
Harwell Report AERE - R.3785 Sept. 1961 and Amer. J. non-destr. Test.20 (1962) 234.
U 4 J COTTERELL, K., Scintillography as an Alternative to Radiography, Harwell Report AERE - R.4293, M a y
(1963).
[ 15] COTTERELL, K., Scintillography as a Means of Recording Radiographic Information, Appl. Mat. Res. 3
(1964) 102:
[16] DERBYSHIRE, R. T.P., HEWITT, G.F. and NICHOLLS, В., X-Radiography of Two-Phase Gas-Liquid Flow,
Harwell Report AERE - M . 1321, Jan. (1964).
[17] SHARPE, R. S., DERBYSHIRE, R. T.P. and PARISH, R. W., The Development of Active Radiographic
Inspection Techniques at Harwell, E.N.E.A. Conference on Working Methods in High Activity Hot
Laboratories, Grenoble, June 1965, Paper No. 7 (to be published).
[18] J A C K S O N , R. and SHARPE, R. S., Radiographic Techniques Applied to Carbons, Chapter in "Porous
Carbon Solids" (to be published).
Ultraeonice and eddy-current techniques
[19] SHARPE, R.S. and A V E Y A R D , S., The Visualisation of an Ultrasonic Extinction Network in Coarse
Grained Uranium, Appl. Mat. Res. 1 (1962) 170.
[20] A V E Y A R D , S., Radiation Patterns from Ultrasonic Probes, Brit. J. non-destr. Test. 4 (1962) 120.
[21] A V E Y A R D , S., A High Definition Ultrasonic Recording System, Inst. Welding Select Conf. on Ultrasonic
Testing 1963, M e m o No. 10.
L22] AVEYARD, S. and SHARPE, R. S., Applications of Pulse Interference," Proc. 4th Int. Conf. on Non-Destr.
Test., Butterworth (1964) 150.
[23 J SHARPE, R.S. and A V E Y A R D , S.,The Inspection of Thin Walled Stainless Steel Reactor-Grade Tubing,
J. Iron and Steel Inst. 201 (1963) 856.
[24J A V E Y A R D . S,, Rapid Methods of Tube Measurement, Harwell Report AERE - M . 1431, July (1964).

DEVELOPMENT OF FLAW-DETECTION TECHNIQUES 363
[25] A V E Y A R D , S., Plotting the Position of Voids in a Sodium Heat Transfer Layer, Harwell Report AERE -
M . 1391, June (1964).
L26J SHARPE, R. S. A V E Y A R D , S. and SAYERS, J. F., The Inspection of Fuel Element Bonding, Harwell
Report AERE - R. 4605, April (1964).
[27] H O D G K I N S O N , W . L., A Quantised System of Facsimile Recording, Harwell Report AERE - R.4688, July
(1964).
[28] SHARPE, R. S., Low Power Ultrasonic Techniques for Materials Inspection, Ultrasonics 3 (1965) 25.
The ultrasonic camera
[29] SAYERS, J. F., Epoxy-Resin Joints for Sealed Off High Vacuum Tubes, J. sci. Instrum. 37 (1960) 203.
[30] S M Y T H , C . N . and SAYERS, J.F., Improvements in or Relating to Ultrasonic Viewing Devices, Brit.
Patent No. 841025, July (1960).
[31] S M Y T H , C.N., P O Y N T O N , F.Y. and SAYERS, J.F.,The Ultrasound Image Camera, Procl.E.E. 110
(1963) 16; and J. I. E.E. _9_(1963) 26.
[32] SAYERS, J. F., The Ultrasound Camera: Part 1, The Instrument Constructed at A. E. R. E., Harwell Report
AERE - R. 4356, Nov. (1963).
[33] SAYERS, J. F., The Ultrasound Camera, Progr. in appl. Mat. Res. 1 (to be published).
[34] SAYERS, J. F., The Ultrasound Camera, Proc. 5th S y m p . Physics and N . D . T . (to be published).
Supporting and supported work
[35] ALDRIDGE, E. E. , (Electronics Division), An Investigation into the Mode of Working of the Ultrasonic
Micrometer used in Thickness Measurements of Thin Wall Stainless Steel Tubing, Harwell Report AERE-
M . 1510, (1965).
L 36j M O T T , G., A Study of Wave Propagation in Thin Sheets, University oi London PhD Thesis, Jan.(1960).
[37] SMITH, R. T., The Propagation of Elastic Waves in Anisotropic Solid Media, University of London M . Sc.
Dissertation, June (1961).
[38] FINNEY, D., Ultrasonic Field Investigations, University of London PhD Thesis, June (1964).
[39] BARTON, J. P., (University of Birmingham), Contrast Sensitivity in Neutron Radiography, Appl. Mat. Res.
(to be published).
[40] BARTON, J. P., (Univeristy of Birmingham), Radiographic Examination through Steel Using Cold Neutrons,
(to be published).
D I S C U S S I O N
J. DORY: What is the resolution of the acoustic image converter? R. SHARPE: In the object plane we find that the resolution is better
than 1. 5 mm at 4 MHz using a lens systems It is quite surprising that such a high resolution can be obtained for a piezoelectric image impressed on the thin quartz face-plate of the converter tube.
J. DORY: Are you not troubled by interference through continuous operation?
R. SHARPE: Yes. This is one of the major problems, especially inter-ference ef fects within the sample. We hope to develop a pulse-sensit ive converter tube to over come this spurious ef fect .
J . DORY: What acoustic power is n e c e s s a r y ? R. SHARPE: Between 0. 1 and 10 W at the transmitter, depending on
the attenuation in the sample. V. V. GORSKY: Did I understand correct ly that to obtain relief on the
facs imi le the voltage on the eddy-current detector is changed for two or three surface scans?

364 R. S, SHARPE
R. SHARPE: To obtain the contours on the facs imi le record the signal voltage f r o m the eddy-current equipment is quantized into discrete amplitude l e v e l s , each of which can be d isp layed in a p r e d e t e r m i n e d writ ing shade.
V . V . GORSKY: What defect do you regard as p e r m i s s i b l e in the wall (can) of the fuel e lement and what i s the p e r m i s s i b l e area of poor bonding, f o r instance in flat fue l e l ements?
R . SHARPE: We a r e not d i r e c t l y r e s p o n s i b l e at Harwel l f o r setting mater ia l spec i f i cat ions f or reac tor components, so I am not the best person to quote current de fec t t o l e r a n c e s . Until m o r e exper imenta l ev idence of de fec t s ign i f i cance i s avai lable our standards are inevitably based on c o n -servat ive es t imates and prev ious operat ional e x p e r i e n c e .
V . GERASIMOV: With what a c c u r a c y do you m e a s u r e the t u b e - w a l l th i ckness using the e d d y - c u r r e n t m e t h o d ?
R. SHARPE: We are not using an eddy-current method f o r any routine measurement of tube-wal l thickness. On the slide I showed during my oral presentation to i l lustrate what we cal l the Eddyfax technique, each c o n -tour in the f a c s i m i l e r e c o r d c o r r e s p o n d e d to a th i ckness change of about 0. 0002 in f o r a s t a i n l e s s - s t e e l tube, with a 0. 015 - in wal l .
V. GERASIMOV: Have you eliminated the ef fects of changes in the e lec -t r i ca l conductivity of the component being inspected and changes in the d i s -tance between probe and tube?
R. SHARPE: To obtain this display the eddy-current scanning probe was spring- loaded against the wall of the tube to eliminate the l i f t -of f effect . This naturally r educes inspect ion speed. We were in fact using speed, of about 60 r p m .
G. TENNEY: What are the s ize and intensity of the source for the Am241
radiation gauge? R. SHARPE: Although the g a m m a radiation emanates f r o m a flat en -
capsulated 2 0 0 - m c source , 7 m m in diameter , only a fract ion of the output i s made use of, as it i s n e c e s s a r y to m a s k the front face of the s o u r c e to prov ide the n a r r o w penc i l of radiation (1 o r 2 m m in d iameter ) needed to give adequate radiographic definition. Count rates in excess of 10 5 / counts / s are obtained and this enables us to obtain an inspect ion speed of about one inch length of fuel plate per minute.
P . de MEESTER: What a c c u r a c y can you obtain in fue l homogeneity? With y o u r quantized r e c o r d i n g I a s s u m e that you a r e putting two o r three quantized l eve l s at both upper and l ower to lerance l imits . How far do you have to put these apart to get good a c c u r a c y ?
R. SHARPE: In the present mode of operation we only use three intensity shades in the quantized record ing of a fuel plate - one shade of grey f or c ompos i t i ons within spec i f i cat ion and two other shades to indicate uranium contents above and be low spec i f i ca t i on . The method of standardizing and setting the quantized levels is naturally influenced by statistical considerations although the l ine -by - l ine corre lat ion in the facs imi le r e cord helps to smooth out some of the statistical uncertainty.

THE NON-DESTRUCTIVE TESTING OF FUEL ELEMENTS AND THEIR COMPONENTS
FOR THE UNITED KINGDOM POWER-REACTOR DEVELOPMENT PROGRAMME
C . A . M A N N A N D I . C . C A M P S Œ
U . К . A . E . A . , R E A C T O R F U E L E L E M E N T L A B O R A T O R I E S ,
S P R I N G F ΠL D S , S A L W I C K , P R E S T O N , L A N C S . , E N G L A N D
A b s t r a c t — R é s u m é — А н н о т а ц и я — R e s u m e n
T H E N O N - D E S T R U C T I V E TESTING OF FUEL E L E M E N T S A N D THEIR C O M P O N E N T S FOR T H E
UNITED K I N G D O M POWER-REACTOR D E V E L O P M E N T P R O G R A M M E . The test procedures are described which
have been developed in the Reactor Fuel Element Laboratories as part of the Reactor Group's development
programme on fuel pins for a number of reactor systems. The sheaths of these pins are tubes in the range 5 m m -
15 m m diam; the materials are stainless steels and zirconium alloys.
(a) Flaw detection in tubes is decribed.
Ultrasonic inspection using two immersed probes. The tubes are traversed helically at high speeds through
a stationary tank. Flaw signals are monitored and recorded. Spark-machined slots on the surfaces of tubes are
used as references in setting up the system and in checking its stability.
Eddy-current inspection is also employed in some cases. T w o tests are described : an encircling coil
system with rapid throughput, and a surface coil with helical scan. Phase selection and filtering of the output
from a bridge circuit is used, at frequencies between 30 and 60 kHz.
(b) Dimensional inspection of tubes and pellets is also discussed.
Various mechanical, pneumatic, nuclear and electronic methods of measuring the tube dimensions are
compared and the arrangements to prevent the scratching of the tubes are described.
Techniques for measuring pellet diameter and circumferences are explained and it is suggested that
with thin-walled tubes a more realistic approach to the pellet/gap problems can be obtained by comparing
circumferences.
With the development of efficient tube-traversing equipment it has been possible to combine the above
development technique to form a completely integrated tube-testing facility operated by sémi-skilled labour.
The laboratory's requirement for precise information of tube sizes has been met by the automatic recording of
measurements, eliminating a time-consuming and somewhat inaccurate method of manual recording of the
results.
For flaw detection in fuel pins, the techniques already mentioned can in general be applied to examine
the sheaths of fuel pins, i. e. after fuel has been loaded and the ends closed. In addition, the integrity of end
closures is established, by radiography. Multiple exposures are commonly made to examine the whole of circum-
ferential weld adequately. The disposition of the fuel can also be recorded accurately by using a panoramic
technique. The use of colour radiography is also discussed. .
Pins are normally tested for leakage after filling with helium, using a mass-spectrometer leak detector.
Pins not filled with helium m a y be tested using a "back-pressurizing" technique. Conventional "probing" and
"sniffing" methods are used when it is desirable to locate the sites of leaks. The bubble test in liquids is also
used, as a cheap and simple test. The use of krypton-85 as a tracer gas is discussed.
CONTROLE N O N DESTRUCTIF DES ELEMENTS COMBUSTIBLES ET DE LEURS PARTIES CONSTITUTIVES
D A N S LE CADRE D U P R O G R A M M E DE DÉVELOPPEMENT DES RÉACTEURS DE PUISSANCE A U ROYAUME-UNI.
Les auteurs décrivent les méthodes d'essai que les laboratoires chargés des éléments combustibles ont élaborées
dans le cadre du programme établi par le « Groupe des réacteurs» en vue de mettre au point des aiguilles de
combustible pour diverses filières de réacteurs. Ces aiguilles sont contenues dans des gaines de 5 à 15 m m de
diamètre, les matériaux utilisés étant des aciers inoxydables et des alliages de zirconium,
a) Détection de défauts dans les gaines.
Examen par ultrasons î l'aide de deux traducteurs immergés. Les tubes sont animés d'un mouvement'
365

366 С. A. MANN and I. С. CAMPSIE
hélicoïdal rapide dans un réservoir fixe. Chaque signal de défaut est vérifié et enregistré. Pour régler le dis-
positif et vérifier sa stabilité, on utilise c o m m e témoins des fentes pratiquées à l'arc à la surface des tubes.
Dans certains cas, on a également recours au contrôle par courants de Foucault. Les auteurs décrivent
deux procédés: l'un, à débit rapide, est fondé sur un système de bobines encerclant le tube; l'autre, S explo-
ration hélicoïdale, utilise une bobine se déplaçant le long du tube. Les signaux fournis par un circuit à pont
sont sélectionnés selon la phase et filtrés, pour des fréquences de 30 à 60 kHz.
b) Contrôle des dimensions de tubes et de pastilles.
Diverses méthodes mécaniques, pneumatiques, nucléaires et électriques permettant de mesurer les
dimensions des tubes font l'objet d'une étude comparative. On décrit les mesures qui sont prises pour ne pas
rayer la surface des tubes.
Les auteurs exposent les procédés employés pour mesurer le diamètre et la circonférence des pastilles:
pour les tubes â paroi mince, les problêmes que pose le rapport entre le volume des pastilles et celui des vides
pourraient être traités de façon plus réaliste en comparant les circonférences.
La mise au point d'un appareil efficace de rotation des tubes a permis de combiner les méthodes décrites
ci-dessus et de construire un dispositif d'essai entièrement intégré dont l'utilisation ne nécessite pas un per-
sonnel hautement qualifié. Pour que le Laboratoire puisse obtenir rapidement des renseignements précis sur les
dimensions des tubes, on procède à l'enregistrement automatique des mesures; on a ainsi supprimé l'opération,
lente et quelque peu inexacte, d'enregistrement 3 la main.
En ce qui concerne la détection des défauts dans les aiguilles de combustible, les méthodes exposées sous
le point a) peuvent, en règle générale, servir à examiner les gaines d'aiguilles de combustible après le charge-
ment du combustible et l'obturation des extrémités. En plus, l'état des bouchons terminaux est vérifié par
radiographie. On fait normalement des expositions multiples pour examiner convenablement toute la péri-
phérie des soudures. On peut également déterminer avec précision la répartition du combustible par radio-
graphie panoramique. Le recours à la radiographie en couleurs est également étudié.
L'étanchéité des aiguilles est vérifiée après remplissage d'hélium au moyen d'un détecteur de fuites S
spectromètre de masse. Les aiguilles ne contenant pas d'hélium peuvent être contrôlées par immersion dans
un milieu sous pression. Pour localiser les fuites, on peut appliquer, le cas échéant, des méthodes d'investi-
gation classiques. On utilise aussi le procédé simple et peu coûteux qui consiste à plonger la pièce dans un
liquide et 5 observer la formation de bulles. Enfin, les auteurs discutent l'emploi du krypton-85 c o m m e
radioindicateur.
НЕДЕСТРУКТИВНОЕ ИСПЫТАНИЕ ТЕПЛОВЫДЕЛЯЮЩИХ ЭЛЕМЕНТОВ И ИХ КОМПО-
НЕНТОВ ДЛЯ ОСУЩЕСТВЛЕНИЯ ПРОГРАММЫ СОЕДИНЕННОГО КОРОЛЕВСТВА ПО РАЗ-
РАБОТКЕ ЭНЕРГЕТИЧЕСКИХ РЕАКТОРОВ. Описываются методы испытаний, которые раз-
работаны в лабораториях реакторных тепловыделяющих элементов в порядке осуществления
программы реакторной группы по разработке тепловыделяющих элементов в виде тонких стер-
жней для ряда реакторных систем. Оболочка этих стержней представляет собой трубку ди-
аметром 5-15 мм и изготавливается из нержавеющей стали и сплавов циркония.
а. Дефектоскопия в трубках
Ультразвуковая проверка с помощью двух погруженных зондов. Трубки перемещаются
винтообразно с большой скоростью через неподвижный бак. Сигналы дефекта измеряются
и регистрируются. Сделанные с помощью дугового разряда прорези на поверхностях тру-
бок используются в качестве эталона при установке системы и проверке ее стабильности.
В некоторых случаях проверка осуществляется также при помощи метода вихревых то-
ков. Описываются два испытания,одно с замкнутой катушечной системой с быстрой произ-
водительностью, а другое - с поверхностной катушкой с винтовой разверткой. Используется
выбор фаз и фильтрация выходного напряжения из мостовой схемы в диапазоне частот от
30 до 60 килогерц.
б. Проверка размеров трубок и таблеток
Сравниваются различные механические, пневматические, ядерные и электронные ме-
тоды измерения размеров трубок. Описываются меры по предотвращению царапин на труб-
ках.
Объясняются методы измерения диаметра и длины окружности таблеток. Предполагается,
что с помощью тонких трубок можно добиться более реалистического подхода к проблемам
таблетка/зазор путем сравнивания длины окружностей.
Разработка эффективного оборудования для перемещения трубок позволила комбини-

NON-DESTRUCTIVE TESTING OF FUEL ELEMENTS 3 6 7
ровать вышеупомянутые методы разработки в целях создания комплексного устройства для
испытания трубок, которым управляют полуквалифицированные рабочие. Требование, ко-
торое предъявляется лабораторией в отношении точной информации о размерах трубок, удов-
летворяется за счет автоматической записи измерений, что устраняет необходимость при-
менять ручной метод записи результата, который тр̂бует̂много времени и является несколь-
ко неточным.
Дефектоскопия в общем применима для проверки оболочек тепловыделяющих элементов
в виде тонкого стержня, т. е. после загрузки топлива и заделки концов. Кроме того, целост-
ность закрытых концов определяется с помощью радиографии. Многократное облучение обыч-
но производится для необходимой проведи всего сварного шва по длине окружности. Поло-
жение топлива также можно точно зарегистрировать с помощью панорамного метода. Рас-
сматривается также использование цветной радиографии.
Стержни обычно испытываются на течь после наполнения гелием с помощью масс -
спектрометрического течеискателя. Стержни, которые не наполняются гелием, можно испы-
тывать методом повышения "обратного давления". Обычные методы зондов и "всасывания
воздуха" используются в тех случаях, когда желательно найти места течи. Используется
также проба на образование пузырей в качестве дешевого и простого испытания. Обсуж-
дается вопрос использования криптона-85 в качестве индикаторного газа.
ENSAY O N O DESTRUCTIVO DE ELEMENTOS COMBUSTIBLES Y SUS C O M P O N E N T E S , EN EL M A R C O DEL
P R O G R A M A DE REACTORES DE POTENCIA DEL REINO UNIDO. Los procedimientos de ensayo que se exponen
han sido establecidos en el Laboratorio de combustibles nucleares, como parte del programa del Grupo corres-
pondiente, relativo a varillas de combustible para reactores de distintos tipos. La vainas de esas varillas con-
sisten en tubos de acero inoxidable o aleaciones <Je circonio de 5 a 15 m m de diámetro.
a) Se describe la localización de fallas o grietas en los tubos.
Inspección ultrasónica con dos sondas sumergidas. Los tubos se someten a un barrido helicoidal a gran
velocidad en un tanque estacionario, con lo cual se observan y registran las señales que denotan la existencia de
fallas. Para calibrar el sistema y comprobar su estabilidad, se usan como referencias unas ranuras practicadas
por chisporroteo.
En ciertos casos se recurre también a la inspección mediante corrientes de Foucault. Los dos métodos que
se describen emplean un sistema de bobina anular de pasaje rápido y una bobina superficial con exploración
helicoidal. Para la selección de fases y filtrado de la señal de salida se una un circuito de puente, con fre-
cuencias comprendidas entre 30 y 60 kHz.
b) Se discute además la inspección de las dimensiones de tubos y pastillas.
Se hace un estudio comparativo de diversos métodos mecánicos, neumáticos, nucleares y electrónicos de
medición de las dimensiones de los tubos, y se explican las precauciones que han de adoptarse para impedir
que éstos se rayen.
Se describen técnicas para medir el diámetro y la longitud de la circunferencia de las pastillas y se reco-
mienda la comparación de las circunferencias, en el caso de tubos delgados, como método más ajustado a la
realidad para el estudio de los problemas que plantea la existencia de huecos entre las paredes del tubo y las
pastillas.
El perfeccionamiento de equipo para el desplazamiento transversal de tubos ha permitido, mediante una
combinación de técnicas, instalar un dispositivo de ensayo que puede ser manejado por personal semiespeciali-
zado. Las necesidades del Laboratorio én cuanto a datos de precisión sobre las dimensiones de los tubos pueden
satisfacerse con un sistema automático que registra los datos y permite prescindir del método laborioso y algo
inexacto de anotación manual de los resultados.
En el caso de la localización de fallas en las varillas de combustible, el método expuesto en el párrafo
a) puede utilizarse en general para examinar los tubos de revestimiento después de haber efectuado la carga
del combustible y de haber cerrado los extremos del tubo; además, la integridad del cierre se comprueba
radiográficamente. Para verificar adecuadamente el estado de una soldadura circular, se toman varias radio-
grafías. Utilizando una técnica panorámica puede también registrarse con exactitud la disposición del combus-
tible. Se estudia además la posibilidad de utilizar la radiografía cromática.
La detección de escapes en las varillas de combustible suele realizarse utilizando un espectrómetro de
masas después de haber procedido al rellenado con helio. Si éste no es posible, puede aplicarse un procedi-
miento de contrapresión. Para localizar los escapes se utilizan los métodos ordinarios de sondeo o «rastreo».
Un procedimiento sencillo y poco oneroso aplicable cuando se trata de lfquidos, es el de burbujeo. Se estudia la
posibilidad de utilizar el kriptÓn-85. como gas indicador.

368 С. A. MANN and I. С. CAMPSIE
1. INTRODUCTION
The r e a c t o r s y s t e m s current ly being deve loped by the R e a c t o r Group U . K . A . E . A . have fuel e lements in the f o r m of c lus ters of fuel p ins . The pins are, typically, stacks of uranium-dioxide pellets enclosed in metal tubes with welded c l osures at each end. This paper d iscusses the methods of non-destruct ive testing and measurement applied to the components of the fuel pin be fo re assembly , and to the fuel pin after assembly . These will be con-s idered under the following headings:
Flaw detection of the tubing. Dimensional inspection of tube and fuel . Checking the integrity of finished pins.
2. INSPECTING TUBING FOR FLAWS
2.1. Ultrasonic flaw-detection
Al l tubing f o r fuel e l ements is examined u l t rasonic al ly, e i ther at the m a n u f a c t u r e r ' s woirks o r in U . K . A . E . A . l a b o r a t o r i e s . The apparatus in the Reactor Fuel Element Laborator ies is in the now conventional form using two pulse -echo f law-detection sets, with the transducer probes oriented, one to detect flaws extended parallel to the axis of the tube and the'other to detect flaws extended around the tube wall (Fig. 1). The transducers are coupled to the tube by water in which they and it are immersed . The ultrasound enters the tube o v e r a smal l area; it has been found advantageous f o r most tests to concentrate the energy by using a spher ica l ly concave c rys ta l in the trans-ducer . The tube must there fore be systematica l ly scanned if every part is to be examined. In the apparatus used in these laboratories the tube is spiralled past the transducers , which are fixed (Fig. 2).
C o m m e r c i a l pu l se - e cho detector sets are used; the sets have however been mod i f i ed by the m a k e r s s o that the pulse repet i t ion rates have been raised to 3000 p u l s e s / s f r o m 600 p u l s e s / s . A higher scanning speed is thus p o s s i b l e . The pulse emiss i on is a lso synchronized to el iminate c r o s s -interference between the two transducers . The returning signals f rom flaws are detected by moni tor units and passed through p r e - a m p l i f i e r s to a two-channel p e n - r e c o r d e r . The f r equency of the pulsed ultrasound i s in the range 2 -12 MHz, with 4 and 6 MHz as the p r e f e r r e d f requenc ies . Conven-tional t ransducers using such mater ia ls as bar ium titanate, lead z irconate o r lithium sulphate are used . It has been found convenient on o c c a s i o n to make up transducers in the laboratory f rom crystal blanks [1] . The radiation patterns in water are plotted, using the system developed by AVEYARD L2] to con f i rm that the t ransducer is functioning sat is factor i ly .
B e c a u s e of the variat ions between nominal ly identical t ransducers , it is n e c e s s a r y to set the exact pos i t ions of the t r a n s d u c e r s in the test tank empir i ca l ly . A spec imen p iece of the tubing under test is used f o r ca l ibra -tion. Into this p i e c e a r e s p a r k - e r o d e d standard s q u a r e - s e c t i o n no t ches , typically 1.2 mm X 50 ц т X 50 pm. Four such notches are normally machined

NON-DESTRUCTIVE TESTING OF FUEL ELEMENTS 369
T R A N S V E R S E D E F E C T
P R O S E
Fig.l
Disposition of ultrasonic transducer probes
in each ca l ibrat ion p i e c e . T w o are on the outs ide s u r f a c e and two on the bore , and of each of these pa i rs one is machined with its m a j o r dimension para l l e l to the axis of the tube while the o ther i s mach ined c i r c u m f e r e n -tially. The t ransducers are adjusted until an equal response i s obtained on the r e c o r d e r f r o m each of the four notches as the cal ibrat ion p iece passes through the equipment, the two longitudinal notches appearing on one r e -c o r d e r channel , and the two c i r c u m f e r e n t i a l ones on the o ther .
There is evidence that the mode of propagation of the ultrasonic pulses on entering the wal l of the tubing i s not s imple , and that m o d e c o n v e r s i o n o c c u r s , as might be expected . The signal returned f r o m any discontinuity varies markedly with distance f rom the point of entry of the ultrasound, with d i s s i m i l a r var iat ions f o r d iscont inuit ies on the inner and outer s u r f a c e s .
24
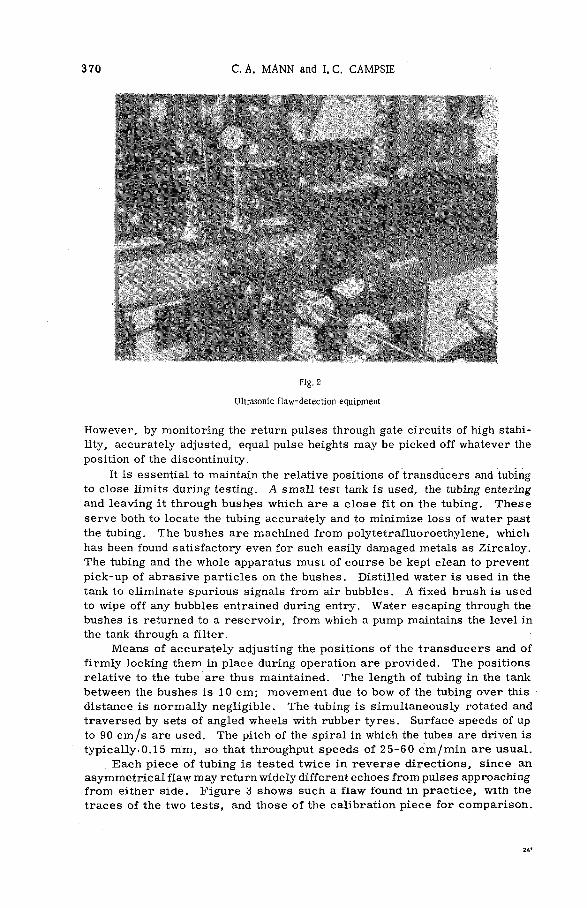
370 С. A. MANN and I. С. CAMPSIE
Fig. 2
Ultrasonic flaw-detection equipment
However, by monitoring the return pulses through gate circuits of high stabi-lity, accurately adjusted, equal pulse heights may be picked off whatever the position of the discontinuity.
It is essential to maintain the relative positions of transducers and tubing to c l ose l imits during testing. A small test tank is used, the tubing entering and leaving it through bushes which a r e a c l o s e f it on the tubing. T h e s e serve both to locate the tubing accurately and to minimize loss of water past the tubing. The bushes are machined f r o m polytetraf luoroethylene, which has been found satisfactory even for such easily damaged metals as Zircaloy . The tubing and the whole apparatus must of c o u r s e be kept c lean to prevent p ick-up of abras ive part i c les on the bushes . Disti l led water is used in the tank to el iminate spurious signals f r o m air bubbles. A fixed brush is used to wipe off any bubbles entrained during entry. Water escaping through the bushes is returned to a r e s e r v o i r , f rom which a pump maintains the level in the tank through a f i l ter .
Means of a c curate ly adjusting the pos i t ions of the t ransducers and of f i r m l y locking them in p lace during operation are prov ided . The posit ions re lat ive to the tube are thus maintained. The length of tubing in the tank between the bushes is 10 c m ; movement due to bow of the tubing o v e r this distance i s normal ly neg l ig ib le . The tubing i s s imultaneously rotated and traversed by sets of angled wheels with rubber tyres . Surface speeds of up to 90 c m / s are used. The pitch of the spiral in which the tubes are driven is typica l ly .0 .15 m m , s o that throughput speeds of 2 5 - 6 0 c m / m i n are usual .
E a c h p i e c e of tubing i s tes ted tw i ce in r e v e r s e d i r e c t i o n s , s i n c e an asymmetr i ca l f law may return widely different echoes f rom pulses approaching f r o m either s ide . F i g u r e 3 shows such a f law found in p r a c t i c e , with the t r a c e s of the two tests , and those of the ca l ibrat ion p i e ce f o r c o m p a r i s o n .
24*

NON-DESTRUCTIVE TESTING OF FUEL ELEMENTS 371
Fig.3
Detection of a flaw

372 С. A. MANN and I. С. CAMPSIE
I N T E R N A L
EXTERNAL
EXTERNAL
" ^ L O N G I T U D I N A L DEFECTS
TRANSVERSE DEFECT
INTERNAL
Fig. 3
Detection of a flaw
This differential sensitivity suggests that one of the weaknesses of the ultra-sonic test method is the variation of its sensit ivity to the shape and o r i e n -tation of the f law. However . i t may be argued that such sharp-edged defects as c racks , which it detects sensitively, are likely to be the most deleterious in fuel -e lement sheaths.
The equipment, once set up, may be operated by semi-ski l led personnel. The ca l ibrat ion p i e c e is put through at stated intervals to c o n f i r m that the equipment is remaining in adjustment.
2.2. Eddy-current flaw-detection
This method is regarded as complementary , rather than an alternative, to the ultrasonic techniques just descr ibed . The eddy-current method is not,

NON-DESTRUCTIVE TESTING OF FUEL ELEMENTS 373
f or example, as sensitive to fine cracks as the ultrasonic method, but detects smooth-s ided pits which the latter does not, because they do not ref lect ultra-sound significantly.
The shortcomings of the eddy-current technique when uncritically carried out are wel l known; spurious signals may originate f r o m such s o u r c e s as d imens iona l var iat ions in the s p e c i m e n , inc idental l o c a l var iat ions in r e -sistivity Of the spec imen ' s material , and movement of the specimen relative to the test c o i l s . Minimizing these spurious signals while combining s impli -city and e f fect iveness has been achieved in two main ways; by phase selection of the output f rom the test co i l s and by further filtering of the selected signal.
Two systems have been developed for tube testing, one with an encircling c o i l arrangement and the other with a sur face c o i l arrangement and hel ical scanning. The two systems are s imi lar e lectr ical ly , in that the eddy currents are generated by an exciting co i l fed f r o m a power osc i l la tor . Two pick-up co i l s , f ixed with respect to the exciting co i l , form two arms of a Heydweiller AC br idge which is normal ly balanced when a sound spec imen of tubing is in p lace . The passage beneath the p ick-up co i l s of a discontinuity in a s p e c i m e n temporar i l y unbalances the br idge ; the unbalance voltage may be considered the input signal to the detection system. A phase-select ive ampli-f i e r has been developed which has been found useful in discriminating between signals f rom defects and those f rom dimensional variations. The output from this a m p l i f i e r a f ter a fur ther stage of ampl i f i cat ion dr ives a conventional pen r e c o r d e r .
In the encircl ing co i l arrangement the pick-up co i ls are mounted symme-tr ical ly within the exciting co i l , the co i l s being coaxial with the tubing under test. This is t raversed through the co i l block by a system of driven ro l lers , s o that i r regu lar movement i s imposs ib le . The speed of t raverse is 15 c m / s . The p h a s e - s e l e c t i o n i s c h o s e n e m p i r i c a l l y a f t e r e x p e r i m e n t s with tubing containing known de f e c t s . F i g u r e 4 shows the t race result ing f r o m a tube containing the ca l ibrat ion notches f o r the u l t rason ic test (Section 2.1) and also notches 2 m m X 200 ¡лт deep X 100 ц т wide. The smal ler notches are bare ly detectable .
In the s u r f a c e - c o i l arrangement, which is stil l under development, two p i c k - u p c o i l s whose a r c s are n o r m a l to the s u r f a c e of the s p e c i m e n are surrounded by the exciting co i l . The co i l s are mounted in a bush which is a c l ose fit over the specimen. The latter is rotated while the bush is traversed along it; alternatively the s p e c i m e n may be t r a v e r s e d through the bush as in the ultrasonic equipment. Figure 5 shows the trace from a tube containing calibration notches ranging f r o m 50 цт - 200 цт deep.
2. 3. A comparison of the methods of inspection
The ul trasonic method of flaw detection must be cons idered the p r i m e technique of inspection, and i t i s the standard technique used bythe U.K.A.E.A. f o r all r e a c t o r f u e l - e l e m e n t tubing. T h e r e is a danger , however , in r e -lying unquestioningly on any one test method, and it is f o r this reason that the eddy-current technique, though surpassed in sensitivity in recent years , has been cons idered worthy of continued development. The two techniques, as already indicated above, d i f f er in their r esponses to defects of different

со -л
© I.D 0 . 0 0 8 in 200 p m I.D. LONGITUDINAL
0 , D ® 0 . 0 0 2 i n 50 | jm O.D. LONGITUDINAL
© I .D. 0.002 in 5 0 p m I D. T R A N S V E R S A L
I. D . © 0 . 0 0 2 In 50 f j m I. D LONGITUDINAL
50 цпг> I. D. TRANSVERSE
© I.D. 0 . 0 0 8 in 200 |Ш1 I D. TRANSVERSE
Г)
t> Z z
p о > S ПЭ CO a
Fig. 4
Eddy-current response from tube containing notches
(encircling coil arrangement)

NON-DESTRUCTIVE TESTING OF FUEL ELEMENTS 375
0.008 in a006 in
Fig. 5
Eddy-current response from tube containing notches
(surface coil arrangement)
types, while any part i cu lar test equipment wil l p o s s e s s its own individual c h a r a c t e r i s t i c s . It is t h e r e f o r e n e c e s s a r y , in spec i fy ing the test f o r any particular tubing, to assess careful ly the requirements and the behaviour of the tubing on test equipment currently available.
3. DIMENSIONAL INSPECTION OF TUBING AND FUEL PELLETS
3. 1. Tubes
The length- to -d iameter ratio of tubes is usually greater than 100:1 and i s c o m m o n l y 500:1. The s imples t method of inspecting inside and outside d i a m e t e r s to a g iven ac cep tance range is to pass plus gauges through the bore and ring gauges over the outside diameter. These are " g o / n o - g o " tests, and little other information is obtained. Maximum forces on gauges must be spec i f ied , and care must be taken not to s c ra t ch o r gall the tubes. Gauges of s intered alumina have been found advantageous. In general , however, it is p r e f e r r e d to measure tube dimensions; apart f r o m the additional information provided, any s ize of tubing in the range of the measuring equipment may be dealt with without manufacturing new plugs o r r ings .
3 . 1 . 1 . Measuring the inside d iameter
A ir -p lug gauges are commonly used. T w o - o r three - je t plugs are used depending on whether it is required to measure l o ca l o r average d iameter .

376 С. A. MANN and I. С. CAMPSIE
A i r gauging is accurate , usually l inear, but the response speed is s low and depends upon the length and d iameter of the a ir -gauge stem and the method of indicating o r displaying the d imension being measured . H i g h - p r e s s u r e a i r gauges can a c c o m m o d a t e d i a m e t e r changes o r oval i ty in the o r d e r of 0.2 m m . Pneumat ic r e c o r d e r s c u r r e n t l y avai lab le a r e s l ow , and l inear inductive t r a n s d u c e r s have been coupled to the a i r - g a u g e c o n t r o l units to d r ive chart r e c o r d e r s o r digital pr int -out units ( s ee F i g . 6) .
Fig. 6
System for recording measurements of inside diameters of
tubing using air gauge
Capacitance gauges have not been widely used since those available had a s m a l l e r range (50 ;um) than the a ir -p lug gauge (200 д т ) . Greater ranges than these require complicated devices f o r centralizing the gauge inside the tube being measured . The speed of response is however very fast .
Mechanical methods are l imited by the length- to -d iameter ratio which i s feasible . Again l inear transducers have been used to give recorded measure -ments. F o r tubes of internal diameter greater than 10 mm the linear trans-ducer is mounted on the gauge head (see Fig . 7).
3 . 1 . 2 . Measuring the outside diameter
The dimension is readi ly measured by conventional equipment and a i r -ring gauges, adjustable a i r - gap gauges, and gap gauges using l inear trans-ducers are used .
3 . 1 . 3 . Measuring the wall thickness
The measurement of the wall thickness remote from the end of long tubes has always been di f f icult until the development of u l trasonic and nucleonic gauges .
Initially the wal l th ickness was m e a s u r e d using a mandre l and a dial gauge but this technique g i v e s p o o r resu l ts due to var iab le r e f l e c t i o n s of the mandrel . A later r ig used a balanced lever arm and an inductance trans-

NON-DESTRUCTIVE TESTING OF FUEL ELEMENTS 377
Fig. 7
Mechanical methods of measuring inside diameter of tubing.
1. Standard bore gauge
2. Bore gauge with extensions for measuring long tubes
3. Small bore gauge
4. Gauge for measuring long tubes. Head adapted to take linear inductance
transducer with long cable connection to control unit.
ducer as a f iducial indicator ; this equipment enabled tubes up to 1 m long to be m e a s u r e d to an a c c u r a c y of ± 2.5 цт, but the p r o c e s s of setting and using the equipment was s l ow and expens ive .
A m o r e s u c c e s s f u l approach to the measurement of long straight tubes was by the use of a m i c r o - a l i g n m e n t t e l e s c o p e sighting on an i l luminated target. This technique although somewhat tedious can measure wall thickness to better than ± 7.5 ц т (see Fig . 8).
Nucleonic gauges, depending on the absorption of radiation from a source, have not been widely used because of their relatively s low response . Ultra-son i c gauging i s now r e g a r d e d as the standard method f o r wa l l - th i ckness measurement . Two types of equipment are used; c o m m e r c i a l s wept- frequency sets which detect r e s o n a n c e of the tube wal l when a beam of ultrasound i s directed perpendicularly at it, and the more prec i se Harwell interferometer [3] . In the la t ter method pu lsed ul trasound i s s i m i l a r l y d i r e c t e d at the

378 С. A. MANN and I. С. CAMPSIE
S T Y L U S R U B B E R S P R I N G P A D S T O C E N T R A L I Z E S T Y L U S
- T A R G E T L I N E S P E R S P E X L I G H T I G U I D E
E N D V I E W O F P E R S P E X L I G H T G U I D E
< « 3 • S T Y L U S
M I C R O - A L I G N M E N T T E L E S C O P E . M E A S U R E S V E R T I C A L M O V E M E N T O F T A R G E T W H I C H I S T U B E W A L L T H I C K N E S S A C C U R A C Y ± 12 y u t m
T U B E R E S T I N G O N K N I F E E D G E
• T A R G E T L I N E
- T U B E B E I N G M E A S U R E D
Fig. 8
M e a s u r e m e n t of wall thickness of tubing using micro-alignment telescope
tubing; the f o r m of the re f l e c ted pulse is ve ry sensit ive to thickness in the ha l f -wave and multiple ha l f -wave condit ions . The u l t rasonic t ransducers are coupled to the tubing through water in both instances (F ig . 9).
The ultrasonic method has the advantage that it requires no component to be inser ted in the b o r e . It can thus be used in m e a s u r e m e n t s on c o m -pleted pins containing fuel . It has also been used on sheathing with external f ins, where these are not m o r e c l ose ly spaced than 2 m m .
3 . 1 . 4 . Preventing damage during inspection
Care must be taken to avoid scratching tubing during inspect ion . A i r gauges have had their working sur faces covered with polytetrafluoroethylene to prevent metal - to -metal contact. Air-plug gauges have also been developed with air-support bearings to centralize the plug in the tubing.
It has not been feas ib le to protec t mechanica l b o r e gauges in any way.
3.2. Fuel pellets
The p r i m e dimension of the fuel pellet is its d iameter , s ince the di f ference between this and the internal diameter of the tubing is an important factor in the design of the fuel pin. T o o smal l a c l earance makes it di f f icult to load the pe l l e ts , while too l a rge a c l e a r a n c e i s ob jec t ionable in s e r v i c e .
As lobing o c c u r s when pellets are ground on their c i r cumference , their maximum diameters are checked by. a ring gauge, and the minimum diameter by a snap gauge (cal iper gauge).
When pellets are loaded into thin-walled tubing the latter may distort to accommodate them. It may there fore be m o r e real ist ic to compare the c i r -c u m f e r e n c e s o f the tubing and the p e l l e t s r a t h e r than t h e i r d i a m e t e r s .
Two techniques have been developed to measure c i r cumferences . First , the d iameter i s m e a s u r e d s u c c e s s i v e l y at d i f ferent angles and the resu l ts are averaged . This i s done automatical ly with up to 12 000 measurements per revolution. Alternatively, a fo l lower-wheel technique has been developed. This is accurate to ± 15 ц т on c i r cumferences of 45 mm (Fig. 10).

NON-DESTRUCTIVE TESTING OF FUEL ELEMENTS 379
T U B I N G B E I N G M E A S U R E D
Fig. 9
Measurement of wall thickness of tubing ultrasonically
M I C R O S C O P E W I T H C R O S S W I R E G R A T I C U L E
F O L L O W E R W H E E L S P R I N G L O A D E D D O W N W A R D S
P E L L E T O R T U B E R E Q U I R I N G W U M / / C I R C U M F E R E N C E M E A S U R E M E N T . J ' / M O U N T E D IN I N D E X I N G H E A D •
( R O T A T I N G H E A D ) P A R A L L E L
P A C K I N G
Fig. 10
Accurate measurement of circumference of pellet or tubing
Starting with the datum coincident with the graticule, the pellet is
rotated accurately through 360°. The follower is raised and lowered
again to a plane surface which is moved to return the follower to its
original orientation. This movement is equal to the
circumference of the pellet
T h e s e techniques have been used to m e a s u r e external pe l let and" tube c i r c u m f e r e n c e s . Methods f or measuring internal tube c i r cumferences through-out the tube length are under development.

380 С. A. MANN and I. С. CAMPSIE
3. 3. Complete semi-automatic tube inspection
With the development of efficient tube traversing equipment for ultra-sonic flaw detection, it has been possible to develop similar equipment for the various dimensional measuring techniques. Rigs based on the equipment described above have been combined to form a complete tube-testing section which is operated by semi-ski l led labour. The laboratories ' require-ments for prec ise information of tube sizes has been met by the auto-matic recording of measurements, eliminating a t ime-consuming manual method with its possibility of human error . The charts are then assessed and the tubes passed or rejected; the charts are stored should more detailed information later be required. Plans at present being discussed in the labo-ratory suggest that time and effort might be saved by having a central control unit capable of monitoring the various measuring rigs at the rate of several scans per rig per second. The results would be recorded on tape and then processed to give a complete collective assessment of the various measurements.
4. CHECKING THE INTEGRITY OF FINISHED FUEL PINS
Fuel pins are normally completed by welding end caps or plugs to the tubing containing the fuel. The integrity of these c losures is assured by leak-testing the whole pin, and by radiographing the welds. It may also be noted that pins with welds which do not stand significantly proud of the sheath diameter may be tested for flaws, if required, on the same rigs as are used for tubing (sections 2.1 and 2.2).
4.1. Leak testing
The preferred method of test is to fill the pins with helium during manufacture and to test for leaks using a mass-spectrometer leak detector in the well-known way. Standards of tightness of 10"' torr . 1 s"1 or better are commonly applied. The main precaution necessary in this t e s t i s to ensure that a pin with a large leak cannot be passed as sound because it has lost helium before the test is made. This can be ensured by imposing a limit to the time which elapses between filling and testing.
Pins which exceed this limit, or which were unavoidably made without helium filling, may be leak-tested by the "back-pressurizing" method [4, 5] . The pins are f irst immersed in the tracer gas (usually helium) at high pressure and then tested for the re -emiss i on of the t racer f rom any leak. Sensitivities equal to those of the helium - filling technique may be obtained, though high pressures or long pressurizing times are needed if the internal volume of the pin is large.
The stipulation of a t ime- l imit may also be avoided by filling with a radioactive tracer . If, for example, to the helium is added a small amount of krypton-85, the continued presence of the filling gas may be confirmed at any time by detecting the radiation from the Kr85 through the sheath of the pin. A helium leak-test may thus be given, following this confirmation, with

NON-DESTRUCTIVE TESTING OF FUEL ELEMENTS 381
confidence that a zero result unambiguously indicates a sound element. If the pin cannot be gas- f i l led, the krypton may be added as a quinol clathrate -milligram amounts of quinol can carry an adequate activity - and the krypton-85 can also serve as the tracer gas.
The bubble technique of leak testing 16, 7, 8] is also used when stringent standards of tightness are not required, since its sensitivity cannot be as-sumed to be better than 10"4 to 10~a torr . 1 s"1. Its main use in U. К. A. E. A. laboratories has been in the location of leaks in elements rejected by other routine leak tests. For this purpose it is a cheap and rapid test, though not as sensitive as the "probing" or "sniffing1 ' tests using helium and the mass spectrometer.
4.2. Radiography of end closures
The end-closure weld is normally circumferential; it is examined radio-graphically for adequate penetration and freedom from inclusions, blowholes etc. The end plug may be solid, in which case the region to be inspected is essentially the outer layer of a solid cylinder. A single radiograph, with the direction of radiation perpendicular to the axis of the pin, cannot be cor -rectly exposed over the whole projected diameter of the pin. The weld is therefore normally examined by a ser i es of such shots, the edges of the image being examined; the pin is rotated through a fixed angle, e . g . 20°, between each exposure. A rig is used to rotate a number of pins, radio-graphed simultaneously, and simultaneously to move the film between ex-posures. These actions are performed by pneumatic actuators controlled by the operator f rom outside the X - r a y cel l .
4. 3. Radiography of complete pin
In the manufacture of experimental batches of fuel pins it is often desir-able to radiograph the complete pin, to obtain information of the gaps between fuel pellets and the disposition of other components. To obviate perspective distortion, the pin and film are traversed beneath a slit to produce a "parallel-beam" radiograph. The pellet gaps are usually required to be the most sharply defined item, and it is possible to increase the width of the slit to say 3 cm for a source-f i lm distance of 66 cm since gaps between pellets act themselves as collimating slits. Gaps down to 75 /лт are detected in this equipment. The fuel pin presents the usual difficulty to the radiographer in accommodating components of widely differing absorptions in a single radio-graph. The technique of colour radiography 19, 10J has been found useful in enabling a single radiograph to be produced of a pin which shows the tube, the gap between tube and fuel, gaps between fuel pellets, and some details of the fuel itself.
R E F E R E N C E S
[1] WALKER, D.C. B. and LUMB, R. F., Applied Materials Research (1964) 176-183.
[2] AVEYARD, S., Brit. J. non-destr. Test. 4 (1962) 120.

382 С. A. MANN and I. С. CAMPSIE
[3] AVEYARD, S. and SHARPE, R. S . i n Proc. of the Fourth Int. Conf. on N. D. T., Butterworths, London
(1964) 150-154.
[4] BLANC, B., D'ORIVAL, M . and C H O U M O F F , S., in Fuel Element Fabrications, 2, IAEA, Vienna (1961)3.
[5] H O W L , D. A. and M A N N , C. A., R; F. L. Springfields U. К. A. E. A. (to be published),
[6] BIRAM, J.G.S., A.E.R.E. CE/R 2066 (1957).
[7] RATCLIFFE, R. T., Brit. J. appl. Phys. 15 (1964) 79-83.
[8] BIRAM, J. and BURROWS, G., Vacuum 14 (1964) 221-226.
[9] BEYER, N. S., ANL-6515 203-217.
[10] PARISH, R.W. and PULLEN, D.A.W., Brit. J. non-destr. Test. 6 (1964) 103-108.
D I S C U S S I O N
P. de MEESTER: You also examine complete fuel pins by gamma scanning in your laboratory . F r o m the technical and economic standpoints, do you p r e f e r this technique o r c o m p l e t e scanning on radiographic f i l m ?
G . MANN: I think the c h o i c e between the two methods depends on the information required. In production, including pi lot-scale production, gamma-scanning with a chart r e cord will usually be acceptable. If more information is required , f o r example on the distribution of fuel, a scanning radiograph may be cons idered des i rab le and worth the extra cos t .
U. NYSTRÔM: What is the actual rotation speed when you test tubes u l t rasonica l ly f o r longitudinal and t ransverse de fec ts , and why do you use a pitch of only 0.15 m m with the corresponding ly low testing speed, which is a disadvantage f r o m the e c o n o m i c point of v iew?
G. MANN: The speed depends on the diameter of the tube: small tubes may be rotated at s e v e r a l thousand r p m , l a r g e r ones at s e v e r a l hundred rpm. Reliable detection of the calibration notches is of course always a neces -s i ty . The pitch of 0.15 m m quoted is used f o r s m a l l tubes; l a r g e r tubes are tested with a l a r g e r p i tch.
U. NYSTROM: I understand you use Branson commerc ia l equipment for measur ing the wall thickness of cladding tubes. F r o m the harmonic r e s o -nance indications you showed on the s c reen during your oral presentation, I suppose you u s e the contact method . Why do you not u s e the i m m e r s i o n technique?
G. MANN: The i m m e r s i o n technique shown in F ig . 9 is normally used f o r tubes. Contact methods are used when n e c e s s a r y .
U. NYSTRÔM: In sect ion 4.2 of your paper you say that a single radio-graph of the welds of c i r cu lar fuel rods cannot be obtained satisfactori ly and that is the reason why you use the technique descr ibed . Have you tr ied using a b lock to compensate f o r the c i r c u l a r shape? If so , what is your opinion of the sensit ivity which can be obtained with the two methods?
G. MANN: Multiple radiographs were used in our laborator ies b e f o r e the compensat ing b l o c k method was deve loped . P o s s i b l y b e c a u s e of the greater exper ience of our inspec tors with the f o r m e r method, we have p r e f e r r e d to continue using it. We see little d i f f erence in the sensitivit ies obtainable f r o m the two methods . '
U. NYSTROM: My last question relates to helium leak detection on fuel rods . I suppose you have a low re ject ion level so I wonder why you test the rods individually, as I understand you do, instead of testing larger batches.

NON-DESTRUCTIVE TESTING OF FUEL ELEMENTS 383
G . MANN: No, in product i on on any s c a l e we do indeed test pins in mult ip le b a t c h e s .
G. VERSTAPPEN: Why do you use both ul trasonics and eddy currents in y o u r l a b o r a t o r i e s , and what are the advantages of each method?
G. MANN: At the moment our normal flaw-detection test for thin-walled tubing is an ultrasonic test. We maintain an eddy-current flaw test because we think it dangerous to have only one test available. Sometimes, moreover , f o r example with exper imenta l batches of tubing, the s u r f a c e f inish o r the i n t e r f e r e n c e e f f e c t s of intragranular products make u l t rason i c test ing d i f f i cu l t .
G. V E R S T A P P E N : Do you then do the s a m e tests with both methods and c o m p a r e the r e s u l t s ?
G. MANN: One must distinguish between tests on routine tubing which is being made in large quantities and development tests . We would not dupli-cate flaw tests on large amounts of tubing. Incidentally, we do not measure wall thickness using eddy currents .


SESSION IX
25


A FAST TEST FOR EXCESSIVE U235 CONCENTRATIONS
IN ENRICHED FUEL ELEMENTS
A . D . M c E A C H E R N
A T O M I C E N E R G Y O F C A N A D A L I M I T E D ,
C H A L K R I V E R , O N T A R I O , C A N A D A
A b s t r a c t — R é s u m é — А н н о т а ц и я — R e s u m e n
A F A S T TEST FOR EXCESSIVE U2 3 S
C O N C E N T R A T I O N S IN ENRICHED FUEL E L E M E N T S . This paper
describes a new non-destructive method oí, detecting areas ot enriched tuel elements containing excessive U2 3 5
,
and an instrument designed to inspect uranium-aluminium alloy fuel for the NRU reactor using the new method.
The new method is as precise as conventional methods but is m u c h faster. The improvement in test speed
depends on the application, but typically m a y be a factor of four. Alternatively, the method m a y be used
to improve the precision of the test without increasing the testing time. •
The method m a y be used when the U2 3 5
concentration in selected areas of a fuel element is estimated by
measuring the intensity of 184-keV y-rays (from the natural decay of U2 3 5
) and when an area is considered
acceptable if the measured intensity from it is less than a limiting intensity equivalent to the maximum allowable
concentration. It the measured intensity is much less or much greater than the limiting intensity, much
less time is required to make this decision than when they are nearly the same. The new method takes advantage
of this. It thus inspects each area only as long as is necessary to make a decision with the required confidence.
The average time taken in practical cases is less than that taken by conventional methods which inspect each
area forapre-selected time chosen to give the required confidence in the most difficult cases - when the
measured and limiting intensities are nearly the same.
The new method is based on sequential sampling theory. It m a y also be used to detect areas with un-
desirably low U "3
concentration.
DETECTION RAPIDE DES CONCENTRATIONS EXCESSIVES DE a
U D A N S LES ÉLÉMENTS COMBUSTIBLES
EN U R A N I U M ENRICHI. Le mémoire décrit une amélioration des méthodes classiques de détection, dans les
éléments combustibles en uranium enrichi, des zones qui contiennent une trop forte quantité de On a
conçu un instrument pour examiner, par cette méthode perfectionnée, le combustible en alliage uranium-
aluminium destiné au réacteur NRU. Cette méthode est aussi précise que les méthodes classiques, mais beau-
coup plus rapide. L'économie de temps dépend du mode d'application; elle peut être normalement de l'ordre
du facteur quatre. On peut également appliquer cette méthode pour accroître la précision de l'essai sans en
augmenter la durée.
La méthode est applicable lorsqu'on évalue la concentration de Î3
*U dans une zone donnée en mesurant
l'intensité des rayons g a m m a de 184 keV (émis lors de la désintégration naturelle de 2 3 5
U) et que l'on con-
sidère une zone c o m m e acceptable si l'intensité mesurée du rayonnement qui en émane est inférieure S une
limite correspondant à la concentration m a x i m u m admissible de *35
U. Si l'intensité mesurée est sensiblement
inférieure ou supérieure à cette limite, il faut beaucoup moins de temps pour se prononcer que lorsqu'elle lui
est sensiblement égale. La méthode améliorée tire parti de ce fait. L'examen de chaque zone ne dure que le
temps strictement nécessaire pour prendre une décision avec la confiance voulue. Dans la pratique, le temps
moyen nécessaire à cet effet est inférieur à celui qu'exigent les méthodes classiques, qui consistent à examiner
chaque zone pendant un temps prédéterminé de manière â pouvoir se prononcer avec confiance dans les cas
les plus difficiles : intensité mesurée très voisine de la limite.
La méthode perfectionnée est fondée sur la théorie de l'échantillonnage continu. On peut également
l'appliquer pour détecter les concentrations trop faibles de 2 3 5u.
БЫСТРОЕ ОПРЕДЕЛЕНИЕ ИЗЛИШНИХ КОНЦЕНТРАЦИЙ U-235 В ОБОГАЩЕННЫХ-
ТОПЛИВНЫХ ЭЛЕМЕНТАХ. Описывается усовершенствование обычных методов обнару-
жения тех мест в обогащенных топливных элементах, в которых содержится излишнее коли-
чество урана-235. Разработан прибор для проверки топлива, изготовленного из сплава уран-
387

388 A. D. McEACHERN
алюминий, для реактора N R U c использованием этого усовершенствованного метода. Усо-
вершенствованный метод такой же точный, как и обычные методы, но значительно быстрее.
Для типичного случая он дает результаты в четыре раза быстрее. Кроме того, усовершен-
ствование можно направить на увеличение точности проверки без увеличения времени, необхо-
димого для проведения такой проверки.
Метод можно применять, когда концентрация урана-235 в отдельных местах в топливных
элементах определяется в результате измерения интенсивности гамма-лучей с энергией
184 кэв (в результате естественного распада урана-235) и когда считается, что это место
является приемлемым, если измеренная в этом месте интенсивность меньше, чем эквива-
лент ограничивающий интенсивность в отношении максимально-допустимой концентрации
урана-235. Если измеренная интенсивность значительно меньше или больше ограничиваю-
щей интенсивности, требуется значительно меньше времени для принятия решения, чем ког-
да они почти одинаковы. Это и учтено при усовершенствованном методе. При этом методе
проверяется каждое место, как только необходимо принять решение с необходимой уверен-
ностью. Принимаемое в практических случаях среднее время меньше, чем при обычных ме-
тодах, когда проверяется каждое место в предварительно определенное время с целью полу-
чения необходимой уверенности в наиболее трудных случЗях, когда измеряемая и ограничива-
ющая интенсивности почти одинаковы.
Усовершенствованный метод основан на теории последовательного отбора проб. Его
можно также применять для обнаружения нежелательно низких концентраций урана-235.
ENSAYO RAPIDO PARA DETERMINAR CONCENTRACIONES EXCESIVAS DE 2 3 5
U EN ELEMENTOS C O M -
BUSTIBLES ENRIQUECIDOS. El presente trabajo describe un perfeccionamiento introducido en los métodos
corrientemente empleados para descubrir en elementos combustibles enriquecidos las zonas que contengan
cantidades excesivas de 2 3 5
U. Se ha ideado un aparato para inspeccionar con este método el combustible a
base de aleación uranio-aluminio, destinado al reactor NRU. El método perfeccionado es tan preciso como
los corrientes, pero mucho más rápido. La reducción del tiempo necesario para la prueba depende de la
aplicación, pero puede tomarse como valor tfpico una disminución a la cuarta parte de aquél. El mejora-
miento puede aprovecharse asimismo para aumentar la precisión del ensayo, sin por ello prolongar su duración.
El método puede aplicarse cuando la concentración de Z 3 S
U en áreas seleccionadas de un elemento com-
bustible se evalúa midiendo la intensidad de los rayos g a m m a de 184 keV (provenientes de la desintegración
natural del 2 3 5
U) y cuando un área se considera aceptable si la intensidad medida en la misma es inferior a
una intensidad lfmite equivalente a la máxima concentración admisible de *3i>
U. Si la intensidad medida
es considerablemente menor o mayor que el valor lfmite, el tiempo necesario para tomar esa decisión es mucho
más breve que el requerido cuando los valores son aproximadamente iguales. El método mejorado aprovecha
esta característica inspeccionando cada área sólo el tiempo necesario para tomar una decisión con el grado de
certeza requerido. El tiempo medio necesario en casos prácticos es inferior al que requieren los métodos clá-
sicos, según los cuales, cada área se inspecciona durante un lapso predeterminado para obtener la certeza
requerida en los casos más difíciles, o sea cuando las intensidades medida y lfmite son aproximadamente
iguales.
El método mejorado se basa en la teoría de muestreo por secuencias. Tafnbién puede aplicarse a con-
centraciones excesivamente bajas de 23i>
U.
I N T R O D U C T I O N
At Chalk R i v e r we inspect our enriched uranium-aluminium alloy fuel e lements to detect a r e a s with too much U235 . These a r e a s are dangerous s ince they m a y get too hot in the r e a c t o r and cause f u e l - e l e m e n t fa i lure .
T o detect them we m e a s u r e the intensity of the 184-keV g a m m a - r a y s produced during the natural decay of и2 3 й [ 1 -3 ] . A sample of the f u e l -e lement s u r f a c e is v i ewed through a c o l l i m a t o r by a g a m m a - s e n s o r such as a scintillation crysta l . It (with associated c ircuitry) produces e lectr i ca l pulses with amplitude related to the energies of the gamma rays. The pulses corresponding to the energy of interest (184 keV in our case ) are se lec ted

FAST TEST FOR EXCESSIVE U235 CONCENTRATIONS 389
and fed to an instrument which measures their rate of occurrence or "count-r a t e " . Since the pulses o c c u r randomly in t i m e , the true average count-rate can only be est imated, and the a c c u r a c y of the est imate is inc reased only by observing the sample f o r a longer t ime so that m o r e pulses are a c -cumulated f r o m each sample f o r the est imation of the average rate .
The test must dec ide whether the count ra tes f r o m sampled a r e a s of the fuel e l ements are g r e a t e r o r l e s s than a l imit ing value , and the m o s t e f f ic ient test makes thesis dec i s ions with an acceptable a c c u r a c y in the shortest t ime. In o rder to compare different tests we can define two functions of interest .
The operating characteristic (ОС)
The ОС is the probabi l i ty (P) of making a chosen dec i s ion f o r any test condition, and plotting it f o r different sample count-rates shows the accuracy of the test . F o r our purposes we are concerned with the ОС curve showing the probabi l i ty of deciding that a sample has a true count rate greater than a s e l e c t e d l imit ing va lue . If the l imit ing count-rate is N and the s a m p l e count-rate i s fN, this i s equivalent to dec id ing that f i s g r e a t e r than 1. I wil l r e f e r to this as a "high" dec is ion and to its alternative as a " l ow" dec i s ion .
THE AVERAGE SAMPLE TIME (AST)
The AST i s the average t ime requ i red to make either a high o r a l ow dec i s ion f o r any given value of f o r f o r an assumed distribution of f in a success i on of samples . In general , increasing the accuracy of a test r e -sults in an increased AST.
I will f i r s t des c r ibe two conventional test methods which we have used f o r a number of y e a r s . They have acceptable ОС curves but we have found them to be inconveniently s low. I will then descr ibe our improved test m e -thod, which has a v e r y s i m i l a r ОС curve but is much fas ter .
The physical s ize of the " sample " re f e r red to depends on the col l imator c r o s s - s e c t i o n . When the fuel e lement is moved re lat ive to the co l l imator (either in steps or continuously) so that adjacent samples are viewed in s u c -c e s s i o n by the g a m m a - s e n s o r , the scanning rate can be e x p r e s s e d in co l l imator -widths p e r second (if the width of the co l l imator c r o s s - s e c t i o n is defined as its d imension in the d irect ion of re lat ive movement ) .
DIGITAL COUNTING FOR A FIXED TIME
This test counts the number of 184 -keV g a m m a - r a y s emitted by each sample in a f ixed t i m e . It makes a high dec i s i on if the accumulated count in the se l e c t ed t ime T is g r e a t e r than TN, where N is the l imit ing count-rate . A f ter t ime T the fuel element is moved to a new position and another sample is observed .
T o compute the ОС f o r this test , we f i r s t observe that f o r the tests of interest the resu l ts f o l l ow the Gaussian distr ibution curve with mean fNT

390 A. D. McEACHERN
and standard deviat ion •JfNT [4] . We can compute the stat ist ic
z = ( NT - fNT ) /s/fNT. (1)
Then
P = (1/-J2TT) f exp ( - x 2 / 2 ) d x , (2) z
which is the Gaussian e r r o r function. The ОС curve results f r o m plotting P against f .
The AST f o r this test is constant and equal to T .
CONTINUOUS SCANNING WITH A C O U N T - R A T E METER
In this test the fuel e lement is m o v e d past the c o l l i m a t o r at a steady rate and the pulses are fed to a count-rate meter with a time constant t. The output of the count - rate m e t e r is t raced on a r e c o r d e r chart , and a t r a c e which g o e s above the l eve l c o r r e s p o n d i n g to N resu l t s in a high d e c i s i o n .
The standard deviat ion of the t r a c e pos i t i on resul t ing f r o m a steady count-rate fN is s/fN/2t [5]. In this case a " s teady" count-rate means one which has been observed by the count-rate meter f o r many t ime constants. This happens when changes in U23& concentration o c cur very gradually, and in this case
z = ( N - f N ) / J f N / 2 t (3)
and P is calculated using equation (2) . It is worth while noting that the ОС of this test is identical to that f o r digital counting f o r a f ixed t ime with T equal to 2t.
If there is a sudden change f r o m a steady count-rate f j N to a new one f i N , at a t ime 1/R seconds after the change.
z = (N-M) /\ /M/2 t , (4)
where
M = f j N + (f2 N - f j N ) ( l - exp [1 /Rt ] ) . (5)
If the sudden increase o c c u r s in only a small spot, the maximum height of the t r a c e indicating it i s g iven by equations (4) and (5) with R equal to the scanning rate in col l imator-widths per second. This l imits the scanning rate if smal l spots are to be detected . We have found that setting R equal to l / 3 t gives a reasonable c o m p r o m i s e between the competing requirements of good discr imination and high scanning rate .
As f or the fixed counting-time test, the AST is constant. It is the r e c i -proca l of the scanning rate .

F A S T T E S T F O R E X C E S S I V E U 2 3 5 C O N C E N T R A T I O N S
OPERATION OF S E Q U E N T I A L S A M P L I N G C I R C U I T
391
I -Ш « or CD z H 1 О -j
« Э z 2 UJ
Q. - L s < (Л
A - S A M P L E R A T E M U C H H I G H E R T H A N T H E L I M I T I N G R A T E
В - AS A B U T S A M P L E R A T E S O M E W H A T L O W E R .
C - S A M P L E RATE L O W E R T H A N T H E L I M I T I N G R A T E .
Fig. 1
Operation of sequential sampling circuit
DIGITAL COUNTING USING SEQUENTIAL SAMPLING
Sequential sampling techniques developed by WALD [6] have been used for a number of years in sampling inspection of manufactured products. COOKE-YARBOROUGH and BARNES applied developments of the theory [7, 8] to the problem of determining whether the intensity of radiation f rom a sample exceeds a limiting value, and our method is based on their treatment of the subject [9].
The difference between the sample count-rate fN and the limiting count-rate N is accumulated. If the di f ference reaches a preset limit L a high decision is made, and if it reaches - L a low decision is made. When either o c curs , observation is stopped and the fuel element is moved to the next sample position. Figure 1 shows a sequence of events which might happen with this method. It shows that the time spent on successive samples is not constant but depends on their count rates.
To compute the ОС function we first define a quantity q so that
( l n q ) / ( q - l ) = f. (6)
Then when f / 1,
(1 - q - L ) / ( q L - q " L ) ^ P * (1 -q"L)/(qL+1 " q"L L (7)

392 A. D. McEACHERN
and when f = 1,
P = 0.5. (8)
Three inequalities define the AST. When f < 1,
(2LP - L ) / ( f N - N ) г AST ь ( [2Ltl ]P - L ) / ( f N - N ) . ( 9 )
When f > 1,
( 2 L P - L ) / ( f N - N ) = = AST s ( [2L + Í ] P - L ) / ( f N - N ) . (10)
When f = 1,
L ' ¿ / N s AST s ( L ¿ + L + 0 .5 ) /N . ( И )
Note that P f o r this test depends on f but not on N. A l s o , the AST i s not constant but changes with both f and N.
A COMPARISON OF THE THREE METHODS
F i g u r e s 2 and 3 show ОС and AST curves f o r the three methods , c a l -culated using the re la t i ons d e s c r i b e d in the p r e c e d i n g s e c t i o n s . The l imiting count-rate is 540 counts / s f o r the cases plotted. In Fig . 2, ОС curves A and В have dif ferent shapes and so cannot be matched exactly, and I have chosen the p a r a m e t e r s so that the two curves co inc ide where P equals 0.01 and 0,99. Below 0.01 curve A is slightly higher than curve В and above 0.99 it is sl ightly l o w e r , although this is not evident f r o m the graph.
Curve С i s calculated f r o m equations (4) and (5) and is included to show the e f fect on the count-rate meter test of smal l spots of high U235 c o n -centration. Many examples could be plotted, but I have chosen one which is typical of our test condit ions. This is a case where the l imiting rate is a reject ion level set 10% above the nominal U235 concentration. In our fabr i -cation p r o c e s s e s this nominal concentration is also the average and is there -f o r e the most probable homogeneous matr ix in which we may expect to find a small high-concentration spot. On the scale of Fig. 2 this nominal concen-tration c o r r e s p o n d s to where f equals 0.91 and this i s the value of f j which was used in equation (5). If a higher o r l ower value of f i is chosen curve С is shifted to the left or right respect ive ly .
We used our sequential sampling instrument to get s o m e exper imental data f o r c ompar i son with the theoret ical curves f o r the sequential sampling test . The data are tabulated in Table I, and the resulting points are plotted in F i g s . 2 and 3. A s I wi l l explain l a t e r , the instrument ' l o s e s 1 about 8% of the sample counts at these count rates, so that for the sequential sampling test N is 500counts/s to match the actual l imiting rate of 540 counts / s . The points match the theoret i ca l curves well within the measurement ac curacy .
Figure 3 shows why the sequential sampling test is faster than the others. The test speed depends on the sample activities encountered in pract ice , arid

FAST TEST FOR EXCESSIVE U235 CONCENTRATIONS 393
0.96 0 97 0.98 0 99 1.00 1.01 1.02 1.03 1.04 1.05
Fig. 2
Operating characteristic (ОС) curves
est imates of it are subject to l a r g e e r r o r s . However , f o r our condit ions where the l imi t ing concentra t i on i s 10% above the nominal (and a v e r a g e ) we can ca l cu late two l imi t ing c a s e s :
(a) A rectangular distribution of concentrations f r o m 10% below to 10% above nominal ( f r o m f = 0.83 to f = 1.00);
(b) A point distribution with g.11 samples at the nominal value (f = 0.91). In prac t i ce the U235 concentrations in the fuel e lements may be r e p r e -
sented by a Gaussian distribution around the nominal value more c losely than by either of these c a s e s .
An approximation of case (a) using an integration method descr ibed in Ref . t9] g ives an average sample t ime of 3.35 s, and f r o m F i g . 3 c a s e (b)

394 A. D. McEACHERN
18
16
14
to о z о io о ш V)
I-V) 8 «
6
4
0 0.7 0.8 0.9 1.0 1.1 1.2 1.3
Fig. 3
Average sample time (AST) curves
gives 1.7 s . Compar ing these f i gures to the 1 1 . 2 - s sampl ing t ime f o r the f i xed - t ime test g ives increased test speeds of fac tors of 3.3 and 6.5 f o r the l imit ing c a s e s , s o that s o m e i n c r e a s e between these l imi t s wil l no rmal ly be rea l i zed in p r a c t i c e .
The purpose of all these tests is to decide whether samples have count rates above o r be low the l imit ing value . When the sample rate is c l o s e to the l imit the m e a s u r e m e n t a c c u r a c y n e c e s s a r y to make this dec i s i on is greater than when it is much above or below it, and the sequential sampling test takes advantage of this. It spends only as long as is necessary on each sample , while the other methods spend as much t ime on each sample as is n e c e s s a r y only in the m o s t d i f f i cult c a s e s , when the s a m p l e and l imi t ing rates are c l o s e t oge ther .
In this d i s cuss ion I have cons idered c a s e s where abnormal ly high U235
concentrat i ons a r e of in teres t , but the s a m e tes t s can be appl ied just as

FAST TEST FOR EXCESSIVE U235 CONCENTRATIONS 395
T A B L E I
D A T A F O R T H E S E Q U E N T I A L S A M P L I N G C U R V E S
Measured Calculated
Time fN* Decisions -
(s) (counts/s) High Low f P AST (s)
300 374.3 0 480 0.751 0.000 0.63
300 395.2 0 405 0.793 0.000 0.74
300 449.9 0 193 0.902 0.000 1.55
1000 480.5 2 236 0.964 0.008 4.20
1000 486.9 3 182 0.976 0.016 5.41
1000 494.4 18 78 0.991 0.188 10.42
3000 499.3 117 121 1.001 0.492 12.61
300 524.6 97 0 1.052 1.000 3.09
300 549.5 196 0 1.102 1.000 1.53
300 574.2 291 0 1.151 1.000 1.03
300 599.3 388 0 1.202 1.000 0.77
300 625.2 489 0 1.254 1.000 0.61
* N = 498.7 counts/s in all cases
well to inspection f o r low concentrat ions . If it is not worth while installing a spec ia l test f o r l ow concentrat ions , s o m e qualitative in format ion about them m a y be der ived f r o m the sequential sampl ing test d e s c r i b e d , s ince the inspect ion of a sect ion of a fuel e lement in an unusually short t ime i n -dicates that it has an unusually low average concentrat ion.
A SEQUENTIAL SAMPLING TEST INSTRUMENT
We have built an instrument to inspect fuel elements using the sequential sampling test , and F ig . 4 shows a functional block diagram of it.
The heart of the instrument is the b i - d i r e c t i o n a l s c a l e r . This i s a digital counter which adds one to its m e m o r y f o r a pulse at its f o r w a r d input and subtracts one f o r a pulse at its r e v e r s e input. When its m e m o r y accumulates a value of L or - L (78 or -78 in the case we have cons idered) it p r o v i d e s an output pulse on the c o r r e s p o n d i n g l ine . T h e s e p u l s e s are r e c o r d e d , and are a lso fed to an OR gate, which g ives an output pulse f o r a pulse at e i ther of its input l i n e s . The OR gate output r e s e t s the s c a l e r

396 A. D. McEACHERN
S E Q U E N T I A L S A M P L I N G C I R C U I T — BLOCK D I A G R A M
Fig. 4
Sequential sampling circuit - block diagram
to zero , signals the mechanical scanner to begin moving the fuel element to a new position, and sets a bistable switch. When the bistable is set in this way it provides an output which opens two inhibit gates in the inputs to the scaler, ensuring that no pulses enter it while the element is being moved. When the element is moved to the next sample position the mechanical scanner sends a pulse to the bistable to reset it. When it is reset the output to the inhibit gates is removed, so that pulses can again enter the scaler .
The pulses to the reverse input of the scaler come from a tuning-fork-controlled oscillator set to a frequency corresponding to the limiting count-rate, and the pulses to the forward input come f rom the gamma detector. A puise on one input line which follows a pulse on the other one too closely can cause our scaler to make errors , so the 60-/us delay and 120-|us inhibit gate in the diagram were added to ensure that pulses on the two inputs are spaced by about 60 /us. In addition, the scaler will not register the second

FAST TEST FOR EXCESSIVE U235 CONCENTRATIONS 397
of two pulses f r o m the g a m m a detec tor which o c c u r l e s s than about 60 /us apart. Both these f a c t o r s result in the l o s s of s o m e of the sample pulses , -and we have found that at count rates near 500 c o u n t s / s we l o s e about 8%. Th i s does not a f fec t the ОС of the test , but it i n c r e a s e s the A S T .
With the exception of the r e c o r d e r and the mechanical scanner, the i n -strument is made of so l id-state c ircuit elements mounted on printed-c ircuit boards .
R E F E R E N C E S
[1] MORRISON, G. H. a n d C O S G R O V E , J. F., Analyt.Chem. 29 (1957) 1770.
[2] J U D D , W . C. and LEBOEUF, M . B., Report KAPL-1925 (1958).
[3] M c E A C H E R N , A. D., Canadian Nuclear Technology 1, No. 3 (1962) 25-28.
[4] BEERS, Y., in Introduction to the Theory of Error, Addison-Wesley Inc., N e w York (1957) 46-9.
[5] ELMORE, W . C. and S A N D S , M . , in Electronics-Experimental Techniques, National Nuclear Energy
Series, Div. V , I_, McGraw-Hill Inc. , N e w York (1949) 252.
[6] W A L D , A., Sequential Analysis, John Wiley and Sons Inc., N e w York (1947).
[7] KIEFER, J. and W O L F O W I T Z , J., N R L Quarterly 3 (1956) 205-19.
[8] D V O R E T Z K Y , A., KIEFER, J. and W O L F O W I T Z , J., Ann. Math. Stat. 24 (1953) 254-64.
[9] C O O K E - Y A R B O R O U G H , E. H., and BARNES, R. С. M . , Proc. I. E. E. Part В 108 (1961) 153-66.
D I S C U S S I O N
P . de MEESTER: If Iunderstand Fig . 4 c o r rec t l y , you are rather limited in count ra te . F r o m the inhibit gate work ing at 120 /JS I a s s u m e that the m a x i m u m counting rate is between 1000 and 3000 c o u n t s / s . Is that right?
A . D . McEACHERN: You are c o r r e c t . The main advantage of this m e -thod is real ized when the count rate is low, as ours is (about 500 counts / s ) . If our count rate had been v e r y much higher than the range you mention,- it might not have been n e c e s s a r y to build this instrument.


THE N O N - D E S T R U C T I V E DETERMINATION OF B U R N - U P BY MEANS OF THE
P r 144 2 . 1 8 - M e V G A M M A - A C T I V I T Y
R . S . F O R S Y T H A N D W . H . B L A C K A D D E R
A B A T O M E N E R G I , S T U D S V I K , S W E D E N
A b s t r a c t — R é s u m é — А н н о т а ц и я — R e s u m e n
THE NON-DESTRUCTIVE DETERMINATION OF BURN-UP BY M E A N S OF THE Pr144
2. 18-MeV G A M M A -
ACTIVITY. In recent years, g a m m a scanning has been used at several establishments tor the determination
. of the burn-up profile along irradiated fuel elements, the 0.75-MeV g a m m a from Zr^/Nb511
being most often
used as the monitored radiation. Difficulties in establishing the geometry and the self-absorption of the g a m m a
activity in the fuel have tended to prevent the application of the method to quantitative bum-up determination,
which has usually been carried out by dissolution of selected portions of the fuel followed by conventional
fission-product separation or by uranium-235 depletion methods.
The present paper describes experiments carried out to calibrate a g a m m a scanner for quantitative measure-
ments by counting the 2.18-MeV gamma-activity due to Pr144
, the short-lived daughter of Ce1 4 4
(T1 / 2 285 d)
from selected pellets in several UQ, fuel specimens. Accurate burn-up values were then determined by -dis-
solution and application of the isotopic dilution method using stable molybdenum fission products.
The elements, which were rotated about their longitudinal axes to minimize assymetry effects, were
viewed by a sodium iodide crystal and a multichannel analyser through a suitable collimator. Correction for
attenuation of the g a m m a activity (much less than for 0. 75 M e V ) in the fuel elements which were of different
diameters (12.6 to 15. 04 m m ) was made by applying relative attenuation factors, and the effective geometry
factor of the instrument was determined. In order to check the corrections applied, the counter factor was also
calculated for the 0. 75-MeV activity from Zrs
7Nbs s
, and in certain cases for the 0. 66-MeV activity from Cs'4
The results obtained demonstrate that, at least over the range of diameters and cooling times used, the method
is suitable for quantitative determinations.
Preliminary experiments to explore the possibility of using the high-energy g a m m a s (2. 35, 2.65 M e V )
from Rh1 0 6
as a method for estimating the fraction of fission events which have taken place in the Pu"9
formed
during irradiation have also been carried out. Determination of the relative intensities of the gammas suggests
that the method is of only limited application.
DÉTERMINATION N O N DESTRUCTIVE DE LA C O M B U S T I O N MASSIQUE PAR MESURE DE L'ACTIVITE
G A M M A (2,18 M e V ) DE 144
Pr. Depuis quelques annëes, on a souvent recours à la gammagraphie pour déter-
miner le profil de la combustion massique le long des éléments combustibles irradiés; en général, on utilise
pour cela les rayons g a m m a de 0,75 M e V émis par 9 5
Zr-9 s
Nb. Mais c o m m e il est difficule d'établir la géo-
métrie et l'auto-absorption de l'activité g a m m a dans le combustible, cette méthode se prête mal à la déter-
mination quantitative de la combustion massique; on préfère habituellement procéder par dissolution de cer-
taines portions du combustible et séparation des produits de fission ou par la méthode de l'appauvrissement en
uranium-235.
Les auteurs décrivent les expériences faites en vue d'étalonner un appareil de gammagraphie pour per-
mettre des mesures quantitatives par comptage de l'activité g a m m a (T1(2 2,18 MeV) de
l44
Pr, produit de filiation
à courte période de 1 4 4
Ce (285 j) dans les pastilles sélectionnées de divers spécimens de bioxyde d'uranium.
On a ensuite déterminé les valeurs exactes de la combustion massique par dissolution et par dilution isotopique
en utilisant les isotopes stables du molybdène produits de fission.
Les éléments combustibles, auxquels on imprime un mouvement de rotation suivant leur axe longitudinal
pour diminuer les effets d'asymétrie, sont explorés par un cristal d'iodure de sodium et un analyseur multicanal
muni d'un collimateur approprié. Pour tenir compte de l'atténuation de l'activité g a m m a (nettement moins
marquée que pour 0, 75 M e V ) dans les éléments combustibles, qui étaient de diamètres différents (12, 6 à
15, 04 m m ) , on a fait une correction en appliquant des facteurs d'atténuation relative; on a ensuite déterminé
le facteur de géométrie effectif de l'instrument. Pour vérifier les corrections appliquées, on a également
calculé le rendement du détecteur pour l'activité g a m m a (0, 75 M e V ) de 9 5
Zr-9 5
Nb et, dans certains cas, pour
399

400 R. S. FORSYTH and W. H. BLACKADDER
l'activité g a m m a (0,66 M e V ) de 1 3 ,
Cs. Les résultats obtenus montrent que, tout au moins pour la g a m m e
des diamètres et des temps de refroidissement considérés, la méthode convient pour des mesures quantitatives.
On a également procédé à des expériences préliminaires pour étudier la possibilité d'utiliser les rayons
g a m m a de haute énergie (2,35, 2, 65 MeV) de u 6
R h pour évaluer la fraction d'événements de fission qui se pro-
duit dans 2 3 9
Pu formé pendant l'irradiation. Le résultat de la détermination des intensités relatives des rayons
g a m m a donne â penser que cette méthode n'a qu'une application limitée.
ОПРЕДЕЛЕНИЕ СТЕПЕНИ ВЫГОРАНИЯ НЕДЕСТРУКТИВНЫМ МЕТОДОМ С ПОМО-
ЩЬЮ ГАММА-АКТИВНОСТИ ПРАЗЕОДИМА-144 С ЭНЕРГИЕЙ 2,18 Мэв. В последние годы
в некоторых научно-исследовательских центрах гамма-скеннирование применяли для опреде-
ления профиля выгорания в облученных топливных элементах, при этом в качестве контро-
лируемого излучения чаще всего использовали гамма-излучение цирконий-95/ниобий-95 с
энергией 0,75 Мэв. В связи с трудностями установления геометрии и определения само-
поглощения гамма-активности в топливе не представлялось возможным применять этот ме-
тод для количественного определения выгорания, которое часто осуществляется путем рас-
творения отдельных частей топлива, после чего применяются методы обычного разделения
продуктов деления или обеднения урана-235.
Описываются эксперименты, проведенные с целью калибрования гамма-развертывающего
устройства для осуществления количественных изменений путем счета гамма-активности
с энергией 2,18 Мэв, порождаемой празеодимом-144, короткоживущим продуктом церий-144
(период полураспада ?85 дней), взятым из отдельных таблеток в некоторых образцах топлива,
изготовленного из U 02. Затем определяли точные значения выгорания путем растворения и
применения метода изотопного разбавления с использованием устойчивых продуктов деле-
ния молибдена.
Элементы, которые вращались вокруг своих продольных осей с целью сведения к ми -
нимуму эффектов асимметрии, наблюдали с помощью кристаллов иодида натрия и многока-
нального анализатора через соответствующий коллиматор. Путем применения соответствую-
щих коэффициентов ослабления брали поправку на ослабление гамма-активности (значитель-
но меньшее, чем при энергии 0,75 Мэв) в топливных элементах, которые имели различные
диаметры (12,6-15,04мм), и определяли коэффициент эффективной геометрии прибора. С
целью проверки применяемых поправок рассчитывали также коэффициент счетчика для ак-
тивности цирконий-95/!1иобий-95 0,75 Мэв, и в некоторых случаях для активности цезия-137
с энергией 0,66 Мэв. Полученные результаты свидетельствуют о том, что по крайней ме-
ре в диапазоне выбранных диаметров и переходов охлаждения этот метод пригоден для коли-
чественных определений.
Проведены также предварительные эксперименты с целью изучения возможностей при-
менения гамма-излучения рения-106 большой энергии (2,35 и 2,65 Мэв) как метода опреде-
ления доли случаев деления плутония-239 во время облучения. Определение относительных
интенсивностей гамма-излучения показывает, что этот метод имеет лишь ограниченную сфе-
ру применения.
DETER M I N A C I O N DEL G R A D O DE C O M B U S T I O N POR MEDIOS N O DESTRUCTIVOS U T I L I Z A N D O LA
RADIACION G A M M A DE 2,18 M e V DEL 114
Pr. En varios establecimientos se ha venido utilizando en los últimos
años la exploración con rayos g a m m a para determinar la variación del grado de combustión a lo largo de
elementos combustibles irradiados; la radiación empleada más a menudo para fines de medición ha sido la
g a m m a de 0, 75 M e V , emitida por el "'Zr/96
^. Las dificultades con que se tropieza para establecer la geo-
metría y la autoabsorción de la actividad g a m m a en el combustible, han impedido aplicar ese método a la
determinación cuantitativa del grado de combustión. Este suele determinarse disolviendo partes seleccionadas
de combustible y separando por procedimientos clásicos los productos de fisión, o bien por métodos de agota-
miento del 2 3 5
U.
El presente trabajo describe los experimentos realizados con miras a calibrar un dispositivo explorador de
rayos g a m m a , destinado a mediciones cuantitativas por recuento de la actividad g a m m a de 2,18 M e V debida
al i«Pr, descendiente de período breve del l 4 4
Ce (T¡/2 285 d), presente en pastillas escogidas de varias muestras
de U 02. Los grados exactos de combustión se determinaron luego por disolución y aplicando el método de
dilución isotópica, para lo cual se emplearon productos estables de la fisión del molibdeno.
Un cristal de yoduro sódico y un analizador multicanal « vefan» , a través de un colimador adecuando,
los elementos combustibles a los que se hacía girar alrededor de sus ejes longitudinales a fin de reducir al
mfnimo los efectos de asimetría. La atenuación de la actividad g a m m a (mucho menor que para el caso de
0, 75 M e V ) en los elementos combustibles de distintos diámetros (12, 6 a 15, 04 m m ) , se corrigió aplicando

NON-DESTRUCTIVE DETERMINATION OF BURN-UP 401
factores de atenuación relativa, y se determinó el factor geométrico efectivo del instrumento. A fin de veri-
ficar las correcciones aplicadas, también se calculó el factor del contador para la actividad de 0,15 M e V
emitida por el 95
Zr/'5Nb, y en algunos casos para la actividad de 0, 66 M e V del "'Cs. Los resultados obtenidos
demuestran que, al menos dentro del intervalo de diámetros y tiempos de enfriamiento utilizados, el método
se presta a determinaciones cuantitativas.
También se han realizado experimentos preliminares destinados a explorar la posibilidad de usar los
rayos g a m m a de alta energía (2, 35 y 2, 65 M e V ) emitidos por el 1 0 6
Rh en la determinación del grado de fisión
sufrido por el 239
Pu formado durante la irradiación. La determinación de las intensidades relativas de los rayos
g a m m a sugiere que el método sólo posee una aplicación limitada.
1. INTRODUCTION
1 . 1 . The determination of the burn-up of irradiated fuel , in the f o r m of i r radiat ion s p e c i m e n s , fue l e l ements o r a s s e m b l i e s , has r e c e i v e d i n -creas ing attention during the past few y e a r s . The ear l i e r approach of d i s -solution f o l l owed by uranium-deplet ion analys is o r by conventional r a d i o -chemica l separation p r o c e d u r e s f o r var ious f i s s i o n products such as Zr 9 5 , Cs137 o r Sr 8 9 , has been complemented and often superseded by the i so top i c -dilution technique using stable molybdenum o r neodymium f i s s i on products [1, 2 ] . This technique o f f e r s inc reased a c c u r a c y and p r e c i s i o n , and inde -pendence of var iat ion of f i s s i o n rate throughout the i r rad ia t i on p e r i o d o r detai led i r radiat ion h i s tory . Growing interest in m a s s - s p e c t r o m e t r i c methods is re f lected in the number of papers describing such methods at the recent Gatlinburg conference [3 ] .
1. 2. The use of gamma-spec t rometry or gamma-scanning f o r the non-destruct ive determinat ion of burn-up , which i s c o n s i d e r e d in this paper , cannot at present reach the same accuracy as the destructive methods, but nevertheless o f f e r s obvious advantages in t ime and expense and, in certain c i rcumstances where it is desirable to avoid fuel dissolution, it may be the most suitable method.
Gamma-scanning is used in several laboratories [4-7] including Studsvik f o r the determination of burn-up prof i le along irradiated fuel -e lements , and the locat ion of c r a c k s o r d iscont inui t ies . Usually the g a m m a act ivity at 0. 75 MeV due to the Zr95/Nb95 f i s s i on -produc t couple has been scanned by a shielded sod ium- iod ide crysta l and the channel-output counting-rate p r e -sented on a r e c o r d e r as the element is moved at a f ixed speed past the co l l imator .
The method has severa l l imitations: the short half - l ives involved , 65 d: Nb 9 5 35 d) res t r i c t the range of irradiat ion t imes to per iods of a few months and c o r r e c t i o n f o r planned and un-planned r e a c t o r shut-downs i n -volves cumbersome calculations. The difficulty of determining the geometry of the specimen and the se l f -absorpt ion of the emitted gamma-activity in the fuel has prevented the method f r o m being used quantitatively, and where this is desired the results have been put on a quantitative basis by the subsequent dissolution of se lected parts of the fuel fo l lowed by radiochemical analysis, thus losing the m a j o r advantage of the method.
1 . 3 . The use of m o r e energe t i c g a m m a s r e d u c e s the i m p o r t a n c e of se l f -absorpt ion in the spec imens , and the 1. 6 M e V - g a m m a f r o m Lai40 h,as
26

402 R. S. FORSYTH and W.H. BLACKADDER
been used f o r s p e c i m e n s i rradiated and coo l ed f o r short p e r i o d s [ 8 ] . By using the 2. 18 -MeV gamma f r o m P r i « , the daughter of Cei<w(T¿,285 d) the p r o b l e m s of both hal f - l i f e and attenuation are alleviated, and this has been cons idered by s e v e r a l authors [7, 9, 10 ] . In the latter r e f e r e n c e , e x p e r i -mental work is described, but once again destructive analysis was performed to establish a quantitative basis f o r the results.
1 . 4 . In the present paper , the ca l ibrat i on of a g a m m a - s c a n n e r f o r quantitative burn-up measurement is d e s c r i b e d . A f ter an initial g a m m a -scan using the 0. 75 -MeV peak, the burn-up at f ixed points along the length can be determined by means of the 2. 18-MeV gamma-activity. We describe the calibration of the instrument by means of three fuel spec imens of different d iameters and cool ing t imes and their subsequent dissolution and analysis by the stable molybdenum method. F o r other e lements , the instrument geometry factor thus determined can be applied, together with a factor allow-ing f o r the re lat ive ly low sel f -attenuation of the gamma-ac t iv i ty in the spec imen .
2. EQUIPMENT
2. 1. Scanner
A schemat i c d iagram of the g a m m a - s c a n n e r built at Studsvik [11] and used in this work is shown in Fig . 1. The apparatus is conventional: the fuel, usually in the f o r m of U0 2 pe l lets in a Z i r c a l o y can, suspended vert ica l ly , i s moved at a contro l l ed speed (6 c m / m i n ) past a c o l l i m a t o r situated in a s tee l - l ined hole in the ce l l wall, a f ixed posit ion being maintained by a pair of r o l l e r guides . Another m o t o r can be used to rotate the e lement about its ax is at a speed of 0. 5 r p m .
F o r scanning experiments, slit co l l imators of 0. 5, 1 or 2 - m m aperture can be used, but f o r the P r 1 4 4 counts a hole co l l imator of 2 - m m d i a m . , scanning a c r o s s the fuel d iameter was p r e f e r r e d , and the e f fect ive volume of fuel examined was cons idered to be a penci l of U0 2 of this d iameter through the pel let . This i s thought to be a reasonable approximation since the f u e l - t o - c o l l i m a t o r distance is smal l .
T o min imize the e f fect of extraneous gamma f r o m the fuel s t reaming through the s tee l l iner , the s o d i u m - i o d i d e c r y s t a l at the outer end of the hole is screened by a lead cap with a central hole. The results were further improved by determining and subtracting instrumentally the background counts with the fuel in posit ion by rep lac ing the co l l imator by a so l id lead plug of the s a m e d imens ions .
2. 2. Gamma spectrometry
The co l l imated penc i l of g a m m a s f r o m the s p e c i m e n w e r e v iewed by a s o d i u m - i o d i d e c r y s t a l ( I f i n X 2 in), the output be ing analysed by a nuc lear -dàta 512-channel analyser , half of the m e m o r y being used f o r the s p e c i m e n s p e c t r u m and half f o r the background. No t emperature contro l
26*

NON-DESTRUCTIVE DETERMINATION OF BURN-UP 403
Fig. 1
Schematic diagram of the g a m m a scanner
A. Lead cap G. Pin coupling
B. Sodium iodide crystal H. Steel liner
C , Multichannel analyser I. Roller guides
D. Motor for vertical movement J. Element
E. Screw drive K. Collimator
F. Motor for element rotation
was necessary since the ambient temperature in the building was sufficiently constant to prevent significant peak drift .
3. FUEL SPECIMENS
Only three fue l s p e c i m e n s w e r e avai lable f o r the ca l ibrat ion e x p e r i -ments , none with a s h o r t e r coo l ing t i m e than f i v e months . B r i e f deta i ls of the spec imens are given below. Detailed information about reactor shut-downs is not given in order to save space, but these, of course , were taken into consideration in all calculation work.
Spec imen 1: UO2, fue l d i a m . , 12 .6 m m . Irradiation t ime , "8705 d. E x a -mined after cool ing t i m e s of 155 and 181 d. Total fue l burn-up was 7.34X10¹⁷ f i s s i o n s / g UO2 at the posit ion examined.
Specimen 2: U 0 2 , fue l d i a m . , 15 .04 m m . Irradiation t ime, 23. 2 d. E x a -mined after a cooling time of 373 d. Fuel burn-up was 1.10 X 10 l s fissions/g UO2.
Spec imen 3: ЦОг, fue l d i a m . , 14 .8 m m . Irradiation t ime, 19. 5 d. E x a -mined after coo l ing t i m e s of 508, 550, 625 and 646 d. Fuel burn-up was 1.60X10¹⁸ f i s s i o n s / g U 0 2 .

404 R. S. FORSYTH and W. H. BLACKADDER
4. METHOD
4.1. General
Although a f o r m of cal ibration corre lat ing the P r i 4 4 counting rate with burn-up, allowing only f o r irradiation and cooling history, fuel geometry and gamma sel f -absorption can be carried out, in this work it has been preferred to extend the method to other gamma emi t t e r s , thus permit t ing a fur ther check on the c o r r e c t i o n f a c t o r s used and perhaps allowing m o r e data to be avai lable f o r s c rut iny . F o r this purpose a knowledge of how the re la t ive pho to -peak e f f i c i e n c y of the de te c t o r c r y s t a l v a r i e s with incident g a m m a energy i s r equ i red , together with data on g a m m a - b r a n c h i n g ra t i os , h a l f -l i v e s and f i s s i o n y i e l d s . A l l f a c t o r s a r e c o n s i d e r e d m o r e f u l l y b e l o w .
4. 2. Gamma counting-rates
T y p i c a l gamma spec t ra of the three s p e c i m e n s with background s u b -tracted are shown in F igs . 2, 3 and 4, plotted to show the relative counts o b -se rved at low and high e n e r g i e s . The reso lut ion of the 2. 18 -MeV gamma photo-peak was always between 5. 5 and 6% (width at hal f -peak height). In each cal ibration exper iment , the counting t ime was selected to give a total photo -peak count of not l e s s than 4 X 1 0 4 , giving a counting p r e c i s i o n (3 a) of 1. 5% or better . F o r the Pr 1 4 4 gamma peak this usually meant a counting t ime of s e v e r a l hundred minutes f o r the relat ively low burn-up spec imens examined.
Determination of the photo -peak counts was c a r r i e d out by ar i thmetic addition of the appropriate channel counts and subtracting an arbitrary back-ground cons idered as a straight line connecting the min imum on the h igh-energy s ide to half the height of the va l ley on the l o w - e n e r g y s ide . T h i s p r o c e d u r e could not be used d i rec t ly when peaks at 0. 66 M e V ( C s 1 3 7 ) and 0. 75 MeV (Zr 9 5 /Nb 9 5 ) were both evident and the results f r o m these spectra are , of c o u r s e , l e s s accurate .
4. 3. Crystal efficiency
The gamma counting-rates as determined in 4. 2 were then correc ted f o r the photo-peak ef f i c iency of the sodium-iodide detection crystal to enable counts at di f ferent energ i es to be c o m p a r e d d i rec t ly . Data w e r e obtained f r o m the l iterature [12] and checked by isotopes calibrated by 4тг counting, satisfactory agreement being obtained. All e f f i c iencies were calculated with respec t to the C s ^ l 0. 6 6 - M e V gamma, which was given an arbi trary e f f i -c i ency of 1. The re la t ive c r y s t a l e f f i c i e n c y curve i s shown in F i g . 5.
4. 4. Gamma attenuation in can and fuel
The re lat ive counting-rat es were then c o r r e c t e d f o r attenuation in the Z i r c a l o y canning, and se l f - absorp t i on in the UO2 fuel . F igure 6 presents c u r v e s showing the re lat ive percentage t r a n s m i s s i o n perpendicu lar to the sur face of g a m m a s of 2. 18, 0. 75 and 0. 66 MeV f r o m varying th i cknesses

NON-DESTRUCTIVE DETERMINATION OF BURN-UP 405
2.18 MeV
Fig. 2
G a m m a spectrum of specimen 1.
(155-d cooling)

406 R. S. FORSYTH and W. H. BLACKADDER
i 2 Э E N E R G Y ( M e V )
Fig. 5
Relative photo-peak efficiency curve of the X 2-in sodium iodide crystal
1 10 15 20 D I A M E T E R U C M m m )
Fig. 6
Relative transmission curves of various g a m m a activities from UOz fuel
of U O z , the m a s s absorption coef f i c ients used being those given by BERRY [ 1 3 ] . It i s not c la imed that the c u r v e s are ac curate , but it is c o n s i d e r e d that they give the relat ive values, and demonstrate how much less sensitive to se l f -absorpt ion e f fec ts is the 2 . 1 8 - M e V gamma-act iv i ty .
4. 5. Fuel geometry
The final c o r re c t i on to the counting results is to calculate the observed activity per gram of fuel . As mentioned in 2 . 1 , the volume of fuel scanned is cons idered to be a penci l of UO2 of diam. 2 m m a c r o s s the pellet diameter. The original density of the UOg is then used to calculate the weight.

NON-DESTRUCTIVE DETERMINATION OF BURN-UP 407
4. 6. Calculated activity
To determine the calibration factor F, the observed counting rates for Pri44, and where possible Zr95/Nb95 and Csi37, corrected as described in 4. 2 to 4. 5, were compared with the total calculated activity per gram of fuel of the appropriate isotope f o r each of the three fuel spec imens . To carry this out, samples of the pellets examined by spectrometry were d is -solved and the burn-up determined accurately by the stable molybdenum method [1] . By use of the detailed irradiation history of each specimen,
TABLE I
DATA USED IN ACTIVITY CALCULATIONS
Isotope Energy
(MeV) Half-life
Branching ratio Fission yield
(%)
Pr"4
(Ce1
") 2.18 285 d 0. 8 6. 0
Z r9 5
0.75 65 d 98 6.2
N b9 5
0. 76 35 d 99
Cs1 3 7
0.66 30 yr sé e. is
together with values of f iss ion yield [14] and half- l i fe and branching ratios [15], the activity of each gamma at the time of the gamma measurements could then be readily calculated. The constants used in the calculations are given in Table I. The calibration factor F represents the ratio of calculated activity to the corrected observed activity.
5. RESULTS
5.1. Element rotation
Some experiments were carried out to determine the degree of i r r a -diation asymmetry of the elements due to their position in the reactor. The rod of specimen 2 was moved past the col l imator until the selected pellet was being viewed by the col l imator, and was then counted thirteen t imes, rotating the element through 90° after each count. The counting rates at 0.75 MeV and 2.18 MeV were then calculated, and the results demonstrated an apparent difference of about 9% between the 0. 75-MeV activity viewing with the element at 0° and 180°, whereas the activities at 90° and 270° were the same and equal to the mean. A rather smaller asymmetry was noted with the 2.18-MeV activity. A similar effect was observed with specimen 3.
Hence, in all experiments, the elements were rotated axially while being counted to obtain a mean burn-up over the whole pellet cross-section.

408 R. S. FORSYTH and W. H. BLACKADDER
Par t i cu lar ly with a hard gamma such as the Pr 1 4 4 2. 18 -MeV gamma, this would a l so helo to even out poss ib le migrat ion e f f e c t s .
5. 2. Calibration results
Tables II, III and IV give the results of the calibration experiments on s p e c i m e n s 1, 2 and 3, r e s p e c t i v e l y , and show the g a m m a c o u n t i n g - r a t e s observed, the counting-rate per gram of fuel correc ted as described in parts 4. 2 - 4 . 5, the total act iv i ty of the p a r t i c u l a r g a m m a as ca l cu la ted by the method d e s c r i b e d in part 4. 6, and the ca l ibrat ion f a c t o r F .
T A B L E II
S P E C I M E N 1: R E S U L T S OF C A L I B R A T I O N E X P E R I M E N T S
Isotope
Cooling
time
(d)
y/min
(observed)
y/min/g U O 2
(corrected)
y/min/g U 02
(calculated)
Calibration
factor
F (X105
)
Zr/Nb9 5
155 1. 53X105
'7. 7 9 X 1 05
1. 62 x 101 1
2.08
Pr144
155 155 1.69X10³
4. 04 x10s
2. 39
Zr/Nb5 5
181 1.14X10⁵
5. 82 X 10 s
1. 27X101 1
2.19
Pr1 4 4
181 147 1. 6 0 x 1 0s
3. 79X108
2. 36
T A B L E III
S P E C I M E N 2: R E S U L T S O F C A L I B R A T I O N E X P E R I M E N T S
Isotope
Cooling
time
(d)
y/min
(observed)
y/min/g U 02
(corrected)
y/min/g UO2 (calculated)
Calibration
factor
F (X105
)
Zr/Nb9 5
373 2 . 4 2 X 1 04
1.12 X 10s
2. 48X101 0
2.21
Pr1 4 4
373 156 1.47 x 1 0s
3. 50 x 108
2. 37
The values f o r the 0. 75 and 0. 66 -MeV peaks f r o m specimen 3 are given only f o r the f irst two experiments. In the last two, the problem of allocation of counts in the partly reso lved joint peak to Zr95/Nb95 o r to Csi37, became too di f f icult . Even f o r the resu l ts quoted, the inaccuracy is high and they aré included only to i l lustrate the method.
The calibration fac tors f r o m all the experiments are collected in Table V, and it can be seen that the values calculated f r o m the P r i 4 4 activity results
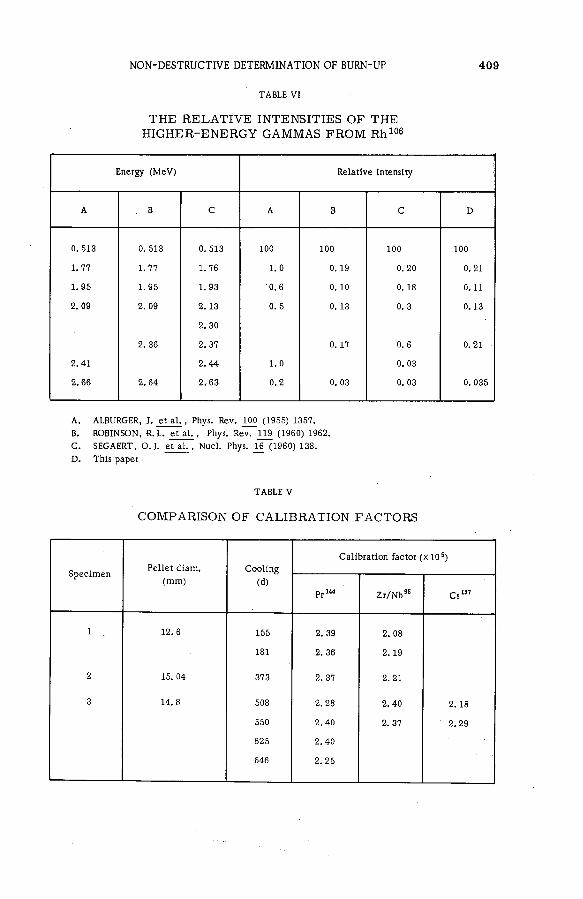
NON-DESTRUCTIVE DETERMINATION OF BURN-UP 409
TABLE VI
THE R E L A T I V E INTENSITIES OF THE H I G H E R - E N E R G Y G A M M A S F R O M Rh 1 0 6
Energy (MeV) Relative intensity
A . В С A В С D
0. 513 0. 513 0. 513 100 100 100 100
1. 77 1.77 1.76 1. 0 0. 19 0. 20 0.21
1. 95 1.95 1.93 0.6 0. 10 0. 18 0.11
2. 09 2. 09 2.13 0. 5 0. 13 0. 3 0.13
2. 30
2. 36 2. 37 0. 17 0. 6 0.21 •
2. 41 2.44 1.0 0. 03
2 66 2. 64 2.63 0.2 0. 03 0. 03 0. 035
A . ALBURGER, J. et al. , Phys. Rev. 100 (1955) 1357.
B. ROBINSON, R. L. et al. , Phys. Rev. U 9 (1960) 1962.
C . S E G A E R T , O.J. et al., Nucí. Phys. Jjï (1960) 138.
D . This paper
T A B L E V
C O M P A R I S O N O F C A L I B R A T I O N F A C T O R S
Specimen Pellet diam.
( m m )
Cooling
(d)
Calibration factor (X105
)
Specimen Pellet diam.
( m m )
Cooling
(d)
P ri « Zr/Nb
9 5
Cs1 3 7
1 12.6 155 2. 39 2. 08
181 2. 36 2.19
2 15. 04 373 2. 37 2.21
3 14. 8 508 2. 28 2. 40 2. 18
550 2. 40 2. 37 2.29
625 2.40
646 2.25

410 R. S. FORSYTH and W. H. BLACKADDER
show v e r y sa t i s fac tory agreement . (The resu l ts a re given to three s i g n i -f icant f i g u r e s to aid c ompar i son , but of c ourse , the p r e c i s i o n of the mean cal ibrat ion f a c t o r is probably about 5 % . )
The bias of only about 8% between the results f r o m the Z r 9 5 / N b 9 5 a c t i -vity ( s p e c i m e n s 1 and 2) arid the P r 1 4 4 act iv i ty must a l s o be r e g a r d e d as sa t i s fac tory cons ider ing the d i f f e rence in fue l d iameter and the e f fec t this may have on the assumptions made with respect to attenuation and geometry. It could a l so , of c o u r s e , be readi ly explained by inaccurate f i s s i o n y ie lds and, m o r e probably, the inaccuracy of the branching ratio of the 2. 18 -MeV gamma used (0. 8%).
5. 3. Rhlut> gamma activity
Since there was a possibi l i ty of the 2. 18-MeV peak being augmented by the 2. 1 - M e V peak f r o m Rhl°6> the 3 0 - s daughter of Rui°6, thus c a u s i n g e r -r o r s , it was dec ided to examine this e f f e c t in detai l . It was a l s o obvious that if a c l e a r l y r e s o l v e d peak f r o m Rh1 0 6 at st i l l higher energy , say that at 2. 65 MeV, could be o b s e r v e d , this would o f f e r the poss ib i l i ty of us ing the ratio between the counting rates at the two energies as a measure of the number of f i s s i o n s in the s p e c i m e n or ig inat ing in U 2 3 5 o r in P u 2 3 9 , s ince the f i s s i o n y i e l d s of Ru1 0 6 a r e widely d i f f erent f o r these i s o t o p e s (0. 38%, 4. 57%). This , of course , was not applicable to the low- irradiated spec imens descr ibed in the paper, but could be valid f o r many p o w e r - r e a c t o r elements.
The published values f o r the re lat ive intensit ies of the h i g h e r - e n e r g y Ruio6 gammas show wide divergence , and it was decided to check the values, f a i r ly approximate ly , using the multichannel analyser and two di f ferent e f f i c i ency - ca l ib ra ted sod ium- iod ide c rys ta l s (2 in X I f in and 3 in X 3 in). The r e s u l t s obtained, t oge ther with the l i t e ra ture va lues , a re p r e s e n t e d in Table VI. Only the results f o r the higher-energy gammas are given, since the peaks at 1 .13 MeV and 1. 55 MeV were readi ly shown to be due to s u m -mation e f f e c t s .
Using the determined relative intensity data and the branching ratio f o r the Rh106 0 . 51-MeV gamma given in re ference [15] , calculation showed that f o r each of the spec imens examined, inter ference f r o m the Rhi°6 2 .1 -MeV peak was negl igible .
It was fur ther shown that, even a f ter long coo l ing t i m e s , s p e c i m e n s which had an apprec iab le percentage of f i s s i on events due to Pu239, grown in situ, would not ;give a c learly resolved peak at 2. 65 MeV because of Rh106 .
6. CONCLUSIONS
It has been shown p o s s i b l e to ca l ibrate a g a m m a - s c a n n i n g apparatus f o r quantitative burn-up determination by a s imple procedure using the 2. 18 -MeV gamma-act iv i ty f r o m P r i 4 4 . The approximations made with r e -spect to attenuation and fuel geometry and the inaccurac ies of nuclear c o n -stants seem to cancel out, at least over the range of fuel diameters and coo l -ing t i m e s d e s c r i b e d h e r e . Continuing work should i m p r o v e the p r e c i s i o n of the calibration, at present bel ieved to be about 5%, and check its validity

NON-DESTRUCTIVE DETERMINATION OF BURN-UP 411
TABLE IV
SPECIMEN 3: RESULTS OF CALIBRATION EXPERIMENTS
Isotope
Cooling
time
(d)
y/min
(observed)
y/min/g U 02
(corrected)
y/min/g U 02
(calculated)
Calibration
factor
F (Х105
)
Cs1 3 7
508 3. 5 4 X 1 03
1. 59X10 4
3.46 x10s
2.18
Zr/Nb9 5
508 8. 20 X 1 03
3 . 8 5 X 1 04
9. 2 3 X 1 09
2.40
Pr1 4 4
508 171 1. 62 X 1 03
3. 70X108
2. 28
Cs1 3 7
550 3. 35X103
1. 51 x 10 4
3. 4 5 X 1 09
2. 29
Zr/Nb9 5
550 5. 32 x10s
2. 51 x 104
5. 95 X 109
2.37
p t 1 4 4 550 145 1. 39 X10 3
3. 34X108
2.40
Pr1 4 4
625 121 1.16X10 3
2.78X10® 2. 40
Pr1 4 4
646 123 1.18X10³
2. 64Х108
2.25
with fuel of different diameters. The absolute accuracy, of course, is still dependent on the accuracy of the nuclear data used, particularly the fission yield, and the irradiation history, but the 285-d half- l i fe helps to reduce the importance of the latter.
R E F E R E N C E S
[1] FORSYTH, R.S. et al., TID-7629, 166-76.
[2] FUDGE, A.J. et al. , TID-7629, 152-65.
[3] The Eighth Conference on Analytical Chemistry in Nuclear Technology, Gatlinburg, Tennessee, 6th-8th
October (1964).
[4] BURIAN, R.J. and G A T E S , J. E. , BMI-1319 (1959).
[5] BURIAN, R.J. et al. , TID-7599, 382-90.
[6] W E S T , D.B. et al. , TID-7599, 391-98,
[7] DIGGLE, W.R. and B L A C K A D D E R , W . H . , T R G Report 603 (D) (1963).
[8] FORSYTH, R.S. and DIGGLE, W.R., U . K . A.E. A . Internal Document IG M e m o 230 (D) (1959).
[9] Reactor Technology Report No. 14, KAPL-2000-11 (1960).
[10] CORNISH, F. W . et al. , A W R E 0-22/61 (1962).
[11] DJURLE, S. and WINOVIST, В., unpublished work, AB Atomenergi, Studsvik.
[12] U S A E C Nuclear Data Tables, Part 3 (1960).
[13] BERRY, P.F., Nucleonics Data Sheet, Nucleonics 19 6 (1961).
[14] Reference Data Manual, Nucleonics H (i960).
[15] ALLEN. R. A . et al. , AERE-R 2938, ~2nd edition (1961).


FUEL LOCATION, HOMOGENEITY AND AMOUNT IN FLAT AND TUBULAR CONFIGURATIONS
P . d e M E E S T E R
S T U D I E C E N T R U M V O O R K E R N E N E R G I E , M O L , B E L G I U M
A b s t r a c t — R é s u m é — А н н о т а ц и я — R e s u m e n
FUEL L O C A T I O N , H O M O G E N E I T Y A N D A M O U N T IN F L A T A N D T U B U L A R CONFIGURATIONS. The
tuei elements tor tne materials testing reactor вк-я can be assembled eitner with plates obtained by the picture-
frame process, or with tubes obtained by co-extrusion. In the course of the fabrication and before reactor
loading the fuel disposition, the homogeneity and the absolute amount have to be checked or measured.
The fuel disposition should be known for positioning of the core in plates and tubes and as a first quality
evaluation of the product with regard to the geometrical specifications. Radiography at about 80-90 keV,
autoradiography and gammagraphy with a thulium-170 source have been done. By radiographing the fuel tubes
a lead mandrel with the X-ray film fixed to it was placed inside the tube and subsequent X-ray shots at different
angles were taken. A radioactive source scanning the fuel tube along its centre line in combination with a
film around the tube showed records with a high resolution.
The fuel homogeneity is to be controlled in view of a safe reactor operation, i. e. on the one hand to
avoid exaggerated fuel concentrations that could give rise to vapour formation in the operating PWR, and on
the other hand to guarantee a sufficient and evenly spread fuel load. Radiographs can be used for a visual
check. However, if a quantitative analysis is needed, a better devicç is a scintillation g a m m a spectrometer
measuring the proper radiation emitted by the U2 3 5
. An analysis of the results on some 400 fuel plates and on
a first batch of fuel tubes is given. Forming characteristics and typical end-forms can be controlled. Absorption
measurements with an activated source gave less good results. Digital results from static measurements and
continuous recording are discussed.
The fuel amount as an absolute quantity should be known per zone for actual reactor-operation calculations
and per complete element for reasons of fuel accounting and for comparison with post-irradiation bum-up
evaluation. The fabrication and the use of the different standards are considered. Accuracy and elimination
of errors are discussed.
Some possible future improvements in the tests are proposed.
RÉPARTITION, HOMOGÉNÉITÉ ET QUANTITÉ D U COMBUSTIBLE D A N S LES ÉLÉMENTS A CONFIGURA-
TION PLATE O U TUBULAIRE. Les éléments combustibles pour le réacteur d'essai de matériaux BR-2 peuvent
être-réalisés, soit avec des plaques obtenues par cadrages, soit avec des tubes obtenus par coextrusion. Au cours
de la fabrication et avant le chargement dans le réacteur, il faut vérifier ou mesurer la répartition, l'homo-
généité et la quantité du combustible.
Il faut connaître la répartition du combustible pour le positionnement de l'âme dans les plaques et tubes
ainsi que pour une première évaluation qualitative du produit du point de vue des spécifications géométriques.
On a procédé à des radiographies 3 80-90 keV, ainsi qu'à des autoradiographies et gammagraphies avec une
source au thulium-170. Pour l'examen radiographique des tubes de combustible, on a introduit dans le tube
un mandrin en plomb auquel était fixé un film sensible aux rayons X, puis on a fait des radiographies sous divers
angles. En utilisant une source radioactive se déplaçant le long de l'axe du tube et un film placé autour du
tube, on á obtenu des enregistrements avec un très bon contraste.
Il faut contrôler l'homogénéité du combustible pour assurer la sécurité du fonctionnement du réacteur,
c'est-à-dire pour éviter toute concentration excessive de combustible pouvant donner lieu à des formations de
vapeur pendant le fonctionnement du réacteur et pour garantir que le chargement de combustible est suffisant
et régulièrement réparti. On peut faire appel à des radiographies en vue d'une vérification visuelle. Cepen-
dant, s'il est nécessaire de faire une analyse quantitative, il est préférable d'utiliser un spectromètre g a m m a à
scintillation permettant de mesurer le rayonnement propre émis par l'uranium-235. Le mémoire contient une'
analyse des résultats obtenus pour quelque 400 plaques de combustible et pour un premier lot de tubes de com-
bustible. Il est possible de contrôler les caractéristiques de déformabilité et les formes finales. La mesure dé
l'absorption à l'aide d'une source activée donne des résultats moins satisfaisants. L'auteur discute les données
numériques obtenues à partir de mesures statiques et d'enregistrements continus.
413

414 P. de MEESTER
Il faut connaître la quantité absolue de combustible par zone pour le calcul des paramètres de fonctionne-
ment du réacteur, et par élément pour la comptabilité du combustible ainsi qu'aux fins de comparaison des
taux d'irradiation. Le mémoire traite de la fabrication et de l'utilisation des divers étalons. Il discute le degré
de précision et l'élimination des erreurs.
L'auteur propose plusieurs améliorations des opérations de contrôle.
ПОЛОЖЕНИЕ, ГОМОГЕННОСТЬ И КОЛИЧЕСТВО ТОПЛИВА В ПЛОСКИХ И ТРУБЧА-
ТЫХ КОНФИГУРАЦИЯХ. Тепловыделяющие элементы для материаловедческого реакто-
ра B R - 2 можно монтировать либо с пластинками, полученными в результате процесса кадро-
вой рамки, либо с трубками, полученными с помощью одновременного продавливания. В про-
цессе изготовления и до загрузки реактора необходимо проверить или измерить располо-
жение, гомогенность и абсолютное количество топлива.
Расположение топлива должно быть известно для помещения сердечника в пластинах
и трубках и для первой оценки качества продукта в отношении геометрических спецификаций.
С помощью тулия-170 были произведены радиография приблизительно при 80-90 кэв,
авторадиография и гаммаграфия. При радиографии топливных Трубок свинцовую оправ-
ку с прикрепленной к ней рентгеновской пленкой помещают внутрь трубки. . Затем под раз-
личными углами делают рентгеновски̂ снимки. Радиоактивный источник, скеннирующий
топливную трубку вдоль ее центральной линии, в сочетании с пленкой вокруг трубки показы-
вает записи, имеющие большую разрешающую способность.
Гомогенность топлива необходимо контролировать для обеспечения безопасной работы
реактора, т.е. , с одной стороны, с целью избежать избыточных концентраций топлива, кото-
рые могут вызвать парообразование при работе реактора, охлаждаемого водой под давлением,
а с другой - обеспечить достаточную и равномерно распределенную топливную загрузку. Ра-
диографы можно использовать для визуальной проверки. Если необходимо сделать количест-
венный анализ, то лучшим прибором является сцинтилляционный гамма-спектрометр, измеря-
ющий собственное излучение, которое испускает уран-235. Приводится анализ результатов,
связанных приблизительно с 400 топливными пластинками и первой партией топливных тру-
бок. Можно контролировать характеристики формирования и типичные концевики. Резуль-
таты абсорбционных измерений с помощью активированного источника являются несколько
худшими. Рассматриваются цифровые результаты статических измерений и непрерывной
записи. Для расчетов фактической работы реактора должно быть известно количество топ-
лива, как абсолютное количество, на каждую зону и на каждый полный элемент в целях уче-
та топлива и сравнения с оценкой выгорания после облучения. Рассматриваются изготов-
ление и использование различных стандартов, а также точность и устранение погрешностей.
Предлагаются некоторые улучшения при проведении испытаний в будущем.
DISPOSICION, H O M O G E N E I D A D Y C A N T I D A D DE COMBUSTIBLES E N CONFIGURACIONES PLANAS Y
TUBULARES. Los elementos combustibles para el reactor de ensayo de materiales BR-2 pueden armarse con
placas tipo cuadro, o bien con tubos preparados por coextrusión. En el curso de la elaboración y antes de cargar
el reactor, es nesesario verificar o medir la disposición, homogeneidad y cantidad absoluta de combustible.
La disposición del combustible debe conocerse para fijar la ubicación del alma en placas y tubos, y
también como primera evaluación de la calidad del producto en lo que atañe a las especificaciones sobre su
forma geométrica. Se han efectuado inspecciones mediante radiografía a unos 80-90 keV, autorradiograffa y
gammagraffa con una fuente de i™Tm. Para radiografiar los tubos de combustible, se colocó en su interior un
mandril de plomo al cual se habfa fijado la película de rayos X y se tomaron luego varias exposiciones desde
distintos ángulos. Una fuente radiactiva usada para explorar el tubo longitudinalmente, combinada con una
película dispuesta alrededor del tubo, permitió obtener registros de elevada resolución.
La homogeneidad del combustible debe controlarse con miras a un foncionamiento seguro del reactor, es
decir, se han de evitar por una parte concentraciones excesivas de combustible que podrían producir vapor en
el reactor de agua a presión (PWR) en funcionamiento, y por otra parte, garantizar una carga de combustible
suficiente y uniformemente distribuida. C o m o verificación visual, puede usarse la radiografía. En cambio,
si se necesita un análisis cuantitativo conviene emplear un espectrómetro de centelleo g a m m a que mida la
radiación emitida por el 2 3 5
U. Se analizan en la memoria los resultados obtenidos con unas 400 placas de
combustible y con una primera partida de tubos. Este método permite controlar las características de Confor-
mación y los casquetes. Las mediciones de absorción con una fuente radiactiva no dieron resultados tan satis-
factorios. Se analizan en la memoria resultados numéricos de mediciones estáticas y de registros continuos.
La cantidad absoluta de combustible en cada zona debe conocerse para poder realizar los cálculos relativos
al funcionamiento del reactor y también debe conocerse la cantidad de combustible contenida en casa elemento

FUEL LOCATION, HOMOGENEITY AND AMOUNT 415
completo, para poder llevar el control de las existencias de combustible y poder comparar con la evaluación
del grado de combustión realizada después de la irradiación. Se considera en la memoria la elaboración y el
uso de distintos elementos patrones. Se analizan el grado de exactitud y la eliminación de errores.
Se proponen algunas mejoras que podrían introducirse en los ensayos,
1. INTRODUCTION
A descr ip t ion is given of s e v e r a l assay techniques f o r M T R - t y p e e l e -ments , developed at S. С . К. / С . E. N. Mol s ome of which are already in use on a routine basis in the Belgian nuclear industry.
The fuel e lements cons idered are those of the Belgian engineering test r eac tor BR2 which can operate at a maximum thermal flux of 1015 n / c m 2 - s (Fig. 1) [1] . The fuel elements are assembl ies , about 78 mm outer diameter, of concentr ic tubes, each with a fuelled length of about 760 m m . They con-tain 90% e n r i c h e d - u r a n i u m fuel in the f o r m of a l u m i n i u m - c l a d U 24 % - A l alloy tubes o r bent plates. A standard element has six tubes f or a total load of 244 g U 2 3 5 . The c o n c e n t r i c tubular f o r m of the fuel a s s e m b l i e s a l lows the irradiat ion of smal l samples in a central exper iment hole at v e r y high thermal and epi thermal fluxes.
The fuel e lements generate la rge amounts of heat which are r e m o v e d by the coo l ing l ight w a t e r . A m a x i m u m heat f lux of about 400 W / c m 2 i s r eached , which is based on a f u e l - l o a d f igure of 38.7 m g U 2 3 5 c m 2 . This f igure is c h a r a c t e r i s t i c f o r plates as we l l as f o r tubes des igned to be a s -sembled with BR2 fuel e lements , and thus fuel-element specif ications impose to lerances on that f igure , actually being + 12%/cm 2 [2] .
Two ways of assembling the BR2 fuel elements are possible; an assemb-ly cons is ts of a c oncent r i c arrangement of e i ther fuel tubes o r plates held at their ends by fittings, which are positioned by a central support tube. The plates are produced by the p i c t u r e - f r a m e technique, sheared and bent o v e r 120°. Sets of three plates f o r m tubes which are a s s e m b l e d p r o g r e s s i v e l y f r o m the inner diameter to the outer one by a deformation locking technique. The tubes are p r o d u c e d by a c o e x t r u s i o n and c o l d drawing technique [3] . Data concerning the geometry and dimensions of the fuel element are given in Table I.
In the assay of such fuel elements some of the major items to be carried out in the c o u r s e of fabr icat ion and b e f o r e r e a c t o r loading are the posit ion of the meat , its homogenei ty and the absolute amount of fuel in a plate, a tube o r a c omple te fuel e lement .
2. F U E L LOCATION
2.1. Principle
The ro l l ed fuel plates and the coextruded fuel tubes are to be sheared to their appropriate dimensions so that the meat is well positioned relative to the edges . On the other hand, in the scope of fabrication process studies a v e r y important f a c t o r to be contro l l ed and m e a s u r e d is the g e o m e t r i c a l end f o r m s of the fuel in plates as we l l as wel l as in tubes.

416 P. de MEESTER
Fig.l
BR2 fuel element
TABLE I
D A T A F O R T H E B R 2 F U E L E L E M E N T
Tube No. Inner diam.
( m m )
M i n i m u m width of active
core per plate '
( m m )
U2 3 5
amount
per plate (g)
1 32.0 24. 59 7.25
2 40.5 33.15 9.83
3 49.0 41.55 12.27
4 57.6 50.08 14. 80
5 66.1 58.62 17.32
6 74.6 67.21 19.86
Wall thickness : 1.27 m m
Cladding thickness : 0.38 m m
Fuel alloy (meat) thickness : 0. 51 m m
Length of plate or tube : 970 m m
Length of active core : 762 ± 12.7 m m
D i f f e r e n t techniques f o r fue l l o ca t i on have been used and c o m p a r e d . They should give information on the fuelled area, which can be easi ly inter-preted and which should geometr ica l ly correspond as well as possible to the meat r e g i o n . The fundamentals of these techniques are d e s c r i b e d [4 ,5] .
2.2. Radiography
The radiography of fuel plates is now m e r e l y a routine procedure. Two X - r a y units, a Baltograph 200 and a Baltospot 300, were used with Gevaert

FUEL LOCATION, HOMOGENEITY AND AMOUNT 417
Fig. 2
Radiograph of extremity of fuel plate C.
Gevaert Litholine 081P, 100 kV, 3 m A , 5 min, FF 70 c m , developer G 201
О °
Fig.3
Radiograph of fuel tube extremity.
Rotating while exposed.
Gevaert D7 film, 75 kV, 5 mA., 1.5 min,
FF 70 c m , developer G 201.
Sçientia e m u l s i o n s Structur ix D7 and the s h r i n k a g e - f r e e Lithol ine 081 p. A s a b a s i s f o r c o m p a r i s o n f o r the d i f f e rent techniques a rad iograph of a plate extremity is given with the appropriate data (.b'ig. '¿). A marked dog -boning e f fect is v i s ib le , fo l lowed by a thinning of the alloy and a subsequent steady r i se in fuel content.
1 The coextruded tubes can be radiographed by subsequent shots, the tube being turned o v e r a given angle f o r each e x p o s u r e . A m o r e elegant t e c h -nique, however , cons is ts in radiographing the tube while continuously turn-ing on two m o t o r - d r i v e n cy l inders . The X - r a y unit stands above this_ro-tation d e v i c e , and o v e r the tube i s a lead c o l l i m a t o r box with a 1 - c m wide s l i t . In both c a s e s the X - r a y f i l m is wound on a lead mandre l inside the
27

418
Fig. 4
Top: Radiograph of plate with separate fuelled areas. Gevaert Structurix. D7, 75 kV,
3 m A , 1 min, FF 70 c m , developer G201.
Bottom: Autoradiograph of same plate area, Gevaert Structurix D10, 7 h.
tube so as to provide a c l o s e contact between the f i lm and the inner wall of the tube. A tube end radiographed in this way is shown in Fig . 3.
2. 3. Autoradiography
Autoradiographs have been obtained with the sensitive Gevaert Structurix D 10 emuls ion . The contact method was used with about 5 — 15-h exposure t ime in a rad iat i on - f ree space . Dense m a r k e r s between fuel plate o r tube and emuls ion permit p r o p e r locat ion. The edge resolution is only slightly l o w e r than that with through radiography. F igures 4a and 4b show the di f -ference between an X - r a y graph and an autoradiograph of three small fuelled regions in a ro l led plate. F igure 5 shows an inner and an outer autoradio-graph of a coextruded tube end. The best resul ts are obtained when the unwrapped f i lm emulsion is placed on the plate or tube. In this way the c l o -ses t contact is obtained and inter fer ing e f f e c t s such as paper texture and wrapping des igns of the envelope can be avoided.
2. 4. Gammagraphy
A dev i ce to check the fuel locat ion and the distribution of the fuel over the total length of the tube has been built using a radioactive source (Fig. 6). Several s o u r c e s have been tried; Tm1™ turned out to be the most appropriate and m o s t e c o n o m i c one. A s o u r c e of 1 Ci encapsulated in a 3 - m m - t h i c k aluminium tube is mounted between two 10-mm-thick lead cyl inders, so that only rays with re lat ive ly little paral lax are emitted to the fuel tube which a b s o r b s part of them (Fig . 7). A f i l m e m u l s i o n i s wound on the tube and c o v e r e d by b lack paper to pro tec t it f r o m light. A 5 - m m - t h i c k lead tube surrounds the complete device as a shielding f or the operator . The source hangs on a nylon wire wound on a motor -dr iven wheel; in this way the source
P. de MEESTER
27-

FUEL LOCATION, HOMOGENEITY AND AMOUNT 419
Д И И Р 1 шше:
• и
шШяШ WÈÈÊm ШЁШ
Я И и Н М Р I ; НИИН1 •
— ШЁЁЁЯшш
— \
mllIÈm
• И
Fig. 5
Autoiadiograph of fuel tube extremity. Gevaeit Structutix DIO, 15 h.
Top: Inner side.
Bottom: Outer side.
can scan the complete tube length while the fuel tube with lead shielding r o -tates on a turning table to smear out the geometr ical asymmetry factor . Be -ing l owered into the extreme posit ion the s o u r c e automatically r i s e s again and wil l return into its own lead cast le which r i s e s further with it up to a p r e s e t m i c r o - s w i t c h posit ion.
P a r t of a g a m m a g r a p h showing the e x t r e m i t y of a fue l tube i s g iven in F ig . 8. The emuls ion was Gevaert D 7 and the scanning speed of the source was about 1 c m / m i n . The complete tube was gammagraphed in one hour . Higher s p e e d s ( e . g . 10 min f o r a tube) can be obtained with D10 emuls ion but then the resolut ion i s reduced , which is partly because of an opposing autoradiography e f f e c t .

420 P. de MEESTER
Fig. 6
Gammagraphy unit foi BR2 tubes
3. FUEL HOMOGENEITY
3.1. Principle and equipment
As mentioned above, the fuel concentration is set at 38.7 m g / c m 2 . The to lerance on this f igure has been narrowed f r o m ± 15% / i n 2 to + 1 2 % / c m 2 . A homogeneous distr ibution of the fuel is not only n e c e s s a r y to prov ide a smooth distribution of neutron flux and power in the operating reac tor , but, m o r e o v e r , the max imum permiss ib l e values are to be determined so as to avoid insuff ic ient fuel loading as wel l as l o ca l l y too high f luxes which may give r i s e to hot spots and r e a c t o r acc idents . F o r these r e a s o n s a c h e c k f o r p o s s i b l e l o c a l v a r i a t i o n s in U 2 3 5 c o n c e n t r a t i o n i s h ighly d e s i r a b l e .
Several systems are used f or checking the fuel homogeneity in elements. Radiography g ives a c l e a r p i c ture , e a s y to interpret and to understand. Quantitative homogenei ty resul ts obtained by radiographic f i lm technique, h o w e v e r , a re l e s s re l iab le on l a r g e s u r f a c e s and quite tedious to obtain. Most d e v i c e s actual ly use a s c in t i l l a t i on - counter s y s t e m . The two p r i n -c ip les adopted are either the absorption measurement of X - r a y s descr ibed by s e v e r a l authors [6, 7] o r the m e a s u r e m e n t of the g a m m a - r a y s emitted by the fuel , which is the method used in s e v e r a l other institutes [8, 9, 10] ; the l a t t e r p r o c e d u r e has a l s o b e e n adopted at S . С . К . / С . E . N . , M o l .
In our laboratory work is being done on an automatic scanning unit and on static manually operated equipment. Both dev i ces are equipped with a

FUEL LOCATION, HOMOGENEITY AND AMOUNT 421
Fig. 7
Sketch of the mounting of the T m1 1 0
source
Nal(Tl ) sc inti l lat ion c rys ta l with p r e a m p l i f i e r and high vo l tage , ampl i f i e r and s ing le - channe l pulse -he ight ana lyser . S c a l e r s and a r e c o r d i n g r a t e -m e t e r provide digital readings and r e c o r d e d c u r v e s . The static apparatus and static measurements on plates have already been descr ibed [11, 12, 13] .
The automatic scanning d e v i c e and a se t of c o l l i m a t o r s are shown in Figs . 9 and 10. Plates or tubes of 1 - m length can be scanned in lapses vary-ing f r o m 30 s to s e v e r á l hours . The scinti l lation c rys ta l in its lead castle can make a transverse movement so that different lines parallel to the length direction can be measured subsequently; an electronical ly steered programme can provide different automatic scanning schemes . A radioactive source can be put on top of the lead cast le to make absorption measurements . Several 10 -mm-thick lead co l l imators are available, thus providing the pos -sibil ity of measuring with dif ferent resolutions and speeds .
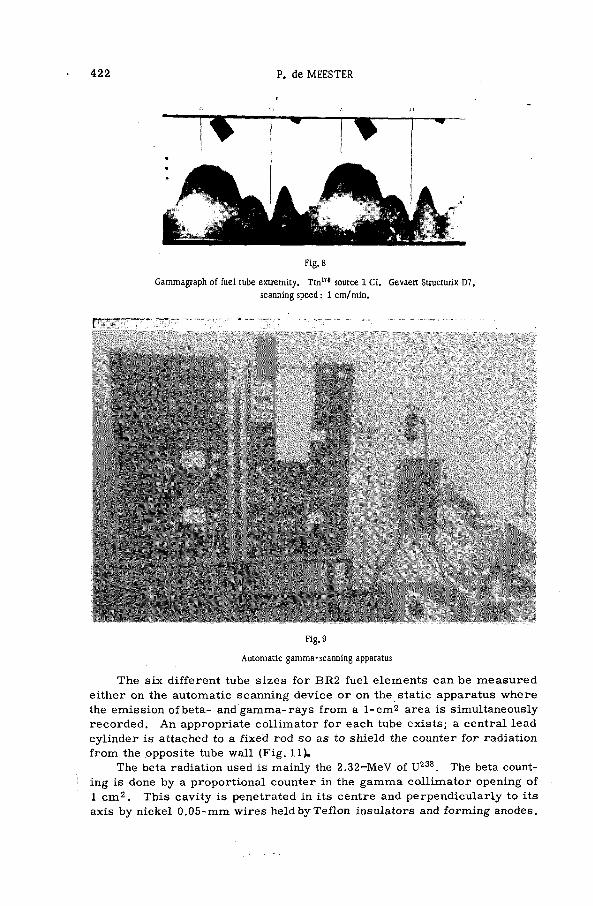
422 P. de MEESTER
Fig. 8
Gammagraph of fuel tube extremity. T mn o
source 1 Ci. Gevaert Structurix D7,
scanning speed : 1 cm/min.
Fig. 9
Automatic gamma-scanning apparatus
The s ix d i f f erent tube s i z e s f o r BR2 fuel e l e m e n t s can be m e a s u r e d e i ther on the automatic scanning d e v i c e o r on the stat ic apparatus where the emiss i on of beta- and g a m m a - r a y s f r o m a 1 - c m 2 area is simultaneously r e c o r d e d . An appropriate c o l l i m a t o r f o r each tube ex is ts ; a centra l lead cy l inder i s attached to a f ixed rod s o as to shield the counter f o r radiation f r o m the opposite tube wall (Fig. 11).
The beta radiation used is mainly the 2.32-MeV of U2 3 8 . The beta count-ing is done by a propor t i ona l counter in the g a m m a c o l l i m a t o r opening of 1 c m 2 . This cavi ty is penetrated in its centre and perpend i cu lar ly to its axis by nickel 0 . 0 5 - m m wires held by Tef lon insulators and forming anodes.

FUEL LOCATION, HOMOGENEITY AND AMOUNT 423
Fig. 10
Detail of gamma-scanning apparatus with set of collimators
— ИmÊÊÊÊÈÊm • • • • • I Я Н Н Н И Н
— •ни яшшшш \
•им шя
"ЯЁШ
j p ; И
• H I
яшш • M H
Fig. 11
Static apparatus with set of tube collimators
The counting gas, namely 90% argon with 10% methane, is circulated through the cavity. The counter is closed by a gold-plated 6-Aim-thick Mylar window. A well-stabilized high-voltage source, a double discriminator with high sensitivity and a scaler-t imer unit with low voltage supply form the electro-nic equipment.
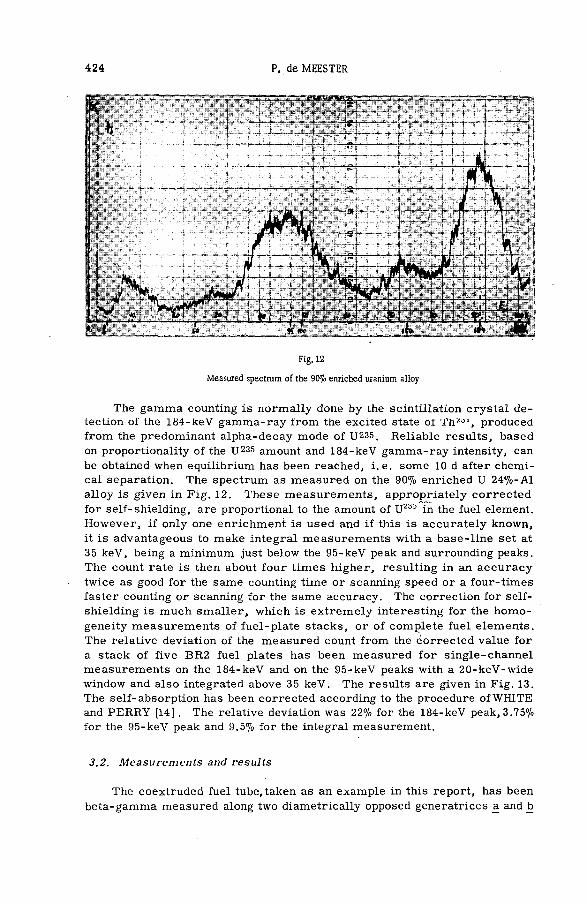
424 P. de MEESTER
Fig. 12
Measured spectrum of the 90% enriched uranium alloy
The g a m m a counting i s normal ly done by the scinti l lat ion c r y s t a l d e -tection of the 184-keV g a m m a - r a y f r o m the excited state of 'Th;"-L, produced f r o m the predominant a lpha-decay mode of U235. Rel iable r e su l t s , based on proportionality of the U 2 3 5 amount and 184-keV gamma-ray intensity, can be obtained when equilibrium has been reached, i . e . some 10 d after chemi -cal separat ion. The spec t rum as m e a s u r e d on the 90% enriched U 24%-Al a l loy i s g iven in F i g . 12. These m e a s u r e m e n t s , appropr iate ly c o r r e c t e d f or se l f -shie lding, are proportional to the amount of и1!ЗЭ in the fuel element. H o w e v e r , if only one enr i chment i s used and if this i s a c c u r a t e l y known, it i s advantageous to make integral m e a s u r e m e n t s with a b a s e - l i n e set at 35 keV, being a minimum just below the 95-keV peak and surrounding peaks. The count rate i s then about f o u r t i m e s h igher , resul t ing in an a c c u r a c y twice as good f o r the same counting time o r scanning speed or a f our - t imes faster counting o r scanning f or the same accuracy . The correct ion for se l f -shielding is much s m a l l e r , which is e x t r e m e l y interest ing f o r the h o m o -geneity m e a s u r e m e n t s of fue l -p la te s t a c k s , o r of c omple te fuel e l ements . The relat ive deviation of the measured count f r o m the c o r r e c t e d value f o r a stack of f ive BR2 fuel plates has been m e a s u r e d f o r s ing le - channe l measurements on the 184-keV and on the 95-keV peaks with a 20 -keV-wide window and also integrated above 35 keV. The results are given in Fig . 13. The se l f -absorpt ion has been correc ted according to the procedure ofWHITE and PERRY [14] . The relative deviation was 22% for the 184-keV peak, 3.75% for the 95-keV peak and 9.5% for the integral measurement.
3.2. Measurements and results
The coextruded fuel tube, taken as an example in this repor t , has been beta-gamma measured along two diametrical ly opposed generatrices a and b

FUEL LOCATION, HOMOGENEITY AND AMOUNT 4 2 5
CUMULATIVE COUNT : c / c m s
- , 6 0 ° Ь 3 0 0
- 5 0 0
К >
S л
- 2 0 0
- 3 0 0
-100
-200
50 too 150 200 m g 2 3 5 U / c m 2
Fig. 13
Gamma-ray intensity measurements on fuel-plate stacks with 2 , 3 , 4 and 5 plates
Д uncorrected measurement on the
184-keV peak of UB 5
+ uncorrected measurement on the
95-keV peak of uranium
О uncorrected integral measurement
above 35 keV
measurements corrected for
self-absorption
(as indicated in F i g . 8). The readings w e r e c o r r e c t e d f o r s e l f - a b s o r p t i o n and f o r cladding absorption, and the measuring points thus obtained are plot-ted in Fig. 14; the agreement with Fig. 8 is evident. Metallographic examina-tion con f i rmed the absolute f igures to better than 0 . 0 3 - m m alloy thickness.
The automatic scanning d e v i c e p e r m i t s a fast quality c ont ro l but can also be a valuable measuring tool in fabrication studies. Using gamma-ray r e co rd ing as a p r e c i s e laboratory tool one should examine the appropriate parameters to reach the p r e c i s i o n s wanted. Measurement charac ter i s t i c s f o r obtaining a prec i s i on of better than 1% at 99% confidence level are given in Table II and compared with the character i s t i c s to obtain but 3% accuracy at 96% conf idence l eve l . Count -reduc ing fa c to rs f o r di f ferent c o l l i m a t o r s are experimental ly measured with the descr ibed apparatus while the ca l cu -lated t ime-constants have been contro l led exper imental ly .

4 2 6 P. de MEESTER
D I S T A N C E FROM T U B E EXTREMITY
F i g . 14
Thickness of fuel alloy along two generatrices of a co-extruded tube as measured by the static
beta-gamma unit, using a tube collimator
Measurements with dif ferent co l l imators and resolutions and at various speeds are given in Fig . 15 of the same area of plate C, corresponding to the a rea shown in F i g . 2. The i n c r e a s e in r e so lu t i on on fuel h o m o g e n e i t y i s c lear ly vis ible . It i s , however, quite impractical to use col l imators smaller than 10 mm' 2 . T o invest igate the homogenei ty pattern on a s m a l l e r s c a l e it is m u c h m o r e appropr ia te to use a m i c r o r a d i o g r a p h i c technique [15] .
F o r the quality control of fuel components on a fabrication or a reception s c a l e , one should c h o o s e the c o l l i m a t o r s and scanning s p e e d s which a r e appropriate to detect the to lerances imposed by the speci f icat ion. A c c o r d -ing to actual BR2 spec i f i ca t i ons the homogenei ty is checked on the 1 - c m 2
b a s i s , the t o l e rance being a 12% deviation. F o r m e r l y , m e a s u r e m e n t s on the square- inch scale have been made, with 15% and 10% tolerances. A quick check yielding an approximate fuel content of the complete plate and a rough homogeneity pattern can be obtained in one-minute scannings of the complete plates by simultaneous chart r e co rd ing and s c a l e r reading. The complete operat ion of r e c o r d i n g , reading and rep lac ing a fuel plate takes l e s s than two minutes . A r e c o r d e r graph of such ' " qu i ck - check" m e a s u r e m e n t s i s given in F ig . 16. P lates A , B , C , D , E , F , G and H of d i f ferent s i z e s are subsequently passed . The nominal value reading and the l ower and higher

FUEL LOCATION, HOMOGENEITY AND AMOUNT 427
Fig. 15
Same area of plate С scanned with different collimators, speeds and time constants.
Collimator: 10 X 50 m m2
Time constant: 20 s
Full scale: 0 - 1750 cps
Scanning speed: 0.5 cm/min
С
Collimator: none
Time constant: 5 s
Full scale : 0 - 800 cps
Scanning speed: 4 cm/min
Collimator: 1 in
Time constant: 5 s
Full scale: 0 - 3250 cps
Scanning speed: 4 cm/min
D
Collimator: 10 m m2
conical
Time constant: 100 s
Full scale: 0 - 5 0 cps
Scanning speed: 0.25 cm/min
Collimator: 10 x 10 m m
Time constant: 20 s
Full scale: 0 - 400 cps
Scanning speed: 0.5 cm/min
tolerance readings on appropriate standards are indicated on the graph; the col l imator had a 1 X 1- in opening, the time constant was 1 s and ful l -scale range of the recorder was 0 to 3500 counts /s . The advantage of such quick checks is that a f irst select ion can be made by an easy operation. Plates F, G and H look well between the to lerances , while plates С and D can i m -mediately be rejected. Plate E will probably be rejected for an exaggerated

to 00
T A B L E II
M E A S U R E M E N T C H A R A C T E R I S T I C S
Collimators
Count-
reducing
factor
T i m e constant for
standard fuel
plate to obtain
an accuracy of
better than ±
on a 9 9 % confidence
level
(s)
Corresponding
scanning
speed
Total time
for scanning
of one fuel
plate
T i m e constant
for about ± 3 %
accuracy at
9 6 % confidence
level
(s)
Corresponding
scanning
speed
Total time
for scanning
of one fuel
plate
None 1 5 1 c m in 10 s 13-14 m i n 1 1 c m in 1. 5 s 2 min
25.4 X 25.4 m m2
0.416 5 (20) 1 c m in 10 s 13-14 m i n 1 1 c m in 1. 5 s 2 min
10 X 50 m m2
0.224 20 1 c m in 1 min 40 s 2 1/2 h 1 1 c m in 4 s 5 min
10 x 10 m m2
0. 0525 20 1 c m in 1 min 40 s 2 1/2 h 5 1 c m in 20 s 25 min
10 m m2
conical 0.0063 100 1 c m in 27.5 min 22 h 10 1 c m in 4,5 m i n ~ 6 h
3 X 3 m m2
0.00115 500 1 c m in 143 min 200 h 100-(500) 1 c m in 22.5 min ~ 3 0 h
H m я

FUEL LOCATION, HOMOGENEITY AND AMOUNT 429
Fig. 16
1-min scannings of 8 fuel plates
Fig.17
Scanning of plate A at different speeds. Scanning times are resp. 44.6 s, 61.1 s, 93.7 s and 179.7 s.
Collimator: 1 in X 1 in, time constant: 1 s, full scale : 0-2500cps
dog-boning while plates A and В can be cons idered as doubtful and will thus be re -examined careful ly . Out of a batch of severa l hundreds of fuel plates 1.5% had to be re jec ted f or too high a fuel content, 1% stayed under the a c -ceptance l e v e l , while 6% w e r e b o r d e r - l i n e c a s e s , mainly with sl ightly e x c e s s i v e dog-boning va lues . It should be noted, however , that by curing this widely-known defect one often gets fading which influences the fuel homo-geneity along the plate axis much m o r e and g ives r i s e to s t rong f lux d i s -tort ions . It is c l e a r that measurements on the end e f f e c t s and on v e r y l o -ca l i zed heterogeneit ies are v e r y inaccurate by such "qu i ck c h e c k s " . This e f f e c t is v i sua l i zed in F i g . 17 where plate A has been scanned at d i f ferent speeds vary ing f r o m 45 s to 3 min f o r a c o m p l e t e scanning.
More detailed homogeneity measurements of plates A , C , D and E are given in Fig . 18. A co l l imator of 10X 10 m m 2 was used while each scanning took about 50 min. These r e co rd ings can be c o m p a r e d with absorption

430 P. de MEESTER
Fig. 18
Detailed scanning of plates A , C , D, E
Collimator: 10 x 10 m m2
, T.C. : 5 s; scanning time: 50 min; full scale: 0-500 cps
measurements with a 1 - C i T m ™ s o u r c e using a 3 X 3-mrr¿¡ c o l l i m a t o r (Fig . 19). The general pro f i le is the same but because of the smal ler c o l l i -mator it is poss ib le to get a higher resolution f o r comparable scanning speeds .
F igure 20 shows a record ing with the 10 X 10-mm2 co l l imator of plate С along its central axis and along two parallel l ines 2 c m apart on each side of it. Near the end of the plate, at the place indicated, a transverse scann-ing has been made which revea l s a marked heterogenei ty in the d i rec t ion perpend i cu lar to the ro l l ing d i rec t i on .
Scanning measurements have been carr ied out on finished fuel elements and on stacks of fuel plates to obtain a picture of the o v e r - a l l homogeneity of an e lement . On this o c cas i on the se l f - shie ld ing e f fect has been checked . F i g u r e 21 shows 3 - m i n r e c o r d i n g s f o r a stack of f ive fuel plates with the l - i n ' z c o l l i m a t o r and with an integra l m e a s u r e m e n t above 35 keV. In the f i r s t scanning the o r d e r of the plates was А , В , E , F and G, while in the second the stacking of fuel plates has been r e v e r s e d ; in the third scanning" plate B , the fourth one, as seen by the counter , has been rep laced by plate

FUEL LOCATION, HOMOGENEITY AND AMOUNT 431
Fig. 19
Absorption measurements of plates С, D and E.
T m "° source 1 Ci, collimator : 3 x 3 m m2
, T. C. : 5 s, fyll scale: 3000-7000 cps
Fig. 20
Three parallel lengthwise scannings of plate С 2 cm apart from each other, and one transverse
scanning near the end of the plate. Collimator: 10 x 10 m m2
.

432 P. de MEESTER
Fig.21
Fuel-plate stack measurements with lx 1-in collimator
(a) Plates А, В, E, F and G piled in this sequence
(b) Plates G , F, E, B, A piled in this sequence
(c) Plates G , F, E, C , A piled in this sequence
C. The total count for the f irst two scannings dif fers only by 0.15% while the total deviation due to self-absorption was the same in the three cases , namely 8.6%.
An application of the gamma-scanning measuring procedure as a la -boratory technique is for the investigation of end forms in sandwich rolling or coextrusion processes . Since such studies are normally performed with natural uranium it is advantageous to use the absorption technique which can yield a much higher counting rate than the proper emission of natural uranium. An experimental plate with several fuel regions of different sizes and end forms has been measured by proper gamma emission and by absorp-tion of the gamma-rays emitted by a Tm1™ source . The recordings are shown in Fig. 22. The high resolution and the c lear indication of the end forms make this method quite attractive for such studies.
4. FUEL AMOUNT
Principle and results
Not only the homogeneous re-partition of the fuel in the element should be sufficiently known, but it is also of interest to obtain accurate measure-ments on the total fuel amount in an element. Fuel accountancy is a delicate item in fuel handling for which too often one has to rely on written cert i f i -cates and, on the other hand, a precise fuel content is a most valuable point f o r subsequent post - irradiat ion tests on burn-up evaluation of given fuel assembl ies and components.
A series of standards for fuel tubes as well as for fuel plates has been developed and determined by counting and chemical analysis. The standards thus obtained agreed within the experimental error with the calculated deter-mination as given by WHITE and PERRY [14] .

FUEL LOCATION, HOMOGENEITY AND AMOUNT 433
Fig. 22
'• Recordings of experimental fuel plate with natural uranium.
Lower chart: G a m m a emission of the 95-keV peak,
•Collimator: 10,x 50 m m , T.C. : 20 s, scanning speed: 1 m / h , full scale : 0-500 cps
.. Upper chart: Absorption measurement.
T m1
'0
source 1 Ci, collimator: 3 X 50 m m , T . C . : 5 s, full scale: 3000 -13000 cps.
By simultaneous digital reading and record ing while measuring the fuel plates it was thus p o s s i b l e to m e a s u r e the uranium amount p e r fuel plate within 0.1% standard e r r o r .
Rather large d i s c repanc i es in c la imed fuel amount of BR2 plates have been encountered. The given fuel amounts were based on Arch imedes den-sity measurements . Nevertheless , this method should not be rejected since it has been, shown that a m o r e sophisticated measurement based on the same principle may yield a high a c c u r a c y [16J, as supported by other statements in the l i t e rature . These m e a s u r e m e n t s , h o w e v e r , are p e r f o r m e d on fuel c o res before rolling o r extrusion. On formed fuel plates or tubes it is more appropriate to measure the fuel amount by the pr inciple of g a m m a - r a y r e -cording. A compar i son of fuel values c la imed f o r the mentioned plates and of values measured in our laboratory i s given in Table III.

434 P. de MEESTER
TABLE III
A C O M P A R I S O N O F F U E L V A L U E S
Plate Claimed U235 amount (g)
Measured U amount (g)
A 18.48 18.45 ± 0.20
В 17.48 17.55 i 0.20
С 19.23 23.30 ± 0 . 2 0
D 18.66 22.70 è 0.20
E 15.18 15.10 ± 0.15
F 11. 64 11. 65 ± 0.10
G 11.64 11.30 10 .10
H 11.74 11. 80 è 0.10
The bo t t l e -neck in these p r o b l e m s always r e m a i n s the fabr i cat ion of extremely homogeneous and appropriate standards whose fuel content is p re -c i se ly known. An appealing technique is the fabrication of standards starting f r o m a lévitation molten alloy [17J . Nominal, high- and low-to lerance stan-dards can s o be obtained in f o r m s s i m i l a r to the f u e l - e l e m e n t g e o m e t r y , the absolute e r r o r s d e c r e a s i n g to a few hundreths of a p e r cent .
5. CONCLUSIONS
The methods f o r the contro l of fuel locat ion , homogeneity and amount are sa t i s fac tory .
Autorad iography , an easy and re la t ive ly inexpensive too l f o r fuel l o -cat ion , is appealing f o r tubes , e s p e c i a l l y in the exper imenta l fabr i ca t i on phase s ince both an ins ide and an outside p i c ture are obtainable . Ins ide p i c tures can be obtained by c l a s s i c a l rad iography ; the resu l t s on outside pictures obtained by a central scanning T m l l U s ource have a higher quality than the f o r m e r . Good qualitative information on fuel homogeneity results f r o m these techniques.
Quantitative results on fuel homogeneity are given by beta- and gamma-scanning. Gamma measurements on the 184-keV peak are made, but if the enrichment is known, the integral measurements above 35 keV give fas ter o r e a s i e r results espec ia l ly f o r stacks of fuel plates o r f o r completed e l e -ments . F o r e lements with natural uranium, beta-scannings and espec ia l ly absorpt ion measurements with radioact ive s o u r c e s such as T m 1 7 0 , are the mos t appropriate of the methods descr ibed . It has been shown that the scanning devices can play an interesting ro le as a laboratory tool f o r fabr i -cation studies, where a var iety of c o l l imators and scanning speeds can provide extremely useful information. This method can contribute to a better
гв*

FUEL LOCATION, HOMOGENEITY AND AMOUNT 435
understanding, not only in the f ield of extrusion and rol l ing techniques, but a l so in the f ie ld of fuel evaluation and the def init ion of s p e c i f i c a t i o n s and t o l e r a n c e s .
The fabrication techniques of high-quality standards have been improved. The equipment with such standards has to be extended s o as to y i e ld m e a s u r e m e n t p r e c i s i o n s up to 0 .03%.
Ef fec t ive X - r a y absorpt ion measurements of uranium and U - A l al loys f r o m 120 to 200 keV, as well as se l f -absorpt ion measurements on these ma-ter ia ls in the complete range up to 200 keV, would ass is t in elucidating the problem of choosing the right gamma-energy range f o r the detection of fuel homogeneity and f o r the measurement of thë fuel amount.
A C K N O W L E D G E M E N T S
Thanks are due to S. С . К. / С. E. N. f o r the interest and the encourage -ment, and for providing the necessary equipment. The technical assistance of M e s s r s . H. Inniger and M. Mouláert is gratefully acknowledged, as well as the assistance of the e lec t ron i cs sect ion and of M r s . P. Heylen and her metal lographic team. Thanks are a lso due to the S . A . Métallurgie et M é -canique Nucléaires , Desse l , Belgium for providing fuel -e lement standards. Finally, the author is much indebted to Mr . R. Deknock and other colleagues of the non-destructive testing group.
R E F E R E N C E S
[1] R U S H , D . et al. , Belgian Engineering Test Reactor BR2, Design and Safety Report B L G 5 9 (1961).
[2] BR2 Fuel Element Specification, M o l . November (1954).
[3] FLIPOT, I., DEPOITIER, J. and M A S S A U X , H . , S.C.K./C.E.N. , R. 2341. (1965).
[4] C O M P T O N , A . H. and ALLISON, S. K . , X-rays in Theory and Experiment, N e w York, Van Nostrand,
(1957).
[b] NiCKERSUN, R.A. , Nondestructive Testing, Ian.-Feb. (1958) 24-27, 41.
[6] COTTERELL, K., Applied Materials Research, April (1954) 102-112.
[7] FOSTER, B.E. , SNYDER, S.D. and M c C L U N G , R.W., Proc. 4th Int. Conf. on Nondestructive Testing,
London (1963) 339-342.
[8] M c G O N N A G L E , W.J. , TID-7560, U S A E C , Jan. (1958) 197-208.
[9] M c G O N N A G L E , W.J., TID-19821. (1963).
[10] BEYER , N.S. , Proc. 4th Int. Conf. on Nondestructive Testing, London (1963) 331-334.
[11] DE MEESTER, P. et al. , T1D-7642, 1 (1963) 182-196. [12] P L A N Q U A R T , J. et_al., 3rd U N Int. Conf. PUAE, A/CONF.28/P/716 (1964).
[13] DE MEESTER, P. , BRABERS, M.J. and D E K N O C K , R., Brit. J. non-destr. Test. 6 , 4 (1964) 123-129.
[14] W H I T E , J.F.K. and PERRY, R.B., COO-272, November (1960).
[15] N EIDER, R. and DE MEESTER, P., See these Proceedings (SM 63/42).
[16] V A N H O V E , L., private communication (1964).
[17] V A N A U D E N H O V E , J. , (to be published) 1965.
D I S C U S S I O N
R . S . SHARPE: I note that you use thulium as a transmission radiation f o r homogeneity measurement . Do you not cons ider that the energy of this radiation is too high f o r adequate contrast?

436 P. de MEESTER
: P , de MEESTER: The 80 keV of Tm 1 7 0 is not the only one to consider ; there is also4the bremsstrahlung at 50 keV which is fair ly important. F o r our fuel plates with a uranium concentration of about 45 m g / c m 2 this gave sat i s fac tory r e su l t s .
U.S. SHARPE; How long does it take to make a thickness measurement over the "dog -bone" region using your smallest co l l imator?
« P . de MEESTER: The smal lest co l l imator we normally use is 10 m m 2
with a c o n i c a l opening. It takes 22 h to get a p r e c i s i o n of 1% at 99% c o n -f idence l e v e l f o r a c omple te fuel plate .
. J . E . LOVETT: I would.like to comment that,' in some preliminary work carr ied out in the United States of Amer i ca "dog-boning" in U-Al alloy plates could be detected quite easily using a slit col l imator \ in X 1? in and counting under static conditions the 184-keV gamma f r o m U23&. Success ive counting f o r per i ods of one minute , mov ing the plate 1 /4 in each t i m e , showed the " d o g - b o n e " as a count rate perhaps 50% greater than that f r o m the central port ions of the plate . The w o r k was not pursued to deve l op a continuous scan at that t ime i although s e v e r a l authors have s ince developed scanning techniques under c i r c u m s t a n c e s where "dog -bon ing" was not a pr imary c oncern .
P . de MEESTER; F o r m e r work at Mol a lso included static m e a s u r e -ments .with a 1 - c m 2 o r lU-mm 2 co l l imator , and gave good results . To save t ime and obtain a c o m p l e t e homogene i ty r e c o r d , automatic scanning, was adopted. I should make it c l ear to both Mr . Sharpe and Mr . Lovett that the s m a l l e r c o l l i m a t o r is used only f o r l a b o r a t o r y work ; f o r fuel evaluat ion , m e a s u r e m e n t s of 1 c m 2 are quite su f f i c i ent .
J. GERARD: Have you made a qualitative o r quantitative c o m p a r i s o n of the p r e c i s i o n of the di f ferent methods of scanning the p lates?
P . de M E E S T E R : F o r exper imenta l natural uranium plates we found the transmission method the best, While f o r tests on enriched uranium plates we pre fer the radiation f r o m the uranium itsel f .
J. GERARD: Are you not afraid that when you use gamma counting over a wide range of the spectrum, the latter may be affected by daughter products of uranium (its age) o r of the i so topes which may be present as a result of r e cyc l ing the .enriched uranium?
P . de MEESTER: You are quite right to mention this . Never the l e s s , we know the batch of fuel, and this ef fect can be corrected f or a given batch. Since sel f -absorpt ion is much less pronounced, the precision is still superior f o r complete elements provided the correct ions I mentioned are made.

SYMPOSIUM ON. NON-DESTRUCTIVE TESTING IN NUCLEAR TECHNOLOGY
HELD AT BUCHAREST, 17-21 MAY 1965
CHAIRMEN OF SESSIONS
Session I
Session II
Session III
Session IV
Session V
Session VI
Session VII
Session VIII
Session IX
H. HULUBEI
A. KISELEV
P. de MEESTER
P. THOMÉ
R. F. HANSTOCK
G. LECCIOSOTTI
G. H. TENNEY
R. FORSYTH
R. SEIFERT
Romania
USSR
Belgium
France
United Kingdom
Italy
United States of America
Sweden
Federal Republic of Germany
Scientific Secretaries:
Administrative Secretary:
Editor:
SECRETARIAT OF THE SYMPOSIUM
J. C. DELANEY
A. PUSHKOV
K. ZYBYLSKI
MONICA KRIPPNER
Division of Nuclear Power ;
Reactors, IAEA
Division of Nuclear Power .Reactors, IAEA
Division of Scientific and Technical Information
Division of Scientific .and. Technical Information
Records Officer: D. MITCHELL Division of Languages
437

LIST O F P A R T I C I P A N T S
Name
Alecu, M .
I n s t i t u t i o n
Institute of Atomic Physics,
Bucharest
Nominating State or Organization
Romania
Allain, C. Commissariat à l'énergie atomique,
CEN de Saclay,
Services de Technologie,
Gif-sur-Yvette (S. et О.)
France
Andreescu, N. Institute of Atomic Physics,
Bucharest
Romania
Aoki, T.
Baffigo, V.
Atomic Fuel Corporation,
2-7 Hirakaw-cho Chiyoda-ku, Tokyo
Sorin, Società Ricerche Impinati Nucleari,
eia (Vercelli)
Japan
Italy
Ballard, D. Sandia Laboratory. Sandia Base,
Albuquerque, New Мех.
USA
Bally, D. Institute of Atomic Physics,
Bucharest
Romania
Bertoletti, S. Centro Informazioni Studi Experienze,
C. P. 3968, Milan
Italy
Blom, G.
Brebant, C.
Euroters, Place Rogier, Brussels
CEN de Cadarache,
Département de métallurgie,
St. Paul-les-Durance (В. du R. )
Netherlands
France
Bonnet, P.
Cizek, L.
Condé, J. F. G.
Delaney, J. C.
Destribats,
Marie-Thérèse
Service de métallurgie,
CCR Ispra Várese, Italy
National Research Institute for
Materials and Technology,
Opletalova 25, Prague
O. E. C. D. Dragon Project,
Atomic Energy Establishment,
Winfrith, Dorchester, Dorset, England
Division of Nuclear Power and Reactors,
IAEA, Kârntner Ring, Vienna
CEN de Saclay,
B.P. 2, Gif-sur-Yvette, (S. et О.)
EURATOM
Czechoslovakia
OECD/ENEA
IAEA
France
438

LIST OF PARTICIPANTS 439
Name
Dory, J.
Institution
Société des realisations ultrasoniques,
9, rue Chaussée de Paris, Meaux,
(S. et M . )
Nominating State or Organization
France
Engelmann, C. Département de métallurgie - S. R. M . P. C.,
B. P. 2, Gif-sur-Yvette, (S. etO.)
France
Filip, R. V. I. Lenin Works National Corp.,
Nuclear Power Stations Division,
Pilsen
Czechoslovakia
Francis, W . Phillips Petroleum Co. Atomic Energy Div.
P. О. B. 2067, Idaho Falls, Idaho
USA
Forsyth, R.
Gérard, J.
AB Atomenergi,
Studsvik, Nykôping
Métallurgie et Mécanique Nucléaires,
12 Europalaan, Dessel
Sweden
Belgium
Gerasimov, V. G. Energetics Institute,
Moscow
- USSR
Gevantman, L. H. Mission to the International Atomic
Energy Agency,
Schmidg. 14, Vienna VIII.
Austria
USA
Glantz, G. Institute of Atomic Physics
Bucharest
Romania
Gorski, V.
Grignon, F.
State Committee on utilisation of
Atomic Energy
CEA, 33 rue de la Fédération,
Paris
USSR
France
Hanstock, R. F.
Horvat, D.
The Reactor Materials Laboratory,
U. К. A. E. A., Colcheth,
Warrington, Lanes., England
Nuklearni Institut "Jozef Stefan",
Jamova 39, Ljubljana, Slovenia
UK
Yugoslavia
Hulubei, H. Institute of Atomic Physics,
Bucharest
Romania
Jansen, J. C. CCR Ispra Várese,
Italy
EURATOM
Kadlez, K. Simmering Graz Pauker AG,
Mariahilfe Strasse 32, Vienna
Austria

440 LIST OF PARTICIPANTS
N a m e
Kiselev, A.
I n s t i t u t i o n
State Committee on Utilization of
Atomic Energy
Nominating State or Organization
USSR
Knudsen, P. Danish Atomic Energy Commission
Research Establishment Riso,
Roskilde
Denmark
Koinig, H. Institute for Theoretical Physics,
University of Innsbruck,
Innsbruck
Austria
Koss, P.
Làbuscâ, Elena
Handelsministerium ffir Handel und
Wiederaufbau, Vienna
Institute of Atomic Physics,
Bucharest
Austria
Romania
Lafaurie, F.
Leccisotti, G.
Libotte, P.
CEA, Service de fabrications industrielles
des combustibles, Centre de Saclay
Ministère de la Santé,
Rome
Société Belge pour l'Industrie Nucléaire, S. A.
35, rue des Colonies, Brussels
France
Italy
Belgium
Listwan, W . Instytut Baden Jadrowych Z-XX,
Swietokrzyska 21, Warsaw
Poland
Lovett, J. E. United States Atomic Energy Commission,
Washington, D.C.
USA
Lucas, Monique CEN de Saclay.- DPC. IS-SSM,
B. P. 2, Gif-sur-Yvette. (S. etO.)
France
Lund, S.A. Danish Central Welding Institution,
47, Nygaardsvej, Copenhagen 0
Denmark
Lungu, S. Institute of Atomic Physics,
Bucharest
Romania
Malinowski, W . Institute of Nuclear Research,
Swierk, Z-XIV, Warsaw
Poland
Mann, C. A. Reactor Fuel Element Labs.,
The Reactor Group, U. К. A. E. A.,
Springfields Works, Salwick,
Preston, Lanes,, England
U K
Marchandise, H. 51 rue Belliard,
Brussels, Belgium.
EURATOM
LIST OF PARTICIPANTS 441
Name
Maurel, J.
McCliing, R. W .
McEachern, A. D.
McKane, R.
Meester, P. de
Mirion, I.
Nakiíenovié, S.
Neider, R.
Nystrôm, U.
•Oquidam, B.
Pawlowski, Z.
Pintelon, M .
Prot, A.
Pugnetti, G.
Purica, I.
I n s t i t u t i o n N o m i n a t i n g S t a t e or O r g a n i z a t i o n
CEN de Fontenay-au-Roses, France
D C - S. E. C. P. E. R.,
B. P. 6, Fontenay-aux-Roses (Seine)
Oak Ridge National Laboratory, USA
P.O. B. X.
Oak Ridge, Tenn. 37831.
Atomic Energy of Canada, Ltd.,
Development Engineering Div.,
Chalk River, Ontario
Canada
E. I. du Pont de Nemours & Co.,
Bldg. 723 A., Savannah, River Plant,
Aiken, S. C.
USA
S. С. К ./С. E. N.,
Boeretang, 200 Mol
Belgium
Institute of Atomic Physics,
Bucharest
Romania
Division of Safeguards and Inspection,
IAEA, Kârntner Ring, Vienna
IAEA
Bundesanstalt fiir Materialpriifung,
(Dahlem), Unter den Eichen 87,
1. Berlin 45
Federal Republic
of Germany
•AB Atomenergi,
Studsvik, Nykôping
Sweden
Centre de recherches,
Les Bérauds, Romans s/Ysère, (Drôme)
France
Institute for Basic Technical Problems
of the Polsih Academy of Sciences,
Swietokrzyska, 21, Warsaw
Poland
Association des Industriels de Belgique,
29, Avenue André Drouart, Brussels 16
Belgium
CEN de Saclay,
B. P. 2, Gif-sur-Yvette (S. et 0. )
France
Comitato Nazionale Energía Nucleate,
С. S. N. Casaccia,
Via Anguillarese, Rome
Italy
Institute of Atomic Physics,
Bucharest
Romania

442 LIST OF PARTICIPANTS
N a m e
Pushkov, A.
Raad, J. A. de
Rapin, M .
I n s t i t u t i o n
Division of Nuclear Power and Reactors,
IAEA, Kârntner Ring, Vienna
RSntgen Technische Dienst N. V.,
Delftweg 144, Rotterdam - 8.
CEA, 33 m e de la Fédération,
Paris
Nominating State or Organization
IAEA
Netherlands
France
Roussel, E. CEN de Saclay,
Dép. de métallurgie - L. E. С. I.,
В. P. 2, Gif-sur-Yvette (S. et О.)
France
Sala, L.
Salvi, P.
C. N. E. N. - Casaccia,
Rome
Ministero Industria e Comercio,
D. G. E. E. I. B..
Rome
Italy
Italy
Sanders, T. Vereinigung der Technischen
Ûberwachungs-Vereine,
Rottstrasse, Essen
Federal Republic
of Germany
Sasao, N.
Seifert, R.
Sharpe, R.
Spagna, F.
Stoian, D.
Atomic Fuel Corporation,
2-7 Hirakaw-cho Chiyoda-ku,
Tokyo
Laboratory of Richard Seifert & Co.
Hamburg 13
Research Group, A. E. R. E. Harwell,
Didcot, Berks., England
Associazione EURATOM-CNEN •
Reacteurs à neutrons Rapides,
Via Mazzini, 2, Bologna
Institute of Atomic Physics,
Bucharest
Japan
Federal Republic
of Germany
U K
Italy
Romania
Szivos*, K.
Tenney, G.
Central Research Institute for Physics,
Csillebérc, Budapest XII
Los Alamos Scientific Laboratory,
P. О. B. 1663, Los Alamos.
N. Мех. 87544.
Hungary
USA
Thomé, P. CEN de Saclay,
B. P. 2, Gif-sur-Yvette (S. et 0. )
France
Tóth, M . Central Research Institute for Physics,
Csillebérc, Budapest XII
Hungary

LIST OF PARTICIPANTS 443
Name
Van der Linde, A.
Vasseur, C.
Verstappen, G.
Warlton, D.
Wells, F.
I n s t i t u t i o n
Reactor Centrum Nederland Petten
Société des réalisations ultrasoniques,
9, Chaussée de Paris,
Meaux (S. et M.)
S. С. К. /С. E. N.,
Boeretang, 200, Mol
Battelle Northwest Laboratory,
Richland, Wash,
U. К.А.Е. A., A.E.R.E.,
Harwell, Berks., England
Nominating State or Organization
Netherlands
France
Belgium
USA
U K


AUTHOR INDEX
R o m a n numerals refer to the volume .number;
Arabic, numerals indicate the first page of the paper by an author; and
underlined arabic numerals refer to participation in a Discussion.
Adamsky , F . - J . : II 213 A l e c u , M. : II 7 5 Al lain, С. : I 167 • A n d r e e s c u , N. : II 75 Aoki , T . : II 265, 275, 276 < Bal lard , D . W . : I 165, 166;
II 45, 166, 285, 303 Bîscoveanu , I. : II 75 B lackadder , W . H . : II 399 Bonnet, P . : I 75, 206, 232, 301;
II 166, 275 B r a b e r s , M. J.-, II 195 Brebant , С. : II 139, 151 Brown, E . S . : II 331 Burdick, ЕЛ-:. : II 331 C a m p s i e , I. Ç. ; Ц 365 Cherpent ier , С . : II 3 Chenouard, J . : II 63 Condé, J . F . G . : II 167, 194 Davey , С. N. : 1 3 2 1 Deknock, R . : II 37, 195 Deniskin, V . P . : I 115 Destr ibats , M a r i e - T h é r è s e ;
I 167, 275; II 3, 21 Dodd, С. V . : II 247 Domoto , К. : II 307 • : ' Dory , J . : I 150, ,275; 283; . . . .
II 45, 46, 363 Douglas , D. A . : II 247 Engelmann, С. : II 139, 148, 149 F i l ip , R. : I 141, F o r s t e r , F . : I 331, 371, F o r s y t h , R. : I 113; II 148, 149,
399 F o s t e r , B. E . : II 247 Fou lqu ier , H. F . : I. 3 03 . F r a n c i s , W. C. : 11,246, 331, 348,
349 G é r a r d , J . : I 35, 58, 254; II 106,
264, 347, 348, 436 G e r a s i m o v , V. G. : I 115, 390;
II 209, 245, 264, 364
Gibson, G . W . : II 331 Good , P . D. : II 167 G o r s k y , V. V. : I 99, 114, 189,
204,; 233, 254, 255; II 21, 165, 275, 363, 364
G o s s e t , J. : II 139 Hanstock, R . F . : 1 72, 277 Hasiguti , R. R. ; II 307 Hol l iday, J. : II 167 Honkonen, D. L . : II 47 Horvat , D. : I 33, 61, 73; II 348 Hui l lery , R. : II 151 Igata, N. : II 307 Inniger , .H. : 1 1 0 1 Jansen, J.: I 75, 99, 205, 301; II 165 Ke l l e rmann , O. A . : I 165; II 123 Khodulev, B . S. : I 233 K i s e l e v , A . A . : I 189 Knudsen, P . : I 191, 283; II 45,
263, 348 Kuhlmann, A . : II 213 Lábuscá , Elena ; I 391; II 75, 106 Leb lanc , J. M. : I 101 Libotte , P . : I 101, П З , П 4 Lovett , J . E . : I 58; II 436 L u c a s , Monique; II 63 Lund, S . A . : I 191, 204 Mann, С. A . : I 232; II 303, 365,
382, 383 M e e s t e r , P . de : I 17, J58, 113,
165, 204, 390; II 45, 46, 60, 106, 123, 148, 195, 263, 264, 303, 364, 382, 397, 413, 436
M c Clung, R . W. : II 247, 263, 264 M c E a c h e r n , A . D. : I 3, 39; II 61,
244, 387, 397 McGonnagle , W. J . : I 151 McKane , R . H. : II 45, £7 , 60, 61
275 M i r ion, I. : II 75 M o n i e r , J. : II 139 M o r g n e r , E . : II 223
445

446 AUTHOR INDEX
Müller , P . : I 331, 367, 371, 390, 391, 392
Nakamura, Y . : II 23, 265, 307 Neider , R. : I 17, 32, 33, 204,
391; II 60, 194, 195, 209, 245, 264
Nikitin, G. A . : I 233 Nystrom, U. : 1 285, 301; II 382 Otter, A. J. : 1 3 Papezik , F . : II 3 Pawïowski , Z . : II 123, 237, 223,
245, 349 P e y r o t , J . P . : 1303 Pigeon , F . : II 3 Pointud, R . : II 167 Popov , V. K. : 1233 Pronyakin, V. T . : I 233 P r o t , A . : I 167, 303 P u r i c a , I. : II 60, 348 Raad, J. A . de: 1259 Renken, C. J. : ' II 125 Rousse l , E . : II 139, 151, 165,
166 Sasao, N. : II 307, 329
Sharpe, R. : 1 32, 99, 114, 165, 254, 272, 283, 301, 321; И 21, 60, 61, 136, 245, 264, 303, 351, 363, 364, 435, 436
Shkarlet, Yu. M. : I 115 Tateishi , Y . : II 23 Tenney, G. H. : I 33, 73, И 4 ;
II 106, 109, 123, Ш>, 364 Thomé , P . : I 167, 189 Tingey, F . H. : • II 331 Tonomae , R. : II 307 Trakhtenberg, L . I . : 1 1 1 5 Van Der Linde, A . : I 259, 272,
273, 391, 392; II 329, 348 Van Hove, L . : 1 3 5 Verstappen, G. : I 150, 254;
II 195, 209, 383 Vyakhorev, V. G. : I 115 Walker , D. С. В. : II 277 Wel l s , F . H . : I 1_13, 273, 321;
II 245, 329 Worl ton , D. C . : 1 204, 254, 301,
390; II 61, 137, 225, 244, 245, 246
Zakharov, V. M. : I 233
TRANSLITERATION INDEX
Вяхорев, В . Г . Vyakhorev, V . G. Герасимов , В . Г . Geras imov , V . G. Горский, В . В . Gorsky, V. V. Денискин, В . П . Deniskin, V . Р . Захарой, В . М . Zakharov, V . M. Никитин, Г . A . Nikitin, G. А . Попов, В . К . Popov, V. К. Пронякин, В . Т . Pronyakin, V. Т . Трахтенберг , Л .И . Trakhtenberg, L . I . Филипп, P . Fi l ip , R. Ходулев, B . C . Khodulev,. В. S. Шкарлет, Ю . М . Shkarlet, Yu. M.

O r d e r s f o r A g e n c y p u b l i c a t i o n s c a n be p l a c e d w i t h y o u r b o o k s e l l e r or any of our s a l e s
a g e n t s l i s t e d b e l o w :
A R G E N T I N A C o m i s i ó n N a c i o n a l de E n e r g í a A t ó m i c a A v e n i d a d e l L i b e r t a d o r G e n e r a l San Martin 8 2 5 0 B u e n o s A i r e s • S u c . 2 9
A U S T R A L I A Hunter P u b l i c a t i o n s ! 2 3 M c K i l l o p Stree t M e l b o u r n e , C . l
A U S T R I A G e o r g F r o m m e & C o . S p e n g e r g a e s e 39 V i e n n a V
B E L G I U M O f f i c e i n t e r n a t i o n a l de l i b ra i r i e 3 0 , a v e n u e Marnix B r u s s e l s 5
B R A Z I L L i v r a r i a K o s m o s E d i t o r a R u a d o R o s a r i o , 135*137 R i o de J a n e i r o
A g e n c i a E x p o e n t e O s c a r M. S i l v a Rua X a v i e r de T o l e d o , 1 4 0 » 1* A n d a r ( C a i x a P o s t a l N o . 5 . 6 1 4 ) S a o P a u l o
B Y E L O R U S S I A N S O V I E T S O C I A L I S T R E P U B L I C
See u n d e r USSR
C A N A D A T h e Q u e e n ' s Pr in te r O t t a w a , O n t a r i o
C H I N A ( T a i w a n ) B o o k s and S c i e n t i f i c S u p p l i e s S e r v i c e , L t d . , P . O . B o x 8 3 T a i p e i
C Z E C H O S L O V A K S O C I A L I S T R E P U B L I C S . N . T . L . S p o l e n a 51 N o v é M e s t o P r a g u e 1
D E N M A R K E j n a r M u n k s g a a r d L t d . 6 N o r r e g a d e C o p e n h a g e n К
F I N L A N D A k a t e e m i n e n K i r j a k a u p p a K e s k u s k a t u 2 H e l s i n k i
F R A N C E
O f f i c e i n t e r n a t i o n a l de d o c u m e n t a t i o n e t l i b ra i r i e 4 8 , rue G a y - L u s s a c P a r i s 5 e
G E R M A N Y , F e d e r a l R e p u b l i c o f R . O l d e n b o u r g R o s e n h e i m e r S t r a s s e 1 4 5 8 Munich 8
H U N G A R Y Kultura Hungar ian T r a d i n g C o , f or B o o k s and N e w s p a p e r s P . O . B . 1 4 9 B u d a p e s t 6 2
I S R A E L H e i l i g e r and C o . 3 Nathan S t r a u s s S t r e e t J e r u s a l e m
I T A L Y A g e n z i a E d i t o r i a l e I n t e m a z i o n a l e O r g a n i z z a z i o n i U n i v e r s a l i ( A . E . I . O . U . ) V i a M e r a v i g l i 16 Mi lan
J A P A N
Maruzen C o m p a n y L t d . 6 , T o r i N i c h o m e N i b o n b a s h i ( P . O . B o x 6 0 5 ) T o k y o C e n t r a l
M E X I C O L i b r a r í a I n t e r n a c i o n a l A v . S o n o r a 206 M e x i c o 1 1 , D . F .
N E T H E R L A N D S N . V . Mart inus N i j h o f f L a n g e V o o r h o u t 9 T h e H a g u e
N E W Z E A L A N D W h i t c o m b e & T o m b s , L t d . G . P . O . B o x 1 8 9 4 W e l l i n g t o n , C . l

N O R W A Y Jehan Grundt T a n u m Kar l J o h a n s gate 4 3 O s l o
P A K I S T A N K a r a c h i E d u c a t i o n S o c i e t y H a r o o n C h a m b e r s South N a p i e r R o a d ( P . O . B o * N o . 4 8 6 6 ) K a r a c h i 2
P O L A N D O s r o d e k R o z p o w s z e c h n i a n a W y d a w n i c t w N a u k o w y c h P o l s k a A k a d e m i a N a u k P a í a c Kultury i N a u k i Warsaw
R O M A N I A C a r t i m e x R u e A . B r i a n d 1 4 - 1 8 B u c a r e s t
S O U T H A F R I C A V a n S c h a i k ' s B o o k s t o r e ( P t y ) L t d . L i b r i B u i l d i n g . C h u r c h S t r e e t ( P . O . B o x 7 2 4 ) P r e t o r i a
S P A I N L i b r a r l a B o s c h R o n d a d e la U n i v e r s i d a d 11 B a r c e l o n a
S W E D E N C . E . F r i t z e s K u n g l . H o v b o k h a n d e l F r e d s g a t a n 2 S t o c k h o l m 16
S W I T Z E R L A N D L i b r a i r i e P a y o t R u e Grenus 6 1 2 1 1 G e n e v a 11
T U R K E Y L i b r a i r i e H a c h e t t e 4 6 9 , I s t i k l a l C a d d e s i B e y o g l u , I s t a n b u l
U K R A I N I A N , S O V I E T S O C I A L I S T R E P U B L I C
S e e u n d e r U S S R
U N I O N O F S O V I E T S O C I A L I S T R E P U B L I C S
M e z h d u n a r o d n a y a K n i g a S m o l e n s k a y a * S e n n a y a 3 2 - 3 4 M o s c o w G - 2 0 0
U N I T E D K I N G D O M O F G R E A T B R I T A I N A N D N O R T H E R N I R E L A N D
H e r M a j e s t y ' s S ta t i onery O f f i c e P . O . B o x 5 6 9 L o n d o n , S . E . I
U N I T E D S T A T E S O F A M E R I C A N a t i o n a l A g e n c y f o r . In te rnat i ona l P u b l i c a t i o n s , I n c . 3 1 7 E a s t 34th Street N e w Y o r k , N . Y . 1 0 0 1 6
V E N E Z U E L A Sr. B r a u l i o G a b r i e l C h a c a r e e G o b e r n a d o r a C a n d i l i t o 37 Santa R o s a l i a ( A p a r t a d o P o s t a l 8 0 9 2 ) C a r a c a s D . F .
Y U G O S L A V I A * J u g o s l o v e n s k a K n j i g a
T e r a z i j e 27 B e l g r a d e
I A E A p u b l i c a t i o n s can a l s o be p u r c h a s e d re ta i l a t the U n i t e d N a t i o n s B o o k s h o p a t U n i t e d N a t i o n s H e a d q u a r t e r s , N e w Y o r k , a t the n e w s - s t a n d a t the A g e n c y ' s H e a d -q u a r t e r s , V i e n n a , and at m o s t c o n f e r e n c e s , s y m p o s i a and s e m i n a r s o r g a n i z e d by the A g e n c y .
In order t o f a c i l i t a t e the d i s t r i b u t i o n o f i t s p u b l i c a t i o n s , the A g e n c y i s p r e p a r e d to a c c e p t p a y m e n t in U N E S C O c o u p o n s or in l o c a l c u r r e n c i e s .
O r d e r s and i n q u i r i e s f rom c o u n t r i e s w h e r e s a l e s a g e n t s h a v e n o t y e t b e e n a p p o i n t e d may b e s e n t to :
D i s t r i b u t i o n and S a l e s G r o u p , I n t e r n a t i o n a l A t o m i c E n e r g y A g e n c y , Karntner R i n g 1 1 , V i e n n a I , A u s t r i a


INTERNATIONAL ATOMIC E N E R G Y A G E N C Y V I E N N A , 1965
PRICE: USA and C a n a d a : US $ 9 . 0 0 A u s t r i a a n d e l s e w h e r e : S 189,-( £2.14.0,- F.Fr. 36,- ; DM 31,50 )
Copyright © 2022 FDOKUMEN