A Multi-Sensor Platform for Non-Destructive Field ... - CiteSeerX
Upload
independentCategory
view
2download
0
1. Phy.I. III FiaI1ie 4 (1994) 1481-1493 AuGusT 1994, PAGE 1481
Classification
Phy.tic.I Abstiacts
06.30L 07.55
General analysis of inductive sensor based systems for non
destructive testing
Isabelle Dufour ('), Moolraj Busawon ('), Denis Premel (2) and Dominique Placko (')
(' Laboratoire d'Electricitd. Signaux et Robotique (LESIR), URA CNRS D1375, Ecole Normale
Supdrieure de Cachan. 61 avenue du Prdsident Wilson, 94235 Cachan Cedex, France
(2) Laboratoire des Signaux et Systbme (LSS), CNRS-ESE-UPS, Ecole Supdrieure d'Electricitd,
Plateau du Moulon, 91192 Gif-sur-Yvette Cedex, France
(Received 20 Januaiy /994, accepted 20 Mav /994)
Abstract. This paper presents a general view of the Non Destructive Te~ting (NDT) systemsbased on the use of inductive sensors where the potential user~ are likely to be more and more
numerous. We describe the different phases of their conception. Firstly, we analyse the phy~ical
interaction between the sensor and the ~pecimen material by the u~e of an enlarged concept of
electrical image~. The instrumentation problem is next reviewed by analy~ing the signals which are
supplied by these sensors, and by the way leading to the definition of the differing range of
application~ of such sensors. Finally, we enumerate the various signal proce»ing techniques
usually applied in NDT and based on the general inversion techniques.
1. Introduction.
1,I THE DIFFERENT TECHNIQUES OF NON DESTRUCTIVE TESTING [1-5]. The presence of
flaws in any type of structure (metals, composites, ceramics.. j has necessarily lead to the
development of testing techniques which are specially meant to reveal these defects without
destroying the integrity of the structure this is the basic principle of Non Destructive Testing(NDTj. These techniques are rather ancient but are in perpetual evolution due to their
necessary adaptation to the control of new materials which are nowadays used in the industryand also to account for the technical progress in modelling, signal and image processing. On
the other hand, in industrial fields, the NDT are more and more demanded because, in order to
optimise the costs of production, the mechanical parts are less over dimensioned and more
stressed.
In the figure I, the users of these types of testing are briefly listed.
Among the criterion for the decisive choice of the technique to be employed, we note the
physical properties which are influenced by the presence of the defects (namely the electrical

1482 JOURNAL DE PHYSIQUE III N° 8
Users~ Aeronautics
fillMetal evaluation
~ Automobile
~,
~2 Nuclear
~
~~~fl Petrochimjcals
~others
Fig. I. Distribution of the user~ of NDT techniques.
conductivity, the magnetic permeability), the localization of the flaws (superficial, sub-surface
or volumetric defects) and the stresses imposed by the environment (single-sided access, no
contact with the specimen is possible, the high ambient temperatures, the presence of magnetic
fields, no place available for the controlling system). In addition, following the conditions
fixed by the manufacturers, one method can be preferred rather than another one the
following cases are to be considered, whether the detection is carried with or without the
determination of the properties of the defects, the rapidity of the measurement, the costs of the
equipment and the level of qualification of the operators.
The distribution of the different NDT techniques are illustrated in figure 2.
Techniques
~ ~~~~~~'~~ ~~~~'ng
ill
~ifl$flfl
~~~'~~~~~~~'~~
,~ j Magnet,c
test'ng
f~fl Dye penetrat'on
test,ng
~ifl-Ray test'ng
~others
Fig. 2. Diuribution of the NDT techniques.
In the coming years, the distribution of these techniques will change considerably specially
the ones which will be developed will be the ones where the role of the operator during the
testing will be greatly reduced or the operator is completely absent. The NDT methnds will be
more and moreautomatic and robotized when the cho~en technology will allow it. These
N° 8 ANALYSIS OF INDUCTIVE NON DESTRUCTIVE TESTING 1483
conditions reveal the important part of the ultrasonic and inductive testing compared to the X-
ray radiography, magnetic particle and dye penetration testing where the operator manipulationand ob~ervation are predominant and where automatic control becomes more difficult.
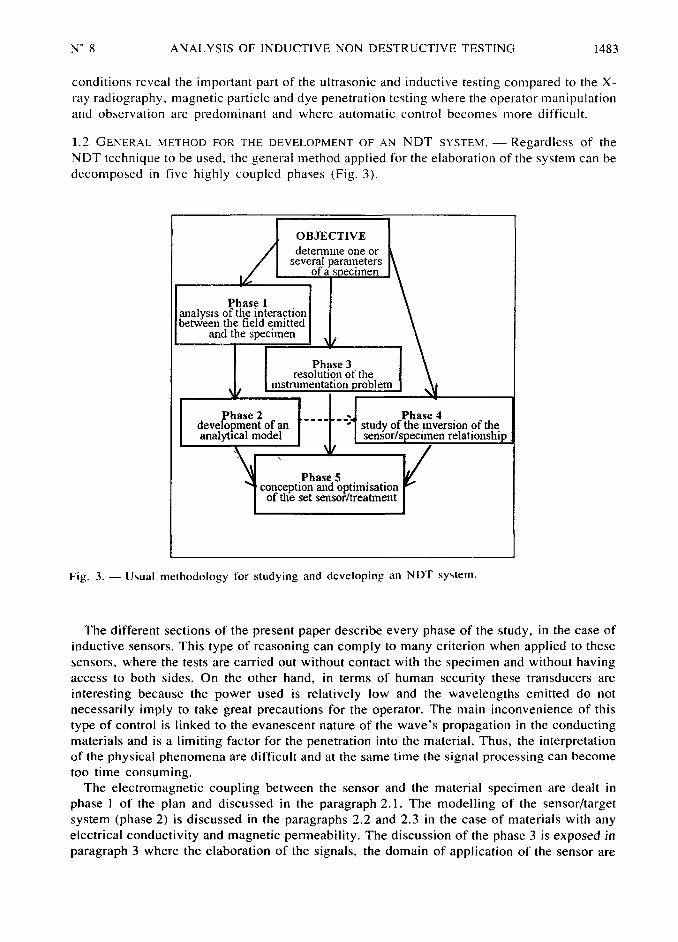
1.2 GENERAL METHOD FOR THE DEVELOPMENT OF AN NDT SYSTEM. Regardless of the
NDT technique to be used, the general method applied for the elaboration of the system can be
decomposed in five highly coupled phases (Fig. 3).
OBJECTIVE
detenmne one or
paraIneters
Phase Iof die interactionfile field qmitted
and the specimen
Phase 2 Phase 4development of an of theanalytical model
_Phase 5conception alid optimisation
offlie set senior/treatlnent
Fig. 3. U~ual methodology for studying and developing an NDT sy~tem.
The different sections of the present paper describe every phase of the study, in the case of
inductive sensors. This type of reasoning can comply to many criterion when applied to these
~ensors, where the tests are carried out without contact with the specimen and without having
access to both sides. On the other hand, in terms of human security these transducers are
interesting because the power used is relatively low and the wavelengths emitted do not
necessarily imply to take great precautions for the operator. The main inconvenience of this
type of control is linked to the evanescent nature of the wave's propagation in the conductingmaterials and is a limiting factor for the penetration into the material. Thus, the interpretation
of the physical phenomena are difficult and at the same time the signal processing can become
too time consuming.The electromagnetic coupling between the sensor and the material specimen are dealt in
phase of the plan and discussed in the paragraph 2.I. The modelling of the sensor/target
system (phase 2) is discussed in the paragraphs 2.2 and 2.3 in the case of materials with anyelectrical conductivity and magnetic permeability. The discussion of the phase 3 is exposed in
paragraph 3 where the elaboration of the signals, the domain of application of the sensor are
1484 JOURNAL DE PHYSIQUE III N° 8
studied. At last, in the paragraph 4, the different methods of signal processing for the inversion
of the signal emitted by the sensor are enumerated.
2. Analysis of the sensor/specimen interaction.
Non Destructive Testing using inductive transducers have been applied since the late 1930°s
at that period, the testing was qualitative in nature (whether or not the measured signal crosses
a fixed threshold level). In the 1940's and 50'~, important progress have been made due to
research in the aeronautical and nuclear fields. By the end of the 1950's, the testing with
inductive sensors have been effectively applied for the measurement of the electrical
conductivity, the detection of surface flaws and afterwards of volumetric flaws [6, 7].
2. THE GENERAL PRINCIPLES OF iNDucTivE SENSOR OPERATION [8, 9]. The principle of
operation of inductive sensors is based on the laws of electromagnetism and the entire
knowledge of the phenomena involved lies on the resolution of the Maxwell's equations. In
this ~ection, we will deal with a qualitative description of the physical phenomena.An inductive transducer can be simply a coil in which is applied an alternative current. This
coil is generally winded around a magnetic circuit with the aim of directing the magnetic field
in a chosen direction. The magnetic field emitted to the transducer is spread in an area which
depends essentially on the sensor geometry : the form of the magnetic circuit is therefore an
important element in the conception of inductive sensors (cups, U-shaped magnetic circuits.. ).
In the present piper, we deliberately db not dptail the bhoice of the" transducer ~tructure,
because of the relatively abundant litterature II b-13].Whenever an electrically conducting and/or magnetic material approaches the influence
zone of the sensor, the result is avariation qf the topology of field l1iles together with
electromagnetic los~es due to the penetration of the magnetic field inside the material.
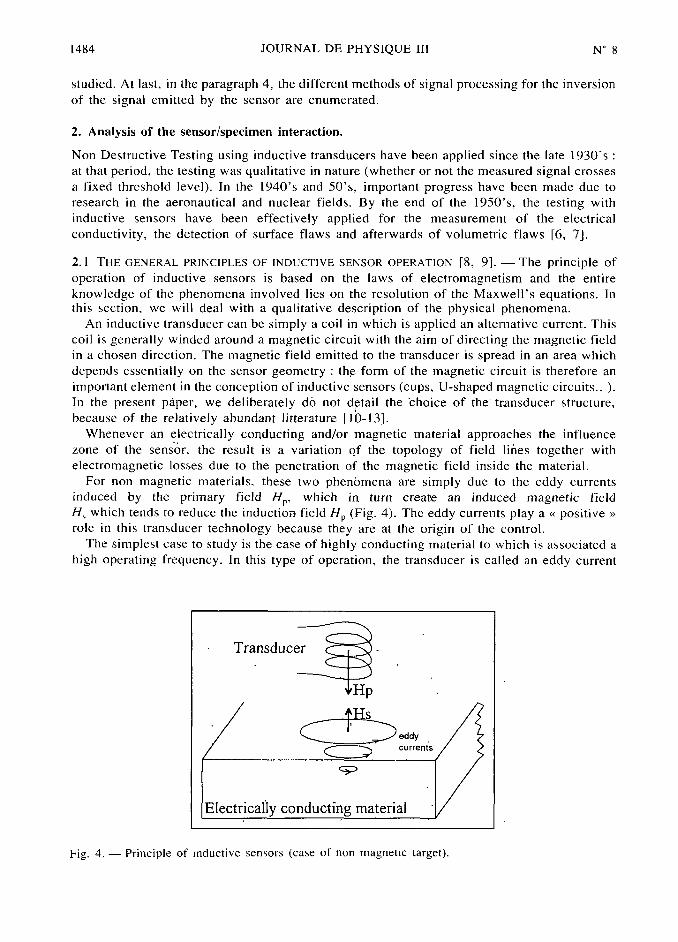
For non magnetic materials, these two phenbmena are simply due to the eddy currents
induced by the primary field H~, which in turn create an induced magnetic field
H, which tends to reduce the induction field H~ (Fig. 4). The eddy currents play a «positive
»
role in this tran~ducer technology because they are at the origin of the control.
The simplest case to study is the case of highly conducting material to which is associated a
high operating frequency. In this type of operation, the transducer is called an eddy current
ransducel
Hp
eddycurrents
CJ~
mate~ial
Fig. 4. Principle of inductive sensors (case of non magnetic target).
N° 8 ANALYSIS OF INDUCTIVE NON DESTRUCTIVE TESTING 1485
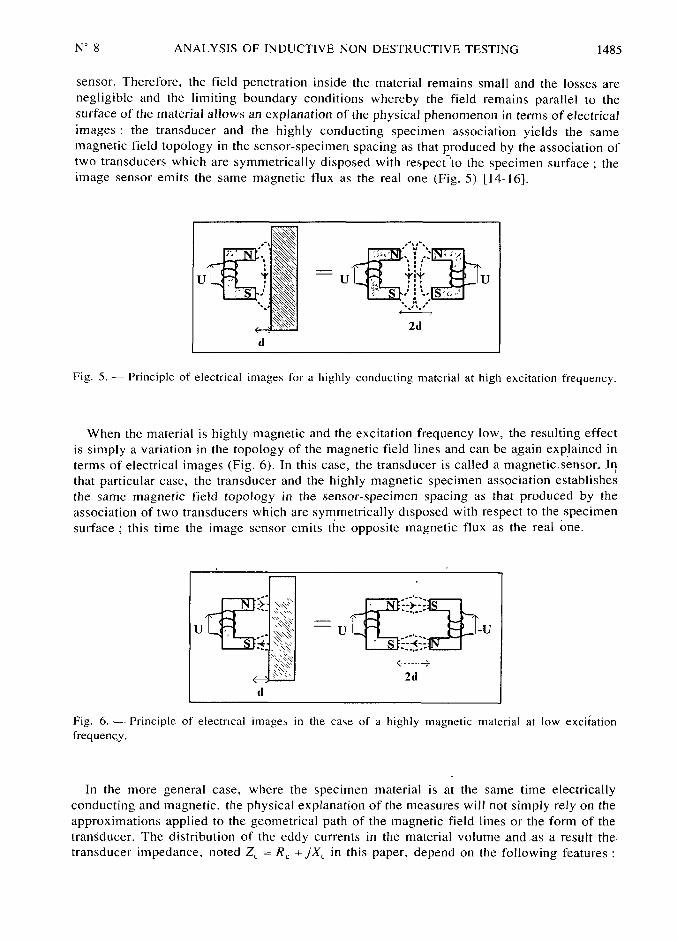
sensor. Therefore, the field penetration inside the material remains small and the losses are
negligible and the limiting boundary conditions whereby the field remains parallel to the
surface of the material allows an explanation of the physical phenomenon in terms of electrical
images the transducer and the highly conducting specimen association yields thesame
magnetic field topology in the sensor-specimen spacing as that produced by the association of
two transducers which are symmetrically disposed with re~pect~to the specimen surface the
image sensor emits the same magnetic flux as the real one (Fig. 5) [14-16].
'5'"
,," §
-SIG' '~~~,, i~'f
~
l1 '~
U U'~
~~~ ~U(~i 1~ (
,' j-'~
~~
'~",~',/
~&
2d
d
Fig. 5. Principle of electrical images for a highly conducting material at high excitation frequency.
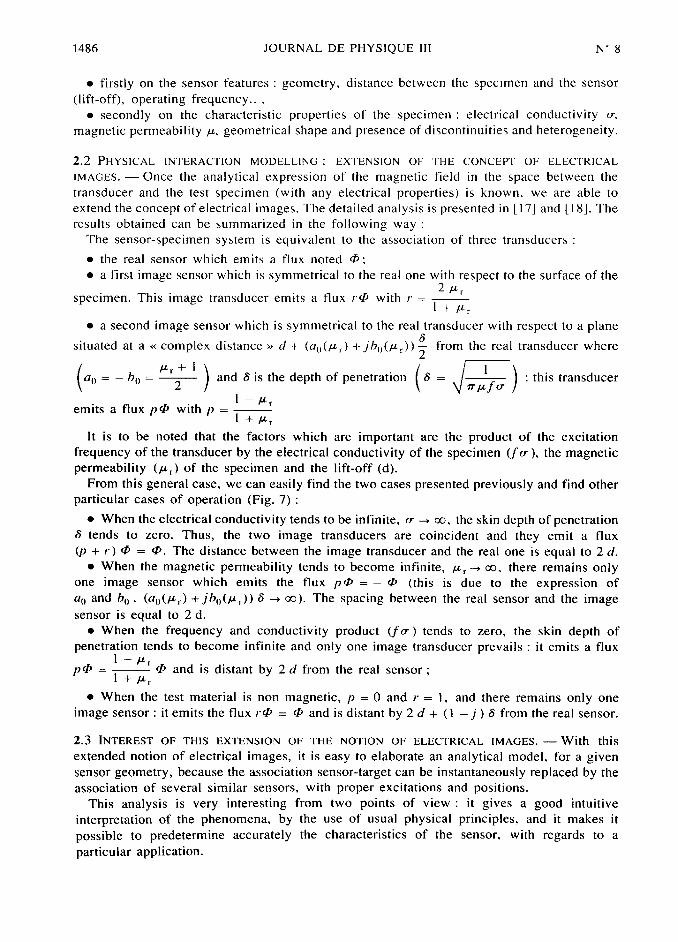
When the material is highly magnetic and the excitation frequency low, the resulting effect
is simply a variation in the topology of the magnetic field lines and can be again explained in
terms of electrical images (Fig. 6). In this case, the transducer is called a magnetic, sensor, Jqthat particular case, the transducer and the highly magnetic specimen association establishes
the same magnetic field topology in the sensor-specimen spacing as that produced by the
association of two transducers which are symmetrically disposed with respect to the specimen
surface ; this time the image sensor emits tie opposite magnetic flux as the real one.
ii((
UUi I-U~ii)i~i~
'
ig.
requenqy.
In the more general case, where the specimen material is at the same time electricallyconducting- and magnetic. the physical explanation of the measures will not simply rely on the
approximations applied to the geometrical path of the magnetic field lines or the form of the
traniducer. The distribution of the eddy currents in the material volume and,as a result the.
transducer impedance~ noted Z~=
R~ + jX~ in this paper~ depend on the following features :
1486 JOURNAL DE PHYSIQUE III N° 8
. firstly on the sensor features geometry, distance between the specimen and the sensor
(lift-of0, operating frequency..
. secondly on the characteristic properties of the specimen electrical conductivity «~
magnetic permeability p, geometrical shape and presence of discontinuities and heterogeneity.
2.2 PHYSICAL INTERACTION MODELLING EXTENSION OF THE CONCEPT OF ELECTRICAL
IMAGES. Once the analytical expression of the magnetic field in the space between the
transducer and the test specimen (with any electrical properties) is known~ we are able to
extend the concept of electrical images. The detailed analysis is pre~ented in [17] and [18]. The
results obtained can be ~ummarized in the following way
The sensor-specimen sy~tem is equivalent to the association of three transducers :
. the real sensor which emits a flux noted ~fij
. a first image sensor which is symmetrical to the real one with respect to the surface of the2 p~
specimen. This image transducer emits a flux i~fi with r =
+ pr
. a second image sensor which is symmetrical to the real transducer with respect to a plane
situated at a «complex distance
»d + (ajj(p~) + jbo(p~))
~from the real transducer where
2
(au =
ho=
~~/ and is the depth of penetration=
j: this transducer
"Pf«p~
emits a flux pa with p =
+ pr
It is to be noted that the factors which are important are the product of the excitation
frequency of the transducer by the electrical conductivity of the specimen vu ), the magneticpermeability (pr) of the specimen and the lift-off (d).
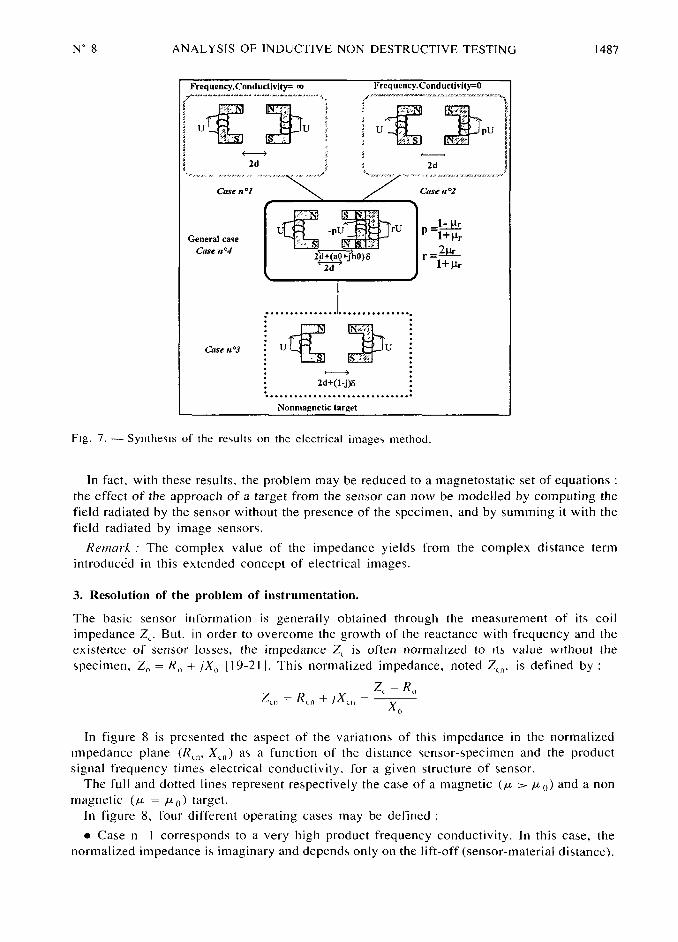
From this general case, we can easily find the two cases presented previously and find other
particular cases of operation (Fig. 7)
. When the electrical conductivity tends to be infinite~ « - oo~ the skin depth of penetrationtends to zero. Thus, the two image transducers are coincident and they emit a flux
~p + r) ~fi=
~fi. The distance between the image transducer and the real one is equal to 2 d.
. When the magnetic permeability tends to become infinite, pr - oo~ there remains only
one image sensor which emits the flux p~fi=
~fi (this is due to the expression of
au and bjj. (au(lLr) + jbjj(pr))-
oo). The spacing between the real sensor and the image
sensor is equal to 2 d.
. When the frequency and conductivity product Ma tends to zero, the skin depth of
penetration tends to become infinite and only one image transducer prevails : it emits a flux
pa=
~~~fi and is distant by 2 d from the real sensor
+ pr
. When the test material is non magnetic, p =
0 and r =I, and there remains only one
image sensor : it emits the flux i-W=
~fi and is distant by 2 d + j ) from the real sensor.
2.3 INTEREST OF THIS EXTENSION OF THE NOTION OF ELECTRICAL IMAGES. -With this
extended notion of electrical images, it is easy to elaborate an analytical model, for a given
sensor geometry, because the association sensor-target can be instantaneously replaced by the
association of several similar sensors, with proper excitations and positions.
This analysis is very interesting from two points of view it gives a good intuitive
interpretation of the phenomena, by the use of usual physical principles, and it makes it
possible to predetermine accurately the characteristics of the sensor~ with regards to a
particular application.
N° 8 ANALYSIS OF INDUCTIVE NON DESTRUCTIVE TESTING 1487
ooI'$ 5i'Q~ ",~()-l;
?
Uj
U U j, ~"ipUI-'
z 42? I
~ ~ ~-- l ~
2d 2d
',q~~...-..,:W~
Cose n °1 Cose ,1°2
t,jmGeneral case
@~~~
~~°~~ "~~
2d+ja0+jh0)6 r
"~
~ ~i+ p~
;., ,,,.......
.wpj
Cnse,1°3 U U
~ ~--
2d+jI-j~6 :S.............................I
Nonmagnetic target
Fig. 7. Synthe~is of the re~ults on the electrical image~ method.
In fact, with these results, the problem may be reduced to a magnetostatic set of equationsthe effect of the approach of a target from the sensor can now be modelled by computing the
field radiated by the sen;or without the presence of the specimen, and by summing it with the
field radiated by image sensors.
Remail The complex value of the impedance yields from the complex distance term
introducid in this extended concept of electrical images.
3. Resolution of the problem of instrumentation.
The basic sensor information is generally obtained through the measurement of its coil
impedance Z~. But. in order to overcome the growth of the reactance with frequency and the
existence of sensor losses, the impedance Z~ is often normalized to its value ~4,ithout the
~pecimen, Z~=
R~, + jX~~ [19-21[. Thi~ normalized impedance, noted Z~~, is defined by
~ ~ ~Z~ R~,
~" ~~~
~" X~,
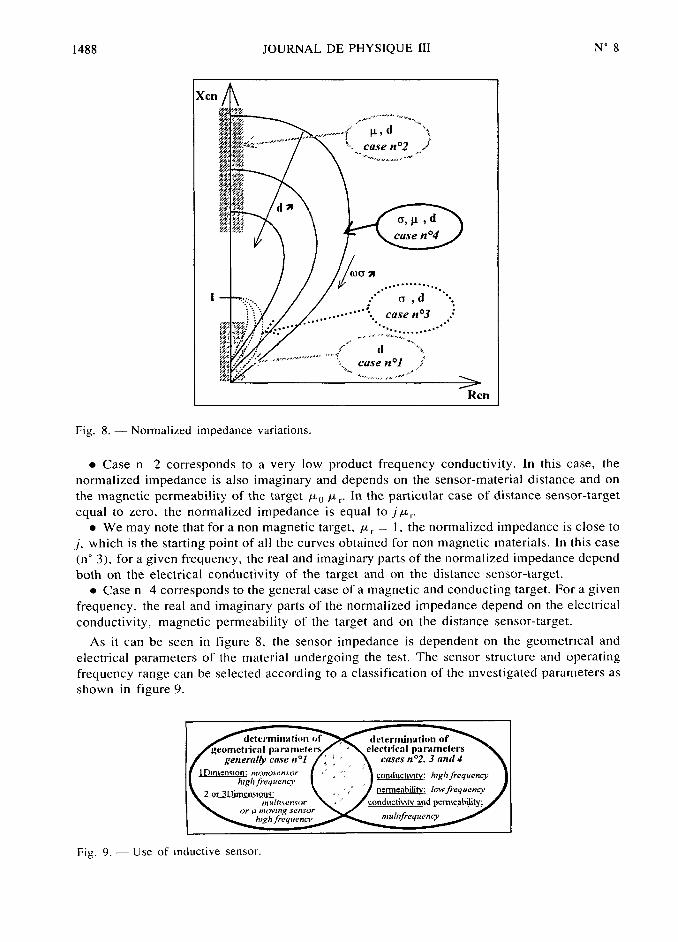
In figure 8 is presented the aspect of the variation~ of this impedance in the normalized
impedance plane (R~~, X~,~) a~ a function of the distance ~ensor-specimen and the product
signal t'requency times electrical conductivity, for a given structure of sensor.
The full and dotted lines represent re~pectively the ca~e of a magnetic (p~ p ii) and a non
magnetic (p po) target.
In figure 8, four different operating cases may be defined
. Case n corresponds to a very high product frequency conductivity. In this case, the
normalized impedance i~ imaginary and depend~ only on the lift-off (sensor-material distance).
1488 JOURNAL DE PHYSIQUE III N° 8
,~,,~--- ...-..,,
p,
d'"<,
'
CXSen°2,/
""...,,_,~ ,,,,,,
~
3, p,
d
Case n°4
~........
l :.'~
,
d °"~
Ca.Se n°3 ?
.......
..'°'
_/"' "~""':.
_~,
...,l' d h_""""~~~ l, Case n°I f
'".,..,.,,__,_
,_,.,,,~ ~
Rcn
Fig. 8. Normalized impedance variations.
. Case n 2 corresponds to a very low product frequency conductivity. In this case, the
normalized impedance is also imaginary and depends on the sensor-material distance and on
the magnetic permeability of the target pn p,, In the particular case of distance sensor-target
equal to zero, the normalized impedance is equal to j Mr.
. We may note that for a non magnetic target, pr
=
I, the normalized impedance is close to
j, which is the starting point of all the curves obtained for non magnetic materials. In this case
(n° 3), for a given frequency, the real and imaginary parts of the normalized impedance depend
both on the electrical conductivity of the target and on the distance sensor-target.
. Case n 4 corresponds to the general case of a magnetic and conducting target. For a given
frequency, the real and imaginary parts of the normalized impedance depend on the electrical
conductivity, magnetic permeability of the target and on the distance sensor-target.
As it can be seen in figure 8, the sensor impedance is dependent on the geometrical and
electrical parameters of the material undergoing the te~t. The sensor structure and operating
frequency range can be selected according to a classification of the investigated parameters as
shown in figure 9.
detct.minaliiii <Ietemliliatiuti ofelecttical piitnmelet.s
generfilfv cfi.<e n°1~
case-v n°2, 3 art(14
lD1nicnvon:,>1,Jn~lsan>or,
.j ~~~d,,~~~ h,ghf~~q,,~~~yhigh frequency
~' - lvw fiaquency,'p
or u moving.lens<Jrhigh freqi<encv muhfireqi<,>nay
Fig. 9. Use of inductive sensor.
N° 8 ANALYSIS OF INDUCTIVE NON DESTRUCTIVE TESTING 1489
The choice of the sensor operation is generally limited to the two simplest cases which
respectively represent the working range of case n (highly conducting medium and highfrequency operation) and case n 2 (test material with high magnetic properties and low test
frequency). However, current NDT transducers are meant to operate in the cases numbered 3
and 4 and whereby the interesting NDT information is extracted in the loci of the probenormalized impedance point. These methods are rarely quantitative and any relevant
estimation and separation of the tested material characteristics are too often a complicatedproblem requiring an analytical model.
In the following section, we shall detail some inversion principles which can be readilyapplied.
4. Inverse problems.
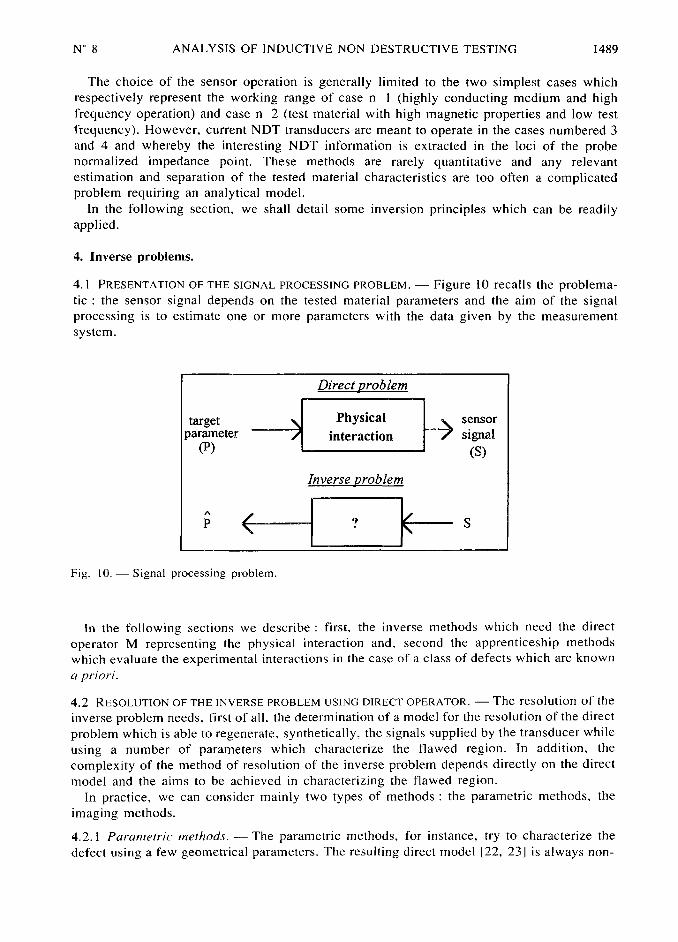
4. PRESENTATION OF THE SIGNAL PROCESSING PROBLEM. Figure 10 recalls the problema-tic the sensor signal depends on the tested material parameters and the aim of the signalprocessing is to estimate one or more parameters with the data given by the measurement
system,
target PhYSiC~'
nteraction
signal
~P) (s)
~
P ?
In the following sections we describe first, the inverse methods which need the direct
operator M representing the physical interaction and, second the apprenticeship methods
which evaluate the experimental interactions in the case of a class of defects which are known
a priori.
4.2 RESOLUTION OF THE INVERSE PROBLEM USING DIRECT OPERATOR. The resolution of the
inverse problem needs, first of all, the determination of a model for the resolution of the direct
problem which is able to regenerate, synthetically, the signals supplied by the transducer while
using a number of parameters which characterize the flawed region. In addition, the
complexity of the method of resolution of the inverse problem depends directly on the direct
model and the aims to be achieved in characterizing the flawed region.
In practice, we can consider mainly two types of methods the parametric methods, the
imaging methods.
4.2.I Paianietric methods. The parametric methods, for instance, try to characterize the
defect using a few geometrical parameters. The resulting direct model [22, 23] is always non-
1490 JOURNAL DE PHYSIQUE III N° 8
linear and a least-squares estimation algorithm is usually sufficient because the number of data
observed is higher than the number of parameters to be estimated. The use of ~uch methods are
limited in practice because the results become reasonably unacceptable when the geometricalform of the defect does not correspond to the form chosen a priori. Moreover, it is often
necessary to determine the geometrical form of the defect.
4.2.2 Iniaging metfiods. Also, eddy current imaging methods are applied which consist of
dividing the defective region using a regular mesh and analysing the NDT problem in the same
was as for the tomographic reconstruction problem for heterogeneous media.
4.2?.I Qualitative methods. In the qualitative imaging methods the flaw's contours are
reconstructed by estimating the den~ity of the induced currents in all the regular mesh points.
The ob~erved data are explicitly related to the eddy current density by a Fredholm integral
equation of the fir~t kind whose kernel is invariant by translation along the measuring axis. In
the case of planar geometry and bj, the use of some simplifying hypothesis [24-26] the
tomographic reconstruction techniques can allow to restitute the contours of the defects from
the image of the induced currents in the inspected conductive material.
4.2.2.2 Quantitative methods. The quantitative imaging methods reconstruct the spatial
distribution of a significant material feature such as the conductivity from the observed data.
The direct problem model needs the resolution of the Fredholm integral equation of the second
kind and the observed data do not appear explicitly relative to parameters which are to be
estimated. The Born approximation is therefore necessary in order to linearize the direct
problem, in which ca~e the electric field in the flawed region is very close to the one in the
same region which is considered to be homogeneous. The inverse problem is then identical to
the inversion of the Fredholm integral equation of the first kind whose kernel is invariant along
the measuring axis.
The tomographic recon~truction of the conductive media can be then considered like a
Fourier synthesis problem which can be treated by using the Fourier domain or directly in the
spatial domain. In the second approach, the problem needs the inversion of a system of linear
equations which result from discreti~ing processes in the spatial domain.
The ill-posed character intrinsic to the Fredholm integral equation of the first kind and the
inherent noi~e that corrupts the measured data impose to regularize the solution. The principleof regularization consists of omitting to solve for the exact solution and to define a cla;s of
admi~sive solution~ following an a priori information such as to obtain an acceptable physicalsolution. The numerical resolution of the inverse problem becomes the minimization of a
mixed criterion containing a term which imposes a good adequation with data and a
regularising term which impose the solution to satisfy the a priori information. Two
regularizing parameter~ are chosen to account for the relative importance of these two terms.
Several regularizing techniques which are deterministic or stochastic have to be applied in
solving ~atisfactorily the eddy current NDT problem [27, ?8].
We note at last that certain methods which are treated in a bayesian approach, have allowed
to include a more specific apiioii information. Therefore, with this approach more
satisfactory solution~ have been obtained in the ca~e of a cylindrical geometry having
axisymmetrical flaws [~9-31].
4.3 RESOLUTIONS OF THE INVERSE PROBLEM WITHOUT THE KNOWLEDGE OF THE DIRECT
OPERATOR. At last, whenever no models are available, methods of adaptative learning are
derived which consist of establishing a set of relationship~ which in turn evaluate the
investigated parameters from the sensor signals obtained experimentally in the calibration
phase. Linearization principles are then commonly applied [32] and the relationship~ existing
between the parameter and the useful signal are extracted by mean~ of a globally memorised
N° 8 ANALYSIS OF INDUCTIVE NON DESTRUCTIVE TESTING 1491
algorithm of
minimisation
iii isi
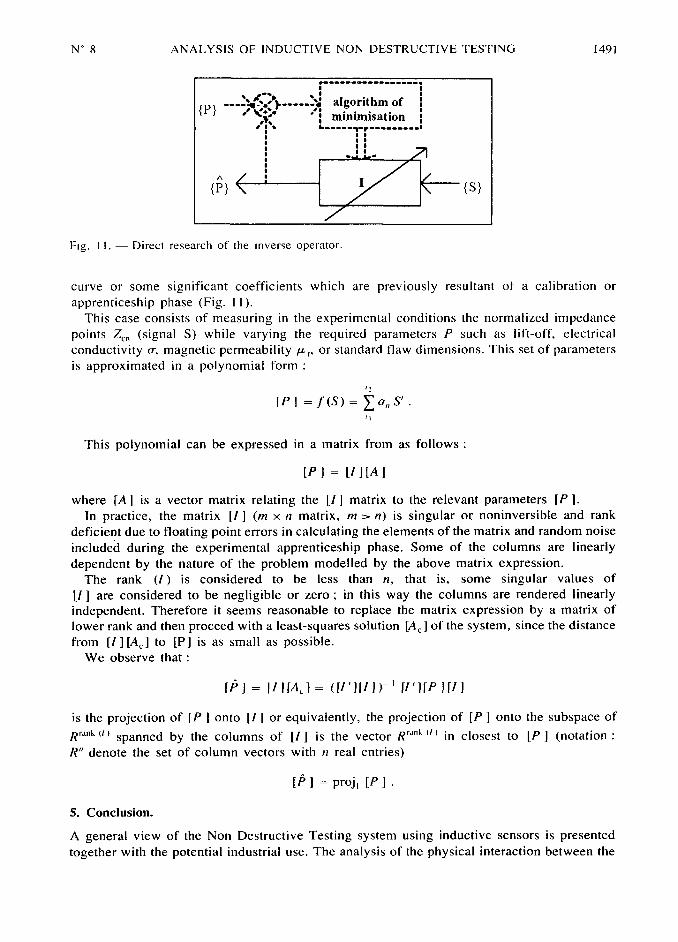
Fig. I. Direct research of the inver~e operator.
curve or some significant coefficients which are previously resultant of a calibration or
apprenticeship phase (Fig. I).
This case consists of measuring in the experimental conditions the normalized impedance
points Z~~ (signal S) while varying the required parameters P such as lift-off, electrical
conductivity «, magnetic permeability p~,
or standard flaw dimensions. This set of parameters
is approximated in a polynomial form
,j
IF=
f'(S )= ajj S~~
ii
This polynomial can be expressed in a matrix from as follows :
iPi=
iiiiAi
where [A is a vector matrix relating the ill matrix to the relevant parameters [P ].
In practice, the matrix iii (m xii matrix, m ~n) is singular or noninversible and rank
deficient due to floating point errors in calculating the elements of the matrix and random noise
included during the experimental apprenticeship phase. Some of the columns are linearly
dependent by the nature of the problem modelled by the above matrix expression.
The rank (I) is considered to be less than n, that is, some singular values of
[I are considered to be negligible or zero ; in this way the columns are rendered linearly
independent. Therefore it seems reasonable to replace the matrix expression by a matrix of
lower rank and then proceed with a least-squares solution [A~ of the system, since the distance
from [I [A;] to [P] is as small as possible.
We observe that
ifii=
iiiiA~i=
(v'iiii)-i ii'iiPiiii
is the projection of [P onto [I or equivalently, the projection of [P onto the subspace of
R"~~Q' spanned by the columns of iii is the vector R~~~~ ~" in closest to [P (notation
R" denote the set of column vectors with ii real entries)
i>=
projj iP1
5. Conclusion.
A general view of the Non Destructive Testing system using inductive sensors is presented
together with the potential industrial use. The analysis of the physical interaction between the
1492 JOURNAL DE PHYSIQUE III N° 8
sensor and the tested material is exhaustive in the sense that all the relevant material propertieshave been included. This presentation has allowed the use of the concept of electrical images(which is not currently applied) and the establishing of different ranges of applications of such
transducers as a function of the working frequency, the electrical conductivity and the
magnetic permeability of the specimen. The final pha~e in the conception of the inductive NDT
system is the signal processing which reveals the desired parameters in this connection, we
have reviewed the general methods used.
References
Ii«
Traitement de l'information et contr01es non destructifs»~
Proceedings of the«
Joumdes d'dtude
jCOFREND et SEE)»
(September 1992) Gif-sur-Yvette, France.
[?]«
Les contrbles non destructifs gdn6ralitd », Cahier de formation du CETIM~ 2~ Edition (I99I
100 pages.
[3] Colomer J., Essai de synthbse des mdthodes de contr0Ie non destructif, Rei. Piatiqiie Contible
/ndii.itiie/ Quahtd, n I61 bis (March 19901 23-27.
[4] Forest G., Choix d'une m6thoJe de contr01e (ddition Afnor~ 1992).
jsj Peyrucat J. F., Le contr0Ie non de~tructif, Me.<vie.I (February 1992) 62-65.
[6] Shaffer R. D., Hi~torical development of eddy current testing in aircraft maintenance~ Matei.
Ei>a/uatiofi (January 1992) 76.
[7] Hagemaier D. J., Applications of eddy current testing to airframes, in Nondestructive testinghandbook, 2nd Ed.~ vol. 4, Electromagnetic te~ting, Paul Mclntire and Michael L. Me~ter
Eds., American society for nondestructive te~ting, Inc., Columbus, OH (1986) pp. 369-420.
[8] Libby H. L., Introduction to electromagnetic nondestructive test methods (Robert E. KriegerPublishing Company, reprint 19791.
[91 Mcmaster R., Udpa S.,«
Ba~ic concepts and theory of eddy current testing»,
in Nondestructive
testing handbook, 2nd Ed., vol. 4, Electromagnetic testing, Paul Mclntire and Michael L.
Mester, Ed~., American society for nondestructive testing, Inc., Columbus, OH (1986 j pp. 25-
5I.
[J0] Ida N., «Eddy current transducer »~ in Nondestructive testing handbook, 2nd Ed., vol. 4,
Electromagnetic testing, Paul McIntire and Michael L. Mester Ed~., American society for
nondestructive testing, Inc., Columbu~, OH (1986) pp. 5~-88.
Ii Vernon S. N., Eddy current probe design for anisotropic composites, Matei. Evaluation (JanuaryJ992) 36-41.
[12] Placko D., Dufour I., A focused field eddy current sensor for iondestructive testing, IEEE TiaJ1s.
MagJ1. 29 jI993) 3J92-3194.
[J3] Dufour I., Placko D., Geoffroy M., Active ~hielding an original method to improve eddy current
sensor performances, submitted to the.I Phi-s- D Applied Physics (November 1993j.
[14] Gardiol F., Electromagndtisme, Traitd d'61ectronique et d'dlectrotechnique (Edition Dunod~ 1987)
pp. 72-73.
[J 5] Lorrain P., Corson D. R., Champs et ondes dlectromagndtiques (Edition A. Colin) pp. 165-J78.
6] PJacko D., Contribution h la conception de capteurs mductifs pour la robotique industrielJe, Rapport
de ~ynthbse pour l'habiJitation h diriger de~ recherches en sciences, Universitd de Paris XI,
Orsay, France j22 mar J990).
7] Dufour I.. Contribution h l'Evolution des procddds de contrbJe non destructif par capteurs tnductifs
application au cas des matdriaux composites carbone~ Thbse de docteur en sciences de
l~Universitd de Paris XI, Orsay, France (28 avriJ J993).
[J8j Dufour 1.~ Placko D., Generalisation of the electrical image theory through an analytical study of
inductive sensors, submitted to IEEE Tt.aJ1i Ma,qii. (July 19931.
II 9] F0rster F.,«
Analysis of encircling coil tests of wire, rods and bars », in Nondestructive testing
handbook, 2nd Ed., vol. 4, Electromagnetic testing, Paul Mclntire and Michael L. Mester
Eds., American society for nondestructive testing, Inc., CoJumbu~, OH (1986) pp. II1-145.
N° 8 ANALYSIS OF INDUCTIVE NON DESTRUCTIVE TESTING 1493
[20] Valleau A. R., Eddy current nondestructive testing of graphite compo~ite materials, Mater.
Evaluation (February 1990) 230-~39.
(21] Vernon S. N., A single sided eddy current method to measure electrical resistivity, Mater
EiahiatioJ1(November 1988) I58I-1587.
[22] Auld B. A., Muennman F. G., Riaziat M.. Quantitative modelling of flaw responses in eddy current
testing, Nondestiucnie Testifi~q n 7 (1984) 37-76.
[23] Ratnajeevan S., Hoole H., Inverse problem methodology and finite elements in the identification of
cracks, sources, materials, and their geometry in inaccessible Iocations~ IEEE TiaJ1s. Ma,qn. 27
(1991) 3433-3443.
[24] Zorgati R., Imagerie par courants de Foucault. Application au contr0Ie non destructif, Thbse de
l'Universitd de Pari~ VII, Paris, France (1990).
[25] Zorgati R., Duchene B., Lesselier D., Pons F., Eddy current testing of anomalies in conductive
materials, Part qualitative imaging i>ia diffraction tomography techniques, IEEE Tiafi,I
Ma,qfi. 27 ii 991) 4416-4437.
[26] Nikolova M., Tomographie des diffraction~ par courants de Foucault pour Ie contr0Ie non
destructif, Rapport L2S, Gif-sur-Yvette I99I ).
[27] Sabbagh H. A., Radecki D. J., Barkeshli S., Shamee B., Treece J. C., Jenkins S. A., Inversion of
eddy current data and recon~truction of three dimensional flaws, IEEE Tiafis Ma~gfi. 26 ii 990)
626-629.
[~8] Zorgati R.~ Duchene B., Lesselier D., Pons F., Eddy current testing of anomalies in conductive
materials, Part 2 quantitative imaging i<ia deterministic and stochastic inversion techniques,IEEE Tian.I Ma,qn. 28 j1992) 1850-1862.
[29 Premel D., Djafari A. M., David B.,«
Tomographie par courants de Foucault », Proc. Actes du
premier congrks COFREND sur (es essais non demructifs, Nice~ France (1990) pp. 415-419.
[30] Premel D., Djafan A. M., David B.,«
Imagerie des milieux conducteurs par courants de
Foucault », Actes du tretzikme colloque GRETSI, Juan~ [es Pins, France II 99 ii pp. 105-108.
[3 ii Premel,«
Imagerie tomographique de; milieux conducteurs par courants de Foucault : application
au contr0Ie non destructif des tubes m6taIliques », Thb~e de docteur en science~ de l'Universitd
de Paris XI, Orsay. France (I6ddcembre 1992).
[3~] Aknin P., Monteil F., Placko D., Moddli~ation d'une structure multicapteur h courants de Foucault
destinde h I~analy~e de profil~ Rei<. Phvi. App/ 24 (1989) 227-242.
Copyright © 2022 FDOKUMEN