Semi-Destructive and Non-Destructive Tests of Timber ... - MDPI
22
materials Article Semi-Destructive and Non-Destructive Tests of Timber Structure of Various Moisture Contents Justyna Jaskowska-Lema ´ nska 1, * and El ˙ zbieta Przesmycka 2 Citation: Jaskowska-Lema ´ nska, J.; Przesmycka, E. Semi-Destructive and Non-Destructive Tests of Timber Structure of Various Moisture Contents. Materials 2021, 14, 96. https://doi.org/10.3390/ma14010096 Received: 25 November 2020 Accepted: 23 December 2020 Published: 28 December 2020 Publisher’s Note: MDPI stays neu- tral with regard to jurisdictional claims in published maps and institutional affiliations. Copyright: © 2020 by the authors. Li- censee MDPI, Basel, Switzerland. This article is an open access article distributed under the terms and conditions of the Creative Commons Attribution (CC BY) license (https://creativecommons.org/ licenses/by/4.0/). 1 Department of Geomechanics, Civil Engineering and Geotechnics, AGH University of Science and Technology, al. Mickiewicza 30, 30-059 Kraków, Poland 2 Faculty of Architecture and Fine Arts, Andrzej Frycz, Modrzewski Krakow University, ul. Herlinga-Grudzi ´ nskiego 1, 30-705 Kraków, Poland; [email protected] * Correspondence: [email protected] Abstract: The condition of heritage and historic timber constructions depends on how they are exploited. Numerous environmental factors degrade the physical and mechanical properties of timber and hence, affect the load-bearing capacity of constructions. As a result, frequent evaluations of their technical condition become necessary. Currently, modern technologies allow for extensive diagnostics of timber constructions using non-destructive and semi-destructive methods; yet, in contrast to classical laboratory tests, there is insufficient knowledge of the impact of individual factors on the results of such studies. This article presents an assessment of the influence of the moisture content of timber elements on the results of ultrasonic stress wave, sclerometric, and resistance drilling tests. Additionally, computed tomography scans were performed on selected samples to demonstrate the destruction mechanism occurring during the semi-destructive tests. The research involved three types of wood: pine, spruce, and fir of different moisture contents. The results reveal a strong relation between the moisture of timber and all the tests conducted in terms of both hygroscopic and capillary moisture. Keywords: timber structures; non-destructive tests; semi-destructive tests; X-ray computed tomogra- phy; wood moisture; natural hazards 1. Introduction Wood, as a construction material, exhibits high durability in favourable conditions, but, under typical conditions of building operation, exposed to a number of disadvan- tageous factors, it deteriorates faster than other building materials. Such properties of timber constructions require an assessment of their technical condition. The problem of load-bearing capacity assessment of timber construction members occurs on occasions of renovation or modernization of historic and heritage objects [1–4]. Historical wooden structures concern all types of buildings or structures entirely or partly wooden, which have cultural significance. Their preservation and protection are a necessary and unquestionable action. In Poland, more than 10% of historic objects are wooden and were built in the timber framing method; in addition, most of the remaining buildings have horizontal building envelopes with timber construction. However, due to challenges related to the proper assessment of technical condition, on many occasions, timber objects or elements, both in Poland and worldwide, are being replaced completely. The consequence of this is a gradual disappearance of historical timber structures and, consequently, impoverishment of cultural heritage [5]. In recent years, several documents have been created recommending particular types of research aimed at estimating the parameters of wood in structures [6,7]; unfortunately, the interpretations of the majority of them do not take into account the factors to which wooden objects may be exposed. The most dangerous threat to the durability of timber structures is humidity. Both objects and structural elements are exposed to weather conditions and other accidental Materials 2021, 14, 96. https://doi.org/10.3390/ma14010096 https://www.mdpi.com/journal/materials
-
Upload
khangminh22 -
Category
Documents
-
view
1 -
download
0
Transcript of Semi-Destructive and Non-Destructive Tests of Timber ... - MDPI

materials
Article
Semi-Destructive and Non-Destructive Tests of TimberStructure of Various Moisture Contents
Justyna Jaskowska-Lemanska 1,* and Elzbieta Przesmycka 2
�����������������
Citation: Jaskowska-Lemanska, J.;
Przesmycka, E. Semi-Destructive and
Non-Destructive Tests of Timber
Structure of Various Moisture
Contents. Materials 2021, 14, 96.
https://doi.org/10.3390/ma14010096
Received: 25 November 2020
Accepted: 23 December 2020
Published: 28 December 2020
Publisher’s Note: MDPI stays neu-
tral with regard to jurisdictional claims
in published maps and institutional
affiliations.
Copyright: © 2020 by the authors. Li-
censee MDPI, Basel, Switzerland. This
article is an open access article distributed
under the terms and conditions of the
Creative Commons Attribution (CC BY)
license (https://creativecommons.org/
licenses/by/4.0/).
1 Department of Geomechanics, Civil Engineering and Geotechnics, AGH University of Scienceand Technology, al. Mickiewicza 30, 30-059 Kraków, Poland
2 Faculty of Architecture and Fine Arts, Andrzej Frycz, Modrzewski Krakow University,ul. Herlinga-Grudzinskiego 1, 30-705 Kraków, Poland; [email protected]
* Correspondence: [email protected]
Abstract: The condition of heritage and historic timber constructions depends on how they areexploited. Numerous environmental factors degrade the physical and mechanical properties oftimber and hence, affect the load-bearing capacity of constructions. As a result, frequent evaluationsof their technical condition become necessary. Currently, modern technologies allow for extensivediagnostics of timber constructions using non-destructive and semi-destructive methods; yet, incontrast to classical laboratory tests, there is insufficient knowledge of the impact of individual factorson the results of such studies. This article presents an assessment of the influence of the moisturecontent of timber elements on the results of ultrasonic stress wave, sclerometric, and resistancedrilling tests. Additionally, computed tomography scans were performed on selected samples todemonstrate the destruction mechanism occurring during the semi-destructive tests. The researchinvolved three types of wood: pine, spruce, and fir of different moisture contents. The resultsreveal a strong relation between the moisture of timber and all the tests conducted in terms of bothhygroscopic and capillary moisture.
Keywords: timber structures; non-destructive tests; semi-destructive tests; X-ray computed tomogra-phy; wood moisture; natural hazards
1. Introduction
Wood, as a construction material, exhibits high durability in favourable conditions,but, under typical conditions of building operation, exposed to a number of disadvan-tageous factors, it deteriorates faster than other building materials. Such properties oftimber constructions require an assessment of their technical condition. The problem ofload-bearing capacity assessment of timber construction members occurs on occasions ofrenovation or modernization of historic and heritage objects [1–4].
Historical wooden structures concern all types of buildings or structures entirely orpartly wooden, which have cultural significance. Their preservation and protection area necessary and unquestionable action. In Poland, more than 10% of historic objects arewooden and were built in the timber framing method; in addition, most of the remainingbuildings have horizontal building envelopes with timber construction. However, dueto challenges related to the proper assessment of technical condition, on many occasions,timber objects or elements, both in Poland and worldwide, are being replaced completely.The consequence of this is a gradual disappearance of historical timber structures and,consequently, impoverishment of cultural heritage [5]. In recent years, several documentshave been created recommending particular types of research aimed at estimating theparameters of wood in structures [6,7]; unfortunately, the interpretations of the majority ofthem do not take into account the factors to which wooden objects may be exposed.
The most dangerous threat to the durability of timber structures is humidity. Bothobjects and structural elements are exposed to weather conditions and other accidental
Materials 2021, 14, 96. https://doi.org/10.3390/ma14010096 https://www.mdpi.com/journal/materials

Materials 2021, 14, 96 2 of 22
factors, which significantly affect the results of their testing. Knowledge on the influence ofmoisture on the results of the examination of wooden structures may enable the mainte-nance of more than their quantity. Figure 1 shows examples of historical timber elementsand objects that were exposed to water at different intensity levels.
Figure 1. (a) The beam ceiling of the Gorzanów Palace—high humidity of the elements resulted from long-term leakage inthe roofing; (b) The church in Haczów—repeatedly flooded by floods.
Tests of construction elements can be divided, as far as their impact on the structure isconcerned, into destructive (DT), non-destructive (NDT), and semi-destructive tests (SDT).Destructive tests require taking numerous samples from the construction, which is usuallyunacceptable in the case of historic and heritage buildings. Thus, norms and standardsrecommend, first of all, the use of NDT and SDT methods [6,8,9].
Among non-destructive methods, which do not leave any permanent traces, thefollowing subgroups can be found: visual strength-grading [10], weighting, and methodsbased on the propagation of electromagnetic waves including ultrasound methods [11,12],as well as advanced X-ray and gamma-ray tests [13–15]. The second subgroup of tests ischaracterized by a low impact on the object. During such studies, only small holes aremade in the specimen, hence the name semi-destructive methods. In this subgroup, a fewclasses of methods are distinguished depending on the degree of impact:
• Penetration methods, leaving traces in the form of holes with a diameter of about3 mm (hardness tests, resistance drilling tests) [16,17];
• Pull-off methods, resulting in irregular breaches having a diameter of about 5 mm [18];• Methods of small sample collection consisting of cutting out cores or triangular
prism-shaped samples, leaving holes or linear dents with a cross-section of up to10 mm [19,20].
Most commonly, an assessment of the timber structure condition involves selectedNDT and SDT methods combined as demonstrated in numerous articles [8,16,21,22].
Non-destructive and semi-destructive tests are currently being strongly developedand are finding application in various branches of industry [23]. When used to test timberconstructions, they are a valuable source of information about the structure’s condition.It is important, though, to bear in mind that the results of these tests are affected by suchfactors as: wood species, wood defects, moisture content, temperature, microbiologicalfactors, and wood age [24]. The influence of particular factors on selected tests and woodspecies are presented in the articles [25–30]. Wood moisture is one of the most significantfactors determining its physical and mechanical properties. In turn, moisture poses one ofthe main threats for heritage constructions, including timber ones [31].
Moisture content (MC) has an influence on the mass of timber, its dimensions andvolume, strength, and elasticity properties, and also conductivity and resistance. The mois-ture of timber is determined by the temperature and humidity of the surrounding air. Thesubstantial influence of moisture on all the physical and mechanical parameters of wood is

Materials 2021, 14, 96 3 of 22
related to its large internal area constituting groundwork for hygroscopic phenomena [32].In the wood moisture range from 0% to about 8%, water vapour bonds via monomolecularadsorption; up to a 15% moisture level of wood, polymolecular adsorption phenomenatake place; and up to about 22–34%, there are capillary condensation phenomena withinsub-microscopic capillaries. This level corresponds to the upper limit of the inner cell wallabsorbency, i.e., the fibre saturation point (FSP). At this point, the mechanical propertiesof wood reach a minimum, whereas swelling becomes maximal [33]. The exact limits ofsubsequent hygroscopic phenomena are dependent on the wood species, its structure anddensity, and hence its specific area. In the moisture range between the fibre saturation pointand the absolute-dry state, the strength properties of wood increase up to a certain leveland then decrease again, except for the compressive strength which reaches a maximumin the state of absolute dryness. Wood exhibits the mechanical properties of the highestvalues at moisture of about 810% (with the exception of the compressive strength) [34]. Aseries of studies on the influence of moisture on the physical and mechanical propertieswere summarized by Gerhards [35]. Currently, the reference timber moisture level for thetest results in the case of physical and mechanical properties is assumed to be 12% [36].
This work focuses on issues related to the influence of the moisture content of woodon the results of sclerometric and resistance drilling tests (SDT) for a selection of species ofEuropean softwood. As far as building studies are concerned, the most interesting moistureranges are those up to the fibre saturation level. There are, however, cases where it will benecessary to conduct tests at much higher moisture content levels, even up to completefibre saturation with water, i.e., members permanently immersed in water, such as woodenpiles, palisades, or bridge elements [37,38].
The main aim of the research was to demonstrate the range of influence of moistureon the results of selected NDT and SDT tests, which can be used during in situ tests inbuildings. In particular, these relationships are important for the examination of historicaland heritage structures. Those structures are usually exposed to increased moisture contentand simultaneously require the determination of the actual load-bearing capacity of eachstructural element. Understanding such relationships provides the opportunity to fullyutilize the potential of using NDT and SDT in estimating both physical and mechanicalproperties of wood in existing structures. Thus, it shall enable the performance of structuralanalysis and the design of any necessary repairs or reinforcements.
2. Materials and Methods
Laboratory experiments were carried out in order to assess the influence of the mois-ture content of timber elements on the results of non-destructive and semi-destructive tests.The tests were conducted for three species of wood most commonly used in constructionin Central Europe: pine, spruce, and fir. Specimens with a cross-section of 175 × 175 mmand a length of 2000 mm were used for extraction of six cuboidal samples with dimensionsof 175 × 175 × 320 mm. The samples are a simulation of structural elements, and it wasdeliberately decided to conduct experiments on a present-day material in order to eliminatethe influence of other factors, such as stress condition and age, on the test results. Table 1presents basic information about the samples.

Materials 2021, 14, 96 4 of 22
Table 1. Properties of test samples.
Name Botanical Name Nominal Sample Size [mm] Average Density for0% Moisture [kg/m3] MC * Reached [%]
Pine Pinus sylvestris 175 × 175 × 320 409.2 0, 4, 7, 10, 12, 14, 18, 25,58, 85, 90, 95
Spruce Picea abies 175 × 175 × 320 386.7 0, 4, 7, 10, 12, 15, 21, 26,53, 78, 92, 94
Fir Abies alba 175 × 175 × 320 367.8 0, 4, 7, 10, 12, 14, 19, 28,35, 65, 76, 96, 102
* The table lists approximate values. The moisture content (MC) values were used in the analysis with an accuracy of 1/100%.
The samples were divided into two groups: the group in which the moisture contentwas increased and the group in which the moisture content was decreased, starting fromthe air-dry state. Each group comprised three samples of each species. Individual sampleswere tested a minimum of three times at different moisture contents. The first group, aftera reference test in the air-dry state, was seasoned in climatic chambers at a temperatureof 25 ◦C and air humidity of 95% until the required moisture content level was reached(Figure 2a). Having exceeded the fibre saturation point, a part of each sample was com-pletely immersed in water with an average temperature of 25 ◦C and was seasoned in thisway for the next twelve months. The second group of samples, after the reference test in theair-dry state, underwent a process of gradual drying at a temperature of 45 ◦C, and next at atemperature of 65 ◦C in laboratory dryers without forced air convection to an absolute-drystate at a temperature of 100 ◦C. All the tests on the samples in this group were carried outafter cooling in a desiccator to room temperature and after control mass measurements.
Figure 2. Seasoning of samples: (a) moisture-rise chamber; (b) wood-drying chamber.
The assessment procedure involved a macroscopic evaluation (identifying placeswith defects in order to eliminate their influence on the test results), ultrasonic wavepropagation tests, sclerometric tests, and resistance drilling tests. Additionally, X-raycomputed tomography imaging was performed to visualize the damage structure. All thetests were performed perpendicularly to fibres. During the works, moisture measurementsof the elements were conducted using the capacitive method (initial determination if themoisture level reached was close to the desirable one), and after the test cycle, a moisturetest was carried out by a means of the oven dry method [36,39]. Next, the density of thesamples was found in the absolute-dry state ($0), and after slitting in the absolute-drystate within every sclerometric test area ($0,s) from a cuboidal sample with dimensionsof 50 × 50 × 25 mm. The test procedure is illustrated schematically in Figure 3. Figure 4

Materials 2021, 14, 96 5 of 22
shows an example of a sample with the test areas and points marked and a schematic viewof the test area distribution.
Figure 3. Schematic diagram of research procedure.
Ultrasonic tests were carried out using a PunditLab set produced by Proceq (Schw-erzenbach, Switzerland) with transducers operating at a frequency of 54 kHz with anautomatic transmitter voltage. Before each use, the device was calibrated on the dedicatedcalibration rod with an ultrasonic wave passage time of 25.4 µs. The measurements weretaken using a coupling agent in the form of a chemically passive polyacrylic gel and bothtransducers were coated with a thin layer of the gel before each measurement. For eachsample, 4 test cross-sections were selected in places found macroscopically to be defect-free(two areas on each side). For each test cross-section of a sample, 3 measurements weretaken and the average values were used as the results of the ultrasonic wave propagationvelocity between the transducers, i.e., the opposite sides of the sample. The apparatus usedin the measurements and an example sample undergoing the test are presented in Figure 5.

Materials 2021, 14, 96 6 of 22
Figure 4. (a) Example of a sample; (b) Schematic view of test field distribution; (c) Illustration of locations of samples fordetermination of area density in the absolute-dry state (I) and tomography imaging studies (II).
Figure 5. Apparatus for non-destructive test (NDT) studies: (a) PunditLab Proceq with accessories; (b) Sampleunder investigation.
Sclerometric studies were performed using a Woodtester device from Novatest (Ancona,Italy) with an impact energy of 2.4 J, equipped with steel pins having a hardness of 60 HRand a diameter of 2.5 mm with a cone-shaped tip inclined at an angle of 35 degrees anda length of 50 mm, and a clock sensor offering measurement accuracy of 0.01 mm. Thedevice was calibrated on a testing anvil characterized by hardness of >52 HRC. Markingwas done on the device in a horizontal position. The quantity measured was the remainingpart of the pin that had not penetrated into the material, and the measurement result wastaken as the difference between the pin length and quantity measured. The maximumpossible pin penetration depth after a fivefold impact, as recommended by the producer, is40 mm. However, for the species of wood used in the experiment with a high moisturelevel, three impacts produce a cavity which is greater than the measurement limitationof the device, hence a decision was made to consider the results of a single (PD1) anddouble (PD2) hammer impact. After readouts of the first and second impact, the pins wereremoved using hand tools. For each sample, three test fields were selected on its three sidesin places macroscopically evaluated as defect-free. In each field, 18 points were selectedfor tests under different moisture levels and no fewer than 9 measurements were taken for
Materials 2021, 14, 96 7 of 22
each area and each moisture level. The device used and an example of a specimen in themiddle of testing are shown in Figure 6.
Figure 6. The device used for semi-destructive test (SDT) studies. (a) Woodtester Novatest and accessories; (b) Dynamicinsertion of sclerometer pins; (c) Penetration depth readout.
The resistance drilling test was carried out by a means of a 4453-S resistograph deviceproduced by RinnTech (Heidelberg, Germany) with a drilling rate of 40 cm/min anda resolution of 1/100 mm dedicated to tests of wood of average density and equippedwith a drill bit with a diameter of 1.5 mm and a head of 3.0 mm. The torque required tokeep a constant drilling rate corresponds to wood resistance and is recorded and plottedversus the drill bit penetration depth. The tests were conducted perpendicularly to fibres,away from the defect-occurring zones. The results of the measurements were taken as thequotient of the area under the resistance drilling curve and the drill depth (RM) [40], asa dimensionless quantity dependent on the device used. For each element, 2 referencecross-sections were selected for which resistance drilling tests were performed in the air-dry state, whereas subsequent measurements were taken at various moisture contents incross-sections situated 15 mm away from the previous one. The apparatus and an exampleof a specimen in testing are shown in Figure 7.
Figure 7. The device used for SDT studies. (a) Rinntech resistograph for resistance drilling tests; (b) Device conductinga test.
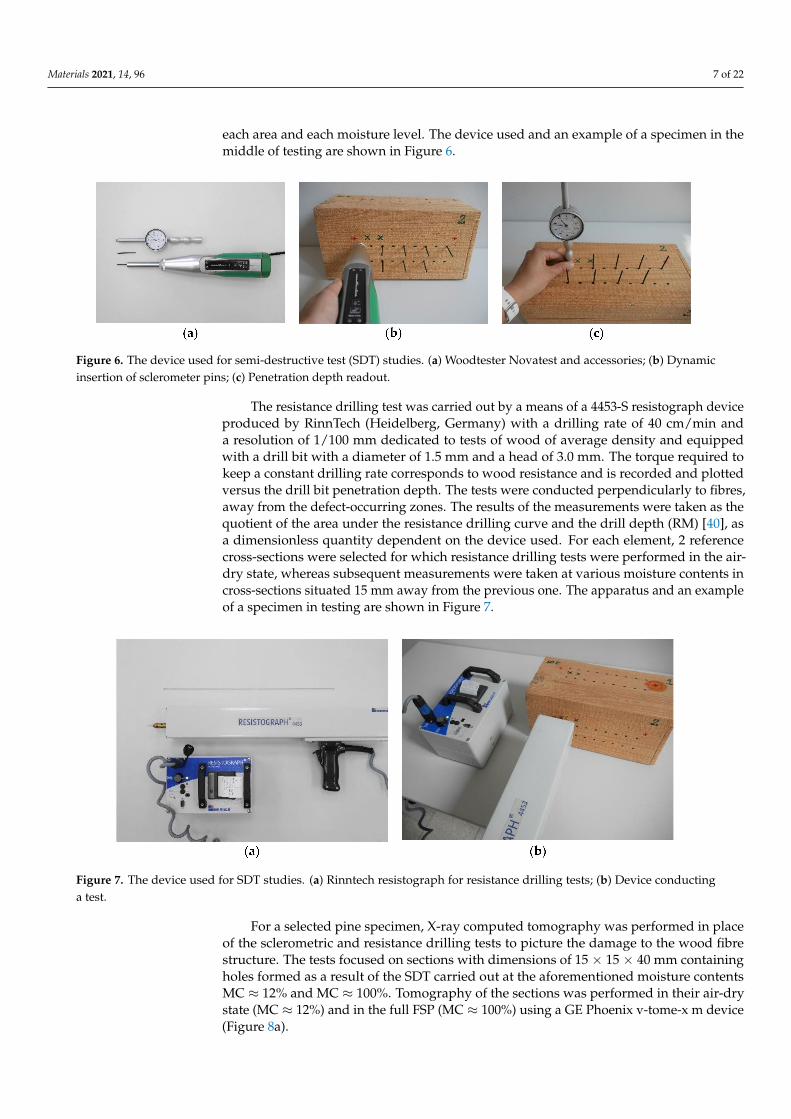
For a selected pine specimen, X-ray computed tomography was performed in placeof the sclerometric and resistance drilling tests to picture the damage to the wood fibrestructure. The tests focused on sections with dimensions of 15 × 15 × 40 mm containingholes formed as a result of the SDT carried out at the aforementioned moisture contentsMC ≈ 12% and MC ≈ 100%. Tomography of the sections was performed in their air-drystate (MC ≈ 12%) and in the full FSP (MC ≈ 100%) using a GE Phoenix v-tome-x m device(Figure 8a).

Materials 2021, 14, 96 8 of 22
Figure 8. X-Ray CT studies. (a) GE Phoenix v-tome-x m device performing a test; (b) Sample prepared for a tomographytest positioned inside the device.
The GE Phoenix v-tome-x m device operating on the VG Studio Max (version 3.4)software allows for reconstruction and analysis of the internal element structure basedon a series of X-ray images taken while the sample was rotating 360◦. Given the differentmoisture level of the material and slightly different specimen sizes, the parameters of thetest were adjusted each time to the element under investigation accordingly. Table 2 liststhe basic test parameters and their value ranges used in the experiment.
Table 2. X-Ray CT test parameters.
Parameter Value
Source Voltage/Source Current 40–50 kV/90–110 µAVoxel size 10–12 µm
Filter noneExposure time 500 ms
Number of X-rays used to reconstruct a 3D image 3000 pcs
3. Results
First, NDT and SDT tests were carried out on all samples in the air-dry state (moisturein the range 11–13%) as reference tests. The following parameters were evaluated: arith-metic average, median, and standard deviation. Most of the results are characterized bylittle variance, which indicates high uniformity, with a clear exception in the case of thefir samples. All the results in individual groups, except for the penetration depths PD1and PD2 for the fir samples, fit in a normal distribution (according to the Shapiro–Wilkstatistical test). The distribution of the characteristics under investigation is presented inFigure 9.
The influence of moisture on the results of the ultrasound, sclerometric, and drillingresistance tests was analysed. The results were divided into a spectrum of hygroscopicmoisture—from zero to the fibre saturation point (FSP) approximately equal to MC ≈ 0–30%and capillary moisture (above the fibre saturation point). For moisture above FSP, in orderto determine the correlations, the outer points of the hygroscopic range were additionallyassumed, for which the moisture content was higher than 25%. Subsequently, variousregression models were verified, from which the linear regression method was selected forpresentation of results and further considerations. It should be noted that for data abovethe FSP, the presented coefficients of determination R2 were derived from a small amountof data.

Materials 2021, 14, 96 9 of 22
Figure 9. Distribution of test properties in the reference sample for individual wood species. Penetration depth (a) after asingle impact, (b) after a double impact; (c) velocity of ultrasonic wave propagation; (d) drilling resistance.
Moreover, a possibility was considered to formulate this relation independently of thewood species. Assuming that the physical and mechanical properties of wood are stronglydetermined by density, the results of the SDT and NDT tests were divided by the densityof the sample in the absolute-dry state ($0). The resultant correlation between the moistureand the quotient of the test results (v, PD1, PD2, RM) and the density in the absolute-drystate is lower than when each wood species was analysed separately. This confirms thatmany other factors additionally affect the results of the tests. Therefore, this normalizationwas omitted in further analyses. In Sections 3.1–3.3, the results of the tests are summarized.
3.1. Ultrasonic Wave Propagation Studies
The analysis was carried out on the results obtained for the individual species ofwood. Generally, there was a decrease in the velocity of the ultrasonic wave passage asthe moisture increased. Regardless of the wood species, this drop was more significantin the moisture range below the FSP than above the FSP. A strong correlation was foundfor spruce and fir timber and a slightly weaker one was for pine timber. The results ofthe study with defined trend lines and corresponding coefficients of determination arepresented in Figure 10.

Materials 2021, 14, 96 10 of 22
Figure 10. Ultrasonic wave testing for samples of different moisture levels.
For all wood species in the moisture range below the FSP, the drop in velocity of thewave passage with a moisture change of one percentage point was 13.7 m/s on average.This represents approximately a 1.0% change in the result with a moisture change of 1% forpine and spruce and 0.8% for the fir. The smallest decrease in the moisture range aboveFSP was recorded for spruce samples, which was about 2.8 m/s per one percentage pointof moisture increase; in this range, the highest decrease was recorded for fir samples andreached 5.5 m/s, which is 0.24% and 0.42% respectively.
3.2. Sclerometric Studies
The sclerometric tests revealed an increase in penetration depth with increasingmoisture of the material, which is confirmed by the strong correlations. Analysis wasperformed of the results obtained for individual wood species for a single and doubleimpact. The results of the tests, accompanied by defined trend lines and correspondingcoefficients of determination, are presented in Figure 11a,b. For all the species, there was astrong correlation independently of the number of impacts or moisture content.
Below the FSP, an increase of one percent in humidity caused a reduction in theresult (PD1 and PD2) of approximately 0.9%, with larger modifications occurring for pineand spruce samples than for fir samples. For all wood species after exceeding the fibresaturation point, the influence of moisture on the obtained results decreased and wasapproximately 0.24% for PD1 and 0.22% for PD2.
Figures 13 and 14 present X-ray images of the damage structure in the wood thatoccurred during the sclerometric test of the samples in the air-dry state and the state of fullfibre saturation with water. The naming convention of the sections is given in Figure 12.

Materials 2021, 14, 96 11 of 22
Figure 11. Sclerometric studies on samples of different moisture contents: (a) Results for individual wood species for asingle impact; (b) Results for individual wood species for a double impact.
Figure 12. The schematic view of considered sections: R, T, and L.
It can be seen that the character of the damage to the microstructure is substantiallydifferent both in the earlywood and latewood of a given sample as well as for thesemoisture levels. Penetration of the sclerometer pin through the air-dry wood causes elastic

Materials 2021, 14, 96 12 of 22
deformation and permanent deformation of individual fibres, most of all in a tangentialdirection and, to a lesser extent, in a longitudinal direction. The damage is accompaniedby a structure integrity breach and brittle fibre fractions, especially in latewood, whichmanifests through an increase in the damage zone in a longitudinal direction (Figure 13b).The cracks are much larger than the diameter of the sclerometer pin and extend up to2.8 mm from the hole axis. In Figure 13a,b, the zone of the damaged fibres is outlined witha black dashed line and substantial broadening of this zone is visible in latewood. Thetest hole has a close to elliptic shape and is smaller than the cross-section of the pin of thesclerometer along the shorter axis by 0.75 mm on average (a cross-section of the sclerometerpin is shown in Figure 13a,b in orange).
Figure 13. Sections through the opening resulting from the sclerometric test on the sample in the air-dry state: (a) Cross-section within earlywood R1—tangential section of wood is visible; (b) Cross-section within latewood R2—tangential sectionof wood is visible; (c) Longitudinal section T—radial wood section is visible; (d) Longitudinal section L—a cross-section ofwood is visible.
In turn, penetration of the sclerometer pin through the saturated wood causes mostlyelastic deformation of individual fibres and pronounced cracking along the fibres. Both inearlywood and latewood, the impact hole in a tangential direction is much smaller than thediameter of the sclerometer pin, whereas the fractions in a longitudinal direction are muchlarger than the pin diameter. In earlywood and latewood, they extend to 1.8 and 3 mm fromthe opening axis, respectively. In Figure 14a,b, the black dashed line corresponds to the

Materials 2021, 14, 96 13 of 22
zone of fibres that sustained damage and the area of the compressed fibres is comparablein both cross-sections. The test hole in a tangential direction is considerably smaller than atransverse cross-section of the sclerometer pin (the sclerometer pin cross-section is shownin Figure 14a,b in orange).
Figure 14. Sections through the opening resulting from the sclerometric test on the sample in the fibre saturation state.(a) Cross-section within earlywood R1—tangential section of wood can be seen; (b) Cross-section within latewoodR2—tangential section of wood can be seen; (c) Longitudinal section T—radial section of wood visible; (d) Longitudi-nal section L—cross-section of wood visible.
3.3. Resistance Drilling Studies
The research indicated a general trend of the development of drilling resistances asthe moisture content increases. Nevertheless, the weak correlations in the range below theFSP suggested a weak dependence of drilling resistances on the moisture content in thisspectrum, whereas above the FSP, these correlations are very strong. The results of thestudy with defined trend lines and corresponding coefficients of determination are givenin Figure 15.

Materials 2021, 14, 96 14 of 22
Figure 15. Resistance drilling tests for samples of different moisture contents.
Below the FSP for fir wood, an increase in moisture content of 1 percentage point con-tributed to an increase in drilling resistance of about 0.3%. The coefficients of determinationobtained in this range for pine and spruce wood did not indicate a significant relationship.In the range above the FSP, an increase in moisture content by 1 percentage point causedan increase in drilling resistance of about 0.2% on average for all wood species.
In Figures 16 and 17, X-ray images illustrate the wood structure damage that wascaused in the resistance drilling tests of the air-dry samples and fully water-saturatedsamples. The naming convention of the sections is given in Figure 12. In resemblance to thesclerometric tests, it can be seen that the damage character of the microstructure differs bothwithin the earlywood and latewood of a given sample and for different moisture levels.
Figure 16. Cont.

Materials 2021, 14, 96 15 of 22
Figure 16. Sections through the opening after the resistance drilling test of the sample in the air-dry state. (a) Cross-sectionwithin earlywood R1—tangential wood surface visible; (b) Cross-section within latewood R2—tangential wood surfacevisible; (c) Longitudinal section T—radial wood surface visible; (d) Longitudinal section L—wood cross-section visible.
Figure 17. Sections through the opening after the resistance drilling test of the sample in the fibre. (a) the tangential woodsurface is visible; (b) Cross-section within latewood R2—the tangential wood surface is visible; (c) Longitudinal sectionT—the radial wood surface is visible; (d) Longitudinal section L—wood cross-section is visible.

Materials 2021, 14, 96 16 of 22
The damage zone in Figure 16a,b is marked with a black line; the distance betweenthe edge of the damaged fibres, in a direction along the fibres, is on average 4.0 mmin earlywood, whereas in latewood, the distance is 3.5 mm. The test borehole is uni-formly filled with fragments of drill cuttings. The zone of the drill operation is shown inFigure 16a,b in orange.
The damage zone is marked with a black line in Figure 16a,b. In a direction longitudi-nal to the fibres, the damage zone extends to 4.1 mm in earlywood and 3.9 mm in latewood.In Figure 17a,b, the drill operation area is outlined in orange.
4. Discussion
The results indicated a relationship between moisture and the data from the NDTand SDT tests. The mechanical properties of the cell wall material strongly differ in theconsidered ranges (below and above the FSP), which is also reflected in the significanceof the impact of moisture content growth on the results of these tests. It was found for allthe studies under consideration that these relationships are higher in the range below theFSP than in the range above FSP. Within individual species, a more significant effect wasobserved for pine and spruce than for fir. One should note that the scatter of results givenin the graphs (Figures 10, 11 and 15) could be related to the fact that most of the studieswere performed between the R and T directions, which also influenced their scale [29].Table 3 presents the percentage change of the test results for the increase in moisture byone percentage point for individual methods.
Table 3. Summary of percentage changes of NDT and SDT test results for 1% increase in moisture content.
TestsPine Spruce Fir
MC ≈ 0–30% MC > 25% MC≈ 0–30% MC > 25% MC ≈ 0–30% MC > 25%
Velocity of Ultrasonic PulsePropagation (m/s) 0.998% 0.308% 1.010% 0.235% 0.781% 0.417%
Penetration Depth PD1 (mm) −0.929% −0.205% −0.991% −0.288% −0.643% −0.244%Penetration Depth PD2 (mm) −1.043% −0.178% −1.012% −0.256% −0.624% −0.225%
Drilling Resistance RM (-) (−0.092%) * −0.172% (−0.069%) * −0.213% −0.326% −0.109%
* Results from relationships that did not obtain satisfactory coefficient of determination.
Firstly, ultrasonic wave propagation velocity tests (NDT) were carried out, for whichthe impact of moisture has already been described in the literature. Among other authors,Sandoz [25] reports a decrease in ultrasonic wave velocity by about 0.8% for each 1%moisture content increase. This value was found only for spruce wood in the 5–30%moisture content range. A broader moisture content range (5–126% for the wood ofDouglas fir) was studied by Wang [41], who describe the ultrasonic wave velocity drop bya polynomial function in the whole range of moisture content. The studies were carried outalong fibres using a hammer, exciting mechanical waves at one end of the specimen, whichimposes substantial limitations for application in existing constructions. However, as theauthor suggested, it could be functional for timber grading. In the moisture range 12–20%,per 1 percent rise in moisture from the polynomial function, a 1.7% decrease in ultrasonicwave velocity was obtained and for moisture in the range 50–60%, per 1 percent increase inmoisture from the polynomial function, a 1.0% drop of ultrasonic wave velocity was noted.In other tests, the ultrasonic wave velocity was reduced by 1.0%; for ultrasound velocity,a correction factor with a decrease in velocity of 0.53% for each 1% increase in moisturecontent (in the range below 28% moisture content) was proposed for spruce [24].
The results obtained in terms of moisture content below FSP are closest to thoseobtained by Sandoz [25]. In the range above the FSP, the results were much lower than inthe study [41], which first of all may be the result of a different wood species and secondlyof the research method used and the polynomial correlation chosen in this study.

Materials 2021, 14, 96 17 of 22
Currently, the existing results come from the sclerometric tests carried out by means ofa Pilodyn 6J device for Douglas fir wood [42] and various species of pine [43]. The resultsof these studies suggest that the influence of moisture on the sclerometric test results maydepend on the wood species. In this work, a 1.6% decrease for each percentage point ofmoisture increase was indicated for pine wood. This is almost three times higher in therange below the FSP than the results obtained here for fir wood, and is considerably higherthan the results obtained for pine and spruce wood regardless of the number of impacts.This phenomenon may be due to the higher impact energy of the device used in the testsof Llana et al. [43]. There is no data for comparison in the moisture range above the FSP;however, similarly to ultrasound tests, the influence of moisture on the sclerometric resultsdecreased as they increased.
An interesting source of information on the influence of this testing method on themicrostructure of wood is the CT scanning. Figures 13 and 14 demonstrate typical imagesobtained for various samples. There is a significant difference in the nature of microstruc-ture destruction for air-dry samples and in the state of full saturation. The dynamicpenetration of the sclerometer needle in the air-dry samples caused destruction in theform of a clear tightening of the lumen of the cells (tracheids) of the earlywood, and in thelatewood, it was accompanied by significant cracking (Figure 13d). The tightened cellsaccumulated on the boundary of the annual growth ring. In a completely different way,the destruction took place in the wood in the state of fibre saturation; there is no brittlecracking between the wood cells (Figure 14d) but only a slight accumulation along thehole left by the sclerometer needle. However, there was a separation in the transversedirection of individual wood fibres over a long distance, as shown in Figure 14a,b. Thiswas most probably caused by water occurring between the micelles, which reduces thecohesion forces between them. This different character of cellular structure destructionbelow and above the FSP indicated a varying influence of moisture on the sclerometric testresults in these ranges. Up to the fibre saturation point, the cohesion forces decrease withincreasing moisture content and thus the influence of moisture on sclerometric test resultsis significant. At the point of fibre saturation, the cohesion forces reach the lowest level;further penetration of free water does not significantly change the mechanical properties ofthe wood, which is reflected in a reduced effect of moisture on the results of these tests.This further, although much smaller, impact of moisture on the results of the tests couldbe explained by the decreasing friction forces associated with the presence of increasingamounts of free water. For the dynamic character of this test, the free water contributesto the slip of the smooth surface of the sclerometer needle within the wood fibres withminimal cohesion.
In turn, when it comes to the resistance drilling tests, the literature offers data onmoisture impact limited only to living trees [44] thus with moisture levels significantlyexceeding those found in building structures. Nevertheless, the study shows a generallinear relationship between the increase in drilling resistance with the increase in moisturecontent (in the MC range of 10–300%) and the possibility of using resistographic methodsto estimate the density of woods with different moisture content. It should be noted thatthe obtained correlations for these tests are lower than for sclerometric and ultrasonic tests;similarly, the magnitude of the moisture impact on the results of the drilling resistance testsis lower. For moisture below the fibre saturation point, in the case of pine and spruce wood,the scatter of results is considerable. Presumably, this is a consequence of the differentposition of the resistographic test in relation to the entire sample cross-section. This doesnot allow general conclusions to be drawn, but the analysis of the drilling resistances forindividual samples indicated the relationship between the increase in drilling resistancesand the increase in moisture even within the moisture content below the fibre saturationpoint. Table 4 shows the results for selected samples in this moisture spectrum. In thecase of fir samples, the obtained correlation curve made it possible to determine the effectof moisture at a change of one percentage point on the below FSP results at 0.3%. In the

Materials 2021, 14, 96 18 of 22
moisture content range above the fibre saturation point, the change in moisture contentresults in a change of about 0.2% for pine and spruce samples and 0.11% for fir samples.
Table 4. Summary of the drilling resistance results for selected samples in the moisture range belowthe fibre saturation point (FSP).
SampleMean Resistance Drilling [RM]
MC ≈ 4% MC ≈ 7.5% MC ≈ 10%
H1 Pine Sample 107.3 109.5 113.9H2 Pine Sample 103.2 106.9 111.2
H1 Spruce Sample 96.1 99.5 107.1H2 Spruce Sample 94.9 98.3 106.9
Analysis of the tomographic images showed the different types of destruction forranges above and below the fibre saturation point. The resistograph bit penetration throughearlywood in the air-dry sample causes fibre destruction, most of all along the fibres. In thiszone, characteristic fibre displacements following the drill’s rotational movement are visible.In latewood, the damage type is similar, but its extent is much lesser. The penetration of theresistograph drill bit through the wood in the state of full saturation causes fibre damageto a much greater extent than in the case of air-dry wood. Characteristic displacements offibres are visible in a direction consistent with the drill bit rotation manner, but the image isnot as clear as for the samples in the air-dry state. Both in earlywood and latewood, thereis a compaction of drill cuttings at the borehole walls. In latewood, the damage zone in atangential and longitudinal direction is comparable. In turn, in earlywood, the greatestdamage occurs along the fibres.
The destruction of the wood structure by drilling below the FSP differs from thedestruction within the range above the FSP—in particular, the distribution of the remainingdrill cuttings in the hole. The drill cuttings for the samples above the FSP range accumulatednear the walls of the drill hole and thus additionally increased the resistance to the side ofthe drill bit in the drilling part.
The drilling resistance test in terms of the wood microstructure is a component of theshearing of individual wood fibres by the drilling tool and the resistance of this material.Both in the moisture range below and above FSP, the drilling conditions between the tooland the material under investigation change with increasing moisture content. In this case,unlike sclerometric tests, the water content increases the friction forces (drilling resistanceforces). These forces are superior to the decrease in mechanical properties that occurs in thewood as the moisture content increases in the range below the FSP. Moreover, the decreasein the modulus of elasticity of the wood together with the increase in moisture causes adecrease in the resistance force, which has a significant impact on the drilling process ofthe material.
Synthesising the results obtained, the linear relationships can be expressed by Equation (1),which allows recalculation of a result of the NDT and SDT tests at a given moisture contentMC (XMC) to a result expected at moisture of 12% (X12). This equation is analogical to theequation used in the literature to recalculate the mechanical properties of wood from amoisture content different from the reference moisture value [45]; a similar relation canalso be found in the work [24].
X12 = XMC[1 ± k(MC − 12)] (1)
In the equation, for ultrasound tests, a “+” should be used; in turn, for resistographicand sclerometric tests, a “−” should be applied. This corresponds to the positive andnegative influence of moisture content on the results of these tests. The k-factor is thepercentage change of the test result in the numerical form, determined in Table 3. Forexample, for ultrasound tests in the range below the FSP for pine wood, the factor k = 0.01should be applied and for calculations in the range above the FSP, k = 0.003.

Materials 2021, 14, 96 19 of 22
For ultrasonic measurements with 54 kHz transducers, a 2.4 J Woodtester sclerometer,and a RinntTech 4453 resistograph for the selected wood species, recalculation of a result toa value expected at a different allowed moisture level (Xi) can be made using Equation (2)and Table 5, listing the coefficient a, where ∆MC is the difference between the moisture ofthe element tested and the moisture for which the result is needed.
Xi = XMC ± a·∆MC (2)
Table 5. Average values for reference level of MC = 12% and slope coefficient a.
Tests MCPine Spruce Fir
XMC = 12% a XMC = 12% a XMC = 12% a
Velocity of Ultrasonic PulsePropagation (m/s)
Below FSP1598.8
−14.2711557.3
−13.7371930.0
−13.164Above FSP −3.884 −2.853 −5.502
Penetration Depth PD1 (mm) Below FSP12.70
0.139411.81
0.142 11.78 0.0817Above FSP 0.0345 0.0526 – 0.0381
Penetration Depth PD2 (mm) Below FSP18.55
0.233816.93
0.207616.92
0.1131Above FSP 0.043 0.0646 0.0496
Drilling Resistance RM (–) Below FSP110.18
(0.1048) *111.45
(0.0765) *121.18
0.4272Above FSP 0.2283 0.2736 0.1509
* Results from relationships that did not obtain satisfactory coefficient of determination.
Table 5 presents the average values of the NDT and SDT tests for the 12% referencelevel and the slope coefficients (a) of the linear relation.
It should be remembered though that these values cannot not be extrapolated beyondthe selected wood species and a moisture level of more than 100%. In the case of species ofa different anatomic structure or within the same species but with very different densities,additional tests would be required to verify if changes of the results given in the Tables3 and 5 are also valid for moisture changes by 1 percentage point. Caution is needed, inparticular, in the case of sclerometric tests, for which the literature-reported changes reacheven 2% depending on the wood species (tests performed with a different device) [43], andresistance drilling tests, for which there are no publications allowing for a comparison of theresults. This is also confirmed by the images obtained through computed tomography of thestructural damage to the wood due to the tests. A different damage character for earlywoodand latewood of various moisture levels may suggest different results at significantlydifferent shares of these annual growth zones in the element under investigation (whichwill be reflected in the density of the material).
5. Conclusions
For all the tests considered in this work, the influence of wood moisture on the testresults cannot be neglected, which is particularly important in the context of studies ofexisting building objects and the known relations between the changes of the physicaland mechanical timber properties and its moisture. It is worth noticing that the moisturecontent of built-up wooden construction elements is hardly ever equal to 12%—the valuefor which the correlations are known. Typically, these are individual curves obtained usingparticular devices and wood species, declared by producers or created by users for theirown purposes. Different moisture content leads to complications in interpretation of theresults of in situ tests, especially for substantially different moisture levels.
Understanding these relationships provides a reliable assessment of the technicalcondition of objects and elements of timber construction exposed to extensive moisture,and thus the possibility of efficient repair and preserving considerably more culturalheritage. Depending on the aim of an in situ test and the evaluation of scrutiny levelrequired, it is recommended that Equations (1) or (2) should be used. The authors suggestthat recalculations to a different moisture content should be taken into account when the

Materials 2021, 14, 96 20 of 22
moisture difference is greater than ± 4% with respect to the reference value. Substantialdifferences in the results are expected, especially in tests of engineering objects constantlyexposed to moisture or direct contact with water, such as bridges or piles, for which themoisture content will be high, or facilities that are exposed to weather conditions due toimproper operation.
The article describes relationships for the most popular structural timber in CentralEurope; it should be noted that these relationships, as well as the general physical andmechanical properties of the wood, are dependent on the habitat conditions, and therefore,the possibility of using the proposed coefficients for other areas is limited. Most importantly,as a completely new feature, the article presents a reference to the influence of moistureon the results of the drilling resistance tests. This device appeared to be the least sensitiveto the increase in wood moisture, which may be an advantage of choosing these testsfor structures. However, it is worth noting that in contrast to sclerometric tests, a higherresult for the drilling resistance is supposed to represent higher mechanical parameters,which in the case of the obtained results may lead to incorrect interpretation of highdrilling resistances if the moisture content of the wood is not taken into consideration and,consequently, to overestimation of the load-bearing capacity of the element or object.
Author Contributions: Conceptualization, J.J.-L. and E.P.; methodology, J.J.-L.; formal analysis J.J.-L.and E.P.; writing—original draft preparation, J.J.-L.; writing—review and editing, E.P; visualizationJ.J.-L.; supervision, E.P. All authors have read and agreed to the published version of the manuscript.
Funding: This research received no external funding.
Institutional Review Board Statement: Not applicable.
Informed Consent Statement: Not applicable.
Data Availability Statement: Data is contained within the article.
Conflicts of Interest: The authors declare no conflict of interest.
References1. Yeomans, D. The Repair of Historic Timber Structures; Thomas Telford Ltd.: London, UK, 2003.2. Lechner, T.; Nowak, T.P.; Kliger, R. In situ assessment of the timber floor structure of the Skansen Lejonet fortification, Sweden.
Constr. Build. Mater. 2014, 58, 85–93. [CrossRef]3. Branco, J.; Descamps, T.; Tsakanika, E.; Costa, A.A.; Arêde, A.; Varum, H. Repair and Strengthening of Traditional Timber Roof
and Floor Structures. In Efficient and Suitable Construction; Springer Science and Business Media LLC.: Singapore, 2017; Volume 9,pp. 113–138.
4. Jasienko, J.; Nowak, T.P.; Bednarz, L. Wrocław University’s Leopoldinum Auditorium—Tests of Its Ceiling and a Conservationand Strengthening Concept. Adv. Mater. Res. 2010, 265–270. [CrossRef]
5. Przesmycka, N. Polish Wooden Architecture. Selected Issues. In The Wooden Treasury. Protecting the Heritage, Creating the Future.Project Summary; Grodzka Gate—The NN Theatre: Lublin, Poland, 2015. (In Polish)
6. Perria, E.; Sieder, M. Six-Steps Process of Structural Assessment of Heritage Timber Structures: Definition Based on the State ofthe Art. Buildings 2020, 10, 109. [CrossRef]
7. PN-EN 17121 Conservation of Cultural Heritage. Historic Timber Structures. Guidelines for the on-Site Assessment of Load-BearingTimber Structures; BSI: London, UK, 2020.
8. Tannert, T.; Anthony, R.W.; Kasal, B.; Kloiber, M.; Piazza, M.; Riggio, M.; Rinn, F.; Widmann, R.; Yamaguchi, N. In situ assessmentof structural timber using semi-destructive techniques. Mater. Struct. 2014, 47, 767–785. [CrossRef]
9. Riggio, M.; D’Ayala, D.; A Parisi, M.; Tardini, C. Assessment of heritage timber structures: Review of standards, guidelines andprocedures. J. Cult. Heritage 2018, 31, 220–235. [CrossRef]
10. Piazza, M.; Riggio, M. Visual strength-grading and NDT of timber in traditional structures. J. Build. Apprais. 2008,3, 267–296. [CrossRef]
11. Kandemir-Yucel, A.; Tavukcuoglu, A.; Caner-Saltik, E. In situ assessment of structural timber elements of a historic building byinfrared thermography and ultrasonic velocity. Infrared Phys. Technol. 2007, 49, 243–248. [CrossRef]
12. Machado, J.; Palma, P.; Simões, S. Ultrasonic indirect method for evaluating clear wood strength and stiffness. In Proceedings ofthe Nondestructive Testing in Civil Engineering, Nantes, France, 30 June–3 July 2009; pp. 3–8.
13. Cała, M.; Cyran, K.; Kawa, M.; Kolano, M.; Łydzba, D.; Pachnicz, M.; Rajczakowska, M.; Rózanski, A.; Sobótka, M.; Stefaniuk,D.; et al. Identification of Microstructural Properties of Shale by Combined Use of X-Ray Micro-CT and Nanoindentation Tests.Procedia Eng. 2017, 191, 735–743. [CrossRef]

Materials 2021, 14, 96 21 of 22
14. Bucur, V. Nondestructive Characterization and Imaging of Wood; Springer Science and Business Media LLC.: Berlin/Heidelberg,Germany, 2003.
15. Mannes, D.; Lehmann, E.; Cherubini, P.; Niemz, P. Neutron imaging versus standard X-ray densitometry as method to measuretree-ring wood density. Trees 2007, 21, 605–612. [CrossRef]
16. Ronca, P.; Gubana, A. Mechanical characterisation of wooden structures by means of an in situ penetration test. Constr. Build.Mater. 1998, 12, 233–243. [CrossRef]
17. Henriques, D.F.; Nunes, L.; Machado, J.S.; de Brito, J. Timber in buildings: Estimation of some properties using Pilodyn andResistograph. In Proceedings of the International Conference on Durability of Building Materials and Components, Porto,Portugal, 12–15 April 2011; pp. 1–8. [CrossRef]
18. Cai, Z.; Hunt, M.O.; Ross, R.J.; Soltis, L.A. Screw withdrawal—A means to evaluate densities of in-situ wood members. InProceedings of the 13th International Symposium on Nondestructive Testing of Wood, Forest Products Society, Madison, WI,USA, 19–21 August 2002; pp. 277–281.
19. Kasal, B.; Drdacky, M.; Jirovsky, I. Semi-destructive methods for evaluation of timber structures. In Proceedings of the StructuralStudies, Repairs and Maintenance of Heritage Architecture VIII, Halkidiki, Greece, 7–9 May 2003; Brebbia, C.A., Ed.; WitPress:Southampton, UK, 2003; Volume 66, pp. 835–842.
20. Kloiber, M.; Drdácký, M.; Machado, J.S.; Piazza, M.; Yamaguchi, N. Prediction of mechanical properties by means of semi-destructive methods: A review. Constr. Build. Mater. 2015, 101, 1215–1234. [CrossRef]
21. Kloiber, M.; Tippner, J.; Hrivnák, J. Mechanical properties of wood examined by semi-destructive devices. Mater. Struct. 2013,47, 199–212. [CrossRef]
22. Feio, A.; Machado, J.S. In-situ assessment of timber structural members: Combining information from visual strength gradingand NDT/SDT methods—A review. Constr. Build. Mater. 2015, 101, 1157–1165. [CrossRef]
23. Jaskowska-Lemanska, J.; Sagan, J. Non-Destructive Testing Methods as a Main Tool Supporting Effective Waste Management inConstruction Processes. Arch. Civ. Eng. 2019, 65, 263–276. [CrossRef]
24. Íñiguez-González, G.; Arriaga, F.; Esteban, M.; Llana, D.F. Reference conditions and modification factors for the standardization ofnondestructive variables used in the evaluation of existing timber structures. Constr. Build. Mater. 2015, 101, 1166–1171. [CrossRef]
25. Sandoz, J. Moisture content and temperature effect on ultrasound timber grading. Wood Sci. Technol. 1993, 27, 373–380. [CrossRef]26. Giuriani, E.; Gubana, A. A penetration test to evaluate wood decay and its application to the Loggia monument. Mater. Struct.
1993, 26, 8–14. [CrossRef]27. De Oliveira, F.G.R.; Candian, M.; Lucchette, F.F.; Salgon, J.L.; Sales, A. A technical note on the relationship between ultrasonic
velocity and moisture content of Brazilian hardwood (Goupia glabra). Build. Environ. 2005, 40, 297–300. [CrossRef]28. Lourenço, P.B.; Feio, A.; Machado, J.S. Chestnut wood in compression perpendicular to the grain: Non-destructive correlations
for test results in new and old wood. Constr. Build. Mater. 2007, 21, 1617–1627. [CrossRef]29. Jaskowska-Lemanska, J.; Wałach, D. Impact of the Direction of Non-destructive Test with Respect to the Annual Growth Rings of
Pine Wood. Procedia Eng. 2016, 161, 925–930. [CrossRef]30. Skowronski, W.; Stawiski, B. Ultrasonic evaluation regarding the effects of biological corrosion of historical roof trusses. MATEC
Web Conf. 2019, 284, 07006. [CrossRef]31. Wikłacz, Z. Dampness in heritage buildings. J. Herit. Conserv. 2018, Nr 55, 57–66. [CrossRef]32. Kollmann, F.F.P.; Cote, W.A. Principles of Wood Science and Technology I—Solid Wood; Springer: Berlin/Heidelberg, Germany, 1968;
ISBN 82-13-00284-9.33. Rowell, R.M. Handbook of Wood Chemistry and Wood Composites, 2nd ed.; Rowell, R.M., Ed.; Taylor & Francis: Boca Raton, FL, USA,
2012; ISBN 9781439853801.34. Ranta-Maunus, A. Effects of climate and climate variations on strength. In Timber Engineering; Thelandersson, S., Larsen, H.J., Eds.;
John Wiley and Sons Ltd.: West Sussex, UK, 2001; pp. 1–16.35. Gerhards, C.C. Effect of Moisture Content and Temperature on the Mechanical Properties of Wood: An Analysis of Immediate
Effects. Wood Fiber 1982, 14, 4–36.36. PN-EN 13183-01. Moisture Content of a Piece of Sawn Timber—Part 1: Determination by Oven Dry Method (in Polish); European
Committee for Standardization: Bruxelles, Belgium, 2004.37. Nowak, T.P.; Karolak, A.; Sobótka, M.; Wyjadłowski, M. Assessment of the Condition of Wharf Timber Sheet Wall Material by
Means of Selected Non-Destructive Methods. Materials 2019, 12, 1532. [CrossRef] [PubMed]38. Tannert, T.; Müller, A.; Vogel, M. Applications and limitations of NDT: A timber bridge case study Résumé Keywords Timber
bridge case study. In Proceedings of the Non-Destructive Testing in Civil Engineering, Nantes, France, 30 June–3 July 2009.39. PN-EN 16682:2017-05 Conservation of Cultural Heritage. Methods of Measurement of Moisture Content, or Water Content, in Materials
Constituting Immovable Cultural Heritage; BSI: London, UK, 2017.40. Nowak, T.P.; Jasienko, J.; Hamrol-Bielecka, K. In situ assessment of structural timber using the resistance drilling
method—Evaluation of usefulness. Constr. Build. Mater. 2016, 102, 403–415. [CrossRef]41. Wang, X. Effects of size and moisture on stress wave E-rating of structural lumber. In Proceedings of the 10th World Conference
Timber Engineering 2008, Miyazaki, Japan, 2–5 June 2008; Volume 3, pp. 1469–1476.42. Smith, S.M.; Morrell, J.J. Correcting Pilodyn measurement of Douglas-fir for different moisture levels. For. Prod. J. 1986, 36, 45–46.

Materials 2021, 14, 96 22 of 22
43. Llana, D.F.; Hermoso, E.; Bobadilla, I.; Íñiguez-González, G. Influence of moisture content on the results of penetration andwithdrawal resistance measurements on softwoods. Holzforschung 2018, 72, 549–555. [CrossRef]
44. Lin, C.J.; Wang, S.Y.; Lin, F.C.; Chiu, C.M. Effect of moisture content on the drill resistance value in Taiwania plantation wood.Wood Fiber Sci. 2003, 35, 234–238.
45. Krzysik, F. Wood Science; Panstwowe Wydawnictwo Naukowe: Warszawa, Poland, 1974. (In Polish)