Reports/Correspondence Related to VB Testing - Nuclear ...
459
MFN 06-127 Enclosure 3 ENCLOSURE 3 MFN 06-127 Reports/Correspondence Related to VB Testing General Electric Com~pany
-
Upload
khangminh22 -
Category
Documents
-
view
2 -
download
0
Transcript of Reports/Correspondence Related to VB Testing - Nuclear ...

MFN 06-127Enclosure 3
ENCLOSURE 3
MFN 06-127
Reports/Correspondence Related to VB Testing
General Electric Com~pany

GE Nuclear Energy
• " ":... . ..-.. , e :•;." •
May 2. 1994 MFN.' NO. 065-04Docket Xo. STN 52.004
Document Control DeskE;. S. Nuclear Regulatory CommissionWashington, D. C. 20555
Attention: Richard W. Borchardt. DirectorStandardization Project Directorate
Subject. NRC Requests for Additional Information (PRA.) on theSimplified Boiling Water Reactor (SBWR) Design
References: Transmittal of Requests for Additional Information (RAI)*;Requesting the SBWR Design, Letter from M. Malloy toP. W. Marriott dated February 9, 1994
The Refereceic letter requested additional information regarding the SBWIRwetwetlto-drywclU vacuum breaker tests. In fulfillment of this request, GE issubmitting Attachment 1 to this letter which transmits the response to RAI900.62.
Sincerely.
E.LeathermnuManager, SBWR Design CertificationM/C 781. (408) 925-.023
Attachment 1. "Responses to NRC RAls"
c: .M. M.alloy, Project Manager (w/2 copies of Attachment 1)F. W. Hassclbcrg, Project Manager (w/1 copy of Attachment 1)
A
a JIM

rn-rn---'
0
RAI Number: 900.62
Question:
The staff needs the following information in order to assess the adequacy of thewetwell-to-drywell vacuum breaker test program:
a. Drawings of the vacuum breaker and instrumentation.
b. Purchase Specification No. 25A5388. Revision 1. "Vacuum Breaker(Prototype)."
c. NEBO Engineering Operating Procedure No. 35-3.00. "Engineering Tests."
d. Detailed specification of the conditions, both normal and design basis, underwhich the vacuum breakers will be required to operate.
c. Detailed test procedures for the tests listed in the test matrix.
E Any information appropriate to ensuring that the data obtained on thereliable performance of the prototypical valve are applicable to (or will bebounding with respect to) the valves to be incorporated into the certified plantdesign.
GE Response:
a. The assembly and manufacturing drawings used to fabricate the vacuumbreaker valve are attached.
b. The purchase and test specifications 25A5388 Rev. 1 and 25A5445 Rev. I areattached.
c. NEBO Engineering Operating Procedure No. 35-3.00. "Engineering Tests." isattached.
d. The detailed specification of the conditions, both normal and design basis.under which the vacuum breakers will be required to 6perate are containedin Section 4.5 of 2SA5388 provided under item b.
e. The following are the detailed test procedumr for the vacuum breaker.
" Radiation Aging Campaign on the Primary Soft Seal of the SBWRVacuum Breaker Prototype, April 1994. Attached
" Drywell to Wetwell Vacuum Breaker Dynamic Qualification TestProcedure, Rev. 1, 2/22/94. Attached
I-

GE Response to WAY Number. 900.62(Continued)
- SBWR Vacuum Breaker (VB) Prototype Experimental Qualification Test
Procedure ED458S$, Rev. 0. Attached
* Vacuum Breaker Design Basis Accident Simulation Test Procedure
PCNVBR00001 (to be provided later following GE approval).
E Information appropriate to e•nsuring that the data obtained on the reliable
performance of the valvc is applicable is contained in. "Bayesian Approach
to the SBIR Vacuum Breaker Reliability Demonstration Testing,
ECN-CX.931 $55., Rev. I (Attached).

33
4
*1*GE tNuclenr Energy
P. W. Uanio~ JAan~V
September 26, 1994
1?$w~~wnP.W6SwimJs. CA 0512;-1014406925n698 phono) 4W08 25-11V3 flaWri)
Docket ST.N 52.004
Document Control DeskU. S. Nuclear Regulatory ComminsionWashington DC 20555
Attention: Richard W. Borchardt, DirectorStandardization Project Directorate
Subject- Responses to the Referenced Letters
Rcferences: 1) Letter, M. Malloy (NRC) to P. W. Marriott (GE), SCHEDULE FORREVIEW OF TEST AND ANALYSIS PROGRAM DESCRIPTION(NEDC-32391P) FOR THE GE NUCLEAR ENERGY (GE)SIMPLIFIED BOILING WATER REACTOR (SBW)) ANDINITIAL REQUESTS FOR ADDITIONAL IMFORMATION(Q900.65•2900.81 AND PURDUE UNIERSTY QUESTIONS .SE75), dated -September 12,1994.
U
2. Letter, K4 Malloy (NRC) to P. W. Marriot (GE), REQUEST FORADDITIONAL INFORMATION REGARDING THE TESTPROGRAM FOR THE GE NUCLEAR ENERGY (GE) SIMPLMFBOILING WATER REACTOR (SBWR) (QPOO.82.Qg0.95), datedSeptember 16,1994.
The Enclosures to this letter contain responses to Requests for Additional Information(RAls) 900.65 - 900.81, Purdue University Questions -Set 5 (Questions 1, 2. and 3). and900.3. 900.87, 900.91, 900.93, and 900.94, which were enclosures to the Referencedletters.
Sincerely,
T. R. McIntyre, Acting ManagerAdvanced Plant Technologies
Enclosures: 1. Responses to Reference 1.2. Responses to Reference 2.
cc: P. A. Bochnert (ACRS)R. W. Hasselberg (NRC)M. Malloy (NWC)
r 11- NO=

..7 7,
S@*0 GE Nuclear Energy
YNj No. 113-94
bcc: J. A. BeczrdR. H. BuchholzR. W. BurkeT. CookS. A. DelviiiT. Y. FernanadezJ. It. FitchD. L ForemanS. A. FranksL S, GiffordMA. Herzogj. E. LcathermanP. W. MarriottT. R. McrntyrcF. A. RossBS. ShiralkarR. SrirsivasanG. A. WingateGE Mawtr FileSBWR Project File
(EPRI)(DoE)
(EPIU)
(DoE)
(DoE)
(EPRI)
M/C 462M/C 781

Enclosure I to MFN 118-94
RAT Number ,00.65
Question:
Resubmit NEDC-82S9IP, "SBWR Test and Analysis Program Description," withclear identification or the proprietary information on each page sought to bewithheld, along with the reasons for withholding the information. Consistentwith the stafis April 7, 199, lctter from D. Crutchfield to P. Marriott regardingthe quality of the SBWR application, .submit a non-proprictary version of thereport within a reasonable period of time of the proprietary version, if the ver-sions are not submitted simultaneously. Both versions of the report should beresubmitted as Revision 0 in lieu of a draft.
In the letter(s) transmitting the report, provide a page-1."page summary of. anyadditions and corrections made to the report since the August 10, 1994. versionwas submitted to the staff for review.
GE Response:
?4...C-32391P. "SBWR Test and Analysis Program Description," Revision A.with clear identification of the proprietary information on each page sought tobe withheld was transmitted by MEN I09-94. dated September 15, 1994. Theletter transmitting the report provided a page-by-page summary of additions andcorrections made to the report. A non-proprietary version entitled "SBWR Testand Analysis Program Description." N•DO-32g91, was transmitted by MFN11 094. dated September 15, 1994.
.I-

RAI Number 900.66
Question:
Provide a point-by-point response to the staffs March 7, 1994, letter from D).Crutchfield to P. Marriott regarding concerns about the SBWR testing program.Alternatively, provide a road map that idensifics where in NEDC-32391P,."SBWR Test and Analysis Program Description," each of the concerns of theMarch 7. 1994, letter are explicitly addressed.
GE Response-.
Acceptability of the Gravity Driven Cooling System (GDCS) Integral SystemsTest (GIST) program data as the sole integral experimental basis for SBWR inview of the differences in configuration compared to the current SBWR design.
While the physical configuration of GIST is representative of the 1988 SUWRdesign. GE considers that GIST provides GDCS performance data suitable forTRACG qualification. The basis for this statement is given below.
The principal difTerence between GIST and the current SBWR design is thatthe GDCS pool is a scparate entity in the dywefl instead of being a part of thesuppression pooL This difference notwithstanding. the test capturcs theinteractions betvween multiple regions represented by the reactor vessel.drywell and wctwell. The interactions between RPV depressurization and theGDCS are properly represented. The scaling study in Appendix B ofNEDC-32391P demonstratcs that the major parameters governing.depressurization rate and driving heads for GDCS flow are preserved. eventhough there are differences in the configuration of GIST from the currentSBWg design
Testing in GIST is intended to simulate the late blowdown/early GDCS phase ofthe LOCA transient (Fig. 5.3.1 of NE2DC32391P). and thereby provide data forTRACG qualification of GDCS performance. The parameters of primary interestare: System pressure response which determines the timing of GDCSinitiation, GDCS flow and RPV level response.
No scaling distortions have been identified in the significant phenomenawhich would preclude the use of the GIST data for their intended application
It should also be noted that the GIST data are supplemented by data from other
BWR LOCA integral test facilities (TLTA. FIST) for the early part of theblowdown.
.1,_, ~ ~~~~ ~~ - - ,F.. . . . . ._ . .
'__~~~M I P j. :__ - -," l, l •••• -• • . .'HI Am"' "n "-

II IT'E
LLWIAbsence of components/systems that could interact (IC, PCCS)
GIST simulates the limiting LOCA transient without credit for the IC. No credit.bs taken in LOCA analysis for the IC.
Analysis shows (NEDC-32391P, Appendix C) that the IC increases theminimum water level for the limiting breaks (bottom break and GDCS linebreak). For the steam line and fecdwatcr line breaks, the minimum water levelis lowered due to void collapse. However, for these breaks the minimum waterlevel is several metcrs above the top of the core and the impact is not significantto safety. Furthermore, postulated intcractions between the IC and DPVresulting in flow reversal in the IC and subsequent reduction in thedepressurization rate arc shown not to be possible (NFEDC.-329P, Appendix C).Thus, the overall impact of the IC is to increase the margins for the liltingbreaks.
Because a relatively small fraction of the drywcll to wctwell flow passesthrough the PCCS in the blowdown period, the POCS has a minimal effect onthe drywell pressure anid GDCS flow(NEDC-32S39P, Appendix C). The absenceof a.PCCS in the GIST test' has little or no effect on the vessel a-ansicnL
Interactions between the PCCS and GDCS are important in the containmentduring the GDCS phase of the transient in that they can result in vacuumbreaker opening. This leads. to a return of the noncondensibles to the drywcUland subsequent recycling through the PCCS. Tests arc planned in PANDAPhase 2 to address these interactions.
Insufficient characterization of GIST facility theinial hydraulic behavior
GE agrccs that calibration data on pressure drops and heat loss•s would bedesirablc. However. the data arc adequate for the intended application.For the TRACG calculations, the pipes, valvcs, elbows and orifices were treatedas standard hydraulic components. The pressure drops arnd pressuredistributions werc calculated based on handbook published losI coefficients(Idelchik, Crane). Based on these assumptions, TRACG. calculated the GISTtransient response satisfactorily. This confirms the previous good expcricncewith this approach.
Critical flow through the SRVs and the break is based on the minimum flowarea. The TRACG model for critical flow, which has been qualified over a wide
rangc of dam (NEDC-32891P, Table 5.1-4) was employed for the calculation ofcritical flow.
.5 -. - --•• _ • -- _

U
Heat losses were calculated based on reasonablc analytical values for thenatural convection heat transrer coefficient. A scnsittvity study on the heattranfer coefficient (variation of heat loss by a factor of 2) showed very littlesensitivity to this parameter.
Lack of a quantitative scaling study
A quantitative scaling study has been performed and is provided in.NEDC-32391P, Appendix B, Attachment BI.
Requirement for additional data from PANDA to be included as part of thetesting for design certification. Details of the test matrix and facility scaling tobe provided to the NRC
GE agrces that PANDA data will be used as primary data for TRACGqualification. The test/qualification matrix and facility scaling are provided InNEDC.3239IP.
Requirement for Isolation Condenser performanc. data from PANTHERS to beincluded as part of the testing for design certification. if credit is taken for theIQ.
GE agrees that PANTHERS thermal hydraulic perrormancc data will be usedfor TRACG qualification. Thu test/qu.lification matrix and facility scaling are.provided in NEDC-32.91P. While no credit is taken for 1Cs in LOCA analyis.interaction studies have shown no deleterious effects if IC% were to operate(NED.-32391P Appendix CQ.
Requirement for data demonstrating PCCS performance in the presence of lightnoncondcnsible gases in an integral system test.
A combination of tests and analysis addresses the effects of lightnoncondcnsibles (hydrogen) on the PCCS performance and containmentpressure.
One'of the major concerns underlying the light noncondcnsible gas issue isthe capability of the PCCS to restart after the dr)wdU and PCCS have bcen filledup with noncondensibles. A Noncondensible Blanketing Test .(M) is planedin PANDA Phase 2 to address this issue. Whether the noncondensible gas islighter or heavier than steam does not make any difference for thiidemonstration, because it shows that the PCCS can purge the noncondensibles.
04-
I
11 1 - I M I I - -

0
At a component level. tests will be performed at PANTHERS to dctcrminc thecffcct of helium buildup in the full scale PCC units. With the vent blocked, thehelium will accumulate in the PCCS, and the distribution of helium and theeffect on heat removal capacity can be determincd.
A helium system response test program in GIRAFFE has been added asdescribed in the response to RAI 900.67.
The cffcct of the hydrogen resulting from 100% mctal-water rcaction on theintegral system response can be bounded through calculations.
LEMAvailability of experimental and facility data for tests run by others for GE(GIRAFFE, PANDA. PANTHERS).
GE will continue to provide the requested information or provide NRC access tothe test facilities and/or test performers.
Requirement for documentation of testing program in conformance with10CFR52.47 in Section 1.5 of SSAR.
GE agrees to include a summary of the testing program in SSAR Section 1.5
and/or a reference to NEDO-32S91.
Need for additional test in properly scaled integral test facility.
A systematic study of test and analysis needs has been performed in NEDO.32391P. A need for additional testing has been identified in PANDA for specificint-ractions between the GDCS and PCS in the GDCS phase resulting invacuum breaker openings, for interactions with ICs, and to demonstrate PCCSrestart when filled with noncondensible.
( Tests MS - M9). ThIse tests have been added to PANDA Phase 2 testing.Scaling of PANDA is judged to be adequate for its intended purpose and isaddressed in Appendix B of NEDC-32391P.
The GIST tests are adequate for validating vessel performance during the lateblowdown/'arly GDCS phase. Here there arc fcw uncertainties and largemargins to core hcatup. The overall covcrage of the LOCA transient by theintegral tests is shown in Figure 5.S-1 of NEDC-S291P.
I
. 5-

. 0
RAY Number 900.67
Questdon:
GE's July 1. 1994. letter (MFN No. 087-94) states that GIRAFFE tests weredevelopment tests and GE intends to use GIRAFFE data to substantiate the resultsof PANDA and PANTHERS at another scale. Contrary to this position,.NEDC.32391P, "SBWR Test and Analysis Program Description," indicates thatthe helium test data from GIRAFFE are to be uscd as part of the TRACGqualification effort. GE needs to clarify the use of helium test data from .GIRAFFE vi-iw-vis the position on GIRAFFE data stated in MFN No. 087-94, inparticular:.
(a) Is the GIRAFFE helium test the only one, or are there plans for otherhelium tests, in GIRAFFE or in another test facility?
(b) If helium test dam from GIRAFFE only is to be used, how will GE resolvethe quality assurance conc.ern raised by the staff on other GIRAFFE testsduring itsJune 21-23, 1994; inspection?
(c) The recently conducted GIRAFFE helium test contained only helium.Explain whether future tests will be more typical of post-accidentconditions, include a combination of helium and nitrogen. In addition,the test duration should be based on observing at least one purge and uran-sient back to steady state operation of the Passive Containment CoolingSystem (PCCS).
GE Response.
(a) Since the submittal of NEDC.32319P in mid-August. GE has been pursuingnegotiations with Toshiba Corporation regarding additional iielium testingin GIRAFFE. These negotiations have recently been concluded. As aresult of this agreement, reference- to the existing GIRAFFP helium testwill be removed from NEDC-32391P. and a new test program will beperformed in GIRAFFE specifically to address the staff's concerns relativeto lighter-than-steam non-condensable gasses in the SBWR. Facilityconfiguration and instrumentation will be similar to the GIRAFFE Phase 2Main Steam Line Break tests. The test objectives of the GIRAFFE HeliumTest Program are:
1. Provide data that demonstrate the effective operation of the passivecontainment cooling system with the presence of a lighter-than-steamnon-condensable gas. and
2. Provide data for qualifcation of containment response predictions byTRACG in the presence of lighter-than-steam non-condensable gases.
.6-
I
*1

Four test conditions will be included. Test Condition HI will be a base casewith nominal initial conditions the same as in PANDA tests MS and M4,e.g.. near SBWR SSAR LOCA conditions one hour into the accidentscenario. The drywcll will contain a mNixture of steam and nitrogen at atotal pressure'of approximately S00 kPa. Test H2 will be a nominal repeator test , but with a helium replacing the total volume of nitrogen in thedrywcll and PCC.S. Test HS will hav'c the same total initial drywellpressure as tests Hl and H2, but with the initial non-condcnsabtc .actionconsisting of helium / nitrogen mixture having the same proportions thatwould result from a 100% SBWR metal water reaction. Test H4 will startwith the same initial conditions as test HI. (nitrogen and steam in thedrywell). and will have constant helium injection to the dryweli. Thehelium addition rate will be such that the helium is injected over a periodof one hour, and the test will be terminated when the total mass of heliumadded is equal to the initial drywell helium mass in Test HS. The test will.bc continued to observe the venting of any residual helium from thedrywcll following termination of helium injection. '
System response from the four tests will be compared with each other toestablish the effects of lighter than steam, or a mixture of lighter-than-steam and hcavicr-than-steam non-condensables, on the eflectiveness ofheat rcjection by the POC hcat exchanger. Specific test conditions arecurrently being finalized. No other helium tcsting in a facility other thanGIRAFFE is planned
(b) The new GIRAFFE HELIUM tests described in response to item (a), above.will be pcrfomed by Toshiba in accordance with '.,apancse NationalStandardJEAG-4101 (1990 Rev.) GE has reviewed this standard, andconcluded that in all important aspects. it meets the intent of iOCFR5oAppendi: B and ANSI/ASME N4k-I. (198S). GE requests that the staffreview this standard for this application, and concur that tests performedunder it arc acceptable for the application of this data to the SBWR.. GEeffort supporting the new GIRAFFE testing will be performed under ourown, NRC accepted. QA program.
In addition to the four GIRAFF Helium tests described in Response (a).Toshiba will also be performing a repeat of the GIRAFFE Phase 2 Main.Steam Line Test, one of the two tests described as GIRAFFE Data Group G.9in NEDC.32391P. This test will be performed using the above qualityassurance requirements, and will be performed in order to reinforce ("ie-back!) the validity of previous GIRAFFE testing with the NRC staff.
(c) We believe the GIRAFFE Helium test program as defined in the responseto item (a) is rcsponsive to the staffs comments as elucidated in this item.
N
*1

RAI Number 900.68
Question:
Both the staff (during a meeting with GE on August 18. 1994) and the ACRSThermal-Hydraulic Phenomena Subcommittee (during a meeting on August24, 1994) have expressed concerns regarding test instrumentation. In general,GE seems to place dependence on a limited number ofrpressure-temperaturemeasurements, and then back-calculate any local conditions of interest.Specifically. the staff is concerned with:
(a) lack of direct local heat fluxes in the PCCS heat exchangers,
(b) lack of direct measurements of the pressure and/or noncondensable gasdistribution along the PCCS heat exchanger tubes,
(c) lack of direct mcasuremcnts of local concentration of noncondensablegases.
Address the above concerns regarding adequacy of test instrumentation forPANDA and PANTHERS.
GE Response:
(a) SIET Document 00157ST92 Rev 1. transmitted to the NRC by MFN No.086-94 datedJune 30,.1994, in response to RAI 950.24, addresses theinstrumentation specifically added to the PANTHERS PCC hcu exchangerin order to address the ACRS concerns on local heat flux measurement.Figure A.2.1 of the SIET document shows the location and type ofinstrumentation for local heat flux measurement.
Briefly, 72 thermocouples were added to the PANTHERS testinstrumentation to address the ACRS concern. Four PCCS tubes, located atdiffering locations within the tube bundle, have been instrumented at nineelevations each. Thermocouples are located on the inside and the outsideof the tubes, so that local heat fluxes may be calculated from thetemperature difference across the tube wall The algorithm to be used indata analysis is given in SIET document 00098PP91 Rev. 1, transmitted tothe NRC by MN No. 098-95 dated August 16, 1994.
(b) It is true that there are no direct measurements of the pressure or non-condensable gas concentration along the PCC heat exchanger tubes. Wehave evaluated this situation, and determined that such measurements arenot necessary to determine the location within the tubes wherecondensation is taking place. Temperature measurements along the PCCStubes were used successfully in GIRAPP to determine the location of thecondensation process within the PCC heat exchanger tubes, and review of
U
-8-"
• / -- - - ._ -: . ..-,.w-- ---- . .. -- ,•- I-- -- _Ir,- .-. N1- - -. . I._ _'1 = _ -- - 4- a .a - •

Iinitial PANTHERS data likccwis has confirmcd this capability. Pressurediffcrcnce mcasuremcnLs between the upper and lowcr headers of thePANTHERS PCCS have indicated very low pressure drop through theunits,
(c) In PANTHERS, which is a steady state experiment, -both the air and steamflow to the heat exchangers arc measured, and controlled as anindependent condition of the expcriment. GE has also committed toprovide local non-condensable measurements in the PANDA drywell.Our.currcnt plan is to determine the non-condcnsable concentrationdistribution by use of a combination of temperature measurements andoxygen sensors located at several locations in the PANDA drywell.
.gB

I I. * 0 A -: . I... : . . ., :. .-'. . ' ...*.* ..I.;. . . .-_ ,--, : .; . ; U-... I-.I. .
RAJ Number .900.69
Question:
Adequacy of scaling. phenomena level versus systems interaction: During ameeting regarding the SBWR test and analysis program on August 24, 1994,the ACRS Thermal-Hydraulic Phenomena Subcommittee expressed concernsabout whether preserving parameters like gravity head and local friction lossesis sufficient to model an integral system behavior. For example. having a "talland skinny" test facility may affect the 3-dimensional distribution ofnoncondcnsable gas, Another example is that inappropriate modeling ofglobal inertia terms may distort-the integral system responses. like pressureand water level oscillations. In the scaling analyses, did GE include these"integral" or "global" effects?
GE Response:
GE has included these effects, as noted below:.
Scaling of the Global Inertia Terms in the Momentum Equation
In the top-down scaling analysis presented in NEDC32288 (Section 2.3). thetransfers of mass driven by pressure differences were considered using themomentum equation integrated over a segment (piping) length. A-rigorousanalysis.led to Eq. (2.31) of NEDC-32288 where a number of non-dimcnsionalgroups appeared..The non-dimensonal number multiplying the rate of changeof the velocity is Ml'n (Eq. 2.32 of NEDG32288),
l'li. : Ap°
which scales the inertial pressure drop with respect to the reference pressuredrop. Considering the transit time of the fluid in the piping. Pin can bereplaced by an alternative form. Eq. (2.37) of NEDC-32288,
ApP
and the ratio of the equivalent inertia to volume lengths, LIlLv. Eq. (2.42).
Lvat
- 10o

- EIIinIII[! EU L! I I
The inertia number and the ratio LI/LV were considered in Appendix B ofNEDC-32391P on Scaling Applicability (Tables 111-9 to BI-1 I for GIST; B1-22 toBI-27 for GIRAFFE; BI-9 to BI-46 for PANDA). The LI/LV ratios of theprototype and of the various experimental facilities are matched reasonablywell. Although the experimental facility components often have different linvalues than the ones of the prototype (due to difference.% in the flow velocities inthere components). this is a very minor scaling distortion, since the relativeimportance of the inertial pressure drops with respect to the systcm response isvery small. Inertial pressure'drops can reach significant magnitudes onlyduring ramid xystem transients when vclocities change abrupty: this is not thecase during SBWR transients. except during the very first moments ofdepressurization. (Rapid velocity changes may take place during certainspecific phenomena such as chugging; the scaling of such particular effects isconsidercd in the bottom-up analysis. Inexact scaling of .o.1 phenomena suchas chugging is not expected to affect overall system behavior.)
Moreover, the scaling analysis of NEDC-S2288 produced three time scales,
(vo, s-,. and vr), which scale the rates of volume fill, of inertial cffects. and ofpipe transrcrs. respectively (Section 2.4). Clearly, the systems considered hereare made of large volumes connected by piping of much lesser volumetriccapacity. The inertia and transit times, which are of the same order ofmagnitude, are much smaller than the volume fill times:.
•o >>, -r -C•
as shown in the NEDC-32S91P tables mentioned above. It was concluded that thetime scale that is controlling system behavior and therefore must be consideredin scaling the system is to. The other two time scales (controlled by thegeometric characteristics LI and LV of the piping) arc clearly of minorimportance.
Tbrec-Diiezzsional Effects
It is evident that 8D effects cannot be simulated exactly in experiments wherethe aspect ratio of the system is necessarily distorted (to preserve the importantheights) tnd the complex SBWR volume gcometries arc replaced bycylindrical vessels. Mixing and stratification phenomena in the various SBWRcontainment volumes arc discussed in Section S.2 of NEDC-$2288, where it isshown that appropriate simulation of the discharge areas of components such asvcnts and vacuum breakers can preserve similarity of the phenomena.
The Grashof numbers of containment volumes controlling natural circulationare considered in Section B1-2.2.2 of NEDC-32S91P. For facility components thatare full-height, the Grashof numbers calculated with height as the length scalematch very well. Examples are shown in Tables 131-2, 11-28, and B1-47 of
ol1-
w

0
numbers based on these cannot be matched, but study or 3D effects was notwithin the scope of these tests. The horizontal dimensions of the. PANDAfacility approach those of the SBWR. Moreover, represcntation in PANDA ofthe Drywell and Suppression Chamber volumes by two large vesselsinterconnected by very large diameter pipes essendally provides two horizontalreference lengths: for example, the diameter of one SC vessel is close to thewidth of the annular SBWR SC pool, while the distance between the opposingends of the two SC vessels approaches that of the SBWR SC perimeter. Thus bothlength scales will be present in the PANDA model.
U
0 12.

I I
RW Number 900.70
Qucstion:
GE has identificd several sources of data that may be included in the SBWRdesign certification database, e.g., Dodcwanrd startup, boron mixing tests, andCRIEPI stability tests. For all of these sourcees (notjust those cited here), providedetailed documentation about the tests, such as facility design. scaling, andinstrumentation; test specifications and test matrices; and test data and analyses,Also, document specifically how GE will use these data within the test andanalysis program.
GE Response:
Section A.3.1.6 of NED0.32391P "SBWR Test and Analysis ProgramDescription' lists six specific sets of existing test data for which TRACGanalyses are being planned. Typically, this is non NQA-4 data, much of itseveral years old, but that can be used to illustrate TRACG capability to correctlypredict a specific parameter, PSTF containment data for as containment mainvent clearing during blowdown for example. Wc intend to use this data toillustrate the breadth of TRACG prediction capability and to corroborate themain body of SBWR data. The specific tests included are.
1/6 Scale Boron Mixing TestCREIPI Natural Circulation TestDodcwaard Plant StartupPSTF Mark IIIMark 1 - 4TSuppressions Pool Stratification - Mark II"
These data arc from tests in SBWR-like, but not necessarily SBWR. unique orscalcd gcometries. Since, in general, these are not SBWR unique tests, specificscaling to the SBWR configuration has not been performed, and were it to beperformed, it would result in the obvious; that these are not SBWR scaled tests.We do not plan to perform any additional scaling analyses for these data sets.
Typically, the phenomena addressed are very specific, and were added to theanalysis plan for additional confidence in TRACG's predictive capability. Ineach of the six cases identified, NEDC,42SD1 is very specific with regrd to runsto be analyzed, and the specific purpose of each of the specific comparisons tobe made.
References to specific test documentation.and the specific dam use are givcn inNED.42891P. The following are GE's comments on each of the six additiondata sets:
3IS-

IiEJUEIIhIWE~ I EVHliuI ] II
I /•l Sc1e rt~rron Mhixin•
This data was submitted to the NRC on the ABWR docket. The report includesscaling. facility design, test matrices, and instrumentation used.
Specific runs to be analyzed arc still being derincd. GE will have a detailedplan for these analyses by December 1. 1994.
CRIEPUN~turalCM •rct:ionont:
We recognize that additional information will be required by.the staff. GE willprepare a data transmittal on this fcility and the results to be used by' December1,1994.
Dodwmard Plant StartUp!
GE will provide the NRC staff with the test reports from the Dodewaard startmp.refcrenced in NEDC-32391P by October 15.1994. Reactor description andinstrumentation is included in the reports. Scaling and test mairix informationis not applicable in this situation.
The test report referenced in NEDC-32391P was submitted to the NRC as part ofthe GESSAR docket in 1973. Scaling (to the BWR-6 design), test facility dcsign.instrumentation, and test matrices are included in the report.
The test report referenced in NEDC-32391P was provided to the NRC under theMark 11 Containment Program in 197M Scaling (to several Mark II containmentconfigurations). testfacility design, instrumentaton. and test matrices areincluded in the report.
S uppresslon P0? Str~#rifletfon _- PStT!
The two reports referenced in NEDC-32391P were provided to the staff'in 1977and 1978 under the GESSAR docket. These reports are specifically dataanalysis reports from PSTF Mark III testing.
o!4-
..................................................-.. _.._.....
U

II.EIEIELIHIIIUE1VEIU I U Iii I I
RAI Number 900.71
Question:
Explain the rationale for excluding shutdown events and beyond-design-basisevents from the SBWR design certification test program. Shutdown eventsmust be cvaluated for the SBWR, and presumably will be analyzed using thesame computer code(s) used for dcsign-basis analyses. As far as beyond-design-bas3s accidents are concerned., the staff must determine the robustness ofthe passive safety systems to deal with events nominally beyond the designbasis (e.g., multiple failures) and the possibility of reliance on active. non-safetysystems to deal with the consequences of these events. Note: "Bcyond-dcsign-basis" in this context is no= equivalnt to severe accidents.
GE Response:.
Beyond-design basis and shutdown events were not explicitly considered forthe study that led to the definition of the Test and Analysis Program. Inresponse to this RAI 900.71, these scenarios have been considered and GEconcludes that they arc covered by the defined programs.
a) Beyond-design basis events:
GE takes this set of events to mean those event and equipment failurecombinations which arc defined by the PRA success criteria (Attachment19AA to the SSAR). In these events, core uncovery occurs but claddingtemperature remains below 2200 F. The dominant phenomena introduced inthese events (beyond the design basis evcnts) relates to core uncovcry for aperiod of time followed by recovery as cooling systems are restored. Thesephenomena arc already included in the PIRT tables (e.g., ClI, CIS, C14, C15,C24, C25). Tests which cover these phenomena include the TLTA boiloff test.and small and large break tests in TLTA and FIST. All these tests wereperformed with a simulated full scale BWR fuel bundle and cladding heatupoccurred over a range of temperatures and system pressures. TRACG has beenqualified against these tests with exccellent results (NEDE-32177P). No additionaltests or analyses arc needed to cover these events.
b) Shutdown events
Plant shutdown to thc hot standby condition is accomplished by bypassingsteam to the main condenser and through the use of the RWCU/SDC systemfor decay heat removal. The ICs can also be used for decay heat removalduring this phase of the transient. No new phenomena are introduced in thistransient, beyond those already considered. Cold shutdown is achievedthrough decay heat removal býy the RWCU/SDC system. If these systems arenot available; other core injection systems (e.g. FAPC), can be used for decay
- IS-
aI
I

-i
a
heat removal. One train of the kWCU/SDC system is suficiecnt to remove thedccay heat. but two trains arc cngaged for the first 8 days to keep the cold cegtcmpcerture of the RCCW at 950F. Again. no new phenomena are introduced.
• 16.
K
MOMi

J~UE1UinEF~1IIWT~~T
RAI Number 900.72
Question:
Explain how GE can rely solely upon analysis to resolve the issues of systemsinteractions during the early phases of transients and accidents, when there areessentially no integral systems test data either existing or planned that coversuch conditions during that time. Note that PANDA is not scaled to rcpresentthe early phase of SBWR accidents, and is incapable of representing the "worst-case" sequences for the SBWR., that is, bottom drain line and GravityDrivcnCooling System line breaks.
GE Response:
GE is not relying solely on analysis to resolve systems interaction issues in theearly phases of the LOCA transient; Figure 5.8-I of.NEDGS2391P illustrates thecoverage of various pordons of the transient by different integral systems tests.Section 5.5 of NEDC.SSSg;P discusses this figure. The systems interactionanalysis v=j performed to identify the needs for tests where systemsinteractions might be important. where possible adverse interactions mightoccur and where there could be uncertainties in the analysis. This led to thedefinition of the PANDA Phase 2 tests. It is true that PANDA does not have thepower supply capability to simulate the decay power at 10 minutes Into thetransient, and that the GDCS tanks do not have sufficient capacity to simulatethe full capacity in the SBWI. However, test procedures will be developed tominimize the impact of these parameters on the system transent response.This is addressed further in response to RAI 900.7$. It should be recognized thatthe purpose of these tests is to provide representative data for code validation ofthe key phenomena and interactions. Thus, in the early GDOS period of thetransient, the emphasis is on the interactions between the heat removal by thePCCS combined with the effects of steam condensation within the reactor andd'ywcll. The key phenomena related to drywel depressurizadon, vacuumbreaker opening, recycling of noncondensiblcs, PCCS purging and restorationof POCS performance will all be maintained even if there are scaling distortionsin tome of the parameter."
Incidentally, the bottom drain line break and GDCS line break arc limiting forthe minimum water level in the reactor vessel. In the PANDA tests, the fbocu ison the containment performance and the large steam line break is the limitingbreak.
-17.
aI II

RAI Number 900.73
Question:
Specify as precisely as possible at what time in the accident sequence thePANDA tests that are to represent the "early' phases of main steam line breakswill begin.
GE Response:
Although the detailed procedures for the PANDA Integral Systems Tests withan early start have not been completed, it appears that these tests (M7 and MS)can simulate the SBWR containment response to a steam line break as early as10 minutes into the transient.
At approximately 10 minutes into a main steam line break accident, the RPVpressure is calculated to have dropped to approximately 300 kPa and is nearlyequal to the drywell and wetwell pressures. The .PANDA vessels andconnecting piping have the capability to model this transient directly from this.time on except for the decay heat and the GDCS inventory addition to the RPV.
The PANDA power supply is capable of providing 1.5 MW to the electricalheaters in the RPV. The SBWR scaled decay heat at one hour after scram isapproximately 1 MW. The remaining 0.5 MW is available to simulate the RPVstructural stored energy for those tests beginning at one hour into the simulatedSBWR accidenL 1.5 MW matches the scaled SBWR decay heat atapproximately 20 minutes following scram.
The PANDA GDCS was designed to provide good simulation of the PCCScondensate drain discharge geometry and discharge conditions after drainingof the initial GDCS inventory to the RPV has stopped. Representation of the fullGDCS capacity.was not an objective'for the PANDA design. As a result, thecapacity of the GDCS is approximately 40% of the scaled SBWR GDCS volume.
The approach in PANDA for modeling the SBWR transients prior to one hourafter scram will take advantage of the fact that a significant fraction of theSBWR decay heat during this period is used to heat the subcooled GDCS waterwhich has drained into the RPV. By running the PANDA tests with a constantpower of 1.5 MW for the period simulated prior to one hour and adjusting theinitial conditions in the R•V and the Gc.CS, It is expocted that the test start timecan correspond closely to 10 minutes into the SBWR main steam fie break.
As stated above, the detailed test procedures for M7 and M9, the PANDAIntegral Systems Tests with an early start, have not been completed. For test.M7, however, the approach described above will provide data to demonstrate thePCC capability to start-up when it is initially filled with air and 11PV conditionsare representative of SBWR conditions immediately following blowdown. Fortest M9, the RPV and GDCS conditions will be adjusted to cause vacuum
-18-
U

I
breaker opcning and rcintroduction of air to the drwcll and PCC. Test MO.thcrc'orc, will demonstrate the POC startup capability if air is reintroduced tothe drywcll via the vacuum breakers early in the transient.

IRAI Number 900.74
Question:
PANDA tests will be initiatcd "on the run". therefore, a transient condition willbe establishcd which is intended to simulate a particular reactor transient. Howwill this be accomplished without significantly affecting the transient understudy?
GE Response
The initial conditions for the PANDA tests will be based on calculatedconditions in the SBWR at the time in the transient corresponding to the teststart time. For the transients to be simulated, the SBWR pressures, temperatures.liquid levels, and non-condcnsible gas concentrations which will be the basisfor the PANDA initial conditions are not varying rapidly with time. Therefore,establishing initial conditions based on the calculated values for these slowlyvarying parameters will not affect the test transient.
.20e
• . . . .2 1
m

U
RAI Number 900.75
Question:
The staff has previously requested detled test matrices for the PANTHERSIsolation Condenser (IC) tests. These have never been provided and theinformation in Appendix A of NEDC-32391P. "SBWR Test and AnalysisProgram Description," is not sufficicntly detailed (e.g., noncondensable gasconcentrations, test duration, test cycles, ctc.). Provide this information (brreview. In addition, address the concerns raised about instrumentation for"PANTHEMS PCCS testing (QPOO.68 above) for the IC tests.
GE Response:
The PANTHERS Test Requirements and Test Specificaton were sent to NRC inMFN 119.9I2, dated May 27. 1992. Rev. 2 of thi specification was Ut.smitted byMFN 101-94, dated August S1, 1994.

A-u-
%AU Number 900.76
Question:
The scaling analysis submitted with NEDC.32391P, "SBWR Test ,nd AnalysisProgram Description," is an improvement over previous documentationprovided by GE; however, additional work is required to demonstrate that foreach of the important phenomena identified in the phenomena identificationand ranking table (PIRT), the range of thcrmal-hydraulic conditions expectedin the SBWR is covered by one or more tests in the test program.
GE Response:
Data has or will be obtained for all of the phenomena marked 'High' in thephcnomena identification and ranking table (PIRT). The data comes from acombination of testing programs and plant data. The type of data used for eachphenomena is indicated by the test coverage matrix shown in Figures 5.5-5 and5.5-2 of the TAPD. Table I of this RAI includes the information in those tablesalong with scaling information on the phenomena. More detailed informationshowing specifically which test or tests are used to obtain data for eachphenomena is also contained in the tables in chapter 5.
Data for some of the Parameters havwe been obtained from operating BWR's.Therefore the data will be over the same ranges as expected in the SBWR.Additionally, data from BWR simulator facilities such as SSTF, TLTA, FIST,PSTF and the Boron Mixing Facility have been used. These facilities weredesign to simulate operating BWR behavior for accidents and transients whichare very similar to those for the SBWR. A description of each of these facilitiesis included The TRACG Qualification document, NEDE-32177P. Rev 1. Dataobtained from this category is marked in the "BWR facility" column of Table 1.
In addition, for those parameters that were considered to be.particularlyimportant. a detailed review of the test data and ranges used for coverage wasperformed. This information is contained in the Qualification Data Base (QDB)that supports the TAPD. Table 1 indicates which PIRT phenomena arereviewed in the QDB. Phenomena that is covered by data from GIST,.GIRAFFE, PANDA or PANTHERS has already been scaled mi Appendix B ofthe TAPD. These phenomena are indicated by checks in the "S-aled in App. BWcolumn of Table 1.
.22"
" " .... .. . .. • _ • :• " " •

U
Table I. PIRT phenomena data coverag-
Test Coverage Scaling
- 7 -
PIRTI Phenomena Issue IAl ILP flashing Lredistrlbution :_I X I X _ I_ X I xAg LP heat slab stored enoEgy X x x - x kAS Inlet orifice uncovery _ j X xA4 LP void fraction x x X )
AS LP void collapse/inlet sube. X X X I x xA9 LP stratification X X X I _ xE81 Byss flashig x x xI _ x82 Bypass level x A x! I I4 CCFL at bottom of byp2ass . I X I x
BS iCCFL at top of bypass x x I x186 Channel to bypass leakal-g . X x x :67 yposs. rfill I x x x,"IAX aVoid coefficient - : _X
C1M IDoripler c~oefficient ,, XCl1X JScram reactiviy x
C2AX Interfacial shear and h.t. x _ X x __x_
C28X Subcooled bolfLna x_ x x I X._
.10M Fuel pallet powerds. x x
C3CX Fuel gap conductance x II04 Core flashing. __ xi _ _
CS Inlet orifice uncovery . E . I06, Inlet orifice C•FL X I X_ _
0 _ Upper top late CCFL __ _X_ J
CS Multlbundfo flow dist. X__ _ _x _
CX jomre vold colapse x I x I010 -Core void distributlon I X 1 .Oil Channelto. ss leakage __________
012 Natural circulation flow . . . i- ' - i013 D yout/boillr , transition J. _ :, ___ _'
014 Film b,,,in.low flow ,iFilm_. -,
U
W nil q I

Table 1. PI.T phenomena data coverage (cont'd)
Test Coverage Scalig
Pm'J0Phenomena Im I[ 015 tFilm bol(ng (d5Lp. drop.) x. I x I XC23 Core pressure drop x x x - xxC24159eay..heat x.x IxC25 Fuel s!orod energy _ _ X_ X x026 CItdial_power for 9 It -core I X XI
Pl GTflashing - x. x . x02 CCFL at top of GT X- X A
04 ROflof, GT .. X - .x_ XEl ;L break uncovey xx xE2 ID C void prof11 x x x _ xM GDCS Intemction _._X xES 0 C heat slabs I X1 X__ -I XE8 _ C sha ,.I x I x I
EV IC interactionE§ DO breakiflow ......... x X1
F i Chimney void distribution . X 1 x
P2 Chimney flow distribution _ X X•4 ~M ig at togo! chlmney• . _-
12 Svaralor Inertia ,, X13 Separator pressure drop _ -
LIX Stoamjl pressure drop x_ _ x_L2X Steamline acoustic effects _______ XXL.. SRV/DPV critIcal flow x x xL2 ODroplet entrainment _ X x X X13 TnIton to unchokod flow X x _
1. Muipie..choked locations x I X ,
e0 pICressure d•o .1, . •1 -X -

m
Table 1. PMRT phenomena data covcmgc (cone'd).
Test Coverage Scaling
"I jfi I,"tm
PIRTJ0Phanomena Issue ii ii03 Stratification In IC drums X X X04 i pnool stratifnab•twen IuX1tipes [Secondery side heat transfer -- x I---
S"1' "Hy~drod.g •'rpbI!YX IX
tfg - orewldo stability x
MRegl__onal stability w xATWI Boron mixm n b.Lnb3 ss__._.
, TW Boron sttifricatlon to LP - X._TW_ Boron delFvery 1o Core X I X
'_Interaction between multiple.1 _IC modules and units x I
System interaction -GooCs/ystemn
W1 • epfessurdzation K KCONTAINMENTM._ Breao.k mass flow Critical flow xxx xII
Fridction x X __ I I__Entrainment xx___x I x IIx
IV1 Main vent flowcIrcuationMV3 Vent clearing, time I.. ...
Sol SRV flow x IXDWI lFlashing/pysaporatin in DWDM Condensation on DW walls I x__
Doegradation of conduction x I xiIS Wall/Structure conduction xx
PhaseDWS 3-D effects distribution Ix-
Ill"--"Nonco ndensableSs distribution xx
!Buoyancy/naturalcirculation -I- X Itlxn.
I muý a I I 1112a UP W I 120MIMMM - --a

U
Table 1. PIRT phenomen data coveruge (conted)
Test Coverage Scaling
PI Phenomena rIssuet tCondensation on reactor Interfacial Heat
DW4 outflows Transfer I JDegradation by
__we_ x _ xx
Con'densation/evaporation Interfacilal Heat
WW1 of main vent discharge Transfer _ X X xDegradation byN/C x x
Condensatlon/evaporation Interfacial HeatWM of SRV dischaoe Transfer . X X
Condransatlon/evo.poratlon Interfaclal HeatIW3 of PCC vent discharge Transfer -X_ x X -
Free surface condensation/ Interfaclal HeatW4 evaporation Transfer _ X _ -
eDegradation byN/C X X X
Condensation oVWS Heat sources/sinks WWwafs t_ X X X x
Conductionthrough WWwails X x X xDegradation byIN/c _ A x X. xBouyancy/natural
WWO Pool mIxina and stratifiation circulation - X X __ XTemperature
WW7 3-0Delfects In gas Opace distribution _ X _ _ Xnoncondensabledis tribution - X
Interfacial shear., x x
U
.. . ° , .. ,..
I Im- IBM 5ýý I I IN

Table 1. PILOT phenomena data coverage (contdd)
Test Coverage Scaling
TI
PIRT ElPhonomena Issue IMixing,entrainment
*-IntJo ts xX
Bouyancy/natural circulation x X
separation IxContainment spray InterfacilL Heat
WM condensation Transfer 1X1, __ X<Degredatlon by
Containment hydrodynamicWW9 loads Pool Gwen XIX x
Condensation J,_oscillation X
' Chgg I X- x
.--- _--_SRV Dlschrge X lGDCS flow X x
PCI PCC flow/Dressure drop _X X XCondonsation on primary
P2 side Interfaclal H.T. X x X x xDegradation by.
_ _ _ _nlc X X X XX
Shear._ _._ Enhancement _
P $O Secondary side heat transfe Pool temp. dis. X x x X
______Poo . void dIst. _ X1 X _ xj
Naturalcirculation - :_ xl!
II lima I gin I I
!

0
Table 1. PMT phcnomena data coverage (contd)
Test Coverage Scallng
~Ii
PIRTR#Phanomrnar Issue__- - .
Secondwy side........ .. entraIrment X X X X
PC4 Parallel PCC tube effects Friction X X X X
Vold fraction X X I X X
P0_ Parallel POC unit qtects Friction X X X X
Vold fraction X_ X X XPCC Ian component
P__.s •aratlon ., XPurging by
P0s PCCS startup with n/o aresssure dilff..X X XDegradation byN/C I X _ X 1X
Leakage between drywail IOWB1 and wetwell lIxX I X x
Vacuum breaker flowVB1 characteristics x X
EQI gaylizatfon ine flow X xEM Equalization line slosh!M x IXI
Heat transfer to safety1001 oenvelopeDPVj Mass Hlow In DPVs Critical flow_ X
_Friction I XEntrainment I_
Containment liner gapLW' conductance
Concrete properties at highCW2 temrporatur_ X ,
- I A-
a
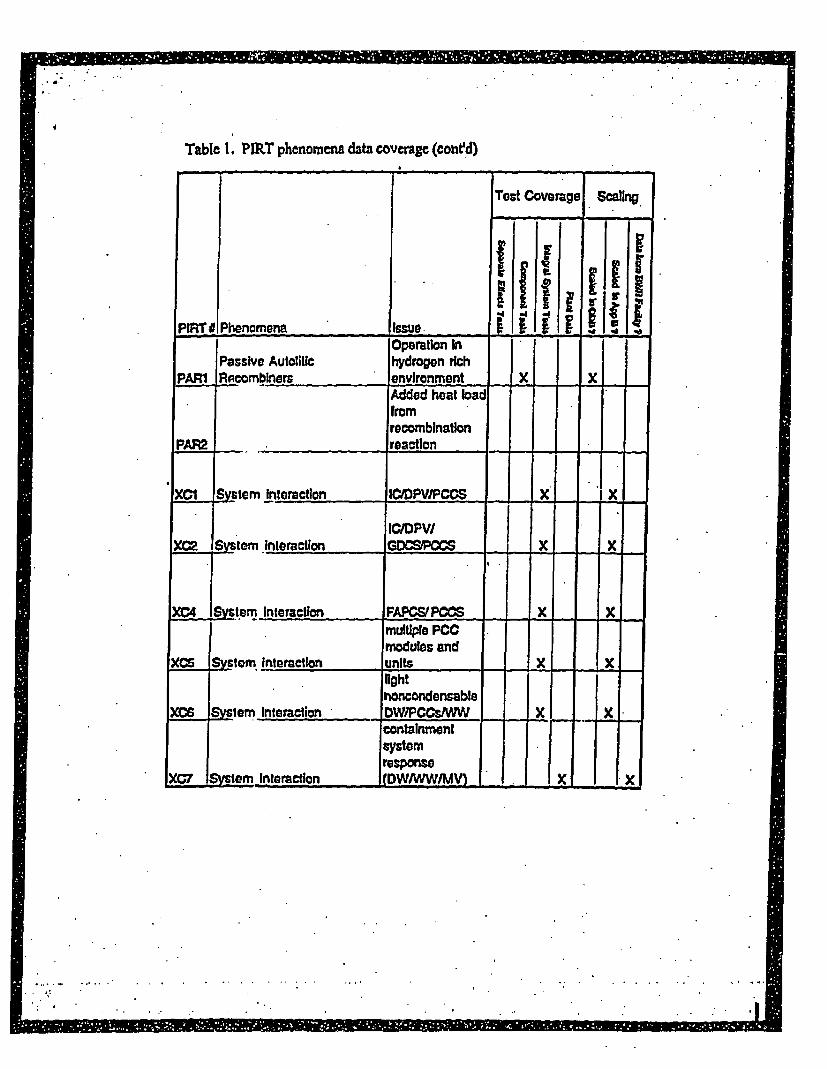
Table 1. PIMT phenomena data coverage (conrad)
Toet Coverage' Scalng
IIplflTNlPhenamena ise
Passive Autolitic hydrogen richPARI Rscombiners environment I x I
SAdde heat badfromrecomblnatlon
PAR2 ____ _reaction
XCI ySytem Interaction ICPV/Pcos _X x
lCIDPV/Xc2 S term Interaction GDCSM= _ X
XC4 Systenm Interaction FAPCVPCM _ -
multiple PCCmodules and
XCS System interaction units Xflghtnoncondensable
O, Sstern Interaction DW"PCCSM? _ W
containment
X07 System interaction I(DW/WW/MV) 5 1x.

RAI Number 900-77
Responses to the stafIs prcvious requests for additional information (April 11,1994) are also nccdcd to dcterminc thc adequacy of NEDC.3291P, "SBWR Testand Analysis Program Dcscription." Of particular intercst are responses toS01.23 through QO01.27.
GE Rýsponsc:
Responses to the refercnced RAls havc been sce in to the NRC by letter MFN096.04, SUBMMTTAL OF ADDITIONAL INFORMATION ON LICENSINGTOPICAL REPORT (NEDE-32177P and NEDE-32178P), dated September 20, 1994.
_U
!

I
I
RAd Number 900.78
Queston
The SBWR is unique from the standpoint of suppression pooI thermal capacity.It is designed only for the first hour of decay heat energy, unlike previousdesigns which could accommodate all of the decay heat encrgy. Therefore,discuss the interactions expected between the PCCS and the suppression poolduring transient periods such'as PCCS purging, return to. steady state operation,and vacuum breaker opening. Specifically, discuss the potential of opening themain vents for short periods. thereby sending mass and energy to the pool andpossible instabilities as seen in the single tube condensation tests at theUniversity of California (Berkclcy). This discussion should rely on test data asmuch as possible.
GE Response:
The statement in this RAI that the SBWR dcsign is unique from the standpointof suppression pool thcrmal capacity is incorrect. All BWR pressuresupprission pools are sized to accommodate the primar system blowdowa-cnergy. None of the suppression pools in existing GE pressure suppressioncontainment types are deigned to accommodate all of the decay energywithout resort to some other energy removal system. In the absence of such asystem, the pool will continue to heat with time as decay energy is added.
In earlier containment designs, the suppression pool temperature is limited byoperation of the pool cooling mode of the Residual Heat Remov•l (RHR)System. The suppression pool absorbs the blowdown energy prior. to operatorinitiation of RHX Energy addition to the suppression pool continues by flow ofdryell steam (generated by decay heat) through the main vents, and energyis removed from the pool by the RHR system to the ultimate heat sink. Thepeak pool temperature is cstablished by the relative rates of energy addition andextraction. Typically. a maximum pool temperature near 190 degrees F occursabout 6 hours into the accident scenario, when the RHR heat exchanger delta Tis sufficient to remove energy at the rate of energy addition to the pool fromdecay heat. The suppression pool temperature then slowly decreases as thedecay energy addition decreases.
In the SBWR the situation is similar. During the blowdown period, thesuppression pool absorbs the majority of the primary system energy, althoughthere is some energy extraction by the PCCS. Depending on the break scenario,the blowdown period lasts &rom about 10 to 30 minutes. Following.blowdown,GDCS reflood of the vessel causes subcooling of its fluid contents, and ittiesteaming occurs until about I hour into the accident scenario. At this time, the?CCS is capable of rejecting all of the decay heat. In this way, the PCCS isanalogous to the RNA system.
S. 24-

H %
A critical clement of SBWR design is the PCCS heat exchanger ventconfiguration. The PCCS vent exits into the suppression pool at a shallowersubmergence than the top main vent. This geometry is important, because theSBWR pressure suppression containment, like all earlier containments, is aforced flow, pressure driven system. not a temperature driven naturalconvection system. In all pressurc suppression containment systems, mass andenergy arc added to the drywell from the break in the primary system, and thedrywcll pressure increases. The pressure will continue to increase, loweringthe water level in .the vent system, until a flow path is established between thedrywell and the wetwelL The wctwell pressure is set by the thermodynamicconditions in the wetwell, including partial pressure of the original wctwell air(or nitrogen in the case of the SBWR), the partial pressure of the air purged overfrom the drywell to the wetwell air apace. and the vapor pressure of steamcorresponding to the suppression pool surface temperature. Once the vents havecleared, the drywell pressure is equal to the wctw•ll pressure, plus thesubmergence head or the vents, plus any flow head losses in the vent system.There would be flow from the dr)vell to the wetwcll even if there arc onlynon-condensable gases in the drywcll. (In fact, some of the containmenttesting performed in the 1970's and '80's was performed with only non-condensablcs.) Once sufficient mass and energy arc added to the drywell sothat the vent submergence head is overcome, flow will occur. This holds truewhether. the flow is through the main vents, or through the POCS heatexchangers
Early in the LOCA scenario, mass and energy addition rates into the drywellfrom the primary system arc larger than. the heat removal capacity of the POCS.During blowdown, the drywell pressure is such that both the P= vent and themain vents are cleared, and flow goes to the suppression pool via both paths. Asprimary system steaming decreases, the drywell pressure will decrease,eventually allowing the top main vents to re-flood and flow to the suppressionpool will stop. Flow will still occur, however, through the P0C heat exchangerand POC vent. It is the difference in submergence between the main vents andPOCS vent that preferentially directs flow through the heat cxchanger, andshifts the primary LOCA heat sink from. the supprcssion pool to the PCCS pool
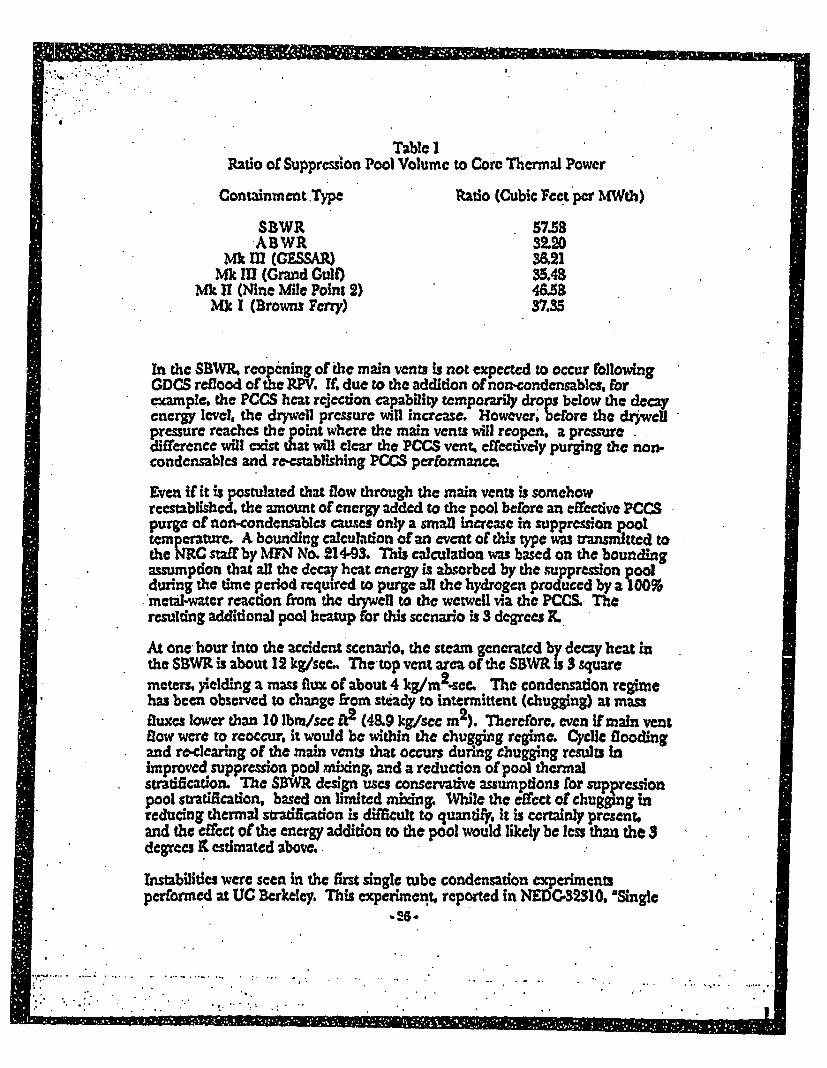
Table I illustrates both the similarities and differences in supprss ion pooldesign as containment configurations have evolved. This tblc give the ratio ofpool volume to core rated thermal power. Both blowdown energy and decayhat are a direct function of core rated power. Thus the ratio of pool volume tocore thermal power is a direct indication of the suppression pool's ability toabsorb the total primary system accident energy. The. value given for theSBWR is the highest of all the containment types listed. Thc design is veryrobust. The relaively high value of this parameter for the SBWR is the result oftwo factors, (1) the potential for thermal stratification in the SBWR tuppressionpool, which has no safety grade system capable of mixing the pool, and (2) therequirement that the pool absorb both the blowdown energy and that smallfraction of the exce•s decay energy that is released, until the system iscapable of assuming the full load at about one hour, .
l gN.
U
Table IRatio of Supprssion Pool Volume to Core Thermal Power
Containment.Type Ratio (Cubic Feet per MWth)
SBWR 57.58-ABWR 32.20
* Mk M! (GESSAR) 36.21Mk IIl (Grand Gulf) 35.48
Mk It (Nine Mile Point 2) 4M8.Mk I (Browns Ferry) 37.35
in the SBWR, reopening of the main vents is not expected to occur followingGDCS reflood of the RPV, If. due to the addition of non-condensables, forecample, the PCCS heat rejection capability temporarily drops below the decayenergy level, the drywell pressure will increase. However. before the dr¢wellpressure reaches the point where the main vents will reopen. a pressuredifference will exist that will clear the PCCS vent, effectively purging the non.condensables and re-establishing PCCS performance.
Even if it is postulated that flow through the main vents is somehowrecstablished, the amount of energy added to the pool before an efective PCCSpurge of non-conder.a.blcs cau.es only a small hicrease in suppression pooltemperature. A bounding calculation of an event of this type was tansmitted tothe RJC staff by 9N& No. 214-93. This calculation was based on the boundingS assumption that all the decay heat energy is absorbed by the suppression poolduring the time period required to purge all the hydrogen produced by a -O07metal-water reaction from the drywell to the wetweil via the PCCS. Theresulting additional pool heatup for this scenario is 3 degrees K.
At one hour into the accident scenario, the steam generated by decay heat inthe SBWR is about 12 kg/sec.. The-top vent area of the SBWR is $ squaremeters, yielding a mass flux of about 4 kg/m 2 -scc. The condensation regimehas been observed to change fror steady to intermittent (chugging) at mass
flxslower than 10 bmscft2 M gscm). Therefore. even if main. Vent
flow were to reoccur, it would be within the chugging regime. Cyclic floodingand re-clearing of the main vents that occurs during chugging results inimproved suppression pool mixing, and a reduction of pool thermalstratification. The SBW1 design uses conservative assumptions for suppressionpool stratification, based on limited mixing. While the effect of chugging inreducing thermal stradficadon is difficult to quantit, It is certainly present,and the efect of the energy addition to the pool would likely be less than the 3degrees K estimated above..
Instabilities were seen in the first single tube condensation experiment$performed at UC Berkeley. This experiment, reported ir NEDC-32310, "Single
L
I

-41
I
Tube Condensation Test Program", was performed -in a natural circulation loop.Subsequent single tube experiments utilizing forced circulation loops, includingtwo experiments at UC Berkeley and two at the Massachusetts Institute ofTechnology. have not shown any evidcnce o( flow oscillations or instabilities.Thermocouple instrumentation of the heat exchanger tubes in the PANTHERSexperiment (see rcsponse to WAJ 900.68) make it possible to monitor forinstabilities in this prototype heat exchanger test. No evidence of instabilitieshas been identified in dam reviewed to date, which include conditions that spanthe PCCS flow regime. Given that the SBWR is a forced flow design, and thatno instabilities have been seen in forced flow cperiments, they are notexpected to be a factor in SBWR perfornance. Also the condensationinstabilities seen in the UC Berkeley natural convection experiments were localin nature, and did not greatly effect the overall heat rejection within the tube.
-27o
. ..... •............,.•. .................... ................
__ 1~~ ~ ~ ~ NOOM - m12- -I

RAI Number 900.79
Question:
Heat loss has proven to be a significant problem in evaluating the GIRAFFEdata. Therefore, provide the heat loss evaluaton of both the PANTHERS andPANDA facilities and discuss how thee losses will be considered in theevaluation of the test data.
GE Response:.
Reference: PANTHERS-PCC TEST PLAN AND PROCEDURES. SIETDocument No. 00098PP9I. Revision LJuly 12, 1994, sent to the NRC in MFNNo. 098.94, dated August 16, 1994.
Section 8.1.2.5 of the PANTHERS Test Plan & Procedures (see reference) givesthe equation for the global energy balance of the PCC at PANTHERS. Thecquauon includes the heat losses of the inlet and oudet lines. However, theseheat losses were measured durbng the'shakedown of the test facility and foundto be negligible (i.c., less than 50 kW) compared to the total thermal power(around 1 to 14 MW). Thererore, the condensation thermal power formula willbe simplified to that shown at the end of the referenced section.
Quantification of heat losses for PANDA is a planned item in the test acilitystartup program. The measurements have not yet been performed. PANDA isvery heavily insulatcd, and heat losses are not .c:.'pccted to have a majjor effecton the results. The design goal is to limit heat losses to 10% of the decay heat at24 hours into the LOCA scenario. Calculations indicate losses will be*substantially less than the target values.
B
. . t .

~LiIrr ~FIT.4
I
RA Number 900.80
Question:
Interaction between the ICs and thc PCCS may have a profound impact on the
performance of the system. Discuss the possibilities or tests considering bothunits operational. In particular, the early in time test to obtain GIST-type datmshould be one of the tests considered.
GE Response:
Thc systems interaction studies performed as part of the SBWR testreassessment and reported in NEDC.B2391P indicated that the minimum RPVwater level was slightly effected by the presence of the IC and PCC for some
postulated break scenarios. However, there was ecssntially no effect on qstemperformance. The SBWR is a very robust design from the standpoint of corecooling. Minimum accident water levels are calculated to be approximately 1 to
4 meters above the top of the fuel, and peak clad ternpratures arc essetntiallyunchanged from steady state performance values. OvraU system performancewould only be effected if the water level dropped below thc top of the fuel. andcven then there would be very significant margins to 10CFJM0.46 andAppendix K temperature limits.
Appendix A of NEDC4S2.91 defines the tests GE has concluded are technicallyadequate for SBWR certification. PANDA test M6 was added to the matrixspecifically to address IC effects. As a result of staff commcnts from the
meeting on August 18, we are considering adding IC operation to PANDA testsMS and M9 as well. As noted in the response to RAI 900.73, PANDA tests M7and M9 will be started approximately 10 minutes into the accident scenario.
o29.
U
..
11 1 ý I w M ;Jý

- I
RAI Number 900.81
Question:
Transient behavior is of particular concern to the staf, therefore, each PANDAtest duration should include at least one purge cycle of the PCCS. Confirm ifthat is the case.
GE Response
It is unclear what is meant by a 'purge cycle" in this PA statement. EveryPANDA test begins with some air fraction within the drywell. Over time, thisair fraction will decline, but there will always be some small residual aircontent in the drywell. Tests MI through M4, are of this type. Tests.MSthrough M9 have test conditions defined to address speciAiTRACGqualification needs as defined in NEDC-32391 P. Some, but not all, of these testswill result i. the vacuum breaker opening, and re-cnty of non-condensablesinto the drywell. In these cases, the purge of these non-condensables into thewetwell will be investigated. Again, there can be no assurance that all the airwill be purged from the drywell in any given test.
Superimposed on these system purges may be short cycle variations in the non-condensable content with the PCC heat exchanger. These will be investigated,should they occur.
If the staff will be more specific in what they mean by "PCCS purge cycle wecan respond more fully.
, 30.
I]I I We P

JUl11 ii
.v.IPwrdue Univers*ty Questions - Set 5
1. Provide the SBWR drywell spray fow rate and water teniperature.
2. Provide the SBWR wetwcll spray flow rate and water temperature.
M. What were the droplet size, flow rate, and water temperature of drywelland wctwell sprays that were assumed in TRACG analyses?
GE Response:
1 The maximum allowablc differential pressure across the containmentliner determines the drywcll depressurization rate and consequently themaximum allowed drywcll spray flowrate. These parameters have notbeen finalized yet.
The Fuel & Auxiliary Pools Cooling System (FAPCS) pumps arc variable
speed pumps and can provide a flow rate between 257 and 422 m3/h in thedrywell spray mode. If these flow rates arc too high. it can be reduced to
150 ms/h for long term operation without causing problems with thepump If an even lower flow rate is required, the flow can be partlybypassed by opening the valve in the discharge line to the suppressionpoOL"
The spray temperature has been calculated to be 550C with a spray
flowratc of 346 ms/h with the supression pool water (source of drywell
spray water being cooled by the FAPGS heat exchanger) at 790C.
2. The maximum allowed wetwcll spray flowratc has not been finalized yet.
The Fuel & Auuiliary Pools Cooling System (FAPCS) pumps are variable
speed pumps and can provide a flow rate between 307 and 445 mA/h in thewctwell spray mode. If these flow rates arc too high,. it can be reduced to
150 mS/h for long term operation without causing problems with thepump. If an even lower flow rate is required. the flow can be partlybypassed by opening the valve in the discharge line to the suppressionpool •
The spray temperature hbs been calculated to be 550C with a spray
flowratc of 346 m3/h with the suprcssion pool water (source of wetwcll
spray water being cooled by the FAPQS heat exchanger) at 790C.
.31 -

I
3. The drytvell and wetwell sprays are simulated with the use of a TRACGPUMP component and a component representing the system heat
exchanger.- The flow rates used for the two spray modes were 321 m3 /hr
and 307 m 3 /hr for the drywell and wetwell, respectively.~ Thetemperature of the spray is not prescribed. The water is circulated throughthe simulated heat exchanger, characterized by a heat transfer area of
386 i 2 , an overall heat transfer coeficient of 1510 Wm 24., and a sinktemperature of 313.L It is expected that the outlet temperature will be onlyslightly above the sink temperature. Spray droplet size is not prescribed. Itis determined by TRACG as the value implied by a critical Webernumber of 6.5, based on relative velocity, or 0.2 mm, whichever is larger.As an example. for containment conditions of 300 kPa and .00o steam,the relative velocity is about 5 m/sec, yielding a droplet size in the range of7 to 8 mm.
* 52.-
I-b
I
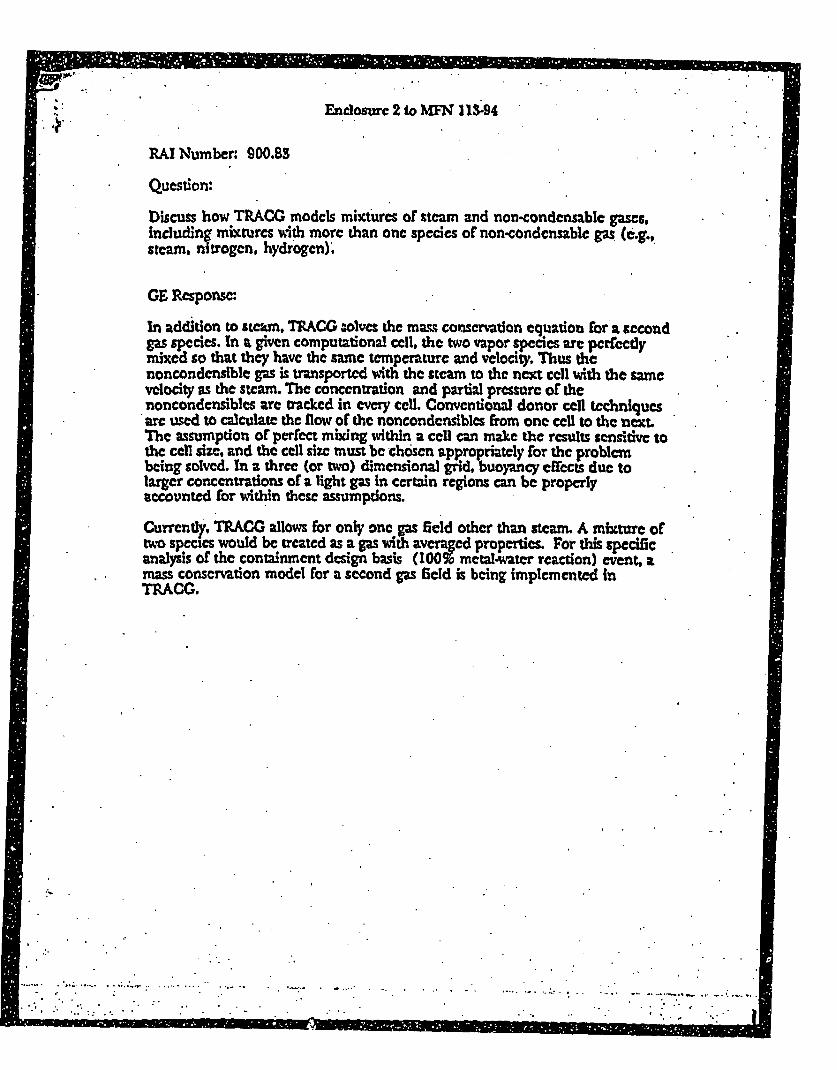
4..Endosure 2 to MFN I13-94
RAI Number: 900.83
Question:
Discuss how TRACG models mixtures of steam and non-condensable gases,including mixtures with more than one species of non-condcnsable gps (e.g.,steam. nitrogen, hydrogen)Y.
GE Response:
In addition to ste,•m, TRACG aolves the mass conservation equation 1or a secondgas species. In a given computational cell. the two vpor species are perfectlymixed so that they have the same temperature and velocity. Thus thenoncondcnsible gas is transported with the steam to the next cell with the samevelocity as the steam. The concentration and partial pressure of thenoncondensibles are tracked in every cell. Conventional donor cell techniquesare used to calculate the flow of the noncondensibles from one cell to the next.The assumption of perfect mixing within a cell can make the results sensitive tothe cell size, and the cell size must be chosen appropriately for the problembeing solved. In a three (or two) dimensional grid, buoyancy effects due tolarger concentrations of a light gas in certain regions can be properlyaccounted for within these assumptions.
Currently, TRACG allows for only one gas field other than steam. A mixture oftwo species would be treated as a gas with averaged propertie. For this specificanalysis of the containment dcsign basis (100% metal-water reaction) event, amass conservation model for a second gas feld is being implemented inTRACG.
.................... ....". . ..
L

%
I. Enclosure 2 to MWIN 1194I
I RAI Number: 900.87
• Qucsdlor:
Provide details of the CSAU study related to SBWR containment analysis.
GE Response
GE intends to follow the CSAU methodology developed by Boyack at al(Qaanti~ing Reactor Safety Margins. NlJREG/CR-3249, 12/89). The 14 stepmethodology developed by this team is outlined in the attached figure from theabove reference. Currently, GE is at Step 8 in the process. The test and analysisneeds have been defined and the Separate Effects Data analysis is completed.The remaining steps involve the determination of bias and uncertainty in -theTIACG calculations (Step 9), establishing whether there is a scale effect (Step10), and accounting for the eiccts ofuncertaintics in the plant operatingparametcrs (Step 11). Undcr Step g, all the parameters idcndified as High in thePIRT tables.( e.g., 4.1-2(a)) will be addressed. It is expected that a much smallersubset of this list will show significant effect on the contanmcnt pressure andtcmpcra•ure response in the preliminary sensitivity studies. For this reduced setof senstive parameters, reasonable ranges will be defined for the subsequentstatistical analysis in St-ps 12 and 13. The model and plant parameters will beperturbed from their nominal values in a set of TRACG calculations. Thesecalculations will serve to define the upper 95th percentile pressure and - . "temperatures, which will be compared with the allowable design limits.
.. ................ .... .,.
Uii
IMMRI , 9 MIN .1

FEncldose 2 to MWN 113-94
RAI Number. 900,91
Question:
The staff is concerned that assumptions termed as "licensing basis" which arcused for calculations of accidents a nd transients in the SBWR do not representthe acoxal operation of the plant which would be expected in such cases. Theseanalyses routinely exclude operation of safety systems that would be expected tooperate, such as the isolation condenser. It is also possible that selected non.safety systems could operate and change the integral plant behavior. GE shouldinclude in its test programs a range of tcst conditions to ensurc that the data willrepresent a sufficiently broad basis for code assessment assuming both"licensing basis* conditions and realistic plant conditions during accidents.
GE Response:
The "licensing basis" calculations do not ake credit for equipment notclassified as Engineering Safeguards. Also, single failure assumptions arcrequired in the analysis. However, GE has performed analysis to show thatscenarios where such equipment is available improve the accident respi.se,and that the licensing assumptions do in fact provide bounding results.In NEDC-32S91P, ca•lulations have been performed with the ICs available.Cases have also been run with active systems operating (GRD and FAPCS).Based on these calculations (Appendix C). testing needs have been defined. ThePANDA tests will include tests where the ICs arc operational. The effects of theFAPCS in the drywell spray mode will be simulated by adding cold water tothe dzrwell. The GIST tests included one (A05) in which the CRD qs m wassimulated. The ICs have a beneficial effect on the limiting LOCA. transients andwere not simulated in GIST.
I I - I U A pmý Ion ia

I 1= 1[11i~;EE.: -N M
Enclosure 2 to FN 113-94
MAI Number. 900.93
Provide a discussion of vacuum breaker actions for analyzed transients andaccidents, including a Gravity-Driven Cooling System line break and includediscussion of assumptions made for both expected and 'licensing-basis"scenarios. In addition, detail why .Maure to clos• (after actuation) of a drywel-to-wetwell vacuum breaker is not, in GE's view, a credible failure.
GE Response:
Vacuum breaker cycling has been predicted Fnr nearly all LOCA., followingGDCS initiation. The injection of subcooled GDCS water into the vessel reducesthe pressure In the vessel and drywell to below the setpoint of the vacuumbreakers and they cycle open, returning noncondensible gases to the drywell.Predictions indicate the vacuum breakers remaim open for only brief periods,and can cycle several times during the GDCS injection period of the transient.The LOC.A transient which is predicted to provide the most vacuum breakercycles is the GDCS line break. This accident dumps the inventory of one GDCSpool directly into the drywell, which produces vacuum breaker openings.Later, as the GDCS flow from the unbroken lines fills the vessel to the level ofthe break and spills over into the drywell, addi.donal vacuum breaker openingsare predicted. Predictions of this transient indicate that as soon as the decayheat boiloff rcsumes, the drywell is re-pressurized, low through the PCCSresumes and the noncondensibles are slowly purged through the PCCS, back tothe wetwell.
Differences in the licensing basis' and expected LOCA calculations such as
those presented to the NRC relate to availability of additional safety systems. Aswas shown, the use of intermittent drywell spray. while reducing the drywellpressure, also produces additional vacuum breaker cycling. For all casesanalyzed to date however, the PCCS was able to return the recyclednoncondensibles to the drywell and retain part of the pressure reduction benefftresulting from the use of the spray.
The assumption of the reliability of vacuum brcaker operation is based on thedesign requirement of the vacuum breaker. The vacuum breaker valve designreliability objective is to fail to open or close lcss than once in every ten-thousand demands. To achieve this objective, simplicity of design was used.The design configuration selected is a vertical poppet valve opening with highwetwell pressure and closing by gravty plus drywell pressure. The valve hasdouble scaling surftces one hard and one soft. The scaling surfaces aredesigned so that a design basis seal obstruction could be accommodated an oneseal without the alure of the second seal. To demonstrate reliability, theprototyp valve has undergone extensive testing. Before the valve reliability testwas begun, the valve was aged and degraded to simulate sixty years of service.Aging consisted of soft seal irradiation, whole valve thermal aging. whole valve
.o ,.
U
€" t ,
M

I.
EkI1~,.-~WEiMUin~EUJE ii~UINi nil______
Enclosurm 2 to MN 113-94
dyamic aging, dcsign basis accident steam aging and ingestion of grit to coat
seal and moving surfaccs. The valve was then cycled three thousand timcs
without failure. Using a Bayesian statstical approach, three thousand cycles.
without failure was shown to demonstrate a high probability of meeting the
reliability objective of one failure in ten thousand.
i
- - fflý- - PI lie=

I
Endosure 2 to MFNO 11-94
RAI Numbcr. 900.94
Qocstion:
Provide a .listing of the -TRACG code vdai used for each TRACG runanalyzed and presented during the 'scaling" part of the August 18, 1994,meeting! including a discussion of any dif.crences in the results obtained withthe "prcliminary" and the *Level 2 "versions of thc TRACG code.
GE Rhesponsc:
The results discussed at the meeting are containcd in Figures B.3-1 to B.S4 forGIST and Figures B.3-5 to B.". for GIRAFFE. For GIST. TRACG calculations areshown for the test, for the current SBWR design and the 1988 SBWR design. Orthese, the test predictions and the calculations for the current SBWV designwere made with the Level 2 version of the code, while the calculations for the1988 SBWR design were old calculations. Calculations made with thepreliminary code version and the Level 2 version have shown very little,diferences for other similar calculations. The G.AFFE test predictions as wellas the corresponding calculations for the SBWR in Figures B. 8-5 and B.36were all made with the Level 2 version of the code.
U
...................................... ,'.....,'
• . , I

GE Nuclear Energy
P. W. Mnh~oJt MannporA . Wia wmpr:orAecwdPber T5. oimo
December 15. 1994
GawrbomE16cme Comafny ~..~9 2.11705041muo fACv-) 40 gSv Jan. CA 9612-01
MFN No. 155-94Docket STN 52-004
Document Control DeskU. S. Nuclear Regulatory CommissionWashington DC 20555
Attention: Richard W. Borchardt. DirectorStandardization Project Directorate
Subject: N'RC Requests for Additional Information (RAUs) on theSimplified Boiling Water Raector (SBWR) Design
References: 1) Transmittal of Requests for Additional Inrormaton (RAI)sRegarding the SBWR Design, Letter from M. Malloy toP. W. Marriott dated February 9, 1994.
2) NRC Requests for Additional Information (RAls)on the SBWR Design, Letter fromJ. E. Leatherman toR. W. Borchardt, dated May 2, 1994.
This letter provides information to supplement that provided by the Reference 2letter regarding the SBWR wctwcll-to-drywcll vacuum breaker tests, specificallyan additional response to RAI 900.62.
Please note that the information contained in the enclosure is of the tvpc which GEmaintains in confidence and withholds from public disclosure. It has beenhandled and classified as proprietary to GE as indicated in the attached affidavit.We hereby request that this information be withheld from public disclosure inaccordance with the provisions of I OCFR2.790.
Sincerely.
P. wt Manager
Advanced Plant Technologies
Attachment 1, "Responsse, to NRC RAIs"
cc: P. A. Bochnert (w/1 copy of Attachment 1)F. W. Hasselberg (w/1 copy of Attachment 1)J. H. Wilson (w/2 copies or Attachment 1)
U

Now., ......
________ - - - - - -
9
- LI(rE.INITV.:LI~VOUt' AG.KUIDAD0%rruyutvt Cmrnaruk! Avaunud UNESA
I
PAGES ATTACHED: 1-tU. PrrM I-to 230
SDWR
STUDY'
V)XCUUI4 3RIEAXER 7XCA
wrrE I/EA DOC. NO. PROJECT DOC. NO. REV.NO.
02 STS-0002-1 TIO I
A
1 7/94 DESIGN NP%~Z~2. )P 4 )'
I. 6/94 fINTORMATZON AND KPV/u'pw 14pr/upf O/dCOHM(ENTS _______ TR/umtr
REV. DAUZ ISSUJING PuRpos ORIGINATOR v3UV I./ APPROVALNO~x ICHEM
r RT02AID/C.A01_

U
X
-- % 02 STS-0002-1/REV.1i
9
SsWR
RECORD OF PRELIMINARY/PENDING DATA
DOCUMENTREFERENCE C*) PRELIMINARIES/PENDING DESCRIPTION
I ) ndicate document cactiLcn, paragraph, figure and/or paqe.

- no-bpo -nf
ii02 STS-O0O2-1/REV.1
SUWR
RECORD OF CHANGES
DOCUMENT REVISION NO: I
l.
DOCUM4ENTCHANGE DESCRIPTION ANID UZASOII
C14ANGSRAZfRZNCZ
I
I*) Ini~dcate documntn se~ctin# paragraphI. figure and/or page.
____ ____ j~~j~ j m. mm millI~i 111IEU.

---- JW02 STS-0002-1 Rev. I Shoot I of 30
TABLE OF CONTENTS
1. PURPOSE
2. SCOPE
3. REFERENCES
4. METHODOLOGY
S. DESCRIPTION OF SYSTEM ANALYZED
5.1 SYSTEM FUNCTION
5.2 EQUIPMENT REQUIRED TO PERFORM FUNCTION
5.3 OPERATING MODES
G. HYPOTHESES
7. CONCLUSIONS
APPENDIX 10: ENVIRONMENTAL CONDITIONS
APPENDIX 20: EQUIPMENT DIAGRAM
APPENDIX 30: MAIN REQUIREMENTS OF EQUIPMENT
APPENDIX 40: FUNCTIONAL TREE
APPENDIX 50: FAILURE MODES AND EFFECTS ANALYSIS TABLES

-Z &
w
U
02 STS-0002.1 Rev. 1 Sheet 2 of 30
1. PURPOSE
This document describes a Failure Modes and Criticality Analysis (FMCA) for the drywall
vacuum breaker valves on the basis of the functional tree constructed for these valves.
2. SCOPE
The scope of this document is the FMCA for the Vacuum Breakers Valves designed forthe SBWR project. It is not in the scope of this document the fault tree quantificationto obtain failure frequencies. These values could be obtained as a result of the testprogram.
3. REFERENCES
1. Vacuum Breaker Design Update. SBWR Working Group Meeting. May 10-13,1983
2. SBWR Vacuum Breaker Valve. General Assembly study and layout. FIAT.
2T137681
3. SBWR Wetwell to Drywall Vacuum Breaker. Test Specification 25A5445
4. SBWR Vacuum Breaker Instrumentation. Test Specification 25A5395
5. NUREGICR.4692. Operating Experience Review of Failures of Power OperatedRelief Valves and Block Valves in Nuclear Power Plants
6. Nuclear Power Experience, vol BWR 2. Relief and Safety Valves
7. Nuclear Power Experience. vol BWR 2. Containment - Miscellaneous
8. SBWR Standard Safety Analysis Report. 25A51 13 Rev A
9. FCI.70-2-1991. Fluid Control Institute. Control Valve Seat Leakage
10. Regulatory Guide 1.82, Rev 1. US Nuclear Regulatory Commission, Office ofNuclear Regulatory Research
In N

.,- 02 STS-0002-1 Rev. 1 Sheet 3 of 30
4. METHODOLOGY
The functional tree of the valve has been constructed on the basis of the valve
functions, the modes in which they are performed, and the valve characteristics and
conditions.
Each system function may be linked to a series of performances carried out in order to
meet a set of needs and also to a list of constraints Imposed for execution of the
function. The technological choices made ?re also significant. This is Illustrated in the
diagram below:
-I-- PPPR•OUAUCES
CONSTlAIWM
Subsequently, based on the functional tree, a failure modes and effects analysis is
r.arried out on the valve. For this analysis. a table has been prepared, containing the
following information for each component:
0 Its function or functions
0 Its possible failure modes
0 Internal or external causes
0 Possible effects of these failures on compliance of the valve function
* Detection or location means
0 Risk reduction means
0 Failure Criticality
I 111-111 11 In XlS1LWU§&WNk= . 1 11, 1 1110 1 9' 1 V 11211 M ill

MIGO
-, 02 STS-O002-1 Rev. 1 Sheet 4 of 30
The following classification has been performed for each function as regards the failure
modes:
0 No function. The function Is not performed at the desired moment
9 Loss of function. The valve functions but then ceases to function
0 Degradation of function. The valve functions but the required performances are
not achieved
Taking into account the failure modes of each component/s which will carry out the
necessary function/s the criticality of the failure on the equipment Is hierarchied. This
results In:
W Catastrophic equipment failure. The valve is completely incapable of carrying out
its function correctly
• Degraded failure, when the valve functions below its specific operating level
0 Incipient failure when the valve functions as designed but presents characteristics
which, not having been considered, could produce degradations or catastrophic failures
Appendix 40 shows the functional tree constructed for the valves analyzed and appendix
50 contains the tables prepared for the failure modes and effects study,
The equipment description (ref 1 and 2) and the test specifications (ref 3 and 4) were
used to perform the analysis.
To identify the mechanisms that could cause the failure of the valves studied herein,information about vacuum breakers and relief and safety valves has been used, taking
into account the differences in construction and the operating conditions experienced.
NUREG/CR-4692 (ref 51 task 8.1 presents events corresponding to leakage causedmainly by faulty or worn seats, anomalies In the disk and stem, or the presence of
foreign matter between the disk and the seat.
Events caused by human error, such as improper installation and mlsadjustment of the
stem causing the valve seat to leak, are mentioned in Table C.1 of the above-mentioned
document.
Information on failure mechanisms has also been obtained from 'Nuclear Power
Experience" (ref 6 and 7). Some of the most representative events referenced are
shown in the following table.
Rio ME 11111MANIPM '11 I&JIMIRIPIrME 1 1111119 M CREM Imem -RM 111 11151

U
EmI.EI!!: EII'1! 'iT
-m• 02 STS-0002.1 Rev. 1 Shoot 5 of 30
Table 4.1
Events / Mechanical Failures
PLANT EVENT FAILURE MODE OBSERVATIONS____________ DATE _______ ____ _________
Oyster Creek 1 69 Excessive leakage The seat was lapped. but there wasno indication that leakage was causedby a damaged seating surface
Oyster Creek 1 Nov. 71 Leakage The valve wag disassembled; repairsconsisted in straightening the stemand lapping the main valve seats.However. the ;eating surfaces did notseem damaged and did not showuneven wear
Browns Ferry 2 May 79 Leakage Leakage was caused by lrregu4-arideson valve seating surfaces andentrapment of debris under theseating surfaces
Arnold Feb. 83 Leakage Leakage was caused by wear of thevalve seat during operation
Hatch 2 March 80 Excessive leakage This was due to wear of the seatingsurfaces. As a result. they weremachined and lapped
Hatch I July 95 Stem failure The valve had not been fullybackseated. which allowed the stemto vibrate until a fatigue.induced
failure occurred
Cooper May 85 Leakage The leakage was thought to be theresult of a slight misalionament of thevalve disk on the valve geat. possiblydue to valve mishandling duringshipment or to foreign particletrapped on the viIv, seating surface
Perry 1 Sept. 87 Leakage Valve leakage was caused by debris_______ _ caught between the disk and seat
ý rmmmmmvn I - . I , I I I I - 111NIF

lb-ml j
Mw 02 STS-0002-1 Rev. 1 Sheet 6 of 30
PLANT EVENT FAILURE MODE OBSERVATIONSDATE .. ..
Dresden 2 Oct. 87 Problems with The tolerances for centering weretolerances for reduced and centering methods were
centering improved
Limerick 1 May 87 Excessive leakage LeakaGe was attributed to minor wearof the valve disk and valve seatingsurfaces. produced during valvestroking. When the valve disk slid intoits seat. small particles of din causedlight scoring on contact surfaces.
Oyster Crook July s8 Valve stem wasbowed
Clinton Jan. 89 Anomalies on This was due to seating surface wearseating surface
Limarick I Feb. 89 Excessive leakage Leakage was attribu•ed to minor wearof the valve disk and seating surfaces,which occurred when small particlesof dirt caused light coring of thecontact surfaces
Oyster Creek Feb. Leakage Leakage was due to damage in theMarch soft-disk seat
91
Oystor Creek April 75 Excessive leakageJan. 76 Ivacuum broeked
Hatch 2 Aug. 78 Leakage (vacuum Leakage was caused by loose retainerbreaker) ring bolts
Dresden 3 Jan. 82 Leakage (vacuum Leakage was caused by a worn seal,breaker) which was replaced
Brunswick 2 July 82 Leakage Ivocuum An accumulation of dir on the valvebreaker) soeting surfaces prevented proper
seating. "the valves were cleaned

-- "o 02 STS-0002-1 Rev. I Sheet 7 of 30
5. DESCRIPTION OF SYSTEM ANALYZED
The system description covers three aspects:
* System function0 Equipment needed to perform the function0 Operating modes
5.1 System ungtion. The main function performed by the Vacuum Breaker system is
to avoid and prevent a high negative differential pressure between the drywell and the
wotweil above the suppression pool.
Depressurization in the drywell may be caused by any of the following events:
* Post-LOCA depressurization caused by the Emergency Core Cooling System ECCSflooding the RPV, and cold water spilling out of the broken pipe or of the broken GDCSline directly into the drywell
* Inadvertent actuation of the drywell spray during normal operation
o The heat removed by the combined action of the ICS and PCCS exceeds the
decay heat steam production
When depressurization of the drywell as compared to the wetwell reaches the value of0.5 psi. the vacuum breaker valves open, with subsequent decrease in the pressuredifference till a steady state is reached. For more detailed information, see the "SBWRStandard Safety Analysis Report" (Chapter 6 In Ref. 8).
The other function of the system is.that of inertino the containment by introducing
nitrogen or air into the wetwell and venting it to the drywall through these valves.
Appendix 10 shows the ambient conditions foreseen, during both normal operation end
LOCA.
5.2 Eaulpment needed to oerform the funCtion. To deal with daprossurization of the
drywell, three valves are required, taking into account the single failure criterion (failureon opening of a valve).
To inert the containment, one of the three valves is required to open at 20%.
These valves are mechanical, le, they open when the pressure difference between thedrywall and the wetwell exceeds the weight of the disk and the surface resistance of
the bearings, and close with the force of gravity. Each valve consists of a vertical lift
disk with an adjustable damper. An EPDM seal and a hard seat ensure that the
Jmg2m to-1 N 1, 1 21 1111 ism it I % -

4-,
,=. = 02 STS-0002.1 Rev. 1 Shoet 8 of 30izsmMaw,,02oft
allowable leak rate is not exceeded. Bearing in mind the maximum allowable rate ofleakage through the seat, the valve is considered to be Class IV according to FCl-70-2.1991 iref 9).
The valves are fitted with instruments which indicate the valve position. Perforated
screens protect them against the entry of foreign objects at both the inlet and the fourdischarge ports.
More information can be obtained from the document "Vacuum Breaker Design Update.SBWR Working Group Meeting' {ref 21.
In view of the foregoing, the main components in each valve are:
Vertical lift disk with upper and lower bearing• Hard seat0 Elastomer seal
Hydraulic damper to avoid disk oscillations (Pend.)* Screens at inlet and outlets for protection against foreign objects• Valve position instrumentation (sensors, transducers, power supply)
Appendix 20 contains a diagram of the equipment and Appendix 30 lists the main valve
requirements.
5.3 Oneratino modes
" Valves closed in normal operation• Valves completely open when PWW-PDW - 0.5 psi after LOCA* Valve open at 20% in Inerting process* Valves tightness maintained after inerting and after LOCA
6. HYPOTHESES
" Only the main valve components were analyzed during the study.
" During the functional study of the valve, the function referring to indication andalarm on the valve position has been assumed to be a performance function, since its
failure presupposes a degraded valve failure. Failure of the Instrumentation would implythat the information referring to the prevailing status of the valve was either not receivedor not issued correctly
• The protective screens servo to prevent the entry of matter which could affect
valve operation. The analysis Introduces this as a restricting function, affecting both the
opening of the valve and the function which ensures isolation between the drywall and
I1 I I a I M 1, 1 WERE 1 191111111 P Im ýJam - - 11 IM111 111 1 M ill

----- - ~,- 02 STS-0002-1 Rev. 1 Shoot 9 of 30
the suppression chamber gas space.
4 The damper serves to guarantee the valve close/open time and to avoid diskoscillations In the low-flow mode, while ensuring that the valve closes correctly. It alsoprevents any impact or bouncing that may be produced during opening.
* The function "generate force necessary to maintain surfaces in contact* refers to
the system which will be used to attach the EPDM seal and prevent leakage through theseal.
7. CONCLUSIONS
7.1 The position of the sensors could be very Important from the point of view ofleaks between the drywell and the wetwell through their penetrations. The sensorsshould be placed in such a way as to eliminate these leak paths.
7.2 Raising the seat could, to some extent, eliminate the possible risk of the elastomerseal behaviour being affected by any debris entering the valve.
7.3 The absence of leaks between the drywall and the suppression chamber is largelydependent on the behaviour of the elastomer seal used. Correct operation of the sealin expected accident environmental conditions should therefore be ensured. Moreover,the allowable force limits for the seal must not be exceeded since excessive compressioncould lead to the design limits being exceeded, whereas if the minimum force is notused, the required leaktightness level would not be guaranteed.
7.4 In terms of the tests to be conducted on the valve, the damper could beeliminated if the valve behaves correctly: in this way the risk of valve malfunction dueto damper defects (incorrect assembly, adjustments, leaks or incorrect behaviour of thefluid in the required environmental conditions) is eliminated. It could also be studied thepossibility of replacing the damper by a spring which carries out the same functions ofthe former but presents a lower risk of failure.
7.6 One of the specifications to be met by the valves Is that of supporting dynamicloads produced by earthquakes and jet loads of 10 psi. To ensure correct behaviour ofthe valve under this type of stress, the tests should be carried out with the same typeof anchorage as that used in the final Installation.
7.6 In order to avoid, as far as pussible, damages to the valve owing to the plpewhipeffect or high-speed water or steam Jets, it is recommended to physically separate thesevalves from the high-energy piping systems.

U
--- '--" 02 STS-0002-1 Rev. 1 Shoot 10 of 30
7.7 To avoid incorrect seating of the disk which could cause leaks, a device has booninstalled a device which prevents the disk from rotating avoiding deformations withcertain types of flows. The possible deformations and turns or rotations of the disk willbe studied during the functional test on the valve, as mentioned in the document "SBWRWetwell to Drywall Vacuum Breaker Test Specification" irof 3). The antirotation keybehaviour must be also studied during that test.
7.8 From the construction point of view, the metal used for manufacturing the valveshould have good mechanical characteristics, and behave correctly with regard tocorrosion and welding.
7.9 Protection against the entry into the valve of foreign matter, such as debrisproduced by LOCA, is achieved by protective screens at both the inlet and the outlet.These screens should comply with the requirements indicated in Regulatory Guide 1.82(ref 10), taking into account their location inside the containment where their immersionis highly unlikely. The protection should really act against debris which Is generatedduring the LOCA period and could be transported by blowdown. The installation of a
double protective screen could also be recommended, as In the case of the containmentheat sinks, where the external screen serves to slow down any possible debris.
The diameter of the perforations in the screen will be obtained after studying pressurelosses through them; It will also depend on the need to prevent the entry of objects intothe valve.
To ensure correct behaviour of these protective screens during operation, it would beadvisable to carry out the valve tests with the screens installed, so as to study theresponse to external stresses (earthquakes, vibrations, loads, etc) of both the screensand their unions to the valve body.
7.10 The test specification states that the response-to-radlation test will use a 230Mrad dose. This dose is high, and it is difficult to qualify a material with thecharacteristics required to ensure valve teaktightness. Therefore. it might be appropriateto perform the test with a lower dose, since regular replacement of the elastomer sea[are expected to take place during the operational life of the plant (60 years).
7.11 The "risk reduction means* that appear in the "Failure Modes and Effects AnalyseTables" can be grouped based on the phase In which they are carried out. In this way,
the following results appear:
A first group formed by the qualification and reliability test, which guaranteescompliance with the specification requirements In the prototype development andprototype
MCI i I ý I t7WOMMM 1123, 1 ý1 SIM WIN 11 ROUNIMEM

02 STS-0002-1 Rev. 1 Sheet 11 of 30
. During the valve fabrication process controls are necessary in order to assure
equipment Quality and compliance with design criteria.
* The use of assembly and calibration procedures and the carrying out of
preoperational tests Iverification of the correct working of valves, opening/ldosing, and
leaktightness) guarantee that the equipment is operative at the time that the reactor
starts operation.
* Visual inspections of the accosible parts of the valves should be carried out at
each loading to determine and assure that they are free from foreign debris 3nd the disk
should be manually tested to assure its freedom of movement and functionability. Also,
inspections should be done of those components susceptible to deteriorate with age.
For those components that need substitution every so often (seal, valve position
instrumentation, damper, replacement. disassembly and reassembly-procedures are
necessary. The replacement intervals will be basically designed by the results obtained
in the tests carried out on the prototype.
I- ~urn~mar

MR
:11:: I.ululuuuu; In III I~i I
-MN A- -
-eql - 02 STS-0002-1 Rev. 1 Shoet 12 of 30
ENVISO0NMF-NTAL -CONDITIONS
';.:

4111- S02 STS-0002-1 Rev. 1 Sheet 13 of 30
ENVIRONMENTAL CONDITIONS
NORMAL OPERATION (60 years)
Radiation:- Gamma 300 magarads- Beta Negligible- Neutrons Negligible
Temperature: 135 - 150 0 F (330-339K)
Humidity: 50%
Fluid: N2 1Air
LOCA
Radiation:- Gamma- Beta- Neutrons
Temperature:
Humidity:
Fluid:
U
100 megarads (in 100 days)100 megarads (in 100 days)Negligible
303OF (424K) (100 days)
100%
N2 /Air/Saturated Steam
1-11 ý IFE .1111' INNEVIONC-Saffm 11:1 11 1 11 11MI Iowa 11

* ___________A
- -aw ýSf- -M
02 STS-0002-1 Rev. I Shoet 14 of 30
6EE~bI&X20
MnUIPMENT DIAGRAM
U
I I w ý IWIN I I=Iý i mI~i I_____________

S... - _________________________
* ~
* ~. . .*Z9 *~e*
** .5 *~q
... ~*
,.* *.,*..
... .
&t. .
* . ** * *.. .
9 .
9' . .'. * -S..-. 4---...
.9.. . & -...
. S. * 9.K ~
* 99a.
***... 9t* .9
* * .. A
., .9.
.9. 9 .;i.
V...... ~* ..: .*.~
-.9 a -* S.. *, .91*
L5(O
9. ° 9
9',
m •
.e *~. ~'.'* - 4.~. ** . . . A
9..... *
* *.. ~.*9
1 ,*.* *
*.*.C ±A *----..=..9
J. I *''I
P 6...-~~
(~)-9' If -. 0 1 1
|
P$
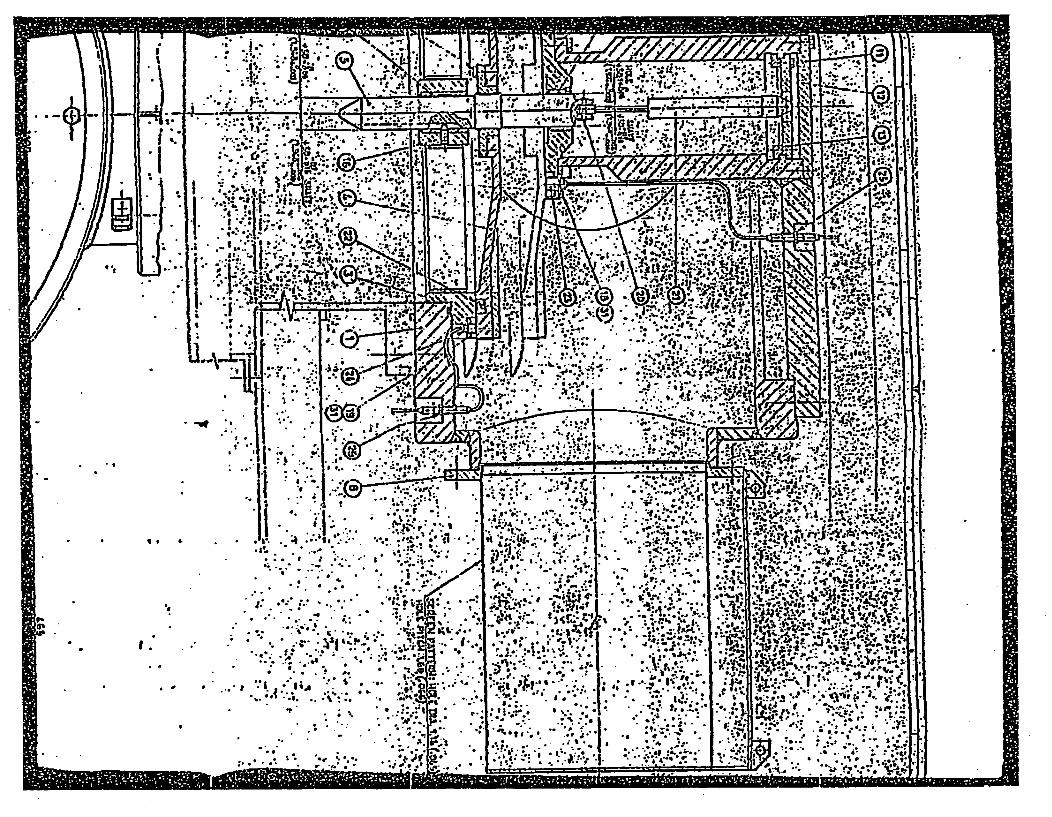
. 0
I
-<1 1;* . . IiI I ...
9.. .
*: : '..
a.
4 4
- .. *
It.. **%.* .4.
'. .9.
4'
* .. * 4.
* 4.
I *4..
...-. ~ .
* *N-..
..**~ .~I,
* ~ ...
LA- I
d*q_*9 *~..
I.
*1.-*9.~*u qr1**'~ N a,
.1..tz.... I. *r.** .. I
.* I -
.9..* ~ *
*q~ ~
- .:&. *...9

I
.1
• .*". .
.,"..' S
°"." • .•..
... "
*.*" ,,: *.I;., . ,..:,'.
*,. ., :.:.. .. . . ."- . ; .,
. 4.. 3
,•."., *. , .*.*. .
, * •* ** *....• . ,--
. .t. .°.,
*o ..
*.4.. ,.. .. C• .~ , s . .- •
l.. ..• • -•.',. . .. .: . *'"! ' r.'. " -"'
-" .
•
..
_ , ,*..
5•. ,.
5 .•o ., _ ..
* *. * •.,
' ' .. -• S* ,,
•
.• "5..|°
* - " m. q
* • .~ j
,. S
*
.:
.'**.o
.. " . .
... • ."* -. . j.
*:•. ,...,.:
,
*S,.,, . . .,.
..- *,
*3.. ..... . -."
.
*5
,
*. *o,
,
. 4. .: *..- -* . * .
"S. ,* , S. ; "
." .' 4 I
.*"•.o
••.5 **. ..
. • . . s
" ; - ••
•
U•• -
* .. °
o .5t
5. o~ -.
'tYLSOL.T
II
P AZThrBW UP .a...f,
'II6 . 6OW. Sr&,ul *
.ip :. *- .-
11i 1 i .DAMPrCt.UST T.
lit'" I'" ,•-t Ab I R RA .I4 1*
I

9 • - * • ....
.. . 9, . I ..l . .. . 9- .9,, Ir• , . l. e ,
, ,9... ; .,.:.' - . •.* , .. ,,, ..
. ,. 9 . - . ,, ,• -,.. .. . -
.,• . . .... .."* . r-,,,
9. . 9 9. ' . 9"~itIi'lliki•
99 9 * 9. ', 9 1 . . * • 1 *
,.l.,.-,9 9 " 9 ," . .' .. *.. . •
'Illill e *9 .. • .. I • ° " .. . o ., .
* ... ~.. ; . 9;. ' ,,;I ,
* . ,9 . ,,... ..- ... .. , ,. , . ... .:
• * ,
. ..?.. . ... . .-."
".. "ir .* 999
In
9 99 . 9
I.
IL
i
It
(9
1•
II Ill I. . IsII.II'Ii
**p~ I.
-999 - ~
* 6
9
-I
a
*
9
.-. A. - n. * - ~0*
-
9 599
•l
9 .4.9
9 9 .-9.~.
.9 ~.9 -.
V
9 9 99 5
- 9 99 9 9 9
9. . 9 9 .... F*.
W
- I . .

JI ____ . .* ...- . . . ..a,, S . . . ...*1*** ..I (~ * **.,* .-. .. . ........ *
~ ~ S -... __
* ~jji ~ * * ~*5*~.* * * -- *
,~k ~ ~ * *: * *. . . - . ~* * *f'.~2.: *'~.*. .*.* . 'I. - . * .~** "~:.- *. *4.. *. *j~, * *. - I *. . *1b
~ :~ ~ * ~* :. -: *~: ~ * . *. *
.1*~ A . .
* .* **...?. ~ . *1* *.. ***p I. .. * . -*. *
* .. *~4. *1 * * I
_____ r* . . *. . . S
• 01 •0o•• QO g Ok(W3 ".
.7
r
pl
S - Se St -
0*
5-
5.
p
V.
ogP
.. a. *. *. *.

rn-rn-'N ' .
• .' 2
a . '9:.L. . :- .
9..4.. .9
%... .9..
* %.
9* .9 .. ..
* *9
*I .9-.
C *~~~ -p aI~ ~ s~ w - - . . . -
.21 1.J9 F~~IJ VIANDRI'V`. A~ A4UwbI OTRU1~UL
* 9 ~ rn2JU iiw.c tASPIA13r4 8H ~O1MHCRL&BL9%*.1
.1.
!
*9.q 179F. l &WS~-~ I~i?~v i.a
i j Piximnysom-5 cokiiis~ I tc-vIr
Z2 i IWCi SCAV L-rLAV,"*Ct. ICMHCRCALI DAPCG 11
1!faI =950N12 C Int
1
IS Ii RIM TCWANC2 I*4ThAW'tip4%
..1T7'1 Iuu1 pt1uc PIN :ý.AthA=wn1E%44
l1 I £)JT&ETAION KEY lw i oyt
*11 Gwi . =1a MriAt13 ! 2 5iW.C. DDS UriMV.OWUUL
1.
IiI5-itiiH.
U.1'i
v N1I 21 I priMatTU1Ta uf. ¶ l[I 11 I I * flZMPCU C~'JKU .1 - - -_~~~~I ~E
i 1iI DAM~PERl €zvgc I,',"•'J7='TMr~r t,•- ~ ~ 1 . --lI4 LýTjA~ Tfa.
_____ ___** -m-~ 014 l- - - 9~r -
7 I 1 .ANT5ICHATI1,G 1r 2ErEN IA=? 4R VE:~-_ ._ .,.- .,-. ..
~ 1.SUS W__W .- TA=rarI:hLI
F-: :ScE~.~~4. WIa1TLI
I sc goiamL
7 ~
Si
I.
III LP~ - ~ ~ 4 I5~ YU~ AtlP
zitwoms, Aut IN "U IM97w. :MMOSiW .IN..
!fte
A ~~s V WI "o,"ll lo905 053 5
Op.Ime.0%a Ift9q 0. .
%we5 104 fto. twoS 090..
-. I~ &~C isi mc~cs
ma, I________________ I;~9,0 5 g .9-.
~b 9.*005C9493 1:s~* I o:..r ;j
CI *059~ * 05 9999 Ij_ a!~9i
* S
I~ of60
s.. . 1q~.
hI I.i 339 L.2T137631i,. 7 .- A.
II
9.C90 0 9~* -. 0.~~.~ * - . .90 -~. ~. ~. -9-
- ~ . .. *.., .. ~ .0. ~..!:4: dll

W'2M A.- AVOW- - af
02 STS-0002-1 Rev. 1 Sheet 15 of 30
6PENDE-3
PLAAM~ ARF II97MMKITC ng: Ml IIPRAr-Krr
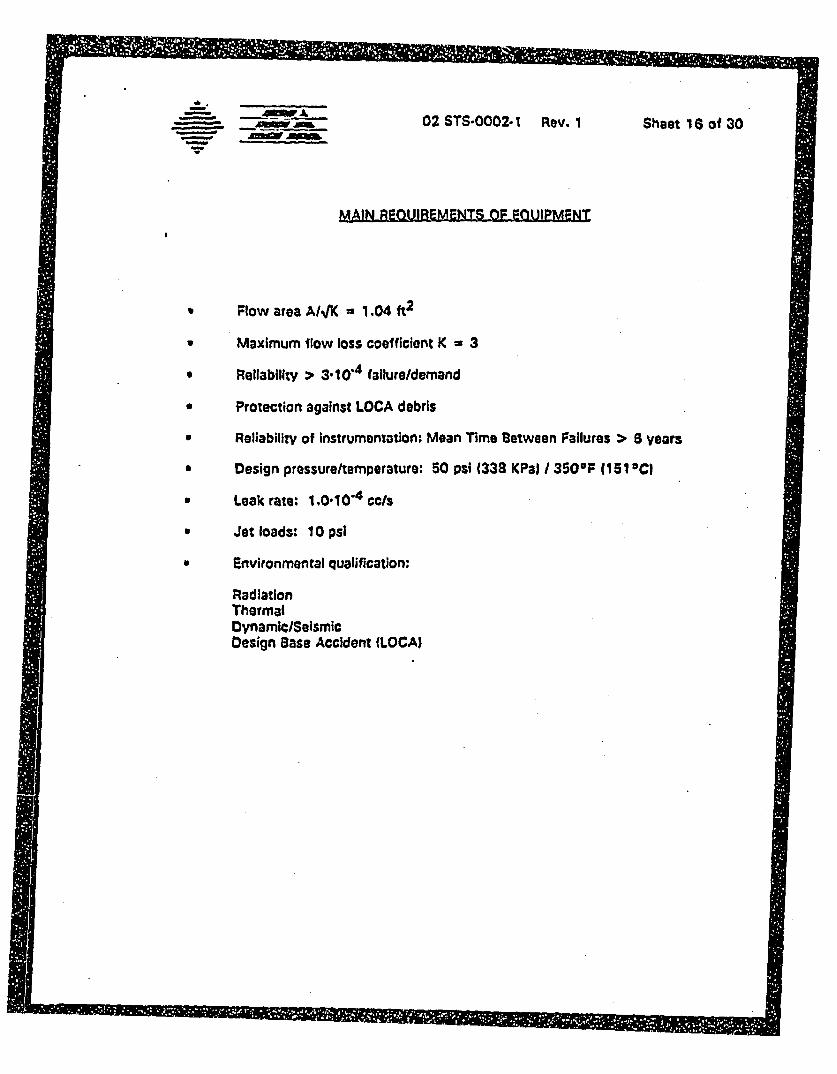
....... - 02 STS-0002-1 Rev. I Shoot I$ of 30
MAINREQUIREMENTS 1_OF-QUIPMENT
* Flow area AIN'K = 1.04 ft2
0 Maximum flow loss coefficient K - 3
0 Reliability > 3"10.4 failureldemand
0 Protection against LOCA debris
9 Reliability of instrumentation: Mean Time Between Failures > 8 years
9 Design pressure/temperature: 50 psi (338 KPal I 3500F (151 C|
a Leak rate: 1.0.10,4 cls
Jet loads: 10 psi
• Environmental qualification:
RadiationThermalDynamic/SeismicDesign Base Accident (LOCA)
i P -11 1 11IN 001112 19EMJ

CO A-jP! A 02 STS-0002.1 Rev. I Sheet 17 of 30
FUNUNAL TBEE

V-LV4 inlOw$-1Wull
C#Vst3 VALVC aptluJ w)4UsKccwlC KoCStZatT1@NVLut or Ulf is 1uCAV
"mW POWs ILA Pon)
pWV-Pwqty.o stoJC? WaVs 1* 0ghmIOuc"It4 coulnowiON aim
PtFaIOSW SMU?1 Oll mfe n s UN
rate waltl 1
tionatow wsscs tsu~i eren :S UJ
or Coatims 18411911(W.At ttM 9ML)
VACUUM

I IN
I~L SP' SCIIit
b3%uiUAMdL ti JJsa lol
tp*lMf qg1i1^10"1e/e1
WOUNtw. wtolacomPncts'om
BREAKER FUNCTIONAL TREE
FIG. I
-
--acs02 STS-0002-1 Rev. 1 Sheet 18 of. 30
A1 I 1RF MODFR AND CRITICALITY ANALYSIS TABLESAll "W: M()DF-,q AND CRITICALErt AMU= AIM

£
-AMA02 STS-0002-1 Rev. I Sheet 19 of 30
FAILURE MODES AND CRMTICALITY ANALYSIS TABLES
EPOM Seal."ousing of seal(n disk.Disk support(hard seatl
Avail ofnecessarycont•ct surfacesto ensurfeaktfghtness
Geometricaltolerances notrespected- Geametricaldefects in sealhousing- Geometricaldefects in seal
Nonnommalconmression ofseat.Elastomer seat notcmrrectly centeredSeal dearedat.onteaks
Dimensionalchecks whichguarantee thatthe tolerances arerespected
Catastrophicvalve failure i
* Ensurecentering of softsest
-Setcompression ofsoft seat (EPOMseafl
-Ensurefeaktiahtnness
Loss of seal orincomplete seat('06001
Absence ofleaktightnessbarrier. Partial ortotal loss ofcontact sgfaces -.leaks
Methods ofavoiding humanerrocs duringvalve erection(Unstaffatianinstrrnvionl andconductfeaktiqhtness testafter erection(Preoperatid-08lchecksl.Replacementprocedures
Catastrophicvalve falure
I" -' . -,
U

Amy- ~02 STS.0002-1 Revi. I Sheet 20 ot 30
FAILURE MODES AND CRITICALITY ANALYSIS TABLES

a.
- A.-NEW 02 STS-0002-1 Rev. I Sheet 21 of 30
FAfLURE MODES AND CRITICALITY ANALYSIS TABLES

AAMBWAWIL
JWWWAý02 STS-0002-1 Hav. 1 Sheet 22 of 30
FAILURE MODES At4D CRITICALITY ANIALYSIS TABLES

U
£
-AR 02 STS-0002-1 R~ev. I Sheet 23 of 30
FAILURE MODES AND CR2TICALITY APIALYSIS TABLES
Ill III H "ll 11 11 111, Im mill , 11. sell -- ---I I

w
02 STS-0002-1 Rev. 1 Sheet 24 of 30
FAILURE MODES AtNO CRIT(CALITY ANALYSIS TABLES
ii

A
JrA 02 sTrs-0002-1 R~ev. I Sheet 25 of 30
FA(WRE MODES AND CRITICALITY ANALYSIS TABLES

A
-A-NWAe"Mgmp.
,90grAMO02 STS-0002-1 Rev. I Sheet 26 of 30
FAILURE MODES AND CRITICAUTY ANALYSIS TABLES
COM(etL No. FUNCTION FAIWRE CAUSES EffECTS GU aT(ou WSK REDUCTION 4C1t1CAurYtMODE MEANS UEAXS
Oani•ec F1 13 AvoId Impact Loss of MaladjusimenA Disk oscillations Test an damper CatasrGow'cIaa4s and (uncldon dudnk operation cod gwduuca blihaviour duting valve ft4(usbouncing at and wear in seat and uperationof "un deoltmadons canditias
Openkng andF1212 Guarantee Closin time hichec
cOUBat CIosue Gf than that specitieddisk. Avoidoxcillatons (a (owHlow mods Ongur flud (eak Idew Catastccpbc
valve failues
Loss of (Culd Wde01 Tests on hid Catesuaoptccharactad$s.-s !kicked va(ve bellavi.u, in valve fa.iluta
accident
condiIio-

I m - -- - m 10,11
.A£
JEWETAANEW
ASUWANUM02 STS-0002-1 Rev. I Sheet 27 of 30
FAILURE MODES AND CRITICALITY ANALYSIS TABLES
IIN so 11 m ý I I I

A&M
- -- A 02 ST".002-1 Rev. I Sheet 28 of 30
FAILURE.MODES AND CRITICALITY ANALYSIS TABLES
If
I

-,- .m
d.
-,wx --mw w~ 02 STS-0002-1 Rev. I Sheet 29 of 30
FAILURE MODES ANDi CRITICALITY ANALYSIS TABLES
I
11,11111 1 q , Irm m I m I 1ý I almami'm 11 U

&
02 STS-0002-1 Rev. I Sheet 30 of 30
F~AILURE MODES AND CRMTCALITY ANALYSIS TABLES

U
mu

ZY ATCOMJENTI C _____________________ XZ - M33
:MM'ANTI M'E VENEMIIA CVINDUST1WA S41A.
Page 2
OIMSIfE CIS I- Co~mmh ADSMTB~T
SE z=oI x: as==I r====91~ xND OR=zATtom
A.2 Z. EST SAM= DW=CZPTXCN
A. 3.) CmESM. QUALFZCATION PYR0fAJ4
A. 4.) DOCUM4T OflAN17TON
212=0HU us 4 M 11 PMAXu!NS OP o lTCi (TUOXNO)
3.1.) Il~nODUC71OR
3.2.) TEST ?ACZLZTY DBSCPTION
3..1 30W toot stand
U.2.2.) Loank tt~t station~
8.3.) TEST ZN"STflACTIT2N
3.3.1.) Flow toot stand insstru.mentation
U.3.2.) Leak test instrumentation
s.4.) TEST DATA ACOUUZ1TZON An3~ PflOCESSUiG
U.4.1.) Flow test data acquis./process.
13.4.2.) Leaki toot data *CqUiZ./ProCoCQ.
U.S.) TZST SZOMECS
3.5.1.) Hydrotant
U.5 * .) Proxdlty instrumontation calibration
3.s.3.) gasoline loa1k togto (h~ard zaat and-dis1k coal)
D.5.4.) gasoline low flow tests (Ulif pressurez, stroke/spoad
adjustanents e flow otab~ity with/without damlpo?)
3.S.S.) MIl flow tests (V.3. head + flow curve)
S.5.6.) Systematic cho1cks (L.eaki ratolift forest. proxdimity
probes functional tests)
U.5.7.) Grit ingestion test (silicon flour blow)
U.5.8.) .Ieliability %out (3000 strokces)
I
U
RIMININ MINE

FiFAT *cOM~POMWrTI E I 1D45833
IMPANTI PE1 L'JINMOA EMI4UMMRA 5-0 Pae
IDM&IIONE CIEI
I•v.5.o.) Forei~gn material seat sensciti~vity tests (leak testo
with particles under the V.1.' veal)
11.5.10) Final. Gitasccmbly and ispection
rCWXOtN C., TESTS wPERiiTAM TO wiU'- XCO 1JiSC PICE13)
C.I.) IN~TRODUJCTIONI
C,2.) TEST FACILITY DESCRIPTION~
C. 3.) TZST INSTRUHENTATION
C. 4.) TEST DATA ACOUISrTZOff AM~ PROCESSIN~G
C. 5.) TEST SEOLTENCEC.5.l) Radiation &goin~g
SE~rXON D: TESS MPTAn=34 TO FERZOLI R CZJWMZTI M=WZN)
DIa. flOCTO~f
V. 2.) TEST FACILITY DESCRIPTION~
D. 3.) TEST WNSTRHWENTATIOIN
D.4.) TEST 'DATA ACOUISITION AM~ PROCESSINZG
D.5.) TEST S11CUENCED.5.2.) Thermal agoin;
SEMIORl Z: TETS PElI14N= TO ANSXLDO RxZPJ Mox1A)
*10.. IINTPODUCTICU
V1.2.) TEST AMXGDHEW DESCR.IPTION~
11.3.) TEST INSTRUHENTATION
11.4.) TEST DXTA ACQUISITION A)ND PROCESSIRG
11.5.) TEST S11OUE14CE (Rozonanca search, Fragility test (with
leakcage monitoring), Seismic test (s.3.11. timeo histories
application))
E 1.G.) ACCEPTWCE CRITERIA
Z1.7.) TEST REPORT
1C.8.) QUALTY ASSWUA8C1 REQIIRDMM
11.9.) HA?4ACEMEI OF TEST WNO CONFORMANWCES
M - ,- - KI -1 1 1 owns= 11 -0 M: AMON1111 11111M I 1 11111 lea=

'J] UU!1111 U
S
RAY -COMPONN1 I gD45833
tMvAN ?gR COMMA tLINDUSTRIA .pA.
DIV~ISIDE CM 11 I- SC'rIOW V: TEMr P IT47 flWG TO LU'.0. DIFSA. 2 SPA~ZO
COLLTY900 00%
7.,,) r,•u•'UCTZoN
T.*2.) TEST 1ACZL%1Y DWMCZPlTIO14
F.3.) TEST XNSTflMMTX*O14
F.4.) TEST DATA ACQUISIZTON AMD PRO=C3:.S.Z'G
7.5.) TEST SEQUE)3CE
M.5.1.) basign basis accidont •imuulation
F.S. ) TEST DATA :SDUCUCO"
A) TE'ST SAMP= •CETC
3) FPAT CIEZ tST PROCEDURE, DOC. NO ED 45834
9.1.) fAT CrZE TEST IALL PERSPECTIVS VIEW
3.20) V.3. MOW TEST IACIL2TY INSTALLATION PLAN VIEW
9.3.) FLOW TEST STAN;D LAYMITS
8.40) LEA ST STATION LYOT
3.5.) FLOW TEST STAND NlSTRUHMMATION
3.6 .) LEA ST STATION INSTRUAMENTATION
B.7.) FLOW TEST DATA ACOUIS./PROCESS. DI.A=M
9.8. ) HYDROT•"T CERIFICATS
3.9. ) PACXIMIZTT PRORES C;•1PATXO CERTIFCATE
2.10) LEA TEST CERTIZICAWS
3.11) LOW FLOW TEST CTLCATZ
9.13) FULL FLOW TEST CERZrTICATE
R.13) RE4IAhZIZT TEST S•VAWJ CERTIFICATE
9.14) FINAL INSPECTION CTWICATE
C) HATUI' - ICO TEST PRfCEMMr, DOC. NO It.X./06494
C.1.) WDIATXNG SWURC3 STRICURAL S)ETCN
C.2.) TEST ENVIRONIMEN ISO-DOSE VALUES
C.S.) =M DOSWETZR CALflPATZ0I CURVE
C.4..) DOSZ)= CE=TJSCATTIW
C.S.) DOSE RATES r= MMIMR FACILITY CA,3MILITY DEFINITIOU
C.6.) V.3. PRIMARY SEAL XNSTAMATION
C.7. ) TEST TOOL FOR PRMY SEAL IADIATZON
II
a
0I - , I, - q'IM , , , 'ON I I - I

MOM83FIAT.- COMPONENT1 IIMpIAtfl PgCR LENCRGIA ELINDUMTIA &~P-&.~
IDMSIONE CEI
ID) VFMROUX E GZPI)OTT TEST PROEMRVU, WOC. NO tD45SS94
D. 1.) TREEML~ AMIGST FUIRNAC Sm~Cll
D * 2. r MAE ZN&STRUMEMNTITZON CERTIFICATES
D. 3.) TDMJITUFMR OMER C=,rTxFc1Tc
~)ANSA=~ RICERCM TEST VROCUEWE =O. NO
7) Epp DIflSA E SPAZIO TEST PRO=DUSE. DCC. No PCNVMROOOO1
r.1.) VAMMU VP.EMR MACLMT P.I.!D.
r.2. Nro MZEGNSPPLY sysTm roR LnP. TESTS
F. 3. SZN=LTE= SSVZCC CONDMW TEST PPZIOFLS
I
0
S
islim
MMMM I Ion 11 WWI Ollie 1 11 1 W

I RAT.* cOMPONENl i =D4S833
IMPI4NTI PER LENERGIA EMINDUSITOU C4A
HagH r
DNISI0N 191• . .. -
The lIET ¶W=L to DAYV WELL VACUUM BRS%=R (V.3.) ia one of the safety
relatod components of the CMMUL LCTRZC nuclear power plant with
incr•ased inherent safety S.D.W.R.
owing to its now concaptual design, V.3. safety functions must be
warranted by moans of an experimental qualification campaign porformed
on a prototype unit, as per ZI= standards ne323, 2984.
Qualification standards suggest the following Squvnco €o
tests/Oprations be prform•od on the prototype:
- asoline peformance identification in normal conditions
- Accoelrated radiation ageing on sensitive sbcomponents
- Accelerated thermal agoing of the complete unit
A Application of service mechanical vibration on the comploto unit*
taking into account also seismic vibration
- Simulation og the DESZ= •;zs Acczom2 (D.A.AE) on the unit
- Roeliability confirmation by moans of iterative functional cycles
on the unit
- Final detailed anal4 is of the cub Components
This general procedure roftor to the above-montioned campaign planned
tcr the V.3. prototype manufactured by FIAT CCIOMHT: ZD IMPIAIMr
=L'R,=GZA Z L'INDUSTtZA, CMfl DIVXISION, Torino, ITALY.
The articulation of the qualification campaign implies the utilization
of different toot facilities, honco the collaboration of tovoeal
firms, in details:* the test hall of FlAT CMONENII ED hI4ZANTZ PER L'WMMWA 3
L'INDUSTnR, CIZZ DtVS•CH, Trino, faor V.8. flow tests
the irradiation device of HATUX - 1C0, Ascoli Picano
for radiation ageing
the ifnuaco of FERZOL1 9 CIJRCTTI - T'XTTAHXEI Tr.4ICX, TORINO
for thermal ageing
I-

I
RAT - COMPONOMTI E 4S_33__-.... ._ O 3
IMP•A•1 KR LVENERGIA ELINDUSMIA ;.p.A. _ -.
DMSIONE CIli- the shaking table of •s•NSrAo R=c~cR, Genova, ter muchnic.,
vibrations appl cation
- the -.tzppn cliamber of UPD-Dil'-Si 9 rn'Alo, Colleferro (IOM~) ter
P O.Ax. o•mla•.t~t.n.
There•ore the preuant documant tc composed of sevoeal sectiono
relatting tot
-General refereoneos (Section X), ac:
* reference technical documents
* d•ocriptions of the test item
* identification of the general qualification program, Alto
specifying operative c€qpatencez
* gonoral organization of individual tout procedures
- Detailed operative test proced•res (Section DM) * ropres:eted by
specific documents vritten by the individual cooperating Arms on
a uniform structural gormat.
I
0€
I I I -IMMMMM I

-if
'Xi
FIAT-COMPONENTE =4 I3SI)JPAMO P6N LENEMCL I
LINDUSTIA S41. H HS=!!ow# At CEWJM3 Ia~mm"CM9 AND CrAMZA'JION
C .Z. Voc. NO 2S5A44S, iPov. I* wWat wall to dry wall. vacuumu
breaker - Tact opeCification'.
- .S. Voc. NO 25A5388, Reov. 3., *Vacuulm breaker prototype -
Purchaso tsp~oi5Jcatiori'.
- C.S. Doc. N; -S5A39S, Roy. 0, *Vacuum brokaic
intrumenntation - Test tpocificationO.
- 0.3Z. Doe. NO 253.5489, "Seciaic responses of S=J3 Reactor
- ASK! 1989. Scat. III, Division It. paragraph NZ-62zo.
- MC-10-2-1921, *Fluid controls institute control 'valvo coat
leakage.
- HU.-STD-320 3, July 14,r 1989.
- MTh C131 Drawin~g No 2T137684* Rev. I. and 2S137714. Rev. I.
"Vacu.um breaker general assembly and cutline'.
- G.S. side letter of July 12. 93: leak rate testing suggested
conditions.
G .R. side letter of Sept.21. 93; DBA test technwical. detailed
conditions.
-0.3. side letter of Doc.l. 93; V.D. radiation environmant
dazinition.
10
U
Ie

C045633RAY - COMPONCNTI E ... 4 ..IMPIMA PER LENERGIA ELIVNSTR;A 81.A. - '
CMVSIM JCEI
XL.2) 'rz3T D~'. ES=PTIOH
The V.S. is a low pressureo poning and gravity aisted cloting
chock valve, vhich vents, the vat a,oll to the dry woal of the
SM. A general sketch of the V.D. prototypo ic shown in
Attachment A; its principal foature: are:
- a cylindrical body, provided vith four discharge nozzles
- a vertically gqudod soaling dick, equipped with the primary
clactaomr soft ceal
- a metallic hard coat#, acing to the coaling dick and acting
at a secondary coal.
- a double acting damping device, optionally mnounted in line
with the atom of the cealing dick.
additional provisions of the V.3. shown in Attachment A are:
- a act of prc~imity sonors, to detect any displac~mont of
the cealing disk.
- a ballast weight, placed an the coaling dick to adjust the
operativv lift proccure.
- A flangod stand-pip*, supporting the V.D. and simulating the
real air flow duct of the V.D. installation arrangement in
the SD3R building.
outlet and inlet scrocnz, acting at anti-micasio dovice; in
the SDW1 plant; they are assembled on the V.S. during the
flo, taste of the qualification campaign to reproduce the
total hand Icos of the nominal V.S. system.
lefor•onco technical data for the V.S. arc the following:
- iatorials;
" V.D. body i 316L stainless steel
" Scaling dick: 316L 0 t
* Hard coat: 400 serioa otainlocc steel
8I
El
11 1 P I I I I I I 1 .1 1 NM I 91 11 9

'I U
A ýV.
tv I
FIAT* COTONE4TI I I D43 33 iIMPWT PMR LENVRCI*. EL'INDUSMhA S&pJ-
DWIDNE C39 1- v.s. total weight: 1.280 da N~ (2800 Lba)
- operating tamp~rature range: 2779#44499 (400+3400F)
- operatingq protsrnisO" Max differentzial presurex in the closing direction
well3 to ¶wot wall): 241.3 KPA (35 paid)
" Max~ differential proazara in the openin~g direction
wall to dry voll)z 20.7 KPa (3 poidt)
I
Neat
- process fluids nitrovon. air, steam
- v.s. minimmwc pactod equi~valent rouaof/f 3ev area: 9.67.10-3
M3 (1.04 fact2)
- .DI. expected opening not point: 3.45 ICP& (0.S paid)
digfferential pressure I wet wall to dry veil)
- V.D. expected operating response time:
*opening time with~ 3.*45 XPS (0.5 paid) d±Zfocontial
pressures 5 ace
closing~ timeh with 0 I(Pa CO paid) differential pressure: 5
sac.
m
SaV
- impa-mlar, ORM S I'lliýiiii2itim

4
-~ fiir~~I
R~AT -COMJPONENTIf E ED45833
I&IPANT M~ WHERJfGIA 6L'INDUSTRIA S.P.A. Page J.J.
DMISONE CeI
AL.3) CMWAL 00 FICA.TCW WROCIW4
Table I chowe the detailed V.S. prototype gancral qualificatioan
program In tarm: of:
- touts/activitioc identification
- tactc/activi~tiec attribu~tion to tho individual cooperating
- reference to the cpacific ppragraphu of the general tact
procedure.
.91 1 1 . I I gi 131M
!_ Li.rqutJ•

U
4-0
PLAT .COMPONONTE X043d833IMMPIAN! E8LNERCIAVINDUSTRI &LpA Vigo
OMSIONE CIOI
'z~DL 1: .D.V.R. VACVJH? 23hm pr4OTVBP
OMMICAQULZOTION PZVCJI
Toets partaing to Soc paragraph
Activi±ties
JL) •I.'dotosti: * 3.5.1
2) ProxiMity inatrumon- 3.5.2tation calibration
3) DSaolino leak toot *.5.3(hard goat ana diskseal)
4) anaoline low flow * .5.4tests (lift* pre-ur.,stroko/spood adjusto-,mo•.S, flow stability
with/vithout damper)
5) Pull flow teats to.ut.CV.D. head 4 flowcurve)
6) padiation agoing C.5.1.[on the disk soal)
7) Systematic chocks D.S.6I leak rate)
8) Thermal agoing 0D.5..(co•plete V.0.)
9) Systomatic chocks 9.5.6Cloak rate, lift fO ceproximity probesfunctional tests).
01
i

IMYAT.COMPONENTI E __________________ ~S
IMPIANV PSR L'FJMRIA E-______ ____________
L1NOUS1RA 64L&A page
Testc. Pertaining to Soe paragraph
Actitvitie S 49
10) ROZOnAnCe Cac h * 1.5(Complato V.D.)
11) rragility tact * 1.5(with leakagemonitoring)
12) Seismic tact E.
application~)
13) Zvvtomatic checks * 1.5.6(leakc rate, liftforce, reowdrnity
.probes functional.toate)
AM14) Design basic accident F .5.1simulation (completeV.13.. with leanicagmonitoring)
15) sy~tomatic ChOCIM B .5.6(leak rate. liftforce, proximityprobes functionaltests)
16) Orit inges~tion test *1**
(silicon flour blow)
17) SYstematic chocks B .S.$(leakc rate. liftlorca, proximityprobes functl~naltentz).
.AO
IF 031wim

I
PLAY - COMPONEDf E I =4SS33!1NIMP& PER VENERCLA IVINDUSTRIA S41A Page.1
DMSJON9 CIO
Touts Pertaining tO goo paragraph
18) RoliJabil•.y toet 9.5.8(3000 stroke$)
39) Systematic chocks * .5.5(Coakc rate, proxmityprobes functionaltests)
20) Foroign material * 9.5.9soat s$nsitivitytests (leak toStsvith particles undertho V.D. coal;for information
21) Final dis:assembly D.5.10and Inspoetion
'54.
0a
5I

RAT- COMPONENTI E . .. 4SS33
IMP= PER LVNERGIA ELINOUSTRIA S.pVA page I
OWGIONL OEIS II
A-4) DOWUCW OR~NZathno"
Operative procedures for the different kinds of
tQotG/activitle: of the V.L. prototype qualification program
arc defined in the spocific documents writton by the
cooperating fiJrms, attached to the present general procedure.
Each specific tout procedure has the follo14ng stuctur.o:
- a goneral introduction an the operative backgrou•md dealing
with the poerormance of the teste.
- a description of the tact facility arrangement, fitted with
ref erence, sketches:.
- a description of the taet inctrumontation, explained by
moans of a flow diagram.
-a •description of the data accuition and procoancia gm.
holped by simplified block-diagramc.
- the identification of the toet socyence, with f ollowing
details explored for each tosti
* teat sot-up prereiuicit•s
* toot porformance oS ative procedures
t ret data rcording~ requirements
*tout standard record: to be utilized
tent results acceptance criteria
2
4,.
.2 I
I

I
NAY -COMPONENTI E ED53
IMINOW KR LENERGIA UI E453LINOUSTRIA M. page
OMSIONI Cl 1 I- SRCTZOI 10 z Tsm prd P aIUZ To ?Zxv CM (MMOxIo
(soo, Doc. FIAT C191 as ED 451134, Attachm. 8)
- ==erON C : EMS PEiXTfl)C TO UATU'.!O (1ASCOU PZcl
(gsDo. c. HATV*-XCO at 05494 Attachzn. W)
- S=09l D a 7~TE PERTIZ1G TOFLVRhOL!_UCV13RO? (TeanolC
(Sea Doc. FIAT CIM nom =45894, Attaclo. 0)
-SECZ~tI r TS mmTS to~AfU~ TONSXLflO 3EXRNCERMIOA
(see Doc. Antaldo nom TCE.MZ.S.1001t Att~achzu. 9)
- ==00 I TESTS P=XmmI1 To 13.P.0.- ODWm I SpA!
(cMZMWM3O - -tRMM)
(3oe Dc*. DIID. nom PCHfVBROO1., Attachin. F)
0
0I
11 Z I I I I lag

I
"t..
LEGENDA
t. DAMPER COVER
2. V.. HONET
3. LEAK TIGHT TEST FLAME
4. OUTLET SCREEN
5. V.8. BODY (4 NOZZLES)
6. CABLE POE?'IrATIO18.
7. PROXIBITT PR6BES (5 ITEIS) A.[MACCELEROEIE"R
' 8. REACTOR 8UILDIKM FLOOR
9. V.B. SUPPORTING STAtND PIPE
10. INLET SCREEN
11. DISK STEM UPPER HE.RIHG
12. L4X'ttR 8EARING WITHANTIROTATI ONE IDICE
13. v.B. SEALING DISK,
14. SOFT. SEAL
I5. HPRiD SEAT
16. AITICHAT'ERIt( DISK
17. BALLAST WEI'HT
18. AM.PER
U
U
MY -COMPONENTI E 453
SILIPIA"I PM~ LENERGIA ELINDUSThZA S4LA.
DMSONE C19I I
7UT? CjZX DOCUMER, V8 2 4S934
PUT. Cl= T~T PROCMRK
I
H
0
a
81!

PzAT -COMIPONENTI I ED45833 D54IMP$ANM PCR VENERGIA E D53 j
WXVISIONE CII0 page I
WXXnE= TYPE: TEST VPD=URE
XNTEPMhL CaZSFXCAflON: Us 97/93
TZ,, s s.s.w.Rt. vACuu DnzAJn ma.~. s OTOTVP
EYMXNEWALCUALIPICATION
FIAT C!E! TE.ST PflOcEDWE
JOB No t C336SO
0A7UTO=S:
- P. Pasollo- P.C. Ferrero
- 0. Lingua- C. loglia
- C. Partiti.
TMc prevent document it th@r section 11
of theo vacauum brOAkor prototypo genarga
tOr-t PrOCOduro. FIAT CZEZ Doc. n. ED45B33
I
M7 66fjiz z,o 2/15/1994'ZLi. VW e-
C. PARTXTI C, PARTITZ PAR-A __________
A E. DATA EMISSIONE VERIRCA APPROVAZXWJ
p.I
- I ý %M%922ffizw I I q ".1 repli , - p C M

U
71F -- -
F•IA, C0MPOgNIE - a5,•tS33 =45S834IMPIANI1 P94 LEN0GIA ELINDUSTRnA S.pA....CIE ..-I, • • . .
SUwIARY
73.2.) 1)aTnoMCT1oI
D.Z.) TST P=~Lxrz DMM2PTOR
Is. 2.1) Flow tout stand
9.2.2) Loak toet station
3.3.) TET Z•S) GTZO
U.3.1) Flov tout stand inctruontation
D.:,.2) Loak toet station instrumontation
4.) SDM ACVIfSMoZ WaO PROaasao
B3.4.1) Vlw~ toaut data acquis./procams.
U-.4.2) Loank test data acquisi./procons.
U
'B.S.) TE. SZO) • o
cOt
s.5.2) Proximity instrumentation calibration
3.S.3) Baseline loak toots (hard :zao and itU seal)
3.S.4) Baseline low flow touts (lift praessre, stroka/spoe4
aijusteonets, flow stability with/vithouat damper)
U.5.5) Full flowl touts MV.D. hoad/flow curve)
5.5.6) Systomatic checks (loak rate, lift foroe, proximity
probes functional tots:)
8.5.1) Grit ingestion tout (silicon flour blow)
9.5.8) noli0ability tent (3000 strokes)
U.5.9) Foreign maatorial scoat sensitivity toots (look touts
with particles under the V.D. real)
D.5.10) Final disassembly And. inspection
0

RIAT -COMPONENTi f C04 5833IMPIANTI PCR LINERGIA E PaD4521L'INDUSTRIA S~p.A.Pae2
Il ~ VOLVO 3
ATTACS1ZNS:
0.. ) FIAT CIEz TEST RALL PERSPECTZVE VIEW
D.2.) V.W. FLOW TEST FACILITY INSTALLATION PLAN VIEW
V.3. ) FLOW TCST STANID LAYOUTM
V.4. ) LEAX TEST STATION LAYOUT
U.S.) FLOW TEST STAND IfWSTfUCNTATIZO?
v.6.) LEMK TEST STATION INSTjWENTATION
V.7.) FLOW TEST DATA A= 4h$./PnRCESS. DZAGRAM
BS. * ) HYDROTSST CERTIFICATE
5.9.) PROmKXTy PRo•D; CALIx=ATxON CERTIFICATE
8.10) LEAX TEST CERTIFICATE
8.11) LW FLOW TEST CERTIZFCATE
3.12) FULL FLOW TEST CERTIFICATE
5.1.3) RE4ABZLIT- TEST SUMMARY CERTIFICATE
8.141 rINAL INSPECTION CERTIFICATE

U
iL j 'K,
RAY • COMPONEN11E •145R33 E.. 5934MUMMANf PER L'ERGA E
CIEI Pago 4
10..) XMflODUCTIONI
V.S. prototype O"IWt TEST's, "Systcinaric Functional Controlva and
"Re8iabi1ity Tout" planned in its oapeprimental qualification
campaign vlil be run at ESI/•FVAT CZnZ t•et hall "A. Pogagnolo"
in Torino. The tost hall was built on the beginning of the
aightios with the financial participation of LIMA In order to
su~pply toot devices to the italian firms involved in~ the late
national nuclear power Program.
The tost hall porapo.tivo viov of Attachment 3.4. shows
following pwincipal facilities:
-the Primanr Pump:g Tent L022, for P.W.IL and 3.W.R. primarxy
C.C.P. functional toeting in full nominal conditions [16 MPs
(2250 psi), 5630 1( (552' F). 8Wl/sec. (130.000 CPm), 10 M]W
-the Auxilia.y Pumps T"st Loop. for nuclear and conventional
service pumps tooting in operating conditions and in sovere
upset conditions (thermal -shock) [2HPa (290 psi), 473OX
(3920?), 0,9 m4/00o. (13.000 GPm), 10 H4W)
the Machanim•s and Valves Tost l•po, for functional and
endurance tosting of P.V.R. control rod drive mechanism and
nuclear and conventional auxiliary valvo•s 16 la (22SO psi)
S53OX (552* F), 8 10 "2 m3/soc (1300 GPM) maximum
simulated flow].
Attachment D.2. shows a plan view of the toet hal whoere the
installation of the two teot devices in indicate., the "flyo
toots standft, and the "leak toots otation". Following auxeiliiry
y:toms/it£ma of the toot hall are utilized during V.3. tests:
- low-voltags (380 V) power supply system
- nitrogen central supply system
U
I IV. 'M . 1 1. MHENIM. I rallik-ORRUM

MY -COMPONENTI~ EDEMMA
WIMNANil KR VENDI~GIA t 3[ao~
orEM PX2
- toot data cenra~al acquistilton and prcotaing systom
- instruments Calibration laboratory
- the Primary Pumpc Tact Loop 4nti-noizo structure, built for
P.W.R. R.C.P. testing
- general lifting devicoz.
Assemb~ling -and ditacacinbling operations on the V.U. prototypo will be
performed by CrEX sepcialists comsing from th a nuclear comzponents
assembling haill w ho usually act in collaboration vith toct hall
personnel.
M
Ing Irm IN. InNIOBIR

a
RAT.- COMPCOENTI E ED45333 =451134UMPANT K~R VIN~FACIA E Pp~ 24 ----- jVINOUSRhIA S.VA- Page SCDl
7. = V)Tt ACVLZT rz=%pnow
2.30.. Plow Test Stanid
Atachment 3.3. thows differont views of the utand with
its over all dimensio ons and its principal structural
zaaturas.
The general stand arrangoment Includes:
- A fan, supplying tho air flow to the V.S. prototype,
W10o5o technical data arc:
* Type : centrifugal, reverse blados inipollro.
single auction* Nominal flow: 80.000 mn/1hr (2.84.100 f1%/hr)
* Nominal head: 800 mm U20 (31.S inches of water)
*Speed: about 1490 rpm
* Powe•: 220 X3
-A fan aution regulating valve, to totally inltrcwept
air flow during fan start-ups, and to perform a
gross flow rogulation during the test.
A. floxible joint, for vibration docoupling of the
stand piping.
A discharge flow modulating bypass with saveral
purposes%* to avoid unstablo fan performances in the low
flow region
" to allow continuous fan operation during V.S.
repeated functional cycling (reliability tosts)
* to increase flow regulation sensitivity
" to allow a precise identification of the V.S.
opaning differential pressure (lift. pr'es'-ro)

RAY . COMPONCNfI E 1__1_ _ _ _3 . ... 3D45834
IP WI PER L'E NE GO L& E .. ... 2L'INDUSMIA S4p.A. Pge 25
CaI Page 7
The by pats includec:
* a flow regulating shutter type valve
& a fixed flow calibratiton gata, set to obtain a low
ctatic proesure under the V.S. disk uhile the fan
ditcharga; itc full glow through the by-pacs, acrscc
the fully open shutter valve.
- A flew voins straightener, to increase flow
meaturements precivion
- A pipe connection vith section varying from rectangular
to circular chap2
- A horizontal duct made of circular thin valled pipe of
1 m (3.3 feat) diametero 2.5 x 10-m (00,1 inch)
thickness. 15 m (49 fa•t) length, required for standard
f lov moasuremnonts
- A bond and a vertical pipe •egment of the came
dimonsions
- ]k V.S, Octard pipe" mock-up 0,5 m (24 inchas)
dia£oter, 0,660 m (26 inchesl lonqt• showing
* at the top end, 4 150 L9 ANSI 916.5 SCH.20 flange
rupporting the V.S. prototype
* at the bottom and, a cructiaral flange carrying the
inlet acreon and bolted to the vertical pipe segment
- A V.S. supporting structure, partially made oa weided
boeam and thowing a detachable section to facilitate
diasasembling.
Tho atructure rests on the from of the antinoisa cage
and on the massive pump caving utilized during the
P.W.U. L.C.P. tests.
- A anti-noieo structure, made of coun.d absorbing panals
and equipped vith doors, operative floor% and an
opanable roof allo-ing l~temn handling oporatazon.

m
i gill P I
IRAT* -•O•PONEXTI 1 1_045833___4534IMMWT PA VENEA I- Page 2 -45334
LINDUSTMI SPA.Cl.I
The •l•w stand arrangomont includeu al:o a low
porfor-mancos auxiliary fan installod on the primary fan
caving is a possible back-up for lift prossure-low flow
tests. Indicative toecnical data for tho auxJ.l.lary Zan
are:
- nominal flow 1 500 Mi3/h (17700 ft'/hr)
- nominal hoad : 525 mmllo (21 inchoe of vater)
the utilization of the auxiliary fan might be roquirod by
a possiblo lack of an •.itivity in the Montifica.ion of
V.D. charactorintio parmamters at low flows. T1bo primary
fan auction valve vwill be full. closod and the flow
modulating bypa•, will be pluggod during auxiliary fan
operation.
o1
--.-- -- .'__.__"m • __ __+:I ... --___.l- I' ' -- E M P+ +•• .. _

FAT- COMPOCM E ED4833.- .. ED45834IMP1•AN PER LEN1 C Pa~o 27 FaLONDUS•IA GOA Pag 27 -page .CIEI9
U.2.2) Leak Tent Station
Attachmant ID. 4 show thit multi-purpocc ctaticn,
Identified by meant of its prevailing function. The
station really asts ass
- a generic V.S, prototype support for any service
operation
- X V.D, support and proccurizod water supply durinq
hydraotes
- a handy V.1. support during proximity instrueontation
calibration
- a fully equipped station for V.S. systematic leak
Main matures of the leak test station arc:
- the V.. supporting cant, tailored for easy assembling
and di•oasembling of the tost item
- the domin•ralizod water supply system, equipped with a
tank, a pneumatic charging pump# isolating valves and a
prossure measuromont section
- the nitrogen supply cystom, equipped with a procsure
reducer, a safety valve, isolating valves and a
proccure Measurmeont section, and connected to the toot
hall general nitrogen cupply syatem (racks of nitrogen
bottles vith a sequence of pressure reduc.'ro)
- the leak conveyor covert to be assembled to the V.S.
bottom In order to detoct primary seal leaks by means
of a small diaeteor tuba -ubmergod in vater (fce.
A"SI/MC! 70-2-1191, note to table 2, pag. 7).
Complementary features of the leak tests station are:
- the atmoopheric preasure high precision monitoring
system available in the instruments calibration
laboratory of the tost hall
El
s~.

MAY *COMPONMEN~ ED-45832 MOM33
IMP(ANT PER LENERGAIMSR A E oo2ONDU RIA810APag 29Pago 10
- tho ambient temnperature monitoring devices available
for generic tout hall services
- the 4 leak tight tout flaniges su1pplied with the 7.3..
for disucharge nozzlesouecaurc during leak toots,
equipped with a fast 3cint. tovw ater and nitrogen
supply.
I I I I a 11 : Jý !M I MOMMIcaffim 101111 1

FIAT - COUPOWENY1 E££a 3. .. .•)53I&IP]MT KR LUERGIA E CD483
UhDU"MIA S~OA Pape 2
CM VnqG 11
D.3.2) Plow Tnt Stand tnctumantation
A schematic instrumontod flow diagram of the flow to:to
stand Is Chown In Attachment B.b.
Following Instruenntation i- foresoon:
- hir flow mncu~remunt and rocordingi tec1n. data:
7 Wlow sencori
" typo multiple Piteto tuba
" fiow rangoe 0+B0.000 m4/hr (O.2.94.10dta/hr)
" nporatSive toniporaturate ambient
" air spooed 29 m/cot ... (95 foot/toc)
" procicionz It of Lnctant flow, over the full
flow range
*Differential proccure tranaducor and square root
*oporator3
. power supply : 24 VVC
. output signal: 4+2O m• Iproportional to tho
flov). precicion: * 0.5% full acale
Digital indicator:
. led type
. 4 digits
. power supply: 22CV - SO hz
* pr•cision : * 0.251 full scale
-V.S. differential prersvure moasuroment and recording
tochn. data:
Re&lative pressure tranoducer:
prossure rangeo 0+1000 mn=RO (0+40 inches of
water)
I•
; ~ ~mr E I -$rjxj3j U N

FIAY- COMPONENTI E =E43834IMPIANTI PER LENEGIA E page 30LINDUSTRA SpA. - page 12
cisPaaZ2I
" po•ur ouppl1y 24 VDC
• output signals 4420 mA
" proclsiont 1 0,2% full scalo
Digita indicator:
* LED typo
* powor supply: 220" - 50 hz
* prociuion: t 0.25% full scale
V.B. disk accoeleation •oacuoament and rocarding;
tochn. data:
Acceleration trazmducoa:
t typos PcM 308804
m moasuromonut rango: t 50 g
ScporAtiLvu tomporaturot ambi.ont
, resolution: 0.003 g
-Mr tomporature measurement, tochn. data%
*Ttanporaturo sonsor:
*typo: TE1UOREZ5!STANC3. PT M0
* tomporat. rango: 0 4 2000C (320 4 3220P)
, procision: t 0.2S% full scalo
Powo: supply:
* CO Mfl ohm/mA, 24 V DC
* output signal: 4 + 20 M1
* procision: t 0.25% full acale
iOgqital indicator:
LED type
3 digits
p power supply: 220 V - 50 ft
, procision: t 0.25% full scalo.
U
mfflmmý Mt v yp R q I I RIM I I I IMP F III 1 .51

FIAT - cOMPoNE"i EIMPLAJJ" KR LUEREGIA EL1NDUMIFA GSPA-
ED45833.IM45934
Pago 13
-V.I. dtisk displacement ionsauremont and recording
(instrumentati.on and electronics cupp1l.od by G.E.d:
toclrn. data:
Pr~oxcimi.ty convors:
" nO 4 "K~aman" KD1950 extreme onvJironmant prober
" nt I Kaman" )tD1g75 0 U U
*Signal amplifierz
" aO 5 OKaman' )Xfl-9200 clactronico modulo*
" output signal, OM3
*Power supplys
0 1. 3V/42ffP half-rack enclooizre, 220NV
50460 hz
Attachmant 3.5 i~ndi~cates also pvowr supply and contcrol
davicos for the motors ot the primary and auxiiary
fans of the flow tests stand.
U
Am 2
I - 31 e WN- I lip FISM I INN I ý I I I I 11M I

FIAT- COMPONENTIE 20s33j~ 4S834ZMPIANTI PER LVENERCIA I Page 32LINDIJSTRIA S4" ag 1cisI1
3..) -ak Test StatiSon Instrumentation
Attachmont 9.6 shows a schematic diagram of the
instrumentation equipping the mlmtJ.-purposo leakc testa
station an~d including:
- 1ydxrotast pransure mozouuowont:*instrument,. BOURDON pressurcr-gaugo
*prossure tango; 041 4Pa, (00140 pui.)
precstions 1 11 full acalo
- Leak test pronsura moaturomanti
"instrument: POUDO pravouro-gaugoU
" proacuro tanqw: 0 + 160 KPa (0 4 23.2 pai), and
0 + 300 lKPa (0 + 43.5 psi)
" precision.- * it full Ocala
- Timuu* measurements
" instruments 3740U1
" revolution: 0.2 sco
Lank testsa tation intumtntation co... lomontary items
are*.
- Atmospheric Parsto moasuremants
" instrument FOR~TIN DA3OMEMR" precisions I mmnHg
- An~biant wtpa~ratuwe measurement-.
v instrhuments GIIJSSA?. MD. DP41 DIGITAL
* precision: i 0.26C (i 0.186T).
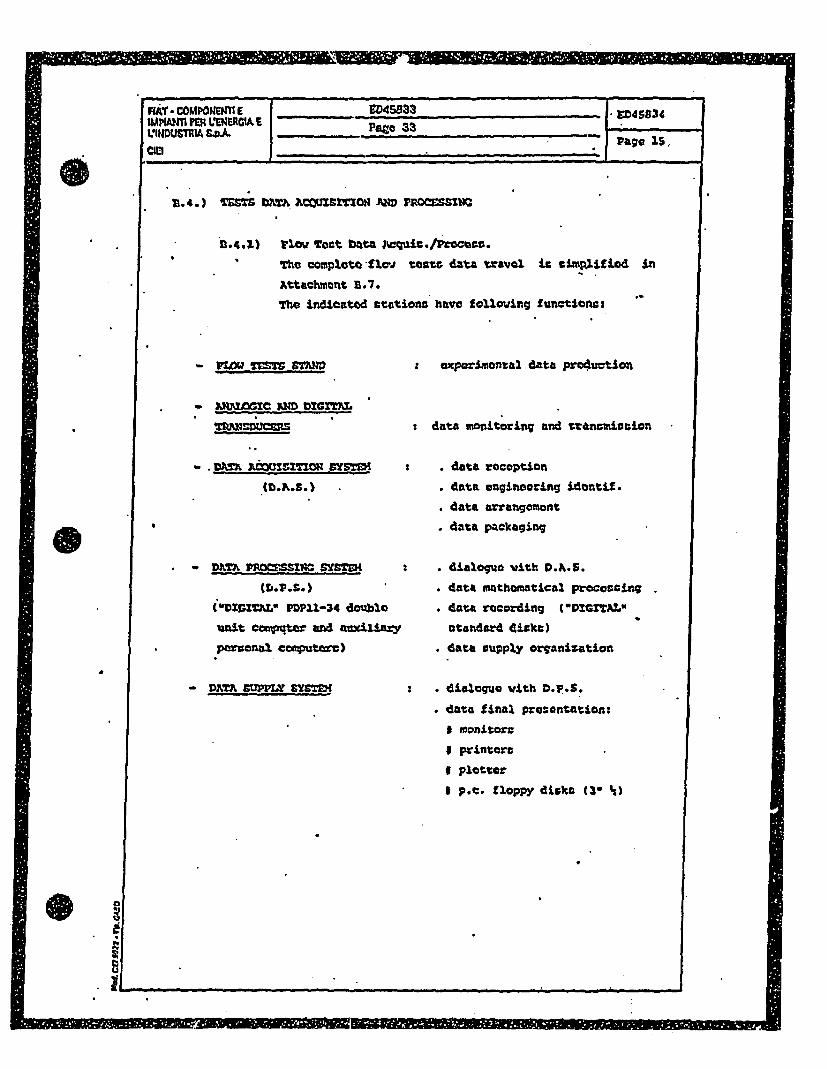
m
FA*COMP~ONEO*Y E ED45933W1'PANTI VRIENERGI E Page 33L'IND "A SM.1CIpe
D. 4.) TESTS W=. A 3=IOSMZON AMD 1PiROSSINO
8-D4.30 VICW ToCt b~ta 3!cqdUiC/VrCCo'~~rt.
The conp2.ot* -flov testc. dat~a trwavel it ctjcp~lf Lad in
Attachmen~t B.*7.
The indicatod ctaticna have following functions3
- VWM ~TE ETA=T
vM 1J 0ussmom ?JDbcIT?
4
VX DTJL P1POMS114C SYS=g
(iDvlomv PDPII-34 double
unit cavputer we Auxiliary
powonal Computoc)
experimental data production
data monitoring and trunicaion
. data reception
. data engineering idantif.
. data arrangement
. data pacicaging
. dialogiue vtb D...S.
. data mathomatical processing
. data recording (OMITAL"
standard dickt)
. data suipply organization
. dicacqoue with D.r.S.
* data final presentaticon:
I monitor=
a printorc
# platter
I p.c. floppy diska Ow '
U
- DATA SUPPLY SYSTTM
INN
- .PMIM IEN. q 11 19 1 11 11 =00 Igo . 'I P 1 1 1 111 1 ý SM IIý I 1 -0 M EINIONSM.

PUT -COMPONENTI 6 E045834JUPIANT PER L0JM9ICM I pg 3LINDUSTMA S.PA. Pago 34CO Page A
U.4.2) Lan Touts Data Acqui•a./pocess.
During V.1. primary/occondary saals loak touts no
automatic data rocording/procosning Ino foroson. Ali toots
data vwil be vioua.ly acquired and manually rocardod on
certification standard modules. Pollowing general
philosophy applioe to the planned loek toots:
I" R:I: Atte•pt to perform the loeia test W moans of .a bubbles
count, (a ps"r JITZ/CI 70-2-1991, note to Tab. 2, vitlh
povoublo different levels of vsal pro:nurization)
incLudings
* tout equipment set up
* V.I. 3oal diffrential Pressurization
*leak stab£ii:ation wait* direct bubbles count during a measured time
(bubbloz/min)
* transfornation of the bubbles count rate into a
otandard loak rate (atcc/soc)
-2"0 ztep: _Laac test- pertormtnne. by-moans of a "Prescurv lasso
meanur. wnt, if bubbles count results are not reliable
Itoo high bubbles production rate); folloving operative
schoem is adopted:
fINITIAL C ZMiCt3 - FflAL cCNDITZO='1 T 'I>
a i.e'
where: tv controlled prossur:£nd volume (cc)# constant in time
tl u initial taut time (ace)
pl initial relativo pressure in volume V (Pa)
Ti initial ambient temperature (eX)
Pato, initial atmosperic pressure (Pa)
t2 final tout time (see)
ý2 '7.
4-
I
I I I M- III MF a I I
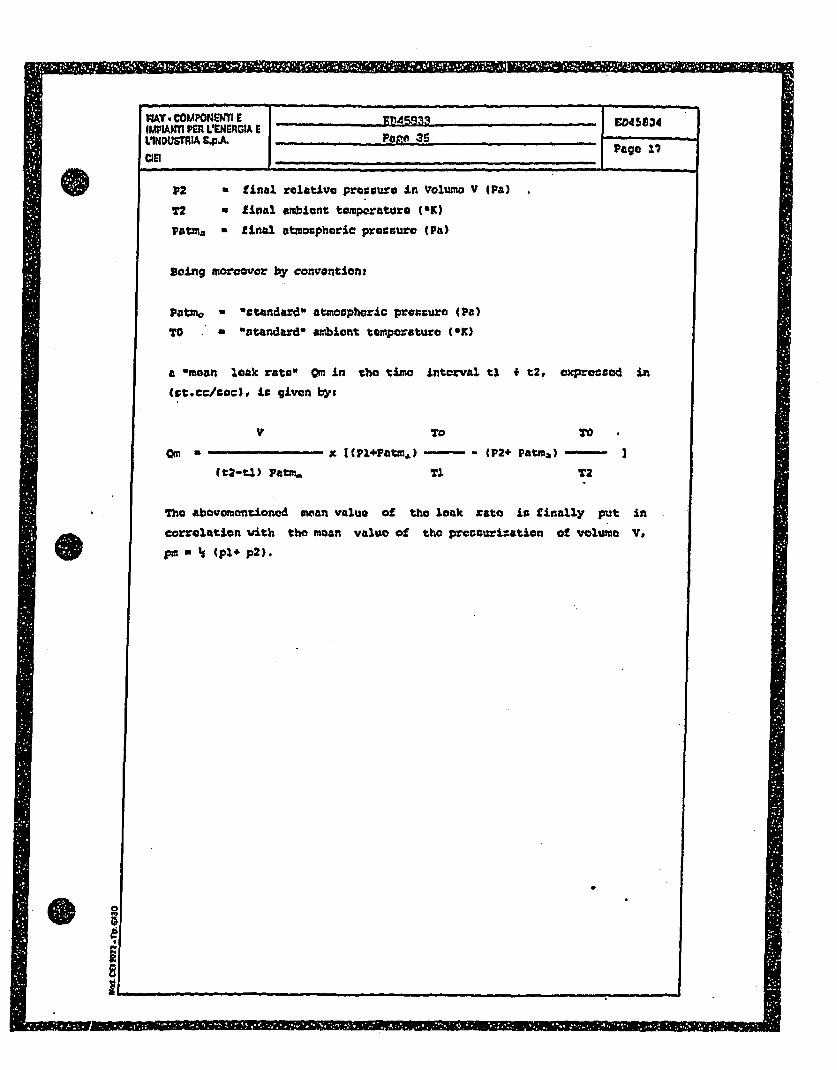
MqAT.- CoMPoNOMn E Eo45834
.....MI --P "ae3 Page 17CRID_ : . .. . .
P2 a final relative pressure in Voluma V IPa)
T2 a final ambient temporaturo (OK)
Patma -f a final atmospheric pr:esure (Pa)
voing moreovo•r by convention:
Patmo - "standard" atnmophoric preacure (Pa)
TO a "standard" ambiont temporature (0I9)
a omoan leak rate" om in tho timo interval tl t2, oxprozzod in
(;t.cc/0oc), to given by$
V To TO
O = x [(Pl+Pat..) -- - (P2+ Patm4) - 3( t2-P.1 Patm. TI. TI2
Tho abovoemntionod moan value of tho leak rate is finally put in
correlation vith the moan value of the preCsurization of volume V.
pm * Is (pl4 p 2 ).
U
-IIg P @ 10

U
TAM,
FRAY- CO•POENTIE ED43833 ED4S834IMUANTI K-R V.'NERGTA E ... .. --- 4
L'INDUSTWA Sp.V Pa-go 36 Page Is
ciPage 18I
B.S. I TZST SW~UM=
U.~.) Sl. 1.1.Ne:-re:cruisi1tes
a) V.S. nominal primary seal replaced by a
conventional commorcial seal, envisagod as
a test tool only for hydrottest performance
b) Proximity probas abeont. cable penotVations
replaced by plugs.
€) Leak tight test flanges ass•mbled on the
V.3. discharge nesales.
d) V.•. prototype placed on the supporting
seat of the loak tceot station and connected
to the dominaralizod water food line.
o) Domineralizod water tanks fillod with water
at room temporature. 'Vater chomistry
certificate available.
f) All isolation valves cloa•o.
•.5.1.• 2.) corativo procoduro
a) Open filling valves and fill the V.D.
prototype vonting by the plug of the cable
penetration on the bonnot, and by the
damper cover. Close vent:.
b) Isolate the filling line, open the vat=
food valve and start up the charging pump
with V.3. internal prossuro control.
c) Stop V.3. prossurization at p a 325 XPa
(47.25 pei).
Shut down the charging pump and clote food
water valve.
M.aintain this preasurization a minimum of
10 minutes: if necessary restore pressure
with the charging pump.
Ieqeq2
.1lip Irl

MYT. COMPONDM E _ _ _ _ _ _ _ _ _ _ 4591d1MPIANTI PER VENERGIA E - -
LINDUV R .IA •9 . - mgo: _ 37 Pag .O
VEI Page Lg
~~~1I
d) Open food water valve and reduce V.b.
intornal pressure to 245 Ka (35.5 put) by
meant of the discharqo valve. Cleoe •e•d
water valve.
Maintain this proseure during e xaminattion
feo leakage of the V., s.ctructure. IL
noccasary raetare pressure with the
charging piM.p.
Ls._. Direct away from tho surface of the V.S.
any leakage from temporary seals utilized
far the toot, to avoid masking leaks from
other jointi.
o) Open food water valve and ,deptocouizr:e the
V.D. by moano of tho discharge valve. Open
the venting plug on the bonnet and unscrew
the damper cover. Open the drain valve and
one of the bottom cable penontraion plugs
and ,mpty the V.S. Close all itolation
valves and di•connont the V.D. from the
water supply system.
8.5.1.3.) Data recerding
a) During the top procsu•ization phas•recc•d
. top pressure
. pressurization ti•o
b) During the leakage examination plhaot record
Sreduced pressure
. pressurization time
* any leakage from volded loints,
connections, regions of high otroes,
thickness transition sections.
®N

n
MlAY.- COMPONENTI E~NR E045834IMPIAIII PER L'ENERGIA t
LINDUTRJA 4LA.Page 20CIEI I
U.S.1.4.1 Standard rntcrdS
Test data will be racordod on standard form
shown in Attachment U.S.
D.3.I.5..) Acepntance criteii
No 1ea~age in accoptable from w.elded joints
and atructural parts of the V.3. prototype
body.
Leakcage of temporary seals, installad for the
purpose of hydrotest performance# may be
permiltted unle3ss the leoakage exceeds the
capacity to main~tain system test pressure for
tho roquirad amouant of time.

IFTAT- COMPONgln E jS D433 .. 4SU34
I IMPI•Afl PER LIENEGIA 9 " 45I34
IIL¶NOU!TIA G.p.A. Pag Pa;
co Pago 21
1.S.2) Pkaximity Znstruwmtation Calibration
.5.2.1) Preo-rquisitoe
a) Proxidmty probes installed on the V.D.
prototype, equippod with nominal cable
ponetrationc, and connected to thoLr
electronics modualo by prototypical cable
lengths.b) V.. prototypo placed on the supporting
ceat of the leak tcst station.
c) Tent flanges and discharge croeon; absent
(freo i€chargo nozzlez)
d) V.D. bonnet unscrewod and equipped gar
frequent handling.
a) v.. disk stem . equipped for froquent
liftings and lowerings
f) V.8.-dick nominal primary coal absent
g) Calibrated chi= and guoalo gauges
available.
h) Probes electronic• power supply available
L) Dick' and ceating ring mating surfaces
cleanness inspoctod.
1.5.2.2.) gporativo procedure
B.S.2.2.1) Vycten accu-acy/repe-tability
domoutration
a) verify probes bohavi4ur at varying
disk/ceat dictancon placing sots of
calibrated shims (3 chims each time
at 1200) undoe the disk of 0.76,
1.018. 2.036, 2.54, 3.8.10"am
(30,40,0,100,150 milt) thicknocp
and back for ,oior probes testing
and of (S-2576), (5-1.764),
(8-2.782)p (9-3.04), (9;-3.8)10--a
thickrao:; and back for upper probe
te1sting, whero 5"is the disk
stroke measured during V.,.
aetucbling.

m
I
IMPIANTI PER VENERGIA 9.'NUSTRIA S.P.A A.,n, ,r m
C)ID. . . ..
Gap toleraneov shall be * 2.S.2AI-'m
910.1 mils)l toolor gau9on will be
used botwaoo the
seat and disk to assure the
required gap.
b) Repoat twice the vori•ications of
roint 3,5,2.2,.a)
0) seturn to zero gap between the seat
and disk
,.5.2.2.2) Particle tout
a) verify probes behaviour by
inverting a eooler gaugo of
L. $ O'm C(60 Milo) thicknegs
hvntoon the soat and the disk at
45S from on* proximity probe. Cap
tolerance shall be 1 2.5.20-m
1.10.1 Milo).
b) Repeat the verification of point
B.S.2.2.2.0) with a feeler gaugo of
2.036.10-2x (80 Mnilo)
c) Return to zero gap between the coat
and disk.
U1.5.2.3.) Data r.cordixnc
S. 5.2. 3 1) System a xacy/ropLatabjIL~ty
demonstration
Record all probes roadings at ouch
stop of variation of the disk/soat gap
from zmro to the max forouoon in the
cycloe required at point 3.5.2.2.1.
3.5.2.3.2) Particle tost
R•cord the dick/•oat gap indicationr
of each proximity probe following the
foolors insertions required at point
).S. 2. 2. 2.
6
I-
B
-ý M N I 1 169 1 gm a 4 1 1 111 1 j

~~1~ ii
VW -.COMPOMENTI E =fA.A4 ~45834IMPWMJT PSR IXNEAGIA ELINOUSTRIA 541A.Pz0A Pago 23
CIS
13.5.2.4.1 Standardi rocorda
Toutz data will be recorded oin standard forms
Chown~ in Attachment B.O.
t.5.2.5.1 Acco1~tanco criteria
0 * .2 * * 2) "ytam accuracy/repoatability
demcnstration
Proximity probes readings shall match
the actual Vapc indicated at point
3.5.2.2.1 vithin t 7.5.2.0-m W* mnile)
9.5-2.5.2) Particle test
At least two of the p~roximsity probes
shall indicate values grontar than
0.76.10-lm (30 mnile) for I.S2.10-sm
(60 mile) fool.: insertion, requsired
at point 0.5.2.2.2., and greater then
1.016.2.0'mn (40 nile) for 2036.10-am
fS0 mile.) f color insertion.
Pnarapah B.5.2. mouts the requiraimontt of rat. C.E. Epee. 25AS3gS
Rev. 0 and the first calibration shall bo carried out at rIAT
pramizatt by C .E technical raspcnsab2.n personnel. with rIXT CIII
assistance and training.
Boston RIM, 19"PI 9 IMAIME 000ý ý YIN I -all I - I

U
I I Zfl
FIAT- COMPONCNlI E D453.34IUMM=~ I019 VENERGIA I ....
D.M.AI. .RLE. Page 4 Pago 2S
CC4GJ Lot tfna.V.. DORY Uoproccure&W
completely.
a) Disconnect the V.D. from the
nitrogen supply Gysteme
depreontv ze the nitrogen food
ling and close all isolating
valven.
9.5.3.1.3) Data rorezdinQ
tocord during each teot sequences
a) The initial stblo precsurJ•zation
of the V.S.
b) Initial ambient temperaturo arzd
atmoupberic presscure
c) Time at the five depressurizationOtopr,.
d) Final ambient temperature a• d
atmospheric pressuro.
2.5.3.1.4) standard records
Tact data vill be recorded on standard
form shovn in Attachment 0 10-1.
The ftrm structure foresees for each
tect sequence:
- moan leak rate calculation at each
doproccurization stop
- corrolatien of the moan leak rate
to the moan value of V.1. body
proccurization at each stop.
- hard seat leak.moan equivalent
area (A/(u) calculation at each
doprozcurization step.
U
I
S'I
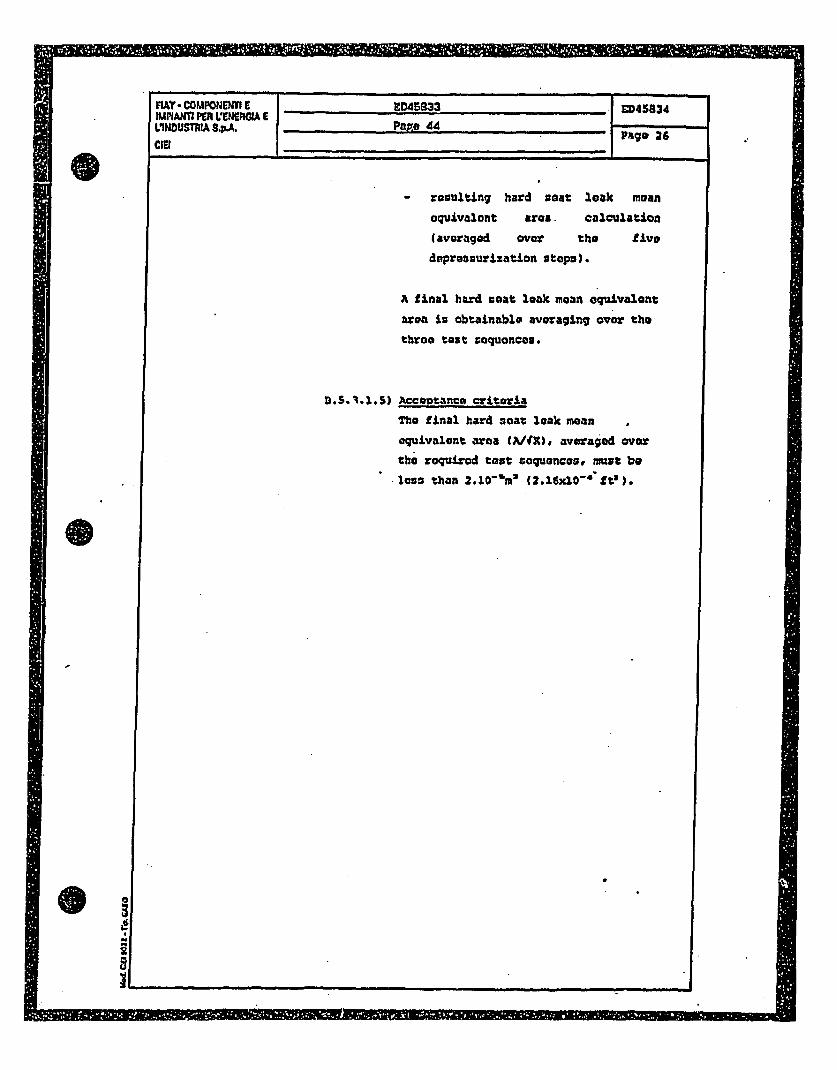
C
MlAY * COMPONEWT E 453 ED43834UIMMANnl PER VENEMIA E
LINDUSTAM Pap_. 44 page 44Cief
- resulti~ng hard cost look moan
equaivalent area. calculation
Caveraged oero the five
depressurization steps).
A final hard coat look mean equivalent
area in obtainable averaging over the
throe test sequences..
13.S.I.I.S) Accentance criteria
The final hard seat lookc mean
oquivalont area (WJX), averaged over
the required test sequences, must be
less than 2.10uM (2 MIWO-6"tl').
7
I Mifix*ý ý -

In;Y.
ED45634
Pago 27
I II I
9.5.3.2) Dick coal bane Use leak test,) pr,-_rgocui.ito
a) Proximity instrumantation
nominally inotanllt on tho V.S.
prototype.
b) V.V. disk nominal primary seal
Installed
0) Loak tight toet flanges assombled
on the discharge nozzles.
d) Soul leak conveyor cover
intalled, vwith bubble monitoring
tubo placed in a transparent water
container.
a) .V.S. placed on tho supporting seat
of the leak to=t station,
connected "to the nitrogen supply
line.
f) Toet hall general nitrogon supply
system available.
i) All nitrogon isolatien valvez
closed.
operative procadure
A) Open nitrgon food valves and
pressurize V.D. body up to 24S M~a
(3O psi) acting on the pressure
reducer.
b) Cloo the nitrogen food valve and
wiait for stabilization of possible
loek from the primary coal,
conveyed by the collecting cover
to the vater contai~nar (preosure
.under the collecting cover must -
grov over the vater head of the
E
1.S..3.2.2)
.8&

~W~UUTI
FIAT - COMPONENTI E I 145S34IMPIANTI PER LENERGIA ELINDUSTRIA W. FP•. 46 Page 28
CIEI
monitoring tubo immorsion, to give
rise to bubbles).
Expocteod stabilz:ation timo with
maximum acceptablo real 1lak v 2o
min.c) Count bubbleo rising from tho
monitoring tuba during a minimum
period of SC min.
d) Open nitrogen food valve and
deprosouri:o V.D. body. C2IoS
nitrogon food valves.
e) Repeat twice oporations from a) to
d).
f0 Dopresuri:ze nitrogen food line
and close all isolation valvos.
1.S.3.2.3) Data rocording
Record for each tout sequence:
a) V.S. body pessuriz:ation level
b) leak stabilzsation wait time
cl bubbles counting period
d) No of bubbles counted
U.'i.3.2.41 Stndard records
Touts data will bo rocordod an
standard form shown in Attachmont
1. 10-2.
The rorm indicates also tho
transformation of the %bubble cout
ra.o" into a standard Pleak rateo in
accord with ANSI/PC: 70-2-1991. note
to TAB. 2 (1 bubblO e 0.1S cc).
U

71
FIAT - COMPONENTI f ED14F.23 M45IMPIANTI PER) LIN!RGIA ILINDUSTRIA SmA. Logo 47Pao2
cisIPgo2
U.S.3.2.S) Acceptance criteria
'I.R. loakago acrocc the dick icoal munct
be loco than 1O0"W/cc w I bubble/
25 min'.
Jm
FI,.

RiT. COMPONENTI C ED458. ED45834.IIMPWIT1 PER LEWnMCIA EPae8LONDUSIA S.P. Page 48-
CV Paqo 30
M5..4) DaSolina Low Flov Tonto (Lift preousuro, ctroke/spoo4
adjustomonta, flow stability with/vithout damper)
U.S.4.1) Tonto without ant•i chattering disk and vithout
a) V.B.p:ototypo nominally asomb'lod
with tho oxcoption o'0 the
antichattoring dovico on tho
soaling disk, of tho dampof on the
disk stem, and of the dampor cover
b) proximity instrumentation nominally
installod on tlao V.D. and connected
to power supply and amplification
olectronics
a) accelerometer placed on tho sealing
disk (vertical direction) and
connected to its power supply and
amplif ication system
d) V.D. prototypo installed on the
supporting stzucturo of the flow.
toet stand
a) main V.S. feoding fan in line on
the flow toet stand
f) V.S. prototype and flow tosts stand
instrumentation connectod to data
aCqUiSition and processing systems
g) main fan auction regulating valve
closed
h) by-pass flow rogulating valve fully
open
i) auxiliary V.D. feeding fan
4vailablo with its pertaining
tool'.
0
a
I ~~E1~~~~

U
/FIT. COMPONENrI E ID40.33 L045834iMAPlANTI KLR LVNERGIA f aeLINDUSIMA S-pA. Pape 41
GdI ag 3
J) 200 daN 4450 lb).dynamomOetr
available. • bottor than St
precision)
ki main and awuxiliary fars pOveQ
supply available.
9.5.4.1.2) •o-rative procedure
a) Lift three times the V.R. scaling
dick by moans of ,arvica lifting
deviceo, to identify a "baca•ine
lift force" on the dynamomoter.
Install the damper cover on the
V.S. bonnet.
b) start-up the main fan and, slovly,
partially open the suction
regulating valve: the foa flow is
totally diverted to the by-parr,
and the pressure under the V.1.
sealing disk is lover than the
expocted lift pressure. ewing to a
previous adequate calibration of
the by-pass flow calibration gate.
Chock instrumentation readings and
recordings.
c) slovly close the by-pass t11o
re.ulating shutter valve, in or or
to increase the pressure under the
V.S. cealing disk, until the disk
lift pressure is reached and dxvk
displacements are noticed. Go on
closing the by-pass shuttor valve
until the V.D. is completely opn,
then slowly re-open the shutter
X
i

I
PIAT.-COMPONENT1 E 1CD45833 ED45834IMPIANTI PER LINER=I E Pone 50LUXURLThA SIP Pago 32CIE1
valva, in ordor to reduce the V.D.
£ned pressure, until the coaling
dick leans on the seat. Pinally
fully ro-open the by-pass shutter
valve.
d) itwpoat four timer operations of
point C.
e) Shut 4ovn the main fan and close
its suction regialating valve.
Stop recording.
Zn case of lack of aedeqate
sensitivity in the identification of
V.13. characteristic parameters at low
flows idisk lift pressure, V.D.
opening time. V.S. closing pressure.
V.D. closing tine), install the
auxili=ay fan, plug the flow divarter
by-penso close the main fan suction
regulating valve and perform
above-mentioned test points. Make use
of the auxiliary fan suction
regulating valve to modify pressure
under the V.D. coaling disk and flow
across the V.D. during opening/closing
phases.
-.
U

M
5-n
- D45834
Pago 33
0VU4a
I
U.S.4.1.31 Data racardin~
Following data mutt bo recorded during
the toot:
a) V.B. coaling disk assembly
"baseline" litt •orco
b) time history of tho differential
pressure across the dick:
particular attention must be paid
to the idontification of the dick
Olift pressure" and of the V.D.
closing precsure. Adj•temonto may
bo made by ballast veight
C4librationr.
c) time histories of the disk
displacements indicated by the S
proximi• y probes: particularly
important is the behaviour of the
signals in the "opening start" and
"ilosing ond" periods. instability
phenomena ought to be doocted by
means of signals oscillations.
d) time history of the vertical
acceleration of the dick, in order
to confirm and possibly amplify
detection capabilities ot above -
mentioned instability phenomena.
a) time history of the air flow,
behaviour during V.S. opening and
closing phases.
f) V.S. opening and closing strokes
time lenghts. derived from
proximity probes signals time
histories
F-
1--.- -- 1- M. ,-U----- I .... - I....

flAT.COMPONNTIE RO ME045834IMPIAJT PER VENERGCIA E Page 52LINDUSTRIA C-P.A.pge
Pa30 3
g) annotations coming from visual
inspections of the dick bohaviour:
one or mere outlot screens may be
disassembled from the V.D. it
considerable instabilities are
detected on proximity probes
signals time histories
h) reference air tomporature and
atmospheric pressure during the
test.
B.5.4.1.4) Standard records
Lift force test data will be recorded
on or attached to standard form shown
in Attachment U1ii-1.
Low flow tests data rill be recorded
zn or attached to standard form shown
in Attachment D.li-2.
9.5.4.2.5) Acceptance criteria
Test results are evaluated by means of
followang criteria:
a) V.B. scaling disk "lift pressure
shall be 3.45 JPa (0.5 psid) 5%
b) V.3. opening and closing times
shall be 5 see or less
c) under low flow conditions the valve
disk shall not cha'ter
II
I
- -UI UP 7 1E111

C
S.
0
~4
'9
I
FIAT. -COMPONNiTIr' ED53 MOM58IMPIANTI PER LENERGIA E E S3
LINDUSTRIA S4PA. 5
CIEI Pago 35
- Uf point b) and c0 criteria are not
fulfilled tests of paragraph 5.S.4.2
wmut noconcarily be pnrf rmod
if point b) and c) critoria are
fulfilled G.E. and PIAT CIZE might
agree either to stop V.3. LO FLOW
TESTS at paraqcraph V.5.4.1, or to co
on to paragraph 6.5.4.2 testc tC
oxploro V.S. im•provable performance
capabilities.

AV... ;L9 a
RIAT* -COLOM'OEI 6 ED45B33iMPIANTI PER LENERGIA 9 Pago 54VINJDUSTAIA S-PA.C10 ___________________
13S.5*4 *2) Tents with arnU Chattering din)' an~d without
Ero-r~nuici'tc
An par B.5.441.1 wich the exception of
'the antichatteriuig d.,vico nominally
assemibled on the Vi.D. Dealing dick.
5S.S.4.2.2) Operative mrocodulro
An par B.5.4.1.2.
U.S.4.2.3) Data rocordina
An per B.S.4.1.3. V.B. soaotng dick
"lift prossure, may be adjusted by
ballast weight calibration. The dick
behaviour in tho "opening start and
"closing and" periods may be corrected
by means of anrichattoring disk
calibrations.
E
2.5.4.2.4) Standard records
As per 1.5.4.1.4
U.5.4.2.5) Acoapanco criteria
Az per O.5.4.1.5.
N=: - If points b) and c) criteria aro not
fulfillod tests of paragraph 8.5.4.3 must
necossarily be poerormod.
- If point b) and c) criteria are fulfix lld
G.R. and FIAT CI13 might agree oither to
stop V.. LOW FLOW T•' at paragraph
B.S.4.2. or to go on to paragraph B.S.4.3
tests to explore V.D. improvable
parformanco capabilities.
5Ia.
W I I 1 11 9 Iasi ý W q, El I M I I

U
Z.
FIAT -COMPOWNM E ___________________
D53
OWMI SpA Uase 55 Pago 37
CIE1
B.5.4.3) Tescts with anti ebattri~nq disk and with
dmr~
Pro-racgiuiitoo
Az per B.5.4.1.1 with tho excoption of
the antichattering devioe and the
dmpor both aoconmblod on the V.S.
U.1.4.3.2) Operative prcodur
Az par B.4.5.1.2.
s.5.4.3.3) Data recordings
at per B.S.4 .1.3. V.8. coaling disk
,lift proccnrew may be adjusted by
ballast %m~ight calibration. The disk
behaviour in the "opening start" and
welocing and" periods may be correctod
by means of antichatterIng disk
calibrations. V.3. openi~ng and closing
timezc may be foosd IfLed acting
parametrically on the damping
coefficient trigger.
3.5.4.3.4) Standard records
AS per 8.5.4.2.4
8.5.4.3.5) aS!potanec criteria
As par O.5.442.5.
p
S
a 11 Ism -Mimi IP11 I M

K
YEN
F!IAT -COMPONENTI E EDI53~3 ED45834IUPIANTI PER LiENERlCIA EPao5LINDUSTRIA G.PALpge3CDl ae3
D.S.5) Pull Plow Toots (,.B. hoa&/f low curve)
3. . 5.1) Pro-roquigitoz
a) V.D. prototype assonmbed in tho
configuration identified by the rosults of
paragraph B.S.4 tests (Low Flow toutS).
b) Proximity instrumontation nominally
installed on the V.3. and connocted to
power supply and implification olectronics.
c) Accelerometer placod on the sealing disk
(vertical dizoction) and connocted to its
power supply and amplification system.
4) V.S. prototype installed on the supporting
structure of the flow toot stand.'
a) Main V.3. fooding fan in lino on the flew
tosts stand.
C) V.S. prototype and flow toSt stand
instrumontation connected to data
acquisition and processing systems.
g) Main fan auction regulating valve closed.
bh By-pass flov rogulating valve fully open.
1) Main fan power supply Available.
B.S.5.2) Operativo procodure
a) Start-up the main fan and, slowly,
partially open tho auction regulating
valve: the fan flow is totally diverted to
the by pass, and the pressure under the
V.3. sealing disk is lovwer than the
expected lift pr•eure, owing to a previous
adequate calibration of the by-pans flow
calibration qate. Chock Instrumentation
readings and recording*.
0 - -- "nn
F 4.1 11 M 111= 1 I I M 111 111A Bill

RAT . CMPOENTI E pnAEA, - D45834IUP(ANTI PER VENERGIA E
RI S5Page 39
b) Slowly close tho by-paso flow regulating
chutter valve, in ordor to increase tho
pressure under the V.S. oalling disk, until
the dick lift pressure is roachod and dick
displacomonts are noticod. Go on closing
tho by-pass Chutter valve until the V.D. is
completoly open. and than go on closing the
shutter valve to increase flow across the
V.S.
0) Stabilizo flow with increasing differential
pressure at 400, 450, 500, SS0, 600, 650,
700 mmn Hv0 steps (0.57, 0.64, 0.71, 0.79,
0.86, 0.93, 1 paid): when necessary
(by-pass shutter valve completely closed)
open the fan suction regulating valve to
increase flow across the V.D.
d) Partially close fan suction regulating
valve and than re-opon by-pans shutter
valve to decrease flow across the V.5.,
and ctabilimo flow with ducreasinq
differential pressure at came st.4ps as
point 0).
e) Repeat twice operations of points €) and 4)
f) Slowly go on reopening the shutter valve
until the V.9. close, then fully reopen
the shutter.
g) Shut down the main fan, and close its
suction regulating valve. stop recocrding.
464.
U
t•
I C I gim 11 1 1 11 1 ININISM

K
RAT.- COMPONENTI E v~nfl5inqA M-45834
ILMPNTI P' L1NERGIA 6O~NDUS1IIL , S.PA PnArP 583Pgo4
CEIDPge4
D.S.S..3) Data rocordin.1
Following data must be rocordod during tho
toot:
a) Time history of the differential procauro
across tho V.B.
b) Time histories of tho V.B. soaling disk
diaplacomonts (proximity probes signals)
a) Timeo nitory of tho vortical acceleration
of the disk
d) Timo history of the air flow across the
a) V.D. opening and closing times
f) Reference air temperature and atmospheric
pros.ur durin-g the test.
9.5.5.4) Standard records
Test data will bo rocorded on or attached to
atandard form shown in Attachment 3.12-1.
S.5.5.5) Acceptance critoria
Flow rate across the V.3. shall exceed values
provided in Attachment D.12-2 from the "lift
pressure" up to at leant 6.9 IPa (U paid)
0
1 11 1 1 1! 1101110 8 11 1@1 1 1 1ý

IAT - COMrONENTI E ED45833 - 45834IMPIANII PER L'LNERGA ELINDUTRA S-PA pope 59.. ..CIEDPge4
U,.5.6) Systmitic chocks (Loak rate, lift forco, proximity
probes functional tootG))
1%. S.6.1 ) Disk real cyctomttic lank tnnt
t. 5.6 1.1) 1"' vtop bubblo tout
.5.6.1.1.1) P.ro-raqini ton
4) V.B. prototypo nominally accomblod.
with the exception of the outlet
ucreent replaced by the leak tight test
glangoe on tho discharge nozleos.
b) goal leak conveyer cover installed,
with bubble monitoring tube placed in a
trancpAront water container.
c) V.S. placed on the supporting seat
of the leak test station, connected to
the nitrogen supply line.
d) Test hall general nitrogen supply
syatem avai1ablo
e) All nitrogen isolation valves closed.
5.S.6.l.l.=) Operative procedure
a) Open nitrogen feod valves and
pressurize V.5. body up to 20.5 KPa
(3psi) acting on the pressure roducor.
b) Close the nitrogon foed valve and wait
for stabilization of possiblo leak from
the primary seal, conveyod by the
collecting cover to the water container
(pressure under the collecting cov
must grow over the water head of the
monitoring tube imm.rsion to produce
bubbles).
0*1
I,
p.
q•- -- ---. i
I I llxpý - _MWIM . I in

4-
0aI
MAY. COMPONENTI E 4D45833 .D45D34IMP(ANTI PER LENERGIA SLINDUSTRIA S#p-A_ Papa 60
Cie Page 42
Suggeotod stabilization
0 count bubbles rising
monitoring tuba during
period of I minuto.
time: Come
from the
a minimum
If bubbles count in unroliabla (too
many bubblos per r-ocond) opon nitrogon
food va•e,:, daprosnuri:c V... body and
not-up paragraph B.S.6.1.2 tout
performance
d) Open nitrogen food valve and
depreosurizeo V.. body. Close
nitrogOn food valvo.
a) Repeat tvico operations from a) to
d)
D) Ropeat operations from a) to a) at
41, 69 and 103 XPa (6,10,15 pai) of
V.9. body pressurization.
9) Dopreossuize nitrogeon food line and
close all i:olation valves.
Data recording
Rocord for each tost oqueonco:
a) V.9. body pressurization level
b) leak stabilization wait time
c) bubblon counting period
d) NO of bubbles counted
]3.5.6.1.1.3)
a

[UIU! ~mr
FIAT * COMPONENTI C E53IWPIANTI PER LENERGIA t E045834LINDUSTRrA S.pJ Pn6r 61
C1I P4go 43
-;.5. 6. .4 ) Stnndards rocords
Testo data vill be rocordod on ctandard
form shown In Attachmont D.10-2.
The form Indicato: also the
transformatilon of the "bubbles- count
rate" into a standard *leak race* In
accord with ANSZ/IPCI 70-2-199g, note to
Tab. 2 (U bubble a 0,15 Cc).
3.56.11.5 Aceptnescriteria
LnAUc rate chhl not exceed valvez
provided iin Attachment U.10-4 at test
prescuro.
1w failure of elanteonee doesnot
conctitute V.S. failure. The time and
manner of failure will be the basis car
concervatively defining the replacement
intervals.
3.5.6.1.2) 21' Vtop Peccure Lear. tact
.5. 6,1.2.1) Pro-roquivites
An par S.S.6.1.1.1 w1ith the excoption
of the absence of the seal leak
conveyor cover.
U.5.5.2.2.2) Ojx'xative crocedure
a) open nitrogen food valve: and
proscurize V.3. body up to 20.5 xPa
(3 psi) acting on the presoure
reducer
b) clo:e nitrogen food valve and vaLt
for 10 minutes to alloy V.D.
internal preasure decrease
.1!
J
-141 11 a I MAIN 1111M WIN 110 M

U
FIAT- COMFONENT1 E " .D45833 E45334IMPIA IM PER t,'4tGIA E PagE 82LfOJDUSTRIA Sp.AP.g _ 2
CID Pago 44
a) porn nitrogon .fcod valve and
doprossu'rie V.D. body. Clone
nitrogen food valvo
d) repeat tieo opoerations from a) to
a)
o) ropoat operations from a) to d) at
41, 69 and 103 XPa (6, 10, 15 pOD)
of V.3. body prossurization
f) doprossuri:o nitrogen food lino and
close all isolation valves.
3.S.6. 1..2.3) .ata ro:.rding
iRocord during each presouro los: test:
a) initial presurization of the V.3.
body
b) initial ambient teimperaturo and
-at•o•pheric pressure
a) wait time for V.9. body
deproeu•rization
4) final provourizatlion of V.S. body
o) final ambient temperature and
atmo:phoric pre suro
3.5.6.1.2.4) Standard records
Toot data will be recorded on standard
Tom ahmm in Attachmont D.10-3.
The form structure foreoson for each
prozzura lIons test:- moan loll% rate calculation
- correlation of the moan boak rate to
the moan value of the V.D. body
pressu•ization during the toot.
E
0 I.4'4
- - I

I -
FIAT.- COMPONEFM E EnD4533 D53ILIAIOPETR ENESCAE
D53
IMIANSTRI PESENRiA Epwop 63
CIE] Page 45
Resulting mean look rate-- for cach
V.S. pressriz:ation level arc obtaiood
by averaging over single pressure lour
tests.
Acceptanco critoria
Lookc rate shall not exceed value=
provided in Attachmont B. 10-4 at toot
D.S.661L2.5)
WOTEI Failure ef olaotomort doesn' t
cenctitute V.S. failure. notia m and
manner of failure will bo the basis for
contorvatively dofining the repl1acement
intarvala.
N
I-

RAT- COMPO•NENTI -- 45834IMRNr PER LENEAGIA ELI?•USTMIA S*JP. 64 Page 46
B ,S.6. *2) OiSIC ac-ombly lift force nyrztematic checks
U.5.6.2.1)
a.5.6.2.2)
3.5.8.2.3)
3.5.5.2.4)
3.5 *6.*2 *5)
pro-rocrluiiton
a) V.D. prototype nominally aseamblde,
with the exception of the damper cover
b) v.s. placed on the supporting seat of
the loak toot station
c) proximity instrumontation connected to
power rsupply. Amplification and
recording systoem
d) 200 daN (450 lb) dynanomater availablo
(betteo than SI procision)
o) probes electronics power =upply
available
operativo procodure
a) lift three times the V.15. coaling dirsh
assembly by moans of zervica lLfting
devices, controlling lift force
behaviour on the dynamomet•or. Stop
proximity probo recording.
Data rocrdilna
Record during the teot:
a) disk assembly lift force readings
b) annotations on possible disk lifting
anomalies Idiscontinuitios Iorca
oscillations, jerkily motion#...)
Standards record:
Data will be recorded on standard form of
Attachment3.-.
Acceptance criteri
max acceptable force variation S1 of
"baseline lift force"
'-I
I
3`7

FIAT - COMPONENTI E ED45833VAPIAwn PER WMAGIA 9VINDUSTRIA SVJL 65
t-. 5. 6.3) Prox~sd.t- probac cal.bration Mtemantic
chock*,
.5.6.3.1) 1Pro-rmisitoa
a) V.S. prototypo nominally ase•eocd, and
pla•ed on tho supporting coat of the
loak toot ctation
b) proximity proboc connoetod to power
cupply. amplification and recordinq
syste
c) v.9 dicchargo noazlo; free from flangoe
or ccroonc
d) V.S. bonnet unscrewed and equippod far
frequent handling
a) V.t. dick stem equippod for frequent
Lftingr and loaorinqu
f) calibrated shims and feeler gauges
available
9) prober alectronits power aupply
availablo
3•.5. 6.3.2 ) _ ativo procodure
As per 8.5.2.2.1
3.5.6.3.3) bat& recordLng
As per U.5.2.3.1
2.5.6.3.4) Atandard records
As per 3.5.2.4
2.5.6.3.5) Acceptance criteria
At per 9.5.2.S.1
m

FIAT- COMPONENTI E 4 EE458334IMPLNWTI PER LVENERGMA E "VINOUSTRIA S4.& F 6 Page 48
c• - [,a, _ • ,
W 13.5.7) Cr.t Zngoetion tost (Silicon flour blov)
B.5.7.1) Prn-rouis.iton
a) V.D. prototypo nominally annomblod, vwith
insidao surfacos coverod with a thin coat of
mi.noz=a oil.
b) V.D. prototype installed on the supporting
structuro of tho flow tont stand.
c) Proximity instrumontation connocted to
povow supply, amplification oloctronics and
rocording oystom.
d) Flow, tomporaturo and proesuro tranoducers
disassembled from the flow toets stand,, and
replaceo by plugging dovices.
a) Main V.D. fooding t~an in line on thio flow
tout stand.
f) Main fan auction rogulatitng valvo closod.
;) Uy-pPat ziov rogulating valve fully open.
h) Dust abating curtains placed around the
V.13. to limit anti-noise, structure
contamination.
D) 0,454 Xg (1 lb) of silicon flour availablo.
j) Prox~i•ity prober power supply available.
k) Main fan powor supply available.
B.5.7.2) Oporative pZrcodure
a) start-up the main fan and. slowly,
partially open tho auction rogaating
valve; the fan flow in totally diverted to
the by-pana, and the proesur* undor the
V.D. scaling disk in lower than the lift
prosauro owing to the calibration of the
by-pass gate.
Chock proximity probes recordings.
FM niIVufl1i 1rr ~,F~n-I

FAT -COMPONENTI t-"5834IMPIANTI PER LENERGIA E ....
A. E
Pa o 6
LCEDUSTRIA S.V? Page 67Ca
P49 49 ib) Slowly cloce the by-pans flow regulating chuttor
valve to increase the proacuro under the V.D.
dick, until the lift proccuro is reached and dick
dicplacomont: are noticod. Go on closing the
:hutter valve until the V.D. in completely open.
Completely cloea the chutter valve.
c) Slowly empty the silicon flour container in the
air flow at the main fan suction, to blow it
trough the V.D.. Maintain flow for at leant 1
minute.
d) Re-open the by pass shutter valve to reduce flow
across the V.D. and then to clone it. Fully open
the chutter valve.
a) Shut-down the main fan, and close its suction
regulating valve. Stop recording.
U.S.7.3) Data recordinq
Record proximity probes signals during test
operations, and possible annotations an their
behaviour.
I.S..7.4) Standard rocoard
Teat data will be recorded on or attached to
standard form shown in Attachmuent B.11-2.
IIFI_
•_-• _• -- :•-- •- --- r .• -- - • ._._ -- • - am -- ---• -• --• _. •v _-_- -'•-..--_ ip=- !

0
FIAT -COMPONENflE9 ED45834 1tMPIANTI PER LENEAGIA E OYo6LINDUSTRIA SPA. pope 6
M page So
U.5.7.5) Acceptance criteria
Silicon flonr compocition in accordance with
MIL-STD-810 B (July 1989), meth~od 510.3, vpction
1-3.2.d (1) 1b).
NMT
silicon flour capturocl by tho oil film on t2ho inside
xurfacas of the V.D. must not be romoved before
suboquont touts ("RELIABZLITY TMSTT and wSEhT
SENSZITV1TY TBSMh
I
w

FIAT.- COMPONENTI E ED45834IMPIANTI PER VENERGIA ELINDUSTA Sp;A. Page 69CEI
Pago 51
BW 3.5.8) Relability test (3000 atrokou)
8.S. 8.1) Pre, r•ouat~ec
a) V.D. prototype nominally aconmblod (twzo
configuration at por "Full Flow teata-
paragraph B.S.S).
b) V.D. insido surfaco contaminatod by
silicon flour blown through the V.3. during
"Grit Xngootion tost., paragraph B.5.7.
a) Proxi•ity instrunentation connected to
power supply isied amplification electronics.
d) V.D. prototype nstalled on the cupporting
structure of the flow toat stand.
0) Main V.S. feeding fan in lino on the lowv
ternts stand.
f) Flow toets stand nominally equipped with
preozuro, temperature and flov transducer.
g) V.S. prototype and flow taot atand
instrumontation connected to data
acq•i•ition and elaboration cyctcmz.
h) Main fan auction r•gulating valve clozed.
1) By-pazz flow regulating valve fully open.
J) main fan power cupply available.
B.S.B.2) 9porativa Rrocedure
a) Start-up the main fan And, slowly.
partially open the iuction ragulating
valve: the fan £lov it totally divorted to
tho by-pass and the pressure under the V.3.
disk ic lower than the lift preosure owing
to the by-paou calibration gate. Chock
inctrumentation readings and rocordingn.
2@
ism 19 1

I
PAT- COMPONENTI E 458. 3 D4S34IMPWT PEN L'ENERGIA E 7LNUS A .. Page $2
CIVs
b) Slowly close the by-pass glow regulating
abutter valve in order to completely open
the V.D. and stabili:o a diff•r•ntial
pro:sure of 520 mM H9O (0.74 psid):
maintain flow for at least 40 soe.
c) Slowly completely ro-open the ahutter valve
in order to close the V.S. and divert the
fan full flo€ to the by-pact.
d) Repeat 3000 timoe operations of point b)
and a).
NOTE:
Prosontly 8+9 hours a day of testing are
planned. 3000 strokes being the integral
performance to be roached. At tho and of
each daily phase operations of point a)
will be performed.
o) Shut-down the main fan, and clote Its
auction regulating valve. Stop recording.
B.5.8.3) Data recording
Following data must be rocordod during the
toots
a) Time history of the differential pr•esuro
Across the V.3.
b) Time historian of %he V.S. coaling dick
displacemonts (proximity probes signals)
0) Time history of the air flow aczosa the
V.D.
I I Rig I I I I I

*~EjI~iiiIiiu~- -
RlAT * COMPON4E"f E rM-63d53- ED5834IMPIAd" PE VtENERGIA E o .- £
L1N0USTURA LOnA. Phg 7
Ona page 53
d) Rof orenco air tofuporaturc and atmoaphodic
pressure during tho test.
U.5.C.4) Standard records
Toot data will' be summuarized an or attached to
standard~ form showni in Attachmnot R.13 Sample
records of V.S. -lift pressure",. Oopening
timon, natabilized difforontini prscauro",
"saiie f low", hicicuing timio1 are fare=*=n
evory 100 strokes.
U.5.B.5) Acceptance criteria
No failure in V.9. lift on demand over 3000
operaticons.
A III 1- 21 - , 11 - 0 M

U
-- iT
lAT- COMPONENTI I E S45S34IMPIAMNTI PCR L'ENERGIA EL¶NDUSTh!A SpA• Pntve 72 Page 54ClB...PgM5
D.S.9) Foreign matorial Scat sannitivity test MLoak toots with
particles under tho V.3. coal)
9.5.9.1) Pro-roquisiton
a) V.D. prototypo nominally assomblod, with
the exception of the damper cover and of
the outleot ocroona on the dischargo
nozzles.
140TE:
V.B. prototype gonoral conditiono mut be
those reoulting from the "ELIAML1TY T=1' of
paragraph B.S.8.
b) V.S. placod on the, supporting seat of the
loak tout station.
0) Rough motallic or ceramic particlos (or
scraps, or grains) of diffeeont average
dimonsions availablo.
d) Toot hall gonoral nitrogon supply systom
available
0) All nitrogen isolation valve: closod.
B.S.9.2) .oprative procodure
a) Place one particle of avorago dimonsion: of
about 0,39 x lO2-m (15 mils) undo? thea soft
coal of the V.D. dick. Roplaco and
nominally close the dampr cover, and
assemble the loak tight toot flanges.
.0.
•'•~~ MI'- IMN It I Is•l_ II M grA, MM..lIN•,,.•P -

I U
-'U----
I
FLAT. COMPONENn E ED4S533 Es45834RIPIAOT PER L'ENERGIA ELI7 Pago 5S
L1NDSTRA SA. _ , g• 5
b) Connect the V.S. to tho nitrogen supply
cyctom, opon nitrogon food valves and
procaurLzo V.B. body up to 20.5 KPa (3pai)
acting on the proesuro reducor.
c) Close nitrogen food valve and wait for I0
minutoc to allow V.S. internal pressuro
docroene.
it tho dopreu rization rato is too high to
allow a wait timo of 10 minuzoa, atop the .vait
timo whon one half of initial proamrmization
in reached.
d) Opon nitrogon food valvo and dapreonsurio
V.D. body.
Closo nitrogen food valve.
a) Roepat twice oporationc from b) to d).
f) Ropoat operations fro b) to e) at 41, 69,
and 103 XPa (6.10,15 pai) of V.S. bbdy
proccuri:ation.
g) Disconnect tho V.3. from the nitrogen
supply yatoem, disascomble leak tight toot
flango: and damper cover.
I
a-
I RROMMOMMM F I ON I III III III

U
- .• - _ __ . -- 777777771--7....... . .
FIAT, COMPONE"I t 045833 ED45834IMSPIAN1 PER VENERGIA IVINDUSTA S).kA PIAt 74 Page 56CIO_ _ - _ ; . ±
h) R•epeat operations frm... a) to g) with
partiC..L of 0,76 x 10" and 1.27 x 2O"sm
(30 and SO mils) average dimensions placed
under the soft seal of the V.D. disk.
i) Deprosurize nitrtgoen food line and clove
All isolation valves.
U.5.9.3) Data recording
Reor•d during each pro-seo los:s tost:
a) Average dimannions of the particle placed
under the soft oeal of the V.D. disk.
b) Initial pressurization of tho V.D. body.
c) Initial ambiont tomparaturo and atmospheric
pressure.
d) wait time for V.3. body dopreossuriation.
o) Final proscuri3ation of the V.,. body.
f) Final aabiont. twpoeraturo and atmnospheric
pressture.
3.5.9.4) Standard record:
Tont data w11 be recorded on standard form
shoan in Attachment 9.10-3.
Tho form structure forzosos for each pressure
loss tont:
- Mean leak rato calculation
- Correlation cf th. mean leak rate to the
moan value of tho V.D. body prossurisatioi
during the teat.
-r I_ II,_ - I. 1 _1 _ 1 - 1---I -

I~I~EEF
FIAY. COMPONENIM E _______45________34___
IMPIAnTIPR LENERGmA Pag 75LINDUSTRI -P.A. Pago 57
TRogultin mean Leak ratec for each~ V.8.
prauauri~zation leval arc obtained by averaging
over vingle proccurW 2ou; tacts.
V.S.O.S) Accoiptanco-Critaria
Leak ratot will be compared to valuou provided Lin
httachmont 9.10-4 at toot protureso
Rocultc aro for C.S. information aey out of the
V.13. prototype qualificationi toot campoign.
I
I -UNA111 1- -1 1

I
,R.AT.• -COPOE C. " 4M E0431,3: IMPWAO PER L'ENERGIAEPao7
LINDU.....p Page So
.5.10.1) PXo-requifstos
a) All toits of the V.S. qualification campaign
performed
b) V.. prototype completoly assembled in the
final toet conditions
C) V.D. prototype placed in the final inspection
hall of the shop (including inlet scroon)
d) Shop drawings, inspotion/Wmoaauromont to*ls
and camora available.
3.5.10.2) cO,,,ativo procoadu
a) Completely divaszcmnblo the V.S. prototype,
vith the oxcoption of the proximity probos
clamped cables.
Try not to alter items surface conditions during
disas•ombling (e.g. grit presence, oil presence.
oxidations, correniona,...)
b) Perform visual inspection on oach V.D. item,
and immodiatoly tako pictures of auy possible
anomaly.
a) Porfom dimensional and surface roughness
chocks an required at point 9.3.10.3.
d) ndividually package V.D. items vwith
identifying devices, for planned subsequent
shop operations.
0g
I
ý Mz M FIgE 1 11 .1 F1

F1AY - COMPOENTI581E =D45834
IMPKNWI PR LMENERGMA ELINDUSTUIA S4. . P age 77 _ ag .A
C I -P age 5-
UVS.1O.31 Data recordincq
a) Take annotationc (and it nacoocary picturec)
of V.D. itemw surface conditionc, with
particular attention for%
- Disk soft seaa
- Hard coat
- Dick atom
- Dick stem boarings
- Proximity pobo1
- Proximity procc connoctorr, cablos and
ponotratlon-
- Zilet and oulet sroeone
Zmportant features area
- Structural deformation&
- wear mariC
- Local grit accumulation- Pocsible oxidation traces
- Initial corro.ion indicationc
b) Make dimnoncional chockc (and it necc-saxy
ourfaco roughnocu chockv) on:
- Dick
- Diick tem
- Lo'ior and upper boarings
- •ard coat
- Dick toft coal
®2

RiAY - COMPO~NEW I ___________834________
tJIANTI PR LENERGIA £ dS3LINDUMTIA S~p.A. page 60
B.S.1O.4) standard records
3Record/attach final inspection results on/to
standard form shlown in Attachmant B.1.4.
fl.S.1O.5) hoeatanco critorin
Not applicable. 1flML IUSPlCTZ VIML BS PA~RT a?
To IN~d* VUAUICZATIONI TEST PZPORT.
Pailure of elautomors ini the courmo of the test
cam~paign does not Constitute V.S. failure.
The time and manner of failure will be the basis
for conservatitvely defi.ning the replacement
interv4ls.
I
I v I - - M INIUM9, 1 ý , IN ý ;, I

t.
TEST LOOP
/"'fECIANISM5 AND VALVES TESTI I II m I
.J(DI0(4
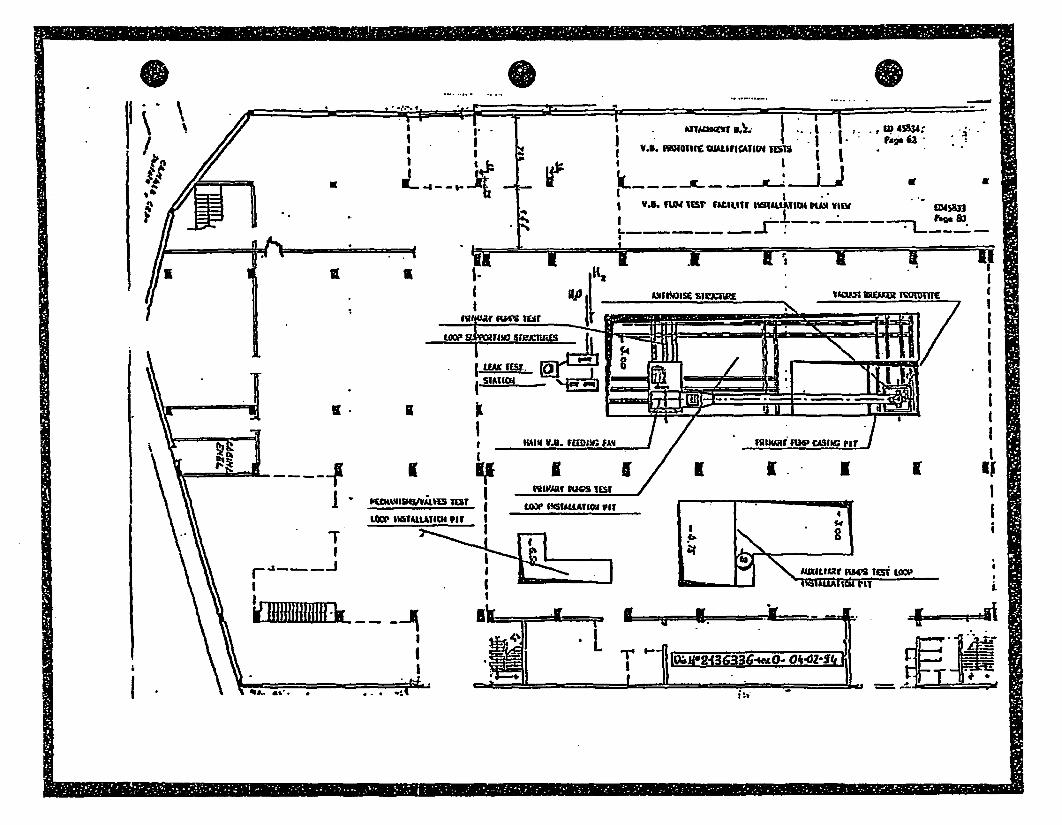
RN. AlAU4WS I= .10 VIE WonS$
AN10S SIRX. VAM3 UUM r.smiI6uLIU A
LII
WA OWIwn M Af MIMA4W RM -
LQ~ ~ I sw flGIAMATION pIn
. ~ - . - -- -~"Maxsuar " m es i i cow
1 0 4 11 09 3 6 3 3 " 4 - 0~ 4 -2 - _ l&i
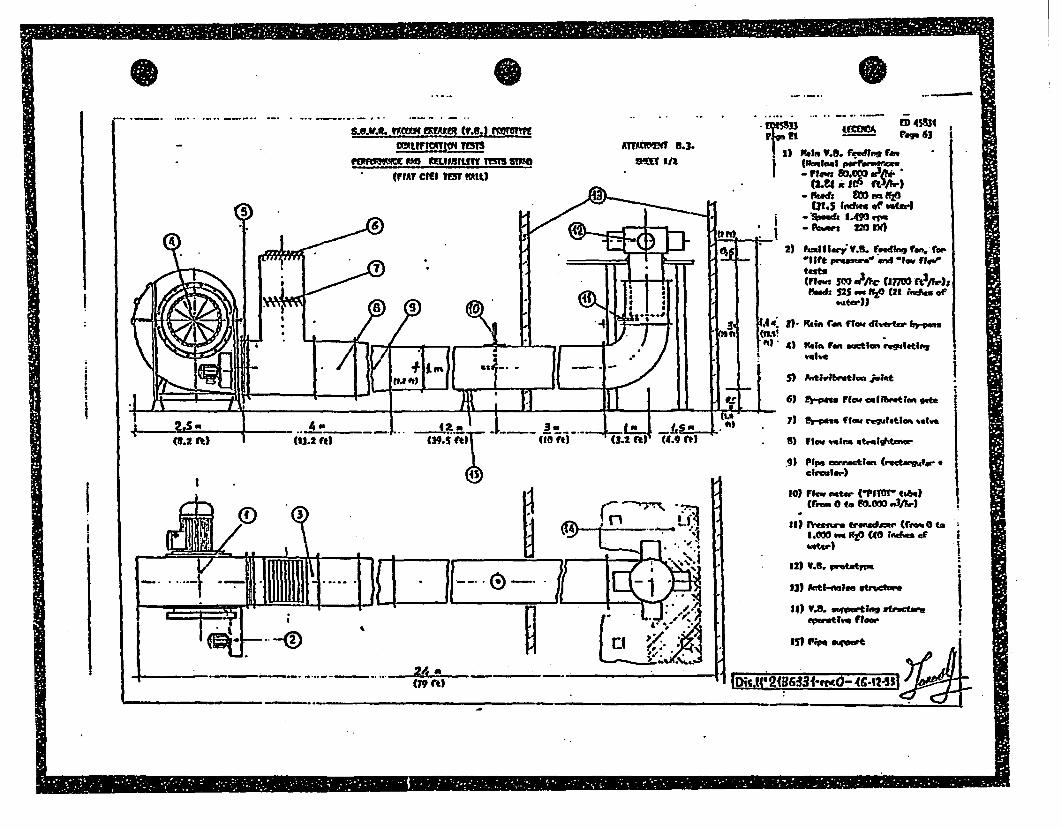
SA.VA.) main V.9!R (V.6.)o ramoi61WV0WN an OMLIFBIUTY 1513 57mf ME 1/) ROelva V.. qf19
(L?4 jtSpftFju)*
S~~ ~ ( :.&Itd of SamtIi)
21 oxemaiutlj.s reaing rum. roe.'-ste"WVwe~ adl ',low 0ii
roads 525 ow Vfz (21 cadios of
.la -) Rain i.ftim divtw 4~-vu.
fi4) lRotCan wict .eon rugulatins
+ ton 51 Protivibirwtio joint
- *.~................** .JSU6) er-Pdl flaw clinlat gu- enqte
(82f)(13.2 Vt) wq Wt I 32V)(9V) . ) flow iritia starolghtmw
.91 Ppip cw Icton (rocwwsar.gI.
10) flew Peter. ('PflM- teo)AD C
13) Anlismle strvoftsdew(ra0
S112) M.6 -or"" og tpp.
ML3 InII like a~curi
I
IIiii i i - i IIDs.W2~~533frw'.O- 4G.124i1
E

•,RTCOMo " I ATTACIHMENT B3. ED 45834LNDUSTRtA 9•JL. V.8. PROTOTYPE OUALIFICATION TESTS
DIVSINE dEl FLOW TEST STAND LAYOUTS Page.64
SHEET 2V2
V.0. SUPPORTING STAND PIPEE045833Pago 82
152.4 mmn (611)
I4ý-/- '-_-
I
no0
7
J " . . N'p
Ii
!
-- S..
* 4
-S}
I
-1 UPPER DRUM 24" SCH. 202 24" ANSI - I50 SERIES FLANGE3 INTERMEDIATE ASSEMBLING FLANGE
4 FLOW TEST STAND ASSEBLING FLANGE5 INLET SCREEN AND PIPING ASSEMBLING FLANGE6 LOWRDRUM 24 SCH. 20
NOTE: - - - . -
NOTE:
(*.)
(N) FITTING EITHER WITH FIAT CIEI. FLOW TEST SIAND,OR WITH ANSALDO RICERCHE SHAKING TABLE
.1
i I 01S NO 2136331 - REV. 0 - 01/o/1979
-41

lilEhi HI
3. MEIINMALIZ W IATER CRAflGM
2. CIWOING MP1 ISOLATION VALVE
3. DI5MIRE. VALKE
4. MINERtALIZED WATER FSE VALVE
S. Y.O. ISOLATION VALVE
6. OVTZOTEST PPMESflE MEASZWD4D
7.WATER LINC CMW1C?04I
B. ~V.0. SUPM~ING SEAT
9. LEAt TICIT TEST FLAC
30. NIIDOCEM BOTTLE
32. FRESSUREI RUIM
13. 015:H=RC VALVE
34. V-0. ISOLATION4 VALVE
15. SAFETY VALVE
16. FRMMSRE MCA2URDIET(RICH LEVEL)
177. FRESMmE MEASZNIROM(LW~ LEVEL)
It. IRnOMv LIKE CO~iNECTION
39. V.1. PRolvTYPE
30. UUDOLS =~NTISC DEVICE
viIls OI' P136335 - REV. 0 - WOV0239W I
znj=l I Mmopm 1, 1 a lammom III 1-M :1 1 1 um
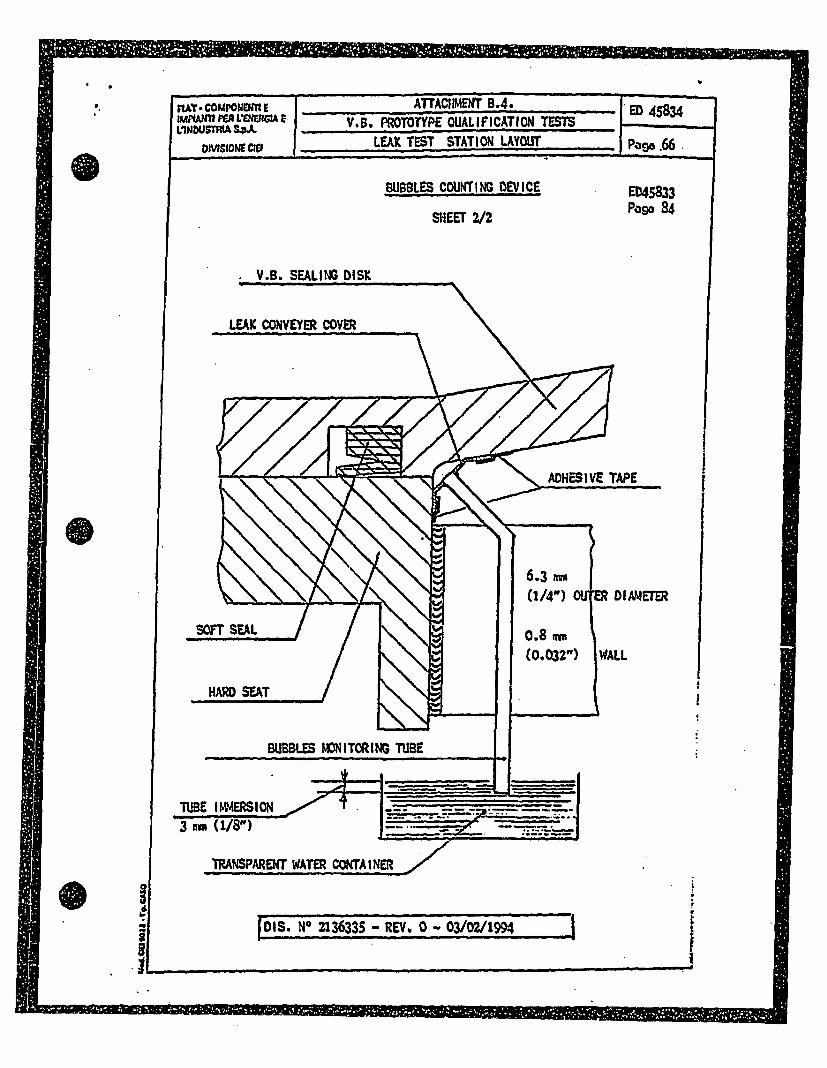
|
ATTACIhM• 8.4. ED 4583V.B. PROTOTYPE QUALIFICATION TESTS
LEAK TEST STATION LAYOUT Page .66
BUBBLES COUNTING DEVICE. . - _ _ . . . .. . ED45833
SHEET 2/2
015S. No 2136335 - REV. 0 - 03/02/1994
I.
I

I014" 3Imiq. 8
ATYAOVM 0.5-
*ED 45931Pagm 67
SAUDItSACS
jkh
II
I I,-J
V.S. rRO~htYM OIDLIfICATIOI 151
fltlf TmT sVL'o imm?~Ematre
o.M.s.•.P.•.
III+
SAID
MO3 5
PO 3
"is 3 8
nos 3
VIFt
VA- MqI qgM S4 "WM
.. atLIFRo fk'4 meR SWII
SI~IAIM MSTIRT * MW
** IfLII ONf MISWT o STCO
-N ELW ASMPIE CHAIR
I, Is
T 14
Ace 15
SINS 16/105
O.A.S./D.E.S.
* IWMMN mmmWffB a51 aM
* 0Etwwkym m"~tal CHAIR
- A~~tWAIj4 1ASEt~q O~tjkIl
_____~~EhI~iJ

RAT .COMPONtJT~g
IMF(M1 PER L'ENERGA 9M1ousm1 SOA
OMSIONECO E
E045833Paso 86
V= Uwi
VITO= LM
I'.'
?1 17 PK=SSIE HEAURMxDu
7-0 11 PRLSMUl HIAUENEU
7I119 * ESMKJAE NASURNE
n2a ATwmSi. mm.E2 mmAS
7:.1 AsDa IT DMVRI. MICAsMa

E
s" AMOM . rmc
V.D. mTOMMT MLttIFVATIC7R TMIiFt(W TMl VRYA aMWISAVMM.fACmAm
CATIAWSiflmI S1SU3I (D.AAJA.
m" "WOUD IMTA MY OMUT
WIMTAL TUM&ICMl
~ f tic. neir mv!, (rI/V
lev ACIuvr
UI

RAY - OMPONDWTE %=xeMME=-b M IM!45834IIMPLUNT PE LENERCIA E V.30 PnoROT'ePS OUALIPICXTXO1 2'SMTLINDLISTMIA SpskA HYDROTEST C1RaIVICATScis PaI 7
- TESTING VrXH: ................
DATE: .. ............
-ES ACIUXTY: LE3II TEST STATZION
ED45833
Page so
- TEST PROCZM= DOC, NO ED45834v MRY. *......
- TEST M01DU1: DEHZNERAWZED WATER
-TOP PRESSURIZATION PHASE DATA:
Nogiflal tse ]EO33tuO
325 XPA
(4':.25 psi)
goal too pressure Pwoacuri:Atidn timtt
Xpa ....... ri
(. pri)
U
ss LZAMXAGEXR~AMINATION P14ASS DATA:
Nominlal Rrazzwo
245 M~
(35.5 psi)
Raal prossuwo
.... Xpa
I ... pail
Prousurization time
II
.. .. ........ .. ... . . . .
* TEST PESULT: ...............
- T=S CONDUC70R: s.**.. ... ... s. G.E9 RPMASMfATIVS: t ..... ...... o..
I-

ATTACFUMNT Bl.ti,
VY3J PROTOWPm QUALZF ATZON~ TEaST
PIKMITW 1VRZLZ. =mAL4B ATO gCETIVJCAn
* TESTXHG FIRM~S .... .. .. ..... CRTIFICATE NO s . .. . .. . .....
DATES ........... 4 ...
- TES? FAZLrtYt LWA TEST STATION PAGES I/
- TEST P)POCEDU;E: DOC. 1411 D45834, R*EV..... * 4S033
- PFrEZ=I"G OPERlATIONS ON THE V.S.I....................................
-PROMSS ZVWTWICATZON:
3
Lower Probo- UppoC Probe
0
0 0
0

FIAT -COMPOMPNTI SATTA4iC.NTNJ B~t ZV45834IPMnPUS RIA S RCI.A E ___________________ hION 72INMPWTIII SPELNRGA PROV.3.T PMOB'TP QUA!FIC7T1O "'1FCt73Pao7
CIEII_ _ _ _ _ _ _ _ _ _ _ _ _ _ _ _ _ _ _ _ _ _ _ _
ED45833page 90
-ACCURA.Y/PE~PSATA3ZLZT TZMT DhTA.,
PIROD PYE30DNC3
Page 3/3
PRO=3 we
TEST N
San=ITzwXooKgM
P~oou &prbe
- .I-
0.75 mm (3-2.13o Milo:) mm
1.013 mu 1 (m-m(40 mils) I mm
2.036 MM | (3-2,45O milo) I mm
I-
2.$4 MM I(100 Mil.s) I
3.3 ma (3-310 Mlan) I mm
*I-
2.54 I (3-3-s I -m
2.036 I(s-2.,mm mm
3.015
. • I . . . .
0976mmu
0 3 £
NmT: as v v.s. coai~ng disk stroke. moacrawd during ansambling (nw.3
I * U mhhm..~MIMIE E~

FIATCOM~OIJENI1I I AT~At!~4MlwT ~..
IMPWAMf PER LENERGIA E V.11. PROTOTYPE OUALUFICATZCU TESTS
CMRTZPZC*%Ts N': ....
DATE: ~ ~ ................
PACE: 3/3
PARTZCLI TEST DATA: ED45833Page tvl
Lpnou PiDiZN=
- AM=OATIONS:
. Accuracy/YRopoatabJ.1ity Tents;:
9.9.9.9.9. .*9 ..... .... 0
. .* ........ 9 . 9. .. .. 9
. .. ... .. .. * . . . .. 9. . .. .
*9.9.. . .. . . . .. . .99 .*..*..*..9.. 9.. 9.. *
.9 ..9 9.. ... . .. 9 9.. .99..9
.Particle Tact: * 9 .. .. .. . 9 9 9 ...... *
. .99 9 9. 9 .999.999..999.. .. .. 9.. 999..
.9.9 9 9 9 9 9 9 9 9 9 9 .9 .*9 .... .... ..... ....
. ... ~ .9999.....9999 ..... ..... .... 0
. .... ... 0.9 9 99.... 0... ..... 9 9 ....
W fST 32SUT: *9999999 * .9.9.9.....
*TrST CO=UUCtOSI~ *~* G.Co XIMPMSEWTATZE .... ......
2
- m - I N RION I ONI mloom - R 11 -1 1:1 191 '1111 le t q 11 g

I
TAT. COMPONENTI E ATTACHMENT, I*418-4IMMMNT PM L'O4XRGIA E n'OME LFc~Z~TT
cisU771 M= U aT =7IMTS ~ Page 74
E0~45933Page 92TMI2MS~a DUR!.?JB Lxx& YM
- T~f4;l~4: .. .. .. .. TZF1C...................
. TEST FACILM:1 L!E1 TEST STATION
- TZS? PiR0D=0Z DOC. NO ED4534, M1.W
- TEST MWZ0UH: MITRCGZ?4
-V.Do DWYDE( ESS9U9R?.TI0O4 TESTS DA.TA:
" Initial ambient temperatu~re: .....
" Initial. atmospheric pressure: .. .p~a,
" Depressurization histcry3
....... psi3
,.D. -92LY
100 Ma(14 psi)
N
I-" Tout
0.00 too
2.04 Toot0. 00 toe 0.00 toc
90 x3a(12.6 psi)
80 Xa(11.2 psi)
70 KPa(9.8 psi)
SO KPS(7 psi)
*Final Ambient Tomperatiire:.........."C ( ....... a?)
P inal Atmospheric Pressure: ..... )Pa (f ...... Psi)
0'U
p.
0
SI
4 1 AMWIRSUMMMMI - I III - I I a wff,&Mý 00 ;

1T1 I -- EU[IEE lii iV
RIAY * COMPONEOf E A AMI- -I -- ED43834M'(MJT PER VENERGIAf
L1INDUSTh1A SpA. V.S PAOrOMZP OUAIrXC3hTON TESTS
ED46833Page 93
)M~1AN LEMJ AATES CALCULILTION:..
(SEE NOT= 3.)
C.RTFCATE WO: . . ....
DATE: ..........
PAME: 2/5
V.D. BODY
Pimssw~
WhNA =CMC IATES st.MAD/Co (t.fts'/660c
200+ 90 IMAP 90+80 I(PA 80170 0 PaI 70160 Xia 60+50 3cpaI
14412.6pat 12.6+11.2pai 11.249.Gpci I.B+8.4p'J. 6.407 psi
.. ... . . . t..... ...* W .... *-fee
lot TSST
2ad TEST!
Ird =TS
H=R SCAT WEU WAN ZOUZVAL=R AREAS CA/O) CALCULATZO? (AT rA~j
jWrPPXT.ZATION 5TE) :(SEE V=T 2
V.D. BODYJWEAN PRESUME
Mr"W ZOUZV1ALM AMMA to (I ts)
95 jPa+ 8 5 ZPA 75 EPa 1 65 2CPo 1 55 E0a I
(13.3 psi) (11.9 ps•) (30.5 psi), (9.3, psi) (7.7 psi)
......................... ..... ...
21:n TT
S........) ......... . ... ) (.......) (........)
( .. .... ) ... .... ) (....... ) (. . . . . . . •
3rd TEST
.8
I I INIM - I ; I I I'M I FIRM

:J.
e-i
RIAT -COMPONENYI 9 ATTACWMNT LD.- 45834IMMINTI PER L'EWIEcA £ y* S* PPTOTYPS OjA$Z~s!CAIOfltN TSTGL'INDUSTRIA S.p.A. EMAR MM91MVT Pago 7X
CIEI
9045833Page 94
RA=SKAT Un~SLflx LaJC T=~
- RWMTfl4 iLHlSrAT LMX HM~
EOU~VAL=~ AM eALCLcM'ONl
(AT SAMr TSST~ (5r1z M= 3 )
iA2SUTIH3 IMV. 1OUXV=NT
CERTIPICATS Re ........
DATS: ..... ............
P=:3 3/5
AME A?' (fta Iq _
lout TrbST ...... ..... ............
2nd TZST .......... ..... 0
3rd TbST ............ .. (..........
- U 1Z w V.r~AT ZS1Ix HM ROUIVALENT AM
(SES R=T 4 )
(A/fx)iaj..RVww~v .........
CJILCULTON:*
( ... . ..... )
" "ET FX=UT-* s ..... 9.............0...
- 72ST CONDUCTR:..................... G.R. REPRBEITATMV .............
0I-
SI
'77.7.F

a
FlAY -COMPONENTI t ATTACHM~UNT 1.10-2 D53
VIMPMT C iN~LtDUSTRIA S.VA V.D. PIAOTOTYPS OW~LrxcxvZOw TEEE______
dCM j 1M Tl caEST-IAfsf Pago 77
ED45933Peco 95
HARDSE1XT VJW-LflS L1AXMVS
cErTIFZCATE NoC:..
DATE:......... ..
PACE: 4/5
INOT I W4AN UMAI RATE Ch=CUATICW? CO,.no) AT EACH MPP.ESSURIZATIO?1
STEP MIN~tG A)45Em TrKEMPEATURE AM 1IOSP11CRIC PRESSURE
PRAC1CALTY CONSTAN~T DURING THE TESTS A 5ZMPLZFfIE
tXPRES8SZON FOR 0",,w is USED)
V.(?-~e
(at-m*/FeQ)
V a V.D. INTEERVALVOLU3Cu a .... M (...... ft")
lp, w INXTIAL V.10. lTr=MZ VMATMV PRESSURE, Ma)
Pe FVIML V.D IN* TERNAL P=ZIXVJ PRESURE (PAL)
Di EV=ESVRIZATION STEP INITIAL TIME (DOC)
ta DEPREtSURUZATIO( STEP MlAL. TIME 5)
P,. OCTAMDAED %TEOSIPHMC PRESSURE a 760 xunflg
w 1.01. X 104 Pa a 14.6 pati
To " STANDARD N1ENT ? CPEATUPE w 206C
Taps, TEST AM4Z5I TMEHPZATURE (OM
4

a
MIAY -COJPONENTI E ~ ~ i~?J nIS453IMPIANfl ME LINEIG1A t
45U
'L¶IOUSrRIA COA. Von. 1PAOTYPEW CUAFZCAIC1II TSTs
cm I ~~LEAKI TEST CERTWZICATS k97
E045833page V6
R2MTlDCAT U ElZ2WAI LW= T=S
C3EltPZChTS N't .........
DATS. ............
PAM: 5/5
NO~TE 2 ?!MY ZQ1JZVA=NT AREA (Af~ CALCULATION AT EACH
DE3AURUATIO?4 STZP
M/1)"AO 0O.iUAIP (e21)
.0R
'U
H~,, mIEMN LMA RhTZ (SEX NMT
10Y"STAbNflOm AIR VNSITY, AT 760 rafthi XTflAP3MI
PPMSSUREAZ AN 2938K AMSIEW4 TEMPMRTURB
a .203 kg/rn' a 7.55'x 10" lb/tt'
Pma1m v M V.S. INTSWNL =RATIVE PRESSURE DURZNG TIM
STEP (Pa)
N=OT 3 :
NMT 4
CA=ZUATION AT ACHI TMIT
1 ~v i~s~wa
mccfflý 1 1 1 ti4mg -W I I wft&q;R89= I I I q I p 1 1 3 1 9 1 . G Im . agis

A TT"AMW%.Wl NIf t.](-1-2
V. a. PROTOTYP OVALZFZCATION TESTS
101= MKAL mAXnflfLrWx TEST 504W533PWg Q7
- TESTZING MKz *..*...a .**q..t*t. CERTZFZCATS *90 .... . ....
- TEST P7LCXLXTY: LEMU T'(ST STATION4 PACE: 1/2
- TEST PflOcUEDTE SO. NO ED45B34, ME. .6..
- TES- MIM0 : NIT==C
- TEST KIND 3 I SYSMMTIC I
- 1MC;•;•ZING OPEP.I•TON<S ON T. V.... ..............................
- ~TEST DATM:
lat TZ Lnd TEST 3rd TES
V.D. BODY WRESSURIZATl0U 245 XPe 24S X~a 245 XPa(14014NAL) (35 pai) (35 Psi) (35 PWL
V.3a. BODY MMS~U2RZATION ... t EK . pa ... Xpa
(DEAL) ... Psi (. pri) ... ps.)
I=L STABILIZATION WAIT
DUSULES. COMMV PERIOD ~ . .. ... .. .... s.. p.....
go 0or RUULE-S CDM=TE .... *.*. .....
MM4ITWG ZZM~ RATS .*..*.. * *....... ..
f1 I WBlLX v w. Is cc) cc/svc C-c/tac cc/tco

tsm U
- flaJua~Ea.aaI.a .~r

N-
RAT . COMPOWim C ATTACMMNT B.10-3 ED45834IMPIAWK rRVLIEIIRGIAt - YDP PROTOM1PE OUALIFICaZOt TEMY
LIWYI O X ns2' TEST MU CATS Pagoel82
DISK~ GM'L r=S=Jt LOS LEAKtES£D45833Page 99
-TESTZNOFZIgHl.0....... CEYWIFICATZ NO: ... ..... *. ...
DATE: ............ #.. o..
- TrST TACILTMs LEMK TEST STATION PAME 1/5
- TEST PXOC50U=E: DOC. NO 5045534, RVM. ...
- TEST XEDZUH: VITRO=E
- PAE- EDEIG OPERATIONS ON THE V. B. *.............................
" Particles untder soft seal:
" Parti~clesdiameoter. ............... mm ....... ms
- TCST DATA.
INITIAL V.D. BDYO PRESSURIZATION CRELP.T!VE)
T T=T 20.5 Ma 41 eZa 69 XFa 103 ]l'awe (3 pzi) (6 psi) (10 p-•.) (IS psi)I
ZNI"TAL AMBIENT -
TEZ' nAT=un (69) 2
3
ZNITIAL ATHOSPH. I
PRSSUME (Pit) 2
3.1
DEPRESSURIZATION -
WAIT TIME (eec) 2
3
FINAL V.a. BODY -
Pr=SSURIZATNCW 2(Pa tel) -
31
FINAL AHI4IEN' -..-
TEMPE.RATUE ('K) 2
IFINAL AT'4OSPH. -PRESS•UR CPa) 2
3
4

U
I
FlAY -COMPONENTIE9 Ar'EA1114,AV B-03 ¶f- E413IMIXIMLINEUS GIA f Vo.PO43834QA~rCTINTETUNDUSANTIEvEIAE 0.3 OTOTbP QWLFCRIM OIt Page 8CDs 61 bf GJb 8
EDA•5M 5Paso 100
DUSX SM~ PRMBSUI LOSS LrM TEST
- mE V.3. BODY PiWs3ulIZATZONS 4P..~) CERTIFICA~TE N~* .......
AN,2D MEAN LEM~ RA~TES Mumn") .. .......... **.....*
IDEWTFICAICITN3 P7~l 2/5
(SEENOTES I and 2 )
V.. Do Dy S HM HEMfINITIA~L PrMSSMTION No V.13. DODY LEAK Mj
20.5 KPa-(3 psi) 2 ate*/soa
3 atca/0oa
41 KPA-(6 psi) 2 atcO0/sco
3 atca/vac
1 Sac~/soa6P9 "~a-(10 psi) 2 atc/sac
3 stWa/m00
I sc/a103 K~a-
(15 psi) 2 sC/o
3 atoc/mac
U
0 I.

RA COMPONDMCNT ATTACH~MEN~T 8.0- *D45834
INDM L&NT 94R L~NRI E V.D. PROT=TPE OUALIFICAflOt4 TESTS
L'I#E UTI A L~..EAK TEST =1tT FJf2= E I 9 93
ED.4533Pageo 101
IDICK SmA V'RECBU1M LOCK Lx TES
- RESEYLTZNG MW. V.3. BODY
PRESSWRIZATIONS (P~ hiWA.) AMD
KEAY LEAK RATES (QMSX man.)
CALCUL.ATION:
(SEE NoTE 3
CERTIFICA.TENS W*........
IDATE: ........
PACE: 3/5
V.D. 300! RESULTING RESULTING
INZTZm VRrSsuxZU=.T!O NEW V.D. MDT! KE?, LEA RATEPRESSURIZATION
20. 5 %Pa .... XPa........ se/o
3 pal) .... Psi)
41 EPa .... Ima* toc/coc
(6 paid .... Psi)
69 pa .... EPA*. .. .. ... Stec/soc
C10 psi) ..... pci)
103 Epa ...... EPa* tcc/soc
C15 psi) C...... Psi)
- TEST RESULTS. ............ .. . . . .
(CCmphPIUON WITH &TTkC~4EN a.0- orDC. ED 4B4
. TEST CONDUCTOR: ........... G.E. REPRESENTATZVE2 .........
U
0
5I
--- 1211.1 M WIMM1112m, 111 1 R am 11 N I I I I Imill 1 111111 0

K
pr
Vy. COMPONOM 6 ATTACHMONT B*10-3 043834IMPIANn PFR VENERGIA 9 V.D. PROTMPB QUALIFICATION TESTSLINDUMIA 8-piL L= TM-EnTIVYWO Pago 84
ED458.33Pago 102
Ws SIM pncssum Lms LEiXX TEST
N0T~S:
FAGS: 4/5
MM0 HUNA~ V.S. 1300?
PSRES1JMZZTX0N CALCULMTI0? AT ZACII TEST:
1/2 (P.wzjxA + jg~~.
NOTS 2 MEAH LEamR ATh
CALCIJLMON AT EACHI TCST:
V 101
a
V
to
To
Pa.u."I U
U~m
V.D. INTZERNAL VOLUME (CC)
INITIAL TEST7 TIM (Sao)
FIN~AL TES7 TXIM (Dec)
-INITIAL V. a. BODY PIMSSURZATION (Pa relatitve)
FINAL V.D. BO0DY P1MSSMIATION (Pa relative)
INITMA AMBIENT TENPZZATURB (OX)
FINAL AMlIBUT TZ"MATLS (OX)
INZTM4 ATJ4OSPNEIIC P ~sURnS (Pa)
FINAL. ATHOSPMXZC PUSSrnJE (Pa)
60
-I

--
MAY.- COMPONEIITI f ATTACWHENT B,.10-3IMPIANT PEN VEMRGIA f E ROOD45834FCAZN &7T
MINUSTRIA SpA.EAK Pn ToJyp ounricTioNJ mm
ED45833Paco 103
DISKZ SEAL PMESCUH LOSS Wtx TsST
CERTIFICATE NO: .............
DATE: .......... -
PACE: 5/5
P,,, * "SLANDAV AI"4OSPHER' C PRESSURE a 160 ftuulg
, 1.01 x 10⁶ Pa m 14.6 pai
To "S3TDAIND" A•XZEHT TEMPERATURE w 200C
O 293OK - 68*F
NOTE 3 3 RESULTING MEAN V.S. BODY PRESSURIZATION AND WEAN LAX
RATE CALCULATIOT:
(AT EACH INITIAL PRE.SSURIZATION LEVEL)
A
P+9 A34 = i
PIC6. ) t
A ±d.
(rmcAm )
(Qxlvjým)
0
3
IiIL
11 - 1; 1 A .1, ql I -mmlimillm M L11 M I IP mAllitm= jý Imllwall F -g lose, a

mmm Blooms - a
E]

U
4!.
RIAY -COMPiONEJTI E IAT1TACIMEN? B.11-1 CUS634.1~1PMATP LENERGLA E V.5 IPMM )AFZXXNT-TLINDUSTR&D S~pA. W L ETClTFCF ae6cm Q LO ETCETFCXlP~5
CD45833DISK ACSEMBLY LXPW P'on= Pageo 106
- TESU4 im FI ......... cSPTZFCATE NOS: ..... o
M E . ........... v
- TUST ....T~I ..........
. TEST PR.O==W: DC. NO ED45834, REV......
- TEST KIND: SYSTEMATIC I
- PRSEcEUC CPMS'zTXCS W~ TIM V.S.z ..............
- TCST DXTAt
3
LIrT MR=~ N (2bl
.. .. .. .. ).
....... ...
.. . . . . . ... I .. .. .. .
... .. .. .. ... .. .. ... *..
.. .. .. . .. .. .. . .. .. .
w
ANNOTATIONSt
- TES? MULT: .*.0 .*...........
. UEST CC=~CTOR: . ....... 9 ... G.E IlPMENETATIVE: ..... *.....
20
*1
m.ft.-j
-`Z

NY
RIAY - COMP0NWNTI E ATTACEWNT 3.21-~2 ~3IMPtANTI PER L'ENERGIA ELINOUM~lA S.PA Vn N=.Q rrcTO S
IE
tow PLOW V.13 PEpWOMNCE9ED45833Page 106
- TESTING IPZH: ..... * ...... .*..
- TEST FACILITY: FlOV TEST STAM~
CEWTIZICATS NO I ... .o .... . .
DATE: ...... *..too.........
PAGES 1/2
- TEST Vfl0CEURZi DOC. NO ED45934, RSV. ...
- TEST 1H.DZUM4 AIR
- TEST DATA SVMW~AE
*ANTICHATTERMN VWn1CZ:
I P=S= I
TEST He
1 2 3 4 3
AR -4 -RAT- RZ () .. ..... .
ATOSPHJI. o,(.. . ...... I...... o.P... * ....
flhZTZA. PROBES PY-ADZNO3
- PRODS I ...... ......... ........
toPRODS 3 ...... ...... ...... ....................
- PROW3 3 ....... ....... ...... ..... * ......
o- PROD 4 ....... ....... ....... ...... .....
- PROBE 5 ...... ..... ............... *.......
CHATTERING YES NO YES NO YES $O YES NO YES No
VoP.ODE am PO
- PRlODS I .. *.... ... .... ... ...
- PRODS 3.2. . . ................. ...... ...... ....
- PROD .... ...... ...... ...... .
- PROD 4 ......- -..... ...... ......
- PRODS 5 ..... ... ... ... too..
U
SaI-

0 1A
MIAY -COMPOMM TE ATTACWSNT D. 11-20 83
IMPlANT PER VENEAGIA E vYE PRoToT3(ps Q4ALxrxCP.Txou TEXTSLINDUSMIA S~pA. Page_________ _____________
Cie83
um F=~ V.D. PEFOMR
- TEST DATA SUH!ROLN: (CONTIM)ED)
~C~fl~SPage 107
GERTIFI T ...
PAGE: 2/2
I T=T NO'
W/A COc~ * ... ... ... . ... .. ...... .. ..f 2/6rc f / ac
1 O N PRSUE (X ) j ... PO I ( . ..PJi I (..pi.I.... S~~G .zIj
I LOING TIME (sac) I . ... I .......... I . ..... ....
ICRAYSRING jYES NOJYES NO 1YSN YSN 1
1Y~ 1O 1 1r 1OJE3
V.S. MOSED PROBES jI
I- PROBE 1. ...... I .... .... . I ...... I ......
-PROBE 2 ...... .... ..... ...... I ..
- PROME 4 1..1.......J......j.. ..... I ... I
- PROBE 5 ... I... ... ...
U
ANNOTATIONS:
.. .. .. .. .. ....... ... ..
....... ....T . ......
S11
- TEST RESULT: ................
- TEST CONDUCTORS: ............ G.
i
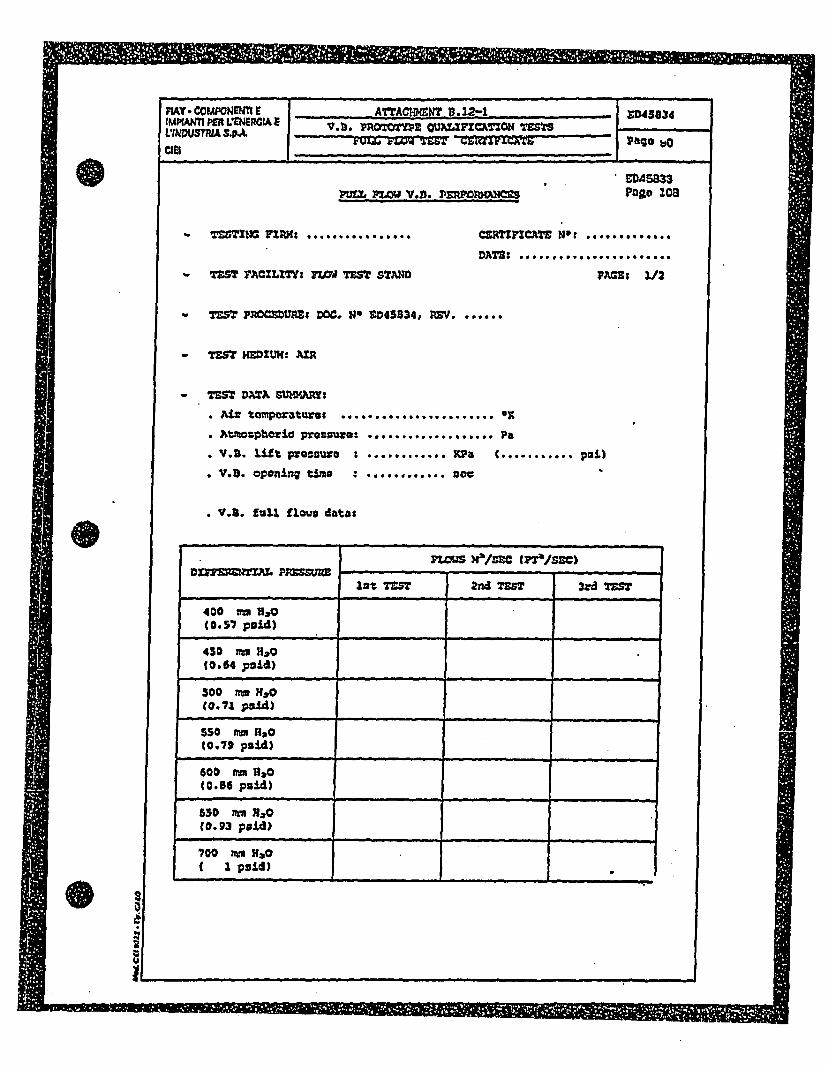
a
f.
RlAY.- COMPONEMT E ATTACW4ENT a. 12_-1 =D43834
IMM'ANTI PE~R LENERCIALNJST1 I Ws. PROTTYPE 'UA0.hLUrZckMol TEMT
CIS I*ED45M3Pageo 108P=L PLOW Von. -PEC~DOIQIxS
- TwS1 ING Z4 *I ..... *.*.~..*.. CERT2IMZATE Nag ...... 0.......
DATS? .. ... ... *...... .. *.** ....
STEST FACIL2T. 7LC~ TEST STAND FACK: 1/2
w TEST PROCEWRM DOC. NO ED45834,p REV. ...
- TEST MI(DUX:. AIR
- TEST DTA SUW0(AM:
" Air tompaoattra: ....... 0........
" Atmospherie proaure . ........... P&
" V.S. li*ft rcuo .. ..... ~ *. KPa C ......... Pi
" V.D. apanlng ti~me o .. ........ DOC
" V.1. full flwow datas
PWuS )el/= lpel/mE)DIPTEREN'l1I. PFSURB
22t TESTc 2ad TMS 3rd TEsT
400 vu Rao(0. 57 paid)
430 m H2(0.64 pai.d)
300 rm ma0C0. 71 psid)
550 mm Rao0(0.79 paid)
600 mm Rao(0.36 paid)
$30 mm 11,0(0.93 puid)
70,0 mm 11,0I paid)
m
2
.4.4
"I
-- i W- I M ý 1 11111 1 1 0.1flog MEMS

N
z. -ee- -*!..."I !Lý. , - .
U,
0
RAY - COMPONWNI I ArTACHM1 T B.122-1
IFWIMt PER LXNERGIAI4U~L E~.A I .a PRTM OVLrcrO TaIDUI a.A MIX r= TM-=TPC ao
CIEa
PS 45533Pago 209
V=L P1aw Y.f. vOmmPH*=
- V. B. FULL FLOWS VATAs CS31TZP2Ch=- NO i . ...........
DA E .... ........ .. e t s ... *(CORTINM)
PAME: 2/2
n=.W X/sEcc (l/cEC)DWFPEERTZAL PRE1"S=
lut TES?
3rd TEST 2nd TEST
I 2vt TESTs-d TS 3rd E
650 = RoO(0.93 p:id)
600 m= HO(0.86 p:ai)
550 mm RaO(0.79 pJai)
500 Inm TR'VO(0.71 Paid)
(0.64 pz.d)
400 m •1oo(0.57 paid)
w
- V.S. C.OSXKG PRESSVRE:................Rpa C......... PGO.
- V.D. CLOSXZNTZN: .......... sac.
- TEST' RMZsTI' ..................
(COIIPA1MZOR WMZ ATTACKHE11 B.12-2 OF DOC. 14' ED 45834)
- TEST CO14U1CTOV2S. ....... .. ... GA8 RPXRESMMATIVE~: ........

AORT(K), w.INV"2
S Sj~3I
02
P1
IiC'PS
'4
PS
0.00ao
025 U.0 DS S.A0 1.2 I.50 U2S
'UPS
002
0

FiAY. COMPONENt 9 ATTAE.,T 1 1D 5834OMPANTI P8R LENLRG, E V,.9 PROTOMTP OUALIFZQhTfON TES'TS
Cl~l ZUMA1LITY TEST S._m= CS Page A
ED45833
Page I11
TESTING FIRM: ................ CERTIFZCT NO: .............
DATES ... .,., ..o,. ., ..
- TEST FACZLITV: FLOW TEST STAND PAME: 1/2
- TEST PROCEDURE: DOC=, N E045934, REV .......
- TEST MEDIUM: AlR
- SAMPLE TEST DATA:
STROKE LIFT OPENZNG STABILIZED STA•ZLIZED CLOSIR
DATE NO PRESSURE TucE DfifEEflNT. FLOw TIN
PRESSURE
100
200
300
400
S00
600
700
Soo
900
1000
1100
1200
1300
1400
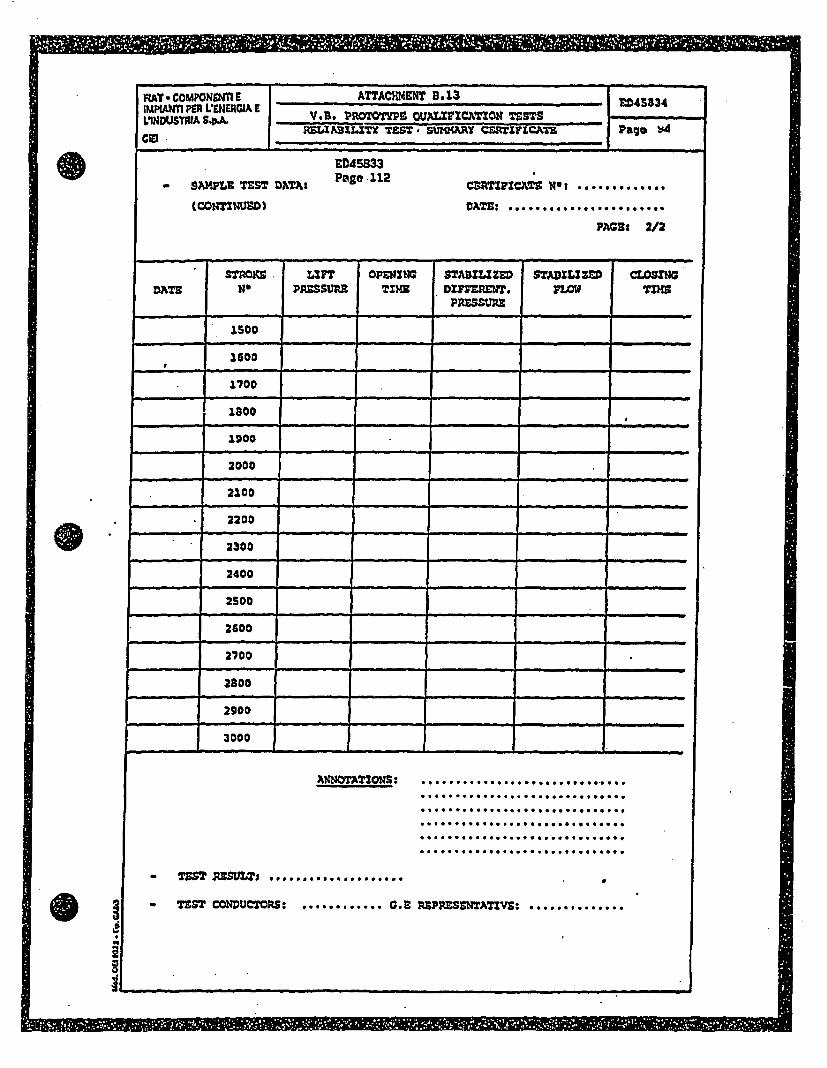
R~AT - COMPON901 9 ATTACHIMENT D.13 ED45334IMPIfLUM PER L'ENEIIA E .. ?OO1~P U 4 ~ZTO ~TLINDUSTRIA S4okV,.POTTPEWA.AIN OT
cllRELXPars4T-V TEST'- SUMMRY crlFzcATz Page tw
ED45833
- 9PLT9T'~Th: Pageo112
(CO14TZNUD DATE: 0.... Q..s..
PAGE:t 2/2
DAT N PMESUP2 TIMEW DMfEfLUlT. PLWW n
1600
1700
1800
1900
2000
2100
* 2200
* 2300
2400
2500
2600
2700
2300
2900
3000
ANNOTATIONS: ...............
. .... .. . .. . .. ...* ..
- 7S2 ~.........................
S - TEST CONDUCTORS: ............ G 8REP SESNTATIVE: ..........
ai
Ills, - 1 19 1 mvvolý I I

FAT" €OC CERT1FCIATO 01 CONTROLLO cc N.
DwIv=NgOIe1 MPsCn ON CEMScAIE roED4 5833Pane' .113
IFabbr$ationManufactisdai
b~SflW £ondar.order
000.4WOou"t m ONrwOaawing
Imitaffalfmaterial
IUiwlio -M anufacturnd
UM di COMFlo _Fewa .. paslna
cc" plan Phase Pace
toofa" dil contolloCdngo gpaelflc-Alfon
I II Wjato 0 dl mecaztaoneAcoopbrics slandird
D1ATA1DW1,1N€w Piu.L'cP.u£DATA IDCA)INA1ION
iI
Zoea oulnula:
C&*Gf otterislon:
ai tAecelalbla I nao.Ual.•tll
N I I
k'- TA.M # 4
g
o F Il T I S
7 AAe mu : -- .-
- -C a_ .0 . ..
.TN~
DoffI W. In~17| 1
11
'U+
Oat . .
im - RIP 2 0 fflon= I

MY -COMMONYJIE I =0______________________ ! 4833 1IMWANIl P0A VENERIqA 9(.'INOU4STRPau;, OMSIOE Ci
7TT7cX~UT I
MMIU-I(M DOCUnW~ NO 05494
............. i'n .....
I
II
I6
4.
i5qWll
M hawI
CANDUMgww~ VV.S 6MO~O lem s-o.&bow. au
=saA"MALtCOOW N UWJIW -M -CAUDW
wNeutn II. lb"ew^A 9 6SOMM
OWSWAM41=8000
MooreU~iC~
Ing 40j"
flo. H.I. n'06494, Recv. 0-Pago !
ED45833Pateo 115
CAS=LECHfO DI MtEO
Ois at.:
~XBY&Y!6M J&ft~Y~J~ eJ~)*PkY~ ~Z ~¶1~ PflYW~flY 9~flP~R"rATZON A=NC C"VAXCH ON T= PPMOM COPT =M
Or TME G.D.V.R. VACUUH TIRRAM PRtOYOMPE
I I
Thc' present document is tho
section c of the vacuum breftkar
prototype qviuoal tost pzrocochret
FIAT CEZE Doe. n. ED4SO33
aS n - a
Pre'pared bya Franicesco Plolici
Ahpdil, 1914

a
( HATUCED45833
Pa 116
b~oo. H. I. n'06494 . Rev. 0Page 2
CAIALUCCIMO Ol fXWO
C.1) fl1ZSMDU0TZON
C.2) TEST rACUZT DES0~PTom
C.3) 2=2 I1STRUMHUTntTZO
C.4) TZST D= AC=SXGTI10h Mw~ pnOcCsZMH Sy=2~
0.3) =-T SSOC(1
a.5.13 rm4taton Agein~g
U
C.1)
C.2)
C.3)C.4)
€.S)
C. 6)
c.7)
Rtadiating nourco str'uctural sketch
'Teut orivixomont is*-dos* alu~1es (doc1imiteto arrangoma~nt
con21gurastioa)
Oimua donmio~ters calibration curve
Douimatorm certifi~cation
Douer-rates read during laciUty cazpabiility definition
V.D. priumay coal instiallationi in the 1£xUadiAti facility
Tout tool. for primary real. irrazlintion
11 11, NJ p; Igall P1111

wurn
:'HA C ES833Page 117
Doc. H.I. n'06493, Rev. 0Pago 3 CAUALCC1o4 DI fR"O
CA1) Z)NT1DMOWCTX
Theprocedur shows operations to be parform on the prinzay
elastmomric o|ft coal of the S.B.W.R. Vacuum Breaker Proetrtype
(V.B.), FZ'T cRIz drawing no 2T137684p to simulate environmnemtal
radiation agqing.
The target of the campaign ie the exposure of the item to a
gamma-radLation field3 able to give the required OTAL ZXWTECUED
DOSE of 20 Hegarads (200 RaOy) in a reasonable time.
C.2) TETPACrLMT OMSCPMTZOR
The irradiation chamber it a concrete structure with va).ll of
I*Sm (6ft) thickness, equipped with a labyrinth for the
inlot/oulat of the exposed product.
Inside the chamber, the radiating Cobalt 60 rods are arrazgod in
an adequate rack, made up with 8 modules, each of them
containing 42 Cobalt rods, for a global charge of 336 rode (;oo.
Attachment C.1).
During facility ctand-by the radiative source restr in a pool of
demineoralized water.
The facility in equipped with an automatic handling cyctem for
the irradiation of induetrial products placed in standard
card-board boxes and remotely operated when the radiative source
is out of the water pool.
For irradiation of items larger and heavier than standard met up
operation: are performed by hands (with source under water) or
by moana of a hoict, to lift the concrete plug on the rooa of
the chambar and place items inside.
ft
M 41 PIOMP, 3 t P 422&ý ý

U
TE
Doe. H.1.06494, Rev. 0Pag 4 CASW=1C$0 am ~N
Possible movoements of ir•adiatod itoms a•e obtainable by moans
of dedicatod trailors.
Main features of the chamber are the fol•1v•ng:
- Source: stainl.os stool roctangular rack, lift• by a ppanmatio
hoist, laterally guided by two stainloso steel zopes.
- Internal Cap&City. 133 M3 (4700 W9).
- Ventilation System pacotimance: 14 air intorehangos par hour
(air flow 1370 l•A/h, 66000 S=/hz).
In Attachmenot C.2 real ir•a-doeo values of the tcst anvironmwnt
arcs tabulated.
C.3) T• ZsmTEh
The irradiation facility in equipped with 'following
intrumentation:
-Dosimeters specific abcorption mwaurama0tis:
. instruments upactropb o4tomttr for UV/V.I~* 5.
. made by: DAU$C1I-LOK
. models SPZCTnI=ZC 5D1
• ototice n:t 01830314
Dosimeteos thicknofs moaromonts:
" instrument: micrometer (10-4m proeelion)
" made by: HM==UT~
" modal : 730l
s ertios not 2046-08
U
I I I F11 11:1 ý 1, 1 IF I I

PUZ~O 119
Doc. m.I. n'06494, Rev. DI PCNOPago 5
Gama-doco measurermonts:
0 instrument: decimeters RED F•ll•SPX
. maft by: RR" LL LAOR~ATORY
. model: 4034CD (monurenm. £feld 5/50 K Gy)
. supply: BA= OPAN" lot, octobor 1992
. readings: performed vith reference to air and bymeanc of a
calibration curvo pertaining to the docimnter. u:ed (aee
Attachment C.3).
-Environnontal conditions measuremonta:
Temperature inside the irradiation chamber docn't Wluonco
the tact, anyway read Lnq of chamber temperaturo and item
temperature arc poccibio, and vii be made at the beginning
and at the end of tho campaign.
" Chamber temparature:
* instrument: valve thermometer
" made by: PXLOTE=CNI
" Ztom temperature:
* inctrument: thermocouple
* made by: KAM-MAY IflrS
* modelt sori' 03-704-708/A
-I I Wman= I II I 1 1111 1 1;

A
......
%A . ED45833Page 120
Doe. H.I, n*OU94, Roy. 0
Pago 6 CASALECCHIO 01 REMO
C.4) TEST W=t AOQU!3T7I0 AMD PAO=SXMl SYS=
The method uzod to identify the "dos*-rato" obtainable in the
irradiation facilty iL shown in the following sequonco:
a) on rebruary, 7th, 1994. at 11 a.m., 30 dosimotors voae placed
innido the chamber, as chou- in Attchmnt C.2t all
dosimotors c=otifid as por Attachment C.4. Dosimeters weore
fixod by means of adhosivo tape to a cable placod parallel to
tho source at a distan=e of 2.03m (6.7 ft), and 2.3 m (4.3
It) high from the ground
b) on February 7th, 1994. at 11.30 a.m., the irradiation van
started (plannod irradiation period: 21 hro)
W) on February Sth, 19g4, at 8.30 a.m., the irrtadination was
stopped to allow dosimoters take-up after a real ir•adiation
period of 2U hre
4) on Fobruary 9th, 1994, at 9.00 a.m., abtoebad dozes wore
road on all dosimeters and dose-rates wor* calculated (sou
Attachment C.S). Prom dozo-rate calculations the position of
the V.D. primary coal to be Irradiated was identifiLed (see
Attachment C.610 corresponding apptoximatoly to dosimeters
positions from SA to 12A and from SS to 12D.
The general roeult of the calculations was an average dono -
rate" from the radiating 2ource of 0,90 XOY/hr (9xl*
Mrad/hr).

Im•
%. ED45M3I{ATU -I O PW 121
Doe. H.I. n-0 6494, Roy. 0Pgo 7 CAULECCI4IO 01 REO
C.5) T=? crt
C.S.I.) RadiatI~on maing
The V.23. primary coal •-radiation campaign hoiuld last
222 "rt: poccible stoeps vwil be certified. The coal
will be assemblad in the toet tool Chown in Attachment
C,7 (FzAT Cizz DR2Awih n. 2RU37732), to cijmlate its
nominal configuration during V.D. normal operation in
the C.D.1W.R. plant; the arangomont vill bo
periodically rotated to obtain maximum exposition
uniformity.
The TOTAL lNTEGM•T2 DOG23 of 20 Hrads will chow a
tolerance of +51.
The T.X.D. ovaluation vwil be performed by moans of
do-imotorc placed on both sides of the irradiated
arrangement.
Dosimeters reading. will be certified at the end of the
campaign.

i
IA (Igd~ateuig scurco structawil ~icet~c1.
0
4~.
Is 1 ~~1II 1 IU ____________ b-I.
&
I
IMM II

-___l______ a__
- -Mamagft -
A ?&AMft -- -45 -S.
U
X'55~PA I2A IM-44A I&AI;A I?A INA l~I4AI{WhIM f 614-4dA5A
Ia* 5 .. ~ I * .5 N 5 ~ I I ~ * S .5~ I a I N - - - I
Attdtmnt . 2.,Test environment IS0-COSE valu.es(dosimm~ters. arrangementz confiaur'ation)

AV
FLATU-TCOae 5833
Page 124
Dcc. H.I n%06494- Page 10
Att~chwnnt C.3
Gomnm dosimoteors cal ibrat ion ci
(shoot 1/3)wva CASWLCCHIO I RMNIO
AW 4034 SATCHAb., Dosecm-I k6y0.71 5.0
O. a= 1. 70.~ 5.3,7
6 .A."J.;3 7.,
OV99 7.5
1.03 7.91.07 3.;1.L5 9.01.15 9.2
1,'; 11.1t.5 *11 1.0
:;3q 12.001.4:3 12.51.47 13.01.51 13.61. 53 14.1L.1.9 14.c1.63 ,5.11.o7 15.71.71 16.21.0Z 16.131.79 17.3:.33 17.91.97 1s.,I.•! 19.1: =; 2.
CO. SPECIFIC ASSORam"NCE (640 MNImAb Daa Abs Dose
I=; kov "-L kgy
0 5.1 0.77 5.20.T90 4.4 7 .131 3..).80 5.' .S 5.
0.04 6.L .) 0. 6.20. ps i.5 0.69 ea.5>. 72 e. 8 0. 93 6.9
.96 1.2 09.7 .'.3,.b0 7.6 1.O0t 7,7
1.04 3.0 1.05 3.1J.P9S 6.4 1.09 J. 6
P.2 9.9 1.13 9.0146 943 1.171 9.4
• ,j q- t.21 9,91 4 10. 2 .3 L9;3 12 0.7 1.29 1*0.8
1.32 L1.2 t.• = l.3
1.36 11.1 1.37 11.9
2.40 t2.2 1.41. L2.3
L A 1.2 1949 L3.31,P2 13.7 I.=3 13.Z
L.56 144 1.57 14.31.60 14.7 1.61 14.9
1.68 15.9 !.69 16.0
;.,72 16.4 1.73 1645,.7-6 16.1 1.77 17.1
1.0o 17.5 1.81 17.6t .ý4 L8. L 1,3 10.1L. t,6 13., 1.39 113,9*, Z 1.93
1.q6 L9;.3 L., 120.02_-.00 :0.4, Z 00 2 •0.
.'ASUS DOS; TAPL•.A4b5. DUamcm-I kcy0.*4 S.00.79 3-6
0.936 4.Z0.90 6.b0. ?4 7.004 99 il, 41..02 7.31. 06 8.261.1.0 83.71.14 9.11.19 9.31.:2 :0.0. :6 10.5
1.30 30.e
1.4 IA.4t.30 11.91.42 12.41.46 12.9L. 30 t3. 41.54 14.0I.59 :4.5
6.62 13.0.66 Mss
1.70 160.11.74 16.6!.78 07.?.1, 2 17.91.96 Is.31.90 1a.91.94 019.5:198 20. 6
.. .5
-g-mla xgljj2jljjjjjAjljý--- Ills 1jjmwmmjjjjw"Aýllllýx

U
HAflJI
CASALECCRIO DI RENO
ED45833
PaM 125
Doc. H.I. n'0 6494 - Pago 11Attachmarnt C.3
(shoot 2/3)
RED 4034 BATCHAbs. Dosecm-1 key2.03 20.52.07 21.52.1I 22.t2.15 22.E2.19 23.4Z. ftw 4.12.27 24.72.421 25.42.35 26.12.39 26.62.43 27.62.47 22.Z2, 1 29."2.55 2". 9
2.%3 0.72.6z 31.32. aT7 Z
2.7t 3,.75 3;4.0
2,E7 35.0
2.e7 36.182.91 37.a2.9a :8.9
94 ;9.9p
:.03 41.0e.07 42.1
Z.11 43.23.15 4494U.19 45.7Z.23 46.9Z.27 48.2Zv31 49.6
CD. $•ECIFIC ABSORBANCE (640 nm)Abp. Dose Abs. Dosecml- I kGy cm-I k6y
'.P4 21.0 2.05 21.2:.Pe 21:.7 2.09 21.9Z. 2 22-,: 2. 1:. ••4
;4. .5b 2.17 .a*. 10 23. =•.2.2! ;"
. 24.2 2.!% 24.4:. 24.q 2.29 25.1
~25.
:.•.0 27.0 2.41 zV122.4,4 27.6 2.45 :;.,o
a.e 26.Z 2.49 28.7. 2 29.3 21.5Z 29.5
2.46 10.1 2.57 30.2. ".0-1.7 2.63 Z1.19
.. bs Z2. 5 2.89 3r2.7Z2r- ZZ.42.r7 -4.3 3.77 w4.*2.SO :35, 2.S1 3S.
2.va 37.1 2.69 7•.3:.©. 3.:. 2.9 " S.6T.3
Z. bO 40.2 3.01 40.4Z.04 41.3 Z.03 41.5
.068 42.4 3.09 42.?Z.12 43.Z 3,3 3.3.,6 44.7 3,17 45.0W.20 46.0 3.21 46.3
. t4 47.3 3,25 47.b:. "S 4l. 6 Z.,29 46.9
Z. 0"2 49.V ZZ V0.Z
VERSUS DOSE TABLE.-Abs. Dosecm-i kGy:.06 2l.;2.10 22.02.14 , 2. 6
2.IG 23; .:
aZ0 2.3.06... 4.
2.34 "&.U2.38 6.&.42 27.42.46 28.!2.50 :G.C.Z.,54 27.72•.5 30.42.62 It.:-. , ,' D .?. *2.6c ; 21 42.74 ,.82. 79 34.7-
62 j5.7.66 36.c
Z.04 38.t
Z.02 4-)---U9046 41.63.10 4;* 1%3,14 44.*Z,18 4r#.4
Z926 479c
_ _ _-INN

i.v
03
~.11
S2.'
CL(a~.
RED 4034*BATCH CD.x obourvad data painte.uaiLd ILna regr'a&ante a IPourthý-crder polynoi~wal.VlttQd to obuugrvad data.
Grid dfauwun9i#o4Ox4D mm.
43
£
e.g
10(A2
0 ke
F5
52
0
00 5 10 15 20 25 so 35 40 45 5
Dase
K _________ I

I - El *1Y rED45833
Doc.H.I. n'0 6494- Pogo 13 Page 127
Attdchmont C.4 .. .
Dos moters cert i fi cat i on
I k
(shoat 1/2) AAEC001M
I4ARELL I EATCHKjOLOGY1
Hig D se Doktr.ServiceBuidin~ 10.30
Odurdawlf OXII oGZA
,I. S.hSS LTOU2A C
ZAX NO* (0235) 43 6314
The folloving 4od-polymethylveth•crylate (C'W dot:i[m6rte have beendaveloped at Harvall for the mesurwaont of high doaxs of gaa radiation inindustrial radiatir procexuing.
Type ;ecomendad Dose Range Recommended Read-out Waval.ngth
Red 4034 !S to 50 klograyz CkGy) 640 naneotrarAber 304.2 '13 to 1I kr.yv 603 MeGAMCM•O YR -100•Cy to 3kry 530nm.
The dosimeters ar 30 x 11 m. optically cleAr rectangular pieces ofmaterial. Individually pro-packad in labelled polyester/aluminiumgoll/Volyethkylne laidnate sachott. On irradi.tLon the douwne vixuiblydarken atud the I degree of darkening, accurately weasuroable byrpectr•photometry related to absorbed (vator-etwvalent) dose.
the dositaoers are ýroducod Ini batchea. The batch referenca numbers orletters are displayed on the dosimeter labels. (for example 4034 AX it led£034 beh AMX). tech batch of dosimaterc i• xubjected to rigorousquality-control, Ahd finally calibrated using a standArdiand cobalt-60irradiator and PUS900 rpoetrophoatomater before sale. •he stinardisation ofthe irradiator, and the final doeimeter calibrations are directly traceabltto L.L. 1wational 8jdsrds.
;n.trumantation Ite t1red
Good quality s:pectphotometer. .icromoter or di4l gouge. It li recommndedthat those istru•.bnts are regularly tUsted for accuracy by weans oftatndardised glass kilters and hardened-vto.l gauge blocks.
1) The dastizter: mut remain sealed before. during and after irradiation,until the time Of reading. (The packaging xaterial Is specially selectodto protect th. W fro= the effects of wacr.ea of atmosphorichumidity).
2) P:eforably, the dotizoterg should bo read vithin 1-2 days after
*u * *uiu:~ ii mu

Acx;-AKn'06494 Pago 14 E0"IC 45M3
Attaohhncnt C.4 Page 128
CASALECCIJ DI VIENOl'M 4034 ?MMSP COMM#0~ DTA
ftu: dosimeters simult:aneously irradiated Wd exch of to doxes.
Pys-thicam PUBSOO apectrophotometer. Waviahogth tstsl accuracy chocked by
dautari= are lUncs. 'Absorbance-salea accuracy by measuro~anz of wrtandu
filters cartified, by iC Stxzda~vds Laboratory (M1).
Absorbazcs vovirz air (640n= [email protected]) divdided by dosizater thickness
sptcific absorbancu. i the sp. absorbance vs. dome rospowse cum*e
xuyplied anth data point repi'ezsnts; the main sp. absorbanco of few~
nraeubil~t
Irradiation via PZicIa and dichromate dosimnrt7 to UK stardixVdi Laborato%7.
Spactropbotomatry: v"p stardzrd filters/D-emissiou lines,
O-Pi/Ga~ewao~j f 'ablvu
-A + Box. C-XI + D.Xc' - LX'
Y w , de#Car xp. absbacs)x v sp. absorbance (wr dose)
Users are advixed to use the suppliad calibration data as a guide and %a
establish calibratLivi-eurves for their own :Lnzt.'=,ats by easurig vezsa.
accurately irradiate4 dosimieters*
Sets of ftradiared, dosmeters are avai.lable frox RU~rwvej. A charge in, made
for the service.

77777-:7 3
(:HAATU'0ED4SM3Pago 129
* oe, H. I. n* 06494 - Page i5
base rates read during facilitycapability dofinition
(shoot 112)
CASALECCRIO 01 RWO
Ou ra prol'l Ikee O r
14, 1, 4d - - -U.--
24/k__ O.ZIA 01 W OAR SL iG
__.S__ O'. 13m OISO? Alto fa,;. 0 g14'4
__4___ C)tLor OmtQ! 44*s 14 AqC o.S66 ____
10,S11 O.W AS~ IS'A O.O+AR
r it 1 :G Qtscd 06Wo I141A O.&uo
__AO__A *0L O,!? MZO 260 1, 13 120
I0'4 ______ AA 04S qaL & 0 _____
ILA 010 -0 -ii U O
(O,& t IQ 01%? 0167.A~O
F
4
- ORPOMMIMS: 1-FERINAM , , : W110511aamm Iffin 11 INN I a-

'-,7; 7-
T"de -14-:1. n-06494 - Pago 16Attachimuont C.S(shoot Z/2)
HA"-ICIpa4,e33P~o, 2.30
CAAUCC•IO Do RENO
/abras (A,,,to Ath,0--_ ... Isol, P,.o ...
ýOsmjlrr)j POPASSOlb*1400a, "O ammL . .0.
I.a o j M- Dolt Dow,pyOI'Uj7,eu i nme ksofeitr Mil A, __________"(P.
dI
It
H•
14.
4
I'
.JA es
. , 0,114 O,'sli 0'a O0,2sq Oc4 o,.4 01264.
01 W?2
9 -ozqe,to
I0411 [0,510 4"xB,
0i
m
.. .. .:-- - - - .
k G 6 OSLAO OJ3UIL ASTI A.sl O10;j
A4& Dow O, L me 124,, 0,4oSA #
•, -,A~ •, ~ f- o, - w~' o'io•1OtGtl AL , ..i. .o
AA A____ ~ Q!;C J.Zo ArtS" 013,
1% 01411 Om [Ah~~~~ LA.. 6~Alo LEJOm4_____
o.~2~IO.LqgfAOq I ~14
4
A nO 0 _q
0,U3,O,'m3%i
h
I 1-~ -~ ~~*J~-.~---*. I
k! imp M

Doe. H.lI. n~'06494 - Piago 17Attachmen~t c. 6
AM V.S.primary real installation in1P. the irradiation facility
HATUICOED4S3Pe~e 313~
C&WLCCWO 01 R040
4-7 7`II1b.

-I
I ...... ...... 1ý
DIc. H.I. n'0494page 18
HLAflJIE]45M33Page 132
CAS4I=CcHO DI RUN0
H~~L
IT.
4I,iii
I
U
~1
ulwgmll-ý - am I 1 11 j M I I

* * .'** ..a. ***A.
4- 6850
+f ~580
+:
10
U
I
I
-- VITI SFALSATE. TRA DI LORO 0
Illz0
41566
Attfc-ment C.7 Test tool for primary seal irr-diatin00
i - I
I
NERO=

a
77777-
FLAY -COMPONENTI E ED45833I1NDUPER LIEFAI E ag 15XJ-8LINDMPAN $06LNEGA. Uj a
OMSIONE GOl Pago I
DOCUMENT IWMP, TEST PPMCED=
flflIaT. MJASS17ICI0?ZO: NIA 98/94
TIL . SJ2-.AJ. VACUUH IBM=~ (V.D.) PflOTOTYMP
LINCIMAL oUALIFcrzow
T7IMR)CL ACCWM rpROcWm
J7OD We: C33650
IkUTB1-3OR:
- FE3OLZ E GWIANOM
- MIAT CIEZ
jl~~~~ I
Tho precont document ir. t)hc
SECTIONI D of tho vacuum
breoaker prototype general.
test procedure ED45633
|IIII!
. . . . . . .. |
SII
I Iffilli, 11 1 1 ý 11 1 111-1 1 1

SUMMARY
DA1.) f4IV=ODUcrOx
D-2~.) FAC1LITw ZEs.ZPTOh
D.3.)
D-4.) DMiZ1 7ACOMMORTW AMD ppzc~3zN
D.5.) OPMLNTV3 SBU
D ..)Thermal a3geing
Attachm•ont•:
I '?2 Teral age~;ing furnace skatch
0.2.) ruxnaca inatrum tant~tonA Cert4.gletOn C*uOtS
D-3.) Temparaturo rocorder cortification sobot

K-
Ej iUUiiIIinjJI
IPtAYT C E-F~A~TCOMPONEMJIE ED4SS33 9045894LINDUSThIA PA. MM' 227 Ig3 I
DMSIONE CIEI
The procedure refers to the thermal &going campaign to be
performed an the S.S.W.R. VACUL3$ IRE)JMR MDJ.) PROTOTYPE# as a
part of its experimental qualification program.
The campaign will simulate the cum.Ujtljtva effects due to
eavirerimontal temperature of the reactor buiilding during a V.D.
meOan life time of 6 years.
The whole V.D. will be subjected to the campaign, which m~ight
however cause moasurable effects primarily an the sealinq disk
dioplacemanto monitoring instrumontation and on the o2.aztemoric
soft goal.
S
2 P I N - I MISK , snal IsmagallfgM I ..111 --

I
7. 7 ".%q r.A s-
M4SM3WMAW PO LTNERGIA ILUOUSTRIA 3416& Ftnm IN
Page 4DMSIDNE C191
V.2) P'ACLITI D=SZPTXMO?
The thermnal agei~ng campaign will be performed by reans of the
furnace of W73)RXOL 3 GZANOTTZ - HEAT ?PEAMUTSr Turij, Italy.
The furnace ine a "hot air rocirculationO facility and Its
principal. features are sketched in Attachment V.I. , vbote. alto
toot Item instal~lation and thermal monitoring devices are
indicated.
The upper portion of the stand-pipe mock-up uzed for SUM toots
performance (soe procoduro FlAT C131 no E45334 Attachment D3.2
shoot 2/2) Will be UtilZed a2 a V.D. supporting device, to make
its installation inside the furnace oasiot.
2
a
a

z
I
FLAT - COMP0NWNTI I fl)45M3 =D45894imW KCR VENEftA E psgo 139L1NDUSTUIA &P4.Pg
OMSIONE CICI Pg
!
The furnace r.: equippod with following inntrumaritation:-
- Safaty monitorin -:
" Lnutrumenti pyomnter
" made bys CHINO
* range: 00\10006 C (320\2S320 7)
" procition: batwoon 0,5 n~nd 1%
* aeri~al numbar: 4376131
-Control wMonitorin :
" inztrumonts pyromotor
" made by: CHINO" range: 00\4000 C (320\7S24 I')
" pracinion: better than 0.5%
" aerial numubori 1163974
Reoerdi~ng
" inctrninontsi thermocouplae (n* 3 units)
" made by. TMO=CNUCI
" range: 3009\10009C (3920\1632*F)
" procitiens better than 0,5%
" aerial number: 02, 03, D>4
Certification pheetv of furnace Inatrumantation are chown in
Attachmont D.2.
I
I I - p M 1 1 1 1 NJ I - ip jjjm jjgjý ý

U
FIAT - COMPONENTI E 453 DSV
VIND1STRA& S U Pop 1406
DWIIVONEM Page
D. 4) DATA AOOUSZTIN AM0 PPD=cS!N
rurnaoe taniporaturas time' histor~ies wiU~ be paper rocotdad
during the V.P. theowmal againg caznpaip, by means of followingr
davice:
* litraocks recorder
*made by: SICEST
*ranges OwNI2000C (32O\21929 P)
*prociviom: better tba 0.5%
The davice certificati~on sheet in chown in Attachment 0.3
U
i.
I Ell I I gold I - tj I ý 11 g I - i III 1111al- M N j I ý Dom
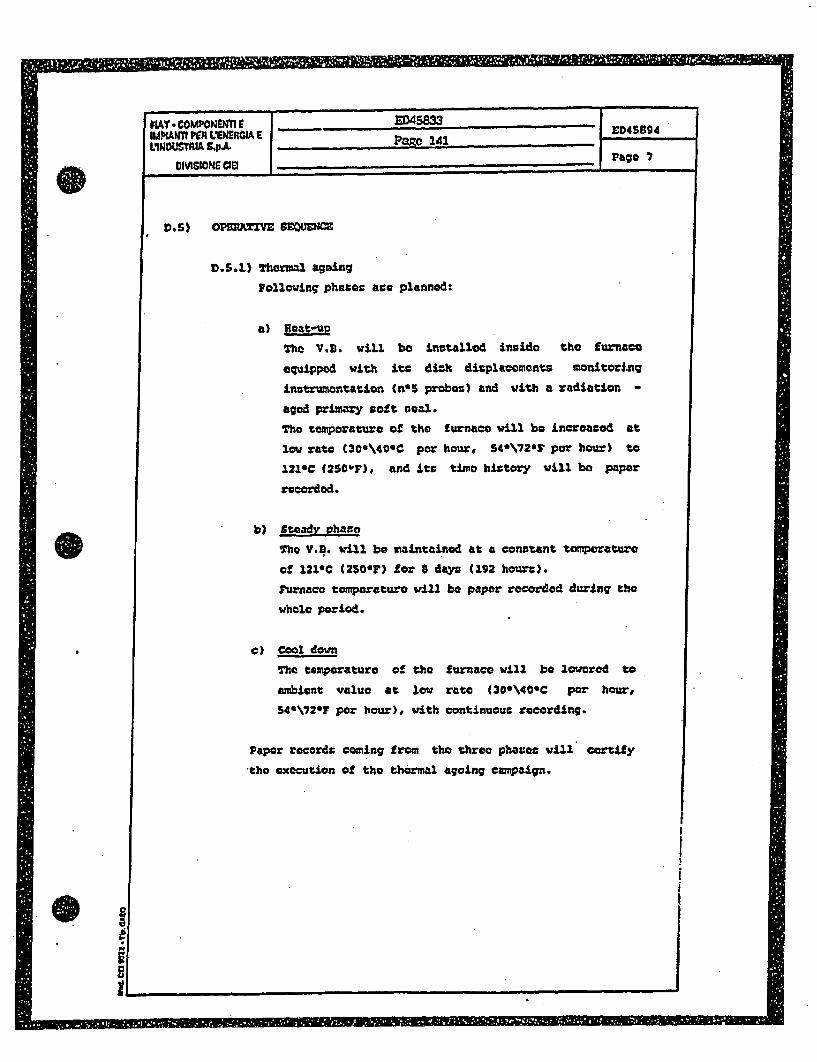
KAY. COWMOE I ED45M E D45894IMPIANTI PS VENERMGIA E -D4141
LINDUSMRIA frp.A. Ppgc 141 .... 7
UMSIONE 02I
D.S) CPMATZVE SEDUEHN=
0.S.]) Thermal againg
Following phasov aza planned:
The V.D. wil• be inutallod inside the furnace
equipped with its dich displacemonts monitoring
inatrumontation (W*S probes) and with a radiation -
aged primary soft oanl.
The temperature of the furnace vwil be increacod at
low rate (30*\400C por hour, 54*\72OF par hour) to
121*C (250"F), and its time history will be paper
recorded.
b) Steady Phano
The V... vwil be maintained at a conatant tomporature
of 1219C (250or) for 0 days (192 h.our0).
Fun=ace tomperatureo vil be paper recorded during the
whole period.
W) cool dovn
The temperature of the furnace vwil be loamred to
ambient value at low rate (30\40*C par hour,
544\72"F per hour), with continuouc recording.
Paper record: coming from the three phavec will certify
•the execution of the thermal agoing campaign.
U
0
Ia'
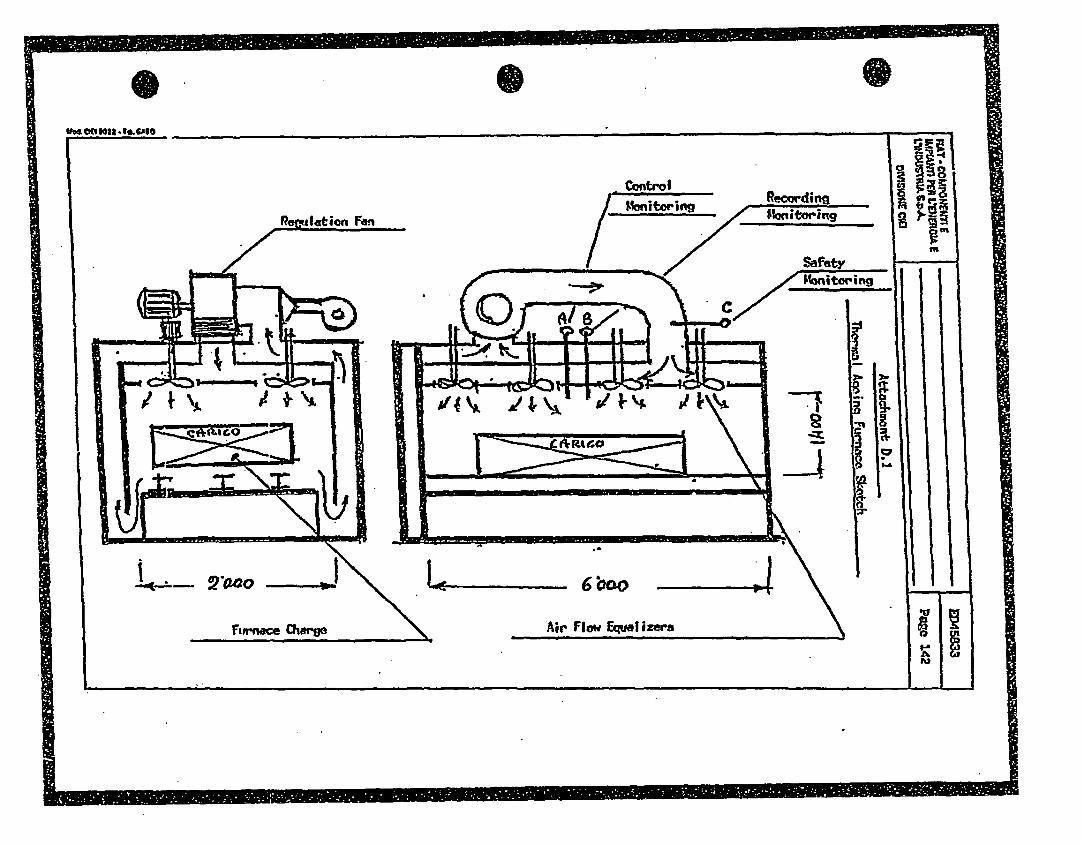
16I-. *. 2~wo 6 6boo
Air' Flowi Equoiizers

A,
W.T COMPOuNOT r ED45833jIj~ IM KANI VENLERGLA 9 ATTACINENT D.21I IDOUG=n S-pA.- o 4
URNACEfl INSR.-CERT.FICATI0WiSHEETS
SAFETY PYROMETER CERTI FI CATE
SCHEDA TAILATORAZMEROL1 & GYANOTTI S.p.A. S2TRlUMMM CONTROLLO j nnft
MopdLAD 002 E EOESIONEI TWIMPRA71mR I IwnI sen~*t' 1.:..-ok
CONnM.OUO W~ ACCMTTA21ONE o CONTROLLD IN RXUIN
'Tipo VOW W...c~pi mv~ x
100dl .. 0 ........
500wo SWi O .....
100 6005IG
2W0 70 00
306 Voo,. 300
9E400 400o
- 000 A00
7WO 100
[too 1100
AT zuuy fl.5% IAT rvuwdmto 4nne~~05
W-r .de~~ 4"49~ 4 Now.
U
2
S ~. ~.---- -
I I

I
RAT.- COMPOINTI E ED45833
wI n U t.'e•HeA " ATTACHMENT. D.2DMSNEa .... FURNACE I.NSTRLIM. CERTIFICATION SHEETS PE 144
I
CONTROL PYROMETER CERTIFICATE
I
i
SCDA TAEATUA.FMoU & GANOrT S.P.A. SUMM CON•ROLL, : lat ,I•.:.
Mod. lAH 002 1-GESTONS / _ ,,
COMTOLLO IN ACCMTAZONE 0 CONTROULO IN~ PIWODUZONE J
I ,po =o ..... , jr.w. d................ :or-o NO..PR7 p RtM 6.72.0M o 1 4...--.-4-.1.4 .......... .........
............................ ..... a .. a
T1 .. . . ..........**.. ?tiT "
1i•=o di "zgcvpa r..._.k~..•.•........ ............ ~cv d mt:iQNO ft-O w - .......Fa,,. ....GP=o di u .. . .. ..............
Dzez a ro p=z o .......... & ..-..........M x= mu np~ i N' ..... . .. ... =
"-"- -- tui " .. o .° ........ = .. ..... . . .....
rm ........ .............
C ME.MOCAL *C SpRLME'4T 'C MEMOCAL *C STRLTUME~T
100 100
.460 .:f 501 00
600 600
700 700
3 00 8 i00 - "
l00w 1000
1100 1100
1200 1200
AT ammem * 0.S &T~~o~rt mTn-lembtO0s % ST 6nemtchioNo. u .L =t:
12 --. i.7-
II
I
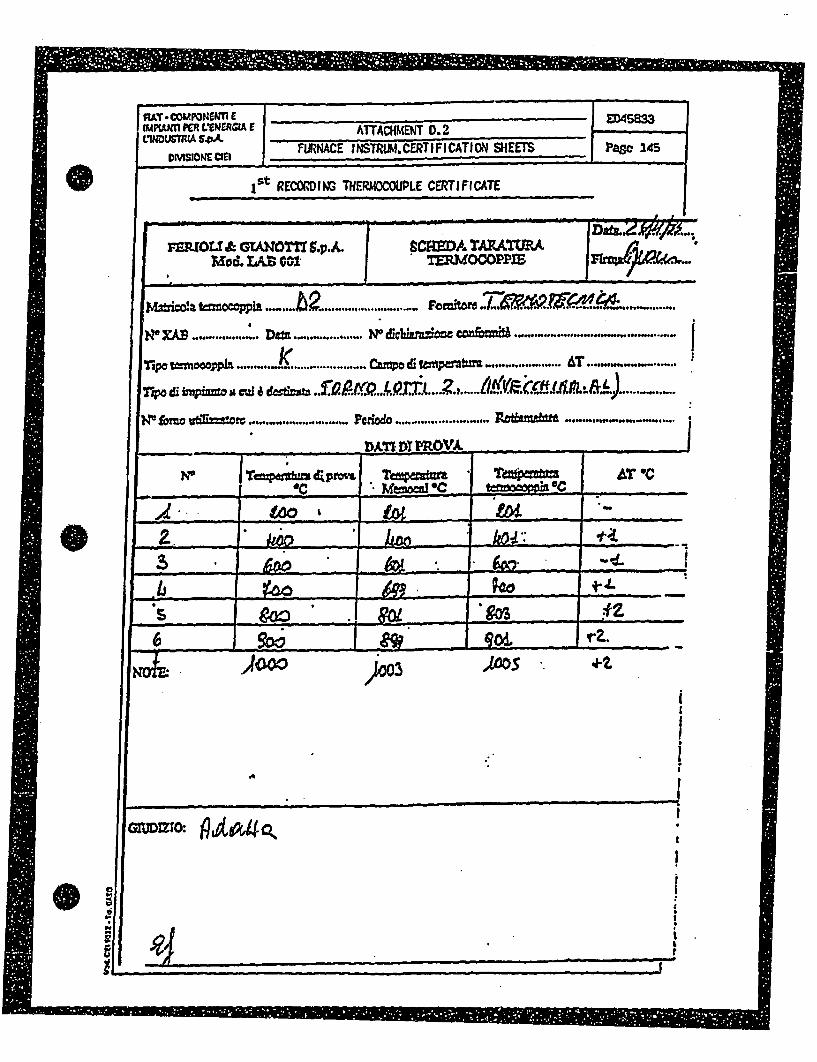
I
RATcO•MPONEPJ11 E ••45833I IMPWMT KR VENlERGIA f A1D458ENT0.LINDMIA. 6YS A ATTACHMET D.2.
DMSIO CIO. ' FURNACE INSTRLM.CERTIFICATION SHEETS Paso 245
1st RECOMDING THERCXOPLE CERTIFICATE
I *1I -- & IU-T7 - ..A. SC..-A TA1-ATMA
us ,ao m -.a... ........... .. o. -'..'-.-.....-..................*.
,,_ _.S . ... ........... .. D o n ... ... ............. '. a .k.! = . . ...rspc ,=,,r, p, ...... .... .K ............. ........ Car• di , •p = . ... ................ .,&T ......... .....
T,• ,•+,,,• +-., .+ • .[o.•.•. .... •E£....z, ...... t... ._l....F.•.......
W to= m~ sxo .. .... . ......... ........... Peid~o ......................... ft ........ .. .... ;v%-t ",. ny vvD'•l fV
-i , .+,% +.•,_. ,.v -;- l .+ ., . . .._....... .
_ _ /100 , JO'S--. ,
_ _ _ _ _ • __, , . _ _ _ _ _ _ 4-._
IA!
!
I
1GnjDzio: tPga4coie
I
It
I
I|

I
MO PER,¢n• LI•NERGIA E .. ATTAH• E~f . D. 2DMSTP14 C FLIR1ACE INSTR, L. CERTIFICATIO•N -MgEE-s Pae O148
2nd RECORDING THROCLE CERTIFICATE
. .. .~~~~~~~. . ......... . --- - _ l
.l! & GIA'OT77 Sp.A. I SCMDA TRAT.RA
M iJd. 1" 001 :_ OC• 1-Irv =
.l .... ..... .. .... . ............ .. .. ........... ..Now . . ......... "... ]DR% ......... . d1 On €O~rbT :.t .........NO. , ........
o t~O c p.I ...... ....... .......... c. ..... .. ...............•,•,, +..,• ,, • . .. • ,A.••..t:...:...• ...•........•€. ........ ... ... ..........
'ir to ub=a=o ........ .. ........ '•x........... Pago&. ........................nA' ]5 P•dnL, Iv*
I
II
IN _ T •.~pes d .ci T'_.. thm, tAT -C.
6M 14X9+. . N.O+, _. . _ _ ,
_ .*. ' . I . . . . •
%.*.tI
ownlzr
'aw0 I
0
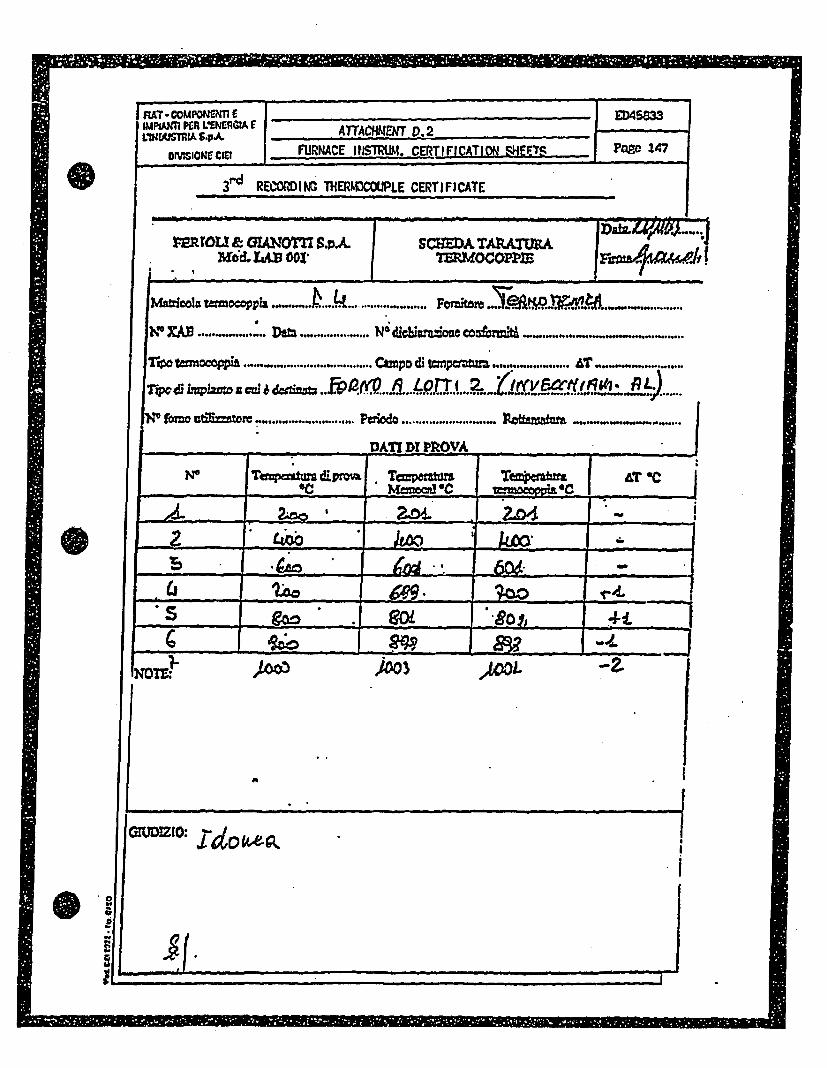
E
I RA.CMPIAn R ENRtATEVWDP IAI~ $-V R4RGA. ATTACH MbENT V.2 P Z 4
DMSONE CIE1 FURNACE ItISRM1. CER11FIC6T1ON RqEE~TS c 4
3dREWORING THERMO)COUPLE CERTIFICATE
mmru &GIAonO i s~p.-a- SCMEA TARATWLA* Mal. 1" 001' TEIMOCOPPW
........... ?eoopa............ Fo t ~........
WcXk .... ~ .a D ............ N'1 dicwuzu!oae 'confarnat . .....
S" 10 utmfl2O wp . ................ Perio d* ~~i~~ .................. .T .rn.n......
f VQ A Lor I'(f~vkcOlV4P9L IqTrmurn dvmtOab Tc~ea~p~w& eort AT -
AI _ __-kw I 1
gad -6U -
NOil
SLa
11 -jloftIF
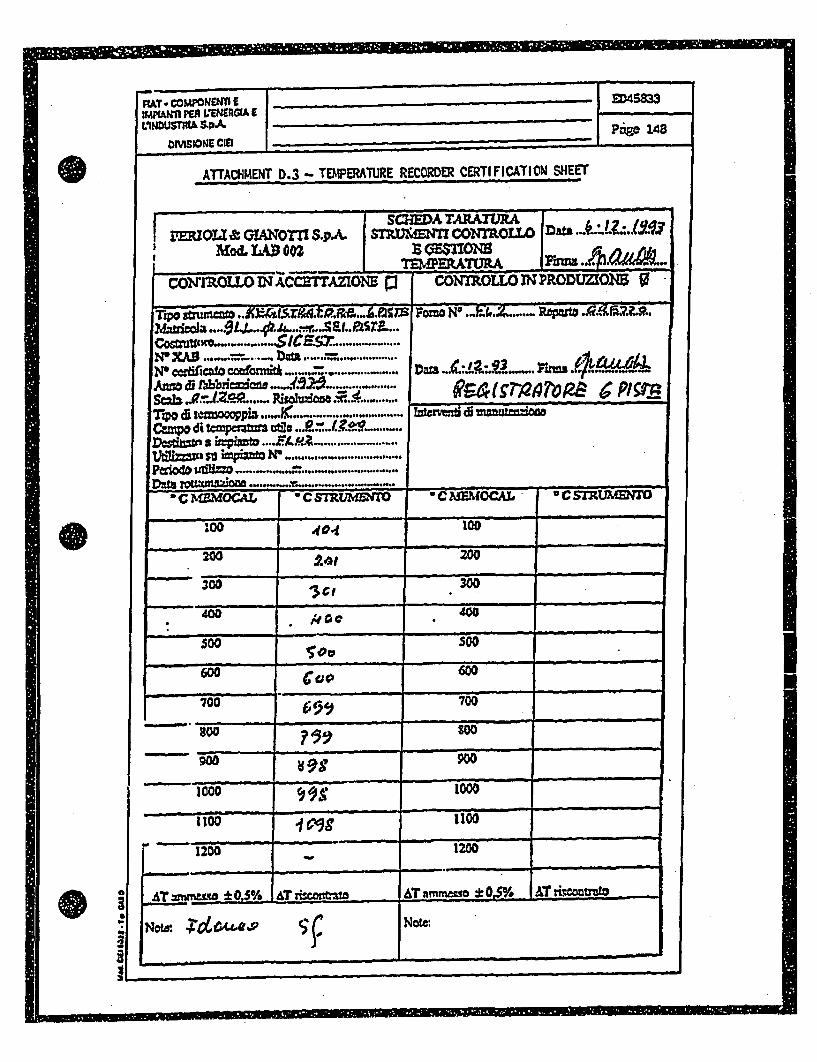
RAT- cOMPONNoI IIMPWJf PMR L'ENUEGIA IL"NWJTIUAL Sp.,
OMSIONE CIED• =
ATTACHMENT D.3 - TEMPERATURE RECORDER CERTIFICATION SIHEET
.SCHWA TA•'A7,RA£IZRJOU it GAOTTIr S$A. SMUM CONTROLL at
Mod. LAD 002 P. GE=fON]
comW1tOLL0 UWN CTAZONE ~l CONTROLLOIN ThPOU~N3
-rwgrui•,.==_..x•isrlm.•.e,v M.' lasm Y'=o N..F..:t..z ...... P4, WZI. F..i.. A.•=
NOW ........ 4,. *..... .........NO cort.icao co.. or. . . ...... DI= 4... raw.Anw d rabri me -. J.1... ' .... ..... .......... 9 m -pm= .. 4;£ ' . . . lo,
Sc , . . ... P u • . . ......... .I" & ... ....... .. ............ in
sa'd u..se,. .......- .& ....... ....Da :s , x w/. P- ............. ..... ..........
TOcm •-l " ;, . .......... ,_......................
goo10
'400 *€ 400200 200
00-- o 70o600 30w
700 700
1000 999100
ý1100IC991100
1200 10
m& m %e.c*S/ 4a riscoeAwo &T nmmmo * 0.5v AT ri==Wouf
No&. Note:
...............
. . . -

j '* o". - .. , * * - - . j , .... , .. 1 .1 - - - ., .. . - " ý. . - - ý. ;, - - .. .. . ý. .. - ý i... ;. ... . -
I . I a I la 11 Is 11, -1 11 1

FliANsALDom - - I
WD45S33
Paae 3.50
PdonbUktb
TC..MII.S.I101
cdaw job. no. fuadby pmFIAT CIEI TOSOO AAI.TCE
__________________________ 1111 lillltI>-cf b
Pmda j%=V~m o**nmkwogmodo dvwJ dt= &Xm
_ I IIi I II_ _ __ _
Tftb Dofto ch
DORyWEU TO WETWELL VACUUM BREAKER DYNAMICOUAURCA11ON.TEST PROCEDURE.
zzbAWAw
Sm. 0 0= 22W2/4 Do•dziam Stiv. i
Radizion A. BoTnNOCrUpy ko C MoA~~In RIp
ptadbyi~bc*tm., ow.zm C. MAZ231ERL
A~T"ACI-fMENT' _• _TO RAT CIE! GE'•TN:RAL PROC•URE
4LI~- 1b C. J
-4- .9-
E
cw
- - - a
pay. 0D= vw Rcowa mp~onawowede~vb ta. 3Radby &awwdZ3V~
Mb__ __ __ _ __ __ __ _ Mmwa wa bc
ax A azWihw 3f A m wV & Wd a rw S W l-

U
ANSALDO=45MYN~h _ .page 151
TCM]IS.10OO1
INDEX X
F.1 IntroductionE.l.1 ScopeE.I12 Referetwe documents
F-2 Test amiagenment descriptionF.2.1 Vacuum valve and test facility identification and descriptionE2.2 Environmental conditions simulation&.2.3 Functional conditions simulation.E-2.4 kntrfae
E-3 Test instrumentationE.3.1 Measurinsg devices locationsE32 Control and measurement equipment
E4 Test data acquisition and processing systemsE4.1 System softwareE.4.2 Synthetization of the acc6lerograms simulating the seismic eventsE43 Resonanc search testE.4A Signals acquisition and processing
E.5 Test sequenceF.6 Acceptance criteriaE7 Te rcportE. Quality amurance requiremenctsL.9 Managemnent of test non conformances

ANSALD0O 45
LZ2~~~J PaW 152
TCE.MILS.001 [IL
E.1 Introduction
E.1. Scope
This document has the scope to define the procedure that will be used to perform resonance,
faagiity and seismic tests on the DRYWELL TO WETWELL VACUUM BREAKER
descnbed at ref. RE1,.1 and E,-12,1.2.
&1.I) Reference documents
E.1-2.1 FIAT CIE! and G.E documents
E.12.I.1 25A5445 rev. I "Drywell to wetwell vacuum breaker. Test specification"
F1..1.2 2T137684rev. 1 "SBWR. Vacuum breaker valve. General assembly"
EJI2.13 Letter FIAT CIM S/CPI1/0048&94 dated 15.04.94 containing modification ofacceleration response Specr
E.1.1.4 DrawingsNO. 2136331 ,2136332 .2136337 andnotes containedinletterFlatCMEI S/CPIO013/34
EI.25.5 2S137714rev. 1 "SBWR. Vacuum breaker valve Outline"
E1.2..6 Fax FIAT CM S/CP/1/0052/94 dated 19.04.94 containing precisation about
applicable acceleration response spectra.
E.12.2, Axialdo Ricerche documents
&1.2.2.1 MTS Operation manual - JOB 93Z89E.1.222 MTS Seismic simulation software manual - JOB 921.78ER.2.3 LAQ.RP.003 rev. 0 " Rapporto di qualilcazione progmrani di simulaaione
sisuica"
EI2.2.4 LAQ.RP.016 rev. 0 " Impianto di simulazione sisrica biassiale. Rapporto deli.prove di qualificazione"
E12.2.5 LAQ.PT384 rev. 0 " Sistema di mniotoraggio contact chatters . Concetli eistruzioni operative del software".
I

ANSA-LDOE5833Pae 153
-- •• / TCE-MILS.$.I01i 11 J4
E.2 Test arrangement description
EM2. Vacuum valvc and test facility identification and description
LE' 1.1 Vacuum valve identification and description
-The vacuum valve is described in ref. E-.2.1.1 and EI.'-I.2. The device will be shipped to
Ansaldo Ricerche assembled in test configuration, that is with the test flanges (item 25 of
reference E.-1 Z12) mounted on the outlets . and the valve itself mounted on the supporting
flanges of ref. R 12,1.4.The mass of the valve is equal to 1245 kg. The mass of the supporting flange (see ref.
E.l..l.4) is equal to 210 Kg-The device will be identified by the serial number written on the nameplate.The nameplate will be tack welded to the outer surface of the valve (see ref. E..2.1.2).
E2.L. Test facility identification and description
For the dynarnic tests described in this procedure the " SCORPIUS " shakdng table of
Ansaldo Riccrche will be used. A description of this test facility is contained in ref. F.I.2.ZI
and E.12.2.4.
E.±2 Environmental conditions simulation
V1221- Fragility test conditions
The fragility qualification will be performed by subjecting the device (at the basis of thesupporting flange : see ref. E.ll1.4) to uniaxial sinusoidal excitation along each of the
principal axis until the malfunction of the valve (see pam. E.23 and E6). The dtactristics
ofthesinusoidalzmotion willbethefollowing(seeref.E.1.21.1):
a) Sine sweep test integrated with sine dwell test
" acceleration peak value : Ig and 2g (this value could be lower depending on the
shaking table maximum capability)* filuencyrange:from 10to 100Hz foreachaccelerationpeakvalue• sweep rmte:_ 2 oct/rmin
The frcquency range from 4 Hz to 10 lHz will be covered by sine dwells at 4 Hz and 7 Hz
with the acceleration peak values indicated above. The duration of each dwell will be 30 s.
------•-------a I -N--- -- 'I_.. =_- _ .- -- ' ---- •_,• •-• .• _•--- - -MI mom •:. ' ... Pip-r

I
® SALD 1,=45MLZ~Zj JPO 154
~TCE.MN 1.S.I 1 ~ 1 ~5
In case the above said accelerations values were not able to provolke the malfunction of thevalve (see para. F-.23 and E.6) the fragility test will be performed with the method of thesine dmell as indicated below:
* acceleration : two value , with peak acceleration >2g . up to the limits of the shakingtable, with step of Ig or less (consistent with the table capability, see fie. 4)
0 frequency : see fig. 40 duration: 30sforeachpeakvalue
b) Resonance frequency dwell
• acceleration peak value : from Ig up to the limits of the shaking table (see fig. 4) withstep of Ig (consistent with the table capability. see fig. 4)
" frequency : first resonance frequency identified during resonance search test (seeparagraph E.43)
" duration: 30sforeachpeak value
E.2.2 Seismic conditions
The seismic qualification will be performed by subjecting the device (at the basis of thesupporting flange ; see ref. E.1.2.1,4) to a biaxial vibratory motion defined by the SSEresponse spectra(RRS)of fig. 1, 2 and 3.These spectra are obtained as envelope of the two vertical and horizontal spectra containedin ref. E.2.13.The tests simulating the SSE vibratory motion will consist of the application of:
• 10 acceleration time histories (the duration of each test shall be 30 s)
The result of the test will be presented in terms of test response spectra (MRS) at 2% dampingfor comparision to the corresponding RRS of fig. I, 2 and 3.The processed TRS will envelope the RRS of fig. 1,2 and 3.The frequency distribution of the significative components of the seismic motion will beLimited to 36 Hz.
E23 Functional condition simulation
The tested vacuum valve will be equipped with 5 proximity probes. I pressure transducerand related electronic equipments for feeding and conditioning (supplied by RAT CIE).The output of these probes will be recorded during the dynamic tests. Before the start ofthe tests the inlet volume of the vacuum valve will be pressurized with nirogen or air.
I
=1 M, M111 I ; I MMIN c I M

DED45833R&MCM Ipage 155
TCE.M.S.1001 1 6
The pressure value will be about 100+150 mm of water .The necessary equipment will besupplied by FIAT CIOI.The output signals will have the following characteristics:
St%,pe of signals: DC voltager tange: 0+2 V for proximity swnsorsr range: 1+5 V for the pressure transducer : obtained by the flowing of the pressuretransducer output current (4+20 mA) through a 250 ohm resistor (precision I %) placed
in the pressure transducercircuit
The above instuments will be switched ou and switched off some seconds before and afterthe start and stop (respectively) of each dynamic tests.The computerized system used for the acquisition and recording of the above signals isdescribed in ref. E.2.2.5 (see also para. E.3.2). An equivalent system could be usedalternatively.These systems grant a resolution of :5 mV.
E.2.4 Interfaces
The device tested will be mounted on a supporting flange supplied by FIAT CME (see refE.1.2.1.4) . This fixture will be fixed to the shaking table (vacuum valve stem in verticalposition and horizontal axes of the discharge outlets coincident with those of the shakingtable) and will permit to rotate the device 90 degrees with respcct to th shang table.

ANSALD0 =45MI d , JPMo Th6
TCE.MfIS.10011
E3 Test instrumentation
E3.1 Measuring devices locations
E.3.1.I Accelerometers locations
The shaking table motion will be controlled by means of two accelerometers mounted in theposition of fig. 5.Response accelerations of the vacuum valve will be recorded by means of threeaccelerometers mounted on each principal axis of the device (see fig. 6).Response accelerations will be recorded only during the resonance search test.
E.3.2, Proximity probes and pressure transducer locations
The proxmity probes (no. 5) and the pressure tsducer (see paragraph E.23) will beinstalled by RATMCIES.The proximity probes locations are indicated at ref. E l.Zl2. The pressure transducerlocation will be indicated by FIAT CME and will not be affected by vacum breakervibrations.
EM32 Control and mcasumment equipment
E32.1 Equipments
A) Control and measurement equipment for Scorpius shaking table
I. digital progrmuning and data acquisition consoles (with DEC PDP 11/34)2. control analog console MTS 443.113. accelerometers ENDEVCO 2262-25 used to control the shaking table4. amplifiers DC-MTS 440.215. osdatr mod. SD104A/5 for fragility tests (sine dwell)6. LING analogical system for acceleration control (for sine sweep frgility and resonance
search tests)
A schematic diagram of the control and measuring equipment is shown in fig. 7.
B) Measur-erent equipment for acceleration sinals
1. accelerometers ENDEVCO 2262C-25/2262-25 and/or Bruel & Kjaer 4438
2. amplifiers VISHAY 3120 or Validine PA89 equipped with impedance convertersCOLUMBIA mod. 5673 (or equivalent)
I
I MOMED, SMEEM , III III ý

N
ANSAL00 45
LIr~mZIM PW~ 5
I d TCEM MI&100 1i j
3. convert=rA) DMTS-12 bis-1231.04. computer DEC-PDP 1lIN345. computer acquisition system Masscornp SLS-5450-0l (see ref. E,.2.2.5) or equivalent
for sine sweep fragility test and sine dwell (frgility) test at zsonance fequency.
C) Measurement equipment for proAmity probes and pressure transducer
The measurcment equipment indicated at previous point B) 5 or equivalent will be used to
measure and record the signals indicated at paragraph E.23.
E.3.22 Measuring errors
a) The global measuring errors of the acceleration measuring devices is equal to:
e<2.3% 0.200Hz
b) The measuring resolution of the output voltages from proximity sensors and pressure
transducer is:
*5mmV
Ileum
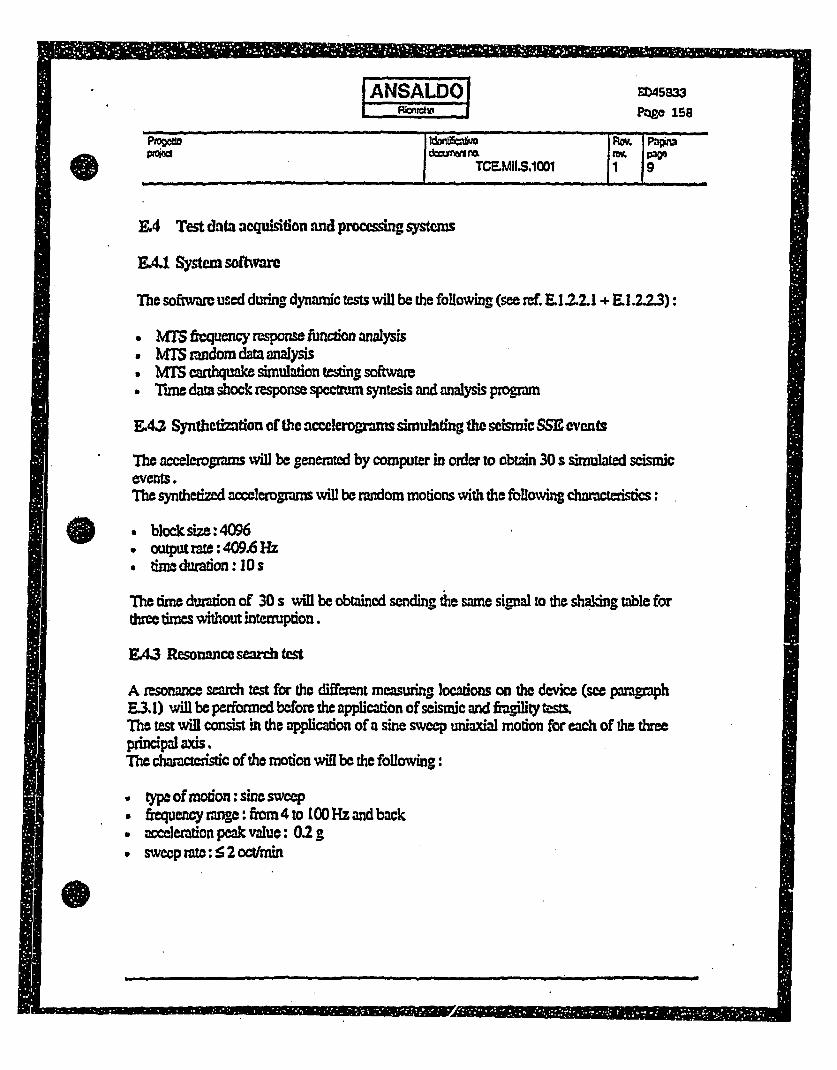
U
jANSAL-DOI M53Rimidn -IPrz9 158
prmdwmoeif M ev. 3aTCE.-MI.S.IO01 1
EA Test data acquisition and processing system
&4.1 System soihftre
The softwa- used during dynamic tests will be the following (see ref E112.2.1 + 1.2.2.3):
SMTS ficquency response function analysis" VMIS rndom data analysis" MNM arthquakc simulation test•ig software" Tire dam shock response spectrum syntesis and analysis program
E.43 Synthetlzation of the acclerogrns simulating the scismic SSE events
The acceleigrams will be generated by computer in order to obtain 30 s simulated seismicevents.The synt4ized accelerograms will be random motions with the following characteristics:
• block size: 40969 outputrate:409-6Hzi dineduradon:0los
The time duration of 30 s will be obtained sending the same signal to the shaldng table forthrco drmes without interruption.
EA3 Resonance seamh test
A resonance search test for the different measuring locations on the device (see paragraphE3.l1) will be peformed before the application of seismic and fragility tests.The test will consist in the application of a sine sweep uniaxial motion for each of fth dthreprincipal axis.The characteistic of the motion will be the following:
* typoofmotion: sinesweepf i-equencyrange:from4to L00 Hzandback
Sacceleration peak value: 0.2 ga sweep rate:52oct/min
I . a - - P I I 11ý p

ANSI 45833
Paze 159
*I TCE.MII.S.1001 1 10
F.AA Signals acquisition and processing
EAA.1 Signals from acclcrometers
EAA.I.1 Acquisition
The characteristics of sampling acquisition am:
* low pass filter cutoff frequency: 200lHZSsampling rac: 409.6 Hz for resonance and seiWc tests" sampling rate: 200 Hz for sine sweep fragility test and sine dwell fragility test at
resonance frequency
EAA.L2 Processing
EAA.l2.1 Resonance scarch test
bThe data from the accelerometers on the device and those firom the acceleronetes on theshaking table will be recorded and processed as transfer function of the msmuring points onthe device to the table accelerations.Any amplification exceeding ratio of 4 to I will be defined as resonance.
E AAJ.L Frag!ity test
a) Sine swoop? test
The table accelerations will be recorded and processed in order to obtain:
* Accelcrograins defining the table motion
b) Dwell test in the range 4+100 Hz
The peak acceleration of each dwell will be controlled by the shaking table operators throughthe display of the LING system (see paragraph E3.11 A point 6). Each performed testvalu will be registered in special tables by the operator.
c) Dwell test (at resonance frequency)
The 30 s table accelerations mill be recorded and procmcd in order to obtain:
* Accelerograms defining the table motion

I
IANSALDO =55
1j~v P.W L D3PM~ftPOI TCE.MII.S.101 i 1
E.4A.1.73 Seismic test (SSR)
The last 10 s of table accelerations will be recorded and processed in order to obtain:
* acclezrogr-m defing the table motion. response spectr (Ml'S) vwth the following characteristics:
" absolute value" frequency rage: 1+100 HzSresolution: 1/3 octave
" damphg: 2 %
E.4.2 Signahl from pro4mity sensrs =nd from pressm transducer
Voltage signals from proximity s=nsors and pressure manducer will be recorded ind
processed in order to obtain (see also paragraph E.3.2.1 C):
O• di•a s of voltage vetsws time
1ý Igo I

ANALOJ ED45833PWs 16M
ftgoaO
I TCE.MI.S.100' j1j12
W; Testsequence
The tests will be perfor accored ig to the following sequence:
a. identifi•cto of the device (see paragraph F.2. 1)b. mounting of the device on the shdk6ng table (see pam. E.2.4). preparation of the map of
the signals to acquire during tests (see pamr E,3.2).c. connection of the feading cables of the proximity sensors and pressure transdu=er
electnic systems to the electric net. Connection of the meuring instruments to dataacquisition systims and checldng of the coet operating of the acquisition systems (seepa=. F..23 and E.32).
d. perform uniaxial resonance search test (see Pam. E.4.3) in the following directions:
" z (vertical direction)" x (frst horiwntal direction)
e. rotate the device 90 degres in the horizontal planeE repeatpoint d. inthe y directiong. pressurization of the internal volune of the vacuum valve with nitrqgen or air (sae
paragraph E.2.3)h. perform uniaxial fragility tests by sine sweep and eventually by sine dwell (see par.
M,.2.I a)) in-the directions zandyi. perbfor uniaxial frigility tests (see para E2.2.1 b)) by sine dwell at the fairt resonance
fiqui (if existg) in the directions z and yI. rotateihe device 90 degrees in th= horizontal planem. repet point L in the x directionn. repetapoint L inthexdircciono. perforn 10 bidirectional SSE tests of 30 s durtion (see pamrapphs E2.2.2 and E.42)
in the directions z/xp. rotate the device 90 degrees in the horizontal planeq. pedformpoint o. in the zl directions
I
The proximity sensors and pressure transducer measuring systers (see para. E2.3) will beswitched on and switched off some seconds before and after the starting and stopping(respe.) of each dynamic tests.At the end of ach SSE and fragility event a visual inspection of the device will beperformed.Any significadive visible failure or modification of fth device will be registe'•d in thelaboratory log-book (see paragraph E.8).
hJP -IMNIN R I I I I III
I

U
ANSALEO] 45833
Rtop"Pfge 162
AML~ woo &=iwra MTC&MMia10O1 J1J13
E.6 Acceptance criteria
E.I Dynamic tests acccptance criteria
E,&6.1 Resomnance search acceptance citeria
As stated in ref. El.2.1 any amplification exceeding ratio of 4 to I will be defined as
rosnance .
E.6.1.Z F ity test
The only acceptance crereia applied to these tests arc those related to the performance of the
vacuum valve. They are indicated at paragraph E62.
E.6.13 SSE sis-nic test
During tests it will be controlled that:
a the rest response spectra CMS) related to the table modon, will envelope the required
response spectra (RP of fig.! 1 2and 3).
a the peak value of the imposed acceleration will be equal or greaer than tdh Z.PA tWken
through te RRS og fig, 1 2 and 3.
It will be acceptable that the TRS is lower than RRS in the fircqucncy field under 4 Hz.
In case of test non conformances the repetition of the SSE event is allowed with a maximumof 4 SSEeventsonatotalof 10SSE.
E.6.2 Functional tests acceptance criteria (by FIAT CI)
The acceptance crteria related to the perfornance of the device during dynamic tests. basedon proximity sensors and pressure tWansucer outputs, will be defined and manegcd by
FIAT CIOI. Ansaldo Ricerche wil only acquire and process the output of the above probes
(as indicated at paragraph F-2,3 and E4.4.2) .
H

ANSALDO EMS=83
LIZviZI Popo 163
PtOQtiO Idnti~i~iojVo. jPaugm
E.7 Test report
The test report will contain:
* test dvice identification* test facility description
rsults of resonance research tests (see paragraph E.4.4.A.2.1)
results of frgit tests (see pamgrph 4.4.1 .2)
• results of SSE tests (sw paragrph 4.4.1 .. 3)
" results of the acquired outputs of proximity s•esors and pressure transducer (see
paragraph E.4.4,2)" informations about possible visual failurms of the device during the dynamic tests
" indication of possible deviation with mspc to the test procedure
" indication and dcscription of possible non conformances (about dynamic test)
NMI I
0
'ANSALDO =45
F MMV '* Pag 164
TCEMII.O01 1 is
ES Quality ssurance requirements
E..1 Documents to be issued
For the present activity the following documents will be issued:
" present test proccdueSq itycontroi plan, test report
Morcover the test wctivity will be recorded in the laboratory log book
E.& Calibration status of acceierometer chains
Ansaldo Ricerche calibration laboratory has implemented an insmentaion manaMngentsystem that permit to control the calibration s= of the accclerocters chains(accelerometers and arnplifiers) used.
U
N Oval _MP III 1 11 111 41 11; - -- won

meow__
Ri~thqPam 165
pc"IS.60 Is
E.9 MmMnement of test tzon conformances
Any type of non conformnces occurring during any phase of the dynamic tests
comprising those indicated at paragraph E6 (acceptance criteria) .regardIless the dynamic
simulator performances or the test specimn performances , will be addressed in hem
following manner:
* complete identification, and documentation of the non conformance* determination of the cause of the non conformance
determination of the impact of the non conformance on the present phase of testingimplementation of corrective measures to prevent reoccurrnce of the non conformance
It shall be responsibility of the Ansaldo Ricerche laboratory:
timely notifiy to RIAT CIO t a test non conformance related to his test facility hasoccurred
4 perfon the activities listed above related to all the aspects of the non confornmie:inherent his test facility
It shall be responsibility of 'FIATCIS:
* perform the Activity listed above related to all the test specimen functional aspects and
their test equipments involved in the non conformance occurrd.
- ~UE~,EflI
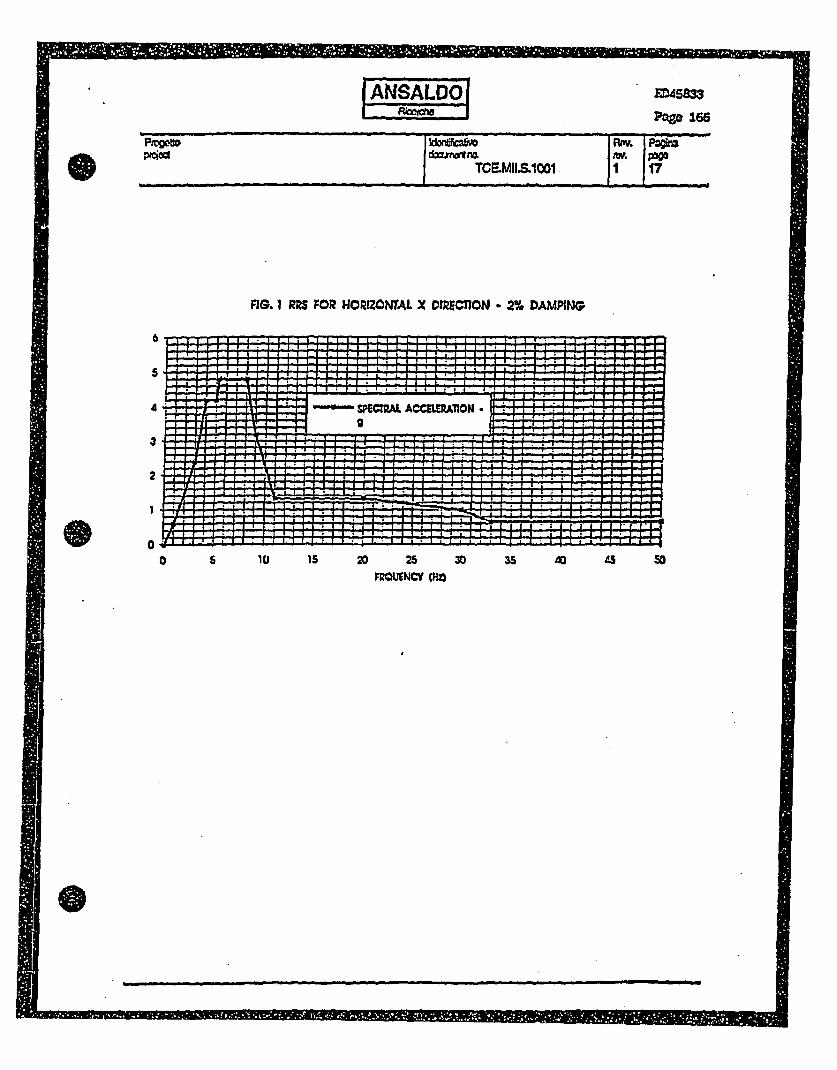
ANSAL001 =458M3
POZe 166
0pivgelo Rm. PaaI Top-MII.s.10O11 17
FIG. I RRS FOR HORIZONTAL X DIRECTION - 2% DAMAPING
6
$
4
3
2
I
00 5 10 15 2D 25
IRMUNCY CHz*30 35 40 4S so

ANSALDýFUMrCtW
EAW533PWg 167
pmg~ kb~~m O
FIG-. R23 FOR HORIZONTAL Y DIRECTION - 2 % DAMPING
6
c
3
2
0
I I i I L I I I I I I I I ]-I I I a I 1 4- 1 1 1 1
a I I I f f I I I I i I
if 11 If If SPECTRAL ACCEmulnON
t I i all I
I ax I I I I I I I I . . . . . . I
.. . I . . . . . .
I I A I J-1 1 1 1 4.
4.4.
0 Is 1 20 25FREOUENCY OWz
30 35 40 45

U
ANSADO M45M3
Po.~o 168
pmmwe~ I&.~ Idon.ficov-~ doswim m. m
TCE.MII.S.1001 1 1
FIG. 3 RIZI FOR VIlCAL Z ICrnOcD1N - 2 %. CAMPING
54.5
4
3.5
32.5
2
1.5
0
E
0 5 1o is 20 25 30 35 4o 45 50FREQUENCY HZ
I

N
~ii~m ~ Em TT~1F U
ANSLO~U-otIo
ED45M3
Page 169
ITCEJVUS.1001 IjI 2
FIG. 4 Shaking table maxinwn estimatcd performances (tested device mass 1400 Kg)
IMV 11
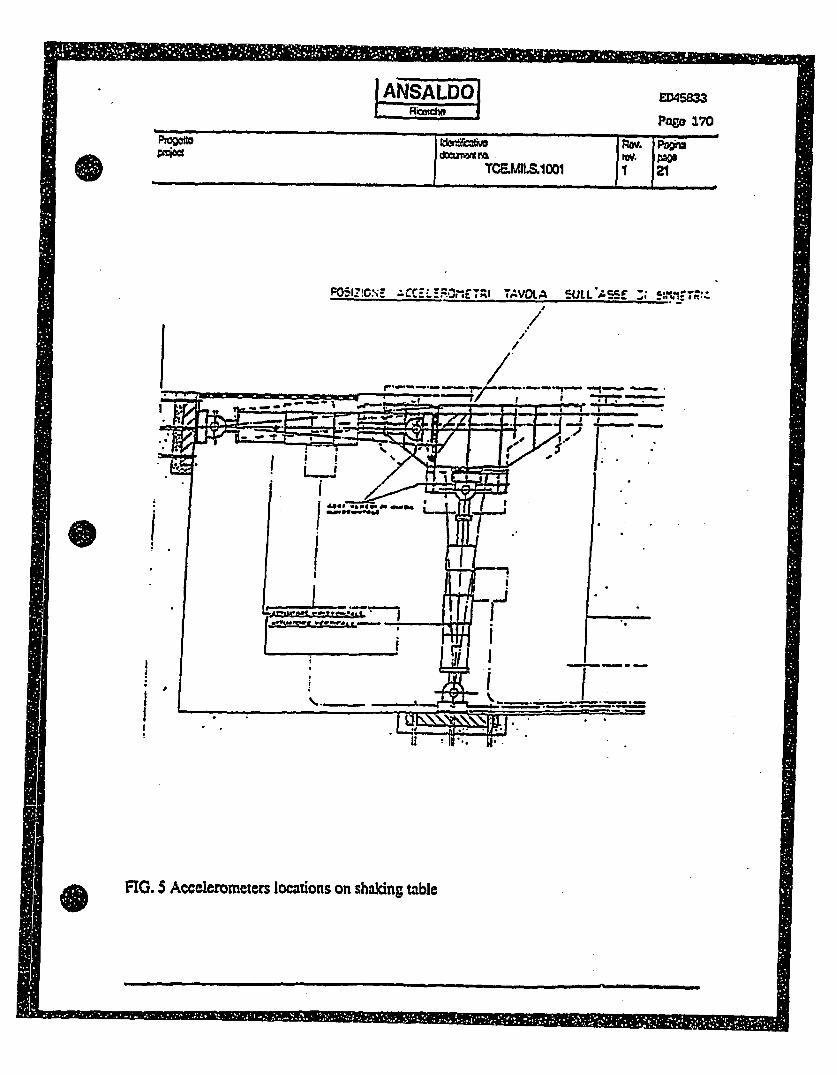
ANSALD01ften" I Pae 170
TCEMIt.S.1001 I 1 12
P0IZw.5 .71 C C 'SE TAVOLA SULL'SE:/
//
//
I
i
FIG. 5 Accelerometers locations on shaking table
man

U
..ftltioANSALDofcho-'-ý
EUSM83
Pag~e 171
-I TVEMII.S.l001 ~ 1 1 2
Y
xa 3 ..
/
CP\
*i (,",y 1a)
FIG. 6 Acceleromwtrs locations on tested device (plant view)
~*~%* -.
* *. & , * .t. ,*.
r 11 plIll I I Is.1111M ISRI 51 r SIR

y'N.0.
8
a.
4.
I.2
4.
4.
I.
I*1
ii
I'
iz0)
I-?00
I I It I-L JL - - - - - - - - - - --It~ga
s-a'4Al

U
U
11 PI p N - 11 . - - - a
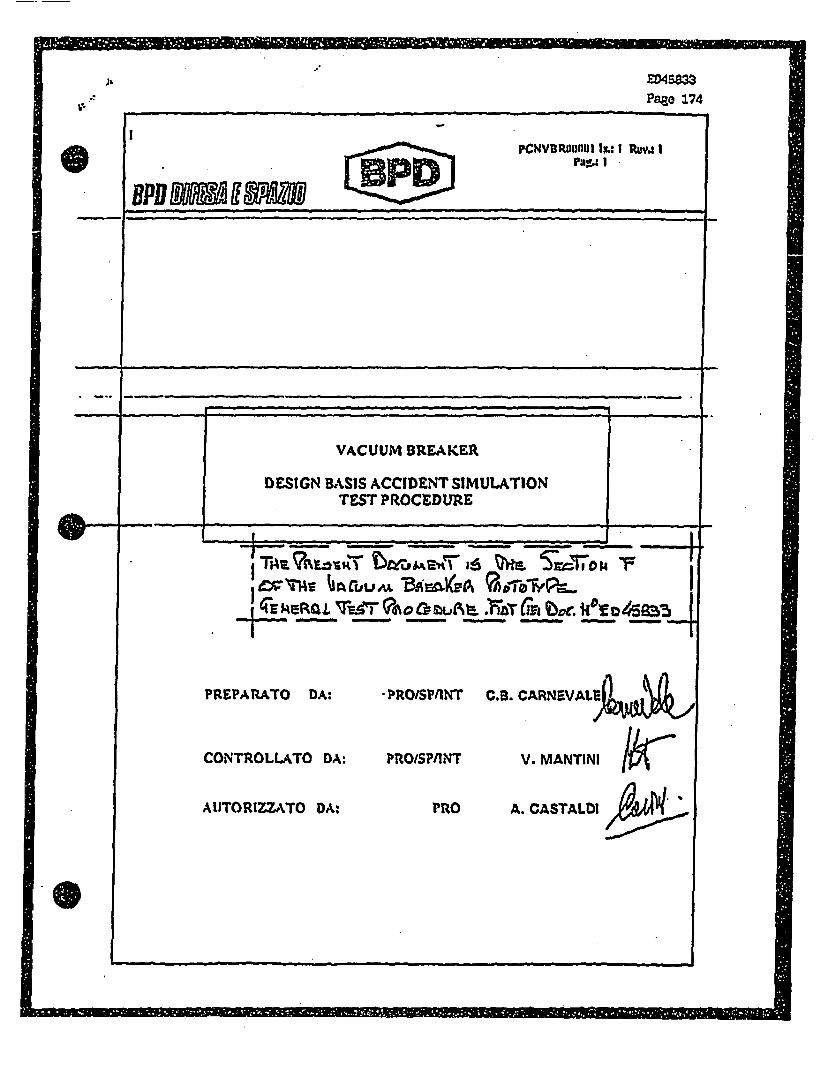
ED4S83Pape 174
Fc~atlp Im I Rv
-~1 1
VACUUM BEAIKER
DESIGN BASIS ACCIDENT SIMULATIONTEST PROCEDURE
14"EaRAL. Te•-9A.•'o~zu• *Kzj"TGj ter. jet,' a:52-S -•'' - -. .-.-.-
PREPARATO DA:
CONTROLLATO DA:
AIJTOftIZZATO DA.-
-PROISP/INT
PROISPlINT
C.R. CARNEVALE
V. MANTINI
PRO A. CASTALDI
q 11 1 1 lip a - I i I I In I .- w

E:45•35
pwt 175
IE PDPCNVBR"1nIz I9.: I ,'•,.t INiz., I
HPD ymiff m- ;SU£ D Y: -- DOCUM IENTCONF/GUTAT EP- Cr ASSIF1C'AT iON"--
BPD DIFESA E SPAZIOIF T DOCUMENT IS ISSUED FOR A PROGRAM
AUT"OR (CS): C.•D. CAmUmVALEContraactualngrn
VACIIIVAI VRIA)CER
Typiz: I A"IX Ye: (Not NIA (I O enerI f I
DISKETTE MDEN7TFICATION Cnmtract Numlber Cost;mnr_/ FIAT1 CII
TITLE:
DRY WEL TO %TWETL VACUUM BREAIMER DESIGN BASIS ACCIDENT SIMULATION TEST PROCEDURE
Paprs: Annees: Total Paivs:
AUTOL ABSTRACr.
w Tnl S.W..B.A VACUUB REAK.ER VALVE.
Nt• iP.AIATI.I DATM,•-,1"79., IKEY WORDS
DW&uitcd by: P.M. Appro,'l:
InuernaI E.%e=nI -- S.B.W.R.
OWL Ke, mwp 0 it•. Dow X - VACULUM BREAKERS I _ - , S ' ' ' I
S' _ I _ *-DESIGN BASISA . .I- -
_ ... .. [..... ... . . .. . .a . . .. . - - -| i- i ,
VISA Ln. CID: Dale.
ViSA by CID: D~uc:

ENS=3
Page 176
1! 0-
PCNVDRIIWlIII Im. I JPiW.: IPu. J
on #mj W -. w -
I_
STATO D~ELLS SDIZIONJISSUE STATUS
Do Eidfr Brmv Desrinrci tiolla Mvodirss Mod.nt N. I RAD JC:onfl. Cirntrul
bst. hmu Riier Dccription of Change (so rich.) j N. Appnor3il
21-07-3 FRSTH SUR1J I
I ___________________________________________________________________ - - - -- . -. -
- - I -
- 1-
U
~1. ..- s--A ~ - I -.
!
I mmommmsibl"m I I I 1 11 1 ffig ý I I I r1i 15 I'll I I I 111m illim;so m

ED45833
Pageo 177
aPD DZFEsx x spxzxo PCNVBROOOO1 Z:.:1 Reov.: 1 Paq.: 4
PROTOTYPE EXPERINWTL 9 P=FCATIGN CERAL TEST PROCEDURE %Eb
453~3"w AMD CORTTUTE TIM SECTION *F" Of TRAT DOCUMNWT.
acOOOOOQ
CON?~WTS
14. ??2TRODUCT!O~ - -
r.3
r.4
F.6
&~ ~
ZK~.I !NSr~tTh~KTA~TON
~z ~&za &~~~uzzz~ &~ ~Lan~~ri ~z~zzi~~Z !2~B2
At!=
gm 12fl0-hpolQ! VACUUM BREAKERL FACILTY PAID
AjS Z Sa54SZU.&Z
KITF=VH~ SUPPLY~ S. FOR LEAX T.
SZMULATSD SERV3Ct CONDITION TEST PR7FILt
-- om - , jolgi lilm I i llilp.1gli I I ilm 1110 W I! lim I 1 11, I'llm s

I
%
ED45833
Pago 178
BPD bZPEsx E SPAl ZO PCNVBROOOO1 Xs,:l Rev.: I Pag.: 5
F1.l SCOfl._-7t-po dw--.h -~~ deacrd=€-b==---a l.-~he ..operat kong-neee=sa&- to-~a~ry-out ...... ...
the DESIGN BASIS ACCIDENT (OBA) SIMULAION toot for the VACUUM
Bp•ALUR valve. All the activitLes shall be performed at COLLzFErO
(Roma) in the 3C-TEST CENTER.
National and canter safety regulation shall be considerod an
applicable.
-.PLZ.2LE •DOCW4ENT$t
2SA5383 VACUUM BREAXRR (PROWOTYPS) PURCHASE SPEC.
25AS445 VRYWK=L TO WZTWELL V. ORSAKS1 ?TEST SPEC.DW 8 318.L•COA.003.00 NITROON SUPPLY S. FOR LZAX TEST.DW, 313.00.A.002 VACUUM BIREAM FAC1hZTY Palo
7.2 Test Facility DOescription
The ORA sLmula.tion facility, is designed and manufactured conform
with CFO VICUUM N ~EAK5 V~ALVE USA test spaerl3.i.CLofl 49 4SX54ia.
The facility is mainly constituted by the followingas
- Teso chamber.
- Fluids (Stoam, water a Nitrogen) supply system.
- Test data acquisition.
- Test data moniJtoring.
- Teot tacility controls system.
- Toot Volumo pressurization, Nitrogen supply control systom.
7.2.1 Tot chambar•:
The tact chamber ret. DWO 323.00.a.001 having a diameter of 2700
manad a length of S200 on, .with an internal volume of about 27
cubic moeor, Ls capable to be pressurized at 9 DaO, -and shall be
submitted to validatiLon by IPESL according to ANCC requirements.

U
r £D45833
Pae 179
UD DxFEs? E sP)ZXO PCWVBROOO20 1c.:1 Rev.: I Pag.: 6
r.2;2 &team supply syOteXM
~- ------ The- -s!on- up$?- Ey ¥gtsm--ku--CenaeJtktused -. y,-a, -4 ? S BarG-pro~aurt.- .......-.
steam Qonorater, used to presuriLze up to 1S bar a 60 cubLc moters
steam accumulator, a domLneralLtd water supply facility, to be
uwed also for the WATER• SPRAY.
r.2.3 Tact data acquisition and data monitorings
-- h .multiplexer NKE-300,.and- •
sto•red n 4 60 b hard dicks, monitors, plotter, data cartridge,
printer etc. are avaLlable.
The test data shall be supplied i
- Chart table print eut of OALL= parameter.
N- MagnitLc tape, to be stored and available for a maximum of I
year.
- •i.oppy Dlk ASCII format up to 24 channel each dick on requeat.
|P OF IMMIMIUMN I 1 0 Imaeffialliffigg M! 1111 1 Al III -NINE OEM M EMI NOWN

I-
Pno 180
9D• DZI A 3S SPAZXO PCMV3RO000 Zs.:1 ReV.: 1 Pag.: 7
r,2.4 Test data monLtoring:
----- Thor--test--conductoe- uh~rl-l'-fo'L".owr t~he-test -act:LvLt, e-'tmby-a-nion.-....
able t* dL:play up to 24 parametsro in the same time, the t••t
data to b= shown on data sreron shall be selected by test
conductor; the toot conductor shall inform the computer operator
prior to start of test activity.
r.2.5 To#% control system:
The tost control system is bamod on a PLC contrllear. capable to
drive the test main earamaters (plressureo teomporatuWo) automatL-
cally. The test PLC and relative lamps and selector switches are
located on CONTROL RACX.
The tas% conductor shall actuate the controls and relative comn-
mands manually or automatically by automatLc/on/off selecto:
swL:•c•v (for axample for the WATER SPRAy).
The physical parameters (pressure. temperature, water level *ot.)
shall be monitored by DATA MONITOR of DATA ACQUISZTION SYSTEN.
The loak t•et shall be performed by actuating (manually) the toet
volume nitrogen supply and purging system by NITROGEN CONTROL
PANL refer to dwg. nO 918.FC.OIA.003.00.
?.2.6 Test volume Nitrogen supply system,
The Test volume, located in the wetwoll side of the Vacuum Breaker
chall be pressurized in oardor to maintain the maximum allowable
delta pressure of 20 PSI during the Test Chamber pressurtzations.
A cracking diaphragm a: 2 Br shall be ins:alled itn ordor to
avoid a reverse pressurization between DRYWELL and WETWlLL.

=
I
ED45833
Pago 181
mW KvIflEh E SPMZZO PCNVBROOOO1 Zs.:1 R~ev.: I pa.: 9
r.3 ?ZAX£&ILYTL Im 1~
PV-04C00 45XV-03 ON 40Xy-OP DN soPT-04 10 BARMT-02 I BARTE-04A TCTE-040 TCTE-04C TOFC-02 ON 32PI-09
VEtNTVENT TEST CHAMBER *HNCK PRESSION"CONDENSE DISCHARGER "ATMOSPHERIC PRESSURE"
TEST CHAMBERDELTA PRESSURE TEST CHAMBER / TEST VOLU14ETEST C•UDBER TEMPERATURETEST CHAMBER TEMPERATURETEST CHAM4BER TEMPERATUREFLOWMETER "DE-OVERHEATER" (VISUAL MONITORIPRESSURE GAUGE WATER PUMP ODE-OVERREATESI"
-- -04 RNU- NWITCH WATERrump-b • SU -0-V&AT&
LG-Ol LEVEL WATER TANK "DE-OVERHEATER'- *V-04-- STEAM VALVE "*-1'" (PRERISC. 570CJ-
SSL-01PI-10PI-07PI-23TI-OsTI-02PI-OP
ARM6 FIOT-Ol
HAND VALVE "OPEN" INDICATOR SWITCH "2-1"NITROGEN SUPPLY PRESSURE GAUGESTEAM ACCUMULATOR PRESSURE GAUGE"E-l" SUPPLY STEAM PRESSUIM INDICATORTEST CHAMBER SUPPLY STEAM TEMPERATURE INDICATORWATER SPRAY TEMPERATURE INDICATORP-2 WATER SPRAY PUMP PRESSURE INDICATOR
ON 40 WATER SPRAY FLOW TRANSMITTER (4-20MA) O-l5mg/hd
VTA-1
WATER SPRAY FLOW (CONVERTER I-VjT-1 TANK WATER SPRAY LEVELT-1 WATER SPRAY LOW LEVEL ALARM
STRUHENTATIONt
FT-04PTO-02
PT-IFT-3PT-2PT-4
IC-2TC-3
TC-10TC-12TC-12TC-8
TEST CHAMBER PRESSURE (CONTROL PROCESS)DELTA PRESSURE (CONTROL PROCESS)
WATER SPRAY TANK LEVELTEST CHAMBER PRESSURENITROGEN INLET PRESSURE. (TEST VOLUME)NITROGEN zINET PRESSURE (TEST VOLUME)
TEST VOLUME TEMPERATURETEST VOLUME TEMPERATURE
TEST VOLUME NITROGEN OUTLET TEMPERATURETEST VOLUME BOTTOM DRAIN NITROGEN OUTLET TEMPERATURECOOL TRAP BODY TEMPERATUREWATER SPRAY TARR TEMPERATURE (43oC)
I

E*Z4533
Pago 382
MPD DXPESA H SPN ZO PCNVBR00001 Z1.:1 Rev.: I Pag.: 9
F.*4 A C UQSLL-T12l SY1
The data acquLiLition ystim shall be Capable to measure and record
oCle sample (channe.1) each 30 microseconds, during test actiViLtes
shall be used the sampli.ng time of 100 mLcroseconds.
The maxLmum channel number iu 129, during tst.s shall be usod a
maxLumu of 64 channel.
The dane shall~ 55 rvcor~3 an value arttr appli&cation cc calibag-
The data print-out m~y be performed at equal or lowor (than acqui-
BL.%Lon) froquency
The moapuro'mont instruments &rta
fT-2 WATER SPRAY TANX LEVELfl.-3 _TES? 0~MOEB PugssmsPT-2 NZTROGM I NLET PRESSURE (TEST VOLUME)
Po-4 NIT•4T EN INLET PRESSUR (TEST VOL UMX)
TC-2 TEST VOLUME TE.3KPET4TURZT0-3 TEST VOLUME TEMPEPATUTIZ
TC-10TEST VOLUHE NITROGEN OUTLET TEMPERATURETC-li TEST VOLUME BOTOKDI4 1 bPHfI TAW9E OUTLET T214PEP-ATURZ
TC-12 COOL ?RAP BODY TSHVISATURETO-9 WATER SPRAY TANX TEMPERATURE (439C)
Per the pressure transducer the accuracy in 3% fs.
TERMOCOUPLEZ P5-CO a ace 31 qty 12
Pressure & temperature transduceg calibratijon data shoots shall be
available, ftl accotdance AAP.
The calibration of the flow-metor shall be supplied by
manufacturers during tost the output shall be compared to the T-i
tanki level variation value.
Em, A II i
H

U
ED45M33
Pae 183
BPD DxflSx E spCzzo PCNVBR00001 Is.:1 Rev.: 1 Pag.: 10
N"OTZ: t -u"rT DzEC=OR" OR THE *ESTC='ONDUCTOR° CAMN "D;cIDECTo-KMODzIt
THE TEST SEQUERCCe OR THE TEST DU•RTION ACCORDING TO TUCE TEST DATA.
PRER•EQUISZiTESS
- Vacuum Breaker JLn:ido test chamber.
- Text Volume connctoed to Vacuum Breakor.
-Tgpt Volump connomettd to pVrL#XjL~jgatLjn_ systeMI
- Text Volume connected to steam condensed reaturing syntom.
- Tcot Volume Tormoceupleo inctalled and functioning.
- Test Volume pFoacure transducers functLonLng.
- Test Volume delta pressure transducers funct/onLnq.
- Test chamber closed.
- Stoam geonrator pressure 14 Bar .mLnLmum.
OPERATZVE PROCEDUREs
NOT~t AML WATER COMINC OUT.OF 2WE COOLD TRAP N=S BE COLLECTED
AMW MEASUED. TiHE TALE BELOW MUST BE USED To RECOIRD TI FOLLOW190
PAB AETAOS:
TABLE DATA LOG
U
DATE TIME
99.9.
*999*
99999
.9...
*9999
9.999
99*991
9*9*99
.9.99
*9*999
9.99.9
99*9*9
999.99
99.999
*99.99
*9*999
COOL TR.TEMP
* 9* Ce*e.
*9999 99 9*99999e9
*.9.. 9e99
9999999, *
999999499.
N2 INLET X2 OUT T.FLOWRATE n.l0 6C
tooo*o.ooe 9:.
,..9...99. 9.9.000"o"..99999oo99 oo999 9999
*99999.99* .9o9oeo99o.
999999o 999 9999
9ee.o9*ee9 9999999o999
02 SOTT.DRA.OUT. n.11 0C9 ..9 9. too
999999999999
999e99999999
too *..9.. 9 ...9toe999999.9
CONDENSATEVOL. COLL.
.99...Ml....99999eO9999909 0...se9 e**
toet g o .e
o .00 ....999
9999 99 99 999
999999999999
-. --

km
E045833
Pago 184
UPD DZFPSA z SP)AZIO PCHVBROOOO1 Is.:1 Reav.: I Pag.: 11.
TAZLX DATA LOGI
---- DArc-j--rnc-f-COOr Tlr;*N2W?4LT"'
o..
.. . . . .
* S.* S
TSMP PLOWRT
*.........
-NVOU? T-..10 Ile
.9.0 .0905 ...
I
OUT. n.1 IIc
5......9......
I'6~ U4J~4.~dk~A. I
Vol'. COLL.
..... ....... ........... ...5555 ... *..*...
9S ~ ~ ~ ~ .. .. . ...5*5 *..9 5 9......5.. ....... **5
.... .. ...* . . .. .. * .... .... ... ... .. ........ .........
59555
.5.5.
S..e.
9....
*5e5e
99o5o5
.5.59
9595,
9....
... 55.
*9.55.
599595
995~59
55....
5.95w~
C9~~5 9
5S*. 9.
* 5.5.55*9q
59.......
* 5555
*.5...55 S
,...595..
955
9*9~~~9S9
5~9*5~5**
* S S S S
55.......
S5~~S~S*5
95~~~55*5
S.....5S.
5~5~*55*~
. . . . .5.5.5
5.......
. 55.. 555. ...
59..9 .. .. . ..
. .. .. 5.5. .
.* ... . . 5. ..
. ... ... ..
. .. .. .. .. ..
. . . .. .. . .
. ...5.5.5.9. ..
.5 . 9 . . 59 ...
...... . 9. . ...
.... . . . .9.. ..
5.59 5 9 . ....
. .. 9 ..
0 6 .. I
05~ 9 0
I *eee tl
9....
9....
S..o.
5...o
.5O..
.55595
95*~9*
5.55..
9599555555
* 9*9555***
*599eS~9*~
* 5555*5 ~
5 SSS S 55 *.S 55
5*.~955.~5..

iED45833Page l85
BVD DZPESN E SA2IO PCNVER00001 S,.:1 Rev.: I Pag.: 12
- Verify that the 4 instruments on facility control rack have the
- Verify that the PC04 controller on faeLILty control rack is in
RZXOTE mod*.
- Verify that ALL selector switches are in AUTO position.
- Verify that PD INGTRUEINT CONTROLLER is .0.6 Dart, if not sot the
controller to thin value, by pressing the up/down arrows on the
front of Instrument.
. eta pe thp hIii'n vi.1vgt C-O1 nend Sigcify vAL--1 LX_.LV =5LO1! rS "OWS"
(on facility control rack).
- Verify manual valve from cold trap are to tout volume are OPEN
- open the hand valve C-01 and verify :AL-01 LAMP VALVE CLOSe IS
Morro.
- Give tho start for T-O saq•unco command by PLC (start hot air
supply to TEST VOLUME) by pressing the "57' c" preas push-button
located on facility control rack.
- Verify X-1 fan lamp.OH.
- Verify temperature increasing an facility control rack.
- Wait until Test Chamber temperature consors are stabilized, if
necscsary adjust TZC-04 located on CONTROL RACK to obtain the
required temporature of 578C.:Record value iTC-1 eC TC-6 _ c A4 *c
TC-2 "C TC-7 _6C AS - ¢
TC-3 Cc TC-9 , c A6 -c
TC-4 'C TC-10 'C (process Coc.)TC-S C TC-ll ...

£D45833
. Pago 188
DPD DXF , Z SP.zzo PC DVBR00001 15.:1 Rev.,: 3. PIJg.: 13.
DATA ZIECOM0ING T-0 STATUSs .. ... .
- GLve the computer operator the STATUS ACQUISITON command for
data acquisition o* 60 sconds.
ACCPTAN CRITERIA ?-0 STATUS:
- Perform a quick-look an data-print-out to verity measuring
system is functioning,.
. 99MjY ME~a IOJ.LOVJ~f paraimeer. are 3
PT002(oiff) 0 BAR * 0.1 BAA. reorgd value ______Ai
PT-041vass) IOIKpaA* l0XpaA. record value______A
.0t-l ell2U c? -FtA V 4f ?f 13v. OP 117c To 34f)al #1 eell .
PAR-TEST CONDZTION3
- vacuum Breaker LnsJ~d* too% chamber at the *T-0 condition (570C).
Teut Volump connectod to .:•.teogon supply system.
Nitrogen supply valve OPEN.
Tout Volume cony.acted to condensed stiaa, measuring system.
Tout Volume Tormocouplas installed and funcioning.
Toet Chamber pressure trantduca:w functioning.
Toot Volume prozzure transducers functioning.
Steam generator pressure 13 par minimum.
"at water accumulator DU-I to 1/2 of tank minimum.
on1 water Ln~octLon pump P-1 operating and the f lowrate 15
m3 /mLn on P0-02# (Lf necessary operate on V-02 (by pass) and V-
al) to adjust flowrate.

Page 187
PCiVBROooo1 Z;.-i2 Rev.: I Pac.: L4VVD bZTVFSX EPNZO
OPERATIVE PROCEDURESP.
.....-OTE-" O l T".T£R -O -"-T'OTTI--"CO ITRAP-" -
82 COLLECTED AND MEASUR ED. THE rOLLOWflIO TABLE MUST BE
COMPLETED TO DOCVI•ENT CONDENSATE COLLECTZON:
mU~lE DATAW LOG
CATS I TIME I COOL TR 1 W2 INLET I N2 OUT T. I N2 OUT T. I CONDENU•AT
444 44.4**C* 4 ... I/min.. ...44 ............. ... ~~r... . .. .-. ..... .
4 4 4~ ~ ~.. .......... 44 4 4 4 .. ..-----•-..- • .-..... .i..-...-... ..-.....-.... ....•.......1 ....... ....
*44. 4494.4l 4 4! • 4ii44it i4* !44 *444 •V Lt l
44944 e •*e 444444 * 44o*ee * 444.4449 e e~~e e • eo e*
44l4..... ... •..... .... ...... ...
#9444
* .4 *.*. 44~
44 444
4~~4~
4~444
*4.44
4~44~
4.444
*44*9
*4494
4....
44444
.4494
*44.4
.4.4.
* 4.94
44.S.
444449
444444
~4*444
*4~4~~
44.4..
4t444.
44444
44944.
494449
4.499.
94.944
~4494~
* 44444
4*~444
4.....
444444
*44444
............44..
* 0 9 0 * *44444
444 4.9. .
* . .. . . .4.o.4.494444.94e 9449.44449
.. .. .. 44..44...4l444444o94 4oo44e.9e4
444449444 o o e*4.
4.* 4* 4 44 44. 4
444444eo *o4o
4 4 4 we~ e
44444444444
44.444.4444
"44 '4.'44444444444444
4444444::.44
449449o4444
4449.44....
4994 4o44444
.44444.444.
4444494444e
4444.944444444444 44444
4...92-•...4. ......
444444.449
4444449444
* . .b
94. .....
444444444
4444 . 9~v
4444449449
494444444444
.. . . . . . . . . . . .. ..... 4..
44444....4444
. ... . . ..... .... . . ..
444444444444
444444449444
444494444o94
49444o9444444
444444444449
444444494444
4444 44444444
444444444.4.
. .e . . I .. .. .. . . .
4444444944i ***e*''ee4oe
44944444
ii
UNFAM02" - q gq"mgl- -OWMIORME

pjý
IZUS833
Pago lB8
PCNVBROOOO Xs.:1 Rev.: I Pq.: 14.
maz.; DATA 1=
T~zm' - coorTM. -- fllCUS? -N2TQUTr. N2-U-.ICNESTT214P LOW1•,A n. tO Oc nol eC VOL. COLU.
o .. .. .. ..... ... .I mi. .. ..... A.. ... .. .... .. .. . .m.It rs.9999 9*999 9 ..... ......... ... 9.* 9. 9 99999 9
*e. .9 99... .9 9. 99.... 9 ............ 9999..... .: ...........
0%.., 9..90.0 9.99. ...... 9 9 .... I9... ........
--- --- -- 97 z
.9 * 99 .. .. .. .. .......9 ... .. .. . ...
l t i-4-rrw rY vw * 1r14r hI% V 9 I t1I'WVW• -r% ..le .lt.t.
__________ _____________e t e eo I.9t tu t
-r e o l t t -e4tt.tt t~ l l I ~ I II I I I I ~ /
99...
*99.*
*.9 999
.9.
*t~99999~
.. 9...99.
• "99S9
999.i99999999
99999999999
9999999"999
9!ii::i..
9999999999
99 99 9999 99
99.9~9.99.
~ 999999999
9999999999
9999999999
... 99.999
99.eooe99.99
""9 " 99 99 99
*99999999229999999999999
w
p999. *99999
9999. 9~99~9
99.9. .9999.
99999 999999
99999 999.99
999.9 999999
*9999 999999
99.99 99.999
~ 999999
99~99 999999
99999 9.9999
~9~*9 999999
99999 999999
*99
99999 *9.9.91
99999 999999
9999w 999999
99999 999999
99999 9.9999
99999 999999
99999 999.99
99999 9999.9
99999 999999
99999 9999.9
99999 99.999
999t999999999ete 9
999
99991tl
* 999 9 99
99999 999'
*e9.9e9 99!
999999999
999999999
999999999
999.99999
9999999.92
999999999
9999e99999
9.99.9...
999999999
999999999999999999
99"99999999999999999
9*9999 9
• o
99 9 99 99
9999999999
9999999999
99 99 99 99
99999t•
9e9.999.99
99e9999999
99e9999e99
99 9999 99e9
9999999999
999e999999
99o99999.9
999999999.9999999999
99999999991
9999991ee
9ee e e e
*9*eeee
9..eee~
99.99 9 9 9 9
9 9 9.teee
9 o99 9 9 999
i9999.......
99999.99.9.
99999999999•
9 9.eeee
99999~~e
9999999to
99999999999
99999999999,
999co
•.199999999
,19e99 99999
9 99 99 9999
99999 9999
9999999999
9999999999
9999999999e
99999ltt
.99999ee
.99999eo
9999999999
999 999 99 9
9999999999t
9999999999
99999999999999999999..
999.99oeo
999999999999
9999999 99999
999999999.99
999999999999
999999999999
999999999999
999999999999
999999999999
999999999999
999999999999
999999999999
9 . 9eto oo
99999999999
teteleet9..
999999999999
9 .9eeeel
999999999999
999999999999
999 999999999
99e999999999
U
I
9 1

ED45M3Paoc 189
rD 1FE•sz x snm PCNVM R00001 ,Z&.:1 R•v.: I Pag.: 16
-. Verify that the delta pressure controller on facility control
start water glowrate to maLntanL low temperature in cool trap.
By leak taot control panel tat the niltrogqn valve Inr the follo-
wing positions
V3 OPF
V6 OPZ
By leak tact control panel tot the nitrogewn valve V80PENc and by
visual inspection on the to•t volume draining output verify that
the tact volumv do not contain vater, If noceosary adjust the
nitrogen purge by-pase to a flevrawo~f 12 I/minutes, ar~d wait
untI the teot voluin shall be drains.
S leave the nitrogen by-pass (lowratc centrol valvo in this positLon.
- •switch OFF the Kl fan by selecter twitch on facility control rack.
- Cloat valve C-01 at the output of the heater (a{nually) fully
cloc•wis p•sitLon.
- Verity K-1 fan lamp (an control rack) OFM.
- Verify 0-02 lamp CLOSt Lu O0 (on the control rack).
- Verify Open V-6 and V8 valve by Nitrogen control panel to con-
n"ct the toct volume to the told trAp.
- VaeLfy water flow to the cold trap.
- Adjust the nJ.trogen flow-rate to 20 I/min
S open the hand valve an the test valve nitrogen outlet

S
ED45833
?ago 190
3Wb Dr F or E z;px o PCNVOROOO01 1s.:1 Rev.: 1 pag.: 3.7
Adjust the hand valve On1 the test vo•ume bottom drain, In Order
to observe the nLtro;en outlet control valve working at regular
interval of I to 6 0toond5.
S- Verity that the Nitrogen supply syste•• s ready to pressur.ze
(faci.Lty main control valve on nitrogen tank n*4 oPEN
and ball. valve before pressure regulator OPEN) and a nitrogen
- Vaouy %W A9..30 =h WON= la? MWI, ay t ?Za IN 13=-34 11=
tam ~ s~ tn
Vef y ST Ctha OVeatora' On the test f.Lid IE ready to Intor
4n gmpO buckeL bolo, the Cool trap outl.et at- the TO star-
commanld.
Give to ate coputeroperator tf e TO-.T-T2 u ckut. ion start
command at; - (minus) 10 secanals.
Whern the count-dhewn roach *0 raHy" aLvr the sqrt TO-Tl-T3t
aommand by a voloctow to activate t the o utl atit O s tquence
controlled by PLC.
- Verify temperature on control rack rising.
IP

I
ED45833P~eg 19l
UrD )xr Esx x SP3LZO PCNVBRDOOO1 Is.:I Ryev.: I Paq.: 1t
wait until Tout Chamber pressure 9 temporature sencor: are
- Replace bucket when T2 condition is reached (when the pressure
roaches 010 Kpa on racLItt¥ control rack panel.
measure condensed water, record value.
- Adjuct, if necessary, the nitrogen flowrate to 7.5 I/minutes
(santiclockw•so to increase flow, clockwise to reduce flow).
ED4.5833Page 3.91
- monitor contLnuosly the bucket to prevent overflow.
- C-Ontiue9 -0290 6 -Minut*e: aftqr ttabiLi atLon -time about 10
minutes from the starting Sequence. At the diucration of the
test conductor- instruct the computer operator to ttop data
acquisition (if necessary ad)uat PZC-04 located on CONTROL
pRAC to obtain the required pressure of S10 %paA (temperature
of 1711C) ." *-...
- :Adu:t, it necessary, nitrogan flowrato to 7.S 1/mLnut.a
- Draon, measur-, and record the quantity of condensed water Ut
present.
* Starting with an empty bucket. begin I hour test duration.
bucket , to prevent overtlow.
After I hour verify the level of bucket, remove condensate
(measure and record value).
_ ,=a SPRAY mi 2Q 7-1C134 JAQM
Verify water spray temperature Li 43 OC.
Verify computer ready to start data aquititen.
I-Reomovea condensate, miesure and record value.
!
saý - I M W 1 1 W 1011:1M . 11 1 111 1 - -- - -

ED45833?DE 192
DPD Dxzsx 3 SP, ,O PCOVBRU0001 Is,:1 Rev.: I Pa..:. 19.
- BogL.gi the count-down foro the Water spray test from -10 soconds.
xt -5 gJ.ve the computer aquLsitLon utart command. At 0 rotate
the NZXT SEgUtCE selaetot switch to start the water spray,
utart stop watch and after 65 seconds rotate the water spray
selector switch to 0 to stop water flow.- Measure condonsatoe,
record value.
------ contv•---PTO 4-.fn--liAN -r-aifd* -the oat-point to 0. -
wait until pressure docrease is below 350 PaA. %ban actuate
the XV04 by placing the selo.or twItch to mXUAL.
- ESsCT 3,gUENCE by seLector switch on control rack.
- )Place the selector switch to T• position on control rac,.
Vority that tfn 4 instri,*nts on facilLty control rack have the
XASIUA.I lamp Orr.
-Verify that the PC04 controller on facility control rac•. Ls if
REM4OTS modo.
- Verify that ALL selector switches are in AUTO position.
Verity that PD flNhTRUMSNT C014TROLLEA is oat to 0.6 Ba:; it not,
net the controller to this value by pressing the up/down
arrows on the front of I.nstrument.
Oe- Op• the hand valve 0-01 and verify :AL-01 LWHP VALVE CLS 1U3 vo"
(on factLLty control rack).
- GLve the start for T-0 sequence command by PLC (start airsupply
to TsT VOLUM4E) by pressing the "570 CO press push-buttonlocatod
on facility control rack.
I
I

S
* ~ED4S83
Paze 193
DPD IFD E ~. -tP- M=O PCNVBR00001 s..:1 Rev.: 1 Pae.: 2.0
- VerLity -i tan 1 amp ON.
- Wait until Tact ChAmbor temperature censors are stabiLized, if
gnoecaray adjust TZC-04 located on CONTROL PACK to obtaLn tho
required tamperAtuita of 576C.:
F~cowd value ITC-2. . C TC-6 . C.. A4 _'C
TC-2 0C TC-7 9C AS _ c
TC-1 TC-9 V b ___C
TC-4 . *C TC-10 . C (process rac,)- P-- TC-11" "
DATA IZCOAOIK T-5 STATUSs
- CLvo the computer oparator the STATUS ACQUZSITZON command for
data acquisition of 60 seconds.
ACCSANC CRTRAT-S gTATUS:
'w-P6cform a quick-look on data-pr£nt-out to verify meosuring
xyttom la functionLng,
- Verify that following p•rameters are
PT*02(DLft) 0 BAR f* 0.1 BAR,. record Valua __.._..8
FT-04(vesel) IOIIpaAt 10KpaA. record value -.BAR
® .
U

ED4SM33
Pago 194
fPO DZFZSA PSZ0gO PCMVR00001 Is.:1 Rev.: 1 Pag.% 23o
TG-TI-T8 THEPMAL SHOCK TO PROM 135 OF (579C) TO 340 OF (171 PC).
PRE-TST cONDITIO~s
Va•u•m Breake• LnsJid test c•, )•mber at the "T-$* condLtion (579C).
Toeot VolumQ C:onn•=Cd to NLitro•en supply syustat.
- rogon supply valve OPtN.
- Toot VoluMQ €cnnc•tgd to condo0nod stoama auri.nq syatste.
- T@St -VOLUII V 9oMoCUiPieu &nbtgllea 3na fUn0%i.0nu2l;.
~ pws~UW r8~TdU~~3 un t-Lon~hq9.
- Test Volumwe prs•ure traneducofa functionLng.
- Steam gonorator prossuro 15 Bar minimum.
Nhot water accumulato: OH-1 to 1/2 of tank loevl by alto glass.
- DH1 water injection pump P-i operating and th f lowate Is
W/om n -DA R02, 1Lf necessary aoprate on V-02 (by pass) and V-
01o to adjust flovrate.
I
1 1 9 1 9 1 - 29 1 1 1 1 1 CURNEWARWdý I I I
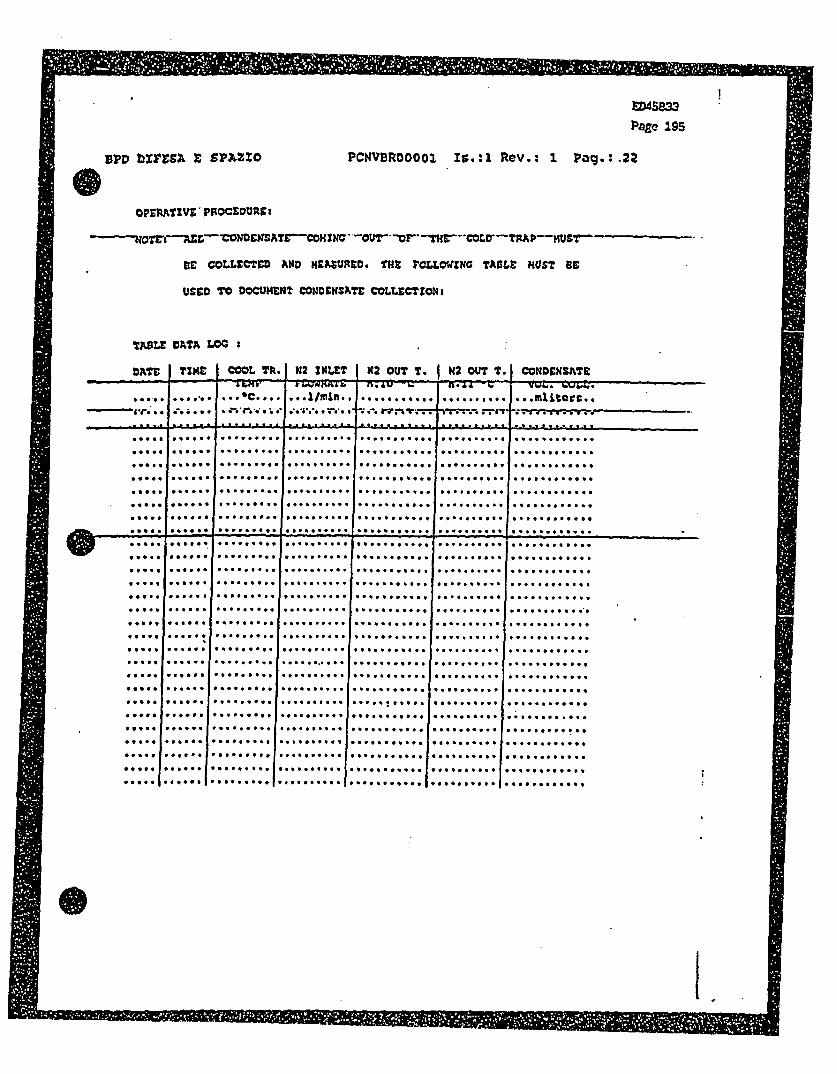
-9
SEN58333Pe 195
vpv btrzrsA E z z PCNVR00OOO15-;:1 Rev.: 1 Paq.:.22
OPERATIVE' PROCEDURE I
---RoTrr--7Xr-VON~rctsATE-C0UKC -OUT- 1F---THCOLDO~rITAVI4U&T-
RC COLLECTED AND MEASUJRED * TKt POLLOWIRG TA~tt1 MOST BE
USED TO DOCUJMENT CONDENSATE COLLECTtWN3
TABLE DATA. WO00
DATE I TIMJE ICOOL TR. H 2 INLET N12 OUT T. I N2 OU T. COMOENSATt
, ' ,.. ... I/oi * * *** .. * ..... rrs -~~to . .. ...... -
__________ ,-LZ-.9 a.aJ.sJ.J.. a a .J.s ..Lz .. ... .. ... . .
999999
.9..99
4999.9
*99999
999999
999099
099999
*9** ~
*99.999. *
9**0.9999
999909099
* 9999 99 99
*.90090.9
.* .. .. .9*. . .. 9
90.9..99..9 .9.99.
. . 9 . .. 9 .. ...
9 . 9.. 99..9999..9.99990999O~e
I9.I.9III.
999999099.99
9. . .. . *9...
* 99999099999
9ll..l.* 9l
II
9.9.9
99999
99909
.9...
99999
9*•09
.999.
et99e9
99999
* 09*9
99999I
0e~9li
09990
o9...
99999
*9999
99999
09~~4~
99.990
999999
999099
099990
999909
900909
999*4
*09999
* 99999
099999
* 099#9
999999
.99999
.49499
99~9~99~~
*...9 .099
9.99.99.9
09.099 .~9
~990~99~~
*. .9
*9909 99.9
099999999
0.9......
9
0990.9.99
999k
9.
* .99.
999099999
099999 999
*9999*999
999099999
. .. ..
.
99..9 .9 99.
999.99.99.
ll l 9 9l p
99999+++
9.~e• e
,99999099999
99o.99o.99.
*9909ooo
999999ee
e9eo9 9 9 9e
99099.9994999099.09999t
0999.990999999999999
.'. ... ". ....9e 9 9~ee
9IIIII
IIII.99I9I
9999.ii
9999.99999+
49990 . . ..9
9099.99.9
...........
999999999999999999999999
499999999099
990 9 9 .99.. ..
999e. 4 99999 . 4 .9eol
9 . .,II II
9999999l~l
9.9 9.9lll
9 9 9 9 99le,
09999999el
999 999. 99 o 9
.. ... I
I

IED4P833
Page 198
B~v xrzx 9SP3AZZO PCNVBROOO01 1s.:1 Rsv.: 1 Page: 23
TASU DATA LOG i
-- I .... I ~ -.9949...9 .99..94- ~ -.... fl99... I ~ n..n. F 9.t914 L94 419&G.4
Vn o I
.99.9
99999
999.9
*9999
9.99.1
999999
* 9***9
999999
99 99
999999
999999
*..999
9.9.9.
I
4eI9 499*
.* .. 9 ..
*.92"992999"
9 99 .949.
*999o999.
9999999.9
I
FLOWRAZ,... /M .
l 999e*9t9o
999999999.
eoe9t 99999
9999999999
I 19.0 %0v4 a . 914 %99 a a
no 10 0a - l n C
*o e9o9, o9o99*9o o
..9..9..9. .. .......
9.9.99.99.9 9.IlI I
I
VOL. COLL.4. ....Lt oo.
,9.9.99999.9e
l99*l 9l99l9.
* 9999999.999
999.99.99...
9.9.99999l9l
949999999999
...9 ........ ......... .......99 ... 99... . ..........
o * 9 9 . o 9 .* 999r9 99,9 999999999999-*rr~
... .. *i .. ........ ..... ...iv - .... ... to. .0...w 0 ......
.* . . . .. . . . * 9 .. .. .. 9..... .. 99to 99.. 9. . *099
.. .. .. ..... ......
" . ' .. .. . 99.99o."9 ... .... . ... .9, 9...... , .999999*,9
.99.9i
9ee99I
99999
99999
9.9..
99999
.9...
9i9le
pe9o9
99999
.9e..
9.o.o
.9e.o
9.99.i
9.9.e
9.9.9
99999
99l99
*..999
999999
999999
999999
.99999
9999.9
9999*9
999999
*99999
999999
*9..9.
999999
..... 9
* 9999999.
9 9 9lll
*99.file
99.9.99.e
99999999
999999999
99..9..9.
999999999
999.99.99
999......
9 9 9 .~oe
99999.e99
*9e99ee99
99999.9991
999o99ee999
999999.99
........ 9999999999
999999999
999999999
99999999.
.9999 9999 9
999 ~999999
999
999
999
999
.9.99999.9
999999 99 9 9
9.999
*999999999
999999999.
9999999999
99.9999999
.9.9999...
9999999999
9999999.9.
99 99 9999 99
.99.999...
999.9.9...
9999999999
99999999I 999 !
9999999"..9..49 99 99 9
99999999999
.,. 999999....
99999999.. ...
9991I~eD
419999999.99
99.9O 99 919 9
99999 99 99 99•
99999999999II I
99 o9 9 i 9 e9
99999999999•+ I
999tl999.99.
*99999*9 999
.9.999999.9• •
......ee e * to ..... oepe
99999. 999999.99............ .........
.99... .99999*
j .999 99999"9.9.9 99999999,::
9llell 99999999999
99999lll 99999999999
9999994 ll~~lll
99999l 99994llllll
It~il~gil! •lll 99994l
• llllllllll 9.9.9.9l
99. 99 99 .. ...........
9999999999 999.99
9499999999 999999 999.9
.99999999 99tl991999999

U
-IT-Irn.. ... 1 ----
ED4S833
Pao 197
DrD bZFESA V SPJZ10 PCNVBR00001 1a.:1 Rev.: I Pag..: 2.4
- Verify that the delta proacura controller on facility control
start wator flow rat. to maintain low temporature on cool trap.
By leak t•ot control panel oct the ntrogen valve in the follo-
wing pouLi oni
vI OPEN
V2 OPEN
V3 OPEN
vS o•cN
VS OPEN
By leak test control panel got tho nitrogon valve V OPEN and by
vLsual inspection the test volume draining output varLfy that
tho t•et volume docs not contain water, it necesoary adjust the .
nitrogen purgo by-pats to a tlowrato of 12 I/minutes, and wait
untIll, the tact volume shall be drained.
- Leave the nLtrogen by-paco flowrrat control valve Ln position.
- Switch OFF the KI tan by eolectoz switch on facility control rack.
- Close valve 0-01 at the output of the heater (manually) fully
clockwise position.
Verify K-I tan lamp (en control rack) OFF.
- Verify C-01 lamp CLOSE is al (on the control rack).
- verify open V-6 and VS valve by Nitrogen control panel to con-
nact the tout volume to the cold trap.
- Verify water flow to cold trap.
- Adjust the nitrogen flow-rote to 20 1/m~n
open the hand valvo on the t•ot valve nLtroqen outlet
Af

ED45833
page 198
pCNVBg00001 Is.:l Rev.: I Paq.: 253D DZESA' z VA
- Adjust thew hand valve on the test volume bottomu drain. Lin order
i nterval of I. to 6 aeconds.
- VerLify that the Nitrogen1 supply system s L ready to pressurize
(facility main control valve on nitrogen tank n94 OPEN,
and ball valve before pressure regulator OPEN) and a nitrogen
flow to the test volume is maintained.
=39q, TIMi-t~ BROKERfl 3AVWW1 Hay -Ba-AL.DjRWED~f xy X -]R n ev
THE TEST CHAMBER COME3S THE TEST VOLUME PRESSURE 3!T 140P THAN
3S PSX (ADOUT 2.S BAR).* THEREFOR THE )flROOEN SUPPLY SYSTEM
EXALT. 89 MAZUTAINED PACE TO PRESSunizz. AND =EE VENING
SYSTEN EXALT. 82 rZOLATC0 SY CLOSZKS TIM V-5 VALVE ON TUC
)flTROCE2I SYSTEM CCNTRL PAME.
U
- Romovo the water (if present) from wator bucket.
- Verity that the computer Is ready to start the T6-T7-T8 data
acquiaLt•ozn.
Verity that the operator at the toet facLity La ready to insert
an empty buckOt below the cool trap outlet at the T6 start
command.
GLve the computeor oporator the TG-T7-T8
command at - (mLnus) S zeconds.
-When the count-down roaches 00 T:Ixr give
comm=nd by a saloctor to activate the
controllod by PLO.
VerLfy temperature on control
acquisition start
the start TG-T7-T8
automatLi sequence
rack rising.
itI
III IZIPICNIVIES Exam 1 ill;,Ilautl
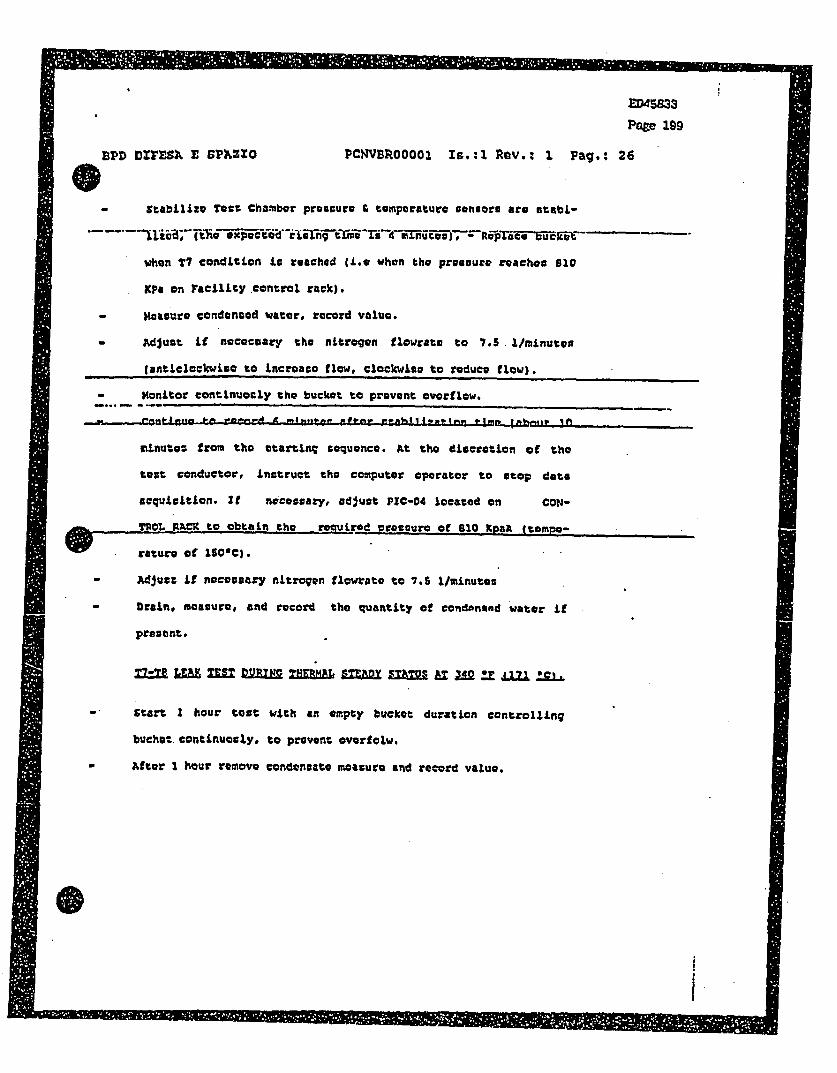
ED45833
Pare 199
DPD DZFEG E GPXZZO PCN•VBROOI IsG.:1 Rev.: I Pag.: 26
- ~Stabilize Tort Chamber proesuro 9 temperature sensors are stabi-
when T7 condition it reached CL.. when the pressure reachou 820
XPa on FaciLIty control rack).
- oeasure condensed water, record value.
- Adjust If nococaary the nitrogen flowrate to 7.5 I/minutgo
ganticlockwiso to Increaso flow. clockwise to reduce flow).
- Monitor contLnuocly the bucket to prevent overflow.
m~tmm.•- . I.,p;ep~t4qI.! 1RI~~i
minute: from tho ttarting sequence. At the discretion of the
test conductor, Instruct the computor operator to atop data
acquisition. 11 necessary, adjust PZC-04 located on CON-
TOL I.•A• to obtain the reutLrod proecure of 810 Kpah (tompo-
raturo of 1604C).
- Adjust If ncossary nitrogen floWato to 7.5 1/minuta:
- Drain, measure, and record tho quantity of condanand water if
present.
-start I hour teot with an empty bucket duration controlling
buchet contLnuosly, to prevent overfelw.
-Jftor 1 hour remove condensate measure and record value.
tem -1- IM-1 ;0 = I 0 11 R O|

U
U
'D4583.
• ~Pago •O0
SPD UVF~SA E SP2ZO PCHMVB0O001 1s.:1 ReV.: 1 Pag.: 27
- Romove condensate, measure and rocord value.
* start the falling slopo by actuating the XT SEQUEMC StLCTOR
SWITCH.
- Aftro 35 minutoe remove condoenate and r€cord vaLue.
VO8 i TEST CONIZTZON TO REMAIN AT TUXS VAU VCFOR so noun CONZ-
-- ------ .---- *-~-$FI** M-TO--•RECOVFR.--I-Zw-2Z--4DK-.-TO- - SO-J.-C-•.)J-Sf- HRWI•
W=L BC CO)4PLTED.
- Verfy dolta presnure controllor Is adjustod to 0.6.
- Adjust nitrogen flowra:o to 7.5 I/minuts LIf necessary.
- wait untLll pressureo temperaturo. dolta pressure and water is
stabilizod.
- o2mvo condensate, measure and record amount.
- star I hour toot whi.le monitoring condensate water.
- •onove condonsato, measure and record value.
- Varify delta pressure controller to adjuustad to 0.7.
- Adjust nitrogen flow ate to 7.5 I/minute, if necessary.
- wait until prossure. temperature, delta pressure and water is
stabil•:&d.
- Aomovo condensate, measure and rocord amount.
- start I hour t••t while monitorinq condensate water.
- Aamove condennate, measuro and record value.
I. q M - I @1 10 1 NJ I

7777- 7
ED45M3
PGOo 201
MDIM E SAI PCNVBROOOO1 1s.;2 Rev.: I Pag.: 28
Verify delta pressure controller Lu adjustod to 0.8.
- Wait until pressure, temperature, delta proesure and water Li
stabilized.
- Romove condanzate, meanure and record amount.
- start for I hour tact duration while monitoring condensate water*
- Remove condenisate, measure and record valuv.
- Verfy delta prensure controller It adjusted to 0.9 or the
- Adust nitrogen flOwrato to 7.5 I/mLnutas If necoptary.
- wait until pressure, temperatures delta pressure and wator is
cuabLli:od.
- tomove condonsato, moature and record value.
-start 1 hodr teat while monitoring condensate water.
- Rmove condensate. meoasure, and record value.
nm 01M

I
-I I':.' II * I~Im
E I
Page 202
VPbOIW D~V3 SPAZXO PCNVBROOOO1 1s,:1 Rev.: 1 Pag.: 29
- verify computer ready to start data aquiaLtion,
- 1~Remove condensate, measure and record value.
- CLva the count-down for the water spray toot from -10 seconds at
-S give computer aquiitlson start command; at 0 rotate the NZXT
sZdUZNCZ selector awitch to start the wat•r spray. Start stop
swLtch and after 6S seconds rotate the water spray selector
switch to_ 0 to stop water flow.- measuro condensate, record
value.
- continue d&pressurization by placing in MANUAL the PVO4AC and by
controllier PT04 in MANUAL place the set-point to 0.
- wait until pressure decrease below 330 XPaA, than actuato the
L.V-. XV04 by placing the selector switch to MANUAL.
I
Note: Rotor to test director for instructions.
__ _ _ _ _ _ _ - I __ 4

ED45833Page 203
1PCVBROOOO1 IS.:1 Rev.: I Paq.*: 30aPD DxrEsA E sp).zzo
EXQIGURE c22k==LQ 1
AEE .1t
VACUUM BREAKE~R PACtLZTY P&ZD
fl~ 1B.F.O1~OO3.O ITROGtN SUFPPJ S. FOR LEAK T.
O 258S442 £IG11EE , --SIMULATE~D SERVICE CONDITION TEST PROFZ.S

It I
VACUUM BREAKER VALVE - UBA TEST P&I BLOCK
,dU
Od
aU
64
I

lsoc il. 0a
0* z
96 v*
R ETV U., %fHAE
lVA*fCM~Pfr rmw'VAE*e4OA~lV FA~ANA-t-

A . 4J.,
M45833
PCWVBROQOO 1 316:1 Rev.: 2 Paq.: 33BpD vxrzs.b z sp~zz~o
MIXNEX *F. 3..SZHIATED SERVICE CONDITION TEST MJOFILE
Nfic~lr -mv 3AS44 13AW I•V J
Prim2 PSLESAY.
_____________vX- qiz.p*_~z- sAt
P0412P -
t S~
Lvw
prosm1J*I
(N (NOT Pam il(NOTE 0 1 I Won 31
~iii4,
iiI p4011:) I
T13I • W . w i iTo T, 73 Ts
M~ 3 60
0401! 2)
T4 TAT Tr Ira To
sv_. 3 60 I o m- D 4
CNOT1!2
Tie
W4=a~r
T11
TIME b
1. * VMA PATO IS 3 GPLU PER LUMlU PER SOUAPS METER OF TET VOUg PULA VIEW AIPE SPRIAYPPE=OOSP-aUU1VYLMSMflAONE UNUTE.
I. HMO DTcJPEAA1UFZ AND PRE=PUR MO A UMINMM OF 0 MMNTE OR WHON ENOGH TO W.A)IJR LEUC RATSUSIEENCMAER AND TIST VOLULL!.
3. PATE CO COOWWN AND PEPIOD OP HOLW EWMEE COL CONDMORO AND HEA11P AIRE AT YHE OPIION OPFIVE TESTMRA. S-nEANO RECRD NErLLWAK~.E VW41gANOT2T 3A14OT4,T 5ANDT*IT1ANOTH.-
Fjgu re 1. Simulated SOMco Conrdion Test Profile
mom
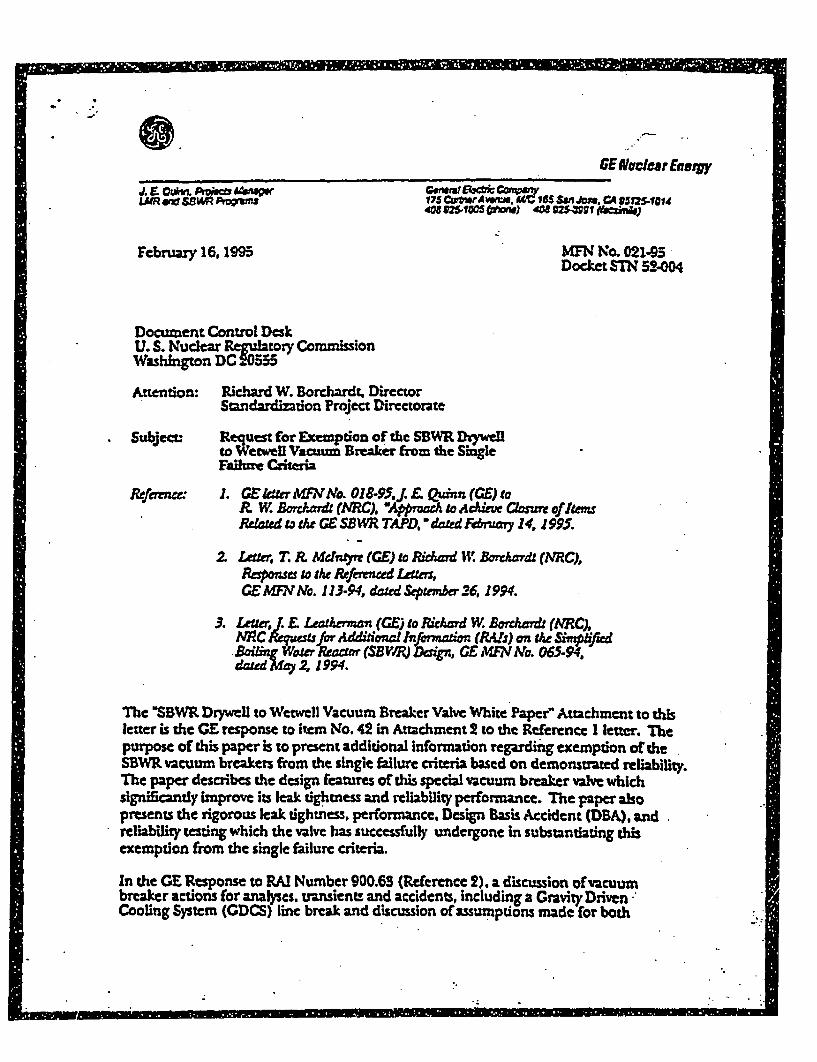
I
GE AWucearEneigy
LAR 0u tBWR Prnts 175 Cur A b'ww.V". 165 San Ja.n CA V5125-I014
February 16,1995 MFN No. 021-95Docket STN 52-004
Document Control Desk* U. S. Nuclear Regulaoy omiso
Washington DC 20555
Attention: Richard W. Borchardu, DirectorStandardization Project Directorate
Subject: Request for Exemption of the SBWR Dqwelto Wetwell Vacuum Breaker from the SingleFailure Criteria
Refar. 1. GEk .kf 7MVNo. 018-95. .F. Quinn (ME) toR W. Bonkard (NRC), "A-ppra to Adiew COsure of AmuMa tted to the GE SBWRM TAPDw dated Fmruay 14, J995.
2. Letter, T. R. Mdnjr (GE) to Rixrd W. Bordard (NRC),Resonses to tMe Refiereed Leam,cE MFIV Mo. 13-4, dated Siptemhr 26. 1994.
3. Letter ZLatherman (GE) to Richarvd W. Bmrckadt (NRC),VAqC for~b AddidoztIifonal zion (R~ts) on t~e Sim sbfed
'Bang WeA-r Reactor (SBVR) V IM n, GEMIM, a. 065-94.dated May 2, 1994.
The "SBWR Drywcl to Wetwell Vacuum Breaker Valve White Paper Attachment to thisletter is the GE response to item No. 42 in Attachment 2 to the Referencc I letter. Thepurpose of this paper is to present additional information regarding exemption of theSBWR vacuum brcakers from the single failure criteria based on demonstrated reliability.The paper describes the design features of this special vacuum breaker valve whichsignificantly improve its leak tightness and reliability performance. The paper alsopresents the rigorous leak tightness. performance, Design Basis Accident (DBA), and.reliability testing which the valve has successfully undergone in substantiating thisexemption from the single failure criteria.
In the GE Response to RAI Number 900.63 (Reference 2). a discussion of vacuumbreaker actions for analyses. transient•. and accidents, including a Gravity DrivenCooling System (GDCS) line break aJd discussion of assumptions made for both
I

. .
GEPNuclearFnergy
MFN No. 021-95 Pap 2
expected and "licensing basis" scenarios was presented. Reference 2 also included detailas to why failure to close (after actuation) of a dr•well to we'well vacuum breaker is not,in GE's view, a credible failure.
In the GE Response to RAI Number 900.62 (Reference 3), information was presented toenable the staff to access the adequacy of the wetwello.w.'drwell vacuum breaker te=program including: drawings of the vacuum breaker and ins'mentation; the vacuumbreaker Purchase Specifications; a copy of the Engineering Operating Pioccduredetailed specification of the conditions, both normal and design basis, under whicIh thevacuum breakers will be required to operate; the detailed test procedures for the vacuumbreaker, and information appropriate to ensuring that the data obtained on the reliableperformance of t.e valve is applicable to the valves to be incorporated into the certifiedplant design.
We hereby request your review of this letter along with the references and approval ofthis request for exemption of the subject vacuum breaker from having to meet the singleFailure cviteria for application to the SBWR.
Sincerely.
Lamce. Quinn. Projects Manager
MR and SBWR Programs
Enclosure: SBWR Drywell to Wetwell Vacuum Breaker Valve White Paper
cc; P.A. Boehne•t (NRC/ACRS)I. Catton (ACRS)S. Q. Ninh (NRC)J. H. Wilson (NRC)

GE Nuclear Energy
General Elecrc Company175 Cwtner Avenue, San Jose, CA 95125
February 14, 1995 MFN No. 018-95Docket STN 52-004 (GE SBWR)
Document Control DeskU.S. Nuclear Regulatory CommissionWashington, DC 20555
Attention: Richard W. Borchardt, DirectorStandardization Project Directorate
SUBJECT: APPROACH TO ACHIEVE CLOSURE OF ITEMS RELA TED TO
THE GE SB WR TAPD
Refs:1. NEDC/0-32391 Rev. A, "SBWR Test and Analysis Program Description" (TAPD), dated
September, 1994.2. Memorandum to John T. Larkins (ACRS) from Dennis M. Crutchfield (NRC), "Draft Safety
Evaluation Report (SER) on the adequacy of the Technical Approach to the Testing and
Analysis Program (TAP) for the Simplified Boiling Water Reactor (SBWR) Design", dated
Nov. 25, 1994.3. ACRS Thermal Hydraulic Phenomena Subcommittee meetings December 15 & 16, 1994,
and January 10, 1995.4. NRC Meeting January 9, 1995.5. ACRS 417th Meeting, January 12, 1995.
Dear Mr. Borchardt:
GE has submitted a Testing and Analysis Program Document (Ref. 1) defining details of how
we would complete these key areas in support of the SBWR certification effort. The NRC has
reviewed this document and formally provided its comments in Ref. 2. In addition, there have
been several meetings (Ref 3-5) with the NRC Staff and the ACRS to explore the
comments/questions. These have been supplemented by informal interactions (faxes, E-mails,
telecons, working meetings) to clarify the positions such that appropriate responses could be
prepared by GE that would satisfy the NRC and ACRS reviewers. A pathway to this is shown in
Att. 1 and the timing and location of each response, along with a brief statement of the
comment/question being addressed, is shown in Att. 2.
We have started the process of developing responses, and the first compilation in Rev. B of
the TAPD will be issued for review on April 17, 1995.

GE expects that completion of SBWR Testing and Analysis Program (TAP) as described in
NEDC/0-32391, "SBWR Test and Analysis Program Description" (TAPD) and completion of
the work outlined in the Attachments to this letter will constitute an acceptable technology basis
for Certification of the SBWR.
We appreciate the constructive dialogue that has led to this approach and trust you will find
this an acceptable path and plan.
Sincerely yours,
J.E. Quinn, Projects MangerLMR and SBWR Programs
Attachment 1: NRC/A CRS Issue Closure ProcessAttachment 2: List of Additional Work From the NRC 12/94 - 1/95
cc: w/attachments:P.A. BoehnertI. CattonS.Q. NinhJ.H. Wilson
- NRC/ACRS- ACRS- NRC- NRC

MFN No. 018-95
bcc: J.A. BeardP.F. BilligR.H. BuchholzR.W. BurkeT. CookJ.D. DuncanT. FernandezJ.R. FitchL.S. GiffordFE. HatchJ.E. LeathernanJ.E. QuinnT.R. McIntyreF.A. RossK.T. SchaeferR. SrinvasanGE Master FileSBWR Project File
(EPRI)(DOE)
(EPRI)
(w/2 copies of atts)(w/atts)
(w/atts)
(DOE)
(EPRI)(M/C 747)(w/atts)
(w/atts)

Attachment 2 to MFN 018-95 List of Additional WorkFrom The NRC 12194 - 1195
No. Item Description Where To BeDocumented
1 MSLB outside containment - TRACG analysis. Perform TRACG analysis for this SSAR
accident with focus on containment response and PCCS purging.
BDB outside containment - TRACG analysis Perform TRACG analysis of accident.
2 For RPV, clarify timing of events leading to isolation of system. For containment, SSAR
focus on PCCS purging.3 Document TRACG time step determination logic. (Part of Item 53) MODEL
Document chimney technical basis. Document supporting data for void fraction in
4 large diameter pipes and capability of TRACG to analyze flow distribution in parallel QDB
channels.5 Develop description on chimney technical basis developed in Item 4 In TAPD TAPD Rev. C
6 Develop figure of SBWR/SBWR nodalization similar to Figure 2.1 of NEDE-32178 forreactor vessel and containment MODEL
7 Derivation of TRACG conservation equations w/ assumptions. (Part of Item 53) MODEL
8 Details of assumptions and range of applicability for correlations in TRACG (Part of MODEL
etem 53)Provide report on separator modeling In TRACG (Sections 4&5 of NUREG/CR-2574,
9 "BWR Refill-Reflood Program Task 4.7 - Model Development TRAC-BWR LETTER
Component Modelso)
10 Document range of separator data vs. range of SBWR conditions during normal QDBoperation and transientsComparison of TRACG decay heat model (used in transients in conjunction with MODEL
neutronics model) vs. ANS standard (1979)Describe SBWR TRACG BOP model used in transient analysis. Justify
12 representation of dynamic components such as pumps by control system elements. APP
13 Provide scaling study of CRIEPI tests to demonstrate that appropriate SBWR TAPD Rev. Bparameters are properly scaled TAPDRev,_B
Expand scaling study to include global scaling of entire system. This should include14a detailed scaling of Interactions between loops and components. TAPD Rev. C
14b Extend GIRAFFE scaling study to the late blowdown phase (starting at-10 bar) TAPD Rev. B
15 Develop scaling groups for individual PIRT parameters (ranked High, Medium) and TAPO Rev. Ccompare values of these parameters for SBWR and test facilities
16 Add description of Main Steam line break to TAPD Section 2.2.1 TAPD Rev. B
Consideration of medium and low phenomena - Include medium ranked phenomena
17 in assessment matrix; low ranked phenomena only in checks for existence of models TAPD Rev. C
In TRACGReview best estimate LOCA scenario accounting for equipment availability and
operator actions. Determine If any additional Items need to be added to PIRT. TAPD Rev. B
19 Clarify Interaction studies discussed in Sections 4.2 and Appendix C of TAPD to TAPD Rev. Caddress specific questions in DSER TAPDRev._C
20 Include vessel/containment interactions as specific highly ranked phenomena in TAPD Rev. C
PIRT21 Discuss PCCS purge/vent process from phenomenological point of view TAPD Rev. C
22 Separate out SRV air clearing loads as an Item In PIRT for containment TAPD Rev. C
Add description of ATWS scenario in Section 2.2.3 and expand Table 2.3-4. For
23 stability, expand Table 2.3-5 PIRT format. Include consideration of bouyancy-driven TAPD Rev. Coscillations during startup at low pressure and power, but with large subcooling.
24 Include discussion of PAR interactions. Add description of performance TAPD Rev. C2 characteristics and flow pattems induced by PARs.
2/14/95 11:44 AM Page 1

Attachment 2 to MFN 018-95 List of Additional WorkFrom The NRC 12/94 - 1/95
No. Item Description Where To BeDocumented
25 Expand discussion of PIRT tables. Add new Appendix E which will include a brief TAPD Rev. Cdiscussion of each parameter and the basis for its ranking.Address phases of the transient in Section 3. Add column to Table 3.2-1 to indicate
26 for what transient the phenomena are ranked and for what phase. Clarify discussion TAPD Rev. C
of what is meant by SBWR unique features and phenomena.Prepare Qualification Data Base (0DB) report for external distribution. Review for
27 completeness, consistency and quality and upgrade as necessary. Add purpose and QDB
a brief summary of the process.
28 Quantification of data uncertainties. Quantify measurement uncertainties in major TESTtest parameters. (Included in plan for Test Reports)Quantification of correlation uncertainties. Quantify uncertainties in the correlations
29 used in TRACG with reference to application to SBWR. (Included in Item 53) MODEL
30 Update detailed test objectives in Appendix A to be consistent with discussions with TAPD Rev. B
NRC Staff. TADRe_._B
31 Expand test conditions description. TAPD Rev. B
Justification of test initial conditions and range. Compare the range of parameters in TAPD Rev. B &
32 the test to those expected in SBWR. Develop basis for how the test is picked up won Rev. C
the fly; i.e. how rate of change of parameters is treated.Test facility design details. (Included in Individual test reports on the various test TEST
3 programs)34 Test instrumentation details - types of instruments, locations and accuracy. (Included TEST
in test reports)Test procedure details - details of test loop preconditioning and initiation of test. TEST
3 (Included In test reports) TEST
36 QA plans - Included as part of test documentation. TEST
37 Use of GIRAFFE data. Role of GIRAFFE data in validation of TRACG. TAPD Rev. B
38 Use of GIST data. Role of GIST data in validation of TRACG. TAPD Rev. C
Determination of TRACG biases and uncertainties. Delineation of sources of data for
quantifying bias and uncertainty in specific models. Roles of separate effects and
integral tests in determination of overall uncertainty. (Included In plan for Qual. LTR
TRACG model ranges vs. SBWR range. Quantify range of parameters over which
40 TRACG models have been assessed vs. range of parametrs expected in SBWR
transients and LOCAs. Comparisons will be made for scaling groups identified for QU1 L
high and medium ranked PIRT41 Scope and range of sensitivity studies. Quantify the range of sensitivity studies
planned for the high ranked PIRT parameters as part of CSAU application.
42 Provide vacuum breaker white paper. Justify exemption from single failure criteria LETTERbased on demonstrated reliability.
43 Debris resistant design. General concept to screen PCCS inlet from debris resulting SSAR
from blowdown. (Detailed design features not part of this program.)
44 Justify PCCS test data range (at LOCA vs I hr). Compare maximum credible PCCS TAPD Rev. 8
flow (limited by main vent uncovery) with PANTHERS test data range. TPDRe_._B
45 PANTHERS IC additional tests (LOW PRESSURE, He). Include additional test and TAPD Rev. B
new test matrix in, TAPD Appendix A.
46 Definition of PANDA tests M5,M7, M9. Define test conditions for PANDA tests based TAPD Rev. C
on TRACG results and engineering judgment.47 GIRAFFE/Helium test objectives. Add to TAPD, Appendix A. TAPD Rev. B
2/14/95 11:44 AM Page 2

Attachment 2 to MFN 018-95 List of Additional WorkFrom The NRC 12194 - 1/95
No. Item Description Where To BeDocumented
48 Define additional GIRAFFE integral system tests. Develop test matrix and initial TAPD Rev. B
conditions. Add to TAPD, Appendix A.Additional GIRAFFE analysis. Perform TRACG analysis of additional tests defined in QUAL
Item 48.Additional PANTHERS analysis. Perform TRACG analysis of additional tests defined QUAL
50__ in Item 45. QUAL
51 Justification of UCB correlation for Hydrogen. Define appropriate correlation to use MODEL
for condensation in the presence of Hydrogen.Reconcile SBWR nodalization vs. tests. Review TRACG nodalization used for
individual test comparisons with the corresponding regions in SBWR. Perform
52 sensitivity studies to establish appropriate SBWR nodalization, if significantly QUAL
different from tests.(In53 Models and Correlations Report- Technical content. Modify TRACG Model LTR MODEL
(32176) to include Items 3, 6, 7, 8, 11 and 29.54 Models and Correlations Report- Production MODEL
Presentation on startup process. Prepare discussion of Dodewaard startup
55a procedure and SBWR startup procedure, showing trajectory of power, pressure, flow Presentation
and inlet subcooling.55b Discussion of startup process. Prepare presentation based on Item 55a. TAPD Rev. C
Treatment of noncondensible distribution-TRACG. Develop plan for validation and TAPD Rev. Bapplication of TRACG for noncondensible distribution. TAPDRev._B
Treatment of noncondensible distribution-measurement. Add capability for
56b measurements of noncondensible distributions in the containment regions of the TAPD Rev. B
SBWR test facilities.57 Dryer data range. Tabulate the range of data over which TRACG model is applicable. 0DB
58 Develop TRACG documentation plan. Prepare a detailed plan and table of contents LETTER
for the modified TRACG Model LTR for discussion with NRC Staff. LE___ER
59 Develop outline for test reports. List proposed test reports. Review proposed content TAPD Rev. B
with NRC Staff. TAPDRev._B
60 Develop outlines for validation reports. List proposed validation reports. Review TAPD Rev. B
proposed content with NRC Staff. TAPDRev._B
61 Add "roadmap" to Introduction section. Include list of reports and tables of contents TAPD Rev. Bas an appendix.
2/14/95 11:44 AM Page 3

November 7, 1995 MFN 216-95Docket STN 52-004
Document Control DeskU.S. Nuclear Regulatory CommissionWashington DC 20555
Attention: T. E. Quay, DirectorStandardization Project Directorate
Subject: SBWR - Vacuum Breaker Single Failure Exemption
References 1. Letter, J. H. Wilson (NRC) to J.E. Quinn (GE), Staff Reviewof GE Request for Exception to Single-Failure Criterion forDrywell-to-Wetwell Vacuum Breakers, dated August 22, 1995.
2. Letter MFN 021-95, J.E. Quinn (GE) to R.W. Borchardt (NRC),
Request for Exemption of the SBWR Drywell to Wetwell VacuumBreaker from the Single Failure Criteria, dated February 16, 1995.
3. Letter MFN 113-94, T.R. McIntyre (GE) to R.W. Borchardt(NRC) Responses to the Referenced Letters, dated September 26,1994.
4. Letter MFN 065-94, J.E. Leatherman (GE) to R.W. Borchardt(NRC), NRC Requiests for Additional Information (RAIs) on theSimplified Boiling Water Reactor (SBWR) Design, dated May1994.
This letter is written in response to the Reference 1 letter, which was in response to the
Reference 2 letter.
We will respond to Reference I in two parts: the vacuum breaker testing program and the
request for single failure exemption. With regard to the former, there has been a
significant investment by NRC and the GE team in the testing program. We request that
you provide a letter stating that the program results are valid and acceptable for use in
licensing and meet the defined testing program objectives. This would in no way relate
to the exemption question.
J.M. Quinn

MFN 216-95Page 2
We need NRC's closure regarding the testing performed on the SBWR vacuum breaker
since the test facility will soon be dismantled due to a relocation of the testing agency,
and GE needs to disposition the test article. As indicated by References 3 and 4, and
several NRC visits to the test facility in Europe, both the staff and GE have made a
substantial investment in developing and reviewing the SBWR vacuum breaker design,
test performance, and test results. We need closure on this part of the technology
program while the people who participated in the program are available to address
questions. Deferring action will likely make it difficult for the NRC to recreate the
familiarity that presently exists from the close association with the test program, in
addition to the inefficiency and expense required to restart the effort later.
Your cooperation in completing the review of the vacuum breaker test data is needed so
that GE has confidence that the vacuum breaker testing conducted was adequate and
sufficient.
Concerning the Vacuum Breaker Single Failure Exemption Request, GE understands the
NRC position that the SBWR PRA needs updating and that the TRACG review needs to
be more mature before coming to a decision. The PRA update and completion of the
design will come after completion of the Technology Program. GE agrees to delay
further action on the exemption request decision until resumption of the Design Phase.
However, GE firmly believes that the SBWR can meet all of the requirements noted in
the attachment to Reference 1:
- Parametric studies of the SBWR behavior with a qualified TRACG code will
adequately demonstrate that the duty required of the SBWR vacuum breaker,
is bounded by testing already performed on the valve and that the vacuum
breaker reliability demonstrated supports the SBWR PRA conclusions.
- The SBWR PRA will demonstrate that the SBWR is acceptable using the
demonstrated SBWR vacuum breaker reliability numbers plus appropriate
data from other sources.
Your prompt action regarding the Test Program review would be appreciated.
Sincerely,
James E. Quinn, Projects ManagerLMR and SBWR Programs
cc: (1 paper copy plus E-Mail)

P. A. Boehnert(NRC/ACRS)I. Catton (ACRS)S.Q. Ninh (NRC)J.H. Wilson (NRC)

J.M. QuinnMFN 216-95Page 2
bcc: (E-Mail except as noted below)
J.A. BeardP.F. BilligR.H. BuchholzT. CookJ.D. Duncan
(DOE) (1 paper copy plus E-Mail)

U U
*I,, • ,'..,,""°'-- UNITED STATES
. - NUCLEAR REGULATORY COMMISSION.. I © WASHINGTON, D.C. 205554-CO
February 14, 1996
Mr. James E. Quinn, Projects ManagerLHR and SBWR ProgramsGE Nuclear Energy175 Curtner Avenue, H/C 165San Jose, California 95125
SUBJECT: VACUUM BREAKER TEST PROGRAM
Dear Mr. Quinn:
In your letter dated November 7, 1995, you requested that the staff provideyou with feedback on the Simplified Boiling Water Reactor (SBWR) vacuumbreaker test results. Specifically, you requested that the staff concludethat the test results, submitted by letter dated December 15, 1994, are Ovalidand acceptable for use in licensing, and meet the defined testing programobjlectives".
During your testing program, the Nuclear Regulatory Commission (NRC) staff
members witnessed a portion of the seismic testing, the conclusion of the3000-cycle reliability testing, the post-test inspection, and leakage-testingin the presence of debris and with various size pieces of wiri placed tinder
the soft seat. These tests were performed by competent and experiencedpersonnel and, with the exception of concerns that arose during the leakagetest and. discussed below, the test program appeared to be thorough. This,together with a review of the test program results, leads the staff to believethat the test results are valid and acceptable for use in licensing. However,
a number of concerns prevent the staff from concluding that the testingprogram meets its objectives.
In request for additional information (RAI) 900.176, the staff questioned GE'sdetermination that a sealant, such as room temperature vulcaniziln (RTV), was
required on the back side of the EPDM soft seal to prevent excessive leakagearound the back of the seal. This sealant was not subjected to the radiationand thermal aging to which the EPDM seal was subjected. Therefore, it will be
necessary to qualify the RTV sealant following similar aging treatment.Alternatively, GE could demonstrate that the leakage is acceptable without theRTV sealant in place, or, if RTV is to be used in the SBWR vacuum breaker,periodic leak testing could be performed with regulatory oversight.
During the reliability testing, a loss of sealing was caused when the softseal groove was spanned by a piece of wire whose diameter was small enough to
pass through the intake screen. This loss of sealing and Its potential impact
on PCC performance will have to be analyzed, possibly referencing the resultsof the containment by-pass experiment run In the PANDA facility and otherrelevant tests. (This issue was also raised in RAI 900.176.)
: ..-..-.. :..,....:'• ,#',,___._._.__

S.
A
rhy%
I'.A
I.
ItI.
Mr. James E. Quinn -2- February 14, 1996
Also, GE has not demonstrated that the following four specific test objectiveswere met by the test program, as described below:
1. 'The vacuum breaker flow capacity could be made equivalent to 1.04 squarefeet.
During the tests that the staff witnessed, the valve stroke was insuffi-cient to meet this flow requirement; while the disc damper had beenremoved, the valve stroke had not been increased to take credit for thischange. GE must provide the data from tests with the Increased valvestroke.
2. 'The main seal is air bubble tight as installed and has an equivalentleakage flow area of <0.02 square centimeters to steam in the fullydegraded condition under design basis accident conditions.*
GE must explain how 'design basis accident conditions' were achieved.
3. "The dynamic loads which result in lift of the disk were acceptable."
GE must submit an analysis of the test data to demonstrate that the loadsand seismic response spectra to which the valve was subjected.during thetesting are valid and acceptable.
4. *The opening and closing reliability are maintained after subjecting thefully aged valve to grit Ingestion."
Although the vacuum breaker operated reliably and failure free during the3,000-cycle test, GE must provide an analysis to support' the relevantreliability numbers used in the SBWR PRA. .
In summary, the staff cannot reach a coniclusion on the acceptability of. thetest results or conclude that the objectitves' of the testing, program have beenmet until GE has submitted its analYses-of the test results and. demonstratedthat they support these conclusioN's ,. .... -
If you have any questions regarding this"matter, contact.James-'i. Oilson at(301) 415-1108 or Son Q. Ninh at (301) ;415-1125.. ' . ,..
I
Sincerely,,•
19ý
K. " Theodore R. Quay, Directi... .. Division of Reactor Prog
S":.. Office of Nuclear Reacto*
Docket o.50004
c See
orDirectorateram Managementr Regulation
.-.•
U

.4
-I ' ' -a - -.. ,- - ^ --
t~.m
• °
I
• ql'
Mr. James E. QuinnGE Nuclear Energy
Docket No. 52-004
4.
cc: Hr. Rob WallaceGE Nuclear Energy1299 Pennsylvania Avenue, N.W.Suite 1100Washington, DC 20004
Director, Criteria & Standards DivisionOffice of Radiation ProgramsU.S. Environmental Protection Agency401 K Street, S.W.Washington, DC 20460
Mr. Sterling FranksU.S. Department of EnergyNE-42Washington, DC 20585
Mr. John E. Leatherman, ManagerSBWR Design CertificationGE Nuclear Energy175 Curtner Avenue, MC-781San Jose, CA 9SI25
Mr. Steven A. HucikGE Nuclear Energy175 Curtner Avenue, MC-780San Jose, CA 95125
Hr. Brian McIntyreWestinghouse Electric Corporation.Energy Systems Business UnitBox 355Pittsburgh, PA 15222
U_
Mr. Frank A. RossProgram Manager, ALWROffice of LWR Safety & TechnologyU.S. Department of EnergyNE-4219901 Germantown RoadGermantown, MD 20874
Mr. Tom 3. Mulford, Manager * . .SBWR Design CertificationElectric Power Research Institute,3412 illview Avenue •Palo Alto, CA 94304-1395. ' /
3~. .
* I
* 33
*.' .33*A. ~
* 3.. * .
= .~. i,..
* a... .
* 0
I, -
I .~.
I-.,
43 I ,.. .3 3
.0 ...
43. ~
FL t''.~ 3
3 .3.''... I * ..
'.3.
3 3 . . *. .3 3. 3. .3
3 .. 3.
- . . 3 3 *~*3* 3.
i

GE Nuclear Energy
J. E. Quinn, Projects Manager General Electric CompanyLMR and SBWR Programs 175 Curtner Avenue, M/C 165 San Jose, CA 95125-1014
408 925-1005 (phone) 408 925-3991 (facsimile)
March 12, 1996 MFN 035-96Docket 52-004
Document Control DeskU. S. Nuclear Regulatory CommissionWashington DC 20555
Attention: Theodore R. Quay, DirectorStandardization Project Directorate
Subject: SBWR - CLOSURE OF THE VACUUM BREAKER TEST PROGRAM
Reference: I. Letter, T. R. Quay (NRC) to J. E. Quinn (GE), Same Subject, dated February14, 1996.
We have received the Reference letter acknowledging the active role NRC played during thetesting program, the competent and experienced test personnel who conducted the tests, and the
thoroughness of the test program. We are pleased with the NRC conclusion that the staff
believes that the test results are valid and acceptable for licensing. With that confirmation we
believe that the SBWR Vacuum Testing task is complete until the production valve is
manufactured and tested as discussed below.
Leakage between the backside of the seal and the disk
This leakage was discovered during initial seal testing. As an expedient solution to prevent this
leakage and continue the tests, RTV was used to seal the gap between the disk retaining grooveand the seal. After application of the sealant, the primary dynamic seal was found to be bubble
tight. RTV is widely used in nuclear applications and has been qualified elsewhere forenvironmental conditions equivalent to this application. The radiation and thermal aging of the
seals with the RTV was not repeated because the preferred solution is to add a static seal to the
back of the production valve main seal. The design of a static seal is relatively simple compared
to a dynamic seal. The performance of the static seal will be verified during production valve
acceptance tests. The addition of a static seal to the backside of the primary seal will have no
affect on the validity of the prototype test program.
Compression set of the main seal caused by design basis steam testing
The wires placed under the vacuum breaker seat to simulate debris interferance followingthermal/radiation aging, design basis accident testing, and reliability testing, demonstrated that
the seal had taken a permanent set nearly flush with the hard seat. This resulted in a reduction of

GE Nuclear Energy.
main seal effectiveness if a particle was lodged on the hard seat. The preferred solution is a
simple modification to the production valve seal to add a bead to the existing seal to resist
compression set. This will ensure that sealing can be maintained if a particle lodges on the valve
seat. The resistance of the production valve seal to compression set will be confirmed by
thermal aging under compression loading. The addition of a properly designed bead to the seal
will have no affect on the validity of the prototype test program.
Vacuum breaker flow capacity
A series of flow capacity tests were performed and are summarized in the figure on page 34 of:
"SBWR Vacuum Breaker (VB) Prototype Experimental Qualification General Test Report
ED45913" (MFN 155-94 dated 12/15/94). As shown on that figure, the stroke of the valve was
not sufficient to meet the design flow capacity equivalent to 1.04 square feet. The stroke of the
valve was then increased to establish that increasing the stroke would provide the required
increase in flow capacity. Increasing the stoke by 40 mm increased the flow capacity by thirty
percent to an equivalent of 1.0 square feet. This test established that stroke was limiting flow
capacity and flow could be adjusted by varying stroke length to meet or exceed flow
requirements considering the slightly reduced effective stroke with the chatter damper in place.
The production valve will have adequate stroke and be tested to demonstrate the design flow
requirement.
Design Basis Accident conditions
The design basis accident conditions were achieved in accordance with the requirements of IEEE
323. The term "fully degraded" means that the primary seal was thermally and radiation aged in
accordance with IEEE 323 before being functionally tested for steam leak tightness as required
by IEEE 323. This.is described in the valve test specification 25A5445 (MFN 065-94 dated
5/2/94). Over the eighty hours of testing in a steam pressure vessel there was no measurable
steam leakage through the valve. (Refer to Page 229 of ED 45913 for Design Basis Accident
test report.)
Dynamic loads which result in lift of the disk
The valve was dynamically aged in accordance with IEEE 323 as described in Attachment E
Page 88 of ED 45913. The test response spectra used for aging was an envelope of the SBWR
SSE spectra at the elevation of the drywell floor where the valve is mounted. Following seismic
aging, a fragility test of the valve was conducted up to the capability of the shake table.
Movement of the valve disk was monitored by measuring changes in pressure across the disk. It
was noted that at approximately IG ZPA, deviations in pressure across the disk were observed.
Refer to paragraph 3.4.2 of, "SBWR Vacuum Breaker Prototype Experimental Qualification
General Test Notification Plan" ED 45841 (MFN 155-94 dated 12/15/94) for a discussion of disk
lift measurements. Disk lift occurred at acceleration levels well in excess of those predicted for
the SBWR SSE.

GE Nuclear Energy
Opening and closing reliability
The basis for the 3,000 cycle test is contained in report titled: "Bayesian Approach to the SBWRVacuum Breaker Reliability Demonstration Testing" ECN-CX-93-135 provided to the NRC as
part of a RAI 900.62 response (MFN 065-94 dated 5/2/94).
Sincerely,
James E. Quinn,Projects Manager
cc: P. A. Boehnert (NRC/ACRS)I. Catton (ACRS)S. Q. Ninh (NRC)D. C. Scaletti (NRC)
(2 paper copies plus E-Mail)(1 paper copy plus E-Mail)
(1 paper copy plus E-Mail)(1 paper copy plus E-Mail)

GE Nuclear Energy
MFN 035-96
bcc: (E-Mail only except as noted)R. AsamotoN. E. BarclayJ. A. BeardP. F. BilligR. H. BuchholzT. Cook (DoE) (1 paper copy plus E-J. D. DuncanR. T. Fernandez (EPRI)J. R. FitchJ. N. FoxP. C. HechtJ. E. LeathermanJ. E. QuinnT. J. Mulford (EPRI) (2 paper copies plus E
P. E. NovakF. A. Ross (DoE) (1 paper copy plus E-Mail)B. ShiralkarR. Srinivasan (EPRI)J. E. TorbeckGE Master File M/C 747 (1 paper copy plus E-Mail)SBWR Project File (1 paper copy plus E-Mail)
Mail)
,-Mail)

GE Nuclear Energy
MFN 035-96
tac: [E-Mail only]
E LuminiS SpoelstraV CavicchiaJJ PenaK MaubachC WittemanA ZimmermannJ YamashitaW van der MheenA van Dijk0 YadigarogluK PetersenH TonegawaF KienleP MasoniW MizumachiG VaradiR Tavoni
H Blaesig (site)J Faig (site)A Toba (site)52700
8-011-39-10-655-82798-011-31-22-456-39128-011-39-68-509-86018-011-34-1-347-42158-011-49-721-987-72578-011-31-48-841-21288-011-49-406-396-36618-011-81-29-423-67508-011-31-26-351-80928-011-31-20-580-70418-011-41-1-632-11668-011-49-201-122-40928-011-81-33-597-22278-011-49-69-630-44208-011-39-51-609-86398-011-81-33-597-22278-011-41-5-698-23278-011-39-51-609-8688
5270052700

4t ... . ..
,
f ~L .;. DRF 'A70-000
Septemibeir 1994.-..-
Lcensmn Topical.]Report . **.....
SBWR Test anAnayiProga Descipton . ...
gram. - . . ." ,
"':',•'": '"'. ' ::.'.;.".,"", ' •;;"'"". '.'.. : " '..- " • .".'." : • • . .. ' "..;... . . . .".-.""...' "".-.. . ." .. ".... .... ".. . . . .,..j 'i • i,. .:
-k. V~n# .
......• •.... ..... , .~ ~~~~~~~~~ ~~~~~......... . . . :. . ,....... . . .. ,...... .. ;...... .... .. ... .< .-~~~~~~~~~~~~~~.. .. ...... ... •.... ..... - ..... .... .. .. . .. o:_ ;"~..0.-: \ :- , , , .::: . ,.. o , .. .o.. ,, , ,.X,,.&...;.&•- • . j...
M .", •I ;r. AI U ,: • t,

0 GE Nuclear Energy
P. W. Ma&rIot ~iAtxýýVAd~rc~d Pb TocaIi~b&$ 70 n Joam CA os*5.lold
Scptember 15,1994 MFI No. 110.94Docket STN 52-004
Document Control DeskU. S. Nuclear Regulatory CommissionWashington DC 20555
Attention: Richard W. Borchardt, DirectorStandardization Project Directorate
Subject SBA Test and Analysis ProgramNEDO..32391 Revision A
Description,
This letter transmits Revision A of the SBWR Test and Analysis PrhraM bDescription
report, NIEDO-32391. for your review (Attachment 1). The report provides a
comprehensive, integrated plan that addresses the testing and analysis elementsneedcd for analysis of the SBWR performance. In particular. this document describes
the final Test Plan (Appendix A).
Sincerely,
P. Wt. Mrrottv ManagerAdvanced Plant Technologies
Enclosure-. SBWR Tasg and AnalysisNEDO032391. Revision A
Prograam Description (TAPD).
cc: P. Bochtnrt (8 copies)IL HasselbcrgA. & LevinM. Malloy (10 copies)
11 -FJJ I

NEDO.32391"Rtvision A
DRF A70-00002Class I
September 1994
SBWR Test and AnalysisProgram Description
B. S. ShiralkurT. R. Mclntyre3. M. HeilzcrW. MarquinoH. A. Upto=P.. E. GambleJ. R. FitchY. C. ChuM. IHerzogJ. E. TorNeck
Approved:
U
P. W. Marriott, ManagerAdvanced Plant Technologics

NEDO-32391, Revision A
IMPORTANT NOTICE REGARDINGCONTENTS OF THIS REPORTPLEASE READ CAREFULLY
The only undertakings of the General Electric Company (GE)respecting information in this document are contained in the contractbetween the customer and GE, as identified In the purchase order forthis report and nothing contained in this document shall be construedas changing the contract. The use of this information by anyoneother than the customer or for any purpose other than that for whichit is intended, is not authorized; and with respect to any unauthorizeduse, GE makes no representation or warranty, and assumes noliability as to the completeness, accuracy, or usefulness of theinformation contained in this document.
I
I

I
r . U
NE0.32391, Revision A
TABLE OF CONTENTS
1.0 NRODUCnON.1.1 Purpose1.1.1 Scope.1.2 Background1.2.1 Use of TRACG1.2.2 Major SBWR Test Facilites1.3 Strategy for Determination of Test and Analysis Needs1.4 Overall Test Wnd Analysis Plan
2,0 IDMEIPCATION OF IMPORTANT THERMAL-HYDRAUI.CPIENOMENA. TOP-DOWN PROCESS2.1 Introduction2.2 Analysis of Events2.2.1 Loss-of-Coolant Accident (LOCA)2.2.2 Anticipated Transients2.2.3 Anticipated TrmansientWhout Scram (ATWS)2.2.4 Stability2.3 Phenomena Identification and Ranking Tables (PIRT)2.3.1 Loss-of-Coolant Accident (LOCA)2.3.2 Anticipated Transients2.3.3 Anticipated Transient Without Scram. Stability
3.0 IDENT CATION OF SBWR-UNIQUE FEATURES AND PHENOMENA-BOTFOM-UP PROCESS3.1 Introduction3.2 Methodology3.2.1 SBWR System Structure3.2.2 Screening Process3.2.3 SBWR Thermal-Hydraulic Phenomena Table3.2.4 Qualification Database Sheets3.3 'Results3.3.1 RPV and Internals (a11)3.3.2 NuclearBoiler System (B21)
.3.3.3 Isolation Condenser System (332)3.3.4 Standby Liquid Control System (C41)3.3.5 Gravity-Driven Cooling System (F50)3.3.6 Fuel and Auxiliary Pools Cooling System(G21)
I
ii

I
N.EDO-32391, Revisrion A
TABLE OF CONTENTS (Continued)
3.3.7 Core (3-Series)3.3.8 Containment (TIO)3.3.9 Passive Containment Cooling System (TIS)
4.0 EVALUATION OF IDENTIFIED PHENOMENA AND INTERACTIONS4.1! Composite List of Identified Phenomena and Interactions4.2 Analytical Evaluation of System Interactions4.2.1 Accident Scenario Definition4.2.2 Results from the Primary Systems In teractions Study4.2.3 Results from the Containment Systems Interactions Study4.2.4 Summary of System Interaction Studies4.3 Summary of Evaluations4.3.1 LOCA4.3.2 Transients;4.3.3 ATWS and Stability
5.0 MATRIX OF TESTS NEEDED FOR SEWR PERFORMANCEANALYSIS5.1 Separate Effects Tests5.2 Component Performance Tests5.3 Integral System Response Tests5.4 Plant Operating Dam5.5 Summary of Test Coverage
6.0 INTEGRATION OF TESTS AND ANALYSIS6.1 TRAM Qualification Plan6.2 Use of Data for TRACO Modc! Improvement and Validation
7.0 SUMMARY AND CONCLUSIONS
8.0 REFERNCES
S

k.
NEDO-32391, Revision A
A.A.1
A.2A.3
B.B.1B.2B.3B.4B.5B.6B.7
C.C.1C.2C.3CA4C.5
APPENDICES
TEST AND ANALYSIS PLAN (TAP)IntroductionTest and Analysis PhilosophyTest and Analysis Plan
SCALING APPLICABImTIntroductionApplication of Test FacilitiesScaling of GIST FacilityScaling of GIRAFFE FacilityScaling of PANDA FacilityPANTHERS ScalingScaling ConclusionsAttachment BI - Detailed Scaling Calculations and Thnory
TRACG INTERACTION STUDIESIntroductionScenario Definition for Interaction StudiesPrimary System Interaction StudiesContainment Interaction StudiesSummary of Interaction Studies
iv
I

I
NEDO-323918 Revision A
LIST OF TABLES
1.2-1 Evolution of the General Electric BWR1.2-2 SBWR Features and Related Experience
1.2-3 TRACOSEWRQualificaton2.2-1 GDCS Line Ereak Sequence of Events
A.2-1 Thermal-Hydraulic Test Data Groups and Description
A.3-1a PANTHERS/ICC Steady-State Perfonmancc Matrix - Steam Only Tests
A.3-1b PANTHE7 R/PCC Steady-State Performance Matrix- Air-Steam Mixture TestsA.3-1c PAN7TMS/PCC Noncondensable -.Buildup Test Matrix
A.3-1d PANTHERS/PCC Pool Water Level Effects - Test Matrix
A.3-2 PANTHEPS/PCC TRACO Qualification Points
A.3-3a PANTHER/IC Steady-State Performance- Test Matrix
A.3-3b PANTHERS/IC Transient Demonstration - Test Matrix
A.3-4 PANTHERS/IC TRACO Analysis CasesA.3-Sa PANDA Steady-State PCC Performance Test Matrix
A.3-Sb PANDA Integral Systems Test MatrixA.3-6 PANDA TRACO Analysis CasesA.3-7 GIST Test Matrix Initial Conditions (RPV at 100 psig)
A.34- GIST Runs Wigh Existing TRACG AnalysisA.3-9 Additional GIST Runs for TRACG AnalysisA.3-10 GIRAFFE Heat Removal Test Matrix (Phase 1 Step - I)
A.3-11 GIRAFFE System Response Tests (Test Group G2)
A.3-12 GIRAFFE Helium Test Conditions (Test Group G3)
A.3-13 FCC Contaiment Coolcr Structural Inssmnmentation
A.3-14 PCC Component Demonstration Test MatrixA.3-1S LOCA Cycle Tme 1-istoryA.3-16 Isolation Condenser Structural MeasurementsA4,-17 IC Component Demonstration Test Matrix
V
K

ZIEDO.32391, Revision A
LIST OF FIGURE
1.1-1 TAPD Focus1.2-1 Evolution of the BWR1.2-2 Evolution of the BWR1.2-3 Comparison of BWR Containments1.3-1 Satcgy for Determination of Test Needs1.4-1 Technology Basis for SBWR Design1.4-2 Overl Test and Alysis Plan2.2-1 SBWR Passive Safety Systems2.2-2 Phases of the LOCA Transient2.2-3 GDCS Line Break Reactor Water Level vs. Time2.2-4 GDCS Line Break Containment Pressure and Temperature vs. Time
2.2-.5 GDCS Line Break Decay Heat and PCC Power vs. Time
2.2-6 SBWR Stability Design Criteria and Performnance2.2-7 SBWR Power/now Map Comparison With Calculated Stability Limit
3.2-1 SBWR Product Structure6.0-1 Technology Basis for SBWR DesignA.3-1 Passive Containraent Cooler Test ArticleA.3-2 PANTHERS/PCC Test Facility SchematicA.3-3 Comparison of PANTHERS/IPC Steam-Air Test Roge to SBWR ConditionA.3-4 TRACO PANTHER CC Qualifcation PointsA.3-5 Isolation Condenser Test ArticleA.3-6 PANTHERSC Test Facility Process DiagramA.3-7 PANDA Facility SchematicA.3-S GIST Facility SchematicA.3-9 GIST Facility Piping Arrangement
* A.3410 GRAPFE Test Facility ScheraticA.3-11 GIRAFFE PCC UnitB.3-1 Comparison of RPV Pressure Response for MSLI3 in GIST and SBWR
B.3-2 Comparison of GDCS Plow for MSLB in GIST and SBW1R3.3-3 Comparison of Drywell Pressure Response for MSLB in GIST and SBWR
B.3-4 Comparison of Wetwell Pressure Response for MSL3 in GIST and SBWR
vi
I

NEDO-32391, Revision A
ABWRACADSAP1RMARIASUMIAnhASATWSBOBW&CACS
CIsECOLCPR~CRDCRIEPICSAUCSHTDBADCDPVDWI D1WEBWREcCsEOPsFAPCSFISTFIXFUCRDHUIGG
F9WFWCSGDCSGE
ABBREVIATIONS AND ACRONYMS
Advanced Boiling Water ReactorAlternating CurrentAutomatic Dexessmizadon SystemAverage Power Range MonitorAlternate Rod InsertionAmerican Society ofMechanical EngineersPE's 8.6 MW Heat Transfer LoopAnticipated Transients Without ScramBoiloffBoiling Water ReactorContainment Atmospheric Control SystemCounter Current now LimitingCentro Informazioni Studi EsperienzcCombined Operating LicenseCritical Power RatioControl Rod DriveCentral Rese•rh Institute of Electric Power IndustryCode Scaling. Applicability and UncertaintyCore Spray Heat TransferDesign Basis AccidentDirect Current .Depressurizatinm ValveDrywelFxpidmental Boiling Water ReactorEmergency Core Cooling SystemEmerency Operating ProceduresFucl and A=xary Pool Cooling SystemBWR Full Integral Simulation TestSwedish Test Loop Use.d for Testing External Pump Circulation
Fme Motion Control Rod DriveResearch Heat Transfer Loop Operated for DanishAtomic EnergyCommissionFeedwaterFeedwater Control SystemGravity-Driven Cooling System
General Electric Company
K
vii
ffm M, 11, 1 1 11 1 ,

:V
NEDO..3239.l, Revisiont A
ABBREVIATIONS AND ACRONYMS (Continued)
GEXLGIRAFFE
GISTHCUHVACICICSINELLASLLBLOCALOOPLPCIMCPRMIT~MPLMSIVMSLMWNBSNRCORNLP&.IDPANDA
PANTHERSPARPCCS
PIRTPSTFQ1DB
RgV•WCU
SB
General Electrc Critical Quality Boiling Length CorrelationGravity-Driven Integral Full-Height Tost for Passive HeatRemovalGDCS Integral System TestHydraulic Control UnitHeating.Ventilating and Air ConditioningIsolation CondenserIsolation Condenser SystemIdaho National Engineering LaboratoryLos Alamos Scientific LdboratoryLarge B•rLoss-of-Coolant AccidentLoss Of Offsite PowerLow Pressure Coolant InjectionMinimum Critical Power RatioMassachusetts Institute of TechnologyMaster Parts ListMain Stamlne Isolation ValveMain SteamlineMegawattNuclear Boiler SystemnNuclezr Regilatory CommissionOak Ridge National LaboratoryProcess and Infor:ation DiagramPassive Nachwarmcabfuehr-und Drucckabbau-Testanlage(Passive Decay Heat Removal and Depressurization Test Pfaility)Performance Analysis and Testing of Heat Removal SystemsPassive Autocatalytic R.combinersPassive Containment Cooling SystemPeak Cladding TemperaturePhenomena Identification and Rankdng TablesPressur Suppression Test FacilityQualification DatabaseRod Control and Information SystemReactor Prsure VesselReactor Water CleanupSmall Break
I

.. ; 77-.
NEDO.32391, Revision A
ABIBREVIATIONS AND ACRONYMS (Continued)
SBWR Simplified Boiling Water ReactorS/C Suppression Chamber (wetweli)
SDC Shutdown CoolingSIET Societa Jormazioni Esperienzc Termoidrauliche
SLCS Standby Liquid Control System
SPERT, Special Power-Excursion Reactor Tess
SRV Safety/Relief Valve
SSAR Standard Safety Aalysis ReportSSLC Safety System Logic ControlSSTF Stem Sector Test Faclity
TAPD Test and Analysis Program Description
TCV Turbine Control Valve.
THTF Thermal-Hydraulic Test FacilityTLTA Two-Loop Test ApparatusTPS Turbine Protection SystemTRAC Transient Reactor Analysis CodeTRACG Transicnt Reactor Analysis Code. GE version
TT Turbine TripUCE University of California. BerkeleyVB Vacuum BreakerWW Wetwell
ioi
U

I
FIT"
NEDO.32391. Revision A
1.0 INTRODUCTION1.1 Purpose
The purpose of the Simplified Boiling Water Reactor (SBWR) Test and Analysis ProgramDescription (TAPD) is to provide, in one document, a comprehensive, integrated plan thataddresses the testing and analysis elements needed for cranysis of SBWR steady-state and transientperformance. The progran was developed by:
" Study of the calculated SBWR transients and identification of important phenomena.• Identification of the unique SBWR design features and their effect on transientperformance." Systematc definition of experimentul and analytical modeling needs." Evaluation of tie current experimental and analydwl model plan against these needs." Definition of modifications as necessary.This document describes the steps in this process leading to the final Test and Analysis Pban
(Appendix A). The TRACG computer code is used for the analysis of SBWR transients, Loss-of-Coolant Accident (LOCA). Anticipated Transient Without Scrmn (ATWS) and stability. The TestPlan has been cross-referenced against the identified phenomena to create the TRACM QualificationMatrix. Section 1.3 describes in more detail the strategy employed to arrive at these objectives.The use of specific tests in the development of TRACG models, for test predictions and for post.test validation. is addressed in the report. Descriptions of the SBWR-sp.=.ccc test facilities andtheir fidelity with respect to scaling the SBWR plant are provided in Appendices A and B.
The SBWR TAPD thus provides the technology basis for determining the performance of theplant for transients and accidents, It tics together the ongoing diverse experimental and analyticalefforts in support of SBWR certification. The ultimate output from this activity is auset of validatedanalytical methods (primarily the TRACM computer code) for SBWR performance analysis.
1.1.1 ScopeThe SBWR Test and Analysis Program Description is directed at providing a sound
technology basis for the prediction of SBWR system performance during normal operation.transients and LOCAs. The document scope includes (1) steady-state operation and startupconditions, (2) transients and ATWS. (3) stability, and (4) LOCA. LOCA response cover• thevessel response [levels and peak cladding temperature (PCT)] with operation of the EmergencyCore Cooling Systems CECCS), as well as the containment pressure and temperature response topostulated breaks. Long-term core cooling by inventory makeup is also considered.
The document does not address "severe accident" issues. The requirement to design thecontainment to handle bydrogen generation assuming 100I metal-water reaction is, however.addressed as a Design Bauis requirement. Issues related not to thermal-hydraulics but, forexample, to material properties, crack resistance, water chemstry, et,. are not covered in thisplan.
The TAPD focus is illustrated in Figure 1.1-1. Transients and accidents, short of Severe coredamage, have been analyzed and the experimental and modeling needs Incorporated into the plan.In the tine domain, the focus of the studies has been on the first three days following a postulatedaccident or mnsient. Quasi-steady-state conditions prevail wellbefore this point in tire.Interactions with active systems such as the Fuel and Auxiliary Pool Cooling System (FAPC)have been studied. No new pheiomena are introduced beyond this point.
1.1-1
.. .,.. .
I
jig - -11111 M all ý --- 1; N, I lmý

N-EDO-323P], Revision A
The experimental and anwlytical modeling needs were analyzed in the context of the applicablecriteria of iOCFS2,.47(b)(a)(i)(A), which require in part that:
" The performance of each safety featue of the design has been demonstrated through eidteranalysis, appropriate test programs experience, or a combination thereof.
" Interdependent effects among the safety features of the design have been found to beacceptable by analysis, appropriate test programs, experience, or a combination thereof.
" Sufficient data exist on the safety features of the design to assess the analytical tools usedfor safety analysis over a sufficient range of normal operating conditions. transientconditions, and specified accident sequencesi including equilibrium core conditions.
The term "safety feature" in the preceding paragraph is understood to include safety-relatedpassive systems as well as other active systems which may be available to operators duringaccidents or tra",ients. The Bottom-Up process described in Section 3 specifically examines allSBWR.unique features that are relevant to safety. Issues related to these features have beenevaluated and the supporting technology basis (analysis. experimental data, plant data)documented. Interdependent effects among safety features have been specifically considercd.Analysis has been performed (Appendix C) to screen interactions that deserve experimenalvalidation. Finally. a test progra has been established which provides a sufficient database forthe qualification of the TRAMC Code for SBWR safety analysis.
jr

NWO.032391. Revision A
SEVER~EAWOOENTS
* I.I
LJ~R -
ThANSIENTS
Ns"
Alp..
MAP NO ME" , 'MyRow
v MA RTWUP
NOWAALOPERATIONS
..................................................3
TME (Wdwv)
TAPD FomuFigure 1.1.1
1.1-3

NEDO.32391, Revision A
1.2 BackgroundSIBWR Design Evolution
The SBWR design is an evolutionary step in boiling water reactor (BWR) design which tracesits commercial demonstration and operating plant history back before 1960 (Figure 1.2-1). Sinceits inception. the BWR. has had plant simplification as a goal for each product improvement (Figure1.2-2). The SBWR has major simplifying improvements drawn from predecessor designs.notably pressure-suppression containment, natural circulation, isolation condenser handling ofwaste heat. and gravity-driven makeup water systems (Table 1.2-1). •oe incorporation of thesefeatures-from predecessor designs Into the SBWR has emphasized employment of passive meansof dealing with operational transients and hypothetical LOCAs. The result of this evolution ofpreviously licensed plant features is simplified operator response to these events (most plant upset
conditions arc dealt with in the same manner, as typified by the hypothetical tteamline break), anda lengthened operator response time for all hypothetical events (from minutes for previouslylicensed reactors todays for the SBWR). Most features of the SBWR have been taken directlyfrom licensed commercial BWRs and reviewed and redesigned as appropriate for the SBWR(Table 12-2). The SBWR draws together the best of previously licensed plant features to continuethe simplification process. As an example, the evolution of the contaiment is shown in Figure.1.2-3.
Analysis and Design ToolsAs implied above, data available from operating plants and from the testing and licensing
efforts done to license the predecessor designs (most recently. ABWR) is the principal foundationof SBWR technology. As a measure of the SBWR's reliance on demonstrated technology,approximately 500 of the content of the SBWR SSAR is technically identical or technically simila(with minor differences) to the ABWR SSAR [31]. The 930 reactor-year database [40] of featureperformance In operating reactors, combined with the recent thorough licensing review of theABWR (Final Design Approval received July 1994). provides well-qualified foundation from
* which to make the modest extrapolations to the SBWR.
To make that extrapolation, GE has developed one computer code (TRACO) to use for designand for three out of the four most limiting licensing analyses. The TRACM Code, validated byoperating plant experience and appropriate testing. is used to analyze the challenges to the fuel(10CFRS0.46 and Appendix K, SSAR Section 6.3). the challenges to the containment (SSARSection 6.2), and many of the opetional transients (MCPR, SSAR Chapter 1S). The radiologicalresponses to hypothetical accidents arc also presented in SSAR Chapter 15, but do not useTRACG for analysis. Thus, TRACG draws from the very large database of licensed BWRs whichincludes all features of the SBWR (alboit in various configurations) and appropriate testing, and
allows direct application to SBWR design and analysis.
1.2.1 Use of TRACGTe TACO Code and its applcadon to the SBWR is documented in a series of GE Nuclear
Energy Topical Reports ([I]. [23, and [7M).TRACG is a GE proprietary version of the Transient Reactor Analysis Code (TAC). It is a
best-estimate code for analysis of 3WR transients ranging from simple operational transients todesign basis LOCAs, stability, and ATWS.
1.2-1
S-; •. . . ••
I

NEDO-32391, Revision A-
1.2.1.1 Background" TRAC was originally developed for pressurized water reactor (PWR) analysis by Los Alamos
National Laboratory (LANL). the. first PWR version of TRAC being TRAC-PIA. Thedevelopment of a BWR version of TRAC started in 1979 in a close collaboration between GE andIdaho National Engineering Laboratozr, The objective of this cooperation was the development ofa version of TRAC capable of simulating BWR LOCAs. The main tasks consisted of improving
the basic models in TRAC for BWR applications and developing models for the specifi BEWRcomponents. This work culminated in the mid-eighties with the development of TRACBO4 at GE
and TRAC.BDI/MODI at NE, which were the first major versions of TRAC having BWR
LOCA capability. Due to the joint development effort, these versions were very similar, havingvirtually identical basic and component models. The GE contributions were jointly. funded by GE,
the Nuclear Regulatory Commssion (NRC) and Electric Power Research Institute (EPRI) underthe RE•blLREIOOD and FIST programs.
The development of the BWR version has continued at GE since 1985. The objective of thisdevelopment was to upgrade the capabilities of the code in the areas of transient, stability and
ATWS gplications. Major improvements included the implementation of a core kinetics modeland addition of an implicit integration scheme into TRAC. The containment models were upgradedfor SBWR applications, and the simulation of the fuel bundle was also improved. TRACO wasthe end result of this development.
1.2.13 Scope and CapabilitiesTRACO is based on a multi-dimemaonal two-fluid model for the reactor thermal-hydrauliks
and a three-dimensional neutron kinetics model.The two-fluid model used for the thermal-hydraulics solves the consarvadon euations for
mass, momentum and energy for the gas and liquid phases. TRACO does not include any
assumptions of thermal or mechanical equilibrium between phases. The gas phase may consist of
a mixture of steam and a noncondensable gas, and the liqud phase may contain dissolved boron.The thermal-hydraulic model is a multi-dimensional formulation for the vessel component and a
one-dimensional formulation for all other components.
The conservation equations for mass. momentum and energy are closed through an extensiveset of basic models consisting of constitutive correlations for shear and heat transfer at thegasAiquid interface as well as at the w:dL The constitutive correlations are flow reghme doepin t
and are determined bwsed on a single flow regime map, which is used consistently throughout thecode.
In addition to the basic thermal-hydraulic models. TRACG contains a set of component.models for components, such as channels. steam separators and dryers. TRACO also contains a
-control system model capable of simulating the major control systems such as reactor pressurevessel WRPV) pressur and water level.
The neutron kinetics model is consistent with the GE core simulator code PANACEA. Itsolves a modified one-group diffusion model with six delayed neutron precursor groups.
Feedback is provided from the thermal-hydraulic model for moderator density, fuel temperature,boron concentration and control rod position.
The TRACO structure is based on a modular approach. The TRACO thermal-hydraulic model.
contains a set of basic components. such as pipe, valve, tee. channel, steam separator, heat
exchanger and vessel System simulations are constructed using these components as building
blocks. Any number of these components may be combined. The number of components, their
1.2-2
* .. . . .

0
~uriiniuituamu~
NEDO.32391, Revision A
interaction, and the detail in each component are specified through code input. TRACGconsequently has the capability to simulate a wide range of facilities, ranging from simple separate
effects tests to complete plants.TRACG has been extensively qualified against separate effects tests, component performance
data, integral system effects tests and full-scale plant data. A detailed documentation of thequalification is contained in the TRACM qualification report NEDE-32177P (2].
1.2.1.3 Scope of Application of TIZACG to SBWkThe TRACG computer code has been qualified to Level 2 status at GE-NE. Thus, the code
configuration is controlled, and the models and the results of validation testing have been reviewedand approved by an Independent Design Review Team. In the development process, the separateeffects and componeut data were used for model developmnt and refinement.
The tota effort and extent of qualification performed on TRACG, since Its inception in 1979,now exceeds, both in extent and breadth, that for any other engineering computer program which.GE has submitted to the NRC for design application approval. GE has chosen to perform SSARanalyses using the Best Estimate plus uncertainty. method [10CFRS0.46(a)(l)(i)). The Level 2application of TRACO includes LOCA analyses, transients. ATWS and Stability Analyses for thereactor and contaiment.
1.2.1.3.1 Transient AnalysisRACO is used to perform safety analyses of nearly all of the Anticipated Operational
Occurrences (AOO) described in SSAR Chapter 15. rnd of the ASME reactor vessel overpressureprotection events in SSAR Chapter S. The Loss of Feedwater Heating and the Control RodWithdrawal Error events presented in SSAR Chapter 15 are analyzed using the GE 3-D coresimulator model. Other SSAR Chapter 15 exceptions are the control rod drop and the fuel-handling accidents, -and radiological calculations for all postulated accidents.
The analysis determines the most limiting event for the AOOs in terms of Critical Power Ratio(CPR) and margin loss (A CPR) and establishes the operating limit minimum CPR (OLMCP2).The OLMCPR includes the statistical CPR adder which accounts for uncertainty in calculated-results arising from uncertainties associated with the. TRACG m6dcl, Initial conditions, and inputparameters. Sensitivity analysis of important parameters affecting the tranient results is performedusing TRACO. Concepts derived from the Code Scaling. Applicability, and Uncertainty (CSAU)methodology are utilized for quantifying the uncertainty in calculated results.
The analysis also determines the most limiting overpressure protection events in terms of peak.vessel pressure The results are used to demonstrate adequate pressure margn to the reactor vesseldesign limit with the SIWR design safetykelief valve capacity. The overpressure protectionanalysis is performed based on conservative initial conditions and input values.
.1.2.1.3.2 ATWS AnalysisTkACG is used for evaluation of the ATWS events in SSAR Chapter 15. The analysis
deterrincs the most limiting AT•S events in terms of reactor vessel pressur, heat flux, neutronflux, peak cladding temperature, suppression pool temperature, and conmaiment pressure. Theresults ame used to demonstrate the capability of the SBWR mitigation design features to complywith the ATWS licensing criteria.
1.2-3

NEDO.32391, Revision A
1.2.1.3.3 ECCS/LOCA AnalysisTRACG is used for evaluation of the complete spectrum of postulated pipe break sizes and
locations, together with possible single active failures, for Section 6.3 of the SBWR SsAIL Thisevaluation determines the worst case break and single failure combinations. The results are used todemonstrate tho SBWR Emergency Core Cooling System (ECCS) capability to comply with the
licensing acceptance criteria.A sensitivity analysis of important parameters affecting LOCA results is performed using
TRACG. For the SBWR. the ILOCA anldysis results are adjusted so that they provide 95%
probability LOCA results for use as the licensing basis. The SBWR LOCA results have large
margin with respect to the licensing acceptanýe criteria.
1.2.1.3.4 Containmrent AnalysisTRACG is also used for evaluation of containment response during a LOCA. The analysis
deter.mines the most limiting LOCA for containment (or Design Basis Accident. DBA) in terms ofcontainment pressure and temperature responses. The DBA is determined from consideration of a
full spectumn of postulated LOCAs. The results are used to demonstrate compliance with the
SBWR containment design limitsSensitivity of the containment rcsponse to parameters Identified as important is evaluated using
TRACO to assess the effect of uncertainties of these parameters on the containment responses.The procedure derived from the CSAU methodology (Section 1.2.2) is used for this purpose.
1.2.2 Major SBWR Test FacilitiesGE has used a procedure similar to the Code Scaling. Applicability and Uncertainty (CSAU)
methodology developed by the NRC [4]. [61 and submitted to the NRC by GE letter [413. This
procedure developed a list of phenomena important to the SBWR behavior in a large number ofanticipated and hypothetical events and matched them against information available from operating
plant and/or test experience. The Phenomena Identification and Ranking Table (PIRT) discussedin Section 2 of this report identifies over a hundred specific goveming phenomena (summarized InTable 1.2-3 of this report), of which over half were concluded to be "important" in prediction ofSBWR transient and LOCA peformance. TRACO contains models capable of simulation of each
;of die important phenomena, and each.has been qualified by the successful predictions of at leastone, and in most cases, several rest data sets. The PIRT defines more than 900 specic data sets.
from 42 different tests and test facilities, that make up the TRACG qualification database. Datafrom separate effects tests, component tests, systems and systems interaction tests. and operating
plant expcrience have been predicted by TRACG in its validation.Early in the SBWR program, one piece of information was identified as needed for the SBWt.
for which there was no information in the databa'e: that is, a heat transfer correlation for steamcondensation in tubes in the presence of noncondensable gases. A test program has since beenconducted to secure this information, reported to the NRC inRcferenca 21.
The, Single Tube Condensation Test Program was conducted to investigate steam condensationinside tubes in the presence of noncondensables. The work was independently conducted at the
University of California at Berkeley (UCB) and at the Massachusetts Institute of Technology(Mf'). T'he work was initiated in order to obtain a database and a correlation for heat transer insimilr conditions as would occur in the SBWRZ PCCS tubes during 'a DBA LOCA. Three
researchers utilized three separate experimental configurations at UCB, while two researchers
1.2-4. ..
M-UDi P IW

WOO
NED0-32391, Revision A
utilized one configuration at MI'L The researchers ran tests with pure steam, steam/air, andsteam/helium mixtures with representative and bounding flow rates and noncondensable massfractions. The experimenters found the system to be well behaved for all tests, with either of thenoncondeusables, for forced flow conditions similar to the SBWR design. The results of the testsat UCB have become the basis for the condensation heat transfer correlation used in the TRACGcomputer code.
While all SBWR features are extrapolations from current and previous designs, two features(specifically. the Passive Containment Cooling System and the Gravity-Driven Cooling System)represent the two most challenging extrapolations. Therefore, It was decided, for these two cases.to obtain additional test dam. which could be used to demonstrate the capabilities of TRACO tosuccessfully predict SBWR performance over a range of conditions and scales. Blind (in somecases double blind) predictions of test facility response use only the internal correlations ofTRACO. No "tuning" of the TRACG inputs is to be performed, and no modifications to thecoding arc anticipated as a result of thens tests.
For the case of the PCCS. it is planned to predict steady-state heat exchanger performance Infull-vertical-scale 3-tube (GIRAFFE). 20-tube (PANDA), and prototypical 496-tube(PANTHERS) configurations, over the range of SBWR expected steam and noncondensableconditions (Appendix A). This process addresses scale and geometry differences between thebasic phenomena tests performed in single tubes, and larger scales including prototype conditions.Transient performance is similarly investigated at two different scales in both GIRAFFE andPANDA.
TRACO GDCS performance predictions were performed against the GIST test series.
1.2.2.1 Major SBWR-Unique Test ProgramsAs noted previously, the majority of data supporting the SBWR design came from the design
and operating experience of the previous BWR product lines, SBWR-unique certification andconfirmation tests are briefly described below. They will be discussed in detail in Appendix A tothis reporý
1.2.2.1.1 GISTGIST is an experimental program conducted by GE to demonstrate the Gravity-Driven
Cooling System (GDCS) concept and to collect GDCS flow rate data to be used to qualify theTRACO computer code for SBWR applications. Simulations were conducted of DBA LOCAsrepresenting main steamline break, bottom drain line break. GDCS line break. and a non-LOCAloss of inventory. Test data have been used in the qualification of TRACO to SBWR anddocumented in Reference 42. Tests were completed in 1998 and documented by GE in 1989.GIST data has been used for validation of certain features of TRACO.
1.2.2.1.2 GIRAFFEGIRAFFE is an experimental program conducted by the Toshiba Corporation to investigate
thermal-hydraulic aspects of the SBWR Passive Containment Cooling System (PCCS)..Fundamental steady-state tests on condensation phenomena in the PCC tubes were conducted.Simulations were ran of DBA LOCAs: specifically, the main steamline break. Tests have beencompleted and results have been documented in Reference 43. GIRAFFE data will be used to
1.2-5

JZZ7~. U
NEDO-32391, Revision A
substantiate PANDA and PANTHERS data at a different scale and to support validation of certainfeatures of TRACO.
1.2.2.13 PANDAPANDA is an experimental program to be run by the Paul Sclherrer Institut of Switzerland.
PANDA is a i vll-vertical-scale 1i25 volume scale model of the SBWR system designed to modelthe thermal.hydraulic performance and post-LOCA decay heat removal of the PCCS. Both steady,state and transient performance simulations are planned. Testing at the same thermal-hydraulcconditions as previously tested in GIAPPE and PANTHERS will be performed, so that scale.specific effects may be quantified. Blind pro-test analyses using TRACG will be submitted to theNRC prior to start of the testing. PANDA data will be used directly for validation of certainfeatures of TRACM.
1.2.2.14 PANTHERS7PANTHERS is an experimental program to be performed by SIET in Italy, with the dual
purpose of providing dam for TRACG qualification and demonstration testing of the prototypeFCCS and IC beat exchangers. Steam and noncondensables will be supplied to proto..ty heatexchangers over the complete range of SBWR conditions to demonstrate the capability of theequipment to handle post-LOCA heat removal. Testing at the same thermal-hydraulic conditions asperformed in GIRAP0E and PANDA is planned. Blind pro-test analyses of selected testconditions using TRACO has been submitted to the NRC prior to the start of testing [35).PANTHE data will be used directly for validation of certain features of TRACO.
In addition to thermal-hydraulic testing. an objective of PANTHERS is to investigate thestructural adequacy of the beat exchangers. This objective is beyond the scope of this repor
1.2.2.1.5 Scaling of TestsA discussion of scaling of the major SBWR tests is contained in Reference 32. That report
contains a complete discussion of the features and behavior of the SBWR during challengingevents, It includes the general (Top-Down approach) scaling considerations, the scaling of specift(Bottom-Up approach) phenomena, and the scaling approach for the specific tests discussedabove. Appendix B of this report supplements the scaling report with detailed quantitative analysesof the major SBWR test facilities.
..... 1.2-6
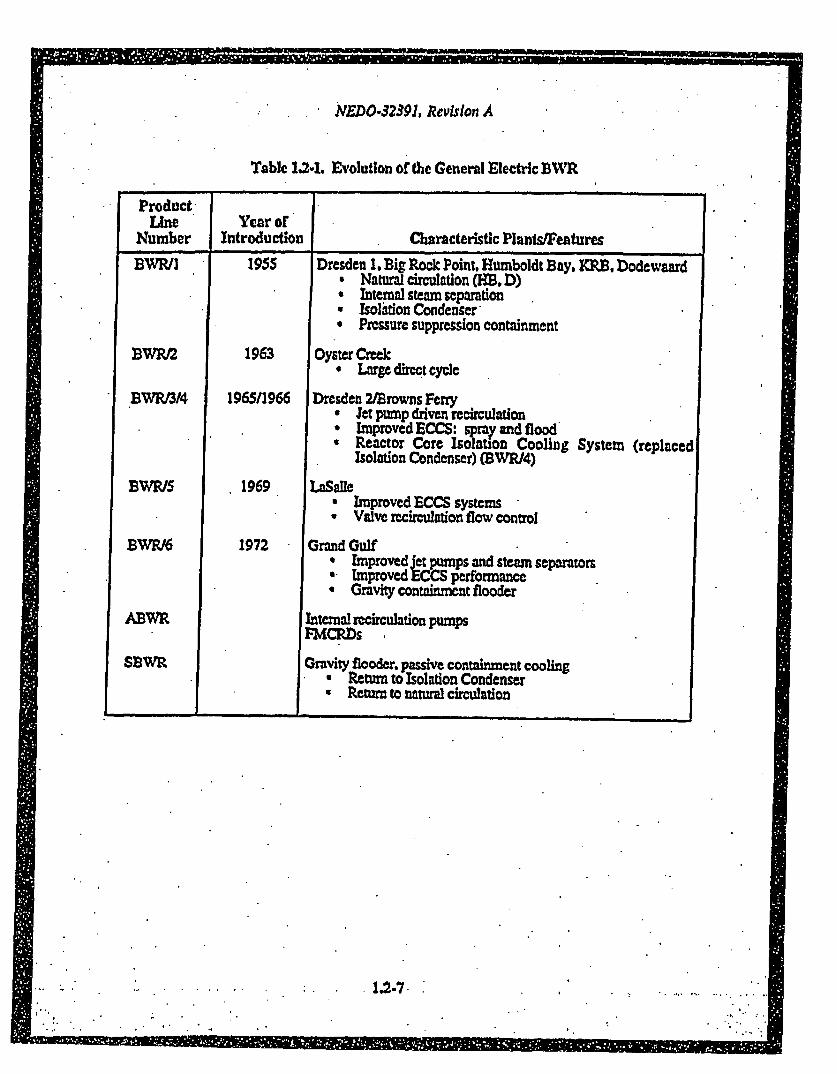
~~7-
NEDO-3239L Revision A
Table 1.2-1. Evolution of the General Electric BWR
ProductLine Year of
Number Introduction Characteristic Plant/.eatures
BWRII 1955 Dresden 1. Big Rock Point, Humboldt Bay, KRB, DodeweardNatural circulation (HB, D)Internal steam separation
* Isolation CondenserSPressure suppression containment
BWRM2 1963 Oyster Creek* Large direct cycle
BWR/3/4 196511966 Dresden 2lMrowns Ferryl et pump driven recirculationImproved ECCS: pry and flood
• Reactor Core Isolation Cooling System (replacedIsolation Condenser) (BWR/4)
BWR/S 1969 LaSalle* Improved ECCS systems
Valve recirculation flow control
BWR/6 1972 Grand Gulf° Improved jet pumps and steam separators• Improved ECCS performance* Gravity containment flooder
ABWR Internal recirculation pumpsFMCRDs
SBWj Gravity flooder. passive containment coolinga Return to Isolation Condenser* Return to natural circulation
: .. .1.2-7. -
H UIEIIIIUUE'E im IE!E

I
NEDO-32391, Iqevision A
Table 1L32. SBWVR Features and Related Experience
SflWAFeature__ Plant Testing.
IC
Natural Circulation
Squib Valves
GravIty Plooder
Intemal SteamSeparators
Chimney (Core to SteamSeparators)
FM•cRDs
u inatic
Docdewaard, resoen T,3, EljR~ockc Pt.. Tarapur 1.2, NineMile Pt. 1, Oyster Creek.Mllstone 1. Tsumiga, NuclenotPikusbima I
Dodewn•rdHumboldt Bay
BWR•I-6 and ABWRSIC Injection Valves
3WR/6 Upper Pool DumpSystem. Suppression PoolPlooder System
BWRII-6 and ABWR
Dodewnard. Humboldt Bay
A3WR
AD BWRs
BWR•1-6 and ABWR
BWR/6 and ABWR
BWPJ2-6 and A1WR
BWR/6, R.IM HX SteamCondensing Mode
Uperating Plants
Operating Plants
Opra~I Plants323 Qualificaton
Testing
Operating PlantsPieoperational Testing
Operating Plants
Operating Plants
ABWR Testlevelopment
(Demonstraon atLaSalle Plant)
Operating Plants
Mk I. Mk IL Mk II andABWR Tests
M II TestingABWR Testifg
Mk LUMh TestingOperating PI~tts
Operating Plants.PANDA.aGmAFMEPANTHE
uPressuroSuppression
Horizontal Vents
Quenchers
PCC (Dual Function HeatExchangers)
1.2-4

U
NFDO-3239, Revision A
Table 1.2-3. TRACG S9WR Qualification
Region Phenomena Identified Major Phenomena
Lower Plenum. 4
Bypass 10 6
Core 39 29
Guide Tube 7• 3
Downcowcr 7 6
Upper Plenum $ 4
Steam Separator 3 3
Steam Dryer 2 0
Stea Dome 3 0
Stearnine 6 5
Containment 68 48
Total 1S9 108
NOTE:Key SBWR Phenomena Identified (summary)
Phenomen are ranked according to importance and major phenomena Identified.
I .2~9
IMMg I I I , 4 11M I I NO I M1 I W
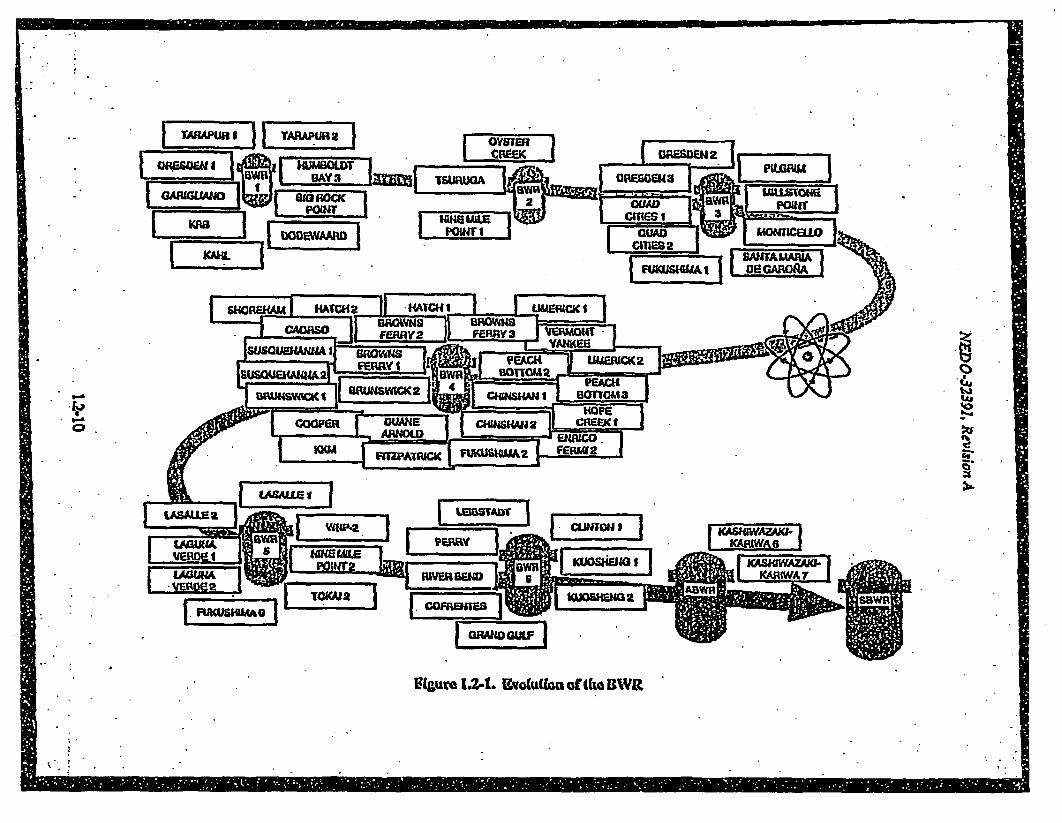
U
TA W W VARA UR D2OYMtER
le iI4
MGM
=LI2QUDIuf
Cmrms 1'cum
FERR I EC-
BR?(gure9 I .4 I~v~~uo(i W
U IIII

.I!
,o
9-.
a-a
LW
'A'~0
Ul
I
Evolution towards simplicity
Flgure 124. Jgvoluf Ion offhe WR

=.
Ssolatlon Contaliurie
Isolation containmeCondenser Flooder
Mark I Mark It Mark IlIDry ABWR SBWR'Pressure. Suppression No Yes Yes Yes Yes YesNumber of Barriers
Containment 1 2 2 3 2 2Fission 2 4 4 4 4 4Volume, million fW 2.5 0.4 0.5 1.6 0.5 0.3Heat Capacity, BTU x 109 0.3 1.7 1.3 1.3 1.3 1.3Design Pressure,-psig 50 62 45 15 45 55
10
0m~
I.'
U
LOCA Pressure, psig 50 44 42 9 39 42
Wgute 1.2-3. Comsparison of BWR Containmnteus
I

- r
NEDO-32391. Revision A
1.3 Strategy for Determination of Test and Analysis NeedsThe process of defining test and analysis needs for analysis of SBWR transient and accident
performance is based on developing a thorough understanding of the key phenomena to be
simulated and modeled. Once such a list of phenomena and interactions between systems iscompiled, the test and analysis plans can be checked against It to dctcrmine their sufficiency. Inthis study, a dun] approach was used to arrive at a comprehensive list of controlling phenomena.Figure 1.3-1 shows the overall strategy. The Top-Down process starts with the calculatedscenarios for the classes of transients and accidents to be studied, The scenario is divided intodifferent phases based on the key events in the evolution of the transient. For example, theLOCA/containsnent scenario can be divided Into (1) the Blowdown phase, where the reactor vesseldepressurizes. enabling the Gravity-Driven Cooling System (GDCS) to start injecting water Intothe reactor vessclh (2) the GDCS phase during which the GDCS tanks drain into the reactorpressure vessel: and (3) the long-term cooling lpare. after the GDCS tanksr have drained and thePassive Containment Cooling System (PCCS) removes decay heat and recycles condensed steamto the reactor vessel. For each phase of the transient, phenomena that might be important Werelisted and ranked to produce Phenomena Identification and Ranking Tables (PIRT). These tableswere developed for ezch region of the reactor vessel and containment. This Top-Down processand the results arc described in Section 2.
In the Bottom-Up process, unique SBWR design features were listed. Phenomena and issuesrelated to these features that might influence SBWR operation and transient behavior were thencompiled. This list was then reviewed and ranked by an independent team of cxpert Theresulting table of important phenomena and interactions is thus developed by an approach that Isdifferent from that used for the PIRT. Of course. both approaches require familiarity with SBWRtransients and phenomena. This Bottom-Up process is described S Section 3.
The information developed through both approaches was combined into a comprehensivetabulation of SBWR phenomena. Because the Bottom-Up approach focused on SBWR-uniquefeatures, the PIRT contains 'generic' SBWR phenomena (common to ill BWRs) that were notpicked up by the SBWR-unique issues. On the other hand, because the Bottom-Up approachstarts with specific SBWR components and systems, it was more suitable to identify interactionsbetween components and the various SBWR systems. The composite table can be found inSection 4.1.
A.l the phenomena and interactions identified as important were evaluated. For thephenomena generic to all BWRs, the evaluation consisted of confirming that data exist in the BWRdatabase covering the phenomena.. For the SBWR-unique phenomena, a more formal evaluationprocess was implemented. A Qualification Database sheet was prepared for each phenomenon.issue or interaction, showing the'expected range of SBWR parameters, the range of test dataavailable and an anslysis of the adequacy of the database. This led to the identification of needs foradditional test data or for TRACO qualification, which were factored into the test plan. Thecomponent and system interactions were also trmated in the same manner.. Numerous SBWRscenaros were analyzed to screen interactions that merited further study or experimental validation.This set was then compared with available integral system data that would capture thesei interactions. The test plan was amended to Incorporate identified gaps in the database. The resultsof the analytical t•udics are summarized in Section 4.2. Further details on the calculations arecontained in Appendix C.
The iteratdve evaluation process discussed above results in the TRACG Qualfication Mtrix(Section 5). The Qualification Matrix is a rearrangement of the Test Matrix showing how theidentified phenomena are covered by specific tests. ThIe Qualification Matrix has'been divided into
•.1.3-1.
1

1h11.1'miULIEIELLUiI ~u lnrDNluuThruuTl3E mm
NEDO.32391, Revision*A
four categories: Separate Effects Data, Component Data, Integral System Data, and BWR
Operating Plnt Data.The Test and Analysis Plan is discussed in Appendix A. It includes a brief description of each
major SBWR test facility, and the test matrix, which contains the test conditions and the purpose
and projected use for each category of tests. Planned analyses with TRCA for pre- and post-test
calculations are identified. Detailed scaling studies were performed on the GIST, GIRAFFE
PANDA and PANTHERS facilies. ThIe results show that the facilities are properly scaled to yield
data for certification. Results of the scaling studies have been summarized in Appendix B.
Section 6 shows how the data will be used for T'ACO development and validation. Separateeffects and component data are used man•ly for model development. Because interactions among
component and are present during the overall system response of integral test facilities, these data
validate the overall performance of the TRAMC Code for prediction of complex system response
characteristics. Integral system tests provide confirmation of the validity of the models. The
feedback from these tests may, also, be used to improve nodalizadon in the TRACO representation
of the test facility, and possibly, the SBWR.. This process is illustrated with the help of an example. One of the phenomena considered
important for the LOCA/ECCS events Is critical flow from the downeomer region, including the
effects of break uncovery and two-phase break flow. This is listed as Phenomenon El in Table
2.3-1. "SBVw PIRT for LOCAICCS'. Because it is given an importance r= king of 7 for the
large break (blowdown period), it is a candidate for incorporation in the composite table of highly.
ranked phenomena in Section 4. This issue is also listed in the Bottom-Up process, Table 3.2-1.
"SBWR ThWral-Hydraulic Phenomena" under B21, Nuclear Boiler System It is evaluated in
Table 3.3-1. "Issue Evaluations Summary" (#13) as having a sufficient data base. It is carried
forward w Table 4.1-1a, "Composite List of Highly Ranked Phenomena for LOCAIECCS" (item
El). Section S shows that the phenomena of critical flow, Including break uncovery and a range of
upstream two-phase conditions (El). are covered by the PSTP vessel blowdown, Edwards.
depressurization test and the Marviken Critical Flow tests in Table 5.1-1. "Separate Effects Tests
for TRACO Qualification for SBWR - R•actor Vessel and Core". The integral system tests which
cover the phenomena are found in Table 5.3-1 (TLTA and FIST large break tests and the SSTP
test). Table 5.5-1 shows that Item El is covered by Separate Effet. Component and Integral
System Tests. Because of this, it is not included in Table 6.1-1, which lists the additional needs
for TRACO qualification.
1.3-2

AtEDO.32391, Rev'ision A
TYOP.OWN
ICOV'AROSI
IP14ENOMENAI(SEC. 3-2
IBE EVALUATEDI~
WFlJOVM2) J5(GEM &2
Figure 13.1. Strategy for Determination of Test Needs
1.3-3

NEDO-32391
1.4 Overall Test and Analysis PlanThis section shows the relationships between thevarious testing, qualification, licensing and
design activities. In this study, the overall TRACO qualification needs are determined andadditional SBWR related testing is defined as shown on Figure 1.4-1. As mentioned In theprevious section, the primary output from the test and qualification activities is a final version ofthe TRACO computer progran, which has been comprehensively validated for application to the
SBWtL Figure 1.4-2 shows this process. which qualifies TRACO against large-scale componentand Integral system test data. A Licensing Topical .eport describing TRACG Qualification againstSBWR related test data will be prepared and submitted to the NRC for review and approval. Uponcompletion of the technology-related activities the SSAR calculations in Chapters 6 and 15 will bere-performed with the final version of the TRACG Code.
1.4-1

OPERAIIHG
OWN 1E444OOLQQ1Y UXG44NOLOGleC&4tLOWGV
QUMRCAIM WEIA
EFFECFSQU11OM 4IG4OGUALIFICA0
1%Ia
Figure IA-1. Techaology Basis for SDIVWl Design
UM

MODEL
'NEDO.3239i
DE2ELOPIASKIT
TESTING
OUAUFlICATIOtN
UCENSING
DESIGN
I.
H
Figure L.4-2. Overall Test and Analysis Plan
1.4-3
IN Immill -IUM 1 11 1 1 1 llý

NEDO..32391. Revision A
2.0 IDENTIFICATION OF IMPORTANT THEI MAL.HYDRAULIC PHENOMENA: TOP-DOWN PROCESS
2.1 IntroductionAs explained in Section 1.3 and illustrated in Figure 1.3-1. the process of defining test and
analysis needs for analysis of SBWR transient and accident performance is based on developing athorough understanding of the key phenomena to be simulated and modeled. This is done in thisreport in two ways: (1) a Top-Down process based on analyses and sensitivity studies, and (2) aBottom-Up process based on examination of individual design features. The Top-Down processidentifies phenomena and their importance based on bow the overall system behaves: the Bottom-Up process, by component cnd subsystem requirements. This section discusses the Top-Downapproach. leading to Phenomena Identification ad Ranking Tables (PIRT). Section 3 discussesthe Bottom-Up process. They are mcred in Section 4.
The PIRT iL a summary of analytical modeling needs for a physical system (in this case, theSBWR). The principal feature of the PIRT is an assessment of the 'importance" of each modelingneed by interdisciplinmary teams of experts. The approach used in the SBWR follows themethodology of Boyack, et al. [6]. TRACG calculations establishcd.the scenarios of variousevents (LOCA. anticipated transients, ATWS and stability). These are descnrbed in Section 2.2.The descriptions stress the phenomenological evolution of the transients. A detailed description ofthe sequence of events can be found in the SSAR (3]. (It Is noted that, due t6 modeling and designchanges since SSAR submittal, the event sequences have been updated somewhat from the SSARversions.)
The analyses were then reviewed by interdisciplinar; teams to identify each thermal-hydraulicphenomenon that plays a role in the analysis. and to rank all of them in terms of 'imporance": thatIs, degree of influence on some figure of merit (e.g.. reactor water level, containment pressure).For a brief view of the output of this process, see the first sheet of Table 2.3-1. The PIRTprocess is discussed in Section 2.3, where the PIRT tables are presented.
... .. 2.1-1 -. ..

NEDO-3239L, RevisLion A
2.2 Analysis of Events2.2.1 Loss-of-Coolant Accident (LOCA)
Chapter 6 of the SSAR includes the entire matrix of calculations of postulated pipe rupturelocations and single failures. For a complete PIRT evaluation. the entire spectrum of events mustbe covered, including analyses with less limiting conditions than the design-basis case with noauxiliary power. To facilitate understanding. a large break in the Gravity-Driven Cooling System(G=)CS) line has been chosen to illustrate the sequence of events during the LOCA. The sequenceof events is similar for all the LOCA events, particularly after initiation of the GDCS flows, whenthe vessel and containment transients are closely coupled. While there are some differences in theassumptions made for analysis of the different breaks, these are not very important in determiningthe phenomenological progression of the LOCA or the importance of various parameters. Thelimiting LOCA from the perspective of margin to core uncovery Is the GDCS line brea k from theviewpoint of containment pressure, it is the large steamline break. A schematic of the SBWR'spassive safety systems Is shown in Figure 2.2-1.
The overaliLOCA sequence can be divided into three periods: blowdown period, GDCSperiod and the long-term cooling PCCS period. These periods are shown in Figure 2.2-2. Theblowdown period is characterized by a rapid depressurization of the vessel through the break.safety relief valves (SRVs) and depressurization valves (DPVs). The steam blowdown from thebreak and DPVs pressurize the dywel,. clearing the main containment vents and.the PCCS vents.First, noncondensable gas and then steam flows through the vents and into the suppression pool.The steam is condensed in the pool and the noncondensable gas collects In the wctwell air spaceabove the pool. At about 500 seconds, the pressure difference between the vessel and the drywcllIs small enough to enable flow from the GDCS pools to cuter the vessel. This marks the beginningof the GDCS period, during which the GDCS pools drain their inventory. Depending on thebreak, the pools are drained in between 2000 and 7000 seconds. The GDCS flow fills the vesselto the level of the break, after which the excess GDCS flow spills over into the drywoll. TheGDCS period Is characterized by condensation of steam in the vessel and drywell. depressurizationof the vessel and drywell and possible openings of the vacuum breakers which returnsnoncondensable gas from the wetwell airspace to the drywall. The decay heat eventuallyovercomes the subcooling in the GDCS water added to the vessel and boiloff resumes. Thedrywell pressure rises until flow is reestablished through the PCCS. This marks the beginning ofthe long-term PCCS coolingperiod. During this period, the noncondensable gas that entered thedrywelI through the vacuum breakers is recycled bacic into the wetwell. Condensation of thebolloff steam in the PCCS Is recycled back into the vessel through the GDCS pool. The mostimportant par of the LOCA transient for vessel response is the blowdown period and the early partof the GDCS period when the vessel is reflooded and level restored. For some breaks, theequalization line from the suppression pool to the reactor vessel may open during the long-termcooling period to provide the vessel an additional source of makeup water.
2.2.1.1 Primiry System Response for the GDCS Line BreakThe GDC§ line break scenario is a double ended guillotine break of a GDCS drain line. There
are three GDCS pools in the SBWR containment, each with Its own drain line from the pool to thevessel. Each drain divides into two branches before entering into the pressure vessel. Each branchhas a check valve followed by a squib operated injection valve and finally a nozzle in the'vcsselwall to control the blowdown flow in case of a break. The check valve prevents backilow from thevessel to the p.-l. The GDCS break is assumed to occur in one branch, between the sqmub
A
2.2-1

I ml. * I. m
NEDO-32391, Revision A
operated valve and the nozzle entering the vessel. Additional assumptions for the LOCA analysisinclude a simultaneous loss of auxiliary power and no credit for the on-site diesel generators. Theonly AC power assumed available is that from battery powered inverters.
a lowdown Period- At break initiation, the assumed simultaneous loss of power trips thegenerator, causing the turbine bypass valves to open and the reactor to scram. The bypassvalves close after 6 seconds. No credit is taken for tins scram or the heat sft provided bythe bypass. The power loss also causes a feedwater coastdown. Drywell cooling is lost.and the control rod drive (CRD) pumps'trip. The blowdown flow quickly Increases thed.ywell prssurc to the scram setpoint. although no credit is taken for this safety function.
High drywell pressure isolates several other functions, including the ContainmentAtmosphere Control System (CACS) purge and vent, Fuel and Auxiliary Pool CoolingSystem (PAPCS), high and low conductivity sumps, fission product sampling, and reactorbuilding Heating, Ventilating and Air Conditioning (HVAC) exhaust.
Loss of feedwater and flow out the break cause the vessel water level to drop past theLevel 3 (1W) scram setpoint. This setpoint is assumed to scram the reactor. The scramwill temporarily increase the rate of level drop and the Level 2 (L2) trip will quickly followthe L3 trip. This trip %Ull isolate the steamlines and open the isolation condenser (IC) drainvalves, but no credit is taken for heat removal by the IC. After L2. the rate of leveldecrease will slow and, without external makeup, the Level I (LI) trip will be reached, but
* not for several minutes. During this delay, the IC, if available, would be removing energyand reducing pressure and break flow. After a 10-second delay to confirm the Licondition, the Automatic Depressurization System (ADS) logic will start a timed sequentialopening ofdepressurinton and Ijection valves. Four SRVs (two on each ste.eam.e) openfirst. The remaining four SRVs open 10 seconds later to stagger S.v line clearing loads Inthe suppression pool and minimize'vessel level swell. Similarly. opening of thedepressurization valves (DPVs) is delayed'45 seconds. Two DPVs on the main steamlines open first, followed in 45 seconds by two additional DPVs. The remaining twoDPVs open after an additional 45 seconds. Ten scconds after the'last DPV opens, the sixGDCS injection valves are opened. When the GDCS injection valves furst open. thehydrostatic head from the pool is not sufficient to open the check valves and GDCS flowdoes not begin immediately. When the GDCS check valves do open, the cold GDCS waterfurther depressurizes the vessel. Blowdown through the break and the SMVs and DPVscauses a level swell in the vessel, which collapses at the end of the blowdown period, withthe ODCS injection.
* GOCS Per'od- The GDCS flow begins refilling the ves.el and the downcomer levelrises. When the level reaches the break, the GDCS flow spills back into the drywelL For.the GDCS break, the flow of GDCS water is sufficient to raise the downcomer level abovethe break. until the pools empty. then the level drains back to the break level Inside ihecore shroud, the level in the chimney also decreases after depressur'iztion, but is restoredafter the GDCS refills the vessel. Figure 2.2-3 shows the chimney level during the first25 minutes of the transient.. The level swell during the initial blowdown and opening ofthe SRVs and DPVs Is not shown in the f•gre (note the level drop and then rise during theGDCS period as the vessil is refilled).
23.1. Containment Response for the GDCS Line BreakCotainment response calculations assume loss of all AC power =xcept tt available from
battery powered inverters, reactor power at 102% of rated power and no credit for IC operation.
.... ~~~.... . ... .. .. .............. .....-2..... .-...........

NEDO-32391, Revision A
The single failure used is the failure to open a check valve in one of the GDCS pool drain lines.Initial conditions are containment normal operating pressure and temperature, with the suppressionpool at its maximum allowable operating temperature.
Blowdown Period The blowdown for the GDCS line break occurs from the vessel sideof the broken line. Simultaneously, the pool side of the broken line drains the inventory ofthe one affected GDCS pool into the containment. The check valve keeps the vessel fromblowing down through the unbroken branch of the GDCS line. As noted earlier, the breakflow is initially a liquid blowdown, and after the downcomer water level falls below theGDCS line elevation, the break becomes a vapor blowdown. The ADS, activated by thedownoomer level, opens the SRVs and the DPVs. The flashing liquid (and later, steam)entering the drywell increases Its press=re, opening the main containment vents andsweeping most of the drywell noncondensable gas through the main vents, the suppressionpool and into the wetwell airspace. The steam flow through the vents is condensed in thesuppression pool. During the blowdown phase of the transient, the majority of theblowdown energy is transferred into the suppression pool through the main vents. Theincrease In drywcll pressure establishes flow through the PCCS, which also'picks up partof the blowdown energy. For the GDCS break, this period of the accident lusts less than10 minutes.GDCS Period- Once the vessel pressure drops below the setpoint of the check valves inthe two unbroken GDCS lines, the GDCS pools begin to empty their inventory into thevessel. The subcooled GDCS water quenches the core voids, stopping the steam flowfrom the vessel. The GDCS flow refills the vessel to the level of the break and then spillsover into the drywell. Spillover from the break into the drywell begins at about 20 minutesinto the accident and continues throughout the GDCS period of the accident. Once theGDCS flow begins, the drywell pressure peaks and begins to decrease. The decrease indrywell pressure stops the steam flow through the PCCS and main vents. The drop indrywell pressure is sufficient to open the vacuum breakers between the drywell and thewetwell airspace several times. Once the GDCS flow begins to spill from the vessel intothe drywell, the drywell pressure drops further and additional vacuum breaker openingsoccur. Some of the noncondensable gas in the wetwell airspace is returned to the drywellthrough the vacuum brcakers. The GDCS period of the transient continues until the GDCSpools empty and the decay heat is able to overcome the subcooling of Ube ODCS inventoryin the vessel. Then. the drywall pressure rises and flow is reestablished through thePCCS. The PCCS heat removal capacity, even while recycling nonornadensable gas backto the wetwell, is sufficient to handle the steam generated by decay heat, and the main vents• ic not reopened. This period of the accident Is expected to last approximately 3 hours forthe GDCS breaL* Long.Tera PCCS Period - After the drywell pressure transient initiated by the GDCSflow Is over, the drywell pressur= settles out slightly above the wetwell airspace pressure.A drywell-to-wetwell pressure difference is established which is sufficient to open thePCCS vent and drive the steam generated by decay beat through the PCCS. The drywellpressure and temperature during the first 12 hours of the GDCS ine break transient areshown in Figure 2.2-4. The drywell pressure rises rapidly during the blowdown perfd.odecreases at ODCS initiation, drops as the GDCS spills into the drywell and finally levelsoff as bofloff resumes. The temperature shown is for a node high in the drywell. At thislocation. the temperature rises during blowdown, then actually superheats during theGDCS period, but levels off as flow to the PCCS resumes. In lower regions of thedrywcll. affected by GDCS spill, the temperature may drop during the GDCS period.
2.2-S

7
NEDO-32391,'Revision A
Figure 2.2-5 shows the PCCS. power during the first 12 houra of the transient. Alsoshown is the decay heat, During the blowdown period. the PCCS picks up part of theenergy released during the blowdown, most of which is deposited in the suppression pool.During the GDCS period, steam flow to the PCCS stops and the PCCS power drops tozero. As soon as the decay heat can overcome the GDCS sibcoollng, boiloff and steamflow to the PCCS resumes and by 12 hours, the PCCS power increases back to nearlyequal to the decay heat power.
By way of comparison, the drywell pressure at the beginning of the long-term period for theGDCS break is below the drywell pressure for the large steam line break. During the 72 hourswhich define the long-term cooling penrod.the drywall pressure remains below the large steam-linebreak pressure. As with other breaks, the drywell prssure estzblshed at the end of th OGDCSperiod defines the containment behavior durng the ong-term cooling period.. "
For this particular break, depending on which GDCS line is broken. the vessel level mayslowly drop during the long-term cooling period because pan of the inventory that is boiled off andcondensed in the PCCS may be returned to the GDCS pool with the break. Ths part of the PCCSflow will drain into the lower drywell instead of returning to the vessel. To avoid uncovering thecore, an equalization line between the vessel and suppression pool Is designed to open before thevessel water level can drop below one meter above the top of the core. This ensures sufficietliquid inventory to keep the core covered even if the boiloff continues. For some break,, the levelin the lower drywell may rise enough to reach the spillover holes in the main vents. Inventoryadded to the lower drywell past this point is returned to the suppression pool and back to the vesselthrough the equalization line. Analysis of the GDCS break indicates that for this break, the drywelllevel will not reach the spillover holes.
During this final period of the transient. drywell pressur'e will rise slowly. This results from aslow increase in the wetwell airspace pressure, due to the assumed leakage flow between thedryw•ell and wetwell airspace and conduction across the wall separating the drywell and wetwell.This energy addition is partially offset by heat losses to the surroundings from the outside wetwellwall. Without the leakage, the containment pressure remains nearly constant during the long-termperiod of the transient.
2.2.13 GDCS Line Break SummaryAlthough the discussion of the GDCS line break has been described in two parts, th primary
system and containment response are not independent, particularly after the blowdown period.The sequence of events occurring in the GDCS line break transient is summarized in Table 2.2-1.The events which produce actions are listed as symptoms and the actions resulting from the eventare listed as actions. The timing of the symptoms is also shown.
For the GDCS break, the reactor core does not uncover, so there is no cladding heatup abovesaturation tenperature of the coolant. In evaluating the "importance" of various phenomena in thePIRT process, the phenomena associated with cladding heamp ( radiation heat trnsfer, metal-water reaction) are compartively unimportant. while phenomena associated .with reactor waterlevel (e.g., decay heat, energy release from heat slabs) are comparatively important. For thecontainment, after the blowdown and release of energy to the suppression pool. the effetiveress.of the PCCS controls the containment response, with no pumped decay-hema removal. systemavailable. In the long-term cooling period, the containment pressure and temperature increaseslowly till the end of the 72-hour period at which time credit for non-safety decay-heat removalsystems is permitted. Thus, containment pressure and temperature become the primary figure of'merit for the conWnment and the phenomena affecting them are important.'
p
.2.2-4
I--

U
~u1q11!~EI!muUEinEm
NEDO.323S91, Revision A
The LOCA scenario develops slowly for the SBWP. The accident detection system logicfunctions almost instantaneously, but thereafter, the time swales are measured in hours rather than
seconds. The reactor water level (Figure 2.2-3) dips briefly about 10 minutes into the LOCA due
to void collapse following GDCS injection. The minimum water level occurs at about 7 hours after
the break. This slow response, which is duc to the large volume of water In the reactor vessel andGDCS pools, makes the LOCA a very slow moving event from the reactor systems and operatorresponse standpoint. Similarly, containment response (Figure 2.2-4) is gradual, not reaching the
design pressure even 72 hours after the break. This slow response permits well-considered,deliberate operator actions.
2.2.2 Anticipated TransientsAs with the LOCA, anticipated transients arc discussed in the SSA1R (Chapter 15) and no
additional analyses are presented in this report. The PIPTs for anticipated transients were
synthesized from consideration of the phenomena involved in various classes of events.
2.2.2.1 Fast Pressurization EventsThese arc the limiting pressurization events, Principal figures of merit on which "Importance"
Is defined arc critical power (MCPR) and reactor pressure..• Turbine Trips - initiated by trip of turbine stop valves from full open to full closed.
Analyzed with bypbss valves functional. and with bypass failure." Generator Load Rejection - initiated by fast closure of turbine control valves from
partially open position to full-closed.' This event is analyzed with bypass valvesimcdoning, and with bypass failure. The turbine c6ntrol valves inay be Initially at thesame position (full arc turbine admission) or at different positions (partial arc turbineadmission).
• Loss of AC Power - Similar to load rejection: however, bypass valves are assumed toclose after 6 seconds due to loss of power to condenser circulating water pumps.
• Main Steinline Isolation Valve (MSIV) Closure- In this cmae, the scram signal on valveposition is further in advance of complete valve closure. This effectively Wtigatea theshorter line length to the vessel available as a compression volume.
* Loss of Condenser Vacuum - This event is similar to the Loss of AC Power a~d aTurbine Trip with Bypass. Because a turbine trip occurs at a higher vacuum setpoi thanthe bypass valve isolation, the bypass valves are available to mitigate the initial pressureincrease.
2.2.2.2 Slow Pressurization Events' These are analyzed principally to ensure that they are bounded by the fast pressurization
events.. MCPR and reactor pressure determine "importance."SPressure Regulator Downscale 1Falure-- Simultaneous closure of all turbine control valves
in normal stroke mode. The triplicated fault tolerant control system prevents any singlefailure from causing this and makes its frequency below the anticipated abnormal
occurrnce category.* Single Control Valve Closure-- This event could be caused by a hydraulic failure in the
valve or a failure of the vau rotor/actuator.
MýM ýRu

NEDO.32391, Revision A
2.2.23 Decrease in Reactor Coolant InventoryLoss of feedwater flow is characteristic of this category of taient. The IC maintains water
level, Reactor water level is the principal figure of merit on which "importance" is defined.
2.2.2.4 Decrease in Moderator TemperatureThese events challenge MCPR and stability, which are the figures of merit on which
"inportance" is defined:• Loss of Feedwater Heating - initiated by isolation or bypass of a fcedwater heater.9 Feedwater Controller Failure'-- hypothesizes an increase in feedwater flow to the
maximum possible with all three feedpumps operating at maximum speed. Similar toturbine trip but with more severe power transient due, to colder &e.dwater.
To determine the phenomena important in modeling anticipated transients, the sequence ofevents and system behavior for each class of events should be understood. To provide an exampleof this, the sequence of events for a fast pressurization transient is discussed below. For this classof transients, important phenomena are those affecting the MCPR and reactor pressu.,
2.2.2.5 Generator Load Rejection Event DescriptionA fast pressurization event will occur due to the fast closure of the turbine control valves
(TCVs), which can be initiated whenever electrical grid disturbances occur which result insignificant loss of electrical load on the generator. Closure of the turbine stop valves is initiated bythe turbine protection system. The valves are required to close rapidly to prevent excessiveoverspeed of the turbine-genertor rotor.
At the same time. the turbine stop or control valves are signaled to close, and the turbinebypass valves are signaled to open in the fast opening mode. The bypass valves are f1ll open onlyslightly later than the turbine valves are closed, and can relieve more than one-third of rated steamflow to the condenser, gready mitigating the transient. Ihe bypass valves also use a triplicateddigital controller. No single failure can cause all turbine bypass valves to fail to open on demand.The worst single failure can only cause one turbine bypass valve to fail to open on demand.
The closing time of the TCVs is short relative to the sonic transit time of the-steamine. so theirclosure sets up a pressure wave in the steamlines. When the pressure wave reaches the vesselsteam dome. the flow rate leaving the vessel effectively undergoes a step change. The area changeentering the steam dome partially attenuates the pressure wave, propagating a weaker pressuredisturbance down through the chimney and downcomer. increasing the vessel pressue, andreducing voids in the core. 'The void-reactivity feedback results in an increase in the neutron flux.A reflection of the pressure wave also travels back toward the turbine, producing an oscillation inflow and pressure in the steamlines.
Concurrent with closure of the turbine control valves, a scram condition is sensed by thereactor protection system. A turbine stop valve position less than approximately full open triggersa scram, as does the low hydraulic fluid pressure in the turbine control valve solenoids which starttheir fast closure mode. The SBWR digital multiplexed Safety System Logic Control (SSLC) willInitiate a scram when any two turbine stop valves are sensed as closing, or any two turbine controlvalves are sensed as fast closing.
The core reactivity is decreased by the control blade Insertion and increased'by thO decrease incore voids and increase in inlet flow. The net effect may be either an immediate shutdown of thereactor and decrease in neutron flux (in cases where there are control blades partally inserted in
2.2-6
E

NEDO-32391, Revision A
high worth areas of the core) or a short period of increased reactivity and neutron flux followed byshutdown (in the safety analysis case where there are no control blades initially inserted. and aslower bounding CRD scram insertion time is assumed.)
In the case where the neutron flux undergoes a transicnt increase, the energy deposition in thefuel pellet will increase clad heat flux. The minimum value of critical power ratio during this
transient is found to occur in the upper part of the bundle.
Eventually, as the blades are fully inserted, the reactor is driven subcritical, power drops todecay heat levels, and clad temperature equifibrates near saturation temperature.
The vessel pressure increase is terminated by the bypass valve opcning. The water level dropsbelow the feedwater sparger and sprays subcooled water into the steam dome. This quenching ofvapor also helps to terminate the pressure increase. If the bypass and feedwater systems areassumed to be unavailable, the duration of increased pressure would be long enough to initiate theIsolation condenser.
In the ASME overpressure protection analysis, the Isolation Condenser is not considered.causing the pressure to slowly increase to the SRV opening pressure. The pressur increase Isterminated immediately with SRV activation, and the maximum vessel pressure occurs at the vesselbottom. The overpressure protection case conservatively assumes the first scram signal to fail, andscram on neutron flux terminates the power increase in both turbine valve closure and the MSIVclosure events.
The water level response in pressurization events is driven by the transfer of water from thedowneomer to core and chimney caused by the collapse of voids in the core and chimney regions.The sensed water level decreases rapidly below the L3 low water scram setpoin. The feedwatersystem flow increases fast enough to prevent the L2 setpoint being reached in high frequencyevents (events where feedwater and bypass valves are available). The feedwater control systemwill demand maximum feedwater flow for approximately one minute, until normal level isrestored. Without feedwater, the level drop will progress to L2, Initiating the IC, isolating theMS1Vs and transferring the CRZ) system to high pressure injection mode. The IC canindependently maintain the water level near the L2 setpoint. CR, high pressure injection willcause level to slowly recover to above normal, and then automatically trip off.
2.2.3 Anticipated Transients Without Scram (ATWS)The most limiting ATWS event in terms of reactor vessel pressure, beat flux, neutron flux,
peak cladding temperature, suppression pool temperature and containment pressure Is theinadvertent closure of all main steaamline Isolation valves with failur of rod insertion. This event isdescribed in Section 15.8 of the SSAR. It is the only ATWS event considered in determining thephenomena needs for qualification of TRACO.
2.2.4 StabilityBecause the SBWR core flow is driven by natural circulation. the most limiting stability
condition is at the rated power/flow condition. This is unlike operating forced-circation BWRs.and It simplifies the stability analysis for the S3WR.
For the SBWR, a stability criterion is used which is very conservative compared to operatingplants (Figure 2.2-5). The core decay ratio is maintained less than 0.4 and the channel decay ratioless than 03.
The stability performance of the SBWR is evaluated at various conditions.
.......... . 2.2-7

I34 --q
N)DO-32391. Revision A
2.2-.4.1 In Steady-State OperationIn .ready-:tate operation, the highest power/flow ratio occurs at 104.2% power 6d 1009
flow conditions. The decay ratio is well within the conservative design criteria (FIgure 22.-5). At
reduced power level, the powerlflow ratio is lower, so the decay ratios for both core and hotchannel are lower than at the rated condition. This conclusion is supported by Dodewaard test data
as shown in the figure. The decay ratios during normal operation at Dodewaard have been very
low. In Figure 2.2-6. the power/flow map of SBWR normal operation Is compared with thestability limit calculated in the Oak Ridge National Laboratory (ORNL) study. The results show
that there is large margin for stability. This indicates that the SBWR is very stable under normal
operation conditions.
2.2.4.2 Of the Anticipated TransientsOf the anticipated transients, the loss of 55.6.C (1007o ) fedwater heatingcase gives the
highest power/flow ratio. Loss of feedwatcr flow is another limiting event. However, the scramquickly mitigates the transient and the power conditions are reduced to hot shutdown. For both
events, the decay ratios for core and hot channel meet the design criteria shown in Figure 2.2-S. In
Figure 2.2-6, both of these znnsient.ovonts are seen to result in power/flow conditions that are wellbelow the exclusion region.
2.1,4.3 Under ATWS ConditionsUnder AM"WS conditions, the persistent high reactor power poses the most challenge to the
stability criteria. However, feedwater runback reduces the core power. and the SBWR's low
power density also helps to alleviate the severity of the challenge to the stability criteria. Eventhough the reduced vessel water level effectively decreases the core flow rate and increases thepower/flow ratio to a higher value than those for the steady state and anticipated transient
conditions, the analysis of performance in the ATWS study indicates the reactor remains stable and
no power oscillation is predicted. The. injection of boron will eventually shut down the reactor Dadmitigate the situation.
2.2.4.4 During StartupDuring strmtup, tere is a special concern that is not present at power. At very low Zows. a
periodic "geyserin" flow oscillation can be postulated to occur caused by either of two
mechanisms. First, condensation of core exit vapor in the subcoocled chimney region and the topof the core might cause a reduced pressure in the channels and a resultant flow reversal in the core.
Oscillations of this kind are unlikely given the SBWR startup procedures, which are similar to
those of the Dodewaard reactor (Dodewand has experienced no "geysering" oscillation in its 22refuel cycles of operation). . Second. vapor production in the lower-hydrostatic-bead chim.ey
region could cause a reduction of hydrostatic head and a resultant core flow increase. This. in
t, could cause voids to collapse in the chimney, leading to a reduction in flow. Oscillations of
this second kind have also n•ver been seen at Dodewaard. If they wore to occur, they would be
mild oscillations with little, if :my, reactivity impact.
.. .. .2.2-8 ,

NEDO-32391, Revision A
Table 2.2-1, GDCS IUne Dreak Sequence of Events
Symptom Action() Time NOr)
LOSS or orfslte power Inaanmneous GD= line brca. Gcnerator trips, bypass 0.valvcs open and mr tor s.ras. Byp.as valve: close after6 seconds. No credit for. this scram or the byass beatsink is taken In the SSAR Chopc r 6 analyisFeCdwater c.omdown _ dies, e en;n;tmOrs fail to MA)Fuel pool cooling lon,
DW cooler% lost__Ck.D tmp trip
Hi1gh diywell pressur Scm(ocei ~ 0.01 (Note 1)CACS (Cont. AtM. Control Ss) -pmw t vent ipolate;FAPCS (Fuel and Aux. Pool Cooling Sys.) isolationFEC condensation begrin%FM pool boiloff begins. -X tubes remain covered>72 hrIsolate high and low conductivity sumps, fission product
___sampline. reactor buildina "VAC exhaust
Low water level Ui Scra _____________ 0.011azow iiLow water level LZ IC drain valve openr (MSIV closure also iniiates) 0,01 (Note 1)
Isolate high and low conductivity sumps, fission product-ampling, reactor buildine HVAC exhaurtDW coolers I.olate
Low w=ite level Li ADS/ODCS initiation. Timed sequential opening of: 4 0.1SRM/4 SRVW/2 DFVP2 Dl:Vda DFV's/6 ODC-injection valves__DW coole'n isolateSmne.cqupilant which isolate on L.2 receives redundlantisplation-sg a!. .. . ..
P rpy G pool head Injection now be•in; .2
Port LOCA radiolytic H2 and FARs (Passive Auocatz)ytc Recombiners) funcdon. 0.2 (Note 2)02 (PAIs arm no: simulated in fuel pemk temperature and
_____ __ _ •minimum water level clcuuationn)P dw C P ww -O.S PSi Vacuumbreaker open ..... 0.3
G=CS pool empties PW ore-stabilized 2.4DW.WW A initiates PCCS flowPCCS condensate returns to ODCS pool. drains to vesselandDW.
Reactor water level falls to Vessel to S/P cqualiznuion line opens. kecps core covered 6.6one meter above top ofcomiquid in DW reaches spillover Inventory added to DW now rturn to SP (then to 9.3 (Note 3)
boles In main vents vesul)-esipnbasi leakage and Pressure rises slowly for 72 bows (defined a end of to 72
sensible heat transer fom DW desin basis)to WW causes adawl •ncrmsof1DWVresvx -_ _ _ _ _ _ __ _ _ _ _ _ _ I_ _ _ _
(1) Scram on high wel presure and level decrease to L2 occur within one minute of the linH break.(2) PARS will actuate as soon as they are exposed to radiolydc hydrogen. estimated to occur within a few
minm of the line brat(3) Incirase of DW level to the spillover holes only occurs V it is assumed that inward flow through fhe bre*
cannot occur. Otherwise. the inventory milled to the DW renims to the 1PV throurh the break.

NEDO.32391, Revision A
Figure 2Z2w. SBRV Passive Safety Systems
2.2-10 "
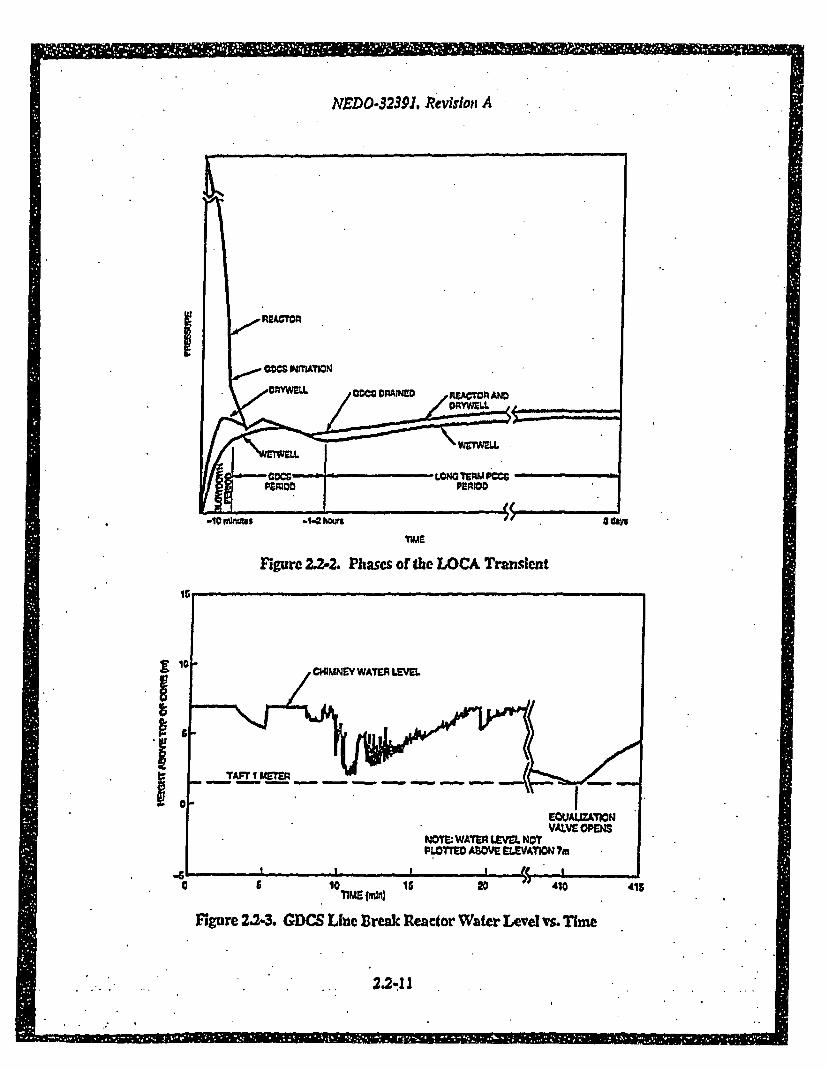
NEDO-3239I. Revislo,; A
I
TME
Figure 2.2-2. Phases of the LOCA Transient
II
Figure 2.2-3. GDCS Lhiu Break Reactor Water L~ele vs. TIme
2.241
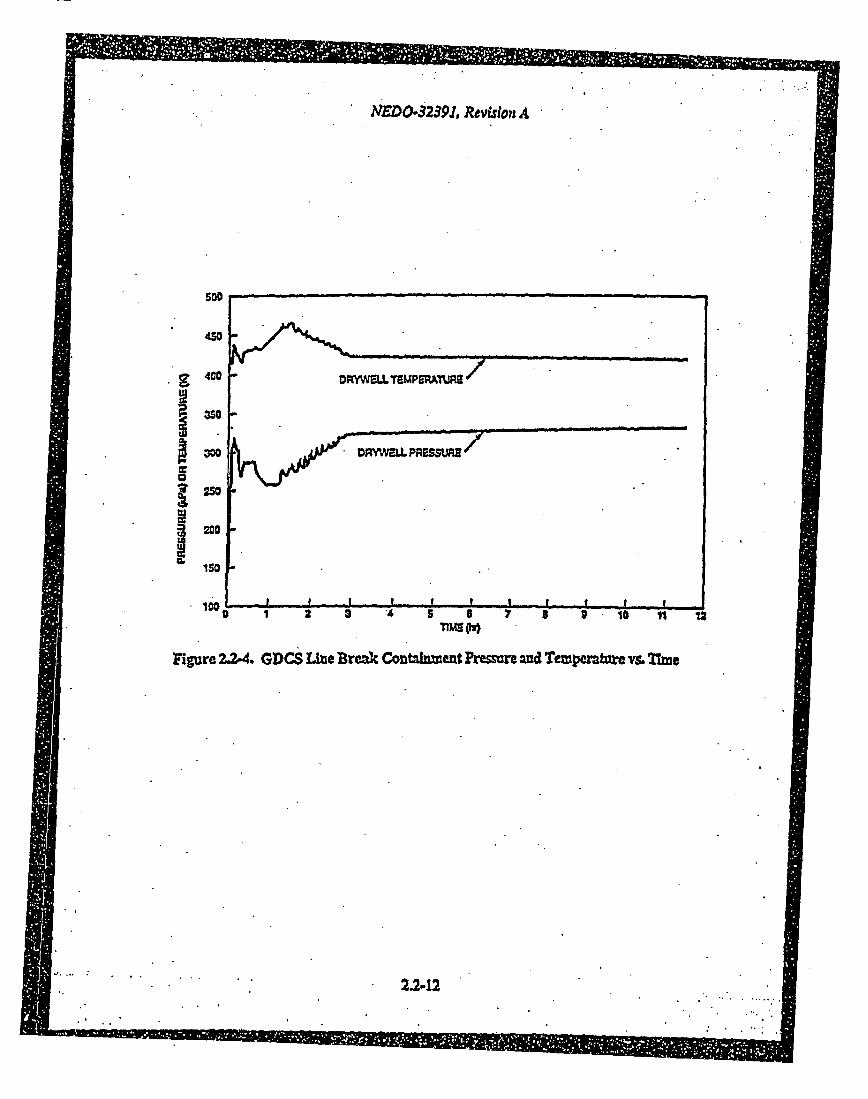
NEDO-32391. Revision A
06
5S0
450
400
250
ISO
Innl
e .! t - .I . f I. I. f r !
Elgurc 2.2A. GDCS Lixe Break Cont3Imiezt Presicre 2nd Tempermtmr v&. Mme2
2.2-12

so
so
140 h
CEM MA PWE
3,
to.
JFigure 2.2-5. GDCS Line Blresk Decay Ifeat ond PCC Power vs. Thne
ON EM - Ul

NEDO.32391, Revision A
OA
M4 0450.CHAMDW~0AVPA1nO
Figure 2.2-6. SBWR Stabflity Design Criteria and Performance
A=oo
3MO
2000
1000
U0 10 '20 30 40 0a so 70
Low Nib"~
Figure 2.2.7. SBWR PowerFlow Map Comparison With Calculated StibilltyLlmHt
2.2-14.

NEDO-3239], Revision A
2.3 Phenomena Identification and Ranking Tables (PIRT).The process of Top-Down analysis and qualification of the performance of the SBWR starts
with the identification of the important physical phenomena. For this purpose, Phenomena
identification and Ranking Tables (PIRT) [6] were developed. This was done by assembling a
team of experts knowledgeable about thermal-hydraulics and transient analysis, and obtaining
consensus on the relative importance of various phenomena. Phenomena were given a rank
between 0 and 9 based on their "importance" as defined in Section 2.2. Table, were developed forsmall break LOCAs, large break LOCAs, operational transients, stability and reactivity insertion
accidents such as control rod withdrawal error and control rod drop. in each case, the importance
of the phenomena was evaluated for each reactor region: lower plenum, core. upper plcnum.chimney, downconmer, containment, etc. For the LOCA events, the tables were finther subdividedinto the blowdown, GDCS and long-erm periods of the transients.
The tables were first condensed to include only the highly ranked phenomena. It was apparentthat for many transients and subregions, the phenomena of importance are the same as for
operating BWRs. As an example, for pressurization transients, the most important parameters are
the nuclear parameters (void, Doppler and scram reactivity), the interfacial shear (void fraction),
subcooled boiling and steam line dynamics. The phenomena that are unique to SBWR are given
primary emphasis In this report. These arc primarily factors affecting the PCCS performance,
GDCS interactions and phenomena associated with natural circulation flow in the core.
The PIRT tables are used for two purposes. First, the capabilities of the TRACG models are
examined to see if all the important phenomena can be treated. Secondly, the qualification database
is examined for completeness against the important phenomena. The second task is discussed inChaptor 5.
2.3.1 Loss-of-Coolant Accident (LOCA)The overall transient consists of three periods: the blowdown period, the GDCS period and
the long-term cooling PCCS period. These periods arc described in previous sections and shown
In Figure 2.2-1. For each of these periods, the important thermal/hydraulic phenomena were listed
and ranked. This was done by experts familiar with BWR and SBWR characteristics and with
transient analysis. The group was interdisciplinary, drawn from several technical areas, such as
SBWR design, methods development, and plant transient analysis. The phenomena wereclassified by reactor and containment region (e.g., lower plenum, core, downcomer, chimney,drywel. wetwell. etc.).
2.3.2 Anticipated TransientsPlant startup and three types of operating transients (pressurization. depressurization. and cold
water transients) arc evaluated. The importance rankings for various phenomena am tabulated byregion. "Importance" is ranked by the influence these ph.-nomena have on the Critical Power Matio
(CPR) and maximum pressure reached in the transient. For plant startup, the key criterion is the
likelihood of large oscillations in the core flow and power. The nuclear parameters and thermal-
hydraulic parameters in the core dominate the pressurization and cold water transients
2.3.3 Anticipated Transients Without Scram, StabilityThese arc considered in determining the matrix of tests aeeded for SBWR performance
analysis in Chapter S.
U
2.3-1I
NEDO-32391, Revision A
3.0 IDENTIFICATION OF SBWR-UNIQUE FEATURES ANDPHENOMENA ,- BOTTOM-UP PROCESS
3.1 IntroductionThis section describes the Bottom-Up process. one of two methods used to develop the tast
and-analysis needs for SBWL It complements the Top-Down process described in Section 2,with which it will be merged in Section 4. This approach compiles. a list of SBWR-uniquefeatures, associated thermam.hydraulic phenomena and supporting TRACG quaffication data. Thepurpose is to evaluate, from the system and component point of view, the adequacy. of the databaseused to qualify TRACG in the areas important to SBWR thermal-hydraulic response.
.................................. .... IM "

NEDO-32391, Revision A
3.2, MethodologyIn order to perform a systematic and thorough review of all systems in the design, the SBWk
System Structure (Figure 3.2-1) was used as a starting point.Each of the 127 SBWR systems was reviewed to determine if the system was unique or had
unique features that do not exist in the BWR operating fleet. Those systems that did not directlyaffect the thermal-hydraulic response of the SBWR were eliminated. System-unique features, the
safety classification of the system, and the MPL number were documented. The principal design
engineers were consulted with respect to the current reference system design and unique features.
as well as References 3. 31. 32 and Tables 2.3-1 and 2.3-2. to determine any new issuesassociated with that unique feature. For ech of the issues, associated imporant thermni-hydraulicphenoin= were identified.
3.2-I
U

I
el I-*& VVR1
MIS
gumre 3M2.. SBWR Product Structure

U
VA
NEDO-32391, Revision A
3.3 ResultsA-discussion of key results by system is provided in the sections below.
3.3.1 RPV and Internals (Bll)Ten thermml-hydraulic phenomena were evaluated in detail.
3.3.2 Nuclear Boiler System (B21)n.hre thermal-hydraulic phenomena were evaluated in detail.
3.3.3 Isolation Condenser System (M32)Eight thermal-hydraulic phenomena were evaluated in detail.
3.3.4 Standby Liquid Control System (C41)Five thermal-hydraulic phenomena were evaluated in detail.
3.3.6 Gravity-Driven Cooling System (ESO).Six thennal-hydraulic phenomena wefe evaluated in detail.
3.3.6 Fuel and Auxiliary Pools Cooling System (G21)Two thermal-hydraulic phenomena were evaluated in detail.
3.3.7 Core (,-Series)In the area of the S3WR core, four issues/phenomena were identified as unique to the SBWM.
3.3.8 Containment (TMO)During the review of the SBWR design, 21 unique containment system thermal-hydraflic
phbeomena were identificd.
3.3.9 Passive Containment Cooling System (TI5)The systematic review of the SBWR design identified 13 thermal-hydrlic phenomena related
to the design of the PCCS.
3.3-1

NEDO-32391, Revision A
4.0 EVALUATION OF IDENTWEIED PHENOMENA ANDINTERACTIONS
The PIRT analysis in Section 2 identificd important phenomena for different types oftransients and LOCAs. These were grouped by the period of the transie:nt and listed separately foreach region of the .reactor vessel and containment, In Section 3. a Bottom-Up process wasemployed to identify SBWR unique design features and associated phenomena and interactions.These were classified according to the SBWR system (e.g., FAPCS, Nuclear Boiler, etc.) wherethe particular feature was found. Following the overall strategy described in Section 1.3. thehighly ranked phenomena from these lists are now combined in this section to yield acomprehensive. composite list of phenomena that need to be considered. The list is composed ofseparate tables for phenomena and interactions for each type of transient (LOCA, operationaltransients, ATWS, etc.). The list of interactions is screened in Section 42. and reduced to a finaltable of phenomena for which data are needed for qualification of TRACG in Section 4.3. InSection 5, these tables will be compared against the Test Plan to confirm that all elements of thetables are covered by tests.
4.1 Composite List of Identified Phenomena and InteractionsThese are also picked up.by the PIRT. The main additions to the PIMT list came from detailed
consideration of the Isolation Condenser units.
I
4.1-1
BMW C I I .

______________________ 1111UE
NEDO-32391. Revision A
4,2 Analytical Evaluation of System InteractionsThe purpose of the system interaction study was to investigate the effect of both active and
paFsive systems which could be available to support Engineered Systems Feature (ES3) systems
during a LOCA; and to determine if interactions between the systems could degrade theperformance of the ESF systems from what it would be if they were acting alone. The studyextends earlier work presented in Chapter 6 of the SSAR (3], which evaluated the effect of thebreak location and of various single failures. A part of this earlier study examined the possibleadverse effect of reverse flow through the Isolation Condenser during an inadvertent opening of aDPV. Additional analysis in Chapter 19 of the SSAR (3] examined use of non-safety gradeengineered systems to prevent core damage.
The present study examines both system interactions which could affect the SBWR primarysystem response. as measured by the fuel temperature and vessel water'level. and systeminteractions which could affect the containment response, as measured by the containmenttemperatmu and pressure. The study was performed using the TRACG code with two differentinput models. System interactions affecting the primary system were studied with the TRACOinput model used for LOCA analysis of the SBWR. which provides a detailed representation of thereactor core. vessel internals and associated systems, but a less detailed representation of thecontainment For system interactions affecting the containment, the TRACO input model forcontainment analysis wbs used. This input model provides a more detailed representation of thecontainment and its systems but a less detailed reactor pressure vessel model. Both input modelshave been compared to assure that they predict similar global response behavior of the reactorpressure vessel and containment.
The use of analysis methods is a practical and effective way to evaluate system interactions.The TRACG code and the input models for the primary system and containment which werediscussed above include detailed .modeling of the important passive and active systems available inthe SBWR and can simulate the interactions between these systems during various accidentscenarios. This makes it possible to screen a large number of possible system combinations andaccident paths to identify those system combinations and accidents most likely to produce adverseinteractions. Based on this type of study, final confirmation of interaction effects can then- beobtained from integral tests.
4.2.1 Accident Scenario DefinitionThe systems selected for the study were those that would likely be available during a LOCA
and which could produce adverse interactions with the safety grade engineered systems for coreand containment cooling.
4.2.2 Results from the Primary Systems Interactions StudySeveral different break locations were considered for the primary system interactions study.
4.2.3 Results from the Containment Systems Interactions StudyThe containent system interactions study investigated interactions between available safety
grade engineered systems as well as interactions of these systems with other systems which couldbe available for containment cooling without a loss of power.
U
4.2-1

NEDO-32391, Revision A
4.2.4 Summary of System Interaction Studies,Lhe system interactions considered in this study have included those which were consideaed
the most likely to occur when some form of external power was available and wbdch were notclearly beneficial to the opeaion of the safety grade engineered safety systems.
4.2-2
- M11M - - 11 0 =Nffiý 1ý ý

U
NEDO.32391, Revision A
4.3 Summary of EvaluationsThis section summarizes the results of screening the phenomena of Section 4.1, primarily in
the area of interactions, as a result of the studies of Section 4.2. This constitutes the final step indetermining the needs for test dam for TRACG qualification. These needs are detailed in Sections4.3.1 and 4.3.2 for LOCA and Transients, respectively. Section 4.3.3 covers ATWS andstability. Section 5 then presents the results of comparing these needs against the test plan.
4.3.1 TransientsAll issues but one have been carried forward to Section 5 as needs for TRACG qualification.
4.3.2 ATWS and StabilityFor ATWS, the majority of the phenomena are captured either by the transient PIRT
(neutronic and thermal hydraulic issues. Isolation Condenser. etc.) for the reactor parameters or bythe containment PIRT for the SRV discharge to the suppression pool (critical flow, poolstratfication and heatup, etc.).
U
4.3-1

N.EDO-32391, Revision A
5.0 MATRIX OF TESTS NEEDED FOR SBWRPERFORMANCE ANALYSIS
The important phenomena and interactions from Section 4 were compared with the originalTest Plan as it existed when this study began. It ws found that most of the identified effects werecovered by tests which could be used to qualify TRACO. In a few cases, additional testing orqualification was proposed and Incorporated into the Test Plan. The tests have been divided into(1) Separate Effects Tests, (2) Component Performance Tests. (3) Integral Systemn Tests, and (4)Operating Plant Data. The first two types of tests are suitable for model development, the lattertwo for checking the overall performance of the code.
5.1 Separate Effects TestsThe facilitie are listed in Appendix A. where the types of tests, test purpose and data available
from each ae also briefly described.
5.1-1
4 no U - - F

I
IIFIErrIErEf~-ur----NEDO-32391, Revision A
5.2 Component Performance TestsA large number of phenomena related to the blowdown -and rofill proccsses in the lower
plenum, bypass and core are covered by the component tests. Parallel channel effects and
separator characteristics are also part of this database.
B
5.24i

NEDO-32391. Revision A
5.3 Integral System Response TestsIntegral system response tests model overall behavior of a facility subjected to transients
simulating specific accidcnts or transient events. Tests are performed on a scaled simulation of the
rcactor sytem.
5.3-1
lmý ý -111 N I Mol a

U
NEDO.32391, Revision A
5.4 Plant Operating DataThe performance of the S3WR is similar to that of other BWRs for operational transients.
Plant data are very valuable in validating code performance for complex systems Involving an
interplay betvveen tcrrmal hydraulics. neutron kdnetics and control system response.
S.4-.1
I I I - ýIM - -

NEDO.32391. Revision A
5.5 Summary of Test CoverageThe previous sectiomn specified the test facilities and BWR plants from which data have been
used (or will be used) for TRACG qualification. This information was tabulated for each of the
identified important phenomena, by category of tests (separate effects, component performance,etc.).
I
5.5-1

N
uii~rni~uJinuu -- __
NE-DO-32391, Revision A
6.0 INTEGRATION OF TESTS AND ANALYSIS
This section examines the tasks necessary to complete the qualification of TRACG. Figure
6.0-1 shows the "Road-Map" of how the new and existing test data support SBWR certification.
6.1 TRACG Qualification Plan. Details on the tests and TRACG runs to be performed can be found in the Test Plan in
Appendix A. The Analysis Plan in Appendix A shows specifically which tests will be used for
blind predictions. and which tests will be used for post-test analysis.
U
6.1-i
"Em SWIM IMPRENWHINS

A
II mui~
NEDO.32391. Revision A
6.2 Use of Data for TRACG Model Improvement and ValidationThe TRACG computer code has been qualified to Level 2 (verified, production) status at GE.
NF. Thus, the code configuration is controlled, and the models and the results of validation testing
have been reviewed and approved by an independent Design Review Team. In the developmentprocess, the separate effects and component data were used for model development and
refinement. These data also provided guidelines for the nodalization which was used for all the
SBWR calculations. The new data and the results of the post-test analyses will be used in the sameway. If changes are necessary to the TRACO models, a new version of the code will be created
and brought to controlled Level 2 status under the GE-NE quality assurance procedures for
computer codes. If changes in the nodalization are indicated, calculations affected by the changeswill be redone and reverified.
U
6.2-1

I
SEPPAEfrETS CMMIE ItTEGRL SYTEM
PERFORUCH QUL(FICAIM"AN
IVtFCT CNUCTN *IEIDM ITAM
1~Igre 604.Techoloy Bais ry SWR Dsig
.1. ..

NEDO-32391, Revision A
7.0 SUMMARY AMD CONCLUSIONSThe Test and Analysis Program Description (TAPD) systematically defined tests and analysis
needs using Top-Down and Bottom-Up approaches to identify key phenomena, issues and
interactions between phenomena and systems (Sections 2, 3. and 4 and Appendix C). These needswere compared with the existing test plan and the existing TRACG qualification plan, andmodifications were made where necessary to fill in gps in the database and the TRACGqualification base (Sections 5 and 6). The Test and Analysis Plan defined the remaining activitiesfor closure (Appendix A). The scaling of the test facilities has been addressed quantitatively(Appendix B). This document supersedes previous submittals with regard to test objectives, teaconditions, data use. and anticipated test analysis.
Several changes in the test and analysis programs resulted from the study documented here. Anumber of tests were added. In several instances, tasks to b. performed have been defined in moredetail, and the focus and data usage from some facilities has been modified. The followingsummaris the changps:
Test Plan" GIST: No changes in testing. Data usage focused on GDCS flow and GDCS initiation
time.* GIRAFFE: No changes in testing. Use of data focused on specific Phase I and Phase 2
tests. Dam usage changed from primary qualification of TRACG to support use." PANTHER/C: No changes in testing or dat usage." PANTHERVIC: Program added to list of tests required for certification. No changes in
testing or dam usage." PANDA: Program added to list of tests required for certification. Test matrix expanded
from two to nine transient tests. Program becomes primary containment and systemsInteraction data base.
Analysis Plan" GIST: Seven additional tests identified for TRACG analysis." PANTHRS/PCC Fifceen specific runs identified for TRACG analysis.* PANTHERSIIC: Six specific runs identified for TRACM analysis." PANDA. All six steady-state tests and nine LOCA tests identified for TRACM analysis." OTI-ER TESTS: TRACO analysis of tests from five other tests and one operating plant
experience to address specific identified qualification needs.
The TAPD specifically addresses the requirements of 10OC 2.47 by establishing that atechnology basis (a combination of test data, analysis and plant dam) exists for the SBWR safetyfeatures, for interdependent effects between safety features, and for qualification of the TRACOcode used for SBWR safety analysis. Specifically:
10CMR52.47 requires that "The performance of each safety feature of the design has beendemonstrated through either analysis. appropriate test programs, experience, or acombination thereof." The studies summarized in Sections 2, 3 and 4 defined- thephenomena important to SBWR safety in two independent ways. These are merged inSection 5 where the testing and experience bases applicable to each are shown. Eachimportant phenomenon is covered by at least one separate effects test, component test,integral systers test, or operating racotor datum.
U
7.0-1 "

Tm miiii mmmi. iI~ mu m.i i -
NEDO-32391, Revision A
10 CFRS2.47 requires that "Interdependent effects among the safety features of the designhave been found to be acceptable by analysis. appropriate test programs, experience, or acombination thereof." The studies summarized in Section 4 and Appendix C identified theimporn interactions, For most of these, analyses or tests already planned suffice to showthe effects arc negligible or bounded. For a few, additional teas were judged to benecessary. These have been added to the SBWR program.
*ICFR52.47 requires that "Sufficient datm exist on the safety features of the design toassess the analytical tools used for safeW analysis over a sufficievt range of normaloperating conditions, transient conditions. and specified accident sequences. includingequilibrium core conditions." The matrix of tests and operating plant data shown inChapter 5 identifies elements which have been used to date, elements in which existing testdata will be used, and elements In which forthcoming test data will be used to qualify theSBWR analytical model, TRACO. These are collected in Section 6 to show the compositeTRACG qualification plan.
GE believes that if the overall TRACO qualification plan described in Section 6, and theSBWR-specific test programs (and associated TRACG analyses) described in Appendix A. arecompleted with no major surprises, it will be possible to conclude that the provisions of10CFM2.47(bX2Xi)(A)(I), (2). and (3) havI" been satisfied.
7.0-2

NEDO-32391, Revision A
8.0 REFERENCES(1] TRACG Computer Code Model Description, J.G.M. Andersen. Md. Alamgir, Y.K.
Chcung, L.A. Klebanov. J.C. Shaug. NEDE-32176P, Licensing Topical Report, January1993.
[2] TR4CG Computer Code Qualtflcation. J.G.M. Andersen. M.D. Mangir. J.$. Bowman.Y.K. Cheung. L.A. Ylebanov. W. Marquino, M. Robergeau. D.A. Salmon, J.C. Shaug,B.S. Shiralkar. F.D. Shum. K.M. Vierow, NEDE-32177P. Licensing Topical Report.January 1993.
[3] SBWR Standard Safety Analysis Report, 25AS113. Rev. A.(4] Quantifying Reactor Safety Margins, NUREG/CR/5249. EGO-2552, Rev. 4.
(53 Implementation of TR4CG for Licensing Analysis. J.L. Rash to R.C. Jones Jr. (NRC.NRR Chief Reactor Systems Branch). MNO 042-92 and JSC-92-010. March 9.1992.
[6] Quantifying Reactor Safety Margins. BE. Boyack et. al. Nuclear Engineering andDesign (Parts 1.4)Q 119. Elsevier Science Publishers B.V. (North Holland), 1990.
(7] Application of TRACG to SBWA Licensing Safety Analysis, NEDE-32179P. H.T. Kim,Fcbruary 1993.
(8] AEOD Concerns Regarding The Power Oscillation Event at LaSalle 2 (BWR.5),USNRC, AEOD Special Report S03. 1988.
(9] Leibsradt Stability Tests During Startup Testing (contained in Reference 5).
[10] Stability Investigations of Forsmark.1 ZWR, B. Andersson. et. al.. InternationalWorkshop on BWR Stability. October 1990.
(113 Vermont Yankee Cycle 8 Stability and Recirculation Pump Trip Test Report, NEDE-25445, August 1982.
(123 ODYSYOJ/ODYSY02 Qualification Report, NEDE-30227. (includes Peach Bottom-2Stability Test Data), July 1983.
(13] The Startup of the Dodewoard Natural Circulation BWR - Experiences. W.H.M.Nissen et. al.. N.Y. GKN. Netherlands, Waalbandijk 112a, 6669 MG Dodewaard (ANP'92). Tokyo. Japan (Detail measurements are contained in OKN-report 92-017/FY/R),October 25-29. 1992.
[14] Stability Monitoring of a Natural.Circulation-Cooled Boiling Water Reactor, T.RJJ.van der Hagen, Thesis, Delft Univ. of Technology, The Netherlands, 1989.'
[15] Measurements at Various Pressures. at the Dodewaard Natural Circulation BoilingWater Reactor in Cycle 23. T.HTJJ. van der Hagen. GKN-Report 93-023/FYiR, 1993.
[16] Hatch Unit 2 Two-pump Trip Test. November 18. 1978 (data contained in Reference S).
[17] Hydrodynamic and Seat Transfer Measurements on a Full-Scale Simulated 36 RodBWR Fuel Element with Non-Uniform Axial and Radial Heat.Flux Distribution, 0.Nylund, et. al., FRIGG-4. ASEA-ATOM, December 1970.
(18] ABVIR Horizontal Vent Containment Tests, NEDC-31393 - SS Test Series.
[19] MIT and UCB Separate Effects Tests for PCCS Tube Geometty, "Single TubeCondensation Test Program". NEDC-32301.
[20] Pressure Suppression Test Facility (PS7F), NEDE-13377.[21] MSC/AASM Y Manual Version 67 Macneal-Schwendler Corporation. Los Angeles.
CA.
9.0-1
1
m

I'
NEDO-32391, Revision A
(22] ABWR Horizontal Vent Containment Tests. NEDC-31027 -IFS series.
[23] Steam Purge Clearing Tests, NEDE-28853.
[24] 1/3 Area Scaled - Single Vent Row Tests. NEDE-21596P.
[25] 1/9 Area Scaled- 3 Vent Row Tests, NEDE-24720P.
[26] JSBWR Phase 2 Report. EBWR and VK50 Tests
[27] CRIEPI Tests, Thermo-Hydraulic instability of natural circulation BWVRs (Explanation on
instability mechanisms at startup by homogeneous and thermodynamic equilibrium model
considering flashing effect.) by Fumio Inada and Tornio Ohkawa, Komas Research
Laboratory, Central Research Institute of Electric Power Industry (CRIEP). Paper
preen.ted at 1994 Conference in Italy.
[28] BWR 5- 1/6 scale Boron Mixng Tests, NEDE-22267.
[29) ABWR - 1/6 scale Boron Mixing Tests, NEDC-30326.[30] Document No. BN-TOP-3. Beechtl Power Corp. San Francisco, CA. August 1975.
[31] Design and Analysis Similarities Between the ABWR and SBWR, NEDC-32231,December 1993.
[32] Scaling of the SBWR Related Tests, NEDC-32288. G. Yadigaroglu. July 1994.
133] Sixteen-Rod Heat Flux Investigation, Steam-water at 600 to 1250 psia. B. Janssen.
GE.[341 7he Effects of Lengths and Pressure on the Critical Heat Flux for a Closely Spaced 19.
Rod Bindle in Forced Convective Boiling. Dept. of Chem Eng.. Engineering ResearchLab Heat Transfer Research Facility, Columbia University, NY.
[35] NRC Requests for Additional Information (PAls) on the Simplified Boiling Water
Reactor (SBWR) Design. Letter MFN No. 078-9.4 from PW. Marriott (GE) to Richard
W. Borchardt (USNRC). May 31. 1994.
[363 Quantifying Reactor Safety Margins - Application of Code Scaling Applicability and
Uncertainty Evaluation Methodology for a Large-Dreak Loss-of-Coolant Accident. B.Boyack. et a).. NUYEG/CR-5249, 1989.
[373 Application of the TRACG Model to SBWR Licensing Safety Analysis. ILT. Kim et aL.NEDE-32178P (Licensing Topical Report). February 1993.
(38] Mark II Pressure Suppresion Test Program Phase Ii and 11 Tests. NEDE-13442?-01,May 1976. Mark HI Pressure Suppresion Test Program Phase II and IWl Tests. NEDE-
13468, October 1976.[39] Hierarchical, Tvo-Tiered Scaling Analysis, Appendix D to An Integrated Structure and
Scaling Methodology for Severe Accident Technical Issue Resolution, Nuclear
Regulatory Commission Report. NURMEICR-5809. EGG-2659, November 1991.
[40] GE COMPASS datba urn d'ated July 1994.
[41] Gz Mstr File Number MNFN 042-92-92, Letter J.L. Rash (GS) to R.C. Jones (NRC),
Implementation of TPACG for Licensing Ana*ls. March 9. 1992.
[42) GIST Final Test Report, SBWR Program Gravity.Driven Cooling System Integrated
Systems Test, GEM-00850, October 1989.
[43) GIRAFFE Passive Heat Removal Testing Program. by IKM. Vierow, NDC-32U15P,
June 1993.
.8.0-2

NEDO.32391, Revision A
[443 Test Report for SBWR Depressurization Valve Operational and Flow Rate Test,WYLE Report #41152-0. September 1990.
[45] Startup of the Dodewaard Natural Circulation Boiling Water Reactor, Hagen. T.HJJ.van der, Karuza, J, Nissen, W.H.M., Stekelenburg, AJ.C., Wouters, J.A.A., GKN
Report 92-017/FYIR, 1992.(46] Full-Scale Mark III Tests. Test Series 5707, NEDE-21853.P, August 1978.
[471 Mark III Confirmatory Test Program, 1/113 Scale Condensation and StratificationPhenomena. Test Series 5807. NEDE-21596P. March 1977.
[48] A Comparison of the RELAP Simulation of Mark III Suppression Pool ThermalStratification with Data from the Pressure Suppression Test Facility, NEDE-21957P,September 1978.
[49] Transient Behavior of Natural Circulation for Boiling Two-Phase Flow (2nd Report:Mechanism of Geysering), M. Aritoini. et a!.. Transactions of First JSMWASME Joint
International Conference on Nuclear Engineering (ICONE-1), Tokyo, Japan, pp. 87-94,
November 4-7, 1991.
8.0-3
11 0 1 ww-ý - - --- --

NEDO.32391, Revision A
Appendix A- Test and Analysis Plan (TAP)
A.1 IntroductionThe study described in the main body of this document culminated in Table 6.1-1. which
identified the qualification in addition to that presented in Reference [2] which is necessary forTRACG to be applied to SBWR safety analysis. This appendix identifies those specific tests andanalyses that will be performed to meet the identified supplemental needs.
The overall goal of the SBWR Test Program is to provide a sufficient data base to supportcertification of the SBWR as a standard design. Consequently. the overall scope of the testprogram goes beyond establishment of the TAMCG qualification database, in that demonstrationtesting of concepts unique to the SBWR, or equipment having design requirements not previouslyanalyzed or tested. is also included. This testing is also described in this appendix. In manycases, the same test data are used for both applications.
Section A.2 provides an overview of the philosophy used in determination of specific test andanalysis runs, definition of test types. and a overview of the test effort. Section A.3 presents theTest and Analysis Plan. The following information is provided for each identified test:
Test Plan" Test matrices'defining test conditions" Test objectives* Description of how the test data meets the specified objectives
Analysis Plan" Test runs identified for TRACM analysis" Description of how the identified comparisons between test and analysis meet the
qualificaton needsThis document superedes previous submittals with regard to test objectives, test conditions.
data use, and anticipated test analysis.
A.2 Test and Analysis PhilosophyA.2.1 Test Types
The overall goals of the SBWR Test and Analysis Program are, to be met by several types oftesting, in several different facilities, world wide. Testing is divided into:
* Thermal.Hydraulic Testing - provides data necessary for qualification of TRACG andfor demonstration of the concepts of passive safety systems design. Tbermal-hydraulictesting Is further subdivided into (1) steady-state and separate effects tests, (2) componentperformance tests, (3) integral systems tests, and (4) concept demonstration tests.
* Component Demonstration Testing - provides dam on the capability of specificequipment to meet its design objectives.
A.2.2 Test OverviewSBWR thermal-hydraulic testing is summarized in Table A.2-1. The test progrm consists of
197 steady-state test conditions, 14 transient perormance demonstrations, and 38 Integral sstemstests. Section A.3.1 describes each of the four facilities (PANTHERS, PANDA, GIST, andGIRAFFE) in which these tests wilt be or have. been performed, and includes specific testobjectives, test matrices and descriptions of how each of the test groups addresses the testobjectives. Additionally.,those test conditions chosen for analysis with TRAMC arc identified and
I
A-1

~~~~~1~~~_________________
NEDO-32391, Revision A
cross-referenced to the qualification needs. Section A3.1.6 also gives an overview of other datathat will be used for TRACO qualification beyond the qualification described in [2].
SBWR component performance tests are described in Section A.3.2. including testing of thePCC and IC heat exchanger components, dcpressurization valves (DPVs), and vacuum breakervalves ('I).
A.2.3 Test ApproachThe philosophy of testing is to focus on those featuresand components that are SBWR-timque
or performance-critical, and to test over a range that spans and bounds the SBWR parameters ofimportance. In general, TRACG is used to predict the SBWR parameter range over a range ofaccidents and transients, and then that range is bounded in the test matrix. Some SBWR tests are
peroredin sald configuration.. In this case, the values of the imporatpames are scaledto be consistent with this philosophy. This approach is discussed in Reference 32 and AppendixB.
Additionally, it is the program philosophy to test in multiple scales wherever possible. Intheae cases, initial conditions for the vaious tests have been made as similar as possible. Multiplescale testing is useu. since it validates the scaling approach and allows a better understanding ofthe thermal-hydraulic phenomena involved.
A comprehensive Licensing Topical Report will be submitted documenting the testing, dataanalysis, and conclusions, following completion of all testing.
A.2.4 Analytical ApproachThe analytical approach to be used is consistent with that previously documented in the
TRACG Qualification Licensing Topical Report. NEDE-32177P [2). Briefly, the. approach is tochoose a representative sampling of test data which comprise separate effects. componentperformance. and integral systems effects, and to perform either pro-tent or post-test analysis usingTRACG. Tests arc chosen for analytical prediction based on their adequacy to demonstrate modeprediction capability over the range of predicted SBWR conditions. Sufficient tests are chosenfrom certification data to establish model adequacy. Additional tests have been chosen fromsupporting data to confirm the certification predictions. over a wider range of test conditions, or atintermediate points.. It is planned to produce a number of "double blind" pr-test analyses for those certification
data exprnnts not yet performed. Double blind indicates that the analyst has no information oneither the results or the exact initial conditions of the experiments. These predictions are based onthe as-designed facility configurations, and will be verified. They wl be documented andtransmitted to the NRC prior to Initiation of matrix testing. (This has already been done for thePANTHERS PCC thermal-hydraulic tests (35].)•
Following completion of individual tests, additional test runs will be analyzed with TRACOand compared with the test results. These post-t6st analyses will be performed with the analysthaving knowledge of the test results, but will utilize the same nodalization and modeling as the"doulite blind" predictions, corrmed, if necessary, to reilect facility as-built geometry and theactual initial conditions. The objective is to establish the adequacy of the TRACG model in thisapplication. All input decks will be verified.
TRACG modeling or nodalization changes are not expected. but will be made if deemednecessary following an assessment of TRACG predictive capability.
I
.A-2

NEDO.3239J. Revision A
A.3 Test and Analysis PlanA.3.1 Thermal-Hydraulic TestsA.3.1.1 PANTHERSIPCCA.3.1.1.1 Test Description
PANTHERSI/PCC (Passive Containment Cooling) testing is being performed as ajoint studyb•, GE, Ansaldo. ENA and ENE at Societa Inforniazoni E~sp.ernzc Termoidrauliche (SIET) in
Psacenn. Italy. The test facility consists of a prototype PCC uit, steam supply, air supply. andvent and condensate volumes sufficient to establish P.C thermal-hydraulic performance. Boththermal-hydraulic and component structural demonstration tests will be performed in this facility.This sertion covers the thermal-hydraulic portion of the testing; component structural performancetests are covered in Section A.3.2.I.
The PCC condenser being tested is a full-scalc, two.module vertical tube heat exchangerdesigned and built by Ansaldo. Figure A.3-1 is an outline drawing of the beat exchangerassembly. It should be noted that the heat exchanger is a prototype unit. built to prototypeprocedures and using prototype materials. Three heat exchanger units of the type being testedwould be found in a SBWR. The PCC is installed in a water pool having the appropriate volumefor one SBWR PCC assembly.
Fig=r A.3-2 Is a schematic of the PANTH2ER/PCC facility. Primary instrurnentation is thatrequired to ascertain heat exchanger themal-hydraulic performance. by performing mass andenergy balances on the facility. Additionally. four heat exchanger tubes are instrumented in such away that local beat flux information may be obtained.
A.3.1.1.2 Test ObjectivesThe test objectives of the PANTHERSI•CC Test Program are:
I. Demonstrate that the prototype PCC heat exchanger is capable of meeting its designrequirements for heat rejection. (Component Perform.iwe)
2. Provide a sufficient database to confirm the adequacy of TRACG to predict the quasi-steady-heat rejection performance of a prototype PCC heat exchanger, over a range of airflow rates, steam flow rates, operating pressures, and superheat conditions, that span andbound the SBWR range. (Steady.State Separate Effects)
3. Determine and quantify any differences in the effects of noncondensable buildup In thePCC heat exchanger tubes between lighter-than-steam and heavier-than-steam gases.(Concept Demonstration)
A.3.1.1.3 Test Matrix and Data AnalysisSteady-State Performance Tests
The majority of the PANTHERSACC testing is steady-state performance testing. For thesetests, the faclity is placed in a condition where steam or air-steam mixtures are supplied to thePCC, and the condensed vapor and vented gases are collected. AD inlet and outlet flows aremeasured. The condensate is returned to the steam suply. and the vented gas is released to theatmosphere. Once steady-state conditions are established, data are collected for a period of15 miutes. The time-averaged data are reported and analyzed.
Table A.3-Ia shows the PANTHERS/PCC Steady-State Performance Matrix for Steam-OnlyTests. Thirteen test conditions are included.
A-3 *

NEDO-32391o Revision A
Test Conditions 37 through 43 (Test Group P1) will be used to determine the baseline heatexchanger performance over a range of saturated steam flow rates without the presence ofnoncondensable _ass. Test Group P1 data will be compared with design requirements tomeet Test Objective 1. T est Conditions 44 through 49 (Test Group P2) address the effectof superheat conditions in the inlet steam. Test Conditions 38, 44, 45. and 46 may be usedto establish the effects of superheat at a relatively low steam flow condition, while TestConditions 41, 47, 48, and 49 will give the same information at a steam flow. rate nearrated conditions,
Table A.3-1b shows the PANTH.RS.PCC Steady-State Performance Maltix for Air-SteamMixture Tests (10 individual test conditions are specified). As noted previously, the independentvariables are steam mass flow rate, ir mass flow rate, steam superheat conditions, and absoluteoperating pressure. Figure A.3-3 shows the relationship between the steam and air flow ratesspecified for. PANTHEPS/PCC testing and the SBWR expected range.
. Test Conditions 9, 15. 18, and 23 (Test Group P3) will be used to compare heat rejectionrates over a range of air flow rates to the saturated, steam-only condition determined fromTest Condition 41 in the pure steam series. Holding steam flow constant at near ratedconditions, these tests yield the effect of air on the condensation process.
- Test Conditions 2. 13, 16. 17, 19, 22, and 25 (Test Group P4) supplement Test GroupP3, in that they define condensation performance at the extremes of ibe SBWR air/steammixture ranges, and at several intermediate points. These tests will be used to quantifynoncondensable effects at off-rated conditions. They will be compared to the appropriateTest Conditions in the P1 group.
- Test Conditions 35 and 36 (Test Group P5) further supplement Test Group P4 byextending the effect of noncondensable gases over the superheated steam range. Thesetests can be compared to Test Conditions 48 and 49 to establish the effect of air content atthe same superhbet condition, and to Test Condition 23 at the same air flow, but withsaturated steam.
Test Conditions 1. 3, 4, , 6. 7. 8, 10, 11, 12. 14, 20, 21, 24. 31. 32, 33. and 34 (TestGroup P6) are lower priority tests. They may be run to supplement the previouslyidentified tests by increasing the data density within the already established air/steam flowmap.
Transient Test ConditionsPANTHERS/PCC transient tests will be used to establish noncondensable buildup effects and
PCC pool water level effects. They are not intended to be systems transient tests.
Table A.3-lc shows the PANTHERSIPCC noncondensable buildup test matrix. Six testconditions are specified as Test Grou P7. In these test conditions, steam will be supplied at aconstant rate, and steady-state conditions established, similar to what was done in the steady-stzteperformance tests. Air. helium, or air/helium mixtures will then be injected into the steam supply,with the vent line closed and the transient degradation in heat transfer performance wil bemeasured, as a fimcton of the total noncondonsable mass injected.
Tests Conditions 50 and 51 provide a baseline condition with air as the onlynoncondensable. Air is similar to nitrogen in molecular weight, and is heavier than steaTest Conditions 75 and 76 are repeats of Test Conditions 50 and 51, but utiliz helitum asthe noncondensable gas instead of air. Helium is lighter than steam. and will mix in amanner simila to hydrogen. The results of these four tests can be compared to establshperformance differences between lighter-than-steam and heavier-than-steam gases as they
U
A-4
U U.m !~~zu!L m ~

I NEDO-32391. R~evision A
build up in the heat exchanger tubes. Test Conditions 77 and 78 can be used to evaluate theeffects of a combination of air and helium concurrntly flowing into the heat exchanger.
- Test Group P7 data will be evaluated to mnct the requirements of Test Objective 3.
Table A.3-ld shows the PANT.HERS/PCC Pool Water Level Effect Test Matrix. Three testconditions arc specified as Test Group PS. In these test conditions, steam and air/steam mixtureswill be supplied to the PCC heat exchanger. and steady-state conditions established, similar to thesteady-state performance tests. In these tests, however, the water level in the FCC pool will beallowed to drop and the PCC tubes to uncover. Both the PCC pool level and the PCC heatrejection rate will be monitored as a function of time.
- Test Conditions 54, 5. and 56 will establish the effects of water level in the PCC pool fora range of ste=m and aidsteam supply rates to the PCC. Data from Test Conditions 54. 55,and 56 may be compared to Test Conditions 41. 15. and 25, respectively., to obtain theeffects of lowered water level on condensation performance. Test Conditions 54 and 55may be compared to establish the cffect of air content on the rate of pool boiloff.
- Test Groups PI through PS, P7 and Pg provide a database for TRACG qualification andmeet test objective 2.
A.3.1.1.4 TRACG Analysis PlanTable A.3-2 lists those PANTHERS/PCC tests that will be analyzed with TRACO. cross-
referenced to the qualification needs. Fifteen TRAMC runs are included in this group. which isintended to demonstrate the capability of TRACG to predict the heat rejecton rate of the PCC heatexchanger over a wide range of conditions. The focus will be on rated conditions, with thequalifiation points also established near the extremes of the SBWR range. Twelve of thequalification data points come from the steady-state performance test matrix (Test Groups PIthrough PS). and the remaining three from the transient group (two from P7 and one from PS).
Figu•r A.3-4 illustrates the locations of the ten saturated condition steady-state TRACGQualification Points within the overall PANTHRS/FPCC steady-state test perfornance test matrix.Tho remaining two conditions arc superheated. and cannot be shown on this figure.
Analysis results will be compared with test data as defined in Table A.3-2. For the steady-stte saturated and superheated steam conditions, the assessment of adequacy will be made on thetotal heat rejection rate and PCC pressure drop. For air/steam and helium/steam mixtures, thedegradationfactor. defined as the ratio of the heat rejection rate in the noncondensable case to thatin the pure steam case, will be the figure of merit. The aidsteam mixture data are taken at fivedifferent pressures. The degradation factor will be based on the air/steam mixture case having theabsolute pressure nearest to the pure steam ease:
PFre Steam Condensation - Analysis -of Test Conditions 41 and 43 demonstratesTRACO capability to predict pure saturated steam condensation rates at and above ratedconditions. Test Condition 49 addresses superheat in this state.Air/Steam Mixtures- Analysis of Test Conditions 9, 15. 190, and 23 addresses the effectsof noncondensable mass frmcton at rated steam flow conditions, over the complete range ofpotential air fractions. Test Conditions 2 and 22 address the effects of air in the low steamflow range, but at the limits of air flows. Test Conditions 17 and 19 arm in the intermediaterange. Test Condition 35 addresses superheat effects.Noneonde ablekDensty- Analysis of Test Conditions $1 and 76 addresses the buildupof noncondensables in the PCC tubes, and will be predicted on a transient basis. TestCondition 51 uses air and Test Condition 76 uses helium.
A-S
I

TIFUTU1~w~ -- ___ _______
NEDO-32391, Revision A
PCC Pool Level - Transient analysis of Test Condition 55 addresses the capability ofTRACG to predict the effects of PCC pool water level.
A.3.1.2 PANTHERS/ICA.3.1.2.1 Test Description
.PANTHERS/IC (Isolation Condenser) testing will be performed at Societa Informazioni' Esperieaze Termoidrauliche (SIET) in Piacenza. Italy. The tests will be performed in the samefacility used for the PANTHERSIPCC program, but using several pieces of different equipment. inorder to better simulate the performance environment of the IC. For the IC testing, the facilityconsists of a prototype IC module, a steam supply vessel which simulates the SBWR reactorvessel, a vent. volume, and associated piping sufficient to establish IC thermal-hydraulicperformance. Both thermal-hydraulie, and component demonstration tests will be pedormed duringthese tests. This section covers the thermal-hydraulic portion of the testing; componentperformance tests are covered in Section A.3.2.2.
The IC being tested is one module of a full-scale, two-module vertical tube heat exchangerdesigned and built by Ansaldo. Only one module unit is being tested because of the much higher
energy rejection rate of the IC relative to the PCC unit, and inherent limitations of facility and steamsupply size. Figure A.3-5 gives an outline drawing of the heat exchanger assembly. Like the PCC
unit, the IC is a prototype unit, built to prototype procedures and using prototype materials. Six
modules (three heat exchanger units) of the typ"e being tested are used in the SBWR The ICis
installed in a water pool having ona half the appropriate volume for one SBWR IC assembly.
Figure A.3-6 is a schematic of the PANTHERS/IC facility. Primary instrumentation is that
required to ascertain heat exchanger thermal-hydraulic performance, by performing mass and
energy balances on the facility.
A.3.1.2.2 Test ObjectivesThe test objectives of the PAWHERVIC Ten Program are:
1. Demonstrate that the prototype IC heat exchanger is capable of meeting its designrequirements for heat rejection. (Component Performance)
2. Provide a sufficient data base to confirm the adequacy of TRACO to predict the quasi-steady heat rejection performance of a prototype IC heat exchanger, over a range of
operating pressures that span and bound the SBWR range. (Steady-State Separate
Effects)3. Demonstrate the startup .of the IC unit under accident conditions. (Concept
Demonstration)4. Demonstrate the noncondensable venting capability of the SBWR IC design, and
condensation restart capability following venting. (Concept Demonstradon)
A.3.1.2.3 Test Matrix and Data AnalysisSteady-State Performance Tests.
As for PANT S/PCC, the =mjority of the IC tests are steady-state performance tests.
Table A.3.3a provides the PANTHERS/IC Steady-State Performance Test Matrix. Ten testconditions are specified. For these tests, the steam generator and IC module will be pressurizd toan inlet pressure of 8.618 MPa. and the IC drain valves opened to initiate IC operation. When the
A-6 I
-- ---- 11 I'mm PJ a M = m 6 1 1 Nfflý

NEDO.32391, Revision A
steam generator pressure has reached desired test condition inlet pressure. the facility will bestabilizzd at that pressure, and heat transfer performance data taken for a period of between fifteenminutes and one-half hour. The time averaged steady-state data will be reported and analyzed.
- Test Conditions 2 through II are identified as Test Group 11. These data will establish theIC heat rejection rate as a function of inlet pressure
Transient Test ConditionsPANT-ERS/IC transient tests will be used to demonstrate the startup of the IC heat exchanger
under full-scale thermodynamic conditions. These tests are designed to demonstrate heatexchanger performance: they arc not intended to be systems simulations.
Table A.3-3b gives the PANTHERS/IC Transient Demonstration Test Matrix. Four TestConditions are specified. These tests will b performed in much the same manner as the steady.state ~,efornanee tests, but transient data will b recorded over the course of the experiment. TestCondition I (Test Group 12) is a set of two duplicate tests designed to demonstrate the startup andoperation of the IC in a iituation comparable to a reactor isolation and trip. Test Conditions 12 and13 (Test Group 13) will have air injected slowly after the steam generator pressure has beenreduced to the value specified as'"inlet pressure" in Table A.3-3b. The IC will be vented when theinlet pressure reaches 7.6S3 MPa (1110 psig) or when the pressure pas, if at a lower value.Re-establishment of condensation following venting will be recorded. Test Condition 16 (TestGroup 14) is a repeat of Test Condition 1. but with the water level in the IC pool allowed to drop.exposing the IC tuWbes, Both the IC pool level rate and the IC heat rejection rate will be monitoredas a function of time.
- Test Group 12 will demonstrate startup of the IC under near prototype conditions, provideheat rejection data at a higher pressure than the data from Test Group h1. and demonstratetest repeatability. Test Conditions 12 and 13 will demonstrate restart of the IC following.venting of noncondensables. Test Condition 16 will establish the degradation of heatrejection ability of the IC as the IC pool water level decreases.
- Test Groups 11 and 12 will be compared with design requirements to meet TestObjective 1.
- Test Groups 11. 12. and 14 provide a database -for TRACG qualification and meet TestObjective 2.
- Test Group 12 demonstrates restart of fh IC and meets Test Objective 3.
- Test Group 13 demonstrates restart of the IC following venting, and meets TestObjective 4.
A.3.1.2.4 TRACG Analysis PlanTable A.3-4 lists those PANTHMS/IC tests that will be analyzed with TRACG. Six TRACG
runs are included in this group, which is intended to demonstrate.the capability of TRACG topredict the heat rejection rate of the IC beat exchanger over the range of reactor pressures where it,wll .be expected to perform. Three of the six points come from the steady-state performance testmatrix (Test Group 12), with the remaining three points coming from the transient data set.
Analysis will be compared with test data as defined in Table A.3-4. In all cases, the primarycomparison will be on the total heat rejection rate. Additionally, for the transient cases, IC Inletpresure will be compar.d as a funcdon of time:
I
A-7

JLZZZiZEUF~
NEDO.32391. Revision A
Pare Steam Condensation - Analysis of Test Conditions 2. 6. and 11 demonstratesTRACG capability to predict pure steam IC condensation rates over the expected SBWRoperating range (7.92 to 1.38 MPa) (1150 to 200 psig).Noncondensable Buildup and Venting - Analysis of Test Conditions 12 and 13demonstrates TRAMC capability to predict the effect of noncondensable buildup indegradation of the overall beat transfer capability of the IC. including re-establishment ofsteam-only condensation following venting.IC Pool Level Effects - Analysis of Test Condition 16 demonstrates TRACO capability topredict the effect of pool level on the degradation of IC performance.
A.3.1.3 PANDAA.3.1.3.1 Test Description
PANDA is a large-scale integrated SBWR containeat experiment that will be peprormed bythe Paul Scherrr• Institut in Wuerenlinapen, Switzerland. The test facility is an approxmately 12volumetric, fall scale height simulation of the SBWR containment system. Pressure vesselsrepresenting the reactor pressure vessel. drywell, wetwelU and wetwel air space, and GDCS poolare interconnected with appropriate piping to simulate a variety of containment transients. Thefacility is equipped with three scaled PCC heat exchangers and one isolation condenser unit. eachwith its own water pool. The PCC and IC units are both scaled by holding the heat transfer tubesat full scale, but reduced in number from the prototype. The reactor pressure vessel volume isequipped with electrical heaters to simulate decay heat and thermal capacitance of the vessel andinternals. The facility is capable of simulating SBWR accident scenarios starting approximatelyone hour into the LOCA.
Figure A.3-7 shows a schematic of the PANDA test facility. Two interconnected vessels areused for the drywell and wetwe.. volumes in order to simulate potential asymrnetiic effects. Inaddition to its transient capabilities PANDA also has piping connections such that a PCC heatexchanger may be tested in a quasi-steady manner.
The PANDA dam acquisition system is capable of recording up to 720 channels with eachchannel recorded once every two seconds. Sufficient instrumentation and data recording will beinstalled to characterize the thermal-hydraulic containment performance for tests lasting up to24 hours.
A.3.1,3.2 Test ObjectivesThe test objectives of the PANDA Test Program are
1. Provide additional data to: (a) support the adequacy of TRACO to predict the quasi-steady heat rejection rate of a PCC heat exchanger, and (b) identify the effects of scale onPCC performance., (Steady-State Separate Effects)
2. Provide a sufficient database to confirm the capability of TRACG. to predict SBWRcontainment system performance, including potential systems interaction effects.(Integral Systems Tests)
3. Demonstrate startup and long-term operation of a passive containment cooling system.(Concept Demonstration)
A-8
.- . .; " . .. .. : .'.
U

N.DO.3239JO Revision A
A.3.1.33 Test Matrix and Data AnalysisSteady.State Performance Tests
A series of steady-state tests will be conducted using one of the PANDA PCC condensers.
The facility will be configured to inject known flow rates of saturated steam and air directly to the
PCCS heat exchanger. The condenser inlet pressure will be maintained at 300 kMa for all tests by
controlling the wetwell pressure. The steam and air flow to the heat exchanger will be controlled
and measdred. Ini addition, the condenser drain flow will be measured.
Table A.3-Sa shows the PANDA Steady-State PCC Performance test matrix. Six test
conditions are included. The independent parameters are the steam and air mass flow rates.
Conditions were chosen so that a direct comparison can be made to PANTHERS and GIRAFM
test points. Table A.3-Sa identifies the test conditions in PANDA and the corresponding
PANTHIERS and GIRAFFE Test Conditions.- Five Test Conditions (Test Conditions SI through SS) am planned with various const•nt
air flows and a constant steam flow of 0.20 kg/sc. In addition, one test will be run with
a pure steam flow equivalent to that expected to match the steam condensing capacity of
the condenser (Test Condition S6).- PANDA Test Conditions SI through S6 provide a data base for TRACO qualification to
meet the requirements .of Test Objective 1(a).- The. results of PANDA Test Conditions S I through S6 will be compared with the
PANTHERS and GIRAFFE steady state performance data as noted in Table A.3-$a to
meet the requirements of Ten Objective l(b).
Transient Integral Systems TestsA series of tests is planned for the PANDA facility to provide an integral systems database for
PCC system performance with conditions representative of the lonp-term post-LOCA SBWR
containment response. Table A3-5b provides the test matrix summarizing the key characteristics
of each test. ond data use:The following provides the purpose and additional descriptive information on each PANDA
tn1ent tcst:- Zest MI Is a simulation of a break in the main steamline of the SBWR. The initial
conditions in the containment will be the same as those tested in the GIRAFFE Phase 2
main steamline break test. These initial conditions are similar to SBWR containmentconditions consisting of a mixture of air and steam at one hour into the LOCA. One-third
of the steam from the break will be directed to drywell DWI which has one FCCcondenser, and two-thirds of the steam will be directed to DW2 with two PCCcondensers. These test conditions represent a symmetrical situation in the PANDA
facilityPANDA test Ml will be compared with GIRAFFE Phase 2 Main Smemne Break Test toassess the effects of facility scale on integral system performance.
- Test is a repeat of Test Ml with all of the break flow steam directed into drywellDW2. DW2 ha two FCC condensers, and this test maximies thezsteam content of DW2and the air content of DWI. It is the most asymmetric condition that can be set inPANDA. Test M2 results will be compared with Test MI results to quantify asymmetriceffects on PCCS cortainmnt perfor%ance.
- Ten MS is very similar to Test MI, but with nominal initial containment cotiditions ascalculated for the SBWR under SSR assuroptions at one hour into the LOCA. The
initial• d.ywefl pressure will be approximately 300 kPa (43.5 psi). This test will provide a
base case for comparison to all other tests.- TestM4 is a repeat of test W3 to demonstrate transient system response repeatability.
A-9

U
NEDO-3239J, Revision A
- Test MS is a repeat of M3, but with continuous water. supply flow to the RPV. In theSBWR, if AC power is available, an.operator might use the Fuel and Auxilary PoolsCooling System. for exanple, to provide active core cooling. This test will demonstratepotenta~l systems interaction effects for cases with continuous cold water addition to theRPV. Continuous water supply flow to the RPV will result in filling of the RV andflow of relatively cold water out of the break and into the drywell. This. in tuna, Isexpected to result in opening of the drywell-to-wetwell vacuum brcak*ers andreintroduction of air from the wetwell into the dywell. This test will provide data onPCC performance when air is reintroduced to the heat exchangers following essentiallypure steam operadon.
- Test MS is a repeat of Test M3 but with the IC operating in p•al with the three PCCcondensers throughout the test period. This test will provide = showing the interactionbetween the PCC condensers and the IC, as well as the effect of the additional beat
=emoval by the IC on containment and reactor system performance.
- est M7 will utilize the same nominal initial conditions as Test M3, but with the eywfeand PCC units filled with air at the start of the transient. Additionally. this test _l beginas ear]y in the SBWR transient as is possible with tho PANDA facily design. This testwill provide data to demonstrate the PCC condenser startup characteristics when initiallyblanketed with noncondensabl gas.
- Test M8 is a repeat of Test M3, but with drywell-to-wetwell bypass leakage. This testwill provide the effect of bypass leakage on containment performance.
- Test U9 is a combination of tests MS and M7. with cold water injection into the RPV,and this test will begin as early as possible in the S3BW LOCA scenaio, consistent with
the PANDA faciity design.- PANDA tests Ml through M9 provide a database for TRACG qualification that meets
Test Objective 2.- PANDA tests Ml through M9 address long-term operation of the PCCS. Tests MS
through M7 and M9 address systems interaction and PCCS restart issues. These testsmeet the requirements of Test Objective 3.
A.3.1.3.4 TRACG Analysis Plan. AU six PANDA steady-sta•e and all nine PANDA integral systems tests will have TRACO
analysis performed. Analyses will be performed post-test or both pro- and post-rest.
a Pare Steam Condensation - Analysis of Tests SI and S6 demonstrates TRACOcapability to predict pure saturated steam condensation rates at and above rated conditions.
a Air-Steam Mixtur - Analysis of Tests S2 through SS addresses the effects of non-condensable mass faction in the PANDA PCC configuration.
• Drywel.tWetweH Noncondenzable Di.tribution -. Analysis of tests M., M2. and MSthrouh M9 addresses the effects of initial gas and vapor distribution within the
containment system, Including vacuum breaker flow, and demonstrate TRAC capabilityto model integral systems performance.
, Systems Interactions - Analytical studies of systems interactions have identified vacuumbreaker and IC operation as the most likely candidates for. systems intraction effects.Analysis of tests W through NV address TRACO capabiity to model systems Interactions.
P Bypass Lea4ge - TRACO analysis of rest MS provides qualification of the bypass
leakage modelinig.
A-10
o il... .o

U
ATEDO.32391, Revision A
A3.1.4 GISTA3.1.4.1 Facility Description
The Gravity-Driven Integrated Systems Test (GIST) was performed by GE Nuclear Energy inSan Jose, Californisa in 1988. Testing is complete, and results were reported in Reference 42.The GIST facility was a section-scaled simulation of the 1988 SBWR design configuration, with a1:1 vertical scale and a 1:508 horizontal area scale of the RPV and containment volumes. Becauseof the 1:1 vertical scaling, the tests provided rnal-time response of the expected SBWR pressuresand temperatures.
An integrated systems test was performed in order to Include the effects of various plantconditions on GDCS initiation and peiformance. Figure A.3- provides a facility schematic, andFigure A.3-9 shows the major interconnecting lines. The GIST facility consisted of four pressurevessels: the RPV, .uppr drywell, lower drywell and the wetwell. The RPV included internalstructures, an electrically theted core, and bypass and chimney regions.
Key interconnecting lines, such as drywell vents and depressurization lines with quenchers,were also included. The suppression pool/wetwell includes the water supply tank, a recirculationpump system used to heat and cool the pool water, and the air lines for pressuýizng the wetwell airspace.
The GIST facility was a simulation of the SBWR design as it existed in 1988. Severaldifferences exist between the GIST configuration and the finalSBWR design. These differencesare listed and reconciled in Appendix B.
One hundred twenty test instruments were mounted on the vessels and piping in the GISTfacility. These instruments were used to measure ADS initiation, dr.ywell and pool temperatures.break flow rates, GDCS initiation and flow rates, and RPV conditions such as temperature.pressure and water level.
A3.1.42 Test ObjectivesThe test objectives for the GIST Test Program were:
1. Demonstrate the technical feasibility of the GDCS concept. (Concept Demonstration)2. Provide a sufficient data base to confirm the adequacy of TRACG to predict GDCS flow
initiation times, GDCS flow rates, and RPV water levels. (Integrated Systems Test)
A3.1.43 Test MatrixThe GIST Test Matrix is shown in Table A.3-7. Twenty-six test conditions were specified.
These 26 individual tests were divided into four test types. three of them loss-of-coolant accdents(LOCAs):
* Bottom Drain Line Break (EDLE)" Ma Steamline Break (MSLB)" ODCS Line Break (GDLB)• No-.Break M)A broad spectrum of test parameters was varied within each one of these test types. In each
one of the four test categories, a base test case was performed and then subsequent tests were runwhbere only one parameter at a tim: was varied fromi that used in the base ease. The GIST facilitymodeled the SBWR plant behavior during the final stages of the ./PV blowdown. The tests startedwith the vessel at 100 psig and continued until the GDCS flow initiated and flooded the IPV.
A-I1
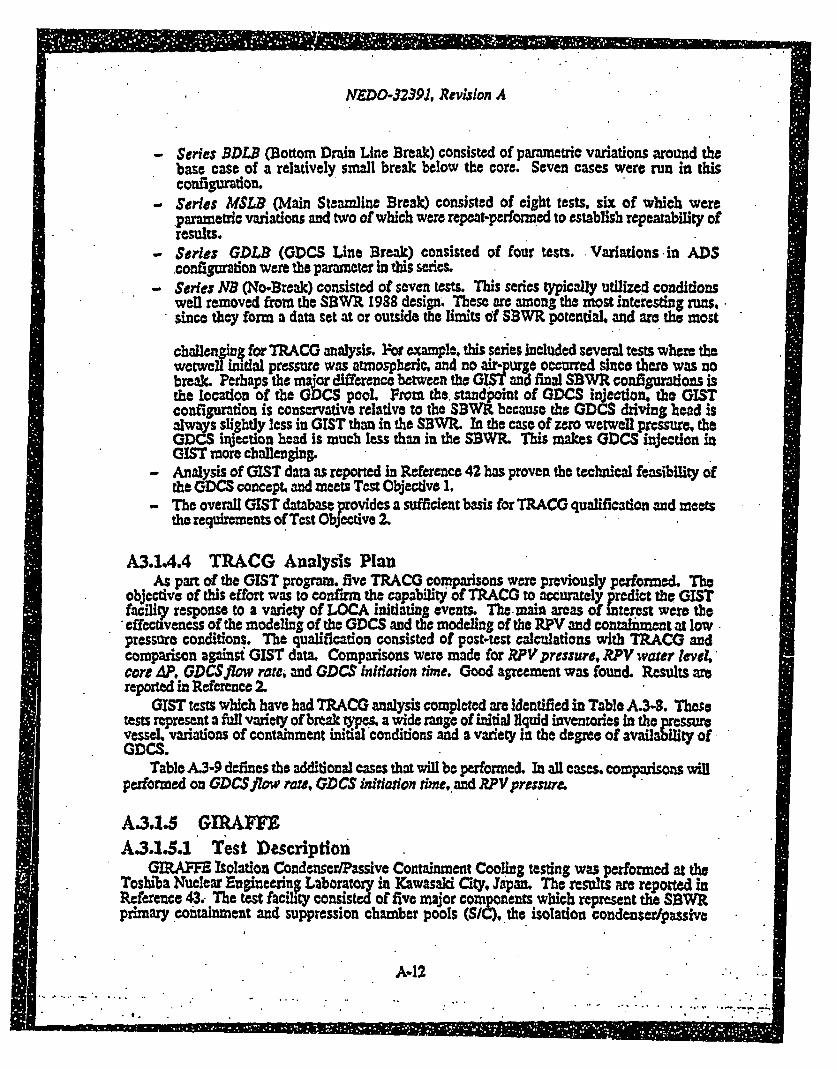
NEDO-3239J. Revision A
- Series BDLB (Bottom Drain Line Break) consisted of parametric variations around thebase case of a relatively small break below the core. Seven cases were run in this
configuration.- Series MSLB (Main Steamline Break) consisted of eight tests, six of which were
parametnr variations and two of which were repeat-performed to establish repeatability of
results.Series GDLD (GDCS Line Break) consisted of four tests. Variations in ADSconfigurtion were the parameter in this Series.
- Series NB (No-Break) consisted of seven tests. This series typically utilized conditionswell removed from the SBWR 1988 design. These are among the most interesting runs.since they form a data set at or outside the limits of SBWR potential, and are the most
thalonging .fo TRACM analysis. For example, this series Included several tests where thewccwe~ifInitial pressure was atmospheric. and no air-purge occurred since there was nobreak, Perhaps the major difference between the GIST and final SBWR confgurations Isthe location of the GDCS pool. From the. standpoint of GD-CS injecion, the GISTconfiguration is conservative relative to the SBWR because the GDCS driving head isalways slightly less in GIST than in the SBWR. In the case of zero wetwell press=ur, theGDCS injection head is much less than in the SBWR. This makes GDCS injection inGIST more cballenging.Analysis of GIST data as reported in Reference 42 has proven the technical feasibility ofthe GDCS concept. and meets Test Objective 1.The overall GIST database provides a sufficient basis for TRACG qualification and meetsthe requirements of Test Objective 2.
A3.1.4.4 TRACG Analysis PlanAs part of the GIST program. five TRACM comparisons were previously performed. The
objective of this effort was to confirm the capability of TRAMC to accurately predict the GISTfaility response to a variety of LOCA initiating events. The.main areas of interest were theeffecuveness of the modeling of the GDCS and the modeling of the RV and conmtaiment at low.pressure conditions. The qualification consisted of post-test calculations with TRACO andcomparison againsi GIST data. Comparisons were made for RPV pressure, RPV water leel,
core P,. GDCS flow rare, and GDCS Initiation time. Good agreement was found. Results arereported in Reference 2.
GIST tests which have had 7RACG analysis complctcd are identified in Table A.3-. Thesetests represent a full variety of break Wty, a wide range of initial liquid inventories in the pressurevessel, variations of containment initial conditions and a variety in the degree of availability of
GDCS.Table A3-9 deines the additional cases that will be pedormed. In all cases. comparisons will
peiformed on GDCS flow rate, GDCS initiation time,.and RPV pressure.
AS3.1.5 GIRAMEA.3.1.5.1 Test Description
GIRAFFE Isolation Condenser/lPassive Containment Cooling testing was performed at the
Toshiba Nuclear Engineerig Laboratory in Iawasaki City, Japan. The results am r;ported inReference 43. The test facility consisted of five major components which represent the SBWRprimary con'anment and suppression chamber pools (SIC), the isolation condenser/passive
A-12 .

NEDO*32391, Revision A
containment cooling (IC/PCC) heat exchanger, and the connecting piping. Separate vesselsrepresented the reactor pressure vessel (RPV), drywell (1/W),. wetwdll (WW), Gravity-DrivenCooling System pools (GDCS pools) and the ICIPCC pools, which house the IC/PCC condenserunit. A schenatic of the facility is shown in Figure A.3-10.
The IC/PCC condenser tested was a full-length, three-tube beat exchanger. The single unitcould be utilized as either an IC or a FCC. Figure A.3-11 gives an outline drawing of the heatexchanger assembly. The IC/PCC was installed in a water pool composed of a makeup pool witha chimney and cavity arrangement in wbich the IC/ICC unit was set.
Measurements were taken throughout the system for absolute pressure, differential pressure,temperature, and flow rate. Instrunment locations arc given in Reference 38.
A.3.1.5.2 Test ObjectivesThe test objectives of the GIRAFFE Test Progrm amc
I. Provide a database to support primary data taken at other scales to confim the capability ofTRACG to predict the quasi-study beat rejection rate of a lCC heat exchanger. (Steady.State Separate Effects)
2. Provide a database to support primary data taken at other scales to confirm the capability ofTRACO to predict PCCS system performance. (Integral Sý,stems Tests)
A.3.1.S.3 Test Matrix and Data AnalysisSteady-State Tests
The majority of the GIAFF data used are steady-state performance dama of the ICAPCC unitunder FCC conditions. For these tests, the facility Was placed in a condition where steam ornitrogen-steamn mixtures were supplied to the IC/PCC, and the condensed vapor and ventednitrogcn were directed to volumes modeled to act as the reactor vessel (RPV) and suppressionchanber pool (SIC), respectively. Condensate outet flows from the IC/PCC were measured bymeasuring the RPV level increase, which, in turn, was used to determine heat removal rate by.multiplying it by the latent heat of vaporization. The condensate was returned to the RPV, and thevented nitrogep was released to the S/C gas space. Once steady-state conditions were established.daam were collected for a period of 10 minutes. The time averaged data were reported andanalyz
Table A.$-10 shows the GIRAFFE PCC Steady-State Performance Matrix used to providedata in mport of the test objectives. Thirteen test conditions are included. These tests arcidentified in the test report as the Phase 1. Step I Tests, and comprise Test Group 01. These testscover the SBWR range of steam and air mass flow ,rae, as has been previously discussed in thePANTIHS/PCC section.
Data from Test Group G2 will be compared to that from corresponding PANDA andPANTHRS. tests to corroborate those results at a third scale. Data from Test Group GlProvide a support database for TRACG qualification and meet the requirements of-TestObjective I.
Systein Response TestsIn the G .IAFFE system response tests, the RPV supplies steam to the dzywell, simulating
release of decay heat through a mai. steamine break. Steam and nitrogen flow frnom the drywell tothe IC/?CC, wtb' condensate returning to the RPV, and gases venting t6 the SIC.
Two GIAFE systems tests are useful in support of the test objectives. These two testconditions arc identified in Table A.3-1 1, and comprse Data Group 02. The two tests identified
A-13,
UM
I

NEDO-32391. Revision A
are a simulated Steamiine ,Brec Test from Phase I Step 3, and a similar steanli.e break test fromPhase 2. The Phase 2 test is more like the current SBWR configuration, and has initial conditionswhich more closely resemble SBWR conditions under SSAR assumptions.
- Data from Test Group 02 will be compared to the corresponding PANDA test (GIRAFPhase 2 to PANDA MI) to address soae effects. Test Group 02 provides a support database for TRACO PCCS performance and meets the requirements of Test Objecive2.
Recently. TOSITMA has conducted a GIRAFFE integral system test with initial conditionssimilar to the Test Group G2 steamlino break test from Phase 2. but with helium in place ofnitrogen in the drywall. Initial conditions are specified in Table A.3-12. This test was not reportedIn [43)]. It is identified as Test Group G3.
- Data from Test Group 03 provide a database for light density gas behavior. It may be usedfor TRACG PCCS performance prediction in this situation. and meets the requirement ofTest Objcctive 2.
A3.15.4 ThACG Analysis PlanA significant number of GULAM TRACO comparisons have been performed as part of the
qualification effort. The objective was to confirm the capability of TRACO to accurately predictPCC steady state performance. Results are reported in Reference 2.
TRACO comparisons have been performed for all the Test Group 01 conditions, and for thePhase 1, Step 1 main stcamline break test.
A.3.16 Other Analyses PlannedThis section will give a brief overview of these tests and the anticipated corresponding
TRACO analyses.
A.3.1.6.1 1/6 Scale Boron Mixing TestGE Nuclear Energy has performed a set of boron mifint injection tests for the BWR/S and
BWRI6 geometries. These tests were reported in Reference 21. The tests were performed in a 116scale three-dimensional model of a 21 8-m reactor pressure vessel, and used the high pressure corespray I-PCS spargers as the pt!mary ijecton location of the simulated boron solution. Usingscaled boron mjccron rates of either 400 or 86 gp• . with and without I{CS flow, the parametbic
effects on mixing were examined in the upper plenum and core bypass regions. Two alternateinjection locations were also examined.
Standby Liquid Control injection locations are different in the SBWR from previous productlines, due primarily to the natural circulation recirculation feature of the SBWR. The SBWRutilizes direct injection into the core region through the shroud at 16 locations.
A series of TRACO predictions of the BWRJS-6 data is planned Specific test cases to beanalyzed have not yet been identified. Primary data comparisons will be made against data on themiing coe.#!Went. which is defined as the concentration of injected solution at the measuredlocation divided by the concentration that would be present if the rnjected solution were uniformlymixed with the entire vessel inventory. Comparisons will bee made at several locations. Thesecomparisons will address the mixing issues identified as qualification needs ATWI, ATW2, andATW3.
A-14

I NEDO.3239J, Revision A
A.3.1.6.2 CRIEPI Natural Circulation Thermal-hydraulic TestFacility
The CRIEPI test facility Is a parallel channel test facility intended to study the stabilitycharacteristics of a natural circulatiot loop during startup conditions, The two parallel channels are1.79m high and arc equipped with heaters with a maximum power input of 64 lW each. At thechannel exit, there is an adiabatic chimney which is 5.7m high. The loop has a separator, acondenser and a subcooler which are used to return the condensed steam to the downcomer. Apreheater with a capacity of IS0kW controls the inlet temperature to the channels. Tests have beenrun at low pressure to simulate low pressure loop startup. Oscillations have been observed undersome conditions and a stability map has been created for the test loop. These tests serve to addressqualification needs C12 (natural circulation) and F4 (geysering during strtup).
A.3.1.6.3 Dodewaard Plant StartupThe Dodewaard reactor is a natural circulation BWR with internal free surface steam
separation. The reactor, with a maximum thermal power of 183 MWth, is connected to aturbogenerator capable of'producing 60.MWe. Initial startup of the reactor was in 1969, and it hasbeen operating continuously since that tim. While relatively small in size, it is thermodynamicanlyand neuctroncaly similar to the SBWR and SBWR startup procedures will be similar to those ofDodeward
On February IS and 16, 1992. the reactor was started up for its 23rd fuel cycle. During thatstartup., data were recordcd to characterize the startup for potential TRACG analysis. Dam weretaken at discrete time intervals during the startup. Typically, the reactor was in a state of smi-eqilib=rium during the measurement. The results of the measurement show early establishment ofrecirculation flow during low power operation. No indication of any reactor instability, includinggeyscring, was observed. Data arc reported In References IS and 45.
TRACG analysis of this startup is being performed. Comparisons with plant data will bemade for reactor pressure, downcomer subcooling. and downcomer pressure difference (ameasure of recirculation flow) to address qualification needs F4 and C12 of Table 6.1-1.
A.3.1.6.4 Containment System Response - PSTF Mark MIIn the early 1970s. GE Nuclear Energy performed several series of tests at the Pressure
Suppression Test Facility (PSTF) to support the Mark M containment desip. The SBWR andMark M containrncnts share a similar horizontal vent system geomnetry. Qualification needs XC7.MV!, MV3, and WWI can be addressed by TRACO analysis of this data.
The test series chosen for these comparisons is PSTF Series 5703, which was reported in(20]. Test Series 5703 utilized a full-scale, three horizontal vent system with geometry verysimilar to that used in the SBW.. Three comparisons will be performed. to test data from Runs5703-1, 2. and 3. for which simulated steamline break size was the primary variable.Comparisons will be made on drywell pressure and wetwcll pressure to address qualificationneeds XC7 and WW1, main vent flow rate to address qualification need MVI, and top ventclearing time to address qualifcation need MV3.
A.3.1.6.5 Containment System Response - Mark 17 4TIn the mid-1970s, GE Nuclear Energy conducted a series of containmcnt tests supportin the
Mark 11 containment design in the.4T (Temporary Tall Test Tank) facility in Son Jose. Calfifonia.While¢ .. primaryxfocus of this testing was spipresson pool dynarmcs, three of the tests runs arcparticularly usefal in addressing TRACG qualification needs XC7, WW2, and WWS.
A-IS
U

N
NEDO-32391, Revision A
Test Series 5101 is reported in Reference 38. These tests were a full-scale, single-ventsimulation of Mark 1I (vertical vent pipe) performance. Normally, the drywell was heated to 135Pprior to test initiation to minimize steam condensation. One test. Run 35. used a unbeated drywell.Very different response was seen due to steam condensation in the drywell. Additionally. twoother runs, 34 and 35, were performed specifically to inve.stiate the effect of a wetwell to-drywellvacuum breaker. (In the Marl: containment, pressurization of the wetwell air space by poolswell causes a short term opening of tha vacuum breaker.)
These three runs will be analyzed with TRACG. Drywell pressure and vent flow rate fromRun 33 will be compared to address qualification need WWS. Drywell pressure, weuieellpressure. ventflow rate, and vacuum breaker opening/elosing dime will be compared to addressqualification need XC7.
A.3.1.6.6 Suppression Pool Stratification - PSTFIn the late 1970s, two series of experiments were performed in the PSTF specifically to
investigate pool condensation and thermal stratification in the Mark M containment system. Thesedata were initially reported in References 46 and 47, and extensively analyzed In Reference.48.More recently, these data were reviewed as one element of an effort to define an appropriatenodalization for the TRACG SBWR suppression pool, but specific comparisons to the data havenot yet been performed.
The tests reported in Reference 46 utilized a full-scale single cell 9-degree segment of the MarkI v e~nt s~sre. ad suppr.ession pool, while those reported in Reference 47 used a vent system and
pool having the same fl-scalae eight, but with flow areas and pool surface areas reduced by afactor of 3. Suppression pool temperatures were monitored by an array of thermocouplessuspended throughout the pool. Initial pool temperatures and blowdown flow rates weremeasured.
TRACI will be used to analyze Test 5707 Run 1 and 5807 Run 29, Qualification need WW6will be addressed by comparison of suppression pool temperature distribution.
A.3.2 Component Demonstration Testing
A.3.2.1 PANTHERS/PCCA.3.2.1.1 Test Description
Component testing of the prototype PCC heat exchanger is being peformed using the samehardware and test facility as described in Section A.3.1.1. The component demonstraton tests willbe ver similar in conduct to the thermal-hydraulic testing. The test article (FCC module "A") isistumented with strain gages. accelerometers, and thermocouples. Structural instrumentation isshown on Table A.3-13. Data will be collected during the thermal-hydraulic tests as well as thestructural paerormance tests descnrbed in this section.
A.3.2.1.2 Test ObjectivesThe test objective of the PANTHERS/PCC Component Deronstration Test is:
I. Confirm that the mechanical design of the PCC heat exchanger is adequate to assure itsstructural integrity over a lifetime that exceeds that required for application of thisequipment to the SBWR.
U
A-16

NEDO-3239i. Revision A
A.3.2.13 Test Matrix and Data AnalysisThe approach taken to address the test objective is to subject the equipment to a total number
of pressure and temperature cycles well in excess of that expected over the anticipated SB.WRlifetime. The test matrix is shown in Table A.3-14. The number of cycles was conservativelychosen as 10 LOCA cycles and 300 pressure test cycles. This represents five times the designrequirement number of hypothetical LOCAs (2) and nearly 17 times the number of expectedpneumatic test cycles in accordance with 10CFR50, App;ndix J over the 60-year design lfe of thePCC [18). (Credit is taken for the thermal cycles experinced during the PCC thermal-hydraulictesting in determination of this Component Demonstraion test matrix.)
Two types of tests will be performed during the PANTHERSIPCC component demonstrationtest: simulated LOCA pressurizations and simulated pneumatic leak test pressurizations.
Simulated LOCA PressurizationsSimulated LOCA cycles will be performed by pressurizing the FCC units with Steam, so that
both the temperature and pressure effects of a LOCA.are simulated. The FCC pool will be atambient temperature at the beginning of a test. but will be allowed to heat up to saturation as eachcycle proceeds. Table A.3-15 gives the time history of the LOCA prssurzations. Each LOCA.cycle will last approximately 30 minutes. Ten cycles will be performed.
Simulated Pneumatic Leak T.at PressurizationsSimulated pneumitic tests arc performed by pressurizing the FCC beat exchanger with air to
758 kPa (110 psig). The FCC pool temperature will be at ambient conditions during thesepressurizations. The test pressure will be held for 2 minutes for each cycle. A total of 300 cycleswil be pmformed.
- The test dam will be analyzed by review of strains and acceleration data against componentacceptance requirements, both in terms of magnitude and frequency content.
A.3.2.2 PANTHERSVICA.3.2.2.1 Test Description
Component testin; of the prototyc PCC heat exchanger will be performed using the samehardware and test facility as described in Section A.3.ZIy. The component demonstration tests willbe very similar In conduct to the thermal-hydraulic testing. The test article (the IC condenser unit)is instrumented with strain gages, accelerometers, and thermocouples. Structural instrumentationis shown on Table A,3-16. Data will be collected during the thermal-hydraulic tests as well as thestructural performance tests described in this section.
A.3.2..2J Test ObjectivesThe test objective of the PANTHERS-IC Component Demonstration Test is:
1. Confirm that the mechanical design of the IC heat exchanger is adequate to assure itsstructural integrity over a period of time between SBWR In-Service Inspections (ISI).
A.3.2.2.3 Test Matrix and Data AnalysisThe approach taken to address the test objective is to subjectthe equipment to a total number
of pressure and temperature cycles well in excess of that expected over the anticipated duration ofan SBWR I5I cycle. Specifically. it is planned to subject the IC to cycles equivalent to one-third of
U
A-17

NVDO-32391, Revision A
the SBWR's 60 year lifetime (i.e., 20 years), Prototype non-destructive tests (NDT) will beperformed before and after the cyclic testing. The test matrix is given as Table A.3-15. (Credit istaken for the tleruu cycles expetienced during the IC thermal-hydraulic testing in determination of
this Component Demonstration Test Matrix.)
Simulated operational cycles will be performed by pressurizing the IC unit with steam, so that
both the temperature and pressure effects of a LOCA are simulated. Tests will be performed at
different pressures, and with varying pressurization rates and durations to simulate "normal" IC
cycles, reactor beamp/cooldown cycles (without IC operation). and an ATWS event. The IC p•owill be at ambient temperature at the beginning of a test. but will be allowed to.heat up to saturation
as each cycle proceeds. Cycles will last between 7 and 12 hours. 120 cycles will be performed.
Data will be recorded for d&rations of several minutes, patiodically through each cycle.
The test data will be analyzed by review of strains and acceleration data against component
acceptance requirements. both in terms of magnitude and frequency content. Evidence of crack
initidtion or growth will be obtained from comparison of the pro-test and post-test NDT.
A.3.2.3 DEPRESSURIZATION VALVE (DPV)
A.3.2.3.1 Test DescriptionA Depressurization Valve (DPV) test program was performed in order to confirm the adequacy
of a squib-actuated valve to provide a reliable means of rapidly depressur.izing the reactor vessel.Performance tests were prormed on ft primer and propellant materials after exposure to the
SBWR environmental conditions. Functional tests were performed on a full-scale prototype valve
at the vendor's shop. The DPV was subjected to steam flow tests to measure the steam flowcapacity and reaction loads. Finally, the DPV was subjected to accelerated environmental aging ofthe nonmetallic components, and dynamic testing, Results are reported in Reference 44.
A.3.23.32 Test ObjectivesThe test objectives of the DPV Test Program were:
1. Confirm that the DPV is a zero leakage valve, and that it opens on demand with amomentary electrical signal. opens within the required response time and remains openwithout an external power source.
2. Obtain data from flow testing to determine stresses in the DPV and confirm tha the DPVsaturated steam flow rate meets the minimum expected blowdown ilow rate.
3. Obtai additional information on primer and propellant performance to provide evidence for
later qualification testing.
A.3.23.3 Test Matrix and Data AnalysisSamples of the primer and propellant materials were subj6cted to irdiation, accelerated
thermal aging and LOCA steam aging. Firing tests were subsequently performed and the results
confirmed that the pressure output versus response time met the performance requirements for the
DPV.Two full-scale prototype squib actuated DPVs were manufactured, assembled and tested by
?yronetics Devices, Ie., which is a subsidiary of EA., ne.,. of Denver Colorado. Firing. testswere performed on a full-scale valve under both a high pressure (1500 psig) condition at the valve
inlet and a low pressure (1 psig) condition at the valve inlet. A momenta, electrical si .al was
supplied and it was confirmed that the valve opened within the required response time and
remained open without an external power source. A thermal exposure heat transfer test was
A-l8
- I'M - I , $0911391M 1 MI

NEDO-32391. Revision A
performed on the valve in order to assess the effects of ambient temperature and steamlinetemperature, It was confirmed that the booster surface temperature was acceptable when the valvewas exposed to the SBWR environmental temperature conditions. A leakage test was performedfor each valve metal diaphragm seal. Each seal was pressurized to 1650 psig and it was confirmedthat there was zero leakage.
Flow and reaction load tests were performed on a full-scale valve at Wyle Laboratories ofJ1untsv. e. Alabama. The test facility was modified to incorporate a prototypical SBWR steam linesection. The DPV was connected to this prototypical section and instrumented with pressure.temperature and strai gages. Accelerometers and displacement transducers. Four steam blowdowntests were performed. The test data confirmed that the DPV mass flow rate would be on the order
of 2.4 x 10⁶ Ibm/hr at an operating pressure of 1100 psia.Potential environmental qualification effects were investigated by addressing two elements.
One element was the accelerated aging of those DPV components that contain non-metallicmaterials to ensure their reliability under adverse in-plant conditions. The second clement was tosubjcct a full-size prototype DPV to dynamically induced loads to simulate in-plant vibration. Thebooster assemblies with Me non-metallic materials were subjected to accelerated ,aing conditionsand then successfully fired, confirming that adequate pressure was delivered.. Te dynamicsimulation was performed on a triaxial seismic table at Wyle Laboratories. The DPV wasassembled using the aged components and then instrumented. The dynamic aging tests includedresonance search, vibration exposure (slow sine sweep) and a series of traxial multi-frequencyrandom input motion tests. It was confirmed that when signaled to actuate. the DPV opened andremained open.
A.3.2.4 VACUUM BREAKER VALVEA.3.2.4.1 Test Description
The vacuum breaker valve test program was designed to confirm that the vacuum breakervalve will provide a reliable leak tight boundary between the drywell and wetwel] and prevent thepressure ln the wetwelU from exceeding that of the drywl by . more than threepounds per squareinch. Leak tightness is achieved by use of a nonmetallic main seal and a back-up hard seat. liedouble seal design provides assurance that maximum leakage requirements will not be exceeded inthe event that an cbstruction should lodge on either seat. A full scale prototype valve was built andsubjected to flow testing to verify lift pressure, flow capacity, and stability at low flow. Theprifiary nonmnetallic seal was radation anid thermally aged. Following thermal aWing the valve was.dynamically aged and subjected to design basis accident conditions to confirm its leak tightness tosteam. Fia•y the fully aged valve was subjected to reliability testing to confirm that its intinsicreliability was consistent with the assumptions of the SBW1, PRA.
A.3.2.4.2 Test ObjectivesThe objectives of the vacuum breaker test program are to demonstrate that:
* The vacuum breaker flow capacity could be made equivalent to 1.04 square feet." The vacuum breaker lift pressure was less than 0.5 psi." The disk was dynamically stable under low flow conditions." The hard seat equivalent flow area was less tla 0.2 square centimeters.• The main seal was air bubble tight as installed and has an equivalent leakage flow area of
less than 0.02 squarc centimeters to steam in the .!uly degraded condition under designbasis accident conditions.D Determine dynamic loads which result in lift of the disk.
I
A-19
211 19 1 11 1

ii!iiimuiirnmumuii!ll I [U
NEDO-32391, Revision A
* The opening and closing reliability arc maintained after subjecting the fully aged valve to
grit ingestion.
A3.2.4.3 Test Matrix and Data AnalysisThe vacuum breaker was air leak tested with a new seal and it was confirmed that the seal was
bubble tigh, The valve was then placed in the flow test facility and evaluated for lift pressure and
low flow stability. The flow stability and lift pressure met reqIrciMents. The flow test determinedthat the valve stroke was not sufficient to meet minimum flow requirements. Since the natural
stability of the valve eliminated the need for a disk damper, the stroke was increased to take creditfor damper deletion. It was demonstrated that increasing the valve stroke would result in achievingthe required flow performance. A seal was then aged with radiation and placed in the valve. frthermal aging. Th valve leak test was then repeated and it was determined the seal was air bobble.tight,
The valve was then placed on a shake table for fragility testing to determine at whatacceleration lift occurred. The valve was then subjected to ten Safe Shutdown Earthquakeacceleration time histories. Upon disassembly of the valve it was discovered that the ballast ring
and the position sensor screws had come loose due to failure to engage existing lock washers.Screws had been ingested by the valve and hammered by the disk. Leak rate testing confirmed theman seal was undamaged and the hard seat still exceeded leak tightness requirements despitemarring. The valve ruggedness and resistance to seal damage was demonstrated by this event.
The Design Basis Accident test demonstrated that the fully aged valve meets leak requirementsat stear pressures and temperatures characteristic of a loss-of-coolant accident followed by waterspray. The leaktightness of the valve was demonstrated by measuring the condensate from thesteaam that passed through the valve seals. During pressure peaks. water sprays and 80 hours ofendurance testing, no measurable condensate leaked through the valve. The test demonstrated theinherent Steam leak resistance of the valve.
The final test is the reliability testing, which will sbject the fully-aged valve to grit ingestionto simulate possible environmental conditions that could affect bearing surfaces and seals duringnormal service. Thea valve will be cycled three thousand times to demonstrate reliability at its.required statistical failure rate of i0-.
A-20

ýz . '. ' - ý . ... I ...- - . .. .. -7. 377-7'7ý7- .- 7 77:--.,777 77-77 7771
NEDO-32391, Revision A
Table A.2.1.. Thermal-Hydraulic Test Data Groups and Description
Data I TestFacility Group Conditions
PANTHWPIPCCPANTHESA=CPANTHERS=CPANTHERSACC
P4QNT1ERSIPCCPANTHERSPCC
PANTHERS/FCCPANTHERS/PCCPANTHERS/C
PANTHERS/IC
PANTHERS.IC.
PANTHERS1IC
PANDAIPCC
PANDA
PANDA
GIRAFFE
GIRAFFB
GIRAFF
GIST
GIST
GIST.
GIST
PI
P2
P3
P4
P5
P6
P7
Ps11
12
13
14
S
7
644**
2**
6
3
101*
2
1
6
Description
PCC steady-state performance: saturated steam
PCC steady-state performance; superheated steam
PCC steady-state performance; air/steam mixtures
PCC steady-state performance; air/steam mixtures
FCC s:eady-state performance; air/stean mixtures
FCC sttedy-qtatc performance: air/steam mixtures
FCC performance; noncondensable buildup
FCC performance; water level effects
IC steady-state performance; inlet pressure effects
IC startup demonstration
IC restart demonstration, noncondensable venting
IC performance; water level effects
PCC steady-state performance; steam and air/steammixtures
Containment performance - basic
Containment performance - integrated systemseffectsFCC steady-sutc performance - steam and air/steammixturesContainment performance - integral system effects
Containment performance - light density gas effects
GDCS performance - integrated system effects -bottom drain
GDCS performance - integrated system effects -main steam
GDCS performance - integrated system effects -GDCS breaks.
GDCS performance - integrated system effects -transients
A
Phase
Phase
1
2
GI
02G3
BDLB
MSLB
ODLB
NB
27
13
2I
7
*8
4
7-
*Test to be performed twice to demonstrate repeatability.**Test to be performed five times at diffe-ent absolute pressures.
A-21
S,

N
NEbO-32391. Revision A
Table A.3-1a. PANTHERS/PCC Steady-State
Performance Matrix- Steam Only Tests
Test TestGroup Condition Steam Flow Air Flow Superheat*
Number Number [kg/s (Ib/s)] [kg/s (Ibis)] [0C (OF)]
P1 37 0.45(1.0) 0(0) 0(0)P 1 38 1.4(3.0) 0(0) 0(0)
P1. 39 2.5(5.5) 0(0) 0(0)
PI 40 3.6 (8.0) 0(0) 0(0)
P1 41 4.5(10.0) 0(0) 0(0)P1 42 5.7(12.5) 0(0) 0(0)P1 43 7.0 (15.4) 0(0) 0(0)
P2 44 1.4(3.0) 0(0) 15(27)P2 45 1.4(3.0) 0(0) 20(36)
P2 46 1.4 (3.0) 0(0) 30(54)P2 47 4.5(10.0) 0(0) 15(27)P2 48 4.5 (10.0) 0(0) 20(36)
P2 49 4.5 (10.0) 0(0) 30(54)
*Superbeat conditions are relative to the steam partial pressu.
U
A-22
11 :12 11 1 91 1; 11 1

U
NEDO-3239J. Revision A
Table A3.1b. PANTIIEPS/PCC Steady-State
Performance Matrix - Air-Steanm Mixture Tests
Test Test Steam Air InletGroup Condition Flow Flow Pressure Superheat*Number Number [kgis (bis)] [kg/s (bis)] [kPa g (psig)] [1C ("F)]
P3 9.1 4.5 (10.0) 0.073 (0.16) 207 (30) 0(0)P3 9-2 4.5 (10.0) 0.073 (0.16) 328 (48) 0(0)
P3 9-3 4.5 (10.0) 0.073 (0.16) 448 (65) 0(R)P3 9-4 4.5 (10.0) 0.073 (0.16) 569 (83) 0 (0)
P3 9-5 4.5 (10.0) 0.073 (0.16) 689(100) 0 (0)P3 15-1 4.5 (10.0) 0.14(0.31) 193(28) 0(0)
P3 15-2 4.5(10.0) 0.14(0.31) 317(46) 0(0)P3 15-3 4.5(10.0) 0.14(0.31) 441(64) 0(0)
P3 15-4 4.5 (10.0) 0.14 (0.31) 565 (82) 0(0)P3 15-5 4.5(10.0) 0.14(0.31) 699(100) 0(0)P3 18-1 4.5 (10.0) 0.36 (0.79) 186 (27) 0(0)P3 18-2 4.5 (10.0) 0.36 (0.79) 274(40) 0(0)P3 18-3 4.5 (10.0) 0.36 (0.79) 362(53) 0(0)P3 18-4 4.5 (10.0) 0.36 (0.79) 450(65) 0(0)P3 18-5 4.5 (10.0) 0.36 (0.79) 538 (78) O(0)P3 23-1 4.5 (10.0) 0.83 (1.83) 159 (23) 0(0)P3 23-2 4.5 (10.0) 0.83 (1.83) 240(35) 0 (0)
P3 23-3 4.5 (10.0) 0.83 (1.J3) 321(47) 0(0)P3 23-4 4.5 (10.0) 0.83(1.93) 402(59) 0(0)P3 23-5 4.5(10.0) 0.83 (1.83) 483(70) 0(0)X4 2-1 1.4 (3.0) 0.014 (0.030) 207 (30) 0(0)P4 2-2 1.4 (3.0) 0.014 (0.030) 328 (48) 0(0)P4 2-3 1.4 (3.0) 0.014 (0.030) 448 (65) 0(0)P4 2-4 1.4 (3.0) 0.014 (0.030) 569 (83) 0(0)P4 2-5 1.4 (3.0) 0.014 (0.030) 689 (100) O(0)P4 13-1 2.5(5.5) 0.14(0.31) 193 M.) 0(0)P4 13-2 2.5(5.5) 0.14 (0.31) 283(41) 0(0)
P4 13-4 2.5 (5.5) 0.14 (0.31) 373(54) 0(0)
P4 13-4 2.5 (5.5) 0.14 (0.31) 462 (67), 0(0)
*Supcrlcat referenced to steam partial pressure.
A-23

U
.NEDO-32391. Revision A
Table A.3.lb. PANMtEES/CC Steady-State
Performanace Matrix - Air-Steam Mixture Tests (Cotitinued)
Test Test Steam Air InletGroup Condton Flow Flow Pressure Superheat*
Number Number I ke/s (i/s)] [kg/s abis)] "kca & (pslg)] [I C (eF)
14P4P4114114P4P4P4P4P4P4P4P4P4P4P4P4P4P4P4P4P4P4P4P4P4PSPSP5
13-516-116-216-3
16-416-517-117-217-317-417-519-119-219-319-419.522-122-222-322-422-525-125-225-325-425-535-135-235-3
2.5 (5.5)7.0 (15.4)7.0 (15.4)7.0 (15.4)7.0 (15.4)7.0 (15.4)2.5 (5.5)2.5 (5.5)2.5 (5.5)2.5 (5.5)2.5 (5.5)
5.7 (12.5)5.7 (12.5)5.7 (12.5)5.7 (12.5)5.7 (2.5)1.4 (3.0)1.4 (3.0)1.4 (3.0)1.4 (3.0)1.4 (3.0)
7.0 (15.4)7.0 (15.4)7.0 (15.4)7.0 (15.4)7.0 (15.4)
4.5 (10.0)4.5 (10.0)4.5 (10.0)
0.14 (0.31)0.14 (0.31)0.14 (031)0.14 (0.31)0.14 (0.31)0.14 (0.31)0.36 (0.79)0.36 (0.79)0.36 (0.79)0.36 (0.79)0.36 (0.79)0.36 (0.79)0.36 (0.79)0.36 (0.79)0.36 (0.79)0.36 (0.79)0.83 (0.83)0.83 (1.83)0.83 (1.83)0.83 (1.83)0.83 (l.93)0.83 (1.83)0.83 (1.83)0.83 (1183)0.83 (1.83)0.83 (1.83)0.83 (1.83)0.83 (1.83)0.83 (1.83)
552(80)200(29)322(47)445 (65)567(82)689(100)172(25)255(37)333 (49)420(61).503(73)193 (28)283 (41)373(54)462 (67)552(80)97(14)
161 (23)225(33)288(42)352(51)179(26),262(38)345(50)427(62)510(74)159(23)240(35)321(47)
0(0),0(0)0(0)0(0)0(0)0(0)0(0)0(0)0(0)0(0)0(0)0(0)0(0)0(0)0(0)0(0).0(0)0(0)0(0)0(0)0(0)0(0)0(0)0(0)0(0)0(0)
20(36)20(36)20(36)
*Superbeat referenced to stem partial pressure.
A-24
man= ON]

I
NEDO.32391. R~evision A
Table A.3-1b. PANTEERS/PCC Steady-StatePerformanice Matrix - Air-Steavn Mixture Tests (Continhued)
Test Test Steam Air InletGroup Condition now Flow Pressure Superheat*Number Number I[kg/s 0lb/s)] [kgls Obfs)] rkpa g (psia) [*c meF
P5PSPSPSPSPSPSP6P6P6P6P6P6P6P6P6P6P6P6P6P6P6P6P6P6P6P6P6P6
35-435-536-136-236-336-436-51-11-21-31-4I-s3-13-23-33-43-54-14-24-34-44-5S-15-25-35-45-56-16-2
4.5 (10.0)4.5 (10.0)4.5 (10.0)4.5 (10.0)4.5 (10.0)4.5 (10.0)4.5 (10.0)0.45 (1.0)0.45 (1.0).0.45 (1.0)0.45 (1.0)0.45 (1.0)2.5 (5.5)2.5 (5.5)2.5 (5.5)2.5 (5.5)2.5 (5.5)3.6 (8.0)3.6 (8.0)3.6 (8.0)3.6 (8.0)3.6 (8.0)
4.5 (10.0)4.5 (10.0)4.5 (10.0)4.5 (10.0)4.5 (10.0)5.7 (12.5)5.7 (12.5)
0.83 (1.83)0.83 (1.83)0.83 (1.83)0.83 (1.83)0.83 (1.83)0.83 (1.83)0.83 (1.83)
0.014 (0.030)0.014 (0.030)0.014 (0.030)0.014 (0.030)0.014 (0.030)0.027 (0.060)0.027 (0.060)0.027 (0.060)0.027 (0.060)0.027 (0.060)0.027 (0.060)0.027 (0.060)0.027 (0.060)0.027 (0.060)0.027 (0.060)0.027 (0.060)0.027 (0.060)0.027 (0.060)0.027 (0.060)0.027 (0.060)0.027 (0.060)0.027 (0.060)
402 (58)483 (70)159(23)240(35)321 (47)402(58)483(70)193 (28)317(46)441(64)565(82)
689(100)207(30)328 (48)4S (65)
569 (83)689 (100)207(30)328(48)448(65)569(83)689(100)207 (30)328 (48)448 (65)569 (83)
689(100)207(30)328 (48)
20(36)20(36)30(54)
30(54)30(54)30(54)30(54)0(0)0(0)0(0)0(0)0(0)0(0)0(0)0(0)0(0)0(0)0(0)0(0)0(0)0(0)0(0)0(0)O(R)0(0)O(0)0(0)o(o)0(0)
U
*Supubcat referenced to steam partial pressure.
A-25
5-1

NEDO-32391, Revision A
Table A.3-b. PANTHERS)PCC Steady-State
Performance Matrix- Air-Steam Mixture Tests (Continued)
Test Test Steam Air Inlet
Group Condition Flow Flow Pressure Superheat*
Number Number ikg/s (bh/s)] - ck•s [b/s) (kPa g (psig)] (OC (a)J
P6 6.3 S.7 (12.5) 0.027 (0.060) 448 (65) 0(0)
P6 6-4 5.7 (12.5) 0.027 (0.060) 569(83) 0(0)
P6 6-5 5.7 (12.5) 0.027 (0.060) 689(100) 0(0)
P6 7-1 7.0 (15.4) 0.027 (0.060) 207(30) 0(0)
P6 7-2 7.0 (15.4) 0.027 (0.060) 328(48) 0(0)
P6 7-3 7.0 (15.4) 0.027 (0.060) 448 (65) 0(0)
P6 7-4 7.0 (15.4) 0.027 (0.060) 569 (83) 0(0)
P6 7-5 7.0 (15.4) 0.027 (0.060) 689(100) 0(0)
P6 841 1.4 (3.0) 0.073 (0.16) 193(28) 0(0)
P6 8-2 1.4(3.0) 0.073 (0.16) 317(46) 0(0)
P6 8-3 1.4 (3.0) 0.073 (0.16) 441(64) 0(0)
P6 8-4 1.4 (3.0) 0.073 (0.16) 565 (82) 0(0)
P6 8.5 1.4 (3.0) 0.073 (0.16) 689(100) 0(0)
P6 10.1 5.7 (12.5) 0.073 (0.16) 207(30) 0(0)
P6 10-2 5.7 (12.5) 0.073 (0.16) 328(48) 0(0)
P6 10-3 5.7 (12.5) 0.073 (0.16) 448 (65) 0(0)
P6 10-4 5.7 (12.5) 0.073 (0.16) 569(83) 0(0)
P6 10.5 5.7 (12.5) 0.073 (0.16) 689(100) 0(0)
P6 11-1 7.0 (15.4) 0.073 (0.16) 207(30) 0(0)
P6 11-2 7.0 (15.4) 0.073 (0.16) 328 (48) 0(0)
P6 11-3 7.0(15.4) 0.073 (0.16) 448(65) 0(0)
P6 11-4 7.0 (15.4) 0.073 (0.16) 569(83) 0(0)
P6 11-5 7.0 (15.4) 0.073 (0.16) 689(100) 0(0)
P6 12-1 0.45 (1.0) 0.14(0.31) 138(20) 0(0)
P6 12-2 0.45(l.0) 0.14(0.31) 212(31) 0(0)
P6 12-3 0.45 (l.0) 0.14 (0.31) 286(42) 0(0)
P6 12-4 0.45 (1.0) 0.14 (0.31) 360(52) 0(0)
P6 12-5 0.45 (1.0) 0.14 (0.31) 434(63) 0(0)
PS 14-1 3.6"(8.0) 0.14 (0.31) 193 (28) 0(0)
*Superheat refcrenced to seam partial pressurm.
A-26

NEDO.32391. Rev'ision A
Table A.3.1b. PANT RSPCC Steady-State
Performance Matrix - Air-Steam Mixture Tests (Continued)
TestGroup
Number
P6P6P6P6P6P6P6P6P6P6P6P6P6P6P6P6P6P6P6P6P6P6P6P6P6P6P6P6P6
TestConditiozNumber
14-214-314-414-520-120-220-320-420-5
21-121-221-321-421-S24-1
.24-2
24-324-424-531-131-231-331-431-532-132-232-332-432-5
SteamFlow
* (kg(s (Ob/s
3.6 (8.0)3.6 (s.0)3.6 (8.0)3.6 (8.0)4.5 (10.0)4.5 (10.0)4.5 (10.0)4.5 (10.0)4.5 (10.0)7.0 (15.4)7.0 (15.4)7.0 (15.4)7.0 (15.4)7.0 (15.4)5.7 (12.5)5.7 (12.5)5.7 (12.5)5.7 (12.5)5.7 (12.5)2.5 (5.5)2.5 (5.5)2.5 (5.5)2.5 (5.5)2.5 (5.5)2.5 (5.5)2.5 (5.5)
2.5 (5.5)2.5 (5.5)_
)]Air
Flow[kg/s Ob/s))
0.14(0.31)0.14 (0.31)0.14 (0.31)0.14(0.31)0.59 (1.29)0.59 (1.29)0.59 (1.29)0.59 (1.29)0.59 (1.29)0.59 (1.29)0.59 (1.29)0.59 (1.29)0.59 (1.29)0.59 (1.29)0.83 (1.83)0.83 (1.83)0.83 (1.83)0.83 (1.83)0.83 (1.83)
0.027 (0.060)0.027 (0.060)0.027 (0.060)0.027 (0.060)0.027 (0.060)0.027 (0.060)0.027 (0.060)0.027 (0.060)0.027 (0.060)0.027 (0.060)
I
317(46)441 (64)565 (82)
689(100)179(26)262 (38)345 (50)42S (62)510(74)16 (27)274(40)362 (53)450(66)538 (78)165 (24)248 (36)331(48)413 (60)496 (72)207 (30)328 (48)448(65)569(93)
689(100)207 (30)328 (48)448(65)569 (83)
689(100)
0(0)0(0)0(0)0(0)0(0)0(0)0(0)0(0)0(0)0(0)0(0)0(0)0(0)0(0).0(0)0(0)0(0)
20(36)20(36)20(36)20(36)20(36)30(54)30(S4)30(S4)30(54)30(54)
InletI Pressure Superheat*[ka' g (psig)) [C (nF))
IB --P ..
*Supedhca referencd to steam partial presswu.
A-27

i
ii EiIi~~iII Ii-~ - - U
NDO.3239J. Revision A
Table A.3-1b. PANTUEX.(PCC Steady-State
Performance Matrk - Air-Steam Mixture Tests (Continued)
Test Test Steam Air inletGroup Condition Flow nlow Pressure Superheat*
Number Number. [kg/s (Ibls)] [kg/s (lb/s)] [kPa g (psig)] ([C (oFrJ
P6 33-1 7.0 (15.4) 0.027 (0.060) 207 (30) 20(36)
P6 33-2 7.0 (15.4) 0.027 (0.060) 328 (48) 20(36)
P6 33.3 7.0 (15.4) 0.027 (0.060) 448(65) 20(36)P6 33-4 7.0 (15.4) 0.027 (0.060) 369(83) 20(36)P6 33-5 7.0 (15.4) 0.027 (0.060) 689 (100) 20(36)
P6 34-1 7.0 (15.4) 0.027 (0.060) 207 (30) 30(54)P6 34-2 7.0 (15.4) 0.027 (0.060) 328 (48) 30(54)
P6 34-3 7.0 (15.4) 0.027 (0.060) 448 (65) 30(54)P6 34-4 7.0 (15.4) 0.027 (0.060) 569 (83) 30(54)P6 34-5 7.0 (15.4) 0.027 (0.060) 689(100) 30(54)
*Suiparbcat referenced to stewn partial pressure.
Table A.3-1e. PANTHELS/PCC Noncondensable - Buildup Test Matrix
Test Test Steam HeliumGroup Condition Flow Flow Air Flow SuperheatP
Number Number [kg/s (b/s)] [kg/s (Ib/s)] [kg's (Ibis)] [1C ("F)]
P7 so 1.4(3.0) 0(0) low 0(0)
P7 51 4.5 (10.0) 0(0) low 0(0)
P7 75 1.4(3.0) low 0(0) 0(0)
P7 76 4.5(I0.0) low 0(0) 0(0)
P7 77 1.4(3.0) low 3.4 % Aa 0(0)
1 7,5 4.5 (10.0) low 3.4 %Hee 0 (0)
*Supcrbca referenced to steam partial pressure.
A-28

NEDO-32391, Revision A
Table A.3-1d. PANTI-E1MS/PCC Pool Water Level Effects - Test Matrix
Test Test StearnGroup Coudition Flow Air Flow Superheat*
Number Number [kg/s Ob/s)n [kg/s Ohbs)] [JC (*F)]
PS 54 4.5(10.0) 0(0) 0(0)
Ps 55 4.5(10.0) 0.14 (0.31) 0(0)
PS 56 7.0 (15.4) 0.83 0.(0)
*Superbeat referenced to stean partial pressure.
A-29

NZDO.32391, Revision A
Table A.3-2. PANTHERSIPCC TRACG .QUALFICATION MOINTS
Test PremPostCodiftlon . TestNumber AAnnlysis Data Comparison
.41 Post Heat Rejection RatwPCC Pressure Drop
43 Post Heat Rejection Rate
9 Post Heat Rejection Ram Degrdation Factor
PCC Pressure Drup
15 Premost Heat Rejection Rate Degradation FactorPCC Pressure Drop
18 Post Heat Rejection Rate Degadation Factor
PCC Pressure Drop
23 Pre/Post Heat Rejection Rate Degmdation Factor
?CC Pressurm Drop
- Post Heat Rejection Rate Dogradaton Factor
17- Post Heat Rejection Rate Degradtion Factor
19 Post Hcat Rejection Rate Degrdation Factor
22 post Heat Rejection Rate Degradation Factor
35 Post Heat Rejection Rate Degmad2on Factor
49 Post Heat Rejection Rae
55 Post Heat Rejection Rate
51 Post Degradation Factor
76 Post Degradation Factor
U
A-30
* ~ ~ 1 gu I i~

NEDO.32391, Revision A
Table A.3.3a. PANTIHRS/IC Steady-State Performance - Test Matrix
Test Test hitw looCondition No. of Group Inlet Pressure Temp.Number Cycles No. [MN g (psig)] °C (on•3
2 Ii 7,920 (1ISO) <32 (90)
3 1 Ii 7.240 (1050) <32 (90)
4 1 11 6.21 (90) <32 (90)
5 1 n 5.52 (800) <32 (90)
6 1 11 4.83 (700) <32(90)
7 1 II 4.14 (6W0) <32 (90)
8 1 Il 3.45 (SO) <32 (90)
9 11 2.76(400) <32 (90)
10 1 11 2.07(300) <32 (90)
11 1 Ij 138(200) <32 (90)
U
Table A.3-3b. PANTHERS/IC Transient Demonstration - Test Matrix
Test Test Inltl Inlet Initial PoolCondition No. of Group Pressure, P1 Pressure Temp.Number Cycles Number MPag (psig) EMWa C (psig) ['C (CF))
1 2 12 9.480 (1375) 8.618 (1250) <21 (70)
12 1 13 8.618 (1250) 0.48 (70) <32 (90)
13 1 B3 8.618 (1250) 2.08 (300) <32 (90)
16 1 14 8.618 (1250) 8.618 (1250) 432(90)
A-31

-Er- - m
NEDO.32391, Revision A
Table A.3-4. PANTBE1VS/IC T1,ACG Analysis Cases
TestCondition Pre/PostNumber Test Data Comparison
2 Post Ht RcjeWtion Ra
6 PrvPJost Heat Rejcton Rate
ii Post Heat Rejecdon Rate
12 Post Heat Rejecdon Ram I _let Pressure
13 PreiPost He-at Rejccdon Rae b.let Pressure
16 Pielpost Heat Rejecrion Rate
Table A.3,$. PANDA Stcdy.State PCC Performaewe Test Matrix
PANTHMR GIRAFFEPANDA Steam Flow Air Flow Test Condition Phase 1, Step 1Test No. (kp/s) (kgfs) No. Test No.
S1 0.20 0 41 2
S5 0.20 0.003 9 4
S3 0.20 0.006 15 6
S4 0.20 0.016 is 5
SS 0.20 0.03 23 10
S6 0.26 0 43 3
A-32

NEDO-3239J. Revision A
Table A.3-5b. PANDA Integral Systems Test Matrix
hudz IRPV Water No. ]BypassTest Break No. of Supply d' Leakage luntialNo. Type PCC Flow IC Area Conditions: Commeuts
MI. MSL I in DWI 0 0 0 GIRAFFE Rcpeat of Giae.33 to 2 in DW2 Phase 2 MSLSDWI Test.67% toDVM
M2 MSL I in DWI 0 0 0 GIRAFFE Repeat of Girffc-0% to 2 in DW2 Phase 2 MSLDWI Test with*10O~e a•y etric seatirDW2 flow to DWI ard
2
M3 Same as I in DWI 0 0 0 SSAR RepeatorMlmi 2 in DW2 with $SAR
conditions
M4 Saue as I in DWI 0 0 0 SSAR Repeat of M3MI 2 in DW2
- -- -
M5 SamC s I in DWI Yes 0 0 SSAR Repe of M3m1 2 in DW2 with continuous
RPV injection
m6 Saro as I In DWI 0 1 0 SSAR Repeat ofM3ml 2 In DW2 with IC
- -. --- -
M7 Sarnoas Iin DWI 0 0 0 PCC IIicd Repent ofMWMl 2 In DW2 with air. early wkh CCblnnkei d with air
Ms SAn as I In DWI 0 0 TED SSAR Repeat ef WMI 2 in DW2 withDWtoWw
bypass leakage
M9 Same 0s 1 in DWI Yes 0 0 SSAIL early Cold wmcrMl 2 in DW2 start inection to open
vacuwn breaker
U
A-33.
- I I I 10's q I ý I I -- -- -p I

m
-mull uuuIusJjm~umu L II
NEDO-32391, Revision A
Table A.3-6. PANDA TRACG Analysis Cae.es
Test Pre/PostNumber Test Data Comparison
S1 Pre/Post Heat Rejection Rate
S2 Pre/Post Heat Rejecdiou Rate Degradation Factor
S3 Pro/Post Heat Rejection Rate Degradaon Factor
S4 Pre/Post Heat Rejection Rate Degradation Factor
S5 Pro/Post Heat Rejection Rate Degrdadon Factor
$6 Pro/Post Heat Rejection Rate
M1 Pro/Post Drywell Pressure
Wetwell Pressure
Drywall TempWetwell Temp
Suppression Pool Temp
PCC Plows
S Pre/Post Drywell PressureWetwell Pressure
DryweUl Temp
Wetwell Temp
Suppression Pool Temp
M3 Post Drywell Pressure
Wetwell Pressure
Dzywell Temp
Wetwell Temp
Suppression Pool Temp
M4 Same as ?
.A-3
0 1 - I I 1 011

I
NEDO.32391, Revision A
Table A.3.M. PANDA TRACG Anulysis Cases (Continued)Test Pre/Post
Number Test Data Comparison
MS Pre/post Drywell Pressure
Wetwell Pressure
Drywcll Temp
Wetwell Temp
Suppression Pool Temp
PCC FlowsVacuum Breaker Flow
M6 Post Drywc!) Pressure
Wetwel Pressure
Diywdll Temp
Wetwdl Temp
Suppression Pool Temp
PCC Flows
IC Flow
Prc/Post Drywell Pressure
Wetwell Pressure
IDywefl TcmpWerweEl Temp
Suppression Pool Temp
PCC Flows
Post Drywell PressuWetwell Pressure
DiywclI TempWetwdl Temp
S Suppression Pool Temp
A-3S

a
mum.... tENlUilI [J
NEDO-32391, Revision A
Table A.3-6. PANDA TtlACG Analysis Cases (Continued)
Test Pre/Post DataNumber Test Comparison
PreJPost Drywell PressureWetweU Pressure
Dywell TempWetwell Temp
Suppression Pool Temp
PCc Flows
A-36
I -- 0 1 MI I I

NEDO-32391, Revision A
Table A.3M. GIST Test Matrix Initial Coiditions(RPV at 100 pslg)
NO.
of IUV Sceam Decay LDW UDW S/P S/P WWGDCS Level Time Heat Level Press Level Temp. Press
Test (1) Llies (iu)02 ) (gec)(3) (kW) (in) (psir) (fA) (F) (pjsg)
SDLB Tests:
AO• •ase Case 3 347 369 89 4 13.0 67.2 1os 6.5
A02 Low S/P Water 3 347 369 89 4 13.0 59.2 105 6.5Level_ _ _ - - - - -...-. - - a
A03 Maximum GDCS 4 347 369 89 4 13.0 67.2 105 6.5
Flow .
AZO .L v ipvwater 3 327 369 89 4 13.0 67.2 105 6.S
AOSCRDFlow 3 347 369 89 4 13.0 67.2 105 6.5
A06 Minimum GDCS 1 347 369 89 4 13.0 67.2 105 6.5FlowI
A0714o Low PrNs 3 347 369 89 4 13.0 672 105 6.5
DPVS_ _•_ -. - - - - -
USLO Tests:
BOI~asc Case 3 340 212 -99 6 14.S 67.2 110 7.0
B02 Low RPV Water 3 320 212 99 6 14.5 67.2 110 7.0Level
B03 Low S/P Water 3 340 212 99 6 14.5 59.2 110 7.0Level
04 Fas'epa Test 3 340 212 99 6 14.5 67.2 110 7.0
B06 Lost RepeatTest 3 340 212 99 6 14.5 67.2 110' 7.0
7 .Low-Low RPV 3 300 212 99 6 14.5 67.2 110 7.0
BOB Acumulator 3 300 212 99 6 14.5 67.2 110 7.0Makeup ...
B0pAecuinulator 3 286 212 99 6 14.$ 67.2 110 7.0
9DLB Tests:
COA •ase C= 2 347 373 88 5 11.5 67.2 105 7.0_ _ _ - - -.- -
CD2 Max HP DPV 2 347 373 88 5 12.5] 67.2 105 7.0Area
C03Wn H DPV 2 347 37 a S 11.5 67.2 105 7.0Ame
Co4 Mgh LP DV 2 347 373 88 5 11.5 6.21 loS 7.0sett. j,
I
A-37
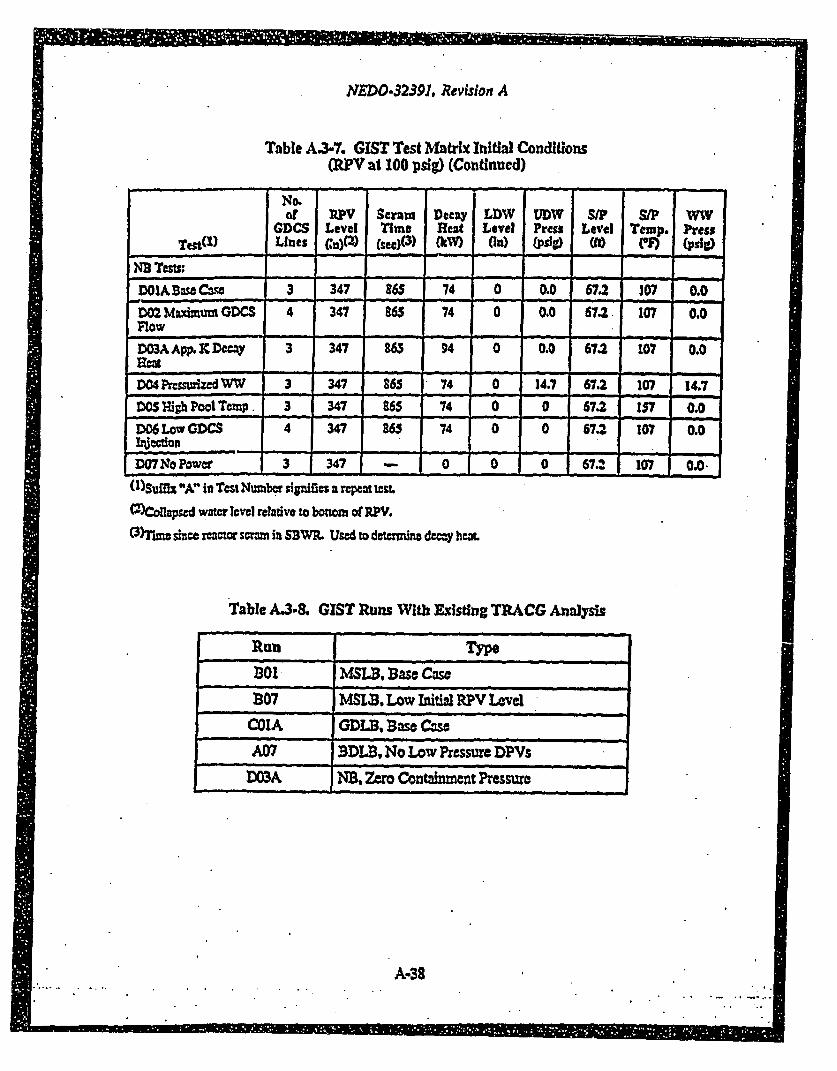
I ....
ii ".IM~lL~ii U. -77 M i~1~
NEDO-32391. Revision A
Table A.3-7. GIST Test Matrix Initial Conditions(RPV at 100 psig) (Continued)
or RPV Scram Decay LDW UDW S/P SIP WWGDCS Level Time Heat Level Press Level Temp. Press
Team Lines Cn)R (sec)(3) (kW) (In) (ps-g) (A) (') (psig)
ND Tests: I: -DOlABraCie 3 347 865 74 0 0.0 67.2 107 0.0
D2 Msxurn GDCS 4 347 865 74 0 0.0 67-. 107 0.0Flow i i--- - - - a a' '
DMAAM. X Dca1y 3 347 8,3 94 0 0.0 67. 107 0.0
D04 Prss-zed WW 3 347 865 74 0 14.7 67. 107 14.7DOSHigh Pool Tcmp. 3 347 863 74 0 0 67.2 137 0.0
- - - - -.
DO6 Low GDCS 4 347 865 74 0 0 67.2 107 0.0Thjccon
D0"7No Power 3 347 - 0 0 0 67. 107 0.0.
(I)Sutx "A" in Test Number uignifics a repeat test.
O)Cohapsed water level relative to bottom of RPV.
Mr)TLmc sinc= reactor scram in SDW.I Used to detrmnins doesy heat.
Table A3.8. GIST Runs With Existing TRACG Analysis
Ran TypM
o301 MSLB. Base Cms"
____07__ msta. Low Iimta "yV Level
COIA GDLB. Base Cmse
A07 3DLB, No Low Pressure DPVs
D03A NB, Zero Contaim=nt Pressure
A-38

NEDO.32391, Revision A
Table A.3.9. Additional GIST Rtuns for TRACG Analysis
Run Type
B03 MSLB, Low Suppression Pool Level
AOI BDLB, Base Case
A03 BDLB, Max GDCS Mow Area
AOS BDLE. CRDF Row
D01A NB. Base Case
1D02 NB, Max Ot)CS Flow Area
D04 NB. Pressurized Wetwell
Table A-3.10. GIRAFFE Test Matrix (Phase 1 Step - I).
SteaI Nitrogen PartialTest Test Flow Rate Pressure PressureNo. Group (kf/s) (fraction of total press.) (kPa)
1 01 0.02 0 300
2 G1 0.03 0 300
3 G0 0.04 0 300
4 G1 0.03 0.01 300
5 "01 0.02 0.02 300
6 01 0.03 0.02 3007 01 0.04 0.02 300
8 01 0.03 0.05 300
9 Gi 0,02 0.10 300
10 01 0.03 0.10 300
11 01 0.04 0.10 300
12 01 0.03 0.02 200
13 G14S 0.03 0.02 400
UE
A-39
W 11 1 N'11 I N I F , , I I m

NFDO-32391, Revision A
Table A,3.11.. GIRAMFFE System Response Tests (Test Group G7)
Ic/PCcPoolParameter S/C RPV D/W
PBASE I Pressure 0.301 0.314 0.314STEP 3 Total (MWa)
Partial 0.278 0.016Pressure(wa)
Temperature 63 134 100 133(deg C)
Level cm) 5.55 i1 3.55 0
PRASZ 2 Pressure 0.174 0.193 0.192MSL Total (MPa)Dreak
N2 Partial 0.164 .0.054Pressure(M•Pa) _ _ _ _ _ _
Temperature 53 119 100 108(deg C)
Level (m) 5.8 8.1* 3.55 0.0
*Eevaon above GDCS nozzle
Table A3.12. GIRAFFE Helium Test Conditions (Test Group G3)
Parameter sic )tPV D _WToM] PrCsure (MPa) 0.174 0.189 0.188-
He Pardal Press 0.135
N2 Partial P'ress 0.053
Temperamw (deg Q 53 11s 108
A-40

I
-4
NEDO.32391, Revision A
Table A.313. PCC Containment Cooler Structural Instrumentatlon
QuantityINo. of at each Total
Measurement/Location Positions Position Meas. Direct
Acceleration:SMm distributor 1 3 3 X,., YZraild-length of tbe 5 2 10 X. Yupper header cover 1 3 3 XYZ
lpIacmcrnt 11nleftbcdcr junction 1 1 2 1steam distributorlower header support 2 1 2 Y
ToA StrainWnetelbow 1 2 2 mcialinlet4heder j~unCdo 1 2 2 Zuppr•beadcr/tube ction 5 1 or2 7 ZtubeflIower eauderjuncon 3 1 3 Zlower header 2 2 4 X. ylower beadcr cover 1 2 2 ZXupperbheader 2 4 9X. Zupper hader cover 1 4 4 X zupper header cover bolts 3 1 or2 5 Y1owcr beader cover bolts 3 1 or2 5 Ydra-ahowcr headerjnedon 1 2 2 XZlower header supports 1 2 2 Z
Permpent stmin:inretraader jjuxeon .Z
upperbedr/tube junction313ZIowcrheader/drainjunction 2 2 Z
Tcmpemt=
Tempera=wiijet/caderjuction . 1 1 Iupper beader/tube junction 3 13tdbeftwerhbeaderjunction 2 1 2lower headerlower header cover I 1 1upper beader 2 2 4u header cover 1 2 2diM'ower hader junction 1 1
A-41
5

eVEDOO3239). Revixsion A
Table A.3-14. PCC Componen~t DemonstrationTest MAtrix
Table A.3,15. LOCA Cycle Time Mstory
PCC Inlet Pressure Time to Reach PrmqurekPa (psig) Se
0(0) 0
175 (25.4) <2.3
249 (36.1) <32
261 (37.8) <67
379 (55) <30 minutes
--- 11 1 11 t I Wil I RM I 1 11 MISMSME

1
NEDO.32391, Revision A
Table A.3-16. Isolation CondenserStructural Measurements
I No. QuantityIIof at each Total
Measurrnient/Loation Positions JPosition IMeas. D_1irect
Acceleration.mid-length of tube 5 2 10 XYdrain line curve 1 3 3 X, Y.Zlower header cover 1 1 I .zupper header cover I S 3 XIYZ
Displacement:steam distributor I 1 1 Zdrain/ower headerjunction 1 1 21 Zsteam pipe lower zone 1
Total Strain:Inlet/upper header unction 1 6 6 XYIZuperoeder/tube jwncion 5 z
ri-eghof tube 3 13Chwbi owehadcrjwnction 3 1 3 Z
owhodr2 2 4 Xlower header cover 1 2 2 XZupper header 2 4 8 XYupper header cover 1 4 4 XZdrain/lower header junction 1 4 4 X, Zdrain line camv 1 2 2 Ydrain linddrain tube 1 4r 4 xupper beader cover bolts 3 2or1 5 Ylower header cover bolts 3 2or 1 5 yguard pipe/dstriutor 1 .3 3 zsupport I 2 2 X, 459upper header near support I 4 4 x Y
Permcannt suiw:inlet/headerjunction 1 3 3 Y, Z 45upper headcr/tube junction 3 1 3 z.lower henaderdrain junction 1 1 2 Z
Tempara=C.puard pipedsiutor 1 1 I
inet pzp~p header 2 2 4upr hedrtb unction 3 1 3tubelower headerjr con 3 1 3lower he2ae 2 1 2uppr .lader. 2 2 4
upper header cover 1 2 2lower header cover 1 1 1
A-43

U
NDO.3239J, Revision A
Table A.4-17. IC Component Demonstration
Test Matrix- -.
. .. . . ..
Test No. Inital
Cond. of Cycle Initial Pressure Inlet Pressure Pool Terap.
No. Cycles Type mpa g (psig) MPa g (psg) aC (oF)
1 1 1 9.480 (1375) 8.618 (1250) <21 (70)
2 1 2 8.618 (1250) 7.920 (1150) <32 (90)
3 1 2 8.618 (1250) 7.2400(050) '<32 (90)
4 1 2 8.618 (1250) 6.21(900) <32 (90)
5 1 2 8,618 (1250) 5.52 (800) <32 (90)
6 1 2 8.618 (1250) 4.83 (700) <32 (90)
7 1 2 8,618 (1250) 4.14(500) <32 (90)
8 1 2 8.618 (1250) 3.45 (500) <32 (90)
9 1 2 8.618 (1250) 2.76(400) <32(90)
10 1 2 8.618 (1250) 2.07 (300) ,32 (90)
11 1 2 8.618 (1250) 1.38(200) <32 (90)
12 2 3 8.618 (1250) 0.48 (70) <32 (90)
13 2 3 8.618 (1250) 2.07 (300) ,32 (90)
14 3 3 8.618 (1250) 4.83 (700) <32 (90)
15 3 8.618 (1250) 7.24(1050) <32 (90)
16 15 1 8.618 (1250) <32 (90)
17 85 4 8.618 (1250) <32 (90)
18 I $ 9.480 (1375) 8.618 (1250) e32 (90)- -- -
A-44

NEDO-32391. Revision A
wrsLI Iii
UiT
Figure A.-M. Passive Containment Cooler Test Article
A4S
=
UI4?A
RIMISH1,11 ON M M

NEDO-3239), Revision A
PC0• POL St PAU TO STACK
MAKE-UP
AIR COMPRSCSOR
ORAIFN
TOV/1
SUPPLY
LINE
V.NTTAK14.4O
1.01V
Figure A.3-2- PANTHERS/PCC Test Facflhty Schemtfac
A-46

09
022-123-1
A2&39ý1
X 244 I M.1
-.1
0m
ok0x 2-1
0.4
K 21-1
& WI- i- 194
IAGL BREAK
X Test Ofoup P4)ALet"PX~es(RM51 -tif
0.2
X S44- MA'l
0 24 6 6 7
Steamn Mass Flow (kaleec)
Ufgrire A-3-3. Compjarison of PANTIIBR8IPCC Steam-Air Test Range to SMJVR, Condiffan
I

. .~ mmmi uuIinm~ui ___________________
Ga
& Z5-
364.X 24-1 a •-1
GO
OA X 21M1
05S
0.4
MSL BREAK
#TQ6IGaGWP3K Test Gtu P4ALToaIGioWPS
02
X 14-1
%I
c t 2 3 4 5 a 7
Steam Mass R~ow (kglaac)
Vi(gure A.3-4. TEL4ACO PANTIUEL1&CC QuadI(catlon Points
I

m
f"-A I
AO
C.)
16tup
Or
VnSW A-A
Figur~e A.M-. rsarn(Ian Condenser Teit Artlief
ý I ý I I In is 1110 -- Ill

NIEDO.32391, Revision A
Figure A.3-. PANTHEISC Test Facility Process Diagram
A-50

I -
NEDO-32391, Revision A
I STVEV~
Figure A.3-7. PANDA Facility Schemitc
A-S1

NEDO-32391, Revision A
WIvJ2gLL
UPP.ADRYWELL
LOWER
Figure A.3-. GIST Facility Schematic

NEDO-323918 Revision A
VA=UM 81MOMJR(G=~f ~TMS ONLYt)
m
Figure A3-9. GIST Fsacility Piping Arrangement
A-53
U oil flalle I Emil,

NEDO-32391, Revision A
PtLESSUR3
Figure A.3-10. GERAFUE Test Facility Scheniatlc
A-54
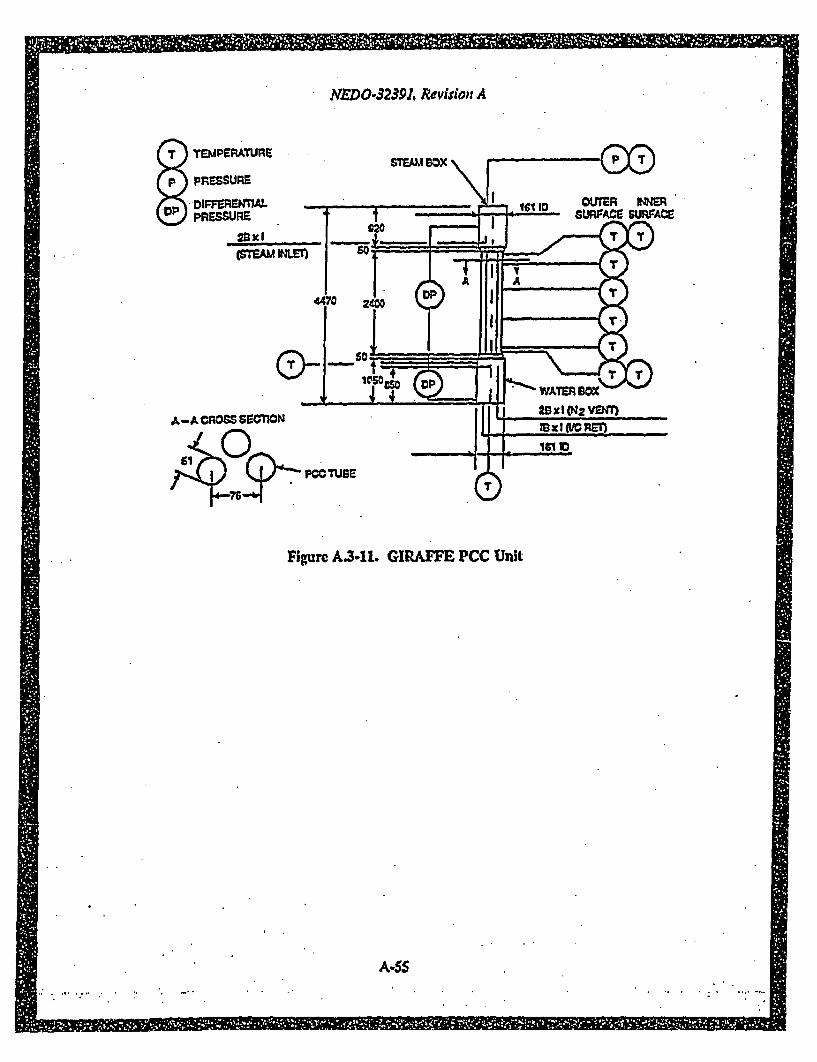
t;
NDO-32391. Revision A
T TEMPERATURE
P& PnESSURE
vpDIFFERENTAJPRESSURE
A-ACROSS SECTON
0uS51
Figure A.3-11. GIRAM PCC Unit
A-55
:7*4 -V

0,ý
NEDO-32391, Revision A
Appendix B - Scaling Applicability
BD1 IntroductionThis appendix contains a discussion of the scaling analyses which show that the SBWR
thermal-hydraulic test facilities - PANTHERS. PANDA, GIST, and GMAM - are scaledappropriately to meet the objectives outlined in Appendix A.
The scaling reported in Reference 32 follows the Hierarchical. Two-Tiered Sealing (M2TS)outlined in Reference 39. Before presenting numerical comparisons of the SBWR and scaled testfacilities, it Is important to utderstand what level of differences between the two is acceptable. Asnoted In Reference 32:
"System tests (such as the GIST. GIRAFFE and PANDA tests) do not have to provideexact system I simulations of the prototype. In fact, it is neither practical nor desirable toattempt to provide such exact simulations. However, system tests do provide data coveringall essential phenomena and system behavior under a variety of conditions. which are usedto qualify a system code (in this particular case., the TRACM code used for safety analysisby GE).
To obtain data In the proper range of systems conditions, the relative importance of thephenomena and processes present in the tests should not differ significantly from what isexpected to take place in the SBWR. Similarly, the overall behavior of the test facilityshould nu•t diverge significantly from that of the SBWR: in particular, one should notobserve bifurcations In the system behavior leading to quite different Intermediate or endstates. Finally. the test should provide sufficiently detailed information, obtained underwell-controlled conditions, to provide an adequate and sufficient database for quaUlying asystems code. TRACG."
B.2 Application to Test FacilitiesIn applying the scaling equations to the SBWR and test facilities, a single point in time during
a single event was selected, the beginning of the test simulation for a Main Steam Line Break(MSLB).
B.3 Scaling of GIST FacilityB.3.1 Facility Description 'and Test Characteristics
The GIST facility is a ful-vcrtical-scale, muti-component integrated system test as outlined in
Reference 42.The system scale is 1:509 and the facility is composed of the following regions:
SReactorVessel* Upper Drywcll
-. LowerDyvD• Wctwflv/ C pool
The ICS and PCCS arc not represented.
B-1
__ -2 .•.=• ._= _=: . .. ., •,• • • : - - :_=. ... • .: '. •_ _ _. __ . .___

m
NEDO-32391, Revlsion A
There are two substantial differences in configuration between the GIST facility, whichrepresented an early SBWR design, and the final SBWR design. First, the GIST GDCS pool iscombined with the suppression pool and located In the wetwell, rather than being a separate poollocated in the drywell, as in the final S33WR design. Second, all of the R"V depressurization inGIST occurs via SRVs that exhaust to the suppressionpool rather than the combination of SRVs(exhausting to the suppression pool) and DPVs (exhausting to the drywell) used in the SBWR. Acomplete discussion of the differences is contained in the appendix of Reference 42.
B.4 Scaling of GiRAFFE FacilityB.4.1 Facility Description and Test Characteristics
The GIRAFF3 facility is a full-vertical-scalo, miul-component integrated containment systemtest with a system scale of 1:400.
13.5 Scaling of PANDA FacilityB.5.1 Facility Description and Test Characteristics
The PANDA facility is a full-vertical-scale multi-component integrated containment systemtest. The system scale is 1:25.
B.6 PANTRERS ScalingThe PANTHERS tests are full-scale component tests. Therefore, scaling analysis is not
necessary for the majority of the facility. The facility includes a full-scale PCC unit (two modules)and one module of an IC unit. Complete descriptions of the PANTHERS facility and testobjectives are contained in Appendix A. Section A.3.1.2.
B.7 Scaling ConclusionsBased on the findings from those scaling analyses, the following conclusions can be drawn
about each of the test facilities:
0 GIST - The GIST tests cover the period of late blowdown and GDCS initiation in apostulated LOCA event. The facility was scaled well to provide dam for code qualificationin the areas of GDCS initiation time and GDCS flow rate. 'he SBWR design changessince the time of the GIST test affect the data in such a way that GIST is not representativeof the final SBWR design performance; however, nothing in the scaling precludes the useof GIST data for SBWR TRACG qualification.
SGIRAFFE The GIRAFP7 tests provide dam on the long-term containment performance.,?CC performance and systcms interactions of the PCC and GDCS. The large bent lossesIn the Phas 1 tests result in deviation in the long-term containment performance. Sincethese beat losses can be modeled with high certainty with the system models, the data canstill be used for TRACO qualification. The relatively small system scale results in ratherlarge distortions in the bottom-up parameters. However, these local bottom-up effects arenot expected to have a significant impact on the large scale system performance. Tho heatlosses were substantially reduced in the Phmas 2 configuration providing results morecharacteristic of the final SBWR desig.
B-2

NEDO-32359Z, Revision A4
PANDA - The PANDA facility is scaled very well and the data from this test can be usedto qualify TRACG for long-term containment system and component performance as wellas system interactions. The system Is scaled to 1/25 of the final SBWR design for the timeframe to be studied in the tests. The larger test scale results in reduced distortions in thebottom-up phenomena compared to GIRAFFE.
PANTHERS - The PANTHERS tests are fall-scale component tests of the PCC and IC.The test will provide dam for TRACG qualification of the PCC and IC performance. Inaddition, the tests will givc information about scaling effects on PCC and IC beat u-ansfcrperformance when compared to the smaller GIRAFFE and PANDA tests.
U
B-3
J,

I]
Z
w9'4,
~~6
I',
too0 400 500TMMEG)
V(gum~ B.34. Comparison of RPV P'ressure Response for MSLU In GISI and SBNVR,
h1iE1 lruuLAin hE U

I., MR
ts
to
it~
too 403 smM. (sec
Sgr --. cmirsn rDSFo a'IMI ITsn RV
I

I U LI ... iimiiimu.
20
-~ ~G .~ ~ - m W m m mm mm m- u n: ------
0 lM2 w 0 0
FiTgure I3J-3. Comparison of Dryeing Pressre Respwiso for hfSLB In GIMT and SBVR
I

I
40
-3ý ---
S:
cr.
4 - - ---- - -- - - 4 -
to41 m
0(AJ
5-- E
II--.- GMST-DATAI2- OfST-IRACG ANAYSIS3- 5B(FRIALVEWOfl-WCGAMAALYStS
14- WWYfl(1188DESfGM-TRACO ANAYSSISISIQ "m
I I . I I -n -- I
no'Co 2" 0 WO0 S0
'MFAE"ec
JFigure .134. Comparison of IWetwell Pressure Response rer NMSLI In GIST and SBWIR.
m Ime'll I I MISS,

NEDO.32391. Revision A
Attachment BI - Detailed Scaling Calculations and Theory
Nomenclature and AbbreviationsA Surface area [m2)a Cross-sectional area (m2]
cp Specific beat at constant pressure (3/g K]cv Specific beat at constant volume ([/kg K]
D Diameter (m]f Friction factorF deted in textFn defined in textH Height [m]h Specific enthalpy [3/1g]hfg Latent heat of vaporization ([/Wc]g Acceleradon of gravity (9.81 m/s2]j Volumetric flow rate (m3/s]I Length [m].L Sum of lengths [m]M Mass fg]p Pressure (PalQ Heat addition rate [WER System ScaleT TeCmperature [K]t Tim Is]u Velocity Im/s]V Volume [M3]
v Specific volume [rn3/kg]y Mass fractionz Axial coordinate (m)8 Kroneclkr deltaV) ViscosityX, Non-dimensional numberp Density [kg/n3]I Time constant Cs]
SubscriptsG GasL Lquid
1I1-
I

mrnriNEDO-3239PL Revision' A
LG Change liquid to gasR - Scaling factor between prototype and modelAdditional subscripts are defined in the text
Superscriptso R•ecrence scale or variable
AbbreviationsDV Depressurization ValveDW DzywellGDCS Gravity Driven Cooling SystemGDLB GDCS Lina BreakH2TS Hicrarchical Two-Tier ScalingIC Isolation CondenserICS Isolation Condenser SystemLOCA Loss-of-Coolant AccidentMSL Main Steam LineMSLB Main Steam Line BreakPCC Passive Containment CoolerPCCS Passive Containment Cooling SystemPIRT Phenomena Identification and RTking TableRPV Reactor Pressure VesselSBWR Simplified Boiling Water ReactorSC Pressure Suppression ChamberSP Suppression PoolSRV Safety/Relief ValveWW Wctwell
B1. IntroductionThis Attachment contains the scaling equations used in scaling the facilitles
U
Bl-2
M P ; PPR on ý !M 1 i xwlý I I

NVEDO-32391. Revision A
B1-2 Top-Down ScalingBI-2.1 Methodology
The general Top-Down scaling criteria for the SBWR are outlined in Section 2.4ofRefe.ence 32. The resulting pnmweters arm repeated here.
The six non-dimcnsional numbers are:
Enthalpy-pressurc
Phase-change
flpchJP Ah0 J
Interracial Phase Change
Ilipch Ajz•pO }
Inertial Pressure Drop
Submergence
ub {
ma
BI-3
i I

NEDO.32391, Revision A
Hydrostatic Pressure Drop
11hyd
Additionally, there ar three time scales:
Volume thne constant
ao Ojo
Transit time constant
Inertial time constant
al
and two geometric parameters:
Ratio of equivalent inertia and volume lengths
S Lv
Total flow resistance
+2 a 2.a al F 4f, 1,. .
ajanf 22aJ' DR
B1I-4

NEDO-323.9J, Revision A
As outlined in Reference 32, it is not necessary to preserve both Ilia and F: only theirproduct.
wl. fljn*F,
must be preserved. Additionally, the time scales . rtr and -tin will be small compared to %co andwill, thercfore, not affect the overall behavior of the system. Thus, it is sufficient to preserve "0 asthe dominant timescale.
A brief dicussion of the significance of each scaling parameter is given below. The first threen value parameters are related to a volume with heat and mass entering or exiting, while the lastthree relate to flow in a pipe:
* Enthalpy-pressure relates additions of enthalpy to changes in the control volume pressurc.
* Phase-change relates additions of heat to changes in fluid phase.interfaclal Phase Change cssentially shows how well the phase change surface areas weremodeled.
* Inertial Pressure Drop represents the pressure drop associated with the fluid velocity.* Submergcnce represents the dynamic head needed to overcome the submergence of a pipe.* Hydrostatic Pressure Drop indicates the pressure drop associated with fluid elevation
changes.Since the fluid properties are prototypic, the submergence and hydrostatic pressure drop
numbers become a measure of how well the different elevations were maintained.Additionally. two-phase behavior is important inside of the reactor vessel. The following list
of two-phase parameters describes the scaling of this phenomena:
Void Fraction
Volumetric flow ratio
Vaporization nwnbcr
,P9•
I
BI-S

U
NEDO-32391. Revision A
Pressure change time constant ratio
'Phase Change Number
QOrIpch = -M p0 h
Depressurization Number
QOJOndp = -•a"*
Flashing Number
"o Pguba
Density -tado
A review of the parameters shows that they will be scaled for a full height faliWty as long as
the initial conditions of pressure. temperature, and mass fractions are preserved. The initial
conditions are matched in all of the tests, therefore these parznmeters are not calculated specificay.
BI-6.- •

NEDO-32391, Revision A
Appendix C - TRACG Interaction Studies
C.1 IntroductionIf a LOCA were actually to occur in an SIBWR several of the limiting assumption.s used in the
licensing analysis may not (in fact, probably will not) apply. In particular, not all power may belost. and non-safety grade systems and safety grade systems that are not engineered safety features=ESF) may be available to support accident management. This Appendix investigates interactions
between active and non-ESF systems with the safety systems designed to operate during theLOCA. to determine if adverse effects due to interactions could result in conditions worse than thecase if the non-ESF systems had not been available. The figure-of-merit used to measure the effectof system interactions inside the reactor vessel is the water level inside the chimney. Outside thevessel, the containment pressure and temperature are used. These studies arc an extension ofearlier work described in the SSAR which examined the effect of break location on the LOCA andthe use of non-ESF systems to prevent core damage.
The TRACM code has been used for these studies. For interactions affecting the primarysystem response (inside the vessel) the TRACG input model for LOCA analysis was used. Thisinput model provides a detailed representation of the reactor core. vessel internals and associatedsystems, but a less detailed representation of the containment. For interactions which may affectthe containment response (outside the vessel) the TRACG input model used for containmentresponse was used. This input model provides a more detailed representation of the containmentand its systems but a less detailed pressure vessel model. Both input models have beenbenchmarked to assure that they predict similar global response for the pressure vessel andcontainment.
Accident scenarios used for the study are similar to those used for LOCA licensing analysis,but additional systems are made available. The use of any additional systems is guided by theSBV, emergency procedure guidelines (EPOs).
C.2 Scenario Definition for Interaction StudiesThe systems selected for the study were those that would likely be available and could produce
adverse interactions with the ESF systems. Systems that would clearly benefit the systemresponse were not considered. For example, with power and the feedwater system available,vessel inventory could be controlled and there would be no threat of core damage and no need for.the passive systems. The Reactor Water Cleanup (RWCU) System is another beneficial system Itremoves water from the vessel, cools it and return it through the feedwater line. For all but afeedwater line break, it provides beat removal capability in addition to the passive systems. Theexception is for a feedwater line break. where operation of the RWCU System could reduce vesselinventory. and this potentially adverse interaction is considered in the study.
For the several different breaks which were analyzed, three cases were considered:
Loss of all AC power, except that provided from invertersOn-site diesel generator power availableNormal auxiliary power available
The first case is the basis used for the LOCA licensing analysis, and the results provide ames.ure of the system performane for the other cases where additional systems are avalable. Thiefart case also provides an opportunity to examine system interactions between those safetysystems that are expected to be available during the design basis accident. In all cases, the ESFsystems were assumed to operated as designed.
C-I
11 111 IMarIe 1 0 a w 1.. a '1 O

NEDO-32391. Revision A
C.3 Primary System Interaction StudiesThe primary system interactions study investigated the effects of non-ESF systems on the
vessel downcomer level and chimney level response. Severn! different break locations wereconsidered.
C.4 Containment Interaction StudiesThe containment system interactions study investigated Interactions between the SSF systems.
and interactions of these systems with other systems which could be available for containmentcooling without a loss of power.
C.5 Summary of Interaction StudiesThe system interactions in this study included those considered most lkely to occur when
some form of external power was available and which were not clearly beneficial to the operationof the ESF systems.
C-2