Development of Nuclear Fuel Rod Testing Technique Using ...
138
KR9700258 KAERI/RR-1680/96 Development of Nuclear Fuel Rod Testing Technique Using the Ultrasonic Resonance Phenomena 29 - 0 j
-
Upload
khangminh22 -
Category
Documents
-
view
0 -
download
0
Transcript of Development of Nuclear Fuel Rod Testing Technique Using ...

KR9700258KAERI/RR-1680/96
Development of Nuclear Fuel Rod Testing Technique
Using the Ultrasonic Resonance Phenomena
29 - 0j

KAERI/RR-1680/96
Development of Nuclear Fuel Rod Testing Technique
Using the Ultrasonic Resonance Phenomena
M -? ts ffl % fir
1997 \i 2 € I7°i
HEXT PA6E(S)left BLANK

i.
^ ^ p r e s s u r i z e d water reactor: PWR)H
300 7fl^ ^^ .^^-^( fue l bundle)!-^-
^ 200 <^7fl^ <23.-g-(fuel rod)^)-, ^
- - : t . # f A 5 . ^ ^ ^ i ^ - . ^ S - ^ ^ r UO2 € 3 ! , Zircaloy-4 ^ 4^:(cladding tube),
#3^(plenum) > i ^ ^ -f-^.^
ice inspection: ISI)°fl, 3-Z\3L 2iA}jL*]ig(post-irradiation
examination: PIE) -f-ofl
iii

°). H2flAi
^^(resonance scattering)
, o]
III. M l * 3!
^^(acoust ic
resonance scattering: ARS)^ , O.?)JL
2 mm 7}<
i a t i o n e x a m i n a t ion facility: PIEF)^
iv

4.
(multilayered) ^"°fl
£ 71*113. 7}^% S )^ -^ , 2 ) ^ - ^ 4 « A f o ^ 7^(gap)oH
, ( ultrasound
spectroscopy system: RUSS)# ^ W . S.^:, ^ ^ ^ fl-S^l ^ ^ - ^
(leak-defective fuel rod detection system: LFRDS)-
IV. £ ^ ^ n r S!S!
^(global matrix approach)^-
M i ? i # - i - a^7fl ^l(boundary matrix)"S
VE ^ , -2.^- ^ J f l ^ l - ^ tf l^ ^ l D-3 *!!•-£
(background) ^ £ - § - ^ 3 * t}±= # £ #
. B n j ^ - 1 - A0>A}(analogous) -f
oflHn]T^o] zero-frequency limit 3. cfl^s}-^ 3Mt)-. o]
-n- 1 € ^ zero-frequency limit 5 . ^ o]
^I, "JL-^afl^(inherent background)"AS.
ai-fVti|)
VI

1H tfl^ n 3J4 33-31
O j A J ^
i^^S 5LEH turn table 4 2(x, y) ^ slide unit,
monostatic pulse-echo bi-static pulse-
echo « o ^
1.2
<>l*fl 3(x, y, z) ^ slide
unit,
A
at 4.
vii ISSXT FAGE(S)left BLANK

SUMMARY
I. Project Title
Development of Nuclear Fuel Rod Inspection Technique Using Ultrasonic
Resonance Phenomena
II. Objective and Importance of the Project
The core of the pressurized water reactors contain about three hundred fuel
bundles. Each fuel bundle, which is of type of rectangular parallelpipe, consists of about
two hundred fuel rods, some guide tubes, spacer grids, and top and bottom nozzles. Each
fuel rod consists of uranium dioxide pellets, a Zircaloy-4 cladding tube, plenum spring(s),
etc. The ends of the rod are sealed with end plugs by welding. Plenum is the internal
space for accumulating the fission gases. For the safe and economic operation of a
nuclear power plant, it is very important to secure the structural integrity of the cladding
tube, which is the first barrier against the release of radioactive fission gases. Therefore a
number of non-destructive testing (NDT) methods have been applied in the various
stages of fuel manufacturing, in-service inspection (ISI) and post-irradiation examination
(PIE).
The current NDT methods to evaluate the extent of failure of in-service or spent
fuel rods are the eddy current testing (ECT) and the ultrasonic testing (UT). The former
is used to examine flaws in the cladding tube and the latter to detect the presence of
water in the gap between cladding tube and pellet, which is indicative of cladding tube
ix

failure. ECT is also used to measure the thickness of oxide layer on the outside surface of
the cladding tube and it is rather simpler than UT in view point of detecting flaws in the
cladding tube, but it requires disassembling of the fuel bundle for testing. UT does not
require the disassembling but its reliability is not so high that, in ISI, the leak-defective
fuel rods detected by UT have been re-examined by ECT. There were many cases that a
rod evaluated as a leak-defective fuel rod by UT is evaluated as a sound rod by ECT, and
vice versa.
Recently, a new UT technique has been developed, which has potential of
detecting the water presence as well as flaws, dimensions and material property change
of the cladding tube. This new technique takes advantage of ultrasonic resonance
phenomenon which is attributed to elastic waves circumnavigating the tube (so-called
"circumferential waves"). In the simulation experiment using a pre-irradiated fuel rod, it
was already shown that this technique can detect the presence of water clearly. The
purpose of this project is to apply the new UT technique to ISI and PIE.
HI. Scope and Contents of the Project
In the first year (1995) of this project, some basic techniques had been developed
for modeling of the acoustic resonance scattering (ARS) by a nuclear fuel rod,
measurement of ultrasonic resonances, and design and manufacturing process of thin
(less than 2 mm) ultrasonic sensors. Particularly, an experimental system for measuring
the resonances of a disassembled spent fuel rod was constructed at the post-irradiation
examination facility (PIEF) in our institute and excellent detection ability of the new UT

for the leak-defective fuel rods was successfully demonstrated.
In the second year(1996), the ARS modeling code developed in the first year has
been extended to be applicable to an multilayered cylindrical shell. An empty cladding
tube, a fluid-filled cladding tube, a pre-irradiated fuel rod with helium gas gap, a leak-
defective fuel rod with water gap, and an in-service or spent fuel rod with zirconium
oxide layer on the outer and/or inner surfaces of the cladding tube can be dealt as an
example of the multilayered cylindrical shell. And the resonant ultrasound spectroscopy
system (RUSS) has been constructed to evaluate the effectiveness of the developed ARS
modeling code. The leak-defective fuel rod detection system (LFRDS) of a laboratory
scale has been also constructed to develop the ISI technique taking advantage of the
resonances of the cladding tube.
IV. Results and Proposal for Applications
The scattering of plane acoustic waves normally incident on a multilayered
cylindrical shell has been formulated using the global matrix approach. This is to
represent each boundary condition as a matrix (so-called "boundary matrix") equation
and to simply add all boundary matrix equations. Therefore this approach allows us to
represent all boundary conditions as a single matrix (so-called "global matrix" or
"system matrix") equation and to obtain the elements of the system matrix for any shell
with arbitrary structure easily and correctly.
A simple approach to formulate a non-resonant background component in the field
scattered by an empty elastic shell has been founded. This is to replace the surface
XI
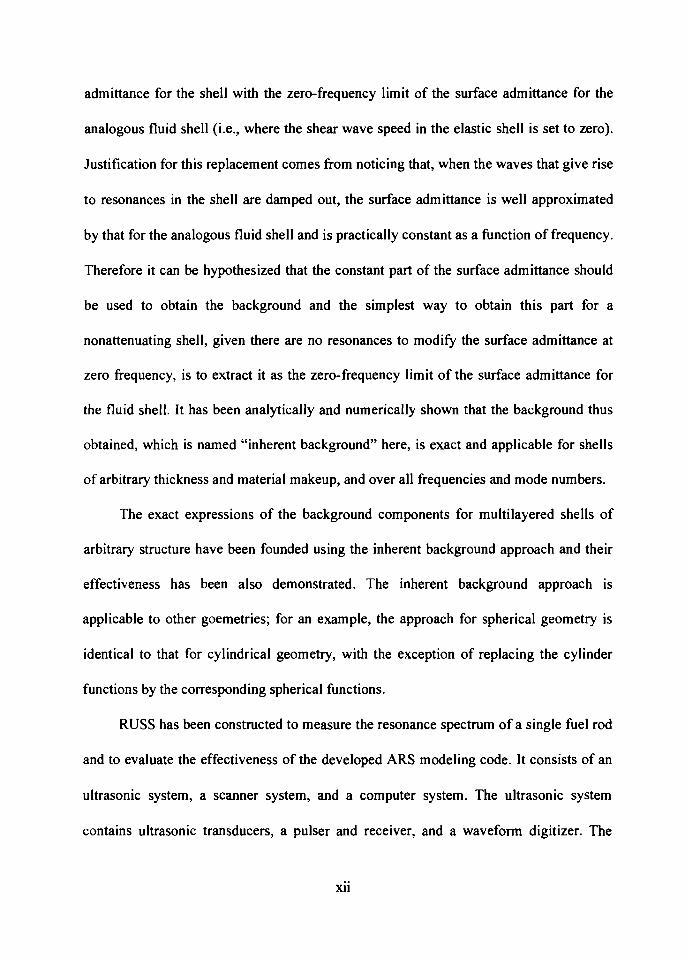
admittance for the shell with the zero-frequency limit of the surface admittance for the
analogous fluid shell (i.e., where the shear wave speed in the elastic shell is set to zero).
Justification for this replacement comes from noticing that, when the waves that give rise
to resonances in the shell are damped out, the surface admittance is well approximated
by that for the analogous fluid shell and is practically constant as a function of frequency.
Therefore it can be hypothesized that the constant part of the surface admittance should
be used to obtain the background and the simplest way to obtain this part for a
nonattenuating shell, given there are no resonances to modify the surface admittance at
zero frequency, is to extract it as the zero-frequency limit of the surface admittance for
the fluid shell. It has been analytically and numerically shown that the background thus
obtained, which is named "inherent background" here, is exact and applicable for shells
of arbitrary thickness and material makeup, and over all frequencies and mode numbers.
The exact expressions of the background components for multilayered shells of
arbitrary structure have been founded using the inherent background approach and their
effectiveness has been also demonstrated. The inherent background approach is
applicable to other goemetries; for an example, the approach for spherical geometry is
identical to that for cylindrical geometry, with the exception of replacing the cylinder
functions by the corresponding spherical functions.
RUSS has been constructed to measure the resonance spectrum of a single fuel rod
and to evaluate the effectiveness of the developed ARS modeling code. It consists of an
ultrasonic system, a scanner system, and a computer system. The ultrasonic system
contains ultrasonic transducers, a pulser and receiver, and a waveform digitizer. The
xu

scanner system contains a water tank, a stepping motor driving turn-table and two-axis
slide unit, and a motor controller. The computer system controls the scanner controller,
the pulser and receiver, and the waveform digitizer, and it acquires and analyzes the
scattered signals. The resonance spectrum of a fuel rod is obtained using the mono-static
pulse-echo method, and the order of each resonance is determined using the bi-static
pulse-echo method. The measured resonance spectrum is in good agreement with the
spectrum predicted by the ARS modeling code.
LFRDS of a laboratory scale has been constructed to develop the ISI technique. It
consists of an ultrasonic flaw detector, an ultrasonic probe of thin (thickness of 1.2 mm)
strip type, a scanner system, a standard (non-irradiated) fuel bundle, and a computer
system. The scanner system contains an water tank, a stepping motor driving three-axis
slide unit, and a motor controller. The computer system controls the scanner controller
and it acquires and processes signals from the flaw detector. Particularly, all techniques
and processes necessary for manufacturing the ultrasonic probe have been developed and
some prototype probes have been manufactured.
I &EXT PAQE(S)left BLANK

iii
2. ^ ^ > £ «n^7i# ?m 5
2.1. *\% 5
2.2. 31-f-^ ^ ^°fl tfltt i-n-wfl^ (inherent background) 8
2.2.1. ^ ^ ^ ] ^(scattering coefficient) 8
2.2.2. S^ iHnlHioll rfl ; ^^.^-i)^ JL^ 10
2.2.3. JL-frHfl Til (inherent background coefficient) 14
2.2.4. -frs: ^ ^ 16
2.2.5. 7fl^^e) 20
2.3. W ^ 4 * €°11 21 *t -§-3|- ^ ^ 23
2.3.1. &A)$\ ^ 24
2.3.2. ^ ^ Kglobal matrix) 28
2.3.3. #£|Hr(scattering function) 31
2.4. %*§r% 4 # 1 H ifl^ JL-H-wfl 34
2.4.1. #4(analogous) -rr fl €°fl ifl^: 1 4 $_T& o f l c ^ ^ ^ . . 3 5
xv

2.4.2. JL-fHfl^T1 41
2.4.3. -S-JL^ 3 ^ 43
3. tt&$ ^7]$ 7^ 51
3.1. >H-E- 51
3.2. ^ 3L-§-4 i ^ ^ ^ i s s ) A^B§ 52
3.3. fi-g- ^ i * | £ ^ ^ ^ 66
4. Y^^S-g- ^ l 7 l # ?m 73
4.1. >H^r 73
4.2. ^ - ^ 1 ^ ^ 77
4.3. 3L-S-4 5LSW. A]3]-^- 4^ 86
5. ! € • 99
«-S. A vfl^.7^ ^l^-o] cj-* jL^l oil tfl^- #£«8t<Jl ^L4i 103
«-S- B. A% €°fl tf l^ < i ^ ^ l l - 4 ZL JSLi 105
«-S- C. V-fl -7} ^ l * ? ! ° 1 ^ aLSfl ^ofl tfl^j. A V ^ ^ t S ] l i H5
t^r^ 119
xvi

Figure 2-1. (a) The modal surface admittance (divided by the fluid-loading-
parameter) GJ,L) of the lowest order (« = 0) partial wave for the liquid shell
(h = 05 and CL=57%Qms~l) without any consideration of structural
damping in water (C, = 1480 m.?"1), and (b) the real parts of the modal
surface admittance for various structural-damping coefficients /3L, plotted as
a function of frequency. 13
Figure 2-2. G(nL)(0+) of the first six (n = 0 ~ 5) partial waves plotted as a
function of relative shell-thickness. 17
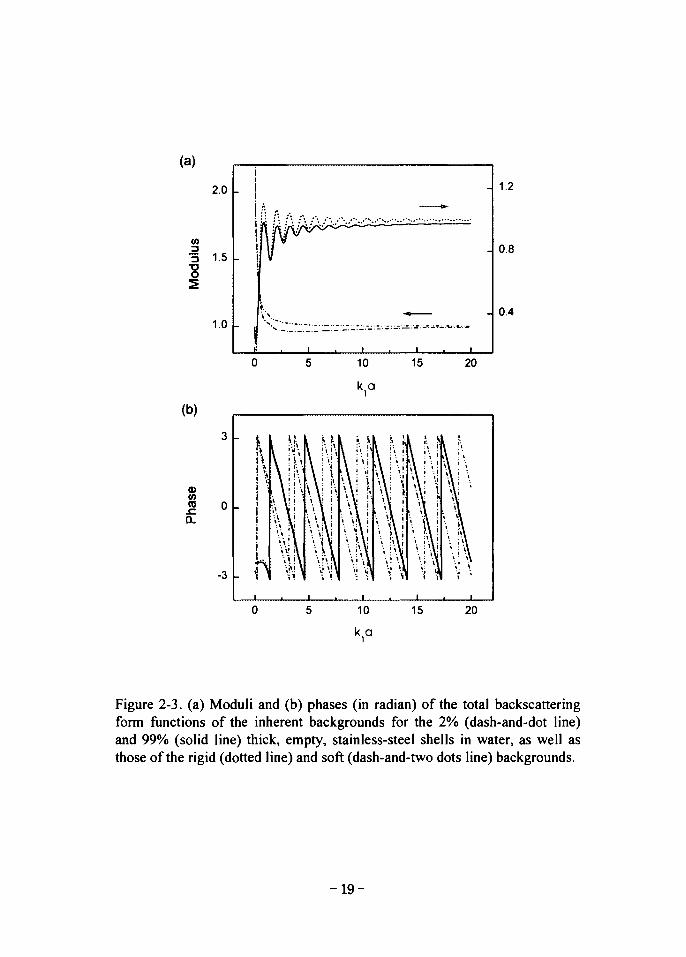
Figure 2-3. (a) Moduli and (b) phases (in radian) of the total backscatteringform functions of the inherent backgrounds for the 2% (dash-and-dot line) and99% (solid line) thick, empty, stainless-steel shells in water, as well as those ofthe rigid (dotted line) and soft (dash-and-two dots line) backgrounds. 19
Figure 2-4. Moduli of the residual backscattering form functions, | / n - / n( A ) | ,
for the lowest six (n - 0 ~ 5) partial waves for the 2% thick, empty, stainless-steel shell in water. 21
Figure 2-5. Geometry of a plane acoustic wave scattering from a multilayeredcylindrical shell. 25
Figure 2-6. Geometry of a plane acoustic wave scattering from an emptydoublelayered elastic cylindrical shell. 45
Figure 2-7. Comparison between the inherent background amplitudes(dottedline) and the backscattering amplitudes (solid line) of the partial waves for an12% thick, empty Zircaloy shell with 10// m thick ZrO2 layer. 47
Figure 2-8. Resonance spectra of the partial waves for an 12% thick, emptyZircaloy shell with 10 // m thick ZrO2 layer. 48
Figure 2-9. Resonance spectra of the (a) «=4 and (b) n=10 partial waves for12% thick, empty Zircaloy shells with the various thickness (10/an, 20//m,50/an, 100/an) of ZrO2 layer 49
xvu

Figure 3-1. Schematic diagram of the resonant ultrasound spectroscopy system. • • 53
Figure 3-2. Overall view of the resonant ultrasound spectroscopy system: (a)scanner, (b) turn table, (c) computer, (d) scanner controller, (e) waveformdigitizer, and (f) pulser & receiver. 54
Figure 3-3. Signal waveform and frequency spectrum of the 0.5 MHztransducer 57
Figure 3-4. Signal waveform and frequency spectrum of the 1.0 MHztransducer. 58
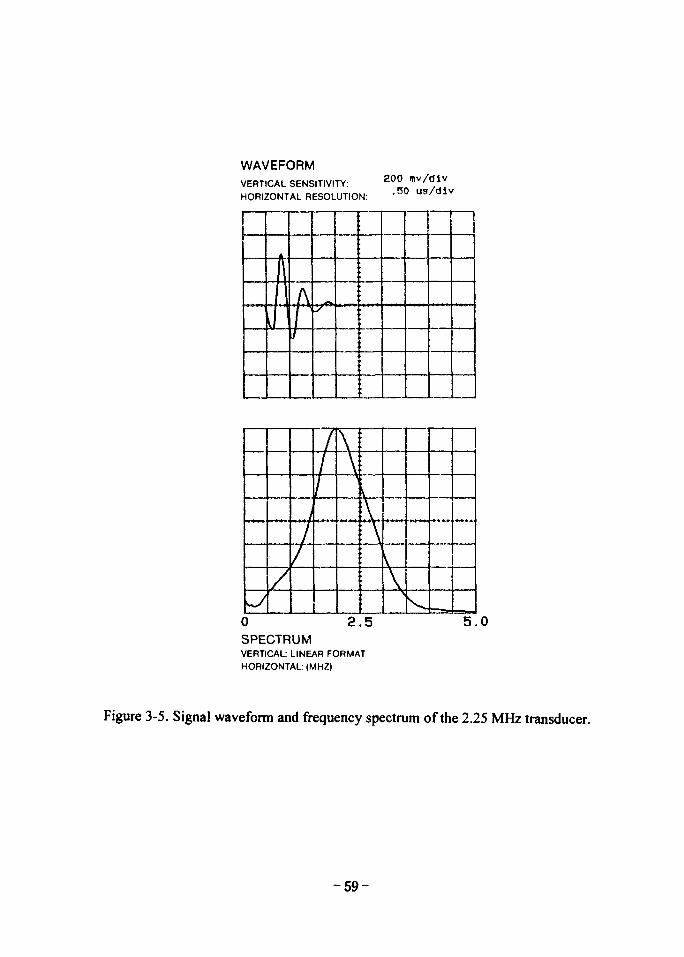
Figure 3-5. Signal waveform and frequency spectrum of the 2.25 MHztransducer. 59
Figure 3-6. Signal waveform and frequency spectrum of the 3.5 MHztransducer. 60
Figure 3-7. Signal waveform and frequency spectrum of the 5.0 MHztransducer. 61
Figure 3-8. Signal waveform and frequency spectrum of the 7.5 MHztransducer. 62
Figure 3-9. Signal waveform and frequency spectrum of the 10 MHztransducer. 63
Figure 3-10. Drawing of the turn table. 64
Figure 3-11. Photograph of the turn table. 65
Figure 3-12. Backscattering echoes obtained from the fuel rod using the 1MHz transducer. c-i
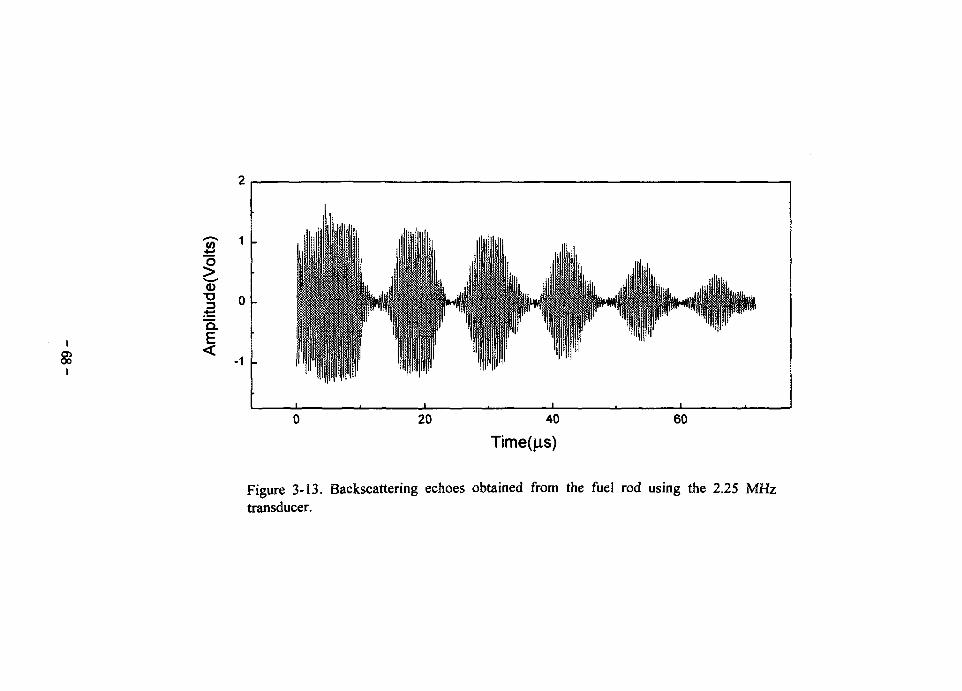
Figure 3-13. Backscattering echoes obtained from the fuel rod using the 2.25MHz transducer. 68
Figure 3-14. Resonance spectrum of the cladding tube obtained using 1 MHztransducer. Here, n denotes the normal mode number. Left number in theparenthesis is resonance frequency measured experimentally and right numberis resonance frequency calculated theoretically. 70
xvin

Figure 3-15. Resonance spectrum of the cladding tube obtained using 2.25MHz transducer. Here, n denotes the normal mode number. Left number in theparenthesis is resonance frequency measured experimentally and right numberis resonance frequency calculated theoretically. 71
Figure 4-1. Different vendors' probes of ultrasonic testing (quoted fromReference [2]). 74
Figure 4-2. Schematic diagram of the leak-defective fuel rod detection system. • • • 78
Figure 4-3. Overall view of the leak-defective fuel rod detection system: (a)scanner, (b) xy slide unit, (c) fuel assembly, (d) computer, (e) scannercontroller, (f) flaw detector, and (g) waveform digitizer. 79
Figure 4-4. Photograph of the ultrasonic probe. 82
Figure 4-5. The ultrasonic probe mounted in the xy slide unit. 84
Figure 4-6. Drawing of the slide unit. 85
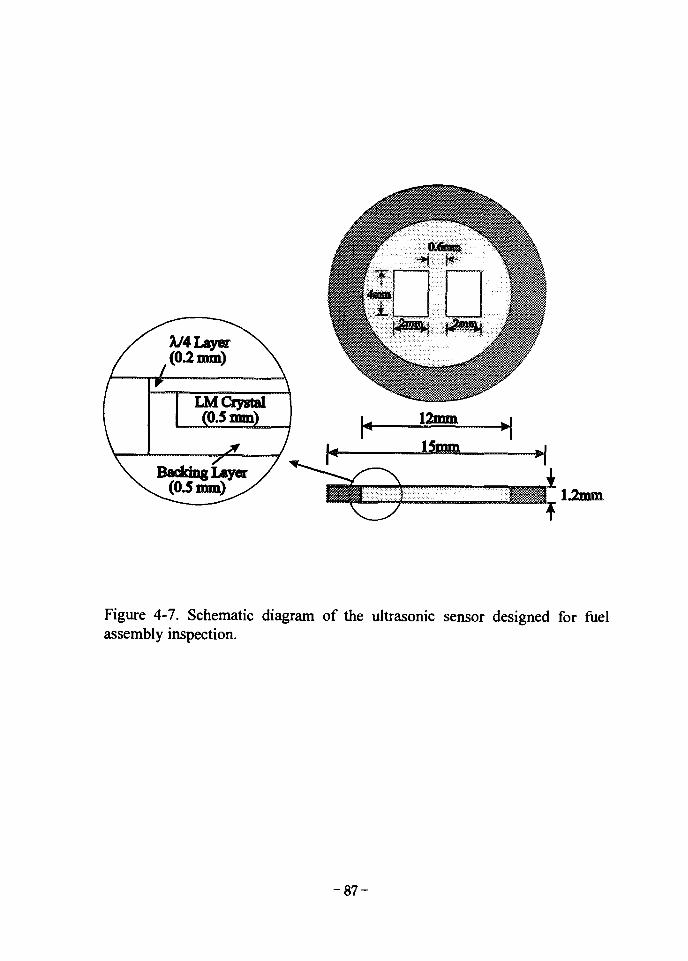
Figure 4-7. Schematic diagram of the ultrasonic sensor designed for fuelassembly inspection. 87
Figure 4-8. Drawing of the ultrasonic sensor housing. 90
Figure 4-9. Drawing of the probe strip 92
Figure 4-10. Drawing of the probe strip holder. 94
x ix

^^(pressurized water reactor: PWR)^ ^
300 7fl5] te^^Kfuel assembly)!-^- i f - ^ 4 - 4 4
*)1TT 200 ^7flS} <SJL#(fuel rod)4, ^ 7flS} ^6\& , ,
*}-^ i t - f l l n 3 -^^^ . #£-!§-& UO2 1^!, Zircaloy-4 a| ^(cladding
tube), 1-el^(plenum) ^ S ^ f-^.S ^ s M ^^r^l -g-^: n>7flS.
7}iffi] ^r^dfl tfl^-
Al-g-^^A>(in-service inspection: ISI)°fl, H5lJL ^A>^:A1 ^(post-
irradiation examination: PIE) -^^l ^
- 1 -

il(leak-defetive)
scattering)
.[3, 4]
(resonance scattering) *fl^ ^ ^ - ^ ^ ^
34-8- W^ i-l-4
5] ' S ^ i . ^ l 2:^|-^Al^Al4i (post-irradiation examination facility: PIEF)°fl ^^1*>
MI-?- #S] ^ ^ ^-^--i- uB-f ^ ^ 4!SUES. ^Til t ^ l ^ ^r SI
(multilayered)
- 2 -

. I151JL
2 .^ -4 ^ ^ m S - ^ S U ] AliEfl(reSonant ultrasound
spectroscopy system: RUSS)^: n 1 ^ ^ 1 ^ .
^E^(leak-defective fuel rod detection system: LFRDS)#
-7fl 1.2
- 3 -

2.1.
A]-g-
gap)/JL^l(UO2
or water gap)/JL^l(UO
(plenum) ^ ^ i ^ ^ l ^ M ^ o . ^ . ^ ^
acoustic pressure)^ «fl
^(scattered acoustic pressure)^ : •?•
- 5 -

(diffraction)°fl, ^*}^ ^£*fi ^ 3 . 5 ] ^(refraction)*}- *1| Hour(reradiationH
-§-#-§:
(rigid background)^-o0-4
background)^-
^•^- i" 3 H r 4 . °1 ^ °1 ufl (transitional background)-^
i°] A^^\°] ^ t 4 : ^ H l ^ - Murphy J§-°1] ^Itb intermediate
background,[6] Ayres £f Gaunaurd °fl 5] wj- midway background,[7] Veksler °fl
liquid-shell background,[8] Werby[9]^- GaunaurdflO]^ 5]^t hybrid background,
5}J! Norris ^r Vasudevan °fl ^^b matched-asymptotic background [11] -§-°l 5
$14. °1 ^^r ^ tb Siol ^ 1 T Xlr
4.
- 6 -
background)" .^
coefficient)^
3. n
^£#(sca t t e red field)**
\ <U4. "jL-ff Mfl (inherent
A ] - g ^ .
wavenumber)^
attenuation
1/eS
. 2.3
4 . OLB\3L 2.4
- 7 -

2.2.
2.2.1. -ttS- ll (scattering coefficient)
^ ^ d = a-b) %%%
(scattering form function)^
Bessel ^ Hankel ^ ^
. o]
- 8 -
-g-
A (1)n=0 n=0 raX
Neumann 7 f l ^ r ( « = 0 ^ °fl e0 = 1, n > l ^ ^ s B = 2 ) ,
5 X 5 ^ l ^ ( d e t e r m i n a n t ) ^

(2)
= dla = \-bla.
D?£r ^11 £>„ ^ ^ ^ l - o ] 4 . ^ ^ "fl^olli ^(surface
admittance)^
] ^ 4 s ^ f l ^ l ^ f . Murphy
^ plateau S.
5 1 ^ - o l ^ ^ r €^1 -g-^^lS^l rfl^-SlJI, plateau^
^1 intermediate background^ ifl-g-^cf. ^-tf^, °1 plateau
unique *}*1 ^ 4 ^ ^-^1^°1 Si°1 intermediate background
- 9 -
Q = (p, / p 2 ) / h S, ^ 5] £ ) ^ -B-*|)-f Sr-Bfl 7fl ^(fluid-loading-parameter)
3,[ll,13, 14] ^S .^ : ^ GB-§- t)-g-3r 2°1 3 3 ^ ^r $14:
f^ G / 1 4 «14 -fMl D^£ «1 -¥- :«rtr. ^^l-^l-^^fl^^r^ null
frequency e -jLJE. l - ^ - ? - ^ , & £ U^l ^^ (sof t )
2.2.2.
Neper/m^
- 1 0 -
LJ = xLJ(\-h), (6)
€- 3-i- p t > r
3.5L, ^ -
3 x 3
5.
- 1 1 -

= mL Jn(yL)Yn(xL)-Jn(xL)Yn(yL)
(liquid-shell background)
1480 5aJl
0.5°lJI ^ 4 ^£(C i)7> 5780 ms"1^! stainless steel
H](Q/C,)7]-
ZLZJE.3.,
2-l(b)Sr
plateau °1 plateau^ ^
- 1 2 -

(a)200
-20060 80 100
(b) 10
4
2
o
-2
- P. =7
P. =5
PL=3
. P.-o>
20 40 60 80 100
Figure 2-1. (a) The modal surface admittance (divided by the fluid-loading-
parameter) GJ,L) of the lowest order (n = 0) partial wave for the liquid shell
(h = 05 and CL =5780/M5~') without any consideration of structural
damping in water (C, =1480/nj"'), and (b) the real parts of the modal
surface admittance for various structural-damping coefficients fiL, plotted
as a function of frequency.
- 1 3 -

tSLJm'(xL)/Jm{xL). (8)
Bessel ^ r t - ^ v]^ _/7> £ 4 ; )
4 ^ 4 ^^-*> ^ P io] <gr}. o]
2-l(bH ^H}^H pL>3°J ^ ^ ^ G ^ S ] ^l7flA>
1 ^ l ^ ^ <L )4 plateau 7f ^ 4 ^ 4 ^
S! ^-foflfe ^ - ^ 4 plateau 7\
4 4 \ i 4 . € fl(inherently) -S- rS! tf" r Gln
L) $\ plateau 7>
plateau^ ^ ^ - ^ ^ t f l ^ o . 5 . ZLS]
2.2.3. ^-^UH ^ >NI ^(inherent background coefficient)
2.2.2
Slt-I: £^ ^ 1 ^ ^ -Sr^jL, 4
ufl, ^ ^ 1H
- 1 4 -

4§ofl
o}z\s.
zero-frequency limit, Fn( t )(0+)5. ^ ^ € ^r S l4 .
zero 91°]*)
- *(=x, or yL)«\ ^ »fl, Bessel t ^ r t ^ r ^-£
4 ^"^ e ^ > * l # S M l ^r 5 1 ^ : [18]
y(f20W = Jc"/(2"n!), rM=o(x) = (2/7i)lnx, ¥„*(x) = - ( « - l)!(2/x)" /n. (10)
^ 10 •§- q 7°fl t f l^t)-^ , " t ^ G ^ ^ zero frequency limit £• ^ -§ -4 7^°1 ^
- 1 5 -

n>\
l-(l-A)2"
(lib)
- 2 ^ *{•%•
* ) ^ - null frequency fi^ ^ V
+ ) fe ^^}s)-(generalized) null frequency
11 5] G(i ) (Q + )^ «^«]:S}- null frequency 7]- ^^g- | « | # null frequency, Q
null frequency °1I ^^f^ l ^ S ] ^ , x, « Fn(L)(0+) ?1
2.2.4.
- 1 6 -

+o
0.0 0.2 0.4 0.6 0.8 1.0
Figure 2-2. GJ,L) (0+ ) of the first six ( n = 0 ~ 5) partial waves plotted as afunction of relative shell-thickness.
- 1 7 -

/,,(A)(Tt,*, ) • § • * , = 0 -20 S] ^ 4 ^ <£ <* ofl Ai T i l ^ ^ J L , „ = 25 4 * 1
(n,xl)3\- f(b){n,xx)
stainless-steel ^«fl cflsfl
Ax, =0.01 OJJL, ^ £ 3 ^ ^flS.^ # ^ ^ cf-g-
4 W : p, =1.0gcm-3, p2 =7.9gcm"3, C, = 1480ms"1, C t = 5780ms"1,
CT = 3090 ms"1.
99%
. 2 o / o
. 99%
o|
- 1 8 -
(b)
8jS 0a,
-3
- 0.4
10
k,a
15 20
10
k,a
15 20
Figure 2-3. (a) Moduli and (b) phases (in radian) of the total backscatteringform functions of the inherent backgrounds for the 2% (dash-and-dot line)and 99% (solid line) thick, empty, stainless-steel shells in water, as well asthose of the rigid (dotted line) and soft (dash-and-two dots line) backgrounds.
- 1 9 -

1-ofl tfltfl ^ S.&6] nV^^cf^ 3}^ 5K]*l-£4. $ i S ^ , H ^ 2-4 r
2%
2.2.5.
£.$ zero-frequency limit S. tfl*)]*]-^ ^ ° 1 4 . °1
Hov^^r zero frequency e*1<HH °l
AcK -n- 1 H^l zero-frequency limit S.-H °
- 2 0 -

0.0
k , a
Figure 2-4. Moduli of the residual backscattering form functions,
I fn ~ fnb)\> for ^ lowest six (n = 0 ~ 5) partial waves for the 2% thick,empty, stainless-steel shell in water.
- 2 1 -

20
514;
- 2 2 -

2.3. £ ! # i i c|-g 10o|| s|oh ^ o |
3 7}
.[20, 21] ol £ -*H tfl*> ° l ^ - ^ t l *fl^ a ^ A S ^ Thomson
Haskell ^ [22, 23] ^iil:39!(transfer matrix)^ 4 Knopoff 5] [24]
^ ^ , 2.3.1
2.3.2 * H H ^ uLSfl/uLS||, -
- 2 3 -

^ Til
5., 2.3.3
2.3.1.
2-5
. o)
Pj
4 4 C} Cj
(12)
$= AA j
dJ=aj_]-ajO)jL, Ol O] y].^- 711S} Hi,
- 2 4 -
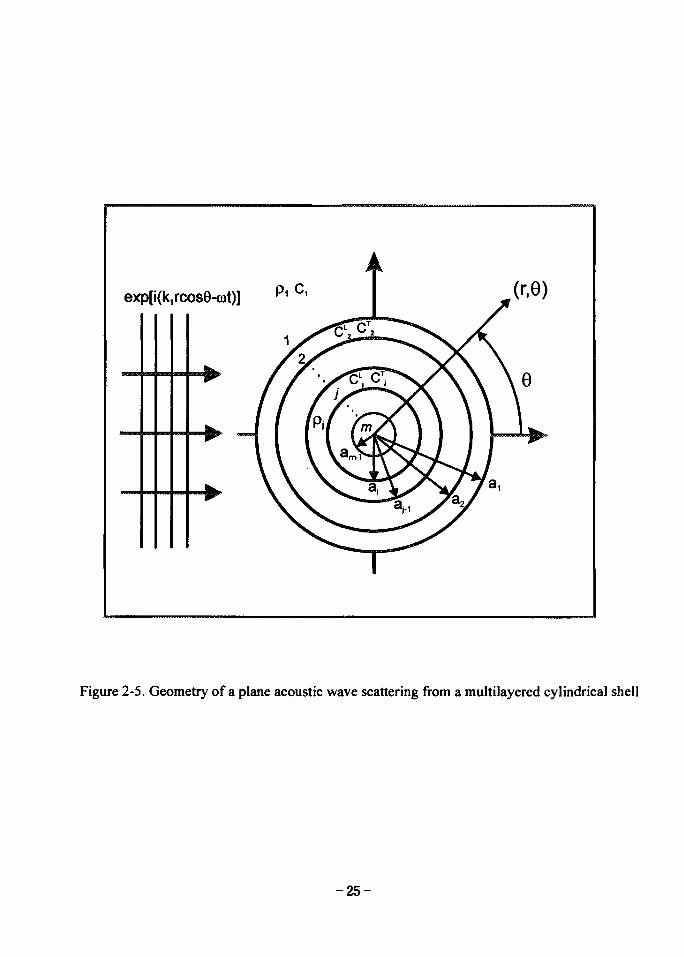
Figure 2-5. Geometry of a plane acoustic wave scattering from a multilayered cylindrical shell
- 2 5 -

x}-T=y}J(l-hj). (13)
= 0
P\ = p'r + Pic = > en/"[/n(V) + RnH; (V)]cos«e, (14)n=0
en^r Neumann ^ K ^ o = 1 > e«i=2),
tfl ^*fi^c>> ^ < 1 ^ Tfl^(scattering coefficient)^4. 4 *
( 1 5 a )n=0
; ) ^ i;(Arjr)]sin«G . (15b)n=0
Bessel
(i6a)
(16b)n=0
- 2 6 -

(i) r = a,
-Pi, ur2=u[, T ? = 0 , (17a)
(ii) r = ajU = -
u)=u%x, (17b)
T r r * - Oj o]
A ^ ^17
(18)
(4/w - 5) x (4m - 5)
2.1
. 4
-§- matrix)^ •
- 2 7 -
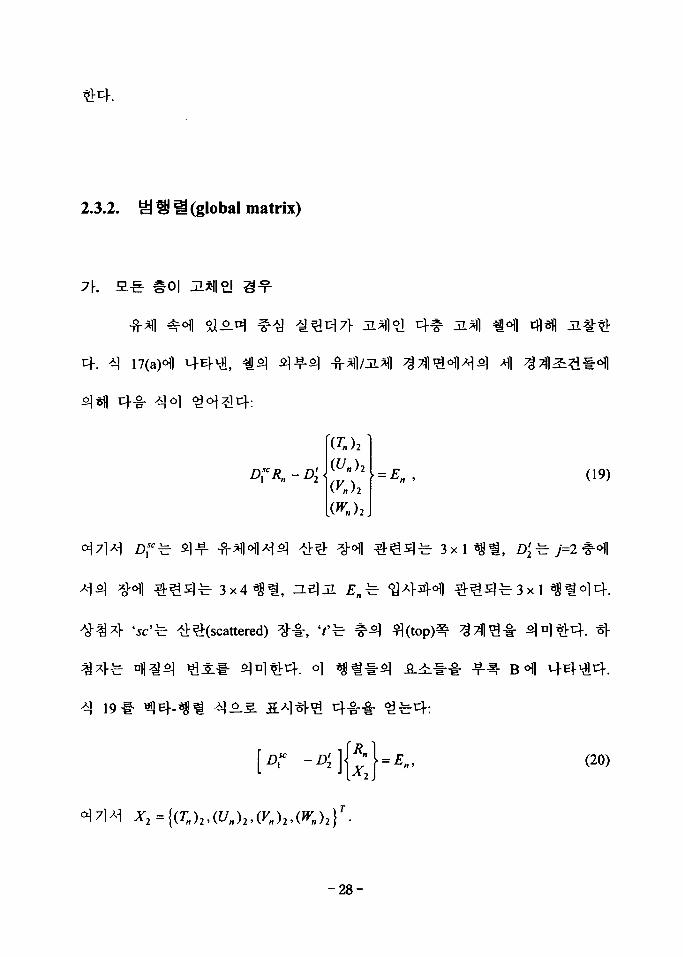
2.3.2. ffl U 1 (global matrix)
(Kh
(19)
^ 3x4 «91,
r^(scattered) ^ " i " , ' ^ ' ^
. o) ^ t l ;
(20)
- 2 8 -
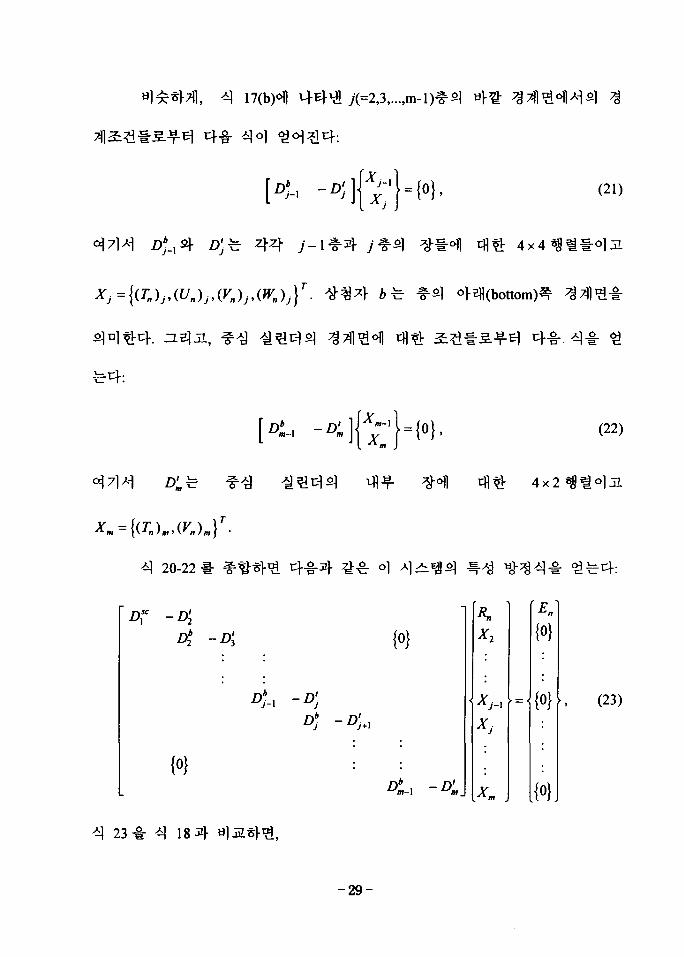
(21)
. ZLE}JL,
(22)
20-22 o] Aj^^o^ ^ .
A* - {0}
Jm-\ Um
\Rn
x2
' Xj_i
[x.
• = .
{0}
{«}
{0}
, (23)
23^- ^ 18 4
- 2 9 -

D\ -
D7-1
o;m-1
(24)
nfl, tfl-^-S]
' —n T ' 9 — n-1 - U> Xm-\ ~ Um-1 (25)
2 2 ^ cf-g-
(26)
2 x 4
n=0
(27)
- 3 0 -

22 4
24 4 A, 4
^ 1 4 3x1 Xm=(T,,)m.
(28)
3x4
J+x = urj, zf_]J+] = 0
24 4 A,2?" £ £
(29)
(30)
B 1
2.3.3.
- 3 1 -

18 4 q 23°IM, # £ 7j)^ Rn±r Cramer
, (31)
\Dn\£r *)^ « 8 ! Dn$\ ^t^(determinant)^i \Bn\-& Dn$
Hankel W
- 3 2 -
^ ^
A u 2^ Z)^ 4:^to)tf.
flJBnl^i(surface admittance) , -ir^-f ^
a], ^ ^ ^5] tfl^. ^ s , Zl^JL
( }
Hankel ^ H™{x)$=
complex conjugate <>]4. 22) )^ , ^^-^-^r Sn-&
(scattering phase shift) 5n ^ ^ . S . i ^ ^ ^ $icf:
5n=exp(2/5J. (35)
- 3 3 -

2.4.
2.2
^nl1i^£l zero-
frequency limits. tflSfl f- - 3 H 4 . ol
o f l ^ u l ^ ^ ^ AOU|. - - 1 ^ofl
o] ^ - ^ AJ W.-O- ^ ^ 7].^- - ^ - ^ HOV^^. z e r o frequency e ^
^^r-s ^ ^ ^ 1 ^ ^ ° 1 § 1 ^ AoV4 -n- 11 € ^ 1 zero-frequency
limit ^ 1 °] ^ ^ ^ 1 W f ^ ^ 1 4
^ ^ 1 , W -fV ll ^ ^ ^ ^ l ^ r S ^ afl-Einm^-I- -fVS^cf. H?)3L 0}
^ 1 ^ ^ ^ zero-frequency limit 1-
Zircaloy-4
- 3 4 -

2.4.1. -^(analogous) T
2-5
36-38
-9-si y(=2,3,..., m -
(36)»=o
n=0
=£eBi-[(7;(I))>yj,(*wr)]cosiie . (38)N=0
^7 = ^ + i ' UJ = UJ+I U = l2,...,m-\). (40)
2.3.2^H H ^ 5J4 ^-^ €^1-1- 4 ^ ^ , ^ 23 4 ^-4-
- 3 5 -
Jn{Xj)XjJn'(Xj)
Pm-l
E -
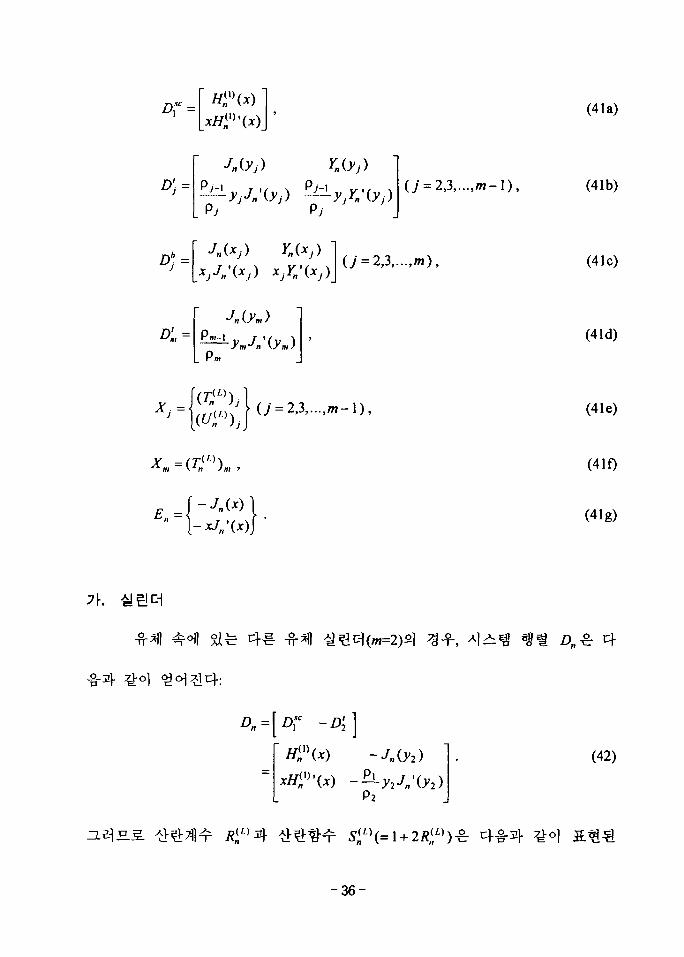
(41a)
(41b)
(41c)
(41d)
(41e)
(41f)
(41g)
-§•4
P2
(42)
- 3 6 -

*-y2^±. (45)P 2 Jniyi)
44
^ 4A]
Hankel ^ - ^ / ^ l ) ( ^ 2 ) 4 ° 1 ^ Hankel
2)^1 Ai ^Aj^o^w.^
^ 1 °14. o] nfl,
- 3 7 -

P. ,. ^•(y2)(SiL))2+H?)'(y1) (47)
£>„
P2
PiP2
(48)
4 3 4 AI 44
" P2
(49)
Bessel t H r ^ Neumann f-^rt- Hankel ^ 1 : 49 fe- 4 ^ 4
47
40.4
- 3 8 -

D ={0} i$ n
P2
o J,0 x^
-
0
0
44
^ 4 ^ 4 7 -0)
(50)
2Hn
P3 JJ
^ ^ 45 °11
. Bessel tJ^rir Hankel
4 7 01
(5^)3 = 1.
(51)
(52)
52
(53)
- 3 9 -

{L)) =^±v. - i ^ — (55)
53 1- ^ 55°fl tfl^*}1^, 4-5-^f £ £ ^^^(recurrence relation)^:
JYB
JYD
^ 1 °)B.S.,
- 4 0 -
(56a)
= Jn'(yJ)Yn'(xJ)-Jn'(xJ)Yn'(yj) , (56b)
= Jn\yj)Yn{xJ)-Jn(xj)Yn\yj) , (56c)
= Jn(yJ)Yn'(xj)-Jn'(xJ)Yn(yJ) , (56d)
= y, (^. )yB (Xj ) - yB (x,. )Yn (yj ) . (56e)

2.4.2. :H
2.2.5
» D(57)
ofl^ol^i^o] Zero-frequency limit
10o)l M-E vfl B e s s e l -%^ Neumann ^-^r^ ^ 4 ^ 1 : ^ : ^ 56 °fl
P, l-ln(l-A,)(Fn( i )(0+
(58a)
(58b)
q.=n J-^ . (58c)
- 4 1 -

(59)
^ n ] ^ ^ F n( L ) (0 + ) ^ ^ 58^1
(60)
^g-f,
2.2.3 11-1-
- 4 2 -

.+£-
2.4.3.
<?l Zircaloy-4 2)
1 0 - 2 0 0 ^ m ^ ^ ^ oiA]-^-xl5.3.^-(ZrO2)
- 4 3 -
( 6 2 )
(63)

2-6 4
1, *\ 3, ZL51JL ^] 9 ^
D?
{0}{0}
D: {0,}
{0} D](64)
Fn^(0+) =- P i
(65a)
1 +
F£Ho*)=*±n . ,, 1;(!.-*')2'\2n
P2
p 3 1 - O -
(65b)
l, Df±. 3 x 1 , £ ) ^ 3x2 , D * ^ D ^ 4x4 ,
^ 2 x 4 9 x 9
C i
- 4 4 -

Figure 2-6. Geometry of a plane acoustic wave scattering from an emptydoublelayered elastic cylindrical shell.
- 4 5 -

fe JL
ZrO2
Zircaloy-4 ^ 4 ^ 6 f l ^^fl ^ ^ t t 4 . ^ ^ - ^ ^ ] ^ f l
>JL ^B]D-]-fi) AJ"ifl-T^ll(/»2)^ 0.1%, 0.2%, 0.5%, 1.
19mm ?1 9 | l ^ * ) ~ f ^ 17x17 < ? ! ^ s ] 4 : a ^ ^-f, ° l ^ ^ r 0.57mm
=0-100, Ax, =0.05
p2=5.6gcm-3, p3 =6.55gcm-3, C, = 1480ms"1,
C2£ =7100ms-1, C^SSOOms"1, C\ = 4600ms"1, C3
r =
Zl^ 2 - 7 ^ 0.1% M|i*l -a-^-^nj.^- ^ ^ - s]^-^ofl tfl*> ^ cf^ 7fl
2-8
Lamb 4°fl 7l«]^4. ^ ^ 2-9
- 4 6 -

20 40 60 80 100
Figure 2-7. Comparison between the inherent background amplitudes(dotted line)and the backscattering amplitudes(solid line) of the lowest five(n=0~4) partial wavesfor the 12% thick, empty Zircaloy shell with lOfam thick ZrO2 layer.
- 4 7 -

3
O
20 40 60
k.,a
80
n=0
n=1
n=2
n=3
n=4
n=12
n=16
n=20
100
Figure 2-8. Resonance spectra of the partial waves for the 12% thick, emptyZircaloy shell with lOjam thick ZrO2 layer.
- 4 8 -

20 40 60 80 100
60 80 100k.,a
Figure 2-9. Resonance spectra of the (a) «=4 and (b) «=10 partialwaves for 12% thick, empty Zircaloy shells with the various thickness
, 20fim, 50|am, lOO^m) of ZrO2 layer.
- 4 9 -

rt]. 3 3 . ^
- 5 0 -

3.1.
ol -(resonance scattering theory: RST)°fl
: 1981 Vl S . ^ Le Havre t f l ^ RipOche iL^r ^ H 5]«fl ^
^- JL^S] $4.[25-28] Quasi-harmonic MIIR(Method of Isolation and Identification of
Resonances)^.
toneburst
4 ^fl^Hl ^3. 7}
, Rayleigh
normal mode number)"^)
- 5 1 -

short-pulse MIIR ofl ^«fl # ^ € T £ &4.[29-30]
FFT(Fast Fourier Transform)^"°-£.tf ^ i ^ j S ^ ^ - Q&ty. °1 yo>
wJ-^l-(quasi-harmonic MIIR 4 short-pulse
^ o)
3.2.
3-1 4 H ^ 3-2^
-52 -

Transmitter/ReceiverTransducer
ReceiverTransducer
Water
Scanner
Pulser & Receiver
(Ritec RAM 10000)
Waveform Digitizer
(Tek.RTD710A)
ADAC4801A GPIB
RS232C
Computer
Controller Printer
Figure 3-1. Schematic diagram of the resonant ultrasound spectroscopy system
- 5 3 -

Figure 3-2. Overall view of the resonant ultrasound spectroscopy system: (a)scanner, (b) turn table, (c) computer, (d) scanner controller, (e) waveformdigitizer, and (f) pulser & receiver.
- 5 4 -

S ] ^ 3(x, y, z)
^ scanner^ turntable, H^JL J2.B]-
5.*}- ^S l -e i , ^^
^ monostatic pulse-echo (MPE) u j " ^ A S <^o] x l ^ z]- ^-^o) ^ > ^ ^ ^ A | &•
^•AQ ^r^l ^-#^1-71- ^ e ) 5 i ^ bistatic pulse-echo (BPE) " J ^
BPE 1 W H ^r^l ^ ^ r f e turn table
. 4 -¥- -
Litec 4^1 RAM-0.25-17.5 Mark VI Mr *}-%-*}Sm. °1 ^ ^ 1 ^ 250
^i 10 MHz ^ o f H ^cfl 1.5 kW (in RMS), 17.5 MHz
1.0 kW(in RMS)^ RF toneburst ^ ^ 1 - V ^ A 1 ^ ^r 9X^-, 78 dB
ADAC4801A ?>=.-!• -i-«l| IBM 586PC °fl
Tektronix/Sony RTD 710A1- ^}-%-t}<^t\; ^ cfl sampling rate fe 200 MHz,
^ ^ r 10 bit, ^ l l i e l ^ 640kB <>14. GPIB 5
- 5 5 -

-^c: Tektronix SPD(signal processing and display) i 5 . S
Panametrics * H VideoScan series(0.50, 1.00, 2.25, 3.50, 5.00, 7.50, 10.00
MHz)t- 4-g-*>^4. ^ 3-3 <HH n ^ 3-9 4*1TT °1
"l-5f Metrotek 4 ^ C403 system^-
1.1 m(L) x 0.6 m(W) x 0.5 m(H) olcf. ^ 2 :
o] ol ig;E<>11 5]«fl ^p-g-ilfe 3(x, y, z)-% scanner 7> ^2)"^cf. o] scanner fe
^ 0.05 mm o)cf. %$-B\9}- SLt\-
fe RS232CS <31€4.
i ] ^ ^ ^ ^ ^ ^ ^ ^^\] %n^= BPE
turn table °fl £]«fl QtfQty. ^l^Nl-c- °1 turn tabled
QQ ^- 3 ^ scanner °fl ^ 2 } - ^ -^-^^1 l l^l l^ jig °fl
3-10 4 ^ - ^ 3-11 r turn tabled 7])x\
- 5 6 -

SIGNAL WAVEFORM
( 2 USEC / DIVISION )
FREQUENCY SPECTRUM1.0
0.8
0.6 ~
0.4 —
0.2 —
0.0
-
-
-
-
.31
j
/
j
1
(
-6dB
\
V615
\
\ ^ _.
\
—I k0 0 0.5
(MHz)1.0
Figure 3-3. Signal waveform and frequency spectrum of the 0.5 MHz transducer.
- 5 7 -

SIGNAL WAVEFORM0.8
0.4 -
0.0
-0.4 —
-0.8
-
-
-
1 1 1
-
-
-
A\fV
( 1 USEC / DIVISION )
FREQUENCY SPECTRUM1.0
0.8 —
0.6 —
0.4 -
0 2
0.0
-
-
-
-
6
j
I
/
/
/
.
6dB
\
\\
.2V\\
..
V
1
(MHz)
Figure 3-4. Signal waveform and frequency spectrum of the 1.0 MHz transducer.
- 5 8 -
WAVEFORMVERTICAL SENSITIVITY:HORIZONTAL RESOLUTION:
200 mv/div.50 us/div
L
JL.
Ar
——
—
/
\\
\
\\ \\\
\0 2 .5SPECTRUMVERTICAL: LINEAR FORMATHORIZONTAL: (MHZ)
5 . 0
Figure 3-5. Signal waveform and frequency spectrum of the 2.25 MHz transducer.
- 5 9 -

SIGNAL WAVEFORM0.8
0.0
-0 .4 —
-0 .8
-
-
-
<
-
-
-
1\\l
A/ '
( .2 USEC / DIVISION )
1.0
0.8 -
0.6 -
0.4 -
0.2 -
0.00.0
FREQUENCY SPECTRUM
-
-
-
-
2.2
/r /J
I/
> // -/
'\\IdB
\j4.4
\
\
y5.0
(MHz)130
Figure 3-6. Signal waveform and frequency spectrum of the 3.5 MHz transducer.
- 6 0 -

WAVEFORMVERTICAL SENSITIVITY:HORIZONTAL RESOLUTION:
BOO mv/div.20 us/div
s
r
///
Y\\\
0 5 .0SPECTRUMVERTICAL: LINEAR FORMATHORIZONTAL: (MHZ)
10.0
Figure 3-7. Signal waveform and frequency spectrum of the 5.0 MHz transducer.
- 6 1 -

WAVEFORMVERTICAL SENSITIVITY:HORIZONTAL RESOLUTION:
200 mv/dlv.10 us/div
s
AI 1\
/I 111J
V
J
/
/
f\/T~
\\\
\\
\ \0 10.0SPECTRUMVERTICAL: LINEAR FORMATHORIZONTAL: (MHZ)
20.0
Figure 3-8. Signal waveform and frequency spectrum of the 7.5 MHz transducer.
- 6 2 -

WAVEFORMVERTICAL SENSITIVITY: 200 mv/rlivHORIZONTAL RESOLUTION: • 1° u s / 1 i \
A A
A 1.1M
///
//
:
\\\V\
1
0 10.0SPECTRUMVERTICAL: LINEAR FORMATHORIZONTAL: (MHZ)
20.0
Figure 3-9. Signal waveform and frequency spectrum of the 10 MHz transducer.
- 6 3 -

mracnoN TABU
Figure 3-10. Drawing of the turn table.

Figure 3-11. Photograph of the turn table.
- 6 5 -

turn table 3\$\ sliding guided *!*13£- jig °fl
Turn tabled 3 3 £ r 500 mm °\5L IM^r^r ^?H1 A}°)^\ 7]$^ 200 mm
tabled 0.5
turn tabled i ^ ^ S-Er^ EJ-O|XJJ ^ E ^ ] s]«fl
scanner 5] z
5 turn
3.3. £
3-12 ^ H ^ 3-13
Westinghouse 14x14
MPE ^ ^ A
o] 10.6 mm < ]J1 ^ ^ ^ 0.6 mm
H.2%
4 4 1 MHz Sf 2.25 MHz
. Zircaloy-4 2 ) 4 ^ «e|-g- 7>^5] ^- *}6\7}
3-13
- 6 6 -

I
I» 03
1 -
-1 -
-2
liSllli I i
•Hil 11 N H|fffTfw
50}isec
• i
Time (
Figure 3-12. Backscattering echoes obtained from the fuel rod using the 1 MHztransducer.
I
20 40
Time(^s)60
Figure 3-13. Backscattering echoes obtained from the fuel rod using the 2.25 MHztransducer.
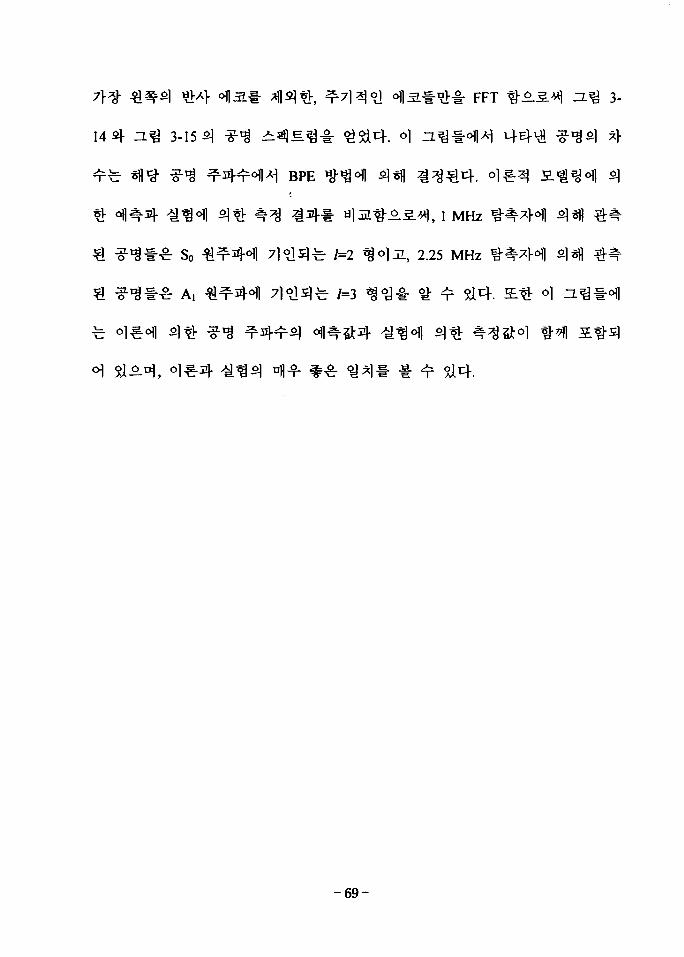
f n J | - FFT &6. 3-
14 3-15
So
A,
°1
BPE
14 , 1 MHz
2.25 MHz
0} n^i-
- 6 9 -

1.0 -
0.0
n=8 (1.035, 1.032)
n=9 (1.157, 1.156)
n=10 (1.284, 1.280)
n=11 (1.401, 1.402)
n=12 (1.523, 1.523)
n=13 (1.641, 1.642)
0.25 0.50 0.75 1.00 1.25Frequency (MHz)
1.50 1.75 2.00
Figure 3-14. Resonance spectrum of the cladding tube obtained using 1 MHz transducer.Here, n denotes the normal mode number. Left number in the parenthesis is resonancefrequency measured experimentally and right number is resonance frequency calculatedtheoretically.

1.0
0.8
<u
0.0
2.1
n=13 (2.705, 2.
2.4
n=14 (2.788, 2.780)
n=16 (2.954, 2.952)
2.7
Frequency (MHz)
3.0 3.3
5BFigure 3-15. Resonance spectrum of the cladding tube obtained using 2.25 MHztransducer. Here, n denotes the normal mode number. Left number in the parenthesis isresonance frequency measured experimentally and right number is resonance frequencycalculated theoretically.

4.1. MB
BBR *\4\ FFRDS(failed fuel rod detection system),[31] D]^- B&W(Bobcock and
Wilcox) 4 5 ] Echo330,[32] ANF(American Nuclear Fuel) *}$] Ultratest [33] %-°)
£ 2-3 mm) ^ L ^ S ^ e 7 r
) 100%
(Zircaloy-4/1-) ^ ^ 1 ^ ^ H H ^ ^
- 7 3 -

Receiver
Transmitter
Probe
Path of Ultrasonic Pulse
Fuel Rod
a) B & W Type
Transmitter
Fuel Rod
Receiver
Path of Ultrasonic Pulse
b) BBR Type
Fuel Rod
Probe
Path of Ultrasonic Pulse
c) ANF Type
Figure 4-1. Different vendors' probes of ultrasonic testing (quoted from Reference [2]).
-74-

Si71 nfl-g-o]cf.
FFRDS ^ ^
34.
o] 2:^.
i~2 ^isec
, 36]
BBR
FFRDS °fl^
3.7]
34.
O] 7 ^ ^ tfl7fl
- 7 5 -

30 S. zM-
330^: ^r^l^ i^g-4 ^151^ $3.^ #3^7}
^fi.^- ifl^-5] #21 ^ o H-cHl n -E). ^ A l ^ ^ ^ - ^ A}Jr^
717]- ^*>4. nl£) £ 3 3 ^ ^ 1 - ^'HM-^ 3713]
Echo330^r
. Ultratest °
71 fi] 9\^$\ ^ ^ 1 ^ 4 . Echo330^1M- Ultratest^ ^-
7fl -ofl xltj.. o]
wave)S
- 7 6 -

(So)
. So
MHz
^-4 -ffl S #1-71
3 MHz 4 dB ^ £ 2 1 «OU}
(A,)
a.-9-s.
4.2.
4-2 Sf a ^ 4-3^8: 4 4 711^3.
- 7 7 -

Ultrasonic strip sensor
Water \Fuel rods
Scanner
Flaw Detector
(Sonic 237)
AD
Waveform Digitizer
(Tek. RTD710A)
RS232C
GPIB
Computer
Controller Printer
Figure 4-2. Schematic diagram of the leak-defective fuel rod detection system
- 7 8 -
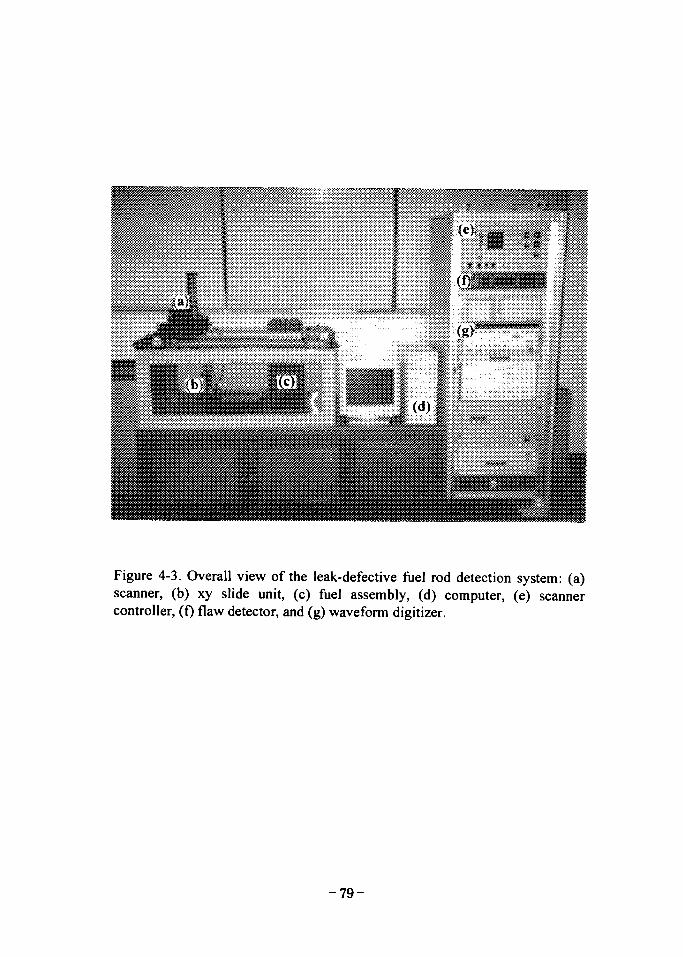
Figure 4-3. Overall view of the leak-defective fuel rod detection system: (a)scanner, (b) xy slide unit, (c) fuel assembly, (d) computer, (e) scannercontroller, (f) flaw detector, and (g) waveform digitizer.
- 7 9 -

^ 3(x, y,
z) ^ scanner, o] ^ # 3 } - ^ ^ - * } ^ ^ -g -4 H.S.«-1-
slide unit, ^L^Jl SLE]- ^ S
4.2.1. S ^
Staveley Instruments ^>^ Sonic 237 i - i - ^ ^ ^ 7 ] (flaw detector)!- ^
. °1 ^ ^ 1 ^ " dual voltage square wave pulser, RF display mode, dual flaw
gates ^--i: S.®*\JL &6.*\ RS232 1- -*fl
Pulser
Type Square wave
Pulse Amplitude Selectable 150 or 300 volts
Pulse Width 30 to 1,000 ns
Modes Pulse Echo, Dual, or Through Transmit
Receiver
Bandwidth 0.3 to 20 MHz (-3dB)
- 8 0 -

Gain
Display
Timebase
Pulse Repetition Rate
Delay Range
DualjGate
Gate Functions
Gate Start and Width
Analog Output
Oto lOOdB in 0.2dB steps
RF, Halfwave+, Halfwave-, Fullwave
150 Hz to 10 kHz in 50 Hz steps
-10 to 3,200 \is
Gate 1: peak detection and flaw alarm
Gate 2: peak detection and selectable thickness
or flaw alarm
0 to 3,200 us
0 to 5 volts full scale for 0 to 100% full screen
height signal.
Updated at the repetition rate.
4 *J J xJS.ui H P Id*L»L* -*— n -**r — - E - —
4-4
BNC
: 1.2 mm)
i , BNC Tfl ?)
- 8 1 -

Figure 4-4. Photograph of the ultrasonic probe.
- 8 2 -

4.3 ^ H *HI*1
4.23.
Metrotek A>^ C403 system^:
1.1 m(L)x0.6m(W)x0.5 m(H)
} ^ 3(x, y, z )# scanner 7} ^ ^ ^ t j - . ZL^ 4-5 °fl
l ^ slide unit oil # ^ 4 . °1 slide unit ^ z
scanner^ 2
-al- £SHf (x, y)
mm RS232
l fe slide unit
°1 (x, y)
4 - 6 ^ : slide unit £]
^ 0.05
7>o]
4.2.4.
Westinghouse 14x14
- 8 3 -

Figure 4-5. The ultrasonic probe mounted in the xy slide unit.
- 8 4 -

,1 „ Iw I,
I
8
©<D
l±JLd
0--~- 8
F i .j I j .
X-AX/S SMOKE 250
X-JX/S
m
IT-AXB SUDE UNIT
, . . i- — i—.
Figure 4-6. Drawing of the slide unit.

4.3.
4.3.1.
1.2 mm
mechanical damping factor 1- ^ ) ^ air backing *1 °fl JE.
^ ^ r c f l^^-^ : ^VJL, £;E<2}- »8-A].^O)| H I J E ^ ^ ^ lead
m e t a n i o b a t e 4 | ] ] § l l > ^ 4 l J ^ f ^ ^ ^ ^ ^ 4
Frequency : 3.0 MHz
Thickness: 0.5 mm
Acoustic impedance : 20.5x10^ kg/m^sec
- 8 6 -
LM Crystal(0.5 mm)
Backing Layer(0.5 mm)
Figure 4-7. Schematic diagram of the ultrasonic sensor designed for fuelassembly inspection.
- 8 7 -

°J A 4 (= sin"1 (CxICp)* 14.3°
.6 min)
1480 m/s o]5L Cp^ 3.0 MHz °1H A,
6000 m/s
. Air backing^: ^ l * f ^ i
0.2 mm -T^ I I^ aluminum foill-
air backing^
0.5 mm 7>
o]
"3! -i" Teknovit 3040^1 1/4
Acoustic impedance : 2.6x10^ kg/m^sec
Acoustic velocity : 2400 m/sec
Density: 1.1 g/m^
3.0 MHz ^ ^ - 4 ^ 1/4 4 ^ ^ : 0.2 mm
- 8 8 -
4.3.2.
impulse response
Impulse response ^ ^ ^ w l s . ^ UltraPac ^1^.^-i- 4-§-^>S^^. °1 A l ^
2\ ^ - § - 4 ^ ^ A i 7 ] ^ Accu-TronInc.^ Model 101OPR
4-8^: 4.3.1 ^ H ^ ^ ^ ^j^S] ^ i f -fr*W7l^ €>H housing
f. °1 housing^ 4^^
^•^•a 1.2 mm ^ . € ^ # strip ^
7} -g-olsl-SL^ o] housing^ t f l^e l^ 2^^ -S . ^3j-i|$jl4. vfl-?- ^B^-el^ 7V
slit 4 ^-^^r z | ^ ^^r^l tf^ldfc^H ^ ^ ^ ^ silver ribbon^ v)*H -§-
die
die $] ^fl^-cr ^• is^-T?!om-. ^ A i ^l2l'A] housing £•
- 8 9 -

0.3
2-00.6 0.6
Figure 4-8. Drawing of the ultrasonic sensor housing
- 9 0 -

°1 die
^ 3 3 8 mm, £°1 0.25 mm
0.2 mm
Micro-Coax Components,
0.58 mm °]JL 3.°}$] ^ j^^r 0.13 mm
^ ° f l , ^ l 3 1 ! ^ sensor housing 3) slit °fl
housing^ silver ribbon «>fl ^1 «B
Silver ribbon
•a-^i^-^- * H ^ ^ >floll"i- ^ l*>7l fl«fl A>-g- cf. n]^- California
Fine Wire Company 5] *flf-°-5. 3.7)^ 0.001 x 0.025 (mil) °}JL £5.^ 99.99%
Probe strip
-g-1- 4 ° l S . €%^1 ° 1 ^ 1 ^r 51^^- 0.5 mm ^ 1 ^ SUS plate
- 9 1 -

7. in L | VB
112 11 . 910
U r . AI11
T
109 ~ ^
3340
I
Figure 4-9. Drawing of the probe strip.

fixture 7} ^ . 1 ^ 2 S £M $1 cf
Strip holder
4-10 £ 1 S 1 i l l W ^ l *H4 £ ^ o l 4 . °1 * ^ , ^ 4-5
, slide unit°fl ^^"S]^ H S H i S ^ ^ l 'S-S.-g-i: ^}°}S.
. °] *C1 ^°fl^ *M) - ^^ 711 o]#3)- BNC
4.3.3.
. -g-
1) ^ u l ^ ^ r M " 5 ! impulse response -t #^^f^ ^4) ^4^r(3.0 MHz
2) \kn3--z: 2M- ^r-g-^M < tf^4i41- i l * l€ 3.7|(2 mm x 4
impulse reponse 4r 4^1
- 9 3 -

1EL
NO|P/NUIC
SSgSraB
™ ~ " - • —
*s*
MATERM. | Q'TY | SPEOTICWON j RCMARK
• u
U/T PROBE HOLDER
YL-KO2OO " " * ntOBEDO | "
Figure 4-10. Drawing of the probe strip holder.

3) °^±7\-S.t^ 0.2 mm ^ i ^ 3.7]$] aluminum foil •§•
4) i r u l € aluminum foil ^ -fre)^: ^ofl ^-JL H $)<=)) silver ribbon tfi°] 10
mm ^JE) #^-g- ^ H ^ t f . ^nfl, snVer ribbon °1 4*\ housing £] -f- ^
aluminum foil °fl tfl silver ribbon ^ $\ *) °ll -
5) 4 ^ 4)°fl>H § « 1 ^ aluminum foil 4 silver ribbon-§: ^ SJ-g- ^ tape S.,
] * } - ^ 7}#z}B\7} silver ribbon ^ ^ | aluminum foil 5] 71-^fel-i- 0.1
mm
6) 4 ^ 5) 1 1 4 1 - i - -n-^^r°flAi tfl^^^ aluminum foil
tape i ^
°fl#Al7> aluminum foil 4
air backing ^ 3 ° 1
7) # S l i * f 3 a)"^ ^ 7 1 - ^ ) - ^ ^ t a p e ^ . ^ . s H3^vfl
4 silver ribbon ^ -r" ^ ^ ^ - S . *}<$ impulse response 1r
8) ^ 4 ^ 1)~8)^- ^-^-*>^ air backing -g- aluminum foil 4 silver ribbon
9) ^o]7> 40 mm ^§£^1 ^1^1 - ^ ^ ?H^1- 2 7flt-
- 9 5 -

11)
housing^
housing •§- ^ J ^
^il^-R- die 3] ^°o> l-#^-7> ^ ^ housing^
die <H1 ^r^^l-71) # ^ ^JL, 4 ^ 1)~9H^ ^ w ] ^ ^ ^ ^ 4 1 " die
14) 4Ui housing ^^-°fl^1 ^ ^ ^ . 4 ^ 1 silver ribbon # ^ " 4 ^Afl
2 4 ? } housing 4 3 # 3 * 1 # ^ < a i € ^r 9XS.^ ribbon 4 3.*}$
15) <y-#:fc*}fi] siver ribbon
silver ribbon 4
silver ribbon A
housing^ w>^ofl f- - ^-g.^- ^ i J E ^ # die
- 9 6 -

die
die
housing^
>H housing T2-^ -SMW silver paste
20) Teknovit 3040 ^ - ^ * ^^-^ofl ^ ^ # 4
housing Ml- -ofl 7rt.Vcf. ol
21)ol)S.A]7l- ^^ i* l ^ - ^ cf-g- ^ M ^ dieoflA^ t^)^ vflc}. ^ 1 ^ housing
tb ^ , impulse response
23) €>H housing^ slit -¥-fl ^^<^1 ^ 2mm ^ £ ^ ) ^ 'S- i - #
24) Siver ribbon 5] ^ #-^-^-ofl ^"^r =7fl ^^1 ^ , 10 mm
# 4 . 4 ^ 24)<Hl i n v # ^ ^1 ^-ig ^ ^ 5 . o] silver ribbon •§:
°1 Sa^- -¥-fl^- °J"^4iXH ^ o i ^-o} o j ^ « - ^ ^ ^Q^ housing^ slit
ofl fl^l^tj-. ^ ^ 4 i 4 5 | -2 .*!34 silver ribbon^: ^ 7 l « ? ] ^ ^ <?!^?!:4.
° H •y^^i " S ^ •y*!! °J-^4i^7r £ # 3 * 1 ^ ^ ^ - ^ ^ t > 4 . Silver ribbon
#-8: ^l^i housing 2] slit <Hl J\$\ ^ ^ ^ silver paste
- 9 7 -

25) Teknovit 3040 ^ - ^ *
housing vflofl &^r ##4:*1- ^ ^ ^ 71-3:4. ° H . S i ^ ^ 4 ^ 24) >H
, housing^
sand paper 3 . i ^ ^ i ^ T f l ^ ^ j - ^ A ^ ^JA^O] im p u i s e response
28) M ^ 4 BNC ^ol l-g- ^ S ^ ^C-H ^-oj^. ^ o] ^ d ifloJH n]Afl
BNC Tflol-g-g. 0^^3:4 o] <g^
- 9 8 -

#?*:•§• ^3) I ' l l (global matrix approaches *r*l3j- t\
^l (boundary matrix)"
o) «OV^ . 4 0 ^ ^ tfl«. ^ t - ^ -^ ^ ^ <?lS -oll tfl
*n ii(jn. n n vfl^si ^ 4 1 - ^ I ^ - ^ - f H tfltt i ^ "D^Dj^^o] zero.
frequency limits, cfl^l^^ ^°14. °1 $\*\}^ 4 ^ 4
o)
1) 430] z e r o .
frequency limit S . ^ 0} #>=. ^ H . ^ . .O] - ufl^ ^
- 9 9 -

£ 1
. O] X\ +
, i>a^ S.4°fl 2(x, y) ^ slide unit 4 turn table,
^l-ei -f-
^ . ^ § 1 - ^ monostatic pulse-echo (MPE)
bistatic pulse-echo (BPE) UO
V)^^- BPE turn
table
- 1 0 0 -

^ 3(X) y>
z) ^ slide unit, 3.^3. £.Ef
HiXTleft BLANK

A.
5 x 5
rf!3 =(2«2 -x r2 )y n (x i ) -2^ i K r t ' ( ^ ) ) rfI4 =2n[xTJn\xT)-Jn{xT)l
dl5 =2n[xTYn'(xT)-Yn(xT)], d2l =-xlHin1)'(xi),
d2i^xLJn'(xL), dn=xLYn'(xL), du=nJn(xT), d25=nYn(xT),
di2 =2n[Jn(xL)-xLJn'(xL)], di3 =2n[Yn{xL)-xLYn\xL)],
du=2xTJn'(xT) + [xT2 -2n2)Jn(xT), d35 =2xTYn'(xT) + [xT
2 -2n2]Yn(xT),
dn =(2n2 -yT2)Jn(yL)-2yLJn'(yL), dA3={2n2 -yT
2)Yn(yL)-2yLYn\yL),
d44 =2n[yTJn'(yT)-Jn(yT)], d45 =2n[yTYn\yT)- Yn(yT)],
d* -2n[Jn(yL)-yLJn'(yL)], d5i =2n[Ytt(yL)-yLYn'(yL)],
[yTz -2n2]Jn(yT), d55 =2yTYn<(yT) + [yT
2 -2n2]Yn(yT),
- 1 0 3 -

B. c« S2|- ZL
scattered
1st medium
P2
du dn dn du
d2l d22 d2i d24
*31 33
top
2nd layer
du =[2n2 -{yT2)
2\Jn{y^-2y$Jn'{yh
dn =[2n2 -(yT2)
2]Yn(y$)-2y2LYn'(y2
L)
du=2rHyT2Yn\y
T2)-Yn{yT
2)]
dn=2n[Yn(y2l)-y2
LYn'(y2L)]
dv=2yT2Jn'(y
T2)-[2n2 -{yT
2)2]Jn{yT
2)
34 =2ylYn'(yl)-[2n2 -(yT2)
2}Yn{yT2)
d22=y2Yn\yL
2)
-105-

dn dn dn dH
i\
i\
42
top
7th layer
d3l =
j )2 }Y(yj-{2n2 - (yj )2 }Yn(yj
- 1 0 6 -

dudn
dn
dn
dnd22
dndn
dud23
dll
dt3
dud*dudAA
bottom
yth layer
du=nYn(xJ)
=Yij[2xTjJn'{xT
j)-{2n2 -
- 1 0 7 -

d2X d22
top
mth layer
d22=yl,Jn\yTm)
TmJn'{yT
m)- Jn{yTm)}
43 =iim[2yTmJn'(y
Tm)-{2n2 -(yT
m
—P2
^ 71
xjT=yj'T(l-hj) (J=2,3,..,m-\)
y (/=2,3,...,/«)^ 4
-108-
Lame constant^

dn
i-l)th layer
dn={2n2 -{xTm_x
dn=2n[xTm_xJn\x
Tm_x)-
-2n2]JAxTm_x),
- 1 0 9 -

bottom
(m-l)th layer
du={2n2
du={2n2
diA =
"21 = Xm-
dn=2n[Yn{xLm-X)-xL
m_xYn'{xLm-X)l
d,3=2xTm_xJn'(x
Tm_x) + [(xT
m_x)2 -2n2]Jn(xLx),
d» =2xTm_xYn'(x
Tm_x) + [(xT
m_x)2 -2n2]Yn(x
Tm_x).
-110-

[".]•u
0
top
with layer d2l=-ymrn'(ym)
Kl-'31 *32
M3 U14
" 2 3 " 2 4
^ 3 3 ^ 3 4
bottom
(/-l)thlayer
du={2n2 -(xU)
du={2n2 -{xl,
dn=2n[xlxJn\xJ_x)-Jn{xU)\
d24=nYn(xlx).
d33 =2xJ_xJn'{
di4 =2xlxYn\
-2n2]Jn(xU),
-2n2\Yn{xlx).
- I l l -

"21
0
" 1 2
* 2 2
0
top
Ah fluid layer
—Pf-l
11 dn
"21 " 2 2
0 0
bottom
fth fluid layer
P/+1
Pi
- 1 1 2 -
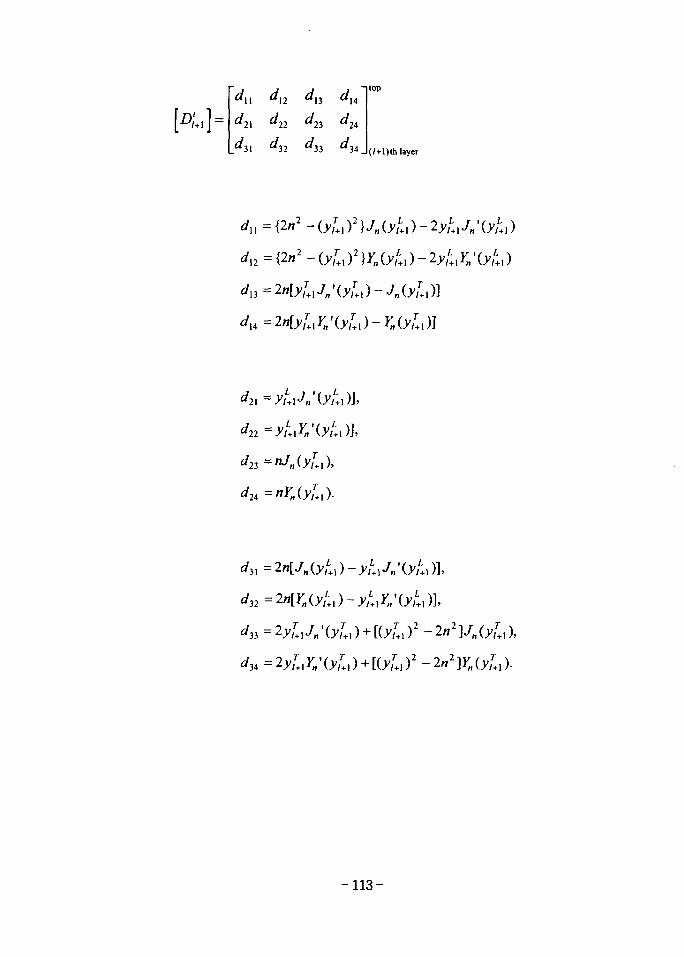
^11 ^12 ^13 ^14
d2\ d22 d2l d2i
d3i dn da dMj
top
(/+l)th layer
dn={2n2 -(ylx
yix)2 -2n2}Jn(ylx)
J+x)2 -2n2]YM(ylx).
-113-

= m-\ %•*]
3x2 DflE^i
22
top
mth layer
du ={2n2 -{yTm)2Jn{y!;,)-2yL
mJn<{yLa),
dn=2n[yTmJn\y
Tm)-Jn{yT
m)l
n={2n2 -{yTm)2)Jn{yT
m)-2yTmJn\y
Tm).
- 1 1 4 -

Mi o | ^
9x9
={2n2 -{yT2)
2}JM)-2y^Jn\
dv=2r,[Yn(y2L)-y2
LYn'(y21)],
i5=2y2TYn'(y2
T) + [(y2T)2 -2n2]Yn{yT
2),
ds2 ="Jn(x2),
</21 =-*,#<'>'(*,),
u =nJn{xT2),
15i=nYn(x2L), dsl=-nYn{y$]
d59=-y^
- 1 1 5 -

d62 ={2n2 -(x2T)2}Jn(x2
L)-2x2LJn'(x2
L),
db,={2n2 -(x2T)2}Yn(x2
L)-2x2LYn'(x2
L),
dM=2n[x2TJn'(x2
T)-Jn(x2T)],
d65=2n[x2TYn'(x2
r)-Ytt(x2T)],
d69 = -(fi3/fi2 )2»D>3rYn\yl) - Yn(yl)l
d72=2n[x2LJn'(x2
L)-Jn(x2L)],
dn=2n[x2LYn'(x2
L)-Yn(x2L)],
dli={2n2 -{xT2)
2}Jn(xT
2)-2xlJn\xT
2),
d15={2n2 -{xT2)
2)Yn{xT2)-2xT
2Yn\xT
2),
d16 =-(ii3/ii2 )2n[y3L Jn • (y3
L) - Jn (y,L)],
= 2x\Jn'(x3L [(jc3
r )2 - 2n2 ]Jn (xt),
[(xl)2 -2n2]Yn(x3L),
d96=xlJn'(xiL),
dg7=x,LYn'(XiL),
d9S =
-116-
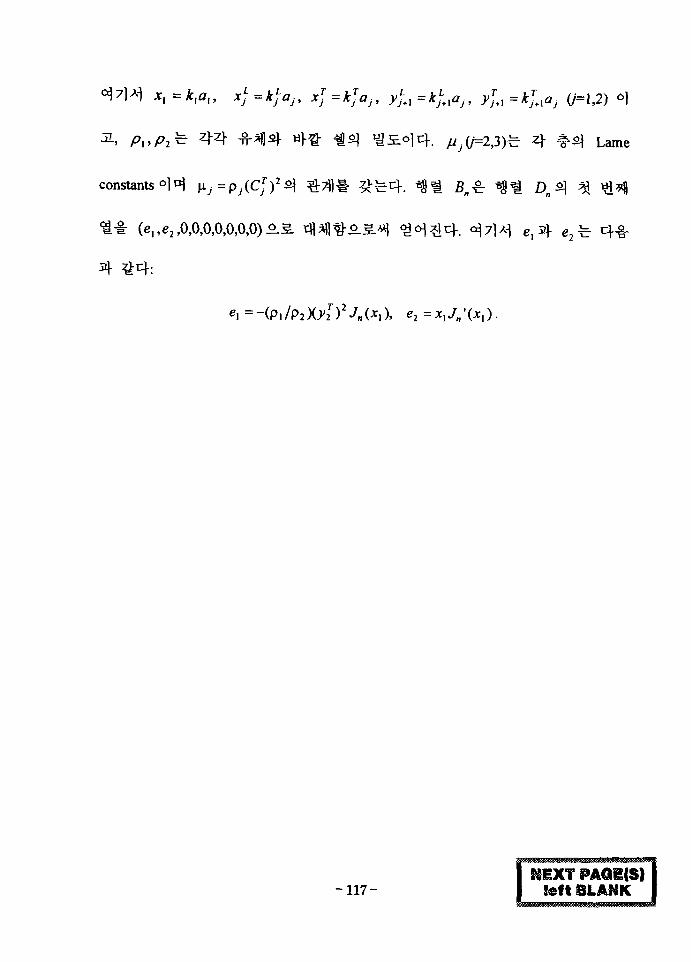
x}=k}aJt x]=k]Oj, y^-k^aj, yl,=kTJ+xaJ (,=1,2) o)
^(/=2,3)^ 4 * ^ Lame
constants
« i * (e,,«2,0,0,0,0,0,0,0)^.3.
4
I HiXT PAQI(S)!ef 18LANK

S"
1. J. T. A. Roberts, "Nuclear fuel NDE", The 3rd International Conference
Proceedings on the Nondestructive Evaluation in the Nuclear Industry(1980), pp.
23-45.
2. 3 $ i f , " C E ^ fS\<^S. A i « | i 7 | # £>*J", KAERI/EP-113/88 (1988), pp.
24, 66; "KWU 4 ^ 1 *%<&£- - H H 1 ^ 7 ] £ £ - ^ ", KAERI/IM-95/87 (1987), pp. 5.
3. M. S. Choi, M. S. Yang and H. C. Kim, "Detection of leak-defective fuel rods using
the circumferential Lamb waves excited by the resonance backscattering of
ultrasonic pulses", Ultrasonics 30, 221-223 (1992).
4. 3 M 34*1, "-S-4^
*1 ^ 074872 3. (1994).
5. 3 ^ ^ 2 ? 1 , «a-S-3|
# 7fl^",KAERI/RR-1545/94 (1995).
6. J. D. Murphy, J. George, A. Nagl and H. Uberall, "Isolation of the resonance
component in acoustic scattering from fluid-loaded elastic spherical shells", J.
Acoust. Soc. Am. 65, 368-373 (1979).
7. V. M. Ayres and G. C. Gaunaurd, "Acoustic resonance scattering by viscoelastic
objects", J. Acoust. Soc. Am. 81, 301-311 (1987).
8. N. D. Veksler, "Intermediate background in problems of sound waves scattering by
elastic shells", Acustica 76, 1-9 (1992).
- 1 1 9 -

9. M. F. Werby, "The acoustical background for a submerged elastic shell", J. Acoust.
Soc. Am. 90, 3279-3287 (1991).
10. G. C. Gaunaurd, "Hybrid background coefficients to isolate the resonance
spectrogram of submerged shells", J. Acoust. Soc. Am. 92, 1981-1984 (1992).
11. A. N. Norris and N. Vasudevan, "Acoustic wave scattering from thin shell
structures", J. Acoust. Soc. Am. 92, 3320-3336 (1992).
12. P. M. Morse and K. U. Ingard, Theoretical Acoustics (McGraw-Hill, Inc., New
York, 1968), pp. 425-426.
13. D. G. Crighton, A. D. Dowling, J. E. Ffowcs Williams, M. Heckl, and F. G.
Leppington, Modern Methods in Analytical Acoustics: Lecture Afote^Springer-
Verlag, New York, 1992), pp.510-523.
14. A. N. Norris and D. A. Rebinsky, "Acoustic coupling to membrane waves on
elastic shells," J. Acoust. Soc. Am. 95, 1809-1829 (1994).
15. X. Y. Huang, "Energy dissipation in sound scattering by a submerged cylindrical
shell," Acustica 77, 221-231 (1992).
16. L. W. Anson and R. C. Chivers, "Ultrasonic scattering from spherical shell
including viscous and thermal effects," J. Acoust. Soc. Am. 93, 1687-1699 (1993).
17. J. P. Lee, J. H. Song, and M. S. Choi, "The effects of material attenuation on
acoustic resonance scattering from cylindrical tubes, Ultrasonics 34, 737-745
(1996).
18. G.N. Watson, A Treatise on the Theory ofBessel Functions(Cambridge University
Press, London, 1966), 2nd ed., pp.199.
- 1 2 0 -

19. G.C. Gaunaurd and M.F. Werby, "Acoustic resonance scattering by submerged
elastic shells," Appl. Mech. Rev. 43, 171-208 (1990).
20. M. J. Lowe, "Matrix techniques for modeling ultrasonic waves in multilayered
media," IEEE Trans, on ultrasonics, ferroelectrics and freq. control, 42(4), 525-542
(1995).
21. C. Randall and F. E. Stanke, "Mathmatical model for internal ultrasonic inspection
of cylindrically layered structures," J. Acoust. Soc. Am. 83, 1295-1305 (1988).
22. W. T. Thomson, "Transmission of elastic waves through a stratified solid medium,"
J. Appl. Phys. 21, 89-93 (1950).
23. N. A. Haskell, "Dispersion of surface waves on multilayered media," Bull. Seism.
Soc. Am. 43, 17-34(1953)
24. L. Knopoff, "A matrix method for elastic wave problems," Bull. Seism. Soc. Am.
54,431-438(1964)
25. G. Maze, B. Taconet, and J. Ripoche, "Influence des ondes de "galeri a echo" sur la
diffusion d'une onde ultrasonore plane par un cy;indre," Physics Letters 84A, 309-
312(1981).
26. G. Maze, J. Ripoche, A. Derem, and J. L. Rousselot, "diffusion d'une onde
acoustique plane par des cylindres solides immerges: etude experimentale et theorie
des resonances," Austica 50, 39-50 (1982).
27. A. Derem, J. L. Rousselot, G. Maze, J. Ripoche, and A. Faure, "Diffusion d'une
onde ultrasonore par des tubes remplis d'air immerges dans I'eau," Austica 55, 69-
85(1984).
- 1 2 1 -

28. J. Ripoche, G. Maze, and J. L. Izbicki, " A new acoustic spectroscopy: resonance
spectroscopy by the MIIR," J. of NDE 5, 69-79 (1985).
29. G. Quentin, M. de Billey, and Hayman, "Comparison of backscattering of short
pulse by solid spheres and cylinders at large ka" J. Acoust. Soc. Am. 70, 870-878
(1981).
30. M. de Billey, "Determination of the resonance spectrum of elastic bodies via the
use of short pulse and Fourier transform theory," J. Acoust. Soc. Am. 79, 219-221
(1986).
31. F. D'Annucci and R. Scharpenberg, "Operational experience of ultrasonic testing on
fuel assemblies with FFRDS", Nuclear Europe .5, 23-24 (1985).
32. Bobcock and Wilcox, "Echo sounds out failed fuel", Nucl. Eng. Int. 31, 45-46
(1986).
33. T.R. Blair and L.F. Van Swam, "Looking for leaks with ultratest", Nucl. Eng. Int.
31,44-45(1986).
34. %%^ $\ 5*1, " 3 ^ 3 . 4 £ « l £ £ . ^ ^ l - f ^ H ^ " , KAERI/RR-638/87
(1987).
35. £ ^ « £ , % 1 ^ 2] 23 «?!,
T02 (1990).
36. # 3 1 3} 4<y,
1609/96 (1996).
", KRC-88N-
", KAERI/RR-
- 1 2 2 -

37. H. C. Kim, M. S. Choi and M. S. Yang, "Resonance scattering of acoustic waves
from circular cylindrical shell and circumferential wave propagation", J. Korean
Phys. Soc., Vol.22(1989), pp. 176-180
38. M. S. Choi, H. C. Kim and M. S. Yang, "Propagation characteristics of elastic
circumferential waves in nuclear fuel cladding tubes", Ultrasonics.30, 213-219
(1992).
- 1 2 3 -

INIS
KAERI/RR-1680/96
^ ^ -9(»1 Bj-^iS 7}7l#
1997. 2.
123 p. -B-(O), -¥-( ) 71 26 cm
«i
^ ^ ( s c a t t e r e d field)ofl>Hll (background)
^Di^A-s. ^(analogous)
i ^ P l ^ i ^ zero-frequency limits,
105]
1.2

Bibliographic Information SheetPerforming Org.
Report No.
KAERI/RR-1680/96
Title
Sponsoring Org.
Report No.Standard
Report NoIMS Subject
Code
Development of Nuclear Fuel Rod Inspection Technique UingUltrasonic Resonance Phenomenon
Project Manager
Researcher and Dep.
Pub. Place
Page
Note
Classified
Sponsor
Myoung-Seon Choi (NDE R&D Dept.)
Young-Sang Joo, Hyun-Kyu Jung, Yong-Moo Cheong(NDE R&D Dept.)
Taejon
123 p.
Pub. Org.
111. and tab.
KAERI
Yes(O), No( )
Pub. Date
Size
1997. 2
26 cm
1996 Research Project
Open(O), Outside( ), Class Report Type
Contract No.
Research Report
Abstract
The scattering of plane acoustic waves normally incident on a multilayeredcylindrical shell has been formulated using the global matrix approach And asimple way to fomulate the non-resonant background component in the fieldscattered by an empty elastic shell has been found. This is to replace thesurface admittance for the shell with the zero-frequency limit of the surfaceadmittance for the analogous fluid shelKi.e., the shear wave speed in the elasticshell is set to zero). It has been shown that the background thus obtained isexact and applicable to shells of arbitrary thickness and material makeup, andover all frequencies and mode numbers. This way has been also applied toobtain the expressions of the backgrounds for multilayered shells.
The resonant ultrasound spectroscopy system has been constructed tomeasure the resonance spectrum of a single fuel rod. The leak-defective fuelrod detection system of a laboratory scale has been also constructed. Prticularly,all techniques and processes necessary for manufacuring the ultrasonic probe ofthin (1.2 mm) strip type have been developed.
Keywords
resonance, scattering, fuel rod, multilayered shell, ultrasonic testing