A review of the non-destructive identification of ... - CiteSeerX
24
A review of the non-destructive identification of diverse geomaterials in the cultural heritage using different configurations of Raman spectroscopy DAVID C. SMITH Museum National d'Histoire Naturelle, Laboratoire LEME, USM0205, 61 Rue Buffon, 75005 Paris, France (e-mail: [email protected]) Abstract: Non-destructive Raman microscopy (RM) applied to geomaterials in the cultural heritage is reviewed by means of explaining selected examples representative of the differ- ent kinds of geomaterials that can be characterized and of the different kinds of analytical configuration that can be employed. To explain the versatility and considerable analytical potential of RM that result from its unique combination of capabilities, the first sections summarize the theory and practice of the method and its advantages and disadvantages. The most modern configurations (mobile RM (MRM) and ultra-mobile RM; micro- mapping and imaging; telescopy) are described. Applications in the new age of 'don't move it, don't even touch it' archaeometry have previously been classified into 10 domains, seven of which concern geomaterials: gems; rocks; ceramics; corroded metals; coloured vitreous materials; and mineral pigments on an inorganic or organic substrate. The representative examples here include all these domains and cover the time range from Prehistoric through Egyptian, Roman, Meso-American, Medieval, Chinese, Renais- sance and Mogul cultures to modern colouring of glass and a contemporaneous simulation of submarine archaeology. The analysis of geomaterials in the cultural heritage, to clarify the nature of the material employed, evaluate possible provenances, detect treatments or to recognize fakes, calls for a variety of techniques, depending upon the type of material available and the kind of infor- mation sought. Raman microscopy (RM) (one kind of Raman spectroscopy (RS)) has become an important technique in archaeometric studies in archaeology and art history since about 1996, and the pseudo-acronym 'ARCHAEORA- MAN' was coined by Smith & Edwards (1998) to summarize this wide field of research activity. More recently the term 'mobile Raman microscopy' (MRM) (Smith 1999) was employed to analyse art works in situ inside museums by taking the laboratory to the object, rather than the object to the laboratory as in con- ventional 'immobile Raman microscopy' (IRM). Subsequently, the possibility of using MRM for subaquatic archaeology was evaluated positively (Smith 2003), and more recently Raman micro- mapping has been used to clarify the microstruc- tural mineralogy of artworks (Smith 2004a) or of rocks susceptible to be the provenance thereof (Smith 2004b,c). The most recent development in RS is telescopy (Sharma et al. 2002, 2003) for very remote studies (such as planetology); this approach has not yet been applied to archaeo- logy, but it could be useful for analysing gem- stones in shop windows from across the street, which brings us into the domain of 'Raman spying' (Smith 2005a), and 21st-century social science, which will not be pursued here. Future developments will no doubt soon include syn- thetic vocal replies for automated analysis (Smith 2005a). In 1986, during a review of RM applications to mineralogy in general, Smith (1987) argued that RM should be of great value to archaeometry, but no significant studies were known to the geologi- cal community at that time, except for some pioneering studies on gemstones and their microinclusions (Drlr-Dubois et al. 1981a,b, 1986a,b). In fact, some chemists and physicists had already begun analysing artworks (Delhaye et al. 1985; Guineau 1987), but only pigments, and only publishing in journals in fields other than geology or mineralogy, especially chem- istry or art history; furthermore, they generally avoided mineralogical terminology by using chemical names such as mercury sulphide or colour names such as vermilion instead of mineral names such as cinnabar. At the From: MAGGETTI, M. & MESSlOA,B. (eds) 2006. Geomaterials in Cultural Heritage. Geological Society, London, Special Publications, 257, 9-32. 0305-8719/06/$15.00 ~:) The Geological Society of London 2006. at Pennsylvania State University on February 20, 2016 http://sp.lyellcollection.org/ Downloaded from
-
Upload
khangminh22 -
Category
Documents
-
view
1 -
download
0
Transcript of A review of the non-destructive identification of ... - CiteSeerX

A review of the non-destructive identification of diverse geomaterials in the cultural heritage using different configurations of
Raman spectroscopy
DAVID C. SMITH
Museum National d'Histoire Naturelle, Laboratoire LEME, USM0205, 61 Rue Buffon,
75005 Paris, France (e-mail: [email protected])
Abstract: Non-destructive Raman microscopy (RM) applied to geomaterials in the cultural heritage is reviewed by means of explaining selected examples representative of the differ- ent kinds of geomaterials that can be characterized and of the different kinds of analytical configuration that can be employed. To explain the versatility and considerable analytical potential of RM that result from its unique combination of capabilities, the first sections summarize the theory and practice of the method and its advantages and disadvantages. The most modern configurations (mobile RM (MRM) and ultra-mobile RM; micro- mapping and imaging; telescopy) are described. Applications in the new age of 'don't move it, don't even touch it' archaeometry have previously been classified into 10 domains, seven of which concern geomaterials: gems; rocks; ceramics; corroded metals; coloured vitreous materials; and mineral pigments on an inorganic or organic substrate. The representative examples here include all these domains and cover the time range from Prehistoric through Egyptian, Roman, Meso-American, Medieval, Chinese, Renais- sance and Mogul cultures to modern colouring of glass and a contemporaneous simulation of submarine archaeology.
The analysis of geomaterials in the cultural heritage, to clarify the nature of the material employed, evaluate possible provenances, detect treatments or to recognize fakes, calls for a variety of techniques, depending upon the type of material available and the kind of infor- mation sought. Raman microscopy (RM) (one kind of Raman spectroscopy (RS)) has become an important technique in archaeometric studies in archaeology and art history since about 1996, and the pseudo-acronym 'ARCHAEORA- MAN' was coined by Smith & Edwards (1998) to summarize this wide field of research activity. More recently the term 'mobile Raman microscopy' (MRM) (Smith 1999) was employed to analyse art works in situ inside museums by taking the laboratory to the object, rather than the object to the laboratory as in con- ventional ' immobile Raman microscopy' (IRM). Subsequently, the possibility of using MRM for subaquatic archaeology was evaluated positively (Smith 2003), and more recently Raman micro- mapping has been used to clarify the microstruc- tural mineralogy of artworks (Smith 2004a) or of rocks susceptible to be the provenance thereof (Smith 2004b,c). The most recent development in RS is telescopy (Sharma et al. 2002, 2003)
for very remote studies (such as planetology); this approach has not yet been applied to archaeo- logy, but it could be useful for analysing gem- stones in shop windows from across the street, which brings us into the domain of 'Raman spying' (Smith 2005a), and 21st-century social science, which will not be pursued here. Future developments will no doubt soon include syn- thetic vocal replies for automated analysis (Smith 2005a).
In 1986, during a review of RM applications to mineralogy in general, Smith (1987) argued that RM should be of great value to archaeometry, but no significant studies were known to the geologi- cal community at that time, except for some pioneering studies on gemstones and their microinclusions (Drlr-Dubois et al. 1981a,b, 1986a,b). In fact, some chemists and physicists had already begun analysing artworks (Delhaye et al. 1985; Guineau 1987), but only pigments, and only publishing in journals in fields other than geology or mineralogy, especially chem- istry or art history; furthermore, they generally avoided mineralogical terminology by using chemical names such as mercury sulphide or colour names such as vermilion instead of mineral names such as cinnabar. At the
From: MAGGETTI, M. & MESSlOA, B. (eds) 2006. Geomaterials in Cultural Heritage. Geological Society, London, Special Publications, 257, 9-32. 0305-8719/06/$15.00 ~:) The Geological Society of London 2006.
at Pennsylvania State University on February 20, 2016http://sp.lyellcollection.org/Downloaded from

1 2
3 4
5 6
7 8
9 10
11
12
13
14
15
16
17
18
Illl
micr
o-ex
tracti
on
yes
yes
x x
x x
x x
x x
x x
x x
x x
x x
rr
i~
m
acro
/micr
o m
icro
micr
o m
icro
micr
o m
icro
micr
o m
icro
micr
o m
icro
nlcro
m
oo
rricr
o x
x x
x x
x m
acro
/rric
ro
horiz
onta
l/ver
tical
verti
cal
verti
cal
verti
cal
verti
cal
verti
cal
verti
cal
verti
cal
verti
cal
verti
cal
~ ~
~ x
x x
x x
x ~
~
mob
ile/im
mob
ile
imm
obile
im
mob
ile
imm
obile
im
mob
ile
imm
obile
im
mob
ile
imm
obile
im
mob
ile
imm
obile
im
Tdoit
e irm
'ebile
m
3bile
m
obile
m
obile
rrd
)ile
m:3b
ile
rn:Y
oile
u/~r
a-].l
~l,f r
n~nn
'doi
le
in si
tu/in
lab
in la
b in
lab
in la
b in
lab
in la
b in
lab
in la
b in
lab
in la
b in
lab
in la
b in
situ
in
situ
in
situ
in
situ
in
situ
in si
tu
in si
tu
in si
tu/in
lab
optic
al fib
re h
ead
x x
x x
x x
x x
x x
x fib
res
til~'es
fib
res
fibre
s fit:
~es
fibre
s all
in on
e op
tical
fibre
lead
un
der
air
air
air
wat
er
air
air
air
air
air
air
air
ar
air
air
air
gl~ss
air
air
un
der
micr
o-m
appin
g x
x x
x tra
p tra
p x
x x
x x
nicro
-map
~ng
, !i
i -
iFRE
SCO-
[p
igme
nts in !pigmantsin i
~ , __
' ~
i i I:
~ris
tmc
i i R
AMAN
!R
oman
iP
rehis
toric
i
r/"c3
|
iPg~
,
~
i~s,
Ro
~, i
~ I i~
a i
Ukra
ine
i ca
ve,
i
..........
..........
..........
..........
..........
..........
..........
..........
..........
i ...
..........
..........
..........
.... I ....
....
....
....
....
....
....
....
....
....
....
....
....
....
....
....
....
....
....
....
....
....
....
....
....
....
....
....
....
....
....
....
....
....
~ ....
..........
..........
......... } ...
..........
..........
..........
..........
.. i lC
ONO-
blu
e
a ~oo
dm
i sla
lue,
!GEM
I~
iRom
an
ieva
luat
ion
i L
~'--
..........
..........
... ~ ....
........
........
.... ~
' ~ .....
..........
.........
RA
I~N
iin
tagl
ios '
IofR
Mo n
in
c~in
irn
arl~
JR
/IM~
.Fra
nce
igem
stone
s ~
~
. ~
MId
l:le/
~ ,.
, ~u
nder
wate
r i
~iso
r~
i ston
e J
........
........
........
........
........
........
.......
! .....
i i~
"Y
' '
'PET
RO.
i ! M
eso-
',~
A~N
i iA
~nca
n ' in
am~c~
i axe
head
, ia
o~
!l~
ished
,
_ !
',MET
ALLO
- i
icor
r~ed
IR
AMAN
i
~/
ic
°ins
(Fe'
i& °t
her
i i
!Cu'
Zn P
b iar
tefa
cts in
; i
i
ivrmo
, i
i iI~
....
-
-
ip grnents on i
!~
i
! or
n st
ained
! i
i i
. ig
lass
I
I !
..
..
.
.- _
refe
renc
es
Barb
et
(1°J
99a)
; Ro
bin
(200
1b,
Gend
ron
Vem
iole
s Sm
ith
(200
1),
(199
9b);
(200
4b);
(200
4a)
(199
9,
(200
1a,
Snith
(2
003b
); F~
ndea
u (2
001a
, b)
Sr~
&
refe
renc
es
(199
9)
Smith
&
(199
7)
2003
) (1
997a
), (1
997)
(2
001,
Bo
ucha
rd &
Bou
char
d &
Smth
29
00);
2005
a);
(200
2);
~?th
(2
001)
; Lm
blanc
hel
Bouc
hard
Sm
ith
2005
b)
Sn~t
h Sm
ith
(200
5c)
Smth
Sr
ffth e
lal,
Srfft
h (2
005a
) Sr
dth
(unp
ub.
/200
0al
/200
5cl
/200
5b)
/200
2/
/200
5at
/200
3a/
t200
5a/
/20(3
5a/
data
/ No
tes t
o tab
ular
part:
x de
note
s "n
o"; b
old t
ype
in th
e co
nfigu
ratio
ns h
ighlig
hts u
nusu
al fe
atur
es.
at P
enns
ylva
nia
Stat
e U
nive
rsity
on
Febr
uary
20,
201
6ht
tp://
sp.ly
ellc
olle
ctio
n.or
g/D
ownl
oade
d fr
om

NON-DESTRUCTIVE RAMAN SPECTROSCOPY 11
international GEORAMAN-1996 conference in Nantes an attempt was made to bring ARCHAEO- RAMAN topics to the attention of the geological community and since then contributions on archaeology and art history became significant at every GEORAMAN meeting (1999 in Valladolid; 2002 in Prague; 2004 in Honolulu) (see table 8 of Smith & Carabatos-Nedrlec (2001) for a list of archaeological or art historical topics presented at these meetings). Another series of international congresses on non- destructive analysis in the cultural heritage brought in RM at Antwerp in 2002, and this con- tinued at Lecce in 2005. The meetings of ICAM (International Congress on Applied Mineralogy), IRUG (InfraRed users Group), GFSV (Groupe Franqais de la Spectroscopie Vibrationelle), and GMPCA (Groupe des M~thodes Pluridiscipli- naires Contribuant h l 'Archrologie), and others, have started to include RM, as have other more archaeological meetings (e.g. Smith et al. 2000). A separate series of international con- gresses on exclusively 'Raman Spectroscopy applied to Archaeology and Art History' ( 'ArtRaman') was started in London in 2001 and continued in Ghent in 2003 and in Paris in 2005. The literature on ARCHAEORAMAN has thus increased enormously in a decade, but it is dissipated amongst journals in many disci- plines. This paper cannot review all the litera- ture; it thus focuses on explaining why RM is so useful and describes a series of examples of studies by the author's research group that are in two ways representative: of the different kinds of geomaterials that can be analysed, and of the different kinds of analytical configuration that can be employed (Fig. 1).
What is Raman spectroscopy?
RS is an optical, hence physical, technique by which the wavelength of light is modified by interactions with interatomic vibrations
(e.g. Smith & Carabatos-Nrdelec 2001; Nasdala et al. 2004). The modified light is called Raman diffused light according to the 'Raman effect' discovered by Sir Chandrase- khara Venkata Raman in 1928, for which he received the Nobel Prize for Physics. Thus the technique does not analyse a single atom, as do a great number of chemical analytical techniques such as X-ray fluorescence, as at least two atoms are required. The vibrational energies involved are the same as those in infrared (IR) spec- troscopy, such that the two techniques are often considered similar. They are indeed complemen- tary, but are not really similar, because in IR spectroscopy photons are absorbed or reflected according to the various vibrational energies, whereas in RS, incoming photons lose some energy, which leaves a vibration mode more excited, and hence the outcoming photons have lost some energy, i.e. they have a higher wavelength, and hence a lower wavenumber (the reciprocal of wavelength) (Fig. 2). This is called Raman Stokes scattering. Raman Anti- Stokes scattering also occurs whereby a vibration mode gives up some energy to become less excited and the outcoming photons have gained energy, i.e. they have a lower wavelength, and hence a higher wavenumber; this effect is weaker and will be ignored here. Thus with Raman Stokes scattering a single kind of intera- tomic vibration causes a shift of the wavenumber of the incoming exciting light, usually from a laser (although Raman used sunlight) and necess- arily monochromatic. The exciting wavelength (e.g. 514.5nm from an Ar + green laser or 632.8 nm from a H e - N e red laser) is placed at zero cm - l on the relative wavenumber scale such that the Raman band created occurs at a characteristic Raman shift (e.g. 465 cm -1 from the major vibration of quartz). Raman shifts are conventionally plotted as being positive, as a shift is an amount without direction, but in reality it should be plotted as - 4 6 5 cm -1, as
Fig. 1. Representative examples of ARCHAEORAMAN studies on geomaterials: configurations, domains and images. Tabular part: configurations listed horizontally; domains listed diagonally; examples placed in the appropriate case. Arrowed superimposed images demonstrate the following selected cases. (a) Raman spectra from the Meso-American stone axe-head in eclogite; from top to bottom: titanite, garnet, clinoamphibole, clinopyroxene (modified after Smith & Gendron 1997a). (b) A Domitian denier silver alloy coin with cuprite corrosion (modified after Bouchard & Smith 2005b). (e) Raman spectra of microcline under air, distilled water and water badly contaminated by animal or vegetable debris as a simulation of subaquatic archaeology (modified after Smith 2003). (d) A Meso-American corroded metal axe-head (modified after Bouchard & Smith 2005b). (e) An Egyptian inscribed commemorative scarab in polycrystalline enstatite established by Raman mapping with a RENISHAW ® Invia ® spectrometer (modified after Smith 2004a). (f) A Chinese sculptured pendant in jadeite-jade (modified after Smith 2005a). (g) A Medieval cloisonnr-gold style fibula encrusted with garnets (photo D. C. Smith'S). (h) A Teotihuac~in sculptured mask in marble with the DILOR ® LabRaman ® horizontal microscope (modified after Nasdala et al. 2004). (i) A Florentine table in stone marquetry being analysed vertically with a KAISER ® Holoprobe ® remote head through the thick protective plate glass (invisible here) (modified after Smith 2005a).
at Pennsylvania State University on February 20, 2016http://sp.lyellcollection.org/Downloaded from

elastic
scattering
Rayleigh
diffusion
D. C. SMITH
inelastic
scattering
Raman Stokes
diffusion
inelastic
scattering
Raman Anti-Stokes
diffusion
vibrational E e
energy
levels Es
+E, E~+E,
E e + E i virtual state
excited state
~round state
extra input (i) relations energy E, E, Ei = h. v i
frequency v, = E , / h v, = E i / h v i = E i ] h = c / L i
wavelength k~ = c /v, ~.~ = c /v , k, = c / v , = h . c / E i
wavenumber (absolute) W, = 1 / k, W i = 1 / k~ W, = 1 / k i = v, / c
wavenumber (relative) W, set at zero W, set at zero
change to sample none (EcEg) gained (E~-Eg) lost
change to light none (Ee-Eg) lost (Ee-Eg) gained
output (o~
energy Eo = Ei Eo = Ei - ( E e-E~) E o = E, + ( E e - E 0
frequency v o = E o / h v o = E o / h v o = E o / h
wavelength k o = c / Vo ~.o = c / v o k o = c / v o
wavenumber (absolute) W o = I /~o W o = ! /ko W o = 1 / k o
comparison: input to output none lower higher
wavenumber (relative) Wr = W, - W o Wr = W o - W 1 W r = W 0 - W
= Raman shift zero negative positive
c = speed o f light; h = Planck's constant
Fig. 2. Scheme of the different ways in which inter-atomic vibrational energy levels give rise to three types o f light scattering (diffusion): Rayleigh, Raman Stokes, Raman Anti-Stokes.
t he a b s o l u t e w a v e n u m b e r is l o w e r t h a n tha t o f
the e x c i t i n g l ine (F ig . 2). A n i m p o r t a n t p o i n t is
t ha t R a m a n sh i f t s a re c o n s t a n t f o r a n y w a v e -
l e n g t h o f the e x c i t i n g l a s e r as the sh i f t s a re f i xed r e l a t i v e to tha t w a v e l e n g t h a n d a re l i n e a r
in c m - ~ ; v e r y f e w e x c e p t i o n s to this ru le o c c u r (e .g . the D b a n d o f g r a p h i t e ) .
As t h e r e a re m a n y d i f f e r e n t k i n d s o f v i b r a t i o n a l s y m m e t r y , e a c h w i t h its o w n e n e r g y
l eve l (e .g . s y m m e t r i c s t r e t c h i n g , a n t i - s y m m e t r i c
s t r e t c h i n g , d e f o r m a t i o n , b e n d i n g , r o c k i n g ,
w a g g i n g , t w i s t i n g ) , a n d all o f th is f o r e a c h k i n d
o f c o m b i n a t i o n o f c h e m i c a l e l e m e n t s ( d e p e n d i n g
u p o n the R a m a n ' s e l e c t i o n r u l e s ' , w h i c h d e p e n d u p o n the c r y s t a l o r m o l e c u l a r s y m m e t r y a n d a l so u p o n the n u m b e r o f c h e m i c a l e l e m e n t s p r e s e n t ) , t h e r e a re s e v e r a l d i s t i n c t R a m a n b a n d s c r e a t e d ( w h i c h o c c a s i o n a l l y o v e r l a p ) s u c h tha t
at Pennsylvania State University on February 20, 2016http://sp.lyellcollection.org/Downloaded from

NON-DESTRUCTIVE RAMAN SPECTROSCOPY 13
a spectrum is obtained (where the ordinate shows photon intensity, and the abscissa shows the wavenumber) (Fig. l a and c). According to these rules, some materials give only one band (e.g. diamond), simple carbonates and sulphates give fewer than 10 bands, silicates such as garnet give about 20, and more complex silicates such as micas and amphiboles may give more. Organic molecules may give rise to hundreds of bands.
Spectra are variably plotted with the zero at the left or the right, but the zero is never plotted as this is where Rayleigh scattering occurs; this involves the restitution of the excit- ing light with the same wavelength (Fig. 2) (physically not the same, but effectively the same as simple reflection).
Rayleigh scattering is very approximately 1012 times more efficient than Raman scattering and this important fact has several consequences: (1) a Raman spectrum cannot show the intensity at 0 c m - i as it would plot somewhere in inter- planetary space; (2) it would burn the detector, or create a plasma from it, and has to be filtered out; (3) a 'Rayleigh tail' occurs in the 10- 100 cm -1 spectral range where the Rayleigh scattering intensity decreases to zero; (4) only about one photon in several billion incoming photons is subject to the Raman effect, so the development of RM necessitated strong laser sources and powerful detectors of very weak signals as well as coupling to a microscope (Dhamelincourt & Bisson 1977); (5) commonly 1-100 mW power is used to analyse a 1 Ixm sized portion of a sample or an art object; if the same power per ixm 2 were applied over a 1 m 2 surface it would need 1012 times more power, i.e. 1 -100 GW, which brings us to the scale of several nuclear power stations (and this ignores the third dimension and another 106). Thus we are dealing with an extremely powerful energy applied to an extremely small location to detect an extremely weak effect.
It is important to appreciate that the intensity of a Raman band of a crystal depends, often strongly, on the orientation of its crystal sym- metry with respect to the polarization of the laser (compare X-ray diffraction) such that in certain situations a Raman band may disappear completely. If it is not possible to rotate either the art work or the RM, one can introduce a half-wave plate and rotate it to see the missing band (Smith 1996).
There are basically two ways of using RS. One approach uses RS to satisfy the chemist's, physicist 's or mineral physicist's need to try to predict and calculate Raman phenomena and to extract thermodynamical data, often by measuring Raman spectra at high or low
temperature (T) and/or high or low pressure (P); this is not discussed further here. The second is to use 'Raman spectral fingerprinting' (Dhamelincourt & Bisson 1977; Smith 1987) to identify mineral or molecular species, as differ- ent species cannot give the same spectrum and the same species will always give the same spec- trum (at the same P - T, if there are no differences in chemical composition, crystal structural order, etc.). This of course requires spectral databases; several now exist, but all are limited in scope (see White 1975; Griffith 1987; Guineau 1987; Pinet et al. 1992; Bell et al. 1997; Burgio & Clark 2001; Bouchard & Smith 2003, 2005a) and numerous others are in preparation as every Raman research group builds its own.
Why has Raman microscopy become so polyvalent and powerful? This is principally because of its great versatility owing to its unique combination of capabilities, as follows.
(1) It characterizes simultaneously the physical structure and the chemical composi- tion of an unknown species by comparison of its Raman spectrum with reference spectra (compare IR and X-ray diffraction (XRD)). This is extremely useful for distinguishing polymorphs such as quar tz -mogani te - tridymite-cristobalite-coesite (SiO2), aragonite- calcite (CaCO3), sanidine-orthoclase-microcline (KA1SiO3), rut i le-anatase-brookite (TiO2), etc., which cannot be done with any purely chemical technique.
(2) It can do this with inorganic or organic material in different states or forms, such as crys- talline, molecular, glassy or amorphous; whether solid, powdery, suspended, plastic, vitreous, liquid or gaseous; and whether pure or mixed. Apparently only IR can also do this. Mixed phases, such as in a pigment or in sub-micron- sized mineral intergrowths in a rock, gem or ceramic, are commonly encountered in archaeometry.
(3) The analysed volume may be on a micro- metre scale, from about 0.5 p~m to about 50 l~m in surface diameter, commonly 1 - 2 txm, but the analysed object may have any size and different parts thereof may be systematically analysed. IR and XRD cannot do this except with a synchrotron (which must be the least mobile analytical apparatus).
(4) No sample preparation whatsoever is required (no extracting, drilling, scraping, sawing, cutting, grinding, polishing, liquefac- tion, gasification, etc., nor a vacuum chamber,
at Pennsylvania State University on February 20, 2016http://sp.lyellcollection.org/Downloaded from
14 D.C. SMITH
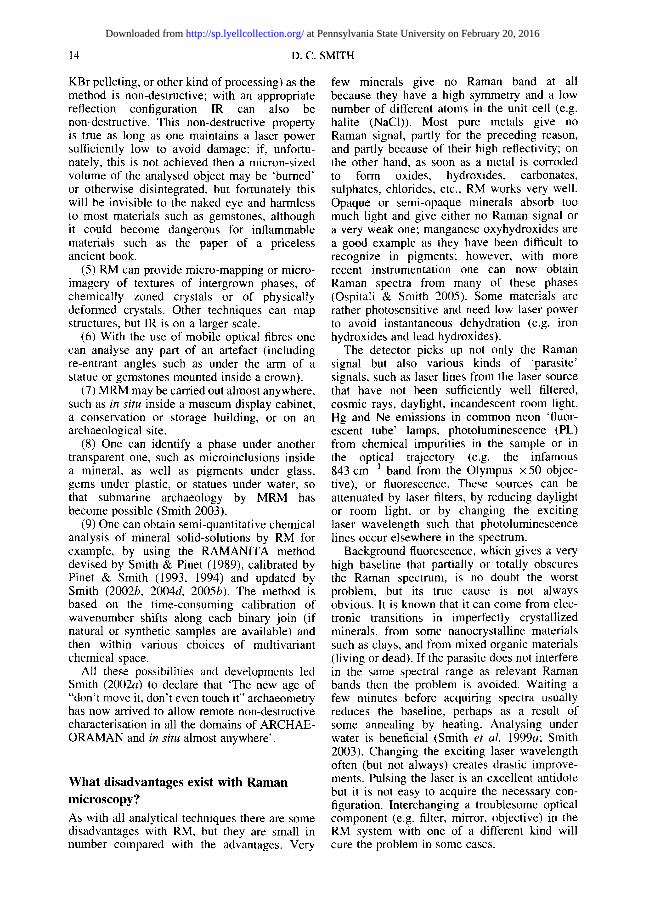
KBr pelleting, or other kind of processing) as the method is non-destructive; with an appropriate reflection configuration IR can also be non-destructive. This non-destructive property is true as long as one maintains a laser power sufficiently low to avoid damage; if, unfortu- nately, this is not achieved then a micron-sized volume of the analysed object may be 'burned' or otherwise disintegrated, but fortunately this will be invisible to the naked eye and harmless to most materials such as gemstones, although it could become dangerous for inflammable materials such as the paper of a priceless ancient book.
(5) RM can provide micro-mapping or micro- imagery of textures of intergrown phases, of chemically zoned crystals or of physically deformed crystals. Other techniques can map structures, but IR is on a larger scale.
(6) With the use of mobile optical fibres one can analyse any part of an artefact (including re-entrant angles such as under the arm of a statue or gemstones mounted inside a crown).
(7) MRM may be carried out almost anywhere, such as in situ inside a museum display cabinet, a conservation or storage building, or on an archaeological site.
(8) One can identify a phase under another transparent one, such as microinclusions inside a mineral, as well as pigments under glass, gems under plastic, or statues under water, so that submarine archaeology by MRM has become possible (Smith 2003).
(9) One can obtain semi-quantitative chemical analysis of mineral solid-solutions by RM for example, by using the RAMANITA method devised by Smith & Pinet (1989), calibrated by Pinet & Smith (1993, 1994) and updated by Smith (2002b, 2004d, 2005b). The method is based on the time-consuming calibration of wavenumber shifts along each binary join (if natural or synthetic samples are available) and then within various choices of multivariant chemical space.
All these possibilities and developments led Smith (2002a) to declare that 'The new age of "don't move it, don't even touch it" archaeometry has now arrived to allow remote non-destructive characterisation in all the domains of ARCHAE- ORAMAN and in situ almost anywhere'.
What disadvantages exist with Raman microscopy? As with all analytical techniques there are some disadvantages with RM, but they are small in number compared with the advantages. Very
few minerals give no Raman band at all because they have a high symmetry and a low number of different atoms in the unit cell (e.g. halite (NaCI)). Most pure metals give no Raman signal, partly for the preceding reason, and partly because of their high reflectivity; on the other hand, as soon as a metal is corroded to form oxides, hydroxides, carbonates, sulphates, chlorides, etc., RM works very well. Opaque or semi-opaque minerals absorb too much light and give either no Raman signal or a very weak one; manganese oxyhydroxides are a good example as they have been difficult to recognize in pigments; however, with more recent instrumentation one can now obtain Raman spectra from many of these phases (Ospitali & Smith 2005). Some materials are rather photosensitive and need low laser power to avoid instantaneous dehydration (e.g. iron hydroxides and lead hydroxides).
The detector picks up not only the Raman signal but also various kinds of 'parasite' signals, such as laser lines from the laser source that have not been sufficiently well filtered, cosmic rays, daylight, incandescent room light, Hg and Ne emissions in common neon 'fluor- escent tube' lamps, photoluminescence (PL) from chemical impurities in the sample or in the optical trajectory (e.g. the infamous 843 cm-I band from the Olympus × 50 objec- tive), or fluorescence. These sources can be attenuated by laser filters, by reducing daylight or room light, or by changing the exciting laser wavelength such that photoluminescence lines occur elsewhere in the spectrum.
Background fluorescence, which gives a very high baseline that partially or totally obscures the Raman spectrum, is no doubt the worst problem, but its true cause is not always obvious. It is known that it can come from elec- tronic transitions in imperfectly crystallized minerals, from some nanocrystalline materials such as clays, and from mixed organic materials (living or dead). If the parasite does not interfere in the same spectral range as relevant Raman bands then the problem is avoided. Waiting a few minutes before acquiring spectra usually reduces the baseline, perhaps as a result of some annealing by heating. Analysing under water is beneficial (Smith et al. 1999a; Smith 2003). Changing the exciting laser wavelength often (but not always) creates drastic improve- ments. Pulsing the laser is an excellent antidote but it is not easy to acquire the necessary con- figuration. Interchanging a troublesome optical component (e.g. filter, mirror, objective) in the RM system with one of a different kind will cure the problem in some cases.
at Pennsylvania State University on February 20, 2016http://sp.lyellcollection.org/Downloaded from

NON-DESTRUCTIVE RAMAN SPECTROSCOPY 15
Raman spectra frequently need some amount of spectral treatment if we are to be able to exploit the data by spectral fingerprinting (on the other hand, treatments are usually avoided for thermodynamical studies as one must not modify the raw data upon which certain calcu- lations are based). First, the 'baseline correction' tries to make the background line horizontal, regardless of the cause of it not being flat (fluor- escence, luminescence); this procedure can dramatically increase signal-to-noise visibility. Subtracting an oblique straight line is acceptable if the baseline has a sub-linear steep slope, but often it is necessary to subtract a polynomial 'best line' curve calculated from selected land- marks on a distinctly curved baseline. Automatic correction can be disastrous as the computer program may confuse wide Raman bands with an undulating baseline. More than a × 2 poly- nomial can produce major distortions and, in any case, it is not necessary to achieve a perfectly flat baseline. Second, one may eliminate known parasite peaks or known detector defects by 'rubbing out' with the computer mouse instead of a piece of rubber. An automatic 'peak elimin- ation' procedure may be useful for eliminating narrow cosmic rays that are distinctly narrower than Raman bands, but it needs to be used with care. Third, 'smoothing' by averaging all intensi- ties over a selected small wavenumber zone is very useful to make real Raman bands more visible by eliminating the basic zigzags of the irreducible background flutter, but must not be done over zones too wide or real Raman bands will become too diluted in intensity or separate nearby bands (doublets) may become fused together. With these three treatments one can fre- quently transform apparently hopeless spectra into perfectly exploitable ones, and this is because the basic information exists in the raw spectrum and it just needs to be rendered visible. A variety of more sophisticated com- puterized techniques exist, such as spectral combination, peak-fitting, Fourier transforms and 3D-plotting, but they will not be dealt with further here.
Classifications of Raman microscopic studies of the cultural heritage
To demonstrate applications of RM to the cul- tural heritage it is convenient to classify the examples according to some criteria. Here the cultural period (Prehistoric, Roman, Medieval, Renaissance, etc.) is not used as this paper is more mineralogical-technological than archaeo- logical. The type of material analysed can be a
Table 1. The 10 domains of ARCHAEORAMAN, updated from Smith (1999, 2002a)
(1) GEMMORAMAN from 'gems': gemstones (rough, cut or mounted), cameos, corals, intaglios, jewellery, collection stones, etc.
(2) CERAMIRAMAN from 'ceramics': brick, china, earthenware, faience, glass, porcelain, pottery, slags, tiles, other vitrified minerals, etc.
(3) PETRORAMAN from 'petros' for rocks: axeheads, building columns, ceremonial stones, inlaid rock, millstones, mosaics, necklaces, sculptures, etc.
(4) METALLORAMAN from 'corroded metals': corroded bracelets, coins, cutlery, necklaces, statues, swords, tools, etc.
(5) RESINORAMAN from 'resin' as an example of a non-cellular organic material composed of only a few different molecules or of amorphous hydrocarbons without a growth texture: amber, glue, gum, oil, putty, wax, bitumen, lignite, coal, etc.
(6) TISSUERAMAN from 'tissue' as an example of cellular organic molecules or biominerals with a growth texture: bone, claw, cotton, feather, fur, hair, hoof, horn, ivory, leather, linen, nail, papyrus, parchment, silk, skin, teeth, wool, wood, etc.
(7) FRESCORAMAN from 'fresco' as an example of pigments/inks/dyes on or in an inorganic substrate: brick, ceramic, plaster, stone, stucco, etc.
(8) ICONORAMAN from 'icon' as an example of pigments/inks/dyes on or in an organic substrate: bone, canvas, paper, skin, textile, wood, etc.
(9) VITRORAMAN from the 'vitreous' state: pigments on or in enamel, glass or glaze, etc.
(10) ENVIRORAMAN from 'environmental' deterioration of any of these materials by climate, burial or immersion: original materials, corrosive agents involved, intermediate and final products
useful criterion, and this was used by Smith & Edwards (1998) as there may be different analytical protocols for different materials; Table 1 lists the 10 domains of research activity as updated by Smith (2002a). The analytical configuration employed is also relevant (macro or micro; vertical or horizontal microscope; optical fibres or not; mobile or immobile; in situ or in a laboratory; under air, glass, mineral, or water). Figure 1 plots the seven domains relevant to geomaterials against com- binations of analytical configurations and lists the studies (by the author's research group) that are mentioned here as being representative of research in ARCHAEORAMAN in general.
at Pennsylvania State University on February 20, 2016http://sp.lyellcollection.org/Downloaded from

16 D.C. SMITH
RM analysis of pigments, whether inorganic or organic materials on inorganic (FRESCORA- MAN) or organic (ICONORAMAN) substrates has dominated ARCHAEORAMAN from the early works of Delhaye et al. (1985) and Guineau (1987) to the production of mini- catalogues of Raman spectra of pigments (Bell et al. 1997; Burgio & Clark 2001), and from applications to prehistoric rock art (e.g. Bouchard 1998, 2001; Edwards et al. 1998; Smith et aL 1999a,b; Smith & Bouchard 2000a) via Roman art (e.g. Smith & Barbet 1999) through various periods of the last millen- nium (e.g. Rull-Perez et al. 1999; Withnall 1999; Rull-Perez 2001) to modem art (e.g. Vandena- beele et al. 2000).
The biomaterials domains RESINORAMAN and TISSUERAMAN have been mainly limited to specialists in biology and/or organic chem- istry (e.g. the early works of Edwards et ai. 1996a,b,c; Brody et al. 1998).
Turning to geomaterials, the earliest known work was on GEMMORAMAN (D~lr-Dubois et al. 1978). The advantages for gemmology are considerable, as RM can be employed for several different purposes: to verify the nature of the gemstone itself, to examine for treatments (e.g. heating, resin impregnation, pigmentation), to explore solid or fluid microinclusions, or to detect synthetic and imitation stones. Certain aspects of gemmology have been studied in detail by RM by Lasnier (1989) and Maestrati (1989), and the first catalogue of the Raman spectra of gemstones was published by Pinet et al. (1992); more recent studies have been made notably by Coupry & Brissaud (1996), Schmetzer et al. (1997), Smith & Robin (1997), Smith & Bouchard (2000b), Kiefert et al. (2001) and Smith (2001a, 2005a).
Apart from extremely few early works (Coupry et al. 1993; Macquet 1994; Wang et al. 1995), 1997 saw the effective beginning of RM studies in the remaining four geomaterial domains, in particular: (1) PETRORAMAN of jade and eclogite by Smith & Gendron (1997a,b) or of sculptured polished ceremonial rocks by Smith & Bouchard (2000b) and Smith (2005a); (2) CERAMIRAMAN of vitrified forts by Smith & Vernioles (1997), of the minerals constituting pottery by Fry et al. (1998) or of the pigments in glazes by Colomban & Treppoz (2001), Colomban et al. (2001) and Liem et al. (2000, 2002); (3) METALLORA- MAN on corroded metal coins and various archaeological metals (Fig. l b and d) by McCann et al. (1999), Bouchard & Smith (2000a,b, 2001, 2005a,b), Bouchard (2001), Di Lonardo et al. (2002), Frost et al. (2002a,b),
Smith & Bouchard (2002) and Martens et al. (2003); (4) VITRORAMAN on the minerals colouring stained glass by Edwards & Tait (1998), Smith et al. (1999c) and Bouchard & Smith (2002).
ENVIRORAMAN studies are less common (e.g. Seaward & Edwards 1998). The RM spectral catalogues of Bouchard & Smith (2003, 2005a) included minerals of relevance to prehistoric paintings, corroded metals and stained glass.
Probably at least 80% of all ARCHAEORA- MAN publications to date concern pigments. Apparently over 90% of all RM analysts are phy- sicists or chemists, which is logical given the physico-chemical basis of the technique. Thus, like botanists and zoologists, geologists of one kind or another (e.g. crystal chemists, mineralo- gists or petrographers) engaged in archaeometry via RM make up a very small community world- wide. However, each specialist brings his own particular competence and, similar to the need for an experienced botanist to identify a kind of tree, geologists are clearly necessary when study- ing natural rock artefacts from the cultural heritage (and solid-solutions, microinclusions, transformations, etc. in their constituent min- erals, and their possible provenance in one or other geological unit). It was argued by Smith & Edwards (1998) that ARCHAEORAMAN studies really require three co-authors, a spectro- scopist for the analysis, a natural scientist for the species of the natural raw material, and a social scientist for the artefact (form and cultural context). Individual scientists can often manage to adequately cover two of these disciplines, but to cover all three properly (or all five if one separ- ates geology, botany and zoology) would be utopia, surely requiring a born-again Leonardo da Vinci.
The following sections, organized by analyti- cal configuration, focus on the geomaterials applications listed in Table 1.
Representative examples of RM applications
I m m o b i l e a n a l y s i s in a l a b o r a t o r y : u n d e r
a i r w i t h a ve r t i ca l m i c r o s c o p e
Me thods . This is the standard method of per- forming archaeometry with RM, either by placing on the microscope stage micro-samples extracted from a cultural item (i.e. not strictly non-destructive in this case) or by placing the whole item under the microscope if it is small enough to squeeze between the objective and the stage, or by taking away the stage.
at Pennsylvania State University on February 20, 2016http://sp.lyellcollection.org/Downloaded from

NON-DESTRUCTIVE RAMAN SPECTROSCOPY 17
i Wavenumber (cm -I) 500 1000 1500 Wavenumber ( cm- I ) 400 600 800 1000
~ (c)
. . . . oo ,ooo 'z°° (d)
Fig. 3. Raman spectra of selected subjects. (a) Raman spectra of pigments from the Roman tomb at Kertsch (Ukraine): red minium (BJMI55yy, bottom left); blue cuprorivaite (BHCV03zz, top left); black carbon (BHCA21hh, right) (modified from Smith & Barbet 1999). Int, intensity. Eight-digit codenames are the computer spectra filenames. (b) Raman spectra of minerals from the new type of jadeite-jade from Guatemala: from top to bottom: jadeite alone (AHCP03 mm); jadeite + quartz (key peak at 468 cm- 1, AJQZ05 mm); jadeite + rutile (key peak at 445 cm- ~, AGCP22 mm); jadeite + titanite (key peak at 543 cm- 1, AHUN 16 ram). Some of the key peaks of jadeite are present in all spectra: 203, 373,698, 986, 1039 cm -1 (modified from Gendron et al. 2002). (e) Raman spectra of Cu-hydroxysulphates, from top to bottom: archaeological brochantite (DGCU 17je); standard brochantite (BSCUO6je); archaeological antlerite (CRCU08je); standard antlerite (BOCU08je). Some bands are at the same wavenumber in all spectra but there are significant shifts between the two species, notably the SO]- vibration just below 1000 cm-l (modified from Bouchard & Smith 2005b). (d) Raman spectra of the interior of two modem glasses: colourless 'verre cord616' (top, BUVE071f) showing intense bands revealing a high Na content (573 cm-i) and a tectosilicate Si-O arrangement (1100 cm- 1); red 'verre antique' (bottom, BQCO04jv) dominated by the bands at 195 cm-1 (CdSe) & 288 c m - l (CdS) characteristic of CdSo.g5Seo.55 (modified from Bouchard & Smith 2005b).
A DILOR ® XY ® spectrometer belonging to the Museum National d 'Histoire Naturelle (MNHN) was employed.
Pigments: Roman wall-paintings. Black, red and blue are the major colours in decorations on a wall-painted Roman tomb at Kertsch, Ukraine. Micro-samples more or less invisible to the naked eye were extracted by the archaeo- logist A. Barbet and submitted to RM examination. It was easy to focus the 1 - 2 tzm diameter laser beam onto any selected mineral grain or part of a composi te micro-assemblage to determine its mineral constitution (Smith & Barbet 1999). In this way it was found that the black is semi-amorphous carbon (C) (Fig. 3a);
this is a very c o m m o n phase in all cultures (often called 'carbon black' , but such varietal names are not always used with precision) and it was probably the first p igment ever used by mankind. The blue pigmentat ion derived from cuprorivaite (CaCuSi4Olo) (Fig. 3a), which is the key constituent in the pigment called 'Egyptian Blue' and which was widely used in the Roman Empire. The red turned out to be min ium (Pb304) (Fig. 3a); although known else- where in the Roman Empire it was not previously known as far NE as Kertsch.
Pigments: Prehistoric cave paintings. Although RM work on pigments had begun in the mid- 1980s, it was not until the late 1990s that RM
at Pennsylvania State University on February 20, 2016http://sp.lyellcollection.org/Downloaded from

18 D.C. SMITH
analysis of Prehistoric pigments from surface rock art (Edwards et al. 1998; Smith et al. 1999b) or cave wall-paintings (Smith et al. 1999a; Smith & Bouchard 2000a; Bouchard 2001) was attempted. Prehistoric pigments are, in general, far more difficult to determine than pigments from historical times. This is not only because they tend to give an enormous fluor- escence but also because the three most common phases used, other than carbon black, each have an additional problem. Thus yellow goethite (a-FeO(OH)) rapidly dehydrates to form red hematite (a-Fe203) even at very low laser power; red hematite strongly absorbs a green laser beam, overheats and decomposes into a black dot that might contain magnetite (Fe304); black MnxOvOH z phases absorb so much light that they give particularly bad Raman spectra. In the case of the limestone caves Pergouset, Les Merveilles and Les Fieux, in the Quercy district, Lot, France, it was possible to identify on various drawings (lines, dots, negative hands, etc.) predominant hematite with minor goethite in the red colours, and carbon in most black parts. Some other black parts were not of carbon and did not give a Raman signal until the micro-fragments were covered with water to keep them cool (Smith et aL 1999a). The Raman signal obtained resembled that of bixbyite (Mn203), a rare species in nature. This raised the question of the possible creation of bixbyite by heating some other MnxOyOH z phase, either by prehis- toric man or by the laser beam during the analysis. Using more recent Raman apparatus, better spectra from some MnxOyOH: phases have been obtained both from samples in the MNHN mineral collection (Ospitali & Smith 2005) and from other limestone caves in Quercy (Roucadour and Combe N~gre 1) (Ospitali et al. 2005). Thus it is now easier to distinguish carbon from MnxOyOHz, which helps enormously in deciding which drawings to sacrifice for carbon isotope dating. A spec- trum of an interesting orange microphase was obtained at Pergouset, which is neither goethite nor hematite because of a strong band at precisely 400 cm -j that lies between the values for well-crystallized goethite or well- crystallized hematite; it was called 'disordered goethite' as it shared several bands with goethite (Smith et al. 1999a) and was probably created by prehistoric man heating 'yellow ochre' (a mixture coloured by goethite).
Gems tones : R o m a n intagl ios . Gemstone identi- fication is one of the applications where RM excels. Three small intaglios were excavated
from a Roman site at Lut~ce (Paris) by the archaeologist S. Robin. When they were studied on a microscope stage it was rapidly established by RM that they were all composed of quartz (SiO2) (Smith & Robin 1997). The texture under the microscope indicated polycrys- talline quartz, i.e. chalcedony, but this mineral has a great number of varieties. Two intaglios were apple-green in colour and it was first thought that they were of chrysoprase, a variety coloured green by Ni. Subsequently, some other green chalcedonies in other rocks were shown to be green because of Cr and have been called Cr-onyx. Because RM does not detect trace elements, as about 1 atomic % of an element is necessary to create a detectable spec- tral difference, the naming of the mineral variety of these intaglios could not be established with confidence, but the mineral species was unequi- vocal. One of them had a small mineral inclusion, which turned out to be zircon (ZrSiO4). The third intaglio was metallic blue under reflected light but bordeaux red under transmitted light; RM showed that this was also of quartz; its variety name could be jasper or sard.
Rocks: M e s o - A m e r i c a n axe. A Meso-American polished axe-head from Cozumel Island, Mexico, now in the collection of the Musre de l'Homme, Paris (Gendron 1998), had previously been classified as a 'greenstone', which literally means a green rock that has not been identified. This one contained at least two reddish minerals as well as two greenish minerals. With RM four kinds of Raman spectra were obtained and identified as clinopyroxene ((Na,Ca)(A1, Fe3+,Mg,Fe2+)Si206) (green), 3clinoam~hi- bole ((D,K,Na)(Na,Ca)z(A1,Fe ,Mg,Fe )5 (Si,AI)sOzz(OH)2) (darker green), garnet ((Mg,Mn,Fe~+,Ca)3(A1,Cr,Fe3+)2Si3012) (red) and titanite (CaTiSiOs) (brown) (Fig. la) (Smith & Gendron 1997a). The positions of the T - O - T bands of the clinopyroxene and the SiO4 bands of the garnet implied considerable proportions of respectively jadeite (NaA1Si2Or) and pyrope (Mg3A12Si30~2) in solid-solution, based on the semi-quantitative analytical method RAMANITA (mentioned above) (Smith 2005b). These two species indicated an eclogite, a rock type in which clinoamphibole and titanite often occur (Smith 1988). The kinds of clinoamphibole cannot be established as there are over 50 amphibole end-members and relatively few published data on their Raman spectra. Eclogite does not occur geologi- cally on Cozumel Island, thus proving its
at Pennsylvania State University on February 20, 2016http://sp.lyellcollection.org/Downloaded from

NON-DESTRUCTIVE RAMAN SPECTROSCOPY 19
transport from afar, possibly from Guatemala (McBirney et al. 1987).
Rocks: jades. A second axe head, from Guate- mala but of uncertain provenance, was shown to be a true jadeite-jade by comparison with the Raman spectrum of a Burmese jadeite-jade (Smith & Gendron 1997a). Indeed, RM is undoubtedly the best technique for rapidly and non-destructively distinguishing the three types of jade: jadeite-jade (clinopyroxene); nephrite jade (clinoamphibole close to the tremolite- actinolite series (Ca2(Mg,Fe)5(Si)8022(OH)2)) and 'tourist jade' (anything else) (Smith 2005c). Thanks to RM, a fiver pebble subsequently collected by the archaeologist F. Gendron was shown to be a new sub-type of jade (quartz- jadeitite) composed also of rutile (TiO2) and titanite (CaTiSiOs) (Fig. 3b) formed at higher pressure than usual Meso-American jade (albite-jadeitite) (Smith & Gendron 1997b; Gendron et al. 2002) from a new locality, on the south side of the Motagua River Valley, whereas all previous findings of geological jade had come from the north side (Harlow 1994). The light greyish-green 'type' jadeite in the MNHN mineral collection, which is itself a Neolithic jade axe whose provenance was most probably in the Western Italian Alps, as well as a strong green 'chromo-jadeite' from Burma both gave typical spectra of jadeite (NaA1Si206) with >90 mol% Jd characterized by the S i - O - Si Raman band at 701 -t- 2 cm-l (Gendron et al. 2002; Smith 2005c).
The singlet (OH) Raman vibration of nephrite at c. 3673 cm-1 is very useful proof of the pre- sence of nephrite jade, when found in addition to the lower wavenumber of the S i - O - S i stretch- ing vibration close to 675 cm- l , which is much lower than that in jadeite. The nephrite jade nature of a series of artefacts, mainly polished flat bracelets or rings, but also some geological source rocks, all from China, was analysed by Smith et al. (2003b). Many were found to be of nephrite, but one of the six source rocks was a serpentine (Mg3SizOs(OH)4), and three artefacts were not nephrite but either calcite or quartz. A few darker artefacts revealed only a weak band at about 675 cm-~ suggestive of nephrite.
Two probable tourist jades from SE Asia were also examined: a supposed sculptured 'lilac jade' was only quartz with a colour between that of amethyst and 'rose quartz', and a green and white bracelet of supposed jade turned out to be of calcite (Smith 2005a).
Ceramics: vitrified wall. Enigmatic vitrified forts are known throughout the c. 1000 BC to
c. AD 1000 Celtic world from Portugal to Sweden, and especially in Ireland and Scotland (Ralston 1983; Buchsenschutz et al. 1998; Kresten et al. 1998). They have in common the fact that stone building blocks at the lower levels are often found to have been fused together by melting. Whether fused for defence, by attack or for religious reasons, a second major archaeological problem is to elucidate how such high temperatures were achieved, and over long surfaces (e.g. 100 m) and sometimes several centimetres depth. A few fragments of vitrified wall were collected by the archaeologist J. Vernioles from the vitrified base of the fre- quently rebuilt fort at St. Suzanne, Mayenne, France. Amongst glass, some crystals were shown by RM to be of e~-cristobalite (SiO2), which is supposed to require a temperature of 1470 °C if created by cooling from [3-cristobalite (Smith & Vernioles 1997). There is considerable doubt over the real temperature achieved, as the literature on this topic is poor and some- times contradictory, and the presence of other elements such as A1 or Na could reduce this temperature; furthermore, polymorphic and order-disorder phenomena are also relevant, as metastable forms of c~- and [3-tridymite and or- and [3-cristobalite can exist. Nevertheless, the temperature must have been high (at some other localities quartzite has been melted (P. Kresten, pers. comm.) and pure quartz melts at 1713 °C). This enigma, strangely unheard of by many archaeologists, is likely to remain a mystery for some time. Chemists have confirmed that wood smouldering during rain could produce gaseous unsaturated hydrocarbons (e.g. acety- lene), which could migrate and burst into flame at extremely high temperature, but the energy available would not be sufficient to penetrate deep into the rock wall. Accumulated lightning strikes over a few millennia provide an alterna- tive possible explanation, otherwise it might be necessary to invoke UFOs (unidentified flying objects)! Interestingly, identical Raman spectra were obtained (Smith & Vernioles 1997) from c~-cristobalite in glass in 'Libyan Desert Glass', which is believed to have been formed by some kind of extra terrestrial impact event.
Corroded metals: copper coins. Coins consti- tute one of the most obvious kinds of metal arte- fact of the cultural heritage and their size is ideal for being placed under a fixed microscope objec- tive. Coins from different periods and composed of various metals (Fe, Cu, Zn, Pb, Ag, A1, Ni, Sn) were thus examined by Bouchard (2001) and Bouchard & Smith (2001, 2005b). As mentioned above, the pure metal or even many alloys do not
at Pennsylvania State University on February 20, 2016http://sp.lyellcollection.org/Downloaded from

20 D.C. SMITH
give a Raman signal, but their corrosion products do. Care must be exercised in interpretation, as the metal in an identified corrosion product may not be a major constituent of the original coin because of 'preferential corrosion'; thus Cu salts are often found on Ag coins that contain a small amount of Cu (Fig. l b). Hence the main purpose is to recognize the kind of corrosion process that has occurred, so as to help restorers and curators decide on the appro- priate method to treat and conserve the coins (or tools, weapons or statues, etc.) (Fig. ld). Concerning copper, the products observed by RM on coins and other artefacts of various ages included Cu-oxides (cuprite (Cu20), tenorite (CuO)), Cu-hydroxycarbonates (azurite (Cu3(CO3)2(OH)2), malachite (Cu2CO3(OH)2)), Cu-hydroxychlorides (atacamite (Cu2CI(OH)3), clinoatacamite (Cu2CI(OH)3)) and Cu- hydroxysulphates (antlerite (Cu3SO4(OH)4), brochantite (Cu4SO4(OH)6)) (Fig. 3c). Particular attention was paid to the RM distinction of the Cu-hydroxychlorides by Bouchard (2001) and Bouchard & Smith (2005b), as clinoatacamite has only recently been recognized by the International Mineralogical Association (IMA) (Jambor et al. 1996) and in earlier works this mineral species may have inadvertently been called paratacamite, which is a Cu-Zn solid- solution ((Cu,Zn)2CI(OH)3)).
Corroded metals: lead plates and an iron ingot. A fragment of a strongly corroded Roman sarcophagus in lead is archived in the MNHN mineral collection and is labelled 'cotun- nite', which thus indicates corrosion by chloride. A R M study found no cotunnite (PbC12) nor any other chloride, but only a mixture of several Pb- hydroxycarbonates: plumbonacrite (Pblo(CO3)6 O(OH)6 ), hydrocerussite (Pb3(CO3)z(OH)2) and cerussite (PbCO3) (Bouchard 2001; Bouchard & Smith 2005b). Another similar plate revealed only the two oxides litharge (PbO) and massicot
2+ (PbO), hence only the valency Pb (as no minium (Pb304) or plattnerite (PbO2) was detected) and no chloride, carbonate or hydroxide.
A Roman ingot brought up from a shipwreck at Sainte-Marie-de-la-Mer off the French coast was examined (Bouchard 2001; Bouchard & Smith 2005b). The minerals found on the highly corroded surface included the Fe-oxide maghemite (~/-Fe203) and the Fe-oxyhydroxides akaganrite, goethite and lepidocrocite (all (FeO(OH))). There were also RM spectral indications of the presence of the ion FeCI42-, and it is known that in akaganrite some (OH)- may be replaced by CI - , especially in marine environments (Arnould-Pernot et al. 1994).
Stained glass: experimental, modem and archae- ological. Glass can be coloured in various ways. The colour may derive from a single chemical element dissolved in trace amounts inside the glass, in which case there is no longer any crystalline mineral phase left to provide a Raman spectrum. Alternatively, there may be micro- or nano-crystalline inclusions, which can provide a Raman spectrum. However, the most common situation in stained glass in church windows (apart from unheated superficial paint) is coloured reaction products formed after pigment minerals (with or without fluxes such as minium and silica to produce a P b - S i - O glass) had been spread on the surface of the glass and then heated; this produces several distinct phenomena: dissolution of some original material into the glass; migration of certain elements from the glass onto the surface (especially alkalis and alkaline earths); intercrys- talline reaction between the applied pigments with or without involvement of the glass; relict original pigment; or glass that did not react at all. A project involving the study of commer- cially available mineral pigments (whose precise chemical composition is not provided by the manufacturers), experimentation to create stained glass and to study the reaction products, and analysis of real archaeological stained glass from the 13th to 20th centuries was described by Smith et al. (1999c) and Bouchard (2001).
The experimentation showed that there is not so much chemical reaction between the original glass and the mixture placed on top as multiple reactions within the mixture. Blue stain caused by superficial cobalt aluminate 'smalt' or 'cobalt blue' (CoO.nAl203) was easily recog- nized by characteristic strong Raman bands along with relict initial corundum (A1203). In a green superficial experimental stain on glass the complex Raman spectrum revealed a consider- able number of intermixed phases: principally blue smalt with orange crocoite (PbCrO4) to create the average green colour by 'colour sub- traction' (i.e. the opposite of the 'colour addition' rules that apply to RGB computer screens) along with minor relict green eskolaite (Cr203) and red minium (Pb304), which had created the crocoite by the oxidizing reaction 6Cr203 + 4 P b 3 0 4 + 702 = 12PbCrO4. A modern commercial deep red glass gave an interesting strong Raman spectrum from the interior of the glass (Fig. 3d); it was possible to identify bands of CdS and CdSe typical of a CdS-CdSe solid- solution (Bouchard 2001), and even deduce the S/(S + Se) proportion to be about 45 atomic % on the basis of a Raman shift calibration made by Schreder & Kiefer (2001).
at Pennsylvania State University on February 20, 2016http://sp.lyellcollection.org/Downloaded from

NON-DESTRUCTIVE RAMAN SPECTROSCOPY 21
The most common mineral pigment found in real archaeological stained glass from earlier periods is hematite (e.g. 13th century from Mans; 16th-17th century from the Mus6e Carnavalet, Paris; 18th-19tb centuries from Strasbourg), but 19th-century glass from Mans and Strasbourg revealed respectively smalt and crocoite. Minerals created by environmental alteration of stained glass included calcite (CaCO3) and gypsum (CaSO4.2H20), and in contact with Pb structural supports a mixture of lead carbonates was found (Bouchard 2001).
immobile analysis in a laboratory: under
air with micro-mapping
Micro-inclusions in Guatemalan jade. The rutile-quartz-jadeitite from Guatemala mentioned above was examined by Raman micro-mapping with a RENISHAW ® INVIA ® spectrometer to gain more information on the nature of the quartz-jadeite contacts (Smith 2004b,c, 2005d). It was already established from Raman point analysis that the Jd content of the clinopyr- oxene is highest in the grain cores (c. 95 mol%) and diminishes sharply at the grain boundaries (sometimes 1-2mo1% lower, sometimes 10- 20 mol% lower), and that the quartz occurs as
micron-sized inclusions in the clinopyroxene grain cores (Gendron et al. 2002). Micro- mapping of a 50 txm x 90 ~m surface with a motorized step of 0.4 Ixm acquired over 20 000 complete spectra overnight. These data were then treated and presented in different ways; for example, the integrated area of the main band of quartz (Fig. 4a) or of the T - O - T band of the clinopyroxene was used to reveal the distri- bution of the presence and absence of the quartz microinclusions, and the Raman wave- number shift of the T - O - T band was used to reveal the tool% Jd distribution in detail (Fig. 4b). The latter map summarizes the col- lision of the North American Plate with the Car- ibbean Plate, subduction and exhumation, all in a 50 ~m x 90 Ixm surface.
Crystal orientation in an Egyptian scarab. An inscribed Ancient Egyptian commemorative scarab was supposed to be made of enstatite ((Mg,Fe)SiO3 with Mg > Fe) (Fig. le). Despite a strong fluorescence, possibly due to patina formed over several millennia, it was possible to confirm from the Raman spectra obtained by placing the scarab on a Raman microscope stage that it does contain enstatite, and so far no other mineral has been found except minor
(a) I~ (b)
E ~
- j
-~z:7
"<.~. ."~ -~'o X 4 0
Fig. 4. Raman micromaps of the quartz-jadeitite RET27 from Guatemala. (a) 3D plot of the 2D spatial distribution of the intensity (signal-to-baseline) of quartz microinclusions over a 95p~m x 50 p~m part of the thin section involving three jadeite grains: they occur only in the core of the larger grain (centre right). (b) 3D plot of the same XY surface as in (a) but with the wavenumber position of the Si-O-Si Raman band around 700 cm- ~ plotted increasing upwards (more Jd upwards). This single 3D map summarizes a complex geodynamical history of tectonic plate collision and subduction that created the high-pressure jadeite + quartz assemblage (the 'hills'), and the subsequent exhumation during which element migration allowed Ca + Mg to enter during retrograde depressurization metamorphism and replace Na + A1, thus reducing the Jd content towards the grain boundaries (the 'valleys').
at Pennsylvania State University on February 20, 2016http://sp.lyellcollection.org/Downloaded from

22 D.C. SMITH
iron oxides. As the patina prevented a good visual observation, it remained possible that the scarab was made of one monocrystal (with minor iron oxide inclusions) or of millions of sub-millimetric crystals as in the case of jadeite-jade. A short Raman map was made and the relative intensity of two bands around 1000cm -1 was examined, as this parameter would vary with crystal orientation under the polarized laser beam. The bands were found to vary in relative intensity, which confirms that their orientation varies and hence that the scarab is polycrystalline (Smith 2004a).
Mobile analysis in situ inside a museum:
with a horizontal microscope
Methods. A DILOR ® LabRam ® spectrometer equipped with a prototype horizontal microscope was carried by four people into the Musre de l 'Homme in Paris in an to attempt to identify various Meso-American sculptured rocks. This LabRam also had a vertical microscope, which allowed the identification of the natural pigment indigo in blue paint on an Aztec whistle in 'terra cotta' (Smith 2000), as this item was small enough to be placed on the micro- scope stage. Most of the other artefacts were much larger. They were also too heavy, some up to c. 60 kg, to place on a special moving platform designed to place objects in front of the horizontal objective. The objects were thus placed on top of various supports, usually strong wooden boxes, and various other pieces of wood, metal or plastic were used to support the artefact in the desired position at which the focused laser beam arrived exactly on that part of the artefact to be analysed. A knob on the hori- zontal objective permitted focusing movement in the z direction, but the xy positions could not be moved. An extra computer screen visualized a magnified image of the artefact and also the precise position of the laser beam. The only problem encountered was when it was necessary to move the artefact only a few microns so as to be able to analyse a particular micron-sized crystal. The 'handyman' solution was to slightly wobble the heavy artefact; when it settled down again after a few moments, the laser beam was never in exactly the same spot; after several attempts the laser beam fell upon either by good luck the desired crystal or one that was of the same species. These analyses are considered as being in situ in the sense that they took place inside the conservation room of the objects, which therefore did not have to leave their room but only be moved a few metres; also,
gloves were worn to avoid any surface damage, so that the artefacts were effectively not touched by hand. The configuration proved excellent for the purpose and produced data on many objects, a few of which are mentioned below.
Rocks: Teotihuacrn, Ta~'no, Totonac and Aztec. A Teotihuacan mask (Fig. l h) labelled 'marble' was composed of layers of greenish-white and greenish-grey colour with parts polished to create angular patterns (glyphs); this artefact rapidly revealed calcite (CaCO3) in both colour zones. A large heavy well-polished Tamo object in a horseshoe shape and labelled 'rock' also yielded only calcite. (This object has been referred to as a 'ceinture/joug' (belt or yoke in English), although this shape has also been con- sidered as a form upon which leather was worked to make large objects, such as a saddle. However, the quality of the finish implies a ceremonial usage.) These data suggested that the rock in each case was composed essentially of calcite (Smith 1999, 2005a), probably marble, the compact dense metamorphosed form of chalk or limestone.
A strangely shaped three-pointed double- headed sculpture from the Ta'ino culture labelled 'rock' was mostly white or grey with some very dark parts. This object revealed spectra of calcite accompanied by a Raman band at 1006 cm-1, compatible with gypsum, but one band is not enough for a definitive identification. Spectra in the dark parts yielded the four Raman bands at 145, 395, 513 and 635 cm - t characteristic of anatase (Smith 1999, 2005a). Anatase is one of the polymorphs of (TiO2) (compare rutile and brookite) but it is usually brilliant white in colour (it is often used as a white pigment) although it can be light grey. It would appear that the anatase occurs as inclusions in the dark parts, which were not identified in the short time available for this analytical operation. The combination of anatase + calcite or of anatase + gypsum is not common in nature and hence no name was attributed to this enigmatic rock.
Another 'ceinture/joug' , but from the Taino culture, was reddish in colour and labelled 'rock'. It revealed the presence of quartz and of albite (NaAISi308) (Smith 1999, 2005a). Several types of igneous, metamorphic or sedi- mentary rocks may contain the association quartz + albite, so no name was given, but at least these mineral species were easily identified.
A third 'ceinture/joug' , Totonac this time, but dark green and labelled 'diorite', revealed the presence of clinopyroxene close to diopside (CaMgSi206) and plagioclase close to
at Pennsylvania State University on February 20, 2016http://sp.lyellcollection.org/Downloaded from

NON-DESTRUCTIVE RAMAN SPECTROSCOPY 23
labradorite ((Na, Ca)(A1, Si)408) (Smith 1999, 2005a). This association is typical of the dark igneous rock gabbro, in which these two mineral species are essential, but they can also occur in the metamorphic rock granulite. The two mineral species essential to a diorite (amphibole + andesine) were not observed. It was thus deduced that this artefact was probably made of gabbro.
Diopside was also discovered in a dark reddish 'feathered serpent' from the Aztec culture labelled 'red porphyry', but diopside is a typical ferromagnesian mineral from a basic rock and is not a typical mineral of red porphyry, an acid igneous rock. The Raman analysis provided support for the idea that it also is a gabbro, as the reddish colour can be explained by a superficial pigment (see below).
Mineral pigments: Aztec and Timshian. The above-mentioned 'feathered serpent' has a surface that is dark red and smooth. Several spectra revealed hematite. A small Aztec reddish sitting statue labelled 'andesite' again yielded analyses of hematite (Smith 1999, 2000). Hematite is a mineral not normally found abundantly in either 'red porphyry' or andesite. However, the ease of finding hematite implied that hematite had been painted on the object as a pigment that masks the real colour of the rock (it is recognized by ethnologists that hematite was sometimes painted on Meso-American ceremonial works).
A more obvious pigment is the red colour of the ears and lips of a Timshian mask sculptured out of a heavy bluish rock. This quickly proved to be cinnabar (HgS) (Smith 1999, 2000).
Monocrystals: Aztec. Several small clear trans- parent carved objects had been labelled 'quartz' or 'calcite'. These could have been verified by traditional mineralogical methods but it was con- venient to pass them rapidly under the laser beam. Most identifications were rapidly con- firmed, but in a few cases a 'calcite' turned out to be quartz and a 'quartz' turned out to be calcite. The famous life-size Aztec skull said to be in 'rock crystal' proved indeed to be in quartz (Smith 1999; Smith & Carabatos- N6delec 2001).
Mobile analysis in situ inside a museum:
under air with optical fibres
Methods. A KAISER ® Holoprobe ® mobile Raman microscope was carried by one man into the treasure vault of the Gallery of
Mineralogy at the MNHN in 2000. A remote head was suspended from a tube on a tripod and in most cases orientated such that the laser beam was focused downwards onto an artefact placed on a table (see Fig. 5b). Occasionally it was more convenient to direct the laser horizon- tally (see Fig. 5a) but any orientation was poss- ible as an optical fibre carried the incident laser and directed the Raman signal back along an adjacent fibre to the spectrometer box (contain- ing the laser source, spectrometer, detectors, etc.) placed on a trolley on the floor to facilitate moving around the Gallery. The technique was impeccable and gave good results on many stones.
Sculptured rocks. Several Chinese jade arte- facts in the gallery were examined to confirm their jade nature as well as the type of jade. A polychrome white + chromium-green pendant with the colour and texture typical of Burmese jade sculptured in China, a much darker green- to-black pendant whose jadeite nature was less obvious (Fig. l f), and a homogeneous pale grey-green sculptured buckle were all proven to be made of jadeite (Smith 2001a, 2005a). A Chinese grasshopper cage, a large Chinese cup studded with other encrusted gemstones (Fig. 5a), and a Mogul dagger head mentioned below encrusted with diamonds, emeralds and 'rubies' were all proven to be made of nephrite (Smith 2001a, 2005a).
Gemstones: Mogul. The Mogul dagger head from NW India (Fig. 5b) is encrusted with emeralds surrounded by a string of diamonds, and rubies are neatly dispersed throughout the artefact. All the emeralds and diamonds were rapidly shown to be correctly identified. However, only about half of the rubies were red corundum (A1203); the others, of the same colour, were found to be red spinel ((Mg,Fe)AI204) (Smith 2005a). This may not indicate any kind of fraud or even of error as the term 'ruby' in certain languages is synony- mous with both corundum and spinel.
Gemstones: Navaratna. An armband and a bracelet encrusted with the specific nine gem- stones (including diamond in the centre) of the Navaratna legend (India) were also examined (Rondeau & Smith 2002). The correct mineral varieties and species were found in eight gems in the bracelet (species in square brackets): coral (red) [calcite] (CaCO3); emerald (green) [beryl] (Be3AlzSi6018); (colourless) [diamond] (C); (red) [grossular] (Ca3A12Si3OI2); pearl (white) [aragonite] (CaCO3); ruby (red)
at Pennsylvania State University on February 20, 2016http://sp.lyellcollection.org/Downloaded from

24 D.C. SMITH
Fig. 5. Photographs of different MRM configurations. (a) Treasure Vault, MNHN, Paris, 2000. A KAISER ® Holoprobe ® remote head connected by optical fibres to the spectrometer box on a trolley below the table. A Chinese nephrite jade cup; the laser beam, coming horizontally from the objective suspended from the tripod, can be seen through the jade (photo modified after Smith 2005a). (b) Treasure Vault, MNHN, Paris, 2000. The KAISER ® Holoprobe ® remote head as in (a). A Mogul inlaid jade dagger handle encrusted with rubies, spinels, emeralds and small diamonds analysed vertically (photo modified after Smith 2005a). (c) Louvre Paris, 2000. The KAISER ® Holoprobe ® remote head as in (a), but with the spectrometer in another room. An Oceanian 3 m high wooden statute painted blue. Noteworthy features are the laser impact spot and that the optical fibre cable is 100 m long (~hoto modified after Smith 2005a). (d) Roucadour cave, Quercy, France, 2004. A DELTA NU ® Inspector Raman with the entire MRM system inside the small black box, oriented here to examine prehistoric pigments on an inclined wall (photo D. C. Smith' ).
[corundum] (A1203); sapphire (blue) [corundum] (A1203); (yellow) [topazl (A12SiO4(OH,F)2)).
However , the expected 'cat ' s eye ' [chryso- beryl] (BeA1204) is in fact a 'cat ' s eye ' quartz (SiO2). In the Navaratna armband, which has three rows each of three large gemstones, the central supposed d iamond is in fact a zircon, the expected ruby is a spinel, the expected chrysoberyl is again 'cat ' s eye ' quartz and the last stone is yel low sapphire [corundum]. The last three stones could easily be due to genuine misidentifications at the historical t ime of mounting, but the central zircon has a not iceably lower-quali ty cut and is rather small for the space available; it is thus very likely
that at some stage in the history of the armband the original stone was replaced by a zircon.
Gemstones." Medieval cloisonn~ gold. Earl~ in 2001 a similar remote head, a DILOR ~ 'Superhead '® plus a spectrometer were carried into the Mus6e des Antiquit6s Nationales in St Germain-en-Laye near Paris. The same kind of configuration was employed to analyse numer- ous stones encrusted in cloisonn6-gold style Medieval jewel lery . Most stones were red and all but one were shown to be garnet; all green stones were glass. The garnets in Medieval cloi- sonn6-gold jewel le ry from Vicq, France (Fig. l g), were examined in a routine fashion by
at Pennsylvania State University on February 20, 2016http://sp.lyellcollection.org/Downloaded from

NON-DESTRUCTIVE RAMAN SPECTROSCOPY 25
rapidly placing each crystal beneath the laser beam, one after the other without the need to verify the laser focusing (Smith & P6rin 2003). They were all a lmandine-pyrope solid-sol- utions, which have been called 'rhodolite' ((Mg,FeZ+)3AlzSi3Oi2), although this is not an official IMA term. Such compositions were already known, but by non-mobile analytical techniques, e.g. by XRF (Greiff 1998), energy- dispersive SEM (Quast & Schltisser 2000) and by Proton Induced X-ray Emission spectroscopy (PIXE) (Calligaro et al. 2002). Most analyses at Vicq were closer to almandine but in two bird's eye fibulae made of silver instead of gold the stone was closer to pyrope. Their chemical dis- tinction was possible by employing the RAMA- NITA method of semi-quantitative analysis (see above) (Smith 2005b).
The same method was employed on other Medieval cloisonne-gold jewellery from Brut, North Ossetia, Russian Federation, and similar almandine-pyrope solid-solutions were found (Smith et al. 2003b; Smith 2005a). However, some garnets were found to be very rich in andradite (Ca3Fe3+Si3Ol2); as far as is known andradite has never been recorded before in this kind of archaeological material.
Mineral pigments: Oceanian statue. The above-mentioned KAISER ® Holoprobe ® mobile Raman microscope was also carried into the Louvre in 2000 to examine some pigmented artworks. Of particular interest was a 3 m high wooden statue from Oceania painted light blue. It was easy to position the remote head on the tripod just in front of the statue and direct the laser at any angle onto the statue (Fig. 5c). In this analytical operation a 100m optical fibre was used and the mobile Raman micro- scope's spectrometer was placed in another room of the museum. Mobile telephones were used to communicate between the person adjusting the focusing and the person controlling the computer, so this is an excellent example of 'remote' analysis (Smith 2001a, 2005a). Very little time was left for this analysis before having to evacuate the building at closing time, and the neon lights of the room in addition to considerable daylight increased the background so much that only one poor spectrum could be collected. However, after extended spectral treatment it was just possible to see a Raman band at the characteristic wavenumber for lazur- ite ((Na,Ca)4_8(A16Si6024)(S,SO4,C1) 1 - 2 ) - It is highly unlikely that the expensive rock 'lapis lazuli' was ground up to be used as a pigment; it is more likely that this statue was painted in
the early 20th century after lazurite had become a synthetic pigment ( 'ultramarine').
Mobile analysis in situ inside a museum:
under glass with optical fibres
Methods. RM has the great advantage over many other analytical techniques that it can analyse through transparent media such as glass, mineral or plastic. It is thanks to this capacity that micro-inclusions within minerals, and especially within gemstones, can be deter- mined precisely, as mentioned in the introduc- tion. To test the MRM method through thick plate glass, the KAISER Holoprobe was used in 2000. The usual tripod with the remote head suspended below it was simply placed on the pro- tective plate glass, as were the computer, key- board and mouse. The laser beam was focused through the glass onto the mineral below, which reduced enormously the intensity of the Raman spectrum of the glass itself. When rela- tively significant Raman bands occurred from the glass (because of a weak Raman signal from the mineral below and hence longer count- ing times) they were in different spectral zones from the Raman bands of the mineral of interest, and were wider and hence distinct, so that the glass was not a problem at all.
Gemstones encrusted in stone marquetry: Florentine tables. Three 17th-century tables with various stones encrusted into black or white marble are exhibited in the Treasure Vault of the Gallery of Mineralogy at the MNHN. They are covered by heavy 1.6 mm thick plate glass, which was not removed. The stones had been inlaid in delicate designs of flowers, fruit, birds and insects. The laser beam was focused on the mineral surface, and as it is flat, it was sufficient to merely slide the tripod over the table and the computer screen gave the Raman spectrum of the mineral under the laser (Fig. l i). In this way it was possible to confirm, for example, the quartz nature of purple crystals composing grapes, quartz or calcite in many designs, quartz in the thorax of a green insect suspected to be a mineral other than quartz, and dolomite (CaMg(CO3)2) in yellowish-white 'lily-of-the-valley' flower petals that could have been in calcite, quartzite or even ivory (Smith & Rondeau 2001; Smith 2002a,c). Blue flowers in lazurite were recognized by their lumines- cence spectrum. The most exciting discovery concerned the red pips of a pomegranate design that were presumed to be of garnet; in fact, some were indeed of garnet but others were of ruby. Thus a very precious stone had been used
at Pennsylvania State University on February 20, 2016http://sp.lyellcollection.org/Downloaded from

26 D.C. SMITH
and one may wonder if the manufacturer had rea- lized that he was mixing two different mineral species in a single kind of design (compare the Mogul dagger head mentioned above).
This short study demonstrated very well that analysing under thick glass is perfectly feasible and indeed rather easy, as exploitable spectra were obtained in a reasonable time.
Raman analysis under water
Methods. As RM can analyse under glass, it can also analyse under water. The world's lakes and oceans are littered with sunken ships still with their cargos, often at shallow depths, and numerous cities from Alexandria to Zeugma have been submerged. Of course, if sufficient finance is available one could build a special submarine and take an entire mobile Raman microscope to great depths and make analyses though a window, i.e. through both glass and water, and this has been done as deep as 3600 m (Brewer et al. 2002). However, for much shallower depths a simpler solution was proposed (Smith 2001b): to take a tripod (or rather a more robust stand) to the sea floor and have a diver focus the laser beam onto part of an artefact of interest. This is possible as there is no electricity at the remote end of the optical fibres. Thus the spectrometer could be in a boat just above. In this way, one could verify sup- posed beryl as the eyes of an Egyptian statue in granite, supposed lazurite as the toenails, and even the kind(s) of feldspar in the granite itself. However, before attempting to mount an expedition, it was important to evaluate if dirty water would cause too much fluorescence and thus hamper if not prohibit the exercise.
Simulation with gemstones. Three gemstones chosen for their Raman response (strong, zircon (ZrSiO4); medium, microcline (KA1Si3Os); weak, sodalite (NasA16Si6024C12)) were placed in a plastic bowl and successively analysed under air, pure distilled water, and various impure waters. These were concocted to create colour, solute and/or suspensions by initially making saturated sugar or salt solutions and then using pure red wine (Smith 2001b). These results were very positive, as pure water actually increased the Raman intensities (perhaps because of cooling), the solutes did not make the spectra any worse, and although the wine considerably reduced the Raman signal because of absorption by the colour and the suspensions, simple spec- tral treatment made it possible to recognize all of the Raman bands except for those of deep blue sodalite. To simulate natural impure
waters more realistically, a second set of exper- iments was carried out with very impure water full of fish dejections or rotten vegetation (Smith 2003) (Fig. lc). The former increased the baseline but did not reduce the Raman signal, whereas the latter reduced the Raman signal but did not increase the baseline. Thus the relevant Raman bands were still visible and after spectral treatment there was effectively no loss of information. Hence even if lake or ocean water does inhibit subaquatic archaeome- try by MRM at certain natural sites of con- centrated impurities and at places polluted by human activities, in general terms there are no physical, chemical, botanical or zoological obstacles.
Ultra-mobile analysis in situ inside a museum
with a hand-held Raman microscope
Methods. A very recent development is an even more extreme miniaturization of an MRM appar- atus, which allows it to be even lighter in weight and easier to manipulate in any direction. The entire DELTA NU ® 'Inspector Raman ~ can be held in one hand, except for the mini-computer, which can be operated with the other hand; it can run on batteries and hence be used effectively anywhere in air (N.B. there is electricity inside this particular 'remote head', as it also contains the laser source, the detector and the spec- trometer). An optional special plastic nozzle fitted over the objective gives exactly the fight focusing distance so that for artefacts that may be touched, such as tough gemstones, it is suffi- cient to place the nozzle on the gem and literally 'shoot' the laser from the 'gun'. For less tough materials the nozzle can be quickly taken off, and for analysing mixtures such as pigments a special video attachment with triple illumination gives an enlarged view of the grains so that the precise zone to be analysed can be chosen. Of course, with all these advantages there must be some disadvantages; these are principally a lower spatial resolution, c. 50 p~m minimum compared with c. 1 ~m for a high-resolution mobile Raman microscope, and a lower spectral resolution such that the bands are wider and their centres less precise. An Inspector Raman was tried in 2004 on the same Florentine tables as mentioned above (Smith & Ospitali 2005), and it was also carried down the Roucadour cave, Quercy, France, in 2004 to examine some other Prehistoric paintings (Smith et al. unpub, data). The first data were disappointing because of several desired features not being available in the supplied software (these problems are being remedied at the time of writing), but the
at Pennsylvania State University on February 20, 2016http://sp.lyellcollection.org/Downloaded from
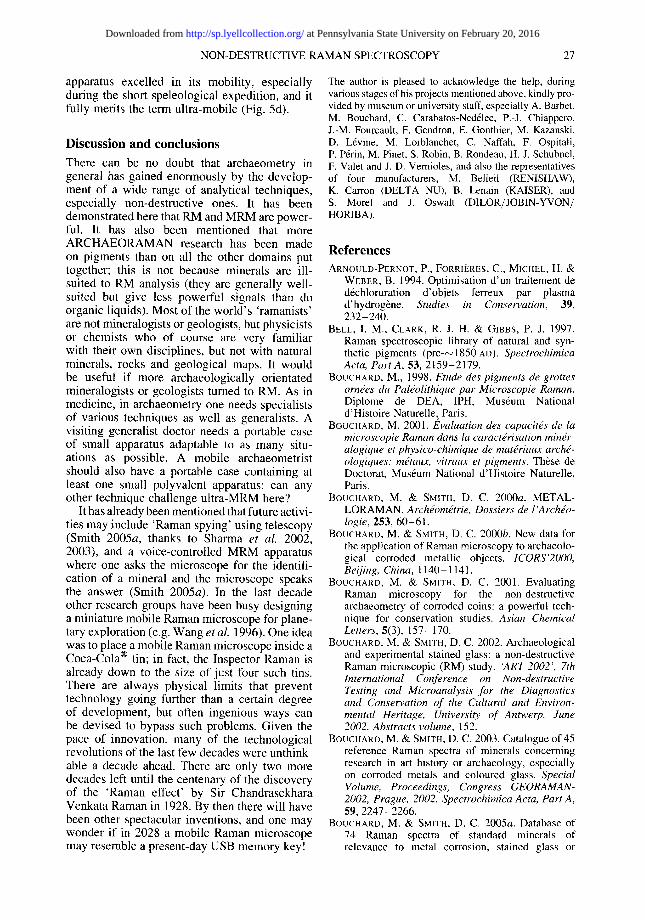
NON-DESTRUCTIVE RAMAN SPECTROSCOPY 27
apparatus excelled in its mobility, especially during the short speleological expedition, and it fully merits the term ultra-mobile (Fig. 5d).
Discussion and conclusions
There can be no doubt that archaeometry in general has gained enormously by the develop- ment of a wide range of analytical techniques, especially non-destructive ones. It has been demonstrated here that RM and MRM are power- ful. It has also been mentioned that more ARCHAEORAMAN research has been made on pigments than on all the other domains put together; this is not because minerals are ill- suited to RM analysis (they are generally well- suited but give less powerful signals than do organic liquids). Most of the world's 'ramanists' are not mineralogists or geologists, but physicists or chemists who of course are very familiar with their own disciplines, but not with natural minerals, rocks and geological maps. It would be useful if more archaeologically orientated mineralogists or geologists turned to RM. As in medicine, in archaeometry one needs specialists of various techniques as well as generalists. A visiting generalist doctor needs a portable case of small apparatus adaptable to as many situ- ations as possible. A mobile archaeometrist should also have a portable case containing at least one small polyvalent apparatus: can any other technique challenge ultra-MRM here?
It has already been mentioned that future activi- ties may include 'Raman spying' using telescopy (Smith 2005a, thanks to Sharma et al. 2002, 2003), and a voice-controlled MRM apparatus where one asks the microscope for the identifi- cation of a mineral and the microscope speaks the answer (Smith 2005a). In the last decade other research groups have been busy designing a miniature mobile Raman microscope for plane- tary exploration (e.g. Wang et al. 1996). One idea was to place a mobile Raman microscope inside a Coca-Cola ® tin; in fact, the Inspector Raman is already down to the size of just four such tins. There are always physical limits that prevent technology going further than a certain degree of development, but often ingenious ways can be devised to bypass such problems. Given the pace of innovation, many of the technological revolutions of the last few decades were unthink- able a decade ahead. There are only two more decades left until the centenary of the discovery of the 'Raman effect' by Sir Chandrasekhara Venkata Raman in 1928. By then there will have been other spectacular inventions, and one may wonder if in 2028 a mobile Raman microscope may resemble a present-day USB memory key!
The author is pleased to acknowledge the help, during various stages of his projects mentioned above, kindly pro- vided by museum or university staff, especially A. Barbet, M. Bouchard, C. Carabatos-Nedrlec, P.-J. Chiappero, J.-M. Fourcault, F. Gendron, E. Gonthier, M. Kazanski, D. LEvine, M. Lorblanchet, C. Naffah, F. Ospitali, P. Prrin, M. Pinet, S. Robin, B. Rondeau, H.-J. Schubnel, F. Valet and J. D. Vernioles, and also the representatives of four manufacturers, M. Belleil (RENISHAW), K. Carron (DELTA NU), B. Lenain (KAISER), and S. Morel and J. Oswalt (DILOR/JOBIN-YVON/ HORIBA).
References ARNOULD-PERNOT, P., FORRII~RES, C., MICHEL, H. &
WEBER, B. 1994. Optimisation d'un traitement de dfchloruration d'objets ferreux par plasma d'hydrogbne. Studies in Conservation, 39, 232-240.
BELL, I. M., CLARK, R. J. H. & GIBBS, P. J. 1997. Raman spectroscopic library of natural and syn- thetic pigments (pre-~1850 AD). Spectrochimica Acta, Part A, 53, 2159-2179.
BOUCHARD, M., 1998. Etude des pigments de grottes orn(es du Pal(olithique par Microscopie Raman. Diplome de DEA, IPH, Musrum National d'Histoire Naturelle, Paris.
BOUCHARD, M. 2001. Evaluation des capacit~s de la microscopie Raman dans la caractrrisation min~r- alogique et physico-chimique de mat~riaux arch~- ologiques: m~taux, vitraux et pigments. Thbse de Doctorat, Musrum National d'Histoire Naturelle, Paris.
BOUCHARD, M. & SMITH, D. C. 2000a. METAL- LORAMAN. Arch~om~trie, Dossiers de l'Arch~o- logie, 253, 60-61.
BOUCHARD, M. & SMITH, D. C. 2000b. New data for the application of Raman microscopy to archaeolo- gical corroded metallic objects. ICORS'2000, Beijing, China, 1140-1141.
BOUCHARD, M. & SMITH, D. C. 2001. Evaluating Raman microscopy for the non-destructive archaeometry of corroded coins: a powerful tech- nique for conservation studies. Asian Chemical Letters, 5(3), 157-170.
BOUCHARD, M. & SMITH, D. C. 2002. Archaeological and experimental stained glass: a non-destructive Raman microscopic (RM) study. 'ART 2002', 7th International Conference on Non-destructive Testing and Microanalysis for the Diagnostics and Conservation of the Cultural and Environ- mental Heritage, University of Antwerp, June 2002, Abstracts volume, 152.
BOUCHARD, M. & SMITH, D. C. 2003. Catalogue of 45 reference Raman spectra of minerals concerning research in art history or archaeology, especially on corroded metals and coloured glass. Special Volume, Proceedings, Congress GEORAMAN- 2002, Prague, 2002. Spectrochimica Acta, Part A, 59, 2247-2266.
BOUCHARD, M. & SMITH, D. C. 2005a. Database of 74 Raman spectra of standard minerals of relevance to metal corrosion, stained glass or
at Pennsylvania State University on February 20, 2016http://sp.lyellcollection.org/Downloaded from

28 D.C. SMITH
Prehistoric rock art. h~: EDWARDS, H. G. M & CHALMERS, J. (eds) Raman Spectroscopy in Archaeology and Art Histotx. The Royal Society of Chemistry, London, 429-464.
BOUCHARD, M. & SMITH, D. C. 2005b. Raman spec- troscopic study of corroded metals, h~: RULL, F. SMITH, D. C. & EDWARDS, H. G. M. (eds) GEORAMAN and ARCHAEORAMAN. Universidad Valladolid, Valladolid (in press).
BREWER, P., PASTERIS, J. D., MALBY, G., et al. 2002, Laser Raman spectroscopy used to study the ocean at 3600-m depth. LOS Transactions American Geophysical Union, 83, 469-470.
BRODY, R. H., EDWARDS, H. G. M., FARWELL, D. W., O'CONNOR, S. & POLLARD, A. M. 1998. Real or take: FT-Raman study of ivories, h2: HEYNS, A. M. (ed.) ICORS, Capetown'98. Wiley, Chichester, 522-523.
BUCHSENSCHUTZ, O., RALSTON, I. B. M. & SCHUBERT, F. 1998. Les fortifications. In: GRUEL, K. ~ VITALI, D. (eds) L'oppidum de Bibracte: un bilan de onze anndes de recherche (1984-1995): Dossier. Gallia, 55, 18-22.
BURGIO, L. & CLARK, R. J. H. 2001. Library of FT-Raman spectra of pigments, minerals, pigment media and varnishes, and supplement to existing library of Raman spectra of pigments with visible excitation. Spectrochimica Acta, Part A, 57, 1491 - 1521.
CALLIGARO, T., COLINART, S., POIROT, J.-P. & SUDRES, C. 2002. Nuclear instruments methods Physics Research B, 189, 320.
COLOMBAN, P. & TREPPOZ, F. 2001. Identification and differentiation of ancient and modern European por- celains by Raman macro- and micro-spectroscopy. Journal of Raman Spectroscopy, 32, 93-102.
COLOMBAN, P., SAGON, G. & FAUREL, X. 2001. Differentiation of antique ceramics fYom the Raman spectra of their coloured glazes and paint- ings, Journal of Raman Spectroscopy, 32, 351-603.
COUPRY, C. & BRISSAUD, D. 1996. Applications in art, jewelry and forensic science. In: TURRELL, G. & CORSET, J. (eds) Raman Microscopy, Develop- ments" and Applications. Academic Press, London, 421-453.
COUpRY, C., SAGON, G. & Lautir, A. 1993. Contribution par spectrom&rie Raman ~ la connaissance des vitraux. Conservation commune d'un patrimoine commun, lkr Colloque du Programme framv- allemand de Recherche pour la Conservation des Monuments historiques, Karlsruhe, 246-249.
DI~LI~-DUBOIS, M. L., DHAMELINCOURT, P. & SCHUBNEL, H.-J. 1978. IXth General Meeting of the International Mineralogical Association, Novosibirsk, USSR, 4 - 9 September. Abstract volume.
DgLE-DUBOIS, M. L., DHAMELINCOURT, P. & SCHUBNEL, H.-J. 1981a. Etude par spectrom&rie Raman d'inclusions dans ies diamants, saphirs et dmeraudes. Revue de Gemmologie, 63, 11 - 14.
Dt~LI~-DUBOIS, M. L., DHAMELINCOURT, P. & SCHUBNEL, H.-J. 1981b. Etude par spectromdtrie
Raman d'inclusions dans les diamants, saphirs et ~meraudes. Revue de Gemmologie, 64, 13-14.
DELE-DUBOIS, M. L., DHAMELINCOURT, P., POIROT, J.-P. & SCHUBNEL, H.-J. 1986a. Differentiation between natural gems and synthetic minerals by laser Raman micro-spectrometry. Journal of Molecular Structure, 143, 135-138.
DELE-DUBOIS. M. L., POIROT, J.-P. & SCHUBNEL, H.-J. 1986b. Identification de micro-inclusions dans des rubis et ~meraudes de synthbse par spectroscopic Raman. Revue de Gemmologie, 88, 15-17.
DELHAYE, M., GUINEAU, B., VEZIN, J. & COUPRY, C. 1985. La microsonde Raman au secours des oeuvres d'art. Mesures, 11, 119-124.
DHAMELINCOURT, P. & BISSON, P. 1977. Principe et rralisation d'un microscope optique utilisant l'effet Raman. Microscopica Acta, 79(3), 267-275.
D! LONARDO, G., MARTINI, C., OSPITALI, F., POLl, G., PRANDSTRALLER, O. & TULLINI, F. 2002. Raman and IR micro-spectroscopy for the study of corrosion products on archaeological bronze objects, hi: VAN GRIEKEN, R., JANSSENS, K., VAN'T DACK, L. & MEERSMAN, G. (eds) Proceed- ings of Art 2002, 7th hTternational Conference on 'Non-destructive Testing and Microanalysis for the Diagnostics and Conservation of the Cultural and Environmental Heritage', 2-6 June 2002, Antwerp, 1-7.
EDWARDS, H. G. M. & TAIT, J. F. K. 1998. Fr-Raman spectroscopic study of decorated stained glass, Applied Spectroscopy, 52(5), 679.
EDWARDS, H. G. M., BARRY, B. W., WILLIAMS, A. C. & RULL, F. 1996a. The Iceman: an FT-Raman spectroscopic study of 5200-year-old human skin. GEORAMAN-96. Terra Abstracts, Supplement 2. Terra Nova, 8, I.
EDWARDS, H. G. M., DAFFNER, L. A., FALK, M. J., FARWELL, D. W., HERON, C. & QUYE, A. 1996b. FF-Raman spectroscopic analyses of ancient resins of archaeological significance, GEORA- MAN-96. Terra Abstracts, Supplement 2. Terra Nova, 8, 1.
EDWARDS, H. G. M., FALK, M. J., FARWELL, D. W. & JANAWAY 1996C. FF-Raman spectroscopic studies of linen samples from archaeological burial sites, GEORAMAN-96. Terra Abstracts, Supplement 2. Terra Nova, 8, 2.
EDWARDS, H. G. M., DRUMMOND, L. & RUSS, J. 1998. Fourier-transform Raman spectroscopic study of pigments in native American Indian rock art: Seminole Canyon. Spectrochimica Acta, Part A, 54, i 849-1856.
FROST, R. L., MARTENS, W., KLOPROGGE, T. & WILLIAMS, P.A. 2002a. Raman spectroscopy of the basic copper choride minerals atacamite and paratacamite: implications for the study of copper, brass and bronze objects of archaeological signi- ficance. Journal of Raman Spectroscopy, 33, 801.
FROST, R. L., WILLIAMS, P. A., MARTENS, W. & KLOPROGGE, T. 2002b. Raman spectroscopy of the polyanionic copper (II) minerals buttgenbachite and connellite: implications for studies of ancient
at Pennsylvania State University on February 20, 2016http://sp.lyellcollection.org/Downloaded from

NON-DESTRUCTIVE RAMAN SPECTROSCOPY 29
copper objects and bronzes. Journal of Raman Spectroscopy, 33, 752.
FRY, R. L., FROST, R. L., TURNER J. & HALLAM, D. 1998. Analysis of ceramics from the wreck of the 'Pandora' using Raman and FTIR spectroscopy. In: HEYNS, A. M. (ed.) ICORS, Capetown'98. Wiley, Chichester, 546-547.
GENDRON, F. 1998. Les roches vertes en Mdsoamdri- que. Archiologie du jade. Doctoral thesis, Ecole Hautes Etudes Sciences Sociales, Paris.
GENDRON, F., SMITH, D. C. & GENDRON-BADOU, A. 2002. Discovery of jadeite-jade in Guatemala confirmed by non-destructive Raman microscopy. Journal of Archaeological Science, 29, 837-851.
GREIFF, S. 1998. Naturwissenschaftliche Untersuchen- gen zur Frage de Rohsteinquellen ftir friihmittelalter- lichen Almandingranatschmuck rheinfr~inkischer Provenienz. Jahrbuch des R6misch-Germanischen Zentralmuseums, Mainz, 45, 599-646.
GRIFFITH, W. P. 1987. Advances in the Raman and infrared spectroscopy of minerals. In: CLARK, R. J. H. & HESTER, R. E. (eds) Spectroscopy of Inorganic-based Materials. Wiley, New York, 119-187.
GUINEAU, B. 1987. L'6tude des pigments par les moyens de la microsp6ctrometrie Raman. In: DELAMARE, F., HACKENS, T. & HELLY, B. (eds) Datation-Caractdrisation des Peintures Parid- tales et Murales (PACT-t7). European University Centre for Cultural Heritage, Ravello, 259-294.
HARLOW, G. E. 1994. Jadeitites, albitites and related rocks from the Motagua Fault Zone, Guatemala. Journal of Metamorphic Geology, 12, 49-68.
JAMBOR, J., DUTRIZAC, J. & ROBERTS, A. 1996. Clinoatacamite, a new polymorph of Cuz(OH)3CI, and its relation to paratacamite and 'anarakite'. Canadian Mineralogist, 34, 61-65.
KIEFERT, L., H,~NNI, H. A. & OSTERTAG, T. 2001. Raman spectroscopic applications to gemmology. /17: LEWIS, I. & EDWARDS, H. G. M. (eds) A Handbook on Raman Spectroscopy. Marcel Dekker, New York, 469-489.
KRESTEN, P., LARSSON, L. & HJARTHNER-HOLDAR, E. 1998. Thermometo' of ancient iron slags from Sweden, and of vitrified material from various hill-forts in western Europe. Geoarchaeology Laboratory, Uppsala, Research Report, R9601.
LASNIER, B. 1989. GEORAMAN-89: CONTRI- BUTIONS. Special Publication, Association Natio- nale de la Recherche Technique, Paris, 17.
LIEM, N. Q., SAGON, G., QUANG, V. X., TAN, H. V. & COLOMBAN, P. 2000. Raman study of the microstructure, composition and processing of ancient Vietnamese (proto)porcelains and celadons (13-16th centuries), Journal of Raman Spec- troscopy, 31, 933.
LIEM, N. Q., THANH, N. T. & COLOMBAN, P., 2002. Reliability of Raman microspectroscopy in analyz- ing ancient ceramics: the case of ancient Vietn- amese porcelain and celadon glazes. Journal of Raman Spectroscopy, 33, 287-294.
MACQUET, C. 1994. Contribution h l'dtude des sur- faces vitreuses anciennes; application b
l'amglioration des techniques de conservation. Th~se de doctorat, Universit6 de Poitiers.
MAESTRATI, R. 1989. Contribution gt l'ddification du catalogue Raman des gemmes. DUG Diploma Memoir, Nantes University.
MARTENS, W., FROST, R. L. & WILLIAMS, P. A. 2003. Raman and infrared spectroscopic study of the basic copper chloride minerals: implications for the study of the copper and brass corrosion and 'bronze disease'. Neues Jahrbuch far Mineralogie, Abhandlungen, 178(2), 197-215.
MCBIRNEY, A., AOKI, K.-I. & BASS, M. N. 1967. Eclo- gites and jadeite from the Motagua Fault Zone, Guatemala. American Mineralogist, 52, 908-918.
MCCANN, L. I., TRENTELMAN, K., POSSLEY, T. & GOLDING, B. 1999. Corrosion of ancient Chinese bronze money trees studied by Raman microscopy. Journal of Raman Spectroscopy, 30, 121-132.
NASDALA, L., SMITH, D. C., KAINDL, R. & ZIEMANN, M. A. 2004. Raman spectroscopy: Analytical per- spectives in mineralogical research. In: BERAN, A. & LIBOWlTZKY, E. (eds) EMU Notes in Miner- alogy. Spectroscopic Methods in Mineralogy, 6, 281-343.
OSr'ITALI, F. & SMITH, D. C. 2005. A Raman micro- scopic library of natural Mn oxides and oxyhydro- xides. In: 3rd International Conference on the Application of Raman Spectroscopy in Art and Archaeology, Louvre, Paris, 31 August-3 September 2005, Abstract volume, 82.
OSPITALI, F., SMITH, D. C. & LORBLANCHET, M. 2005. Raman microscopic analysis of prehistoric pig- ments in wall-painted caves: Roucadour, France. In: 3rd International Conference on the Appli- cation of Raman Spectroscopy in Art and Archaeol- ogy, Louvre, Paris, 31 August-3 September 2005, Abstract volume, 20.
PINET, M. & SMITH, D. C. 1993. La micr0spectrom~- trie Raman des grenats X3Y2Z3012: I. La s6rie calcique naturelle ouvarovite- grossulaire- andradite. Schweizerische Mineralogische and Petrographische Mitteilungen, 73(1), 21-40.
PINEY, M. & SMITH, D. C. 1994. La microspectrom6- trie Raman des grenats X3Y2Z3012: II. La s6rie alu- mineuse naturelle pyrope-almandin-spessartite. Schweizerische Mineralogische and Petrogra- phische Mitteilungen, 74(2), 161 - 179.
PINEY, M., SMITH, D. C. & LASNmR, B. 1992. Utilit6 de la microsonde Raman pour l'identification non-destructive des gemmes, avec une s~lection representative de leurs spectres Raman. In: La Microsonde Raman en Gemmologie. Revue de Gemmologie, numdro spdcial hors sdrie, 11-61.
QUAST, D. & SCHL13SSER, U. 2000. Mineralogische Untersuchungen zur Herkunft der Granate mero- wingerzeitlicher Cloisonn6arbeiten. Germania, 78, 75-96.
RALSTON, I. B. M. 1983. Vitrified walls. Bulletin of Experimental Archaeology, 4, 10-11.
RONDEAU, B. & SMITH, D. C. 2002. Non-destructive in situ identification of gemstones on two 'Navaratna' jewels by MRM (mobile Raman microscopy). In: 'ART 2002', 7th International Conference on Non-destructive Testing and Microanalysis for
at Pennsylvania State University on February 20, 2016http://sp.lyellcollection.org/Downloaded from

30 D.C. SMITH
the Diagnostics and Conservation of the Cultural and Environmental Heritage, University of Antwerp, June 2002, Abstracts volume, 223.
RULL-PEREZ, F. 2001. Applications of IR and Raman spectroscopy to the study of Medieval pigments. In: LEWIS, I. & EDWARDS, H. G. M. (eds) A Handbook on Raman Spectroscopy. Marcel Dekker, New York, 835-862.
RULL-PEREZ, F., EDWARDS, H. G. M., RIVAS, A. & DRUMMOND, L. 1999. Fourier transform Raman spectroscopic characterization of pigments in the Mediaeval frescoes at Convento de la Peregrina, Sahagun, L6on, Spain, Part 1--Preliminary study. Journal of Raman Spectroscopy, 30, 301-305.
SCHMETZER, K., KIEFERT, L., BERNHARDT, H.-J. & BEILI, Z. 1997. Characterisation of Chinese hydro- thermal synthetic emerald. Gems & Gemmology, 33, 277-291.
SCHREDER, B. & KIEFER, W. 2001. Raman spec- troscopy on I I -VI semiconductor nanostructures. In: LEWIS, I. & EDWARDS, H. G. M. (eds) Hand- book of Raman Spectroscopy. Marcel Dekker, New York, 491-547.
SEAWARD, M. R. D. & EDWARDS, H. G. M. 1998. Biological origin of major chemical disturbances on ecclesiastical architecture studied by Fourier transform Raman spectroscopy. Journal of Raman Spectroscopy, 28(9), 691-696.
SHARMA, S. K., ANGEL, S. M., GHOSH, M., HUBBLE, H. W. & LUCEY, P. G. 2002. Remote pulsed laser spectroscopy system for mineral analysis on plane- tary surfaces to 66 meters. Applied Spectroscopy, 56, 699-705.
SHARMA, S. K., LUCEY, P. G., GHOSH, M., HUBBLE, H. W. & HORTON, K. 2003. Stand-off Raman spectroscopic detection of minerals on planetary surfaces. Special Volume, Proceedings, GEORA- MAN-2002 Congress, Prague, 2002. Spectrochi- mica Acta, Part A, 59, 2391-2407.
SMITH, D. C. 1987. The Raman spectroscopy of natural and synthetic minerals: a review. International Conference 'GEORAMAN-86'. Terra Cognita 7, 20-21.
SMITH, D. C. 1988. A review of the peculiar mineral- ogy of the 'Norwegian coesite-eclogite province', with crystal-chemical, petrological, geochemical and geodynamical notes and an extensive bibli- ography. In: SMITH, D. C. (ed.) Eclogites and Eclogite-Facies Rock~. Developments in Petrology, 12, 1-206.
SMITH, D. C. 1996. The importance of using a half- wave plate for the Raman spectroscopy of minerals which cannot be rotated under the laser beam, especially large objects of gemmological or archaeological interest. GEORAMAN-96, Terra Abstracts, Supplement 2. Terra Nova, 8, 23-24.
SMITH, D. C. 1999. Letting loose a laser: MRM (mobile Raman microscopy) for archa~ometry and ethnomineralogy in the next millennium. Minera- logical Socie~ Bulletin, December, 3-8.
SMITH, D. C. 2000. Pigments rouges et bleus sur cinq oeuvres d'Am6rique: analyse non-destructive par MRM (microscopie Raman mobile). Techne, 11, 69-83.
SMITH, D. C. 2001a. Recent MRM (mobile Raman microscope) analytical operations in situ in four French museums. Colloquium: 'Raman Spec- troscopy in Archaeology and Art History', British Museum, bmdon, 20 November 2001.
SMITH, D. C. 2001 b. Simulation of submarine archaeo- merry by non-destructive physico-chemical analy- sis of gemstones by MRM (mobile Raman microscopy) in situ under impure water. Congrks "Archdomdtrie 2001", GMPCA, La Rochelle Universit3.', 108.
SMITH, D. C. 2002a. ARCHAEORAMAN and mobile Raman microscopy (MRM): from pigments in aerial wall-paintings to gemstones in submarine archaeometry. Congress GEORAMAN-2002. Acta Universitatis Carolinae, Geologica, Praha, 46(1), 84-86.
SMITH, D. C. 2002b. Semi-quantitative chemical analysis of garnet and jade in mounted jewels by non-destructive Raman microscopy: recent pro- gress with the analytical method. Congress GEORAMAN-2002. Acta Universitatis Carolinae, Geologica, Praha, 46(1), 87-89.
SMITH, D. C. 2002c. MRM (mobile Raman microscopy) in situ in four national museums. 'ART 2002', 7th International Conference on Non- destructive Testing and Microanalysis for the Diagnostics and Conselvation of the Cultural and Environmental Heritage, Universita' of Antwerp, Belgium, June 2002. Abstracts volume, 46.
SMITH, D. C. 2003. In situ mobile subaquatic archaeo- metry evaluated by non-destructive Raman microscopy of gemstones lying under impure waters. Special Volume, Proceedings, GEORA- MAN-2002 Congress, Prague, 2002. Spectrochi- mica Acta, Part A, 59, 2353-2369.
SMITH, D. C. 2004a. An ancient Egyptian commem- orative scarab carved in rock: non-destructive mineral identification by Raman microscopy, ln: FREDERICKS, P. M., FROST, R. L. & RINTOUL, L. (eds) XIXth International Conference on Raman Spectroscopy, ICORS, Gold Coast, Australia, 8-13 August 2004, Proceedings, (CD-ROM).
SMITH, D. C. 2004b. Raman micromapping of physical and/or chemical transformations of minerals of interest in geology or archaeology. GEORAMAN- 2004, University of Hawaii, Honolulu, Hawaii, 6-11 June 2004. School of Ocean and Earth Science Technology Publications, 04-02, 71-72.
SMITH, D. C. 2004c. Raman micro-mapping of chemi- cal and/or physical mineral phase transformations involving jadeite, coesite, diamond or zircon in natural ultra-high pressure metamorphic environ- ments (UHPM). ht: FREDERICKS, P. M., FROST, R. L. & RINTOUL, L. (eds) XIXth International Conference on Raman Spectroscopy, ICORS, Gold Coast, Australia, 8-13 August 2004, Pro- ceedings (CD-ROM).
SMITH, D. C. 2004d. Non-destructive semi-quantitat- ive chemical analysis of a garnet gemstone by Raman microscopy compared with analysis by PIXE. hTternational Congress GEORAMAN-2004, Honolulu, Universi O' of Hawaii, 6-11 June 2004.
at Pennsylvania State University on February 20, 2016http://sp.lyellcollection.org/Downloaded from

NON-DESTRUCTIVE RAMAN SPECTROSCOPY 31
School of Ocean and Earth Science Technology, Special Publications, 04-02, 73-74.
SMITH, D. C. 2005a. Jewellery and precious stones. In: EDWARDS, H. G. M. & CHALMERS, J. (eds) Raman Spectroscopy in Archaeology and Art History. Royal Society of Chemistry, London, 335-378,
SMITH, D. C. 2005b. The RAMANITA ~- method for non-destructive and in situ semi-quantitative chemical analysis of mineral solid-solutions by multidimensional calibration of Raman wave- number shifts. Proceedings, 6th International GEORAMAN Congress, Hawaii, June 2004. Spec- trochimica Acta, Part A 61, 2299-2314.
SMITH, D. C. 2005c. Mesoamerican jade. In: EDWARDS, H. G. M. & CHALMERS, J. (eds) Raman Spec- troscopy in Archaeology and Art History. Royal Society of Chemistry, London, 412-426,
SMITH, D. C. 2005d. Raman mapping of the clinopyr- oxene/silica contacts in the quartz-jadeitite rock, possibly an 'Olmec Blue' jade, from Guatemala. 3rd International Conference on the Application of Raman Spectroscopy in Art and Archaeology, Louvre, Paris, 31 August-3 September 2005, Abstract volume, 63.
SMITH, D. C. & BARBET, A. 1999. A preliminary Raman microscopic exploration of pigments in wall-paintings in the Roman tomb discovered at Kertch, Ukraine, in 1891. Journal of Raman Spectroscopy, 30, 319- 324.
SMITH, D. C. & BOUCHARD, M. 2000a. Analyse de pigments des peintures pari&ales de Pergouset par microscopie Raman, In: LORBLANCHET, M. (ed.) La Grotte de Pergouset. DAF, Paris, 174.
SMITH, D. C. & BOUCHARD, M. 2000b. PETRORA- MAN. Archdom~trie, Dossiers de l'Archdologie, 253, 54.
SMITH, D. C. & BOUCHARD, M. 2002. Bronze disease: non-destructive distinction of three polymorphs of Cu2CI(OH)3 by Raman microscopy (RM). 'ART 2002', 7th International Conference on Non- destructive Testing and Microanalysis for the Diagnostics and Conservation of the Cultural and Environmental Heritage, University of Antwerp, June 2002, Abstracts Volume, 227.
SMITH, D. C. & CARABATOS-NEDI~LEC, C. 2001. Raman spectroscopy applied to crystals: phenom- ena and principles, concepts and conventions. In: LEWIS, I. & EDWARDS, H. G. M. (eds) A Handbook on Raman Spectroscopy. Marcel Dekker, New York, 349-422.
SMITH, D. C. & EDWARDS, H. G. M. 1998. A wave- number-searchable tabular indexed catalogue for 'ARCHAEORAMAN~':~': Raman spectra of geomaterials and biomaterials of interest in archae- ology (sensu lato). In: HEYNS, A. M. (ed.) ICORS Capetown'98. Wiley, Chichester, 510-511.
SMITH, D. C. & GENDRON, F. 1997a. Archaeometric application of the Raman microprobe to the non- destructive identification of two Pre-Columbian ceremonial polished 'greenstone' axe heads from Mesoamerica. Journal of Raman Spectroscopy 28, 731-738.
SMITH, D. C. & GENDRON, F. 1997b. New locality and a new kind of jadeite jade from Guatemala: rutile-
quartz-jadeitite. Fifth International Eclogite Con- ference. Terra Nova, 9, Abstract Supplement 1, 35.
SMITH, D. C. & OSPITALI, F. 2005. First use of a hand- held self-contained ultra-mobile Raman micro- scope for non-destructive in situ analysis of gem- stones inlaid in XVIIth century Florentine stone marquetry tables. 3rd International Conference on the Application of Raman Spectroscopy in Art and Archaeology, Louvre, Paris, 31 August-3 September 2005, Abstract volume, 66.
SMITH, D. C. & PER1N, P. 2003. Non-destructive in situ MRM (mobile Raman microscope) semi- quantitative chemical analysis of garnets in Mero- vingian cloisonn~ style jewellery from Vicq, France. International Congress 'Application of Raman Spectroscopy in Art and Archaeology', Ghent, September 2002, 62.
SMITH, D. C. & PINET, M. 1989. A method for single variable plotting of multi-dimensional chemical data for comparing Raman wavenumbers with chemical variations in solid-solutions. GEORA- MAN-89: Contributions. Special Publication, Association Nationale de la Recherche Technique, Paris, 24.
SMITH, D. C. & ROBIN, S. 1997. Early-Roman Empire intaglios from 'rescue excavations' ign Paris: an appli- cation of the Raman microprobe to the non-destructive characterisation of archaeological objets. Journal of Raman Spectroscopy, 28(2-3), 189-193.
SMITH, D. C. & RONDEAU, B. 2001. Non-destructive mineralogical analysis of precious stones in situ under thick glass by MRM (mobile Raman microscopy). Congress 'Archdomdtrie 2001 ', GMPCA, La Rochelle Universi~. , La Rochelle, 101.
SMITH, D. C. & VERNIOLES, J. D. 1997. The tempera- ture of fusion of a Celtic vitrified fort: a feasibility study of the application of the Raman microprobe to the non-destructive characterisation of unpre- pared archaeological objects. Journal of Raman Spectroscopy, 28(2- 3), 194-197.
SMITH, D. C., BOUCHARD, M. A. & LORBLANCHET, M. 1999a. An initial Raman microscopic investi- gation of prehistoric rock art in caves of the Quercy district, S. W. France. Journal of Raman Spectroscopy, 30, 347-354.
SMITH, D. C. EDWARDS, H. G. M. and Russ, J. 1999b. Congress GEORAMAN'99, Abstracts. Valladolid University Press, Valladolid, 61-62.
SMITH, D. C., CARABATOS-NEDI~LEC, C. BOUCHARD, M. 1999c. VITRORAMAN: establish- ing a database on the Raman spectra of pigments on and in stained glass. GEORAMAN'99, Abstracts. Valladolid University Press, Valladolid, 36-37.
SMITH, D. C., EDWARDS, H. G. M., BOUCHARD, M., BRODY, R., RULL-PEREZ, F., WITHNALL, R. & COUPRY, C. 2000. MRM (mobile Raman microscopy): a powerful non-destructive poly- valent in situ arch~eometric tool for microspectro- metrical analysis of cultural heritage in the next millennium (ARCHAEORAMAN): geomaterials, biomaterials and pigments. In: GUARINO, A. (ed.) 2nd International Congress on 'Science and Technology for the Safeguard of Cultural Heritage in the Mediterranean Basin, Nanterre, Paris, 5-9
at Pennsylvania State University on February 20, 2016http://sp.lyellcollection.org/Downloaded from

32 D.C. SMITH
July 1999, Proceedings, Vohone 2. Elsevier, Amsterdam, 1373-1375.
SMITH, D. C., GONTHIER, E. & REINHARDT, A. 2003a. Raman Microscopy of Chinese nephrite jades, both ancient cultural artefacts and geological sources in China. International Congress 'Application of Raman Spectroscopy in Art and Archaeology', Ghent, September 2002, 85.
SMITH, D. C., PI~RIN, P., KAZANSKI, M. & GABUEV, T. 2003b. Andradite-rich pentary garnet compositions deduced from non-destructive in situ MRM (Mobile Raman Microscope) semi-quantitative chemical analysis of Vth century cloisonn~ garnets from an Alan warrior burial mound at Brut, Northern Ossetia, Russian Federation. International Con- gress "Application of Raman Spectroscopy in Art and Archaeology', Ghent, September 2002, 39.
VANDENABEELE, P., MOENS, L., EDWARDS, H. G. M. & DAMS, R. 2000. Raman spectroscopic database of azo-pigments and application to modern art
studies. Journal of Raman Spectroscopy, 31(6), 509-517.
WANG, A., JOLLIFF, B. L. & HASKIN, L. A. 1996. Raman system for robotic exploration on planets. GEORAMAN-96, Terra Abstracts, Supplement N 2. Terra Nova, 8, 25.
WANG, C., LU, B., ZUO, J., SUZUKI, M. & CHASE, W. T. 1995. Structural and elemental analysis of the nanocrystal SnO2 in the surface of ancient Chinese black mirrors. Nanostructured Materials, 4, 489-496.
WHITE, W. B. 1975. Structural interpretation of lunar and terrestrial minerals by Raman spec- troscopy. In: KERR, C. (ed.) hlfrared and Raman Spectroscopy of Lunar and Terrestrial Materials. Academic Press, New York, 325-357.
W1THNALL, R. 1999. h7 situ identification of pigments, manuscripts and prints using Raman microscopy. GEORAMAN'99. Valladolid University Press, Vailadolid, 15- ! 6.
at Pennsylvania State University on February 20, 2016http://sp.lyellcollection.org/Downloaded from