Source term identification of environmental radioactive Pu/U particles by their characterization...
15
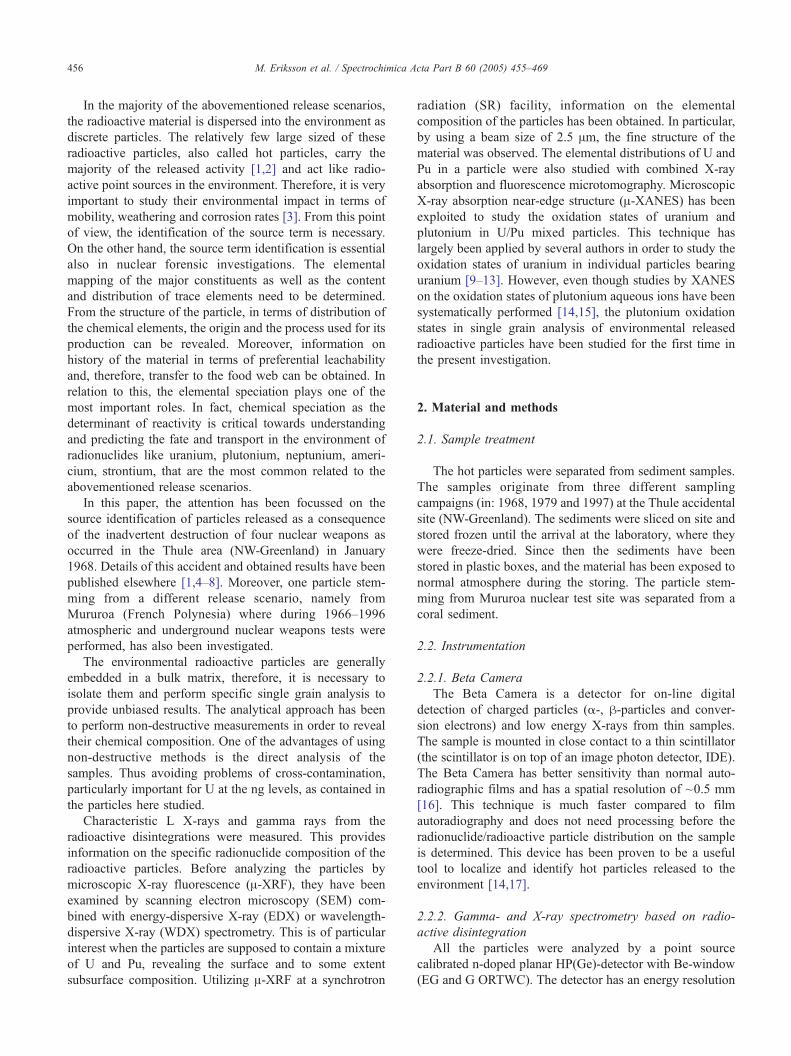
Source term identification of environmental radioactive Pu/U particles by their characterization with non-destructive spectrochemical analytical techniques M. Eriksson a, T , J. Osa ´n b , J. Jernstrfm a , D. Wegrzynek c,d , R. Simon e , E. Chinea-Cano c , A. Markowicz c,d , S. Bamford c , G. Tamborini a , S. Tfrfk b , G. Falkenberg f , A. Alsecz b , H. Dahlgaard g , P. Wobrauschek h , C. Streli h , N. Zoeger h , M. Betti a, T a European Commission, Joint Research Centre, Institute for Transuranium Elements, P.O. Box 2340, D-76125 Karlsruhe, Germany b KFKI Atomic Energy Research Institute, P.O. Box 49, H-1525 Budapest, Hungary c Agency’s Laboratories Seibersdorf, IAEA, A-1400 Vienna, Austria d Faculty of Physics and Nuclear Techniques, University of Mining and Metallurgy, 30-059 Krakow, Poland e Forschungsgruppe Synchrotronstrahlung, FZK Research Centre, D-76021 Karlsruhe, Germany f Hamburger Synchrotronstrahlungslabor HASYLAB at Deutsches Elektronen-Synchrotron DESY, Notkestr. 85, 22607 Hamburg, Germany g Risø National Laboratory, Dk-4000 Roskilde, Denmark h Atominstitut der O ¨ sterreischen Universita ¨ten, Technische Universita ¨t Wien, Stationallee 2, A-1020 Vienna, Austria Received 19 November 2004; accepted 15 February 2005 Available online 7 April 2005 Abstract Six radioactive particles stemming from Thule area (NW-Greenland) were investigated by gamma-ray and L X-ray spectrometry based on radioactive disintegration, scanning electron microscopy coupled with energy-dispersive and wavelength-dispersive X-ray spectrometer, synchrotron radiation based techniques as microscopic X-ray fluorescence, microscopic X-ray absorption near-edge structure (A-XANES) as well as combined X-ray absorption and fluorescence microtomography. Additionally, one particle from Mururoa atoll was examined by microtomography. From the results obtained, it was found out that the U and Pu were mixed in the particles. The U/Pu intensity ratios in the Thule particles varied between 0.05 and 0.36. The results from the microtomography showed that U/Pu ratio was not homogeneously distributed. The 241 Am/ 238 + 239 + 240 Pu activity ratios varied between 0.13 and 0.17, indicating that the particles originate from different source terms. The oxidation states of U and Pu as determined by A-XANES showed that U(IV) is the preponderant species and for Pu, two types of particles could be evidenced. One set had about 90% Pu(IV) while in the other the ratio Pu(IV)/Pu(VI) was about one third. D 2005 Elsevier B.V. All rights reserved. Keywords: Spectrochemistry; Synchrotron radiation techniques; Environmental radioactive microparticles 1. Introduction In the last 10 years, it has repeatedly been observed that nuclear or other radioactive material has been released into the environment or illegally possesses. This as a conse- quence of nuclear accidents and the inadvertent destruction of devices containing nuclear warheads; nuclear weapons tests; illegal dumping of nuclear scrap or waste; releases of traces of radioisotopes from declared or clandestine activ- ities; orphaned radioactive sources; diverted nuclear mate- rial; illicit trafficking of nuclear or other radioactive material. In investigating such incidents, questions arise regarding their impact on the environment and human health as well as the intended use, the origin and, when applicable, the smuggling route for the dispersed material. 0584-8547/$ - see front matter D 2005 Elsevier B.V. All rights reserved. doi:10.1016/j.sab.2005.02.023 T Corresponding authors. E-mail addresses: [email protected] (M. Eriksson)8 [email protected] (M. Betti). Spectrochimica Acta Part B 60 (2005) 455 – 469 www.elsevier.com/locate/sab
-
Upload
independent -
Category
Documents
-
view
5 -
download
0
Transcript of Source term identification of environmental radioactive Pu/U particles by their characterization...
www.elsevier.com/locate/sab
Spectrochimica Acta Part B
Source term identification of environmental radioactive Pu/U particles
by their characterization with non-destructive spectrochemical
analytical techniques
M. Erikssona,T, J. Osanb, J. Jernstrfma, D. Wegrzynekc,d, R. Simone, E. Chinea-Canoc,
A. Markowiczc,d, S. Bamfordc, G. Tamborinia, S. Tfrfkb, G. Falkenbergf, A. Alseczb,H. Dahlgaardg, P. Wobrauschekh, C. Strelih, N. Zoegerh, M. Bettia,T
aEuropean Commission, Joint Research Centre, Institute for Transuranium Elements, P.O. Box 2340, D-76125 Karlsruhe, GermanybKFKI Atomic Energy Research Institute, P.O. Box 49, H-1525 Budapest, Hungary
cAgency’s Laboratories Seibersdorf, IAEA, A-1400 Vienna, AustriadFaculty of Physics and Nuclear Techniques, University of Mining and Metallurgy, 30-059 Krakow, Poland
eForschungsgruppe Synchrotronstrahlung, FZK Research Centre, D-76021 Karlsruhe, GermanyfHamburger Synchrotronstrahlungslabor HASYLAB at Deutsches Elektronen-Synchrotron DESY, Notkestr. 85, 22607 Hamburg, Germany
gRisø National Laboratory, Dk-4000 Roskilde, DenmarkhAtominstitut der Osterreischen Universitaten, Technische Universitat Wien, Stationallee 2, A-1020 Vienna, Austria
Received 19 November 2004; accepted 15 February 2005
Available online 7 April 2005
Abstract
Six radioactive particles stemming from Thule area (NW-Greenland) were investigated by gamma-ray and L X-ray spectrometry based on
radioactive disintegration, scanning electron microscopy coupled with energy-dispersive and wavelength-dispersive X-ray spectrometer,
synchrotron radiation based techniques as microscopic X-ray fluorescence, microscopic X-ray absorption near-edge structure (A-XANES) aswell as combined X-ray absorption and fluorescence microtomography. Additionally, one particle from Mururoa atoll was examined by
microtomography. From the results obtained, it was found out that the U and Pu were mixed in the particles. The U/Pu intensity ratios in the
Thule particles varied between 0.05 and 0.36. The results from the microtomography showed that U/Pu ratio was not homogeneously
distributed. The 241Am/238 +239 +240Pu activity ratios varied between 0.13 and 0.17, indicating that the particles originate from different
source terms. The oxidation states of U and Pu as determined by A-XANES showed that U(IV) is the preponderant species and for Pu, two
types of particles could be evidenced. One set had about 90% Pu(IV) while in the other the ratio Pu(IV)/Pu(VI) was about one third.
D 2005 Elsevier B.V. All rights reserved.
Keywords: Spectrochemistry; Synchrotron radiation techniques; Environmental radioactive microparticles
1. Introduction
In the last 10 years, it has repeatedly been observed that
nuclear or other radioactive material has been released into
the environment or illegally possesses. This as a conse-
0584-8547/$ - see front matter D 2005 Elsevier B.V. All rights reserved.
doi:10.1016/j.sab.2005.02.023
T Corresponding authors.
E-mail addresses: [email protected] (M. Eriksson)8
[email protected] (M. Betti).
quence of nuclear accidents and the inadvertent destruction
of devices containing nuclear warheads; nuclear weapons
tests; illegal dumping of nuclear scrap or waste; releases of
traces of radioisotopes from declared or clandestine activ-
ities; orphaned radioactive sources; diverted nuclear mate-
rial; illicit trafficking of nuclear or other radioactive
material. In investigating such incidents, questions arise
regarding their impact on the environment and human health
as well as the intended use, the origin and, when applicable,
the smuggling route for the dispersed material.
60 (2005) 455–469
M. Eriksson et al. / Spectrochimica Acta Part B 60 (2005) 455–469456
In the majority of the abovementioned release scenarios,
the radioactive material is dispersed into the environment as
discrete particles. The relatively few large sized of these
radioactive particles, also called hot particles, carry the
majority of the released activity [1,2] and act like radio-
active point sources in the environment. Therefore, it is very
important to study their environmental impact in terms of
mobility, weathering and corrosion rates [3]. From this point
of view, the identification of the source term is necessary.
On the other hand, the source term identification is essential
also in nuclear forensic investigations. The elemental
mapping of the major constituents as well as the content
and distribution of trace elements need to be determined.
From the structure of the particle, in terms of distribution of
the chemical elements, the origin and the process used for its
production can be revealed. Moreover, information on
history of the material in terms of preferential leachability
and, therefore, transfer to the food web can be obtained. In
relation to this, the elemental speciation plays one of the
most important roles. In fact, chemical speciation as the
determinant of reactivity is critical towards understanding
and predicting the fate and transport in the environment of
radionuclides like uranium, plutonium, neptunium, ameri-
cium, strontium, that are the most common related to the
abovementioned release scenarios.
In this paper, the attention has been focussed on the
source identification of particles released as a consequence
of the inadvertent destruction of four nuclear weapons as
occurred in the Thule area (NW-Greenland) in January
1968. Details of this accident and obtained results have been
published elsewhere [1,4–8]. Moreover, one particle stem-
ming from a different release scenario, namely from
Mururoa (French Polynesia) where during 1966–1996
atmospheric and underground nuclear weapons tests were
performed, has also been investigated.
The environmental radioactive particles are generally
embedded in a bulk matrix, therefore, it is necessary to
isolate them and perform specific single grain analysis to
provide unbiased results. The analytical approach has been
to perform non-destructive measurements in order to reveal
their chemical composition. One of the advantages of using
non-destructive methods is the direct analysis of the
samples. Thus avoiding problems of cross-contamination,
particularly important for U at the ng levels, as contained in
the particles here studied.
Characteristic L X-rays and gamma rays from the
radioactive disintegrations were measured. This provides
information on the specific radionuclide composition of the
radioactive particles. Before analyzing the particles by
microscopic X-ray fluorescence (A-XRF), they have been
examined by scanning electron microscopy (SEM) com-
bined with energy-dispersive X-ray (EDX) or wavelength-
dispersive X-ray (WDX) spectrometry. This is of particular
interest when the particles are supposed to contain a mixture
of U and Pu, revealing the surface and to some extent
subsurface composition. Utilizing A-XRF at a synchrotron
radiation (SR) facility, information on the elemental
composition of the particles has been obtained. In particular,
by using a beam size of 2.5 Am, the fine structure of the
material was observed. The elemental distributions of U and
Pu in a particle were also studied with combined X-ray
absorption and fluorescence microtomography. Microscopic
X-ray absorption near-edge structure (A-XANES) has beenexploited to study the oxidation states of uranium and
plutonium in U/Pu mixed particles. This technique has
largely been applied by several authors in order to study the
oxidation states of uranium in individual particles bearing
uranium [9–13]. However, even though studies by XANES
on the oxidation states of plutonium aqueous ions have been
systematically performed [14,15], the plutonium oxidation
states in single grain analysis of environmental released
radioactive particles have been studied for the first time in
the present investigation.
2. Material and methods
2.1. Sample treatment
The hot particles were separated from sediment samples.
The samples originate from three different sampling
campaigns (in: 1968, 1979 and 1997) at the Thule accidental
site (NW-Greenland). The sediments were sliced on site and
stored frozen until the arrival at the laboratory, where they
were freeze-dried. Since then the sediments have been
stored in plastic boxes, and the material has been exposed to
normal atmosphere during the storing. The particle stem-
ming from Mururoa nuclear test site was separated from a
coral sediment.
2.2. Instrumentation
2.2.1. Beta Camera
The Beta Camera is a detector for on-line digital
detection of charged particles (a-, h-particles and conver-
sion electrons) and low energy X-rays from thin samples.
The sample is mounted in close contact to a thin scintillator
(the scintillator is on top of an image photon detector, IDE).
The Beta Camera has better sensitivity than normal auto-
radiographic films and has a spatial resolution of ~0.5 mm
[16]. This technique is much faster compared to film
autoradiography and does not need processing before the
radionuclide/radioactive particle distribution on the sample
is determined. This device has been proven to be a useful
tool to localize and identify hot particles released to the
environment [14,17].
2.2.2. Gamma- and X-ray spectrometry based on radio-
active disintegration
All the particles were analyzed by a point source
calibrated n-doped planar HP(Ge)-detector with Be-window
(EG and G ORTWC). The detector has an energy resolution
M. Eriksson et al. / Spectrochimica Acta Part B 60 (2005) 455–469 457
of 530 eV (FWHM, full width at half maximum) at 122 keV.
The detector was cooled with liquid N2 and provided with a
voltage of �2000 V from a high voltage supply (EG and G
Ortec 659). The pulses obtained from the HP(Ge)-detector
were magnified and shaped by a spectroscopy amplifier
(Canberra 2021) and analyzed in the multichannel buffer
(EG and G Ortec, Ethernim 919E). The spectra were
acquired with the software GammaVision32 (EG and G
Ortec). The detector is placed in a well-ventilated room and
is shielded with 5 cm of lead with low content of 210Pb.
2.2.3. Scanning electron microscopy
All the particles were analyzed by Personal SEM
(ASPEXk Instruments) scanning electron microscope with
an energy dispersive X-ray detector (EDX) attached. The
EDX system uses a 10 mm2 Si(Li) detector with an energy
resolution of 135 eV. The analyses were carried out with an
emission current of 30 AA at an acceleration voltage of 20
kV and the probe to sample distance was adjusted between
16 and 18 mm.
One particle was additionally analyzed in a Tescan Vega
TS 5130MM SEM with a wavelength dispersive X-ray
(WDX) analyzer. The WDX spectrometer was a INCAWave
(Oxford instruments) system using an INCA Energy+soft-
ware. For the analysis, a PET-crystal was used with an
energy resolution of 20 eV. The analyses were carried out
with an acceleration voltage of 30 kV and a beam current of
1.29 nA.
2.2.4. X-ray fluorescence microprobe
The A-XRF measurements were carried out at the X-ray
fluorescence microprobe station of the FLUO-TOPO Beam-
line of the ANKA synchrotron facility (Karlsruhe, Ger-
many) [18]. A monochromatic beam with photon energy
23.2F0.3 keV and a photon flux of ~1012 ph s�1 mm�2
was focussed by a mono-capillary. The resulting microbeam
had an intensity of ~4�109 ph s�1 and a diameter of 20
Am, resulting in a footprint of 30�20 Am2 on the sample
due to the 458 geometry. A collimated Si(Li) detector
[resolution: 133 eV (FWHM) at 5.9 keV] was placed in a
right angle to the incoming beam in order to minimize the
inelastic scattering going in to the detector. On top of the
detector collimator, a 20 Am Al foil was attached to prevent
the low energy X-rays to reach the detector and thereby
reduce the deadtime. Adjusting the detector–sample dis-
tance by moving the detector also controlled the deadtime.
The slits in the beamline and absorbers of the exciting beam
were adjusted in order to reach optimal photon flux for the
measurements. The elemental maps and the Pu/U-ratios
were determined from the intensities of U and Pu-La X-ray
lines. Elemental maps were produced with a step size of 10
Am, in both horizontal and vertical direction of the sample,
with a spectral acquisition real time of 20–30 s at each
pixel. At the pixel of each recorded map where the
maximum U-La X-ray intensity was observed, a second
acquisition was done to determine the Pu/U-ratio. The data
acquisition times were chosen so that the precision of the
measurements was better than 1.5% for both elements of
interest. The spectra were deconvoluted with a software
program called AXIL [19] using non-linear least-squares
fitting. The energies and relative intensities of the L and M
line series of plutonium have been added to the X-ray
library of AXIL, based on a database of X-ray transition
energies [20].
2.2.4.1. Microspatial elemental distribution measurements
with a 2.5 lm X-ray beam. In order to obtain a better spatial
resolution for the study of the microstructure of single
particles, the X-ray beam has been focussed with a new type
of compound refractive X-ray lens [21] down to a beam size
of a few micrometers. The photon energy was set to 18.7
keV in order to obtain ideal focus conditions of the lens and
to excite Pu-L3 and U-L3 edges. By knife-edge scanning of
a 0.5 Am thin Ni/Fe structure (IRMM 301 standard), the
beam size was measured as 2.5�2.5 Am2.
2.2.5. Combined X-ray absorption and fluorescence
microtomography
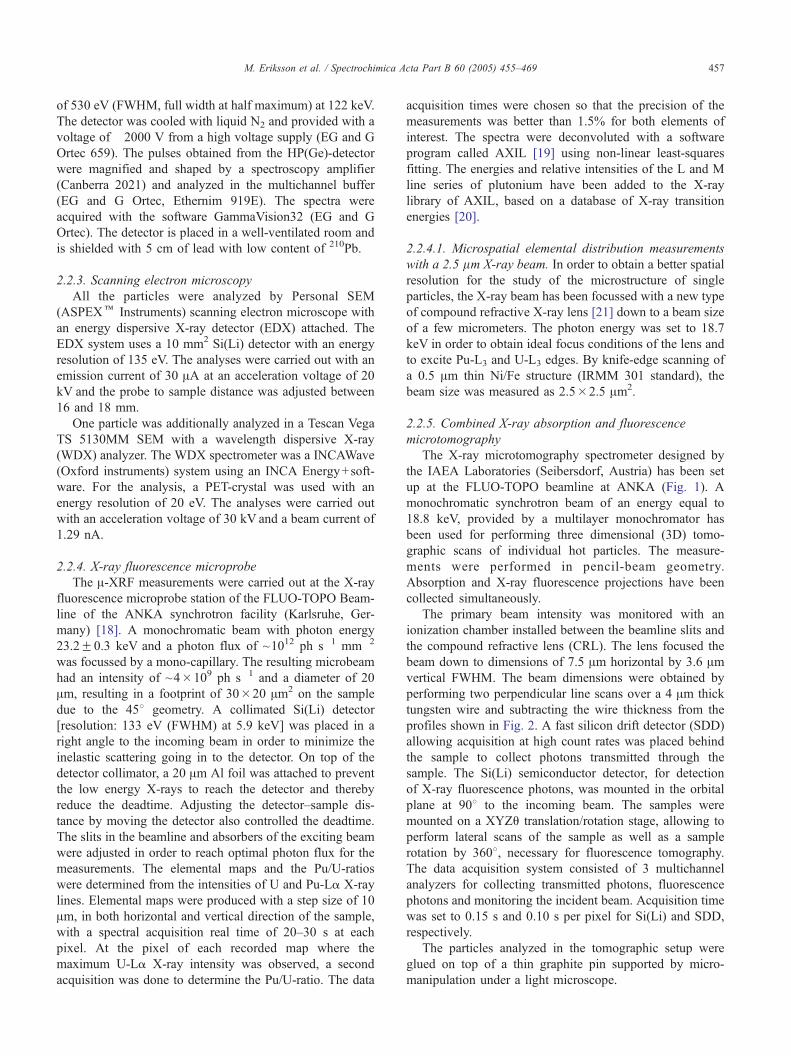
The X-ray microtomography spectrometer designed by
the IAEA Laboratories (Seibersdorf, Austria) has been set
up at the FLUO-TOPO beamline at ANKA (Fig. 1). A
monochromatic synchrotron beam of an energy equal to
18.8 keV, provided by a multilayer monochromator has
been used for performing three dimensional (3D) tomo-
graphic scans of individual hot particles. The measure-
ments were performed in pencil-beam geometry.
Absorption and X-ray fluorescence projections have been
collected simultaneously.
The primary beam intensity was monitored with an
ionization chamber installed between the beamline slits and
the compound refractive lens (CRL). The lens focused the
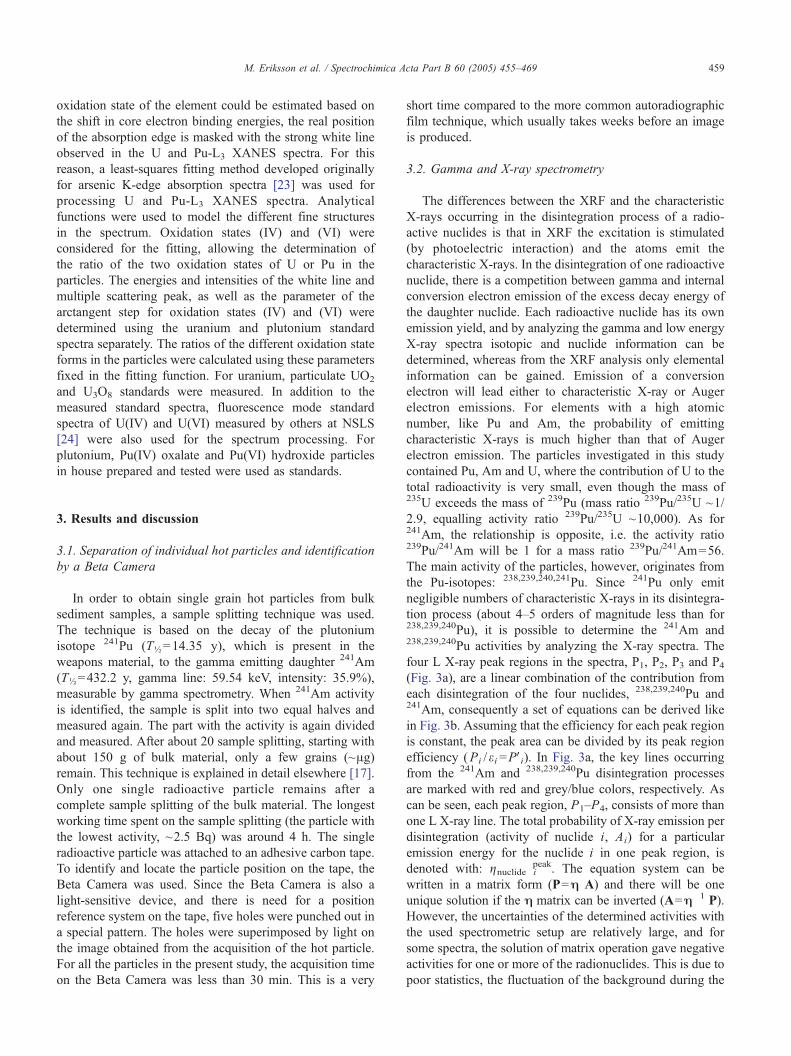
beam down to dimensions of 7.5 Am horizontal by 3.6 Amvertical FWHM. The beam dimensions were obtained by
performing two perpendicular line scans over a 4 Am thick
tungsten wire and subtracting the wire thickness from the
profiles shown in Fig. 2. A fast silicon drift detector (SDD)
allowing acquisition at high count rates was placed behind
the sample to collect photons transmitted through the
sample. The Si(Li) semiconductor detector, for detection
of X-ray fluorescence photons, was mounted in the orbital
plane at 908 to the incoming beam. The samples were
mounted on a XYZu translation/rotation stage, allowing to
perform lateral scans of the sample as well as a sample
rotation by 3608, necessary for fluorescence tomography.
The data acquisition system consisted of 3 multichannel
analyzers for collecting transmitted photons, fluorescence
photons and monitoring the incident beam. Acquisition time
was set to 0.15 s and 0.10 s per pixel for Si(Li) and SDD,
respectively.
The particles analyzed in the tomographic setup were
glued on top of a thin graphite pin supported by micro-
manipulation under a light microscope.
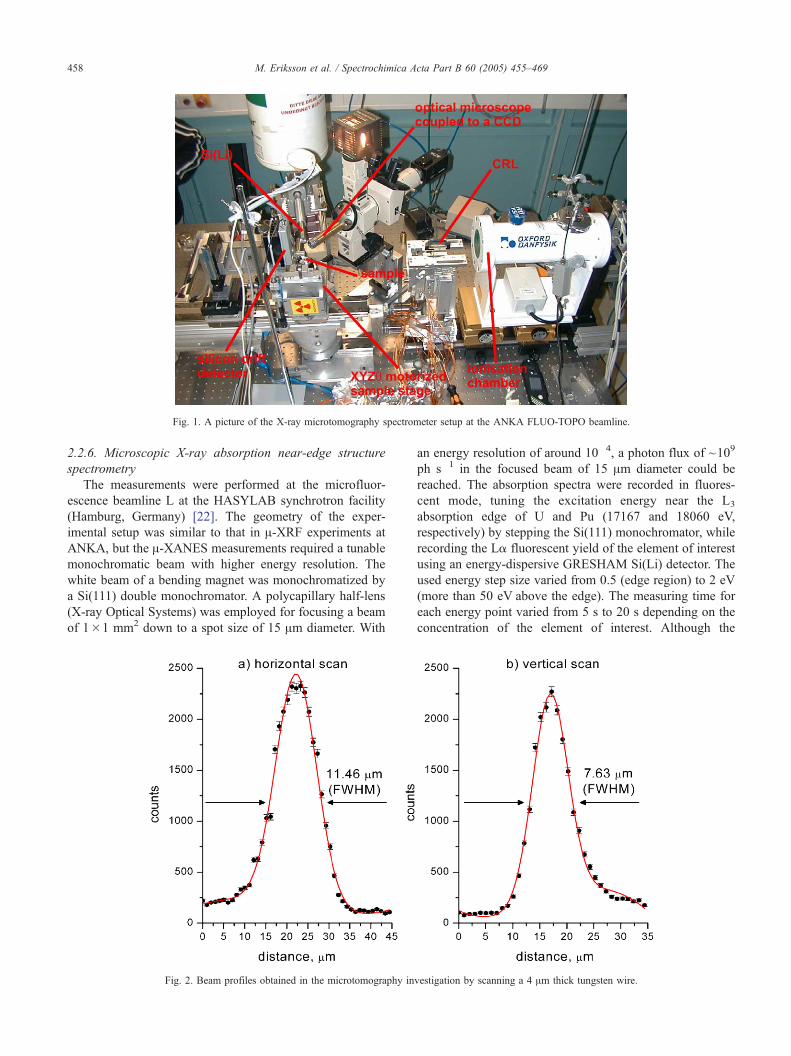
Fig. 1. A picture of the X-ray microtomography spectrometer setup at the ANKA FLUO-TOPO beamline.
M. Eriksson et al. / Spectrochimica Acta Part B 60 (2005) 455–469458
2.2.6. Microscopic X-ray absorption near-edge structure
spectrometry
The measurements were performed at the microfluor-
escence beamline L at the HASYLAB synchrotron facility
(Hamburg, Germany) [22]. The geometry of the exper-
imental setup was similar to that in A-XRF experiments at
ANKA, but the A-XANES measurements required a tunable
monochromatic beam with higher energy resolution. The
white beam of a bending magnet was monochromatized by
a Si(111) double monochromator. A polycapillary half-lens
(X-ray Optical Systems) was employed for focusing a beam
of 1�1 mm2 down to a spot size of 15 Am diameter. With
Fig. 2. Beam profiles obtained in the microtomography in
an energy resolution of around 10�4, a photon flux of ~109
ph s�1 in the focused beam of 15 Am diameter could be
reached. The absorption spectra were recorded in fluores-
cent mode, tuning the excitation energy near the L3
absorption edge of U and Pu (17167 and 18060 eV,
respectively) by stepping the Si(111) monochromator, while
recording the La fluorescent yield of the element of interest
using an energy-dispersive GRESHAM Si(Li) detector. The
used energy step size varied from 0.5 (edge region) to 2 eV
(more than 50 eV above the edge). The measuring time for
each energy point varied from 5 s to 20 s depending on the
concentration of the element of interest. Although the
vestigation by scanning a 4 Am thick tungsten wire.
M. Eriksson et al. / Spectrochimica Acta Part B 60 (2005) 455–469 459
oxidation state of the element could be estimated based on
the shift in core electron binding energies, the real position
of the absorption edge is masked with the strong white line
observed in the U and Pu-L3 XANES spectra. For this
reason, a least-squares fitting method developed originally
for arsenic K-edge absorption spectra [23] was used for
processing U and Pu-L3 XANES spectra. Analytical
functions were used to model the different fine structures
in the spectrum. Oxidation states (IV) and (VI) were
considered for the fitting, allowing the determination of
the ratio of the two oxidation states of U or Pu in the
particles. The energies and intensities of the white line and
multiple scattering peak, as well as the parameter of the
arctangent step for oxidation states (IV) and (VI) were
determined using the uranium and plutonium standard
spectra separately. The ratios of the different oxidation state
forms in the particles were calculated using these parameters
fixed in the fitting function. For uranium, particulate UO2
and U3O8 standards were measured. In addition to the
measured standard spectra, fluorescence mode standard
spectra of U(IV) and U(VI) measured by others at NSLS
[24] were also used for the spectrum processing. For
plutonium, Pu(IV) oxalate and Pu(VI) hydroxide particles
in house prepared and tested were used as standards.
3. Results and discussion
3.1. Separation of individual hot particles and identification
by a Beta Camera
In order to obtain single grain hot particles from bulk
sediment samples, a sample splitting technique was used.
The technique is based on the decay of the plutonium
isotope 241Pu (TO=14.35 y), which is present in the
weapons material, to the gamma emitting daughter 241Am
(TO=432.2 y, gamma line: 59.54 keV, intensity: 35.9%),
measurable by gamma spectrometry. When 241Am activity
is identified, the sample is split into two equal halves and
measured again. The part with the activity is again divided
and measured. After about 20 sample splitting, starting with
about 150 g of bulk material, only a few grains (~Ag)remain. This technique is explained in detail elsewhere [17].
Only one single radioactive particle remains after a
complete sample splitting of the bulk material. The longest
working time spent on the sample splitting (the particle with
the lowest activity, ~2.5 Bq) was around 4 h. The single
radioactive particle was attached to an adhesive carbon tape.
To identify and locate the particle position on the tape, the
Beta Camera was used. Since the Beta Camera is also a
light-sensitive device, and there is need for a position
reference system on the tape, five holes were punched out in
a special pattern. The holes were superimposed by light on
the image obtained from the acquisition of the hot particle.
For all the particles in the present study, the acquisition time
on the Beta Camera was less than 30 min. This is a very
short time compared to the more common autoradiographic
film technique, which usually takes weeks before an image
is produced.
3.2. Gamma and X-ray spectrometry
The differences between the XRF and the characteristic
X-rays occurring in the disintegration process of a radio-
active nuclides is that in XRF the excitation is stimulated
(by photoelectric interaction) and the atoms emit the
characteristic X-rays. In the disintegration of one radioactive
nuclide, there is a competition between gamma and internal
conversion electron emission of the excess decay energy of
the daughter nuclide. Each radioactive nuclide has its own
emission yield, and by analyzing the gamma and low energy
X-ray spectra isotopic and nuclide information can be
determined, whereas from the XRF analysis only elemental
information can be gained. Emission of a conversion
electron will lead either to characteristic X-ray or Auger
electron emissions. For elements with a high atomic
number, like Pu and Am, the probability of emitting
characteristic X-rays is much higher than that of Auger
electron emission. The particles investigated in this study
contained Pu, Am and U, where the contribution of U to the
total radioactivity is very small, even though the mass of235U exceeds the mass of 239Pu (mass ratio 239Pu/235U ~1/
2.9, equalling activity ratio 239Pu/235U ~10,000). As for241Am, the relationship is opposite, i.e. the activity ratio239Pu/241Am will be 1 for a mass ratio 239Pu/241Am=56.
The main activity of the particles, however, originates from
the Pu-isotopes: 238,239,240,241Pu. Since 241Pu only emit
negligible numbers of characteristic X-rays in its disintegra-
tion process (about 4–5 orders of magnitude less than for238,239,240Pu), it is possible to determine the 241Am and238,239,240Pu activities by analyzing the X-ray spectra. The
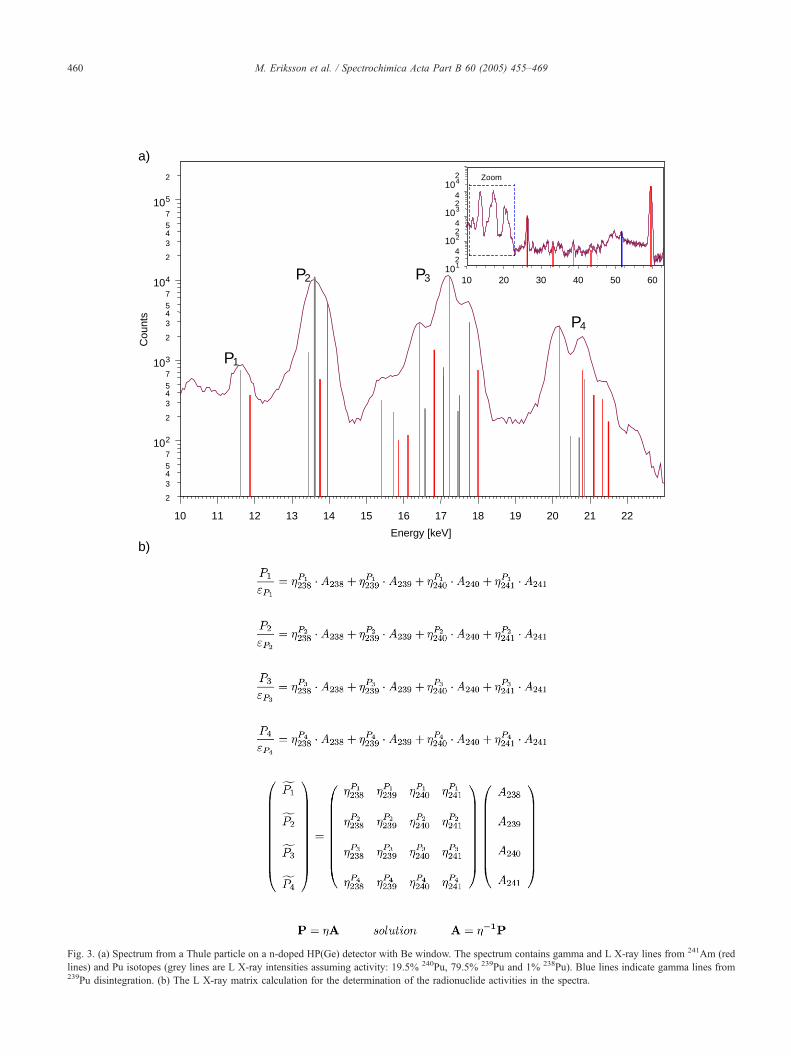
four L X-ray peak regions in the spectra, P1, P2, P3 and P4(Fig. 3a), are a linear combination of the contribution from
each disintegration of the four nuclides, 238,239,240Pu and241Am, consequently a set of equations can be derived like
in Fig. 3b. Assuming that the efficiency for each peak region
is constant, the peak area can be divided by its peak region
efficiency (Pi / ei =PVi). In Fig. 3a, the key lines occurring
from the 241Am and 238,239,240Pu disintegration processes
are marked with red and grey/blue colors, respectively. As
can be seen, each peak region, P1–P4, consists of more than
one L X-ray line. The total probability of X-ray emission per
disintegration (activity of nuclide i, Ai) for a particular
emission energy for the nuclide i in one peak region, is
denoted with: gnuclide ipeak. The equation system can be
written in a matrix form (P=H A) and there will be one
unique solution if the H matrix can be inverted (A=H�1 P).
However, the uncertainties of the determined activities with
the used spectrometric setup are relatively large, and for
some spectra, the solution of matrix operation gave negative
activities for one or more of the radionuclides. This is due to
poor statistics, the fluctuation of the background during the
10 11 12 13 14 15 16 17 18 19 20 21 22
Energy [keV]
102
103
104
105
2
345
7
2
345
7
2
345
7
2
345
7
2
Cou
nts
Zoom
10 20 30 40 50 60101
102
103
104
24
24
24
2
P1
P2 P3
P4
a)
b)
Fig. 3. (a) Spectrum from a Thule particle on a n-doped HP(Ge) detector with Be window. The spectrum contains gamma and L X-ray lines from 241Am (red
lines) and Pu isotopes (grey lines are L X-ray intensities assuming activity: 19.5% 240Pu, 79.5% 239Pu and 1% 238Pu). Blue lines indicate gamma lines from239Pu disintegration. (b) The L X-ray matrix calculation for the determination of the radionuclide activities in the spectra.
M. Eriksson et al. / Spectrochimica Acta Part B 60 (2005) 455–469460
M. Eriksson et al. / Spectrochimica Acta Part B 60 (2005) 455–469 461
acquisitions, the uncertainties on the intensities-data of the
X-ray transitions and possible self-absorption processes.
Therefore, the gamma and X-ray spectra were only used to
determine the 241Am and the total 238 + 239 + 240Pu activities.
This is possible for the particles investigated here, since it is
known that the debris from Thule consists only of two
sources of unique Pu isotopic composition [1,25,26].
Knowing that, for these two different sources, denoted as
bHigh ratioQ and bLow ratioQ, the relative activity for238Pu,239Pu and240Pu is 1.56; 81.49; 16.95 and of 0.99;
90.01; 9.00%, respectively, the total 238 + 239 + 240Pu activity
could be calculated. In addition, the 241Am activities were
determined from the 59.54 keV gamma line. By using this
determined activity, each X-ray peak in the spectra consists
only of one undetermined component, i.e. the activity of the
bHigh ratioQ or of the bLow ratioQ. In Table 1, the
determined 241Am and 238+ 239 + 240Pu activities are reported.
The differences in the determined activities for the bHighratioQ and the bLow ratioQ are small, as expected. The241Am/238 + 239 + 240Pu activity ratios vary from 0.13 to 0.17,
which is in accordance with other studies of sediment from
the Thule area [1,27].
A similar approach has been used to determine the Pu
isotopic ratios in bulk Thule samples [25,28,29]. A radio-
chemical separation of Pu from the bulk sample was
performed and the 238Pu and 239+ 240Pu activities were
determined by alpha spectrometry. With this information,
the 240Pu/239Pu activity ratio is obtained from the X-ray
spectrometric data.
3.3. SEM
All the particles were analyzed by SEM with an EDX
detector attached. The morphology, size and the surface
elemental composition of the particles were studied. The
secondary (SE) and back-scattered electron (BE) images
also served as guiding maps when relocation of the particles
was done at the SR-facilities ANKA and HASYLAB. The
SEM used has a maximum acceleration voltage of 20 kV,
which did not allow the efficient excitation of U and Pu-L
shells. In the EDX spectra the M X-ray peaks of U and Pu
were not resolved due to the strong overlap between the Ma
peaks of Pu and the Mh peaks of U. Absolute determination
of the Pu/U element ratio could not be done, as standard
mixed Pu/U particles would be required to calibrate the
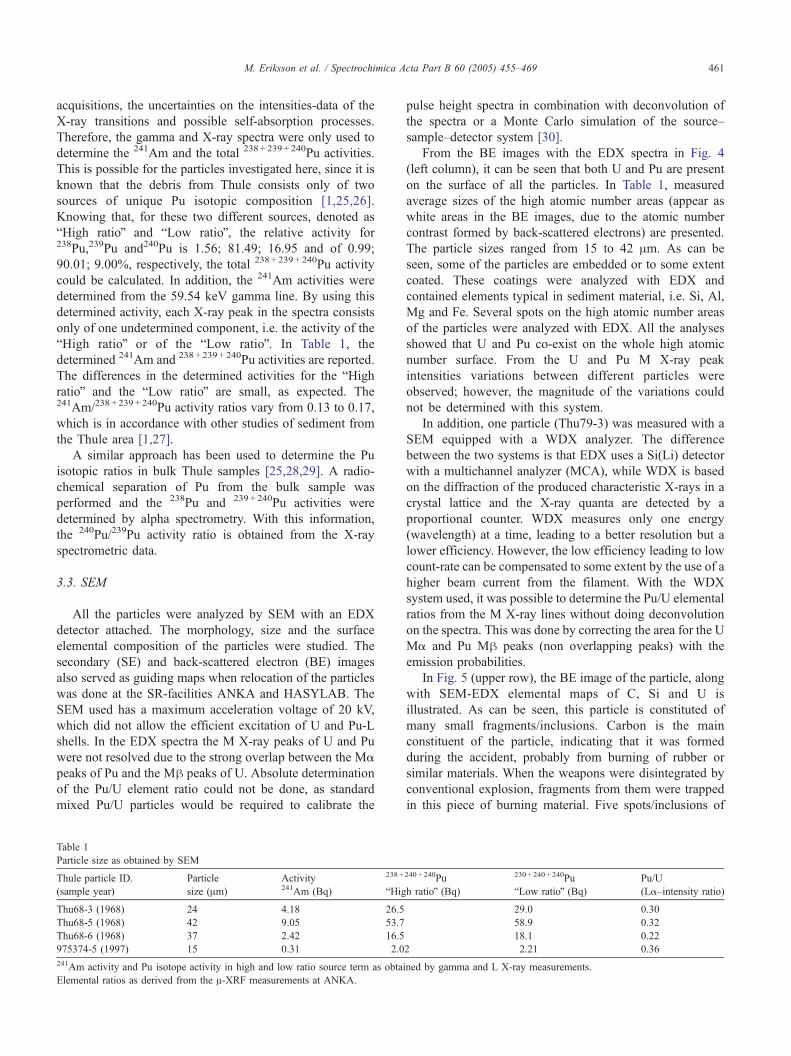
Table 1
Particle size as obtained by SEM
Thule particle ID.
(sample year)
Particle
size (Am)
Activity241Am (Bq)
238+
bHig
Thu68-3 (1968) 24 4.18 26.5
Thu68-5 (1968) 42 9.05 53.7
Thu68-6 (1968) 37 2.42 16.5
975374-5 (1997) 15 0.31 2.0
241Am activity and Pu isotope activity in high and low ratio source term as obtai
Elemental ratios as derived from the A-XRF measurements at ANKA.
pulse height spectra in combination with deconvolution of
the spectra or a Monte Carlo simulation of the source–
sample–detector system [30].
From the BE images with the EDX spectra in Fig. 4
(left column), it can be seen that both U and Pu are present
on the surface of all the particles. In Table 1, measured
average sizes of the high atomic number areas (appear as
white areas in the BE images, due to the atomic number
contrast formed by back-scattered electrons) are presented.
The particle sizes ranged from 15 to 42 Am. As can be
seen, some of the particles are embedded or to some extent
coated. These coatings were analyzed with EDX and
contained elements typical in sediment material, i.e. Si, Al,
Mg and Fe. Several spots on the high atomic number areas
of the particles were analyzed with EDX. All the analyses
showed that U and Pu co-exist on the whole high atomic
number surface. From the U and Pu M X-ray peak
intensities variations between different particles were
observed; however, the magnitude of the variations could
not be determined with this system.
In addition, one particle (Thu79-3) was measured with a
SEM equipped with a WDX analyzer. The difference
between the two systems is that EDX uses a Si(Li) detector
with a multichannel analyzer (MCA), while WDX is based
on the diffraction of the produced characteristic X-rays in a
crystal lattice and the X-ray quanta are detected by a
proportional counter. WDX measures only one energy
(wavelength) at a time, leading to a better resolution but a
lower efficiency. However, the low efficiency leading to low
count-rate can be compensated to some extent by the use of a
higher beam current from the filament. With the WDX
system used, it was possible to determine the Pu/U elemental
ratios from the M X-ray lines without doing deconvolution
on the spectra. This was done by correcting the area for the U
Ma and Pu Mh peaks (non overlapping peaks) with the
emission probabilities.
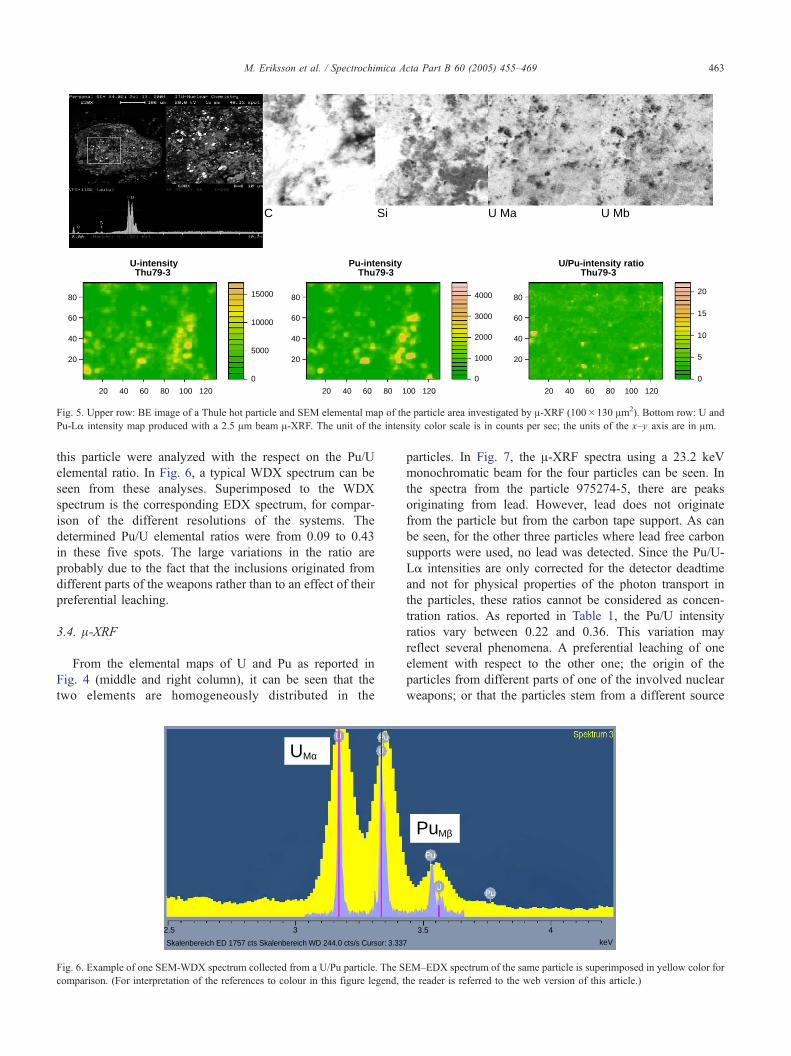
In Fig. 5 (upper row), the BE image of the particle, along
with SEM-EDX elemental maps of C, Si and U is
illustrated. As can be seen, this particle is constituted of
many small fragments/inclusions. Carbon is the main
constituent of the particle, indicating that it was formed
during the accident, probably from burning of rubber or
similar materials. When the weapons were disintegrated by
conventional explosion, fragments from them were trapped
in this piece of burning material. Five spots/inclusions of
240 + 240Pu
h ratioQ (Bq)
230+ 240+ 240Pu
bLow ratioQ (Bq)Pu/U
(La–intensity ratio)
29.0 0.30
58.9 0.32
18.1 0.22
2 2.21 0.36
ned by gamma and L X-ray measurements.
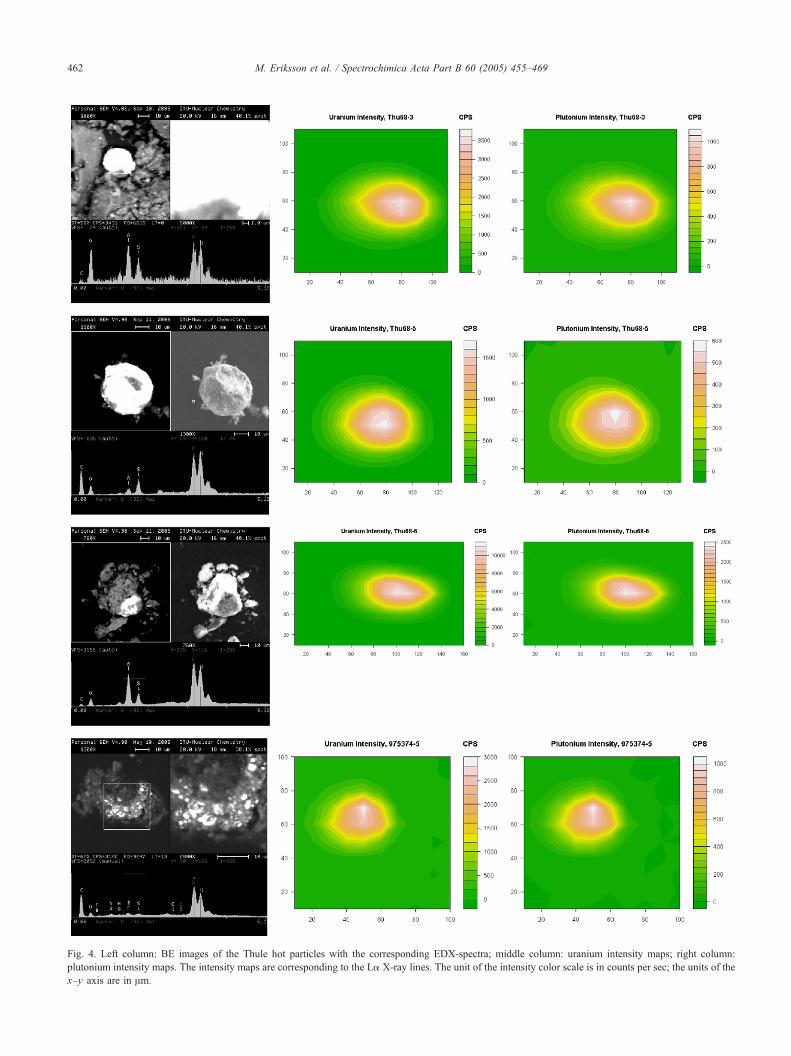
Fig. 4. Left column: BE images of the Thule hot particles with the corresponding EDX-spectra; middle column: uranium intensity maps; right column:
plutonium intensity maps. The intensity maps are corresponding to the La X-ray lines. The unit of the intensity color scale is in counts per sec; the units of the
x–y axis are in Am.
M. Eriksson et al. / Spectrochimica Acta Part B 60 (2005) 455–469462
0
5
10
15
20
20 40 60 80 100 120
20
40
60
80
U/Pu-intensity ratio Thu79-3
0
1000
2000
3000
4000
20 40 60 80 100 120
20
40
60
80
Pu-intensity Thu79-3
0
5000
10000
15000
20 40 60 80 100 120
20
40
60
80
U-intensity Thu79-3
C Si U Ma U Mb
Fig. 5. Upper row: BE image of a Thule hot particle and SEM elemental map of the particle area investigated by A-XRF (100�130 Am2). Bottom row: U and
Pu-La intensity map produced with a 2.5 Am beam A-XRF. The unit of the intensity color scale is in counts per sec; the units of the x–y axis are in Am.
M. Eriksson et al. / Spectrochimica Acta Part B 60 (2005) 455–469 463
this particle were analyzed with the respect on the Pu/U
elemental ratio. In Fig. 6, a typical WDX spectrum can be
seen from these analyses. Superimposed to the WDX
spectrum is the corresponding EDX spectrum, for compar-
ison of the different resolutions of the systems. The
determined Pu/U elemental ratios were from 0.09 to 0.43
in these five spots. The large variations in the ratio are
probably due to the fact that the inclusions originated from
different parts of the weapons rather than to an effect of their
preferential leaching.
3.4. l-XRF
From the elemental maps of U and Pu as reported in
Fig. 4 (middle and right column), it can be seen that the
two elements are homogeneously distributed in the
UMα
2.5
Skalenbereich ED 1757 cts Skalenbereich WD 244.0 cts/s Cursor: 3.337
3
Fig. 6. Example of one SEM-WDX spectrum collected from a U/Pu particle. The S
comparison. (For interpretation of the references to colour in this figure legend, t
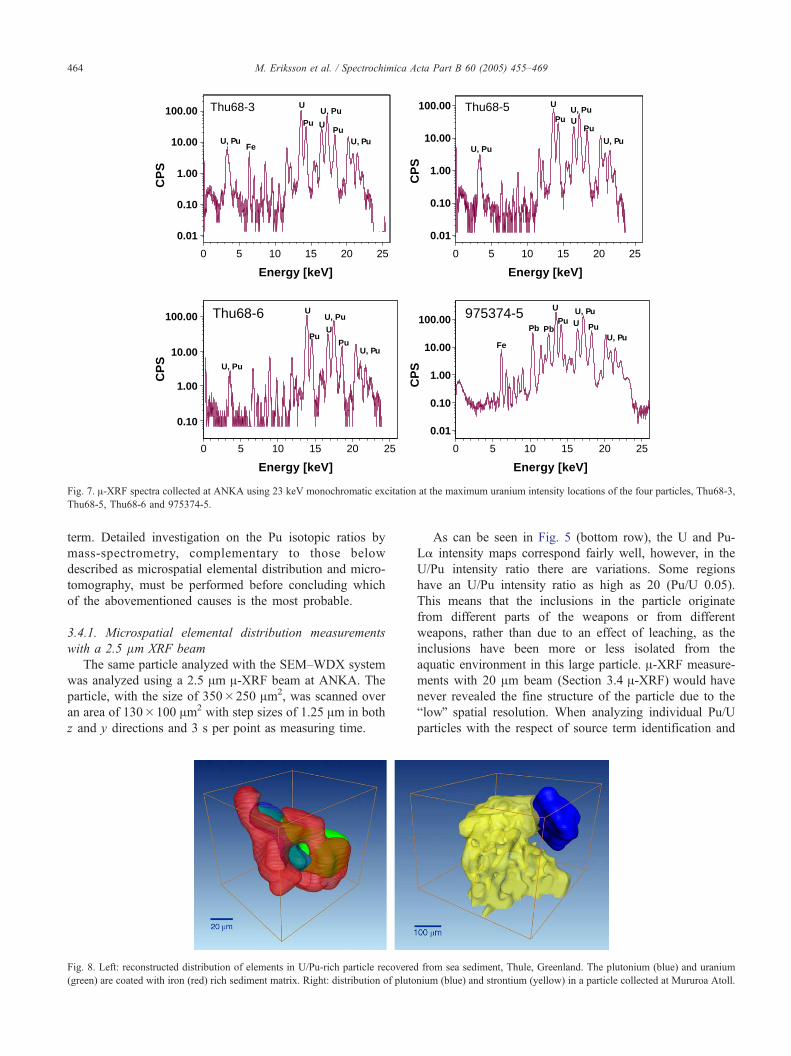
particles. In Fig. 7, the A-XRF spectra using a 23.2 keV
monochromatic beam for the four particles can be seen. In
the spectra from the particle 975274-5, there are peaks
originating from lead. However, lead does not originate
from the particle but from the carbon tape support. As can
be seen, for the other three particles where lead free carbon
supports were used, no lead was detected. Since the Pu/U-
La intensities are only corrected for the detector deadtime
and not for physical properties of the photon transport in
the particles, these ratios cannot be considered as concen-
tration ratios. As reported in Table 1, the Pu/U intensity
ratios vary between 0.22 and 0.36. This variation may
reflect several phenomena. A preferential leaching of one
element with respect to the other one; the origin of the
particles from different parts of one of the involved nuclear
weapons; or that the particles stem from a different source
PuMβ
3.5 4
keV
EM–EDX spectrum of the same particle is superimposed in yellow color for
he reader is referred to the web version of this article.)
0 5 10 15 20 25
0.01
0.10
1.00
10.00
100.00
CP
S
Thu68-3
U, Pu
U
Pu U
U, Pu
PuU, Pu
Fe
0 5 10 15 20 25
0.01
0.10
1.00
10.00
100.00 Thu68-5
U, Pu
U
Pu UU, Pu
Pu
U, Pu
0 5 10 15 20 25
0.10
1.00
10.00
100.00
CP
S
Thu68-6
Energy [keV]
U, Pu
U
PuU
U, Pu
PuU, Pu
0 5 10 15 20 25
0.01
0.10
1.00
10.00
100.00
CP
S
975374-5
Fe
Pb Pb
U
Pu UU, Pu
PuU, Pu
CP
S
Energy [keV] Energy [keV]
Energy [keV]
Fig. 7. A-XRF spectra collected at ANKA using 23 keV monochromatic excitation at the maximum uranium intensity locations of the four particles, Thu68-3,
Thu68-5, Thu68-6 and 975374-5.
M. Eriksson et al. / Spectrochimica Acta Part B 60 (2005) 455–469464
term. Detailed investigation on the Pu isotopic ratios by
mass-spectrometry, complementary to those below
described as microspatial elemental distribution and micro-
tomography, must be performed before concluding which
of the abovementioned causes is the most probable.
3.4.1. Microspatial elemental distribution measurements
with a 2.5 lm XRF beam
The same particle analyzed with the SEM–WDX system
was analyzed using a 2.5 Am A-XRF beam at ANKA. The
particle, with the size of 350�250 Am2, was scanned over
an area of 130�100 Am2 with step sizes of 1.25 Am in both
z and y directions and 3 s per point as measuring time.
Fig. 8. Left: reconstructed distribution of elements in U/Pu-rich particle recovered
(green) are coated with iron (red) rich sediment matrix. Right: distribution of pluto
As can be seen in Fig. 5 (bottom row), the U and Pu-
La intensity maps correspond fairly well, however, in the
U/Pu intensity ratio there are variations. Some regions
have an U/Pu intensity ratio as high as 20 (Pu/U 0.05).
This means that the inclusions in the particle originate
from different parts of the weapons or from different
weapons, rather than due to an effect of leaching, as the
inclusions have been more or less isolated from the
aquatic environment in this large particle. A-XRF measure-
ments with 20 Am beam (Section 3.4 A-XRF) would have
never revealed the fine structure of the particle due to the
blowQ spatial resolution. When analyzing individual Pu/U
particles with the respect of source term identification and
from sea sediment, Thule, Greenland. The plutonium (blue) and uranium
nium (blue) and strontium (yellow) in a particle collected at Mururoa Atoll.
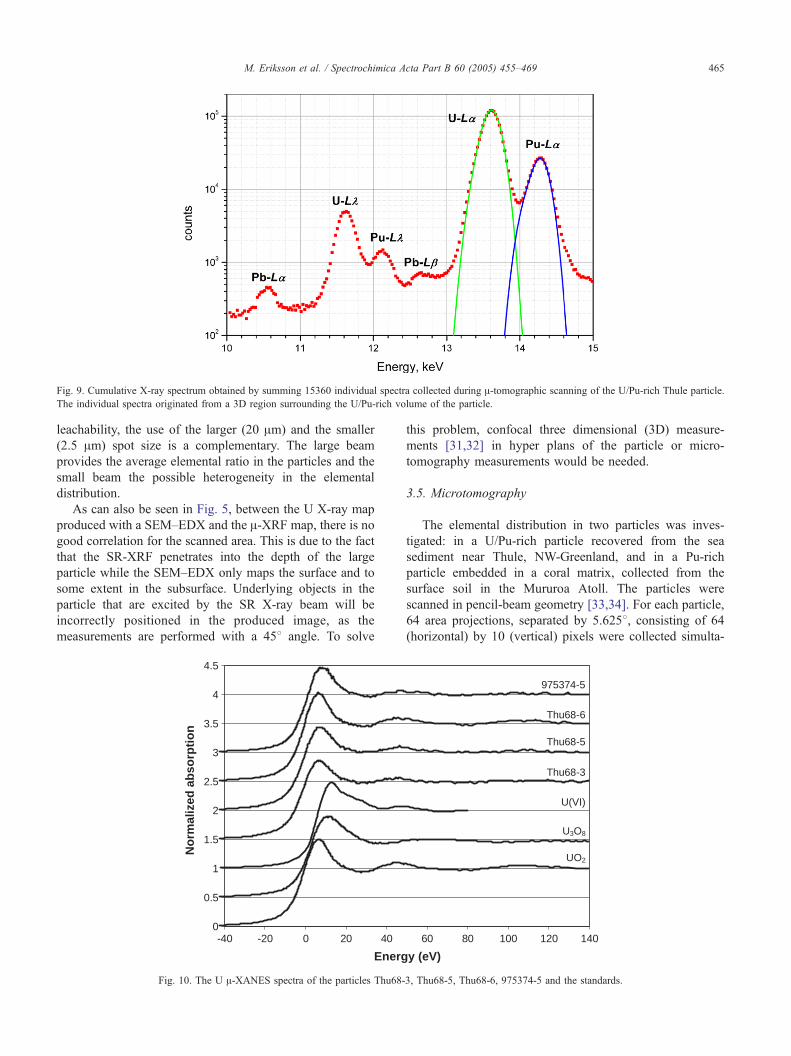
Fig. 9. Cumulative X-ray spectrum obtained by summing 15360 individual spectra collected during A-tomographic scanning of the U/Pu-rich Thule particle.
The individual spectra originated from a 3D region surrounding the U/Pu-rich volume of the particle.
M. Eriksson et al. / Spectrochimica Acta Part B 60 (2005) 455–469 465
leachability, the use of the larger (20 Am) and the smaller
(2.5 Am) spot size is a complementary. The large beam
provides the average elemental ratio in the particles and the
small beam the possible heterogeneity in the elemental
distribution.
As can also be seen in Fig. 5, between the U X-ray map
produced with a SEM–EDX and the A-XRF map, there is no
good correlation for the scanned area. This is due to the fact
that the SR-XRF penetrates into the depth of the large
particle while the SEM–EDX only maps the surface and to
some extent in the subsurface. Underlying objects in the
particle that are excited by the SR X-ray beam will be
incorrectly positioned in the produced image, as the
measurements are performed with a 458 angle. To solve
0
0.5
1
1.5
2
2.5
3
3.5
4
4.5
-40 -20 0 20 40
Energ
No
rmal
ized
ab
sorp
tio
n
Fig. 10. The U A-XANES spectra of the particles Thu68-
this problem, confocal three dimensional (3D) measure-
ments [31,32] in hyper plans of the particle or micro-
tomography measurements would be needed.
3.5. Microtomography
The elemental distribution in two particles was inves-
tigated: in a U/Pu-rich particle recovered from the sea
sediment near Thule, NW-Greenland, and in a Pu-rich
particle embedded in a coral matrix, collected from the
surface soil in the Mururoa Atoll. The particles were
scanned in pencil-beam geometry [33,34]. For each particle,
64 area projections, separated by 5.6258, consisting of 64
(horizontal) by 10 (vertical) pixels were collected simulta-
60 80 100 120 140
y (eV)
UO2
U(VI)
Thu68-3
Thu68-5
Thu68-6
975374-5
U3O8
3, Thu68-5, Thu68-6, 975374-5 and the standards.
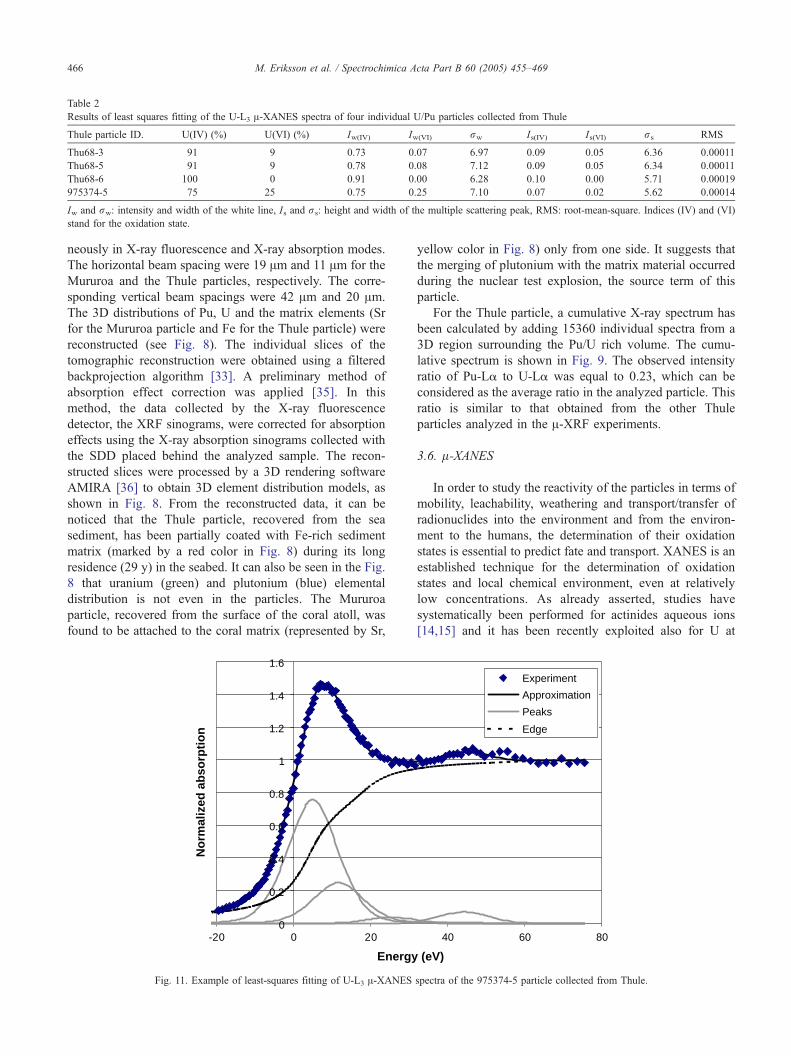
Table 2
Results of least squares fitting of the U-L3 A-XANES spectra of four individual U/Pu particles collected from Thule
Thule particle ID. U(IV) (%) U(VI) (%) Iw(IV) Iw(VI) rw Is(IV) Is(VI) rs RMS
Thu68-3 91 9 0.73 0.07 6.97 0.09 0.05 6.36 0.00011
Thu68-5 91 9 0.78 0.08 7.12 0.09 0.05 6.34 0.00011
Thu68-6 100 0 0.91 0.00 6.28 0.10 0.00 5.71 0.00019
975374-5 75 25 0.75 0.25 7.10 0.07 0.02 5.62 0.00014
Iw and rw: intensity and width of the white line, Is and rs: height and width of the multiple scattering peak, RMS: root-mean-square. Indices (IV) and (VI)
stand for the oxidation state.
M. Eriksson et al. / Spectrochimica Acta Part B 60 (2005) 455–469466
neously in X-ray fluorescence and X-ray absorption modes.
The horizontal beam spacing were 19 Am and 11 Am for the
Mururoa and the Thule particles, respectively. The corre-
sponding vertical beam spacings were 42 Am and 20 Am.
The 3D distributions of Pu, U and the matrix elements (Sr
for the Mururoa particle and Fe for the Thule particle) were
reconstructed (see Fig. 8). The individual slices of the
tomographic reconstruction were obtained using a filtered
backprojection algorithm [33]. A preliminary method of
absorption effect correction was applied [35]. In this
method, the data collected by the X-ray fluorescence
detector, the XRF sinograms, were corrected for absorption
effects using the X-ray absorption sinograms collected with
the SDD placed behind the analyzed sample. The recon-
structed slices were processed by a 3D rendering software
AMIRA [36] to obtain 3D element distribution models, as
shown in Fig. 8. From the reconstructed data, it can be
noticed that the Thule particle, recovered from the sea
sediment, has been partially coated with Fe-rich sediment
matrix (marked by a red color in Fig. 8) during its long
residence (29 y) in the seabed. It can also be seen in the Fig.
8 that uranium (green) and plutonium (blue) elemental
distribution is not even in the particles. The Mururoa
particle, recovered from the surface of the coral atoll, was
found to be attached to the coral matrix (represented by Sr,
0
0.2
0.4
0.6
0.8
1
1.2
1.4
1.6
-20 0 20
Energy
No
rmal
ized
ab
sorp
tio
n
Fig. 11. Example of least-squares fitting of U-L3 A-XANES
yellow color in Fig. 8) only from one side. It suggests that
the merging of plutonium with the matrix material occurred
during the nuclear test explosion, the source term of this
particle.
For the Thule particle, a cumulative X-ray spectrum has
been calculated by adding 15360 individual spectra from a
3D region surrounding the Pu/U rich volume. The cumu-
lative spectrum is shown in Fig. 9. The observed intensity
ratio of Pu-La to U-La was equal to 0.23, which can be
considered as the average ratio in the analyzed particle. This
ratio is similar to that obtained from the other Thule
particles analyzed in the A-XRF experiments.
3.6. l-XANES
In order to study the reactivity of the particles in terms of
mobility, leachability, weathering and transport/transfer of
radionuclides into the environment and from the environ-
ment to the humans, the determination of their oxidation
states is essential to predict fate and transport. XANES is an
established technique for the determination of oxidation
states and local chemical environment, even at relatively
low concentrations. As already asserted, studies have
systematically been performed for actinides aqueous ions
[14,15] and it has been recently exploited also for U at
40 60 80
(eV)
Experiment
Approximation
Peaks
Edge
spectra of the 975374-5 particle collected from Thule.
0
0.5
1
1.5
2
2.5
3
3.5
4
4.5
-40 -20 0 20 40 60 80 100 120 140
Energy (eV)
No
rmal
ized
ab
sorp
tio
n
Pu(IV)
Pu(VI)
Thu68-3
Thu68-5
Thu68-6
975374-5
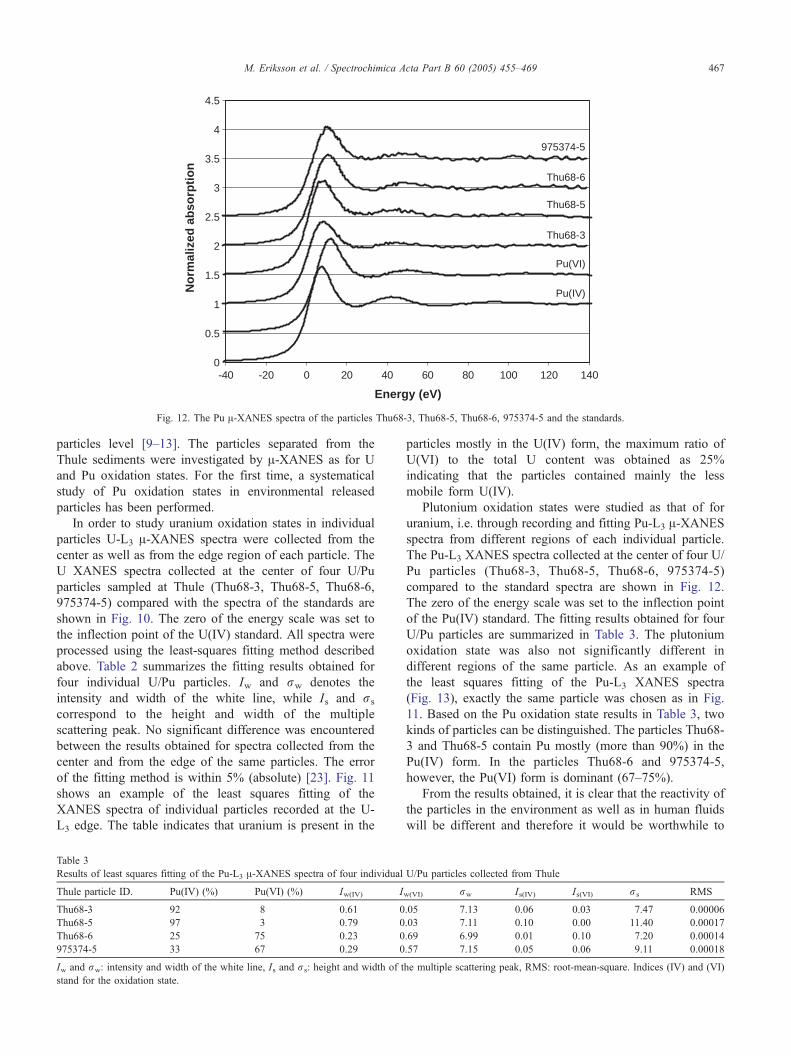
Fig. 12. The Pu A-XANES spectra of the particles Thu68-3, Thu68-5, Thu68-6, 975374-5 and the standards.
M. Eriksson et al. / Spectrochimica Acta Part B 60 (2005) 455–469 467
particles level [9–13]. The particles separated from the
Thule sediments were investigated by A-XANES as for U
and Pu oxidation states. For the first time, a systematical
study of Pu oxidation states in environmental released
particles has been performed.
In order to study uranium oxidation states in individual
particles U-L3 A-XANES spectra were collected from the
center as well as from the edge region of each particle. The
U XANES spectra collected at the center of four U/Pu
particles sampled at Thule (Thu68-3, Thu68-5, Thu68-6,
975374-5) compared with the spectra of the standards are
shown in Fig. 10. The zero of the energy scale was set to
the inflection point of the U(IV) standard. All spectra were
processed using the least-squares fitting method described
above. Table 2 summarizes the fitting results obtained for
four individual U/Pu particles. Iw and rw denotes the
intensity and width of the white line, while Is and rs
correspond to the height and width of the multiple
scattering peak. No significant difference was encountered
between the results obtained for spectra collected from the
center and from the edge of the same particles. The error
of the fitting method is within 5% (absolute) [23]. Fig. 11
shows an example of the least squares fitting of the
XANES spectra of individual particles recorded at the U-
L3 edge. The table indicates that uranium is present in the
Table 3
Results of least squares fitting of the Pu-L3 A-XANES spectra of four individual
Thule particle ID. Pu(IV) (%) Pu(VI) (%) Iw(IV) I
Thu68-3 92 8 0.61 0
Thu68-5 97 3 0.79 0
Thu68-6 25 75 0.23 0
975374-5 33 67 0.29 0
Iw and rw: intensity and width of the white line, Is and rs: height and width of t
stand for the oxidation state.
particles mostly in the U(IV) form, the maximum ratio of
U(VI) to the total U content was obtained as 25%
indicating that the particles contained mainly the less
mobile form U(IV).
Plutonium oxidation states were studied as that of for
uranium, i.e. through recording and fitting Pu-L3 A-XANESspectra from different regions of each individual particle.
The Pu-L3 XANES spectra collected at the center of four U/
Pu particles (Thu68-3, Thu68-5, Thu68-6, 975374-5)
compared to the standard spectra are shown in Fig. 12.
The zero of the energy scale was set to the inflection point
of the Pu(IV) standard. The fitting results obtained for four
U/Pu particles are summarized in Table 3. The plutonium
oxidation state was also not significantly different in
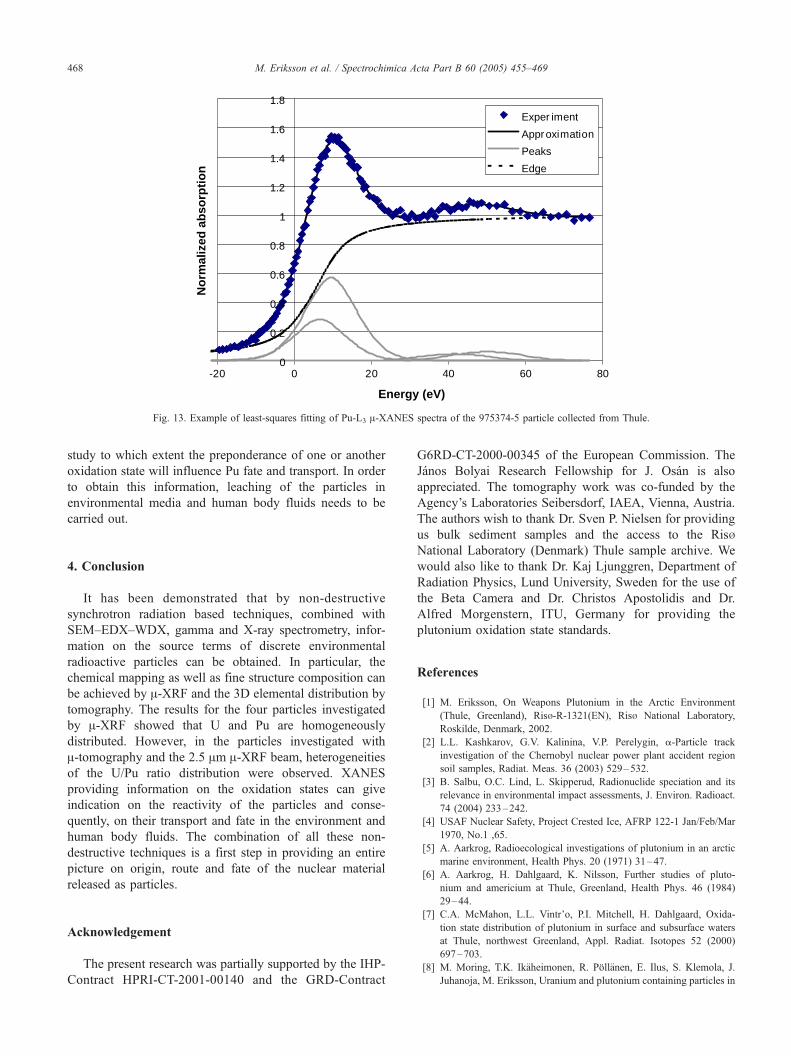
different regions of the same particle. As an example of
the least squares fitting of the Pu-L3 XANES spectra
(Fig. 13), exactly the same particle was chosen as in Fig.
11. Based on the Pu oxidation state results in Table 3, two
kinds of particles can be distinguished. The particles Thu68-
3 and Thu68-5 contain Pu mostly (more than 90%) in the
Pu(IV) form. In the particles Thu68-6 and 975374-5,
however, the Pu(VI) form is dominant (67–75%).
From the results obtained, it is clear that the reactivity of
the particles in the environment as well as in human fluids
will be different and therefore it would be worthwhile to
U/Pu particles collected from Thule
w(VI) rw Is(IV) Is(VI) rs RMS
.05 7.13 0.06 0.03 7.47 0.00006
.03 7.11 0.10 0.00 11.40 0.00017
.69 6.99 0.01 0.10 7.20 0.00014
.57 7.15 0.05 0.06 9.11 0.00018
he multiple scattering peak, RMS: root-mean-square. Indices (IV) and (VI)
0
0.2
0.4
0.6
0.8
1
1.2
1.4
1.6
1.8
-20 0 20 40 60 80
Energy (eV)
No
rmal
ized
ab
sorp
tio
n
Exper iment
Approximation
Peaks
Edge
Fig. 13. Example of least-squares fitting of Pu-L3 A-XANES spectra of the 975374-5 particle collected from Thule.
M. Eriksson et al. / Spectrochimica Acta Part B 60 (2005) 455–469468
study to which extent the preponderance of one or another
oxidation state will influence Pu fate and transport. In order
to obtain this information, leaching of the particles in
environmental media and human body fluids needs to be
carried out.
4. Conclusion
It has been demonstrated that by non-destructive
synchrotron radiation based techniques, combined with
SEM–EDX–WDX, gamma and X-ray spectrometry, infor-
mation on the source terms of discrete environmental
radioactive particles can be obtained. In particular, the
chemical mapping as well as fine structure composition can
be achieved by A-XRF and the 3D elemental distribution by
tomography. The results for the four particles investigated
by A-XRF showed that U and Pu are homogeneously
distributed. However, in the particles investigated with
A-tomography and the 2.5 Am A-XRF beam, heterogeneities
of the U/Pu ratio distribution were observed. XANES
providing information on the oxidation states can give
indication on the reactivity of the particles and conse-
quently, on their transport and fate in the environment and
human body fluids. The combination of all these non-
destructive techniques is a first step in providing an entire
picture on origin, route and fate of the nuclear material
released as particles.
Acknowledgement
The present research was partially supported by the IHP-
Contract HPRI-CT-2001-00140 and the GRD-Contract
G6RD-CT-2000-00345 of the European Commission. The
Janos Bolyai Research Fellowship for J. Osan is also
appreciated. The tomography work was co-funded by the
Agency’s Laboratories Seibersdorf, IAEA, Vienna, Austria.
The authors wish to thank Dr. Sven P. Nielsen for providing
us bulk sediment samples and the access to the RisbNational Laboratory (Denmark) Thule sample archive. We
would also like to thank Dr. Kaj Ljunggren, Department of
Radiation Physics, Lund University, Sweden for the use of
the Beta Camera and Dr. Christos Apostolidis and Dr.
Alfred Morgenstern, ITU, Germany for providing the
plutonium oxidation state standards.
References
[1] M. Eriksson, On Weapons Plutonium in the Arctic Environment
(Thule, Greenland), Risb-R-1321(EN), Risb National Laboratory,
Roskilde, Denmark, 2002.
[2] L.L. Kashkarov, G.V. Kalinina, V.P. Perelygin, a-Particle track
investigation of the Chernobyl nuclear power plant accident region
soil samples, Radiat. Meas. 36 (2003) 529–532.
[3] B. Salbu, O.C. Lind, L. Skipperud, Radionuclide speciation and its
relevance in environmental impact assessments, J. Environ. Radioact.
74 (2004) 233–242.
[4] USAF Nuclear Safety, Project Crested Ice, AFRP 122-1 Jan/Feb/Mar
1970, No.1 ,65.
[5] A. Aarkrog, Radioecological investigations of plutonium in an arctic
marine environment, Health Phys. 20 (1971) 31–47.
[6] A. Aarkrog, H. Dahlgaard, K. Nilsson, Further studies of pluto-
nium and americium at Thule, Greenland, Health Phys. 46 (1984)
29–44.
[7] C.A. McMahon, L.L. Vintr’o, P.I. Mitchell, H. Dahlgaard, Oxida-
tion state distribution of plutonium in surface and subsurface waters
at Thule, northwest Greenland, Appl. Radiat. Isotopes 52 (2000)
697–703.
[8] M. Moring, T.K. Ik7heimonen, R. Pfll7nen, E. Ilus, S. Klemola, J.
Juhanoja, M. Eriksson, Uranium and plutonium containing particles in
M. Eriksson et al. / Spectrochimica Acta Part B 60 (2005) 455–469 469
a sea sediment sample from Thule, Greenland, J. Radioanal. Nucl.
Chem. 248 (2001) 623–627.
[9] B. Salbu, T. Krekling, O.C. Lind, D.H. Oughton, M. Drakopoulos, A.
Simionovici, I. Snigireva, A. Snigirev, T. Weitkamp, F. Adams, K.
Janssens, V.A. Kashparov, High energy X-ray microscopy for
characterisation of fuel particles, Nucl. Instrum. Methods Phys.
Res., Sect. A 467–468 (2001) 1249–1252.
[10] B. Salbu, K. Janssens, O.C. Lind, K. Proost, P.R. Danesi, Oxidation
states of uranium in DU particles from Kosovo, J. Environ. Radioact.
64 (2003) 167–173.
[11] S. Tfrfk, J. Osan, L. Vincze, S. Kurunczi, G. Tamborini, M. Betti,
Characterization and speciation of depleted uranium in individual soil
particles using microanalytical methods, Spectrochim. Acta, Part B 59
(2004) 689–699.
[12] J. Jernstrfm, M. Eriksson, J. Osan, G. Tamborini, S. Tfrfk, R. Simon,
G. Falkenberg, A. Alsecz, M. Betti, Non-destructive characterization
of low radioactive particles from Irish sea sediment by micro X-ray
synchrotron radiation techniques: micro X-ray fluorescence (A-XRF)and micro X-ray absorption near edge spectroscopy (A-XANES), J.Anal. At. Spectrom. 19 (2004) 1428–1433.
[13] P.R. Danesi, A. Markowicz, E. Chinea-Cano, W. Burkart, B. Salbu, D.
Donohue, F. Rudenauer, M. Hedberg, S. Vogt, P. Zahradnik, A.
Ciurapinski, Depleted uranium particles in selected Kosovo samples,
J. Environ. Radioact. 64 (2003) 143–154.
[14] S.D. Conradson, Ilham Al Mahamid, D.L. Clark, N.J. Hess, E.A.
Hudson, M.P. Neu, Ph.D. Palmer, W.H. Runde, C.D. Tait, Oxidation
state determination of plutonium aquo ions using X-ray absorption
spectroscopy, Polyhedron 17 (1998) 599–602.
[15] S.D. Conradson, K.D. Abney, B.D. Begg, E.D. Drady, D.L. Clark, Ch.
den Auwer, M. Ding, P.K. Dorhout, F.J. Espinosa-Faller, P.L. Gordon,
R.G. Haire, N.J. Hess, R.F. Hess, D.W. Keogh, G.H. Lander, A.J.
Lupinetti, L.A. Morales, M.P. Neu, Ph. D. Palmer, P. Paviet-
Hartmann, S.D. Reilly, W.H. Runde, C.D. Tait, D.K. Veirs, F. Wastin,
Higher order speciation effects on plutonium L3 X-ray absorption near
edge spectra, Inorg. Chem. 43 (2004) 116–131.
[16] K. Ljunggren, Beta Camera, development and biomedical application.
PhD thesis, Lund University, Sweden, 2003.
[17] M. Eriksson, K. Ljunggren, C. Hindorf, Plutonium hot particle
separation techniques using real-time digital image systems, Nucl.
Instrum. Methods Phys. Res., Sect. A 488 (2002) 375–380.
[18] R. Simon, G. Buth, M. Hagelstein, The X-ray-fluorescence facility at
ANKA, Karlsruhe: minimum detection limits and micro probe
capabilities, Nucl. Instrum. Methods Phys. Res., Sect. B 199 (2003)
554–558.
[19] B. Vekemans, K. Janssens, L. Vincze, F. Adams, P. Van Espen,
Analysis of X-ray spectra by iterative least squares (AXIL): new
developments, X-ray Spectrom. 23 (1994) 278–285.
[20] R.D. Deslattes, E.G. Kessler, P. Indelicato Jr., L. de Billy, E. Lindroth,
J. Anton, X-ray transition energies: new approach to a comprehensive
evaluation, Rev. Mod. Phys. 75 (2003) 35–99.
[21] V. Nazmov, E. Reznikova, M. Boerner, J. Mohr, V. Saile, A. Snigirev,
I. Snigireva, M. Dimichiel, M. Drakopoulos, R. Simon, M. Grigoriev,
Refractive lenses fabricated by deep SR lithography and LIGA
technology for X-ray energies from 1 keV to 1 MeV, in: T. Warwick
(Ed.), Synchrotron Radiation Instrumentation: 8th Internat. Conf., AIP
Conference Proceedings: Melville, 2004, pp. 752–755.
[22] G. Falkenberg, O. Clauss, A. Swiderski, Th. Tschentscher, Upgrade of
the X-ray fluorescence beamline L at HASYLAB/DESY, X-ray
Spectrom. 30 (2001) 170–173.
[23] J. Osan, B. Tfrfk, S. Tfrfk, K.W. Jones, Study of the chemical state
of toxic metals during the life cycle of fly ash using X-ray absorption
near edge structure, X-ray Spectrom. 26 (1997) 37–44.
[24] M.C. Duff, D.E. Morris, D.B. Hunter, P.M. Bertsch, Spectroscopic
characterization of uranium in evaporation basin sediments, Geochim.
Cosmochim. Acta 64 (2000) 1535–1550.
[25] P.I. Mitchell, L. Leon Vintro, H. Dahlgaard, C. Gasco, J.A. Sanchez-
Cabeza, Pertubation in the 240Pu/239Pu global fallout ratio in local
sediments following the nuclear accidents at Thule (Greenland) and
Palomares (Spain), Sci. Total Environ. 202 (1997) 147–153.
[26] H. Dahlgaard, M. Eriksson, E. Ilus, T. Ryan, C.A. McMahon, S.P.
Nielsen, Plutonium in the marine environment at Thule, NW-Green-
land after a nuclear weapons accident, in: A. Kudo (Ed.), Plutonium in
the Environment, Elsevier, 2001, pp. 15–30.
[27] T.K. Ik7heimonen, E. Ilus, S. Klemola, H. Dahlgaard, T. Ryan, M.
Eriksson, Plutonium and americium in the sediments off the Thule air
base, Greenland, J. Radioanal. Nucl. Chem. 252 (2002) 339–344.
[28] K. Komura, M. Sakanoue, M. Yamamoto, Determination of240Pu/239Pu ratio in environmental samples based on the measurement
of Lx/a-ray activity ratio, Health Phys. 46 (1984) 1213–1219.
[29] D. Arnold, W. Kolb, Determination of plutonium content and isotopic
ratios in environmental samples by L X-ray and a-particle measure-
ments, Appl. Radiat. Isotopes 46 (1995) 1151–1157.
[30] C.-U. Ro, J. Osan, I. Szaloki, J. de Hoog, A. Worobiec, R. Van
Grieken, A Monte Carlo program for quantitative electron-induced
X-ray analysis of individual particles, Anal. Chem. 75 (2003)
851–859.
[31] B. Kanngiesser, W. Malzer, I. Reiche, A new 3D micro X-ray
fluorescence analysis set-up—first archaeometric applications, Nucl.
Instrum. Methods Phys. Res., Sect. B 411 (2003) 259–264.
[32] Z. Smit, K. Janssens, K. Proost, I. Langus, Confocal -XRF depth
analysis of paint layers, Nucl. Instrum. Methods Phys. Res., Sect. B
219–220 (2004) 35–40.
[33] A.C. Kak, M. Slaney, Principles of Computerized Tomographic
Imaging, IEEE Press, 1998.
[34] D. Wegrzynek, Computer microtomography using a laboratory X-ray
fluorescence microbeam spectrometer—a feasibility study, X-ray
Spectrom. 30 (2001) 413–418.
[35] D. Wegrzynek, A. Markowicz, S. Bamford, E. Chinea-Cano, E.
Bogovac, X-ray fluorescence analysis and computerized tomographic
imaging with a laboratory micro-beam scanning spectrometer,
presented during 17th International Congress on X-ray Optics and
Microanalysis, September 22–26, 2003, Chamonix Mont-Blanc,
France, 2003.
[36] Amira, Advanced 3D visualization and volume modeling software,
TGS Inc., 5330 Carroll Canyon Road, San Diego, CA 92121-3758,
USA.