In situ investigation of water transport in an operating PEM fuel cell using neutron radiography:...
11
In situ investigation of water transport in an operating PEM fuel cell using neutron radiography: Part 2 – Transient water accumulation in an interdigitated cathode flow field J.P. Owejan a, * , T.A. Trabold a , D.L. Jacobson b , D.R. Baker a , D.S. Hussey b , M. Arif b a General Motors Fuel Cell Activities, 10 Carriage Street, Honeoye Falls, NY 14472, USA b National Institute of Standards and Technology (NIST), Center for Neutron Research, 100 Bureau Drive, Gaithersburg, MD 20899, USA Received 18 May 2005; received in revised form 30 June 2006 Available online 20 September 2006 Abstract An interdigitated cathode flow field has been tested in situ with neutron radiography to measure the water transport through the por- ous gas diffusion layer in a PEM fuel cell. Constant current density to open circuit cycles were tested and the resulting liquid water accu- mulation and dissipation rates with in-plane water distributions are correlated to measured pressure differential between inlet and outlet gas streams. The effect of varying the reactant gas relative humidity on liquid water accumulation is also demonstrated. These results provide evidence that the reactant gas establishes a consistent in-plane transport path through the diffusion layer, leaving stagnant regions where liquid water accumulates. A simplified permeability model is presented and used to correlate the relative permeability to varying gas diffusion layer liquid water saturation levels. Ó 2006 Elsevier Ltd. All rights reserved. Keywords: Fuel cell; Interdigitated; Neutron radiography; Visualization; Water management 1. Introduction In a polymer electrolyte membrane (PEM) fuel cell, the gas diffusion layer has stringent design constraints. It must be porous, thermally and electrically conductive, mechani- cally stable under compression, and able to support three- dimensional diffusion and water removal. Optimization of these material properties is especially important for the cathode side of the fuel cell, due to the relatively slow kinet- ics of the oxygen reduction reaction. Interdigitated reactant flow fields have been developed and employed in PEM fuel cells to aid in water management by forced convective transport through the diffusion layer [1–4]. In this flow field design, the reactant channels are not continuous from inlet to outlet, but are rather terminated to force gas through the diffusion layer. Product water may be removed from the cathode elec- trode by several mechanisms: back diffusion to the anode, membrane uptake, diffusion (with less than 100% saturated inlet gas stream used), and condensation with capillary transport. These combined mechanisms are responsible for introducing liquid water into the gas diffusion layers. Once liquid water is accumulated in the cathode diffusion layer it is removed by evaporation, capillary transport and shear drag force from convective flow through the flow field channels across the surface of the diffusion layer. Liquid water in the anode diffusion layer is of lesser 0017-9310/$ - see front matter Ó 2006 Elsevier Ltd. All rights reserved. doi:10.1016/j.ijheatmasstransfer.2006.07.004 * Corresponding author. Tel.: +1 585 624 6802; fax: +1 585 624 6680. E-mail address: [email protected] (J.P. Owejan). www.elsevier.com/locate/ijhmt International Journal of Heat and Mass Transfer 49 (2006) 4721–4731
-
Upload
independent -
Category
Documents
-
view
3 -
download
0
Transcript of In situ investigation of water transport in an operating PEM fuel cell using neutron radiography:...

www.elsevier.com/locate/ijhmt
International Journal of Heat and Mass Transfer 49 (2006) 4721–4731
In situ investigation of water transport in an operatingPEM fuel cell using neutron radiography:
Part 2 – Transient water accumulation in an interdigitatedcathode flow field
J.P. Owejan a,*, T.A. Trabold a, D.L. Jacobson b, D.R. Baker a, D.S. Hussey b, M. Arif b
a General Motors Fuel Cell Activities, 10 Carriage Street, Honeoye Falls, NY 14472, USAb National Institute of Standards and Technology (NIST), Center for Neutron Research, 100 Bureau Drive, Gaithersburg, MD 20899, USA
Received 18 May 2005; received in revised form 30 June 2006Available online 20 September 2006
Abstract
An interdigitated cathode flow field has been tested in situ with neutron radiography to measure the water transport through the por-ous gas diffusion layer in a PEM fuel cell. Constant current density to open circuit cycles were tested and the resulting liquid water accu-mulation and dissipation rates with in-plane water distributions are correlated to measured pressure differential between inlet and outletgas streams. The effect of varying the reactant gas relative humidity on liquid water accumulation is also demonstrated. These resultsprovide evidence that the reactant gas establishes a consistent in-plane transport path through the diffusion layer, leaving stagnantregions where liquid water accumulates. A simplified permeability model is presented and used to correlate the relative permeabilityto varying gas diffusion layer liquid water saturation levels.� 2006 Elsevier Ltd. All rights reserved.
Keywords: Fuel cell; Interdigitated; Neutron radiography; Visualization; Water management
1. Introduction
In a polymer electrolyte membrane (PEM) fuel cell, thegas diffusion layer has stringent design constraints. It mustbe porous, thermally and electrically conductive, mechani-cally stable under compression, and able to support three-dimensional diffusion and water removal. Optimization ofthese material properties is especially important for thecathode side of the fuel cell, due to the relatively slow kinet-ics of the oxygen reduction reaction. Interdigitated reactantflow fields have been developed and employed in PEM fuel
0017-9310/$ - see front matter � 2006 Elsevier Ltd. All rights reserved.
doi:10.1016/j.ijheatmasstransfer.2006.07.004
* Corresponding author. Tel.: +1 585 624 6802; fax: +1 585 624 6680.E-mail address: [email protected] (J.P. Owejan).
cells to aid in water management by forced convectivetransport through the diffusion layer [1–4]. In this flow fielddesign, the reactant channels are not continuous from inletto outlet, but are rather terminated to force gas through thediffusion layer.
Product water may be removed from the cathode elec-trode by several mechanisms: back diffusion to the anode,membrane uptake, diffusion (with less than 100% saturatedinlet gas stream used), and condensation with capillarytransport. These combined mechanisms are responsiblefor introducing liquid water into the gas diffusion layers.Once liquid water is accumulated in the cathode diffusionlayer it is removed by evaporation, capillary transportand shear drag force from convective flow through the flowfield channels across the surface of the diffusion layer.Liquid water in the anode diffusion layer is of lesser

Nomenclature
Ax�DL diffusion layer substrate cross-sectional area,cm2
d source aperture, mdch channel width, cmdland land width, cmF Faraday constant, 96485.34 sA/eqGDL gas diffusion layerh cathode gas diffusion layer thickness, cmhch channel depth, cmHFR high frequency resistance, X cm2
J current density, A/cm2
k gas phase permeability, darcyl channel length, cmL beam length, mMEA membrane electrode assemblyMPL microporous layerN atomic density, molecules/cm3
nch number of channelsnland number of landsP pressure, PaP 01ð0Þ dimensionless inlet gas velocityRch hydraulic radius of channel, cmRH relative humidity, %s saturation ratiot time, sT thickness, cmVi velocity in channel i, cm/sVland velocity in land, cm/sVvol volumetric gas flow, cm3/s
Greek symbols
a ratio of convective resistance to gas flowl gas viscosity, Pa sU gas diffusion layer substrate porosity
4722 J.P. Owejan et al. / International Journal of Heat and Mass Transfer 49 (2006) 4721–4731
concern considering the high diffusivity of hydrogen. Useof an interdigitated design in the cathode flow distributorwill increase liquid water removal from the cathode diffu-sion layer through convective transport.
Such a design has several shortcomings from a systemand durability perspective. The increased pressure differen-tial induced by forcing all gas flow through the relativelylow permeability gas diffusion layer will result in increasedcompressor work and hence reduced system efficiency.However, the interdigitated design is a proven tool forin situ water management diagnostics and characterization.At the onset of load, during the initial transition from opencircuit, it has been shown that cathode pressure drop willincrease proportionally with product water mass as it isgenerated from the oxygen reduction reaction [3].
Upon reviewing the available data it is speculated thatwater accumulation in both the flow channels and the dif-fusion layer can be correlated to the pressure drop behavioron the cathode side of the fuel cell. Moreover, it suggeststhat the rate at which the pressure differential increases isproportional to the water production rate, and that thegas diffusion layer accumulates water until a critical voidis filled. At this point, the pressure drop stops increasingand the mass flow rate of water removed from the cellmatches the rate at which water is produced. It is expectedthat this ‘‘critical water mass” can be optimized by varyingdiffusion layer parameters to reduce the percentage of voidsblocked with stagnant liquid water, thereby decreasing themass transport resistance.
Coupling neutron radiography with an interdigitatedcathode flow field and pressure differential measurementscan offer insight into local water accumulation, and enablequantification of the critical mass that will be retained inthe cell. The present paper describes the application of this
technique to study a single 50 cm2 PEM fuel cell, andexpands upon the detailed description of the experimentalmethod provided in the Part 1 paper [5]. In contrast to pre-vious applications of neutron radiography in fuel cellstudies [6–11] these experiments are focused on using themethod to obtain unknown saturation relationships inthe gas diffusion layer (GDL). Water production rates (atconstant current density) are compared to water retentionrates in diffusion layer and separately in the flow fieldchannels. Also, the ohmic resistance is correlated toinlet relative humidity and saturation level of the diffusionlayer.
2. Experimental
The experimental apparatus has been changed some-what from that in Part 1 of this study. This modification(described in detail in [12]) involves moving the testing areadownstream of the previous test area by a distance of2.13 m and adding an additional 5 cm of liquid nitrogencooled bismuth filter material before the collimating aper-ture. Moving the apparatus results in an increase in thebeam size at the sample position from 18 cm to 26 cm. Thisreduces the thermal neutron fluence rate to 43% of theprevious value. The additional 5 cm of bismuth reducesbackground high-energy neutrons and gammas at a costof reducing the thermal neutron fluence rate to a further58% of the previous value. Overall the total fluence ratehas been reduced to 25% of the previous value. On theother hand, to recover the intensity, the full open or 2 cmaperture position was used, which provided a factor of 4increase in intensity. Previously the 2 cm aperture couldnot be used since the background fast neutron and promptgamma radiation level were too high for the existing shield-

Fig. 1. Water macroscopic neutron cross-section calibration cuvette.
1 Certain trade names and company products are mentioned in the textor identified in an illustration in order to adequately specify theexperimental procedure and equipment used. In no case does suchidentification imply recommendation or endorsement by the NationalInstitute of Standards and Technology, nor does it imply that the productsare necessarily the best available for the purpose.
J.P. Owejan et al. / International Journal of Heat and Mass Transfer 49 (2006) 4721–4731 4723
ing to provide adequate radiological protection. Theadditional 5 cm of bismuth helped to lower this back-ground to acceptable levels. The last alteration was to theL/d ratio, which changed from 400 to 300. An L/d ratioof 300 is considered to be very good for a neutron fluencerate of 1.84 � 107 cm�2 s�1.
An additional calibration of the water mass as measuredby neutron transmission is also presented here. To convertthe attenuation images (representing the product NrT, asdescribed in Part 1 [5]) to water mass values or thicknessvalues, the attenuation length (Nr) must be known. Thevalue for r depends on energy and thus the attenuationlength depends on the neutron beam spectrum. Here theneutron beam is a thermal Maxwellian distribution of neu-trons and therefore the cross-section is averaged over themany different neutron energies found in this beam. Basedon a Monte Carlo N particle (MCNP) calculation of thebeam spectrum [12] and measured liquid water cross-sections as a function of energy [13], the average calculatedcross-section is 3.197 cm�1. To avoid uncertainty in theMCNP calculation, the cross-section for water for thisbeam is measured. In addition the cross-section measure-ment demonstrates the linearity of the measured values,which is essential for application of Beer’s law. Fig. 1shows the device constructed to allow many thicknessesof water to be placed in the beam. It consists of many stepsmachined into an aluminum plate with each step approxi-mately 50 lm thicker than the previous step. The true step
size was measured with a Mitutoya digital indicator1 with1 lm resolution. Fig. 1 shows the average gray level imageversus the measured step thickness of the water. From theslope of a linear least squares fit of the data in Fig. 1 thevalue of the attenuation coefficient Nr is determined tobe 2.958 ± 0.010 cm�1.
The fuel cell experimental apparatus is generallyunchanged from that described in Part 1 of this study.The only notable change in the test section is the anodeand cathode flow distributor designs. The anode is astraight pass design that was not interdigitated and thecathode is a straight pass with interdigitated channels.Fig. 2 gives an overview of the cathode flow field designwhere every other channel has an inlet and the remainingchannels are connected to the outlet manifold. This designforces convective transport through the diffusion layer. Theanode flow distributor dimensions are identical, exceptthat every channel is connected to both the inlet and outletheaders. The anode and cathode flow channels are 1.42 mmwide and 0.3 mm deep, with a land width between of2.68 mm. Both flow fields were machined from aluminum

Fig. 2. Cathode interdigitated flow field.
4724 J.P. Owejan et al. / International Journal of Heat and Mass Transfer 49 (2006) 4721–4731
and then plated with a thin layer of gold. These materialshave relatively low neutron attenuation, and were selectedto enhance the sensitivity of the measurement system toliquid water produced within the fuel cell.
Differential pressure is measured directly from the inletand outlet headers with 40 kPa differential pressure sen-sors. The pressure sensors are calibrated and accuratewithin an uncertainty band of ±0.25 kPa. The cell temper-ature is controlled by a thermocouple located in the cath-ode flow field (not the backing plate). Measurements ofall operating parameters (flows, temperatures, pressures,voltage, current, and impedance amplitude) are acquiredat a frequency of 1.0 Hz.
After the cell had undergone a start-up procedure tohydrate the membrane, all experiments were run in con-stant current mode to assure a constant water productionrate in the cell. A low load of 0.2 A/cm2 that is of interestfor these experiments was ideal to assure that the temporalresolution (0.18 Hz) of the neutron imaging system wouldcapture the water generation dynamics during the transientexperiments. These experiments consist of load cycling(off–on–off) with constant reactant gas flow. Additionalinlet relative humidity (RH) transients were conducted atcontinuous load. In these experiments the inlet RH wasdecreased from 100% to 50% and back again. The outletpressure was fixed in all experiments at 120 kPa.
In all tests the anode and cathode gas flow was run con-tinuously with a stoichiometric ratio (i.e., ratio of theactual flow to that required by reaction stoichiometry) of2.0, calculated based on load. The load cycling tests wererun with the cell temperature maintained at 60 �C andthe anode and cathode dew points were maintained at60 �C resulting in 100% saturated inlets. This conditionwas used to minimize evaporation and back diffusion,
hence isolating convective and capillary transport in thecathode backing layer. The RH transient experiment wasexecuted by keeping the cathode dew point constant at60 �C and increasing the cell temperature and the anodedew point to 76 �C, in turn varying the cathode inlet RHfrom 100% saturated to 50%.
Radiographs were exposed for 2 s each with an imagefile write time of 3.41 s resulting in the temporal resolutionof 0.18 Hz. The CCD camera was focused on a10 cm � 10 cm area. The camera was a large format2048 � 2048 pixel camera, but the images were binned to1024 � 1024 because the spatial resolution constrainingcomponent was the scintillator, not the CCD array. Byreducing the image size each pixel had a similar spatial res-olution to that of the scintillator, which is described inmore detail in Part 1 [5,12].
3. Results and discussion
Radiographs were averaged typically in groups of 10images to increase the signal-to-noise ratio for both visualand quantitative analysis. Since the background CCD sig-nal (no neutron flux) is typically constant and accountedfor in the image analysis, the primary contributor to noisein individual images is scattered neutrons. After averaginga sequence, a median filter with a 3 � 3 kernel was appliedto remove hot, dead pixels, and data from fast neutrons.Averaging images, however, greatly reduced temporal res-olution and as a result the data are presented in the formof average accumulated water.
With saturated inlet gas streams, condensation in thegas delivery system existed even though efforts were madeto minimize this effect. Condensation is a result of fluctua-tions in PID (proportional integral derivative) temperaturecontrol and cold spots in the heated delivery lines. Throughtransient analysis of sequential radiographs (movies) it waspossible to isolate accumulated water from inlet condensa-tion. This has been considered in all quantitative analysesof the presented data, where condensed water was not con-sidered in measurements. This issue is expected to be aproblem with most humidification systems for fuel cell test-ing, and it has been observed in these experiments that evenvery small amounts of condensation have a significanteffect on channel water accumulation in small-scale sys-tems. In the configuration presented in this paper, mostaccumulation from condensation was in the anode chan-nels due to the straight pass, low velocity and pressuredrop. These random slugs in the anode channels are notexpected to affect the fuel cell experiments given the smallrelative length scale of the blockage.
3.1. Load cycling global water accumulation and dissipation
Recent publications have shown that the cathode pres-sure differential in an interdigitated flow field is related towater accumulation and dissipation associated with theonset and offset of current load being drawn from the
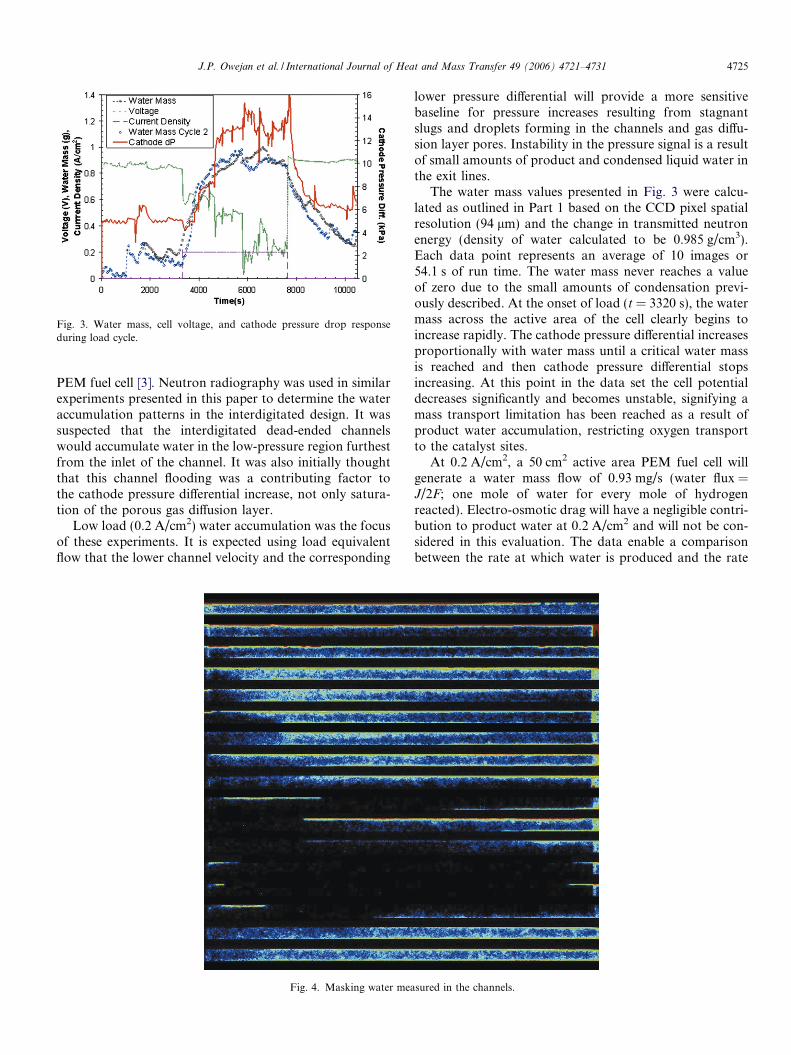
Fig. 3. Water mass, cell voltage, and cathode pressure drop responseduring load cycle.
J.P. Owejan et al. / International Journal of Heat and Mass Transfer 49 (2006) 4721–4731 4725
PEM fuel cell [3]. Neutron radiography was used in similarexperiments presented in this paper to determine the wateraccumulation patterns in the interdigitated design. It wassuspected that the interdigitated dead-ended channelswould accumulate water in the low-pressure region furthestfrom the inlet of the channel. It was also initially thoughtthat this channel flooding was a contributing factor tothe cathode pressure differential increase, not only satura-tion of the porous gas diffusion layer.
Low load (0.2 A/cm2) water accumulation was the focusof these experiments. It is expected using load equivalentflow that the lower channel velocity and the corresponding
Fig. 4. Masking water mea
lower pressure differential will provide a more sensitivebaseline for pressure increases resulting from stagnantslugs and droplets forming in the channels and gas diffu-sion layer pores. Instability in the pressure signal is a resultof small amounts of product and condensed liquid water inthe exit lines.
The water mass values presented in Fig. 3 were calcu-lated as outlined in Part 1 based on the CCD pixel spatialresolution (94 lm) and the change in transmitted neutronenergy (density of water calculated to be 0.985 g/cm3).Each data point represents an average of 10 images or54.1 s of run time. The water mass never reaches a valueof zero due to the small amounts of condensation previ-ously described. At the onset of load (t = 3320 s), the watermass across the active area of the cell clearly begins toincrease rapidly. The cathode pressure differential increasesproportionally with water mass until a critical water massis reached and then cathode pressure differential stopsincreasing. At this point in the data set the cell potentialdecreases significantly and becomes unstable, signifying amass transport limitation has been reached as a result ofproduct water accumulation, restricting oxygen transportto the catalyst sites.
At 0.2 A/cm2, a 50 cm2 active area PEM fuel cell willgenerate a water mass flow of 0.93 mg/s (water flux =J/2F; one mole of water for every mole of hydrogenreacted). Electro-osmotic drag will have a negligible contri-bution to product water at 0.2 A/cm2 and will not be con-sidered in this evaluation. The data enable a comparisonbetween the rate at which water is produced and the rate
sured in the channels.
4726 J.P. Owejan et al. / International Journal of Heat and Mass Transfer 49 (2006) 4721–4731
at which it is accumulated in the voids of the cathode dif-fusion layer. A linear regression was calculated for the first800 s after the load was activated (denoted by the first 14data points and the steep linear increase after t = 3320 s).The slope illustrates the cell initially retains 0.78 mg/s ofwater, indicating that 84% of the water produced stays inthe cell until a critical open volume of the diffusion mediumis full and the induced pressure differential is sufficient toremove the water flux produced. At this point (t = 5800–7600 s), water accumulation in the cell reached a steadystate value of 0.88 ± 0.04 g. This value includes water inthe cathode diffusion medium and water in the cathodechannels, which together have a total dry open volume of1.395 cm3.
It is possible to isolate the water accumulated in just thecathode gas diffusion layer (assuming no water in anodediffusion layer and electrodes) by performing the maskingoperation described in Part 1. After masking the channelsthe critical water mass measured in the lands is 0.23 ±0.01 g. The land regions cover 32.4 cm2 of the 50 cm2 activearea. The open void volume of the 75% porous gas diffu-sion layer (GDL) in this portion of the active area is0.404 cm3, accounting for only the cathode GDL thicknessloaded with 20% compressive strain (compressed thick-ness = 166 lm, not including the MPL). On average, themaximum critical water mass in the GDL is reached once
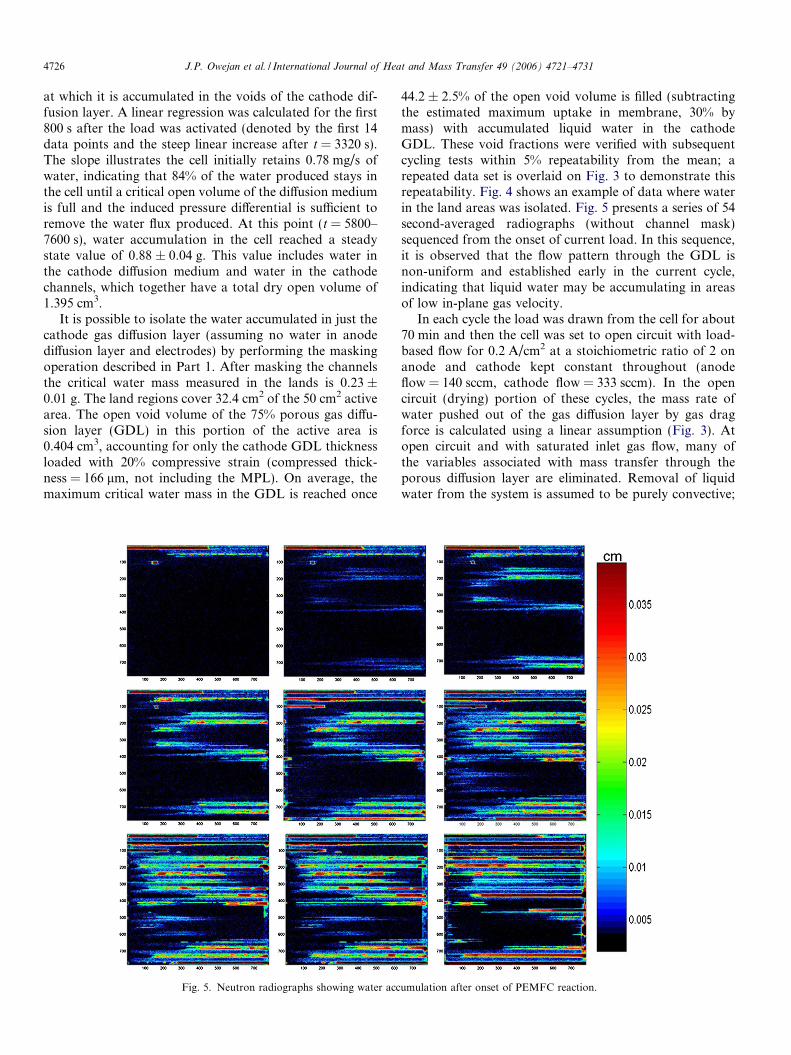
Fig. 5. Neutron radiographs showing water acc
44.2 ± 2.5% of the open void volume is filled (subtractingthe estimated maximum uptake in membrane, 30% bymass) with accumulated liquid water in the cathodeGDL. These void fractions were verified with subsequentcycling tests within 5% repeatability from the mean; arepeated data set is overlaid on Fig. 3 to demonstrate thisrepeatability. Fig. 4 shows an example of data where waterin the land areas was isolated. Fig. 5 presents a series of 54second-averaged radiographs (without channel mask)sequenced from the onset of current load. In this sequence,it is observed that the flow pattern through the GDL isnon-uniform and established early in the current cycle,indicating that liquid water may be accumulating in areasof low in-plane gas velocity.
In each cycle the load was drawn from the cell for about70 min and then the cell was set to open circuit with load-based flow for 0.2 A/cm2 at a stoichiometric ratio of 2 onanode and cathode kept constant throughout (anodeflow = 140 sccm, cathode flow = 333 sccm). In the opencircuit (drying) portion of these cycles, the mass rate ofwater pushed out of the gas diffusion layer by gas dragforce is calculated using a linear assumption (Fig. 3). Atopen circuit and with saturated inlet gas flow, many ofthe variables associated with mass transfer through theporous diffusion layer are eliminated. Removal of liquidwater from the system is assumed to be purely convective;
umulation after onset of PEMFC reaction.

Fig. 6. Neutron radiographs showing water dissipation after offset of PEMFC reaction.
J.P. Owejan et al. / International Journal of Heat and Mass Transfer 49 (2006) 4721–4731 4727
evaporation and back diffusion are neglected. The mea-sured water dissipation flux is 0.29 ± 0.01 mg/s includingchannels and 0.08 ± 0.01 mg/s excluding the channel watervolume, only considering the cathode GDL. Fig. 6 presentsthe series of 54 second-averaged radiographs (withoutchannels mask) sequenced from the offset of current loadwith sustained constant gas flow.
Characterizing the convective portion of transport in thegas diffusion layer is desirable due to local water accumu-lated in regions associated with the diffusion layer irregu-larity during an actual reaction with water production.Typically this characterization must be done ex situ. Theaverage gas velocity through the cathode gas diffusion layersubstrate based on dry porosity is calculated to be 3.3 cm/s(Vvol/(Ax�DL*nland*U)). The corresponding gas volumetricflow rate through the GDL is 5.03 cm3/s. The differencebetween the dissipation rate measured with neutron radio-graphy and the gas purging volumetric flow illustrates thatconvective transport through the gas diffusion layer isnonhomogeneous. Homogeneous convective flow wouldremove water at a similar rate to the gas flow if the gasmomentum was distributed evenly through the diffusionlayer void. It is expected that the water trapped in the smal-ler pores of the gas diffusion layer cannot be removed bygas shear at the given mass flow rate. Since the pressure dif-ferential to remove a droplet is proportional to both theradius of curvature and surface properties of the pore in
which it resides, the droplets in smaller pores will remainwhile the larger pores are purged (assuming the surfaceproperties are similar throughout the structure). After alarge pore adjacent to a smaller pore is purged, the smallerpore empties into the larger pore by capillary transport.This is shown by the logarithmic decay in pressure gradientthrough the gas diffusion layer after the current load isremoved (Fig. 3). Initially the pressure drop decreasesquickly as the large pores are purged, and then the ratedecreases as the smaller pores empty into the larger pores.It is expected that these small pores see less gas flow thanthe primary flow paths through the larger pores and in turnwould have a less significant effect on pressure dropthrough the diffusion layer.
3.2. Distribution of local water accumulation
Neutron radiographs detail areas of water hold-up anduniformity of its distribution across the active area.This demonstrates the dynamics associated with the inter-digitated design. Each radiograph pixel represents about94.2 lm � 94.2 lm ± 0.5 lm of active area, thus yieldinglocal water volume/mass measurements with highresolution.
Water accumulation in the channels was of interest todetermine if gas channels were flooding. Fig. 7 representsthe early portion of a load cycle where reaction water is

Fig. 7. Channel geometry overlay.
4728 J.P. Owejan et al. / International Journal of Heat and Mass Transfer 49 (2006) 4721–4731
accumulating from a dry state due to the onset of load. ACAD drawing of the interdigitated cathode flow channels isimposed over the radiograph to illustrate areas of wateraccumulation (inlet manifold on left; outlet manifold onright). In Fig. 5 water droplets and films are shown to ran-domly accumulate in the outlet channels initially. As theexperiment progresses, these water films form slugs thatare periodically purged out of the cell. Contact line pinningdue to the sharp transition from the outlet channel to theexhaust manifold is expected to be the root cause of accu-mulation at the end of each outlet channel.
Varying the inlet humidity of the cathode gas streamcoupled with neutron imaging provides understanding ofwhere and how much water can be removed in the vaporphase. These experiments show a significant decrease inaccumulated liquid water as the cathode relative humidityis decreased from 100% to 50%. Fig. 8 presents the timetransient of voltage, water mass, relative humidity, andohmic resistance. The relative humidity was changed byincreasing the cell temperature and the values shown inFig. 8 were calculated based on a constant dew point ofthe inlet cathode gas.
Fig. 8. Effect of cathode gas stream relative humidity on accumulatedwater mass.
During these experiments the ohmic resistance was mea-sured with impedance spectroscopy at a frequency of1.0 kHz. This resistance indicates the membrane’s resis-tance to proton transfer, a function of membrane hydra-tion. Fig. 8 shows this drying transient effect on ohmicresistance. The initial rapid decrease in ohmic resistanceis proportional to the rate at which water is accumulatedin the cell. The slope in ohmic resistance reached zeroX cm2/s after 10 min of cell operation, signifying the timeconstant for membrane hydration at this current loadand water production rate. The instability in the ohmicresistance measurement correlates with rapid fluctuationsin channel relative humidity. It has been observed thatthe negative ‘‘spikes” in high-frequency resistance (HFR)correspond to periodic slugs of product water that arepurged through the channels or water slugs that are intro-duced from the humidifiers. Although great care was takento remove excess liquid water from the inlet gas streams,there may be some condensation within the heated inletgas lines due to local cold spots. The inlet hoses were ori-ented so that pooling of condensate would not occur andthe dew point was calibrated with a dew cup at the heatedline outlet. Over time this condensation can result in slugsof water moving through the fuel cell. The resulting HFRfluctuations are apparent under dry conditions where themembrane resistance is elevated above the fully saturatedvalue and liquid water has greater influence on relativehumidity.
It is apparent in all radiographs that the primary gastransport path is through channels and GDL located atvertical pixel 400–650. This region is shown to be consis-tently drier due to higher gas velocity. This local increasein velocity through the GDL and channels is a direct resultof the pressure profile along the inlet and outlet headers.
3.3. In-plane permeability using pressure differential and
saturation data
The in-plane permeability of the reactants in the gas dif-fusion layer is an important parameter to evaluate and cor-relate to fuel cell performance. Moreover, the behavior ofthis permeability with increasing volumetric water contentcan be evaluated with measured pressure differential andliquid water volume. These permeability functions for boththe gas and liquid phases, represented by Darcy’s equation,are important for multi-phase transport models in porousmedia. In the work presented below, only the gas phasepermeability is investigated. A comprehensive modeldescription is provided in Appendix A.
To evaluate the saturation only in the land regions of thefuel cell, the local water accumulation in the channel area isremoved from the water mass data arrays. Then theremaining water mass is summed over the land portion ofthe active area. From this sum the estimated water massfor a fully hydrated membrane (0.05 ± 0.01 g for the landarea only, assuming 30% water uptake by mass) is sub-tracted. With the assumption that no liquid water is located

Fig. 9. Cathode pressure differential vs. diffusion layer saturation.
J.P. Owejan et al. / International Journal of Heat and Mass Transfer 49 (2006) 4721–4731 4729
in the anode diffusion layer, electrodes, or microporous lay-ers, the volumetric saturation fraction is calculated fromthe 75% porous, 166 lm thick compressed cathode diffu-sion layer substrate (not including MPL). The calculatedsaturation fractions thus consider all liquid water underthe interdigitated lands to be located in the membraneand cathode diffusion layer.
The load cycling described in Section 3.1 combined withsaturated inlet gas streams is ideal because evaporation canbe ignored and back diffusion is minimized. The velocityprofile through the depth of the cathode GDL is assumedto be uniform, an assumption that should be valid whenthe ratio of land width to GDL thickness is large. Thisratio was 15 for these experiments. Calculations wereapplied to data after the current load was removed. With-out water generation and species changes, convective flowthrough the cathode gas diffusion layer can be describedby Darcy’s law in the gas phase. Pressure drop throughthe channels was approximated using a friction factorbased on the hydraulic radius of the rectangular channel.Appendix A describes how these assumptions can be usedto calculate the permeability from the measured flow rateand pressure differential. Liquid water accumulation inthe channels was calculated to have an insignificant impact
Fig. 10. Relative permeability vs. cathode GDL saturation.
on the measured pressure differential (<1%) as the pressuredifferential of the GDL will dominate the measurement.Plugged inlet channels may introduce error of up to 6%in calculated relative permeability if there is no gas flowthrough the plugged channel.
From the cycle shown in Fig. 3, the cathode pressure dif-ferential as a function of saturation fraction is extractedfrom the region where the load was removed. Fig. 9 showsthis measured pressure plotted against the saturation frac-tion in the cathode GDL substrate (calculated from mea-sured water mass). The ratio k(s)/k0 of permeability at asaturation level s to dry permeability is called the relativepermeability. Using the model presented in Appendix A,the dry permeability was calculated from the steady statedry pressure drop of 6.0 kPa at a flow of 333 sccm, yieldinga value of 0.26 Darcy (cm2). Fig. 10 shows the plot of rel-ative permeability as a function of cathode land saturation.
As described in Section 3.1 the critical void in the cath-ode diffusion medium is found to be 44.2 ± 2.5%. Fig. 10indicates that this volumetric water content reduces thegas permeability through the cathode GDL significantly.It is hypothesized that extrapolating this permeabilitycurve shown in Fig. 10 will result in an asymptote near zeropermeability once the cathode GDL void is over 50% fullof liquid water.
4. Conclusions
Neutron radiography has been used to visualize liquidwater distributions and measure average accumulatedwater mass during transient tests of a PEM fuel cell. Aninterdigitated flow field was used to force all cathode gasthrough the porous backing layers and the resultingchanges in pressure differential from inlet to outlet havebeen shown to correlate with the saturation level of gas dif-fusion layers. Local water accumulation patterns and uni-formity were illustrated. The cathode inlet humidity wasdemonstrated to have a substantial effect on liquid wateraccumulation. The following conclusions are drawn:
1. Small amounts of condensation in the gas handling sys-tem can have a significant effect on local channel flood-ing for small scale PEMFC experiments.
2. Initially, a relatively dry cathode accumulates liquidwater at a rate equivalent to that at which it is produced.
3. The porous backing layers operating under saturatedconditions accumulates water until a critical water massis reached (approximately 44.2 ± 2.5% of available voidvolume); at this point reaction water is removed fromthe cell at the rate in which it is produced.
4. With the driving force for evaporation eliminated in theexperiment and with no product water being produced,homogenous convective gas shear cannot account forslow water removal rate. It is hypothesized that gas isinitially purged from large pores, and then capillarytransport removes water trapped in smaller pores toempty through large pores.
4730 J.P. Owejan et al. / International Journal of Heat and Mass Transfer 49 (2006) 4721–4731
5. Flooding occurs primarily in the outlet channels at themanifold due to pinning at the sharp transition fromchannel to manifold.
6. Ohmic loss measured with high frequency resistance isproportional to water accumulation in presented exper-iments. Both the mean value and temporal fluctuationsare indicative of the hydration in the membrane andGDL.
7. Relative permeability is reduced significantly as the crit-ical water mass is approached. Mass transport resistancewill force the limiting current once half of the open voidin the cathode GDL is full of liquid water.
Acknowledgements
This work was supported by the US Department ofCommerce, the NIST Ionizing Radiation Division, theDirector’s office of NIST, the NIST Center for NeutronResearch, and the Department of Energy interagencyAgreement No. DEn_AI01-01EE50660.
Appendix A. Interdigitated in-plane permeability calculation
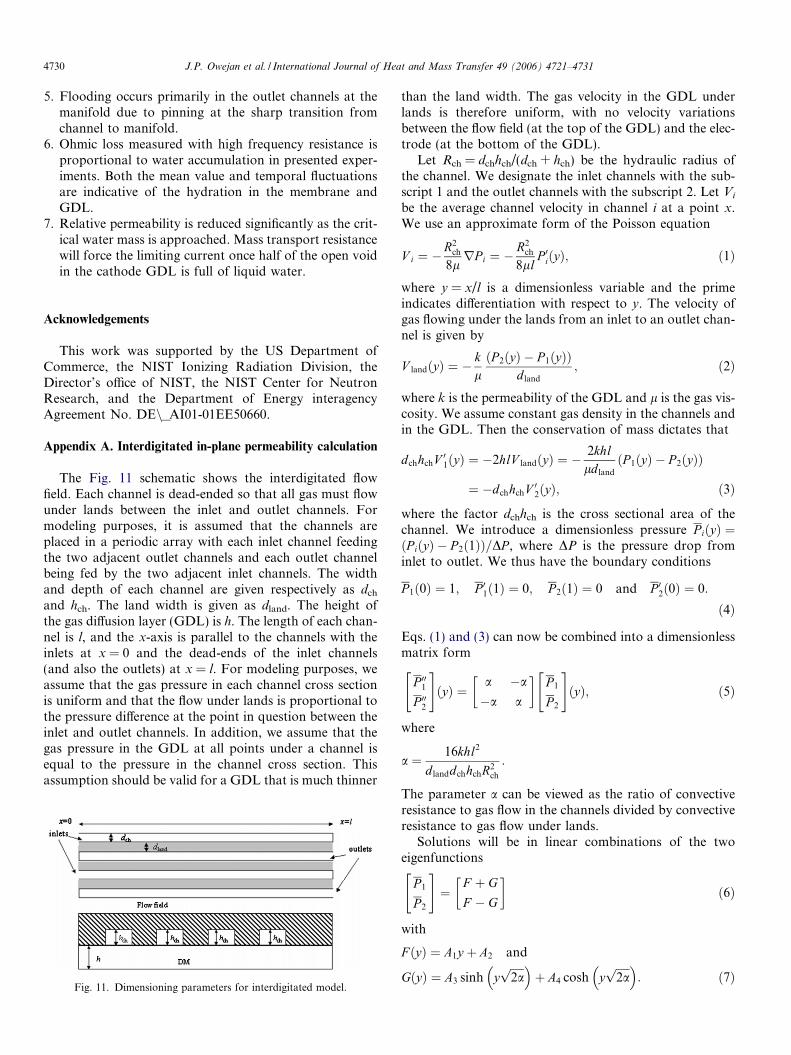
The Fig. 11 schematic shows the interdigitated flowfield. Each channel is dead-ended so that all gas must flowunder lands between the inlet and outlet channels. Formodeling purposes, it is assumed that the channels areplaced in a periodic array with each inlet channel feedingthe two adjacent outlet channels and each outlet channelbeing fed by the two adjacent inlet channels. The widthand depth of each channel are given respectively as dch
and hch. The land width is given as dland. The height ofthe gas diffusion layer (GDL) is h. The length of each chan-nel is l, and the x-axis is parallel to the channels with theinlets at x = 0 and the dead-ends of the inlet channels(and also the outlets) at x = l. For modeling purposes, weassume that the gas pressure in each channel cross sectionis uniform and that the flow under lands is proportional tothe pressure difference at the point in question between theinlet and outlet channels. In addition, we assume that thegas pressure in the GDL at all points under a channel isequal to the pressure in the channel cross section. Thisassumption should be valid for a GDL that is much thinner
Fig. 11. Dimensioning parameters for interdigitated model.
than the land width. The gas velocity in the GDL underlands is therefore uniform, with no velocity variationsbetween the flow field (at the top of the GDL) and the elec-trode (at the bottom of the GDL).
Let Rch = dchhch/(dch + hch) be the hydraulic radius ofthe channel. We designate the inlet channels with the sub-script 1 and the outlet channels with the subscript 2. Let Vi
be the average channel velocity in channel i at a point x.We use an approximate form of the Poisson equation
V i ¼ �R2
ch
8lrP i ¼ �
R2ch
8llP 0iðyÞ; ð1Þ
where y = x/l is a dimensionless variable and the primeindicates differentiation with respect to y. The velocity ofgas flowing under the lands from an inlet to an outlet chan-nel is given by
V landðyÞ ¼ �klðP 2ðyÞ � P 1ðyÞÞ
d land
; ð2Þ
where k is the permeability of the GDL and l is the gas vis-cosity. We assume constant gas density in the channels andin the GDL. Then the conservation of mass dictates that
dchhchV 01ðyÞ ¼ �2hlV landðyÞ ¼ �2khlld land
ðP 1ðyÞ � P 2ðyÞÞ
¼ �dchhchV 02ðyÞ; ð3Þ
where the factor dchhch is the cross sectional area of thechannel. We introduce a dimensionless pressure P iðyÞ ¼ðP iðyÞ � P 2ð1ÞÞ=DP , where DP is the pressure drop frominlet to outlet. We thus have the boundary conditions
P 1ð0Þ ¼ 1; P 01ð1Þ ¼ 0; P 2ð1Þ ¼ 0 and P 02ð0Þ ¼ 0:
ð4Þ
Eqs. (1) and (3) can now be combined into a dimensionlessmatrix form
P 001P 002
" #ðyÞ ¼
a �a
�a a
� �P 1
P 2
" #ðyÞ; ð5Þ
where
a ¼ 16khl2
d landdchhchR2ch
:
The parameter a can be viewed as the ratio of convectiveresistance to gas flow in the channels divided by convectiveresistance to gas flow under lands.
Solutions will be in linear combinations of the twoeigenfunctions
P 1
P 2
" #¼
F þ G
F � G
� �ð6Þ
with
F ðyÞ ¼ A1y þ A2 and
GðyÞ ¼ A3 sinh yffiffiffiffiffi2ap� �
þ A4 cosh yffiffiffiffiffi2ap� �
: ð7Þ

Fig. 12. Dimensionless inlet gas velocity vs. convective resistance to gasflow.
J.P. Owejan et al. / International Journal of Heat and Mass Transfer 49 (2006) 4721–4731 4731
The boundary conditions (4) must be used to solve for theconstants Ai. These constants take on the values
A1 ¼ �b sinh½b�
cosh½b� þ b sinh½b�
A2 ¼ 1� cosh½b�2ðcosh½b� þ b sinh½b�Þ
A3 ¼ �sinh½2b�
2ð1þ cosh½2b� þ b sinh½2b�Þ
A4 ¼cosh½b�
2ðcosh½b� þ b sinh½b�Þ
where b ¼ffiffiffiffiffiffiffiffia=2
p. To evaluate data, we consider the quan-
tity �P 01ð0Þ, which can be viewed as a dimensionless inletgas velocity, and we plot it as a function of a. This is shownin Fig. 12.
The dashed line in Fig. 12 indicates that, for small a, thecurve has a slope of 1. This corresponds to the situation inwhich the GDL permeability is so low that there are nopressure losses in the channels. Instead the entire pressuredrop occurs uniformly in the GDL between the inlet andoutlet channels. As a increases, (as the GDL becomes morepermeable) the pressure drops in the channels become com-parable to those between the channels. As a result of this,the curve deviates from the diagonal line. One can showthat in the limit of large a the derivative P 01ð0Þ tends to�
ffiffiffiffiffiffiffiffia=2
p.
We turn now to the issue of determining a permeabilityk from pressure and flow data for the interdigitated flowfield. We assume that steady-state conditions prevail andthat the pressure drop DP and volumetric flow Vvol haveboth been measured. Then one finds that
V vol ¼ � nch
2
dchhchR2chDP
8llP 01ð0Þ; ð8Þ
where nch is the number of cathode channels, only half ofwhich are gas inlet channels. It follows that P 01ð0Þ can bedetermined from DP,Vvol, and the other parameters inEq. (8). From P 01ð0Þ we can use the above plot to extracta value for a, from which one can determine the permeabil-ity k. Fig. 12 was computed by starting with a-values andusing them to calculate values for �P 01ð0Þ. In applications,one starts with a value of �P 01ð0Þ and must compute a valueof a associated to it. A bisection method was used toaccomplish this task.
References
[1] T.V. Nguyen, A gas distributor design for proton-exchange-mem-brane fuel cells, J. Electrochem. Soc. 143 (1996) L105.
[2] D. Woods III, J. Yi, T.V. Nguyen, Effect of direct liquid waterinjection and interdigitated flow field on the performance of protonexchange membrane fuel cells, Electochim. Acta 43 (1998) 3795–3809.
[3] W. He, G. Lin, T.V. Nguyen, Diagnostic tool to detect electrodeflooding in proton-exchange-membrane fuel cells, AIChE J. 49 (2003)3221–3228.
[4] L. Wang, H. Liu, Performance studies of PEM fuel cells withinterdigitated flow fields, J. Power Sources 134 (2004) 185–196.
[5] T.A. Trabold, J.P. Owejan, D.L. Jacobson, M. Arif, P.R. Huffman,In situ investigation of water transport in an operating PEM fuel cellusing neutron radiography: Part 1 – Experimental method andserpentine flow field results, Int. J. Heat and Mass Transfer, in press,doi:10.1016/j.ijheatmasstransfer.2006.07.003.
[6] R.J. Bellows, M.Y. Lin, M. Arif, A.K. Thompson, D. Jacobson,Neutron imaging for in situ measurement of water transport gradientswithin Nafion in polymer electrolyte fuel cells, J. Electrochem. Soc.146 (1999) 1099–1103.
[7] A.B. Geiger, A. Tsukada, E. Lehmann, P. Vontobel, A. Wokaun,G.G. Scherer, In situ investigation of two-phase flow in flow fields ofPEFC’s using neutron radiography, Fuel Cells 2 (2003) 92–98.
[8] D. Kramer, J. Zhang, R. Shimoi, E. Lehmann, A. Wokaun, K.Shinohara, G.G. Scherer, In situ diagnostic of two-phase flowphenomena in polymer electrolyte fuel cells by neutron imaginingPart A. Experimental, data treatment, and quantification, Electro-chimica Acta 60 (2005) 2603–2614.
[9] J.P. Owejan, Neutron radiography study of water transport in anoperating fuel cell: effects of diffusion media and cathode channelproperties, MS Thesis, Rochester Institute of Technology, Rochester,New York, 2003.
[10] N. Pekula, K. Heller, P.A. Chuang, A. Turhan, M.M. Mench, J.S.Brenizer, K. Unlu, Study of water distribution and transport in apolymer electrolyte fuel cell using neutron imaging, Nucl. Instr. Phys.Res. A 542 (2005) 134–141.
[11] R. Satija, D.L. Jacobson, M. Arif, S.A. Werner, In situ neutronimaging technique for evaluation of water management systems inoperating PEM fuel cells, J. Power Sources 129 (2003) 238–245.
[12] D.S. Hussey, D.L. Jacobson, M. Arif, P.R. Huffman, R.E. Williams,J.C. Cook, Nucl. Instr. Phys. Res. A 542 (2005) 9–15.
[13] M. Mattes, E. Sartori, JEF Report 1 (1984).