WATER AND WASTE WATER ANALYSIS For Environmental ...
287
WATER AND WASTE WATER ANALYSIS For Environmental Health Science Students Laboratory Manual Walelegn Worku Bikes Destaw December 2006 University of Gondar
-
Upload
khangminh22 -
Category
Documents
-
view
3 -
download
0
Transcript of WATER AND WASTE WATER ANALYSIS For Environmental ...

WATER AND WASTE WATER ANALYSIS
For
Environmental Health Science Students
Laboratory Manual
Walelegn Worku
Bikes Destaw
December 2006
University of Gondar
id3540421 pdfMachine by Broadgun Software - a great PDF writer! - a great PDF creator! - http://www.pdfmachine.com http://www.broadgun.com

Water and Wastewater Analysis Laboratory Manual For Environmental Health Science Students
University of Gondar Collage of Medicine and Health Science I
PREFACE
The principal risk associated with community water supply is from pathogenic
microorganisms, toxic chemicals and mineral substances due to contamination as a result of
natural, human and animal activities. When people consume water from contaminated
source, they will be exposed to infectious and other related diseases, possible death &
disability. Therefore, it is important to make the water safe for human consumption through
utilization of different methods of physical, chemical toxicological & bacteriological analysis
of water quality.
To approach these methods of analysis shortage of the examination of water and
wastewater materials within higher education institutions is a major problem in Ethiopia. This
fact holds true for Environmental Health Laboratory Manual as well. The few books that are
available within the institutes are too vast and unorganized to our relevant task. Moreover,
there are no environmental Health Laboratory manuals prepared for undergraduate
environmental Health students. Therefore, this Laboratory manual prepared to alleviate the
abovementioned problem.
This water and wastewater analysis Laboratory Manual contains information on the
methods, procedures, materials and medium, essential chemicals and reagent preparation
processes for analyses of water and waste water samples examination based on world
health organization guide line and EPA manuals to be collected for analysis in the
laboratories. Methods described in this water and wastewater laboratory manual are to be
used specifically in work relating to in most of Environmental health laboratories in all
universities who have the department in Ethiopia.
The structure of this manual also reflects the key stages in the development of
important laboratory procedures, safety rules, etc. Thus, chapter one covers important
considerations in the laboratory, the subsequent chapters deal with bacteriological analysis
and interpretation by membrane filter and fermentation tube technique (chapter two).
Chapter three covers the biological analysis in-terms of parasitological by Ballinger�s
method and assessment of water quality by macro invertebrate identification (chapter
three).chapter four deals with physicochemical parameters analysis of water and waste

Water and Wastewater Analysis Laboratory Manual For Environmental Health Science Students
University of Gondar Collage of Medicine and Health Science II
water by using analytical methods, and the last chapter five emphasis on the toxicological
analysis of water and waste water .
This laboratory manual is mainly prepared for laboratory related health science students,
regional health laboratory and other concerned bodies.

Water and Wastewater Analysis Laboratory Manual For Environmental Health Science Students
University of Gondar Collage of Medicine and Health Science III
ACKNOWLEDGMENTS
It is a pleasure to pass our heartfelt thanks to The Carter Center and the Ethiopia Public
Health Training Initiative (EPHTI) for providing the encouragement and financial as well as
technical support and Ato Akililu Mulugeta of the Carter Center for facilitating the process of
this teaching laboratory manual.
Very special thanks go to national reviewers to Ato Shimelis Tizazu (Head, Public Health
Chemistry Laboratory, Ethiopian Health and Nutrition Research Institute (EHNRI) and Ato
Kebede Faris (World Bank, TA) for their constructive comments.
Our thanks go to inter-institutional reviewer, Ato Esayas Alemayehu from Jimma University,
Ato Yemane Ashebir from Mekele University, Ato Bezatu Mengistie from Haromaya
University and Ato Alemu Tolcha from Hawasa University for giving valuable comments and
suggestions for improving the preparation of this laboratory manuals.
Our thanks go to internal reviewer Dr. Mengesha Admasu, Ato Temesgen Abebe, Ato
Yifoker Tefera and Ato Mesafint Molla from Gondar Collage of Medical and Health science
and the teaching staff of the environmental and occupational health department for giving
valuable comments and suggestions for improving the preparation of this laboratory
manuals.
Our thanks also go to the staff members of the Department of Environmental and
occupational Health, giving us the time and facilities to prepare this laboratory manual.
Our last but not least heart felt thanks go to W/ro. Abebech Asmamaw for writing this paper.

Water and Wastewater Analysis Laboratory Manual For Environmental Health Science Students
University of Gondar Collage of Medicine and Health Science IV
TABLE OF CONTENTS
PREFACE.............................................................................................................................................. I ACKNOWLEDGMENTS .................................................................................................................. III TABLE OF CONTENTS................................................................................................................... IV LIST OF FIGURES ........................................................................................................................... VI LIST OF TABLES ...........................................................................................................................VIII ACRONYMS ...................................................................................................................................... IX CHAPTER ONE................................................................................................................................... 1 1. GENERAL INTRODUCTION ........................................................................................................ 1
1.1 Objective ................................................................................................................1 1.2. Introduction ...............................................................................................................1 1.3. Laboratory safety ......................................................................................................2 1.4 Appropriate use of Lab Equipment...........................................................................4 1.5. Role of Laboratory Instructor ...................................................................................4 1.6. Sampling ....................................................................................................................5 1.7. Laboratory statistics .................................................................................................7 1.8. Standardization of Acids and Bases......................................................................13 1.9. Introduction to Instrumentation ...........................................................................17 1.10. Questions ...............................................................................................................25
CHAPTER TWO ................................................................................................................................ 26 2. BACTERIOLOGICAL ANALYSIS ............................................................................................. 26
2.1. Objectives ................................................................................................................26 2.2 Introduction ..............................................................................................................26 2.3. Membrane filters technique:...................................................................................26 2.4. Multiple Fermentation Tube Technique ................................................................53 2.5. Questions.................................................................................................................89
CHAPTER THREE............................................................................................................................ 90 3. SANITARY PARASITOLOGY AND BENTHIC MACRO INVERTEBRATE....................... 90
3.1. Objectives ................................................................................................................90 3.2. Introduction .............................................................................................................90 3.3. Sanitary parasitology ..............................................................................................91 3.4. Benthic macro invertebrates ................................................................................106 3.5. Questions...............................................................................................................117
CHAPTER FOUR ............................................................................................................................ 118 4.1. Objectives ..............................................................................................................118 4.2. Introduction ...........................................................................................................118 4.3. Color .......................................................................................................................119 4.4. Turbidity .................................................................................................................122 4.5. Temperature...........................................................................................................126 4.6. pH (Hydrogen ion concentration).........................................................................127 4.7. Conductivity...........................................................................................................132 4.8. Acidity ....................................................................................................................137 4.9. Alkalinity ................................................................................................................141 4.10. Total Hardness ....................................................................................................145 4.11. Calcium and magnesium hardness ...................................................................150 4.12. Chlorine (Cl2)........................................................................................................154

Water and Wastewater Analysis Laboratory Manual For Environmental Health Science Students
University of Gondar Collage of Medicine and Health Science V
4.13. Chloride................................................................................................................157 4.14. Ammonia nitrogen...............................................................................................160 4.15. Nitrite nitrogen.....................................................................................................164 4.16. Nitrate Nitrogen ...................................................................................................167 4.17. Fluoride ................................................................................................................170 4.18. Phosphate ............................................................................................................174 4.19. Iron........................................................................................................................180 4.20. Manganese ...........................................................................................................183 4.21. Dissolved Oxygen (Do). ......................................................................................187 4.22. Biochemical Oxygen demand(BOD). .................................................................191 4.23. Chemical oxygen demand ..................................................................................196 4.24. Sulfate ..................................................................................................................200 4.25. Solids....................................................................................................................204 4.26. Chromium ............................................................................................................213 4.27. Arsenic .................................................................................................................217 4.28. Lead ......................................................................................................................223 4.29. Mercury ................................................................................................................227 4.30. Questions:............................................................................................................230
CHAPTER FIVE .............................................................................................................................. 231 5. INTRODUCTION TO TOXICOLOGICAL ANALYSIS .......................................................... 231
5.1. Objectives ..............................................................................................................231 5.2. Introduction ...........................................................................................................231 5.3. Basic Requirements for Toxicity Tests: ..............................................................232 5.4. Classification of Toxicity Tests ............................................................................232 5.5. Preparing organisms for toxicity tests:...............................................................233 5.6. Toxicity Test Systems...........................................................................................235 5.7. Cleaning test chambers and laboratory apparatus ............................................248 5.8. Questions:..............................................................................................................248
GLOSSARY ..................................................................................................................................... 249 BIBLIOGRAPHY ............................................................................................................................. 251 ANNEX- I .......................................................................................................................................... 253 ANNEX-II .......................................................................................................................................... 257 ANNEX- III ........................................................................................................................................ 262 ANNEX- IV ....................................................................................................................................... 265 ANNEX- V......................................................................................................................................... 266 ANNEX VI ........................................................................................................................................ 273

Water and Wastewater Analysis Laboratory Manual For Environmental Health Science Students
University of Gondar Collage of Medicine and Health Science VI
LIST OF FIGURES
Figure 1.1. A correctly plotted graph. .................................................................................................. 20 Figure 1.2 Block diagram of a spectrophotometer............................................................................... 20 Figure 1.3 Spectrophotometer circuit................................................................................................... 22 Fig 2.1. Adding 1.8 ml of sterile membrane lauryl sulfate broth to a Petri dish containing a sterile absorbent pad. ...................................................................................................................................... 40 Fig.2.2. Placing a sterile membrane filter on the membrane filtration unit. ........................................ 40 Fig2.3. Pouring about 20 ml of diluents into the membrane filtration unit. ........................................ 41 Fig.2.4. Adding 5 ml of sample to the membrane filtration unit. ........................................................ 41 Fig.2.5. Using a manual vacuum pump to filter the sample through the membrane filter. ................. 41 Fig.2.6. With a rolling action, placing the membrane filter on an absorbent pad saturated with membrane lauryl sulfate broth. ............................................................................................................ 41 Fig.2.7. After incubation at 44°C for 24 h, the yellow colonies on the membrane filter are counted. 42 Fig.2.8. Steps in the Membrane filter technique: ................................................................................. 52 Fig.2.9. Preparation of dilutions........................................................................................................... 57 Fig.2.10. a positive test in a fermentation tube (a trapped gas bubble and cloudiness in the lactose broth) signals the possible presence of coliform bacteria in the sample.............................................. 58 Figure 2.11. Schematic outline of presumptive confirmed and completed phases for total coliform detection ............................................................................................................................................... 64 Fig. 2.12. Adding 1 ml of sample......................................................................................................... 76 Fig. 2.13. Adding 1 ml of the 1:10 dilution to a test-tube1:10 dilution of the sample......................... 76 Fig.2.14. After incubation at 44°C ....................................................................................................... 76 Fig.2.15. After incubation at 44°C for 24 h, five of the tubes containing 1-mL of sample are positive (gas production), two of those containing 0.1 ml (1-mL of the 1:10 dilution), and two of those containing 0.01-mL (1-mL of the 1:100 dilution). For cla .................................................................. 76 Fig.2.16. Steps in the multiple fermentation tube technique................................................................ 89 Fig.3.1 - Straight-sided containers ....................................................................................................... 92 Fig.3.2. Removal of the supernatant with a suction pump................................................................. 92 Fig.3. 3. Washing the sides of the container with dilute detergent solution. ....................................... 93 Fig.3.4. The pellet with 1 volume of buffer and 2 volumes of solvent................................................ 94 Fig.3. 5a. Homogenization of the sample ............................................................................................ 94 Fig. 3.5b. The sample can also be Homogenized by hand. .................................................................. 94 Fig.3. 6.Separation of the sample......................................................................................................... 95 Fig.3.7.The supernatant is discarded, leaving only the pellet. ............................................................. 95 Fig. 3.8. The pellet, here 1 mL, is suspended in 5 Volumes of zinc sulfate solution. ......................... 96 Fig. 3.9.Filling a McMaster slide:........................................................................................................ 96 Fig.3.10. Old-style McMaster slide: 0.15 mL is held under each grid. ............................................... 96 Fig.3.11. New style McMaster slide: 0.15 mL is held under the Single grid ...................................... 97 Fig.3.12. Representation of part of an eyepiece micrometer superimposed over stage micrometer for microscope calibration ......................................................................................................................... 98 Fig 3.13 Helmenth eags from plate I to plate XVII. ........................................................................ 105 Fig 4.2. Types of acidity of important in ordinary sanitary analysis, and the pH ranges in which they are significant. .................................................................................................................................... 138 Figure 4.3. Titration curve for the carbonate system. ....................................................................... 142

Water and Wastewater Analysis Laboratory Manual For Environmental Health Science Students
University of Gondar Collage of Medicine and Health Science VII
Figure4.4 . Changes in biodegradable organics, measured in oxygen equivalents, as a function of time..................................................................................................................................................... 193 Fig4.6. Arsine generator and absorber assembly .............................................................................. 219

Water and Wastewater Analysis Laboratory Manual For Environmental Health Science Students
University of Gondar Collage of Medicine and Health Science VIII
LIST OF TABLES
Table 1.1 Determination of values of t................................................................................................ 11 Table 1.2 Wave lengthes of absorbed and observed colors. ............................................................... 23 Table 2.1 suggested sample volumes for membrane filter total coliform test .................................. 33 Table 2.2 Saggested sample volumes for membrane filter fecal coliform test ................................... 37 Table 2.3 preparation of Lauryl Tryptose broth.................................................................................. 56 Table 2.4 MPN values per 100mL of samples and 95% confidence limits for various combination of posetive and negative results(when 10 mL portions are used) ............................................................ 65 Table 2.5 MPN values per 100mL of sample and 95% confidence limits for various combination of posetive and negative results (whenfive 10 mL portions,five 1 mL portions and five 0.1 mL portions are Used) .............................................................................................................................................. 66 Table 2.6 Examples of multiplying factors for determination of MPN for different dilutions of samples................................................................................................................................................. 70 Table 2.7 MPN values for 100mL of samples and 95% confidence limits for various combination of posetive and negative results(when three 10 mL portions,three one mL portions and three 0.1 mL portions are used) ................................................................................................................................. 70 Table 2.8 MPN values per 100mL of samples and 95% confidence limits for various combination of posetive and negative rsults (when one 50 mL ,and five 10 mL test portions are used) ..................... 72 Table 2.9 Fecal coliform MPN per 100mL of sample for one set of five tubes containing 0.1 mL of sample .................................................................................................................................................. 77 Table 2.10 Feacal coliform MPN per 100 mL of sample for three sets of five tubes containing 1mL,0.1 mL and 0.01 mL of sample respectively ............................................................................... 78 Table 3.1 Scoring systems in the Chandler Biotic Index ................................................................... 107 Table 3.2 Allocation of biological scores in the BMWP score system............................................. 109 Table 4.1 Turbidity range that shows the nearest value in NTU. ..................................................... 126 Table 4.2 Preparation of pH standard solutions. ............................................................................... 130 Table 4.3 The preparation of various acid-base indicators. .............................................................. 131 Table 5.2 Preparation of synthetic fresh water using mineral water 1............................................... 240 Table 5.3 Preparation of synthetic sea water using reagent grade chemicals 1,2,3 .......................... 240 Table 5.4 Oxygen solubility (mg/L) in water at equilibrium with air at 760 mm Hg (after Richards and Corwin, 1956).............................................................................................................................. 245 Table 5.5 Summery of test conditions and test acceptability criteria for ceriodaphnia Dubia acute Toxicity tests with Effluents and Reciving waters............................................................................. 246

Water and Wastewater Analysis Laboratory Manual For Environmental Health Science Students
University of Gondar Collage of Medicine and Health Science IX
ACRONYMS
CFU -Colony Forming Units
ISO - International Organization for Standardization
EPA - Environmental Protection Agency.
WHO - World Health Organization.
MF - Membrane Filtration
MPN - Most probable Number
BMWP - Biological Monitoring Working Party.
ASPT - Average Score per Taxon
DO - Dissolved Oxygen
BOD - Biochemical Oxygen Demand
COD - Chemical Oxygen Demand
THAM -Tris-(hydroxymethyle) amino methane
QA - Quality Assurance
QC - Quality control
NPDES - National Pollutant Discharge Elimination System
SOPs - Standard Operating Procedures
EC - Environmental Chamber.
USEPA - United State Environmental Protection Agency

Water and Wastewater Analysis Laboratory Manual For Environmental Health Science Students
University of Gondar Collage of Medicine and Health Science 1
CHAPTER ONE
1. GENERAL INTRODUCTION
1.1 Objective
At the end of this chapter, students will be able to Know:
1. Prerequisite for laboratory analysis for water and wastewater.
2. Some of the safe guards to minimize the risks during laboratory work.
3. Some statistical tools to give some basic knowledge and how statically interprets
their results.
4. How to plot their sample blanks in the graph to compare the real value.
5. Safe handling of laboratory equipment and chemicals.
6. How Calibration of instruments.
7. Method of sampling for water and wastewater.
1.2. Introduction
Water is a necessity for life. Unfortunately, not all water helps human to survive. Water from
contaminated sources cause numerous diseases and untimely deaths due pathogenic
organisms and toxic chemicals. In-terms of physical parameters, pure water is practically
colorless, odorless and tasteless. Any deviation from these physical characteristics should
be considered as an indication of impurities. Impurities vary from dissolved chemicals,
minerals to suspended matter and disease causing microorganisms. Water gathers
impurities as it goes through its natural cycle. Surface water may pick up dirt
microorganisms, chemicals and any thing else in its path which can be moved or dissolved.
Physicochemical, Biological, Toxicological, and bacteriological laboratory analysis methods�
for monitoring water quality serves as a number of related purposes, including occurrence

Water and Wastewater Analysis Laboratory Manual For Environmental Health Science Students
University of Gondar Collage of Medicine and Health Science 2
studies in community water systems, health effect studies, and the determination of the
efficacy of various water treatment approaches. These activities, in turn, form the supporting
bases for water quality regulations.
In wastewater analysis, the laboratory data define the treatment plant influent, the status of
the steps in the treatment process, and the final load imposed upon the water resources.
Decisions on process changes, plant modifications or even the construction of a new facility
may be based upon the results of laboratory analysis. The financial pressures alone are
significant reasons for extreme care in analysis.
Research investigations in environmental pollution control rest upon a firm base of
laboratory data. The progress of the research and the alternate pathways available is
generally evaluated on the basis of laboratory data. The value of the research effort will
depend upon the validity of the laboratory results. Thus, learning to perform laboratory tests
on water, wastewater, plays an important role in the environmental health and other related
professionals.
1.3. Laboratory safety
It is critical that you prepare for each experiment by reading it carefully before entering to
the laboratory. Not only will this ensure that you get the maximum benefit of the experience,
but it also makes for a safer environment in the laboratory. This is important not only for
your own safety but also for those around you. A number of directives have been developed
in order to make sure that the laboratory is safe and that it runs smoothly. In each
experiment specific hazards are indicated by bold type and procedures are described that
must be adhered to. Accidents commonly occur when the following rules are violated.
Safety Rules for Laboratory Work
The following rules are designed for your safety in the laboratory. The Laboratory
Instructor has complete authority for enforcement of these rules and any other procedures
to ensure safe practices in carrying out the laboratory work.
Water and Wastewater Analysis Laboratory Manual For Environmental Health Science Students
University of Gondar Collage of Medicine and Health Science 3
1. Approved safety goggles must be worn at all times.
2. Shoes and laboratory cloth must be worn at all times. It is strongly recommended that
wear clothing that completely covers your arms, legs, and feet while working in the
laboratory. Inadequate protection often leads to injury. Avoid wearing expensive
clothing to lab as it may get damaged.
3. Laboratory areas must never be used for eating or drinking.
4. Smoking is not permitted in the laboratory.
5. Observe the location and learn how to operate the nearest eyewash fountain, safety
shower, fire extinguisher, and fire alarm box. First aid for acid or base in the eyes is to
wash with copious amounts of water using the eyewash fountain for 15 minutes. Use
the emergency shower if appropriate. For any acid or base burns on skin wash
thoroughly with water for 15 minutes.
6. All operations in which noxious or poisonous gases are used or produced must be
carried out in the fume hood.
7. Confine long hair while in the laboratory. Hair can catch on fire while using open flames.
8. Mouth suction must never be used to fill pipettes. Always use a bulb to fill pipettes.
9. Perform only authorized experiments. Chemicals are not to be removed from the
laboratory.
10. Maintain your working area in a reasonable state of neatness. If you spill water or a
reagent or break a piece of glassware, clean it up immediately. Any spilled reagents
must also be wiped up immediately, exercising the appropriate care to protect yourself
from skin contact with the substance. Clean off your desktop before leaving the
laboratory.
11. Put all toxic or flammable waste into the appropriate waste container(s)
Provided in your laboratory.
12. Containers of chemicals may not be taken out of the laboratory except to the
dispensary for refilling or replacing laboratory chemicals and exchanging
full waste jugs for empty ones.
13. No laboratory work will be done without supervision.

Water and Wastewater Analysis Laboratory Manual For Environmental Health Science Students
University of Gondar Collage of Medicine and Health Science 4
1.4 Appropriate use of Lab Equipment
Laboratory equipment is expensive and care should be taken when using it. This means
that the equipment should be properly maintained to provide reliable experimental results.
Calibration should be done regularly. It is necessary to see that all equipment being used
is clean before and after use. Better results can be obtained when the equipment being
used is clean, so always maintain your equipment as if it is your own.
1.5. Role of Laboratory Instructor
The objective of the analytical laboratory is to provide qualitative and quantitative data to
be used in decision-making. To be valuable, the data must accurately describe the
constituent characteristics and concentrations in the sample submitted to the laboratory.
Decisions made using water and wastewater data are far reaching. The role of laboratory
instructors is to help students to carry out their activities. These activities may consist of:
Following instructions;
Solving a design problem;
Setting up apparatus;
Checking the apparatus works;
Obtaining, observing and recording the results;
Noting any peculiarities in methods or results;
Link the results to theoretical principles or other results.
Therefore, laboratory instructors must understand the experiments and be familiar with the
equipment and procedures if they are to help the students.

Water and Wastewater Analysis Laboratory Manual For Environmental Health Science Students
University of Gondar Collage of Medicine and Health Science 5
As a lecturer in charge of a laboratory course, you can help them by providing a laboratory
manual. This should outline the experiments and provide guidelines for the demonstrators
on what to do during laboratory sessions. Indeed, you could also spend some time training
them to develop their skills as instructors. Instructors at a number of universities identified
the following useful skills that all laboratory assistants should:
Observe students at work.
Anticipate and recognize major difficulties of understanding
Give brief direction and clear explanations of processes and procedures.
Ask questions, which clarify difficulties of understanding.
Ask questions, which guide students through the activity.
Answer students' questions in a simple, direct and non-critical way.
Offer supportive and encouraging remarks.
Know when to help or not help a student.
1.6. Sampling
Grab samples: a sample collected at a particular time and place can represent only the
composition of the source at that time and place. When the source is known to vary with
time, grab samples collected at suitable intervals and analyzed separately can document
the extent, frequency, and durations of these variations. When the source composition
varies in space rather than time, collect samples from appropriate locations.
Composite samples: A combination of grab samples collected at the same sampling
point at different times. Time composite samples are most useful for observing average

Water and Wastewater Analysis Laboratory Manual For Environmental Health Science Students
University of Gondar Collage of Medicine and Health Science 6
concentrations used in calculating such variables as the loading of the efficiency of a
wastewater treatment plant.
Integrated samples: A mixture of grab samples collected from different points analyzed
simultaneously. An example of the need for integrated sampling occurs in a river that varies
in composition across its width and length.
Both natural and artificial lakes show variation of composition with both depth and horizontal
location. However, there are conditions under which neither total nor average results are
especially useful, but local variations are more important. Preparation of integrated samples
usually requires equipment designed to collect a sample from a known depth with out
contaminating with overlying water.
Sample container
The type of sample container used is utmost importance. Containers typically are made of
plastic or glass, but one material preferred over the other. For example silica and sodium
may be leached from glass but not from plastic, trace levels of metals may sorbs on to the
walls of glass containers. Some volatile organic compounds in samples may dissolve in to
the walls of plastic containers or may even leach substance from the plastic.
Sample preservation
Complete and an equivalent preservation of samples, whether domestic waste water,
industrial waste or natural waters is a practical impossibility. Regardless of the sample
nature, complete stability for every constituent never can be achieved. At best preservation
techniques only retard chemical and biological changes that inevitably continue after sample
collection.

Water and Wastewater Analysis Laboratory Manual For Environmental Health Science Students
University of Gondar Collage of Medicine and Health Science 7
Sample storage
Some cat ions, Cd, Cr, Cu, Fe, Pb, Mn, Hg, and Zn, are subjected to loss by adsorption on
or ion exchange with, the wall of glass containers, unless acidified with nitric acid to pH
below 2.0 to minimize ppt. absorption in container walls. Storage is not allowed for DO, CO2,
pH, and temperature since the concentration changed in a matter of minutes. Iron and
manganese are readily soluble in their lower oxidation states; therefore, these cat ions may
ppt or they may dissolve from sediment, depending on the redox potential of the sample.
During storage, microbial activity may affect the concentration of ions by secondary
transformation:
Nitrate __________ Nitrite ________Ammonia.
Sulfate __________ sulfite.
Cr+6____________Cr+3
Changes causes by growth of microorganisms are greatly restarted by keeping the sample
in the dark and at low temperature (< 4oc but above freezing). Zero head space is important
in the preservation of sample with volatile organic compounds. Loss of volatile organic
carbon should be avoided by avoided by carefully filling so that the top of the meniscus is
above the top of the bottle rim.
1.7. Laboratory statistics
When performing chemical analyses of natural waters, the goal is to obtain accurate and
reliable data in a safe and efficient manner. Guidelines for performing chemical tests safely
are provided at the beginning of this manual. Below, important aspects of QA/QC are
presented.
Quality Assurance: Quality assurance is defined as a set of operating principles that
provide reliable data of known quality. These operating principles are spelled out in a QA
Plan. A QA Plan typically includes the following: cover sheet with plan approval signatures,
staff organization and responsibilities, sample control and documentation, standard
operating procedures for all analytical methods, calibration procedures, quality control
activities, performance audits, data assessment procedures, data reduction, validation and
reporting.

Water and Wastewater Analysis Laboratory Manual For Environmental Health Science Students
University of Gondar Collage of Medicine and Health Science 8
Quality Control: A good quality control program consists of the following elements:
certification of operating competence, recovery of known additions (�spikes�), analysis of
externally supplied standards, analysis of reagent blanks, calibration of standards, analysis
of duplicates, and maintenance of control charts. Quality control activities are integrated in
all subsequent laboratory procedures to provide you the opportunity to become familiar with
these concepts. Descriptions of QC activities are provided below.
An understanding of statistics is an absolute necessity in the laboratory for determining the
accuracy and precision of quantitative analytical data. Many new and specific mathematical
terms will be used in the study of statistics. For example, accuracy means the correctness of
a given analysis while precision means the "reproducibility" of an analytical procedure. A
measure of accuracy can be obtained by analyzing a sample of known concentration and
noting the deviation from the known standard, whereas a measure of precision is obtained
my measuring a sample multiple times.
Statistical Terminology
Some additional common terms in laboratory statistics are mean, median, mode, absolute
error, relative error, deviation, relative deviation, standard deviation, coefficient of variation,
and confidence limits intervals. These terms are defined as follows:
A) Mean ( y ) - The technique of "taking an average" by adding the numerical values (y1,
y2, y3 ....etc.) of an analysis and dividing this sum by the number (n) of measurements
used.
The experimental mean, y, is our best estimate of the true mean,
B) Median - The same data used to calculate the mean can be displayed in increasing or
decreasing series. The median is defined as the "middle" value. If the total number of

Water and Wastewater Analysis Laboratory Manual For Environmental Health Science Students
University of Gondar Collage of Medicine and Health Science 9
measurements is an even number, there will not be a single middle value; the median in this
case will be the average of the two middle values.
C) Mode - The measurement value that appears most frequently in the series.
Statistics Used to Describe Measures of Accuracy
D) Absolute Error - The difference between the true value and the measured value with
the algebraic sign indicating whether the measured value is above (+) or below (-) the true
value.
Yi - Yt
Yi = Measured Value
Yt = True Value
E) Relative Error or Percent Error - Relative error is the absolute error (difference
between the true and measured value divided by the true value. It is usually expressed as a
percentage (percent error).
Yi = Measured Value
Yt = True Value
Note the difference between relative error (no absolute value) and the deviation from the
mean, which contains an absolute value.
Statistics Used to Describe Measures of Precision
F) Deviation from the mean (dy) - How much each measured value differs from the
mean.

Water and Wastewater Analysis Laboratory Manual For Environmental Health Science Students
University of Gondar Collage of Medicine and Health Science 10
Deviation from the mean can also be expressed as a percent deviation.
G) Standard Deviation (s) - A measure of the distribution of values about its mean. The
standard deviation for small data sets (n<20) can be calculated in five steps:
1. Determine the mean ( y )
2. Subtract the mean from each measured value
3. Square each difference
4. Sum the squared terms in step 3 and divide by "n-1"
5. Calculate the square root of the average found in step 4 by dividing by
one less than the actual number of measurements.
The value of "s" is an estimate of the true standard deviation; .The variance
is equal to 2.
H) Coefficient of Variation, CV - The relative standard deviation which is calculated by
dividing the standard deviation by the mean.
Water and Wastewater Analysis Laboratory Manual For Environmental Health Science Students
University of Gondar Collage of Medicine and Health Science 11
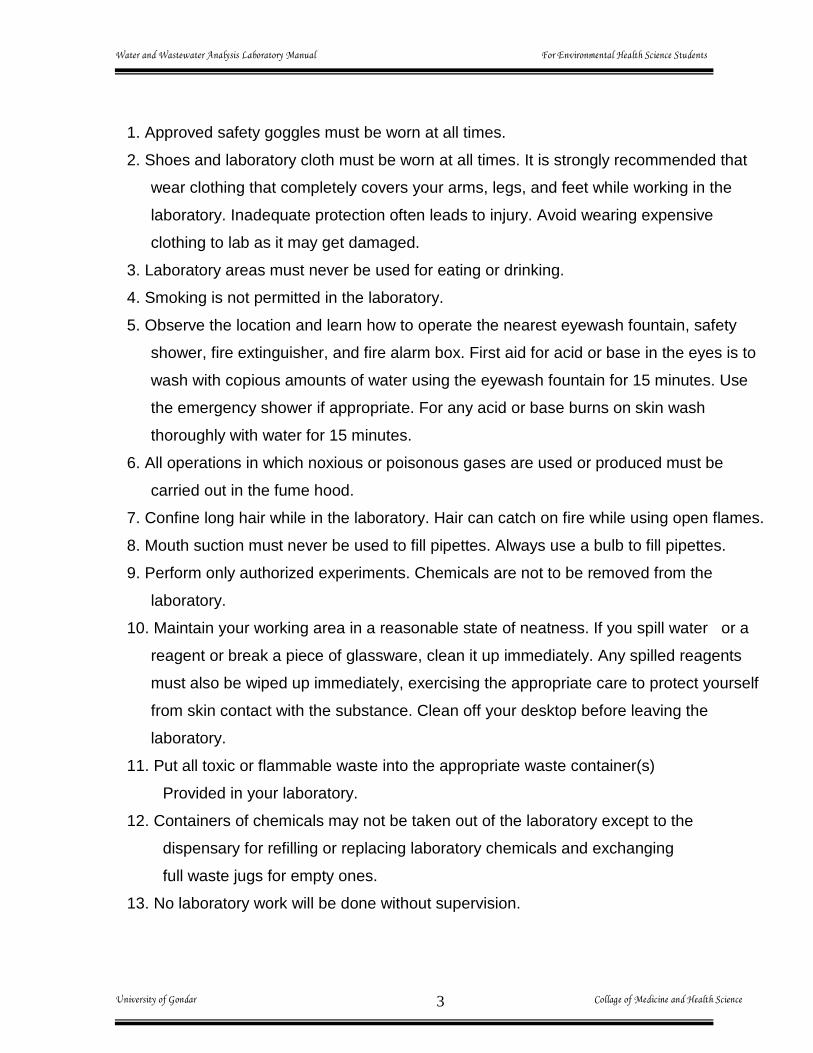
I). Confidence Limits. The interval around an experimental mean within which the true
result can be expected to lie with a stated probability. Confidence limits for small data
sets are estimated through the following expression.
The value of t is determined from the following table.
Table 1.1 Determination of values of t

Water and Wastewater Analysis Laboratory Manual For Environmental Health Science Students
University of Gondar Collage of Medicine and Health Science 12
Control samples are routinely analyzed along with environmental samples. These control
samples include blanks, replicates, standards, and spikes. Blanks are used to assure that
there was negligible contamination in carrying out the experimental procedure. Replicates
are used to obtain a measure of the reproducibility (or precision) of the experiment.
Standards are samples of known concentration, which can be prepared from raw materials
or purchased directly from commercial manufacturers. Standards are used for one of two
purposes: to establish calibration lines/curves OR to determine the accuracy of an
experiment. Standards used to determine the accuracy of the experiment are called
�controls.� Control standards are NOT to be used in establishing calibration lines or curves.
Spike samples involve adding a known amount of material to a sample and measuring the
increase in concentration. Spike analyses are useful for determining whether interferences
exist in an analytical procedure.

Water and Wastewater Analysis Laboratory Manual For Environmental Health Science Students
University of Gondar Collage of Medicine and Health Science 13
1.8. Standardization of Acids and Bases
Reagents and Apparatus
a).Glassware: (1 L volumetric flask, 10 or 25mL Mohr pipette, 1 L glass stock
acid bottle, 500mL Erlenmeyer flask (3), 50mL burette, 1 L polyethylene
stock NaOH bottle)
b).Concentrated sulfuric acid (H2SO4): 17.6M (35.2N), molecular weight of
98.079.
c).Sodium hydroxide (NaOH): molecular weight of 39.997.
d).Tris-(hydroxymethyl)aminomethane (TRIS): molecular weight of 121.135.
e).Potassium hydrogen phthalate (KHP): molecular weight of 204.223.
f). Bromcresol Green: prepared by the TA by dissolving 0.1 g bromcresol
green into 100mL deionized water and adding 3 drops of 0.2 N NaOH.
g).Phenolphthalein: prepared by the TA by dissolving 0.2 g phenolphthalein into
200mL deionized water and 200mL 95% ethanol.
Acid Standardization: Standardization of acid solutions is accomplished by precisely
measuring the volume of acid needed to neutralize a known amount of base. The usual
base primary standard is sodium carbonate, however, tris-(hydroxymethyl) amino
methane, known also as �TRIS� or �THAM� is also used. The chemical formula for TRIS is
(HOCH2)3CNH2, and it has a molecular weight of 121.135. TRIS reacts with acids by
adding one proton to the amino group, becoming (HOCH2)3CNH3+. Thus, its equivalent
weight is also 121.135. The proton can come from either the surrounding water or from
the added acid.
TRIS is available commercially in primary-standard purity, and its rather large formula
weight (121.135) minimizes weighing errors. TRIS is hygroscopic and prior to use must
be dried at 105°C so that absorption of atmospheric moisture does not impair weighing.
The equivalence point of TRIS lies between pH 4 and 5 and therefore bromocresol green
(which changes color from blue to yellow at pH 4.5) is a good choice of indicator.

Water and Wastewater Analysis Laboratory Manual For Environmental Health Science Students
University of Gondar Collage of Medicine and Health Science 14
Procedure:-
Prepare stock 0.2 N solution of sulfuric acid and standardize with TRIS. To prepare your
solution, follow the procedure below.
1. Calculate the volume of concentrated H2SO4 needed to produce 1 L of 0.2N H2SO4.
2. Put about 0.5 L of deionized water into a 1 L volumetric flask.
3. Put a suction bulb (Propipette) on a graduated (Mohr) pipette, being careful to lubricate
the end of the pipette with deionized water and using a gentle, axial, rotating force to
seat the bulb.
4. While working in the fume hood, draw the needed amount of concentrated H2SO4 into
the pipette and drain the pipette into the volumetric flask. Be sure you are proficient
using the pipette prior to attempting the procedure with acid. (If not proficient, then
practice with deionized water.)
5. Carefully fill the volumetric flask to the mark with deionized water and mix by holding the
flask in two hands (one under the base and one on the neck). Mix thoroughly by gently
swirling the contents and turning the flask end-over-end.
6. Drain the volumetric flask into a 1 L glass stock solution bottle, and label the bottle with
(a) your name, (b) the date, (c) the solution it contains, and (d) the approximate
concentration of the solution. All solutions should be labeled in this way.
To standardize the 0.2 N sulfuric acid solution prepared above, do the following:
1. Dry 3 to 5 g TRIS at 105°C and cool in a desiccators. (This has been done for you
by the TA to save time.)
2. Weigh out three samples of TRIS between 0.7 and 0.75 g, and add to three separate
500mL Erlenmeyer flask. Record the exact weight of each TRIS sample to 4 signifi-
cant figures.

Water and Wastewater Analysis Laboratory Manual For Environmental Health Science Students
University of Gondar Collage of Medicine and Health Science 15
3. Add approximately 150mL of deionized water to each flask to dissolve the TRIS.
4. Add 2 to 3 drops of bromcresol green indicator to each flask.
5. Fill a clean 50mL burette with the stock 0.2 N H2SO4 solution.
6. Titrate the TRIS in each Erlenmeyer flask until the solution turns yellow by adding
small volumes of acid and swirling the flask to mix. The endpoint should be about
30mL, and as you approach the endpoint, add the acid drop-wise. The equivalence
point determined using your indicator should be accurate to the nearest drop.
Record the volume of acid dispensed from the burette to the nearest 0.01mL.
7. Calculate the normality of the stock acid solution assuming the TRIS is 100 percent
pure.
Base Standardization: Bases are standardized by titrating precisely weighed quantities
of acid. The usual choice for primary acid standard is potassium acid phthalate, also
known as potassium hydrogen phthalate or �KHP�. The formula for KHP is KHC8H4CO4,
and its molecular weight is 204.223. It only gives up one proton during titration, so its
equivalent weight is also 204.223.
KHP is dried at 105°C (but not higher) and cooled in a desiccators. The resulting solid is
no hygroscopic and has a relatively high molecular weight. The equivalence point occurs
when all the KHP has been stripped of protons. The pH at the equivalence point occurs
between 8 and 10 and, therefore, phenolphthalein is a good indicator.
Significant Digits. In any analytical procedure it is important to consider significant digits,
in particular when specifying the concentration of standard solutions. In general, all
reported digits should be definitively known, except the last digit, which may be in doubt.
For example, an analyst reports the concentration of TSS as 76.5 mg/L. The analyst is
confident about the 76, but is not sure if it is 0.5, 0.7 or 0.4, etc. When values for a
parameter (e.g., TSS) are presented in a column for multiple samples, all values in the
column need not have the same number of significant digits.

Water and Wastewater Analysis Laboratory Manual For Environmental Health Science Students
University of Gondar Collage of Medicine and Health Science 16
The standard deviation of an analysis is used to determine which digits are significant.
For example, the TDS of a sample measured as 1467 mg/L, with a standard deviation of
40 mg/L, should be reported as 1470 mg/L. If the standard deviation is 100 mg/L, report
the measurement as 1500 mg/L.
When multiplying or dividing, the digits in the final answer should equal those in the factor
with the fewest significant figures. If adding or subtracting, the number with the fewest
decimal places, not the number with the fewest significant figures, puts the limit on the
number of places that may be justifiably carried in the sum or difference.
Procedure:-
Prepare a stock 0.2 N solution of sodium hydroxide and standardize your stock solution
with KHP. To prepare your base solution, follow the procedure below.
1. Calculate the weight of sodium hydroxide pellets needed to produce 1 L of 0.2 N
NaOH.
2. Select and zero a plastic-weighing dish or weighing paper.
3. Weight out the amount of NaOH needed to prepare 1 L of 0.2 N NaOH solutions by
adding small amounts of the pellets to the plastic-weighing dish or paper. Use a
scapula. You can make this weighing process go more quickly by first determining
the weight of an average pellet and then counting out the approximate number of
pellets needed. Remove and dispose of pellets that may have fallen on the scale.
NaOH is corrosive and will quickly ruin the instrument.
4. Put about 0.5 L of deionized water into a 1 L volumetric flask.
5. Carefully add the pellets to the volumetric flask and let the pellets dissolve. You can
hasten this by holding the flask in two hands and gently swirling the contents.
6. When the pellets have dissolved, carefully fill the volumetric flask to the mark with
deionized water. Mix by inverting the flask several times after securing a cap.

Water and Wastewater Analysis Laboratory Manual For Environmental Health Science Students
University of Gondar Collage of Medicine and Health Science 17
7. Drain the volumetric flask into a 1 L polyethylene stock solution bottle and label the
bottle with (a) your name, (b) the date, (c) the solution it contains, and (d) the
approximate concentration of the solution.
To standardize the 0.2 N sodium hydroxide solution prepared above, do the
following:
1. Dry 3 and 5g KHP at 105°C and cool in a desiccators. (To save time, this has been
done for you by the TA.)
2.Weigh out three (3) quantities of KHP, each between 1.1 and 1.3g, and add each
quantity to a separate 500mL Erlenmeyer flask. Be sure to record the exact weight of
each quantity of KHP to 4 significant figures.
3. Add approximately 150mL of deionized water to each flask to dissolve the KHP.
4. Add 2 to 3 drops of phenolphthalein indicator to each flask.
5. Fill a clean 50mL burette with the stock 0.2 M NaOH solution.
6. Titrate the KHP in each Erlenmeyer flask until the solution turns pink. Titrate by adding
small volumes of base and swirling to mix. The endpoint should be about 30mL. As
you approach the endpoint, add the base drop-wise. The equivalence point
determined using your indicator should be accurate to the nearest drop. Record the
volume of base added to the nearest 0.01mL.
7. Calculate the normality of the stock base solution assuming KHP is 100 percent pure.
1.9. Introduction to Instrumentation
i) Specrtrphometer
Spectrophotometer involves the measurement of the absorption of radiant energy by
chemical species as a function of wave length of the radiation or its measurement at a given
wavelength. Spectrophotometer methods are generally rapid and adaptable to the
determination of small concentration of species. In spectrophotometer analysis, a sample is

Water and Wastewater Analysis Laboratory Manual For Environmental Health Science Students
University of Gondar Collage of Medicine and Health Science 18
irradiated with a beam of radiant energy by a narrow wavelength range and the amount of
absorbed energy is measured.
The wave length of the incident beam is varied and the absorbance or transmittance is
plotted against the wavelength. In such a manner an absorption spectrum is obtained.
The essential parts of a spectrophotometer are:-
1. Source of radiant energy.
2. Monochromatic i.e. a device for isolating monochromatic light or, more
accurately, narrow bands of radiant energy from the solution under taste.
3. A device to receive or measure the beam or beams or radiant energy
passing through the solution.
The power of transmitted radiation through a solution depends up on the power of the
incident radiation string, the solution and the number of radiation absorbing particles, which
the radiation encounters. The number of particles encountered depends up on the thickness
of solution through which the radiation absorbing species. The usual source for radiant
energy for visible spectrophotometer as well as the near infrared as an incandescent lamp
with a tungsten filament. The useful wave range is from about 325 or 350 nm to about 3µm.
For ultra violate region of the spectrum, a low pressure hydrogen or deuterium discharge
tube is generally used as the source. The effective range is from about 185nm to 375 or
400nm.
Instruments which read both absorbance (A) and percent transmittance (%T) use
a linear scale for %T and a logarithmic scale for A. With this arrangement a more precise
reading can be made for �A� when the absorbance is low and more precise reading for % T
when the absorbance is high.
There for ,at absorbance above 0.6, it is preferable to read %T and calculated
absorbance using the following equation.
A = 2-log %T.

Water and Wastewater Analysis Laboratory Manual For Environmental Health Science Students
University of Gondar Collage of Medicine and Health Science 19
When the plot of absorbance versus concentration for an absorbing species at a particular
wavelength is linear, the substance is said to obey Beer�s law and such a plot is known as
calibration curve. When a calibration curve is not linear the substance is said to deviate from
Beer�s law.
An instrumental variation, which may cause deviation to Beer�s law include:-
Power titration of the radiation source and detector amplification system.
Sensitivity changes in the detector and
Strong radiation reflected with in instrument reaching the detector.
Thus, errors are largely cancelled out by using a double beam spectrophotometer.
The types and size of cuvate also is a determining factor in spectrophotometer
determination. In windows the absorption cell must be kept scrupulously clean. Finger print
smudges and traces of contamination can cause considerable error. The sample cell, when
positioned, becomes part of the optical path through the spectrophotometer and must be
positioned exactly the same each time; the cell must be filled such that the radiation passes
through the solution and not the meniscus.
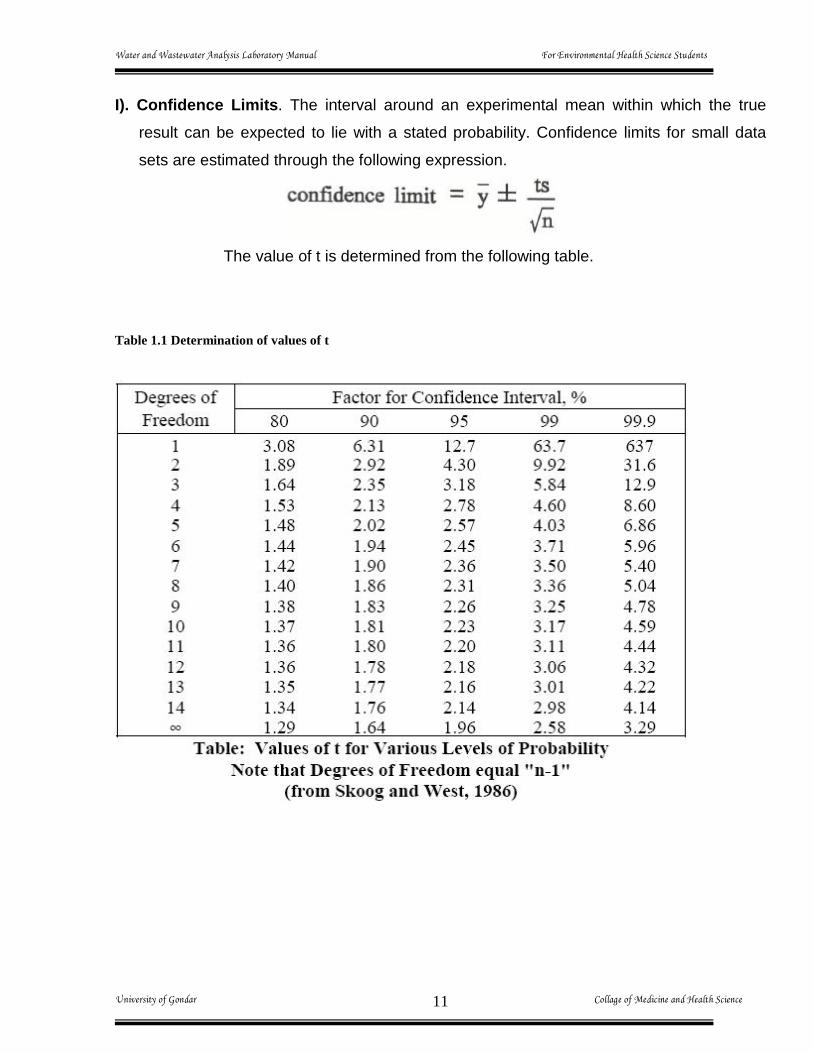
RULES FOR GRAPHING IN INSTRUMENTAL ANALYSIS
1. Graphs may be inserted in the text of the module report. However, be sure the graph is
large enough so that the data is easily interpreted, and that axis labels are legible.
2. Every graph should be numbered and have a have a caption that completely describes
the graph.
3. Multiple sets of data may be plotted on the same graph as long as the axes are
appropriate for all sets of data. A legend must be included when multiple sets of data are
plotted.
4. Graphs must have titles, axis labels, and units.
5. The equation of any regression lines should be included on the chart.
Water and Wastewater Analysis Laboratory Manual For Environmental Health Science Students
University of Gondar Collage of Medicine and Health Science 20
An acceptable graph is shown in Figure 6.2.
Figure 1.1. A correctly plotted graph.
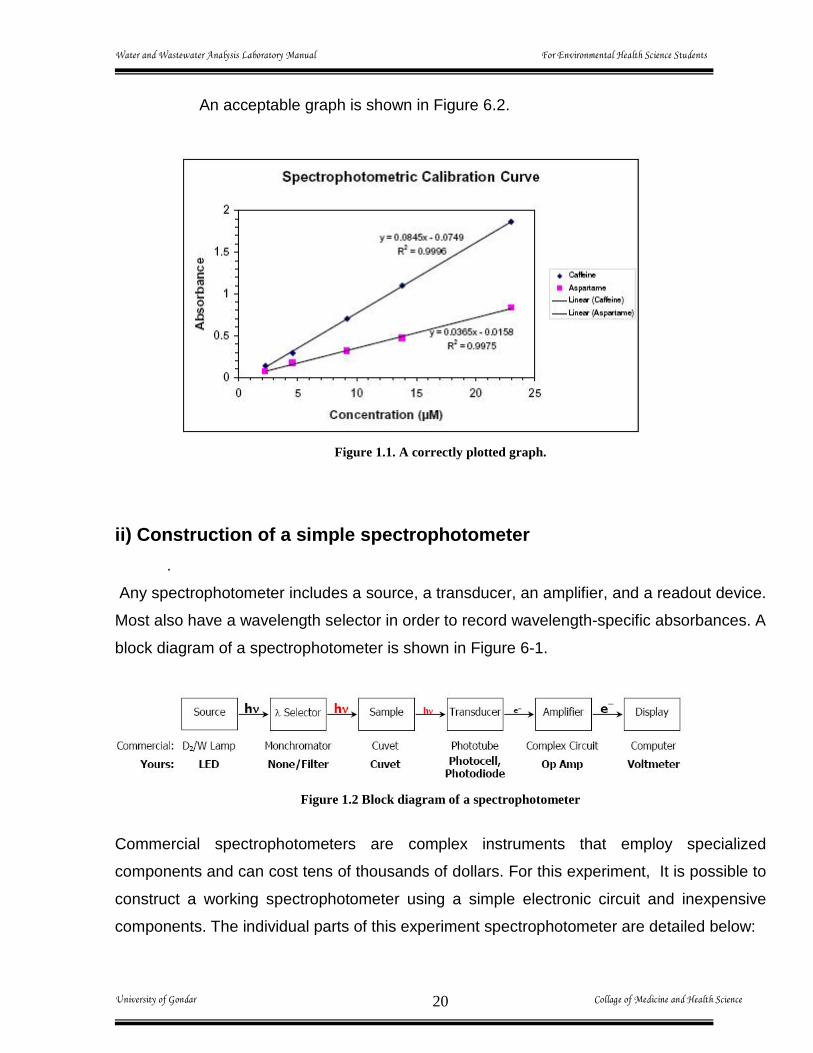
ii) Construction of a simple spectrophotometer
. Any spectrophotometer includes a source, a transducer, an amplifier, and a readout device.
Most also have a wavelength selector in order to record wavelength-specific absorbances. A
block diagram of a spectrophotometer is shown in Figure 6-1.
Figure 1.2 Block diagram of a spectrophotometer
Commercial spectrophotometers are complex instruments that employ specialized
components and can cost tens of thousands of dollars. For this experiment, It is possible to
construct a working spectrophotometer using a simple electronic circuit and inexpensive
components. The individual parts of this experiment spectrophotometer are detailed below:

Water and Wastewater Analysis Laboratory Manual For Environmental Health Science Students
University of Gondar Collage of Medicine and Health Science 21
Materials.
Source: You will construct a visible source using an LED (light emitting diode), a resistor,
and a power source. The function of the resistor is to control the amount of current
flowing through the LED and thus controlling the intensity of the light.
ë Selector: Wavelength selection will be accomplished using a colored LED (red, blue,
yellow, or green) or a white LED with a colored glass filter.
Sample: Disposable plastic cuvets will be used to hold the sample.
Transducer: Two transducers will be used: a photocell and a photodiode. A photocell is a
device that has a resistance that varies with light intensity. A photodiode is a
diode that can conduct current in the reverse-biased direction when illuminated.
The amount of current that flows is proportional to the light intensity.
Amplifier: You will wire a simple operational amplifier circuit that will convert the current
flowing through the transducer into a voltage.
Display: A voltmeter will be used to display the voltage produced by the amplifier. This
voltage is proportional to the current flowing through the transducer (which is
proportional to the light intensity measured by the transducer.
The circuit you will build is shown in Figure 6-2. According to Ohm�s law (V = IR), changing
the value of the resistor (RLED) changes the amount of current (I) that flows through the
LED since the voltage (V) remains constant. The wavelength range can be changed by
using a different colored LED or by using a white LED with a filter. As part of the experiment,
you will characterize the wavelength dependence of the light produced by the source in
order to select the best source for the analysis of an unknown.

Water and Wastewater Analysis Laboratory Manual For Environmental Health Science Students
University of Gondar Collage of Medicine and Health Science 22
Figure 1.3 Spectrophotometer circuit.
The value of Rf must be selected so that a reasonable voltage is produced by the amplifier.
For the photocell, start with Rf = 10 kÙ (brown-black-orange) for the photodiode start with Rf
= 1.0 MÙ (brown black-green). Note that the photodiode must be reverse biased (cathode
side towards the resistor).
A simple current-to-voltage converter is used in the detector circuit. The current flowing
through the transducer(Iin) is converted to an output voltage, Vout, that depends on the
magnitude of the feedback resistor (Rf):
Since the current through the transducer is proportional to the light intensity, the output
voltage is also proportional to the light intensity. To measure the absorbance of a solution,
then, one simply measures the voltage for a blank (Vblank) and a sample (Vsample),
converts it to a transmittance (T), and then calculates the absorbance (A):

Water and Wastewater Analysis Laboratory Manual For Environmental Health Science Students
University of Gondar Collage of Medicine and Health Science 23
Alignment of the LED and the transducer is not critical as long as their relative positions do
not change during the course of an experiment. The cuvet, however, should be reproducibly
positioned to avoid errors. Recall that the color of a compound is the complement of the
color of light it absorbs. This is of great importance in spectrophotometry, as the analysis
wavelength must be absorbed by the molecule of interest. The following table will help you
to select the appropriate wavelength for analysis in this experiment.
Table 1.2 Wave lengthes of absorbed and observed colors.
Procedure.
A. Source Characterization:
Build the source portion of the circuit, selecting any one of the LEDs. Be sure to
use the correct resistor value to avoid destroying the LED. Record the spectrum
of the LED and find its wavelength of maximum emission using the fiber optic

Water and Wastewater Analysis Laboratory Manual For Environmental Health Science Students
University of Gondar Collage of Medicine and Health Science 24
diode array detector. Be sure to save the spectrum. Repeat this for each color of
LED.
Are the wavelengths of maximum emission consistent with your
expectations?
When using the white LED, also record some spectra with various filters between
the LED and the fiberoptic. Note how the spectrum changes. Save the spectra for
at least 3 different filters.
Do your findings for the filters agree with Table 1?
B. Transducer Characterization:
Build the detector portion of the circuit using either the photodiode or the photocell.
Note that Rf = 10 kÙ for the photocell and 1.0 MÙ for the photodiode. Place the
transducer in the path of the light beam inside the sample compartment of a Spec 20
spectrophotometer. (You will need to run wires between the transducer and your
circuit.) Record the output voltage of the circuit (Vout) as a function of
wavelength.Record in increments of at least 25 nm between 350 and 900 nm.
The Spec 20 uses a tungsten lamp as a visible source. Is the emission of a
tungsten lamp the same at all wavelengths? How does this affect the
measurement of the transducer spectral response?
C. Spectrophotometer Characterization:
Assemble the complete spectrophotometer using the green LED and either one of the
transducers. Measure Vout as a function of LED current for at least 5 values of RLED. Repeat
using the red LED.
What differences do you notice in the response of the instrument to the red and
green LEDs? Is this consistent with your findings in part A and B?
Which LED produces the more sensitive detector response?
D. Absorption Measurements:
Prepare a series of 5 solutions (at least 25 mL of each) containing either Ni2+, Co2+, or Cu2+ in
concentrations ranging from 20 to 500 mM. Be as accurate as possible when preparing these
solutions.. Fill plastic cuvets with each solution and with an unknown solution. Select the best
LED and transducer for the solution you choose.(Remember that a solution�s color tells us

Water and Wastewater Analysis Laboratory Manual For Environmental Health Science Students
University of Gondar Collage of Medicine and Health Science 25
about the wavelength of transmitted and absorbed light.) For each solution and for a blank
(deionizer water), measure Vout at least 3 times. To examine the effect of stray light, also
measure Vout for each solution with the lid of the spectrophotometer partially open.
What effect does stray light have on the absorption measurements?
1.10. Questions
1. How the value of research effort is depend on validity of laboratory results?
2. Write at least four basic considerations to minimize the risk in the laboratory?
3. Prepare a checklist which is important to safe guard laboratory work?
4. Write at least seven safety rules?
5. Write the elements of quality control of laboratory work?
6. Define quality assurances?
7. During base standardization, what is the purpose of KHP (potassium Hydrogen
Phthalate)?
8. What is the difference between primary standard and secondary standard
chemicals?

Water and Wastewater Analysis Laboratory Manual For Environmental Health Science Students
University of Gondar Collage of Medicine and Health Science 26
CHAPTER TWO
2. BACTERIOLOGICAL ANALYSIS
2.1. Objectives
At the end of this chapter, students will be able to:
-Identify the correct procedures of membrane filter and multiple fermentation tube
technique.
-Describe the essential agars and nutrient broth
-Identify indicator organisms from water and wastewater analysis
-Describe and understand important laboratory equipments and materials
2.2 Introduction
Bacteriological analysis enables us to determine the degree of contamination of water with
wastes of human or animal origin, and hence it can provide us with an important clue as to
the potability of the water from the bacteriological point of view. The microbiological
examination of drinking water emphasizes assessment of the hygienic quality of the supply.
This requires the isolation and enumeration of organisms that indicate the presence of fecal
contamination. In certain circumstances, the same indicator organisms may also be used to
asses the efficiency of drinking water treatment plants, which is an important element of
quality control .
2.3. Membrane filters technique:
This Method describes a membrane filter (MF) procedure for the detection and enumeration
of total coliform, fecal coliform (Escherichia coli) and enterococci bacteria in ambient water.
E. coli as well as enterococci bacteria is a common inhabitant of the intestinal tract of
warm-blooded animals, and its presence in water samples is an indication of fecal pollution
and the possible presence of enteric pathogens.

Water and Wastewater Analysis Laboratory Manual For Environmental Health Science Students
University of Gondar Collage of Medicine and Health Science 27
The membrane filter method gives a direct count of total coliforms and fecal coliforms
present in a given sample of water. A measured volume of water is filtered, under vacuum,
through a cellulose acetate membrane of uniform pore diameter, usually 0.45 µm. Bacteria
are retained on the surface of the membrane which is placed on a suitable selective
medium in a sterile container and incubated at an appropriate temperature. If coliforms
and/or fecal coliforms are present in the water sample, characteristic colonies form that can
be counted directly.
Membrane filtration and colony count techniques assume that each bacterium, clump of
bacteria, or particle with bacteria attached, will give rise to a single visible colony. Each of
these clumps or particles is therefore, a colony-forming unit (cfu) and the results are
expressed as colony forming units per unit volume. In the case of thermotolerant coliform
bacteria the result should be reported as thermotolerant coliforms (No :) cfu per 100 ml.
2.3.1. Standard Total coli form membranes filter procedures:
I. Laboratory apparatus
For MF analysis use glassware and other apparatus composed of material free from
agents that may affect bacterial growth. Sterilize glassware as described in washing and
sterilization section.
a) Sample bottles:
For bacteriological samples, used sterilizable bottles of glass or plastic of any suitable size
and shape. Use bottles capable of holding a sufficient volume of sample for all required
tests and an adequate air space, permitting proper washing, and maintaining samples
uncontaminated until examinations are completed
b) Dilution bottle or tubes:
Use bottles or tubes of resistant glass, preferably Borosilicate glass, closed with glass
stoppers or screw caps equipped with liners that do not produce toxic or bacteriostatic
compounds on sterilization. Do not use cotton plugs as closures. Mark graduation levels
indelibly on side of dilution bottle or tube.

Water and Wastewater Analysis Laboratory Manual For Environmental Health Science Students
University of Gondar Collage of Medicine and Health Science 28
c) Pipettes and graduated cylinders
Before sterilization, loosely cover opening of graduated cylinders with metal foil or a suitable
heavy wrapping-paper substitute. Immediately after sterilization secure cover to prevent
contamination.
d) Containers for culture medium:
Use clean borosilicate glass flasks pre-sterilized to reduce bacterial contamination. Any size
or shape of flask may be used, but Erlenmeyer flasks with metal caps, metal foil covers, or
screw caps provided for adequate mixing of the medium contained and are convenient for
storage.
e) Culture dishes:
use sterile borosilicate glass or disposable, pre-sterilized plastic Petri dishes, 60 x 15 mm,
50 x 9mm, or other appropriate size. Wrap convenient numbers of clean, glass culture
dishes in metal foil if sterilized by dry heat, or suitable heavy wrapping paper when
autoclaved.
f) Filtration units:
The filter-holding assembly (constructed of glass, autoclavable plastic, porcelain, or
stainless steel) consists of a seamless funnel fastened to a base by a locking device or held
in place by magnetic force.
g) Membrane filters:
Use membrane filters with a rated pore diameter such that there is complete retention of
coliform bacteria. Use membrane grid�marked in such a manner that bacterial growth is
neither inhibited nor stimulated along the grid lines when the membranes with entrapped
bacteria are incubated on a suitable medium. Preferably, use fresh stocks of membrane
filters and if necessary store them in an environment without extremes of temperatures and
humidity. Obtain no more than a year�s supply at any one time.
Preferably, neither use pre-sterilized membrane filters for which the manufacturer has
certified that the sterilization technique has neither induced toxicity nor alter the chemical or
physical properties of the membrane. If membranes are sterilized in the laboratory,

Water and Wastewater Analysis Laboratory Manual For Environmental Health Science Students
University of Gondar Collage of Medicine and Health Science 29
autoclave for 10min at 121OC. At the end of the sterilization period, let the steam escape
rapidly to minimize accumulation of water of condensation on filters.
h) Absorbent pads:
It consists of disks of filter papers or other material certified for each lot by the manufacturer
to be of high quality and free of sulfites or other substances of a concentration that could
inhibit bacterial growth. Use pads approximately 48mm in diameter and of sufficient
thickness to absorb 1.8 to 2.2-mL of medium. Dry pads so they are free of visible moisture
before use.
Smooth-tipped, without corrugations on the inner sides of the tips. Sterilize before use by
dipping in 95% ethyl or absolute methyl alcohol and flaming.
j) Incubators:
Use incubators to provide a temperature of 35 + 0.5OC and to maintain a humid
environment (60% relative humidity).
k) Microscope and light source:
To determine colony counts on membrane filters. Use a magnification of 10 to 15 diameters
and a cool white fluorescent light source adjusted to give maximum sheen discerning
coliforms colonies on Endo-type media.
II. Materials and culture media:
a) LES Endo agar:
Yeast extract--------------------------------------------------1.2g
Casitone or trypitcase ---------------------------------------3.7g
Thiopeptone or thiotone------------------------------------3.7g
Tryptose--------------------------------------------------------7.5g
Lactose-----------------------------------------------------------9.4g
Dipotassium hydrogen phosphate, K2HPO4--------------3.3g
Potassium dihydrogen phosphate,KH2PO4---------------1.0g
Sodium chloride, NaCl-------------------------------------- 3.7g

Water and Wastewater Analysis Laboratory Manual For Environmental Health Science Students
University of Gondar Collage of Medicine and Health Science 30
Sodium desoxycholate----------------------------------------0.1g
Sodium lauryl sulfate-----------------------------------------0.05g
Sodium sulfite, Na2SO3----------------------------------------1.6g
Basic fuchsin---------------------------------------------------15.0g
Reagent-grade water-------------------------------------------- 1 L
Re-hydrated in 1L water containing 20mL 95% ethanol. Do not use denatured ethanol,
which reduce background growth and coliform colony size. Bring to a near boil to dissolve
agar, then promptly remove from heat and cool to 45 to 50OC. Do not sterilize by
autoclaving.
Final pH 7.2 + 0.2. Dispense in 5 to 7mL quantities into lower section of 60mm glass or
plastic Petri dishes. If dishes of any other size are used, adjust quantity to give an
equivalent depth. Do not expose plates to direct sunlight: store in the dark at 4 to 8OC,
preferably in sealed plastic bags or other containers to reduce moisture loss. Discard
unused medium after 3 weeks or sooner if there is evidence of moisture loss or medium
contamination (darkening of the medium).
b) M-Endo medium:
Tryptose or polypeptone------------------------------------------10.0g
Thiopeptone or thiotone-------------------------------------------5.0g
Casitone or trypitcase----------------------------------------------- 5.0g
Yeast extract-----------------------------------------------------------1.5g
Lactose-----------------------------------------------------------------12.5g
Sodium chloride, NaCl------------------------------------------------5.0g
Dipotassium hydrogen phosphate, K2HPO4----------------------4.375g
Potassium dihydrogen phosphate,KH2PO4------------------------1.375g
Sodium lauryl sulfate--------------------------------------------------0.05g
Sodium desoxycholate-------------------------------------------------0.10g
Sodium sulfite, Na2SO3------------------------------------------------2.10g
Basic fuchsin-------------------------------------------------------------1.05g
Agar (optional) ----------------------------------------------------------5.0g
Reagent-grade water-----------------------------------------------------1 L

Water and Wastewater Analysis Laboratory Manual For Environmental Health Science Students
University of Gondar Collage of Medicine and Health Science 31
o Agar preparation: Re-hydrate in 1L water containing 20mL 95% ethanol. Heat to
near boiling to dissolve agar, then promptly remove from heat and cool to between 45
and 50OC. Dispense 5- to 7ml quantities into 60mm sterile glass or plastic Petri dish.
If dishes of any other size are used, adjust quantity to give an equivalent depth. Do
not sterilize by autoclaving. Final pH should be 7.0 + 0.2. A precipitate is normal in
Endo-type media. Store finished medium in the dark at 4 to 8OC and discard unused
agar after 2 weeks.
o Broth preparation: Prepare as above, omitting agar. Dispense liquid medium (1.8 to
2.2 ml per plate) onto absorbent pads. Broth may be stored at 4OC for up to 4 day.
c) Buffered dilution rinse water:
i) Buffered water:
To prepare stock phosphate buffer solution dissolve 34.0g potassium dihydrogen
phosphate (KH2PO4), in 500mL reagent-grade water, adjusted pH 7.2 + 0.5 with 1N
NaOH, and dilute to 1L with reagent-grade water.
Add 1.25mL stock phosphate buffer solution and 5.0mL magnesium chloride solution
(81.1g MgCl2.2H2O/L reagent-grade water) to 1L reagent-grade water. Dispense in
amounts that will provide 99 + 0.2mL or 9 + 0.2mL after autoclaving for 15min. Do not
suspend bacteria in any dilution water for more than 30min at room temperature because
death or multiplication may occur.
ii) Peptone water:
Prepare a 10% solution of peptone in distilled water. Dilute a measure volume to provide a
final 0.1% solution. Final pH should be 6.8. Dispense in amounts to provide 99 + 0.2mL or 9
+ 0.2mL after autoclaving for 15min. Do not suspend bacteria in any dilution water for more
than 30min at room temperature because death or multiplication may occur.

Water and Wastewater Analysis Laboratory Manual For Environmental Health Science Students
University of Gondar Collage of Medicine and Health Science 32
III .Samples:
a. Containers: - collect samples for microbiological examination in bottles that have been
cleansed and rinsed carefully, given a final rinse with distilled water, and sterilized. For
some applications sample may be collected in pre-sterilized bags.
b. Dechlorination: add a reducing agent to containers intended for the collection of water
having residual chlorine or other halogen unless they contain broth for direct planting of
sample. Sodium thiosulfate (Na2S2O3) is the satisfactory Dechlorinating agent that
neutralizes any residual halogens and prevents continuation of bactericidal action during
sample transit. The examination then will indicate more accurately the true microbial content
of the water at the time of sampling.
For sampling chlorinated wastewater effluents add sufficient Na2S2O3 to a clean sample
bottle to give a concentration of 100mg/L in the sample. In a 120-mL bottle 0.1mL of a 10%
solution of Na2S2O3 will neutralize a sample containing about 15,g/L residual chlorine. For
drinking water samples, the concentration of dechlorinating agent may be reduced: 0.1mL of
a 3% solution of Na2S2O3 in a 120-mL bottle will give a final concentration of 18mg/L in the
sample and will neutralize up to 5mg/L residual chlorine. In emergency disinfection with
higher concentrations of chlorine and sufficient dechlorination agent to give a concentration
of 100 mg/L in the sample. Cap bottle and sterilize by either dry or moist heat, as directed
sterilization procedure. Pre-sterilized plastic bags containing Na2S2O3 are available
commercially.
IV. Procedures:
a) Selection of sample size: size of sample will be governed by
expected bacterial density. In drinking water analysis, sample size
will be limited only by the degree of turbidity or by the noncoliform
growth on the medium. For regulation purposes, 100mL is the
official sample size.

Water and Wastewater Analysis Laboratory Manual For Environmental Health Science Students
University of Gondar Collage of Medicine and Health Science 33
Table 2.1 suggested sample volumes for membrane filter total coliform test
Volume (x) to be filtered in mL Water source
100 50 10 11 0.11,2 0.011,2 0.0011,2
Drinking water X
Swimming pool X
Wells, springs X X X
Lakes, reservoirs X X X
Water supply intake X X X
Bathing beaches X X X
River water X X X X
Chlorinated sewage X X X
Raw sewage X X X
Source; standard methods for water and wastewater APHA 19th edition 1995
1 small volume should be added to the filtration apparatus together with a minimum of 9ml of
sterile diluents to ensure adequate dispersal across the surface of the filter membrane. 2 1.0, 0.1, 0.01, and 0.001-ml volumes are filtered after first preparing serial dilutions of the
sample to filter:
1.0-ml of sample, use 10-ml of 1/10 dilution
0.1-ml of sample, use 10-ml of 1/100 dilution
0.01-ml of sample, use 10-ml of 1/1,000 dilution
0.001-ml of sample, use 10-ml of 1/10,000 dilution
b) Sterile filtration units: use sterile filtration units at the beginning of each filtration
series as a minimum precaution to avoid accidental contamination.
c) Filtration of sample: using sterile forceps, place a sterile membrane filter (grid side up)
over porous plate of receptacle. Carefully place matched funnel unit over receptacle and
lock it in place. Filter sample under partial vacuum. With filter still in place, rinse the interior
surface of the funnel by filtering three 20- to 30-mL portion of sterile dilution water.

Water and Wastewater Analysis Laboratory Manual For Environmental Health Science Students
University of Gondar Collage of Medicine and Health Science 34
Alternatively, rinse funnel by a flow of sterile dilution water from a squeeze bottle and its
contents do not become contaminated during use.
d) Alternative single-step direct technique: If the agar-based medium is used, place
prepared filter directly on agar as described in preceding section, invert dish, and incubate
for 22 to 24hours at 35 + 0.5OC. Differentiation of some colonies from either agar or liquid
medium substrates may be lost if cultures are incubated beyond 24 hours.
e) Counting: To determine colony counts on membrane filters, use a low-power (10 to 15
magnifications) binocular wide-field dissecting microscope or other optical device, with a
cool white fluorescent light source directed to provide optimal viewing of sheen.
The typical coliform colony has a pink to dark-red color with a metallic surface sheen. The
sheen area may vary in size from a small pinhead to complete coverage of the colony
surface.
Samples of disinfected water or wastewater effluent may include stressed organisms that
grow relatively slowly and produce maximum sheen in 22 to 24h. Organisms from
undisinfected sources may produce sheen at 16 to 18h, and sheen subsequently may fade
after 24 to 30h.
f. Calculation of coliform density:
Compute the count, using membrane filters with 20 to 80 coliforms colonies and not more
than 200 colonies of all types per membrane, by the following equation:
(Total) coliform colonies /100mL = Coliform colonies counted X 100
mL. sample filtered
Example: water of other than drinking water quality as with potable water samples, if no
filter has a coliform count falling in the ideal range, total the coliform counts on fall filters
and report as number per 100mL. For example if duplicate 50-mL portions were examined
and the two membranes had five and three coliform colonies, respectively, report the
count as eight coliform colonies per 100mL.

Water and Wastewater Analysis Laboratory Manual For Environmental Health Science Students
University of Gondar Collage of Medicine and Health Science 35
(i.e. (5+3) x100
(50+50)
Similarly, if 50ml,25ml,and 10ml portions were examined and the counts were 15,6, and <1
coliform colonies, respectively, report the count as 25/100mL.
i.e. (15+6+0) x100)
( 50+25+10)
2.3.2 Fecal coli form membrane filters procedure using M-FC medium:
The fecal coliform MF procedure uses an enriched lactose medium and incubation
temperature of 44.5 + 0.2OC for selectivity and gives 93% accuracy in differentiating
between coliforms found in the feces of warm-blooded animals and those from other
environmental sources. Because incubation temperature is critical, submerge waterproofed
(plastic bag enclosure) MF cultures in a water bath for incubation at the elevated
temperature or use an appropriate, accurate solid heat sink incubator. Alternatively, use an
equivalent incubator that will hold the 44.5 + 0.2OC temperature (throughout chamber), over
a 24-h period.
I. Laboratory Apparatus
See section 3.2.1 (I)
II. Materials and culture medium:
a. M-FC medium:
Tryptose or biosate-----------------------------------------10.0g
Proteose No. 3 or polypeptone ----------------------------5.0g
Yeast extract-------------------------------------------------3.0g
Sodium chloride, NaCl -------------------------------------5.0g
Lactose- ------------------------------------------------------12.5g
Bile salts No. 3 or bile salts mixture----------------------1.5g
Aniline blue----------------------------------------------------0.1g
Agar (optional) ----------------------------------------------15.0g
Reagent-grade water----------------------------------------1 L

Water and Wastewater Analysis Laboratory Manual For Environmental Health Science Students
University of Gondar Collage of Medicine and Health Science 36
Re-hydrate dehydrate medium in 1L water containing 10mL 1% rosolic acid in 0.1NNaOH.
Heat to near boiling, promptly remove from heat, and cool to below 50OC. Do not sterilize by
autoclaving. If agar is used, dispense 5- to 7-mL quantities to 50- x 12-mm Petri plates and
let solidify. Final pH should be 7.4 + 0.2. Store finished medium at 4 to 8OC, preferably in
sealed plastic bags or other containers to reduce moisture loss, and discard unused broth
after 96h or unused agar after 2weeks.For most samples M-FC medium may be used
without the 1% rosolic acid solution, provided there is no interference with background
growth. Such interference may be expected in storm water samples collected during the first
runoff (initial flushing) after a long dry period.
b) Culture dishes:
Tight-fitting plastic dishes are preferred because the membrane filter cultures are
submerged in a water bath during incubation. Place fecal coliform cultures in plastic bags or
seal individual dishes with waterproof (freezer) tape to prevent leakage during submersion.
c) Incubator:
The specificity of the fecal coliform test is related directly to the incubation temperature.. To
meet the need for greater temperature control use a water bath, a heat-set incubator, or a
properly designed and constructed incubator giving equivalent results. A temperature
Tolerance of 44.5 + 0.2OC can be obtained with most types of water baths that also are
equipped with a gable top for the reduction of water and heat losses.
III. Sampling
See section 2.3.1 (III)
IV. Procedure:
a) Selection of sample size:
Select volume of water sample to be examined in accordance with the information in Table-
2. Use sample volumes that will yield counts between 20 and 60 fecal coliform colonies per
membrane. When the bacterial density of the sample is unknown, filter several volumes or
dilutions to achieve a countable density.
\

Water and Wastewater Analysis Laboratory Manual For Environmental Health Science Students
University of Gondar Collage of Medicine and Health Science 37
Table 2.2 Saggested sample volumes for membrane filter fecal coliform test
Volume (x) to be filtered in mL Water source
100 50 10 1 0.1 0.01 0.001
Lakes, reservoirs X X
Wells, springs X X
Water supply intake X X X X
Natural bathing waters X X X X
Sewage treatment plant, 2O effluent X X X
Farm ponds, rivers X X X
Storm water runoff X X X
Raw municipal sewage X X X X
Feedlot runoff X X X
Source; standard methods for water and wastewater APHA 19th edition 1995
b) Filtration of sample:
Follow the same procedure and precautions as prescribed under total coliform section2.3.1 (
IVc) above.
c) Preparation of culture dish:
Place a sterile absorbent pad in each culture dish and pipette 1.8 to 2.0mL M-FC medium,
prepared as directed above, to saturate pad. Carefully remove any excess liquid from
culture dish.
As a substrate substitution for the nutrient-saturated absorbent pad, add 1.5% agar to M-
FC broth.
d) Incubation:
Place prepared cultures in water proof plastic bags or seal, invert, and submerge Petri
dishes in water bath, and incubate for 24 + 2h at 44.5 + 0.2OC . Anchor dishes below water
surface to maintain critical temperature requirements. Place all prepared cultures in the

Water and Wastewater Analysis Laboratory Manual For Environmental Health Science Students
University of Gondar Collage of Medicine and Health Science 38
water bath within 30min after filtration. Alternatively, use an appropriate, accurate solid heat
sink or equivalent incubator.
e) Counting:
colonies produced by fecal coliform bacteria on M-FC medium are elevating the
temperature various shades of blue. Nonfecal coliform colonies are gray to cream-colored.
Normally, few nonfecal coliform colonies will be observed on M-FC medium because of
selective action of the elevated temperature and addition of rosolic acid salt reagent.
Elevated the temperature to 44.5 + 0.2OC may be useful in eliminating environmental
Klebsiella strains from the fecal coliform population. Count colonies with a low-power (10 to
15 magnifications) binocular wide-field desiccating microscope or other optical device.
f.. Calculation of fecal coliform density:
Compute the density from the sample quantities that produced MF counts within the desired
range of 20 to 60 fecal coliform colonies. This colony density range is more restrictive than
the 20 to 80 total coliform ranges because of larger colony size on M-FC medium. Calculate
fecal coliform density by the following equation:
Fecal coliform colonies /100mL = Fecal Coliform colonies counted X 100
mL. sample filtered
2.3.3. Fecal coliform Membrane filter procedure using Membrane laurel
sulfate broth
Membrane filtration is a method of obtaining fecal coliform counts by filtering a known
volume of a wastewater sample (or a dilution of it) though a membrane filter. This is a
special filter-paper with a pore size of 0.45 µm, so that all fecal coliform bacteria are
retained on it. The membrane filter is then placed on an absorbent pad saturated with a
fecal coliform growth medium and incubated. During incubation, each fecal coliform
bacterium develops into a visible yellow colony. After incubation, the yellow colonies are
counted, and the count per 100 ml is calculated.
I. Apparatus

Water and Wastewater Analysis Laboratory Manual For Environmental Health Science Students
University of Gondar Collage of Medicine and Health Science 39
See section 2.3.1.(I)
II. Materials and culture medium
a) Culture medium:
These comprise the following:
- Membrane filters (0.45 µm pore size, 47 mm diameter)
- Absorbent pads (47 mm diameter)
- Membrane lauryl sulfate broth
- Quarter-strength Ringer�s solution
- Ethanol.
Membrane lauryl sulfate broth is available commercially in dehydrated form. Alternatively, it
may be made up in accordance with the following formula:
Peptone----------------------------------------------------------------------------- 40 g
Yeast extracts ------------------------------------------------------------------------6 g
Lactose -------------------------------------------------------------------------------30 g
Phenol red (4 g/l aqueous solution) ----------------------------------------------50 ml
Sodium lauryl sulfate ----------------------------------------------------------------1 g
Distilled water (pH 7.6 before sterilization) --------------------------------------1 liter
Quarter-strength Ringer�s solution is also available commercially in tablet form; alternatively,
sodium chloride solution (8.5 g NaCl in 1 liter of distilled water) may be used.
b)Equipment
The following are required:
- Membrane filter forceps
- Petri dishes (60-mm diameter glass or disposable plastic)
- Membrane filtration units (glass or plastic)
- 5-ml or 10-ml and 1-ml serological �blow-out� pipettes
- pipette suction pump
- Vacuum pump (electrical, manual or water Venturi pump)
- Bunsen burner, - Incubator, - Autoclave or pressure cooker, - Balance (± 0.01 g).
III. Sampling
See section 2.3.1 (III).
IV. Procedures:

Water and Wastewater Analysis Laboratory Manual For Environmental Health Science Students
University of Gondar Collage of Medicine and Health Science 40
The following procedure is suitable for wastewater samples containing 200-2000 fecal
coliforms per 100 ml. For samples containing more than 2000 per 100 ml, see step 11
below. Aseptic procedures should be used throughout.
1. Collect a sample of wastewater in a sterile 100-ml screw-capped bottle.
2. Dip the membrane filter forceps in ethanol, and burn off in the flame of the Bunsen
burner.
Using the now sterile forceps, transfer a sterile absorbent pad to each of three sterile Petri
dishes.
3. Using a sterile 5-ml or 10-ml pipette, aseptically add 1.8 ml of sterile membrane lauryl
sulfate broth to each of the three Petri dishes, so as to just saturate (but not flood) each
absorbent pad (Fig. 2.1).
Fig 2.1. Adding 1.8 ml of sterile membrane lauryl sulfate broth to a Petri dish containing a sterile absorbent pad.
Fig.2.2. Placing a sterile membrane filter on the membrane filtration unit.
4. Dip the membrane filter forceps in ethanol and burn off in the Bunsen flame. Aseptically
place sterile membrane filter in the membrane filtration unit (Fig2.3).
5. Pour in about 20 ml of sterile quarter-strength Ringer�s solution (Fig.2.3), and then add 5
mL of the wastewater sample to the membrane filtration unit using a sterile pipette (Fig.2. 4).

Water and Wastewater Analysis Laboratory Manual For Environmental Health Science Students
University of Gondar Collage of Medicine and Health Science 41
Fig2.3. Pouring about 20 ml of diluents into the membrane filtration unit.
Fig.2.4. Adding 5 ml of sample to the membrane filtration unit.
Fig.2.5. Using a manual vacuum pump to filter the sample through the membrane filter.
Fig.2.6. With a rolling action, placing the membrane filter on an absorbent pad saturated with membrane lauryl sulfate broth.
6. Turn on the vacuum pump and, when all the liquid has been filtered through the
membrane filter, switch off; a manual vacuum pump can also be used (Fig.2.5).
7. Aseptically transfer the membrane filter to a sterile Petri dish containing an absorbent pad
just saturated with sterile membrane lauryl sulfate broth. It is best to do this by a rolling
action, so as to avoid air bubbles between the membrane filter and the absorbent pad
(Fig.6).
8. Repeat steps 4-7 twice.
9. Place all three Petri dishes upside down in an incubator maintained at 44°C (± 0.5°C).

Water and Wastewater Analysis Laboratory Manual For Environmental Health Science Students
University of Gondar Collage of Medicine and Health Science 42
10. After incubation for 24 h, count the number of yellow colonies, irrespective of size, on
each of the three membrane filters (Fig.7). (Fecal coliform bacteria produce acid from the
lactose in membrane lauryl sulfate broth, and the acid changes the colour of the phenol
red pH-indicator to yellow.) Calculate the mean of these three colony counts; since these
counts are for 5 mL (the volume of sample filtered), multiply this figure by 20 to obtain
the faecal coliform count per 100 ml.
Fig.2.7. After incubation at 44°C for 24 h, the yellow colonies on the membrane filter are counted.
Here, the number of colonies was 40; this is the count per 5 ml (the volume filtered), so the
corresponding faecal coliform count per 100 ml is 800.
11. Filter smaller volumes of the sample (or dilutions of it) if each membrane filters has more
than 100 colonies growing on it, since it then becomes difficult to count them. Thus 1 ml
of the sample can be used for fecal coliform counts of up to 10 000 per 100 ml, 1 ml of a
1:10 dilution for counts up to 100 000 per 100 ml, and so on.

Water and Wastewater Analysis Laboratory Manual For Environmental Health Science Students
University of Gondar Collage of Medicine and Health Science 43
2.3.4. Membrane Filter Method for E. coli
This method describes a membrane filter (MF) procedure for the detection and enumeration
of Escherichia coli (E. coli). Because the bacterium is a natural inhabitant only of the
intestinal tract of warm-blooded animals, its presence in water samples is an indication of
fecal pollution and the possible presence of enteric pathogens.
The MF method provides a direct count of bacteria in water based on the development of
colonies on the surface of the membrane filter . A water sample is filtered through the
membrane which retains the bacteria. After filtration, the membrane containing the bacterial
cells is placed on a selective and differential medium, M-TEC, incubated at 44.5OC for 22 h.
Following incubation, the filter is transferred to a filter pad saturated with urea substrate.
After 15 min, yellow or yellow-brown colonies are counted with the aid of a fluorescent lamp
and a magnifying lens.
In this method, E. coli are those bacteria which produce yellow or yellow brown colonies on
a filter pad saturated with urea substrate broth after primary culturing on M-TEC medium.
Interferences - Water samples containing colloidal or suspended particulate material can
clog the membrane filter and prevent filtration, or cause spreading of bacterial colonies
which could interfere with identification of target colonies.
I. Apparatus
1. Glass lens, 2-5X magnification, or stereoscopic microscope.
2. Lamp with cool, white fluorescent tube and diffuser.
3. Hand tally or electronic counting device.
4. Pipette container, stainless steel, aluminum, or borosilicate glass, for glass pipettes.
5. Pipettes, sterile, T.D. bacteriological or Mohr, glass or plastic, of appropriate volume.
6. Graduated cylinders, covered with aluminum foil or Kraft paper and sterile.
7. Membrane filtration units (filter base and funnel), glass, plastic or stainless steel, wrapped
with aluminum foil or Kraft paper and sterile.
8. Ultraviolet unit for sterilizing the filter funnel between filtrations (optional).
9. Line vacuum, electric vacuum pump, or aspirator for use as a vacuum source.
In an emergency, or in the field, a hand pump, or a syringe equipped with a check valve
to prevent the return flow of air, can be used.

Water and Wastewater Analysis Laboratory Manual For Environmental Health Science Students
University of Gondar Collage of Medicine and Health Science 44
10. Flask, filter vacuum, usually 1 L, with appropriate tubing. A filter manifold to hold a
number of filter bases is optional.
11. Flask for safety trap, placed between the filter flask and the vacuum source.
12 . Forceps, straight or curved, with smooth tips to handle filters without damage.
13. Ethanol, methanol or isopropanol in a small, wide-mouth container, for flame sterilizing
forceps.
14. Burner, Bunsen or Fisher type, or electric incinerator unit for sterilizing inoculation loops.
15 .Thermometer, checked against a National Institute of Science & Technology (NIST)
certified thermometer or one traceable to an NIST thermometer.
16. Petri dishes, sterile, plastic, 50 × 12 mm, with tight-fitting lids, or 60 × 15 mm, glass or
plastic, with loose-fitting lids. 100 × 15 mm dishes may also be used.
17. Bottles, milk dilution, borosilicate glass, screw-cap with neoprene liners, marked at 99
mL for 1-100 dilutions. Dilution bottles marked at 90 mL, or tubes marked at 9 mL may be
used for 1-10 dilutions.
18. Flasks, borosilicate glass, screw-cap, 250-2000 mL volume.
19. Membrane filters, sterile, white grid marked, 47 mm diameter, with 0.45 ± 0.02 µm pore
size.
20. Absorbent pads, sterile, 47 mm diameter (usually supplied with membrane filters).
21. Inoculation loops, at least 3 mm diameter, and needles, nichrome and platinum wire, 26
B & S gauge, in suitable holders. Disposable applicator sticks or plastic loops are
alternatives to inoculation loops. Note: A platinum loop is required for the cytochrome
oxidase test.
22. Incubator maintained at 35 ± 0.5OC, with approximately 90 percent humidity if loose-
lidded Petri dishes are used.
23. Water bath incubator maintained at 44.5 ± 0.2OC.
24. Water bath maintained at 44-46OC for tempering agar.
25. Test tubes, 150 × 20 mm, borosilicate glass or plastic.
26. Test tubes, 75 × 10 mm, borosilicate glass.
27. Test tube caps, aluminum or autoclavable plastic, for 20 mm diameter test tubes.
28 Test tubes, screw-cap, 125 × 16 mm or other appropriate size.
29. Filter paper.
Water and Wastewater Analysis Laboratory Manual For Environmental Health Science Students
University of Gondar Collage of Medicine and Health Science 45
II. Materials and Reagents
a. Buffered Dilution Water
1. Composition:
Sodium Dihydrogen Phosphate---------------------------- 0.58 g
Sodium Monohydrogen Phosphate------------------------- 2.50 g
Sodium Chloride ----------------------------------------------8.50 g
2. Preparation: Dissolve the ingredients in 1 L of reagent water in a flask and dispense in
appropriate amounts for dilutions in screw-cap bottles or culture tubes, and/or into
containers for use as rinse water. Autoclave after preparation at 121OC (15 lb pressure) for
15 min. Final pH should be 7.4 ± 0.2.
b. M-TEC Agar (Difco 0334-15-0)
1. Composition:
Proteose Peptone #3 ----------------------------------------5.0 g
Yeast Extract ------------------------------------------------3.0 g
Lactose ------------------------------------------------------10.0 g
NaCl ---------------------------------------------------------7.5 g
Dipotassium Phosphate ------------------------------------3.3 g
Monopotassium Phosphate --------------------------------1.0 g
Sodium Lauryl Sulfate -------------------------------------0.2 g
Sodium Desoxycholate ------------------------------------0.1 g
Brom Cresol Purple ----------------------------------------0.08 g
Brom Phenol Red -------------------------------------------0.08 g
Agar -----------------------------------------------------------15.0 g
2. Preparation: Add 45.26 g of M-TEC medium to 1 L of reagent water in a flask and heat
to boiling, until ingredients dissolve. Autoclave at 121OC (15 lb pressure) for 15 min. and
cool in a 44-46OC water bath. Pour the medium into each 50 × 10 mm culture dish to a
4-5 mm depth (approximately 4-6-mL) and allow solidifying. Final pH should be 7.3 ±
0.2.Store in a refrigerator.
c. Urea Substrate Medium
1. Composition:

Water and Wastewater Analysis Laboratory Manual For Environmental Health Science Students
University of Gondar Collage of Medicine and Health Science 46
Urea ----------------------------------------------------------------2.0 g
Phenol red --------------------------------------------------------0.01 g
2. Preparation: Add dry ingredients to 100 mL reagent water in a flask. Stir
to dissolve and adjust to pH 5.0 with a few drops of 1N HC1. The substrate
solution should be a straw-yellow color at this pH.
d. Nutrient Agar (Disco 0001-02, BBL 11471)
1. Composition:
Peptone -----------------------------------------------------------5.0 g
Beef Extract ----------------------------------------------------3.0 g
Agar------------------------------------------------------------- 15.0 g
2. Preparation: Add 23 g of nutrient agar ingredients to 1 L of reagent water and mix well.
Heat in boiling water bath to dissolve the agar completely. Dispense in screw-cap tubes,
bottles or flasks and autoclave at 121OC (15 lb pressure) for 15 min. Remove tubes and
slant. The final pH should be 6.8 ± 0.2.
e. EC Broth (Difco 0314-02) or EC Broth (BBL 12432)
1. Composition:
Tryptose or Trypticase Peptone ----------------------------------------20.0 g
Lactose ---------------------------------------------------------------------5.0 g
Bile Salts No. 3 or Bile Salts Mixture ---------------------------------1.5 g
Dipotassium Phosphate --------------------------------------------------4.0 g
Monopotassium Phosphate ----------------------------------------------1.5 g
Sodium Chloride ----------------------------------------------------------5.0 g
2. Preparation: Add 37 g of EC medium to 1 L of reagent water and warm to dissolve
completely. Dispense into fermentation tubes (150 × 20 mm tubes containing inverted 75 ×
10 mm vials). Sterilize at 121OC (15 lb pressure) for 15 min. The final pH should be 6.9 ±
0.2.

Water and Wastewater Analysis Laboratory Manual For Environmental Health Science Students
University of Gondar Collage of Medicine and Health Science 47
III. Sampling
See section 2.3.1 (III).
IV. Procedures
1. Prepare the M-TEC agar and urea substrate as directed in section 2. 3.4.II b & c.
2. Mark the Petri dishes and report forms with sample identification and sample volumes.
3. Place a sterile membrane filter on the filter base, grid-side up and attach the funnel to the
base; the membrane filter is now held between the funnel and the base.
4. Shake the sample bottle vigorously about 25 times to distribute the bacteria uniformly and
measure the desired volume of sample or dilution into the funnel.
5. For ambient surface waters and waste waters, select sample volumes based on previous
knowledge of pollution level, to produce 20-80 E. coli colonies on the membranes.
6. Smaller sample size or sample dilutions can be used to minimize the interference of
turbidity or high bacterial densities. Multiple volumes of the same sample dilution may
be filtered and the results combined.
7. Filter the sample and rinse the sides of the funnel at least twice with 20-30mL of sterile
rinse water. Turn off the vacuum and remove the funnel from the filter base.
8. Use sterile forceps to aseptically remove the membrane filter from the filter base and roll
it onto the M-TEC agar to avoid the formation of bubbles between the membrane and the
agar surface. Reseat the membrane, if bubbles occur. Close the dish, invert, and incubate
at 35OC for 2 h.
9. After 2 h incubation at 35 OC, transfer the plates to Whirl-Pak bags, seal, and place
inverted in a 44.5OC water bath for 22-24 h.
10. After 22-24 h, remove the dishes from the water-bath. Place absorbent pads in new
Petri dishes or the lids of the same Petri dishes, and saturate with urea broth. Aseptically
transfer the membranes to absorbent pads saturated with urea substrate and hold at room
temperature.

Water and Wastewater Analysis Laboratory Manual For Environmental Health Science Students
University of Gondar Collage of Medicine and Health Science 48
11. After 15-20 min. incubation on the urea substrate at room temperature, count and record
the number of yellow or yellow-brown colonies on those membrane filters ideally
containing 20-80 colonies.
12. Calculation of Results
Select the membrane filter with the number of colonies within the acceptable range (20-
80) and calculate the count per 100 mL according to the general formula:
E. coli/100 mL = No. E. coli Colonies Counted× 100 mL
Volume in mL of Sample Filtered
2.3.5. Membrane Filter Techniques for fecal streptococcus and enterococcus groups
I. Laboratory Apparatus (See Section 2. 3.1( I))
II. Materials and Culture Media
a. mE agar for enterococci
Peptone ---------------------------------- 10.0 g
Sodium chloride,NaCl -----------------15.0 g
Yeast extract ---------------------------- 30.0 g
Esculin ----------------------------------- 1.0 g
Actidione (cycloheximide)------------- 0.05 g
Sodium azide,NaN3-------------------- -0.15 g
Agar -------------------------------------- 15.0 g
Reagent grade water ------------------- 1 L
Heat to dissolve ingredients, sterilize, and cool in a water-bath at 44 to 460C. Mix 0.25 g
nalidixic acid in 5mL reagent-grade water, add a few drops of 0.1N Na OH to dissolve the
antibiotic, and add to the basal medium. Add 0.15g 2,3,5- triphenyle tetrazolium chloride
and mix well to dissolve. Pour the agar into 9-x50-mm Petri dishes to a depth of 4 to 5 mm
(approximately 4 to 6mL), and let solidify. The final pH should be 7.1 + 0.2. Store poured
plates in the dark at 2 to 100C .Discard after 30 days.(Note: this medium is recommended
for culturing enterococci in fresh and marine recreational waters.)

Water and Wastewater Analysis Laboratory Manual For Environmental Health Science Students
University of Gondar Collage of Medicine and Health Science 49
b. EIA substrate
Esculin---------------------------------1.0 g
Ferric citrate --------------------------0.5 g
Agar -----------------------------------15.0 g
Reagent-grade water ----------------- 1 L
The pH should be 7.1 + 0.2 before autoclaving. Heat to dissolve ingredients sterilize, and
cool in a water-bath at 44 to 460 pour medium in to 50-mm Petri dishes to a depth of 4 to
5mm (approximately 4 to 6mL ) and let solidify. Store poured plates in the dark at 2 to
100C. Discard after 30 days.
c. m Enterococcus agar for fecal streptococci
Tryptose ---------------------------------------- 20.0 g
Yeast extract ----------------------------------- 5.0 g
Glucose ---------------------------------------- 2.0 g
Dipotassium phosphate, K2HPO4---------- 4.0 G
Sodium azide, NaN3 --------------------------- 0.4 g
2,3,5-Triphenyl tetrazolium chloride ---------- 0.1 g
Agar ------------------------------------------------ 10.0 g
Reagent-grade water ------------------------------ 1 L
Heat to dissolve ingredients. Do not autoclave. Dispense in to 9- x 50-mm Petri plates to
a depth of 4 to 5mm (approximately 4 to 6mL) and let solidify. Prepare fresh medium for
each set of samples. (Note: This medium is recommended for Group D streptococci in
fresh and marine waters.)
d. Brain-heart infusion broth
Infusion of calf brain ----------------------------------- 200 g
Infusion of beef heart -----------------------------------250 g
Proteose peptone ---------------------------------------- 10 g
Glucose --------------------------------------------------- 2.0 g
Sodium chloride, NaCl --------------------------------- 5.0 g
Disodium hydrogen phosphate, Na2 HpO4 ------------ 2.5 g

Water and Wastewater Analysis Laboratory Manual For Environmental Health Science Students
University of Gondar Collage of Medicine and Health Science 50
Reagent-grade water ------------------------------- ------1 L
The pH should be 7.4 after sterilization.
e. Brain-heart infusion agar:
Add 15.0g agar to the ingredients for brain-heart infusion broth (part d). The pH should be
7.4 after sterilization.
f. Bile esculin agar
Beef extract -------------------------------------3.0 g
Peptone ----------------------------------------- 5.0 g
Oxgall ----------------------------------------- 40.0 g
Esculin ----------------------------------------- 1.0 g
Ferric citrate --------------------------------- 15.0 g
Agar ------------------------------------------ 15.0 g
Reagent-grade water ------------------------ 1 L
Heat to dissolve ingredients. Dispense 8 to 10mL in to tubes for slant or an appropriate
volume into a flask for subsequent pouring into plates. Autoclave at 1210C for15 min. Do
not overheat because this may cause darkening of the medium. Cool to 44 to 460C and
slant the tubes or dispense 15mL into 15-x100-mm Petri dishes. The final pH should be
6.6 + 0.2 after sterilization. Store at 4 to 100C.
III. Sampling
See section 2.3.1 (III).
IV. Procedures
a. mE Method
1) Selection of sample size and filtration- filter appropriate sample volumes through a
0.45-ìm, graded, sterile membrane to give 20 to 60 colonies on the membrane surface.
Transfer filter to agar medium in Petri dish avoiding air bubbles beneath the membrane.
2) incubation- inverts culture plates and incubates at 410C + 0.5oC for 48h
3) Substrate test- After 48 h incubation carefully transfer filter to EIA medium. Incubate at
410C+ 0.50C for 20 min.

Water and Wastewater Analysis Laboratory Manual For Environmental Health Science Students
University of Gondar Collage of Medicine and Health Science 51
4) Counting-pink to red enterococci colonies develops a black or reddish-brown precipitate
on the underside of the filter. Count colonies using a fluorescent lamp and a magnifying
lens
b. m Enterococcus method
1) Selection of sample size and filtration..
2) Incubation -Let plates stand for 30min, then inverts and incubates at 35 + 0.50Cfor 48 h.
3) Counting- count all light and dark red colonies as enteroccocci. Count colonies using a
fluorescent lamp and a magnifying lens.
4) Calculation of fecal streptococci or enteroccocci density .
Fecal streptococci or enterococci /100 ml = # of colonies counted x100

Water and Wastewater Analysis Laboratory Manual For Environmental Health Science Students
University of Gondar Collage of Medicine and Health Science 52
mL sample filtered
Fig.2.8. Steps in the Membrane filter technique: Starting from at the left top
a. Add absorbent pad to Petri dishb. Soak pad in nutrient mediumc. Disinfect tips of
blunt ended forceps and coold. Remove membrane filter from sterile packete. Place
membrane filter in filtration apparatusf. Add sample to filtration apparatusg. Apply
vacuum to sanction flaskh. remove filter with sterile forcepsi. place filter in prepared

Water and Wastewater Analysis Laboratory Manual For Environmental Health Science Students
University of Gondar Collage of Medicine and Health Science 53
Petri dishj. Label Petri dishk. Leave to resuscitate and then incubatel. count colonies
after full incubation.
2.4. Multiple Fermentation Tube Technique
This method describes multiple-tube fermentation procedures [also called the most probable
number (MPN) procedure] for the detection and enumeration of total coliform ,fecal coliform
& streptococcus�s and entrococcus bacteria in ambient water. These methods use culture-
specific media and elevated temperature to isolate and enumerate fecal coliform organisms.
Fecal coliform bacteria, including Escherichia coli (E. coli), are commonly found in the feces
of humans and other warm-blooded animals, and indicate the potential presence of other
bacterial and viral pathogens.
The technique has been used for the analysis of drinking-water and wastewater for many
years with satisfactory results. It is the only procedure that can be used if water samples are
very turbid or if semi-solids such as sediments or sludge�s are to be analyzed. The
procedure followed is fundamental to bacteriological analyzes and the test is used in many
countries. It is customary to report the results of the multiple tube tests for coliforms as a
most probable number (MPN) index. This is an index of the number of coliform bacteria that,
more probably than any other number, would give the results shown by the test. It is not a
count of the actual number of indicator bacteria present in the sample.
There are a number of variants to the multiple fermentation tube technique. The most
common procedure is to process five aliquots of water from each of three consecutive 10-
fold dilutions; for example, five aliquots of the sample itself, five of a 1/10 dilution of the
sample and five of a 1/100 dilution Aliquots may be 1-ml volumes, each added to 10 ml of
single-strength culture medium, or 10-ml volumes each added to 10ml of double-
strength medium. Results are compared with values such as those given in table 2.3.
The use of one of the following variants of the technique may help to reduce the cost of
analysis:

Water and Wastewater Analysis Laboratory Manual For Environmental Health Science Students
University of Gondar Collage of Medicine and Health Science 54
-A smaller number of tubes are incubated at each dilution, for example three instead of
five. A different table must then be used for the MPN determination (See Table 2.5 later).
Some precision is lost, but using 9 tubes instead of 15 saves materials, space in the
incubator, and the analyst�s time.
-For samples of drinking-water one tube with 50ml of sample and five tubes with 10ml of
sample are inoculated and incubated. The results are compared with the values such as
those given in table 2.6(see later) to obtain the MPN.
2.4.1. Standard Total Coliform Fermentation Technique
The standard test for the coliform group may be carried out either by the multiple-tube
fermentation technique (through the presumptive-confirmed phases or completed test), by
the membrane filter (MF) technique, or by the proposed chromogenic substrate coliform
test. Each technique is applicable within the limitations specified and with due consideration
of the purpose of the examination.
The precision of each test depends on the number of tubes used. The most satisfactory
information will be obtained when the largest sample inoculum�s shows no gas in all or a
majority of the tubes. Bacterial density can be estimated by the formula given or from the
table using the number of positive tubes in multiple dilutions.
I. Presumptive Phase
Use lauryl tryptose broth in the presumptive portion of the multiple-tube test. If the medium
has been refrigerated after sterilization, incubate overnight at room temperature (20ºC)
before use. Discard tubes showing growth and/or bubbles.

Water and Wastewater Analysis Laboratory Manual For Environmental Health Science Students
University of Gondar Collage of Medicine and Health Science 55
a. Reagents and culture medium:
Lauryl tryptose broth:
Tryptose........................................................... 20.0 g
Lactose............................................................ 5.0 g
Dipotassium hydrogen phosphate, K2HPO4......... 2.75 g
Potassium dihydrogen phosphate, KH2PO4......... 2.75 g
Sodium chloride, NaCl....................................... 5.0 g
Sodium lauryl sulfate......................................... 0.1 g
Reagent-grade water.......................................... 1 L
Add dehydrated ingredients to water, mix thoroughly, and heat to dissolve. pH should be 6.8
± 0.2 after sterilization. Before sterilization, dispense sufficient medium, in fermentation
tubes with an inverted vial, to cover inverted vial at least one-half to two-thirds after
sterilization. Alternatively, omit inverted vial and add 0.01 g/L bromcresol purple to
presumptive medium to determine acid production, the indicator of a positive result in this
part of the coliform test. Close tubes with metal or heat-resistant plastic caps.
Make lauryl tryptose broth of such strength that adding 100-mL, 20-mL, or 10-mL portions
of sample to medium will not reduce ingredient concentrations below those of the standard
medium. Prepare in accordance with Table 2.3.

Water and Wastewater Analysis Laboratory Manual For Environmental Health Science Students
University of Gondar Collage of Medicine and Health Science 56
Table 2.3 preparation of Lauryl Tryptose broth
Inoculum�s
mL
Amount of
Medium in Tube
mL
Volume of
Medium + Inoculum
mL
Dehydrated Lauryl
Tryptose Broth
Required
g/L
1 10 or more 11 or more 35.6
10 10 20 71.2
10 20 30 53.4
20 10 30 106.8
100 50 150 106.8
100 35 135 137.1
100 20 120 213.6
Source; standard methods for water and wastewater APHA 19th edition 1995
b. Procedure:
1) Arrange fermentation tubes in rows of five or ten tubes each in a test tube rack. The
number of rows and the sample volumes selected depend upon the quality and character of
the water to be examined. For potable water use five 20-mL portions, ten 10-mL portions, or
a single bottle of 100-mL portion; for non-potable water use five tubes per dilution (of 10, 1,
0.1-mL, etc.).
In making dilutions and measuring diluted sample volumes, follow the precautions and use
Figure 9 as a guide to preparing dilutions. Shake sample and dilutions vigorously about 25
times. Inoculate each tube in a set of five with replicate sample volumes (in increasing

Water and Wastewater Analysis Laboratory Manual For Environmental Health Science Students
University of Gondar Collage of Medicine and Health Science 57
decimal dilutions, if decimal quantities of the sample are used). Mix test portions in the
medium by gentle agitation.
2) Incubate inoculated tubes or bottles at 35 ± 0.5OC. After 24 ± 2 h swirl each tube or
bottle gently and examine if for growth, gas, and acidic reaction (shades of yellow color)
and, if no gas or acidic reaction is evident, re-incubate and reexamine at the end of 48 ± 3 h.
Record presence or absence of growth, gas, and acid production. If the inner vial is omitted,
growth with acidity signifies a positive presumptive reaction.
Note: Production of an acidic reaction or gas in the tubes or bottles within 48 ± 3 h
constitutes a positive presumptive reaction. Submit tubes with a positive presumptive
reaction to the confirmed phase (see section 2.4.1.II).
The absence of acidic reaction or gas formation at the end of 48 ± 3 h of incubation
constitutes a negative test (see fig.10). Submit drinking water samples demonstrating
growth without a positive gas or acid reaction to the confirmed phase. An arbitrary 48-h limit
for observation doubtless excludes occasional members of the coliform group that grow very
slowly.
Source; Basic environmental technology, Nathanson, 3rd ed. 2000.
Fig.2.9. Preparation of dilutions

Water and Wastewater Analysis Laboratory Manual For Environmental Health Science Students
University of Gondar Collage of Medicine and Health Science 58
Fig.2.10. a positive test in a fermentation tube (a trapped gas bubble and cloudiness in the lactose broth) signals the possible presence of coliform bacteria in the sample. Source; Basic environmental technology, Nathanson, 3rd ed. 2000.
The larger the sample volume, the more likely it is that the tube will test positive. And if the
number of positive tubes that occurs in a series of sample dilutions is high, then the MPN of
coliform is high.

Water and Wastewater Analysis Laboratory Manual For Environmental Health Science Students
University of Gondar Collage of Medicine and Health Science 59
II. Confirmed Phase
a. Culture medium: Use brilliant green lactose bile broth fermentation tubes for the
confirmed phase.
Brilliant green lactose bile broth:
Peptone................................... 10.0 g
Lactose.......... ������..10.0 g
Oxgall...................................... 20.0 g
Brilliant green...................... 0.0133 g
Reagent-grade water......��. 1 L
Add dehydrated ingredients to water, mix thoroughly, and heat to dissolve. pH should be
7.2 ± 0.2 after sterilization. Before sterilization, dispense, in fermentation tubes with an
inverted vial, sufficient medium to cover inverted vial at least one-half to two-thirds after
sterilization. Close tubes with metal or heat-resistant plastic caps.
b. Procedure: Submit all presumptive tubes or bottles showing growth, any amount of
gas, or acidic reaction with 24 ± 2 h of incubation to the confirmed phase. If active
fermentation or acidic reaction appears in the presumptive tube earlier than 24 ± 2 h,
transfer to the confirmatory medium; preferably examine tubes at 18 ± 1 h. If additional
presumptive tubes or bottles show active fermentation or acidic reaction at the end of a 48 ±
3- h incubation period, submit these to the confirmed phase.
Gently shake or rotate presumptive tubes or bottles showing gas or acidic growth to re-
suspend the organisms. With a sterile loop 3.0 to 3.5 mm in diameter, transfer one or more
loop-full of culture to a fermentation tube containing brilliant green lactose bile broth or insert
a sterile wooden applicator at least 2.5 cm into the culture, promptly remove, and plunge
applicator to bottom of fermentation tube containing brilliant green lactose bile broth.
Remove and discard applicator. Repeat for all other positive presumptive tubes.

Water and Wastewater Analysis Laboratory Manual For Environmental Health Science Students
University of Gondar Collage of Medicine and Health Science 60
Incubate the inoculated brilliant green lactose bile broth tube at 35 ± 0.5°C. Formation of
gas in any amount in the inverted vial of the brilliant green lactose bile broth fermentation
tube at any time (e.g., 6 ± 1 h, 24 ± 2 h) within 48 ± 3 h constitutes a positive confirmed
phase. Calculate the MPN value from the number of positive brilliant green lactose bile
tubes.
III. Completed Phase
To establish the presence of coliform bacteria and to provide quality control data, use the
completed test on at least 10% of positive confirmed tubes (see Figure 2.1). Simultaneous
inoculation into brilliant green lactose bile broth for total coliform and EC broth for fecal
coliform or EC-MUG broth for Escherichia coli (EC) may be used. Consider positive EC
and EC-MUG broths elevated temperature (44.5°C) results as a positive completed test
response. Parallel positive brilliant green lactose bile broth cultures with negative EC of EC-
MUG broth cultures indicate the presence of non-fecal coliform.
a. Culture media and reagents:
. 1. MacConkey agar:
Peptone��............................................................17 g
Proteose peptone.....................................................3 g
Lactose..................� �����.�����..10 g
Bile salts....�.�......� ����������..1.5 g
Sodium chloride, NaCl��������..��..5 g
Agar.............�......... �����������.13.5 g
Neutral red....�................................................... 0.03 g
Crystal violet.�.......� ���������..0.001 g
Reagent-grade water.... �����.�.......��..1 L
Add ingredients to water, mix thoroughly, and heat to boiling to dissolve. Sterilize by
autoclaving for 15 min at 121°C. Temper agar after sterilization and pour into Petri plates
(100 X 15 mm). pH should be 7.1 ± 0.2 after sterilization.

Water and Wastewater Analysis Laboratory Manual For Environmental Health Science Students
University of Gondar Collage of Medicine and Health Science 61
2. Nutrient agar:
Peptone��............................5.0 g
Beef Extract.�.�..�...........�3.0 g
Agar���.........�............�15.0 g
Reagent-grade water..................1 L
Add ingredients to water, mix thoroughly, and heat to dissolve. pH should be 6.8 ± 0.2
after sterilization. Before sterilization, dispense in screw-capped tubes. After sterilization,
immediately place tubes in an inclined position so that the agar will solidify with a sloped
surface. Tighten screw caps after cooling and store in a protected, cool storage area.
3. Gram-stain reagents:
a) Ammonium oxalate-crystal violet (Hucker�s): Dissolve 2 g crystal violet (90% dye
content) in 20-mL 95% ethyl alcohol; dissolve 0.8 g (NH4)2C2O4·H2O in 80-mL reagent-
grade water; mix the two solutions and stay for 24 h before use; filter through paper
into a staining bottle.
b) Lugol�s solution, Gram�s modification: Grind 1 g iodine crystals and 2 g KI in a
mortar. Add reagent-grade water, a few milliliters at a time, and grind thoroughly after
each addition until solution is complete. Rinse solution into an amber glass bottle with
the remaining water (using a total of 300-mL).
c) Counter stain: Dissolve 2.5 g safranin dye in 100-mL 95% ethyl alcohol. Add 10-mL to
100-mL reagent-grade water.
d) Acetone alcohol: Mix equal volumes of ethyl alcohol (95%) with acetone.
b. Procedure:
1. Using aseptic technique, streak one LES Endo agar or MacConkey agar plate from
each tube of brilliant green lactose bile broth showing gas, as soon as possible after
the observation of gas. Streak plates in a manner to insure presence of some discrete
colonies separated by at least 0.5 cm. Observe the following precautions when

Water and Wastewater Analysis Laboratory Manual For Environmental Health Science Students
University of Gondar Collage of Medicine and Health Science 62
streaking plates to obtain a high proportion of successful isolations if coliform
organisms are present:
(a) Use a sterile 3-mm-diameter loop or an inoculating needle slightly curved at the tip;
(b) Tap and incline the fermentation tube to avoid picking up any membrane or scum on the
needle;
(c) Insert end of loop or needle into the liquid in the tube to a depth of approximately
0.5 cm; and
(d) Streak plate for isolation with curved section of the needle in contact with the agar to
avoid a scratched or torn surface. Flame loop between second and third quadrants to
improve colony isolation. Incubate plates (inverted) at 35 ± 0.5°C for 24 ± 2 h.
2. The colonies developing on LES Endo agar are defined as typical (pink to dark red
with a green metallic surface sheen) or atypical (pink, red, white, or colorless colonies
without sheen) after 24 h incubation. Typical lactose-fermenting colonies developing on
MacConkey agar are red and may be surrounded by an opaque zone of precipitated
bile. From each plate pick one or more typical, well-isolated coliform colonies or, if no
typical colonies are present, pick two or more colonies considered most likely to
consist of organisms of the coliform group, and transfer growth from each isolate to a
single-strength lauryl tryptose broth fermentation tube and onto a nutrient agar slant.
(The latter is unnecessary for drinking water samples.)
If needed, use a colony magnifying device to provide optimum magnification when
colonies are picked from the LES Endo or MacConkey agar plates. When transferring
colonies, choose well-isolated ones and barely touch the surface of the colony with a
flame-sterilized, air-cooled transfer needle to minimize the danger of transferring a
mixed culture.
Incubate secondary broth tubes (lauryl tryptose broth with inverted fermentation vials
inserted) at 35 ± 0.5°C for 24 ± 2 h; if gas is not produced within 24 ± 2 h re-incubate
and examine again at 48 ± 3 h. Microscopically examine Gram-stained preparations
from those 24-h nutrient agar slant cultures corresponding to the secondary tubes that
show gas.

Water and Wastewater Analysis Laboratory Manual For Environmental Health Science Students
University of Gondar Collage of Medicine and Health Science 63
Note: Formation of gas in the secondary tube of lauryl trypotose broth within 48 ± 3 h and
demonstration of gram-negative, non spore-forming, rod-shaped bacteria from the agar
culture constitute a positive result for the completed test, demonstrating the presence
of a member of the coliform group.
IV. Estimation of Bacterial Density (Determination of MPN)
a. Precision of Fermentation Tube Test: Unless a large number of sample portions is
examined, the precision of the fermentation tube test is rather low. For example, even when
the sample contains 1 coliform organism/mL, about 37% of 1-mL tubes may be expected to
yield negative results because of random distribution of the bacteria in the sample. When
five tubes, each with 1-mL sample, are used under these conditions, a completely
negative result may be expected less than 1% of the time. Even when five fermentation
tubes are used, the precision of the results obtained is not of a high order. Consequently,
exercise great caution when interpreting the sanitary significance of coliform results
obtained from the use of a few tubes with each sample dilution, especially when the number
of samples from a given sampling point is limited.
b. Computing and Recording of MPN: To calculate coliform density, compute in terms of
the Most Probable Number. The MPN values are given in Table 2.2. Included in this table is
the 95% confidence limit for each MPN value determined. If the sample volumes used are
those found in the tables, report the value corresponding to the number of positive and
negative results in the series as the MPN/100-mL or report as total or fecal coliform
presence or absence.
When the series of decimal dilutions is different from that in the table, select the MPN value
from the table for the combination of positive tubes and calculate according to the following
formula:
MPN value(from table) x (10/largest volume tested series used for MPN determination) =
MPN/100mL

Water and Wastewater Analysis Laboratory Manual For Environmental Health Science Students
University of Gondar Collage of Medicine and Health Science 64
Source; standard methods for water and wastewater APHA 19th edition 1995
Figure 2.11. Schematic outline of presumptive confirmed and completed phases for total coliform detection
Inoculat lauryl tryptose broth or presence-absence broth fermentation tubes or bottles and incubate 24 +2h at 35+ 0.5OC
(1) Gas and/or acidic growth produced. Transfer to confirmatory brilliant green lactose bile. Incubate 48 + 3 h at 35 + 0.5OC
(2) No gas or acid produced incubate additional 24 h
(total 48+ 3h).
(a) Gas produced. Transfer to les Endo or
macConkey. Incubate 24 + 2 h at 35 + 0.5OC
(1.2) Negative colonies.
Coliform group absent.
(1.1) Typical OR atypical coliform colonies. Transfer to agar slant and lauryl tryptose broth fermentation tube. Incubate agar slant 18 to 24 h and aluryl tryptose broth 24 + 2 h at 48 + 3h at 35 + 0.5OC
(b) No gas produced.
Negative test. Coliform group absent.
(a) Gas produced gram �stain
portion of agar slant growth. .
(b) No gas produced. Negative test. Coliform group absent
(1.11) Gram-negative rods present, no spores present. Completed test coliform group present. Gram-positive and negative rods both
present. Repeat procedure beginning at 1.1.
(1.12) Spores or gram-positive rods and spores present completed
test coliform group absent
(a) Gas or acid produced.
Continue as in (1a)
(c) No gas or acid produced. Negative test. coliform
group absent
(a) Acidc growth.
confirm as in (1)
.

Water and Wastewater Analysis Laboratory Manual For Environmental Health Science Students
University of Gondar Collage of Medicine and Health Science 65
Table 2.4 MPN values per 100mL of samples and 95% confidence limits for various combination of posetive and negative results(when 10 mL portions are used)
#of tubes giving positive reaction out of
10 of 10mL each
MPN
Index/100mL
95% Confidence Limits
(approximate)
Lower Upper
0 less than 1.1 0 3.0
1 1.1 0.03 5.9
2 2.2 0.26 8.1
3 3.6 0.69 10.6
4 5.1 1.3 13.4
5 6.9 2.1 16.8
6 9.2 3.1 21.1
7 12.0 4.3 27.1
8 16.1 5.9 36.8
9 23.0 8.1 59.5
10 greater than 23.0 13.5 infinite
Source; standard methods for water and wastewater APHA 19th edition 1995
When more than three dilutions are used in a decimal series of dilutions, use the results
from only three of these in computing the MPN. To select the three dilutions to be used in
determining the MPN index, choose the highest dilution that gives positive results in all five
portions tested (no lower dilution giving any negative results) and the two next succeeding
higher dilutions.
Use the results at these three volumes in computing the MPN index. In the examples given
below, the significant dilution results are shown in boldface. The number in the numerator
represents positive tubes; that in the denominator, the total tubes planted; the combination
of positives simply represents the total number of positive tubes per dilution:

Water and Wastewater Analysis Laboratory Manual For Environmental Health Science Students
University of Gondar Collage of Medicine and Health Science 66
Example 1 mL 0.1 mL 0.01 mL 0.001 mL Combination of positives MPN index/100 mL
A 5/5 5/5 2/5 0/5 5-2-0 5000
B 5/5 4/5 2/5 0/5 5-4-2 2200
C 0/5 1/5 0/5 0/5 0-1-0 20
Source; standard methods for water and wastewater APHA 19th edition 1995
Table 2.5 MPN values per 100mL of sample and 95% confidence limits for various combination of posetive and negative results (whenfive 10 mL portions,five 1 mL portions and five 0.1 mL portions are Used)
Number of tubes giving positive reaction out of: 95%confidence limits
5 of 10ml each 5 of 1ml each 5 of 0.1ml each
MPN index/
100ml Lower Upper
0 0 0 <2 - -
0 0 1 2 1.0 10
0 1 0 2 1.0 10
0 2 0 4 1.0 13
1 0 0 2 1.0 11
1 0 1 4 1.0 15
1 1 0 4 1.0 15
1 1 1 6 2.0 18
1 2 0 6 2.0 18
2 0 0 4 1.0 17
2 0 1 7 2.0 20
2 1 0 7 2.0 21
2 1 1 9 3.0 24
2 2 0 9 3.0 25
2 3 0 12 5.0 29
3 0 0 8 3.0 24

Water and Wastewater Analysis Laboratory Manual For Environmental Health Science Students
University of Gondar Collage of Medicine and Health Science 67
3 0 1 11 4.0 29
3 1 0 11 4.0 29
3 1 1 14 6.0 35
3 2 0 14 6.0 35
3 2 1 17 7.0 40
4 0 0 13 5.0 38
4 0 1 17 7.0 45
4 1 0 17 7.0 46
4 1 1 21 9.0 55
4 1 2 26 12 63
4 2 0 22 9.0 56
4 2 1 26 12 65
4 3 0 27 12 67
4 3 1 33 15 77
4 4 0 34 16 80
5 0 5 23 9.0 86
5 0 1 30 10 110
5 0 2 40 20 140
5 1 0 30 10 120
5 1 1 50 20 150
5 1 2 60 30 180
5 2 0 50 20 170
5 2 1 70 30 210
5 2 2 90 40 250
5 3 0 80 30 250
5 3 1 110 40 300
5 3 2 140 60 360

Water and Wastewater Analysis Laboratory Manual For Environmental Health Science Students
University of Gondar Collage of Medicine and Health Science 68
5 3 3 170 80 410
5 4 0 130 50 390
5 4 1 170 70 480
5 4 2 220 100 580
5 4 3 280 120 690
5 4 4 350 160 820
5 5 0 240 100 940
5 5 1 300 100 1300
5 5 2 500 200 2000
5 5 3 900 300 2900
5 5 4 1600 600 5300
5 5 5 ≥1600 - -
Source; standard methods for water and wastewater APHA 19th edition 1995
The MPN for combinations not appearing in the table or other combinations of tubes or
dilutions may be estimated by Thomas� simple formula:
MPN/100mL = No. of positive tubes X 100
Sq. root of (mL sample in negative tubes X mL sample in all tubes)
The results represent the confirmatory test for thermo-tolerant (faecal) coliforms, Table 2.5
indicates that coded result of ( 5x10-mL positive ,3x 1mL positive , 1 x 0.1mL positive ) gives
an MPN value of 110, meaning that the water sample contains an estimated 110 coliforms
per 100mL. Next, consider an example of heavily polluted water. The procedure outlined
above may give a coded result of 5-5-5. Such a result does not give a definite MPN value.
When such heavy contamination is suspected it is usual to inoculate more than three

Water and Wastewater Analysis Laboratory Manual For Environmental Health Science Students
University of Gondar Collage of Medicine and Health Science 69
dilutions in a series of factors of 10. This series of 10-fold dilutions should be made in such
a way that a negative result is likely for at least the highest dilution incubated. If 5x 1.0mL,
5x0.1mL, 5x0.01mL, and 5x0.001mL are initially inoculated and a confirmed coded result is
5-5-1 is obtained, only three of these results should then be used to obtain the MPN value
from table 2.5. These should be selected by choosing the smallest sample volume (in the
case, 0.1mL) for which all the tubes give a positive result, and the two next succeeding
higher dilutions.
The coded result of these three volumes is then used to obtain the MPN value from Table
2.5. In the above example, the result 5-4-1 would be chosen, representing volumes of 0.1,
0.01, and 0.001mL of the sample. The MPN value obtained from table 2.3.Should be
multiplied by 100 to obtain the MPN for this particular sample (see below); in this case, the
result is 1,700 per 100mL.
Some times the laboratory worker may find it difficult to determine the multiplying factor to
be used to obtain the appropriate MPN is to divide the MPN value obtained from table 2.5
by the sample volume represented by the middle number in the chosen code. For example,
consider a chosen code of 5-2-0, in which the 2 represents a sample volume of 0.01, is 49.
The MPN value for the sample tested will therefore be: (49/0.01)= 49x100=4900

Water and Wastewater Analysis Laboratory Manual For Environmental Health Science Students
University of Gondar Collage of Medicine and Health Science 70
Table 2.6 Examples of multiplying factors for determination of MPN for different dilutions of samples Number of tubes giving a positive reaction
Example 5
of
1ml
5 of
0.1ml
5 of
0.01ml
5 of
0.001ml
5 of
0.0001ml
Coded
result
chosen
Multiplying
factor MPN
1 5 5 2 0 0 5-2-0 100
2 5 5 4 1 0 5-4-1 100
3 5 3 0 0 0 5-3-0 10
4 5 5 5 3 1 5-3-1 1000
5 0 1 0 0 0 0-1-0 10
Source; standard methods for water and wastewater APHA 19th edition 1995
Table 2.7 MPN values for 100mL of samples and 95% confidence limits for various combination of posetive and negative results(when three 10 mL portions,three one mL portions and three 0.1 mL portions are used)
Number of tubes giving positive reaction out of:
95% confidence limits
3 of 10 ml each 3 of 1 ml each 3 of 0.1 ml each
MPN Index per 100ml
Lower
Upper
0 0 1 3 1 9
0 1 0 3 1 13
1 0 0 4 1 20
1 0 1 7 1 21
1 1 0 7 1 23
1 1 1 11 3 36
1 2 0 11 3 36
2 0 0 9 1 36
2 0 1 14 3 37
2 1 0 15 3 44
2 1 1 20 7 89
2 2 0 21 4 47
2 2 1 28 10 150
3 0 0 23 4 120

Water and Wastewater Analysis Laboratory Manual For Environmental Health Science Students
University of Gondar Collage of Medicine and Health Science 71
3 0 1 39 7 130
3 0 2 64 15 380
3 1 0 43 7 210
3 1 1 75 14 230
3 1 2 120 30 380
3 2 0 93 15 380
3 2 1 150 30 440
3 2 2 210 35 470
3 3 0 240 36 1300
3 3 1 460 71 2400
3 3 2 1100 150 4800
Source; standard methods for water and wastewater APHA 19th edition 1995
To illustrate this, MPN values using a series of nine tubes are presented in table 2.7. Three
of the nine tubes are inoculated with 10mL of sample, three are inoculated with 1mL
sample, and three are inoculated with 0.1mL sample. This example illustrates the use of the
table.
The results of a multiple tube fermentation test on a sample of river water are as follows:
Dilution series Results after incubation
2 positive
10mL 1 negative
1 positive
1mL 2 negative
0 positive
0.1mL 3 negative
Determine the MPN of coliform from these data:
Solution: Entering table 2.7 locates the row with 2, 1, and 0 in the first three columns,
respectively. These numbers represent the number of positive tubes in each dilution series.
Under the column headed MPN index, we read an MPN of 15 coliform per 100mL. The last
two columns of the table point out the statistical nature of the MPN. We see that the

Water and Wastewater Analysis Laboratory Manual For Environmental Health Science Students
University of Gondar Collage of Medicine and Health Science 72
probability is 95 percent that the actual coliform concentration is at least 3 but no more than
44 per 100mL.
Unpolluted and treated water
Water in or entering the distribution system may generally be assumed to contain little or no
pollution. In this case, it is recommended that one 50-mL plus five 10-mL volumes of water
sample should be inoculated into the tubes, five tubes should each contain 10-mL and one
tube 50-mL of double strength medium.
Table 2.8 MPN values per 100mL of samples and 95% confidence limits for various combination of posetive and negative rsults (when one 50 mL ,and five 10 mL test portions are used)
95% confidence
limits
Number of tubes giving positive reaction out
of.
1 of 50 ml 5 of 10 ml each
MPN Index per
100ml Lower Upper
0 0 0 - -
0 1 1 <1 4
0 2 2 <1 6
0 3 4 <1 11
0 4 5 1 13
0 5 7 2 17
1 0 2 <1 6
1 1 3 <1 9
1 2 6 1 15
1 3 9 2 21
1 4 16 4 40
1 5 18+ - -

Water and Wastewater Analysis Laboratory Manual For Environmental Health Science Students
University of Gondar Collage of Medicine and Health Science 73
2.4.2. Fecal coliform procedures by medium A-1.
MPN methods
The numbers of fecal coliform bacteria in wastewater samples are usually counted by Most
Probable Number (MPN) methods.
MPN counts are statistical best estimates (hence the name, most probable number)
obtained by culturing a number (usually five) of sample volumes and/or dilutions of such
samples. These estimates are based on the principle of �dilution to extinction�. For example,
if a single 1-mL aliquot from each of a series of 1:10 dilutions is examined and growth
occurs at a dilution of 10-3 but not at 10-4, the best estimate of the count is 103 bacteria per
mL.
This method, which is very simple and inexpensive, is suitable for the routine analysis of
treated wastewaters that comply with the guideline value of no more than 1000 fecal
coliform per 100 mL.
In the second MPN method, five 1-mL aliquots of each of three dilutions are examined, so
that a much better estimate of fecal coliform numbers is obtained. This method can be made
suitable for the analysis of wastewater containing any number of fecal coliform bacteria by
altering the dilutions examined.
I. Materials and culture mediums:
a. Culture mediums:
The chemicals listed below for medium A-1 will be needed, together with quarter-strength
Ringer�s solution (commercially available in tablet form) or sodium chloride solution (8.5 g
NaCl per litre of distilled water). Non-absorbent cotton wool is also required. Medium A-1
(American Public Health Association, 1995) is recommended, as it can be used for direct
incubation at 44°C. It is not commercially available in dehydrated form and must be made
up to the following formula:

Water and Wastewater Analysis Laboratory Manual For Environmental Health Science Students
University of Gondar Collage of Medicine and Health Science 74
Medium A-1
Lactose -------------------------------------------------5 g
tryptone -----------------------------------------------20 g
salicin -------------------------------------------------0.5 g
NaCl ---------------------------------------------------5 g
Triton X-100 -----------------------------------------1 mL
Distilled water ---------------------------------------1 liter
It is dispensed in 5-ml quantities into test-tubes (or screw-capped bottles) each of which
contains an inverted Durham tube (this is a very small test-tube). The test-tubes are closed
with a plug of non-absorbent cotton wool and sterilized. During sterilization, the air in the
Durham tube is expelled and it becomes completely full of medium.
b. Equipment
The following are required:
- 100-ml screw-capped bottles
- Test-tubes (100 mm × 12 mm) or half-ounce (14-mL) screw-capped bottles
- 1-ml serological �blow-out� pipettes
- Bunsen burner
- Test-tube rack
- Incubator or water-bath
- Autoclave or pressure cooker
- Balance (± 0.01 g).
Note:
Two MPN methods are described below. Method A is the simpler of the two and is suitable
for the routine monitoring of treated wastewater effluents that contain around 1000 or fewer
fecal coliforms per 100 ml. Method B is more accurate and can also be used for samples
containing 1000 or fewer fecal coliforms per 100 mL, or for those containing many more.
II. Method A Procedure:
1. Collect a sample of wastewater effluent in a sterile 100-ml screw-capped bottle.

Water and Wastewater Analysis Laboratory Manual For Environmental Health Science Students
University of Gondar Collage of Medicine and Health Science 75
2. Shake the sample bottle thoroughly, and aseptically withdraw 1 ml using a sterile 1-ml
�blowout� pipette. Transfer this to a sterile test-tube or screw-capped bottle containing 9 ml
of quarter-strength Ringer�s solution (or 8.5 g/l NaCl solution) (Fig. 2.12). Do not pipette by
mouth - use a pipette suction pump.
3.Shake this 1:10 dilution of the sample thoroughly and using a single fresh sterile 1-ml
pipette, transfer 1 ml to each of five sterile test-tubes or screw this 1:10 dilution of the
sample thoroughly and, w-capped bottles containing an inverted Durham tube and 5 ml of
medium A-1 (Fig. 2.13). Label each tube or bottle with a code for the sample, the date and
1:10.
4. Place these five test-tubes or bottles in an incubator or water-bath maintained at 44°C (±
0.25°C).
5. After incubation for 24 h, examine each test-tube or bottle for gas production. (Fecal
coliform bacteria produce gas from the lactose in medium A-1, and some of this gas is
trapped in the inverted Durham tube.) Count the number of positive tubes or bottles (i.e.
those with gas production) (Fig. 2.14) and determine the MPN from Table 2.9.

Water and Wastewater Analysis Laboratory Manual For Environmental Health Science Students
University of Gondar Collage of Medicine and Health Science 76
Fig. 2.12. Adding 1 ml of sample to 9 ml of diluent to make a containing 5 ml of medium A-1 and an inverted Durham tube.
Fig. 2.13. Adding 1 ml of the 1:10 dilution to a test-tube1:10 dilution of the sample.
Fig.2.14. After incubation at 44°C for 24 h, three of the tubes show gas production. The MPN is determined from Table 2.9 as 910 fecal coliforms per 100-mL of sample (treated Waste water).
Fig.2.15. After incubation at 44°C for 24 h, five of the tubes containing 1-mL of sample are positive (gas production), two of those containing 0.1 ml (1-mL of the 1:10 dilution), and two of those containing 0.01-mL (1-mL of the 1:100 dilution). For cla

Water and Wastewater Analysis Laboratory Manual For Environmental Health Science Students
University of Gondar Collage of Medicine and Health Science 77
Table 2.9 Fecal coliform MPN per 100mL of sample for one set of five tubes containing 0.1 mL of sample
a Adapted from Department of the Environment (1994) by kind permission of Her Majesty�s
Stationery Office.
III. Method B Procedure:
1.Collect a sample of wastewater as described in method A.
2. Make a 1:10 dilution (as described in method A) and a 1:100 dilution (this is simply a 1:10
dilution of the 1:10 dilution;
3. Label each of five sterile test tubes or screw-capped bottles containing an inverted
Durham tube and 5 ml of medium A-1 with a code for the sample, the date and 1:100.
4. Repeat, labeling 1:10; repeat, labeling 1:1.
5. Using a fresh sterile 1-ml pipette, add 1 ml of the 1:100 dilutions to each of the five
sterile test tubes or screw-capped bottles labeled 1:100.
6. Using the same pipette (but taking care not to lay it down on the bench or to touch
anything with its tip), add 1 ml of the 1:10 dilution to each of the second set of five test-tubes
or screw capped bottles labeled 1:10.
7. Again using the same pipette, add 1 ml of the undiluted sample to each of the third set of
five test-tubes or screw-capped bottles labeled 1:1.
8. Place the 15 tubes in a rack and transfer to an incubator or water-bath maintained at
44°C (± 0.25°C).
9. After incubation for 24 h, count the number of positive tubes (those with gas production)
at each dilution (Fig. 2.15), and determine the fecal coliform MPN from Table 2.10.
10. If the fecal coliform count is much greater than 1800 per 100 ml, use smaller sample
volumes (i.e. 1-ml quantities of higher dilutions). If the test-tubes contain 0.1 ml, 0.01 ml
and 0.001 ml of sample, multiply the MPN given in Table 2.8 by 10. Similarly, if the test-

Water and Wastewater Analysis Laboratory Manual For Environmental Health Science Students
University of Gondar Collage of Medicine and Health Science 78
tubes contain 0.01 ml, 0.001 ml and 0.0001 ml of sample, multiply the MPN given in
Table 2.10 by 100.
Table 2.10 Feacal coliform MPN per 100 mL of sample for three sets of five tubes containing 1mL,0.1 mL and 0.01 mL of sample respectively
Number of positive tubes MPN per 100ml
1mL 0.1mL 0.01mL 0
0 0 0 20
0 1 0 20
1 0 0 40
1 0 1 40
1 1 0 50
1 2 0 40
2 0 0 50
2 0 1 50
2 1 0 70
2 1 1 70
2 2 0 110
2 3 0 70
3 0 0 90
3 0 1 90
3 1 0 130
3 1 1 130
3 2 0 160
3 2 1 160
3 3 0 110
4 0 0 140
4 0 1 160
4 1 0 200
4 1 1 200
4 2 0 250
4 2 1 250
4 3 0 310
4 3 1 320
4 4 0 380

Water and Wastewater Analysis Laboratory Manual For Environmental Health Science Students
University of Gondar Collage of Medicine and Health Science 79
4 4 1 220
5 0 0 290
5 0 1 410
5 0 2 310
5 1 0 430
5 1 1 600
5 1 2 850
5 1 3 500
5 2 1 700
5 2 2 950
5 2 3 1200
5 2 0 750
5 3 1 1100
5 3 2 1400
5 3 3 1750
5 3 4 2100
5 3 0 1300
5 4 1 1700
5 4 2 2200
5 4 3 2800
5 4 4 3450
5 4 0 2400
5 5 1 3500
5 5 2 5400
5 5 3 9100
5 5 4 16000
5 5 5 >18000
Adapted from Department of the Environment (1994) by kind permission of Her Majesty�s
Stationery Office

Water and Wastewater Analysis Laboratory Manual For Environmental Health Science Students
University of Gondar Collage of Medicine and Health Science 80
IV. Medium preparation and sterilization:
This consists of the following steps:
1. Weigh out all the chemicals needed to make up the medium, for the formulas of medium
A-1 and membrane lauryl sulfate broth, or weigh out the appropriate quantity of
dehydrated membrane lauryl sulfate broth if this is being used. Add to the appropriate
quantity of distilled water and allow dissolving completely. (It may not always be
advisable to make up 1 liter of medium as, once sterilized; it must be stored below 10°C
in the dark and used within 3 months.)
2. Dispense the medium into bottles or test-tubes before sterilizing. Medium A-1 should be
added in 5-ml quantities to screw-capped bottles or test-tubes each containing an
inverted Durham tube; if test-tubes are used, these must be closed with a plug of non-
absorbent cotton wool. Dispense membrane sodium lauryl sulfate broth in small
quantities into screw-capped bottles (just under 6 ml are needed for testing each
sample) .Make up diluent�s either by dissolving a tablet of quarter-strength Ringer�s
solution in 500 ml of distilled water, or by weighing out 8.5 g NaCl and dissolving it in 1
liter of distilled water. Dispense the diluent�s in 9-ml quantities into screw-capped bottles
(for making 1:10 dilutions) or in 100-ml quantities when it is to be used for membrane
filtration.
3. Once the media and diluents have been dispensed, sterilize in an autoclave or pressure
cooker, as follows:
- Medium A-1 and membrane lauryl sulfate broth: 115°C, 67 kPa (10 lb/in2), for 10 min once
the temperature and pressure are reached; and
- Quarter-strength Ringer�s solution or NaCl solution: 121°C, 101 kPa (15 lb/in2), for 15 min
once the temperature and pressure are reached.
4. Autoclave screw-capped bottles with their caps only loosely screwed down (to avoid
explosions); after sterilization and when the bottles are at room temperature, screw the
caps down tightly. Before use, store in a dust-free place and label as sterile.

Water and Wastewater Analysis Laboratory Manual For Environmental Health Science Students
University of Gondar Collage of Medicine and Health Science 81
Making serial 1:10 dilutions
Dilutions are used in both method A and method B for MPN counts and may be used for
membrane filter counts .The procedure is as follows:
1. With a sterile 1-ml pipette, aseptically add 1 ml of the wastewater sample to a sterile test-
tube or bottle containing 9 ml of diluents. Mix thoroughly. This is a 1:10 dilution.
2. using a fresh sterile 1-ml pipette, add 1 ml of the 1:10 dilution to a second sterile tube or
bottle containing 9 ml of diluents. Mix thoroughly. This is a 1:100 dilution.
3. Step 2 is repeated as required, adding 1 ml of the last dilution made to another tube or
bottle containing 9 ml of diluents. This gives higher dilutions in sequence: 1:1000, 1:10 000
and so on. (If these higher dilutions are to be used, remember that untreated wastewater
usually contains 107-109 fecal coliforms per 100 ml.)
V. Incubation:
Fecal coliform bacteria are incubated at 44°C (± 0.25°C). It is best to use a fan-assisted
incubator (the fan ensures that all parts of the incubator are at the required temperature;
without a fan this is difficult to achieve, and it is very important that incubation is carried out
very close to 44°C), although a water-bath can be used for the test-tubes in the MPN
procedures. After incubation and examination of the samples, all the test-tubes or screw-
capped bottles containing medium, must be sterilized by autoclaving at 121°C for 15 min
before disposal to ensure that the billions of bacteria that have grown during incubation are
destroyed.
2.4.3. Fecal Coli form Procedure using EC medium
Elevated-temperature tests for distinguishing organisms of the total coliform group that also
belong to the fecal cloiform group are described herein. Modifications in technical
procedures, standardization of methods, and detailed studies of the fecal coliform group
have established the value of this procedure. The test can be performed by one of the
multiple-tube procedures described here or by membrane filter methods as described in
section 2.3.4. The procedure using A-1 broth is a single-step method.

Water and Wastewater Analysis Laboratory Manual For Environmental Health Science Students
University of Gondar Collage of Medicine and Health Science 82
The fecal coliform test (using EC medium) is applicable to investigations of drinking water,
stream pollution, raw water sources, wastewater treatment systems, bathing waters sea-
waters, and general water-quality monitoring. Prior enrichment in presumptive media is
required for optimum recovery of fecal coliforms when using EC medium. The test using A-1
medium is applicable to source water, seawater, and treated wastewater.
I. EC med ium
Tryptose or trypticase �...............................................20.0g
Lactose�������������������� 5.0g
Bile salts mixture or bile salts No.3���������1.5 g
Dipotassium hydrogen phosphate, K2HPO4����� 4.0 g
Potassium dihydrogen phosphate,KH2PO4������ 1.5 g
Sodium Chloride, NaCL�������������� 5.0 g
Reagent-grade Water���������������. 1 L
Add dehydrated ingredients to water mix thoroughly and heat to dissolve. pH should be
6.9 + 0.2 after sterilization. Before sterilization, dispense in fermentation tubes, each with
an inverted vial, sufficient medium to cover the inverted vial at least partially after
sterilization. Close tubes with metal or heat-resistant plastic caps.
II. Procedure:
Submit presumptive tubes or bottles showing any amount of gas, growth or acidity
within 48 h of incubation to the fecal coliform test.
1. Gently shake or rotate presumptive fermentation tubes or bottles showing gas, growth,
or acidity. Using a sterile 3-or3.5mm-diameter loop or sterile wooden applicator stick,
transfer growth from each presumptive fermentation tube or bottle to EC broth (see
section 2.4.1.II.)
2.Incubate inoculated EC broth tubes in a water bath at 44.5 + 0.2OC for 24+ 2 h) Place all
EC tubes in water bath within 30 min after inoculation. Maintain a sufficient water depth
in water bath incubator to immerse tubes to upper level of the medium.

Water and Wastewater Analysis Laboratory Manual For Environmental Health Science Students
University of Gondar Collage of Medicine and Health Science 83
Note:
Gas production with growth in an EC broth culture within 24 + 2 h or less is considered a
positive fecal coliform reaction. Failure to produce gas (with little or no growth
constitutes a negative reaction. If multiple tubes are used, calculate MPN from the number
of positive EC broth tubes a described in section 2.4.1.IV. When using only one tube for
sub-culturing from a single presumptive bottle, report as presence or absence of fecal
coliforms.
2.4.4. Multiple-Tube Technique for fecal streptococcus and enterococcus groups
The multiple -tube technique is applicable primarily to raw and chlorinated waste water and
sediments, and can be used for fresh and marine waters.
a. Fecal streptococcus group
The fecal streptococcus group consists of a number of species of the genus streptococcus
such as S. faecalis S.faecium,S. avium, S. bovis, S. equinus, and S.gallinarum .They all
give a positive reaction with Lancefield's Group D antisera and have been isolated from the
feces of warm-blooded animals.
The normal habitat of fecal streptococci is the gastrointestinal tract of warm-blooded
animals. S.faecalis and S.fuecium once were thought to be more human-specific than other
streptococcus species.
The fecal streptococci have been used with fecal coli forms to differentiate human fecal
contamination from that of other warm-blooded animals. Editions of standard methods
previous to the 17th suggested that the ratio of fecal coli forms (FC) to fecal streptococci
(FS) could provide information about the source of contamination .A ratio greater than 4 was
considered indicative of human fecal contamination whereas a ratio of less than 0.7 was
suggestive of contamination by nonhuman sources .The value of this ratio has been
questioned because of variable survival rates of fecal streptococcus group species. S.bovis
and S.equinus die off rapidly once exposed to aquatic environments, whereas S. faecalis
and S.faecium tend to survive longer. .

Water and Wastewater Analysis Laboratory Manual For Environmental Health Science Students
University of Gondar Collage of Medicine and Health Science 84
b. Enteroccoccus group
The enterococcus group is a subgroup of the fecal streptococci that includes S.faecalis,S
.faccium. S.gallinarum, and S.avium.the enterococci are differentiated from other
stepotcocci by their growth in 6.5% sodium chloride, at pH 9.6 and at 10OC and45OC.
The enterococci portion of the fecal streptococcus group is a valuable bacterial indicator
for determining the extent of fecal contamination of recreational surface waters. Studies at
marine and fresh water bathing beaches indicated that swimming associated gastroenteritis
is related directly to the quality of the bathing water and that enterococci are the most
efficient bacterial indicator of water quality. Water quality guidelines based on enterococcal
density have been proposed for recreational fresh waters the guideline is 33 enterococci
/100 mL while for marine waters it is 35/100 mL. Each guideline is based on the geometric
mean of at least five samples per 30-day period during the swimming season.
I. Materials and Culture Media
a. Azide dextrose broth
beef extract ---------------------------- -4.5 g
Tryptone or polypeptone -------------15.0g
Glucose ----------------------------------7.3 g
Sodium chloride, NaCl --------------- 7.5 g
Sodium azide NaN3 ------------------- 0.2g
Reagent-grade water ------------------- 1 L
pH should be 7.2 + 0.2 at 250C after sterilization .
b. Pfizer selective enterococcus (PSE) agar
peptone C --------------------------------------17.0 g
Peptone B-------------------------------------- 3.0 g
Yeast extract----------------------------------- 5.0 g
Bacteriological bile -------------------------- -10.0 g
Sodium chloride, NaCl ------------ -----------5.0 g
Sodium citrate ----------------------- -----------1.0 g
Esculin ------------------------------------------- 1.0 g

Water and Wastewater Analysis Laboratory Manual For Environmental Health Science Students
University of Gondar Collage of Medicine and Health Science 85
Ferric ammonium citrate ---------------------- 0.5 g
Sodium azide, NaN3 ---------------------------0.25 g
Agar --------------------------------------------- 15.0 g
Reagent -grade water ------------------ --------1 L
pH should be 7.1 + 0.2 after sterilization. Hold medium for not more than 4 h at 45 to 50OC
before plates are poured .
II. Presumptive Test procedure
Inoculate a series of tubes of azide dextrose broth with appropriate graduated
quantities of sample. Use sample of 10mL portions or less. Use double-strength both for
10mL inocula. The portions used will very in size and number with the sample character.
Use only decimal multiples of 1ml (sec section 2.4.1 ).
Incubate inoculated tubes at 35 + 0.50 C. Examine each tube for turbidity at the end of 24 +
2 h .If no definite turbidity is present re-incubate and read again at the end of 48 + 3 h.
III. Confirmed test procedure
Subject all azide dextrose broth tubes showing turbidity after 24- or 48-h incubation to the
confirmed test. Streak a portion of growth from each positive azide dextrose broth tube on
PSE agar. Incubate the inverted dish at 35 + 0.50C for 24+2h. Brownish-black colonies with
brown halos confirm the presence of fecal streptococci.
Brownish-black colonies with brown halos may be transferred to a tube of brain-heart
infusion broth containing 6.5% NaCl. Growth in 6.5% NaCl broth and at 45OC indicates that
the colony belongs to the enteroccoccus group.
IV. Computing and Recording of MPN
Estimate fecal streptococci densities from the number of tubes in each dilution series that
are positive on PSE agar. Similarly estimate enterococci densities from the number of tubes
in each dilution series containing streptococci that can grow in 6.5% NaCl broth. Compute
the combination of positives and record as the most probable number (MPN).

Water and Wastewater Analysis Laboratory Manual For Environmental Health Science Students
University of Gondar Collage of Medicine and Health Science 86
2.4.5. Presence-Absence (P-A) coliform test
The presence absence (P-A) test for the coliform group is the simple modification of the
multiple-tube procedure. Simplification, by use of one large test portion (100mL) in a single
culture bottle to obtain qualitative information on the presence or absence of coliform, is
justified in the theory that no coliforms should be present in 100ml of a drinking water
sample. The P-A test also provides the optional opportunity for further screening of the
culture to isolate other indicators (fecal coliform, Aeromonas, staphylococcus,
pseudomonas, fecal streptococcus, and clostridium) on the same qualitative basis.
Additional advantages include the possibility of examining a larger number of samples a unit
of time. Comparative studies with the membrane filter procedure indicate that may coliform
detection in samples containing may maximize organisms that could over grow coliform
colonies and causes problems in detection.
The P-A test is intended for use on routine samples collected from distribution systems or
water treatment plants. When sample locations produce a positive P-A results for coliforms,
it may be advisable to determine coliform densities in repeat samples. Quantitative
information may indicate the magnitude of a contaminating event.
I. Presumptive phase
a. Culture media:
1. P-A broth: this medium is commercially available in dehydrated and in sterile
concentrated form.
Beef extract------------------------------------------------------3.0g
Peptone-----------------------------------------------------------5.0g
Lactose-----------------------------------------------------------7.46g
Tryptose----------------------------------------------------------9.83g
Dipotassium hydrogen phosphate,K2HPO4-----------------1.35g
Potassium dihydrogen phosphate,KH2PO4------------------1.35g
Sodium chloride, NaCl----------------------------------------2.46g
Sodium laural sulfate------------------------------------------0.05g
Bromcresol purble----------------------------------------------0.0085g
Reagent grade water--------------------------------------------1 L

Water and Wastewater Analysis Laboratory Manual For Environmental Health Science Students
University of Gondar Collage of Medicine and Health Science 87
Make this formulation triple (3x) strength when examining 100ml samples. Dissolve the P-A
broth medium in water without heating, using a stirring device. Dispense 50mL prepared
medium into a screw-cap 250ml milk dilution bottle. A fermentation tube insert
is not necessary. Autoclave for 12min at 121OC with the total time in the autoclave limited to
30 min or less. pH should be 6.8 + 0.2 after sterilization. When the P-A medium is sterilized
by filtration a 6x strength medium may be used. Aseptically dispense 20mL of the 6x
medium into a sterile 250mL dilution bottle or equivalent container.
2) Lauryl tryptose broth: (see section 2.4.1.I).
b. Procedure:
Shake sample vigorously for 5second (approximately 25 times) and inoculate 100mL into a
P-A culture bottle. Mix thoroughly by inverting bottle one or twice to achieve even
distribution of the triple-strength medium throughout the sample. Incubate at 35 + 0.5 OC
and inspect after 24 and 48hours for acid reactions.
Note: A distinct yellow color forms in the medium when acid conditions exist following
lactose fermentation. If gas also is being produced, gently shaking the bottle will result in a
foaming reaction. Any amount of gas and/or acid constitutes a positive presumptive test
requiring conformation.
II. Confirmed phase:
Positive presumptive test should be confirmed by inoculating a tube of brilliant-green
lactose-bile (BGLB) broth with cultures that show acid and/or gas production and incubating
at 35+0.5OC. Growth and the production of gas in the BGLB broth culture within 48hours
confirm the presence of coliform bacteria. (See figure 2.11)

Water and Wastewater Analysis Laboratory Manual For Environmental Health Science Students
University of Gondar Collage of Medicine and Health Science 88
a. Culture medium:
Use brilliant green lactose bile fermentation tubes (see section2.4.1.IIa).
b. procedure:
Transfer all cultures that show acid reaction or acid and gas reaction into brilliant green
lactose bile(BGLB) broth for incubation at 35 + 0.5 OC(see section2.4.1.IIb).
Note: Gas production in the BGLB broth culture within 48 + 3hours confirms the presence of
coliform bacteria. Report result as presence-absence test positive or negative for total
coliform in 100mL of sample.
III. Completed phase:
The completed phase is outlined in 2.4.1.III & Fig. 2.11.

Water and Wastewater Analysis Laboratory Manual For Environmental Health Science Students
University of Gondar Collage of Medicine and Health Science 89
Fig.2.16. Steps in the multiple fermentation tube technique
2.5. Questions
1. Explain the difference between Membrane Filter and Multiple Fermentation Tube
technique to estimate bacterial density in given water sample.
2. If you duplicate 50mL portions of water or wastewater samples were examined and the
two membranes had 5 and 7 coliform colonies respectively. How many average total
coliform colonies, you will report per 100mL sample.
3. Similarly, If you take 100mL,75mL, 50mL, and 25ml portions of water or wastewater
samples were examined and the counts were 25,20,15, and <1 coliform colonies
respectively. How many average total coliform colonies, you will report per 100mL sample.

Water and Wastewater Analysis Laboratory Manual For Environmental Health Science Students
University of Gondar Collage of Medicine and Health Science 90
CHAPTER THREE
3. SANITARY PARASITOLOGY AND BENTHIC MACRO
INVERTEBRATE
3.1. Objectives
At the end of this chapter the students will be able to know:
1. correct laboratory procedures of helminth ova and benthic macro invertebrates
identification.
2. Essential chemicals and materials to identify ova of helminthes.
3. Important laboratory equipments and materials for analysis of both sanitary parasitology
and benthic macro-invertebrates.
3.2. Introduction
Many methods for the enumeration of helminth eggs in water and wastewater are described
in the literature. Each method has its own advantages and disadvantages: some have a
high percentage recovery, but some are very time-consuming; many are not reported in
sufficient detail for replication to be possible, or their recovery rate is unknown; some require
prohibitively expensive chemicals or are otherwise unsuitable for use in laboratories with
limited equipment; and others only recover a limited range of species. It is clear that there is
no one method that is universally useful, recovers all the helminth eggs of medical
importance, and has a known rate of recovery.
All the available methods are based on one of two fundamental principles: either the
parasites are floated away from other debris in a solution of comparatively high relative
density, or the fatty and other matter is separated in an inter-phase solution (normally ether
or ethyl acetate) while the parasites sediment into a non-miscible buffer below. Both
processes rely on centrifugal force.
In the other hand , Invertebrates are collected from different habitats (e.g. gravel, silt, weed
beds) at representative sites on river stretches and identified to the required taxonomic level
(normally family level) Each group or family is allocated a score between 1 and 10,

Water and Wastewater Analysis Laboratory Manual For Environmental Health Science Students
University of Gondar Collage of Medicine and Health Science 91
according to their sensitivity to environmental disturbance. The most sensitive organisms,
such as stoneflies, score 10 and the least sensitive, such as Oligochaete worms, score 1.
The scores for each family represented in the sample are then summed to give the BMWP
score. Total score ranges from 0 to 250. In order to reduce the effects of sample size,
sampling effort and sampling efficiency on the results obtained by this method, the average
score per Taxon (ASPT) should also be taken in to consideration.
This is obtained by dividing the BMWP score by the total number of taxa (families) in the
sample. The number of taxa present is indicative of the diversity of the community. A BMWP
score greater than 100, together with an ASPT value greater than 4, generally indicates
good water quality.
3.3. Sanitary parasitology
The development of medical parasitology has led to a wide range of techniques for the
enumeration of intestinal helminth eggs and larvae in feces and the basic principles of these
methods have been adapted to the enumeration of helminth eggs in sludge and compost.
The enumeration of intestinal helminth eggs and larvae in wastewater, however, is much
less straightforward. A great variety of human and animal parasite species, as well as free-
living species, may be present, varying in size, specific gravity and surface properties, and
at much lower concentrations than in feces, sludge or compost.
This test method describes the detection and enumeration of intestinal helminth eggs and
larvae in feces and in sludge and compost by modified Bailenger method procedure.
These pathogenic intestinal protozoa occur in domestic and wild animals as well as in
humans.
3.3.1. Equipment
The following will be required: plastic containers for sample collection; a centrifuge (capable
of generating 1000 g) and centrifuge tubes with lids (50-ml and 15-ml tubes are preferable);
Pasteur pipettes and teats; McMaster counting slides (1 or 2); a vortex mixer (not absolutely
essential); a siphon; a 10-ml or 50-ml measuring cylinder or 10-ml graduated pipette.

Water and Wastewater Analysis Laboratory Manual For Environmental Health Science Students
University of Gondar Collage of Medicine and Health Science 92
3.3.2. Reagents
The reagents required are the following: zinc sulfate solution (33%, relative density 1.18);
ether (or ethyl acetate); acetoacetic buffer (pH 4.5) (15 g sodium acetate trihydrate, 3.6
mLglacial acetic acid, made up to 1 liter with distilled water); detergent solution
(1 mL Triton X-100, made up to 1 liter with tap water).
3.3.3. Samples and Procedures
The method is very efficient for use with raw wastewater. However, the sample size must
be increased to at least 10 liters for the efficient recovery of eggs in treated waste-water
effluents, since egg numbers are then much lower. It consists of the following steps:
1. Collect a sample of wastewater of known volume (V-liters), usually 1 liter for raw or
partially treated wastewaters and 10 liters for final treated effluents.
2. Allow the sample to sediment for 1-2 hours, depending on the size of the container. It is
recommended that an open-topped, straight-sided container should be used for
sedimentation, since this makes removal of the supernatant easier and permits thorough
rinsing of the container (Fig. 3.1).
3. Remove 90% of the supernatant using a suction pump or siphon (Fig. 3.2).
Fig.3.1 - Straight-sided containers suitable for Sedimentation
Fig.3.2. Removal of the supernatant with a suction pump

Water and Wastewater Analysis Laboratory Manual For Environmental Health Science Students
University of Gondar Collage of Medicine and Health Science 93
4.Carefully transfer the sediment to one or more centrifuge tubes, depending on the volume,
and centrifuge at 1000 g for 15 min. Remember to rinse the container well with detergent
solution, and add the rinsing�s to the sediment (Fig. 3.3).
5. Remove the supernatant. If more than one centrifuge tube has been used in step 4,
transfer all the sediments to one tube (remember to rinse thoroughly with detergent solution
to ensure that no sediment is discarded), and re-centrifuge at 1000 g for 15 min.
6. Suspend the pellet in an equal volume of acetoacetic buffer, pH 4.5 (i.e. if the volume of
the pellet is 2 ml, add 2 ml of buffer). If the pellet is less than 2 ml, add buffer up to 4 ml to
ensure that, after extraction with ethyl acetate (steps 7 and 8), there is sufficient volume of
buffer above the pellet to allow the ethyl acetate layer to be poured off without re-
suspension of the pellet.
Fig.3. 3. Washing the sides of the container with dilute detergent solution. 7. Add two volumes of ethyl acetate or ether (i.e. 4 ml in the above example) (Fig. 3.4), and
mix the solution thoroughly in a vortex mixer. The sample can also be shaken by hand. This
is quite
acceptable if a mechanical mixer is not available (Fig. 3.5).

Water and Wastewater Analysis Laboratory Manual For Environmental Health Science Students
University of Gondar Collage of Medicine and Health Science 94
8. Centrifuge the sample at 1000 g for 15 min. The sample will now have separated into
three distinct phases. All the non-fatty, heavier debris, including helminth eggs, larvae and
protozoa, will be in the bottom layer. Above this will be the buffer, which should be clear.
The fatty and other material moves into the ethyl acetate or ether and forms a thick dark
plug at the top of the sample (Fig. 3.6).
Fig.3.4. The pellet with 1 volume of buffer and 2 volumes of solvent.
Fig.3. 5a. Homogenization of the sample can be carried out with a vortex mixer.
Fig. 3.5b. The sample can also be Homogenized by hand.

Water and Wastewater Analysis Laboratory Manual For Environmental Health Science Students
University of Gondar Collage of Medicine and Health Science 95
Fig.3. 6.Separation of the sample into three distinct phases after centrifugation.
Fig.3.7.The supernatant is discarded, leaving only the pellet.
9. Record the volume of the pellet containing the eggs, and then pour off the rest of the
supernatant in one smooth action (Fig. 3.7). It may be necessary to loosen the fatty plug
first by running a fine needle around the side of the centrifuge tube.
10. Re-suspend the pellet in five volumes of zinc sulfate solution, (i.e. if the volume of the
pellet is 1 mL, add 5 ml of ZnSO4). Record the volume of the final product (X mL)
(Fig.3.8). Mix the sample thoroughly, preferably using a vortex mixer. Note that a
minimum of 1.5 mLis required to fill a two-chambered McMaster slide.
11. Quickly remove an aliquot with a Pasteur pipette and transfer to a McMaster slide for
final examination (Fig. 3.9).
12. Leave the full McMaster slide to stand on a flat surface for 5 min before examination.
This allows all the eggs to float to the surface.
13. Place the McMaster slide on the microscope stage and examine less than 10× or 40×
magnification. Count all the eggs seen within the grid in both chambers of the McMaster
slide (Fig. 3.10). For greater accuracy, the mean of two slides, or preferably three, should
be recorded.

Water and Wastewater Analysis Laboratory Manual For Environmental Health Science Students
University of Gondar Collage of Medicine and Health Science 96
Fig. 3.8. The pellet, here 1 mL, is suspended in 5 Volumes of zinc sulfate solution.
Fig. 3.9.Filling a McMaster slide: air bubbles must be avoided.
Fig.3.10. Old-style McMaster slide: 0.15 mL is held under each grid.

Water and Wastewater Analysis Laboratory Manual For Environmental Health Science Students
University of Gondar Collage of Medicine and Health Science 97
14. Calculate the number of eggs per liter from the equation:
N = AX/PV
Where:
N = number of eggs per liter of sample
A = number of eggs counted in the McMaster slide or the mean of counts from two or three
slides
X = volume of the final product (mL)
P = volume of the McMaster slide (0.3 mL)
V = original sample volume (liters)
Remember that, if a single-chamber McMaster slide is being used, P = 0.15 mL (Fig. 3.11).
Fig.3.11. New style McMaster slide: 0.15 mL is held under the Single grid
3.3.3.1. Sedimentation time
Stokes� law can be used to calculate the settling rates of nematode eggs in water. At 20°C
the settling rates of the three most commonly found eggs are:
-Ascaris lumbricoides-------------------------------- 20 mm/min
-Trichuris trichiura ------------------------------------16 mm/min
-hookworms ---------------------------------------------6 mm/min
It is recommended that, to ensure the collection of all eggs, at least double the theoretical
settling time for any container depth should be used.

Water and Wastewater Analysis Laboratory Manual For Environmental Health Science Students
University of Gondar Collage of Medicine and Health Science 98
3.3.3.2. Acetoacetic buffer
Extensive work by Bailenger (1979) showed that the removal of helminths from fecal
samples was not just a matter of sedimentation or flotation based on relative density, but
that the hydrophilic-lipophilic balance of the parasite eggs in relation to the extraction
medium was also very important. By controlling the pH, the hydrophilic-lipophilic balance
can be modified so as to optimize the concentration of parasite eggs. Acetoacetic buffer at
pH 4.5 was found to be the most suitable for the concentration of a wide range of helminth
eggs.
3.3.3.3. Microscope calibration
Materials
The following are required:
Stage micrometer: a microscope slide on which a 1 mm scale has been engraved, divided
into 100 equal spaces. One space is equal to 10 µm.
Eyepiece micrometer, a special eyepiece on which a scale has been engraved. Not all
eyepieces have the same size subdivisions (this depends on the manufacturer).
Calibration of the eyepiece micrometer
Each microscope and each eyepiece used must be individually calibrated, as follows:
1. Place the stage micrometer on the microscope stage and, using the lowest power dry
objective, e.g. 4× or 10×, bring the scale into focus.
Fig.3.12. Representation of part of an eyepiece micrometer superimposed over stage micrometer for microscope calibration

Water and Wastewater Analysis Laboratory Manual For Environmental Health Science Students
University of Gondar Collage of Medicine and Health Science 99
3.3.3.4. Use of the McMaster slide
A McMaster counting chamber is a specialized microscope slide, which allows the number
of helminth eggs or larvae to be counted in a known quantity of a flotation solution. Two
models are now available through most commercial suppliers of laboratory equipment. In
the older, more commonly used model (Fig.3.10), the chamber is divided into two parts,
each of which has a grid etched on to the glass of the upper surface. The precise volume
contained under each of the two grids is 0.15-mL. In the new version (Fig. 3.11), there is
only one chamber, but the volume held under the grid is still 0.15-mL.
The principle of the McMaster slide is that the eggs are lifted in the flotation solution and lie
immediately below the upper glass of the chamber, while the heavier debris settles to the
floor. If the microscope is focused on the grid, the eggs will be clearly in focus while the
debris is not. By searching up and down the grid systematically, the number of eggs in 0.15-
mL of the suspension solution can be accurately counted.
To fill the two-chambered McMaster slide:
1. Mix the final flotation suspension thoroughly, preferably in a vortex mixer to ensure a
homogeneous mix. Quickly fill a Pasteur pipette and carefully run the solution into one
compartment of the McMaster slide. Fill the whole compartment completely even though it
is only the section under the grid that is to be counted. Work quickly and smoothly at this
stage so that eggs do not start to float in the test-tube or in the pipette. Ensure that there
are no air bubbles under the grid.
2. Fill the other compartment of the McMaster slide, remembering to re-homogenize the
solution first.
3. Leave the McMaster slide to stand for a few minutes before starting to count, thus
ensuring that all the eggs have floated to the surface and that the debris has been
allowed to settle.
4. Count the number of eggs under both grids. If there are large numbers of eggs and some
are under the lines, it is usual to count those on two sides of the grid as �in� (e.g. on the

Water and Wastewater Analysis Laboratory Manual For Environmental Health Science Students
University of Gondar Collage of Medicine and Health Science 100
top and left hand lines) and discard those under the other two lines (e.g. the bottom and
right hand lines). This gives a good estimate of the number of eggs present in 0.3-mL.
5. Make at least two (preferably three) counts if there is enough flotation solution, and take a
mean of the two (or three) counts. Calculate the number of eggs present in the original
sample using the formula given on above (remember that P = 0.15 if the new single-
chamber counting slide is used).
McMaster counting chambers are usually made of glass and can be ordered from most
major suppliers of scientific equipment. Some companies now produce less expensive
(and less fragile) plastic chambers. If these are used, care must be taken to ensure that
they do not become scratched.
3.3.4. Use of centrifuges Most published methods that involve the use of centrifuges quote centrifuge speed in terms
of relative centrifugal force. However, in some papers, speed is expressed in revolutions per
minute (rpm). To convert rpm to force, the following formula is used:
RCF = r (rpm) 2/k
Where:
RCF = relative centrifugal force (g),
r = radius of the centrifuge from the spindle to the centre of the bucket (cm),
k = 89 456.
To convert force to rpm:

Water and Wastewater Analysis Laboratory Manual For Environmental Health Science Students
University of Gondar Collage of Medicine and Health Science 101
3.3.5. Identification of helminth eggs
Wastewater frequently contains the eggs of parasites of animals, e.g. rats, domestic animals
such as pigs and dogs, and birds. Although it is not necessary to identify these positively, it
is important to recognize that they are not of human origin. Plate�s I-XVII (Fig.3.12) show a
number of the eggs of the human parasitic helminths most frequently encountered in
wastewater samples. Although these eggs are typical for each species, it must be
remembered that not all eggs are absolutely uniform in size and shape. A number of books
are available that will make identification easier. It is sometimes almost impossible;
however, to determine whether eggs are of human or animal origin, e.g. the eggs of Ascaris
suum (from pigs) and A. lumbricoides (from humans) are morphologically indistinguishable.
Similarly, the eggs of Trichuris spp. are all of similar color and shape. Eggs of the human
whipworm, T. trichiura, can only be separated from those of animal species by careful
measurement. For a comparison of human and animal helminth eggs, the plates in
Thienpont, Rochette & Vanparijs are excellent.
Human parasitic helminth eggs can be accurately identified using an eyepiece micrometer in
a microscope calibrated using the method given on above.
For this purpose, the egg, e.g. a Trichuris trichiura egg, is moved under the eyepiece
micrometer scale. If its length is found to cover 8 spaces of the scale using the standard 10×
objective calibrated. Its real length is: 8 × 6.7 = 53.6 µm
Similarly, if the same egg is measured again using the 40× objective calibrated in the
example, and 33.5 spaces are covered by the length of the egg, its real length can be
calculated as: 33.5 × 1.6 = 53.6 µm.

Water and Wastewater Analysis Laboratory Manual For Environmental Health Science Students
University of Gondar Collage of Medicine and Health Science 102
Plate I. Ascaris lumbricoides Plate II. Ascaris lumbricoides
(infertile)
Plate III. Trichuris trichiura Plate IV. Hookworm

Water and Wastewater Analysis Laboratory Manual For Environmental Health Science Students
University of Gondar Collage of Medicine and Health Science 103
Plate V. Enterobius vermicularis Plate VI. Capillaria hepatica
Plate VII. Capillaria philippinensis Plate VIII. Hymenolepis diminuta

Water and Wastewater Analysis Laboratory Manual For Environmental Health Science Students
University of Gondar Collage of Medicine and Health Science 104
Plate IX. Taenia sp. Plate X. Hymenolepis nana
Plate XI. Diphyllobothrium latum Plate XII. Clonorchis sinensis

Water and Wastewater Analysis Laboratory Manual For Environmental Health Science Students
University of Gondar Collage of Medicine and Health Science 105
Plate XIII. Fasciola hepatica Plate XIV. Paragonimus westermani
Plate XV. Schistosoma haematobium Plate XVI. Schistosoma japonicum
Plate XVII. Schistosoma mansoni
Fig 3.13 Helmenth eags from plate I to plate XVII.

Water and Wastewater Analysis Laboratory Manual For Environmental Health Science Students
University of Gondar Collage of Medicine and Health Science 106
3.4. Benthic macro invertebrates
Benthic macro invertebrate means organisms
Each aquatic organism has particular requirements with respect to the physical, chemical
and biological condition of its habitat. Changes in these conditions can result in reduction in
species numbers, a change in species dominance or total loss of sensitive species by death
or migration.
The presence or absence of living organisms in water can be one of the most useful
indicators of its quality. In streams, rivers, and lakes, the diversity of fish and insect species
provides a measure of the biological balance or health of the aquatic environment. A wide
variety of different species of organisms usually indicates that the stream or lake is
unpolluted. The disappearance of certain species and overabundance or other groups of
organisms is generally one of the effects of pollution tout for example, will soon disappear
from a polluted stream, whereas catfish and other scavenger organisms will thrive. If the
pollution is very severe, fish life will vanish altogether. Biologists can survey the fish and
insect life of natural waters and assess the water quality on the basis of a compound
species diversity index.
The particular water quality characteristics have been exploited in the development of
ecological methods based on �indicator species�.
These methods are frequently referred to as biotic indices and require a good knowledge
of the organisms in the specific environments to which the methods are applied. Information
on the physical and chemical status of the aquatic habitats in which these methods are used
is also essential in order to determine whether certain species could survive there even
under undisturbed conditions.
The fluctuations in diversity and numerical abundance of species have also been
developed in to a variety of community structure indices. These methods often require a
less detailed knowledge of the species in a particular habitat and have, as a result, been
rather widely applied without adequate investigation in to their biological relevance. They
are, nevertheless, very use full while a (possibly) more sensitive method is being developed
and tested. Macro-invertebrates are particularly suitable for both of these approaches.

Water and Wastewater Analysis Laboratory Manual For Environmental Health Science Students
University of Gondar Collage of Medicine and Health Science 107
He purpose of this section is to use standard methods to assess the quality of water for
the presence of various aquatic organism to water body by detection of macro-invertebrates
using various methods.
3.4.1. Methods
3.4.1.1. Chandler score:
This index overcomes the omission of relative abundance of indicator groups in the Trent
biotic index by recognizing five levels of abundance and weighting the score of each
indicator accordingly. For example each abundant sensitive species attracts a very high
score while each abundant tolerant species obtains a very low score.
Under temperate conditions the score rarely exceeds 1500 and would be 0 if no macro-
invertebrates are recorded.
Table 1Table 3.1 Scoring systems in the Chandler Biotic Index
Increasing Abundance Species
P F C A V
Each species of: Planaria alpina
- Perlidae, perlodidae
- Tenopterygidae
- Isoperlidae
- Chlorperlidae
- Each species of:
- � � Nemouridae
- Lectridae,Capniidae
- Amphinemura
- Each species of :Ephemmeroptera
- Each species of :cased caddis, megalopetion
- � � Ancylus
- � � Rhyacophila (Trichoptera )
90
84
79
75
70
65
94
89
84
80
75
70
98
94
90
86
82
77
99
97
94
91
87
83
100
98
97
94
91
88
Genera of Dicraneta, Limnophora 60 65 72 78 84

Water and Wastewater Analysis Laboratory Manual For Environmental Health Science Students
University of Gondar Collage of Medicine and Health Science 108
Genera of Simulium
- Genera of Coleoptera ,nematode
- Genera of Amphinemura(Plecoptera)
- Genera of Baetis ( Ephemmeroptera)
- Genera of Gammarus
56
51
47
44
40
61
55
50
46
40
67
61
54
48
40
73
66
58
50
40
75
72
63
52
40
- Each species � uncases caddis
- � � - Tricldida
- Genera of Hydracarina
- Each species of Mollusca
- � � - Chironomids
- � � - Glossiphonia
38
35
32
30
28
26
36
33
30
28
25
23
35
31
28
25
21
20
33
29
25
22
18
16
31
25
21
18
15
13
Each species of Aselus, 25 22 18 14 10
24
23
22
21
20
19
20
19
18
17
16
15
16
15
13
12
10
9
12
10
12
7
6
5
8
7
9
4
2
1
Each species of Leech (Glossiphona)
� � Haemopsis
� � Tubifex species
� � Chironomus riparius
� � Nais
� � Air breathing species
- No animal life 0
(source water and wastewater analysis, Gray, 1999)
Level of abundance in score systems
Level Number per 5 minutes samples
- P= present ���������������� 1-2
- F= Few ����������������� 3-10
- C= Common ��������������� 11-50
- A= Abundant �������������� 50-100
- V= Very abundant ������������. >100

Water and Wastewater Analysis Laboratory Manual For Environmental Health Science Students
University of Gondar Collage of Medicine and Health Science 109
3.4.1.2. The Biological Monitoring working party (BMWP) Score:-
In order to reduce the effort and taxonomic expertise necessary for routine biological
assessments based on indicator organisms, there is much interest in developing score
systems which rely only on identification to the family level and which are not specific to
any single river catchments or geographical area. One such method, the Biological
Monitoring working party score (BMWP) has been standardized by the international
organization for standardization (ISO). It can be used to reflect the impact of organic
pollution, such as results from sewage disposal or farm waste.
Table 2 Table 3.2 Allocation of biological scores in the BMWP score system.
Examples of the family. score
Siphnuridae, Heptagenidae, ephemeredllidae, ephemeridae periidae,
chloroperlidae, aphelocheiridae.
10
Phryganeidae, mollanidae, baracidae,heptoceridae, goeridae, sericostomatidae. 9
Lestidae, agriidae gomphidae,aeshnidae 8
Nemouridae, rhyacophilidae, polyentropodidae limnephilidae, caenidae 7
Neritidae,viviparidae, ancylidae unionidae 6
Elminthidae, clorysomelidae, hydrosychisae, 5
Bactidae,sialidae, pisciolodae. 4
Valvatidae, hymnaeidae, planorbidae sphaeriidae 3
Chironomidae 2
Oligochaeta (whole class) 1
(source Gray, 1999)
a.Selecting a Sample site.
Sample within the streams main flow
Sample at water depths of 10 to 40 cm
Collect three replicate samples in a single riffle; depth, flow and substrate type should be
similar for the three replicates.
Begin sample at the downstream end of the riffle and proceed upstream to collect the
three replicates;

Water and Wastewater Analysis Laboratory Manual For Environmental Health Science Students
University of Gondar Collage of Medicine and Health Science 110
b. When to sample:
Species composition and population sizes of macro invertebrates vary substantially
through a rivers seasonal cycles. Because the goal is to assess the influence of human
actions, not natural variation through time, collect samples during a short period.
In tropical climate such as Ethiopia, sampling during the dry season is preferable. This
timing gives representative samples of stream invertebrates and simultaneously.
1) Avoids endangering field crews (danger of floods)
2) Standardizes seasonal context
3) Maximizes efficiency of the sampling method because the effect of flash floods.
c. Procedure
1. Use a standardized collection technique (normally a pond net, although dredges or grabs
can be used in deep water) to collect macro invertebrates from each of the major habitat
types at the sample site.
2. Remove large pieces of organic debris or stones from the sample and empty it into a
suitable, labeled, container.
3. if sorting and identification can not be carried out in the field, the sample may be
preserved with formaldehyde or alcohol for transportation and storage at the laboratory.
4. Empty the sample into a white tray and sort the macro-invertebrates present into the
groups identified and tabulate the result.
5. Tick off the groups present on a sample record sheet. Note that even if more than one
species occurs for a particular group that group is only recorded once.
6. Add the scores for all groups ticked on the record sheet to give the BMWP score (e.g. if
oligochaete, Baetidae and caenidae were present the score would be 12).
7. Add up the total number of groups occurring in the sample (for the example given in the
step 6 above the total number is 3).
8. Divide the BMWP score by the total number of groups present to give the ASPT (for the
example above 12/3=4.
9. Record the result as BMWP------ASPT------- (for the example above the result of BMWP
12, ASPT 4 would suggest very poor water quality).
Water and Wastewater Analysis Laboratory Manual For Environmental Health Science Students
University of Gondar Collage of Medicine and Health Science 111
3.4.1.3. Community Structure
Community structure methods are based on the numerical abundance of each species
rather than relaying on particular indicator species. Some of the resultant indices are
derived from mathematical principles, such as information theory, and their direct relevance
to, and suitability for, the environmental situations in which they should be thoroughly
tested. Although knowledge of taxonomy is required to sort and count samples of
organisms, the indices can be useful to non-specialists as an indicator of whether
environmental conditions are changing. Community structure indices should only be used to
study changes at the same site over time or to compare sites with similar natural physical
and chemical features. They are normally applied to samples of organisms of the same
type, example:-benthic macro invertebrates, diatoms, or fish Widely used diversity indexes
are Shannon and Simpson index.
Diversity Indices.
Diversity indices are best applied to situations of toxic or physical pollution, which impose
general stress on the organisms. Stable ecosystems are generally characterized by high
species diversity, with each species represented by relatively few individuals. Although
diversity can be reduced by anthropogenic disturbance or stress, some natural conditions
can also lead to a reduced diversity (Such as nutrient poor head waters) and it is very
important that diversity indices are only used to compare sites of similar physical and
chemical characteristics.
i. Shannon � wiener index
This combines data on species or taxa richness with data on individual abundance.
The species number indicates the diversity of the system and the distribution of numbers of
individuals between species indicates the evenness. In a diverse community, we are
unlikely to guess correctly the species to which a randomly � chosen individual belongs.

Water and Wastewater Analysis Laboratory Manual For Environmental Health Science Students
University of Gondar Collage of Medicine and Health Science 112
- This measuring of uncertainty is done by the Scary equation below.
s
H1 = - ni/n lnni/n
i =1
Where n= the number of taxa in the sample
ni = the number of individual in the ith taxa.
with only one species (minimum diversity), In ni/n = log1 must be zero
With equally abundance species index is equal to in S maximum value rises
with S.
Procedure for the Shannon index
1. Sort organisms in to particular taxa (species, genus or family). All organisms should
be identified to the same taxonomic level, e.g. genus level.
2. Count organisms in each taxonomic group.
3. Total the number of organisms in the whole sample.
4. Calculate the Shannon index H1 from the following formula:
H1 = - ni/n ln ni/n
Where n= the number of taxa in the sample
ni = the number of individual in the ith taxa.
Note- The numerical values generated can not be taken to be indicative of any particular
water quality unless extensively tested and related to physical, chemical and biological
conditions in the specific water bodies from which they have been obtained. They can be
used, however, to show relative differences from one site to another with in the same
aquatic system or at the same site over time.
ii. Simpson index
- It is the second group of heterogeneity indices
- It is occasionally called Yule index, since it resembles the measure G.U Yule devise
to characterize the vocabulary used by different authors.

Water and Wastewater Analysis Laboratory Manual For Environmental Health Science Students
University of Gondar Collage of Medicine and Health Science 113
- It is a dominance measure.
Simpson�s index (D) Simpson (1949) gave the probability of any two individuals drawn at
random from an infinitely large community belonging to different species as:
D= Pi2
Where Pi= the proportion of individual in the ith species.
In order to calculate the index the form appropriate to a finite community is used:
D= ( ni (ni-1) )
N(N-1)
Where ni= the number of individuals in the ith species and
N= the total number of individuals.
As D increases, diversity decreases and Simpson�s index is therefore usually expressed
as 1-D or 1/D.
_ Simpson�s index is heavily weighted towards the most abundant species in the
sample.
In general � In a diverse community, two randomly chosen individuals are less likely to
belong to the same species ���.. This is the principle behind Simpson�s index, which
follows.
DIVERSTY = 1/D
With only one species (minimum diversity) 1/D must be 1
With equally-abound ant species, index is equal to richness S.
Some use 1-D as the index, instead of 1/D, in this case possible range is from
0 up to 1- 1/S
Isolating Richness and Evenness
Easy to get at species richness by counting them, although may need to consider
effect of sample size.
Usually try to isolate evenness by saying �OK�, we found S species, so what is the
maximum diversity value for that richness? ----- and how close to is does our
sample come?

Water and Wastewater Analysis Laboratory Manual For Environmental Health Science Students
University of Gondar Collage of Medicine and Health Science 114
Shannon � wiener:
Hmax = logS
Evenness � H1/Hmax = H1/logS
Simpson�s ---- (1/D)max = S
Eveness = 1/D = (1/D)
1/Dmax S
3.4.2. Sampling
Ecological methods can use a wide range of sampling techniques ranging from qualitative
collection (such as selection of macrophytes by hand), to semi-quantitative methods (such
as selection of benthic organisms using a standardized hand net technique), to fully
quantitative technique (such as bottle samples for plankton or grab samples for benthic
organisms). Ecological methods based on biotic or community structure indices require the
use of quantitative or semi-quantitative methods.
The simplest and cheapest method of collecting benthic invertebrates in shallow flowing
waters is by means of a standard hand net.
The following materials and equipment are recommended for collecting macro-invertebrate
samples from streams with rocky or gravel stream beds.
1. Kick seine (a fine 3'x3' net with a 1/16" mesh and 5-6' supporting poles on each side.)
2. White sheet (a large white plastic bag will do) to place under the kick seine when
locating collected specimens.
3. Containers for holding and sorting macro-invertebrates if you plan to identify the
collected specimens in the field. (White enamel or plastic shallow pans and ice cube
trays work well.)
4. Plastic buckets if you plan to transport the collected specimens to your "lab" for
identification. (It will be easier if the buckets have lids.)

Water and Wastewater Analysis Laboratory Manual For Environmental Health Science Students
University of Gondar Collage of Medicine and Health Science 115
5. Hand-held magnifying glasses (or magnifier boxes) to aid in specimen identification.
6. Tweezers or forceps for handling specimens (optional).
7. Small vegetable brushes for brushing macro-invertebrates from rocks during sample
collection (optional).
8. Wading boots or other tall waterproof boots and rubber gloves to wear during
sample collection.
9. Thermometer for recording stream-water temperature.
10. Yardstick for measuring the depth and width of the stream at the collection site.
11. Sample Record and Assessment Form, pencils, and clipboard
12. A copy of the Monitor's Guide to Aquatic Macro-invertebrates ( if you plan to
identify the collected specimens in the field.).
3.4.3. Procedure:
1. The net is held vertically against the river or streambed, with the mouth facing
upstream.
2. In shallow water the operator turns over the stones by had for a defined area
immediately upstream of the net. In deep water � The operator kick the
substrate in a defined area for a fixed period of time in order to dislodged the
organisms.
3. Stones from the defined area are examined and any attached organisms
dislodged in to the net.
4. The fine substrate from the sample area is also disturbed.
5. Continue the above activities for three minutes.
6. The contents of the net are gently washed.
7. Ideally, organisms should be identified and enumerated and preserve for later
sorting, identification and counting.

Water and Wastewater Analysis Laboratory Manual For Environmental Health Science Students
University of Gondar Collage of Medicine and Health Science 116
8. To reduce the volume of sample requiring preservation and storage, net
samples can be gently washed through a 500m sieve and placed in a white
dish containing water. The organism can then be sorted from the stones and
debris with a wide mouth pipette or forceps and placed in a labeled container
9. Then finally count.
10. The net should be thoroughly washed before taking the next sample.
3.4.4. Field Data Habitat Assessment
Aquatic invertebrates can be found in nearly any habituate from small temporary
pools to large lakes and small springs to large rivers. Some of the more extreme
habitats include highly saline waters (e.g. Great Salt Lake), pools of petroleum,
sewage treatment plant lagoons, and hot springs. With a water body, aquatic
invertebrates inhibit a variety of habitats. In lentic, or standing waters, aquatic
invertebrates occur at the bottoms of deep lakes, along vegetative margins, and in
open water. In lotic, or flowing waters, aquatic organisms occur under stones or
woody debris, buried in sand or sediment, and crawling or sprawling on rocks, leaf
packs and snags. The greater diversity of aquatic invertebrates is found in medium-
sized, forested streams with cobble and gravel substrates.
Habitat assessment from an important of the fieldwork component of ecological
methods because any change (natural or unnatural) in the habitat will lead to a
change in the ecological balance (species, abundance, and diversity of organisms
present). Consequently, a filed record sheet, which describes the habitat condition
and indicated any signs of contamination, should be completed for each sampling
site. (See annex -II).

Water and Wastewater Analysis Laboratory Manual For Environmental Health Science Students
University of Gondar Collage of Medicine and Health Science 117
3.5. Questions
1. List the necessary Laboratory equipments and materials to identify helminthic eggs.
2. Explain the purpose of identification of benthic macro-invertebrates in the water
body.
3. List some examples of insects, which are sensitive to polluted water.

Water and Wastewater Analysis Laboratory Manual For Environmental Health Science Students
University of Gondar Collage of Medicine and Health Science 118
CHAPTER FOUR
4. PHYSICO-CHEMICAL PARAMETERS
4.1. Objectives
At the end of this chapter, the students will be able to:
1. Know correct laboratory methods and procedures to analysis water and wastewater
samples.
2. Determine physical and chemical parameters of a sample.
3. Describe the essential reagents and equipments to examine water and wastewater
analysis.
4.2. Introduction
For the assessment of water and wastewater analysis the more commonly measured
parameters include pH, turbidity, DO, BOD, Ammonia, Oxidized Nitrogen (Nitrites plus
Nitrates), Phosphates chloride, fluoride, total dissolved solids. Continuous records of
concentration and flow would form the ideal basis for water quality assessment but in
practice this is impossible for financial, technical and logistical reasons. Reliance must,
therefore, be placed on discrete samples because such samples constitute only a minute
fraction of the whole body of water under investigation and because they are only
representative of conditions at the particular time of sampling the interpretation of data
arising from such samples requires great care.
Unlike the biological assessment of water quality, where the incidence and intensity of
pollution is based on the degree to which the chosen organism association deviates from its
expected natural diversity, the physico-chemical assessment is usually based on a
comparison of the measurements made with water quality criteria or with standards derived
from such criteria. The setting of national standards of water, sewage and other effluents by
WHO and recommended and accepted by ministry of health of Ethiopia. Some of the

Water and Wastewater Analysis Laboratory Manual For Environmental Health Science Students
University of Gondar Collage of Medicine and Health Science 119
physico-chemical parameters which are important in the analysis of water and waste water
with their procedures, chemicals and apparatuses are described in this chapter.
4.3. Color
Color in water may result from the presence of natural metallic ions (iron and manganese),
humus and peat materials, plankton weeds, and industrial wastes. Color is removed to
make water suitable for general and industrial applications. Colored industrial wastewaters
may require color removal before discharge in to water courses.
The term color is used hear to mean true color, that is, the color of water from which
turbidity has been removed. The term �apparent� color includes not only color due to
substances in solution, but also that due to suspended matter. Apparent color is
determined on the original sample with out filtration or centrifugation. In some highly
colored industrial waste waters color is contributed principally by colloidal or suspended
material. In such cases both true color and apparent color should be determined.
Color is determined by visual comparison of the sample with known concentration of
colored solutions. Comparison also may be made with special, properly calibrated glass
color disks. The platinum- cobalt method of measuring color is the standard method, the
unit of color being that produced by 1mg/l in the form of the chloroplatinate ion.
The platinum-cobalt method is useful for measuring color of potable water; it is not
applicable to most highly industrial waste waters. Even a slight turbidity causes the
apparent color to be noticeably higher than the true color; therefor remove turbidity before
approximating true color by differential reading with different color filters or by differential
scattering measurements. Remove turbidity by centrifugation or by filtration. The color
value of water is extremely pH dependent and in-variably increases as the pH of the water
is raised.

Water and Wastewater Analysis Laboratory Manual For Environmental Health Science Students
University of Gondar Collage of Medicine and Health Science 120
4.3.1. Apparatus and reagent
A. Nessler tube, matched, 50-ml, tall form
B. pH meter, for determining sample pH.
C. Potassium chloroplatinate, crystalline cobaltous chloride Concentrated HCl, distilled
water.
4.3.2. Procedure
1. Collect representative samples in clean glass wear .Make the color determination
within a reasonably period because biological or physical changes occurring in
storage may affect color. With naturally colored waters these changes invariably lead
to poor results.
2. Prepare a stock solution: - Dissolve 1.246 g potassium chloroplatinate,
K2PtCl6(equivalent to 500 mg metallic Pt) and 1.00 g crystallized cobaltous
chloride,CoCl2.6H2O (equivalent to about 250 mg metallic Co) in distilled water with
100 ml concentrated HCl and dilute to 1000 mL with distilled water. This stock standard
has a color of 500 units.
3. If K2PtCl6 is not available, dissolve 500mg pure metallic Pt in aqua regia with the acid of
heat; remove HNO3 by repeated evaporation with fresh portions of con HCl. Dissolve
this product, together with 1.00 g crystallized CoCl2.6H2O,as directed above.
4. Prepare standards having colors of 5,10,15,20,25,30,35,40,45,50,60,and 70 by diluting
0.5,1.0,1.5,2.0,2.5,3.0,3.5,4.0,4.5,5.0,6.0,and 7.0 ml stock color standard with distilled
water to 50 ml in nessler tubes. Protect these standards against evaporation and
contamination when not in use.
5. Observe sample color by filling a matched nessler tube to the 50 ml mark with sample
and comparing it with standards.

Water and Wastewater Analysis Laboratory Manual For Environmental Health Science Students
University of Gondar Collage of Medicine and Health Science 121
6. Look vertically down ward through tubes toward a white or specular surface placed at
such an angle that light is reflected upward through the columns of liquid. If turbidity is
present and has not been removed, report as �apparent color�
7. If the color exceeds 70 units, dilute sample with distilled water in known proportions until
the color is within the range of the standard.
8. Measure the pH of each sample.
9. Calculate the color units by the following equation:-
Color unit = A X 50
B
Where:-
A = Estimated color of a diluted sample and
B = mL sample taken for dilution.
10. Record color results in whole numbers and record as follows:-
Color unit Record to nearest
1-50 1
51-100 5
101- 250 10
251-500 20

Water and Wastewater Analysis Laboratory Manual For Environmental Health Science Students
University of Gondar Collage of Medicine and Health Science 122
4.4. Turbidity
It is a measure of the extent to which light is either absorbed or scattered by suspended
material in water. Correlation of turbidity with the weight or particle number concentration
of suspended matter is difficult, because the size, shape and refractive index of the
particles affect the light scattering properties of the suspension.
Historically, the standard method for determination of turbidity has been based on the
Jackson candle turbidimeter; however, the lowest turbidity value that can be measured
directly on this device is 25 Jackson Turbidity units (JTU). Because turbidities of water
treated by conventional fluid-particle separation processes usually fall within the range of 0
to 1 unit, indirect secondary method were developed to estimate turbidity.
Electronic Nephlometers are the preferred instruments for turbidity measurement.
Turbidity should be determined as soon as possible after the sample is taken.
The concentration of solid particles in water can be measured based upon its turbidity
using a turbidimeter. This instrument measures the amount of scattered light in a water
sample, and in general scattering intensity increases with particle concentration. In this
technique, a water sample in a glass cuvette is irradiated with white light and a detector,
located at an angle of 90 degrees from the incident beam, measures the amount of
scattered light. The preferred expression used to express turbidity is the nephelometric
turbidity unit (NTU). This nomenclature evolved from the original unit of turbidity defined
as the amount of scattered light originating from a 1 mg/L solution of SiO2 of specific size.
The turbidity of a water in-situ can be estimated using a Secchi disk, and particle counters
can be used to provide quantitative information about the number of particles in a water or
wastewater sample.
Direct microscopic examination provides information regarding the shape of particles and
the degree of particle aggregation. Although most theories of particle removal (for
example, equations describing the sedimentation of particles in settling basins) assume
that particles are roughly spherical, particles can possess a variety of shapes.
Furthermore, particles are not often isolated units but instead exist as members of large

Water and Wastewater Analysis Laboratory Manual For Environmental Health Science Students
University of Gondar Collage of Medicine and Health Science 123
aggregates with densities that depend on the size of the aggregate. Particle aggregates in
a given aquatic system may be composed of organic and inorganic particles, polymeric
material, as well as metals and other constituents.
4.4.1. Methods of determination 4.4.1.1. Jackson turbidity unit(JTU).
It is based on light absorption and employed a long tube and standardized candle. The
candle was placed beneath the glass tube that was then housed in a block metal sheathe
so that the light from the candle could only been seen from above the apparatus. The
water sample was then powered slowly in to the tube until the light candle was no longer
visible i.e. complete absorption had occurred. The glass tube was calibrated with
suspension of silica dioxide (SiO2).
1mg SiO2 per litter = 1JTU.
Fig.4.1. The Jackson candle turbidometer, showing short and long form tubes, source sawyer and Mc Carty chemistry for Environmental Engineers second edition.

Water and Wastewater Analysis Laboratory Manual For Environmental Health Science Students
University of Gondar Collage of Medicine and Health Science 124
4.4.1.2. Nephlometric Method
Most commercial turbidimeters designed for measuring low turbidities give comparatively
good indicators of the intensity of light scattered in one particular direction, predominantly
at right angles to the incidence light. Turbidimeters with scattered light detectors located at
900 to the incident beam are called nephlometers. Nephlometers are relatively unaffected
by small differences in design parameters and therefore are specified as the standard
instrument for measuring of low turbidity.
4.4.2 Apparatus and Reagent
1. Nephelometer (light source):- Tungsten filament lamp operated at a color
temperature between 2200 and 3000ok.
2. Cuvet.
3. Dilution water (distilled water).
4. Standard solution;
A. Stock primary standard formazin suspension.
Solution I, Dissolve 1.000gm hydrazine sulphate,(NH2)2.H2SO4, in distilled water and dilute
to 100mL in a volumetric flask.Solution II, Dissolve 10.00 gm hexamethylenetetramine,
(CH2)6N4, in distilled water and dilute to 100 ml in a volumetric flask. SolutiReference:on
III, Mix 5.0ml solution I and 5.0 ml solution II withinReference: a flask and left for 24
hours at 25oc + 3oc. This results in a 4000-NTU suspension. Transfer this solution in to
amber glass or UV light blocking bottle for storage. It is stable for up to one year when
properly stored. This primary standard is important for instrumental calibration.
B. Secondary standards.
Secondary standards are standards that the manufacturer (or an independent testing
organization) has certified will give instrument calibration results equivalent (within certain
limits) to the results obtained when the instrument is calibrated with the primary standard,
i.e. user prepared formazin. For example suspension of styrene-divinylbenzine

Water and Wastewater Analysis Laboratory Manual For Environmental Health Science Students
University of Gondar Collage of Medicine and Health Science 125
copolymer is available commercially. These suspensions can be instrument specific;
therefore, use only suspensions formulated for the type of nephlometer being used.
4.4.3. Procedure:- Turbidometer:
1. Rinse two cells with distilled water.
2. Fill one of the two cells with distilled water up to the cell mark
3. Put the cell with distilled water in the cell holder of the turbidometer and shield the
light,
4. press on button and adjust to the desired unit of measurement
5. When the reading gives zero, put out the cell from the cell holder (The turbidometer is
standardized).
6. Then put the cell with the sample up to the mark in the cell holder and shield the light.
7. Press on button and take the reading from the turbidometer.
NOTE:
1. Remove air bubble or any gas in the sample. Degas by partial vacuum, adding a
nonfoaming �type surfactant, using an ultrasonic bath, or applying by heat. Do not remove
air bubbles by letting samples stand for a period because during standing, turbidity-
causing particles may settle and sample temperature may change.
If fogging recurs, let sample warm slightly by letting it stand at room temperature, or
by partially immersing it in a warm water bath for a short time.
2. Shake samples well mixed.
3. Wait until air bubbles disappear and pour sample in to cell. When possible, pour well
mixed sample in to cell and immerse it in an ultrasonic bath for 1 to 2 second or apply
vacuum degassing , causing complete bubble release.
4. Interpretation of results.
Report turbidity readings as follow:-

Water and Wastewater Analysis Laboratory Manual For Environmental Health Science Students
University of Gondar Collage of Medicine and Health Science 126
Table 3 Table 4.1 Turbidity range that shows the nearest value in NTU.
Turbidity Range
NTU
Report to the nearest NTU
0-1.1 0.05
1-10 0.1
10-40 1
40-100 5
100-400 10
400-1000 50
>1000 100
Interferences: - Turbidity can be determined for any water sample that is free of debris
and rapidly settling course sediment. Dirty glassware and the presence of air bubbles give
false results.
4.5. Temperature
Temperature is an important parameter in natural surface water systems. Temperature of
surface waters governs to a large extent the biological species present and their rates of
activity. Temperature has an effect on most chemical reactions that occur in natural water
systems. Temperature also has a pronounced effect on the solubility of gasses in water.
The aim of this section is to measure the Temperature of the various forms of water and
wastewater by Thermometer, termistor and termophore instruments
4.5.1. Field methods.
A. Non �Depth temperature measurement:-
Temperature measurements may be made with any good mercury-filled Celsius
thermometer. As a minimum, the thermometer should have a scale marked for every
0.1oc. With marking etched on the capillary glass. The thermometer should have a

Water and Wastewater Analysis Laboratory Manual For Environmental Health Science Students
University of Gondar Collage of Medicine and Health Science 127
minimum thermal capacity to permit rapid equilibration. For field operations use a
thermometer having a metal case to prevent breakage. Thermometers are calibrated for
total immersion or partial immersion. One calibrated for total immersion must be
completely immersed to the depth of the etched circle around the stem just below the
scale level.
B. Depth Temperature Measurements.
Depth temperature required for limn logical studies may be measured with a reversing
thermometer, thermophone, or thermistor. The thermistor is most convenient and
accurate; however, higher cost may preclude its use. Calibrate any temperature
measurement devices with a national standards authority certified thermometer before
field use.
4.6. pH (Hydrogen ion concentration).
.
PH is the way of expressing the hydrogen ion activity. Measurement of PH is one of the
most important and frequent used tests in water and wastewater analysis such as:-Acid
base neutralization, Water softening, Precipitation, Coagulation, Disinfection, Corrosion
control. The concept of pH evolved from a series of development that led to fuller
understanding of acids and bases. Acids and bases were originally distinguished by their
difference in taste and latter by the manner in which they affect certain materials that
come to be known as indicators. With the discovery of hydrogen by Cavendish in 1766, it
soon becomes apparent that all acids contained the element hydrogen. Chemists soon
found that neutralization reaction between acids and bases always produced water. From
this and other related information, it was concluded that bases contained hydroxyl groups.
Concept of pH and POH by Bronsted lowery.
Ionization of water = H2O + H2O ====== H3+ + OH-
Kc = [H3+] [OH-]
[H2O]2 Assume [H2O] remains constant.
Kc < o

Water and Wastewater Analysis Laboratory Manual For Environmental Health Science Students
University of Gondar Collage of Medicine and Health Science 128
Kc [H2O]2 = [H3+] [OH-]
Kw = [H3O+] [OH-] - Kw Ionization constant of water
- Dissociation constant of water.
Kw = 1.0 x 10⁻¹⁴ at 25oc.
Kw = [H3O+] [OH-]
log Kw = log[H3O+] + log [OH-]
-log Kw = - log[H3O+] + -log [OH-]
P- Notation
Px = - log x = log 1/x
-log kw = Pkw.
- log [H3O+] = pH.
- log [OH-] = pOH.
P Kw = pH + pOH.
At a given temperature the intensity of the acidic or basic character of a solution is
indicated by PH or hydrogen ion activity.
PH = - log [H+].
PH scale is usually represented as ranging from 0 to 14, with pH 7 at 25oc representing
absolute neutrality.

Water and Wastewater Analysis Laboratory Manual For Environmental Health Science Students
University of Gondar Collage of Medicine and Health Science 129
The minus sign is used because most of the concentration encountered is less than 1M,
and so this delineation gives a positive number. The aim of this section is to determine the
pH of the various forms of water and wastewater by visual comparison method and
electrode method
The basic principle of electrometric PH measurement is determination of the activity of the
hydrogen ions by potentiometric measurement using a standard hydrogen electrode. The
hydrogen electrode consists of a platinum electrode across which hydrogen gas is
bubbled at a pressure of 101 kp.
Because of difficulty in its use and the potential for poisoning the hydrogen electrode, the
glass electrode commonly is used. The electromotive motive force (emf) produced in the
glass electrode system varies linearly with PH. this linear relationship is described by
plotting the measured emf against the PH of different buffers. Sample PH is determined by
trapolation
4.6.1. Apparatus & Reagent
1. PH meter:-Consisting, glass electrode, reference electrode potentiometer and
temperature compensating device.
Potentiometer: A cerimit is completed when the electrodes are emerced
reads as a form of PH or millivoHS
Reference Electrode: A hafe cell that provides a constant electrode potential
mostly calomel and silver that is silver- chloride electrodes.
Glass electrode: A special glass containing a fixed concentration of HCl or a
buffered chloride solution in contact with an internal reference electrode
1. Beaker: Preferably use polyethylene
2. Stirrer: Use either a magnetic or mechanical
3. Flow chamber: For continuous flow measurement or for poorly buffered solution.
Preparation of buffer solution to calibrate the electrode before measuring the PH. After
preparation the buffer solution should be replaced after 4 weeks and stored in polyethylene
bottles.

Water and Wastewater Analysis Laboratory Manual For Environmental Health Science Students
University of Gondar Collage of Medicine and Health Science 130
Table 4.2 Preparation of pH standard solutions.
Standard Solution (Molality) PH at
25OC
Weight of chemical
model/1000 ml at 25 OC
Primary Standards
Potassium hydrogen tartorate
0.05 potassium hydrogen
trate
0.05 potassium hydrogen
photalate
0.008695 potassium
dihydrogen phosphate +
0.03043 disodium hydrogen
phosphate
0.025 sodium bicarbonate +
0.025 sodium carbonate
3.557
3.776
4.004
7.415
10.014
7g KHC4H4O6
11.41g KH2C6H5O7
10.12g KH C8H4O4
1.179 g KH2 PO4+4.303g
NO2 HPO4
2.092 g Na HCO3 + 2.640g
Na2 CO3
Measurement of pH is one of the most important and frequent used tests in water
chemistry. pH measurements are affected by temperature in two ways: mechanical effects
that are caused by changes in the properties of the electrodes and chemical effects
caused by equilibrium changes.
4.6.2. Procedure
A. Color comparison.
A wide variety of indicators were calibrated with the hydrogen electrode to determine their
color characteristics at various at various pH levels. A number of naturally occurring or
synthetically prepared organic compound under go definite color changes in well defined
pH ranges. In general these compounds are weak acids or bases which changes color

Water and Wastewater Analysis Laboratory Manual For Environmental Health Science Students
University of Gondar Collage of Medicine and Health Science 131
when changed from the neutral to the ionized form. The pH at which the color change
takes place depends up on the ionization constant for the particular indicator which is
useful for various pH ranges are listed below. which is useful for various pH ranges.
From these studies it became possible to determine pH values fairly accurately by
choosing an indicator that exhibited significant color changes in particular range involved,
with the use of about six to eight indicators: it is possible to determine pH value.
Table 4.3 The preparation of various acid-base indicators.
INDICATOR ACID COLOR BASE COLOR PH RANGE
1.Methyl violet Yellow Violet 0-2
2.Malchite green Yellow Blue green 0-1.8
3.Tymol blue Red Yellow 1.2-2.8
4. Bromophenol blue Yellow red Blue 3-4.6
5. Methyl orange Red Yellow orange 3.1-4.6
6. Bromocresol green Yellow Blue 3.8-5.4
7. Methyl red Red Yellow 4.4-6.2
8. Litmus Red Blue 4.5-8.3
9. Bromothymol blue Yellow Blue 6.0-7.6
10. Mehta cresol purple Yellow Purple 7.6-9.2
11. Phenolphthalein Colorless Red 8.2-9.8
12. Thymol Phathaline Colorless Blue 9.3-10.5
13. Alizarin yellow Yellow Laic 10.1-11.1
14. Malachite green Green Colorless 11.4-13
For environmental health practice, methyl orange and phenolphthalein are commonly used
for all acid and base titration.

Water and Wastewater Analysis Laboratory Manual For Environmental Health Science Students
University of Gondar Collage of Medicine and Health Science 132
B. Glass Electrodes.
1. The electrodes are either immersed in, or have been rinsed with, distilled water,
remove them from the water and blot dry.
2. Rinse the electrodes and a small beaker with a portion of the sample
3. Pour sufficient of the sample in to the small beaker to allow the tips of the electrodes
to be immersed to depth of about 2 cm. The electrodes should be at least 1 cm away
from the sides and the bottom of the beaker.
4. Measure the temperature of the water sample and set the temperature adjustment
dial accordingly (if the instrument does not have automatic temperature
compensation).
5. Turn on the pH meter.
6. Read the pH of the water sample on the dial of the meter. Make sure that the needle
has stopped moving before the pH is recorded.
7. Turn the pH meter to stand-by and raise the electrode out of the sample. Remove
the sample and discard it. Rinse the electrodes and the beaker with distilled water,
blot the electrodes and the beaker with distilled water, and blot the electrodes with
soft tissue.
8. If others samples are to be tested, repeat steps 2to 7.
9. If no others samples are to be tested, slide the rubber sleeve down to cover the
hole in the side of the reference electrode and replace the protective rubber cap
on the tip.
10.Switch the meter off and pack it in its carrying case for transport.
4.7. Conductivity.
Conductivity (K) is a measure of the ability of the aqueous solution to carry an electric
current. This ability depends on:- Presence of ions, their concentration, mobility,
temperature, Valence.

Water and Wastewater Analysis Laboratory Manual For Environmental Health Science Students
University of Gondar Collage of Medicine and Health Science 133
Solutions of most inorganic compounds are relatively good conductors. Conversely
molecules of organic compounds that do not dissociate in aqueous solution conduct a
current very poorly, if at all.
Conductance is defined as the reciprocal of resistance, R.
G = 1/R
Where the unit of R is Ohm and G is ohm-1 (some times written mho). Conductance of a
solution is measured between two spatially fixed and chemically inert electrodes. To avoid
polarization at the electrodes surfaces the conductance measurement is made with an
alternating current signal. The conductance of a solution G is directly proportional to the
electrode surface area, A cm2 ,and inversely proportional to the distance between the
electrodes, L cm. the constant proportionality, K such that:
G = K (A/L), is called conductivity or specific conductance. In the international
system of units (SI) the reciprocal of ohm is the siemens(S) and conductivity is reported as
millisiemense per meter (ms/m).
1 ms/m = 10µmhos/cm.
Conductivity values of different water sources:-
o Distilled water____________0.5 to 3 µmhos/cm.
o Potable water_____________50 to 1500 µmhos/cm.
o Industrial wastes___________10,000 µmhos/cm.
The conductivity of a solution is a measure of its ability to carry an electric current. It
varies with temperature and depends on the presence of ions and their total concentration,
mobility, and valence. In practice, conductivity can be used as a measure of the dissolved
solids in water, and the greater the dissolved solids the greater the ability of the water to
carry electric current. Conductivity may also be referred to as specific conductance. The
conductivity of deionized water is typically between 0.5 and 3.0 S/cm, and that of potable
water ranges between 50 and 1500 S/cm. Wastewater conductivity may be as high as
10,000 S/cm. Measuring conductivity is important to:

Water and Wastewater Analysis Laboratory Manual For Environmental Health Science Students
University of Gondar Collage of Medicine and Health Science 134
Establish degree of mineralization to asses the effect of the total concentration of
ions on chemical equilibrium, Physiological effect on plants and animals, and
corrosion effect.
Asses degree of mineralization of distilled water and deionized water.
Determine the amount of ionic reagent needed in certain ppt. and neutralization
reactions.
Estimate the amount of total dissolved solids in a sample by multiplying conductivity
by an empirical factor. This factor may vary from 0.55 to 0.9 depending up on the
soluble components of the water and the temperature measurement.
The aim of this section is to determine the conductivity of the various forms of water and
wastewater by electrode method.
4.7.1. Reagent and Apparatus
1. Sample to be measured.
2. Standard potassium chloride solution:- KCl ,0.0100M: Dissolve ,745.6 mg
anhydrous KCl in conductivity water and distilled to 1000 ml in a volumetric flask at
250c. This is the standard reference solution, which at 250c has a conductivity of
1412 µmhos/cm. The solution must be stored in a plastic container and the air
space should be kept to an absolute minimum. This shelf life of 1 week can be
increased by storing below 40c, but where any doubt exists about the viability of
stored solution a fresh batch should be prepared.
3. Thermometer, capable of being read to the nearest 0.1oc and covering the range 23
to 27oc.Conductivity is a temperature dependent measurement. All substances
have a conductivity coefficient which varies from 1%/c0 to 3%/c0 for most commonly
occurring substances.
4. Conductivity cell; Platinum electrode type - conductivity cells containing platinized
electrodes are available in either pipet or immersion form.

Water and Wastewater Analysis Laboratory Manual For Environmental Health Science Students
University of Gondar Collage of Medicine and Health Science 135
4.7.2. procedures.
A. Measurement of conductivity in the Lab
1. Calibrate the instrument; Rinse conductivity cell with at least three portions of 0.01M
KCl solution. Adjust the temperature of a fourth portion to 25.0 + 0.10c .If
conductivity meter displays resistance, R, Ohms, measure resistance of this portion
and note temperature. Compute cell constant, C:
C (cm-1) = (0.001412) (RkcL) [1+0.019(t-25)]
Where:- RkcL = Measured resistance, Ohm, and
t = Observed temperature, 0c.
Conductivity meters often indicate conductivity directly. Commercial probes
commonly contain a temperature sensor. With such instruments, rinse probe three
times with 0.0100MKCL, as above. Adjust temperature compensation dial to
0.0191/C. With probe in standard KCl solution, adjust meter to read 1412 µmho/cm.
This procedure automatically adjusts cell constant internal to the meter.
2. Rinse cell with one or more portions of sample. Adjust temperature of a final portion to
about 250c. Measure sample resistance or conductivity and note temperature to +
0.10C.
3. Report all conductivities at 250c.
a). When samples resistance is measured, conductivity at 250c is .
K = (1000000)(C)
Rm[1+ 0.019(t-25)]
Where: - k = conductivity. µmho/cm
C = cell constant. Cm-.

Water and Wastewater Analysis Laboratory Manual For Environmental Health Science Students
University of Gondar Collage of Medicine and Health Science 136
Rm = measured resistance of sample, ohm, and
t = temperature of measurement.
b) When sample conductivity is measured without internal temperature compensation
conductivity at 250c is:
K, µmho/cm = (km)
1 +0.019(t � 25)
Where: - Measured conductivity in units of µmho/cm at t0c. and other units are defined as
above.
B. Measurement of conductivity at sample site
1. Turn on the conductivity meter.
2. Place the conductivity probe in the conductivity standard solution and verify the meter
is responding accurately.
3. Obtain approximately 200 mL of sample and place in a 250 mL beaker.
4. Place the probe in the sample solution and measure the conductivity. Record your
data in S/cm.
5. Estimate the TDS (in mg/L) by multiplying the conductivity by a conversion factor of
0.55.
Water and Wastewater Analysis Laboratory Manual For Environmental Health Science Students
University of Gondar Collage of Medicine and Health Science 137
4.8. Acidity
Acidity of water is its quantitative capacity to react with a strong base to designed pH.
Acidity is a measure of an aggregate property of water and can be interpreted in terms of
specific substance only when the chemical composition of the sample is known. Strong
mineral acids, weak acids such as carbonic and acetic and hydrolyzing salts such as iron
or aluminum sulphates may contribute to the measured acidity according to the measure
of determination.
The objective of this laboratory is to determine the acidity in water using the Methyl
Orange Acidity (Mineral Acidity) and Phenolphthalein Acidity (Mineral acidity + weak acid)
method.
A. Carbon dioxide acidity:-
Carbon dioxide is a normal component of all natural waters by absorption from the
atmosphere, but only when its concentration in water is less than that in equilibrium with
carbon dioxide in the atmosphere, in accordance with Henry�s law. Carbon dioxide may
also be produced in waters through biological oxidation of organic matter, particularly in
polluted water. In such cases, if photosynthetic activity is limited, the concentration of
carbon dioxide in the water may exceed equilibrium with that of the atom and CO2 will
escape from the liquid. Thus it may be concluded that surface waters are constantly
absorbing or giving up CO2 to maintain equilibrium with the atmosphere. The amount that
can exist at equilibrium with the atmosphere is very small because of low partial pressure
of CO2 in the atmosphere.
Carbon dioxide is an end product of both aerobic and an aerobic bacterial oxidation;
therefore, its concentration is not limited by the amount of DO originally present.
It is not uncommon to encounter ground waters with 30 to 50 mg/l of CO2. This is
particularly true of waters that have percolated through soil that do not contain enough
calcium or magnesium carbonate to neutralize the CO2 through formation of bicarbonate.

Water and Wastewater Analysis Laboratory Manual For Environmental Health Science Students
University of Gondar Collage of Medicine and Health Science 138
CO2 + CaCO3 + H2O---------Ca+2 + 2 HCO3- .
B. Mineral acidity.
♣ Mineral acidity is present in many industrial wastes particularly:-
♫ Industrial wastes such as:-Metallurgical industry, Production of synthetic organic
materials, Drainage from abandoned mines; Lean ore dumps will contain significant
amounts of sulphuric acid or salts of sulpher, sulphides, or iron pyrites.
♫ Conversion of these materials to sulphuric acid and sulphates is brought about by
sulpher oxidizing bacteria under aerobic conditions.
2S + 3O2 + 2H2O ------- bacteria---- 4H+ + SO4-2.
FeS2 + 7/2O2 + H2O ---bacteria ----- Fe+2 + 2H+ + 2SO4-2.
Fe3+ , Al3+ +Salts of heavy metals.FeCl3 + 3H2O---- Fe (OH)3 + 3H+ + 3Cl-. Fig fig fig
Fig 4.2. Types of acidity of important in ordinary sanitary analysis, and the pH ranges in which they are significant.

Water and Wastewater Analysis Laboratory Manual For Environmental Health Science Students
University of Gondar Collage of Medicine and Health Science 139
4.8.1. Reagents
a).carbon dioxide-free water: -- prepare all stock and standard solutions and dilution
water for the standardization procedure with distilled or deionized water that has
been freshly boiled for 15 min and cooled to room temperature. The final pH of the
water should be > 6.0 and its conductivity should be <2 µmhos/cm.
b). Potassium hydrogen phthalate solution:- approximately 0.05N: crush 15 to 20g
primary standard KHC8H4O4 to about 100 mesh and dry at 120OCfor 2h. Cool in a
desiccator�s. Weigh 10.0+ 0.5g (to the nearest mg), transfer to a 1-L volumetric flask,
and dilute to 1000 ml.
c). Standard sodium hydroxide titrant, 0.1N:- prepare approximately 0.1N by dissolving
4g NaOH in CO2 free water and diluting to 1liter. Standardize by titrating 40.00 mL
KHC8H4O4 solution using a 25-mL burette. Titrate to the inflection point, which should
be close to pH 8.7. Calculate the normality of NaOH:-
Normality = A x B
204.2 X C
Were:
A: gkHC8H4O4, Weighed In to 1-L Flask
B: mL kHC8H4O4 solution taken for titration and
C: mL NaOH solution used.
Use the measured normality in further calculations or adjust to 0.1 N; 1mL=5.00mg
CaCO3.
d). Standard sodium hydroxide titrant, 0.02N:- Dilute 200mL 0.1N NaOH to 1000mL
and store in a polyolefin bottle protected from atmospheric CO2 by a soda lime tube
or tight cap. 1mL = 100mg CaCO3.
e). Hydrogen peroxide, H2O2 30%.
f). Bromophenol blue indicator solution, pH 3.7 indicator:- Dissolve 100 mg
bromophenol blue, sodium salt, in 100ml water.
g). Meta cresol purple indicator solution, pH 8.3:- Dissolve 100mg metacresol purple in
100ml water.

Water and Wastewater Analysis Laboratory Manual For Environmental Health Science Students
University of Gondar Collage of Medicine and Health Science 140
h).Methyl orange indicator solution: - dissolve 500 mg methyl-orange powder in distilled
water and dilute to 1L
i). Phenolphthalein indicator solution, alcoholic, PH = 8.3 indicator:- Dissolve 8g
phenolphthalein in 500 mL 95 % ethyl or isopropyl alcohol and add 500mL distilled water.
If necessary add 0.02 N NaOH drop wise until a faint pink color appears.
j). Sodium thiosulfate, 0.1N:- dissolve 25g Na2S2O3. 5H2O and dilute to 1000 mL with
distilled water.
4.8.2. Procedures
A). Methyl Orange Acidity (Mineral Acidity)
1. Transfer a sample of suitable size, 50 or 100 ml if possible to an Erlenmeyer flask or
a white porcelain casserole.
2. If necessary, remove the residual chlorine by adding 0.05 ml (1 drop) of 0.1 N sodium
thiosulphate solutions.
3. Add. 0.1 ml (2 drops) methyl orange indicator solution and titrate against a white
background with standard 0.02N sodium hydroxide solution till a faint orange color
(PH)= 4.5) is obtained.
4. Record milliliters base consumed.
B). Phenolphthalein Acidity (Mineral acidity + weak acid).
1. Transfer a sample of suitable size, 50 or 100 ml if possible to an Erlenmeyer flask or a
white porcelain casserole.
2. If necessary, remove the residual chlorine by adding 0.05 ml (1 drop) of 0.1N sodium
thiosulphate solution.
3. Add. 0.15 ml (3 drops) phenolphthalein indicator solution and titrate against a white
background with standard 0.02 N sodium hydroxide to the appearance of the faint
pink color characteristic of PH=8.3.
4. Record the milliliters base consumed.

Water and Wastewater Analysis Laboratory Manual For Environmental Health Science Students
University of Gondar Collage of Medicine and Health Science 141
Calculation:
Acidity, as Mg/CaCO3/L = AXNX50,000
ml sample
Where:
A= ml standard base used and.
N= Normality of standard base.
NB: weak acid = Phenolphthalein Acidity- Methyl Orange acidity
4.9. Alkalinity
Alkalinity is a measure of the capacity of a water and wastewater sample to neutralize
strong acid. In natural waters this capacity is attributable to bases such as HCO3-, CO3
2-,
and OH- as well as to species often present in small concentrations such as silicates,
borates, ammonia, phosphates, and organic bases. Alkalinity in natural waters affects a
wide range of processes such as coagulation in water treatment operations, buffering
capacity of lakes and rivers, and ammonia stripping, to name a few.
Titrimetric method:
To determine the total alkalinity, a known volume of sample is titrated with a standard
solution of a strong acid to a final pH value of approximately 4.5. This endpoint is
commonly indicated by the color change of the indicator1 bromocresol green, and it
corresponds to the pH at which the conversion of bicarbonate to carbonic acid is
complete. The H+ added is the stoichiometric amount required for the following
reactions:
H+ + HCO3- H2CO3 [1]
At the pH corresponding to the endpoint of the titration for total alkalinity the solution
contains only H2CO3 and H2O.

Water and Wastewater Analysis Laboratory Manual For Environmental Health Science Students
University of Gondar Collage of Medicine and Health Science 142
For solutions with a high starting pH (nominally greater than 8.3), the alkalinity is
determined in two steps. In the first step, the titration is conducted to an endpoint pH of
approximately 8.3 (see Figure 3), where the conversion of carbonate to bicarbonate is
complete. At this endpoint, a stoichiometric amount of H+ has been added to complete the
following two reactions:
H+ + OH- H2O [2]
H+ + CO32- HCO3
- [3]
Figure 4.3. Titration curve for the carbonate system.
This is often termed the phenolphthalein endpoint, based on the use of the indicator phe-
nolphthalein (pKa ~ 8.3). This endpoint is typically poorly defined. In the second step of
the titration, the solution is titrated to convert bicarbonate to carbonic acid as previously
described and shown in equation [1]. The expressions in Table 4.4 can be used to predict
contributions from the three principal forms of alkalinity (CO32-, HCO3
- and OH-), based on
the phenolphthalein (P) and total alkalinity (T) endpoints. The values of P and T in Table
4.4 should be expressed in terms of meq/L or mg/L calcium carbonate.
2
3
4
5
6
7
8
9
10
11
12
-2.00-1.50-1.00-0.500.000.501.001.502.002.503.00
mL Acid
pH
Point of Inflection
Point of Inflection
H+ + OH- H2O
H+ + CO32- HCO3
-
H+ + HCO3-
H2CO3

Water and Wastewater Analysis Laboratory Manual For Environmental Health Science Students
University of Gondar Collage of Medicine and Health Science 143
Table 4.4. Forms of Alkalinity
Titration
Result
Hydroxide
Alkalinity
Carbonate
Alkalinity
Bicarbonate
Alkalinity
P=0
0 0 T
P
12
T 0 2P T-2P
P
12
T 0 2P 0
P
12
T 2P-T 2(T-P) 0
P=T T 0 0
Note that the true endpoint for alkalinity determinations is slightly variable and is best
determined by measuring the pH at different points of the titration and making a plot of this
versus volume of added acid. The true endpoints are then determined from this plot by
the points of inflection.
The aim of this section is to determine the concentration of different carbonate species
from alkalinity measurements.
4.9.1. Reagents
a). Standard sulfuric acid or hydrochloric acid0.1N: dilute 2.8-mL conc. H2SO4 (specific
gravity 1.834-1.836, 96-99% w/w H2SO4) or8.3-mL Conc. HCl (specific gravity 1.174-
1.189,36-37%w/w HCl) to 1000-mL standardize against the standard NaOH solution
prepared for Acidity determination.
b). Standard sulfuric acid or Hydrochloric acid, 0.02N; Dilute 200.00-mL 0.1000N
standard Acid to 1000-mL with distilled water.

Water and Wastewater Analysis Laboratory Manual For Environmental Health Science Students
University of Gondar Collage of Medicine and Health Science 144
c). Mixed bromocresol green-Methyl Red indicator solution: Dissolve 0.02g Methyl red
and 0.1g bromocresol green in 100ml 95% ethyl alcohol.
d). Phenolphalein solution, alcoholic pH 8.3 indicator: Dissolve 8g phenolphthalein in
500 mL 95 % ethyl or isopropyl alcohol and add 500mL distilled water.
e). Sodium thiosulfat 0.1N.
4.9.2.Procedures
1. Measure the appropriate sample volume for the indicated alkalinity ranges and
transfer
Sample Volume mL. Alkalinity Range mg/Las CaCO3
100
50
25
0.250
251-500
501-1,000
2. If necessary, remove the residual chlorine by adding 1 drop of sodium thiosulphate to
each flask and mix.
3. Add two drops of phenolphthalein indicator solution and mix. If the sample turns pink,
Carbonate or hydroxide is present, proceed with step. If the sample remains colorless,
the water contains bicarbonate or is acid. Skip steps 4 and 5 and go on to step 6.
4. If the sample turns pink, gradually add sulphuric acid titrant from the burette, shaking
the flask constantly until the pink just disappears.
5. Record the milliliters acid consumed
6. To the same sample, add 2 drops of mixed bromocresol green or methyl red indicator
solution.
7. Titrate with small volume of sulphuric acid titrant until the color changes from
greenish blue to light pink
8. Record the milliliters acid consumed. Calculate the total volume of acid used in the p-
Alkalinity titration (If step 4 is carried out) and the M-Alkalinity titration (Step 7)
9. Calculation:
Alkalinity mg/L as CaCO3 = AXNX50,000

Water and Wastewater Analysis Laboratory Manual For Environmental Health Science Students
University of Gondar Collage of Medicine and Health Science 145
mL sample
Where
A= mL standard acid used and
N= normality of standard acid
4.10. Total Hardness
Water and wastewater hardness is a means of quantifying the concentration of multivalent
cations. At sufficiently high concentration, hardness produces undesirable effects that
include the loss of detergency with the use of soaps, the formation of precipitates or
�scale� in boilers, hot-water heaters, and distribution pipelines, and undesirable taste.
While Mg2+ and Ca2+ are the primary hardness cations, Fe2+, Mn2+, and Sr2+ contribute to
water hardness in certain cases.
The total hardness of water is defined as the summation of the concentrations for
hardness cations, or �hardness� [Ca2+] + [Mg2+]. Hardness units are generally expressed
in mol/vol., equiv./vol., or as the equivalent mass of CaCO3/vol. Equivalent concentrations
in this case are computed on the basis of the metal ion charge. The total hardness may
be divided into two forms; �carbonate� and �non-carbonate� hardness. When the hardness
is numerically greater than the alkalinity due to carbonate and bicarbonate, that amount of
hardness equivalent to the total alkalinity (assuming OH-alkalinity is negligible) is called
carbonate hardness. The amount of hardness in excess is called the non-carbonate
hardness. When the hardness is numerically equal to or less than the sum of carbonate
and bicarbonate alkalinity, all hardness is carbonate hardness.
EDTA Titrimetric Method:
Most frequently, hardness is determined analytically by complex-formation titrations, which
involves adding a complexing or chelating agent to form coordination compounds, or
complex ions, with metal cations. Chelates are produced when a metal ion coordinates
with two or more donor groups of a single complexing molecule. In general, the stability of

Water and Wastewater Analysis Laboratory Manual For Environmental Health Science Students
University of Gondar Collage of Medicine and Health Science 146
a chelate is related in part to the number of coordinative bonds that can form between the
chelating agent and the metal ion.
One of the most common hardness test methods involves the aminopolycarboxylic
chelating agent, ethylene diamine (N,N,N�,N�) tetra acetic acid (called EDTA). The EDTA
molecule has the following structure:
HOOC
HOOC
COOH
COOH
N NH2C
CH2
H2C
CH2
H2C
CH2
The EDTA molecule has six potential sites for bonding with a metal ion: the four carboxyl
groups (pKa1=2.0, pKa2=2.8, pKa3=6.2, pKa4=10.3) and the two amino groups. Metal ions
usually have a coordination number of six, and thus form very stable complexes with
EDTA. If EDTA is not fully deprotonated, the complexes are less stable.
In the determination of hardness, samples are titrated with EDTA. Several competing
equilibria are involved. The sample solution is buffered at pH 10±0.1 as a compromise
between chelate stability and the prevention of metal ion precipitation (especially CaCO3
or Mg(OH)2). An ammonia buffer is used since ammonia forms weak complexes with
hardness cations and helps to prevent their precipitation. EDTA and EDTA-metal
complexes are not colored, and an additional chelating agent and indicator, calmagite, is
used to determine the endpoint of the EDTA titration. Calmagite is deep red when
complexed with divalent ions, and can be detected visually. The ammonia buffer is
usually spiked with a trace amount of Mg2+-EDTA to facilitate endpoint detection in the
event the sample does not contain Mg2+.
As the EDTA titrant is added to the sample solution, it reacts first with Ca2+, then with
Mg2+, since the Ca2+-EDTA complex is more stable than the Mg2+-EDTA complex:
EDTA+ Ca2+ Ca2+-EDTA K=1010.7
EDTA+ Mg2+ Mg2+-EDTA K=108.7

Water and Wastewater Analysis Laboratory Manual For Environmental Health Science Students
University of Gondar Collage of Medicine and Health Science 147
Metal ions are also readily extracted from ammonia complexes because metal-EDTA
complexes are much more stable. After adding sufficient EDTA, such that all of the free
Mg2 is complexed, further addition of EDTA removes Mg2+ from the Mg-calmagite
complex, causing the indicator to change to a blue color.
Mg-calmagite(red) + EDTA Mg-EDTA + calmagite(blue)
The resulting color change allows for the determination of the endpoint of the titration.
Since one mole of EDTA binds with exactly one mole of Ca2+ or one mole of Mg2+, the
total moles of EDTA added represents the total moles of hardness, or
Hardness(mg / L CaCO3) moles EDTA titrated
vol.sample titratedx
1 mole CaCO3
1 mole EDTAx
100, 000mg CaCO3
mole CaCO3
The purpose of this section is to introduce the concept of complex formation and stability
and to use this concept to measure the calcium and magnesium concentration in water.
4.10.1. Reagent and Apparatus.
a). Glassware: (25mL volumetric pipette, 100-mL volumetric flask, 50-mL burette,
plastic beakers).
b). Buffer solution: Dissolve 16.9g ammonium chloride (NH4Cl) in 143-mL of conc.
Ammonium hydroxide (NH4OH). Add 1.25g magnesium salt of EDTA and dilute to 250-mL
with distilled water. Store in a plastic or borosilicate glass container for no longer than 1
month. Stopper tightly to prevent loss of ammonia or pick up of CO2. Dispense by means
of a bulb-operated pipette.
C). Complxing agents:
Inhibitor I- Sodium cyanide powder
Inhibitor II- Dissolve 5.0g sodium sulfide anhydride (Na2S.9H2O) or 3.7g Na2S.
5H2O in 100 mL distilled water.

Water and Wastewater Analysis Laboratory Manual For Environmental Health Science Students
University of Gondar Collage of Medicine and Health Science 148
Inhibitor III- Dissolve 4.5g hydroxylamine hydrochloride in 100 mL of 95 %ethyl
alcohol.
d). Indicators: Liquid indicator: Dissolve 0.5g eriochrome Black T in 100g
triethanolamine or 2-methoxymethanol. Add 2 drops per 50mL solution to
be titrated.
Solid indicator mixture-weigh separately 0.5g eriochrome black T dye and
100g sodium chloride. Place in a mortar and grind together with a pestle
until the dark dye is uniformly distributed through the white salt. Store in a
tightly stopper bottle.
e). Standard EDTA titrant, 0.01M (0.02N) :
Weigh 3.723g analytical reagent-grade disodium ethylene
diaminetraacetate dehydrate, dissolve in distilled water and dilute to
1000mL. Standardize against standard calcium solution and store in a
polyethylene bottle. Compensate for gradual deterioration by periodic re-
standardization and by using a suitable correction factor.
f). Standard Calcium Solution:
Weigh 1.000g anhydrous CaCO3 power into a 500-mL Erlenmeyer flask.
Place a funnel in the flask neck and add, a little at a time, 1+1 HCl until
all the CaCO3, has dissolved. Add 200-mL distilled water and boil for a few
minutes to expel CO2 cool, add a few drops of methyl red indicator and adjust
to the intermediate orange color by adding 3N NH4OH or 1+1 HCl as required.
Transfer quantitatively and dilute to 1000-mL with distilled water, 1mL =
1.00mg CaCO3
g).Sodium Hydroxide: NaOH, 0.1N
4.10.2. Procedures
1. Measure the appropriate sample volume for the indicated hardness rages and transfer
to a 250 ml Erlenmeyer flask.

Water and Wastewater Analysis Laboratory Manual For Environmental Health Science Students
University of Gondar Collage of Medicine and Health Science 149
2. If a sample volume of 25 or 10-mL is used, bring the total volume to 50-mL by adding
distilled water.
3. Prepare a color comparison blank by placing distilled water in a similar flask and
which has the same volume as the sample used for analysis?
4. Add 1-2-mL of buffer solution to the color comparison blank and the sample and mix.
5. Add 0.2g solid indicator mixture (Eriochrome Black T) to the color comparison blank
and the sample. Mix to achieve dissolution
6. To the color comparison blank, carefully add from a burette one drop of EDTA titrant at
a time unit the purplish color changes to a bright blue.
7. Record the mL EDTA consumed.
8. If the sample turns a red or purple color in step 5, gradually add EDTA titrant from a
Burette shaking the flask constantly.
9. Continue adding the titrant until the wine red color turns to a purplish tinge. Stop the
titrant addition at this point for 10 seconds but continue the shaking (or stirring).
10. Resume adding the EDTA titrant drop by drop until the purple color turns to the same
bright blue color as in the color comparison blank. Shake the flask throughout the
addition of the titrant.
11. Record ml EDTA consumed
12. Calculate the net volume of titrant used for the sample alone by subtracting the ml titrant
consumed by the blank from the result found in step 11.
13. Calculation
Total hardness, as Mg/CaCO3/L = (A-B)XNX50,000
Ml of sample
Sample Volume mL. Alkalinity Range mg/Las CaCO3
50
25
10
0.300
301-600
601-1,500

Water and Wastewater Analysis Laboratory Manual For Environmental Health Science Students
University of Gondar Collage of Medicine and Health Science 150
Where
A= Ml titration for sample
B= Ml titration for Blank, and�
N= Normality of the EDTA titrant
Note:
1. Complete the titration within 5 minutes, measured from the time of buffer addition
2. The absence of a sharp end-point color change in the titration usually means that an
inhibitor must be added at this point or that the indicator has deteriorated.
4.11. Calcium and magnesium hardness
A) Calcium hardness
Hardness of water is a property caused by calcium and magnesium ions. The total
hardness is defined as the sum of the multivalent cations in water. Calcium and
magnesium concentrations usually dominate and both expressed as calcium carbonate in
milligrams per liter or eq/ L. Hardness is measured by forming chelates with metal ions
using the commonly used chelating agent ethylene diamine (N, N, N', N'), tetraacetic acid
usually called EDTA.
EDTA TITRIMETRIC METHOD
In the determination of hardness using EDTA, the sample is buffered at pH 10.0 to prevent
the precipitation of metal ions. Since EDTA and hardness complexes are not colored, an
additional chelating agent Eriochrome black T (EBT) is used for the endpoint
determination. A small amount of EBT is added to the test solution before the titration with
EDTA.
The purpose of the experiment is to introduce the concept of complex formation and
stability and to use this concept to measure the calcium and magnesium concentration in
water.

Water and Wastewater Analysis Laboratory Manual For Environmental Health Science Students
University of Gondar Collage of Medicine and Health Science 151
4.11.1. Apparatus and Reagent
APPARATUS:
� Burettes, ring stand, funnel, and burette holder
� Volumetric flasks
� 150 ml beaker
� Stirrer and magnetic stir bar
� 50 ml graduated cylinder
REAGENTS:
a) Standard CaCO3 Solution: Weigh 1.000 g anhydrous CaCO3 into 500-mL Erlenmeyer
flask. Place a funnel in the flask neck and add a little at a time 1 + 1 HCl until all the
CaCO3 has dissolved. Add 200 ml distilled water and boil for a few minutes to expel
CO2. Cool and adjust pH to a value of 5.0 using 3N NH4OH or 1 + 1 HCl as required.
Transfer to a 1 liter volumetric flask and bring-up to volume.
b) Buffer Solution: Dissolve 16.9 g ammonium chloride (NH4Cl) in 143 ml concentrated
ammonium hydroxide; add 1.170 g of disodium ethylene diamine tetracetate
dihydrate and 780 mg of MgSO4· 7H2O and dilute to 250 ml with distilled water. Keep
in the hood in a tightly stoppered plastic or resistant glass container.
c) EDTA Titrant, approx. 0.01 M (1 ml = 1 mg hardness as CaCO3): Dissolve 3.723 g
disodium ethylene diamine tetraacetate dihydrate (a.k.a. Titra Ver Hardness Reagent
or Ethylenediaminetetraacetic Acid, Disodium Salt, Dihydrate) in distilled water and
dilute to 1 liter.
d) EBT indicator: Dissolve 0.5 g of Eriochrome Black T and 4.5 g hydroxylamine
hydrochloride in 95% ethyl alcohol.
e) Sodium Hydroxide, 1N
f) Indicators: Murexide ammonium purpurate or calcon (eriochrome blue black R) solid
indicator mixture:

Water and Wastewater Analysis Laboratory Manual For Environmental Health Science Students
University of Gondar Collage of Medicine and Health Science 152
Weigh separately: 100g sodium chloride and either 0.2g murexide or 0.2g
calcon place the NaCl and the indicator in a mortar and grind and the indicator
in a mortar and grind together with a pestle until the dye is uniformly distributed
through white salt. Store in a tightly stoppered bottle.
4.11.2. Procedure
1. Measure the appropriate sample volume for the indicated calcium range and transfer to
a 250 ml Erlenmeyer flask.
2. Bring the total volume to 50 ml with distilled water if the sample size is less than 50ml.
3. Prepare a color comparison blank by placing distilled water in a similar flask and which
has the same volume as the sample
4. With a measuring pipet add 2 ml sodium hydroxide solution (IN) to the comparison
blank and the sample, and mix.
5. Add 0.2g solid indicator mixture (murexide or calcon) to the blank and sample
6. To the color comparison blank carefully and from a buret one or two drops of EDTA
titrant shaking constantly until the color turns to an unchanging orchid purple color if
murexide is used as indicator, and from wine red to a definite blue if calcon is used
7. Record the mL EDTA consumed
8. If in step 5 the sample turns a wine red colour, add EDTA titrant from a buret drop by
drop, shaking the flask constantly, until the colour changes to the same deep or chid
purple as the comparison blank (if murexide is used) or to a definite blue (is calcon is
used)
9. Record the mL EDTA consumed.
10. Calculation
Calcium hardness, as mgCaCO3/L = (A-B) XN 50,000
Ml of sample
Sample Volume mL. Alkalinity Range mg/Las CaCO3
50
25
10
0-200
201-400
401-1,000

Water and Wastewater Analysis Laboratory Manual For Environmental Health Science Students
University of Gondar Collage of Medicine and Health Science 153
Where: A= Ml titration for the sample
B= Ml titration for the blank, and
N= Normality of the EDTA titrant
Note:
1. Because of the high PH used in this procedure (PH 12 to 13) titrate immediately after
adding alkali and indicator.
2. Analyze hard waters with alkalinity higher than 300 mg CaCO3/L by taking a smaller
portion and diluting to 50-mL.
B) Magnesium hardness
Magnesium ranks eight among the elements inorder of abundances and is a common
constituent of natural water. Magnesium salts, important contributors to the hardness of
water, breakdown when heated, forming scale in boilers. Concentrations greater than
125mg/L also can have a cathartic and diuretic effect. The magnesium concentrations
may vary from zero to several hundred milligrams per liter, depending on the source and
treatment of the water. Magnesium can be determined with the atomic absorption
spectrometric, inductively coupled plasma methods, Gravimetric method and calculation
method.
CALCULATION METHOD:
Magnesium may be estimated as the difference between hardness and calcium as CaCO3
if interfering metals are present in non-interfering concentrations in the calcium titration
and suitable inhibitors are used in the hardness titration.
Or
mg Mg2+/L = (( H-A)* B*C* 1000)/mL of sample
Where:
H= mL of titrant for total hardness (mL of EDTA used for hardness)
A= mL of titrant for calcium ( mL of EDTA used for calcium)
B= concentration of EDTA
C= molecular weight of magnesium , 24.32
mg Mg/L = ( Total hardness as mg CaCO3/L � Calcium hardness as mg CaCO3/L) X 0.243

Water and Wastewater Analysis Laboratory Manual For Environmental Health Science Students
University of Gondar Collage of Medicine and Health Science 154
4.12. Chlorine (Cl2)
Chlorination is the most commonly used method of disinfection. Although there are
alternatives like ozone, chlorine is an inexpensive and a powerful oxidizing agent. The key
reactions are:
Cl2 + H2O < = > HOCl + H+ + Cl-
HOCl < = > H+ + OCl-
The prime disinfecting agent is the hypochlorous acid (HOCl) in which dissociation is pH
dependent. At a higher pH values, the hypochlorous acid yields less effective hypochlorite
(OCl-) ions. Together, HOCl and OCl- are called free available chlorine. The relative
proportion of these free chlorine forms is pH and temperature-dependent. The free
chlorine reacts readily with ammonia and certain nitrogenous compounds to form
combined chlorine. With ammonia, chlorine reacts to form the chloramines:
monochloramine, dichloramine, and nitrogen trichloride. The chloramines formed depend
on the pH of the water, the amount of ammonia available, and the temperature.
HOCl + NH3 => H2O + NH2Cl (Monochloramine)
HOCl + NH2Cl => H2O + NHCl2 (Dichloramine)
HOCl + NHCl2 => H2O + NCl3 (Trichloramine)
One disadvantage of chlorination is the potential formation of trihalomethanes (THMs) in
the presence of organic matter.
The two most common methods for measuring the chlorine residual in water are the
iodometric method and the DPD method. The iodometric method is suitable for measuring
total chlorine concentrations greater than 1 mg/L. The DPD method can measure lower
concentrations of total chlorine residual (down to 0.1 mg/L) and can measure individual
chlorine species. Chlorine residual should be analyzed on samples collected downstream
of chlorinated effluent discharges or increase where the presence of chlorine is suspected.
Chlorine has an effect on fecal coli form samples, BOD, cyanide,and
pesticides/herbicides. If chlorine is present in samples to be analyzed for BOD, cyanide, or
pesticides/herbicides, the samples must be treated with sodium thiosulfate to remove the
chlorine. Chlorine residual should be analyzed on a grab sample using the N,N-diethyl-p-

Water and Wastewater Analysis Laboratory Manual For Environmental Health Science Students
University of Gondar Collage of Medicine and Health Science 155
phenylenediamine (DPD)-ferrous ammonium sulfate (FAS)titration or using the DPD
colorimetric procedure.
The purpose is to determine amount of the various forms of residual chlorine by using the
DPD Method.
4.12.1. APPARATUS and REAGENT:
APPARATUS
Pipettes (5-mL, 3 per group) and pipette bulb.
Magnetic stirrer, stir bar, ring stand, burette, funnel, and burette holder
Four, 250-mL Erlenmeyer flasks
Balance Scale, spatulas, and weighing boats
100-mL graduated cylinder
500-mL volumetric flask
.
REAGENTS:
a).Chlorox solution (approximately 50,000 mg/L as Cl2): Purchase a fresh bottle of
Chlorox bleach from the supermarket. Prepare a 100mg/L Chlorine standard from the
Chlorox solution.
b). Phosphate buffer solution: Dissolve 24 g anhydrous Na2HPO4, and 46g anhydrous
KH2PO4 in distilled water. Combine this solution with 100 ml distilled water in which
800 mg disodium ethylenediamine tetraacetate dihydrate (a.k.a. Titra Ver Hardness
Reagent or Ethylene diaminetetraacetic Acid, Disodium Salt, Dihydrate) have been
dissolved. Dilute to 1 liter with distilled water, and to prevent interference in the free
available chlorine test caused by any trace amounts of iodide in the reagents.
c).N,N- diethyl - p- phenylenediamene (DPD) indicator solution: Dissolve 1g DPD
oxalate in chlorine - free distilled water containing 8 ml of approximately 9 N sulfuric
acid and 200 mg disodium ethylenediamine tetraacetate dihydrate (a.k.a. Titra Ver
Hardness Reagent or Ethylene diaminetetraacetic Acid, Disodium Salt, Dihydrate).

Water and Wastewater Analysis Laboratory Manual For Environmental Health Science Students
University of Gondar Collage of Medicine and Health Science 156
Make up to 1 liter, store in a brown glass - stoppered bottle. Discard when discolored.
Caution: DPD oxalate is toxic- take care to avoid ingestion.
d).Standard ferrous ammonium sulfate (FAS) titrant: Dissolve 1.106 g
Fe(NH4)2(S04)26H2O in distilled water containing 1 ml of approximately 9 N sulfuric
acid and make up to 1 liter with distilled water. 1 ml FAS titrant = 0.1 mg available
residual chlorine as Cl2. For a 100 ml sample 1ml FAS = 1 mg/L of available residual
chlorine as Cl2.
e).Potassium iodide, KI crystals.
f). Sulfuric acid, approximately 9 N: Slowly add 250-mL concentrated H2SO4 to
approximately 750-mL distilled water.
h). Samples: 2 mg/L control (analyze two times)
i). Blank (de-ionzied water)
4.12.2. PROCEDURE:
1. Using the standard provided, prepare 500 ml of a 2 mg/L solution of Cl2.
2. In a separate titration flask, mix 5-mL of buffer reagent and 5 ml of DPD indicator
solution.
3. Add 100-mL of the 2 mg/L chlorine solution to the titration flask. Mix the solution.
4. Free Chlorine (Reading A): Fill burette to zero reading at top with ferrous ammonium
sulfate titrant. Titrate rapidly until the red color is discharged. Observe the volume at
which this occurs. If the color reappears, do not titrate further.
5. Monochloramine (Reading B): Add one small KI crystal to the solution from part 4 and
mix, continue titration and observe the volume at which the red color disappears. Do
not titrate further if the red color reappears.
6. Dichloramine (Reading C): Add several KI crystals to the solution from part 5 and mix
for approximately 2 minutes, continue titration and observe the volume at which the red
color disappears. Allow the sample to stand for an additional 2 minutes if color
reappears. Titrate again and use new reading as reading �C�.
7. Nitrogen Trichloride (Reading D): Fill burette to zero reading. Obtain a clean titration
flask. Place a small KI crystal in the titration flask. Add 100 ml of sample and mix. Add

Water and Wastewater Analysis Laboratory Manual For Environmental Health Science Students
University of Gondar Collage of Medicine and Health Science 157
the contents to a second flask containing 5 ml of buffer solution and 5 ml of DPD
indicator solution. Titrate rapidly with FAS until the red color disappears.
8. Observe the volume at which it occurs.
9. Repeat procedure for tap water, untreated groundwater, and di-ionzed water.
Perform a replicate on the 2 mg/L control.
COMPUTATIONS:
4.13. Chloride
Chloride, in the form of chloride ion (Cl-), is one of the major inorganic anions in water and
waste water. In potable water, the salty taste produced by chloride concentrations is
variable and dependent up on the chemical composition of water.
Human excreta particularly the urine contains chloride in amount about equal to the
chlorides consumed with food and water. This amount averages about 6gm of chlorides
per person per day and increases the amount of chloride in municipal waste water about
15mg/l above that of the carriage water. Thus, waste water effluents add considerable
chlorides to receive streams. Many industrial wastes contain appreciable amounts of
chlorides.

Water and Wastewater Analysis Laboratory Manual For Environmental Health Science Students
University of Gondar Collage of Medicine and Health Science 158
Before the development of bacteriological testing procedures, chemical tests for chloride
and nitrogen, in its various forms, served as the basis of detecting contaminations of
ground water.
In many areas the level of chlorides in natural waters is an important consideration in the
selection of supplies for human, industrial, and agricultural use. Where brackish waters
must be used for domestic purposes, the amount of chlorides present is an important
factor in determining the type of desalting apparatus to be used. The chloride
determination is used to control the pumping of ground water from locations where
intrusion of sea water is a problem.
In areas where the discharge of salts water brines and industrial wastes containing high
concentrations of chlorides must be controlled to safe guard receiving waters, the chloride
determination serves as to excellent advantage for regulatory purpose.
Chlorides interfere in the determination of chemical oxygen demand. A correction is made
on the basis of the amounts present or else a complexing agent such as Mercury sulfate
can be added. High chloride content may harm metallic pipes and structures, as well as
growing plants.
The purpose is to determine amount of chloride water and wastewater by using the
argentometric Method.
ARGENTOMETRIC METHOD
4.13.1. Reagent.
a). Potassium chromate indicator solution:
Dissolve 50g K2 CrO4 in a little distilled water. Add AgNO3 solution until a definite a
red precipitate is formed. Let stand 12h filter and dilute to 1L with distilled water.
b). Standard silver nitrate titrant, 0.0141N:
Dissolve 2.395g AgNO3 in distilled water and dilute to 1000mL. Standardize against
0.0141N NaCl solution. 1.00mL = 500 µgCl-, store in a brown bottle.
Water and Wastewater Analysis Laboratory Manual For Environmental Health Science Students
University of Gondar Collage of Medicine and Health Science 159
c) Standard sodium chloride. 0.0141N: Dissolve 824g NaCl (dried at 140Oc) in distilled
water and dilute to 1000-mL, 1.00mL=600µg Cl-.
d) Special reagents for removal of interference:
i. Aluminum hydroxide suspension: dissolve 125g Aluminum potassium sulfate or
aluminum ammonium sulfate, in 1L distilled water. Warm to 60Oc and add 55mL conc.
NH4OH slowly with stirring. Let stand about 1hr transfer to a large bottle, and wash
precipitate by successive additions, with thorough mixing and decanting with distilled
water, until free from chloride.
ii. Phenolphthalein in indicator solution .
iii. Sodium hydroxide 1N.
iv. Sulfuric acid, 1N.
v. Hydrogen peroxide, 30%.
4.13.2. Procedure
1. Measure the appropriate sample volume for the indicated chloride range using the
following table and transfer to a 250 ml Erlenmeyer flask or porcelain casserole.
2. Brink the total volume to 100-mL with distilled water If the sample size is less than 100-
mL
3. Prepare a color comparison blank by placing distilled water in a similar flask and the
volume must be equal to that of the sample.
4. Add 1-mL potassium dichromate indicator solution to the blank and the sample; and
mix.
5. To the color comparison blank, carefully add from a burette drop by drop silver nitrate
titrant until the yellow color changes to a brownish tine.
6. Record the mL silver nitrate titrant consumed
Sample Volume mL. Alkalinity Range mg/Las CaCO3
100
50
25
10
1-50
51-100
101-200
201-500

Water and Wastewater Analysis Laboratory Manual For Environmental Health Science Students
University of Gondar Collage of Medicine and Health Science 160
7. If the sample turns yellow, gradually add silver nitrate titrate from a burette. Shake the
flask continuously and continue adding the titrant until the sample turns the same.
8. Record mL silver nitrate titrant consumed
9. Calculation
mg Cl/l= (A-B) XNX35,450
Ml of sample
Where
A= Ml nitration for sample
B= mL titration for blank and
N= normality of silver nitrate
Mg NaCl/L = (mg Cl/L) x 1.65
Note:
1. Directly titrate sample in the PH range 7 to 10. Adjust sample PH to 7 to 10 with
H2SO4 or NaOH if not in this range
2. For highly colored samples clarification with aluminum hydroxide suspension is
necessary
3. If sulfide, sulfite thiosulphate is present, add 1 ml hydrogen peroxide and stir for 1
minute.
4.14. Ammonia nitrogen
The compounds of nitrogen are great interest in environmental engineering because of the
importance of nitrogen compounds in the atmosphere and life process of all plants and
animals.
The chemistry of nitrogen is complex because of the several oxidation states that nitrogen
can assume and the fact that changes in oxidation states can be brought about by living
organisms. The chemistry of nitrogen of interest in water and waste water can
summarized as follows.
NH3------N2-------N2O3------N2O5

Water and Wastewater Analysis Laboratory Manual For Environmental Health Science Students
University of Gondar Collage of Medicine and Health Science 161
All thus forms of nitrogen are biochemical interconvert able and are components of the
nitrogen cycle. The oxidation state changes brought by bacteria and anaerobic conditions
prevail.
The two major factors that influence selection of the method to determine ammonia are
concentration and presence of interferences. In general, direct manual determination of low
concentrations of ammonia is confined to drinking waters, clean surface of ground water,
and good-quality nitrified wastewater effluent. In other instances, and where interferences
are present or greater precision is necessary, a preliminary distillation step ) is required
A titrimetric method , an ammonia-selective electrode method an ammonia-selective
electrode method using known addition , a phenate method and an automated version of
the phenate method are presented.
Nesslerization has been dropped as a standard method. a though it has been considered a
classic water quality measurement for more than a century. The use of mercury in this to
warrants its deletion because of the disposal problems.
The distillation and titration procedure is used especially to NH3-N concentration greater
than 5 mg/L. use boric acid the absorbent following distillation if the distillate is to be titrated.
The bulk of organic nitrogen occurs in the form of amino group (NH2) in the amino acid
that build up the proteins, Mineralization of proteins leads to conversion of the se amino
groups to ammonia further more, protein ingested by animals including man is largely
excreted in the form of urea, which is quickly hydrolyzed by bacteria in to carbon dioxide
and ammonia.
In the mineralization process and also in biological waste treatment, organic nitrogen
initially converted to ammonia.
In the presence of oxygen, ammonia can be converted by nitrosomonas to nitrite, which in
turn is then further oxidized by nitrobacter to nitrates.
NH3 +O2 nitrosomonas NO2 + 3H+
2NO2 + O2 nitrobactor 2NO3

Water and Wastewater Analysis Laboratory Manual For Environmental Health Science Students
University of Gondar Collage of Medicine and Health Science 162
The purpose is to determine amount of ammonia nitrogen in water and waste water by
using nesslerization method
DIRECT NESSLERIZATION METHOD
4.14.1. Reagent and apparatus
a). Zinc sulfate solution: dissolve 100g ZnSO4.7H2O and dilute to 1L with water.
b) Stabilize reagent(Rochelle salt solution): Dissolve 50g potassium sodium tartarate
tetrahydrat in 100-mL distilled water. Remove ammonia usually present in the salt by
boiling off 30-mL of solution. After cooling, dilute to 100-mL.
c) Nessler reagent: Dissolve 100g HgI2 and 70g KI in a small quantity of water and add
this mixture slowly, with stirring, to a cool solution of 160g NaOH dissolved in 500-mL
water. Dilute to 1L. Store in rubber stoppered borosilicate glassware and out of sunlight
to maintain reagent stability for up a year under normal laboratory conditions. Check
reagent to make sure that it yields the characteristic color with 0.1mg NH3-N/L with in
10min after addition and does not produce a precipitate with small amounts of
ammonia with in 2h. (Caution: Toxic care to avoid ingestion).
d) Stock ammonium solution: dissolve 3.819g anhydrous NH4Cl, dried at 100 0c In
water and dilute to 1000-mL, 1-mL = 1.00mgN = 1.22mg NH3.
e) Standard ammonium solution: dilute 10mL stock ammonium solution to 100mL with
water, 1.00-mL = 10.00 µg N= 12.2µg NH3.
f) 6N NaOH solution .

Water and Wastewater Analysis Laboratory Manual For Environmental Health Science Students
University of Gondar Collage of Medicine and Health Science 163
4.14.2. Procedure
1. Prepare series of standards by transferring the following amounts of standard
ammonium chloride solution to a 50-mL volumetric flask stoppered graduated cylinder
and dilution to 50-mL with ammonia free distilled water.
2. Nesslerize the standards by adding 1.0-mL Nessler�s reagent to each flask with a safety pipet.
3. Stopper and invert several times
4. Read the absorbance 425 nm at least 10 minutes after adding Nessler�s reagent
5. Plot a calibration curve absorbance versus concentration
Treatment of Samples
1. Take 100-mL of sample in a 100-mL volumetric flask or graduated cylinder
2. With a measuring pipette add 1-mL zinc sulfate solution and mix thoroughly
3. Add 0.4 to 0.5-mL 6N sodium hydroxide solution to obtain a PH of 10.5 and mix
thoroughly.
4. Let treated sample stand for a few minutes, where upon a heavy flocculent
precipitation should fall, leaving a clear and colorless super mate
5. Prepare a filter with a fast filter paper by washing it until it is free of ammonia (Check
then filtrate with Nessler�s reagent)
6. Pour estimated 25-mL of the clear liquid through the filter paper. Discard this filtrate.
7. Pour the remaining clear liquid through the same filter and catch the filtrate in a clean
100-mL stoppered graduated cylinder
Sample Ammonia Solution. mL Ammonia Nitrogen µg /50 mL
0
0.5
1.0
2.0
3.0
4.0
5.0
0
5.0
10.0
20.0
30.0
40.0
50.0

Water and Wastewater Analysis Laboratory Manual For Environmental Health Science Students
University of Gondar Collage of Medicine and Health Science 164
8. Measure the appropriate volume of the filtrate for the indicated ammonia nitrogen
range and transfer it to a 50-mL volumetric flask or graduated cylinder.
9. If necessary dilute to the 50-mL mark with NH3 FEE DISTILLED WATER
10. Add 0.05 to 0.10-mL (1 to 2 drops) Rochette salt solution and mix well.
11. Add 1-mL Nessler�s reagent with a safety pipette
12. Stopper and mix well
13. Allow the yellow or brownish color to develop for at least 10 minutes
14. Read the absorbance at 425 nm with a spectrophotometer
15. Determine the microgram NH*N from the calibration curve
16. Calculation
a) mg/L NH3- = ugNH3-N
Ml of sample
b) mg/L NH3- = ugNH3-Nx1.22
Ml of sample
c) mg/L NH4- = ugNH3-Nx1.29
Ml of sample
4.15. Nitrite nitrogen
Total oxidized nitrogen is the sum of nitrated and nitrite nitrogen. Nitrated generally occurs
in trace quantities in surface water but may attain high levels in some groundwater. In
excessive amount, it contributes to the illness known as methemoglobinemia infants. A limit
of 10 mg nitrate as nitrogen/L has been imposed on drinking water to prevent this disorder.
Nitrate is found only in small amounts in fresh domestic wastewater but in the effluent of
nitrifying biological treatment plants nitrate may be found in concentrations of up to 30 mg
nitrate as nitrogen/ L. It is an essential nutrient for many photosynthetic autotrophs and in
some cases has been identified as the growth-limiting nutrient.
Sample Ammonia Solution. mL Ammonia Nitrogen ug/50 mL
50
25
10
01-1.0
11-2.0
2.1-5.0

Water and Wastewater Analysis Laboratory Manual For Environmental Health Science Students
University of Gondar Collage of Medicine and Health Science 165
Nitrite is an intermediate oxidation state of nitrogen both in the oxidation of ammonia to
nitrate and in the reduction of nitrated. Such oxidation and reduction may occur in
wastewater treatment plants, water distribution systems and natural waters corrosion
inhibitor in industrial process water. Nitrite is the actual etiologic agent of
methemoglobinemia. Nitrous acid, which is formed from nitrite in acidic solution, can react
with secondary amines (RR�NH) to form nitrosamines (RR�N-NO), many of which are known
to be carcinogens. The toxicologic significance of nitrosation reactions in vivo and in the
natural environment is the subject of much current concern and research.
The purpose to determine amount of nitrite nitrogen in water and waste water by using the
diazotization method.
DIAZOTIZATION METHOD
4.15.1. Reagent and apparatus
a) Nitrite-free water: use nitrite-free water in making all reagents and
dilutions
b) Sulfanilamide reagent: dissolve 5g sulfanilamide in a mixture of 50mL conc. HCl and
about 300 mL water. Dilute to 500mL with water. The solution is stable for many
months.
c) N-(1-naphthyl-)ethylenediamine dihydrochloride solution: Dissolve 0.5g NED
dihydrochloride in 500-mL water. Store in dark bottle. Replace monthly or
immediately when it develops a strong brown color.
d) Hydrochloric acid, HCl, 1+3: Use water for dilution.
e) Stock Nitrite solution: dissolve 1.232g NaNO2 in water and dilute to
1000-mL 1.00-mL = 250µgN. Preserve with 1mL CHCl3.
f) Intermediate nitrite solution: dilute 50mL stock nitrite solution to 250-mL with distilled
water, 1.00-mL= 50.0µg N prepare daily.
g).Standard nitrite solution: dilute 1000-mL intermediate NO2- solution to1000-mL with
water 1:00-mL =0.500µg N prepare daily.
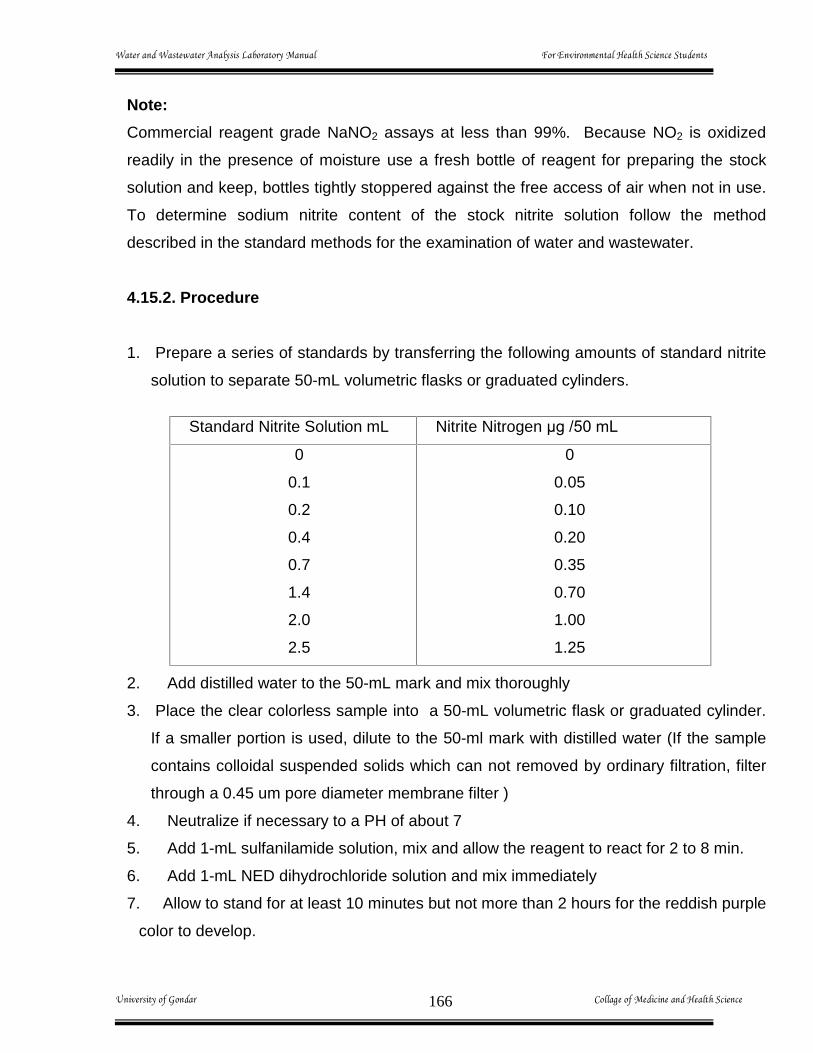
Water and Wastewater Analysis Laboratory Manual For Environmental Health Science Students
University of Gondar Collage of Medicine and Health Science 166
Note:
Commercial reagent grade NaNO2 assays at less than 99%. Because NO2 is oxidized
readily in the presence of moisture use a fresh bottle of reagent for preparing the stock
solution and keep, bottles tightly stoppered against the free access of air when not in use.
To determine sodium nitrite content of the stock nitrite solution follow the method
described in the standard methods for the examination of water and wastewater.
4.15.2. Procedure
1. Prepare a series of standards by transferring the following amounts of standard nitrite
solution to separate 50-mL volumetric flasks or graduated cylinders.
2. Add distilled water to the 50-mL mark and mix thoroughly
3. Place the clear colorless sample into a 50-mL volumetric flask or graduated cylinder.
If a smaller portion is used, dilute to the 50-ml mark with distilled water (If the sample
contains colloidal suspended solids which can not removed by ordinary filtration, filter
through a 0.45 um pore diameter membrane filter )
4. Neutralize if necessary to a PH of about 7
5. Add 1-mL sulfanilamide solution, mix and allow the reagent to react for 2 to 8 min.
6. Add 1-mL NED dihydrochloride solution and mix immediately
7. Allow to stand for at least 10 minutes but not more than 2 hours for the reddish purple
color to develop.
Standard Nitrite Solution mL Nitrite Nitrogen µg /50 mL
0
0.1
0.2
0.4
0.7
1.4
2.0
2.5
0
0.05
0.10
0.20
0.35
0.70
1.00
1.25

Water and Wastewater Analysis Laboratory Manual For Environmental Health Science Students
University of Gondar Collage of Medicine and Health Science 167
8. Measure the absorbance of each standard and the sample against a reagent blank in
a suitable photometer at 546 nm.
9. Determine the µg of NO2- N in the sample by reference to a standard calibration curve.
10. Calculation
a) mg/L NO2 -N = µg NO2-N
Ml of sample
b) mg/L NO2 = µgNO2-Nx3,285
Ml of sample
4.16. Nitrate Nitrogen
Determination of nitrate (NO3-) is difficult because of the relatively complex procedures
required the high probability that interfering constituents will be present, and the limited
concentration ranges of the various techniques.
An ultraviolet (UV) technique that measure the absorbance of NO3- at 220 nm is suitable for
screening uncontaminated water (low in organic matter) Screen a sample, if necessary then
select a method suitable for its concentration range and probable interferences. Nitrate may
be determined by ion chromatography. Applicable ranges for other methods are: nitrate
electrode method 0.14 to 1400 mg NO3- -N/L cadmium reduction method 0.01 to 1.0mg
NO3- -N/L stannous chloride method .0.01 to 10mg NO3
- -N/L hydrazine reduction method
0.01 to 10mg NO3- -N/L automated cadmium reduction method 0.5 to 10mg NO3
- -N/L. For
higher NO3- -N/L concentrations dilute into the range of the selected method.
Colorimetric methods require an optically clear sample. Filter turbid sample through 0.45 -
µm- pore-diameter membrane filter. Test filters for nitrate contamination.
Start No3- determinations promptly after sampling. If storage is necessary, store for up to 24
ha at 4OC. NOTE: when sample is preserved with acid, NO3- and NO2
- cannot be
determined as individual species.
The main purpose is to determine the nitrate concentration for various forms of water and
wastewater by phenoldisulfonic acid method.

Water and Wastewater Analysis Laboratory Manual For Environmental Health Science Students
University of Gondar Collage of Medicine and Health Science 168
PHENOLDISULFONIC ACID METHOD
4.16.1. Reagent and apparatus
a). standards silver sulfate solution: Dissolve 4.40g silver sulfate free from nitrate in
distilled water and dilute to 1000-mL ,1.00-mL = 1.00 mg /L
b). Phenoldisulfonic acid reagent: Dissolve 25g pure white phenol in 150-mL conc.
H2SO4.Add 75-mL fuming H2SO4 (15% free SO3) stir well and heat for 2 hour on a
hot water bath.
c). Ammonium hydroxide Conc: if this can not be used, prepare 12N KOH solution by
dissolving 673 g KOH in distilled water and diluting to 1 liter
d). EDTA reagent: Rub 50 gm disodium ethylendeiamine tetracetae dehydrate with 20-mL
distilled water to form a thoroughly weight paste add 60 ml concentrated ammonium
hydroxide(NH4OH) and mix well to dissolve the paste.
e). Stock nitrate solution: dissolve 9.7218g anhydrous potassium nitrate and dilute to
1000 mL with distilled water 1-mL = 100 µg N.
f) Standard Nitate solution: Evaporate 50.0-mL stock nitrate solution to dryness on a
steam or water bath dissolve the residue by rubbing with 2.0-mL phenoldisulfonic acid
reagent, and dilute to 500-mL with distilled water,1.00-mL= 10.0 µg N= 44.3 µg No3-
g). Reagent for treatment of unusual interference:
a. Aluminum hydroxide suspension-prepares as in for chloride determination but wash
KHO free of ammonia, chloride nitrite, and nitrate
b. Sulfuric acid 1N dilutes cautiously 28-mL conc. H2 SO4 to 11 with distilled water.
c. Potassium permanganate 0.1N: dissolve 0.316g KMNO4 in distilled water and dilute to
100-mL.
d. Dilute hydrogen peroxide solution: dilute 10-mL of 30% hydrogen peroxide to 100-mL
with distilled water.
e. Sodium hydroxide 1N: dissolve 40g NaOH and dilute to 1 Liter with distilled water.

Water and Wastewater Analysis Laboratory Manual For Environmental Health Science Students
University of Gondar Collage of Medicine and Health Science 169
4.16.2. Procedure.
1. Determine the chloride content of the water sample and treat 100 ml with an
equivalent amount of silver sulfate solution (1mL for 1 mg Cl) to precipitate the
chlorides
2. Remove the precipitated chloride either by centrifugation or by filtration coagulating
the AgC1 by heat If necessary.
3. If the sample has color of more than 10 unit (on platinum cobalt scale), decolorize by
adding 3-mL aluminum hydroxide suspension to 150-mL sample; stir very thoroughly;
allow to stand for a few minutes; then filter, discarding the first portion of the filtrate
4. Pipette a suitable quantity of the sample or the clarified filtrate in to an evaporating
dish and neutralize to approximately PH7
5. Evaporate to dryness over a hot water bath.
6. Add 2-mL phenoldisulfonic acid reagent and rub the residue thoroughly to insure
dissolution of all solids. If needed heat on the water bath a short time to dissolve the
entire reside
7. Dilute with 20-mL of distilled water and add with stirring about 6 to 7-mL of NH4OH or
about 5 to 6-mL KOH solution (12N) until maximum yellow color is developed
8. Remove any resulting flocculent hydroxides by filtration or add the EDTA reagent drop
wise with stirring until the turbidity re dissolves
9. Transfer the filtrate of clear solution to a 50-mL volumetric flask or graduated cylinder.
Rinse the dish, glass rod and filter paper with distilled water, adding the rinsing to the
flask or cylinder until all the colored solution has been transferred.
10. Dilute to the 50-mL mark with distilled water, and mix thoroughly
11. Measure the absorbance at a wave length of 410 nm against a blank prepared from
the same volumes of reagents as used for the samples.
12. Construct a calibration curve in the range 0-2mg/L NO3-N by adding 0,0.2,
0.5,1.0,3.0,5.0, and 10-mL of standard nitrate solution to separate evaporating dishes
and treating them in the same way as the sample.
13. Determine the µg of NO3-N in the sample by reference to the calibration curve
14. Calculation:

Water and Wastewater Analysis Laboratory Manual For Environmental Health Science Students
University of Gondar Collage of Medicine and Health Science 170
a) mg/L NO3-N = µg NO3-N
mL sample
b) mg/L NO3 = µg NO3-Nx4.427
mL sample
Note:
Nitrite levels in excess of 0.2 mg/L erratically increase the apparent nitrate concentration
as it responds like nitrate, Hence, the nitrite must be converted to nitrate by a suitable
oxidizing agent prior to the determination of nitrate.
Nitrite Conversion
To 100 mL of sample add 1 of 1 N sulphuric acid and stir, Add drop wise with stirring 0.1N
KMn04, solution. Let the treated sample stand for 15 minutes to complete the conversion of
nitrite to nitrate. A faint pink color persists for at least 15 minutes when sufficient KMn04, is
used.) Make the proper deduction at the end of the nitrate determination for the nitrite
concentration as determinate by the method described in nitrogen nitrite
4.17. Fluoride
Fluoride is a fairly common element representing about 0.3 g/kg of the earth crust. It is the
most active element known. It forms fluoride compounds and many complex ions.
Fluoride exists in a number of minerals of which fluor spar, cryolite and fluoro apatite are
the commonest. Fluorides occur naturally in many public water supplies and some food
staffs. They may also be added to water in controlled amount and may gain access to
water sources through in industrial pollution.
Fluoride has both beneficial and adverse effect on human health at decreasing level;
dental carries become a serious problem and at increasing level dental and skeletal
fluorosis become a problem.
High Fluoride
If fluoride is present in excess amounts, it may give rise to dental fluorosis in children 0-7
years of age in whom the teeth are under mineralization.

Water and Wastewater Analysis Laboratory Manual For Environmental Health Science Students
University of Gondar Collage of Medicine and Health Science 171
At levels above 1.5 mg/le mottling of teeth has been reported. The degree and severity of
mottling increases as the fluoride level rises.
At 3-6 mg/l skeletal fluorosis may be observed when concentration exceeded, crippling
fluorosis can ensure-endemic cumulative fluorosis with resulting skeletal damage both in
children and adult.
Low fluorides
Fluoride is an essential constituent of drinking water with regard to the prevention of
dental carries in both children and adults. Once fluoride is incorporated in to teeth, it
reduces the solubility of the enamel under acidic conditions and there by provides
protection against dental carries. If the fluoride concentration of drinking water is less than
0.5 mg/l the incidence of dental carries is likely to be high.
Research has shown that approximately 1mg/l of fluoride is desirable in public waters for
optional dental health. If effectively reduces dental carries with out harm full effects on
health. In situation where fluorides are added to provide an optimum level for the control of
dental carries, it is necessary to know the amount of supplementary fluoride can be added.
Whenever supplementation is practiced, it is necessary to monitor the finished water to be
sure that proper amount of chemical are being fed. The fluoride content of water source
determines the suitability of supply for development. If defluoridation units will depend on
the level of fluorides present in the water. Accurate determination of fluoride has increased
in importance with the growth of the practice of fluoridation of water supplies as a public
health measure. Maintenance of an optimal fluoride concentration is essential in
maintaining effectiveness and safety of the fluoridation procedure.
Among the methods suggested for determining fluoride ion (F-) in water the electrode and
colorimetric methods are the most satisfactory. Because both methods are subject to errors
due to interfering ions it may be necessary to distill the sample before making the
determination when interfering ions are not present in excess of the tolerances of the
method the fluoride determination may be made directly without distillation.
Fluoride measurements can be made with a specific ion electrode and either an expanded-
scale pH meter or a specific ion meter usually without distillation in the time necessary for

Water and Wastewater Analysis Laboratory Manual For Environmental Health Science Students
University of Gondar Collage of Medicine and Health Science 172
electrode equilibration. A curve developed from standards is used for determining the
fluoride concentration of a sample.
Preferably use polyethylene bottles for collecting and storage samples for fluoride analysis.
Glass bottles are satisfactory previously they have not contained high-fluoride solutions
ways rinse bottle with a portion of sample. Never use on excess of dechlorinating
agent. Dechlorinate sodium arsenite rather than sodium thiosulfate when using alizarin
photometric method because the latter may produce turbidity causes erroneous readings.
ALIZARIN PHOTOMETRIC METHOD
4.17.1. Reagent and apparatus.
a). Stock fluoride solution: dissolve 0.2210 g anhydrous sodium fluoride, NaF, in distilled
water and dilute to 1000mL, 1.00ml = 100µgF-.
b). Standard fluoride solution: Dilute 100 mL stock fluoride solution to 1000 mL with
distilled water, 1.00ml = 10.0. µgF-.
c). Alizarin red solution: Dissolve 0.75 g alizarin reds in distilled water and dilute to 1
liter. If insoluble material is present, filter protect from direct sun light.
d). Zirconyl acid reagent: Dissolve 133mg zirconyl chloride octahydrate,
ZrOCl2.8H2O, in about 25 ml distilled water. Add 350 ml con H2SO4 slowly, and dilute
to 500 ml with distilled water. Cool to temperature and after one hour the reagent is
ready to use.
e). Sodium arsenite solution: Dissolve 5.0 g NaAsO2 and dilute to 1L with distilled
water. (Caution: Toxic1 � avoid ingestion).
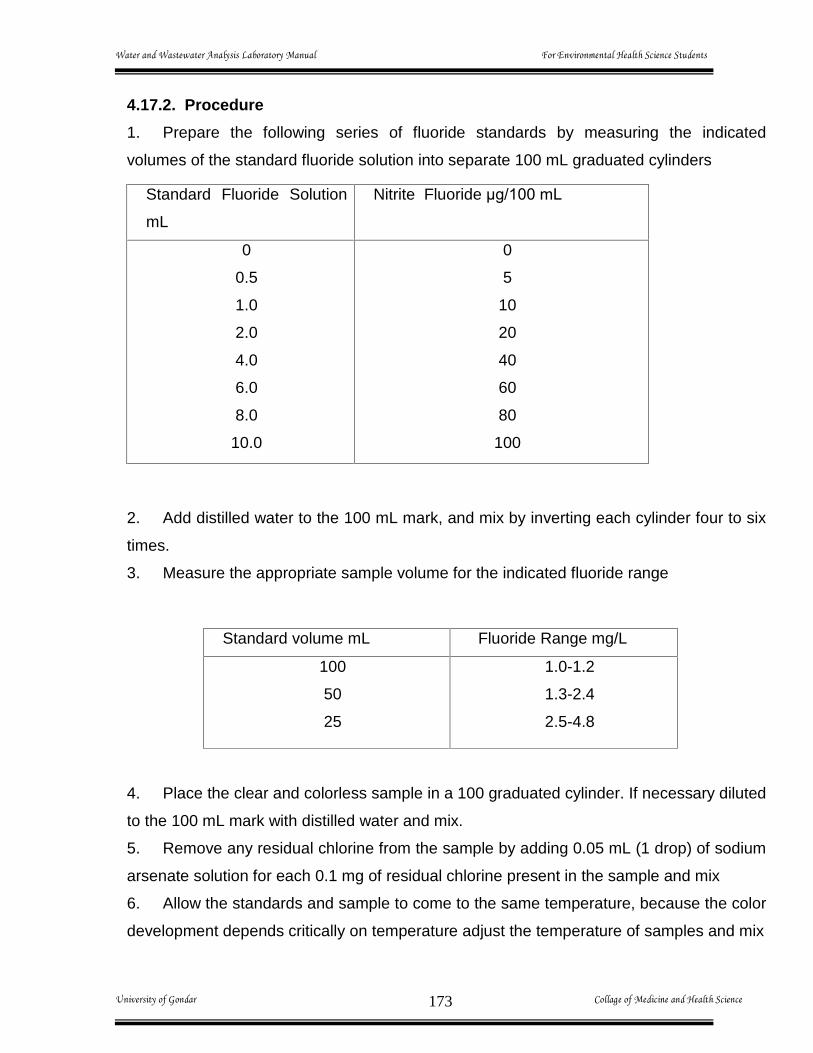
Water and Wastewater Analysis Laboratory Manual For Environmental Health Science Students
University of Gondar Collage of Medicine and Health Science 173
4.17.2. Procedure
1. Prepare the following series of fluoride standards by measuring the indicated
volumes of the standard fluoride solution into separate 100 mL graduated cylinders
2. Add distilled water to the 100 mL mark, and mix by inverting each cylinder four to six
times.
3. Measure the appropriate sample volume for the indicated fluoride range
4. Place the clear and colorless sample in a 100 graduated cylinder. If necessary diluted
to the 100 mL mark with distilled water and mix.
5. Remove any residual chlorine from the sample by adding 0.05 mL (1 drop) of sodium
arsenate solution for each 0.1 mg of residual chlorine present in the sample and mix
6. Allow the standards and sample to come to the same temperature, because the color
development depends critically on temperature adjust the temperature of samples and mix
Standard Fluoride Solution
mL
Nitrite Fluoride µg/100 mL
0
0.5
1.0
2.0
4.0
6.0
8.0
10.0
0
5
10
20
40
60
80
100
Standard volume mL Fluoride Range mg/L
100
50
25
1.0-1.2
1.3-2.4
2.5-4.8

Water and Wastewater Analysis Laboratory Manual For Environmental Health Science Students
University of Gondar Collage of Medicine and Health Science 174
7. With a volumetric pipette, add 5 mL Alizarin Red reagent & 5 mL acid zinconyl
reagent to each of the standards and the sample. complete the addition of reagent to the
entire series of cylinders with in 5 minutes.
8. Mix the contents by inverting four to six times
9. Allow to stand for at least 1 hour + 5 minutes
10. Measure the standard and sample absorbace at 550 nm using distilled water to zero
the spectrophotometer
11. Construct a calibration curve using the standard series
12. From the calibration curve determine the microgram fluoride in the sample making
the necessary blank correction
mg/L F- = µg F-
ml of sample
4.18. Phosphate
Phosphate in natural waters. Phosphorus is an essential nutrient for algal growth, and when
in excess it is one of the leading causes of eutrophication. The primary sources of
phosphorus in natural systems include wastewater treatment facilities, runoff of fertilizer
from agricultural operations, detergents and some natural sources. Under summer growing
conditions, it has been established that the critical level for inorganic phosphorus is
approximately 5 g/L.
Orthophosphates and polyphosphates are the most common forms of inorganic phosphorus
found in natural waters. Orthophosphates contain a single phosphorus molecule, and
common orthophosphates include trisodium phosphate (Na3PO4), disodium phosphate
(Na2HPO4), monosodium phosphate (NaH2PO4), and diammonium phosphate
((NH4)2HPO4). Polyphosphates contain multiple phosphorus molecules, and examples
include sodium hexametaphosphate (Na3(PO3)6), sodium tripolyphosphate (Na5P3O10), and
tetrasodium pyrophosphate (Na4P2O7). Polyphosphates hydrolyze in natural waters to the
ortho form, typically in the time frame of several hours to days.

Water and Wastewater Analysis Laboratory Manual For Environmental Health Science Students
University of Gondar Collage of Medicine and Health Science 175
Several techniques are available for the determination of phosphorus in natural water
samples, including gravimetric, volumetric, and colorimetric methods. Gravimetric and
volumetric methods are best when the concentration of phosphorous is high. In most
environmental engineering applications, this is not the case, and colorimetric methods are
preferred. The method detection level for phosphate by colorimetry is approximately 0.1
mg/L as phosphorous, or 0.01mg/L if an extraction step is included, and thus it is the most
common technique used for the analysis of water and wastewater.
Colorimetry and Beers Law. Spectrophotometer methods are used to determine the
concentration of dissolved substances that absorb light in the ultraviolet (~180-400nm) or
visible (~400-800nm) wavelength range. These methods make use of the Beer-Lambert
Law, i.e. the relationship of the amount of light transmitted by a solution to the concentration
of the light absorbing constituent, namely,
Log(I0 / I) A bc [1]
where I is the intensity of monochromatic light transmitted through the test solution, I 0 is the
intensity of light transmitted through the reference solution (or �blank�), A is the absorbance,
is the molar absorptivity or extinction coefficient (a constant for a given solute and
wavelength), b is the path length, and c is the concentration of absorbing solute.
For solutions that obey Beer�s Law, light absorbance is directly proportional to the path
length and the concentration of the absorbing species. Alternatively, the intensity of the
light transmitted through the solution can be measured. The transmittance, T, of a
solution is defined as I/I 0 , and percent transmittance as 100xT.
In this set of experiments you will perform a spectrophotometric determination of
orthophosphate in solution. The instrument that will be used in this experiment is a visible
wavelength spectrophotometer. Light from a tungsten lamp is directed through a
diffraction grating and a wavelength bandwidth of ~20nm is selected with a slit. The
monochromatic beam is then passed through the sample, and light that is not absorbed is
received by a light-sensitive phototube. The analog or digital signal is then displayed on
the instrument panel. Variations at different wavelengths in the light source emission

Water and Wastewater Analysis Laboratory Manual For Environmental Health Science Students
University of Gondar Collage of Medicine and Health Science 176
intensities, response characteristics of the phototube, and light absorption by the cuvette,
require that the intensity control be adjusted to compensate for these effects.
The sensitivity of a spectrophotometric analysis depends on the degree of adherence to
Beer�s Law, the absorptivity of the species being measured relative to other compounds
present, and the path length of the sample cuvette. Deviations from Beer�s Law can occur
for several reasons, particularly if the molar absorptivity over the bandwidth of
wavelengths varies significantly, if the sensitivity of the phototube is exceeded, if the
extent of equilibrium among species changes, or if one of the solutes fluoresces. Other
nonlinear effects are also possible. Spectrophotometric methods are most sensitive when
the species of interest has a much greater extinction coefficient than all other sample
constituents. Furthermore, to maximize the sensitivity of a measurement, wavelength
selection should be determined from the absorption spectrum; the analyst must choose a
wavelength near the region where maximum light absorption occurs and where the
absorptivity is reasonably constant over the 20nm bandwidth.
Stannous Chloride Colorimetric Method. In this laboratory we will use the stannous
chloride colorimetric method for the determination of orthophosphate in water samples. In
this method, phosphates combine with ammonium molybdate under acid conditions to
form a molybdophosphate complex,
PO43- + 12(NH4)2MoO4 + 24H+ (NH4)3PO412MoO3 + 21NH4
+ + 12H2O
When large amounts of phosphate are present this reaction forms a yellow precipitate that
can easily be detected using a spectrophotometer. For cases in which the concentration
of phosphate is low (<30mg/L), which is common for most environmental applications, an
additional step is needed. When stannous chloride is added, it reduces the
molybdophosphate complex forming a molybdenum blue complex,
(NH4)3PO412MoO3 + Sn2+ (molybdenum blue) + Sn4+
The reduced blue complex is easily detected at 690nm using a standard UV-Vis
spectrophotometer. When polyphosphates are present, an additional acid hydrolysis step

Water and Wastewater Analysis Laboratory Manual For Environmental Health Science Students
University of Gondar Collage of Medicine and Health Science 177
converts all polyphosphates to orthophosphates. However, in most natural samples,
orthophosphates represent greater than 95% of the total phosphorus present.
The objective of this laboratory is to determine the concentration of phosphorus in water
using the stannous chloride colorimetric method.
STANNOUS CHLORIDE METHOD
4.18.1. Reagent and apparatus
Apparatus
a).Glassware: (200mL volumetric flask [1 per analysis ], 500mL or 250 mL
Erlenmeyer flasks [1 per standard], 10mL Mohr pipette, 2-3 clean
spectrophotometric cuvettes, 100mL graduated cylinder (1), 250mL beaker (1-
2 per analysis ), timer.
b). Spectrophotometer: (capable of operating at a wavelength of 690nm).
Reagent
a). Phenolphthalein Indicator: dissolve 0.2g phenolphthalein into 200mL
deionized water and 200mL ethanol.
b) Ammonium Molybdate Reagent: Dissolve 25g (NH4)6 MO7O24 .4H2O in 175 ml
distilled water. Cautiously add 280 ml con. H2SO4 to 400 mL distilled water. Cool,
add molybdate solution, and dilute to 1litter.
c.)Stannous Chloride Reagent: Dissolve 2.5g of fresh stannous chloride in 100mL
glycerol (also known as glycerin). Heat on a hot plate (lowest setting) and stir with a
stirring rod to enhance dissolution. This reagent is stable and requires neither
preservatives nor special storage.
d). Stock phosphate solution: Dissolve in distilled water 0.7165 anhydrous KH2PO4
and dilute to 100mL; 1.00ml = 500gPO43- - P

Water and Wastewater Analysis Laboratory Manual For Environmental Health Science Students
University of Gondar Collage of Medicine and Health Science 178
e).Standard Phosphate Solution: Dissolve 219.5mg of potassium biphosphate
(KH2PO4) and dilute to 1000mL (1mL=50.0 gPO43- - P).
f). Strong-acid solution: slowly add 300 mL conc. H2SO4 to about 600 mL distilled water.
When cool, add 4.0 mL conc HNO3 and dilute to 1L.
4.18.2. Procedure
A) Determination of Orthophosphate:
1. Prepare the following series of phosphate standards by measuring the indicated volume
of standard phosphate solution in to separate 100 mL volumetric flasks (Or graduated
cylinders).
Standard Phosphate Solution. mL Phosphate (PO34) µg/100mL
0
1
2
3
4
5
6
0
5
10
15
20
25
30
2. To the sample, add 0.05 ml 1 drop) of phenolphthalein indicator solution. If the sample
turns pink, add strong acid solution drop wise until the color is discharged.
3. With a measuring pipette, add 4 mL acid-molybdate solution to each of the standards
and sample.
4. Mix thoroughly by inverting each flask four to six times
5. With medicine dropper, add 0.5 mL (10 drops) of stannous chloride solution to each of
the standards and sample
6. Stopper and mix by inverting each flask four to six times
7. After 10 minutes, but before 12 minutes, measure the color photo metrically at 690 nm
using distilled water as blank.
8. Construct a calibration curve using the standards and determine the amount of
phosphate in µg in the sample.

Water and Wastewater Analysis Laboratory Manual For Environmental Health Science Students
University of Gondar Collage of Medicine and Health Science 179
9. Calculation:
Calculation
a) mg/L PO43 =µ phosphate
Ml of sample
b) mg/L P = µg PO43 �x0.32614
Ml of sample
c) Mg/L P2O5 = µg PO43 �X 1.4946
Ml of sample
B. Determination of Total Phosphate
1. Take a 50 mL sample in a 250 mL Erlenmeyer flask and dilute to 100 mL with distilled
water.
2. Add 1 drop (0.05 mL) of phenolphthalein indicator solution .
3. If a pink color develops, add strong acid solution one drop at a time until the pink
color disappears. Then add 1 mL extra of the acid solution .
4. Boil the acid �treated sample gently for 90 minutes, adding distilled water from
time to time to keep the volume between 25 and 50mL.
5. Cool to room temperature.
6. Stirring the sample constantly and sodium hydroxide solution until a faint pink color
reappears.
7. Transfer sample to a 100 mL volumetric flask or graduated cylinder
8. Rinse the flask, glass beads, and stirring rod with distilled water and add the wash to
the flask/cylinder and dilute to the 100 mL mark with distilled water.
9. Complete the determination as described for orthophosphate staring with step 3.
10. Calculate the total phosphate using the formulae given for orthophosphate.

Water and Wastewater Analysis Laboratory Manual For Environmental Health Science Students
University of Gondar Collage of Medicine and Health Science 180
4.19. Iron
Iron in Natural Waters. Iron is a common element in soil and is ubiquitous in natural waters.
Common iron minerals include iron hydroxides (e.g., hematite, goethite), iron sulfides (e.g.,
pyrite), and iron carbonates (e.g., siderite). In lakes, rivers, and groundwater iron may be
present in either the ferrous (Fe2+) or ferric (Fe3+) form depending on the oxidation-reduction
conditions. In well-oxygenated surface waters, the ferric form of iron will predominate,
whereas in surface waters impacted by high levels of organic matter, or low dissolved
oxygen ground waters, ferrous iron may also be important. The ferrous form is more soluble
than the ferric form, and therefore, anaerobic conditions generally result in increased levels
of total soluble iron.
Although moderate levels of iron in drinking water do not have significant health effects, the
United States Environmental Protection Agency has promulgated a secondary maximum
contaminant level for iron of 0.3 mg/L. Moderate levels of iron create drinking water taste
problems (bittersweet, astringent taste) and can stain sinks, bathtubs and other plumbing
fixtures. Soluble iron precipitates as iron hydroxide (Fe(OH)3) producing a characteristic
orange or red color. The most common approaches for determining the amount of iron in
natural waters include atomic absorbance spectroscopy, inductively-coupled plasma (ICP)
atomic emission spectroscopy, and the phenanthroline colorimetric method.
Dissolved iron does not absorb in the ultraviolet or visible range and cannot be determined
directly by colorimetric methods. Therefore, in this method, soluble ferrous iron is reacted
with 1,10-phenanthroline to produce an orange-colored complex. It is important to note that
1,10-phenanthroline only reacts with ferrous iron. Therefore, if ferric or total dissolved iron
is of interest, the iron in the samples must first be reduced from the ferric to the ferrous form.
The following approach can be used to determine total soluble iron in a water sample
(ferric ferrous). In the first step hydroxylamine is added which reduces all ferric iron to
ferrous iron,
4Fe3+ + 2NH2OH 4Fe2+ +N2O +4H+ [1]
Next, 1,10-phenanthroline is added which reacts with the ferrous iron and forms an
orange-red complex,

Water and Wastewater Analysis Laboratory Manual For Environmental Health Science Students
University of Gondar Collage of Medicine and Health Science 181
Fe2+ + 3(1,10-phenanthroline) Fe-(1,10-phenanthroline)3 [2]
The amount of iron in the original sample is then directly proportional to the intensity of the
iron-phenanthroline complex determined spectrophotometrically.
The objective of this laboratory is to determine the amount of total dissolved iron in a water
sample using a colorimetric approach.
PHENANTHROLINE METHOD
4.19.1. Reagent and Apparatus.
a).Glassware: 100mL volumetric flask (5 or 10), 50mL volumetric pipette, 1L
volumetric flask, 10mL volumetric pipette, 5mL volumetric pipette, 1mL Mohr
pipette, 10mL Mohr pipette, clean cuvettes(5) .
b).Concentrated hydrochloric acid: The acid must contain less than 0.00005%
iron.
c).Ammonium acetate buffer solution: Dissolve 250g ammonium acetate
[NH4CH3COO] in 150mL deionized water. Add 700mL glacial acetic acid and
bring up to 1 L with deionized water.
d).Hydroxylamine solution: Dissolve 10g NH2OH HC1 in 100mL of deionized
water.
e). 0.1 N Potassium Permanganate solution: Dissolve 3.2g of potassium
permanganate [KMnO4] in 1L of deionized water.
f).Phenanthroline solution: Dissolve 1.0g of 1,10-phenanthroline monohydrate
[C12H8N2(H2O)] in 1L of deionized water that contains 20 drops of concentrated
hydrochloric acid by stirring and heating to 80OC.
Note: The stoichiometric ratio for the complex is 3 moles of phenanthroline per
mole of Fe2+, or 10.65g phenanthroline per g of Fe2+. This implies that 1mL (1 mg
phenanthroline) of this reagent is sufficient for about 100 g of Fe. However, in

Water and Wastewater Analysis Laboratory Manual For Environmental Health Science Students
University of Gondar Collage of Medicine and Health Science 182
order to get rapid, complete complexation, excess phenanthroline is required and in
practice 1mL of this solution suffices for no more than 2.5 g of Fe2+.
g).Stock Iron Solution: Slowly add 20mL of concentrated sulfuric acid to 50mL of
deionized water and dissolve 1.404g of ferrous ammonium sulfate
[Fe(NH4)2(SO4)2(H2O)6] in the acid/water mixture. Add 0.1 N potassium
permanganate dropwise until a faint pink color persists. Dilute to 1L with deionized
water. Note, 1.00mL=200g Fe.
g).Standard Iron Solution: Prepare this solution daily. Using a volumetric pipette,
pipette 50mL of the stock iron solution into a 1L volumetric flask and dilute to 1L with
deionized water. Note, 1.00mL=10 g Fe.
4.19.2. Procedures 1. Prepare the following series of iron standards by measuring the indicated
volumes of standard iron solution in to separate 100 mL graduate cylinders or
volumetric.
2. Add distilled water to the 50 mL mark and mix
3. Mix the sample thoroughly and measure the appropriate sample volume for the
indicated range
4. Place the sample in a 250-mL Erlenmeyer flask; and mL conc. HC1, and mix
5. Add 1 mL hydroxylamine hydrochloride solution and mix
6. Add a few glass beads and heat the solution to boiling until the volume reduced to
about 15 to 20 mL.
7. Cool, and transfer to a 100 mL volumetric flask or cylinder
8. Rinse the flask and glass beads with distilled water, and add the wash to the volumetric
flask or cylinder
9. To the sample and the series of standards, add 10ml acetate buffer solution with a
pipette, and mix thoroughly
10. Add 4 mL phenanthroline solution with a pipette, dilute to the mark with distilled water,
and mix thoroughly.
11. Allow to stand at least 15 minutes for the orange-red cooler develop

Water and Wastewater Analysis Laboratory Manual For Environmental Health Science Students
University of Gondar Collage of Medicine and Health Science 183
12. Measure the absorbance of the standard series and sample against a reagent blank in a
suitable photometer at 510 nm.
13. Determine the microgram of iron in the sample by reference to a standard curve.
14. Calculation: mg/L Fe = µg Fe
Ml of sample.
4.20. Manganese
Although manganese in groundwater generally is present in the soluble divalent ionic form
because of the absence of oxygen. Part or all of the manganese in a water treatment plant
may be in a higher valence state. Determination of total manganese does not differentiate
the valence state.. The heptavalent per manganese ion is used to oxidize manganese
and/or organic matter causing taste. Excess permanganate complexed trivalent manganese
or a suspension of qudrivalent manganese must be detected with great sensitivity to control
treatment and to prevent their discharge in to a distribution system. There is evidence that
manganese occurs in surface waters both in suspension in the quadrivalent state and in the
trivalent state in a relatively stable, soluble complex. Although rarely present in excess of 1
mg/L, manganese imparts objectionable and tenacious stains to laundry and plumbing
fixtures. The low manganese limits imposed on an acceptable water stem from these, rather
than toxicological, consideration. Special means of removal often are necessary, such as
chemical precipitation. pH adjustment, aeration, and use of special ion-exchange materials.
Manganese occurs in domestic wastewater, industrial effluents, and receiving streams.
The atomic absorption spectrometric and the inductively coupled plasma methods permit
direct determination with acceptable sensitivity and are the methods of choice. Of the
various colorimetric methods. The persulfate method is preferred because the use of
mercuric ion can control interference from a limited chloride ion concentration.

Water and Wastewater Analysis Laboratory Manual For Environmental Health Science Students
University of Gondar Collage of Medicine and Health Science 184
PER SULFATE METHOD
Manganese may exist a soluble form in neutral water when first collected, but it oxidizes to a
higher oxidation state and precipitates or becomes adsorbed on the container walls.
Determine manganese very soon after sample collection. When delay is unavoidable, total
manganese can be determined if the sample is acidified at the time of collection with HNO,
to pH <2.
The objective of this laboratory is to determine the amount of total dissolved
manganese in a water sample using a colorimetric approach.
Persulfate oxidation of soluble manganese compound to form permanganate is carried out
in the presence of silver nitrate. The resulting color is stable for at least 24 h if excess
persulfate is present and organic matter is absent.
Interference: As much as 0.1 g chloride (Cl-) in a 50-ml. sample can be prevented from
interfering by adding 1g mercuric sulfate (HgSO4) to form slightly dissociated complexes
Bromide and iodie still will interfere and only trace amount may be present. The persulfate
procedure can be used for potable water with trace to small amounts of organic matter if the
period of heating is increased after more persulfate has been added.
For wastewater containing organic matter. Use preliminary digestion with nitric and sulfuric
acids (HNO, and H2 SO4 if large amounts of C1- also are present, boiling with HNO3 helps
remove it. Interfering traces of CI are eliminated by HgSO4 in the special reagent. Colored
solutions from other inorganic ions are compensated for in the final colorimetric step.
Sample that have been exposed to air may give low results due to precipitation of
manganese dioxide(MnO2) Add 1 drop 30% hydrogen peroxide (H2O2 ) to the sample, after
adding the special reagent, to redissolve precipitated manganese.

Water and Wastewater Analysis Laboratory Manual For Environmental Health Science Students
University of Gondar Collage of Medicine and Health Science 185
4.20.1. Reagent and Apparatus.
a). Special reagent: Dissolve 75g HgSO4 in 400 mL Conc HNO3 and 200 mL distilled
water. Add 200mL 85% phosphoric acid, and 35 mg silver nitrate. Dilute the cooled
solution to 1L.
b). Ammonium Per sulfate, (NH4)2S2O8, solid.
c).Stock manganese solution: Weigh 0.308g dry manganese sulphatemnohydrate
(MnSO4. H2O). Carefully transfer the weighed comical to a 250 mL beaker and dissolve
in 100mL distilled water. Cautiously add 1.0 mL concentrated sulfuric acid with
constant mixing. Transfer the acid solution to a 1L volumetric flask & dilute to
volume. Stopper & mix thoroughly. 1 mL = 100 µg Mn.
d). Standard manganese solution: with a volumetric pipet, measure 10 mL stock
manganese solution into a 100 mL volumetric flask. Dilute to the mL mark with distilled
water. Stopper and mix thoroughly. Prepare on the day of use 1mL = 10 µg Mn.
e). Hydrogen Peroxide H2O2, 30%.
4.20.2. Procedure.
Prepare the following series of manganese standards by measuring the indicated
Volumes of standard manganese solution into separate 250-mL Erlenmeyer flasks.
Standard Manganese Solution. mL Manganese µg/100mL
0
0.5
1.0
2.0
4.0
6.0
8.0
10.0
0
5
10
20
40
60
80
100

Water and Wastewater Analysis Laboratory Manual For Environmental Health Science Students
University of Gondar Collage of Medicine and Health Science 186
1. With a graduated cylinder, measure 75 ml distilled water and add to each flask.
2. Measure 100 ml of sample into a 250 ml Erlenmeyer flask which has been marked
with a line at the 90 ml level (Use a marker to make the line)
3. Add 5 ml mixed reagent solution to the sample
4. Add a few glass beads and heat the sample to boiling. Boil until the liquid level reaches
the 90 ml level.
5. To each manganese standard prepared in step 1, add 5 mL mixed reagent solution,
and mix.
6. Weight about 1g portions of ammonium per sulfate (or potassium per sulfate crystals,
and add to each manganese standard and to the sample.
7. Heat the contents of each flask to boiling; then boil gently for 1 minutes more. A pink �
to*purple color will develop in the manganese standards at this stage.
8. Remove each flak to room the heat source, and allow standards at this stage.
9. Cool each flask to room temperature under running tap water. Do not delay, since slow
coiling may result in some loss of permanganate color
10. Transfer the contents of each flask to separate 100 ml volumetric flasks or graduated
cylinders.
11. Rinse the flasks or graduated cylinders, glass with small amounts of distilled water, and
add the wash to the volumetric flasks/graduated cylinders
12. Dilute to the mark with distilled water & mix by inverting for at least six times.
13. Measure the absorbance of the standard series and the sample against a reagent
blank in a suitable photometer at 525 nm.
14. Determine the microgram of manganese in the sample by reference to a standard
curve.
15. Calculation:
mg/L Mn = µg Mn
Ml of sample

Water and Wastewater Analysis Laboratory Manual For Environmental Health Science Students
University of Gondar Collage of Medicine and Health Science 187
4.21. Dissolved Oxygen (Do).
Natural levels of dissolved oxygen in surface waters range from 7 mg/L to 14 mg/L,
depending on temperature, salt concentration, and the amount of biodegradable organic
matter. When organic pollution is present, for example due to a combined sewer overflow,
microorganisms in the water utilize the available oxygen to convert the organic material to
cell mass and carbon dioxide. As a result, the dissolved oxygen concentration can drop to
levels significantly below 7 mg/L.
THE AZIDE MODIFICATION OF THE WINKLER METHOD
The two most common approaches for measuring dissolved oxygen in natural waters
include the Winkler method with Azide modification, and a membrane electrode method.
In the Azide-modified Winkler procedure, oxygen is fixed using manganous sulfate
(MnSO44H2O), which is then used to oxidize iodide (I-) to iodine (I2). The resulting I2,
which will be proportional to the amount of O2 originally present, can then be determined
directly by titration with sodium thiosulfate.
The fixation of O2 occurs as,
Mn2+ + 2OH- + ½ O2 MnO2 + H2O [1]
This reaction is slow, and therefore, vigorous shaking for at least 20 seconds helps
precipitate the white manganese solid. The resulting precipitate then reacts with I-, in the
presence of a strong acid, to produce I2,
MnO2 + 2I- + 4H+ I2 + 2H2O + Mn2+ [2]
In this reaction, Mn4+ is reduced to Mn2+ while I- is oxidized to form I2. The iodine is
usually complexed with excess iodide to form a tri-iodide complex. The amount of I2 (or
tri-iodide) in solution is then determined by titration with sodium thiosulfate,
2Na2S2O35H2O + I2 Na2S4O6 + 2NaI + 5H2O [3]

Water and Wastewater Analysis Laboratory Manual For Environmental Health Science Students
University of Gondar Collage of Medicine and Health Science 188
Thus, each mole of O2 present in the original sample will consume 4 moles of sodium
thiosulfate. Typically, starch is used as an indicator for the above reaction. Starch forms
a dark blue color when complexed with tri-iodide. When sodium thiosulfate has reacted
with all the iodine, the starch complex will be destroyed and the solution will turn clear.
Other compounds commonly found in water may also oxidize I- in the procedure above,
most notably nitrite (NO2-). Nitrite interference is easily overcome, however, by treating the
sample, prior or during the addition of iodide, with sodium azide (NaN3). Under acid
conditions, sodium azide reacts with any free nitrite in solution producing N2 gas that
leaves the aqueous phase,
NaN3 + H+ HN3 + Na+ [4a]
HN3 + NO2- + H+ N2 + N2O + H2O
The objectives of this laboratory are to measure the dissolved oxygen concentration of a
water sample using the azide modification of the Winkler procedure.
4.21.1. Reagent and Apparatus
a).Glassware: (500mL Erlenmeyer flask, 300mL BOD bottles, 10 or 15mL Mohr
pipette, 50mL burette)
b). Manganese sulfate: Dissolve 480 gm MnSO4 4H2O2 400 gm MnSO4-2H2O or 364 g
MnSO4-H2O in distilled water filter and dilute to 1L. MnSO4 solution should not give a
color with starch when added to an acidified KI solution.
c).Alkali-iodide-azide: Dissolve 500g NaOH (or 700g KOH) and 235 g NaI (or 100g KI)
in distilled water and dilute to 1L Add 10g sodium azide dissolved in 40-mL distilled
water potassium and sodium salts may be used interchangeably. This reagent should
not give a colour with starch solution when diluted and acidified.
d).Sulfuric acid: H2SO4 conc.: One millimeter is equivalent to about 3ml alkali Iodide-
azide reagent.

Water and Wastewater Analysis Laboratory Manual For Environmental Health Science Students
University of Gondar Collage of Medicine and Health Science 189
e).Starch Indicator: Dissolve 2g of starch and 0.2g salicylic acid in 100mL of hot
deionized water.
f).Sodium thiosulfate, 0.025(m) N: Dissolve 6.205g of Na2S2O35H2O in deionized water,
add 0.4g NaOH and dilute to 1L. (Note: Sodium thiosulfate absorbs and loses water
readily, so this solution should be standardized against potassium bi-iodate.). Add 1.5
mL 6N NaOH or 0.4g solid NaOH and dilute to 1000-mL. Standardize with bi-iodate.
f). Standard potassium bi-iodate solution 0.0021 M. 0.025N:
Dissolve 0.8124g KH(I03)2 in distilled water and dilute to 1000-mL .
Standardization=dissolve approximately 2g KI, Free from iodate, in an Erlenmeyer
flask with 100 to 150-mL distilled water. Add 1-mL 6N H2SO4 or a few drops of
conc. H2SO4 and 20-mL of standard bi-iodate solution. dilute to mL and titrate the
liberated iodate with thiosulfate titrant adding starch toward end of titration, when a
pale straw color is reached adjust the Na2S2O3 solution to 0.025 N if necessary.
g). Potassium fluoride solution: dissolve 40g KF.2H2O in distilled water and dilute to
100-mL.
4.21.2. Procedures
1. Collection the sample in glass-stoppered BOD bottle of 250-300 mL capacity. Write
down the volume of the bottle.
2. Remove the glass stopper from the sample bottle, using a measuring pipet, add 1 ml if
manganese sulfate solution followed by 1 ml alkali-iodide-azide reagent. Place the tip
of the pipette below the surface of the water so as to allow the heavy solution of flow in
without contact with the air
3. Stopper carefully to exclude air bubbles and mix by inverting the bottle a few time
4. Allow the resulting precipitate to settle at least to one half the bottle volume to leave
clear sup ate above the manganese hydroxide floc.
5. Remove the stopper again, and with measuring pipet, add 1ml conc. sulphuric acid

Water and Wastewater Analysis Laboratory Manual For Environmental Health Science Students
University of Gondar Collage of Medicine and Health Science 190
6. Re stopper carefully to prevent air from entering the bottle mix by inverting several
times until the precipitate completely dissolves and the brown or yellow color is
distributed uniformly.
7. Titrate with 0.025 N sodium thiosulfate solution a volume corresponding to 200 ml
original sample after correction for sample loss by displacement with reagents. Thus
for a total of 2 ml of reagents (1 ml each of MnSO4 and alkali-iodide-azide reagents) in
a 300-ml, titrate 200x300=201 ml
298
8. Gradually add small portion of the sodium thiosulfate titrant while constantly swirling
the liquid in the flask, until the sample changes to a pale yellow or straw color
9. Add a few drops of starch indicator solution and continue the titration to the first
disappearance of the blue color.
10. Calculation
mg/L DO = AxNx8,000
Ml of sample
Where:
A= ml sodium thiosulfate
N= Normality o sodium thosulfate.
Note:
1. If the end point is over run, add a measured volume of treated sample and titrate
carefully to the proper end point. Correct for the amount of sample added.
2. Disregard Subsequent re colorations.

Water and Wastewater Analysis Laboratory Manual For Environmental Health Science Students
University of Gondar Collage of Medicine and Health Science 191
4.22. Biochemical Oxygen demand(BOD).
Biochemical oxygen demand (BOD) is the amount of oxygen required by microorganisms
to biologically degrade organic wastes. Usually the BOD test is used to measure the
strength of organic pollution. One of the major factors in determining the performance of
wastewater treatment plants is the BOD reduction that they achieve. Complete
stabilization of a waste by microorganisms requires too long an incubation period for
practical purposes; therefore, the 5-day period has been accepted as a standard. The 5-
day BOD (BOD5) is the total amount of oxygen consumed by microorganisms during the
first 5 days of biodegradation. Samples are incubated at 20oC in darkness. This prevents
algae from adding oxygen to the air tight bottle. The typical composition of untreated
domestic wastewater has a BOD5 concentration of 100 - 300 mg/L.
The experimental procedure is based upon diluting the wastewater with a known amount
of dilution water and measuring dissolved oxygen concentrations over the course of 5
days. One set of experiments are conducted on the dilution water only and another set is
conducted on the mixture of dilution water and wastewater. The BOD of the dilution water
at any time t, BODt, is given by the following expression.
BODt = DOD,0 - DOD,t
where DOD,0 is equal to the dissolved oxygen concentration (mg/L) of the dilution water at
time t = 0 and DOD,t is the dissolved oxygen concentration (mg/L) of the dilution water at
time t = t. A similar expression can be developed for the BOD of the mixture of dilution
water and wastewater at any time t, BODM,t.
BODM,t, = DOM,0 - DOM,t
Mass balance considerations are then used to determine the BOD of the wastewater from
the BOD of the mixture. Within the BOD bottle the �mass of BOD within the bottle� is equal
to the sum of the �mass BOD from the wastewater� plus the �mass BOD from the dilution
water.�
In many situations the data are fit to a BOD equation which provides BOD concentration of
the wastewater as a function of time. This equation can be derived by assuming that the

Water and Wastewater Analysis Laboratory Manual For Environmental Health Science Students
University of Gondar Collage of Medicine and Health Science 192
rate of oxygen utilization is linearly related to the amount of oxygen-consuming organic
matter present in a sample or,
where: Lt = Oxygen equivalent of organic matter present at time t. (mass/volume)
ke= Reaction constant (inverse time). Please note that this constant is a function of
temperature and therefore, constant temperature conditions are needed throughout the
experiment.
Integrating the above expression, then
where: BOD= ultimate BOD (mass/volume). The expression above requires the
computation of BODand ke from experimental data. The results of the 5 day BOD test
can be used in conjunction with one of two solution methods for computing BODand ke .
These methods include: 1) the method of least squares, and 2) the Thomasmethod.
The BOD test is one of the most common measures of organic matter in wastewater and
sewage-contaminated natural waters. In the BOD test, the amount of oxygen used in the
metabolism of biodegradable organics is termed the biochemical oxygen demand, or
�BOD.� The principal forms of biodegradable organic matter include proteins,
carbohydrates, lipids, and fats.
The BOD of a water sample is determined by placing aliquots with appropriate dilution
water in glass-stoppered 300mL BOD bottles, incubating the bottles at a standard
temperature (20°C), and measuring the change in oxygen concentration with time. The
concentration of dissolved oxygen in the BOD bottles is determined using either a
dissolved oxygen electrode or by performing the Winkler procedure.
The BOD, as a function of time, is assumed to follow a first-order rate model. Based on
this model, the BOD consumed or exerted in the BOD bottle at any time is equal to the

Water and Wastewater Analysis Laboratory Manual For Environmental Health Science Students
University of Gondar Collage of Medicine and Health Science 193
difference between the BOD existing at the initial time (BODu or Lo) and the BOD
remaining at any time, (BODr or Lt).
ktuto eBODLLx 1 [5]
where x is BOD exerted at any time, t, BODu is the ultimate BOD (assumed equal to the
oxygen equivalent of organics at time zero, Lo), k is a first-order rate constant, and t is
time.
Figure4.4 . Changes in biodegradable organics, measured in oxygen equivalents, as a function of time.
Because BOD changes with respect to time, it is important to report at what time a BOD
measurement was made. The most common time interval for reporting BOD values is 5
days. For example, a number of national standards for BOD are based on BOD5. The
BOD is calculated as,
BOD D1 D2 f (B1 B2)
P [6]
where D1 and D2 are the dissolved oxygen concentrations of the mixtures in the BOD
bottles before and after incubation, respectively, B1 and B2 are the dissolved oxygen
concentrations in the dilution water before and after incubation, respectively, f is the
faction of dilution water in the mixture and P is the fraction of sample in the mixture.
0
50
100
150
200
250
300
0 5 10 15 20 25
Time (days)
Oxy
gen
Eq
uiv
alen
t B
OD
, L (
mg
/L)
Lo
BOD Exerted
L RemainingLt
Lo - Lt
BODt

Water and Wastewater Analysis Laboratory Manual For Environmental Health Science Students
University of Gondar Collage of Medicine and Health Science 194
The purpose of this section is to determine the amount of oxygen necessary for biological
oxidation of wastewater, effluents, and polluted waters. To determine the amount of
oxygen required by bacteria while stabilizing decomposable organic matter
4.22.1 . Reagent and Apparatus
Apparatus
BOD bottles; 300 ml capacity
Air Incubator (20OC ± 1O C)
Stir plate, stir bar, ring stand, burette, 200 ml beaker, and burette holder
250 ml Graduated Cylinder
Containment vessel, baking soda, wash beaker, solution beaker, and pipette for
handling concentrated sulfuric acid.
Large 40 liter carboy, with diffuser stone attached to a source of pressurized air
Reagent
a). Phosphate buffer solution: Dissolve 8.5g KH2PO4 , 21.75 g K2HPO4 33.4g
Na2HPO4 7H2O, and 1.7g NH4Cl in about 500 mL distilled water and dilute to 1L. The
PH should be 7.2 without further adjustment. Discard reagent (or any of the
following reagent) if there is any sign of biological growth in the stock battle.
b). Magnesium sulfate solution: Dissolve 22.5g MgS4. 7H2O in distilled water and dilute
to1L.
c). Calcium chloride solution: dissolve 27.5g CaCl2 in distilled water and dilute to 1L.
d). Ferric Chloride solution: dissolve 0.25g FeCl3. 6H2O in distilled water and dilute to 1L
e). Acid and alkali solutions, IN: for neutralization of caustic or acidic waste sample.
f). Sodium sulfite solution 0.025N: Dissolve 1.575g Na2SO3 in 1000 mL distilled water.
This solution is not stable; prepare on the day of use.
g). Nitrification inhibitor: 2-chloro-6- (trichloro methyl) pyridine.

Water and Wastewater Analysis Laboratory Manual For Environmental Health Science Students
University of Gondar Collage of Medicine and Health Science 195
h).Glucose-glutamic acid solution: Dry reagent-grade glucose and reagent-grade
glutamic acid at 103OC for 1h. Add 0.150 g glucose and 0.150g glutamic acid to
distilled water, dissolve and dilute to 1 1iter. Prepare fresh immediately before use.
4.22.2. Procedure.
1. a) Using your best engineering judgment, determine the dilution for the glucose-
glutamic acid control (BOD5= 198 mg/L) and for the raw and treated wastewater
samples. Suggestions: read section 22-3 in Sawyer, et al., note table 22-1.
b) Check proposed dilutions with instructor before proceeding.
2. a) Prepare four dilution water blanks by filling each bottle with the dilution water/seed
mixture.
b) Prepare four raw wastewater samples. Add the appropriate volumes of raw effluent,
X1 ml, as determined in step 1. Add (300-X1) ml of dilution water. Make sure you
shake the sample bottle thoroughly prior to pipetting sample. Samples for this lab
can be pipetted directly from the sample bottle to assure that uniform samples are
pipetted. Shake bottle between additions of raw wastewater to different BOD
bottles.
c) Prepare four treated wastewater samples as in part b with appropriate volumes of
treated wastewater, X2, and dilution water (300-X2) as determined in step 1. Make
sure you shake the sample bottle thoroughly prior to pipetting sample as in part b
above.
d) Prepare eight glucose-glutamic acid samples as in part b, with appropriate volumes
of glucose-glutamic acid,X3, and dilution water (300-X3) as determined in step 1.
3. Add water to the reservoir at top of BOD bottle. Refill during incubation period to avoid
total evaporation of water.
4. Determine the DO (day = 0) on one bottle of raw wastewater, treated wastewater, and
dilution water blank, and two bottles of the glucose-glutamic acid control. (See DO
determination below).
5. Put remaining samples in incubator (20OC).
6. Repeat step three for days 3, 4, and 5.

Water and Wastewater Analysis Laboratory Manual For Environmental Health Science Students
University of Gondar Collage of Medicine and Health Science 196
4.23. Chemical oxygen demand
The Chemical Oxygen Demand (COD) is the amount of oxygen needed to chemically
oxidize wastes. In the COD test, a strong chemical oxidizing agent is used to oxidized the
organics. The primary advantage if COD over BOD is that it is relatively fast, taking 2 to 3
hours, whereas BOD requires 5 day to complete. Another difference in the test methods is
that BOD is a biochemical process as measured by the ability of microbes to degrade the
organics, whereas COD is purely a chemical process.
To estimate the oxygen demand of organic matter when it is subjected to oxidation by a
strong chemical oxidant in water.
A. Open Reflux Method, Titrimetric Method
4.23.1. Reagents and Apparatus
Apparatus
COD reactor with cover and test tube rack
Spectrophotometer (Milton Roy, Spec 20) with red plastic filter and
phototube for reading within the 600 to 620nm range (CE-A30) .
Heat Resistant Gloves
1, 25 or 50 ml graduated cylinder
Pipettes (5 & 10 ml) and pipette bulbs
100 ml volumetric flasks (4 per student group)
50, 100, or 150 ml beakers (3 per student group)
Reagent
a). Standard potassium dichromate solution, 0.0417 M (0.25N): dissolve 12.259g
K2Cr2O7 primary standard grade previously dried at 103OC for 2h in distilled water and
dilute 100mL
b). Sulfuric acid reagent: Add Ag2SO4 at the rate of 5.5g Ag SO4 per Kg H2SO4 Let
stand 1 to 2 days to dissolve Ag2SO4 per kg H2SO4 let 1 to 2 days to dissolve Ag2SO4.

Water and Wastewater Analysis Laboratory Manual For Environmental Health Science Students
University of Gondar Collage of Medicine and Health Science 197
c). Ferroin indicator solution: dissolve 1.485g 1,10-phenanthrolina monohydrate and
0.695g FeSO4. 7H2O in distilled water and dilute to 100mL.
d).Standard ferrous ammonium sulfate (FAS) titrant approximately 0.25M (0.25N):
Dissolve 98g Fe (NH4)2 (SO4)2 6H2O in distilled water. Add 20 mL Conc. H2SO4 Cool,
and dilute to 1000 mL. Standardize daily against K2Cr2O7 solution as follows:-
Dilute 10.0 mL standard K2Cr2O7 to about 100 mL. Add 30 mL Conc H2SO4 and
cool. Titrate with FAS totrant using 0.10 to 0.15 mL (2 to 3 drops) ferroin
indicatory
e). Mercuric sulfate, crystals or powder. (extra pura)
f). Sulfamic acid
g). Potassium hydrogen phthalate (KHP) standard: Lightly crush and then dry KHP to
constant weight at 120OC. Dissolve 0.425 g in distilled water and dilute to
1000 mL. KHP has a theoretical COD of 1.176 mg O2/mg this solution has a
theoretical COD of 5000g O2/mL. This solution is table when refrigerated for up to 3
months.
4.23.2. Procedures
Place 5 ml of sample in a 250 or 500-mL refluxing flask
1. Add about 3 glass beads to the reflux flask
2. Add approximately 1 g mercuric sulfate
3. Very slowly add 5.0-mL sulphuric acid reagent with mixing to dissolve the mercuric
sulfate.
4. Cool under the tap while mixing to avoid possible loss of volatile materials
5. Add 25.0 ml of 0.0417M (0.25N) potassium dichromate solution
6. Mix until the solution is completely homogeneous
7. Attach the reflux flask to the condenser and turn on the cooling water
8. Add 75-mL of sulphuric acid reagent through the open end of the condenser continue
swirling and mixing while adding the sulphuric acid reagent
9. Cover the open end of the condenser with a small beaker and reflux for exactly 2
hours.
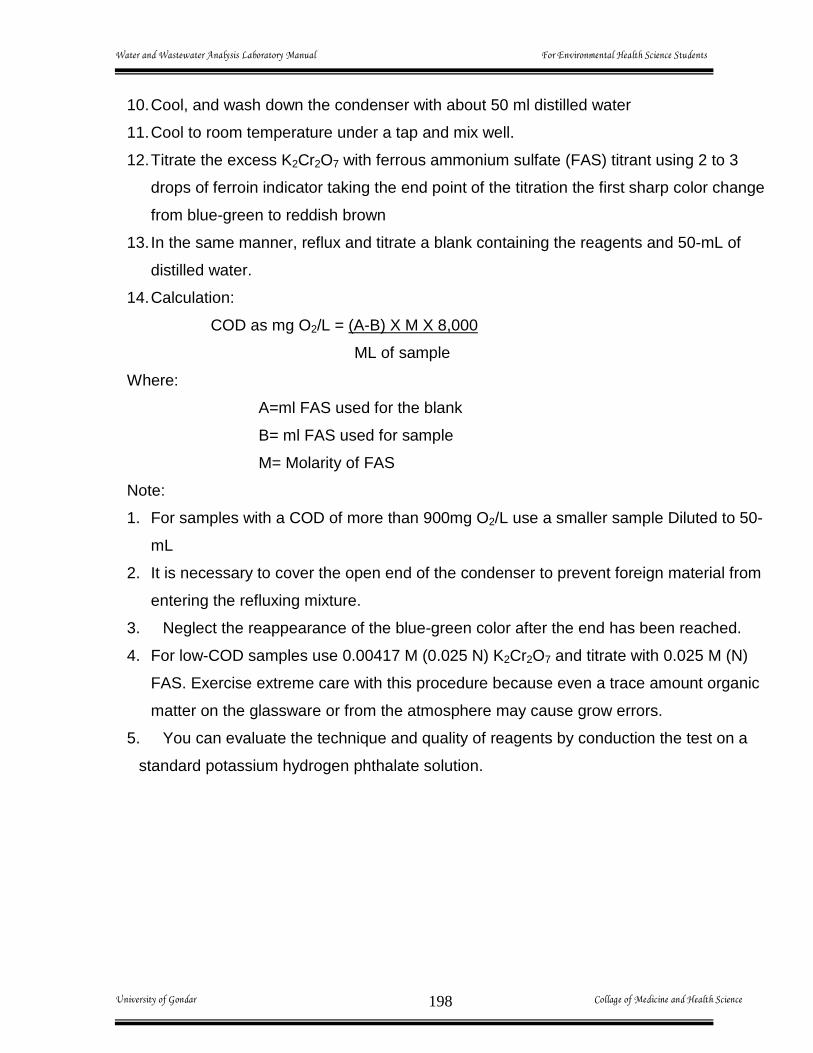
Water and Wastewater Analysis Laboratory Manual For Environmental Health Science Students
University of Gondar Collage of Medicine and Health Science 198
10. Cool, and wash down the condenser with about 50 ml distilled water
11. Cool to room temperature under a tap and mix well.
12. Titrate the excess K2Cr2O7 with ferrous ammonium sulfate (FAS) titrant using 2 to 3
drops of ferroin indicator taking the end point of the titration the first sharp color change
from blue-green to reddish brown
13. In the same manner, reflux and titrate a blank containing the reagents and 50-mL of
distilled water.
14. Calculation:
COD as mg O2/L = (A-B) X M X 8,000
ML of sample
Where:
A=ml FAS used for the blank
B= ml FAS used for sample
M= Molarity of FAS
Note:
1. For samples with a COD of more than 900mg O2/L use a smaller sample Diluted to 50-
mL
2. It is necessary to cover the open end of the condenser to prevent foreign material from
entering the refluxing mixture.
3. Neglect the reappearance of the blue-green color after the end has been reached.
4. For low-COD samples use 0.00417 M (0.025 N) K2Cr2O7 and titrate with 0.025 M (N)
FAS. Exercise extreme care with this procedure because even a trace amount organic
matter on the glassware or from the atmosphere may cause grow errors.
5. You can evaluate the technique and quality of reagents by conduction the test on a
standard potassium hydrogen phthalate solution.

Water and Wastewater Analysis Laboratory Manual For Environmental Health Science Students
University of Gondar Collage of Medicine and Health Science 199
B. Instrumental Method
REAGENTS:
a). HACH COD Ampules, Range 0 to 1500 ppm .
b). Stock Solution of Potassium Hydrogen Phthalate, C8H5O4K (2500mg/L as KHP):
Dry approximately 3.5g C H O K at 120° C overnight. Dissolve 2.500g in water and
dilute to 1 liter.
PROCEDURE:
Samples include: one blank, three standards for calibration curve (500mg/L, 250mg/L,
62.5 mg/L potassium hydrogen phthalate, KHP), control (125 mg/l KHP, do not use for
calibration curve), and two environmental samples (wastewater before and after treat
treatment). Replicate the environmental sample to obtain a measure of precision. Prepare
the standards (500, 250; 62.5mg/l) using sequential dilutions calibration. Prepare the 125
mg/L control directly from the 2500 mg/L stock solution.
DIGESTION STEP (Follow Safety Instructions Carefully)
1. Turn on the COD reactor to preheat to 150°C. Safety precaution should be
taken for the next process. Wear goggles, gloves, and apron. Wrap the COD
Digestion Reagent Vial in a towel in case of breakage. Cautiously remove the
cap.
2. Carefully pipette 2.5 ml of sample into the vial. Spilled reagent will affect test
accuracy and is hazardous to skin and other materials.
3. Make sure that caps are well-tightened. Over the sink, thoroughly mix the
contents in the vial that is still wrap in a towel. WARNING: Vial will become very
hot during the mixing and could break easily. The plastic shield should be in
place on the heater block before vials are placed in the reactor.
4. Prepare a reagent blank by repeating steps 1-3, replacing the sample with
distilled (demineralized) water. For two hours, heat the vials at 150°C and then
cool for 20 minutes.

Water and Wastewater Analysis Laboratory Manual For Environmental Health Science Students
University of Gondar Collage of Medicine and Health Science 200
COLORIMETRIC MEASUREMENT
1. With the spectrophotometer disconnected form the power source, insert red
plastic filter into spectrophotometer and check that the proper lamp is
placed inside (CE-A20). Turn on the spectrophotometer and allow it to
warm-up for 20 minutes. Adjust wavelength (600 to 620 nm). Adjust 0% T
with left knob while cuvette chamber is empty. Adjust 100% T with right
knob with the blank sample from the digestion step. (Handle ampules
carefully. Do not shake)
2. Record Absorbance and Transmittance of samples.
4.24. Sulfate
The sulfate ion is one of the major anion occurring in natural waters. It is importance in
public water supplies because of its cathartic effect up on humans when it is present in
excessive amounts. For this reason, the recommended upper limit is 250 mg/e in waters
intended for human consumption. Sulfates are important in both public and industrial water
supplies, because of the tendency of waters containing appreciable amounts to form hard
scale in boilers and heat exchangers.
Sulfates are of considerable consideration because they are indirectly responsible for two
serious problems often associated with the handling and treatment of waste water. These
are odor and sewer corrosion problems resulting from the reduction of sulfates to hydrogen
sulfide under anaerobic condition.
SO4 + Organic matter anaerobic S2-+H2O+CO2
bacteria
S2-+H+ HS-
HS-+H+ H2S.
The gravimetric method is considered to yield the most accurate results and is the
recommended standard procedures for sulfate concentration above 10mg/e. At noted above
the quantitative aspect of this method depend up on the fact that barium ion combines with
sulfate ion to form poorly soluble barium sulfate as follows.
Ba2+ + So42- BaSO4

Water and Wastewater Analysis Laboratory Manual For Environmental Health Science Students
University of Gondar Collage of Medicine and Health Science 201
The ppt is normally accomplished by adding barium chloride in slight excess to samples of
water acidified with HCL and kept near the boiling point. The sample is acidified to
eliminated the possibility of ppt of BaCO3, which might occur in highly alkaline waters
maintained near to boiling temperature. Excess BaCl2 is used to produce sufficient common
ion to ppt sulfate ion as completely as possible.
Because of the great insolubility of barium sulfate (KsP=1X10⁻¹⁰), there is a considerable
tendency for much of the ppt to form in a colloidal condition that cannot be removed by
ordinary filtration procedures. Digestion of the samples at a temperature near boiling point
for a few hours usually results in a transfer of the colloidal to crystalline forms, in
accordance with the principle and filtration can then be accomplished.
The crystal of barium sulphate are usually quite small for this reason, a special grade of filter
paper (suitable for sulfate determination) should be used with reasonable care to make sure
that all crystals have been transferred to the filter and with sufficient washing to remove all
excess barium chloride and other salts, this method is capable of measuring sulfates with a
high order of accuracy. Its major limitation is time required.
The barium sulphat ppt formed may be weight after filtration either following combustion to
destroy the filter paper or by the weighing the ppt and the filter together and then subtraction
the weight of the previously tarred filter form the result to obtain the weight of the ppt alone.
The measurement of solid matter in a wide variety of liquid and semisolid materials /
ranging from potable waters through polluted waters / domestic and industrial waste
and sluges produced in treatment process / is very important in environmental engineering
practice.
In all other liquid materials, the amount of suspended material increases the degree of
pollution. Sludge represents an extreme case in which most of the solid matter is in
suspended form and the dissolved fraction is in a minor consideration.
GRAVIMETRIC METHOD WITH IGNITION OF RESIDUAL
4.24.1. Reagent and Apparatus
a). Methyl red indicator solution: dissolve 0.1 g methyl red sodium salt in distilled water
and dilute to 100 mL

Water and Wastewater Analysis Laboratory Manual For Environmental Health Science Students
University of Gondar Collage of Medicine and Health Science 202
b). Hydrochloric acid HC1 1+1
C). Barium chloride solution: dissolve 100g bacl2. 2H2O in 1L distilled water. Filter
through a membrane filter or hard-finish filter paper prior use 1 mL is capable of
precipitating approximately 40mg S04-2.
d). Silver nitrate-nitric acid reagent: dissolve 8.5 g AgNO3 and 0.5 mL Conc. HNO3 in 500
mL distilled water.
4.24.2. Procedures
1. Adjust the volume of clarified sample to contain approximately 50 mg of sulfate in a
150-mL volume. Lower concentrations of sulphates may be tolerated if it is impractical
to concentrated the sample to the optimum level, but in such cases limit the total
volume to 150-mL
2. Adjust the pH with concentrated HC1 to pH 4.5-5.0 using a pH meter or the orange
color of methyl red indicator. Then, add an additional 1 to 2-mL HCI.
3. Heat the solution to boiling and while stirring gently, add warm barium chlorides
solution slowly until precipitation appears to be complete. Then add about 2-mL in
excess.
4. Digest the precipitate at 80-90OC for not less than 2 hours.
5. Filter and wash the precipitate with small portion of warm distilled water until the
washings are free of chloride as indicated by testing with AgNO3HNO3 reagent.Br sure
that all of the precipitate is transferred to the paper.
6. Place the filter paper and precipitate in ignited and weighed crucible and dry in the
oven
7. Ignite at 800OC for 1 hour, cool in a desiccators and weigh.
8. Calculation:
mg/L SO24 = mg BaSO4 x 411.6
Ml sample
Interferences:
Positive interference: suspended matter and silica
Negative interference: Heavy metals and Alkali metals

Water and Wastewater Analysis Laboratory Manual For Environmental Health Science Students
University of Gondar Collage of Medicine and Health Science 203
If the silica concentration is above 25 mg/l, it must be removed by the following method
prior to sulfate determination.
Removal of silica
1. Evaporate the sample nearly to dryness in an evaporating dish on a steam bath.
2. Add 1ml HC1, tilt the dish and rotate it until ht residue is wetted. Evaporate to
dryness and complete the drying at 180OC
3. If organic matter is present , char over the flame or a burner
4. Moisten the residue with 2 ml distilled water and 1 ml HCl, evaporate ate to
dryness on a steam bath
5. Add 2 ml HCl, take up the soluble residue in hot water, and filter.
6. Wash the insoluble silica with several small portions of hot distilled water
7. Combine the filtrate and washings and proceed starting with step 1 of the sulfate
analysis procedure.
Note:
1. If the total cation concentration in the sample is 250 mg/1 or above, or if the total
heavy mental ion concentration in the sample is 10mg/L or more, pass the sample
portion intended for sulfate precipitation through a cat ion-removing exchange
column.
2. During the ignition process, do not allow the filter paper to flame
3. It is advisable to use ash less filter paper pulp during filtration as filter aid to reduce the
tendency of the precipitate to creep.

Water and Wastewater Analysis Laboratory Manual For Environmental Health Science Students
University of Gondar Collage of Medicine and Health Science 204
4.25. Solids
Particulate matter is ubiquitous in all surface water and ground water systems, and can
lend to water a cloudy or hazy appearance. Due to their high specific surface area,
suspended particles are efficient adsorbents and they play a major role in regulating the
transport and distribution of many chemical compounds. Minute suspended particles may
also indicate the presence of bacteria and non-bacterial pathogens (e.g., Cryptosporidium,
Guardia, and viruses) and their presence inhibits disinfection processes.
The size spectrum of waterborne particles in both natural and polluted waters is
continuous, spanning roughly 0.001 µm to 100 µm (Figure 1). The composition of these
particles can be organic (e.g., bacteria, algae and viruses), inorganic (e.g., clay, sand, and
iron oxides), or both. Suspended particles less than 1 µm in diameter do not readily settle,
and are considered colloids. This colloidal fraction may be highly stable, hence mobile,
and can significantly enhance the transport of adsorbed contaminants in surface and
ground water.
Gravimetric Analysis
Varieties of separation techniques are commonly used to gravimetrically classify solids by
size and chemical characteristics (see Figure 4.5). Filtration is used to separate
�suspended� or �particulate� fractions from �dissolved� or �soluble� components. In this
technique, glass-fiber filters are used to remove particles as they pass through the deep
mat of fibers by interception and impaction. Because the average pore size and collection
efficiency of commercial filters varies, it is always important to specify the type of filter
used, and pore size.
Evaporation separates water from dissolved and/or suspended matter. The drying
temperature has an important effect upon the results and weight losses due to
volatilization of organic matter, water occluded in the interstices of crystals, water of
crystallization, and gases from thermally induced decomposition may occur. In addition,
weight gain due to oxidation is possible. Consequently, two drying temperatures are
conventionally used: 103-105°C and/or 179-181°C. The lower temperature is used with

Water and Wastewater Analysis Laboratory Manual For Environmental Health Science Students
University of Gondar Collage of Medicine and Health Science 205
samples containing high concentrations of organic matter, which may undergo significant
weight loss due to volatilization and decomposition at the higher temperature. There is
only slight decomposition of most organic salts at 103°C. Some loss of CO2 can be
expected from the conversion of bicarbonate to carbonate during the dehydration process.
Occluded or bound water is not completely removed at 103°C; however, its removal is
virtually complete at 180°C. At 180°C, thermal decomposition of ammonium salts
(especially ammonium carbonate) may occur. The type of cation in the salt greatly affects
the degree of decomposition at a given temperature.
Solids are operationally characterized as either volatile or nonvolatile (in some texts the
term �fixed� is used in place of nonvolatile). Volatile solids are those that volatilize when
samples are heated to a temperature of 550°C. The volatile fraction is primarily composed
of organics, whereas the fixed fraction is mostly inorganic. To measure these quantities,
samples are placed in a �muffle� oven at 550°C for a fixed period of time. The remaining
sample is weighed again and the mass loss represents the volatile fraction. Special filters,
made of noncombustible glass fibers, must be used.

Water and Wastewater Analysis Laboratory Manual For Environmental Health Science Students
University of Gondar Collage of Medicine and Health Science 206
A number of units for conductivity are in current use. The tradition unit for conductivity is
1/ohm-cm, or mho/cm. In the SI system of units, siemens (S) is the reciprocal of ohm
and conductivity is often reported in units of S/cm. Thus, S/cm and mho/cm are
equivalent units. The total dissolved solids (in mg/L) of a water sample can be estimated
by multiplying the conductivity (in µS/cm) by an empirical constant (usually between 0.55
and 0.90). This empirical constant should be determined for a particular water sample by
comparing conductivity measurements to a direct gravimetric analysis.
The purpose of this laboratory is to examine the turbidity, conductivity, and solids content
of several different water samples.
Volatile Dissolved
Nonvolatile Dissolved
Solids
Volatile Suspended
Solids (VSS)
Figure 4.5. Operational definition of different types of solids.
0.45 m filtration
Heating at 550 C
Sample
Heating at 105 C
Heating at 105 C
Heating at 105 C
Heating at 550 C
Total Dissolved Solids (TDS) Total Suspended
Solids (TSS)
Total Volatile Solids (TVS)
Nonvolatile Total Solids
Heating at 550 C

Water and Wastewater Analysis Laboratory Manual For Environmental Health Science Students
University of Gondar Collage of Medicine and Health Science 207
4.25.1. Reagent and Apparatus.
a).Glassware: (250mL volumetric flask [1 per analysis team], 300mL beaker, 100
mL beaker, 25mL volumetric pipette.
b).Check standard: (prepared by the TA by suspending 100 mg/L kaolin in a
solution of 100 mg/L NaCl in deionized water)
c).Turbidity meter and sample cells:
d).Filtration apparatus: (vacuum flask, clamp, 2-piece membrane holder, and
pump)
e).Filter papers: (rinsed, dried at 103 � 105 C, and stored in desiccators by TA
prior to lab)
4.25.2. Procedures.
4.25.2.1 Total Solids dried at 103�105OC
1. Clean a porcelain evaporating dish and place it in an oven at 103-105OC or 1 hour, or
if the fixed and volatile solids determinations is also to be made, ignite at 550 + 50OC
in a muffle furnace for 1 hour
2. Place the dish in desiccators and weight as soon as it has cooled to balance
temperature
3. Thoroughly mix the sample and transfer a sample volume that will yield a residue
between 2.5 mg and 200 mg to pre weighed dish. (Care must be taken to keep the
solids in suspension while measuring)
4. Place the dish on a steam bath and evaporate the sample to dryness.
5. Dry the dish and residue in an oven maintained at 103-105OC for I hour
6. Place the dish in desiccators and weigh as soon as it has cooled to balance
temperature.
7. Repeat cycle of drying cooling desiccating and weighing until a constant weight is
obtained, or until weight loss is less than 4% of previous weight or 0.5 mg.
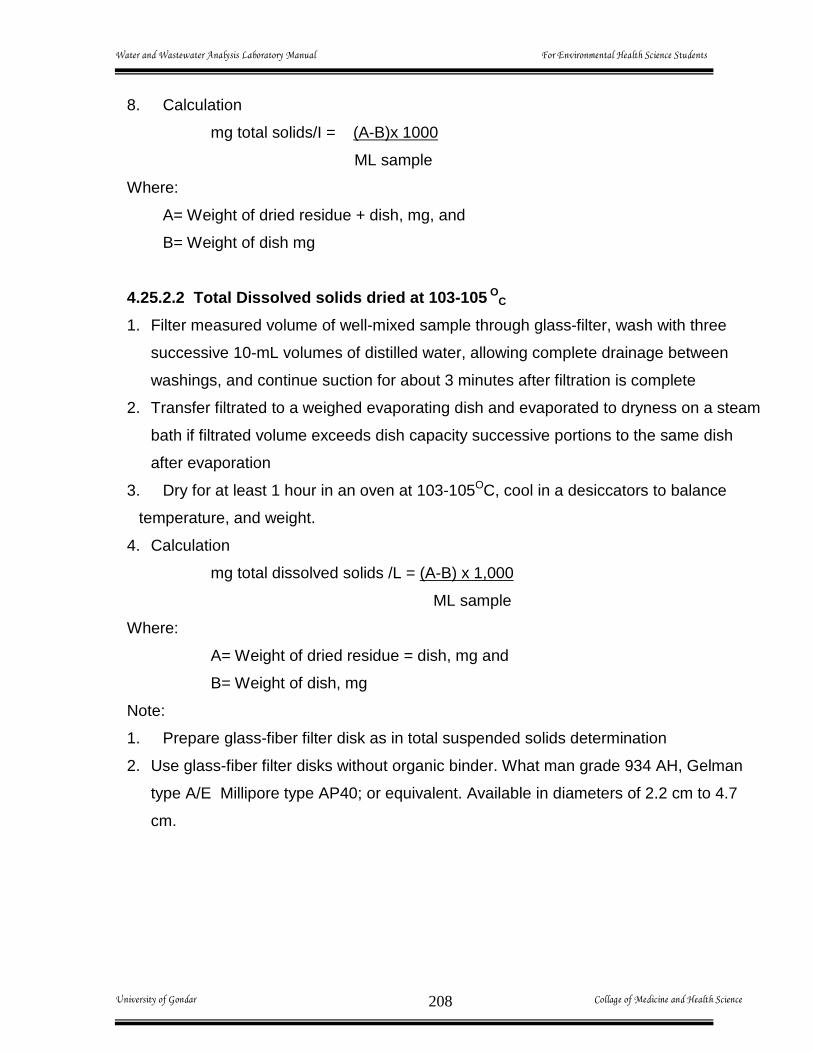
Water and Wastewater Analysis Laboratory Manual For Environmental Health Science Students
University of Gondar Collage of Medicine and Health Science 208
8. Calculation
mg total solids/I = (A-B)x 1000
ML sample
Where:
A= Weight of dried residue + dish, mg, and
B= Weight of dish mg
4.25.2.2 Total Dissolved solids dried at 103-105 OC
1. Filter measured volume of well-mixed sample through glass-filter, wash with three
successive 10-mL volumes of distilled water, allowing complete drainage between
washings, and continue suction for about 3 minutes after filtration is complete
2. Transfer filtrated to a weighed evaporating dish and evaporated to dryness on a steam
bath if filtrated volume exceeds dish capacity successive portions to the same dish
after evaporation
3. Dry for at least 1 hour in an oven at 103-105OC, cool in a desiccators to balance
temperature, and weight.
4. Calculation
mg total dissolved solids /L = (A-B) x 1,000
ML sample
Where:
A= Weight of dried residue = dish, mg and
B= Weight of dish, mg
Note:
1. Prepare glass-fiber filter disk as in total suspended solids determination
2. Use glass-fiber filter disks without organic binder. What man grade 934 AH, Gelman
type A/E Millipore type AP40; or equivalent. Available in diameters of 2.2 cm to 4.7
cm.

Water and Wastewater Analysis Laboratory Manual For Environmental Health Science Students
University of Gondar Collage of Medicine and Health Science 209
4.25.2.3 Total Dissolved Solids Dried At 103-105oc
1. Filter measured volume of well-mixed sample through glass-fiber-filter, wash with three
successive 10-mL volumes of distilled water, allowing complete drainage between
washings, and continue suction for about 3 minutes after filtration is complete
2. Transfer filtrated to a weighed evaporating dish and evaporate to dryness on a steam
bath if filtrate volume exceeds dish capacity successive portions to the same dish after
evaporation
3. Dry for at least 1 hours in an oven at 103-105oc, cool in a desiccators to balance
temperature, and weigh.
4. Calculation
mg total dissolved solids/L = (A-B)x 1,000
ML sample
Where:
A= Weight of dried residue= dish, mg and
B= Weight of dish, mg
Note:
1. Prepare glass-fiber filter disk as in total suspended solids determination
2. Use glass-fiber filter disks without organic binder. what man grade 934 AH, Gelman
type A/E; Millipore type AP40; or equivalent. Available in diameters of 2.2 cm to 4.7 cm.
4.25.2.4 Total suspended solids (dried at 103-105OC)
Centrifugation Method
1. Clean an empty centrifuge tube thoroughly and dry at 103-105OC in an oven
2. Cool in a desiccators and weigh (A gram)
3. Place 10 mL of thoroughly mixed sample in the centrifuge tube by means of a pipet
4. Centrifuge for 10 minutes at 2000 rpm.
5. Pour off the supernatant and add distilled water. Stir the tube and centrifuge again for
10 minutes at 2000 rpm.
6. Pour of the water and dry for 1 hour at 103-105OC
7. Cool in a desiccators and weight (B gram)

Water and Wastewater Analysis Laboratory Manual For Environmental Health Science Students
University of Gondar Collage of Medicine and Health Science 210
8. Calcualtion:
mg/L suspended solids = (B-A) x 1,000,000
mL of sample
Sludge volume Index (SVI)
Calculate the SVI by the following formula
Sludge Volume Index (mL/g) = Settled Sludge Volume (ML/L) x 10000
Suspended solids (mg/L)
4.25.2.5. Total suspended solids dried at 103-105-oc.
Gravimetric method preparation of glass-fiber disk
1. Insert disk with wrinkled side up in filtration apparatus
2. Apply vacuum and wash disk with three successive 20-mL portions of distilled water
continue suction to remove all traces of water, and discard washing
3. Removal filter from filtration apparatus along with the Gooch crucible and dry in an
oven at 103 to 105 OC for 1 hour. If volatile solid are to be measured, ignite at 550 ±50
OC for 15 minutes in a muffle furnace.
4. Cool in desiccators to balance temperature and weighing until a constant weight is
obtained or until weight loss is less than 0.5 mg between successive weightings.
Sample analyses
1. Assemble filtering apparatus and filter and begin suction. Wet filter with a small volume
of distilled water to seat it.
2. Filter a measured volume of well mixed sample through the glass fiber filter.
3. Wash with three successive 10-mL volumes of distilled water, allowing complete
drainage between washings and continue suction for about 3 minutes after filtration is
complete.
4. Remove the crucible and filter combination from the crucible adapter if a Gooch
crucible is used
5. Dry for at least I hour at 103 to 105 OC in an oven, Cool in a desiccators to balance
temperature, and weigh

Water and Wastewater Analysis Laboratory Manual For Environmental Health Science Students
University of Gondar Collage of Medicine and Health Science 211
6. Calculation
Mg suspended solids/L = (A-B)x 1000
ML sample
Where:
A= Weight of filter + dried residue, mg
B= Weight of filter, mg
4.25.2.6 Saleable solids
Gravimetric Method
1. Determine total suspended solids of well-mixed sample
2. Pour a well-mixed sample into a glass vessel of not less than 9 cm diameter using not
less than 1 L and sufficient to give a depth of 20 cm.
3. Let stand quiescent for 1 h and , without disturbing the settled or floating material,
siphon 250 mL from the center of the container at a point half way between the surface
of the settled material and the liquid surface.
4. Determine the total suspended solids (mg/l) of this supernatant liquor. These are the
non settle able solids.
5. Calculation
mg settle able solids/L = mg total suspended solids/L-mg
non settle able solids/L
Fixed an volatile solids Ignited at 550OC
1. Ignite the residue produced from the total solids, total dissolved solids or total
suspended solids determination to constant weight in a muffle fumace at a temperature
of 550 + 50OC about 15 to 20 minutes
2. Let dish or filter disk cool partially in air until most of the heast has been dissipated
3. Transfer to a desiccators for final cooling in a dry atmosphere
4. Weigh dish or disk as soon as it has cooled to balance temperature
5. Repeat cycle of igniting, cooling desiccating and weighing until constant weight is
obtained or until weigh loss is less than 4% of previous weight.

Water and Wastewater Analysis Laboratory Manual For Environmental Health Science Students
University of Gondar Collage of Medicine and Health Science 212
6. Calculation
mg volatile solids/L = (A-B) x 1000
mL sample
mg fixed solids/L = (B-C) x 1000
mL sample
Where:
A. Weight of residue + dish before ignition, mg
B. Weight or residue + dish of filter after ignition, mg &
C. Weight of dish of filter, mg.
4.25.2.7 Total Fixed and volatile solid in solid and semisolid samples
A) Total Solids
1. Preparation of evaporating dish-if volatile solids are to be measured, ignite a clean
evaporating dish at 550 + 50OC for 1 hour in a muffle furnace. If only total solids are to
be measured, heat the dish at 103 to 105OC for 1 hour in an oven. Cool in a desiccators
and weigh, and store in a desiccators until ready for use.
2. Sample Analysis
a. fluid samples- if the sample contains enough moisture to flow more or less readily stir
to homogenize, place 25 to 50g in a prepared evaporating dish, and weigh
evaporate to dryness on a water bath, dry at 103 to 105OC
for 1 hour, cool
to balance temperature in desiccators and weigh.
b. Solid samples-if the sample consists of discrete pieces of solid material
(dewatered sludge, for example) pulverize the entire sample coarsely on
a clean surface by hand using rubber gloves. Place 25 to 50g in
prepared evaporating dish and weigh. Place in an oven at 103 to 105OC
overnight cool to balance temperature in a dedicator and weigh.
B. Fixed and volatile solids: Transfer to a cool muffle furnace, heat fumes to 550 + 50OC
and ignite for 1 hour (if the residue from 2) above contains large amounts
of organic matter, first ignite the residue over a gas burner and under and
exhaust hood in the presence of adequate air to lessen losses due to

Water and Wastewater Analysis Laboratory Manual For Environmental Health Science Students
University of Gondar Collage of Medicine and Health Science 213
reducing conditions, and to avoid odor in the laboratory) cool in desiccators
to balance temperature and weigh.
3. Calculation
Mg Volatile Solids/L = (A-B) x 100
mL sample
Where:
A: Weight of residue + dish before ignition, mg
B: Weight of residue + dish or filter after ignition, mg and
C: Weight of dish or filter, mg
4.26. Chromium
The hexavalent chromium concentration of U.S. drinking water has been reported to vary
between 3 and 40 µg/L with a mean if 3.2 µg/L. Chromium slats are used extensively in
industrial processes and may enter a water supply through the discharge of wastes.
Chromate compounds frequently are added to cooling water for corrosion control.
Chromium may exist in water supplies in both the hexavalent and the trivalent state the
trivalent form rarely occurs in potable water.
The colorimetric method is useful for the determination of heaxavalent chromium in a
natural or treated water intended to be potable. The ion chromatographic method is suitable
for determining dissolved hexavalebt chromium in drinking water groundwater, and industrial
wastewater effluents. The electro thermal atomic absorption spectrometric method is
suitable for determining low levels of total chromium (<50 µg/L) in water and wastewater,
and the flame atomic absorption spectrometric method or the inductively coupled plasma
method for measuring concentrations up to milligram per-liter levels.
If only the dissolved metal content is desired, filter sample through a 0.45- µm members
filter at the time of collection. After filtration acidify filtrate with conc. nitric acid (HNO3) to pH
<2. If the total chromium content is desired acidify unfiltered sample at time of collection with
conc HNO3 to pH<2.

Water and Wastewater Analysis Laboratory Manual For Environmental Health Science Students
University of Gondar Collage of Medicine and Health Science 214
This procedure measures only hexabalent chromium (Cr6-). Therefore to determine total
chromium convert all the chromium to the hexavalent state by oxidation with potassium
permanganate. The hexavalent chromium is determined calorimetrically by reaction with
diphenylcarbazide in acid solution. A red-violet color of unknown composition is produced.
The reaction is very sensitive the absorptivity based on chromium being about 40000 Lg-1 at
540 nm. To determine being the sample with a sulfuric nitric acid mixture and then oxidize
with potassium permanganate before reacting with the diphenylcarbazide.
The reaction with diphenylcarbazide is nearly specific for chromium. Hexavalent
molybdenum and mercury salts will react to form color with the reagent but the intensities
are much lower than that for chromium at the specified pH. Concentrations as high as 200
mg Mo or Hg/L can be tolerated vanadium interferes strongly but concentrations up 10 times
that of chromium will not cause trouble. Potential interference from permanganate is
eliminated by prior reduction with azide iron in concentrations greater than 1mg/L may
produced a yellow color but the ferric ion (Fe3-) color is not strong and no difficulty is
encountered normally if the absorbance is measured photo metrically at the appropriate
wavelength. Interfering amounts of molybdenum, vanadium iron and copper can be
removed by (CHCL3) A procedure for this extraction is provided but do not use it unless
necessary because residual cupferron and CHCL3 in the aqueous solution complicate the
later oxidation. There fore follow the extraction by additional treatment with acid fuming to
decompose these compounds
To determine the chromium concentration of the various forms of water and waste water by
diphenyl carbazide method

Water and Wastewater Analysis Laboratory Manual For Environmental Health Science Students
University of Gondar Collage of Medicine and Health Science 215
Diphenyl Carbazide Method
4.26.1. Reagent and Apparatus.
a). Stock chromium solution: dissolve 141.1 mg K2Cr2O2 in water & dilute to 1L. 1mL =
50.0 µg cr.
b). Standard chromium solution: dilute 10.0-mL stock chromium solution to 100 mL
1.00-mL = 5.00 µg Cr.
c). Nitric acid, HNO3 conc.
d). Sulfuric acid. H2SO4 1+1
e). Methyl orange indicator solution
f). Hydrogen peroxide H2O2,30%.
g). Redistilled water:-Distilled water re-distilled in all-glass apparatus.
h). NH4OH, Conc.
i). Potassium permanganate solution: dissolve 4g KMnO4 in 100-mL water.
j). Sodium azide solution: Dissolve 0.5g NaN3 in 100-mL water
k.)Diphenylcarbazide solution: dissolve 250 mg 1.5-diphenylcarbazide in 50-mL
acetone. Store in a brown bottle discard when solution becomes discolored.
l). Sulfuric acid. H2SO4 0.2N: dilute 17-mL 6N H2SO4 to 500-mL with water.
m). Chloroform � chemically pure.
n). Cupferron solution: Dissolve 5g C6H5N (NO) ONH4 in 96 m water
4.26.2. Procedures
Preparation of Calibration Curve
1. Pipette measured volumes of standard chromium solution (5µg/mL) ranging from 2.0
to 20.0-mL to give standards for 10 to 100µg Cr. into 250-mL beakers or conical
flasks.
2. Proceed with subsequent treatment of standards as if they were samples.
3. Develop color as for sample, transfer a suitable portion of each colored solution to a
1-cm absorption cell, and measure the absorbance at 540 nm.

Water and Wastewater Analysis Laboratory Manual For Environmental Health Science Students
University of Gondar Collage of Medicine and Health Science 216
4. As reference, use distilled water, correct absorbance readings or standards by
subtracting the absorbance of a reagent blank carried through the method.
5. Construct a calibration curve by plotting corrected absorbance values against
micrograms chromium in 102-mL final volume Oxidation of Trivalent Chromium to
Hexa valent Chromium
1. Pipette a portion of sample containing 10 to 100 µg Cr into a 125-mL conical flask
2. Using methyl orange as indicator add conc. Ammonium hydroxide until the solution is
just basic to methyl orange, then adds 1+1 H2SO4 drop wise until it is acidic plus 1 ml
in excess.
3. Adjust volumes to about 40-mL add a few glass beads, and heat to boiling.
4. Add 2 drops potassium permanganate solution to give a dark red color. If fading
occurs add KMnO4 drop wise to maintain excess of about 2 drops.
5. Boil for 2 minutes longer. Add 1-mL sodium azide and continue boiling gently. If the red
color does not fade completely after boiling for approximately 30 seconds add another
1-mL sodium aside solution
6. Continue boiling for 1 minute after the color has faded completely. Cool and add 0.25-
mL (5 drops) orthophosphoric
Color Development
1. With 0.2N sulphuric acid and using a PH meter, adjust the solution PH to 1.0 + 0.3
2. Transfer the solution to a 100-mL volumetric flask or stopered graduated cylinder, diluted
to 100mL and mix thoroughly
3. Add 2 ml diphenyl carbazide solution, mix and let stand 5 to 10 minutes for full color
development.
4. Transfer and appropriate portion to 1-cm absorption cell and measure its absorbance at
540 nm. Use distilled water as reference.
5. Correct absorbance reading or sample by subtracting the absorbance f the blank
carried through the method
6. From the corrected absorbance, determine micrograms Cr present by reference to the
calibration curve.
7. Calculation

Water and Wastewater Analysis Laboratory Manual For Environmental Health Science Students
University of Gondar Collage of Medicine and Health Science 217
mg Cr/L= µg Cr
mL sample
Note:
4. If the sample contains organic matter, it must be subjected to acid digestion to destroy
the organic matter.
5.If the solution is turbid after dilution to 100-mL take an absorbance reading before adding
carbonize reagent and correct the absorbance reading of the final colored solution by
subtracting the absorbance measured previous .
4.27. Arsenic
Severe poisoning can arise from the ingestion of as little as 100 mg arsenic trioside chronic
effects may result from the accumulation of arsenic compounds in the body at low intake
levels. Carcinogenic properties also have been imputed to arsenic compounds. The arsenic
concentration in most potable waters seldom exceeds 10µg/L although values as high as
100 µg/L have been reported. Aqueous arsenic in the form of arsenate and organic arsenic
arsenicals may result from mineral dissolution industrial discharges or the application of
herbicides. The chemical form of arsenic depends on its source (inorganic arsenic from
minerals industrial discharges, and insecticides organic arsenic from industrial discharges
insecticides and biological action on inorganic arsenic).The toxicity of arsenic depends on
its chemical form.
Methods are available to identify and determine arsenite, arsenate, methylarsonic acid,
dimethylarsinic acid, arsenocholine, arsenobetaine and other organic arsenic compounds.
Unpolluted fresh water normally does not contain organic arsenic compounds but may
contain inorganic arsenic compounds in the form of arsenate and arsenite.
Silver diethldithiocarbamate Method
Arsenite containing trivalent arsenic is reduced actively by aqueous sodium borohydride
solution to arsine in an aqueous medium of pH 6. Arsenate methylarsonic and

Water and Wastewater Analysis Laboratory Manual For Environmental Health Science Students
University of Gondar Collage of Medicine and Health Science 218
dimethylarsenic acid are not reduced under these concentrations. The generated arsine is
swept by a stream of oxygen nitrogen from the reduction vessel through a scrubber
containing glass wool or cotton impregnated with lead acetate so into an absorber tube
containing silver diethyldithiocarbamate and morpholine dissolved in chloroform. A red color
develops, the intensity of which is measured at 520nm.
4.27.1. Apparatus and reagents:
Apparatus:
a) Arsine generator scrubber and absorption tube:
Use a 200-mL three-necked flask with a sidearm through which the delivery tube
reaching almost to the bottom of the flask.
Place a small magnetic stirring bar to flask. Fit absorber tube (20-mL capacity) to the
scrubber with silver diethyldithiocarbamate solution. Do not use cork stoppers because
they may absorb arsine. Clean equipment with concentrated nitric acid.
b) Fume hood: use apparatus in a well-ventilated hood with flask secured on top of a
magnetic stirrer.
c) Photometric equipment:
1. Spectrophotometer, for use at 520 nm.
2. Filter photometer, with green filter having maximum transmittance in the 500- to 540-nm
range.
3. Cells, for Spectrophotometer or Filter photometer, 1-cm, clean, dry, and each equipped
with a tightly fitting cover (TFE stopper) to prevent chloroform evaporation.
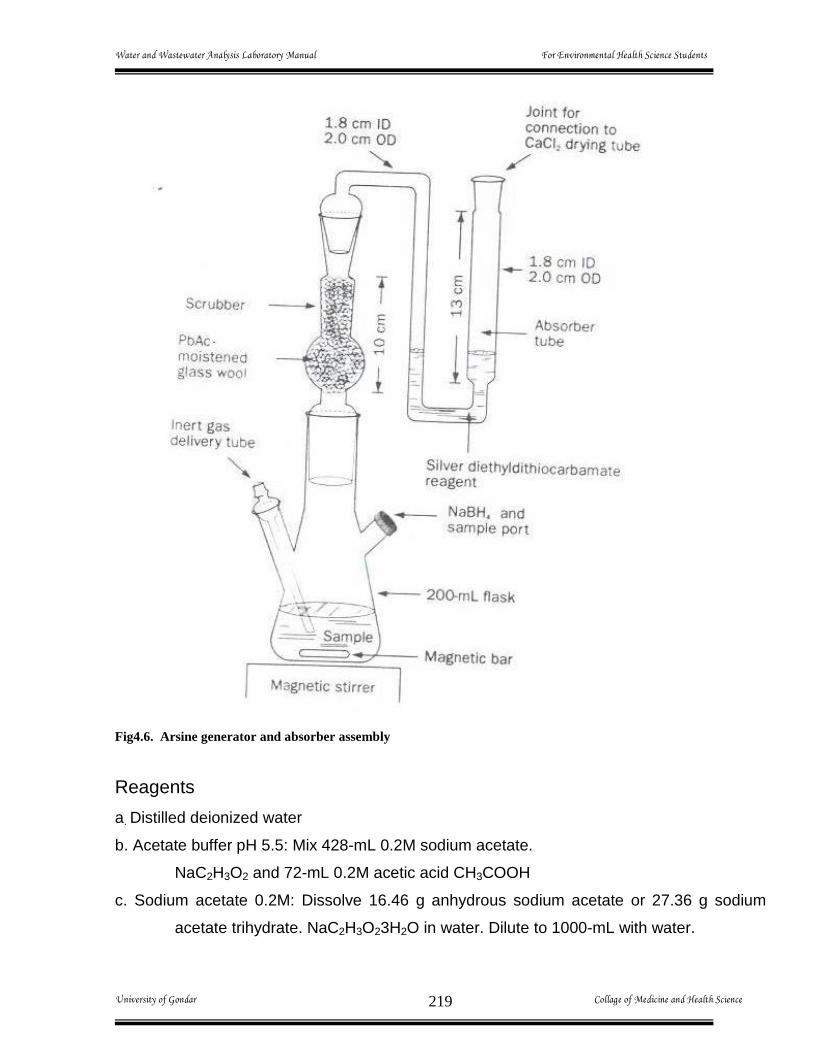
Water and Wastewater Analysis Laboratory Manual For Environmental Health Science Students
University of Gondar Collage of Medicine and Health Science 219
Fig4.6. Arsine generator and absorber assembly
Reagents
a. Distilled deionized water
b. Acetate buffer pH 5.5: Mix 428-mL 0.2M sodium acetate.
NaC2H3O2 and 72-mL 0.2M acetic acid CH3COOH
c. Sodium acetate 0.2M: Dissolve 16.46 g anhydrous sodium acetate or 27.36 g sodium
acetate trihydrate. NaC2H3O23H2O in water. Dilute to 1000-mL with water.

Water and Wastewater Analysis Laboratory Manual For Environmental Health Science Students
University of Gondar Collage of Medicine and Health Science 220
d. Acetic acid 0.2M: Dissolve 11.5-mL glacial acetic acid in water. Dilute to 1000-mL
e. Sodium borohydride solution, 1%: dissolve 0.4g sodium hydroxide NaOH(4 pellets), in
400-mL water. Add 4.0 g sodium borohydride. NaBH, (check for absence of arsenic).
Shake to dissolve and to mix. Prepare fresh every few days.
f. Hydrochloric acid. HCl, 2M: Dilute 165-mL conc. HCl to 1000-mL with water
g. Lead acetate solution: Dissolve 10.0g Pb (CH3COOO)2 3H2O in 100-mL water.
h. Silver diethyldithiocarbamate solution: Dissolve 1.0-mL morpholine (CAUTION:
corrosive-avoid contact with skin) in 70-mL chloroform, CHCl3 . Add 0.30g silver
diethyldithiocarbamates. Ag SCSN(C2H5)2: Shake in a stoppered flask until most is
dissolved. Dilute to 100-mL with chloroform. Filter and store in a tightly closed brown
bottle in a refrigerator.
i. Intermediate arsenite solution: Dilute 10.0-mL stock solution to 100-mL with water:
1.00-mL = 10.0 µg AS. CAUTION: Toxic-avoid contact with skin and do not ingest.
j. Intermediate arsenite solution: dilute 10.0-mL stock solution to 100-mL with water:
1.00mL = 100 µg As.
k. Standard arsenate solution: dilute 10.0-mL intermediate solution to 100-mL with water:
1.00-mL = 1.00 µg As.
l. Standard arsenate solution: dissolve 0.416g Na2HAsO4.7H2O in water and dilute to 100-
mL. Dilute 10.0-mL to 100mL with water; dilute 10-mL of this intermediate solution to
100mL: 1.00-mL = 1.00 µg As.
4.27.2. Procedure:
a. Arsenite:
1. Preparation of scrubber and absorber-dip glass wool into lead acetate solution:
-Remove excess by squeezing glass wool. Press glass wool between pieces of filter paper,
and then fluff it.
-Alternatively, if cotton is used treat it similarly but dry in a desiccator and fluff thoroughly
when dry. Place a plug of loose glass wool or cotton in scrubber tube.

Water and Wastewater Analysis Laboratory Manual For Environmental Health Science Students
University of Gondar Collage of Medicine and Health Science 221
-Add 4.00-mL silver diethyldithiocarbamate solution to absorber tube (5.00-mL may be used
to provide enough volume to rinse spectrophotometer cell).
2. Loading of arsine generator----pipette not more than 70-mL sample containing not more
than 20.0 µg As (arsenite) into the generator flask.
-Add 10-mL acetate buffer. If necessary, adjust total volume of liquid to 80-mL.
-Flush flask with nitrogen at the rate if 60-mL/min
3. Arsine generation and measurement---while nitrogen is passing through the system,
use a 30-mL syringe to inject through the septum 15-mL 1% sodium borohydride solution
within 2 min.
-Stir vigorously with magnetic stirrer.
-Pass nitrogen through system for an additional 15 min to flush arsine into absorber solution
pour absorber solution into a clean and dry spectrophotometeric cell and measure
absorbance at 520nm against chloroform.
- Determine concentration from a calibration curve obtained with arsenite standards. If
arsenate also is to be determined in the same sample portion save liquid in the generator
flask
4. Preparation of standard curves---Treat standard arsenite solution containing 0.0, 1.0,
2.0, 5.0. 10.0 and 20.0 µg As described in 1 through 3 above.
-plot absorbance versus micrograms arsenic in the standard.
b. Arsenate:
-After removal of arsenite as arsine, treat sample to convert arsenate to arsine:
-If the lead acetate-impregnated glass wool has become ineffective in removing hydrogen
sulfide (if it has become gray to black) replace glass wool.
-Pass nitrogen through system at the rate of 60-mL/min.
-cautiously add 10-mL, 2.0N HCl. Generate arsine and prepare standard curves with
standard solutions of arsenate.

Water and Wastewater Analysis Laboratory Manual For Environmental Health Science Students
University of Gondar Collage of Medicine and Health Science 222
c. Total inorganic arsenic:
-prepare scrubber and absorber as directed in 4.26.2.a1 and load arsine generator as
directed in 4.26.2a2 using 10-mL 2.0N HCl instead of acetate buffer.
-Generate arsine and measure as directed in 4.26.2.a3.
-Prepare standard curves according to 426.2.a4 .Curves obtained with standard arsenite is
almost identical to those obtained with arsenate standard solutions. -Therefore use either
arsenite or arsenate standards.
d. Calculation
Calculate arsenite, arsenate, and total inorganic arsenic from readings and calibration
curves obtained in 4.26.2a, b, and c, respectively, as follows:
mg As/L= µg As(from calibration curve)/mL sample in generator flask
Interferences: Although certain metals chromium, cobalt, mercury, molybdenum, nickel,
platinum and silver influence the generation of arsine, their concentrations seldom are high
enough to interfere.
- H2S interferes, but interference is removed with lead acetate.
- Antimony is removed to stibine, which forms a colored complex with an absorption
maximum at 510 nm.
- .Methylarsenic compounds are reduced at pH 1 to methylarsines, which form colored
complexes with the absorber ion.
- If methylarsenic compounds are present, measurements total arsenic and arsenate
are unreliable. The results for arsenics are not influenced by methylarsenic
compounds.
-Minimum detectable quantity: 1µg arsenic.

Water and Wastewater Analysis Laboratory Manual For Environmental Health Science Students
University of Gondar Collage of Medicine and Health Science 223
4.28. Lead
Lead is a serious cumulative body poison. Natural waters seldom contain more than 5 g/L
although much higher values have been reported. Lead in a water supply may come from
industrial, mine .and smelter discharges or from the dissolution of old lead plumbing. Tap
waters that are soft, acid, and not suitably treated may contain lead resulting from an attack
on lead service pipes or solder pipe joints.
The atomic absorption spectrometric method has a relatively high detection limit in the flame
mode and requires an extraction procedure for the low concentration common in potable
water; the elecrothermal atomic absorption method in much more sensitive for low
concentrations and does not require extraction. The inductively coupled plasma method has
a sensitivity similar to that flame atomic absorption method. The Dithizone method is
sensitive and specific as a colorimetric procedure.
Dithizone Method
An acidified sample containing microgram quantities of lead is mixed with ammoniacal
citrate-cyanide reducing solution and extracted with dithizone in chloroform (CHCl3) to form
a cherry-red lead dithizonate. The color of the mixed color solution is measured
photometrically. Sample volume taken for analysis may be 2L when digestion is used.
Preliminary sample treatment: At time of collection acidify with conc. HNO3 to PH<2 but
avoid excess HNO3. Add 5-mL 0.1N iodine solution to avoid losses of volatile organo-lead
compounds during handling and digesting of samples, prepare a blank of lead-free distilled
water and carry through the procedure.
Digestion of samples: Unless digestion is shown to be unnecessary, digest all samples for
dissolved or total lead.
Minimum detectable concentration: 1.0 µg Pb/10mL dithizone solution

Water and Wastewater Analysis Laboratory Manual For Environmental Health Science Students
University of Gondar Collage of Medicine and Health Science 224
4.28.1. Apparatus and Reagents :
Apparatus :
a. Spectophotometer for use at 510nm, providing a light path of 1cm or longer
b. pH meter.
c. Separatory funnels : 250-mL squibb type. Clean all glass -ware , including sample
bottles, with 1 + 1HNO3 . Rinse thoroughly with distilled or deionized water.
d. Authomatic dispensing burets : Use for all reagents to minimize indeterminate
concentration errors.
Reagents :
Prepare all reagents in lead-free distilled water.
a. Stock lead solution: dissolve 0.1599g lead nitrate, Pb (NO3)2 (minimum purity
99.5%), in approximately 200-mL water. Add10-mL conc. HNO3 and dilute to 1000-mL
with water. Alternatively, dissolve 0.1000 g pure Pb metal in 20-mL 1 + 1 HNO3 and
dilute to 1000-mL with water: 1:00-mL = 100 µg Pb.
b. Working lead solution: Dilute 2.0mL stock solution to 100-mL with water:
1mL= 2.00 µg Pb.
c. Nitric acid, HNO3, 1 + 4: Dilute 200-mL conc. HNO4 to 1 L with water
d. Ammonium hydroxide, NH4OH, 1 + 9 : Dilute 10-mL conc. NH4OH to 100-mL with
water
e. Citrate Cyanide reducing solution: dissolve 400g dibasic ammonium citrate.
(NH4)2HC6H5O7, 20g anhydrous sodium sulfite, Na2SO3, 10g hydroxylamine
hydrochloride, NH2OH-HCl, and 40g potassium cyanide, KCN (CAUTION: poison) in
water and dilute to 1L. Mix this solution with 2L conc. NH4OH. Do not pipette by
mouth
f. Stock dithizone solution:

Water and Wastewater Analysis Laboratory Manual For Environmental Health Science Students
University of Gondar Collage of Medicine and Health Science 225
g. Dithizone working solution: dilute 100-mL stock dithizone solution to 250-mL with
CHCl3: 1-mL= 40 µg dithizone
h. Special dithizone solution: dissolve 250mg dithizone in 250-mL CHCl3. This solution
may be prepared without purification because all extracts using it are discarded.
i. Sodium sulfite solution: dissolve 5g anhydrous Na2SO3 in 100-mL water
j. Iodine solution: dissolve 40g KI in 25-mL water, add 12.7 g resublimed iodine and
dilute to 1000-mL.
4.28.2. Procedure
a. With sample digestion:
-To a digested sample containing not more than 1-mL conc. acid add 20-mL 1 + 4 HNO3
and filter through lead-free filter paper and filter funnel directly into a 250-mL
separatory funnel.
-Rinse digestion beaker with 50-mL water and add to filter. Add 50-mL ammoniacal
citrate-cyanide solution, mix, and cool to room temperature.
-Add 10-mL dithizone working solution, shake stoppered funnel vigorously for 30seconds,
and let layers separate.
-Insert lead-free cotton in stem of separatory funnel and draw off lower layer.
-Discard 1 to 2-mL CHCl3 layer, then fill absorption cell.
- Measure absorbance of extract at 510 nm, using dithizone working solution, 4.27.1g
above to zero spectrophotometer.
b. Without sample digestions:
-To 100-mL acidified sample (pH 2) in a 250-mL separaorty funnel add 20-mL 1+ 4 HNO3,
and 50-mL citrate-cyanide reducing solution; mix.
-Add 10-mL dithizone working solution and proceed as in 4.27.2a above.
c. Calibration curve:
-plot concentration of at least five standards and a blank against absorbance.
-Determine concentration of lead in extract from curve. All concentrations are µg Pb/10-mL
final extract.

Water and Wastewater Analysis Laboratory Manual For Environmental Health Science Students
University of Gondar Collage of Medicine and Health Science 226
d. Removal of excess interferences:
-The dithizonates of bismuth, tin and thallium differ from lead dithizonate in maximum
absorbance.
-Detect their presence by measuring sample absorbance at 510 nm each wavelength by
subtracting absorbance of blank at same wavelength.
-Calculate ratio of corrected absorbance at 510 nm to corrected absorbance at 465 nm. -
The ratio of corrected absorbance for lead dithizonate is 2.08 and for bismuth dithizonate is
1.07. If the ratio for the sample indicates interference, i.e., is markedly less than 2.08
proceed as follows with a new 100-mL sample. If the sample has not been digested, add 5-
mL Na2SO3 solution to reduce iodine preservative.
-Adjust sample to pH 2.5 using a pH meter and 1 + 4 HNO3 or 1 + 9 NH4OH as required. -
Transfer sample to 250-mL separatory funnel, extract with a minimum of three 10-mL
portions special dithizone solution or until the CHCl3 layer is distinctly green. Extract with 20-
mL portions CHCl3 to remove dithizone (absence of green) Add 20-mL 1+4 HNO3.50-mL
citrate-cyanide reducing solution, and 10-mL dithizone working solution. Extract as in
4.27.2a and measure absorbance.
e. Calculation
mg Pb/L = µg (in 10mL. from calibration curve)
mL sample
Interference: In a weakly ammoniacal cyanide solution (pH 8.5 to 9.5) dithizone forms
colored complexes with bismuth, stannous tin and monovalent thallium. In strongly
ammoniacal citrate �cyanide solution (pH 10 to 11.5) the dithizonates of these ions are
unstable and are extracted only partially. This method uses a high pH, mixed color, single
dithizone extraction. Interference from stannous tin and monovalent thallium is reduced
further when these ions are oxidized during preliminary digestion. A modification of the
method allows detection and elimination of bismuth interference. Excessive quantities of
bismuth, thallium, and tin may be removed.
Water and Wastewater Analysis Laboratory Manual For Environmental Health Science Students
University of Gondar Collage of Medicine and Health Science 227
Dithizone in CHCl3, absorbs at 510 nm; control its interference by using nearly equal
concentrations of excess dithizone in samples, standards and blank.
The method is without interference for the determination of 0.0 to 30.0µg Pb in the
presence of 20 µg Tl+, 100 µg Sn2+, 200 µg In3+, and 1000 µg each of Ba2+, Cd2+, Co2+,
CU2+, Mg2+, Mn2+, Hg2+, Sr2+ , Zn2+, Al3+ , Sb, As3+, Cr3+, Fe3+, V3+, PO43-, and SO4
2-. Gram
quantities of alkali metals do not interfere. A modification is provided to avoid interference
from excessive quantities of bismuth or tin.
4.29. Mercury
Organic and inorganic mercury salts are very toxic and their presence in the environment,
especially in water, should be monitored.
The cold vapor atomic absorption method is the method of choice for all samples, while the
dithizone method can be used for determining high levels of mercury (>2 µg/L) in potable
water
Because mercury can be lost readily from samples, preserve them by treating with HNO3 to
reduce the pH to <2.
Dithizone method
Mercury ions react with a dithizone solution in chloroform to form an orange color. The
various shades of orange are measured in a spectrophotometer and unknown
concentrations are calculated from a standard curve.
Minimum detectable concentration: 1 µg Hg/10-mL final volume corresponding to µg Hg/L
when a 500-mL sample is used. Acceptable precision is obtained when this concentration is
exceeded.

Water and Wastewater Analysis Laboratory Manual For Environmental Health Science Students
University of Gondar Collage of Medicine and Health Science 228
4.29.1. Apparatus and Reagents
Apparatus
a. Spectrophotometer, for measurements at 492 nm, providing a light path of 1cm or longer
b. Separatory funnels 250-and 1000-mL, with TFE stopcocks,
c. Glass-ware: Clean all glassware with potassium dichromate sulfuric acid cleaning
solution. When possible, dedicate glass water for use in Hg analysis. Avoid using glassware
previously exposed to high levels of Hg.
Reagents
a. Mercury-free water: Use redistilled or deionized distilled water for preparing all reagents
and dilutions
b. Stock mercury solution: dissolve 135.3 mg mercuric chloride, HgCl2 in about 700mL water
add 1.5 L conc. HNO3 and make up to 1000-mL with water: 1.00-mL = 100 µg Hg.
c. Standard mercury solution: Dilute 1.00-mL stock solution to 100-mL with water:
1.00-mL = 1.00 µg Hg. Prepare immediately before use.
d. Potassium permanganate solution: Dissolve 5g KMnO4 in 100-mL water.
e. Sulfuric acid H2SO4 conc. low in mercury
f. Potassium persulfate solution. Dissolve 5g K2S2O8 in 100-mL water
g. Hydroxylamine hydrochloride solution: dissolve 50g NH2OH.HCl in 100mL water
h. Dithizone solution: dilute 60-mL stock dithizone solution 1 with CHCl
to 1000-mL: 1mL = 6 µg dithizone
i. Sulfuric acid 0.25N: dilute 250-mL 1NH2SO4 to 1L with water
j. Potassium bromide solution: dissolve 40g KBr in 100-mL water
k. Chloroform CHCl3 .
l. Phosphate-carbonate buffer solution: Dissolve 150 g Na2HPO4.12H2O and 38 anhydrouse
K2CO3 in 1L water. Extract with 10-mL portions of dithizone until the last portion remains
blue. Wash with CHCl3 to remove excess dithizone.
m. Sodium sulfate, Na2SO4 anhydrous

Water and Wastewater Analysis Laboratory Manual For Environmental Health Science Students
University of Gondar Collage of Medicine and Health Science 229
4.29.2. Procedure
a. Preparation of calibration curve:
-pipette 0(blank), 2.00, 4.00 6.00, 8.00, and 10.00 µg mercury into separate beakers. To
each beaker, add 500-mL water (or any other volume selected for sample) 1mL KMnO4
solution and 10-mL con. H2SO4 stir and bring to a boil.
-If necessary add more KMnO4 until a pink color persists. After boiling has ceased
cautiously add 5-mL K2S2O8 solution and let cool for 0.5h. Add one or more drops NH2OH
.HCl solution to discharge the pink color.
-When cool transfer each solution to individual 1-L separatory funnels. Add about 25-mL
dithizone solution.
-Shake separatory funnel vigorously and transfer each organic layer to a 250-mL separatory
funnel. Repeat this extraction at least three times making sure that the color in the last
dithizone layer is as intense a blue as that of the original dithizone solution.
-Wash accumulated dithizone extracts in the 250-mL separatory funnel by shaking with 50-
mL 0.25N H2SO4.
-Transfer washed dithizonate extracts to another 250-mL separatory funnel. Add 50-mL
0.25N H2SO4 and 10-mL KBr solution and shake vigorously to transfer mercury dithizonate
from organic layer to aqueous layer.
-Discard lower dithizone layer. Wash aqueous layer with a small volume of CHCl3 and
discard the CHCl3.
-Transfer 20-mL phosphate carbonate buffer solution to each separatory funnel and add 10-
mL standard dithizone solution. Shake thoroughly, and after separation, transfer the
mercury dithizone to beakers.
-The finals dithizone extract should be slightly blue. Dry contents with anhydrous Na2SO4.
-Transfer mercury dithizonate solution to a cuvette and record absorbance at 497 nm. On
linear graph paper plot absorbance against micrograms mercury in 10-mL final volume
b. Treatment of samples: Samples containing 1.5-mL Conc. HNO3 usually do not affect
dithizone, although strong solutions of HNO3 will oxidioze it. Use a 500-mL sample to
Water and Wastewater Analysis Laboratory Manual For Environmental Health Science Students
University of Gondar Collage of Medicine and Health Science 230
increase absorbance readings and prepare an absorbance blank consisting or reagents.
When necessary, filter sample through glass wool in to the separatory funnel after oxidation
step. Complete procedure as described under 4a above. Read mercury content from
calibration curve.
c. Calculation
µg Hg/L = µg Hg(in 10-mL final volume)
L sample
Interference: Copper, gold, palladium, divalent platinum and silver react with dithizone in
acid solution. Copper in the dithizone extract remains in the organic phase while the
mercury dissolves in the aqueous phase. The other contaminants usually are not present.
The mercury dithizonate must be measured quickly because it is photosensitive.
4.30. Questions:
1. Enumerate necessary reagents to determine calcium hardness of the water.
2. What are they the types of method to examine chloride, Ammonia Nitrogen, Fluoride,
phosphate, Iron and Manganese?
3. Explain the concept of DO, BOD, and COD.

Water and Wastewater Analysis Laboratory Manual For Environmental Health Science Students
University of Gondar Collage of Medicine and Health Science 231
CHAPTER FIVE
5. INTRODUCTION TO TOXICOLOGICAL ANALYSIS
5.1. Objectives
At the end of this chapter the student will be able to:
1. Distinguish the difference among short-term, intermediate and long- term toxicity
tests.
2. Identify the purpose of toxicity tests.
3. Determine basic factors to classify the type of toxicity tests.
4. Understand Toxicity Test Systems, Materials and procedures.
5.2. Introduction
Toxicity tests are desirable in water pollution evaluations because chemical and physical
tests alone are not sufficient to assess potential effects on aquatic abiota. For example, the
effects of chemical interactions and the influence of complex matrices on toxicity cannot be
determined from chemical tests alone. Different species of aquatic organisms are not
equally susceptible to the same toxic substances nor are organisms equally susceptible
throughout the life cycle. Even previous exposure to toxicants can alter susceptibility. In
addition, organisms of the same species can respond differently to the same level of a
toxicant from time to time, even when all other variables are held constant. Thus, the main
purpose of this chapter to introduce the basic toxicological analysis of water pollution.
Toxicity tests are useful for a variety of purposes that include determining:
(a) Suitability of environmental conditions for aquatic life,
(b) Favorable and unfavorable environmental factors, such as DO, pH, temperature, salinity,
or turbidity,
(c) Effect of environmental factors on waste toxicity,
(d) Toxicity of wastes to a test species,
(e) Relative sensitivity of aquatic organisms to an effluent or toxicant.
(f) Amount and type of waste treatment needed to meet water pollution control
requirements,

Water and Wastewater Analysis Laboratory Manual For Environmental Health Science Students
University of Gondar Collage of Medicine and Health Science 232
(g) Effectiveness of waste treatment methods,
(h) Permissible effluent discharge rates, and
(i) Compliance with water quality standards, effluent requirements, and discharge permits.
In such regulatory assessments, use toxicity test data in conjunction with receiving water
and site-specific discharge data on volumes, dilution rates, and exposure times and
concentration
5.3. Basic Requirements for Toxicity Tests:
The basic requirements and desirable conditions for toxicity tests are (a) an abundant
supply of water of desired quality (b) an adequate and effective flowing water system
constructed of nonpolluting on absorbing materials (c) adequate space and well-planned
holding, culturing and testing equipment and facilities (d) adequate source of health
experimental organisms and (e) appropriate lighting facilities for plant toxicity tests.
5.4. Classification of Toxicity Tests
Toxicity tests are classified according to (a) duration �short-term, intermediate, and/or
long-term (b) method of adding test solutions-static, renewal, or flow-through and (c)
purpose-effluent quality monitoring, single compounds testing, relative toxicity, relative
sensitivity, taste or odor or growth rate etc.
5.4.1. Short-term toxicity tests:
Are used for routine monitoring suitable for effluent discharge permit requirements and for
exploratory tests.
Short-term tests may be static, renewal, or flow-through. Exposure periods for these tests
usually are 48h or 96h. Static or renewal tests often are used when the test organisms are
phyto-or zoonplankton because these organisms are easily washed out in flow-through
tests. Static and renewal tests are considerably less expensive to perform than flow-through
tests.

Water and Wastewater Analysis Laboratory Manual For Environmental Health Science Students
University of Gondar Collage of Medicine and Health Science 233
5.4.2. Intermediate-Term Toxicity Tests:
Toxicity of intermediate duration typically are used when longer of exposure actions are
necessary to determine the effect of the toxicant on various life stages of long-life-cycle
organisms, and to indicate toxicant concentrations for life-cycle tests.
No sharp time separation exists between short-and intermediate-or between intermediate
and long-term tests. Usually tests lasting 10 days or less are considered short-term while
intermediate tests may last from 11 to 90days. Intermediate-length tests may be static,
renewal, or flow through, but flow-through tests are recommended for most situation.
5.4.3. Long-term, partial-or complete-Life- cycle Toxicity Tests:
Long term toxicity tests are generally used for estimating chronic toxicity. Long-term testing
may include early-life-stage, partial life-cycle or full-life-cycle testing. Exposures may be as
short as 7day to expose specific portions of an organism�s life cycle, 21 to 28 days to
several months or longer for traditional partial-life-cycle and full-life-cycle tests with fish.
5.5. Preparing organisms for toxicity tests:
The organisms should appear healthy, behave normally, feed well, and have low mortality in
cultures, during holding, and in test controls. Test organisms should be positively identified
to species.
5.5.1.Test species
1. The species used in characterizing the acute toxicity of effluents and/or receiving waters
will depend on the requirements of the regulatory authority and the objectives of the test.
It is essential that good quality test organisms be readily available throughout the year
from in-house or commercial sources to meet NPDES monitoring requirements.

Water and Wastewater Analysis Laboratory Manual For Environmental Health Science Students
University of Gondar Collage of Medicine and Health Science 234
2. Toxicity test conditions and culture methods are provided in this manual for the following
principal test organisms:
Freshwater Organisms:
1. Ceriodaphnia dubia (daphnid)
2. Daphnia pulex and D. magna (daphnids)
3. Pimephales promelas (fathead minnow)
4. Oncorhynchus mykiss (rainbow trout) and Salvelinus fontinalis (brook trout)
Estuarine and Marine Organisms:
1. Mysidopsis bahia (mysid)
2. Cyprinodon variegatus (sheepshead minnow)
3. Menidia beryllina (inland silverside), M. menidia (Atlantic silverside), and M.
peninsulae (tidewater silverside)
5.5.2.Holding and handling test organisms
1. Test organisms should not be subjected to changes of more than 3OC in water
temperature or 3� in salinity in any 12 h period.
2. Organisms that are dropped or touch dry surfaces or are injured during handling must be
discarded. Dipnets are best for handling larger organisms.
3. Holding tanks for fish are supplied with good quality water with a flow-through rate of at
least two tank-volumes per day. Otherwise, use a recirculation system where the
water flows through an activated carbon or undergravel filter to remove dissolved
metabolites.
4. Crowding should be avoided. The DO must be maintained at a minimum of 4.0 mg/L for
marine and warm water, freshwater species, and 6.0 mg/L for cold-water, freshwater
species.
5. Fish should be fed as much as they will eat at least once a day with live or frozen brine
shrimp or dry food (frozen food should be completely thawed before use).
6. Fish should be observed carefully each day for signs of disease, stress, physical damage,
and mortality. Dead and abnormal specimens should be removed as soon as
observed.

Water and Wastewater Analysis Laboratory Manual For Environmental Health Science Students
University of Gondar Collage of Medicine and Health Science 235
7. A daily record of feeding, behavioral observations, and mortality should be maintained.
5.5.3.Transportation to the test site
1. Organisms are transported from the base or supply laboratory to a remote test site in
culture water or standard dilution water in plastic bags or large-mouth screw-cap (500 mL)
plastic bottles in styrofoam coolers.
2. Upon arrival at the test site, organisms are transferred to receiving water if receiving
water is to be used as the test dilution water. All but a small volume of the holding water
(approximately 5%) is removed by siphoning, and replaced slowly over a 10 to 15 min
period with dilution water.
3. A group of organisms must not be used for a test if they appear to be unhealthy,
discolored, or otherwise stressed, or if mortality appears to exceed 10% preceding the
test. If the organisms fail to meet these criteria, the entire group must be discarded and a
new group obtained.
4. In static tests, marine organisms can be used at all concentrations of effluent by adjusting
the salinity of the effluent to a standard salinity (such as 25�).
5. Saline dilution water can be prepared with deionized water or a freshwater such as well
water or suitable surface water.
6. All effluent concentrations and the control(s) used in a test should have the same salinity.
5.6. Toxicity Test Systems
5.6.1. Apparatus and equipment for culturing and toxicity tests
1. Culture units: It is preferable to obtain test organisms from in-house culture units.
2. Samplers -- automatic samplers, preferably with sample cooling capability, that can
collect a 24-h composite sample of 2 L or more.

Water and Wastewater Analysis Laboratory Manual For Environmental Health Science Students
University of Gondar Collage of Medicine and Health Science 236
3. Sample containers -- for sample shipment and storage.
4. Environmental chamber or equivalent facility with temperature control (20EC or 25EC)
5. Water purification system -- MILLIPORE® MILLI-Q®, MILLIPORE® QPAK�2, or
equivalent.
6. Balance -- analytical, capable of accurately weighing to 0.0001 g.
7. Reference weights, Class S -- for documenting the performance of the analytical
balance(s). The balance(s) should be checked with reference weights which are at the
upper and lower ends of the range of the weighings made when the balance is used.
8. Test chambers -- borosilicate glass or non-toxic disposable plastic test chambers are
suitable. The chambers should be covered with safety glass plates or sheet plastic, 6
mm (¼ in) thick.
9. Volumetric flasks and graduated cylinders -- Class A, borosilicate glass or non-toxic
plastic labware, 10-1000-mL for making test solutions.
10. Volumetric pipettes -- Class A, 1-100-mL.
.11 Serological pipettes -- 1-10-mL, graduated.
12. Pipette bulbs and fillers -- PROPIPET®, or equivalent.
13. Droppers, and glass tubing with fire polished edges, 4 mm ID -- for transferring test
organisms.
14. Wash bottles -- for rinsing small glassware and instrument electrodes and probes.
15. Glass or electronic thermometers -- for measuring water temperature.
16. Bulb-thermograph or electronic-chart type thermometers -- for continuously recording
temperature.
17. National Bureau of Standards Certified thermometer (see USEPA Method 170.1;
USEPA 1979b).
18. pH, DO, and specific conductivity meters -- for routine physical and chemical
measurements. Unless the test is being conducted to specifically measure the effect of
one of the above parameters, a portable, field-grade instrument is acceptable.
19. Refractometer -- for measuring effluent, receiving, and test solution salinity.
20. Amperometric titrator -- for measuring total residual chlorine.

Water and Wastewater Analysis Laboratory Manual For Environmental Health Science Students
University of Gondar Collage of Medicine and Health Science 237
5.6.2. Reagents and consumable materials
1. Reagent water -- defined as MILLIPORE® MILLI-Q®, MILLIPORE® QPAK�2 or
equivalent water .
2. Effluent, dilution water, and receiving water, Dilution Water, Effluent and Receiving Water
Sampling and Sample Handling.
3. Reagents for hardness and alkalinity tests (see USEPA Methods 130.2 and 310.1;
USEPA l979b).
4. Standard pH buffers 4, 7, and 10 (or as per instructions of instrument manufacturer) for
instrument calibration (see USEPA Method 150.1; USEPA 1979b).
5. Specific conductivity and salinity standards (see USEPA Method 120.1; USEPA 1979b).
6. Laboratory quality control checks samples and standards for the above chemistry
methods.
7. Reference toxicant solutions (see Section 4, Quality Assurance).
8. Membranes and filling solutions for dissolved oxygen probe (see USEPA Method 360.1;
USEPA 1979b), or reagents for modified Winkler analysis.
5.6.3. Sources of Food for Cultures and Toxicity Tests:
1. All food should be tested for nutritional suitability, and chemically analyzed for organic
chlorine, PCBs, and toxic metals.
2. Brine Shrimp (Artemia)
2.1. Brine Shrimp (Artemia) Cysts.
2.2. Frozen Adult Brine Shrimp
3. Trout Chow
4 Dried, Powdered Leaves (CEROPHYLL®)
5. Yeast
6. Flake Fish Food.

Water and Wastewater Analysis Laboratory Manual For Environmental Health Science Students
University of Gondar Collage of Medicine and Health Science 238
5.6.4. Dilution water
Water used for culturing and test dilution should be analyzed for toxic metals and organics
at least annually or whenever difficulty is encountered in meeting minimum acceptability
criteria for control survival and reproduction or growth. The concentration of the metals, Al,
As, Cr, Co, Cu, Fe, Pb, Ni, and Zn, expressed as total metal, should not exceed 1 ìg/L
each, and Cd, Hg, and Ag, expressed as total metal, should not exceed 100 ng/L each.
Total organochlorine pesticides plus PCBs should be less than 50 ng/L (APHA, 1992).
Pesticide concentrations should not exceed USEPA's Ambient Water Quality chronic criteria
values where available.
1. Standard, synthetic dilution water
Standard, synthetic, dilution water is prepared with deionized water and reagent grade
chemicals or mineral water (Tables 5.1 and 5.2) and commercial sea salts (FORTY
FATHOMS®, HW MARINEMIX®) The source water for the deionizer can be groundwater,
or tap water.
2. Standard, synthetic freshwater
2.1 To prepare 20 L of standard, synthetic, moderately hard, reconstituted water, use the
reagent grade chemicals in Table 5.1 as follows:
1. Place 19 L of MILLI-Q®, or equivalent, deionized water in a properly cleaned plastic
carboy.
2. Add 1.20 g of MgSO4, 1.92 g NaHCO3, and 0.080g KCl to the carboy.
3. Aerate overnight.
4. Add 1.20 g of CaSO4C2 H2O to 1 L of MILLI-Q® or equivalent deionized water in a
separate flask. Stir on magnetic stirrer until calcium sulfate is dissolved, add to the 19 L
above, and mix well.
5. For Ceriodaphnia culture and testing, add sufficient sodium selenate (Na2SeO4) to
provide 2 ìg selenium per liter of final dilution water.
6. Aerate the combined solution vigorously for an additional 24 h to dissolve the added
chemicals and stabilize the medium.

Water and Wastewater Analysis Laboratory Manual For Environmental Health Science Students
University of Gondar Collage of Medicine and Health Science 239
7. The measured pH, hardness, etc., should be as listed in Table 5.1.
2.2 To prepare 20 L of standard, synthetic, moderately hard, reconstituted water, using 20%
mineral water such as PERRIER® Water, or equivalent (Table 5.2), follow the instructions
below.
1. Place 16 L of MILLI-Q® or equivalent deionized water in a properly cleaned plastic
carboy.
2. Add 4 L of PERRIER® Water, or equivalent.
3. Aerate vigorously for 24 h to stabilize the medium.
4. The measured pH, hardness, and alkalinity of the aerated water will be as indicated in
Table 5.1.
5. This synthetic water is referred to as diluted mineral water (DMW) in the toxicity test
methods.
Table 5.1. Preparation of synthetic freshwater using reagent grade chemicals1

Water and Wastewater Analysis Laboratory Manual For Environmental Health Science Students
University of Gondar Collage of Medicine and Health Science 240
Table 5.2 Preparation of synthetic fresh water using mineral water 1
Table 5.3 Preparation of synthetic sea water using reagent grade chemicals 1,2,3

Water and Wastewater Analysis Laboratory Manual For Environmental Health Science Students
University of Gondar Collage of Medicine and Health Science 241
3. Use of tap water as dilution water
3.1. The use of tap water as dilution water is discouraged unless it is dechlorinated and fully
treated. Tap water can be dechlorinated by deionization, carbon filtration, or the use of
sodium thiosulfate. Use of 3.6 mg/L (anhydrous) sodium thiosulfate will reduce 1.0 mg
chlorine/L (APHA, 1992). Following dechlorination, total residual chlorine should not
exceed 0.01 mg/L. Because of the possible toxicity of thiosulfate to test organisms, a
control lacking thiosulfate should be included in toxicity tests utilizing thiosulfate-
dechlorinated water.
3.2. To be adequate for general laboratory use following dechlorination, the tap water is
passed through a deionizer and carbon filter to remove toxic metals and organics, and
to control hardness and alkalinity.
4. Dilution water holding
A given batch of dilution water should not be used for more than 14 days following
preparation because of the possible build-up of bacterial, fungal, or algal slime growth and
the problems associated with it. The container should be kept covered and the contents
should be protected from light.
5.6.5. Acute toxicity test procedures
1. Preparation of effluent and receiving water samples for toxicity tests
1.1. When aliquots are removed from the sample container, the head space above the
remaining sample should be held to a minimum. Air which enters a container upon removal
of sample should be expelled by compressing the container before re-closing, if possible
(i.e., where a CUBITAINER® used), or by using an appropriate discharge valve (spigot).
1.2. It may be necessary to first coarse-filter samples through a sieve having 2-4 mm mesh
openings to remove debris and/or break up large floating or suspended solids. Caution:
filtration may remove some toxicity.

Water and Wastewater Analysis Laboratory Manual For Environmental Health Science Students
University of Gondar Collage of Medicine and Health Science 242
1.3. At a minimum, pH, conductivity or salinity, and total residual chlorine are measured in
the undiluted effluent or receiving water, and pH and conductivity are measured in the
dilution water.
1.4. It is recommended that total alkalinity and total hardness also be measured in the
undiluted test water (effluent or receiving water) and the dilution water.
1.5. Total ammonia is measured in effluent and receiving water samples where toxicity may
be contributed by unionized ammonia (i.e., where total ammonia 5 mg/L).
1.6. Effluents and receiving waters can be dechlorinated using 6.7 mg/L anhydrous sodium
thiosulfate to reduce 1 mg/L chlorine.
1.7. The DO concentrations in the samples should be near saturation prior to use.
1.8. If the samples must be warmed to bring them to the prescribed test temperature,
supersaturation of the dissolved oxygen and nitrogen may become a problem. To avoid this
problem, samples may be warmed slowly in open test containers.
1.9. Mortality due to pH alone may occur if the pH of the sample falls outside the range of
6.0-9.0.
2. Receiving water tests
2.1. Receiving water toxicity tests generally consist of 100% receiving water and a control.
The total hardness or salinity of the control should be comparable to the receiving water.
2.2. The data from the two treatments are analyzed by hypothesis testing to determine if test
organism survival in the receiving water differs significantly from the control. A minimum of
four replicates and 10 organisms per replicate are required for each treatment (see Tables
5.5).

Water and Wastewater Analysis Laboratory Manual For Environmental Health Science Students
University of Gondar Collage of Medicine and Health Science 243
2.3. In cases where the objective of the test is to estimate the degree of toxicity of the
receiving water, a definitive, multi-concentration test is performed by preparing dilutions of
the receiving water, using a $0.5 dilution series, with suitable control water.
3. Number of test organisms
A minimum of 20 organisms of a given species are exposed to each effluent concentration
(Jensen, 1972). Small fish and invertebrates are captured with 4- to 8-mm inside diameter
pipettes. Organisms larger than 10 mm can be captured by dip net. In a control (six
concentrations x 20 organisms per concentration).
4. Loading of test organisms
4.1. A limit is placed on the loading (weight) of organisms per liter of test solution to
minimize the depletion of dissolved oxygen, the accumulation of injurious concentrations of
metabolic waste products, and/or stress induced by crowding, any of which could
significantly affect the test results.
4.2. For both renewal and non-renewal static tests, loading in the test solutions must not
exceed the following live weights: 1.1 g/L at 15°C, 0.65 g/L at 20°C, or 0.40 g/L at 25°C.
4.3. For flow-through tests, the live weight of test organisms in the test chambers must not
exceed 7.0 g/L of test solution at l5°C, or 2.5 g/L at 25°C.
5. Illumination
A light of the quality and intensity normally obtained in the laboratory during working hours
is adequate (50-100 ft-c). A uniform photoperiod of 16 h light and 8 h darkness can be
achieved in the laboratory or environmental chamber, using automatic timers.
6. Feeding
6.1. Where indicated in the test summary tables (Tables 5.5) food is made available to test
organisms while holding before they are placed in the test chambers. The organisms are fed

Water and Wastewater Analysis Laboratory Manual For Environmental Health Science Students
University of Gondar Collage of Medicine and Health Science 244
at test renewal, 48 h after the test is initiated, if Regional or State policy requires a 96-h test
duration.
6.2. Where Artemia nauplii are fed, the nauplii are first concentrated on a NITEX® screen
and then are resuspended in fresh or salt water, depending on the salinity of the test
solutions, using just enough water to form slurry that can be transferred by pipette.
6.3. Problems caused by feeding, such as the possible alteration of the toxicant
concentration, the build-up of food and metabolic wastes and resulting oxygen demand, are
common in static test systems. Where feeding is necessary, excess food should be
removed daily by aspirating with a pipette.
6.4. Feeding does not cause the above problems in flow-through systems. However, it is
advisable to remove excess food, fecal material, and any particulate matter that settles from
the effluent, from the bottom of the test vessels daily by aspirating with a pipette.
7. Test temperature
Test temperature will depend on the test species and objectives of the test. Where acute
and short-term chronic toxicity tests are performed simultaneously with the same species to
determine acute: chronic ratios, both tests must be performed at the chronic test
temperature. The average daily temperature of the test solutions should be maintained
within ±1°C of the selected test temperature, for the duration of the test.
8. Stress
Minimize stress on test organisms by avoiding unnecessary disturbances.
9. Dissolved oxygen concentration
Aeration during the test may alter the results and should be used only as a last resort to
maintain the required DO. Aeration can reduce the apparent toxicity of the test solutions by
stripping them of highly volatile toxic substances, or increase its toxicity by altering the pH.
However, the DO in the test solution should not be permitted to fall below 4.0 mg/L for warm
water species and 6.0 mg/L for cold water species.

Water and Wastewater Analysis Laboratory Manual For Environmental Health Science Students
University of Gondar Collage of Medicine and Health Science 245
Table 5.4 Oxygen solubility (mg/L) in water at equilibrium with air at 760 mm Hg (after Richards and Corwin, 1956).
10. Test duration
Test duration may vary from 24 to 96 h depending on the objectives of the test and the
requirements of the regulatory authority.
11. Acceptability of test results
11.1. For the test results to be acceptable, survival in controls must be at least 90%. Tests
in which the control survival is less than 90% are invalid, and must be repeated. In tests with
specific chemicals, the concentration of the test material must not vary more than 20% at
any treatment level during the exposure period.
11.2. Upon subsequent completion of a valid test, the results of all tests, valid and invalid,
are reported to the regulatory authority with an explanation of the tests performed and
results.

Water and Wastewater Analysis Laboratory Manual For Environmental Health Science Students
University of Gondar Collage of Medicine and Health Science 246
Table 5.5 Summery of test conditions and test acceptability criteria for ceriodaphnia Dubia acute Toxicity tests with Effluents and Reciving waters.
N.B. Acute and chronic toxicity tests performed simultaneously to obtain acute/chronic ratios
must use the same temperature and dilution water.

Water and Wastewater Analysis Laboratory Manual For Environmental Health Science Students
University of Gondar Collage of Medicine and Health Science 247

Water and Wastewater Analysis Laboratory Manual For Environmental Health Science Students
University of Gondar Collage of Medicine and Health Science 248
5.7. Cleaning test chambers and laboratory apparatus
New plasticware used for effluent or dilution water collection or organism test chambers
does not require thorough cleaning before use. It is sufficient to rinse new sample
containers once with sample dilution water before use. New glassware must be soaked
overnight in 10% acid (see below) and rinsed well in deionized water and dilution water.
All non-disposable sample containers, test vessels, tanks, and other equipment that has
come in contact with effluent must be washed after use in the manner described below to
remove surface contaminants as described below:
1. Soak 15 min in tap water, and scrub with detergent, or clean in an automatic dishwasher.
2. Rinse twice with tap water.
3. Carefully rinse once with fresh, dilute (10%, V:V) hydrochloric or nitric acid to remove
scale, metals, and bases. To prepare a 10% solution of acid, add 10 mL of concentrated
acid to 90 mL of deionized water.
4. Rinse twice with deionized water.
5. Rinse once with full-strength, pesticide-grade acetone to remove organic compounds
(use a fume hood or canopy).
6. Rinse three times with deionized water.
All test chambers and equipment should be thoroughly rinsed with the dilution water
immediately prior to use in each test.
5.8. Questions:
1. What is the purpose of toxicity test?
2. Distinguish among short-term, intermediate and long- term toxicity tests.
3. What are the basic factors to help the classification of the three types of toxicity tests?
Water and Wastewater Analysis Laboratory Manual For Environmental Health Science Students
University of Gondar Collage of Medicine and Health Science 249
GLOSSARY
Activated Carbon Filter: Water treatment process to remove taste, odor, some organic
compounds, and radon. Anaerobic (Anoxic): in the absence of oxygen.
Available Nitrogen: amount of nitrogen present as either nitrate or ammonium, forms which
can be readily taken up by plants.
Available Water: the portion of water in soil that can be readily absorbed by plant roots.
Bacteria: microscopic one-celled organisms which live everywhere and perform a variety of
functions. While decomposing organic matter in water, bacteria can greatly reduce the
amount of oxygen in the water.
Biochemical Oxygen Demand (BOD): laboratory measurement of the amount of oxygen
consumed by microorganisms while decomposing organic matter in a product. BOD levels
are indicative of the effect of the waste on fish or other aquatic life which require oxygen to
live, and though not a specific compound, it is defined as a conventional pollutant under the
federal Clean Water Act.
Chemical Oxygen Demand (COD): laboratory measurement of the amount of oxygen used
in chemical reactions that occur in water as a result of the addition of wastes. A major
objective of conventional wastewater treatment is to reduce the chemical and biochemical
oxygen demand.
Chlorination: addition of chlorine as a means of disinfecting drinking water or wastewater.
Coliform Bacteria: microorganisms which typically inhabit the intestines of warm-blooded
animals. They are commonly measured in drinking water analyses to indicate pollution by
human or animal waste.
Contaminant: any physical, chemical, biological, or radiological substance causing an
impurity in the environment.

Water and Wastewater Analysis Laboratory Manual For Environmental Health Science Students
University of Gondar Collage of Medicine and Health Science 250
C Dissolved Oxygen (DO): oxygen dissolved in water and readily available to fish and
other aquatic organismsorrosive: capable of eating away materials and destroying living
tissue on contact.
Eutrophication: degradation of water quality due enrichment by nutrients, primarily nitrogen
(N) and phosphorus (P), which results in excessive plant (principally algae) growth and
decay. Low dissolved oxygen (DO) in the water is a common consequence Hardness: characteristic of water which describes the presence of dissolved minerals.
Carbonate hardness is caused by calcium and magnesium bicarbonate; noncarbonate
hardness is caused by calcium sulfate, calcium chloride, magnesium sulfate, and
magnesium chloride Organic Compound: any carbon-based substance, including some petroleum products,
solvents, pesticides, and halomethanes. Volatile organic compounds (VOCs) are those
which are readily vaporized; a number of these are known or probable carcinogens
Oxygen Demand: materials such as food waste and dead plant or animal tissue that use up
dissolved oxygen in the water when they are degraded through chemical or biological
processes. Chemical and biochemical oxygen demand (COD and BOD) are measures of
the amount of oxygen consumed when a substance degrades.
Pathogen: disease-causing biological agent such as a bacterium, virus, or fungus.
pH: numerical measure of acidity, with a scale of 0 to 14. Neutral is pH 7, values below 7
are acidic, and values above 7 are alkaline.
Turbidity: measure of water cloudiness due to suspended solids

Water and Wastewater Analysis Laboratory Manual For Environmental Health Science Students
University of Gondar Collage of Medicine and Health Science 251
BIBLIOGRAPHY
1. Joseph A solvato, environmental engineering and sanition 4th edition, Johan wilkey
and son. inc New york �1992.
2. European standard for drinking water, WHO 2nd edition Geneva 1970.
3. WHO, Guidelines for drinking water quality volume I, Geneva 1984.
4. WHO, Guidelines for drinking water quality volume II, Geneva 1984.
5. Mark J. Hammer, water and waste water technology 3rd ed. USA prentice. Hail inc,
1996.
6. Teka G.E. an introduction to an environmental Health practice, water supply in
Ethiopia, A.A university press 1977.
7. Shree R. Kundalkar, 2004 (Online), Water and waste water analysis laboratory
manual available from (http://www.miami.edu/health-
safety/Laboratory_Safety_Manual) .
8. Sawyer C.N etal, chemistry for environmental engineering 4th edition, singapor; MC
Graw Hill inc, 1994.
9. Standard methods for the examination of water and wastewater. Washington DC
American public health Association, 1995.
10. Worku Legesse, 2005 Environmental Quality control I Lecture note series, Jimma
University.
11. Nathanson JA, Basic environmental technology, third edition Prentice-Hill,
inc.2000,USA.
12. Guidelines for drinking- water quality, 2nd ed. Vol.3, WHO, Geneva,1999.
13.Bouchard, R.W. Jr. 2004. Guide to aquatic macroinvertibrates of the upper Midwest.
Water Resource center, University of Minnesota.
14. Tebbutt T.H.Y. priniciples of water control. 4th ed.New york;
pergamons press, 1992
15.Monica Cheesbrogh, Tropical Laboratory Manual, Volume II

Water and Wastewater Analysis Laboratory Manual For Environmental Health Science Students
University of Gondar Collage of Medicine and Health Science 252
16.htt://people.virginia.edu/sos-iwla/stream-study/stream study home page/stream
study.HTML
17. Mamta Tomar. Quality assessment of water and wastewater, 1999.
18. Chemical methods of water testing, 2nd ed. BDH chemicals Ltd Poole, 1973.

Water and Wastewater Analysis Laboratory Manual For Environmental Health Science Students
University of Gondar Collage of Medicine and Health Science 253
ANNEX- I
Typical field record sheet for biological sampling and ecological survey
(Bertram, j, balance, r., 1996)
Water body __________________ date ______________ Time ____________
Name and number of sample site __________________No ______________
Weather:-
a) Rain: None __________ Last 24 hours ___________ Duration _______
b) Cloud cover: None of little _________ variable _________ Extensive _______
WATER CONDITION:-
a) Width (M):< 1 _______ 1-2 ______3-5 ____ 6-10 ____11-20 ____>20
b) Depth (M): <0.1 _____0.1 - 0.3_____0.40.6_____0.7-10 ____>1.0 ___
c) Currents: No turbulence_____ Still ___Turbulent ___ Strong turbulent ___
d) Estimated velocity (ms-1): < 0.2 _______ 0.2-0.4 ____ 0.5-0.8 _____>0.8 ____
e) Turbidity: None ________ Little ____ Moderate _____ Strong __________
f) Color: Colored ___________ Uncolored _____________
g) ODOR: Absent ________ Present______ Chemical____ H2S ____ Others____

Water and Wastewater Analysis Laboratory Manual For Environmental Health Science Students
University of Gondar Collage of Medicine and Health Science 254
SUBSTRATE:-
a) Boulders f) Silt
b) Large Stoned g) Detritus
c) Small stones h) Mosses
d) Filamentous i) Submergence plant
e) Algae j) Marginal Plants
HABITAT
a) % Still water: Very Little _________ < 25% ______ 26-50% _____> 50% ________
b) % Flowing water: very little ______ < 25% ______26-50% _____ > 50% _________
c) Shade: None ______ Little _______ Moderate ______ Heavy ___________
d) River protection Measures: None _____ Concrete Banks ________ Others _________
REDUCING CONDITION:
a) Reducing condition : Absent ___________ Present ____________
b) Bubble forming Sediments: Yes ____________ No __________
c) Black sediments: Superficial __________ below sediments surface ____________
d) Under sides of stones: None ___________ Partial ________ Total ____________
1 2 3 1 2 3 1 2 3 1 2 3 1 2 3
1 2 3 1 2 3 1 2 3 1 2 3 1 2 3
SCORE: Rare<25% Intermediate 25-50% Dominant > 50%
1
2
3

Water and Wastewater Analysis Laboratory Manual For Environmental Health Science Students
University of Gondar Collage of Medicine and Health Science 255
REACH OBSERVATIONS (OF 100m stream length) (HALSE,
S. ET.AL., 2002)
Unstream land use
Adjacent land use: Left bank: Score� Type � Right bank: Score� Type
0. Urban/Semi-Urban, industrial
1. Irrigated copping, intensive forestry of heavy grazing
2. Non-irrigated cropping, moderate grazing
3. Light grazing, vegetation clearing
4. Natural
Local catchment erosion: None Little some Moderate Extensive
Water Colour: Clear Green Opaque Tannin Other
Sediment deposit: None Sand Silit Other ���.
Water surface: Normal Slick Scum Foaming Other ���..
Variety of habitat: Shallow deep Pool Run Riffle
(circle all types) undercut bank LWD Machrophytes Other ���..
RIPARIAN ZONE (TO MAXIMUM 100M WIDTH)
Width of riparian zone: Left bank��. M Right bank ��.M
Bare ground None Little Some Moderate Extensive
Grass None Little Some Moderate Extensive
Shrubs None Little Some Moderate Extensive
Trees < 100m high None Little Some Moderate Extensive
Presence of exotic-riparian species:
None Little Some Moderate Extensive
Width of continuous tree zone from bank: Left bank � M Right bank �M
Signs of pollution

Water and Wastewater Analysis Laboratory Manual For Environmental Health Science Students
University of Gondar Collage of Medicine and Health Science 256
a) Open water: None _____ Sewage ___ Oil ____ Other _____
b) Margins: None ____ Sewage _____ Oil _______ Other ______
Other comments : _________________________________________________
Physico- Chemical Parameters: PH _____ Air temp. (oC) _________
Dissolved O2(mg/L) _______ Water Temp ___________
Observers� named and signature _________________________________
_____________________________

Water and Wastewater Analysis Laboratory Manual For Environmental Health Science Students
University of Gondar Collage of Medicine and Health Science 257
ANNEX-II
Key to Aquatic Macro invertebrates
A. Macro invertebrates that Are Sensitive to Pollution Found in Good Quality Water
Stonefly Riffle Beetle Adult Gilled Snail Planarian
Mayfly Water Penny Caddisfly Hellgramite

Water and Wastewater Analysis Laboratory Manual For Environmental Health Science Students
University of Gondar Collage of Medicine and Health Science 258
B. Macro invertebrates that Are Somewhat Sensitive to Pollution Found
in Good or Fair Quality Water
Crayfish Alderfly Crane Fly Riffle Beetle Larva
Damselfly Sowbug Dragonfly Watersnipe Fly
Scud Whirligig Beetle Larva Fishfly Clam or Mussel

Water and Wastewater Analysis Laboratory Manual For Environmental Health Science Students
University of Gondar Collage of Medicine and Health Science 259
C. Macro-invertebrates that Are Tolerant of Pollution Found in Any
Quality Water
Aquatic Worm Black Fly
Lunged Snail Leech Midge Fly

Water and Wastewater Analysis Laboratory Manual For Environmental Health Science Students
University of Gondar Collage of Medicine and Health Science 260
D. Mislanuous classification based on insect orders Order-Ephemeroptera (Mayflies)
Order-Trichoptera (Caddisflies)
Order-Plecoptera (Stoneflies)

Water and Wastewater Analysis Laboratory Manual For Environmental Health Science Students
University of Gondar Collage of Medicine and Health Science 261
Order- Coleoptera (Water Beetles)
Order- Odonata (Damselflies, Dragonflies)
Order- Megaloptera (Dobsonflies, Alderfli
Order- Hemiptera (Water, Backswimmer, Water Boatman)
Order- Collembola (Freshwater Springtails)

Water and Wastewater Analysis Laboratory Manual For Environmental Health Science Students
University of Gondar Collage of Medicine and Health Science 262
ANNEX- III
Standard Preservation Methods for water and wastewater samples
Measurement Sample
volume (ml)
Container* Preservative** Holding Time***
Physical
Color 50 P.G Cool 4OC 24h
Odor 200 G. only Cool, 4OC 24 h
Temperature 100 P.G Determine on
site
No holding
Turbidity 100 P.G Cool 4OC 48 h
Settleable
matter
1000 P.G None required 24 h
Residue
TSS
TDS
VSS
Total solids
100
100
100
100
P.G
P.G
P.G
P.G
Cool 4OC
Cool, 4OC
Cool, 4OC
Cool, 4OC
7 days
7 days
7 days
7 days
CHEMICAL
Inorganic
pH 25 P.G Determine on site 2h
Conductivity 100 P.G Cool, 4OC 28 days
Acidity 100 P Cool, 4OC 14 days
Hardness 100 P.G Cool, 4OC 6 months
Alkalinity 100 P.G Cool, 4OC 14 days
Bromide 100 P.G Cool, 4OC 24 h
Chloride 50 P.G None required 28 days
Chlorine 200 P.G Determine on site No

Water and Wastewater Analysis Laboratory Manual For Environmental Health Science Students
University of Gondar Collage of Medicine and Health Science 263
residual holding
Fluoride 300 P None required 28 days
Cyanide 500 P.G Cool, 4OC NaOH to
pH 12
24 h
Iodide 100 P.G Cool, 4OC 24h
Sulfate 50 P.G Cool, 4OC 7 days
Sulfide 500 P.G 2 ml zinc acctate 24h
Sulfate 50 P.G Determine on site No
holding
400 P.G Cool, 4OC H2SO4
to pH <2
24 h
500 P.G Cool, 4OC H2SO4
to pH <2
24 h
100 P.G Cool 4OC 48 h
Nitrogen
Ammonia
Kjeldahl total
Nitrate
Nitrite 50 P.G Cool, 4OC 24 h
Winkler 300 G. only Fix on site 4-8 h
50
P.G
Filter on site Cool
4OC
24 h
50 P.G Cool, 4OC, H2SO4
to pH <2
24 h
Orthophosph
ate:
Dissolved
Hydrolysable
Total
50 P.G Cool, 4OC, H2SO4
to pH <2
24 h
200
P.G
Filter on site HNO3
to pH<2
6 months
200 P.G Filter on site 6 months
Metals:
Dissolved
Suspended
Total 100 p.G HNO3 to pH<2 6 months

Water and Wastewater Analysis Laboratory Manual For Environmental Health Science Students
University of Gondar Collage of Medicine and Health Science 264
Source: Quality assessment of water and wastewater (1999) * = P � plastic and G- glass container. For metals, polyethylene with a polypropylene cap
(no liner) is preferred. ** = If the sample is stabilized by being cooled to 4OC, it should be warmed to 25 OC for
experiment, or temperature correction should be made and results reported at 25 OC. *** = Holding times listed above are recommended for properly preserved sample.
100
p.G
Filter on site
HNO3 to pH<2
28 days (G)
13 days (hard
p)
Mercury :
Dissolved
Total
100 p.G HNO3 to pH<2 28 days (G)
13 days (p)
CHEMICAL -Organic
BOD 1,000 P.G Cool 4OC 24 h
COD 1,000 P.G H2SO4 to pH<2 7 days
Oil/grease G only Cool, 4OC, H2SO4
or HCL to pH<2
24 h
Organic
Carbon
25 p.G Cool, 4OC, H2SO4
or HCl to pH<2
24 h
Phenol 500 G only Cool, 4OC, H3PO4
to PH< 4,1.0g
CuSO4
24 h
MABS
(Surfactants)
250 p.G Cool, 4OC 24h

Water and Wastewater Analysis Laboratory Manual For Environmental Health Science Students
University of Gondar Collage of Medicine and Health Science 265
ANNEX- IV
Check list on back of effluent toxicity data sheet
.

Water and Wastewater Analysis Laboratory Manual For Environmental Health Science Students
University of Gondar Collage of Medicine and Health Science 266
ANNEX- V
Guideline value of water quality
A.Microbiological and biological quality
Organism Unit Guidelin
e value
Remark
1. Microbiological
Quality
A. Piped water
supplies
A.1 Treated water
entering the
distribution system :
-Faecal coliforms Number/100
ml
0
-Coliform organisms Number/100
ml
0
Turbidity <1 NTU, for
disinfection with chlorine, pH
preferably
<8.0, free chlorine residual 0.2-
0.5 mg/liter following 30
minutes (minimum) contact
A.2 Untreated water
entering the
distribution system:
-Faecal coliforms Number/100
ml
0
-Coliform organisms Number/100
ml
0
In 98% of samples examined
throughout the year-in the case
of large supplies when
sufficient samples are
examined
-Coliform organisms Number/100 3 In an occasional sample, but

Water and Wastewater Analysis Laboratory Manual For Environmental Health Science Students
University of Gondar Collage of Medicine and Health Science 267
ml not inconsecutive samples
A.3 water in
distribution system
-Faecal coliforms Number/100
ml
0
-Coliform organisms Number/100
ml
0 In 95% of samples examined
throughout the year-in the case
of large supplies when
sufficient samples are
examined
-Coliform organisms Number/100
ml
3 In an occasional sample, but
not inconsecutive samples
B. Unpiped water
supplies :
-Faecal coliforms Number/100
ml
0
-Coliforms organisms Number/100
ml
10 Should not occur repeatedly; if
occurrence is frequent and if
sanitary protection can not be
improved, an alternative source
must be found if possible
C. Bottled drinking
water:
-Faecal Coliforms Number/100
ml
0 Source should be free from
faecal contamination
-Coliform Organisms Number/100
ml
0
D. Emergency water
supplies

Water and Wastewater Analysis Laboratory Manual For Environmental Health Science Students
University of Gondar Collage of Medicine and Health Science 268
Faecal Coliforms Number/100
ml
0 Advice public to boil water in
case of failure to meet
guideline values
Coliform Organisms Number/100
ml
0
Enteroviruses --- No
guideline
value set
II. Biological quality
Protozoa (pathogenic) -- No
guideline
value set
Helminths (pathogenic) -- No
guideline
value set
Free-living organisms
(algae, others)
-- No
guideline
value set
(Source: Guidelines for drinking-water quality; vol. 1. WHO, Geneva,1984)

Water and Wastewater Analysis Laboratory Manual For Environmental Health Science Students
University of Gondar Collage of Medicine and Health Science 269
B. Inorganic constituents of health significance
Constituents Unit Guideline Value Remarks
Arsenic Mg/1 0.05
Asbestos -- No guideline value
set
Barium -- No guideline value
set
Beryllium -- No guideline value
set
Cadmium Mg/l 0.005
Chromium Mg/l 0.05
Cyanide Mg/l 0.1
Fluoride Mg/l 1.5 Natural or deliberately
added, local or climatic
conditions may necessitate
adaptation
Hardness No health-related
guideline value set
Lead Mg/l 0.05
mercury Mg/l 0.001
Nickel -- No guideline value
set
Nitrate Mg/1(N) 10
Nitrite -- No guideline value
set
Selenium Mg/1 0.01
Silver -- No guideline value
set
Sodium -- No guideline value
set

Water and Wastewater Analysis Laboratory Manual For Environmental Health Science Students
University of Gondar Collage of Medicine and Health Science 270
(Source: Guidelines for drinking-water quality; vol. 1. WHO, Geneva,1984)
C.Organic Constituents of health significance
Constituents Unit Guideline Value Remarks
Aldrin and dieldrin µg/l 0.03
Benezene µg/l 10a
Benzo[a] pyrene µg/l 0.01a Tentative guideline valueb
Carbon
tetrachloride
µg/l 3a
Chloridane µg/l 0.3
chlorobenzenes µg/l No health-related
guideline value set
Odour threshold concentration
between 0.1 and 3 µg/l
Chloroform µg/l 30a Disinfection efficiency must not be
compromised when controlling
chloroform content
Chlorophenols µg/l No health-related
guideline value
set
Odour threshold
concentration 0.1 µg/l
2,4-D µg/l 100c
DDT µg/l 1
1,2-dichloroethane µg/l 10a
1,1-dichloroethened µg/l 0.3a
Heptachlor and
heptachlor epoxide
µg/l 0.1
hexachlorobenzene µg/l 0.01a
Gamma-HCH
(lindane)
µg/l 3
Methoxychlor µg/l 30
pentachlorophenol µg/l 10
Tetrachloroethened µg/l 10 Tentative guideline value b

Water and Wastewater Analysis Laboratory Manual For Environmental Health Science Students
University of Gondar Collage of Medicine and Health Science 271
Trichloroethene d µg/l 30a Tentative guideline value b
2,4,6-
trichhorophenol
10a,c Odour threshold
concentration 0.1 µg/l
Trihalomethanes No guideline value
set See chloroform
(Source: Guidelines for drinking-water quality; vol. 1. WHO, Geneva,1984)
a = these guideline values were computed from a conservative hypothetical model which
cannot be experimentally verified and values should therefore be interrupted differently.
Uncertainties involved may amount to two orders of magnitude (i.e., from 0.1 to 10 times the
number).
b = when the available carcinogenicity data did not support a guideline value, but the
compounds were judged to be of importance in drinking-water and guidance was
considered essential, a tentative guideline value was set on the basis of the available
health-related data.
c = May be detectable by taste and odour at lower concentrations d = these compounds were previously known as 1,1-dichloroethylene, tetrachloroethylene,
and trichloroethylene, respectively.
D. Aesthetic quality
Constituent or
characteristic
Unit Guideline Value Remarks
Aluminium mg/l 0.03
chloride mg/l 250
Chlorobenzenes and
chlorophenols
-- No guideline value set These compounds
may affect taste

Water and Wastewater Analysis Laboratory Manual For Environmental Health Science Students
University of Gondar Collage of Medicine and Health Science 272
and odour
Colour True
colour
Units
(TCU)
15
Copper mg/l 1.0
Detergents -- No quideline value set There should not
be any foaming or
taste and odour
problems
Hardness mg/l (as
CaCO3)
500
Hydrogen sulfide -- Not detectable by
consumers
Iron mg/l 0.3
Manganese mg/l 0.1
Oxygen-dissolved -- No guideline value set
pH -- 6.5-8.5
Sodium mg/l 200
Solids-total dissolved mg/l 1000
Sulfate mg/l 400
Taste and odour -- Inoffensive to most
consumers
Temperature -- No guideline value set
Turbidity NTU 5 Preferably <1 for
disinfection
Efficiency
Zinc mg/l 5.0
(Source: Guidelines for drinking-water quality; vol. 1. WHO, Geneva,1984)

Water and Wastewater Analysis Laboratory Manual For Environmental Health Science Students
University of Gondar Collage of Medicine and Health Science 273
ANNEX VI
UNITS OF MEASUREMENT
1 inch (in) = 2.54 centimeters (cm) = 25.4 millimeters (mm)
1 foot (ft) = 30.5 centimeters (cm) = 0.305 meters (m)
1 yard (yd) = 36 inches (in) = 0.914 meters (m)
1 mile (mi) = 5280 feet (ft) = 1.61 kilometers (km)
1 square yard (yd2) = 9 square feet (ft2) = 0.836 square meters (m2)
1 acre (ac) = 43,560 square feet (ft2) = 0.405 hectares (ha) = 4050 square meters (m2)
1 square mile (mi2) = 640 acres (ac) = 259 hectares (ha)
1 cubic foot (ft3) = 7.48 gallons (gal) = 28.3 liters (L)
1 cubic yard (yd3) = 27 cubic feet (ft3) = 202 gallons (gal) = 0.765 cubic meters (m3)
1 gallon (gal) = 0.137 cubic feet (ft3) = 8.33 pounds (lbs) water = 3.78 liters (L)
1 acre-inch (ac-in) = 3630 cubic feet (ft3) = 27,154 gallons (gal) = 102.8 cubic meters(m3)
1 acre-foot (ac-in) = 43,560 cubic feet (ft3) = 325,851 gallons (gal) = 1234 cubic meters
(m3)
1 pound (lb) = 454 grams (g) = 0.454 kilograms (kg)
1 ton (ton) = 2000 pounds (lbs) = 907 kilograms (kg) = 0.907 megagrams (Mg)
1 pound per acre (lb/ac) = 1.12 kilograms per hectare (kg/ha)
1 bushel per acre, 60 lb (bu/ac) = 67.2 kilograms per hectare (kg/ha)

Water and Wastewater Analysis Laboratory Manual For Environmental Health Science Students
University of Gondar Collage of Medicine and Health Science 274
1 bushel per acre, 56 lb (bu/ac) = 62.7 kilograms per hectare (kg/ha)
1 bushel per acre, 48 lb (bu/ac) = 53.8 kilograms per hectare (kg/ha)
1 cubic foot per second (cfs) = 449 gallons per minute (gpm) = 28.32 liters per second (L/s)
1 million gallons per day (MGD) = 1.55 cubic feet per second (cfs) = 3785 cubic meters per
day (m3/day)
1 milligram per liter (mg/L) =1 part per million (ppm) =1000 parts per billion (ppb)*
1 microgram per liter (mg/L) =1 nanogram per milliliter (ng/mL) = 1 part per billion (ppb) *
1 nanogram per liter (ng/L) =1 part per trillion (ppt) = 1000 parts per quadrillion (ppq) *
1 picogram per liter (pg/L) = 1 part per quadrillion (ppq) *
1 grain per gallon (gpg) = 17.1 milligrams per liter (mg/L)
1 pound per square inch (psi) = 2.04 inches mercury (in Hg) = 27.7 inches water (in H2O).

Water and Wastewater Analysis Laboratory Manual For Environmental Health Science Students
University of Gondar Collage of Medicine and Health Science 275
ANNEX VII
A.Report form of Physical and Chemical examination of water
Reference No:________________
Where collected:____________
Name and address of the sender :_____________________________________
Source of water:__________________________________________________
Intended water usage:______________________________________________
Date and time of collection:_________________________________________
Date and time of arrival at Laboratory:________________________________
Date of analysis:_________________________________________________
Physical examination
Temperature(when collected):_____________________________________
Appearance
a) apparent ( Platinium cobalt scale):_____________________________
b) True color( Platinium-cobalt scale):_____________________________
Odour:_______________________________________________________________
Taste:________________________________________________________________
Turbidity:____________________________________________________________
Suspended matter:___________________________________________________
Dissolved matter(Total):_____________________________________________
Chemical examination (results in mg/L)
Alkalinity (total as CaCO3):___________________________________

Water and Wastewater Analysis Laboratory Manual For Environmental Health Science Students
University of Gondar Collage of Medicine and Health Science 276
Acidity (total as CaCO3):_____________________________________
Iron :_____________________________________________________
Manganese:_______________________________________________
Magnesium:_______________________________________________
Fluoride:_________________________________________________
Nitrite:__________________________________________________
Nitrate:__________________________________________________
Chloride:_________________________________________________
Sulphate:_________________________________________________
Oxidizable organic matter :__________________________________
Residual chlorine:________________________________________
Free chlorine:___________________________________________
Total chlorine :__________________________________________
Arsenic:_______________________________________________
Chromium:____________________________________________
Lead :________________________________________________
Gold:_________________________________________________
Other chemical substances:________________________________
Remark___________________________________________________________________
_________________________________________________________________________
_________________________________________________________________________
Date of report:__________________________
Reported by:___________________________
Signature:_____________________________
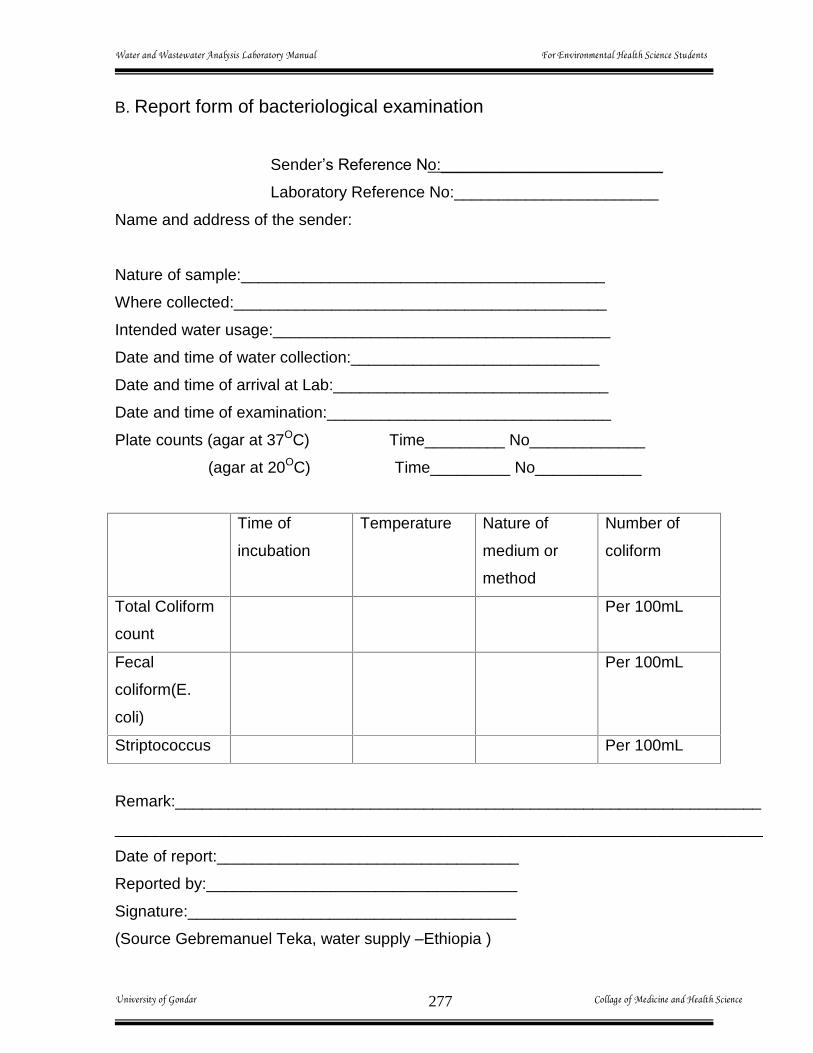
Water and Wastewater Analysis Laboratory Manual For Environmental Health Science Students
University of Gondar Collage of Medicine and Health Science 277
B. Report form of bacteriological examination
Sender�s Reference No:_________________________
Laboratory Reference No:_______________________
Name and address of the sender:
Nature of sample:_________________________________________
Where collected:__________________________________________
Intended water usage:______________________________________
Date and time of water collection:____________________________
Date and time of arrival at Lab:_______________________________
Date and time of examination:________________________________
Plate counts (agar at 37OC) Time_________ No_____________
(agar at 20OC) Time_________ No____________
Time of
incubation
Temperature Nature of
medium or
method
Number of
coliform
Total Coliform
count
Per 100mL
Fecal
coliform(E.
coli)
Per 100mL
Striptococcus Per 100mL
Remark:__________________________________________________________________
_________________________________________________________________________
Date of report:__________________________________
Reported by:___________________________________
Signature:_____________________________________
(Source Gebremanuel Teka, water supply �Ethiopia )