Marine Water Quality in Hong Kong in 2004 - Environmental ...
166
-
Upload
khangminh22 -
Category
Documents
-
view
1 -
download
0
Transcript of Marine Water Quality in Hong Kong in 2004 - Environmental ...
Marine Water Quality in Hong Kong in 2004
Results for 2004 from theMarine Monitoring Programme
of the Environmental Protection Department
Monitoring SectionWaste and Water Science Group
Environmental Protection DepartmentGovernment of the Hong Kong Special Administrative Region
2005
Marine Water Quality in Hong Kong in 2004
Date : November 2005
Report written by : Jackie Y. C. Lam, J. H. Liu
Work done by : Jackie Y. C. Lam, J. H. Liu, W. S. Ng,
L. M. Li, C. S. Wong, M. F. Lam, S. K. Fung,
S. W. Law, K. K. Lo, M. S. Cheng,
C. W. Mok, S. S. Kwan, M. Y. Wu.
Work supervised by : Cathie S. W. Kueh
Security classification : Unrestricted
Note : The information contained in this publication can beused freely for study, research or training purposessubject to acknowledgement of the source. Use of theinformation for purposes other than those stated aboverequires prior written permission of the Director ofEnvironmental Protection.
1.
2.
3.
4.
5.
6.
7.
8.
9.
K-1
K-2
S-1
1.1
2.1
3.1
4.1
5.1
6.1
7.1
8.1
9.1
Page
CONTENTSChapter
Acknowledgements
Disclaimer
Summary of Marine Water Quality in Hong Kong in 2004
Introduction
Eastern Waters - Mirs Bay, Port Shelter and Tolo Harbour andChannel Water Control Zones
Southern Waters - Southern Water Control Zone
Central Waters - Victoria Harbour, Eastern Buffer, Junk Bay andWestern Buffer Water Control Zones
Western Waters - Deep Bay and North Western Water ControlZones
Sediment Quality
Typhoon Shelters
Phytoplankton and Red Tides
Marine Water Quality in 2004
LIST OF FIGURES
Figure 1.1
Figure 1.2
Figure 1.3
Figure 1.4
Figure 1.5
Figure 1.6
Figure 1.7
Figure 1.8
Figure 1.9
Figure 2.1
Figure 2.2
Figure 2.3
Figure 2.4
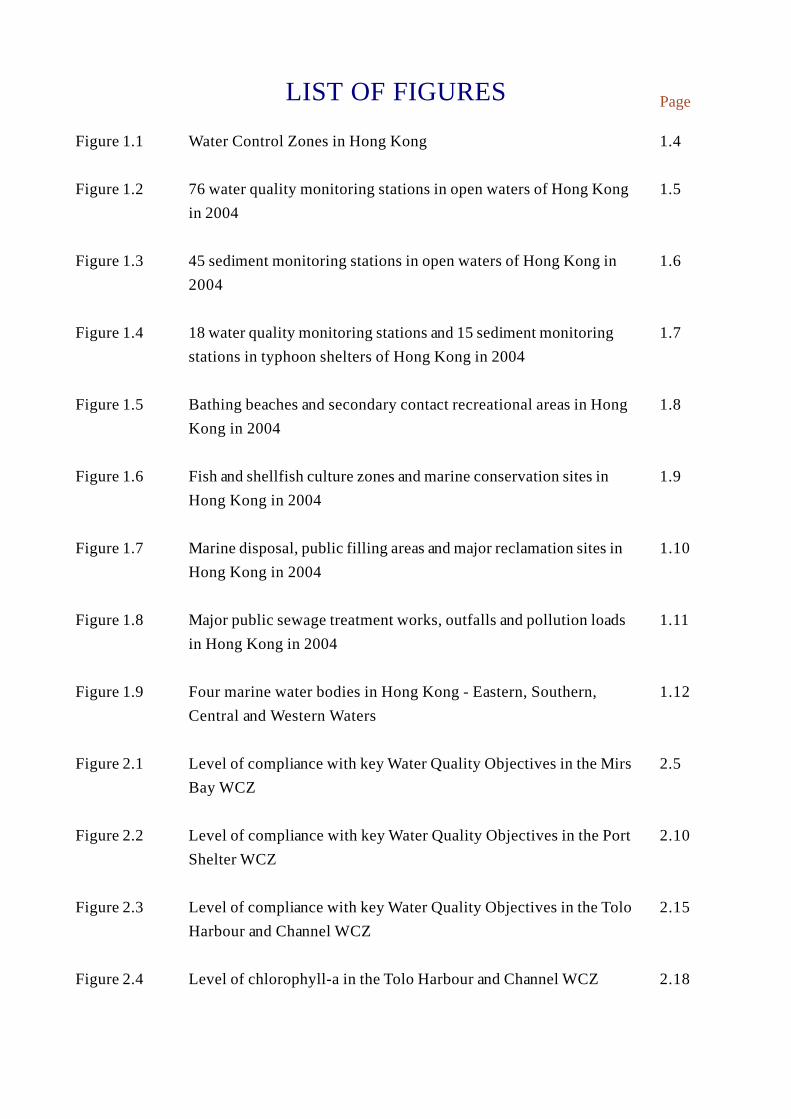
Water Control Zones in Hong Kong
76 water quality monitoring stations in open waters of Hong Kongin 2004
45 sediment monitoring stations in open waters of Hong Kong in2004
18 water quality monitoring stations and 15 sediment monitoringstations in typhoon shelters of Hong Kong in 2004
Bathing beaches and secondary contact recreational areas in HongKong in 2004
Fish and shellfish culture zones and marine conservation sites inHong Kong in 2004
Marine disposal, public filling areas and major reclamation sites inHong Kong in 2004
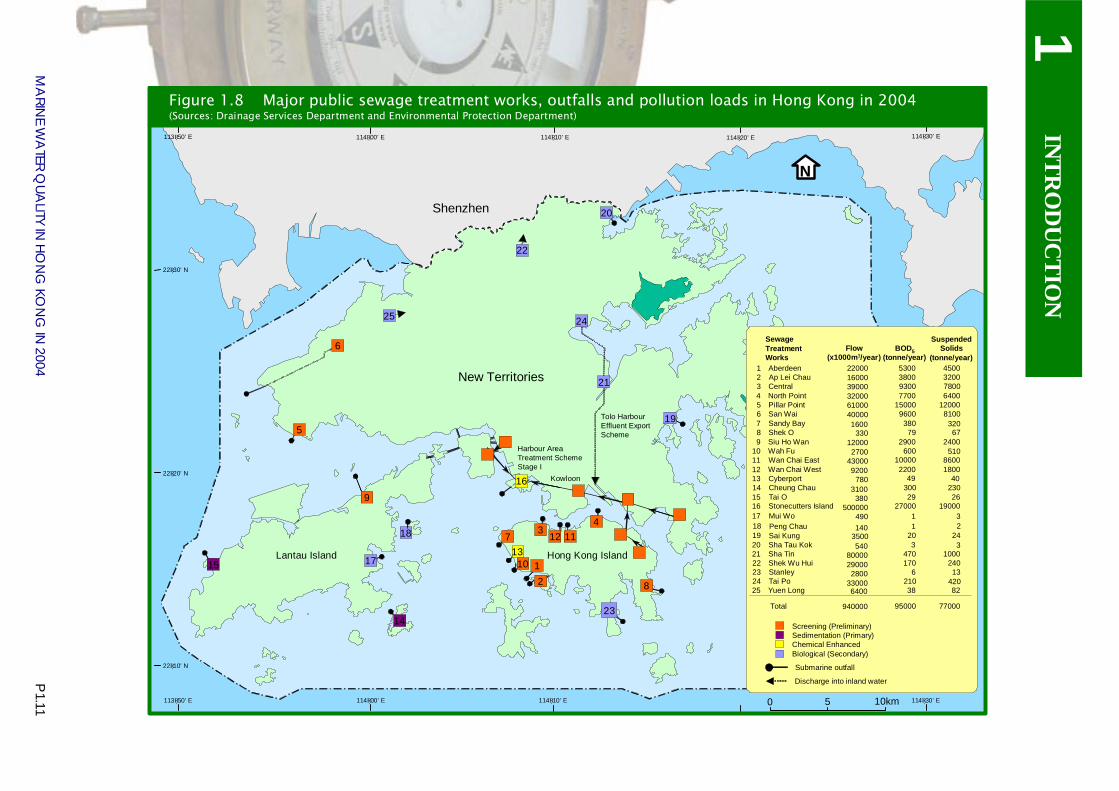
Major public sewage treatment works, outfalls and pollution loadsin Hong Kong in 2004
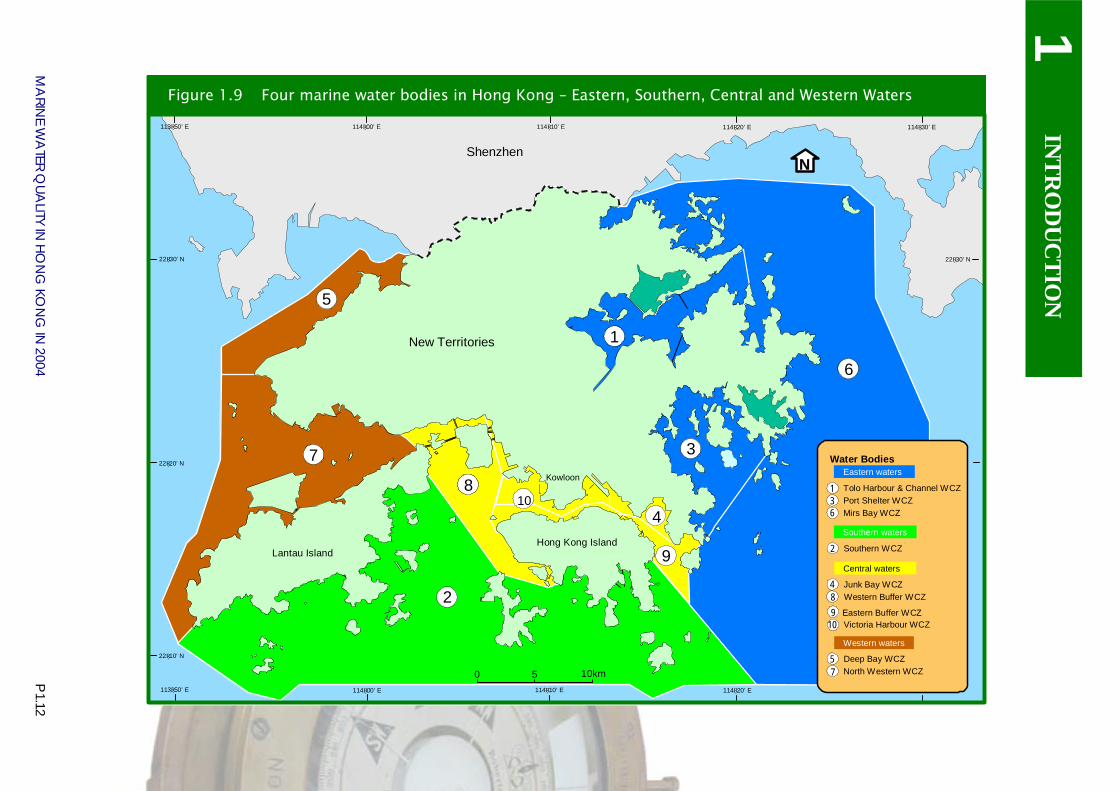
Four marine water bodies in Hong Kong - Eastern, Southern,Central and Western Waters
Level of compliance with key Water Quality Objectives in the MirsBay WCZ
Level of compliance with key Water Quality Objectives in the PortShelter WCZ
Level of compliance with key Water Quality Objectives in the ToloHarbour and Channel WCZ
Level of chlorophyll-a in the Tolo Harbour and Channel WCZ
Page
1.4
1.5
1.6
1.7
1.8
1.9
1.10
1.11
1.12
2.5
2.10
2.15
2.18
Page
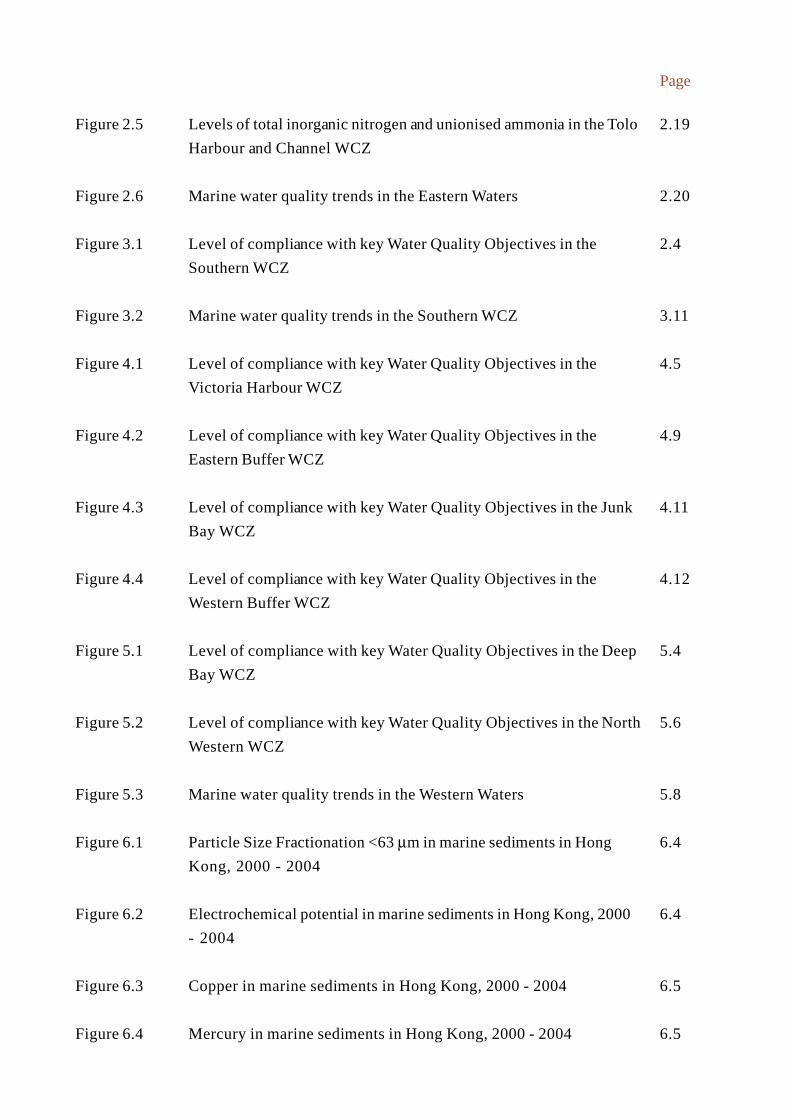
Levels of total inorganic nitrogen and unionised ammonia in the ToloHarbour and Channel WCZ
Marine water quality trends in the Eastern Waters
Level of compliance with key Water Quality Objectives in theSouthern WCZ
Marine water quality trends in the Southern WCZ
Level of compliance with key Water Quality Objectives in theVictoria Harbour WCZ
Level of compliance with key Water Quality Objectives in theEastern Buffer WCZ
Level of compliance with key Water Quality Objectives in the JunkBay WCZ
Level of compliance with key Water Quality Objectives in theWestern Buffer WCZ
Level of compliance with key Water Quality Objectives in the DeepBay WCZ
Level of compliance with key Water Quality Objectives in the NorthWestern WCZ
Marine water quality trends in the Western Waters
Particle Size Fractionation <63 μm in marine sediments in HongKong, 2000 - 2004
Electrochemical potential in marine sediments in Hong Kong, 2000- 2004
Copper in marine sediments in Hong Kong, 2000 - 2004
Mercury in marine sediments in Hong Kong, 2000 - 2004
Figure 2.5
Figure 2.6
Figure 3.1
Figure 3.2
Figure 4.1
Figure 4.2
Figure 4.3
Figure 4.4
Figure 5.1
Figure 5.2
Figure 5.3
Figure 6.1
Figure 6.2
Figure 6.3
Figure 6.4
2.19
2.20
2.4
3.11
4.5
4.9
4.11
4.12
5.4
5.6
5.8
6.4
6.4
6.5
6.5
Page
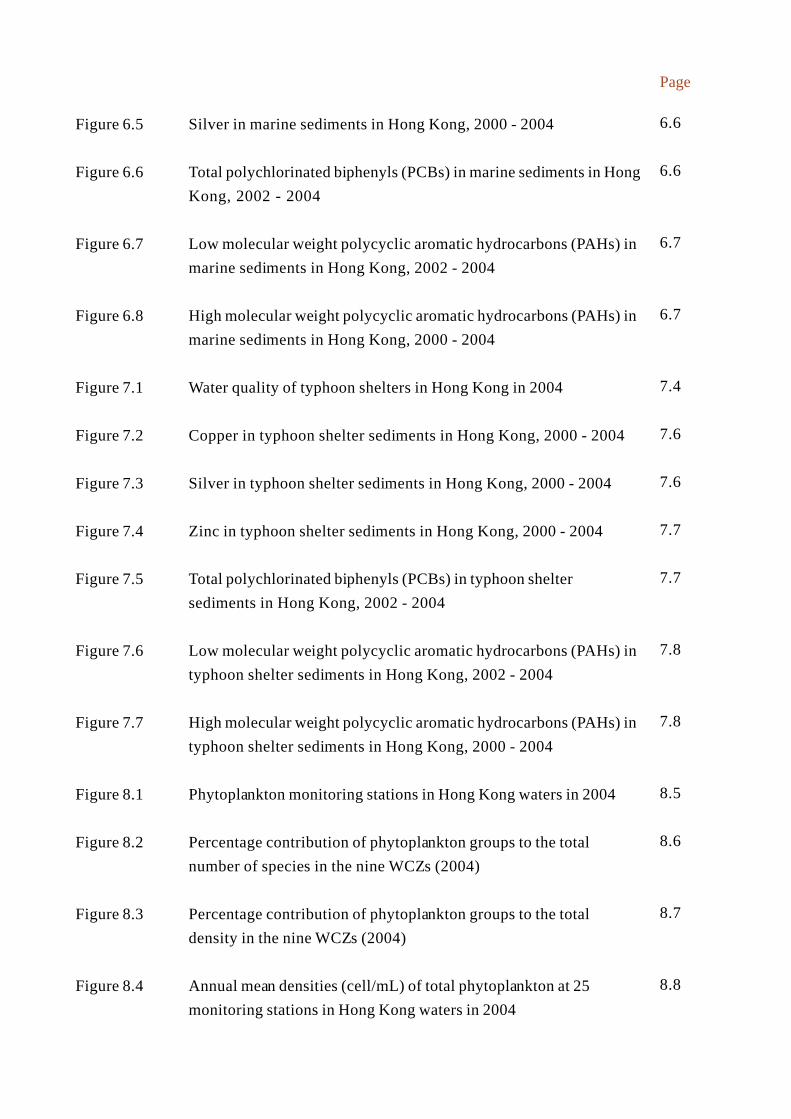
Silver in marine sediments in Hong Kong, 2000 - 2004
Total polychlorinated biphenyls (PCBs) in marine sediments in HongKong, 2002 - 2004
Low molecular weight polycyclic aromatic hydrocarbons (PAHs) inmarine sediments in Hong Kong, 2002 - 2004
High molecular weight polycyclic aromatic hydrocarbons (PAHs) inmarine sediments in Hong Kong, 2000 - 2004
Water quality of typhoon shelters in Hong Kong in 2004
Copper in typhoon shelter sediments in Hong Kong, 2000 - 2004
Silver in typhoon shelter sediments in Hong Kong, 2000 - 2004
Zinc in typhoon shelter sediments in Hong Kong, 2000 - 2004
Total polychlorinated biphenyls (PCBs) in typhoon sheltersediments in Hong Kong, 2002 - 2004
Low molecular weight polycyclic aromatic hydrocarbons (PAHs) intyphoon shelter sediments in Hong Kong, 2002 - 2004
High molecular weight polycyclic aromatic hydrocarbons (PAHs) intyphoon shelter sediments in Hong Kong, 2000 - 2004
Phytoplankton monitoring stations in Hong Kong waters in 2004
Percentage contribution of phytoplankton groups to the totalnumber of species in the nine WCZs (2004)
Percentage contribution of phytoplankton groups to the totaldensity in the nine WCZs (2004)
Annual mean densities (cell/mL) of total phytoplankton at 25monitoring stations in Hong Kong waters in 2004
Figure 6.5
Figure 6.6
Figure 6.7
Figure 6.8
Figure 7.1
Figure 7.2
Figure 7.3
Figure 7.4
Figure 7.5
Figure 7.6
Figure 7.7
Figure 8.1
Figure 8.2
Figure 8.3
Figure 8.4
6.6
6.6
6.7
6.7
7.4
7.6
7.6
7.7
7.7
7.8
7.8
8.5
8.6
8.7
8.8
Page
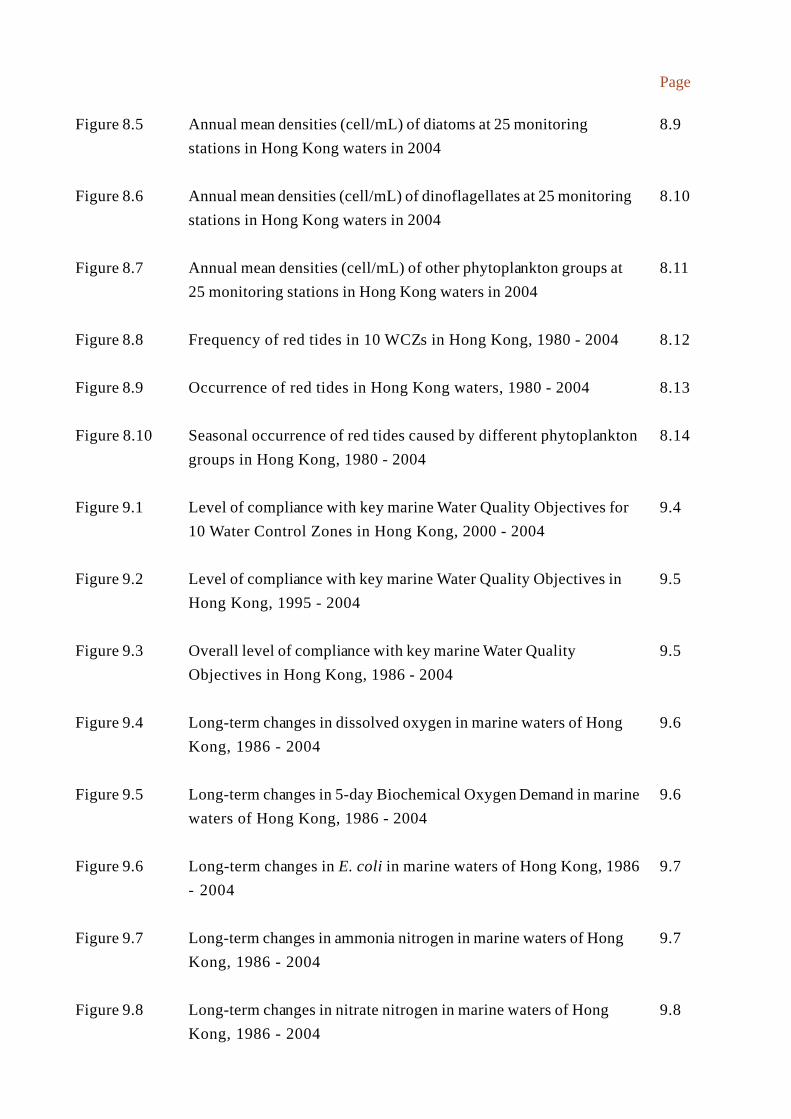
Annual mean densities (cell/mL) of diatoms at 25 monitoringstations in Hong Kong waters in 2004
Annual mean densities (cell/mL) of dinoflagellates at 25 monitoringstations in Hong Kong waters in 2004
Annual mean densities (cell/mL) of other phytoplankton groups at25 monitoring stations in Hong Kong waters in 2004
Frequency of red tides in 10 WCZs in Hong Kong, 1980 - 2004
Occurrence of red tides in Hong Kong waters, 1980 - 2004
Seasonal occurrence of red tides caused by different phytoplanktongroups in Hong Kong, 1980 - 2004
Level of compliance with key marine Water Quality Objectives for10 Water Control Zones in Hong Kong, 2000 - 2004
Level of compliance with key marine Water Quality Objectives inHong Kong, 1995 - 2004
Overall level of compliance with key marine Water QualityObjectives in Hong Kong, 1986 - 2004
Long-term changes in dissolved oxygen in marine waters of HongKong, 1986 - 2004
Long-term changes in 5-day Biochemical Oxygen Demand in marinewaters of Hong Kong, 1986 - 2004
Long-term changes in E. coli in marine waters of Hong Kong, 1986- 2004
Long-term changes in ammonia nitrogen in marine waters of HongKong, 1986 - 2004
Long-term changes in nitrate nitrogen in marine waters of HongKong, 1986 - 2004
Figure 8.5
Figure 8.6
Figure 8.7
Figure 8.8
Figure 8.9
Figure 8.10
Figure 9.1
Figure 9.2
Figure 9.3
Figure 9.4
Figure 9.5
Figure 9.6
Figure 9.7
Figure 9.8
8.9
8.10
8.11
8.12
8.13
8.14
9.4
9.5
9.5
9.6
9.6
9.7
9.7
9.8
Page
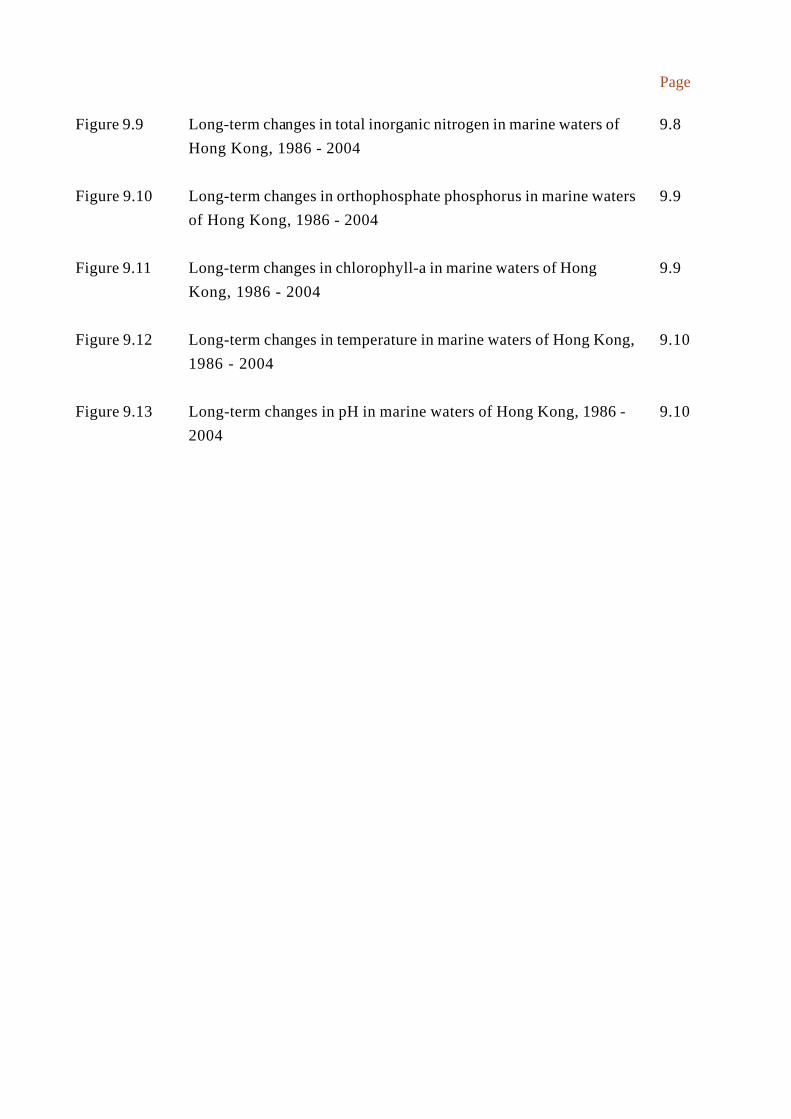
Long-term changes in total inorganic nitrogen in marine waters ofHong Kong, 1986 - 2004
Long-term changes in orthophosphate phosphorus in marine watersof Hong Kong, 1986 - 2004
Long-term changes in chlorophyll-a in marine waters of HongKong, 1986 - 2004
Long-term changes in temperature in marine waters of Hong Kong,1986 - 2004
Long-term changes in pH in marine waters of Hong Kong, 1986 -2004
Figure 9.9
Figure 9.10
Figure 9.11
Figure 9.12
Figure 9.13
9.8
9.9
9.9
9.10
9.10
LIST OF TABLES
Table 1.1
Table 1.2
Table 1.3
Table 1.4
Table 2.1
Table 2.2
Table 2.3
Table 2.4
Table 2.5
Table 2.6
Table 3.1
Table 3.2
Table 4.1
Table 4.2
Table 4.3
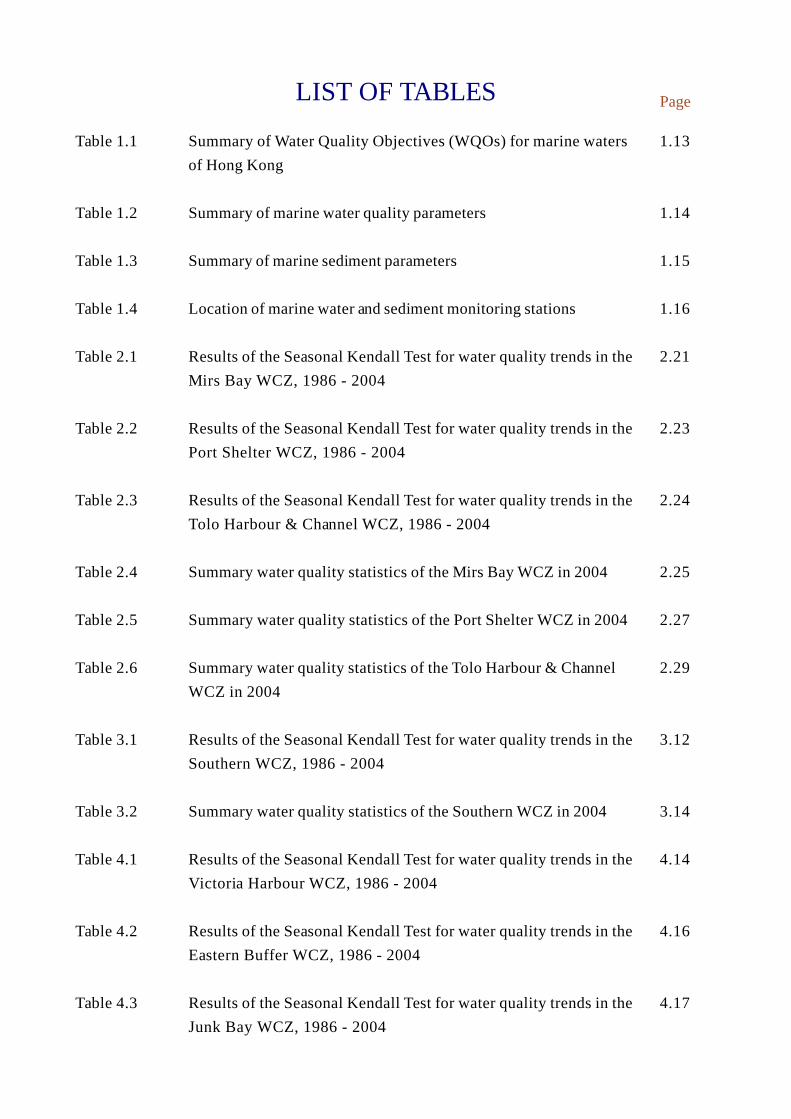
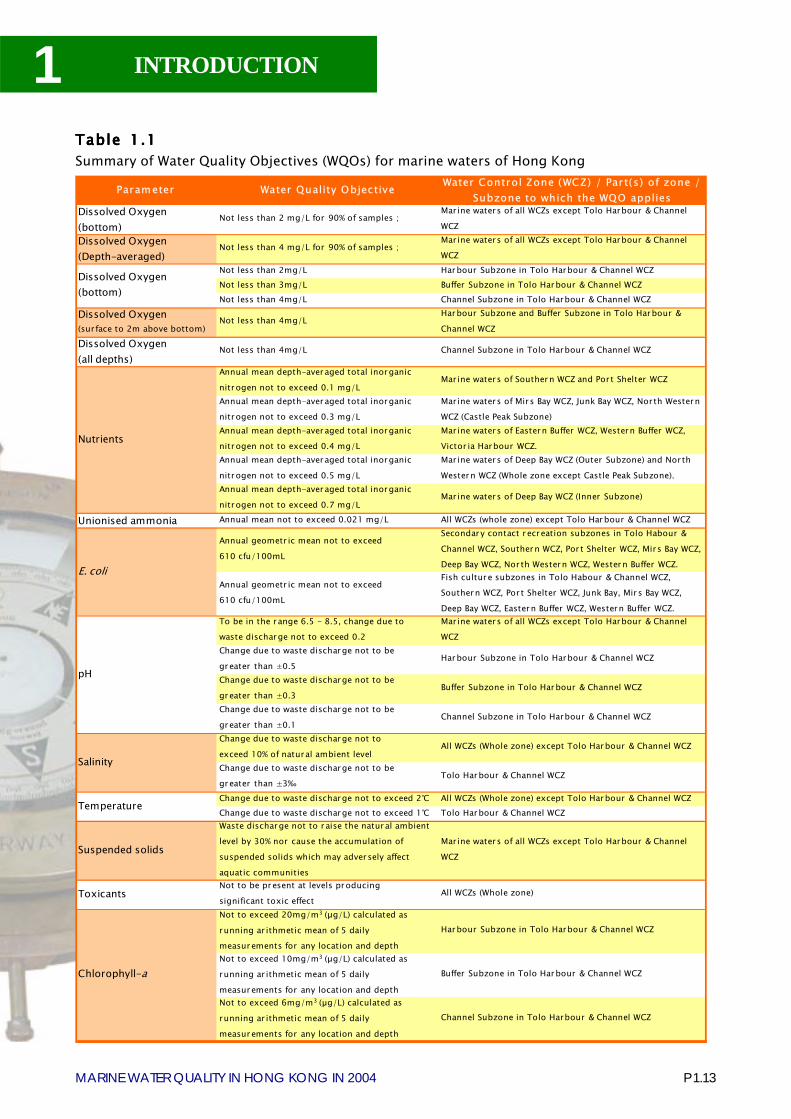
Summary of Water Quality Objectives (WQOs) for marine watersof Hong Kong
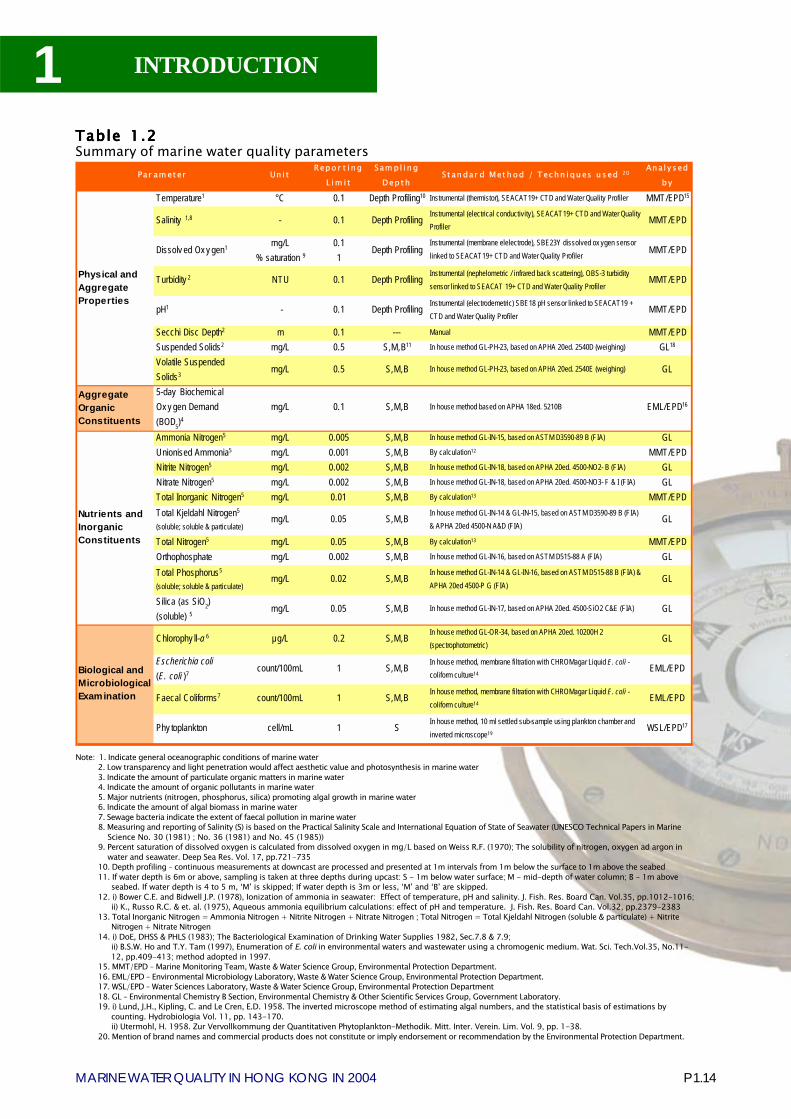
Summary of marine water quality parameters
Summary of marine sediment parameters
Location of marine water and sediment monitoring stations
Results of the Seasonal Kendall Test for water quality trends in theMirs Bay WCZ, 1986 - 2004
Results of the Seasonal Kendall Test for water quality trends in thePort Shelter WCZ, 1986 - 2004
Results of the Seasonal Kendall Test for water quality trends in theTolo Harbour & Channel WCZ, 1986 - 2004
Summary water quality statistics of the Mirs Bay WCZ in 2004
Summary water quality statistics of the Port Shelter WCZ in 2004
Summary water quality statistics of the Tolo Harbour & ChannelWCZ in 2004
Results of the Seasonal Kendall Test for water quality trends in theSouthern WCZ, 1986 - 2004
Summary water quality statistics of the Southern WCZ in 2004
Results of the Seasonal Kendall Test for water quality trends in theVictoria Harbour WCZ, 1986 - 2004
Results of the Seasonal Kendall Test for water quality trends in theEastern Buffer WCZ, 1986 - 2004
Results of the Seasonal Kendall Test for water quality trends in theJunk Bay WCZ, 1986 - 2004
1.13
1.14
1.15
1.16
2.21
2.23
2.24
2.25
2.27
2.29
3.12
3.14
4.14
4.16
4.17
Page
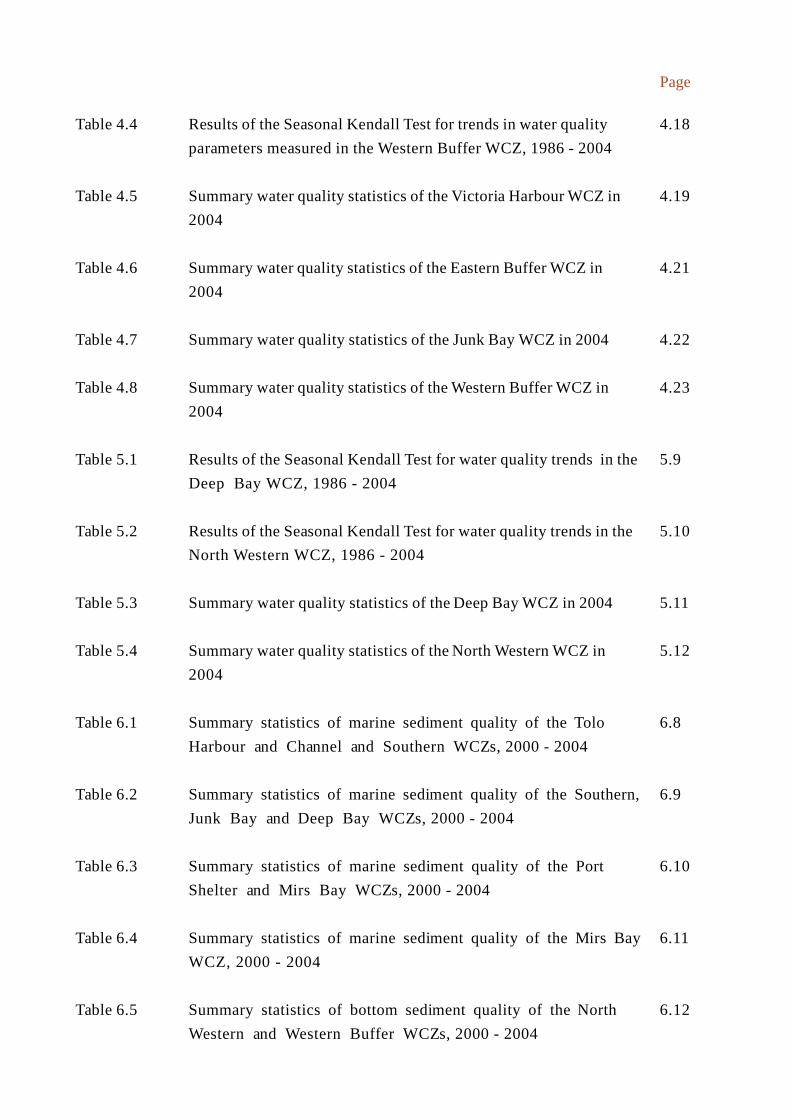
Table 4.4
Table 4.5
Table 4.6
Table 4.7
Table 4.8
Table 5.1
Table 5.2
Table 5.3
Table 5.4
Table 6.1
Table 6.2
Table 6.3
Table 6.4
Table 6.5
Results of the Seasonal Kendall Test for trends in water qualityparameters measured in the Western Buffer WCZ, 1986 - 2004
Summary water quality statistics of the Victoria Harbour WCZ in2004
Summary water quality statistics of the Eastern Buffer WCZ in2004
Summary water quality statistics of the Junk Bay WCZ in 2004
Summary water quality statistics of the Western Buffer WCZ in2004
Results of the Seasonal Kendall Test for water quality trends in theDeep Bay WCZ, 1986 - 2004
Results of the Seasonal Kendall Test for water quality trends in theNorth Western WCZ, 1986 - 2004
Summary water quality statistics of the Deep Bay WCZ in 2004
Summary water quality statistics of the North Western WCZ in2004
Summary statistics of marine sediment quality of the ToloHarbour and Channel and Southern WCZs, 2000 - 2004
Summary statistics of marine sediment quality of the Southern,Junk Bay and Deep Bay WCZs, 2000 - 2004
Summary statistics of marine sediment quality of the PortShelter and Mirs Bay WCZs, 2000 - 2004
Summary statistics of marine sediment quality of the Mirs BayWCZ, 2000 - 2004
Summary statistics of bottom sediment quality of the NorthWestern and Western Buffer WCZs, 2000 - 2004
4.18
4.19
4.21
4.22
4.23
5.9
5.10
5.11
5.12
6.8
6.9
6.10
6.11
6.12
Page
Summary statistics of marine sediment quality of the EasternBuffer and Victoria Harbour WCZs, 2000 - 2004
Sediment Quality Criteria for the Classification of Sediments
Results of the Seasonal Kendall Test for water quality trends intyphoon shelters, 1986 - 2004
Summary water quality statistics of typhoon shelters in 2004
Summary statistics of bottom sediment quality of typhoon shelters,2000 - 2004
Abundance and frequency of the dominant phytoplankton species indifferent WCZs in 2004
Occurrence and distribution of red tide species in different WCZs,1980 - 2004
Table 6.6
Table 6.7
Table 7.1
Table 7.2
Table 7.3
Table 8.1
Table 8.2
6.13
6.14
7.9
7.11
7.14
8.15
8.16
Page
K - 1
ACKNOWLEDGEMENTS
We acknowledge the following parties for their contributions to themarine water quality report:
Government Laboratory
for undertaking chemical analyses of water and sediment samples.
Marine Department
for managing and operating the vessel Dr. Catherine Lam for conductingfield sampling and measurement.
Agricul ture , Fisher ies and Conservat ion Department , Civ i lEngineering Department, Drainage Services Department and LandsDepartment
for providing information on geography, major activities and uses of marinewater.
Lands Department
for permission to use the map“Map of Hong Kong in Its RegionalSetting” (Licence No. G07/2005) for the covers of chapters 1-5.
DISCLAIMER
Whilst the Government of the Hong Kong Special Administrative Region (“theGovernment”) endeavours to ensure the accuracy of the information in this report, theGovernment (including its officers and employees) makes no warranty, statement orrepresentation, expressed or implied, with respect to accuracy, completeness, orusefulness of the information contained herein, and in so far as permitted by law, shallnot have any legal liability or responsibility (including liability for negligence) for anyloss, damage, injury and death which may result, whether directly or indirectly, fromthe supply or use of such information. Users are responsible for making their ownassessments of all information contained in this publication before acting on it.
K - 2

Summary ofMarine Water Qualityin Hong Kong in 2004
In 2004, the overall compliance with the marine Water Quality Objectives(WQOs) in the territory was maintained at the record level of 87%, similar tothat in the previous two years. On the other hand, the water quality in InnerDeep Bay remained very poor, with low dissolved oxygen (DO) and elevatedlevels of nitrogen and phosphorus, highlighting the pollution problem in the bay.
The water quality of Port Shelter and Mirs Bay continued to be excellent, withlow bacteria, organic matter and high DO. In Victoria Harbour, the improvementsfollowing the commissioning of the Harbour Area Treatment Scheme (HATS)Stage 1 were sustained in 2004. These included an increase in DO and reductionin nutrients in the eastern and central parts of the harbour. While the easternharbour experienced a reduction of E. coli bacteria, the higher levels in the centraland western harbour persisted.
The water quality in Tolo Harbour followed its upward trend with declines inorganic and inorganic pollutants. The condition in Deep Bay further deterioratedin 2004 with increases in ammonia and nitrogen and a reduction in the compliancewith the WQOs.
Some increase of ammonia nitrogen was observed in the Southern, Western Bufferand North Western Water Control Zones in 2004. On the other hand, there wasa widespread increase of DO of around 9% in the eastern and southern waters,probably related to natural fluctuation and the lower baseline in the previous year.
S - 1
P 1.2MARINE WATER QUALITY IN HONG KONG IN 2004
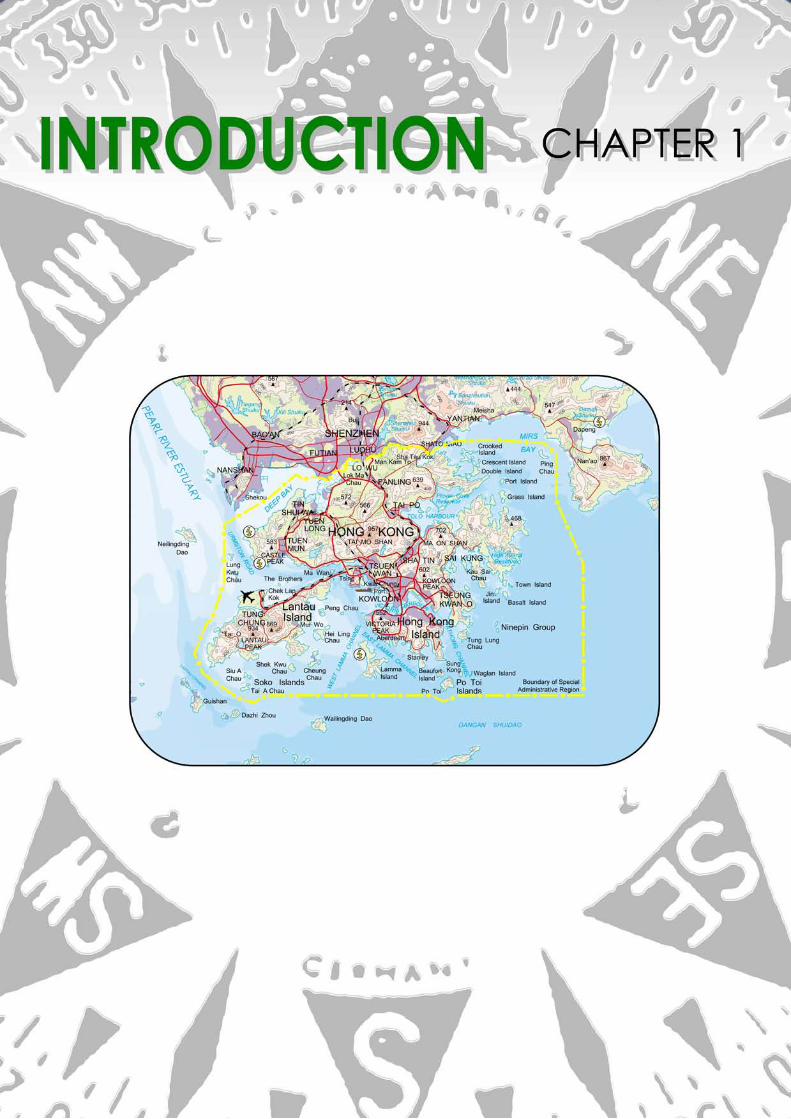
1 INTRODUCTION
Chapter 1 - Introduction
Introduction
1.1 The Hong Kong Special Administrative Region (HKSAR) has a land area of 1,104km2 and 1,651 km2 area of marine water. It has long coastlines, including 456 km in the KowloonPeninsula and New Territories and 722 km in Hong Kong Island, Lantau Island and 260 smallislands.
1.2 With a population of 6.9 million, Hong Kong relies heavily on marine water for recreation,fish culture, cooling, toilet flushing, transport and effluent disposal. Hong Kong’s coastal water isunder the influence of Pearl River, supporting a rich diversity of life ranging from microscopicplankton, sponges and corals to dolphins and porpoises.
1.3 To protect the ecology and human uses of marine water, the HKSAR Government hasestablished Water Quality Objectives (WQOs) (Table 1.1) for the 10 Water Control Zones (WCZs)(Figure 1.1). The aim is to achieve the WQOs by implementing measures to reduce pollution andimprove water quality. In order to assess the health status of the marine environment, detect long-term water quality changes and measure compliance with the WQOs, the Environmental ProtectionDepartment (EPD) implements a comprehensive marine monitoring programme.
Marine Monitoring Programme
1.4 The current marine monitoring programme has been in operation since 1986. Monitoringis mostly conducted onboard a 26-metre vessel, the Dr. Catherine Lam. The vessel is equippedwith an advanced Differential Global Positioning System (DGPS) and an electronic navigation chartfor precise location of monitoring stations in the sea.
1.5 A conductivity-temperature-depth (CTD) profiler linked to a computer -controlledrosette water sampler is used to measure field parameters and collect water samples. Bottomsediments are collected by a sediment grab. The water and sediment samples are analysed byEPD’s laboratories and the Government Laboratory (http://www.govtlab.gov.hk) for over 80physical, chemical and biological parameters (Tables 1.2 and 1.3).
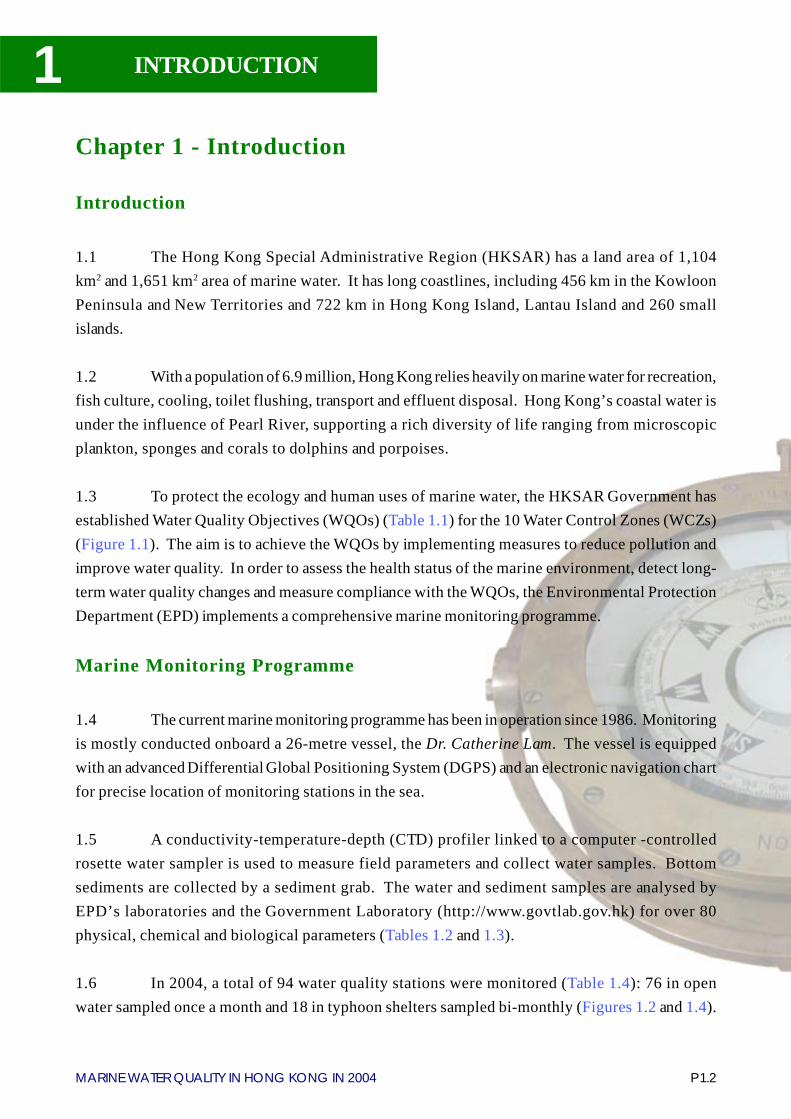
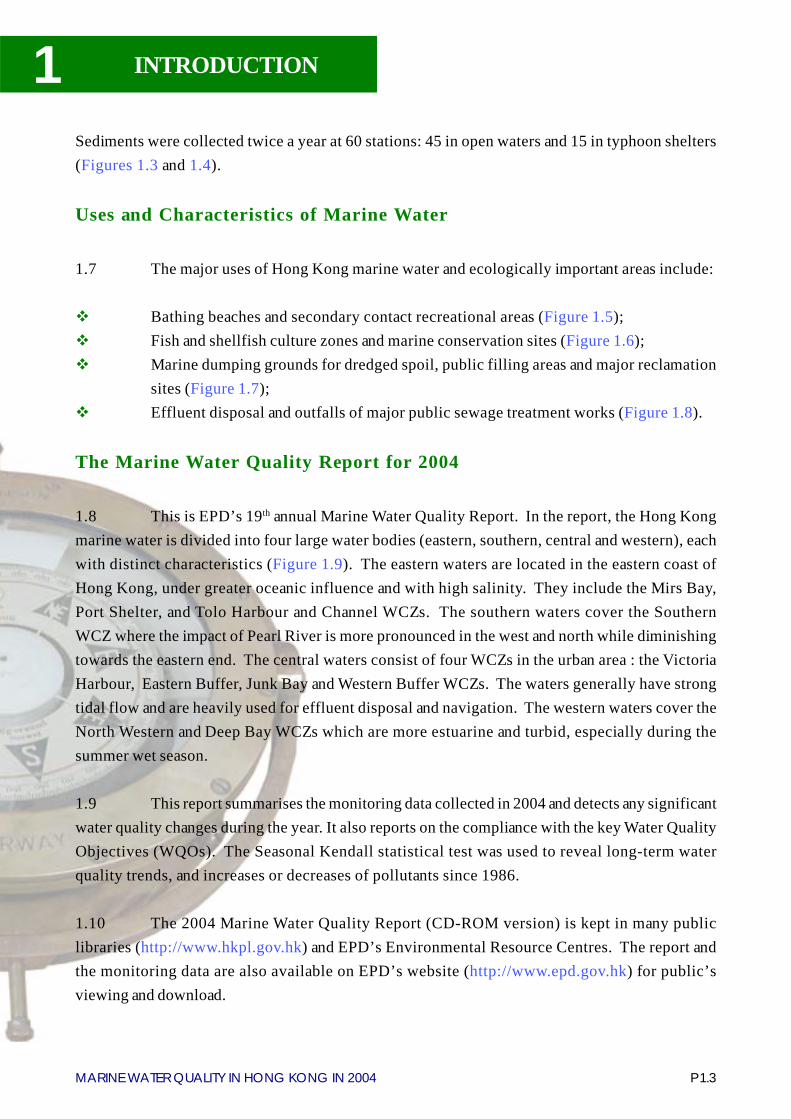
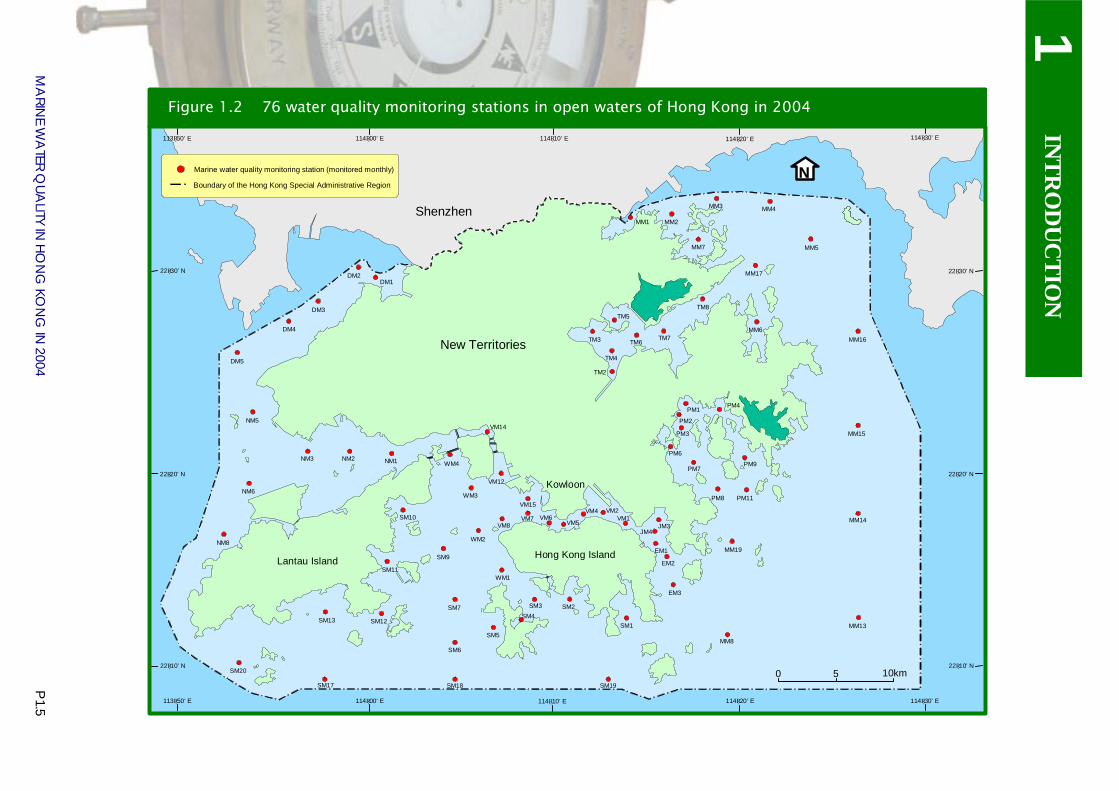
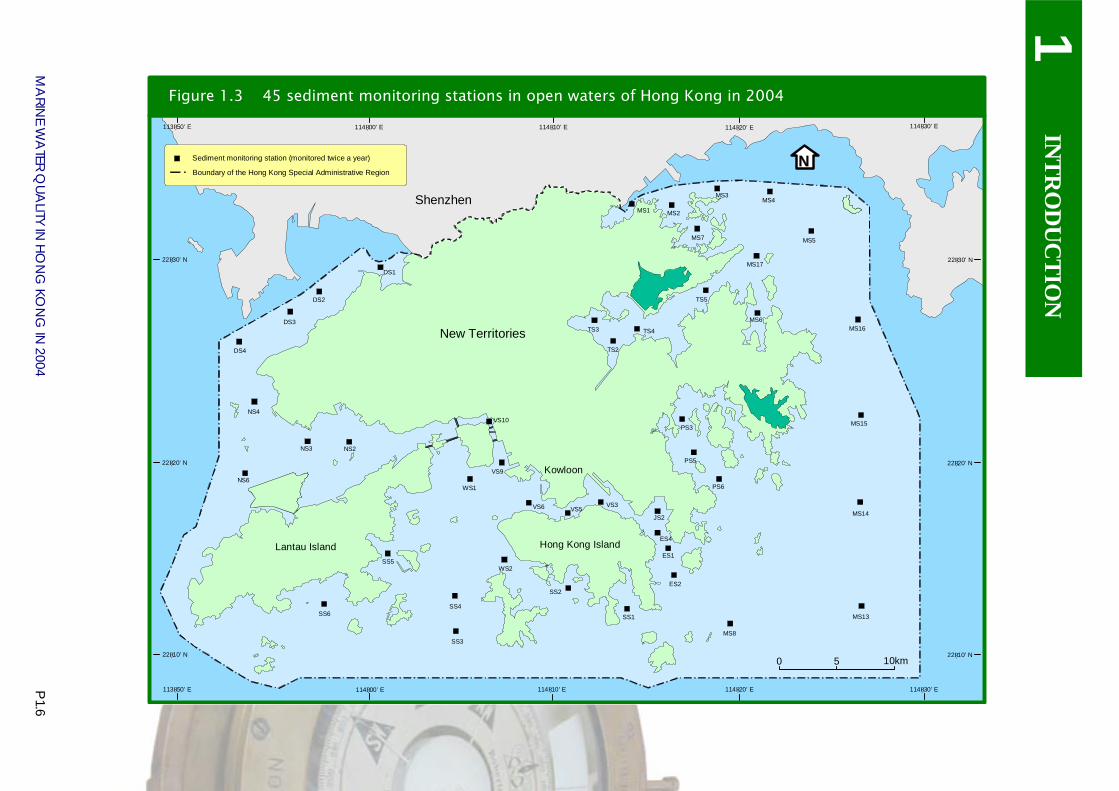
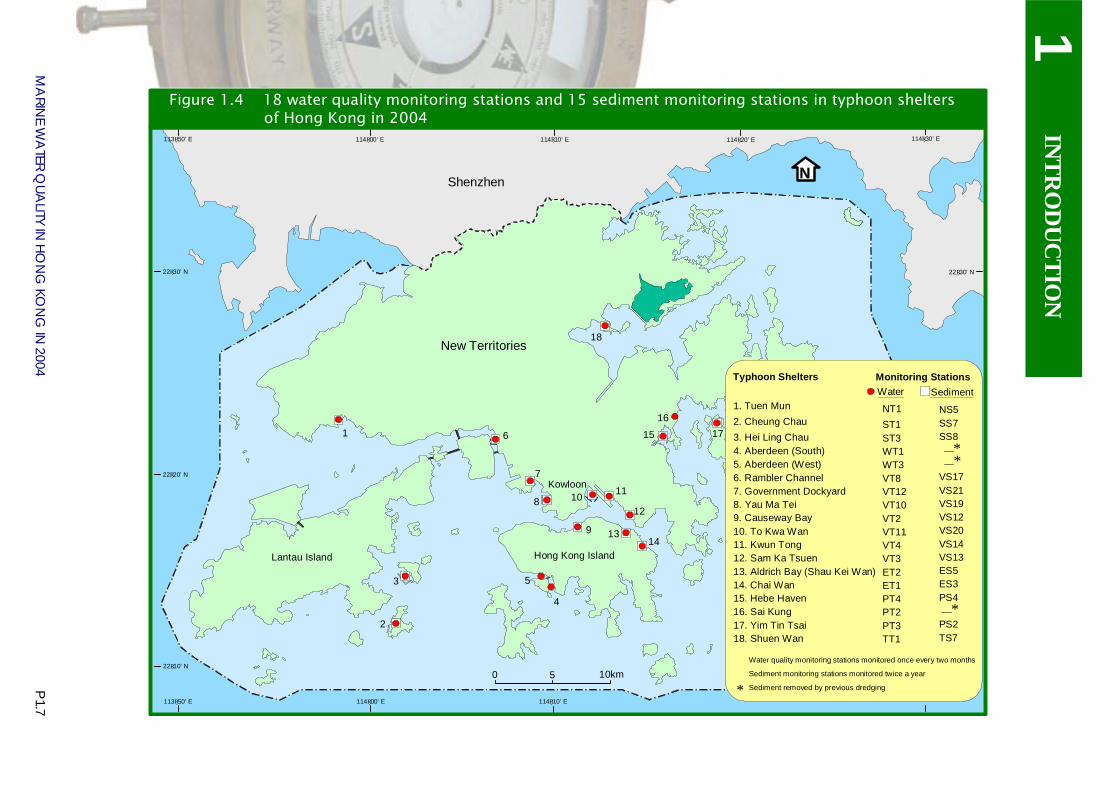
1.6 In 2004, a total of 94 water quality stations were monitored (Table 1.4): 76 in openwater sampled once a month and 18 in typhoon shelters sampled bi-monthly (Figures 1.2 and 1.4).
P 1.3MARINE WATER QUALITY IN HONG KONG IN 2004
1 INTRODUCTION
Sediments were collected twice a year at 60 stations: 45 in open waters and 15 in typhoon shelters(Figures 1.3 and 1.4).
Uses and Characteristics of Marine Water
1.7 The major uses of Hong Kong marine water and ecologically important areas include:
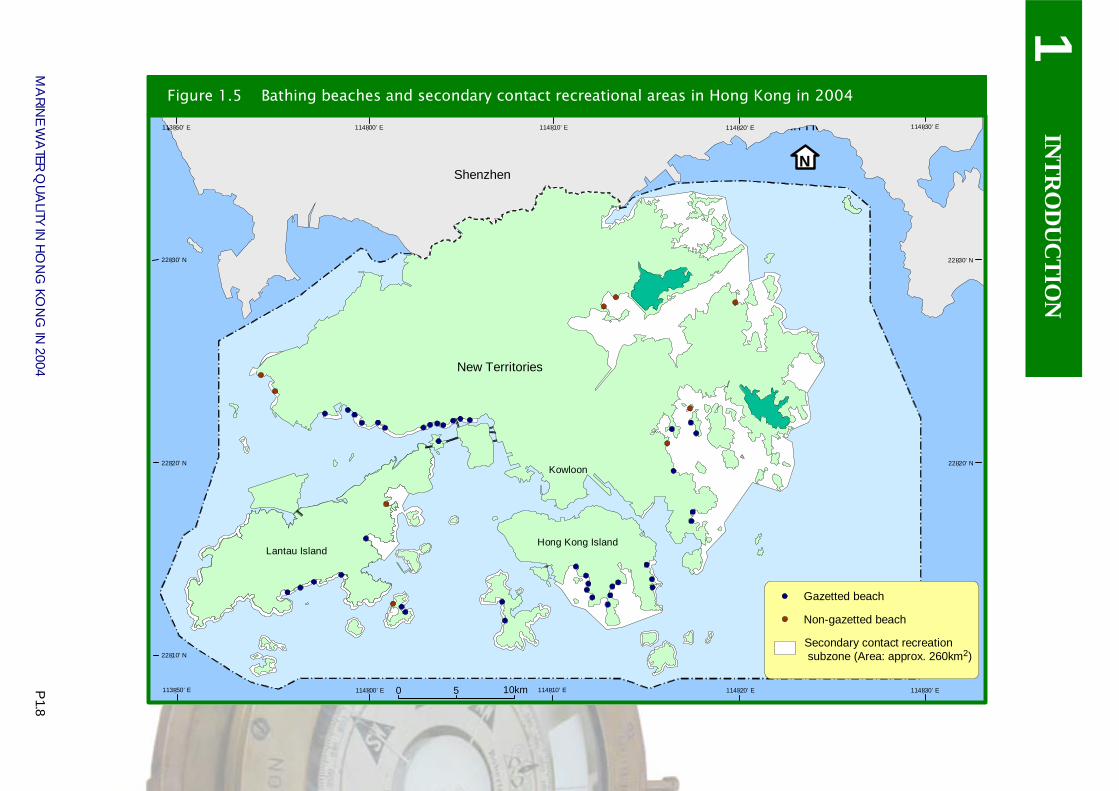
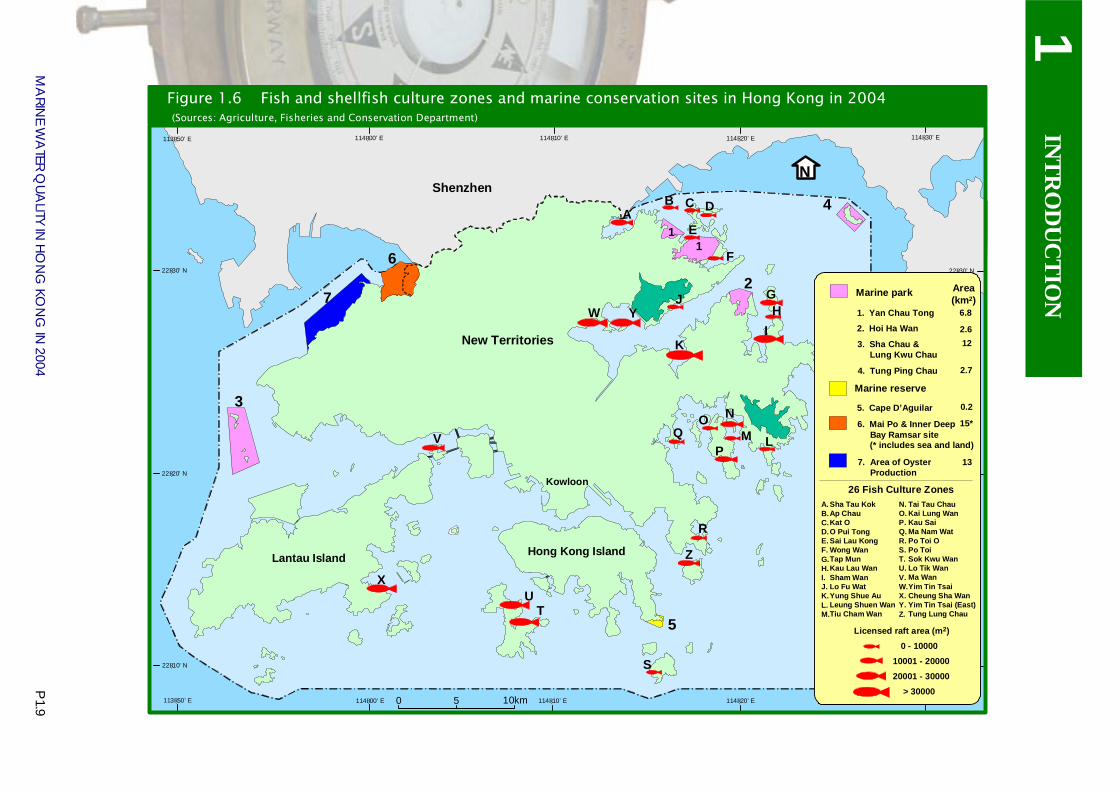
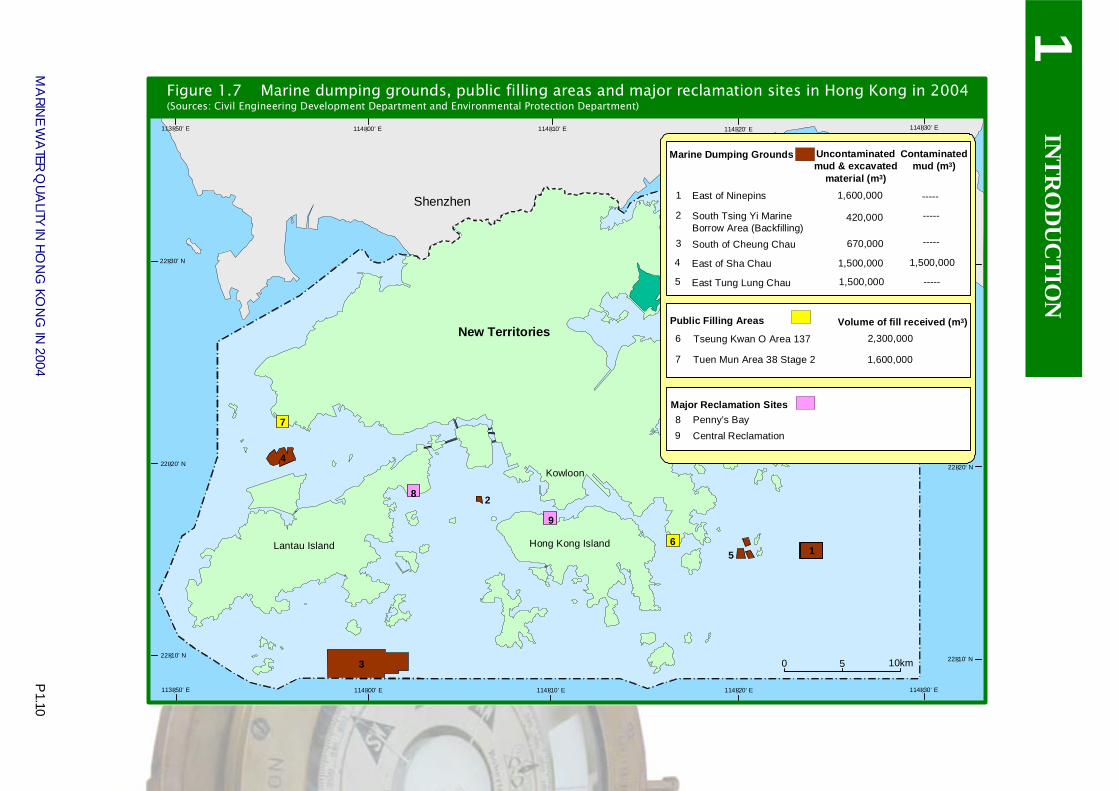
Bathing beaches and secondary contact recreational areas (Figure 1.5);Fish and shellfish culture zones and marine conservation sites (Figure 1.6);Marine dumping grounds for dredged spoil, public filling areas and major reclamationsites (Figure 1.7);Effluent disposal and outfalls of major public sewage treatment works (Figure 1.8).
The Marine Water Quality Report for 2004
1.8 This is EPD’s 19th annual Marine Water Quality Report. In the report, the Hong Kongmarine water is divided into four large water bodies (eastern, southern, central and western), eachwith distinct characteristics (Figure 1.9). The eastern waters are located in the eastern coast ofHong Kong, under greater oceanic influence and with high salinity. They include the Mirs Bay,Port Shelter, and Tolo Harbour and Channel WCZs. The southern waters cover the SouthernWCZ where the impact of Pearl River is more pronounced in the west and north while diminishingtowards the eastern end. The central waters consist of four WCZs in the urban area : the VictoriaHarbour, Eastern Buffer, Junk Bay and Western Buffer WCZs. The waters generally have strongtidal flow and are heavily used for effluent disposal and navigation. The western waters cover theNorth Western and Deep Bay WCZs which are more estuarine and turbid, especially during thesummer wet season.
1.9 This report summarises the monitoring data collected in 2004 and detects any significantwater quality changes during the year. It also reports on the compliance with the key Water QualityObjectives (WQOs). The Seasonal Kendall statistical test was used to reveal long-term waterquality trends, and increases or decreases of pollutants since 1986.
1.10 The 2004 Marine Water Quality Report (CD-ROM version) is kept in many publiclibraries (http://www.hkpl.gov.hk) and EPD’s Environmental Resource Centres. The report andthe monitoring data are also available on EPD’s website (http://www.epd.gov.hk) for public’sviewing and download.

P 1.4M
ARIN
E WA
TER QUA
LITY IN HO
NG
KON
G IN
2004
1IN
TRO
DU
CTIO
N
0 5 10km
Shenzhen
Hong Kong Island
Kowloon
Lantau Island
N
114° 20’ E114° 10’ E114° 00’ E113° 50’ E
22° 30’ N22° 30’ N
22° 20’ N
22° 10’ N
113° 50’ E 114° 00’ E 114° 10’ E 114° 20’ E
New Territories
114° 30’ E
5
1S
1
10.1
1S
8 10.2
10.3
10.1
4
3
6
9
2S
2SI
2
2SI
2S
7S
7 Water Control ZonesFirst
Appointed Day
1 Tolo Harbour & Channel 1.4.87Southern 1.8.88Port Shelter 1.8.89Junk Bay 1.8.89Deep Bay 1.12.90Mirs Bay 1.12.90North Western 1.4.92Western Buffer 1.6.93Eastern Buffer 1.6.93Tolo Harbour Supplementary 1.6.93
Phase 1 1.11.94Phase 2 1.9.95Phase 3 1.4.96
Second Southern Supplementary 1.11.99North Western Supplementary 1.11.99
Southern Supplementary 1.6.93Victoria Harbour
23456789
10.1
10.2
10.3
1S2S10
2SI7S
Figure 1.1 Water Control Zones in Hong Kong
P 1.5M
ARIN
E WA
TER QUA
LITY IN HO
NG
KON
G IN
2004
1IN
TRO
DU
CTIO
N
N
0 5 10km
DM3
DM4
DM5
NM5
NM3
NM6
NM8
NM2 NM1 WM4
WM3
WM2
WM1
SM10
SM11
SM9
SM13
SM17
SM20
SM18
SM7
SM6
SM5
SM4SM3 SM2
SM1
SM19
VM12
VM8
VM15
VM7 VM6VM5
VM4 VM2
JM3JM4
EM1
EM2
EM3
MM8
MM13
MM14
PM11PM8
PM9PM7
PM6
Hong Kong Island
Boundary of the Hong Kong Special Administrative Region
Marine water quality monitoring station (monitored monthly)
SM12
Lantau Island
114° 20’ E114° 10’ E114° 00’ E113° 50’ E
22° 20’ N
22° 10’ N
114° 00’ E 114° 10’ E113° 50’ E 114° 20’ E
22° 20’ N
22° 10’ N
New Territories
Kowloon
MM19
DM1DM2
Shenzhen
22° 30’ N
VM14PM3 MM15
TM4
TM2
TM3 TM6 MM16
PM2
PM1PM4
TM5
TM7
TM8
MM6
MM4
MM2
MM3
MM1
MM17
MM7 MM5
22° 30’ N
VM1
114° 30’ E
114° 30’ E
Figure 1.2 76 water quality monitoring stations in open waters of Hong Kong in 2004
P 1.6M
ARIN
E WA
TER QUA
LITY IN HO
NG
KON
G IN
2004
1IN
TRO
DU
CTIO
N
0 5 10km
Shenzhen
New Territories
Hong Kong Island
Kowloon
Lantau Island
DS1
DS2
DS3
DS4
NS4
NS3
NS6
NS2
WS1
WS2SS5
SS6SS4
SS3
SS2
SS1
VS10
VS9
VS6 VS5VS3
JS2
ES4
ES1
ES2
MS8
MS13
MS14
PS6
PS5
PS3
TS2
TS3 TS4
TS5
MS6MS16
MS15
MS17
MS7 MS5
MS4
MS2
MS3
MS1
Sediment monitoring station (monitored twice a year)
Boundary of the Hong Kong Special Administrative RegionN
114° 20’ E114° 10’ E114° 00’ E113° 50’ E
22° 30’ N
22° 20’ N
22° 10’ N
22° 30’ N
22° 20’ N
22° 10’ N
113° 50’ E 114° 00’ E 114° 10’ E 114° 20’ E
114° 30’ E
114° 30’ E
Figure 1.3 45 sediment monitoring stations in open waters of Hong Kong in 2004
P 1.7M
ARIN
E WA
TER QUA
LITY IN HO
NG
KON
G IN
2004
1IN
TRO
DU
CTIO
N
0 5 10km
Shenzhen
Kowloon
1617
18
1 6
2
8
14
10
13
12
5
11
9
N
3
15
4
7
114° 20’ E114° 10’ E114° 00’ E113° 50’ E
New Territories
Hong Kong IslandLantau Island
113° 50’ E 114° 00’ E 114° 10’ E
22° 30’ N
22° 20’ N
22° 10’ N
22° 30’ N
114° 30’ E
Monitoring Stations
1. Tuen Mun 2. Cheung Chau3. Hei Ling Chau4. Aberdeen (South)5. Aberdeen (West) 6. Rambler Channel7. Government Dockyard8. Yau Ma Tei9. Causeway Bay10. To Kwa Wan 11. Kwun Tong 12. Sam Ka Tsuen13. Aldrich Bay (Shau Kei Wan)14. Chai Wan15. Hebe Haven16. Sai Kung17. Yim Tin Tsai18. Shuen Wan
NT1ST1ST3 WT1WT3VT8VT12VT10VT2VT11VT4VT3 ET2ET1PT4PT2PT3TT1
NS5SS7SS8
VS17VS21VS19VS12VS20VS14VS13ES5ES3PS4
PS2TS7
Typhoon SheltersWater Sediment
Water quality monitoring stations monitored once every two months
Sediment monitoring stations monitored twice a year
Sediment removed by previous dredging*
**
*
Figure 1.4 18 water quality monitoring stations and 15 sediment monitoring stations in typhoon shelters of Hong Kong in 2004
P 1.8M
ARIN
E WA
TER QUA
LITY IN HO
NG
KON
G IN
2004
1IN
TRO
DU
CTIO
N
Figure 1.5 Bathing beaches, secondary contact recreational areas, and seawater abstraction points in Hong Kong in 2003
0 5 10km
Hong Kong Island
Shenzhen
Kowloon
New Territories
Lantau Island
N
Secondary contact recreationsubzone (Area: approx. 260km2)
Gazetted beach
Non-gazetted beach
114° 20’ E114° 10’ E114° 00’ E113° 50’ E
22° 30’ N
22° 20’ N
22° 30’ N
22° 20’ N
22° 10’ N
113° 50’ E 114° 00’ E 114° 10’ E 114° 20’ E
114° 30’ E
114° 30’ E
Figure 1.5 Bathing beaches and secondary contact recreational areas in Hong Kong in 2004
P 1.9M
ARIN
E WA
TER QUA
LITY IN HO
NG
KON
G IN
2004
1IN
TRO
DU
CTIO
N
0 5 10km
Hong Kong Island
Kowloon
New Territories
N
114° 20’ E114° 10’ E114° 00’ E
22° 30’ N
22° 20’ N
22° 30’ N
22° 20’ N
22° 10’ N
113° 50’ E 114° 00’ E 114° 10’ E 114° 20’ E
114° 30’ E
1
114° 30’ E
X
Hong Kong Island
Shenzhen
Kowloon
New Territories
6.8
5
1
C
GH
K
LMO
P
Z
S
V
1
22° 20’ N
22° 10’ N
2
4
3
6
7
A
F
NQ
R
TU
W Y
E
B
J
I
D
Marine park Area(km2)
1. Yan Chau Tong
2. Hoi Ha Wan 2.63. Sha Chau &
Lung Kwu Chau12
4. Tung Ping Chau 2.7
Marine reserve
5. Cape D’Aguilar 0.2
6. Mai Po & Inner DeepBay Ramsar site(* includes sea and land)
15*
7. Area of OysterProduction
13
6.8
26 Fish Culture ZonesA.B.C.D.E.F.G.H.I.J.K.L.M.
N.O.P.Q.R.S.T.U.V.W.X.Y.Z.
Sha Tau KokAp ChauKat OO Pui TongSai Lau KongWong WanTap MunKau Lau WanSham WanLo Fu WatYung Shue AuLeung Shuen WanTiu Cham Wan
Tai Tau ChauKai Lung Wan Kau SaiMa Nam WatPo Toi OPo ToiSok Kwu WanLo Tik WanMa WanYim Tin TsaiCheung Sha WanYim Tin Tsai (East) Tung Lung Chau
Licensed raft area (m2)
113° 50’ E
> 3000020001 - 3000010001 - 20000
0 - 10000
Lantau Island
Figure 1.6 Fish and shellfish culture zones and marine conservation sites in Hong Kong in 2004 (Sources: Agriculture, Fisheries and Conservation Department)
P 1.10M
ARIN
E WA
TER QUA
LITY IN HO
NG
KON
G IN
2004
1IN
TRO
DU
CTIO
N
N
0 5 10km
Hong Kong Island
Shenzhen
Kowloon
Lantau Island
6
114° 20’ E114° 10’ E114° 00’ E113° 50’ E
22° 30’ N
22° 20’ N
22° 10’ N
113° 50’ E 114° 00’ E 114° 10’ E 114° 20’ E
7
8
9
6
New Territories
114° 30’ E
114° 30’ E
5 1
2
1
422° 20’ N
22° 10’ N
22° 30’ N
3
Public Filling Areas Volume of fill received (m3)
Tuen Mun Area 38 Stage 2 1,600,0007
Tseung Kwan O Area 137 2,300,0006
East of Sha Chau 1,500,000 1,500,000
East Tung Lung Chau 1,500,000 -----
South Tsing Yi Marine Borrow Area (Backfilling)
420,000
1 East of Ninepins 1,600,000 -----
-----
Marine Dumping Grounds Uncontaminatedmud & excavated
material (m3)
Contaminatedmud (m3)
South of Cheung Chau 670,000 -----
2
3
4
5
Major Reclamation SitesPenny’s Bay8
9 Central Reclamation
Figure 1.7 Marine dumping grounds, public filling areas and major reclamation sites in Hong Kong in 2004 (Sources: Civil Engineering Development Department and Environmental Protection Department)
P 1.11M
ARIN
E WA
TER QUA
LITY IN HO
NG
KON
G IN
2004
1IN
TRO
DU
CTIO
N
0 5 10km
Hong Kong Island
Shenzhen
Kowloon
New Territories
Lantau Island
N
23
12
73
12 114
16
8
21
19
17
14
15
9
5
6
25
22
20
24
Tolo HarbourEffluent ExportScheme
Harbour AreaTreatment SchemeStage I
1013
114° 20’ E114° 10’ E114° 00’ E113° 50’ E
22° 30’ N
22° 20’ N
22° 10’ N
113° 50’ E 114° 00’ E 114° 10’ E
114° 30’ E
114° 30’ E
18
123456789
1011121314151617
25
192021222324
SewageTreatmentWorks
Cyberport
Shek Wu Hui
AberdeenAp Lei ChauCentralNorth PointPillar PointSan WaiSandy BayShek OSiu Ho WanWah FuWan Chai EastWan Chai West
Cheung ChauTai OStonecutters IslandMui Wo
Yuen Long
Sai KungSha Tau KokSha Tin
StanleyTai Po
Flow(x1000m3/year)
Discharge into inland water
BOD5(tonne/year)
SuspendedSolids
(tonne/year)22000160003900032000
1600330
120002700
430009200
7803100
380500000
29000
3500
490
6400
54080000
280033000
4000061000
530038009300
960038079
2900600
100002200
4930029
27000
170
20
1
38
3470
6210
150007700
450032007800
810032067
2400510
86001800
4023026
19000
240
24
3
82
31000
13420
120006400
Screening (Preliminary)Sedimentation (Primary)Chemical EnhancedBiological (Secondary)
Total 940000 95000 77000
Submarine outfall
18 Peng Chau 140 1 2
Figure 1.8 Major public sewage treatment works, outfalls and pollution loads in Hong Kong in 2004 (Sources: Drainage Services Department and Environmental Protection Department)
P 1.12M
ARIN
E WA
TER QUA
LITY IN HO
NG
KON
G IN
2004
1IN
TRO
DU
CTIO
N
22° 20’ N
22° 10’ N
New Territories
Lantau Island
2
9Hong Kong Island
Kowloon
3
1
5
7
2S
10.1
810.2
6
4
5
10
Shenzhen
Hong Kong Island
Kowloon
N
New Territories
0 5 10km
114° 20’ E114° 10’ E114° 00’ E113° 50’ E
22° 30’ N
114° 30’ E
114° 00’ E 114° 10’ E 114° 20’ E
22° 30’ N
113° 50’ E
Water BodiesEastern waters
Tolo Harbour & Channel WCZPort Shelter WCZMirs Bay WCZ
136
Eastern Buffer WCZVictoria Harbour WCZ
910
Junk Bay WCZWestern Buffer WCZ
48
Central waters
Southern WCZ
Southern waters
2
Western waters
Deep Bay WCZNorth Western WCZ7
5
Lantau Island
Figure 1.9 Four marine water bodies in Hong Kong – Eastern, Southern, Central and Western Waters
P 1.13MARINE WATER QUALITY IN HONG KONG IN 2004
1 INTRODUCTION
Table 1.1Table 1.1Table 1.1Table 1.1Table 1.1Summary of Water Quality Objectives (WQOs) for marine waters of Hong Kong
Param eter Water Quality Objective Water Control Zone (WCZ) / Par t( s ) of zone /Subzone to which the WQO applies
Dissolved Oxygen(bottom)
Not less than 2 mg/L for 90% of samples ;Mar ine waters of all WCZs except Tolo Harbour & ChannelWCZ
Dissolved Oxygen(Depth-averaged)
Not less than 4 mg/L for 90% of samples ;Mar ine waters of all WCZs except Tolo Harbour & ChannelWCZ
Not less than 2mg/L Harbour Subzone in Tolo Harbour & Channel WCZNot less than 3mg/L Buffer Subzone in Tolo Harbour & Channel WCZNot less than 4mg/L Channel Subzone in Tolo Harbour & Channel WCZ
Dissolved Oxygen(sur face to 2m above bottom)
Not less than 4mg/LHarbour Subzone and Buffer Subzone in Tolo Harbour &Channel WCZ
Dissolved Oxygen(all depths)
Not less than 4mg/L Channel Subzone in Tolo Harbour & Channel WCZ
Annual mean depth-averaged total inorganicnitrogen not to exceed 0.1 mg/L
Mar ine waters of Southern WCZ and Por t Shelter WCZ
Annual mean depth-averaged total inorganicnitrogen not to exceed 0.3 mg/L
Mar ine waters of Mir s Bay WCZ, Junk Bay WCZ, Nor th WesternWCZ (Castle Peak Subzone)
Annual mean depth-averaged total inorganicnitrogen not to exceed 0.4 mg/L
Mar ine waters of Eastern Buffer WCZ, Western Buffer WCZ,Victor ia Harbour WCZ.
Annual mean depth-averaged total inorganicnitrogen not to exceed 0.5 mg/L
Mar ine waters of Deep Bay WCZ (Outer Subzone) and Nor thWestern WCZ (Whole zone except Castle Peak Subzone).
Annual mean depth-averaged total inorganicnitrogen not to exceed 0.7 mg/L
Mar ine waters of Deep Bay WCZ (Inner Subzone)
Unionised ammonia Annual mean not to exceed 0.021 mg/L All WCZs (whole zone) except Tolo Harbour & Channel WCZ
Annual geometr ic mean not to exceed610 cfu/100mL
Secondary contact r ecr eation subzones in Tolo Habour &Channel WCZ, Southern WCZ, Por t Shelter WCZ, Mirs Bay WCZ,Deep Bay WCZ, Nor th Western WCZ, Western Buffer WCZ.
Annual geometr ic mean not to exceed610 cfu/100mL
Fish culture subzones in Tolo Habour & Channel WCZ,Southern WCZ, Por t Shelter WCZ, Junk Bay, Mir s Bay WCZ,Deep Bay WCZ, Eastern Buffer WCZ, Western Buffer WCZ.
To be in the r ange 6.5 - 8.5, change due towaste discharge not to exceed 0.2
Mar ine waters of all WCZs except Tolo Harbour & ChannelWCZ
Change due to waste discharge not to begreater than ±0.5
Harbour Subzone in Tolo Harbour & Channel WCZ
Change due to waste discharge not to begreater than ±0.3
Buffer Subzone in Tolo Harbour & Channel WCZ
Change due to waste discharge not to begreater than ±0.1
Channel Subzone in Tolo Harbour & Channel WCZ
Change due to waste discharge not toexceed 10% of natural ambient level
All WCZs (Whole zone) except Tolo Harbour & Channel WCZ
Change due to waste discharge not to begreater than ±3‰
Tolo Harbour & Channel WCZ
Change due to waste discharge not to exceed 2°C All WCZs (Whole zone) except Tolo Harbour & Channel WCZChange due to waste discharge not to exceed 1°C Tolo Harbour & Channel WCZ
Suspended solids
Waste discharge not to r aise the natural ambientlevel by 30% nor cause the accumulation ofsuspended solids which may adver sely affectaquatic communities
Mar ine waters of all WCZs except Tolo Harbour & ChannelWCZ
ToxicantsNot to be present at levels producingsignificant toxic effect
All WCZs (Whole zone)
Not to exceed 20mg/m3 (µg/L) calculated asrunning ar ithmetic mean of 5 dailymeasurements for any location and depth
Harbour Subzone in Tolo Harbour & Channel WCZ
Not to exceed 10mg/m3 (µg/L) calculated asrunning ar ithmetic mean of 5 dailymeasurements for any location and depth
Buffer Subzone in Tolo Harbour & Channel WCZ
Not to exceed 6mg/m3 (µg/L) calculated asrunning ar ithmetic mean of 5 dailymeasurements for any location and depth
Channel Subzone in Tolo Harbour & Channel WCZ
pH
Chlorophyll-a
Dissolved Oxygen(bottom)
Nutrients
E. coli
Salinity
Temperature
P 1.14MARINE WATER QUALITY IN HONG KONG IN 2004
1 INTRODUCTION
Table 1.2Table 1.2Table 1.2Table 1.2Table 1.2Summary of marine water quality parameters
Note: 1. Indicate general oceanographic conditions of marine water2. Low transparency and light penetration would affect aesthetic value and photosynthesis in marine water3. Indicate the amount of particulate organic matters in marine water4. Indicate the amount of organic pollutants in marine water5. Major nutrients (nitrogen, phosphorus, silica) promoting algal growth in marine water6. Indicate the amount of algal biomass in marine water7. Sewage bacteria indicate the extent of faecal pollution in marine water8. Measuring and reporting of Salinity (S) is based on the Practical Salinity Scale and International Equation of State of Seawater (UNESCO Technical Papers in Marine
Science No. 30 (1981) ; No. 36 (1981) and No. 45 (1985))9. Percent saturation of dissolved oxygen is calculated from dissolved oxygen in mg/L based on Weiss R.F. (1970); The solubility of nitrogen, oxygen ad argon in
water and seawater. Deep Sea Res. Vol. 17, pp.721-73510. Depth profiling � continuous measurements at downcast are processed and presented at 1m intervals from 1m below the surface to 1m above the seabed11. If water depth is 6m or above, sampling is taken at three depths during upcast: S - 1m below water surface; M - mid-depth of water column; B - 1m above
seabed. If water depth is 4 to 5 m, �M� is skipped; If water depth is 3m or less, �M� and �B� are skipped.12. i) Bower C.E. and Bidwell J.P. (1978), Ionization of ammonia in seawater: Effect of temperature, pH and salinity. J. Fish. Res. Board Can. Vol.35, pp.1012-1016;
ii) K., Russo R.C. & et. al. (1975), Aqueous ammonia equilibrium calculations: effect of pH and temperature. J. Fish. Res. Board Can. Vol.32, pp.2379-238313. Total Inorganic Nitrogen = Ammonia Nitrogen + Nitrite Nitrogen + Nitrate Nitrogen ; Total Nitrogen = Total Kjeldahl Nitrogen (soluble & particulate) + Nitrite
Nitrogen + Nitrate Nitrogen14. i) DoE, DHSS & PHLS (1983); The Bacteriological Examination of Drinking Water Supplies 1982, Sec.7.8 & 7.9;
ii) B.S.W. Ho and T.Y. Tam (1997), Enumeration of E. coli in environmental waters and wastewater using a chromogenic medium. Wat. Sci. Tech.Vol.35, No.11-12, pp.409-413; method adopted in 1997.
15. MMT/EPD � Marine Monitoring Team, Waste & Water Science Group, Environmental Protection Department.16. EML/EPD � Environmental Microbiology Laboratory, Waste & Water Science Group, Environmental Protection Department.17. WSL/EPD � Water Sciences Laboratory, Waste & Water Science Group, Environmental Protection Department18. GL � Environmental Chemistry B Section, Environmental Chemistry & Other Scientific Services Group, Government Laboratory.19. i) Lund, J.H., Kipling, C. and Le Cren, E.D. 1958. The inverted microscope method of estimating algal numbers, and the statistical basis of estimations by
counting. Hydrobiologia Vol. 11, pp. 143-170.ii) Utermohl, H. 1958. Zur Vervollkommung der Quantitativen Phytoplankton-Methodik. Mitt. Inter. Verein. Lim. Vol. 9, pp. 1-38.
20. Mention of brand names and commercial products does not constitute or imply endorsement or recommendation by the Environmental Protection Department.
Un i tRep o r t i ng
L im i t
Sam pl i n g
Dep t hSt an dar d Met h od / Techn iqu es u sed 20
Anal ysed
b y
Temperature1 °C 0.1 Depth Profiling10 Instrumental (thermistor), SEACAT19+ CTD and Water Quality Profiler MMT/EPD15
Salinity 1,8 - 0.1 Depth ProfilingInstrumental (electrical conductivity), SEACAT19+ CTD and Water QualityProfiler
MMT/EPD
mg/L 0.1% saturation 9 1
Turbidity 2 NTU 0.1 Depth ProfilingInstrumental (nephelometric / infrared back scattering), OBS-3 turbiditysensor linked to SEACAT 19+ CTD and Water Quality Profiler
MMT/EPD
pH1 - 0.1 Depth ProfilingInstrumental (electrodemetric) SBE18 pH sensor linked to SEACAT19 +CTD and Water Quality Profiler
MMT/EPD
Secchi Disc Depth2 m 0.1 --- Manual MMT/EPDSuspended Solids2 mg/L 0.5 S,M,B11 In house method GL-PH-23, based on APHA 20ed. 2540D (weighing) GL18
Volatile SuspendedSolids3
mg/L 0.5 S,M,B In house method GL-PH-23, based on APHA 20ed. 2540E (weighing) GL
AggregateOrganicConstituents
5-day BiochemicalOx y gen Demand(BOD5)
4
mg/L 0.1 S,M,B In house method based on APHA 18ed. 5210B EML/EPD16
Ammonia Nitrogen5 mg/L 0.005 S,M,B In house method GL-IN-15, based on ASTM D3590-89 B (FIA) GLUnionised Ammonia5 mg/L 0.001 S,M,B By calculation12 MMT/EPDNitrite Nitrogen5 mg/L 0.002 S,M,B In house method GL-IN-18, based on APHA 20ed. 4500-NO2- B (FIA) GLNitrate Nitrogen5 mg/L 0.002 S,M,B In house method GL-IN-18, based on APHA 20ed. 4500-NO3- F & I (FIA) GLTotal Inorganic Nitrogen5 mg/L 0.01 S,M,B By calculation13 MMT/EPDTotal Kjeldahl Nitrogen5
(soluble; soluble & particulate)mg/L 0.05 S,M,B In house method GL-IN-14 & GL-IN-15, based on ASTM D3590-89 B (FIA)
& APHA 20ed 4500-N A&D (FIA)GL
Total Nitrogen5 mg/L 0.05 S,M,B By calculation13 MMT/EPDOrthophosphate mg/L 0.002 S,M,B In house method GL-IN-16, based on ASTM D515-88 A (FIA) GLTotal Phosphorus5
(soluble; soluble & particulate)mg/L 0.02 S,M,B
In house method GL-IN-14 & GL-IN-16, based on ASTM D515-88 B (FIA) &APHA 20ed 4500-P G (FIA)
GL
Silica (as SiO2)(soluble) 5
mg/L 0.05 S,M,B In house method GL-IN-17, based on APHA 20ed. 4500-SiO2 C&E (FIA) GL
Chlorophy ll-a 6 µg/L 0.2 S,M,BIn house method GL-OR-34, based on APHA 20ed. 10200H 2(spectrophotometric)
GL
Escherichia coli(E. coli )7
count/100mL 1 S,M,BIn house method, membrane filtration with CHROMagar Liquid E. coli -coliform culture14
EML/EPD
Faecal Coliforms7 count/100mL 1 S,M,BIn house method, membrane filtration with CHROMagar Liquid E. coli -coliform culture14
EML/EPD
Phy toplankton cell/mL 1 SIn house method, 10 ml settled sub-sample using plankton chamber andinverted microscope19
WSL/EPD17
Nutrients andInorganicConstituents
Biological andMicrobiologicalExamination
Instrumental (membrane elelectrode), SBE23Y dissolved ox ygen sensorlinked to SEACAT19+ CTD and Water Quality ProfilerDepth Profiling
Par am et er
Dissolv ed Ox y gen1 MMT/EPD
Physical andAggregateProperties
P 1.15MARINE WATER QUALITY IN HONG KONG IN 2004
1 INTRODUCTION
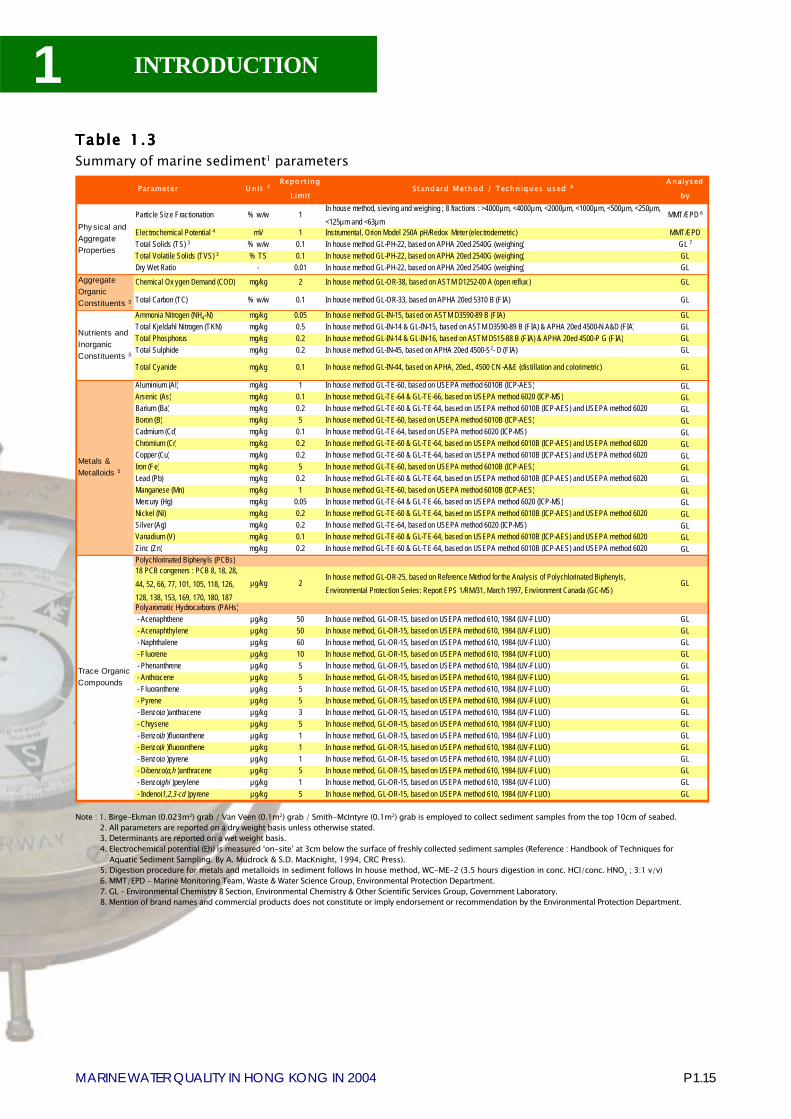
Table Table Table Table Table 1.1.1.1.1.33333Summary of marine sediment1 parameters
Note : 1. Birge-Ekman (0.023m2) grab / Van Veen (0.1m2) grab / Smith-McIntyre (0.1m2) grab is employed to collect sediment samples from the top 10cm of seabed.2. All parameters are reported on a dry weight basis unless otherwise stated.3. Determinants are reported on a wet weight basis.4. Electrochemical potential (Eh) is measured �on-site� at 3cm below the surface of freshly collected sediment samples (Reference : Handbook of Techniques for
Aquatic Sediment Sampling. By A. Mudrock & S.D. MacKnight, 1994, CRC Press).5. Digestion procedure for metals and metalloids in sediment follows In house method, WC-ME-2 (3.5 hours digestion in conc. HCl/conc. HNO3 ; 3:1 v/v)6. MMT/EPD - Marine Monitoring Team, Waste & Water Science Group, Environmental Protection Department.7. GL � Environmental Chemistry B Section, Environmental Chemistry & Other Scientific Services Group, Government Laboratory.8. Mention of brand names and commercial products does not constitute or imply endorsement or recommendation by the Environmental Protection Department.
U nit 2Report ing
LimitStandard Method / Techn iques used 8
A nalysed
by
Particle Size Fractionation % w/w 1In house method, sieving and weighing ; 8 fractions : >4000µm, <4000µm, <2000µm, <1000µm, <500µm, <250µm,<125µm and <63µm
MMT/EPD 6
Electrochemical Potential 4 mV 1 Instrumental, Orion Model 250A pH/Redox Meter (electrodemetric) MMT/EPDTotal Solids (TS) 3 % w/w 0.1 In house method GL-PH-22, based on APHA 20ed 2540G (weighing) GL 7
Total Volatile Solids (TVS) 3 % TS 0.1 In house method GL-PH-22, based on APHA 20ed 2540G (weighing) GLDry Wet Ratio - 0.01 In house method GL-PH-22, based on APHA 20ed 2540G (weighing) GL
Chemical Ox ygen Demand (COD) mg/kg 2 In house method GL-OR-38, based on ASTM D1252-00 A (open reflux ) GL
Total Carbon (TC) % w/w 0.1 In house method GL-OR-33, based on APHA 20ed 5310 B (FIA) GL
Ammonia Nitrogen (NH4-N) mg/kg 0.05 In house method GL-IN-15, based on ASTM D3590-89 B (FIA) GLTotal Kjeldahl Nitrogen (TKN) mg/kg 0.5 In house method GL-IN-14 & GL-IN-15, based on ASTM D3590-89 B (FIA) & APHA 20ed 4500-N A&D (FIA) GLTotal Phosphorus mg/kg 0.2 In house method GL-IN-14 & GL-IN-16, based on ASTM D515-88 B (FIA) & APHA 20ed 4500-P G (FIA) GLTotal Sulphide mg/kg 0.2 In house method GL-IN-45, based on APHA 20ed 4500-S2- D (FIA) GL
Total Cyanide mg/kg 0.1 In house method GL-IN-44, based on APHA, 20ed., 4500 CN -A&E (distillation and colorimetric) GL
Aluminium (Al) mg/kg 1 In house method GL-TE-60, based on USEPA method 6010B (ICP-AES) GLArsenic (As) mg/kg 0.1 In house method GL-TE-64 & GL-TE-66, based on USEPA method 6020 (ICP-MS) GLBarium (Ba) mg/kg 0.2 In house method GL-TE-60 & GL-TE-64, based on USEPA method 6010B (ICP-AES) and USEPA method 6020 GLBoron (B) mg/kg 5 In house method GL-TE-60, based on USEPA method 6010B (ICP-AES) GLCadmium (Cd) mg/kg 0.1 In house method GL-TE-64, based on USEPA method 6020 (ICP-MS) GLChromium (Cr) mg/kg 0.2 In house method GL-TE-60 & GL-TE-64, based on USEPA method 6010B (ICP-AES) and USEPA method 6020 GLCopper (Cu) mg/kg 0.2 In house method GL-TE-60 & GL-TE-64, based on USEPA method 6010B (ICP-AES) and USEPA method 6020 GLIron (Fe) mg/kg 5 In house method GL-TE-60, based on USEPA method 6010B (ICP-AES) GLLead (Pb) mg/kg 0.2 In house method GL-TE-60 & GL-TE-64, based on USEPA method 6010B (ICP-AES) and USEPA method 6020 GLManganese (Mn) mg/kg 1 In house method GL-TE-60, based on USEPA method 6010B (ICP-AES) GLMercury (Hg) mg/kg 0.05 In house method GL-TE-64 & GL-TE-66, based on USEPA method 6020 (ICP-MS) GLNickel (Ni) mg/kg 0.2 In house method GL-TE-60 & GL-TE-64, based on USEPA method 6010B (ICP-AES) and USEPA method 6020 GLSilver (Ag) mg/kg 0.2 In house method GL-TE-64, based on USEPA method 6020 (ICP-MS) GLVanadium (V) mg/kg 0.1 In house method GL-TE-60 & GL-TE-64, based on USEPA method 6010B (ICP-AES) and USEPA method 6020 GLZinc (Zn) mg/kg 0.2 In house method GL-TE-60 & GL-TE-64, based on USEPA method 6010B (ICP-AES) and USEPA method 6020 GLPolychlorinated Biphenyls (PCBs)18 PCB congeners : PCB 8, 18, 28,44, 52, 66, 77, 101, 105, 118, 126,128, 138, 153, 169, 170, 180, 187
µg/kg 2In house method GL-OR-25, based on Reference Method for the Analysis of Polychlorinated Biphenyls,Environmental Protection Series: Report EPS 1/RM/31, March 1997, Environment Canada (GC-MS)
GL
Polyaromatic Hydrocarbons (PAHs) - Acenaphthene µg/kg 50 In house method, GL-OR-15, based on USEPA method 610, 1984 (UV-FLUO) GL - Acenaphthylene µg/kg 50 In house method, GL-OR-15, based on USEPA method 610, 1984 (UV-FLUO) GL - Naphthalene µg/kg 60 In house method, GL-OR-15, based on USEPA method 610, 1984 (UV-FLUO) GL - Fluorene µg/kg 10 In house method, GL-OR-15, based on USEPA method 610, 1984 (UV-FLUO) GL - Phenanthrene µg/kg 5 In house method, GL-OR-15, based on USEPA method 610, 1984 (UV-FLUO) GL - Anthracene µg/kg 5 In house method, GL-OR-15, based on USEPA method 610, 1984 (UV-FLUO) GL - Fluoranthene µg/kg 5 In house method, GL-OR-15, based on USEPA method 610, 1984 (UV-FLUO) GL - Pyrene µg/kg 5 In house method, GL-OR-15, based on USEPA method 610, 1984 (UV-FLUO) GL - Benzo(a )anthracene µg/kg 3 In house method, GL-OR-15, based on USEPA method 610, 1984 (UV-FLUO) GL - Chrysene µg/kg 5 In house method, GL-OR-15, based on USEPA method 610, 1984 (UV-FLUO) GL - Benzo(b )fluoranthene µg/kg 1 In house method, GL-OR-15, based on USEPA method 610, 1984 (UV-FLUO) GL - Benzo(k )fluoranthene µg/kg 1 In house method, GL-OR-15, based on USEPA method 610, 1984 (UV-FLUO) GL - Benzo(a )pyrene µg/kg 1 In house method, GL-OR-15, based on USEPA method 610, 1984 (UV-FLUO) GL - Dibenzo(a,h )anthracene µg/kg 5 In house method, GL-OR-15, based on USEPA method 610, 1984 (UV-FLUO) GL - Benzo(ghi )perylene µg/kg 1 In house method, GL-OR-15, based on USEPA method 610, 1984 (UV-FLUO) GL - Indeno(1,2,3-cd )pyrene µg/kg 5 In house method, GL-OR-15, based on USEPA method 610, 1984 (UV-FLUO) GL
Metals &Metalloids 5
Trace OrganicCompounds
Parameter
Phy sical andAggregateProperties
AggregateOrganicConstituents 3
Nutrients andInorganicConstituents 3
P 1.16MARINE WATER QUALITY IN HONG KONG IN 2004
1 INTRODUCTION
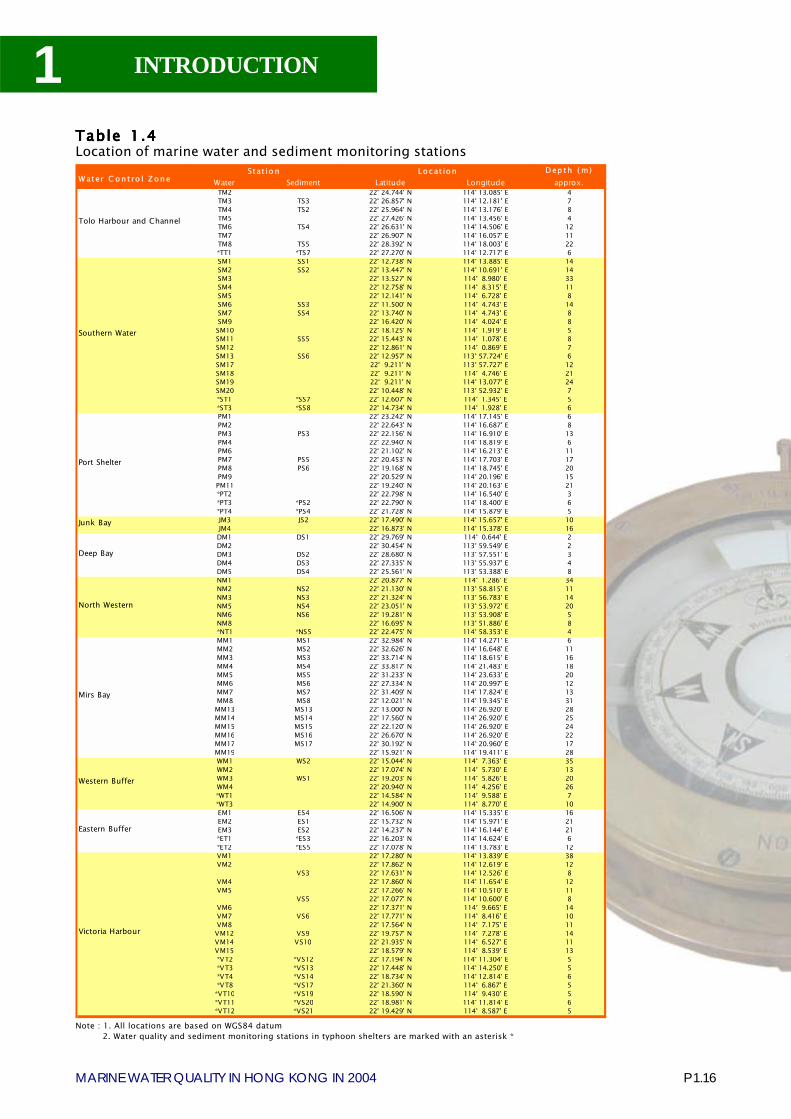
Note : 1. All locations are based on WGS84 datum 2. Water quality and sediment monitoring stations in typhoon shelters are marked with an asterisk *
Table 1.4Table 1.4Table 1.4Table 1.4Table 1.4Location of marine water and sediment monitoring stations
D ep th ( m)Water Sediment Latitude Longitude approx.TM2 22° 24.744' N 114° 13.085' E 4TM3 TS3 22° 26.857' N 114° 12.181' E 7TM4 TS2 22° 25.964' N 114° 13.176' E 8TM5 22° 27.426' N 114° 13.456' E 4TM6 TS4 22° 26.631' N 114° 14.506' E 12TM7 22° 26.907' N 114° 16.057' E 11TM8 TS5 22° 28.392' N 114° 18.003' E 22*TT1 *TS7 22° 27.270' N 114° 12.717' E 6SM1 SS1 22° 12.738' N 114° 13.885' E 14SM2 SS2 22° 13.447' N 114° 10.691' E 14SM3 22° 13.527' N 114° 8.980' E 33SM4 22° 12.758' N 114° 8.315' E 11SM5 22° 12.141' N 114° 6.728' E 8SM6 SS3 22° 11.500' N 114° 4.743' E 14SM7 SS4 22° 13.740' N 114° 4.743' E 8SM9 22° 16.420' N 114° 4.024' E 8SM10 22° 18.125' N 114° 1.919' E 5SM11 SS5 22° 15.443' N 114° 1.078' E 8SM12 22° 12.861' N 114° 0.869' E 7SM13 SS6 22° 12.957' N 113° 57.724' E 6SM17 22° 9.211' N 113° 57.727' E 12SM18 22° 9.211' N 114° 4.746' E 21SM19 22° 9.211' N 114° 13.077' E 24SM20 22° 10.448' N 113° 52.932' E 7*ST1 *SS7 22° 12.607' N 114° 1.345' E 5*ST3 *SS8 22° 14.734' N 114° 1.928' E 6PM1 22° 23.242' N 114° 17.145' E 6PM2 22° 22.643' N 114° 16.687' E 8PM3 PS3 22° 22.156' N 114° 16.910' E 13PM4 22° 22.940' N 114° 18.819' E 6PM6 22° 21.102' N 114° 16.213' E 11PM7 PS5 22° 20.453' N 114° 17.703' E 17PM8 PS6 22° 19.168' N 114° 18.745' E 20PM9 22° 20.529' N 114° 20.196' E 15PM11 22° 19.240' N 114° 20.163' E 21*PT2 22° 22.798' N 114° 16.540' E 3*PT3 *PS2 22° 22.790' N 114° 18.400' E 6*PT4 *PS4 22° 21.728' N 114° 15.879' E 5JM3 JS2 22° 17.490' N 114° 15.657' E 10JM4 22° 16.873' N 114° 15.378' E 16DM1 DS1 22° 29.769' N 114° 0.644' E 2DM2 22° 30.454' N 113° 59.549' E 2DM3 DS2 22° 28.680' N 113° 57.551' E 3DM4 DS3 22° 27.335' N 113° 55.937' E 4DM5 DS4 22° 25.561' N 113° 53.388' E 8NM1 22° 20.877' N 114° 1.286' E 34NM2 NS2 22° 21.130' N 113° 58.815' E 11NM3 NS3 22° 21.324' N 113° 56.783' E 14NM5 NS4 22° 23.051' N 113° 53.972' E 20NM6 NS6 22° 19.281' N 113° 53.908' E 5NM8 22° 16.695' N 113° 51.886' E 8*NT1 *NS5 22° 22.475' N 114° 58.353' E 4MM1 MS1 22° 32.984' N 114° 14.271' E 6MM2 MS2 22° 32.626' N 114° 16.648' E 11MM3 MS3 22° 33.714' N 114° 18.615' E 16MM4 MS4 22° 33.817' N 114° 21.483' E 18MM5 MS5 22° 31.233' N 114° 23.633' E 20MM6 MS6 22° 27.334' N 114° 20.997' E 12MM7 MS7 22° 31.409' N 114° 17.824' E 13MM8 MS8 22° 12.021' N 114° 19.345' E 31MM13 MS13 22° 13.000' N 114° 26.920' E 28MM14 MS14 22° 17.560' N 114° 26.920' E 25MM15 MS15 22° 22.120' N 114° 26.920' E 24MM16 MS16 22° 26.670' N 114° 26.920' E 22MM17 MS17 22° 30.192' N 114° 20.960' E 17MM19 22° 15.921' N 114° 19.411' E 28WM1 WS2 22° 15.044' N 114° 7.363' E 35WM2 22° 17.074' N 114° 5.730' E 13WM3 WS1 22° 19.203' N 114° 5.826' E 20WM4 22° 20.940' N 114° 4.256' E 26*WT1 22° 14.584' N 114° 9.588' E 7*WT3 22° 14.900' N 114° 8.770' E 10EM1 ES4 22° 16.506' N 114° 15.335' E 16EM2 ES1 22° 15.732' N 114° 15.971' E 21EM3 ES2 22° 14.237' N 114° 16.144' E 21*ET1 *ES3 22° 16.203' N 114° 14.624' E 6*ET2 *ES5 22° 17.078' N 114° 13.783' E 12VM1 22° 17.280' N 114° 13.839' E 38VM2 22° 17.862' N 114° 12.619' E 12
VS3 22° 17.631' N 114° 12.526' E 8VM4 22° 17.860' N 114° 11.654' E 12VM5 22° 17.266' N 114° 10.510' E 11
VS5 22° 17.077' N 114° 10.600' E 8VM6 22° 17.371' N 114° 9.665' E 14VM7 VS6 22° 17.771' N 114° 8.416' E 10VM8 22° 17.564' N 114° 7.175' E 11VM12 VS9 22° 19.757' N 114° 7.278' E 14VM14 VS10 22° 21.935' N 114° 6.527' E 11VM15 22° 18.579' N 114° 8.539' E 13*VT2 *VS12 22° 17.194' N 114° 11.304' E 5*VT3 *VS13 22° 17.448' N 114° 14.250' E 5*VT4 *VS14 22° 18.734' N 114° 12.814' E 6*VT8 *VS17 22° 21.360' N 114° 6.867' E 5*VT10 *VS19 22° 18.590' N 114° 9.430' E 5*VT11 *VS20 22° 18.981' N 114° 11.814' E 6*VT12 *VS21 22° 19.429' N 114° 8.587' E 5
W ater C on t ro l Z on eStat io n Locat ion
Southern Water
Tolo Harbour and Channel
Eastern Buffer
Victoria Harbour
Port Shelter
Junk Bay
Deep Bay
North Western
Mirs Bay
Western Buffer
2
P 2.2MARINE WATER QUALITY IN HONG KONG IN 2004
EASTERN WATERS
Chapter 2 – Eastern Waters
Water Quality in 2004
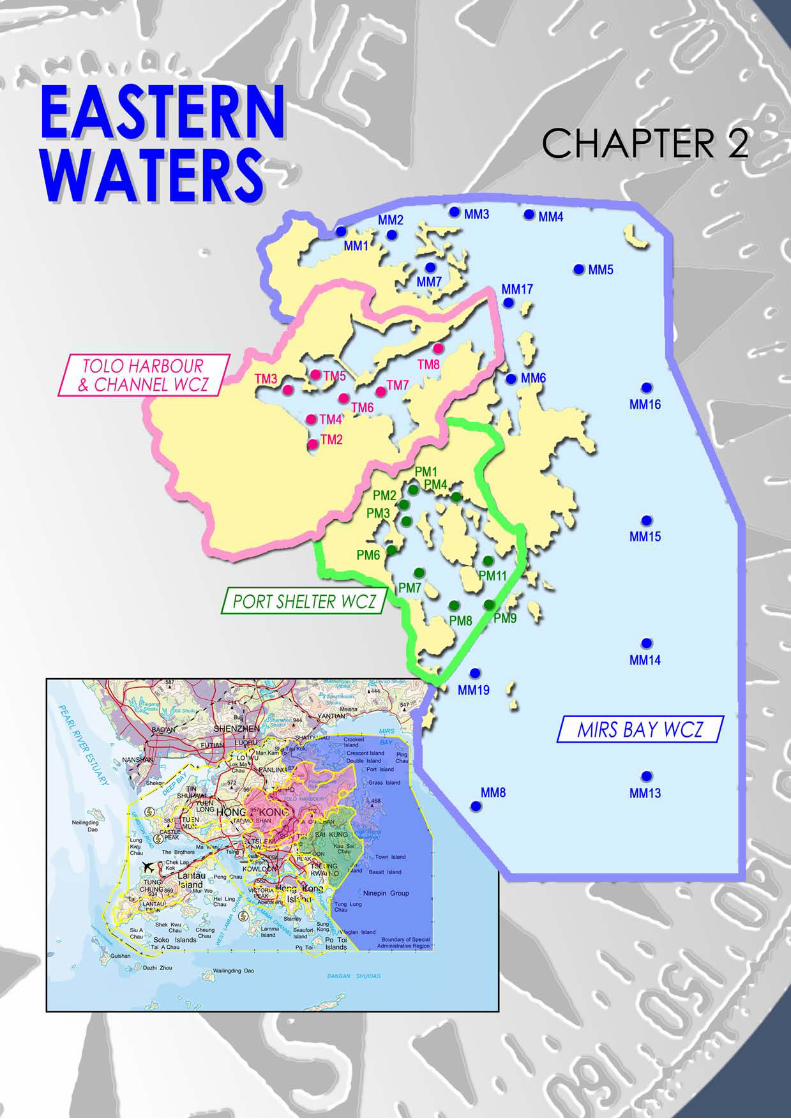
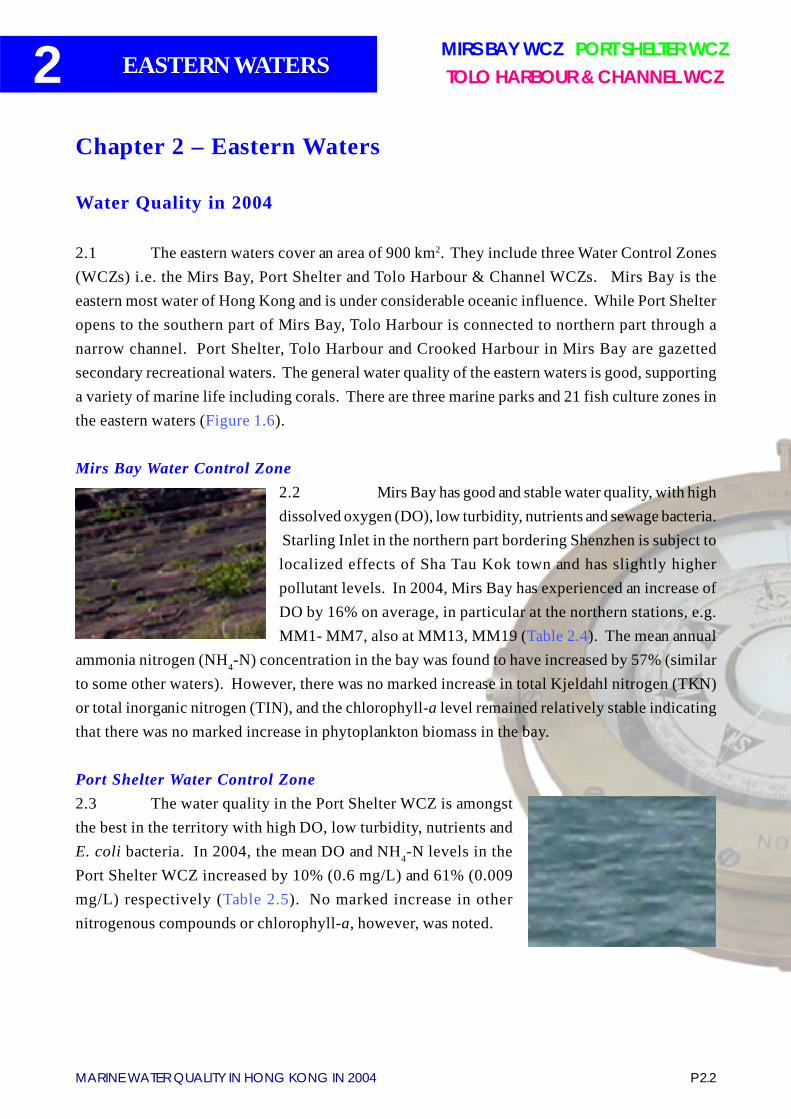
2.1 The eastern waters cover an area of 900 km2. They include three Water Control Zones(WCZs) i.e. the Mirs Bay, Port Shelter and Tolo Harbour & Channel WCZs. Mirs Bay is theeastern most water of Hong Kong and is under considerable oceanic influence. While Port Shelteropens to the southern part of Mirs Bay, Tolo Harbour is connected to northern part through anarrow channel. Port Shelter, Tolo Harbour and Crooked Harbour in Mirs Bay are gazettedsecondary recreational waters. The general water quality of the eastern waters is good, supportinga variety of marine life including corals. There are three marine parks and 21 fish culture zones inthe eastern waters (Figure 1.6).
Mirs Bay Water Control Zone2.2 Mirs Bay has good and stable water quality, with highdissolved oxygen (DO), low turbidity, nutrients and sewage bacteria. Starling Inlet in the northern part bordering Shenzhen is subject tolocalized effects of Sha Tau Kok town and has slightly higherpollutant levels. In 2004, Mirs Bay has experienced an increase ofDO by 16% on average, in particular at the northern stations, e.g.MM1- MM7, also at MM13, MM19 (Table 2.4). The mean annual
ammonia nitrogen (NH4-N) concentration in the bay was found to have increased by 57% (similarto some other waters). However, there was no marked increase in total Kjeldahl nitrogen (TKN)or total inorganic nitrogen (TIN), and the chlorophyll-a level remained relatively stable indicatingthat there was no marked increase in phytoplankton biomass in the bay.
Port Shelter Water Control Zone2.3 The water quality in the Port Shelter WCZ is amongstthe best in the territory with high DO, low turbidity, nutrients andE. coli bacteria. In 2004, the mean DO and NH4-N levels in thePort Shelter WCZ increased by 10% (0.6 mg/L) and 61% (0.009mg/L) respectively (Table 2.5). No marked increase in othernitrogenous compounds or chlorophyll-a, however, was noted.
MIRS BAY WCZ PORT SHELTER WCZTOLO HARBOUR & CHANNEL WCZ
iwp12
印章
iwp12
印章
P 2.3MARINE WATER QUALITY IN HONG KONG IN 2004
2 EASTERN WATERS
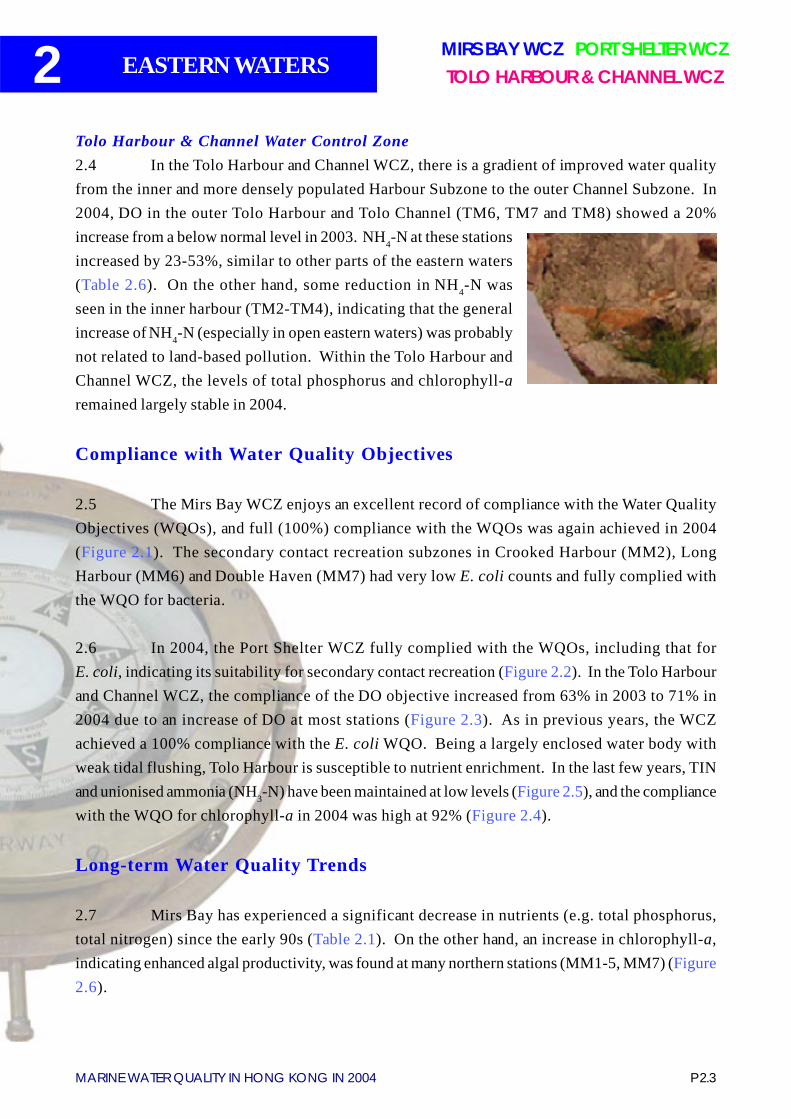
Tolo Harbour & Channel Water Control Zone2.4 In the Tolo Harbour and Channel WCZ, there is a gradient of improved water qualityfrom the inner and more densely populated Harbour Subzone to the outer Channel Subzone. In2004, DO in the outer Tolo Harbour and Tolo Channel (TM6, TM7 and TM8) showed a 20%increase from a below normal level in 2003. NH4-N at these stationsincreased by 23-53%, similar to other parts of the eastern waters(Table 2.6). On the other hand, some reduction in NH4-N wasseen in the inner harbour (TM2-TM4), indicating that the generalincrease of NH4-N (especially in open eastern waters) was probablynot related to land-based pollution. Within the Tolo Harbour andChannel WCZ, the levels of total phosphorus and chlorophyll-aremained largely stable in 2004.
Compliance with Water Quality Objectives
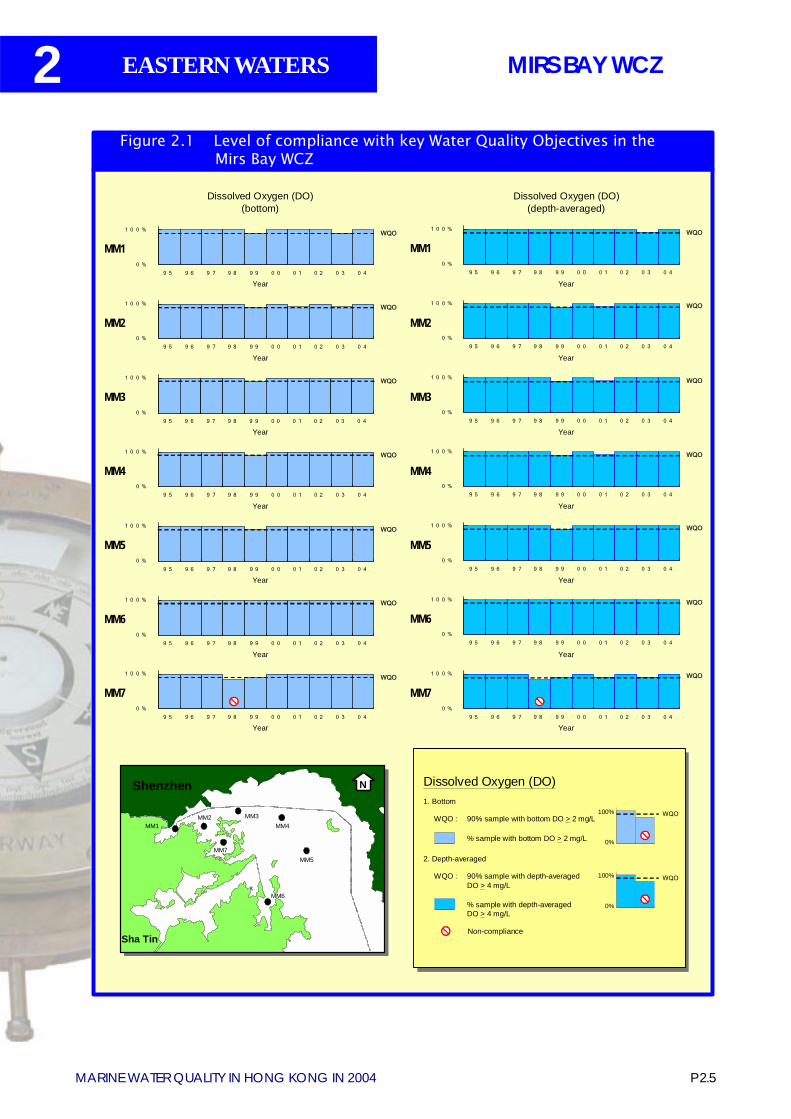
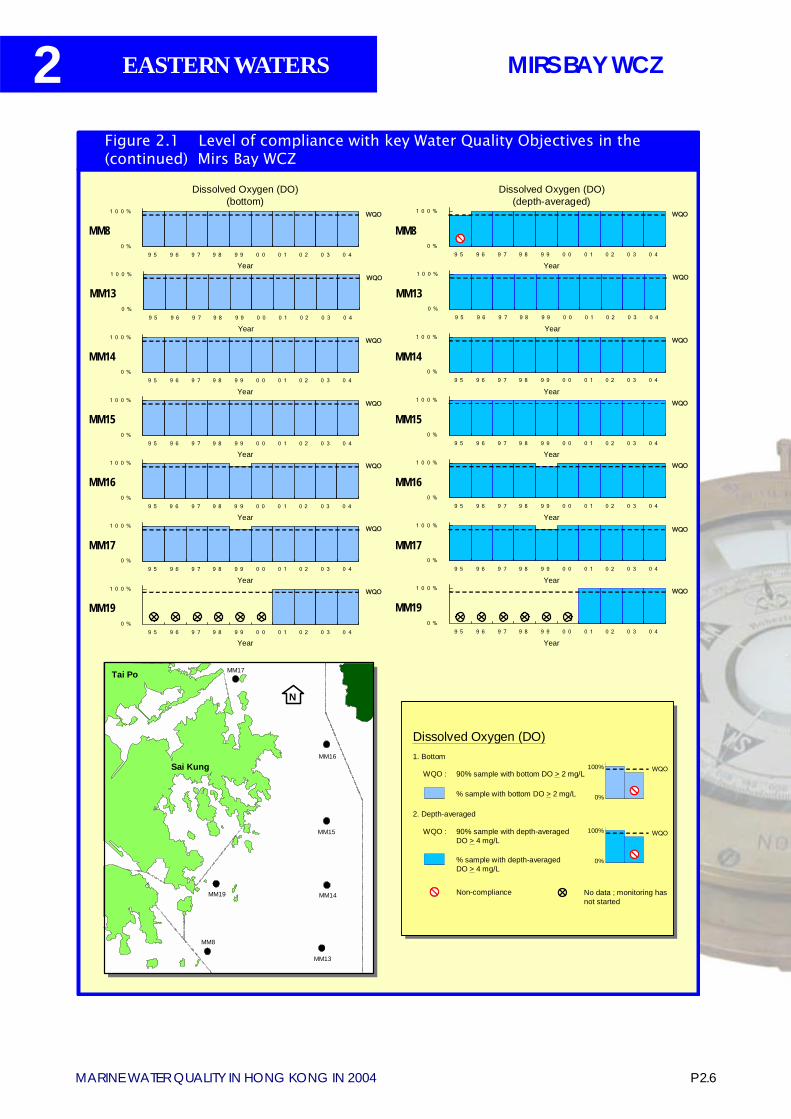
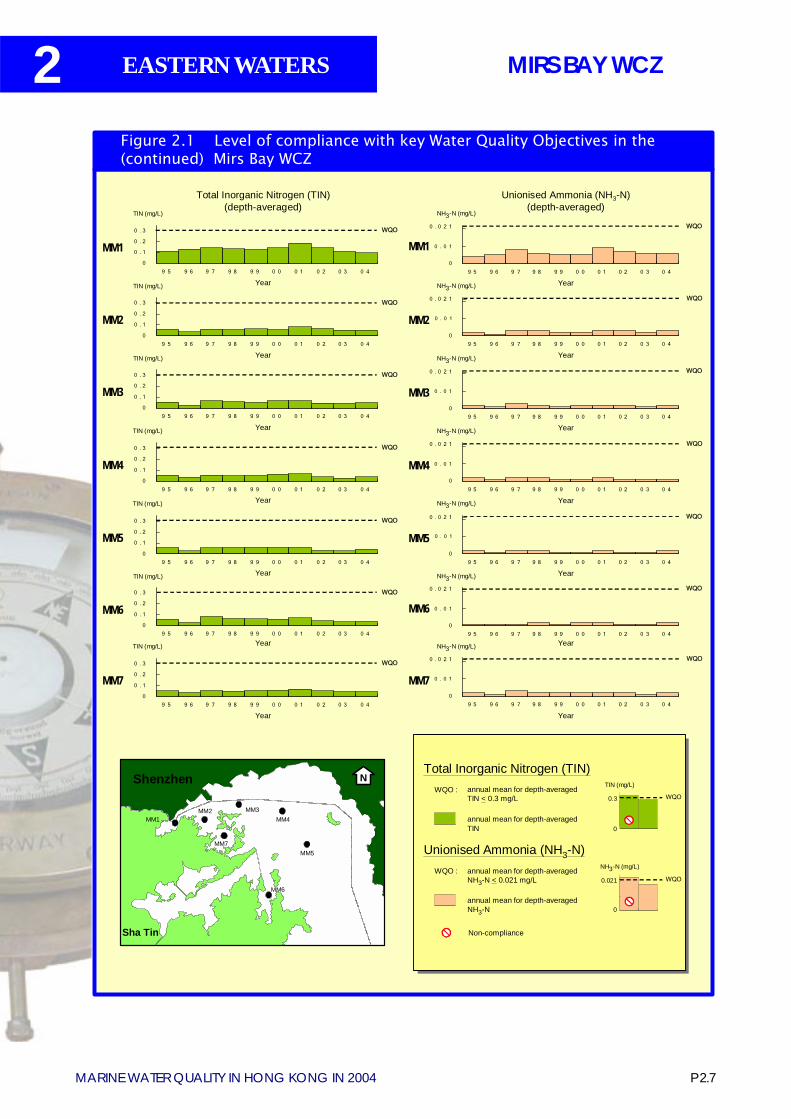
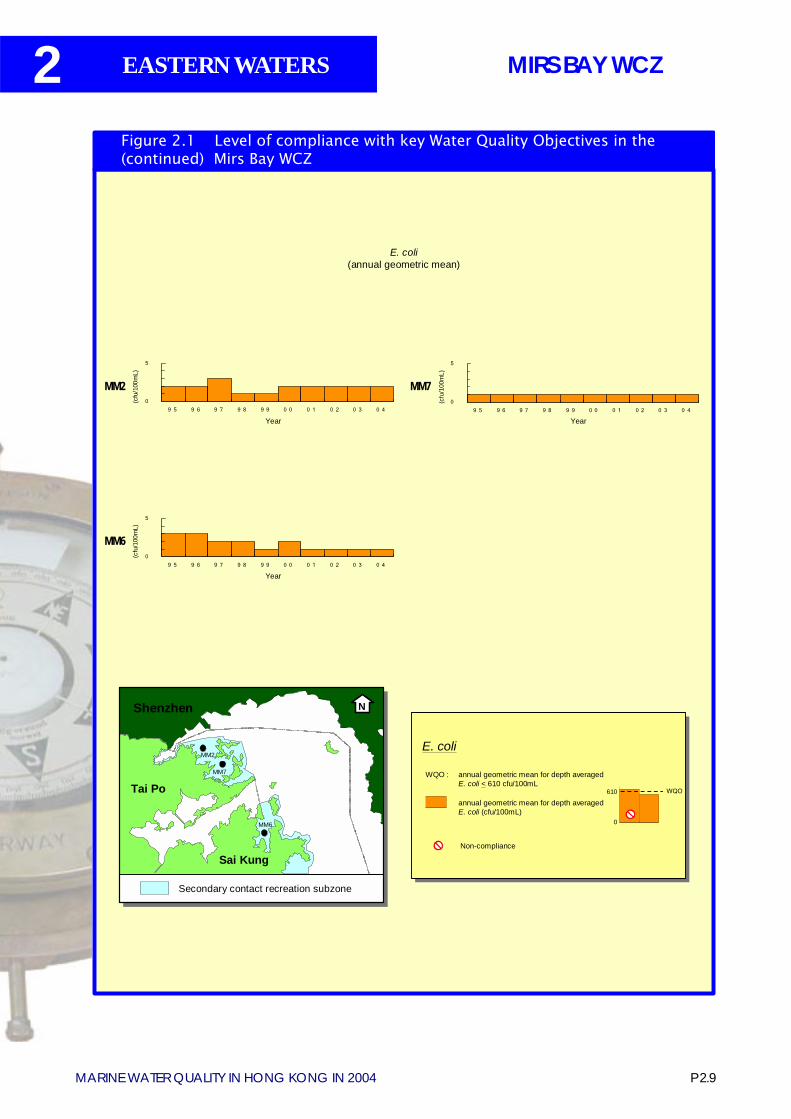
2.5 The Mirs Bay WCZ enjoys an excellent record of compliance with the Water QualityObjectives (WQOs), and full (100%) compliance with the WQOs was again achieved in 2004(Figure 2.1). The secondary contact recreation subzones in Crooked Harbour (MM2), LongHarbour (MM6) and Double Haven (MM7) had very low E. coli counts and fully complied withthe WQO for bacteria.
2.6 In 2004, the Port Shelter WCZ fully complied with the WQOs, including that forE. coli, indicating its suitability for secondary contact recreation (Figure 2.2). In the Tolo Harbourand Channel WCZ, the compliance of the DO objective increased from 63% in 2003 to 71% in2004 due to an increase of DO at most stations (Figure 2.3). As in previous years, the WCZachieved a 100% compliance with the E. coli WQO. Being a largely enclosed water body withweak tidal flushing, Tolo Harbour is susceptible to nutrient enrichment. In the last few years, TINand unionised ammonia (NH3-N) have been maintained at low levels (Figure 2.5), and the compliancewith the WQO for chlorophyll-a in 2004 was high at 92% (Figure 2.4).
Long-term Water Quality Trends
2.7 Mirs Bay has experienced a significant decrease in nutrients (e.g. total phosphorus,total nitrogen) since the early 90s (Table 2.1). On the other hand, an increase in chlorophyll-a,indicating enhanced algal productivity, was found at many northern stations (MM1-5, MM7) (Figure2.6).
MIRS BAY WCZ PORT SHELTER WCZTOLO HARBOUR & CHANNEL WCZ
iwp12
印章
2
P 2.4MARINE WATER QUALITY IN HONG KONG IN 2004
EASTERN WATERSMIRS BAY WCZ PORT SHELTER WCZTOLO HARBOUR & CHANNEL WCZ
2.8 The water quality of Port Shelter showed notable improvements since the mid-80s dueto provision of sewage infrastructure and implementation of pollution control measures in thecatchment. Decreasing trends in total Kjeldahl nitrogen, total nitrogen and total phosphorus werenoted at most monitoring stations of the bay (Table 2.2 and Figure 2.6).
2.9 As a result of the implementation of the Tolo Harbour Action Plan, the pollution problemsin Tolo Harbour have been controlled and the water quality showed steady improvements in thelast two decades. Significant decreases in BOD5 (organic pollutants), E. coli, nitrogen and phosphatewere evident (Table 2.3 and Figure 2.6), while chlorophyll-a in the harbour remained relativelystable.
P 2.5MARINE WATER QUALITY IN HONG KONG IN 2004
2 EASTERN WATERS
Dissolved Oxygen (DO)(bottom)
Dissolved Oxygen (DO)(depth-averaged)
0 %
1 0 0 %
9 5 9 6 9 7 9 8 9 9 0 0 0 1 0 2 0 3 0 4
MM1WQO
Year
0 %
1 0 0 %
9 5 9 6 9 7 9 8 9 9 0 0 0 1 0 2 0 3 0 4
MM1WQO
Year
0 %
1 0 0 %
9 5 9 6 9 7 9 8 9 9 0 0 0 1 0 2 0 3 0 4
MM2WQO
Year
0 %
1 0 0 %
9 5 9 6 9 7 9 8 9 9 0 0 0 1 0 2 0 3 0 4
MM2WQO
Year
0 %
1 0 0 %
9 5 9 6 9 7 9 8 9 9 0 0 0 1 0 2 0 3 0 4
MM5WQO
Year
0 %
1 0 0 %
9 5 9 6 9 7 9 8 9 9 0 0 0 1 0 2 0 3 0 4
MM5WQO
Year
Non-compliance
Dissolved Oxygen (DO)
% sample with bottom DO > 2 mg/L
90% sample with bottom DO > 2 mg/LWQO :
2. Depth-averaged
1. Bottom
90% sample with depth-averagedDO > 4 mg/L
WQO :
% sample with depth-averagedDO > 4 mg/L
WQO
WQO
N
MM1MM2 MM3
MM4
MM7MM5
Sha Tin
Shenzhen
0 %
1 0 0 %
9 5 9 6 9 7 9 8 9 9 0 0 0 1 0 2 0 3 0 4
MM3WQO
Year
0 %
1 0 0 %
9 5 9 6 9 7 9 8 9 9 0 0 0 1 0 2 0 3 0 4
MM3WQO
Year
0 %
1 0 0 %
9 5 9 6 9 7 9 8 9 9 0 0 0 1 0 2 0 3 0 4
MM7WQO
Year
0 %
1 0 0 %
9 5 9 6 9 7 9 8 9 9 0 0 0 1 0 2 0 3 0 4
MM7WQO
Year
0 %
1 0 0 %
9 5 9 6 9 7 9 8 9 9 0 0 0 1 0 2 0 3 0 4
MM4WQO
Year
0 %
1 0 0 %
9 5 9 6 9 7 9 8 9 9 0 0 0 1 0 2 0 3 0 4
MM4
Year
WQO
0 %
1 0 0 %
9 5 9 6 9 7 9 8 9 9 0 0 0 1 0 2 0 3 0 4
0 %
1 0 0 %
9 5 9 6 9 7 9 8 9 9 0 0 0 1 0 2 0 3 0 4
MM6WQO
Year
MM6WQO
Year
MM6
100%
0%
100%
0%
Figure 2.1 Level of compliance with key Water Quality Objectives in the Mirs Bay WCZ
MIRS BAY WCZ
2
P 2.6MARINE WATER QUALITY IN HONG KONG IN 2004
EASTERN WATERS
Dissolved Oxygen (DO)(bottom)
Dissolved Oxygen (DO)(depth-averaged)
0 %
1 0 0 %
9 5 9 6 9 7 9 8 9 9 0 0 0 1 0 2 0 3 0 4
MM8WQO
Year
0 %
1 0 0 %
9 5 9 6 9 7 9 8 9 9 0 0 0 1 0 2 0 3 0 4
MM8WQO
Year
0 %
1 0 0 %
9 5 9 6 9 7 9 8 9 9 0 0 0 1 0 2 0 3 0 4
MM13WQO
Year
0 %
1 0 0 %
9 5 9 6 9 7 9 8 9 9 0 0 0 1 0 2 0 3 0 4
MM13WQO
Year
0 %
1 0 0 %
9 5 9 6 9 7 9 8 9 9 0 0 0 1 0 2 0 3 0 4
MM17WQO
Year
0 %
1 0 0 %
9 5 9 6 9 7 9 8 9 9 0 0 0 1 0 2 0 3 0 4
MM17WQO
Year
0 %
1 0 0 %
9 5 9 6 9 7 9 8 9 9 0 0 0 1 0 2 0 3 0 4
MM14WQO
Year
0 %
1 0 0 %
9 5 9 6 9 7 9 8 9 9 0 0 0 1 0 2 0 3 0 4
MM14WQO
Year
0 %
1 0 0 %
9 5 9 6 9 7 9 8 9 9 0 0 0 1 0 2 0 3 0 4
MM15WQO
Year
0 %
1 0 0 %
9 5 9 6 9 7 9 8 9 9 0 0 0 1 0 2 0 3 0 4
MM15WQO
Year
0 %
1 0 0 %
9 5 9 6 9 7 9 8 9 9 0 0 0 1 0 2 0 3 0 4
MM16WQO
Year
0 %
1 0 0 %
9 5 9 6 9 7 9 8 9 9 0 0 0 1 0 2 0 3 0 4
MM16WQO
Year
0 %
1 0 0 %
9 5 9 6 9 7 9 8 9 9 0 0 0 1 0 2 0 3 0 4
0 %
1 0 0 %
9 5 9 6 9 7 9 8 9 9 0 0 0 1 0 2 0 3 0 4
MM19WQO
Year
MM19WQO
Year
Tai Po
Sai Kung
MM17
MM8
MM15
MM14
MM16
MM13
N
Non-compliance No data ; monitoring hasnot started
Dissolved Oxygen (DO)
% sample with bottom DO > 2 mg/L
90% sample with bottom DO > 2 mg/LWQO :
2. Depth-averaged
1. Bottom
90% sample with depth-averagedDO > 4 mg/L
WQO :
% sample with depth-averagedDO > 4 mg/L
WQO
WQO
MM19
100%
0%
100%
0%
Figure 2.1 Level of compliance with key Water Quality Objectives in the (continued) Mirs Bay WCZ
MIRS BAY WCZ
P 2.7MARINE WATER QUALITY IN HONG KONG IN 2004
2 EASTERN WATERS
Total Inorganic Nitrogen (TIN)(depth-averaged)
Unionised Ammonia (NH3-N)(depth-averaged)
N
MM1MM2 MM3
MM4
MM7MM5
Sha Tin
ShenzhenTotal Inorganic Nitrogen (TIN)
annual mean for depth-averagedTIN
annual mean for depth-averagedTIN < 0.3 mg/L
WQO :
annual mean for depth-averagedNH3-N < 0.021 mg/L
WQO :
Non-compliance
annual mean for depth-averagedNH3-N
Unionised Ammonia (NH3-N)
0
0.3 WQO
TIN (mg/L)
0
0.021 WQO
NH3-N (mg/L)
0
0 . 0 2 1
9 5 9 6 9 7 9 8 9 9 0 0 0 1 0 2 0 3 0 4
Year
NH3-N (mg/L)
WQO
MM10
0 . 1
0 . 2
0 . 3
9 5 9 6 9 7 9 8 9 9 0 0 0 1 0 2 0 3 0 4
MM1
Year
TIN (mg/L)
WQO
0
0 . 0 2 1
9 5 9 6 9 7 9 8 9 9 0 0 0 1 0 2 0 3 0 4
MM2
Year
NH3-N (mg/L)
WQO
0
0 . 1
0 . 2
0 . 3
9 5 9 6 9 7 9 8 9 9 0 0 0 1 0 2 0 3 0 4
MM2
Year
TIN (mg/L)
WQO
0
0 . 0 2 1
9 5 9 6 9 7 9 8 9 9 0 0 0 1 0 2 0 3 0 4
MM3
Year
NH3-N (mg/L)
WQO
0
0 . 1
0 . 2
0 . 3
9 5 9 6 9 7 9 8 9 9 0 0 0 1 0 2 0 3 0 4
MM3
Year
TIN (mg/L)
WQO
0
0 . 0 2 1
9 5 9 6 9 7 9 8 9 9 0 0 0 1 0 2 0 3 0 4
MM4
Year
NH3-N (mg/L)
WQO
0
0 . 1
0 . 2
0 . 3
9 5 9 6 9 7 9 8 9 9 0 0 0 1 0 2 0 3 0 4
MM4
Year
TIN (mg/L)
WQO
NH3-N (mg/L)
MM50
0 . 0 2 1
9 5 9 6 9 7 9 8 9 9 0 0 0 1 0 2 0 3 0 4
Year
WQO
0
0 . 1
0 . 2
0 . 3
9 5 9 6 9 7 9 8 9 9 0 0 0 1 0 2 0 3 0 4
MM5
Year
TIN (mg/L)
WQO
0
0 . 0 2 1
9 5 9 6 9 7 9 8 9 9 0 0 0 1 0 2 0 3 0 4
MM7
Year
NH3-N (mg/L)
WQO
0
0 . 1
0 . 2
0 . 3
9 5 9 6 9 7 9 8 9 9 0 0 0 1 0 2 0 3 0 4
MM7
Year
TIN (mg/L)
WQO
0
0 . 0 2 1
9 5 9 6 9 7 9 8 9 9 0 0 0 1 0 2 0 3 0 4
0
0 . 1
0 . 2
0 . 3
9 5 9 6 9 7 9 8 9 9 0 0 0 1 0 2 0 3 0 4
Year
NH3-N (mg/L)
WQO
MM6MM6
Year
TIN (mg/L)
WQO
MM6
0.3
0
0.021
0
0 . 0 1
0 . 0 1
0 . 0 1
0 . 0 1
0 . 0 1
0 . 0 1
0 . 0 1
Figure 2.1 Level of compliance with key Water Quality Objectives in the (continued) Mirs Bay WCZ
MIRS BAY WCZ

2
P 2.8MARINE WATER QUALITY IN HONG KONG IN 2004
EASTERN WATERS
Total Inorganic Nitrogen (TIN)(depth-averaged)
Unionised Ammonia (NH3-N)(depth-averaged)
0
0 . 0 2 1
9 5 9 6 9 7 9 8 9 9 0 0 0 1 0 2 0 3 0 4
0
0 . 1
0 . 2
0 . 3
9 5 9 6 9 7 9 8 9 9 0 0 0 1 0 2 0 3 0 4
Year
NH3-N (mg/L)WQO
MM19MM19
Year
TIN (mg/L)
WQO
0 . 0 1
Non-compliance No data ; monitoring hasnot started
Total Inorganic Nitrogen (TIN)
annual mean for depth-averagedTIN
annual mean for depth-averagedTIN < 0.3 mg/L
WQO :
annual mean for depth-averagedNH3-N < 0.021 mg/L
WQO :
annual mean for depth-averagedNH3-N
Unionised Ammonia (NH3-N)
0
0.3 WQO
TIN (mg/L)
0
0.021 WQO
NH3-N (mg/L)
Tai Po MM17
MM8
MM15
MM14
MM16
MM13
N
MM19
Sai Kung 0.3
0
0.021
0
MM170
0 . 0 2 1
9 5 9 6 9 7 9 8 9 9 0 0 0 1 0 2 0 3 0 4
MM17
Year
NH3-N (mg/L)WQO
0
0 . 1
0 . 2
0 . 3
9 5 9 6 9 7 9 8 9 9 0 0 0 1 0 2 0 3 0 4
Year
TIN (mg/L)
WQO
0 . 0 1
0
0 . 1
0 . 2
0 . 3
9 5 9 6 9 7 9 8 9 9 0 0 0 1 0 2 0 3 0 4
0
0 . 0 2 1
9 5 9 6 9 7 9 8 9 9 0 0 0 1 0 2 0 3 0 4
MM16
Year
NH3-N (mg/L)WQO
MM16
Year
TIN (mg/L)
WQO
0 . 0 1
0
0 . 0 2 1
9 5 9 6 9 7 9 8 9 9 0 0 0 1 0 2 0 3 0 4
NH3-N (mg/L)
MM15
Year
WQO
0
0 . 1
0 . 2
0 . 3
9 5 9 6 9 7 9 8 9 9 0 0 0 1 0 2 0 3 0 4
MM15
Year
TIN (mg/L)
WQO
0 . 0 1
0
0 . 0 2 1
9 5 9 6 9 7 9 8 9 9 0 0 0 1 0 2 0 3 0 4
MM14
Year
NH3-N (mg/L)WQO
0
0 . 1
0 . 2
0 . 3
9 5 9 6 9 7 9 8 9 9 0 0 0 1 0 2 0 3 0 4
MM14
Year
TIN (mg/L)
WQO
0 . 0 1
0
0 . 0 2 1
9 5 9 6 9 7 9 8 9 9 0 0 0 1 0 2 0 3 0 4
MM13
Year
NH3-N (mg/L)WQO
0
0 . 1
0 . 2
0 . 3
9 5 9 6 9 7 9 8 9 9 0 0 0 1 0 2 0 3 0 4
MM13
Year
TIN (mg/L)
WQO
0 . 0 1
0
0 . 0 2 1
9 5 9 6 9 7 9 8 9 9 0 0 0 1 0 2 0 3 0 4
MM8
Year
NH3-N (mg/L)WQO
0
0 . 1
0 . 2
0 . 3
9 5 9 6 9 7 9 8 9 9 0 0 0 1 0 2 0 3 0 4
MM8
Year
TIN (mg/L)
WQO
0 . 0 1
Figure 2.1 Level of compliance with key Water Quality Objectives in the (continued) Mirs Bay WCZ
MIRS BAY WCZ
P 2.9MARINE WATER QUALITY IN HONG KONG IN 2004
2 EASTERN WATERS
N
MM2
MM7
MM6
Shenzhen
Secondary contact recreation subzone
Tai Po
Sai Kung
E. coli(annual geometric mean)
E. coli
annual geometric mean for depth averagedE. coli (cfu/100mL)
annual geometric mean for depth averagedE. coli < 610 cfu/100mL
WQO :
Non-compliance
0
610 WQO
0
5
9 5 9 6 9 7 9 8 9 9 0 0 0 1 0 2 0 3 0 4
MM7
Year
0
5
9 5 9 6 9 7 9 8 9 9 0 0 0 1 0 2 0 3 0 4
MM2
Year
(cfu
/100
mL)
(cfu
/100
mL)
0
5
9 5 9 6 9 7 9 8 9 9 0 0 0 1 0 2 0 3 0 4
MM6
Year
(cfu
/100
mL)
610
0
Figure 2.1 Level of compliance with key Water Quality Objectives in the (continued) Mirs Bay WCZ
MIRS BAY WCZ
2
P 2.10MARINE WATER QUALITY IN HONG KONG IN 2004
EASTERN WATERS
0 %
1 0 0 %
9 5 9 6 9 7 9 8 9 9 0 0 0 1 0 2 0 3 0 4
0 %
1 0 0 %
9 5 9 6 9 7 9 8 9 9 0 0 0 1 0 2 0 3 0 4
Dissolved Oxygen (DO)(bottom)
Dissolved Oxygen (DO)(depth-averaged)
0 %
1 0 0 %
9 5 9 6 9 7 9 8 9 9 0 0 0 1 0 2 0 3 0 4
PM1WQO
Year
0 %
1 0 0 %
9 5 9 6 9 7 9 8 9 9 0 0 0 1 0 2 0 3 0 4
PM1WQO
Year
PM2WQO
Year
0 %
1 0 0 %
9 5 9 6 9 7 9 8 9 9 0 0 0 1 0 2 0 3 0 4
PM3WQO
Year
0 %
1 0 0 %
9 5 9 6 9 7 9 8 9 9 0 0 0 1 0 2 0 3 0 4
PM4WQO
Year
WQO
PM9
Year
0 %
1 0 0 %
9 5 9 6 9 7 9 8 9 9 0 0 0 1 0 2 0 3 0 4
PM2WQO
Year
0 %
1 0 0 %
9 5 9 6 9 7 9 8 9 9 0 0 0 1 0 2 0 3 0 4
PM3WQO
Year
0 %
1 0 0 %
9 5 9 6 9 7 9 8 9 9 0 0 0 1 0 2 0 3 0 4
PM4WQO
Year
0 %
1 0 0 %
9 5 9 6 9 7 9 8 9 9 0 0 0 1 0 2 0 3 0 4
PM9WQO
Year
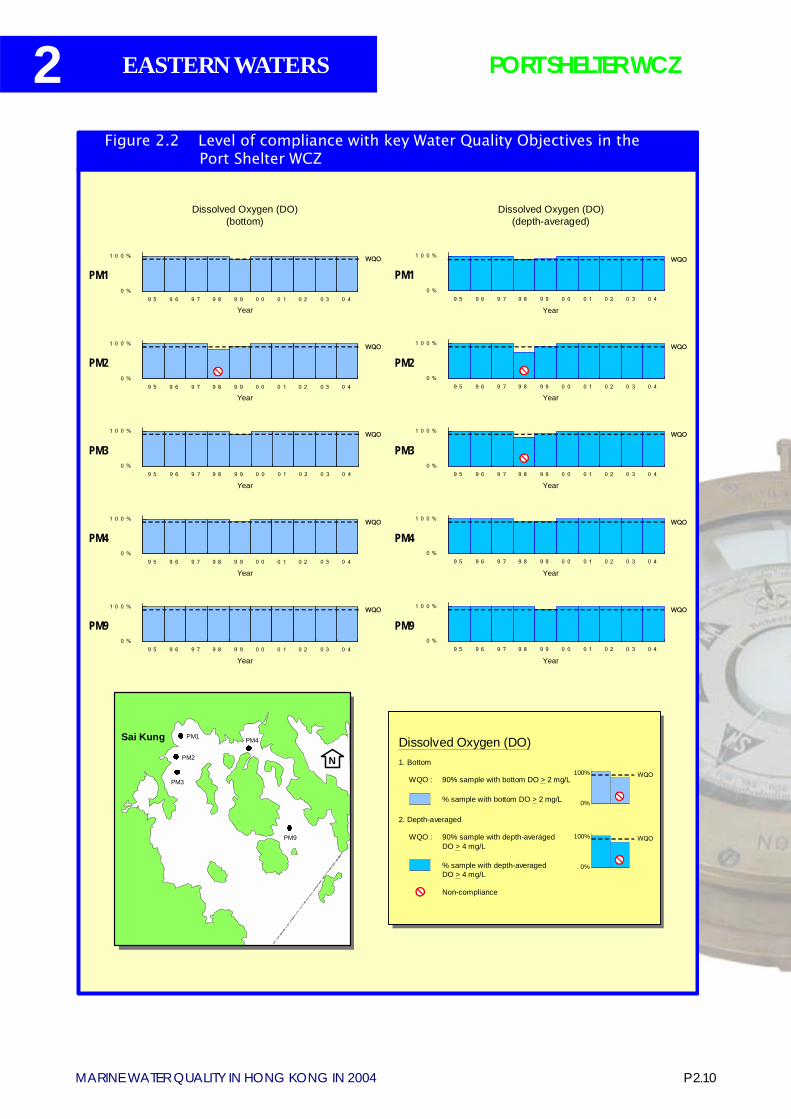
Dissolved Oxygen (DO)
% sample with bottom DO > 2 mg/L
90% sample with bottom DO > 2 mg/LWQO :
2. Depth-averaged
1. Bottom
90% sample with depth-averagedDO > 4 mg/L
WQO :
Non-compliance
% sample with depth-averagedDO > 4 mg/L
WQO
WQO
PM9
PM4PM1
PM3
Sai Kung
PM2 N100%
0%
100%
0%
Figure 2.2 Level of compliance with key Water Quality Objectives in the Port Shelter WCZ
PORT SHELTER WCZ
P 2.11MARINE WATER QUALITY IN HONG KONG IN 2004
2 EASTERN WATERS
0 %
1 0 0 %
9 5 9 6 9 7 9 8 9 9 0 0 0 1 0 2 0 3 0 4
0 %
1 0 0 %
9 5 9 6 9 7 9 8 9 9 0 0 0 1 0 2 0 3 0 4
0 %
1 0 0 %
9 5 9 6 9 7 9 8 9 9 0 0 0 1 0 2 0 3 0 4
PM6WQO
Year
PM6WQO
Year
Dissolved Oxygen (DO)(bottom)
Dissolved Oxygen (DO)(depth-averaged)
0 %
1 0 0 %
9 5 9 6 9 7 9 8 9 9 0 0 0 1 0 2 0 3 0 4
PM8WQO
Year
0 %
1 0 0 %
9 5 9 6 9 7 9 8 9 9 0 0 0 1 0 2 0 3 0 4
PM8WQO
Year
PM11
PM8
PM7
PM6
Sai Kung
N
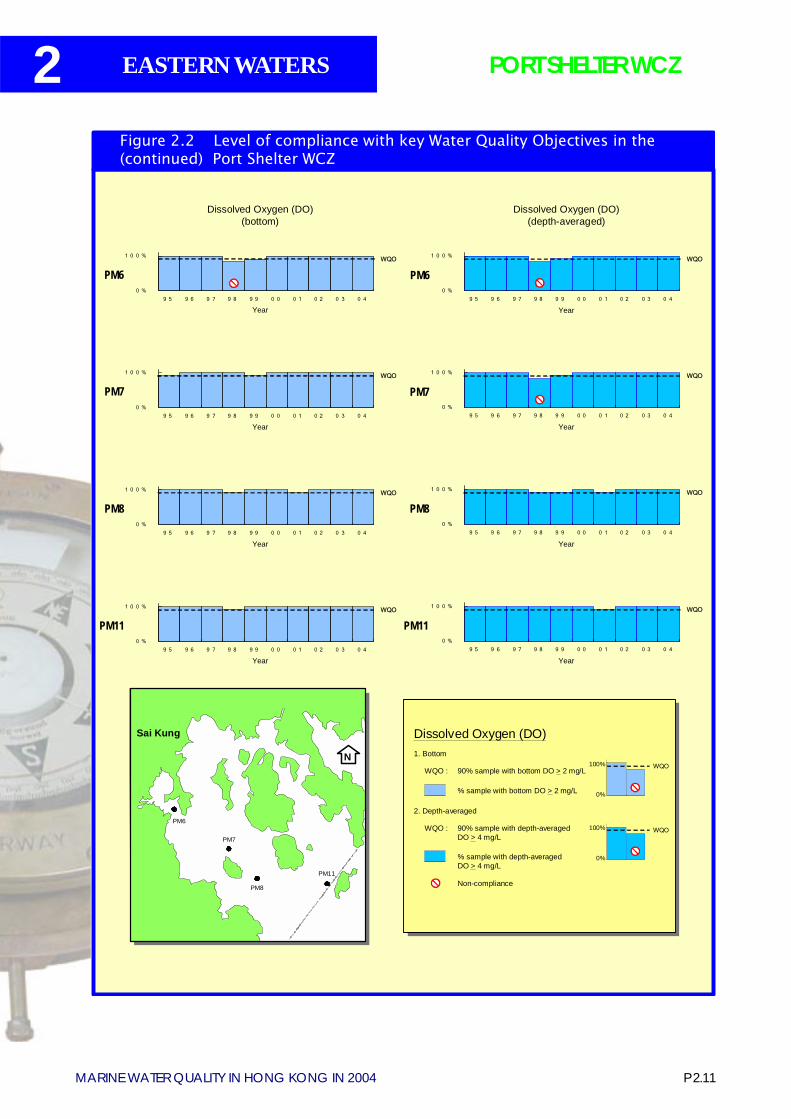
Dissolved Oxygen (DO)
% sample with bottom DO > 2 mg/L
90% sample with bottom DO > 2 mg/LWQO :
2. Depth-averaged
1. Bottom
90% sample with depth-averagedDO > 4 mg/L
WQO :
Non-compliance
% sample with depth-averagedDO > 4 mg/L
WQO
WQO
WQO
0 %
1 0 0 %
9 5 9 6 9 7 9 8 9 9 0 0 0 1 0 2 0 3 0 4
PM11
Year
PM11WQO
Year
0 %
1 0 0 %
9 5 9 6 9 7 9 8 9 9 0 0 0 1 0 2 0 3 0 4
Year
0 %
1 0 0 %
9 5 9 6 9 7 9 8 9 9 0 0 0 1 0 2 0 3 0 4
Year
PM7WQO
PM7WQO
100%
0%
100%
0%
Figure 2.2 Level of compliance with key Water Quality Objectives in the (continued) Port Shelter WCZ
PORT SHELTER WCZ
2
P 2.12MARINE WATER QUALITY IN HONG KONG IN 2004
EASTERN WATERS
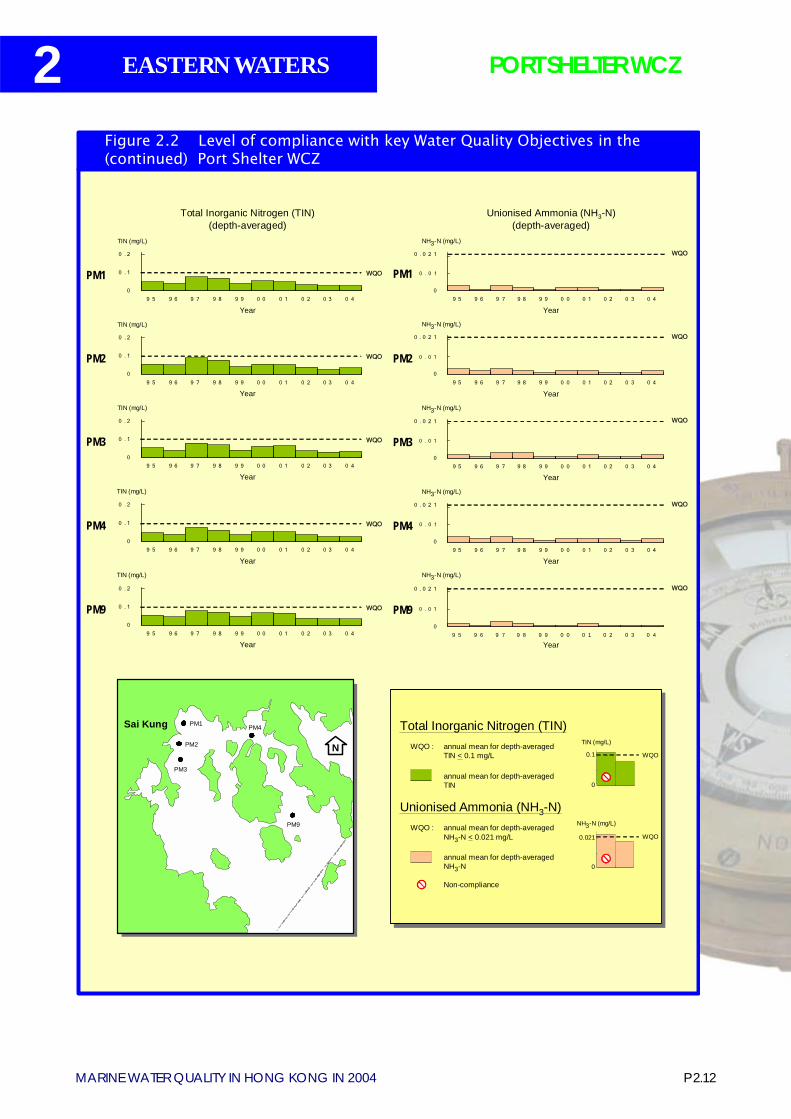
Figure 2.2 Level of compliance with key Water Quality Objectives in the (continued) Port Shelter WCZ
Total Inorganic Nitrogen (TIN)(depth-averaged)
Unionised Ammonia (NH3-N)(depth-averaged)
Total Inorganic Nitrogen (TIN)
annual mean for depth-averagedTIN
annual mean for depth-averagedTIN < 0.1 mg/L
WQO :
annual mean for depth-averagedNH3-N < 0.021 mg/L
WQO :
Non-compliance
annual mean for depth-averagedNH3-N
Unionised Ammonia (NH3-N)
0
0.1 WQO
TIN (mg/L)
0
0.021 WQO
NH3-N (mg/L)
0
0 . 0 2 1
9 5 9 6 9 7 9 8 9 9 0 0 0 1 0 2 0 3 0 4
PM2
Year
NH3-N (mg/L)
WQO
PM30
0 . 0 2 1
9 5 9 6 9 7 9 8 9 9 0 0 0 1 0 2 0 3 0 4
Year
NH3-N (mg/L)
WQO
0
0 . 0 2 1
9 5 9 6 9 7 9 8 9 9 0 0 0 1 0 2 0 3 0 4
PM4
Year
NH3-N (mg/L)
WQO
NH3-N (mg/L)
PM90
0 . 0 2 1
9 5 9 6 9 7 9 8 9 9 0 0 0 1 0 2 0 3 0 4
Year
WQO
0
0 . 1
0 . 2
9 5 9 6 9 7 9 8 9 9 0 0 0 1 0 2 0 3 0 4
PM9
Year
TIN (mg/L)
WQO
0
0 . 1
0 . 2
9 5 9 6 9 7 9 8 9 9 0 0 0 1 0 2 0 3 0 4
PM4
Year
TIN (mg/L)
WQO
0
0 . 1
0 . 2
9 5 9 6 9 7 9 8 9 9 0 0 0 1 0 2 0 3 0 4
PM2
Year
TIN (mg/L)
WQO
0
0 . 0 2 1
9 5 9 6 9 7 9 8 9 9 0 0 0 1 0 2 0 3 0 4
Year
NH3-N (mg/L)
WQO
PM10
0 . 1
0 . 2
9 5 9 6 9 7 9 8 9 9 0 0 0 1 0 2 0 3 0 4
PM1
Year
TIN (mg/L)
WQO
0
0 . 1
0 . 2
9 5 9 6 9 7 9 8 9 9 0 0 0 1 0 2 0 3 0 4
PM3
Year
TIN (mg/L)
WQO
PM9
PM4PM1
PM3
Sai Kung
PM2 N0.1
0
0.021
0
0 . 0 1
0 . 0 1
0 . 0 1
0 . 0 1
0 . 0 1
PORT SHELTER WCZ
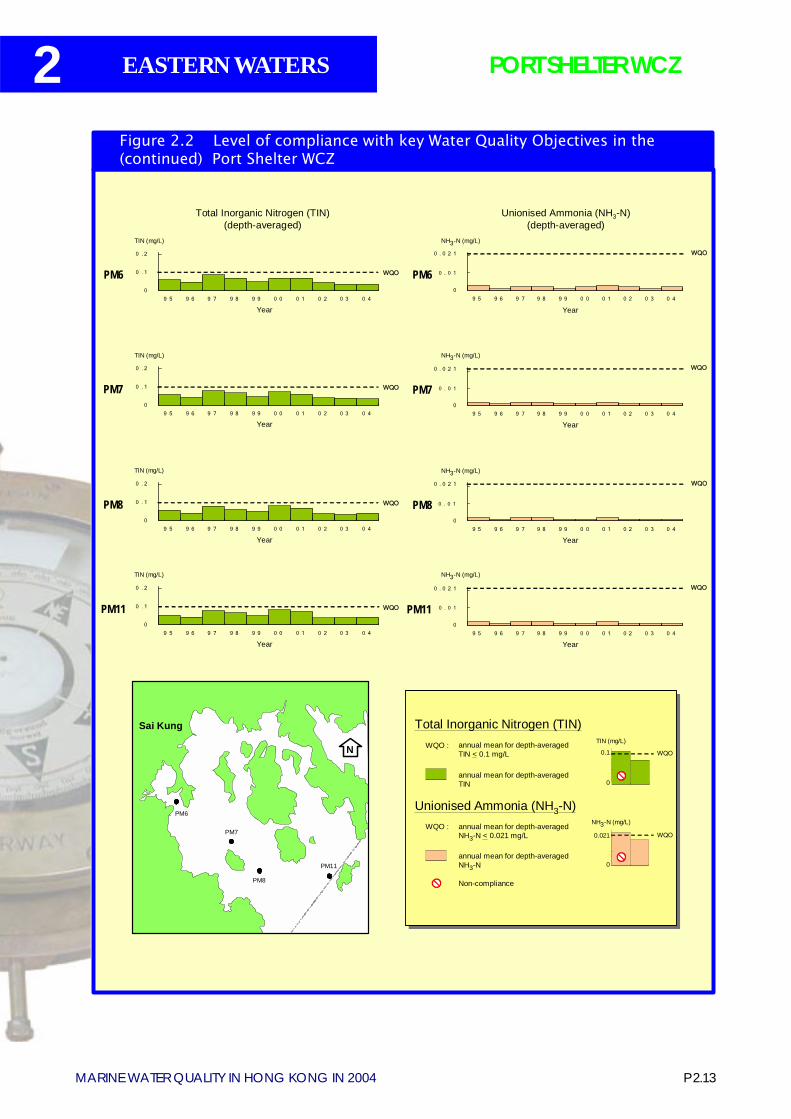
P 2.13MARINE WATER QUALITY IN HONG KONG IN 2004
2 EASTERN WATERS
0
0 . 0 2 1
9 5 9 6 9 7 9 8 9 9 0 0 0 1 0 2 0 3 0 4
PM6
Year
NH3-N (mg/L)
WQO
0
0 . 1
0 . 2
9 5 9 6 9 7 9 8 9 9 0 0 0 1 0 2 0 3 0 4
PM6
Year
TIN (mg/L)
WQO
PM11
PM8
PM7
PM6
Sai Kung
N
Total Inorganic Nitrogen (TIN)(depth-averaged)
Unionised Ammonia (NH3-N)(depth-averaged)
NH3-N (mg/L)TIN (mg/L)
0
0 . 0 2 1
9 5 9 6 9 7 9 8 9 9 0 0 0 1 0 2 0 3 0 4
PM8
Year
WQO
0
0 . 1
0 . 2
9 5 9 6 9 7 9 8 9 9 0 0 0 1 0 2 0 3 0 4
PM8
Year
WQO
NH3-N (mg/L)TIN (mg/L)
NH3-N (mg/L)TIN (mg/L)
PM70
0 . 0 2 1
9 5 9 6 9 7 9 8 9 9 0 0 0 1 0 2 0 3 0 4
Year
WQO
0
0 . 1
0 . 2
9 5 9 6 9 7 9 8 9 9 0 0 0 1 0 2 0 3 0 4
PM7
Year
WQO
Total Inorganic Nitrogen (TIN)
annual mean for depth-averagedTIN
annual mean for depth-averagedTIN < 0.1 mg/L
WQO :
annual mean for depth-averagedNH3-N < 0.021 mg/L
WQO :
Non-compliance
annual mean for depth-averagedNH3-N
Unionised Ammonia (NH3-N)
0
0.1 WQO
TIN (mg/L)
0
0.021 WQO
NH3-N (mg/L)
PM110
0 . 0 2 1
9 5 9 6 9 7 9 8 9 9 0 0 0 1 0 2 0 3 0 4
Year
WQO
0
0 . 1
0 . 2
9 5 9 6 9 7 9 8 9 9 0 0 0 1 0 2 0 3 0 4
PM11
Year
WQO
0.1
0
0.021
0
0 . 0 1
0 . 0 1
0 . 0 1
0 . 0 1
Figure 2.2 Level of compliance with key Water Quality Objectives in the (continued) Port Shelter WCZ
PORT SHELTER WCZ
2
P 2.14MARINE WATER QUALITY IN HONG KONG IN 2004
EASTERN WATERS
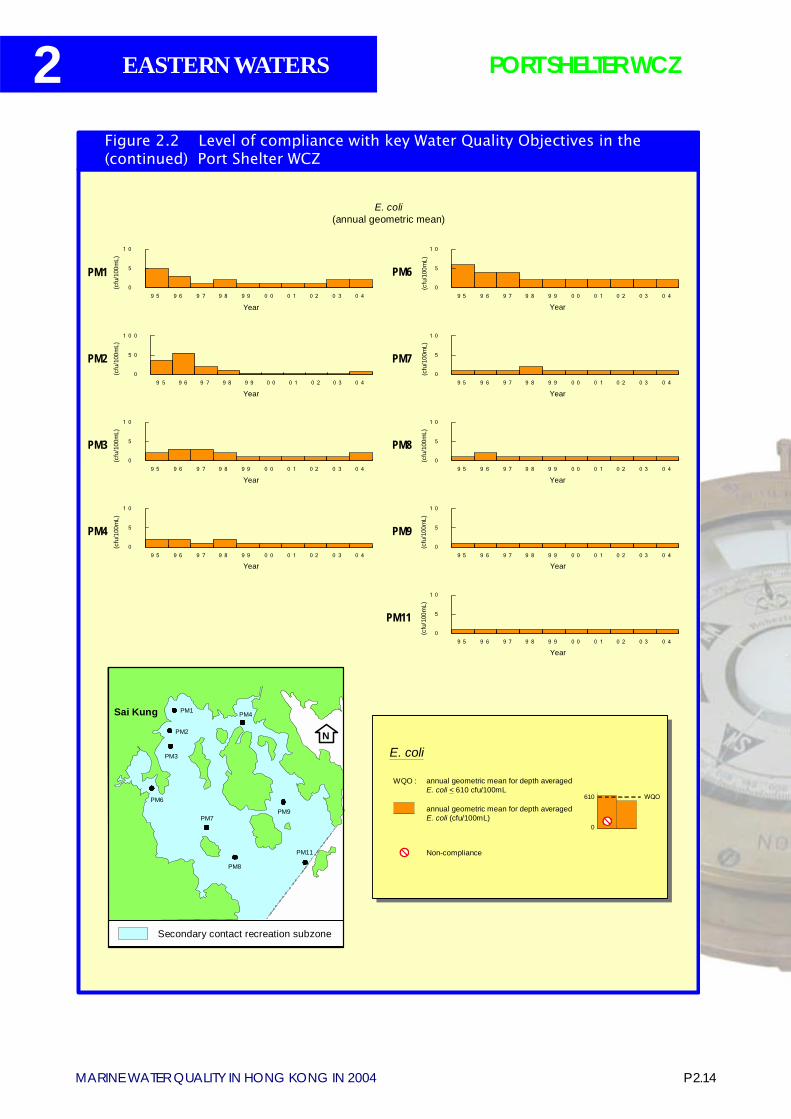
E. coli(annual geometric mean)
0
5 0
1 0 0
9 5 9 6 9 7 9 8 9 9 0 0 0 1 0 2 0 3 0 4
PM2
Year
(cfu
/100
mL)
0
5
1 0
9 5 9 6 9 7 9 8 9 9 0 0 0 1 0 2 0 3 0 4
PM7
Year
(cfu
/100
mL)
0
5
1 0
9 5 9 6 9 7 9 8 9 9 0 0 0 1 0 2 0 3 0 4
PM3
Year
(cfu
/100
mL)
0
5
1 0
9 5 9 6 9 7 9 8 9 9 0 0 0 1 0 2 0 3 0 4
PM8
Year
(cfu
/100
mL)
0
5
1 0
9 5 9 6 9 7 9 8 9 9 0 0 0 1 0 2 0 3 0 4
PM4
Year
(cfu
/100
mL)
0
5
1 0
9 5 9 6 9 7 9 8 9 9 0 0 0 1 0 2 0 3 0 4
PM9
Year
(cfu
/100
mL)
0
5
1 0
9 5 9 6 9 7 9 8 9 9 0 0 0 1 0 2 0 3 0 4
PM1
Year
(cfu
/100
mL)
0
5
1 0
9 5 9 6 9 7 9 8 9 9 0 0 0 1 0 2 0 3 0 4
PM6
Year
(cfu
/100
mL)
E. coli
annual geometric mean for depth averagedE. coli (cfu/100mL)
annual geometric mean for depth averagedE. coli < 610 cfu/100mL
WQO :
Non-compliance
0
610 WQO
0
5
1 0
9 5 9 6 9 7 9 8 9 9 0 0 0 1 0 2 0 3 0 4
PM11
Year
(cfu
/100
mL)
PM11
PM8
PM7
PM6
Sai Kung
N
PM9
PM4PM1
PM3
PM2
Secondary contact recreation subzone
610
0
Figure 2.2 Level of compliance with key Water Quality Objectives in the (continued) Port Shelter WCZ
PORT SHELTER WCZ
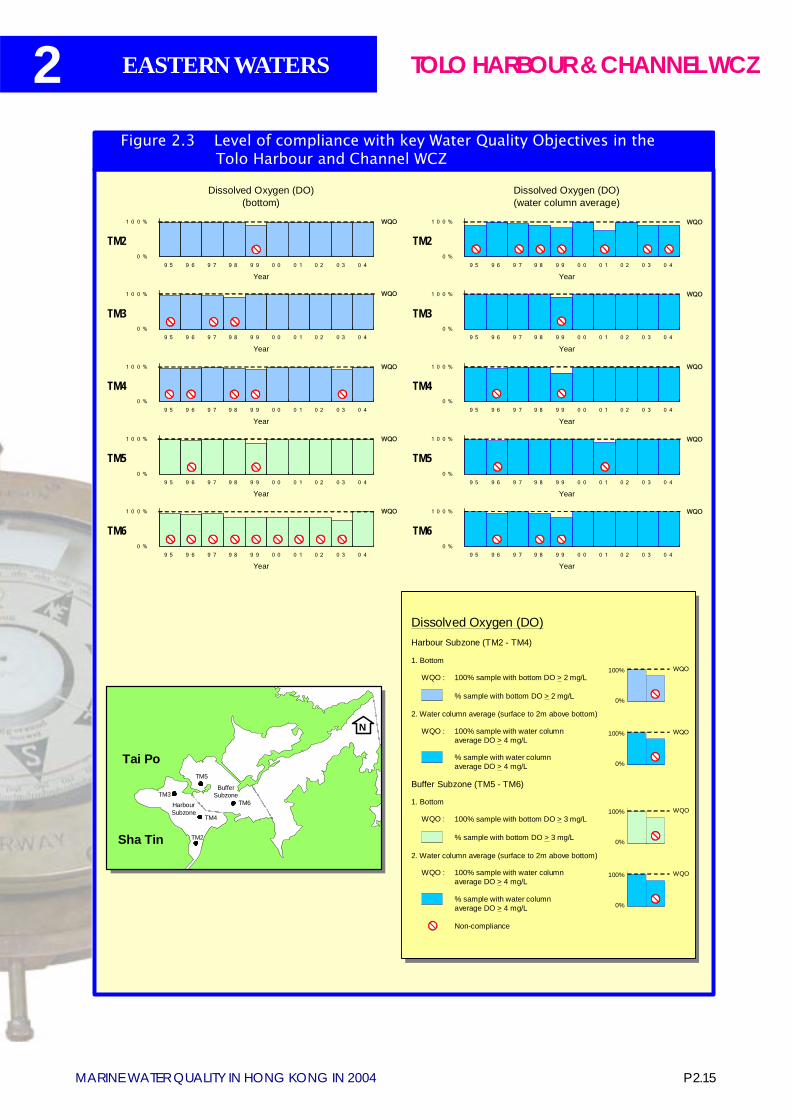
P 2.15MARINE WATER QUALITY IN HONG KONG IN 2004
2 EASTERN WATERS TOLO HARBOUR & CHANNEL WCZ
Dissolved Oxygen (DO)(bottom)
BufferSubzone
HarbourSubzone
Sha Tin TM2
TM4
TM3
TM5
TM6
Tai Po
N
Dissolved Oxygen (DO)(water column average)
0 %
1 0 0 %
9 5 9 6 9 7 9 8 9 9 0 0 0 1 0 2 0 3 0 4
TM2
WQO
Year
0 %
1 0 0 %
9 5 9 6 9 7 9 8 9 9 0 0 0 1 0 2 0 3 0 4
TM2
WQO
Year
0 %
1 0 0 %
9 5 9 6 9 7 9 8 9 9 0 0 0 1 0 2 0 3 0 4
TM3
WQO
Year
0 %
1 0 0 %
9 5 9 6 9 7 9 8 9 9 0 0 0 1 0 2 0 3 0 4
TM4
WQO
Year
0 %
1 0 0 %
9 5 9 6 9 7 9 8 9 9 0 0 0 1 0 2 0 3 0 4
TM5
WQO
Year
0 %
1 0 0 %
9 5 9 6 9 7 9 8 9 9 0 0 0 1 0 2 0 3 0 4
TM6
WQO
Year
0 %
1 0 0 %
9 5 9 6 9 7 9 8 9 9 0 0 0 1 0 2 0 3 0 4
TM3
Year
0 %
1 0 0 %
9 5 9 6 9 7 9 8 9 9 0 0 0 1 0 2 0 3 0 4
TM4
Year
0 %
1 0 0 %
9 5 9 6 9 7 9 8 9 9 0 0 0 1 0 2 0 3 0 4
TM5
Year
0 %
1 0 0 %
9 5 9 6 9 7 9 8 9 9 0 0 0 1 0 2 0 3 0 4
TM6
Year
Dissolved Oxygen (DO)Harbour Subzone (TM2 - TM4)
% sample with bottom DO > 2 mg/L
100% sample with bottom DO > 2 mg/LWQO :
Buffer Subzone (TM5 - TM6)
2. Water column average (surface to 2m above bottom)
2. Water column average (surface to 2m above bottom)
1. Bottom
% sample with water columnaverage DO > 4 mg/L
% sample with bottom DO > 3 mg/L
1. Bottom
WQO : 100% sample with water columnaverage DO > 4 mg/L
% sample with water columnaverage DO > 4 mg/L
WQO
Non-compliance
100% sample with water columnaverage DO > 4 mg/L
WQO :
100% sample with bottom DO > 3 mg/LWQO :
WQO
WQO
WQO
WQO
WQO
WQO
WQO
100%
0%
100%
0%
100%
0%
100%
0%
Figure 2.3 Level of compliance with key Water Quality Objectives in the Tolo Harbour and Channel WCZ
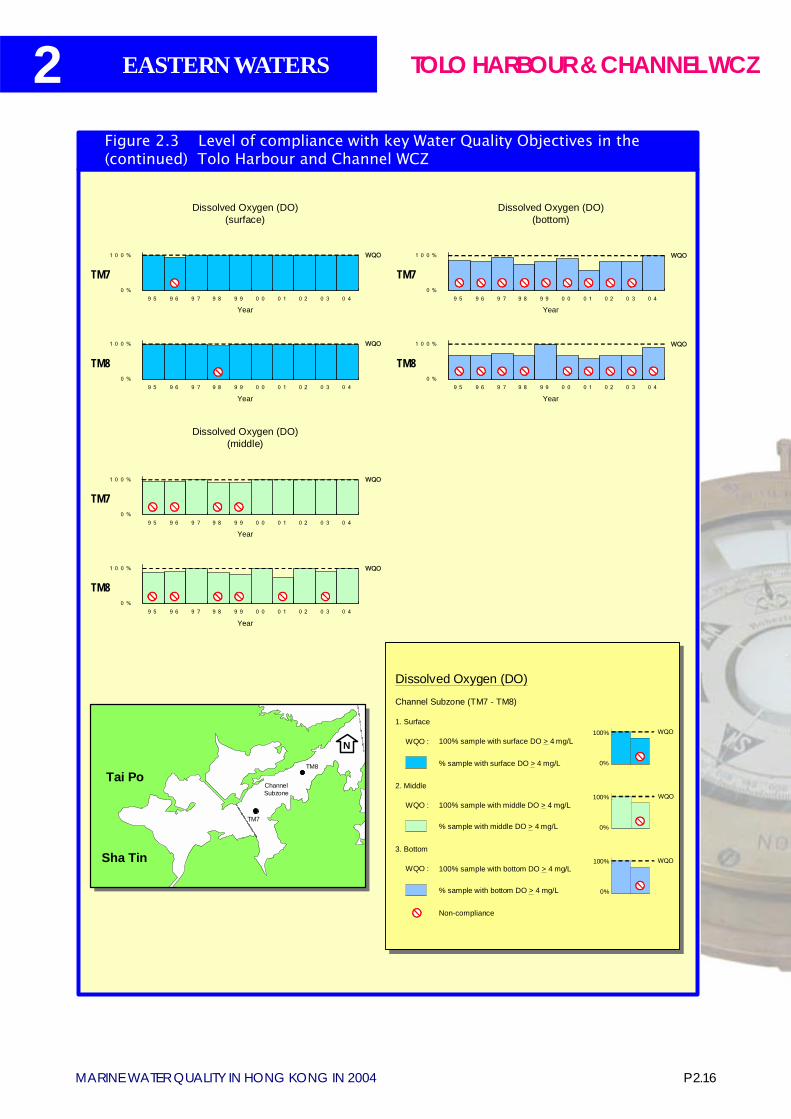
2
P 2.16MARINE WATER QUALITY IN HONG KONG IN 2004
EASTERN WATERS
0 %
1 0 0 %
9 5 9 6 9 7 9 8 9 9 0 0 0 1 0 2 0 3 0 4
Dissolved Oxygen (DO)(surface)
Dissolved Oxygen (DO)(bottom)
0 %
1 0 0 %
9 5 9 6 9 7 9 8 9 9 0 0 0 1 0 2 0 3 0 4
TM7
Year
0 %
1 0 0 %
9 5 9 6 9 7 9 8 9 9 0 0 0 1 0 2 0 3 0 4
TM7
Year
0 %
1 0 0 %
9 5 9 6 9 7 9 8 9 9 0 0 0 1 0 2 0 3 0 4
TM8
Year
0 %
1 0 0 %
9 5 9 6 9 7 9 8 9 9 0 0 0 1 0 2 0 3 0 4
TM7
Year
0 %
1 0 0 %
9 5 9 6 9 7 9 8 9 9 0 0 0 1 0 2 0 3 0 4
TM8
Year
TM8
Year
Dissolved Oxygen (DO)(middle)
Sha Tin
Tai Po
N
TM8
TM7
ChannelSubzone
Dissolved Oxygen (DO)
Channel Subzone (TM7 - TM8)
% sample with surface DO > 4 mg/L
100% sample with surface DO > 4 mg/LWQO :
2. Middle
1. Surface
3. Bottom
100% sample with middle DO > 4 mg/LWQO :
100% sample with bottom DO > 4 mg/LWQO :
Non-compliance
% sample with middle DO > 4 mg/L
% sample with bottom DO > 4 mg/L
WQO
WQO
WQO
WQO
WQO
WQO
WQO
WQO
WQO
100%
0%
100%
0%
100%
0%
Figure 2.3 Level of compliance with key Water Quality Objectives in the (continued) Tolo Harbour and Channel WCZ
TOLO HARBOUR & CHANNEL WCZ
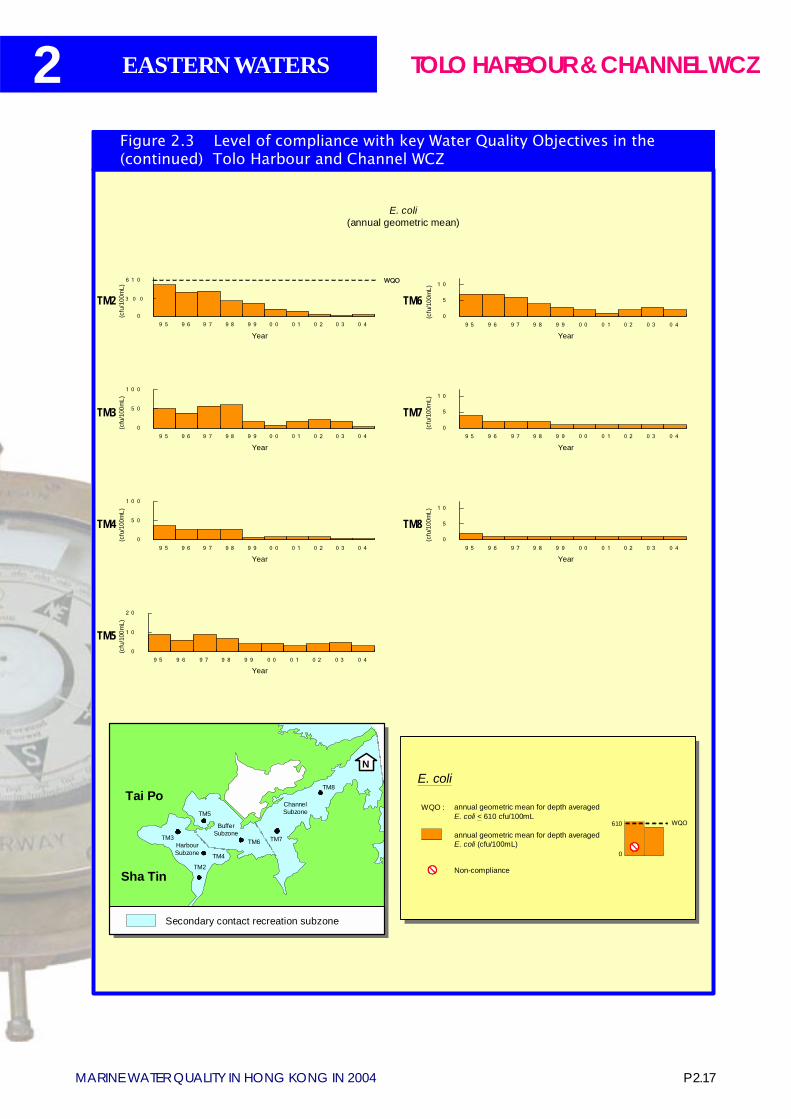
P 2.17MARINE WATER QUALITY IN HONG KONG IN 2004
2 EASTERN WATERS
0
6 1 0
9 5 9 6 9 7 9 8 9 9 0 0 0 1 0 2 0 3 0 4
3 0 0
E. coli(annual geometric mean)
0
5
1 0
9 5 9 6 9 7 9 8 9 9 0 0 0 1 0 2 0 3 0 4
TM6
Year
TM2
WQO
Year
0
5 0
1 0 0
9 5 9 6 9 7 9 8 9 9 0 0 0 1 0 2 0 3 0 4
TM3
Year
0
1 0
2 0
9 5 9 6 9 7 9 8 9 9 0 0 0 1 0 2 0 3 0 4
TM5
Year
0
5
1 0
9 5 9 6 9 7 9 8 9 9 0 0 0 1 0 2 0 3 0 4
TM7
Year
0
5
1 0
9 5 9 6 9 7 9 8 9 9 0 0 0 1 0 2 0 3 0 4
TM8
Year
E. coli
annual geometric mean for depth averagedE. coli (cfu/100mL)
annual geometric mean for depth averaged E. coli < 610 cfu/100mL
WQO :
Non-compliance
0
610 WQO
0
5 0
1 0 0
9 5 9 6 9 7 9 8 9 9 0 0 0 1 0 2 0 3 0 4
TM4
Year
(cfu
/100
mL)
(cfu
/100
mL)
(cfu
/100
mL)
(cfu
/100
mL)
(cfu
/100
mL)
(cfu
/100
mL)
(cfu
/100
mL)
BufferSubzone
HarbourSubzone
Sha TinTM2
TM4
TM3
TM5
TM6
Tai Po
N
TM8
TM7
ChannelSubzone
Secondary contact recreation subzone
610
0
Figure 2.3 Level of compliance with key Water Quality Objectives in the (continued) Tolo Harbour and Channel WCZ
TOLO HARBOUR & CHANNEL WCZ
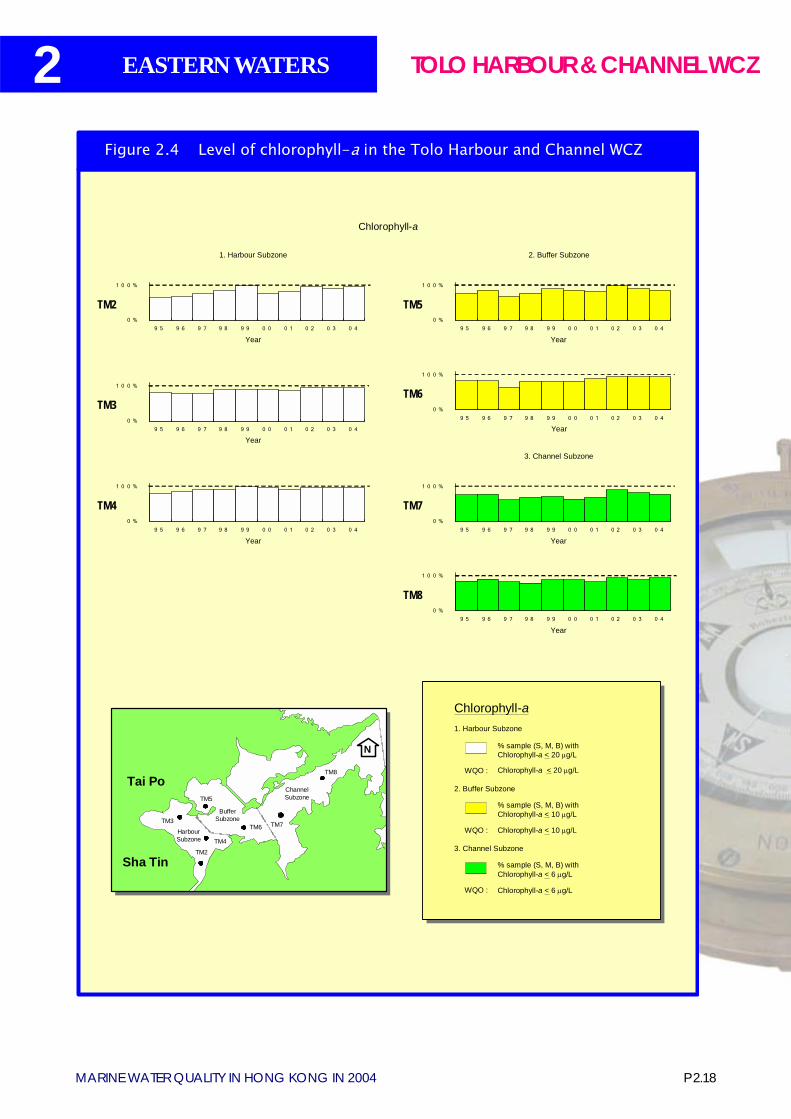
2
P 2.18MARINE WATER QUALITY IN HONG KONG IN 2004
EASTERN WATERS
Chlorophyll-a
TM50 %
1 0 0 %
9 5 9 6 9 7 9 8 9 9 0 0 0 1 0 2 0 3 0 4
Year
0 %
1 0 0 %
9 5 9 6 9 7 9 8 9 9 0 0 0 1 0 2 0 3 0 4
TM2
Year
0 %
1 0 0 %
9 5 9 6 9 7 9 8 9 9 0 0 0 1 0 2 0 3 0 4
TM3
Year
0 %
1 0 0 %
9 5 9 6 9 7 9 8 9 9 0 0 0 1 0 2 0 3 0 4
TM6
Year
0 %
1 0 0 %
9 5 9 6 9 7 9 8 9 9 0 0 0 1 0 2 0 3 0 4
TM4
Year
0 %
1 0 0 %
9 5 9 6 9 7 9 8 9 9 0 0 0 1 0 2 0 3 0 4
TM7
Year
0 %
1 0 0 %
9 5 9 6 9 7 9 8 9 9 0 0 0 1 0 2 0 3 0 4
TM8
Year
BufferSubzone
HarbourSubzone
Sha TinTM2
TM4
TM3
TM5
TM6
Tai Po
N
TM8
TM7
ChannelSubzone
Chlorophyll-a
% sample (S, M, B) withChlorophyll-a < 20 μg/L
Chlorophyll-a < 20 μg/LWQO :
2. Buffer Subzone
1. Harbour Subzone
3. Channel Subzone
Chlorophyll-a < 10 μg/LWQO :
Chlorophyll-a < 6 μg/LWQO :
% sample (S, M, B) withChlorophyll-a < 10 μg/L
% sample (S, M, B) withChlorophyll-a < 6 μg/L
2. Buffer Subzone1. Harbour Subzone
3. Channel Subzone
Figure 2.4 Level of chlorophyll-a in the Tolo Harbour and Channel WCZ
TOLO HARBOUR & CHANNEL WCZ
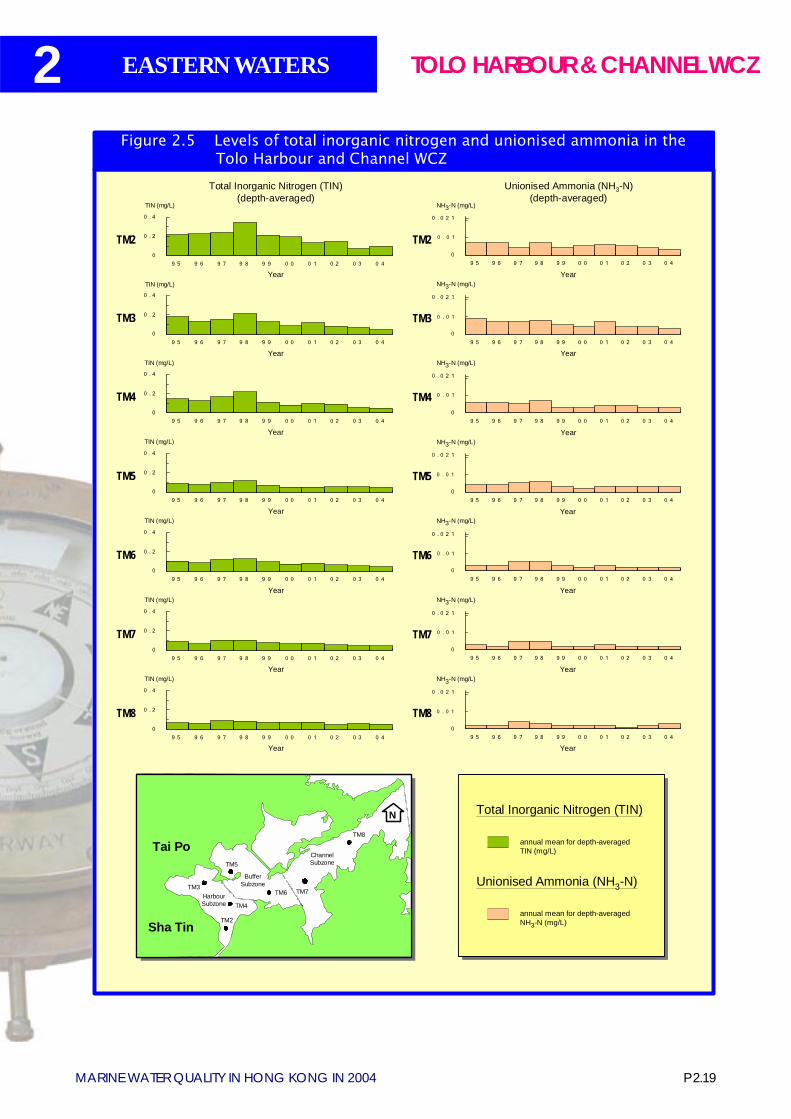
P 2.19MARINE WATER QUALITY IN HONG KONG IN 2004
2 EASTERN WATERS
0
0 . 0 2 1
9 5 9 6 9 7 9 8 9 9 0 0 0 1 0 2 0 3 0 4
BufferSubzone
HarbourSubzone
Sha TinTM2
TM4
TM3
TM5
TM6
Tai Po
N
TM8
TM7
ChannelSubzone
Total Inorganic Nitrogen (TIN)(depth-averaged)
Unionised Ammonia (NH3-N)(depth-averaged)
Total Inorganic Nitrogen (TIN)
annual mean for depth-averagedTIN (mg/L)
annual mean for depth-averagedNH3-N (mg/L)
Unionised Ammonia (NH3-N)
0
0 . 2
0 . 4
9 5 9 6 9 7 9 8 9 9 0 0 0 1 0 2 0 3 0 4
TM2
Year
TIN (mg/L)
0
0 . 2
0 . 4
9 5 9 6 9 7 9 8 9 9 0 0 0 1 0 2 0 3 0 4
TM8
Year
TIN (mg/L)
0
0 . 2
0 . 4
9 5 9 6 9 7 9 8 9 9 0 0 0 1 0 2 0 3 0 4
TM3
Year
TIN (mg/L)
0
0 . 2
0 . 4
9 5 9 6 9 7 9 8 9 9 0 0 0 1 0 2 0 3 0 4
TM4
Year
TIN (mg/L)
0
0 . 2
0 . 4
9 5 9 6 9 7 9 8 9 9 0 0 0 1 0 2 0 3 0 4
TM5
Year
TIN (mg/L)
0
0 . 2
0 . 4
9 5 9 6 9 7 9 8 9 9 0 0 0 1 0 2 0 3 0 4
TM6
Year
TIN (mg/L)
0
0 . 2
0 . 4
9 5 9 6 9 7 9 8 9 9 0 0 0 1 0 2 0 3 0 4
TM7
Year
TIN (mg/L)
0
0 . 0 2 1
9 5 9 6 9 7 9 8 9 9 0 0 0 1 0 2 0 3 0 4
TM2
Year
NH3-N (mg/L)
0
0 . 0 2 1
9 5 9 6 9 7 9 8 9 9 0 0 0 1 0 2 0 3 0 4
TM3
Year
NH3-N (mg/L)
0
0 . 0 2 1
9 5 9 6 9 7 9 8 9 9 0 0 0 1 0 2 0 3 0 4
TM4
Year
NH3-N (mg/L)
0
0 . 0 2 1
9 5 9 6 9 7 9 8 9 9 0 0 0 1 0 2 0 3 0 4
TM5
Year
NH3-N (mg/L)
TM60
0 . 0 2 1
9 5 9 6 9 7 9 8 9 9 0 0 0 1 0 2 0 3 0 4
Year
NH3-N (mg/L)
0
0 . 0 2 1
9 5 9 6 9 7 9 8 9 9 0 0 0 1 0 2 0 3 0 4
TM7
Year
NH3-N (mg/L)
TM8
Year
NH3-N (mg/L)
0 . 0 1
0 . 0 1
0 . 0 1
0 . 0 1
0 . 0 1
0 . 0 1
0 . 0 1
Figure 2.5 Levels of total inorganic nitrogen and unionised ammonia in the Tolo Harbour and Channel WCZ
TOLO HARBOUR & CHANNEL WCZ
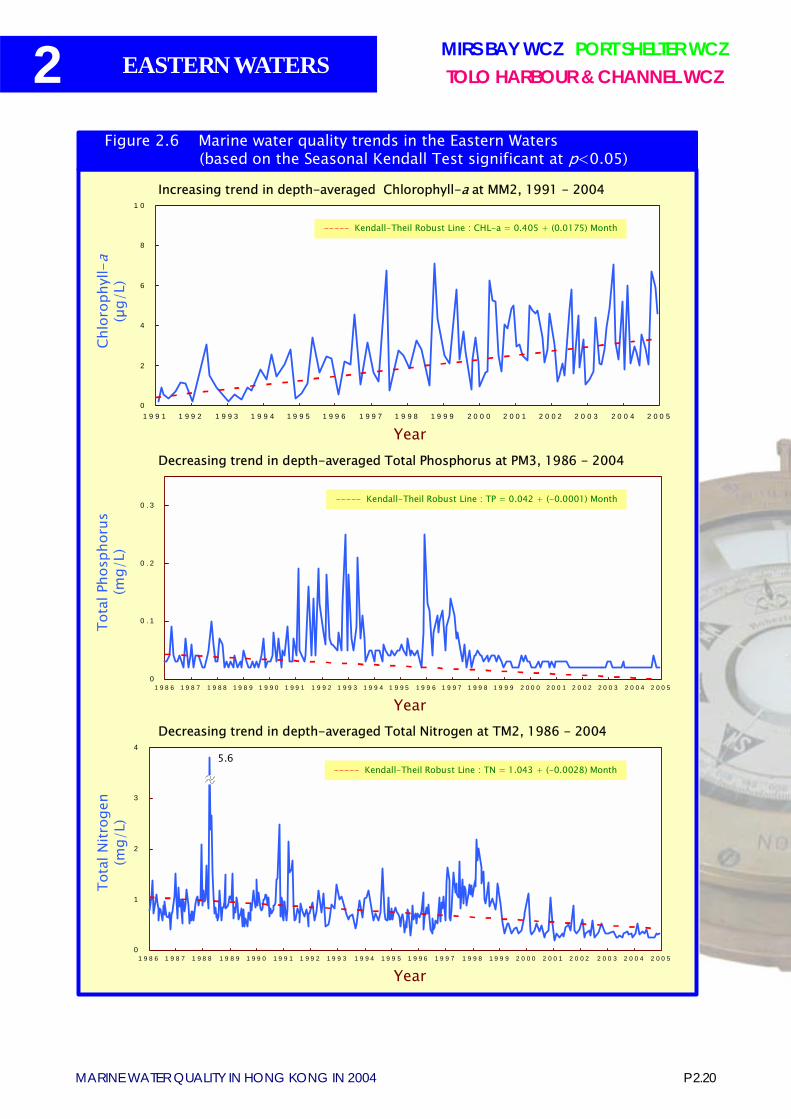
2
P 2.20MARINE WATER QUALITY IN HONG KONG IN 2004
EASTERN WATERSMIRS BAY WCZ PORT SHELTER WCZTOLO HARBOUR & CHANNEL WCZ
Decreasing trend in depth-averaged Total Nitrogen at TM2, 1986 - 2004
Year
Tota
l Nitr
ogen
(mg/
L)
0
1
2
3
4
1 9 8 6 1 9 8 7 1 9 8 8 1 9 8 9 1 9 9 0 1 9 9 1 1 9 9 2 1 9 9 3 1 9 9 4 1 9 9 5 1 9 9 6 1 9 9 7 1 9 9 8 1 9 9 9 2 0 0 0 2 0 0 1 2 0 0 2 2 0 0 3 2 0 0 4 2 0 0 5
----- Kendall-Theil Robust Line : TN = 1.043 + (-0.0028) Month
Figure 2.6 Marine water quality trends in the Eastern Waters(based on the Seasonal Kendall Test significant at p<0.05)
Year
Increasing trend in depth-averaged Chlorophyll-a at MM2, 1991 - 2004
Chlo
roph
yll-
a(µ
g/L)
0
2
4
6
8
1 0
1 9 9 1 1 9 9 2 1 9 9 3 1 9 9 4 1 9 9 5 1 9 9 6 1 9 9 7 1 9 9 8 1 9 9 9 2 0 0 0 2 0 0 1 2 0 0 2 2 0 0 3 2 0 0 4 2 0 0 5
----- Kendall-Theil Robust Line : CHL-a = 0.405 + (0.0175) Month
Decreasing trend in depth-averaged Total Phosphorus at PM3, 1986 - 2004
Year
Tota
l Pho
spho
rus
(mg/
L)
0
0 . 1
0 . 2
0 . 3
1 9 8 6 1 9 8 7 1 9 8 8 1 9 8 9 1 9 9 0 1 9 9 1 1 9 9 2 1 9 9 3 1 9 9 4 1 9 9 5 1 9 9 6 1 9 9 7 1 9 9 8 1 9 9 9 2 0 0 0 2 0 0 1 2 0 0 2 2 0 0 3 2 0 0 4 2 0 0 5
----- Kendall-Theil Robust Line : TP = 0.042 + (-0.0001) Month
a
5.6
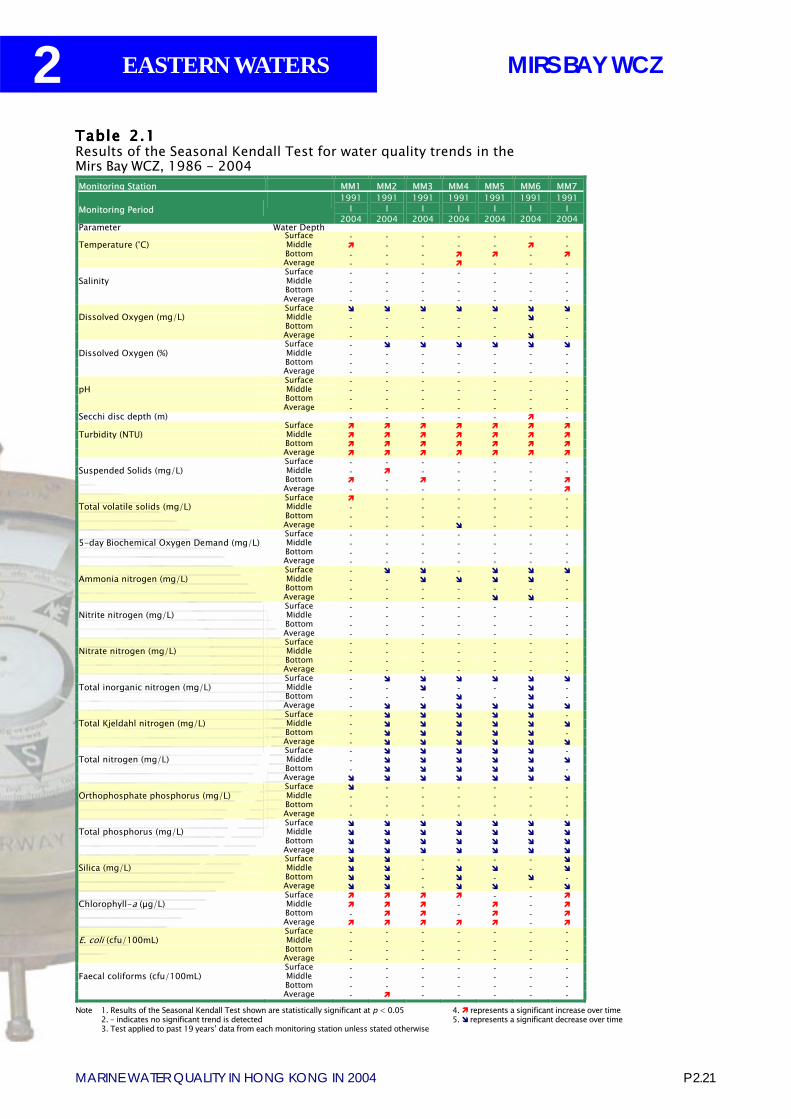
P 2.21MARINE WATER QUALITY IN HONG KONG IN 2004
2 EASTERN WATERS
Table Table Table Table Table 22222.....11111Results of the Seasonal Kendall Test for water quality trends in theMirs Bay WCZ, 1986 - 2004
Note 1. Results of the Seasonal Kendall Test shown are statistically significant at p < 0.052. � indicates no significant trend is detected3. Test applied to past 19 years� data from each monitoring station unless stated otherwise
4. ! represents a significant increase over time5. " represents a significant decrease over time
Monitoring Station MM1 MM2 MM3 MM4 MM5 MM6 MM7
Monitoring Period 1991
I 2004
1991 I
2004
1991 I
2004
1991 I
2004
1991 I
2004
1991 I
2004
1991 I
2004 Parameter Water Depth Surface - - - - - - - Temperature (°C) Middle ! - - - - ! - Bottom - - - ! ! - ! Average - - - ! - - - Surface - - - - - - - Salinity Middle - - - - - - -
Bottom - - - - - - - Average - - - - - - -
Surface " " " " " " " Dissolved Oxygen (mg/L) Middle - - - - - " - Bottom - - - - - - - Average - - - - - " - Surface - " " " " " " Dissolved Oxygen (%) Middle - - - - - - - Bottom - - - - - - - Average - - - - - - - Surface - - - - - - - pH Middle - - - - - - - Bottom - - - - - - - Average - - - - - - - Secchi disc depth (m) - - - - - ! - Surface ! ! ! ! ! ! ! Turbidity (NTU) Middle ! ! ! ! ! ! ! Bottom ! ! ! ! ! ! ! Average ! ! ! ! ! ! ! Surface - - - - - - - Suspended Solids (mg/L) Middle - ! - - - - - Bottom ! - ! - - - ! Average - - - - - - ! Surface ! - - - - - - Total volatile solids (mg/L) Middle - - - - - - - Bottom - - - - - - - Average - - - " - - - Surface - - - - - - - 5-day Biochemical Oxygen Demand (mg/L) Middle - - - - - - - Bottom - - - - - - - Average - - - - - - - Surface - " " - " " " Ammonia nitrogen (mg/L) Middle - - " " " " - Bottom - - - - - - - Average - - - - " " - Surface - - - - - - - Nitrite nitrogen (mg/L) Middle - - - - - - - Bottom - - - - - - - Average - - - - - - - Surface - - - - - - - Nitrate nitrogen (mg/L) Middle - - - - - - - Bottom - - - - - - - Average - - - - - - - Surface - " " " " " " Total inorganic nitrogen (mg/L) Middle - - " - - " - Bottom - - - " - " - Average - " " " " " " Surface - " " " " " - Total Kjeldahl nitrogen (mg/L) Middle - " " " " " " Bottom - " " " " " - Average - " " " " " " Surface - " " " " " - Total nitrogen (mg/L) Middle - " " " " " " Bottom - " " " " " - Average " " " " " " " Surface " - - - - - - Orthophosphate phosphorus (mg/L) Middle - - - - - - - Bottom - - - - - - - Average - - - - - - - Surface " " " " " " " Total phosphorus (mg/L) Middle " " " " " " " Bottom " " " " " " " Average " " " " " " " Surface " " - - - - " Silica (mg/L) Middle " " - " " - " Bottom " " - " - " - Average " " - " " - " Surface ! ! ! ! - - ! Chlorophyll-a (µg/L) Middle ! ! ! - ! - ! Bottom - ! ! - ! - ! Average ! ! ! ! ! - ! Surface - - - - - - - E. coli (cfu/100mL) Middle - - - - - - - Bottom - - - - - - - Average - - - - - - -
Surface - - - - - - - Faecal coliforms (cfu/100mL) Middle - - - - - - - Bottom - - - - - - - Average - ! - - - - -
MIRS BAY WCZ
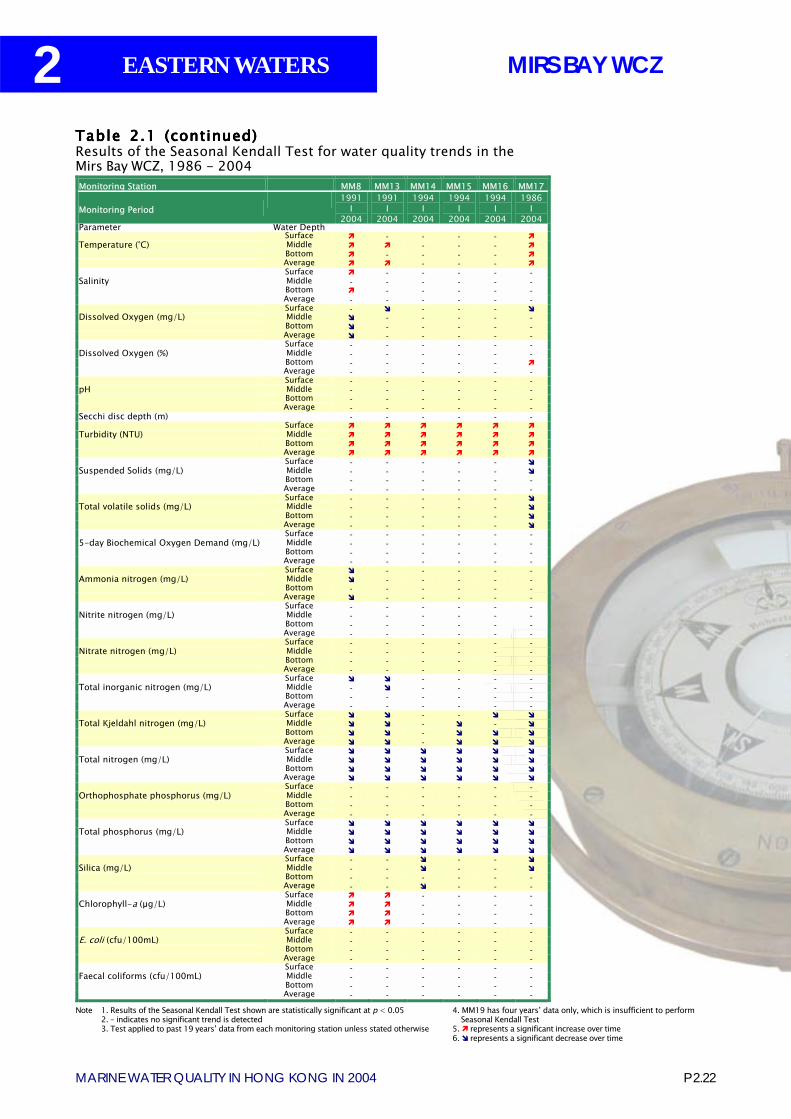
2
P 2.22MARINE WATER QUALITY IN HONG KONG IN 2004
EASTERN WATERS
Table Table Table Table Table 22222.....1 (continued)1 (continued)1 (continued)1 (continued)1 (continued)Results of the Seasonal Kendall Test for water quality trends in theMirs Bay WCZ, 1986 - 2004
Note 1. Results of the Seasonal Kendall Test shown are statistically significant at p < 0.052. � indicates no significant trend is detected3. Test applied to past 19 years� data from each monitoring station unless stated otherwise
4. MM19 has four years� data only, which is insufficient to perform Seasonal Kendall Test5. ! represents a significant increase over time6. " represents a significant decrease over time
Monitoring Station MM8 MM13 MM14 MM15 MM16 MM17
Monitoring Period 1991
I 2004
1991 I
2004
1994 I
2004
1994 I
2004
1994 I
2004
1986 I
2004 Parameter Water Depth Surface ! - - - - ! Temperature (°C) Middle ! ! - - - ! Bottom ! - - - - ! Average ! ! - - - ! Surface ! - - - - - Salinity Middle - - - - - -
Bottom ! - - - - - Average - - - - - -
Surface - " - - - " Dissolved Oxygen (mg/L) Middle " - - - - - Bottom " - - - - - Average " - - - - - Surface - - - - - - Dissolved Oxygen (%) Middle - - - - - - Bottom - - - - - ! Average - - - - - - Surface - - - - - - pH Middle - - - - - - Bottom - - - - - - Average - - - - - - Secchi disc depth (m) - - - - - - Surface ! ! ! ! ! ! Turbidity (NTU) Middle ! ! ! ! ! ! Bottom ! ! ! ! ! ! Average ! ! ! ! ! ! Surface - - - - - " Suspended Solids (mg/L) Middle - - - - - " Bottom - - - - - - Average - - - - - - Surface - - - - - " Total volatile solids (mg/L) Middle - - - - - " Bottom - - - - - " Average - - - - - " Surface - - - - - - 5-day Biochemical Oxygen Demand (mg/L) Middle - - - - - - Bottom - - - - - - Average - - - - - - Surface " - - - - - Ammonia nitrogen (mg/L) Middle " - - - - - Bottom - - - - - - Average " - - - - - Surface - - - - - - Nitrite nitrogen (mg/L) Middle - - - - - - Bottom - - - - - - Average - - - - - - Surface - - - - - - Nitrate nitrogen (mg/L) Middle - - - - - - Bottom - - - - - - Average - - - - - - Surface " " - - - - Total inorganic nitrogen (mg/L) Middle - " - - - - Bottom - - - - - - Average - - - - - - Surface " " - - " " Total Kjeldahl nitrogen (mg/L) Middle " " - " - " Bottom " " - " " " Average " " - " " " Surface " " " " " " Total nitrogen (mg/L) Middle " " " " " " Bottom " " " " " " Average " " " " " " Surface - - - - - - Orthophosphate phosphorus (mg/L) Middle - - - - - - Bottom - - - - - - Average - - - - - - Surface " " " " " " Total phosphorus (mg/L) Middle " " " " " " Bottom " " " " " " Average " " " " " " Surface - - " - - " Silica (mg/L) Middle - - " - - " Bottom - - - - - - Average - - " - - - Surface ! ! - - - - Chlorophyll-a (µg/L) Middle ! ! - - - - Bottom ! ! - - - - Average ! ! - - - - Surface - - - - - - E. coli (cfu/100mL) Middle - - - - - - Bottom - - - - - - Average - - - - - -
Surface - - - - - - Faecal coliforms (cfu/100mL) Middle - - - - - - Bottom - - - - - - Average - - - - - -
MIRS BAY WCZ
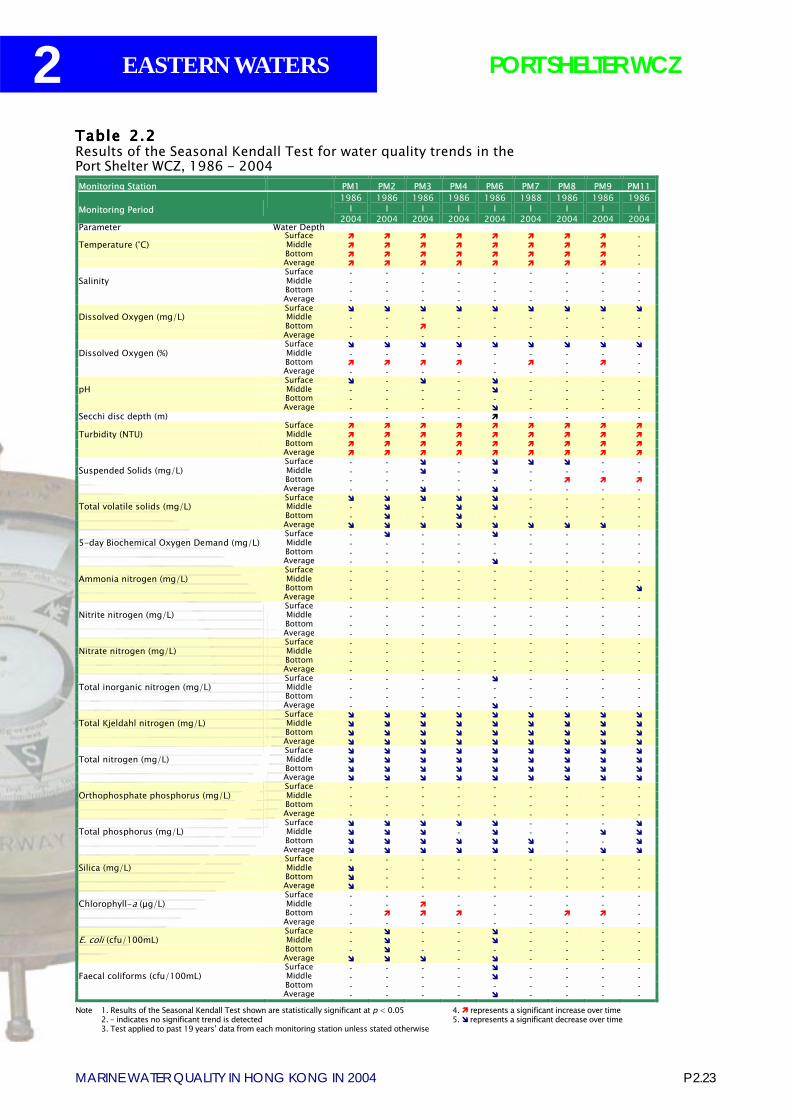
P 2.23MARINE WATER QUALITY IN HONG KONG IN 2004
2 EASTERN WATERS
Table Table Table Table Table 22222.....22222Results of the Seasonal Kendall Test for water quality trends in thePort Shelter WCZ, 1986 - 2004
Note 1. Results of the Seasonal Kendall Test shown are statistically significant at p < 0.052. � indicates no significant trend is detected3. Test applied to past 19 years� data from each monitoring station unless stated otherwise
4. ! represents a significant increase over time5. " represents a significant decrease over time
Monitoring Station PM1 PM2 PM3 PM4 PM6 PM7 PM8 PM9 PM11
Monitoring Period 1986
I 2004
1986 I
2004
1986 I
2004
1986 I
2004
1986 I
2004
1988 I
2004
1986 I
2004
1986 I
2004
1986 I
2004 Parameter Water Depth Surface ! ! ! ! ! ! ! ! - Temperature (°C) Middle ! ! ! ! ! ! ! ! - Bottom ! ! ! ! ! ! ! ! - Average ! ! ! ! ! ! ! ! - Surface - - - - - - - - - Salinity Middle - - - - - - - - -
Bottom - - - - - - - - - Average - - - - - - - - -
Surface " " " " " " " " " Dissolved Oxygen (mg/L) Middle - - - - - - - - - Bottom - - ! - - - - - - Average - - - - - - - - - Surface " " " " " " " " " Dissolved Oxygen (%) Middle - - - - - - - - - Bottom ! ! ! ! - ! - ! - Average - - - - - - - - - Surface " - " - " - - - - pH Middle - - - - " - - - - Bottom - - - - - - - - - Average - - - - " - - - - Secchi disc depth (m) - - - - ! - - - - Surface ! ! ! ! ! ! ! ! ! Turbidity (NTU) Middle ! ! ! ! ! ! ! ! ! Bottom ! ! ! ! ! ! ! ! ! Average ! ! ! ! ! ! ! ! ! Surface - - " - " " " - - Suspended Solids (mg/L) Middle - - " - " - - - - Bottom - - - - - - ! ! ! Average - - " - " - - - - Surface " " " " " - - - - Total volatile solids (mg/L) Middle - " - " " - - - - Bottom - " - " - - - - - Average " " " " " " " " - Surface - " - - " - - - - 5-day Biochemical Oxygen Demand (mg/L) Middle - - - - - - - - - Bottom - - - - - - - - - Average - - - - " - - - - Surface - - - - - - - - - Ammonia nitrogen (mg/L) Middle - - - - - - - - - Bottom - - - - - - - - " Average - - - - - - - - - Surface - - - - - - - - - Nitrite nitrogen (mg/L) Middle - - - - - - - - - Bottom - - - - - - - - - Average - - - - - - - - - Surface - - - - - - - - - Nitrate nitrogen (mg/L) Middle - - - - - - - - - Bottom - - - - - - - - - Average - - - - - - - - - Surface - - - - " - - - - Total inorganic nitrogen (mg/L) Middle - - - - - - - - - Bottom - - - - - - - - - Average - - - - " - - - - Surface " " " " " " " " " Total Kjeldahl nitrogen (mg/L) Middle " " " " " " " " " Bottom " " " " " " " " " Average " " " " " " " " " Surface " " " " " " " " " Total nitrogen (mg/L) Middle " " " " " " " " " Bottom " " " " " " " " " Average " " " " " " " " " Surface - - - - - - - - - Orthophosphate phosphorus (mg/L) Middle - - - - - - - - - Bottom - - - - - - - - - Average - - - - - - - - - Surface " " " " " - - - " Total phosphorus (mg/L) Middle " " " - " - - " " Bottom " " " " " " - - " Average " " " " " " - " " Surface - - - - - - - - - Silica (mg/L) Middle " - - - - - - - - Bottom " - - - - - - - - Average " - - - - - - - Surface - - - - - - - - - Chlorophyll-a (µg/L) Middle - - ! - - - - - - Bottom - ! ! ! - - ! ! - Average - - - - - - - - - Surface - " - - " - - - - E. coli (cfu/100mL) Middle - " - - " - - - - Bottom - " - - - - - - - Average " " " - " - - - -
Surface - - - - " - - - - Faecal coliforms (cfu/100mL) Middle - - - - " - - - - Bottom - - - - - - - - - Average - - - - " - - - -
PORT SHELTER WCZ
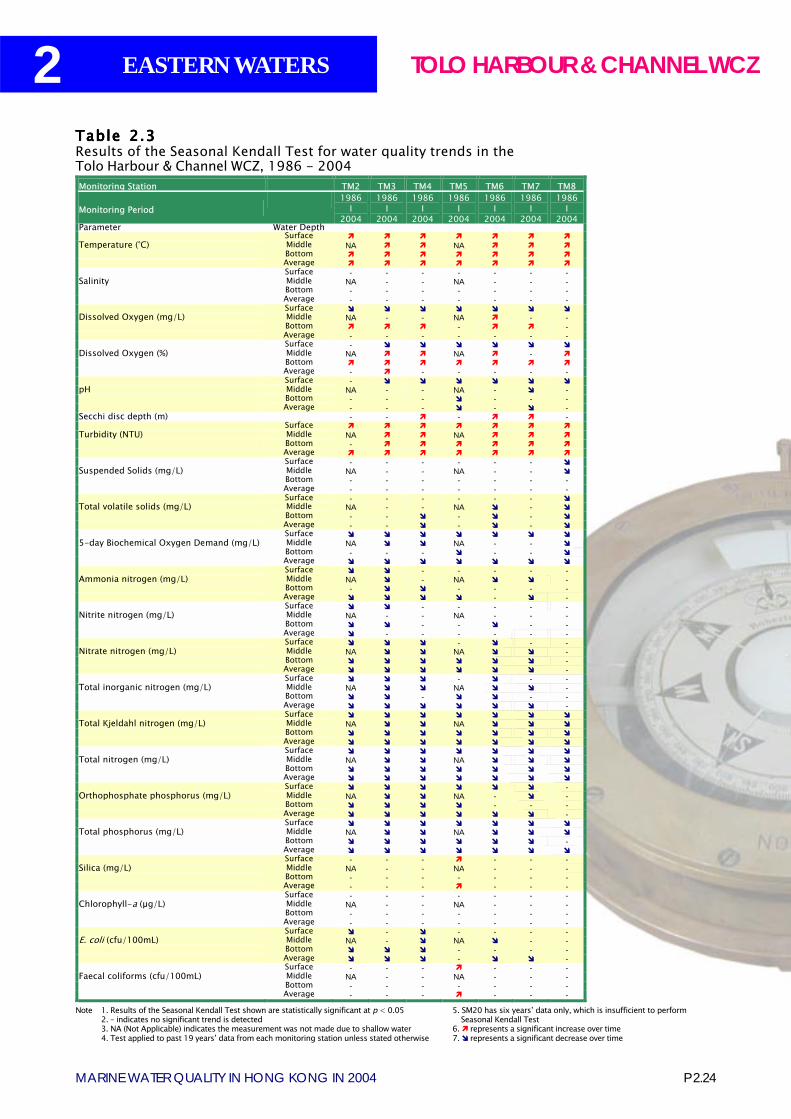
2
P 2.24MARINE WATER QUALITY IN HONG KONG IN 2004
EASTERN WATERS
Table Table Table Table Table 22222.....33333Results of the Seasonal Kendall Test for water quality trends in theTolo Harbour & Channel WCZ, 1986 - 2004
Note 1. Results of the Seasonal Kendall Test shown are statistically significant at p < 0.052. � indicates no significant trend is detected3. NA (Not Applicable) indicates the measurement was not made due to shallow water4. Test applied to past 19 years� data from each monitoring station unless stated otherwise
5. SM20 has six years� data only, which is insufficient to perform Seasonal Kendall Test6. ! represents a significant increase over time7. " represents a significant decrease over time
Monitoring Station TM2 TM3 TM4 TM5 TM6 TM7 TM8
Monitoring Period 1986
I 2004
1986 I
2004
1986 I
2004
1986 I
2004
1986 I
2004
1986 I
2004
1986 I
2004 Parameter Water Depth Surface ! ! ! ! ! ! ! Temperature (°C) Middle NA ! ! NA ! ! ! Bottom ! ! ! ! ! ! ! Average ! ! ! ! ! ! ! Surface - - - - - - - Salinity Middle NA - - NA - - -
Bottom - - - - - - - Average - - - - - - -
Surface " " " " " " " Dissolved Oxygen (mg/L) Middle NA - - NA ! - - Bottom ! ! ! - ! ! - Average - - - - - - - Surface - " " " " " " Dissolved Oxygen (%) Middle NA ! ! NA ! - ! Bottom ! ! ! ! ! ! ! Average - ! - - - - - Surface - " " " " " " pH Middle NA - - NA - " - Bottom - - - " - - - Average - - - " - " - Secchi disc depth (m) - - ! - ! ! - Surface ! ! ! ! ! ! ! Turbidity (NTU) Middle NA ! ! NA ! ! ! Bottom - ! ! ! ! ! ! Average ! ! ! ! ! ! ! Surface - - - - - - " Suspended Solids (mg/L) Middle NA - - NA - - " Bottom - - - - - - - Average - - - - - - - Surface - - - - - - " Total volatile solids (mg/L) Middle NA - - NA " - " Bottom - - " - " - " Average - - " - " - " Surface " " " " " " " 5-day Biochemical Oxygen Demand (mg/L) Middle NA " " NA - - " Bottom - - - " - - " Average " " " " " " " Surface " " - - - - - Ammonia nitrogen (mg/L) Middle NA " - NA " " - Bottom - " " - - - - Average " " " " - " - Surface " " - - - - - Nitrite nitrogen (mg/L) Middle NA - - NA - - - Bottom " " - - " - - Average " - - - - - - Surface " " " - " - - Nitrate nitrogen (mg/L) Middle NA " " NA " " - Bottom " " " " " " - Average " " " " " " - Surface " " " - " - - Total inorganic nitrogen (mg/L) Middle NA " " NA " " - Bottom " " - " " - - Average " " " " " " - Surface " " " " " " " Total Kjeldahl nitrogen (mg/L) Middle NA " " NA " " " Bottom " " " " " " " Average " " " " " " " Surface " " " " " " " Total nitrogen (mg/L) Middle NA " " NA " " " Bottom " " " " " " " Average " " " " " " " Surface " " " " " " - Orthophosphate phosphorus (mg/L) Middle NA " " NA - " - Bottom " " " " - - - Average " " " " " " - Surface " " " " " " " Total phosphorus (mg/L) Middle NA " " NA " " " Bottom " " " " " " - Average " " " " " " " Surface - - - ! - - - Silica (mg/L) Middle NA - - NA - - - Bottom - - - - - - - Average - - - ! - - - Surface - - - - - - - Chlorophyll-a (µg/L) Middle NA - - NA - - - Bottom - - - - - - - Average - - - - - - - Surface " - " - - - - E. coli (cfu/100mL) Middle NA - " NA " - - Bottom " " " - - - - Average " " " - " " -
Surface - - - ! - - - Faecal coliforms (cfu/100mL) Middle NA - - NA - - - Bottom - - - - - - - Average - - - ! - - -
TOLO HARBOUR & CHANNEL WCZ
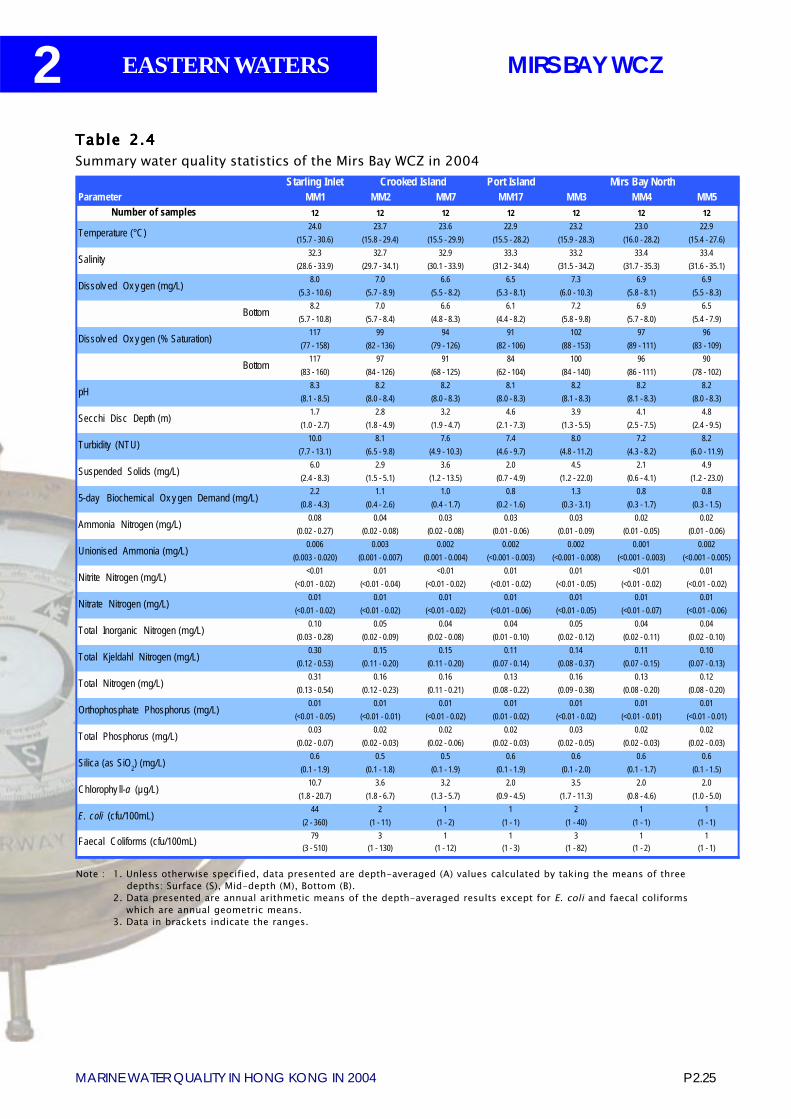
P 2.25MARINE WATER QUALITY IN HONG KONG IN 2004
2 EASTERN WATERS
Note : 1. Unless otherwise specified, data presented are depth-averaged (A) values calculated by taking the means of threedepths: Surface (S), Mid-depth (M), Bottom (B).
2. Data presented are annual arithmetic means of the depth-averaged results except for E. coli and faecal coliformswhich are annual geometric means.
3. Data in brackets indicate the ranges.
Starling Inlet Port IslandParameter MM1 MM2 MM7 MM17 MM3 MM4 MM5
Number of samples 12 12 12 12 12 12 1224.0 23.7 23.6 22.9 23.2 23.0 22.9
(15.7 - 30.6) (15.8 - 29.4) (15.5 - 29.9) (15.5 - 28.2) (15.9 - 28.3) (16.0 - 28.2) (15.4 - 27.6)32.3 32.7 32.9 33.3 33.2 33.4 33.4
(28.6 - 33.9) (29.7 - 34.1) (30.1 - 33.9) (31.2 - 34.4) (31.5 - 34.2) (31.7 - 35.3) (31.6 - 35.1)8.0 7.0 6.6 6.5 7.3 6.9 6.9
(5.3 - 10.6) (5.7 - 8.9) (5.5 - 8.2) (5.3 - 8.1) (6.0 - 10.3) (5.8 - 8.1) (5.5 - 8.3)8.2 7.0 6.6 6.1 7.2 6.9 6.5
(5.7 - 10.8) (5.7 - 8.4) (4.8 - 8.3) (4.4 - 8.2) (5.8 - 9.8) (5.7 - 8.0) (5.4 - 7.9)117 99 94 91 102 97 96
(77 - 158) (82 - 136) (79 - 126) (82 - 106) (88 - 153) (89 - 111) (83 - 109)117 97 91 84 100 96 90
(83 - 160) (84 - 126) (68 - 125) (62 - 104) (84 - 140) (86 - 111) (78 - 102)8.3 8.2 8.2 8.1 8.2 8.2 8.2
(8.1 - 8.5) (8.0 - 8.4) (8.0 - 8.3) (8.0 - 8.3) (8.1 - 8.3) (8.1 - 8.3) (8.0 - 8.3)1.7 2.8 3.2 4.6 3.9 4.1 4.8
(1.0 - 2.7) (1.8 - 4.9) (1.9 - 4.7) (2.1 - 7.3) (1.3 - 5.5) (2.5 - 7.5) (2.4 - 9.5)10.0 8.1 7.6 7.4 8.0 7.2 8.2
(7.7 - 13.1) (6.5 - 9.8) (4.9 - 10.3) (4.6 - 9.7) (4.8 - 11.2) (4.3 - 8.2) (6.0 - 11.9)6.0 2.9 3.6 2.0 4.5 2.1 4.9
(2.4 - 8.3) (1.5 - 5.1) (1.2 - 13.5) (0.7 - 4.9) (1.2 - 22.0) (0.6 - 4.1) (1.2 - 23.0)2.2 1.1 1.0 0.8 1.3 0.8 0.8
(0.8 - 4.3) (0.4 - 2.6) (0.4 - 1.7) (0.2 - 1.6) (0.3 - 3.1) (0.3 - 1.7) (0.3 - 1.5)0.08 0.04 0.03 0.03 0.03 0.02 0.02
(0.02 - 0.27) (0.02 - 0.08) (0.02 - 0.08) (0.01 - 0.06) (0.01 - 0.09) (0.01 - 0.05) (0.01 - 0.06)0.006 0.003 0.002 0.002 0.002 0.001 0.002
(0.003 - 0.020) (0.001 - 0.007) (0.001 - 0.004) (<0.001 - 0.003) (<0.001 - 0.008) (<0.001 - 0.003) (<0.001 - 0.005)<0.01 0.01 <0.01 0.01 0.01 <0.01 0.01
(<0.01 - 0.02) (<0.01 - 0.04) (<0.01 - 0.02) (<0.01 - 0.02) (<0.01 - 0.05) (<0.01 - 0.02) (<0.01 - 0.02)0.01 0.01 0.01 0.01 0.01 0.01 0.01
(<0.01 - 0.02) (<0.01 - 0.02) (<0.01 - 0.02) (<0.01 - 0.06) (<0.01 - 0.05) (<0.01 - 0.07) (<0.01 - 0.06) 0.10 0.05 0.04 0.04 0.05 0.04 0.04
(0.03 - 0.28) (0.02 - 0.09) (0.02 - 0.08) (0.01 - 0.10) (0.02 - 0.12) (0.02 - 0.11) (0.02 - 0.10)0.30 0.15 0.15 0.11 0.14 0.11 0.10
(0.12 - 0.53) (0.11 - 0.20) (0.11 - 0.20) (0.07 - 0.14) (0.08 - 0.37) (0.07 - 0.15) (0.07 - 0.13)0.31 0.16 0.16 0.13 0.16 0.13 0.12
(0.13 - 0.54) (0.12 - 0.23) (0.11 - 0.21) (0.08 - 0.22) (0.09 - 0.38) (0.08 - 0.20) (0.08 - 0.20)0.01 0.01 0.01 0.01 0.01 0.01 0.01
(<0.01 - 0.05) (<0.01 - 0.01) (<0.01 - 0.02) (0.01 - 0.02) (<0.01 - 0.02) (<0.01 - 0.01) (<0.01 - 0.01)0.03 0.02 0.02 0.02 0.03 0.02 0.02
(0.02 - 0.07) (0.02 - 0.03) (0.02 - 0.06) (0.02 - 0.03) (0.02 - 0.05) (0.02 - 0.03) (0.02 - 0.03)0.6 0.5 0.5 0.6 0.6 0.6 0.6
(0.1 - 1.9) (0.1 - 1.8) (0.1 - 1.9) (0.1 - 1.9) (0.1 - 2.0) (0.1 - 1.7) (0.1 - 1.5)10.7 3.6 3.2 2.0 3.5 2.0 2.0
(1.8 - 20.7) (1.8 - 6.7) (1.3 - 5.7) (0.9 - 4.5) (1.7 - 11.3) (0.8 - 4.6) (1.0 - 5.0)44 2 1 1 2 1 1
(2 - 360) (1 - 11) (1 - 2) (1 - 1) (1 - 40) (1 - 1) (1 - 1)79 3 1 1 3 1 1
(3 - 510) (1 - 130) (1 - 12) (1 - 3) (1 - 82) (1 - 2) (1 - 1)
Crooked Island Mirs Bay North
Bottom
Bottom
Total Phosphorus (mg/L)
Silica (as SiO2) (mg/L)
pH
Total Kjeldahl Nitrogen (mg/L)
Total Nitrogen (mg/L)
Secchi Disc Depth (m)
Turbidity (NTU)
Suspended Solids (mg/L)
Faecal Coliforms (cfu/100mL)
E. coli (cfu/100mL)
Chlorophy ll-a (µg/L)
5-day Biochemical Ox y gen Demand (mg/L)
Orthophosphate Phosphorus (mg/L)
Total Inorganic Nitrogen (mg/L)
Unionised Ammonia (mg/L)
Nitrite Nitrogen (mg/L)
Nitrate Nitrogen (mg/L)
Ammonia Nitrogen (mg/L)
Temperature (°C)
Salinity
Dissolv ed Ox y gen (mg/L)
Dissolv ed Ox y gen (% Saturation)
Table Table Table Table Table 22222.....44444Summary water quality statistics of the Mirs Bay WCZ in 2004
MIRS BAY WCZ
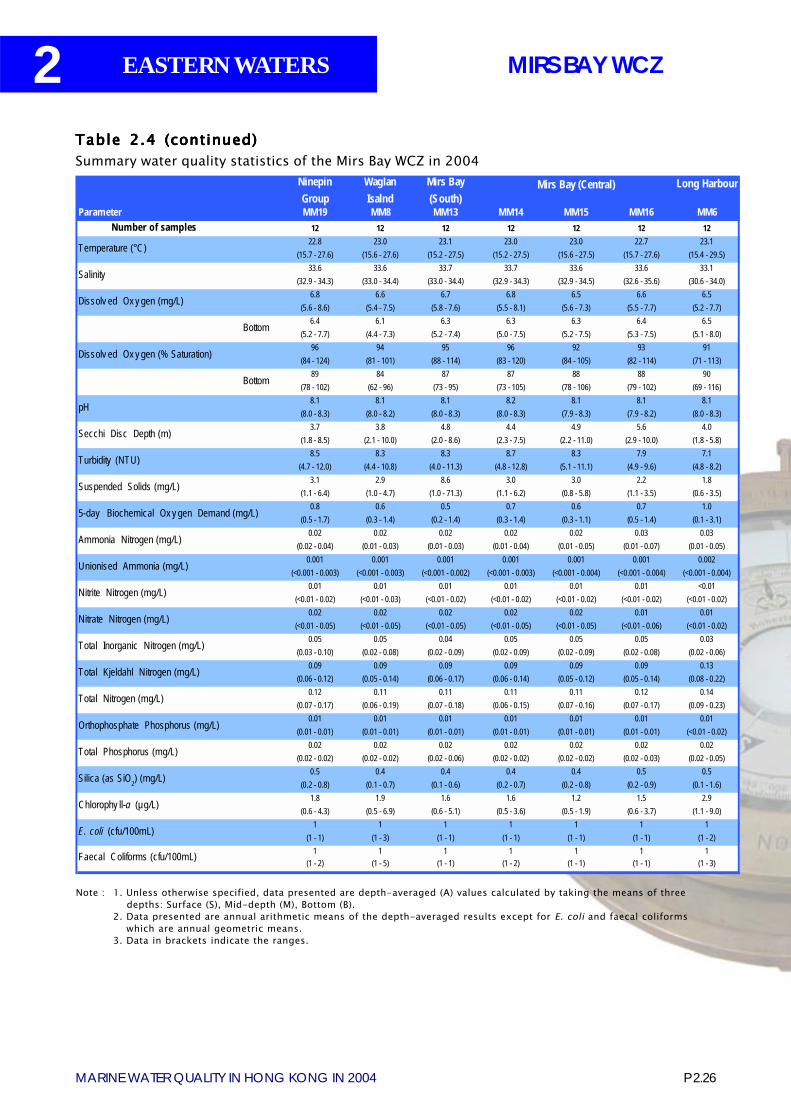
2
P 2.26MARINE WATER QUALITY IN HONG KONG IN 2004
EASTERN WATERS
NinepinGroup
WaglanIsalnd
Mirs Bay(South)
Long Harbour
Parameter MM19 MM8 MM13 MM14 MM15 MM16 MM6Number of samples 12 12 12 12 12 12 12
22.8 23.0 23.1 23.0 23.0 22.7 23.1(15.7 - 27.6) (15.6 - 27.6) (15.2 - 27.5) (15.2 - 27.5) (15.6 - 27.5) (15.7 - 27.6) (15.4 - 29.5)
33.6 33.6 33.7 33.7 33.6 33.6 33.1(32.9 - 34.3) (33.0 - 34.4) (33.0 - 34.4) (32.9 - 34.3) (32.9 - 34.5) (32.6 - 35.6) (30.6 - 34.0)
6.8 6.6 6.7 6.8 6.5 6.6 6.5(5.6 - 8.6) (5.4 - 7.5) (5.8 - 7.6) (5.5 - 8.1) (5.6 - 7.3) (5.5 - 7.7) (5.2 - 7.7)
6.4 6.1 6.3 6.3 6.3 6.4 6.5(5.2 - 7.7) (4.4 - 7.3) (5.2 - 7.4) (5.0 - 7.5) (5.2 - 7.5) (5.3 - 7.5) (5.1 - 8.0)
96 94 95 96 92 93 91(84 - 124) (81 - 101) (88 - 114) (83 - 120) (84 - 105) (82 - 114) (71 - 113)
89 84 87 87 88 88 90(78 - 102) (62 - 96) (73 - 95) (73 - 105) (78 - 106) (79 - 102) (69 - 116)
8.1 8.1 8.1 8.2 8.1 8.1 8.1(8.0 - 8.3) (8.0 - 8.2) (8.0 - 8.3) (8.0 - 8.3) (7.9 - 8.3) (7.9 - 8.2) (8.0 - 8.3)
3.7 3.8 4.8 4.4 4.9 5.6 4.0(1.8 - 8.5) (2.1 - 10.0) (2.0 - 8.6) (2.3 - 7.5) (2.2 - 11.0) (2.9 - 10.0) (1.8 - 5.8)
8.5 8.3 8.3 8.7 8.3 7.9 7.1(4.7 - 12.0) (4.4 - 10.8) (4.0 - 11.3) (4.8 - 12.8) (5.1 - 11.1) (4.9 - 9.6) (4.8 - 8.2)
3.1 2.9 8.6 3.0 3.0 2.2 1.8(1.1 - 6.4) (1.0 - 4.7) (1.0 - 71.3) (1.1 - 6.2) (0.8 - 5.8) (1.1 - 3.5) (0.6 - 3.5)
0.8 0.6 0.5 0.7 0.6 0.7 1.0(0.5 - 1.7) (0.3 - 1.4) (0.2 - 1.4) (0.3 - 1.4) (0.3 - 1.1) (0.5 - 1.4) (0.1 - 3.1)
0.02 0.02 0.02 0.02 0.02 0.03 0.03(0.02 - 0.04) (0.01 - 0.03) (0.01 - 0.03) (0.01 - 0.04) (0.01 - 0.05) (0.01 - 0.07) (0.01 - 0.05)
0.001 0.001 0.001 0.001 0.001 0.001 0.002(<0.001 - 0.003) (<0.001 - 0.003) (<0.001 - 0.002) (<0.001 - 0.003) (<0.001 - 0.004) (<0.001 - 0.004) (<0.001 - 0.004)
0.01 0.01 0.01 0.01 0.01 0.01 <0.01(<0.01 - 0.02) (<0.01 - 0.03) (<0.01 - 0.02) (<0.01 - 0.02) (<0.01 - 0.02) (<0.01 - 0.02) (<0.01 - 0.02)
0.02 0.02 0.02 0.02 0.02 0.01 0.01(<0.01 - 0.05) (<0.01 - 0.05) (<0.01 - 0.05) (<0.01 - 0.05) (<0.01 - 0.05) (<0.01 - 0.06) (<0.01 - 0.02)
0.05 0.05 0.04 0.05 0.05 0.05 0.03(0.03 - 0.10) (0.02 - 0.08) (0.02 - 0.09) (0.02 - 0.09) (0.02 - 0.09) (0.02 - 0.08) (0.02 - 0.06)
0.09 0.09 0.09 0.09 0.09 0.09 0.13(0.06 - 0.12) (0.05 - 0.14) (0.06 - 0.17) (0.06 - 0.14) (0.05 - 0.12) (0.05 - 0.14) (0.08 - 0.22)
0.12 0.11 0.11 0.11 0.11 0.12 0.14(0.07 - 0.17) (0.06 - 0.19) (0.07 - 0.18) (0.06 - 0.15) (0.07 - 0.16) (0.07 - 0.17) (0.09 - 0.23)
0.01 0.01 0.01 0.01 0.01 0.01 0.01(0.01 - 0.01) (0.01 - 0.01) (0.01 - 0.01) (0.01 - 0.01) (0.01 - 0.01) (0.01 - 0.01) (<0.01 - 0.02)
0.02 0.02 0.02 0.02 0.02 0.02 0.02(0.02 - 0.02) (0.02 - 0.02) (0.02 - 0.06) (0.02 - 0.02) (0.02 - 0.02) (0.02 - 0.03) (0.02 - 0.05)
0.5 0.4 0.4 0.4 0.4 0.5 0.5(0.2 - 0.8) (0.1 - 0.7) (0.1 - 0.6) (0.2 - 0.7) (0.2 - 0.8) (0.2 - 0.9) (0.1 - 1.6)
1.8 1.9 1.6 1.6 1.2 1.5 2.9(0.6 - 4.3) (0.5 - 6.9) (0.6 - 5.1) (0.5 - 3.6) (0.5 - 1.9) (0.6 - 3.7) (1.1 - 9.0)
1 1 1 1 1 1 1(1 - 1) (1 - 3) (1 - 1) (1 - 1) (1 - 1) (1 - 1) (1 - 2)
1 1 1 1 1 1 1(1 - 2) (1 - 5) (1 - 1) (1 - 2) (1 - 1) (1 - 1) (1 - 3)
Silica (as SiO2) (mg/L)
Mirs Bay (Central)
Temperature (°C)
Salinity
Dissolv ed Ox y gen (mg/L)
Suspended Solids (mg/L)
Bottom
Bottom
Total Phosphorus (mg/L)
Dissolv ed Ox y gen (% Saturation)
Faecal Coliforms (cfu/100mL)
E. coli (cfu/100mL)
Chlorophy ll-a (µg/L)
5-day Biochemical Ox y gen Demand (mg/L)
Orthophosphate Phosphorus (mg/L)
Total Inorganic Nitrogen (mg/L)
Unionised Ammonia (mg/L)
Nitrite Nitrogen (mg/L)
Nitrate Nitrogen (mg/L)
Ammonia Nitrogen (mg/L)
pH
Total Kjeldahl Nitrogen (mg/L)
Total Nitrogen (mg/L)
Secchi Disc Depth (m)
Turbidity (NTU)
Table Table Table Table Table 22222.....4 (continued)4 (continued)4 (continued)4 (continued)4 (continued)Summary water quality statistics of the Mirs Bay WCZ in 2004
Note : 1. Unless otherwise specified, data presented are depth-averaged (A) values calculated by taking the means of threedepths: Surface (S), Mid-depth (M), Bottom (B).
2. Data presented are annual arithmetic means of the depth-averaged results except for E. coli and faecal coliformswhich are annual geometric means.
3. Data in brackets indicate the ranges.
MIRS BAY WCZ
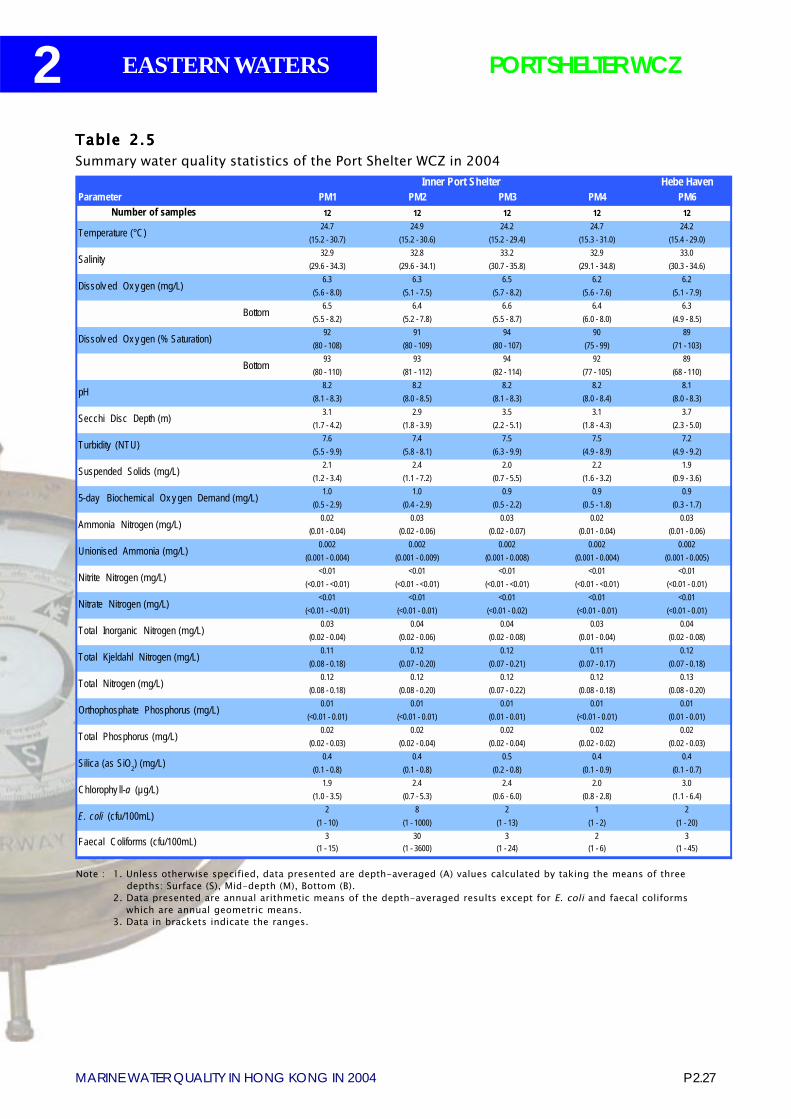
P 2.27MARINE WATER QUALITY IN HONG KONG IN 2004
2 EASTERN WATERS
Hebe HavenParameter PM1 PM2 PM3 PM4 PM6
Number of samples 12 12 12 12 1224.7 24.9 24.2 24.7 24.2
(15.2 - 30.7) (15.2 - 30.6) (15.2 - 29.4) (15.3 - 31.0) (15.4 - 29.0)32.9 32.8 33.2 32.9 33.0
(29.6 - 34.3) (29.6 - 34.1) (30.7 - 35.8) (29.1 - 34.8) (30.3 - 34.6)6.3 6.3 6.5 6.2 6.2
(5.6 - 8.0) (5.1 - 7.5) (5.7 - 8.2) (5.6 - 7.6) (5.1 - 7.9)6.5 6.4 6.6 6.4 6.3
(5.5 - 8.2) (5.2 - 7.8) (5.5 - 8.7) (6.0 - 8.0) (4.9 - 8.5)92 91 94 90 89
(80 - 108) (80 - 109) (80 - 107) (75 - 99) (71 - 103)93 93 94 92 89
(80 - 110) (81 - 112) (82 - 114) (77 - 105) (68 - 110)8.2 8.2 8.2 8.2 8.1
(8.1 - 8.3) (8.0 - 8.5) (8.1 - 8.3) (8.0 - 8.4) (8.0 - 8.3)3.1 2.9 3.5 3.1 3.7
(1.7 - 4.2) (1.8 - 3.9) (2.2 - 5.1) (1.8 - 4.3) (2.3 - 5.0)7.6 7.4 7.5 7.5 7.2
(5.5 - 9.9) (5.8 - 8.1) (6.3 - 9.9) (4.9 - 8.9) (4.9 - 9.2)2.1 2.4 2.0 2.2 1.9
(1.2 - 3.4) (1.1 - 7.2) (0.7 - 5.5) (1.6 - 3.2) (0.9 - 3.6)1.0 1.0 0.9 0.9 0.9
(0.5 - 2.9) (0.4 - 2.9) (0.5 - 2.2) (0.5 - 1.8) (0.3 - 1.7)0.02 0.03 0.03 0.02 0.03
(0.01 - 0.04) (0.02 - 0.06) (0.02 - 0.07) (0.01 - 0.04) (0.01 - 0.06)0.002 0.002 0.002 0.002 0.002
(0.001 - 0.004) (0.001 - 0.009) (0.001 - 0.008) (0.001 - 0.004) (0.001 - 0.005)<0.01 <0.01 <0.01 <0.01 <0.01
(<0.01 - <0.01) (<0.01 - <0.01) (<0.01 - <0.01) (<0.01 - <0.01) (<0.01 - 0.01)<0.01 <0.01 <0.01 <0.01 <0.01
(<0.01 - <0.01) (<0.01 - 0.01) (<0.01 - 0.02) (<0.01 - 0.01) (<0.01 - 0.01) 0.03 0.04 0.04 0.03 0.04
(0.02 - 0.04) (0.02 - 0.06) (0.02 - 0.08) (0.01 - 0.04) (0.02 - 0.08)0.11 0.12 0.12 0.11 0.12
(0.08 - 0.18) (0.07 - 0.20) (0.07 - 0.21) (0.07 - 0.17) (0.07 - 0.18)0.12 0.12 0.12 0.12 0.13
(0.08 - 0.18) (0.08 - 0.20) (0.07 - 0.22) (0.08 - 0.18) (0.08 - 0.20)0.01 0.01 0.01 0.01 0.01
(<0.01 - 0.01) (<0.01 - 0.01) (0.01 - 0.01) (<0.01 - 0.01) (0.01 - 0.01)0.02 0.02 0.02 0.02 0.02
(0.02 - 0.03) (0.02 - 0.04) (0.02 - 0.04) (0.02 - 0.02) (0.02 - 0.03)0.4 0.4 0.5 0.4 0.4
(0.1 - 0.8) (0.1 - 0.8) (0.2 - 0.8) (0.1 - 0.9) (0.1 - 0.7)1.9 2.4 2.4 2.0 3.0
(1.0 - 3.5) (0.7 - 5.3) (0.6 - 6.0) (0.8 - 2.8) (1.1 - 6.4)2 8 2 1 2
(1 - 10) (1 - 1000) (1 - 13) (1 - 2) (1 - 20)3 30 3 2 3
(1 - 15) (1 - 3600) (1 - 24) (1 - 6) (1 - 45)
Inner Port Shelter
Bottom
Temperature (°C)
Salinity
Dissolv ed Ox y gen (mg/L)
Bottom
Total Phosphorus (mg/L)
Silica (as SiO2) (mg/L)
pH
Total Kjeldahl Nitrogen (mg/L)
Total Nitrogen (mg/L)
Faecal Coliforms (cfu/100mL)
E. coli (cfu/100mL)
Chlorophy ll-a (µg/L)
5-day Biochemical Ox y gen Demand (mg/L)
Orthophosphate Phosphorus (mg/L)
Total Inorganic Nitrogen (mg/L)
Nitrate Nitrogen (mg/L)
Dissolv ed Ox y gen (% Saturation)
Secchi Disc Depth (m)
Unionised Ammonia (mg/L)
Nitrite Nitrogen (mg/L)
Turbidity (NTU)
Suspended Solids (mg/L)
Ammonia Nitrogen (mg/L)
Table Table Table Table Table 22222.....55555Summary water quality statistics of the Port Shelter WCZ in 2004
Note : 1. Unless otherwise specified, data presented are depth-averaged (A) values calculated by taking the means of threedepths: Surface (S), Mid-depth (M), Bottom (B).
2. Data presented are annual arithmetic means of the depth-averaged results except for E. coli and faecal coliformswhich are annual geometric means.
3. Data in brackets indicate the ranges.
PORT SHELTER WCZ

2
P 2.28MARINE WATER QUALITY IN HONG KONG IN 2004
EASTERN WATERS
Rocky Harbour Bluff IslandParameter PM7 PM8 PM9 PM11
Number of samples 12 12 12 1223.8 23.4 23.6 23.3
(15.3 - 28.9) (15.6 - 27.5) (15.4 - 28.4) (15.6 - 27.5)33.5 33.6 33.5 33.6
(32.3 - 34.5) (32.7 - 35.1) (31.7 - 34.7) (32.7 - 34.5)6.7 6.7 6.5 6.6
(5.6 - 8.4) (5.6 - 8.1) (5.7 - 8.2) (5.8 - 7.8)6.8 6.8 6.7 6.7
(5.6 - 8.6) (5.2 - 8.6) (5.6 - 8.8) (5.4 - 8.2)96 94 92 94
(84 - 117) (85 - 107) (85 - 106) (87 - 105)95 94 94 93
(84 - 115) (77 - 115) (85 - 114) (80 - 107)8.1 8.1 8.2 8.1
(8.1 - 8.3) (8.1 - 8.2) (8.1 - 8.3) (8.1 - 8.3)4.9 5.6 4.4 5.2
(2.5 - 8.7) (2.5 - 11.0) (1.6 - 8.9) (2.2 - 11.0)7.9 7.6 7.5 7.8
(4.7 - 14.0) (5.0 - 10.9) (5.2 - 10.9) (5.9 - 11.4)1.7 1.9 1.9 2.2
(0.6 - 5.5) (0.9 - 5.6) (0.9 - 4.2) (1.1 - 5.0)0.8 0.7 0.7 0.9
(0.1 - 1.9) (0.1 - 1.6) (0.2 - 1.4) (0.1 - 4.0)0.02 0.02 0.02 0.02
(0.01 - 0.04) (0.01 - 0.04) (0.01 - 0.04) (0.01 - 0.04)0.001 0.001 0.001 0.001
(<0.001 - 0.004) (0.001 - 0.003) (<0.001 - 0.004) (<0.001 - 0.003)<0.01 <0.01 <0.01 0.01
(<0.01 - 0.01) (<0.01 - 0.01) (<0.01 - 0.02) (<0.01 - 0.02)0.01 0.01 0.01 0.02
(<0.01 - 0.06) (<0.01 - 0.06) (<0.01 - 0.05) (<0.01 - 0.06) 0.03 0.04 0.04 0.04
(0.02 - 0.10) (0.02 - 0.10) (0.02 - 0.09) (0.02 - 0.10)0.10 0.09 0.10 0.09
(0.05 - 0.15) (0.06 - 0.13) (0.06 - 0.14) (0.06 - 0.13)0.11 0.11 0.11 0.11
(0.06 - 0.19) (0.07 - 0.19) (0.07 - 0.19) (0.06 - 0.17)0.01 0.01 0.01 0.01
(0.01 - 0.01) (0.01 - 0.01) (0.01 - 0.01) (0.01 - 0.01)0.02 0.02 0.02 0.02
(0.02 - 0.03) (0.02 - 0.02) (0.02 - 0.02) (0.02 - 0.02)0.5 0.5 0.5 0.6
(0.2 - 1.1) (0.1 - 1.2) (0.2 - 1.2) (0.2 - 1.1)1.9 1.6 1.6 1.7
(0.8 - 3.7) (0.6 - 3.1) (0.5 - 2.5) (0.5 - 3.0)1 1 1 1
(1 - 2) (1 - 1) (1 - 1) (1 - 1)1 1 1 1
(1 - 2) (1 - 1) (1 - 2) (1 - 1)Faecal Coliforms (cfu/100mL)
E. coli (cfu/100mL)
Chlorophy ll-a (µg/L)
5-day Biochemical Ox y gen Demand (mg/L)
Orthophosphate Phosphorus (mg/L)
Total Inorganic Nitrogen (mg/L)
Nitrate Nitrogen (mg/L)
Unionised Ammonia (mg/L)
Silica (as SiO2) (mg/L)
Outer Port Shelter
Bottom
Total Phosphorus (mg/L)
Dissolv ed Ox y gen (% Saturation)
Bottom
Temperature (°C)
Salinity
Dissolv ed Ox y gen (mg/L)
Suspended Solids (mg/L)
Ammonia Nitrogen (mg/L)
pH
Total Kjeldahl Nitrogen (mg/L)
Total Nitrogen (mg/L)
Secchi Disc Depth (m)
Turbidity (NTU)
Nitrite Nitrogen (mg/L)
Table Table Table Table Table 22222.....5 (continued)5 (continued)5 (continued)5 (continued)5 (continued)Summary water quality statistics of the Port Shelter WCZ in 2004
Note : 1. Unless otherwise specified, data presented are depth-averaged (A) values calculated by taking the means of threedepths: Surface (S), Mid-depth (M), Bottom (B).
2. Data presented are annual arithmetic means of the depth-averaged results except for E. coli and faecal coliformswhich are annual geometric means.
3. Data in brackets indicate the ranges.
PORT SHELTER WCZ
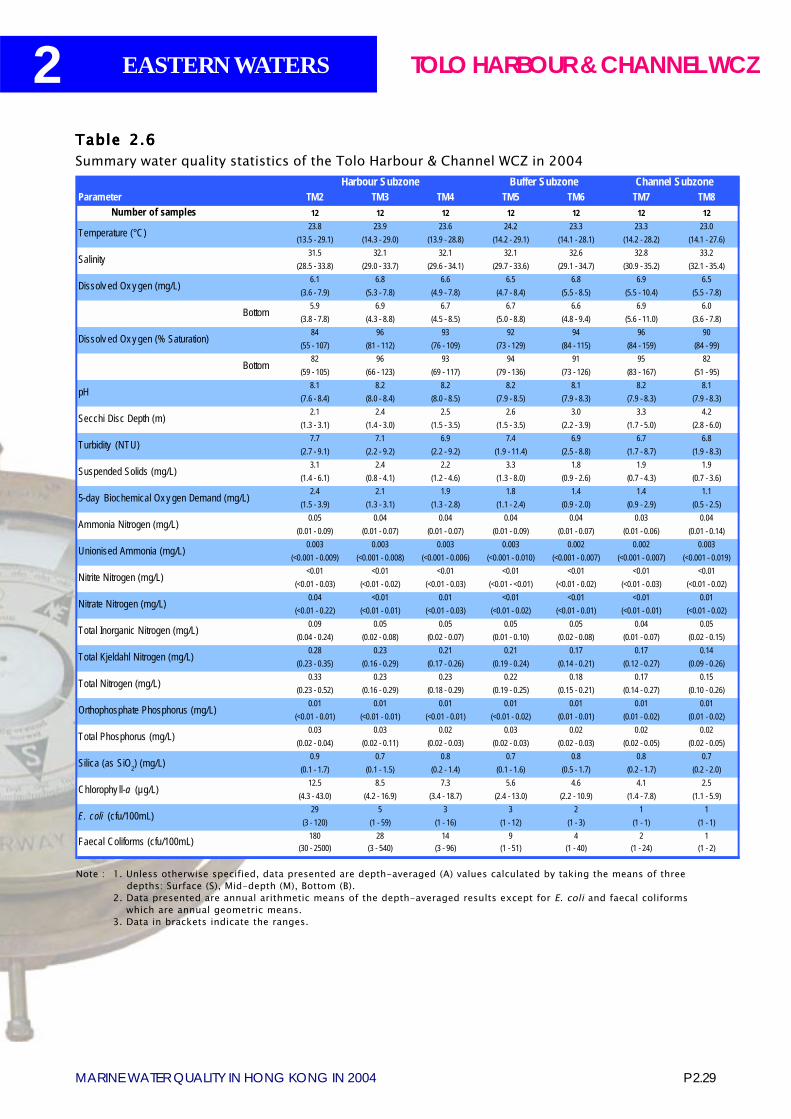
P 2.29MARINE WATER QUALITY IN HONG KONG IN 2004
2 EASTERN WATERS
Harbour Subzone Buffer Subzone Channel Subzone Parameter TM2 TM3 TM4 TM5 TM6 TM7 TM8
Number of samples 12 12 12 12 12 12 1223.8 23.9 23.6 24.2 23.3 23.3 23.0
(13.5 - 29.1) (14.3 - 29.0) (13.9 - 28.8) (14.2 - 29.1) (14.1 - 28.1) (14.2 - 28.2) (14.1 - 27.6)31.5 32.1 32.1 32.1 32.6 32.8 33.2
(28.5 - 33.8) (29.0 - 33.7) (29.6 - 34.1) (29.7 - 33.6) (29.1 - 34.7) (30.9 - 35.2) (32.1 - 35.4)6.1 6.8 6.6 6.5 6.8 6.9 6.5
(3.6 - 7.9) (5.3 - 7.8) (4.9 - 7.8) (4.7 - 8.4) (5.5 - 8.5) (5.5 - 10.4) (5.5 - 7.8)5.9 6.9 6.7 6.7 6.6 6.9 6.0
(3.8 - 7.8) (4.3 - 8.8) (4.5 - 8.5) (5.0 - 8.8) (4.8 - 9.4) (5.6 - 11.0) (3.6 - 7.8)84 96 93 92 94 96 90
(55 - 107) (81 - 112) (76 - 109) (73 - 129) (84 - 115) (84 - 159) (84 - 99)82 96 93 94 91 95 82
(59 - 105) (66 - 123) (69 - 117) (79 - 136) (73 - 126) (83 - 167) (51 - 95)8.1 8.2 8.2 8.2 8.1 8.2 8.1
(7.6 - 8.4) (8.0 - 8.4) (8.0 - 8.5) (7.9 - 8.5) (7.9 - 8.3) (7.9 - 8.3) (7.9 - 8.3)2.1 2.4 2.5 2.6 3.0 3.3 4.2
(1.3 - 3.1) (1.4 - 3.0) (1.5 - 3.5) (1.5 - 3.5) (2.2 - 3.9) (1.7 - 5.0) (2.8 - 6.0)7.7 7.1 6.9 7.4 6.9 6.7 6.8
(2.7 - 9.1) (2.2 - 9.2) (2.2 - 9.2) (1.9 - 11.4) (2.5 - 8.8) (1.7 - 8.7) (1.9 - 8.3)3.1 2.4 2.2 3.3 1.8 1.9 1.9
(1.4 - 6.1) (0.8 - 4.1) (1.2 - 4.6) (1.3 - 8.0) (0.9 - 2.6) (0.7 - 4.3) (0.7 - 3.6)2.4 2.1 1.9 1.8 1.4 1.4 1.1
(1.5 - 3.9) (1.3 - 3.1) (1.3 - 2.8) (1.1 - 2.4) (0.9 - 2.0) (0.9 - 2.9) (0.5 - 2.5)0.05 0.04 0.04 0.04 0.04 0.03 0.04
(0.01 - 0.09) (0.01 - 0.07) (0.01 - 0.07) (0.01 - 0.09) (0.01 - 0.07) (0.01 - 0.06) (0.01 - 0.14)0.003 0.003 0.003 0.003 0.002 0.002 0.003
(<0.001 - 0.009) (<0.001 - 0.008) (<0.001 - 0.006) (<0.001 - 0.010) (<0.001 - 0.007) (<0.001 - 0.007) (<0.001 - 0.019)<0.01 <0.01 <0.01 <0.01 <0.01 <0.01 <0.01
(<0.01 - 0.03) (<0.01 - 0.02) (<0.01 - 0.03) (<0.01 - <0.01) (<0.01 - 0.02) (<0.01 - 0.03) (<0.01 - 0.02)0.04 <0.01 0.01 <0.01 <0.01 <0.01 0.01
(<0.01 - 0.22) (<0.01 - 0.01) (<0.01 - 0.03) (<0.01 - 0.02) (<0.01 - 0.01) (<0.01 - 0.01) (<0.01 - 0.02) 0.09 0.05 0.05 0.05 0.05 0.04 0.05
(0.04 - 0.24) (0.02 - 0.08) (0.02 - 0.07) (0.01 - 0.10) (0.02 - 0.08) (0.01 - 0.07) (0.02 - 0.15)0.28 0.23 0.21 0.21 0.17 0.17 0.14
(0.23 - 0.35) (0.16 - 0.29) (0.17 - 0.26) (0.19 - 0.24) (0.14 - 0.21) (0.12 - 0.27) (0.09 - 0.26)0.33 0.23 0.23 0.22 0.18 0.17 0.15
(0.23 - 0.52) (0.16 - 0.29) (0.18 - 0.29) (0.19 - 0.25) (0.15 - 0.21) (0.14 - 0.27) (0.10 - 0.26)0.01 0.01 0.01 0.01 0.01 0.01 0.01
(<0.01 - 0.01) (<0.01 - 0.01) (<0.01 - 0.01) (<0.01 - 0.02) (0.01 - 0.01) (0.01 - 0.02) (0.01 - 0.02)0.03 0.03 0.02 0.03 0.02 0.02 0.02
(0.02 - 0.04) (0.02 - 0.11) (0.02 - 0.03) (0.02 - 0.03) (0.02 - 0.03) (0.02 - 0.05) (0.02 - 0.05)0.9 0.7 0.8 0.7 0.8 0.8 0.7
(0.1 - 1.7) (0.1 - 1.5) (0.2 - 1.4) (0.1 - 1.6) (0.5 - 1.7) (0.2 - 1.7) (0.2 - 2.0)12.5 8.5 7.3 5.6 4.6 4.1 2.5
(4.3 - 43.0) (4.2 - 16.9) (3.4 - 18.7) (2.4 - 13.0) (2.2 - 10.9) (1.4 - 7.8) (1.1 - 5.9)29 5 3 3 2 1 1
(3 - 120) (1 - 59) (1 - 16) (1 - 12) (1 - 3) (1 - 1) (1 - 1)180 28 14 9 4 2 1
(30 - 2500) (3 - 540) (3 - 96) (1 - 51) (1 - 40) (1 - 24) (1 - 2)Faecal Coliforms (cfu/100mL)
E. coli (cfu/100mL)
Chlorophy ll-a (µg/L)
5-day Biochemical Ox y gen Demand (mg/L)
Orthophosphate Phosphorus (mg/L)
Total Inorganic Nitrogen (mg/L)
Total Phosphorus (mg/L)
Silica (as SiO2) (mg/L)
Total Kjeldahl Nitrogen (mg/L)
Total Nitrogen (mg/L)
Nitrate Nitrogen (mg/L)
Temperature (°C)
Salinity
Dissolv ed Ox y gen (mg/L)
Dissolv ed Ox y gen (% Saturation)
Turbidity (NTU)
Suspended Solids (mg/L)
Ammonia Nitrogen (mg/L)
pH
Secchi Disc Depth (m)
Unionised Ammonia (mg/L)
Nitrite Nitrogen (mg/L)
Bottom
Bottom
Table Table Table Table Table 22222.....66666Summary water quality statistics of the Tolo Harbour & Channel WCZ in 2004
Note : 1. Unless otherwise specified, data presented are depth-averaged (A) values calculated by taking the means of threedepths: Surface (S), Mid-depth (M), Bottom (B).
2. Data presented are annual arithmetic means of the depth-averaged results except for E. coli and faecal coliformswhich are annual geometric means.
3. Data in brackets indicate the ranges.
TOLO HARBOUR & CHANNEL WCZ
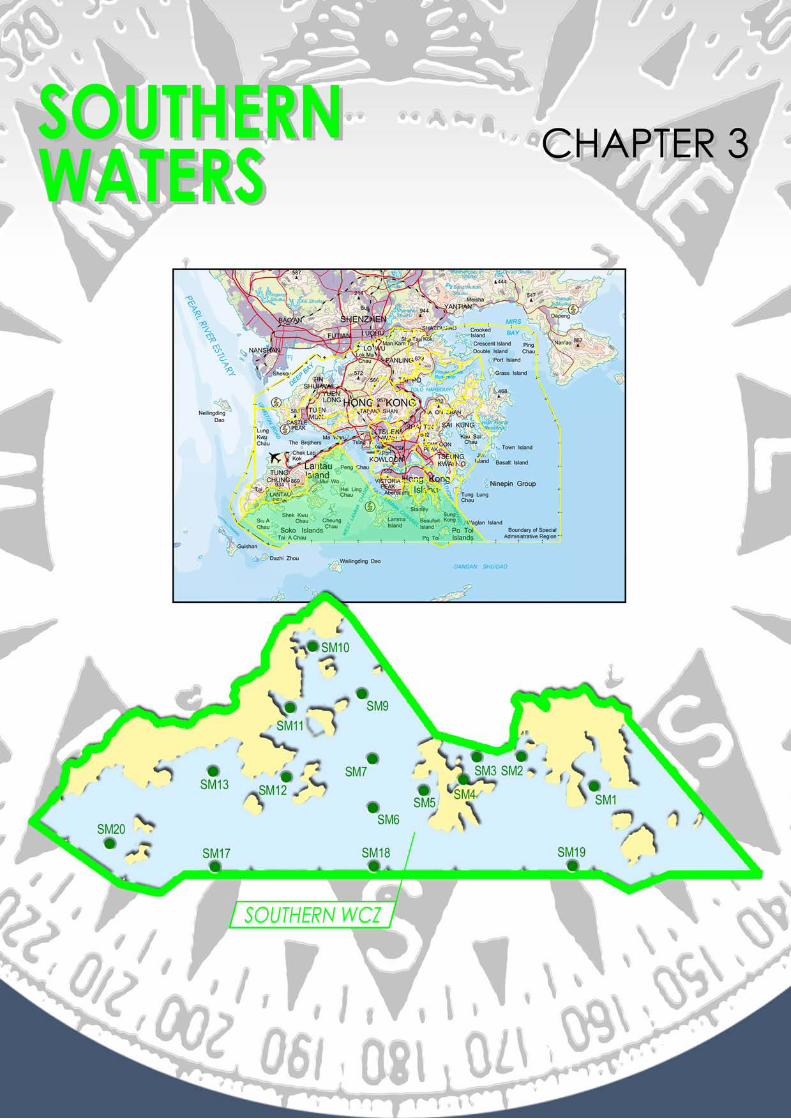
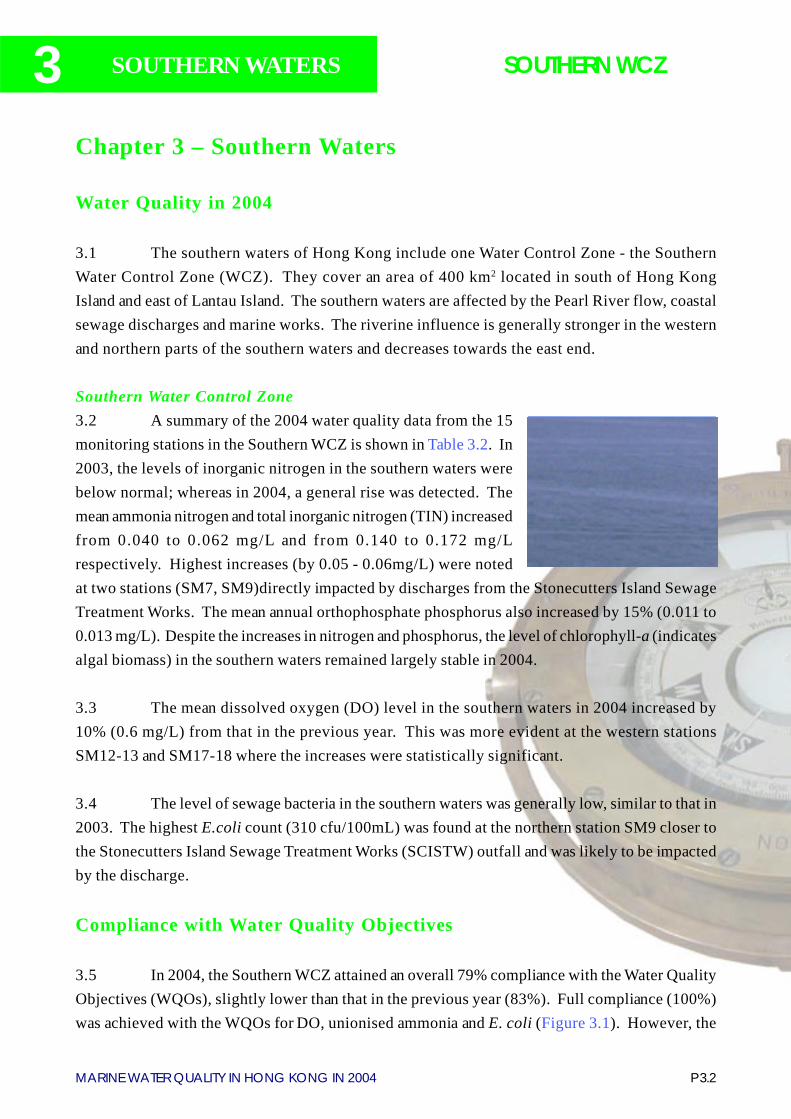
3
P 3.2MARINE WATER QUALITY IN HONG KONG IN 2004
SOUTHERN WATERS SOUTHERN WCZ
Chapter 3 – Southern Waters
Water Quality in 2004
3.1 The southern waters of Hong Kong include one Water Control Zone - the SouthernWater Control Zone (WCZ). They cover an area of 400 km2 located in south of Hong KongIsland and east of Lantau Island. The southern waters are affected by the Pearl River flow, coastalsewage discharges and marine works. The riverine influence is generally stronger in the westernand northern parts of the southern waters and decreases towards the east end.
Southern Water Control Zone3.2 A summary of the 2004 water quality data from the 15monitoring stations in the Southern WCZ is shown in Table 3.2. In2003, the levels of inorganic nitrogen in the southern waters werebelow normal; whereas in 2004, a general rise was detected. Themean ammonia nitrogen and total inorganic nitrogen (TIN) increasedfrom 0.040 to 0.062 mg/L and from 0.140 to 0.172 mg/Lrespectively. Highest increases (by 0.05 - 0.06mg/L) were notedat two stations (SM7, SM9)directly impacted by discharges from the Stonecutters Island SewageTreatment Works. The mean annual orthophosphate phosphorus also increased by 15% (0.011 to0.013 mg/L). Despite the increases in nitrogen and phosphorus, the level of chlorophyll-a (indicatesalgal biomass) in the southern waters remained largely stable in 2004.
3.3 The mean dissolved oxygen (DO) level in the southern waters in 2004 increased by10% (0.6 mg/L) from that in the previous year. This was more evident at the western stationsSM12-13 and SM17-18 where the increases were statistically significant.
3.4 The level of sewage bacteria in the southern waters was generally low, similar to that in2003. The highest E.coli count (310 cfu/100mL) was found at the northern station SM9 closer tothe Stonecutters Island Sewage Treatment Works (SCISTW) outfall and was likely to be impactedby the discharge.
Compliance with Water Quality Objectives
3.5 In 2004, the Southern WCZ attained an overall 79% compliance with the Water QualityObjectives (WQOs), slightly lower than that in the previous year (83%). Full compliance (100%)was achieved with the WQOs for DO, unionised ammonia and E. coli (Figure 3.1). However, the
iwp12
印章
P 3.3MARINE WATER QUALITY IN HONG KONG IN 2004
3 SOUTHERN WATERS SOUTHERN WCZ
compliance for TIN fell from 44% in 2003 to 31% due to an increase of ammonia nitrogen. Theoverall compliance rate, however, was still higher than that in 2002 and the previous ten years(1992-2001) which were below 20%. The stations which complied with the TIN objective weremostly located in the eastern part of the WCZ where influence from the Pearl River was lower.Generally Pearl River flow has a profound influence in the TIN levels in the western part of HongKong coastal waters.
3.6 As in previous years, the secondary contact recreation subzones (stations SM1, SM2,SM10 and SM11) achieved full compliance (100%) with the E. coli objective in 2004, indicatingtheir suitability for wind surfing, boating and other water sports activities.
Long-term Water Quality Trends
3.7 Since the mid-1980s, long-term decreasing trends in total Kjeldahl nitrogen, totalnitrogen and total phosphorus were detected in two areas: a) Southern coast of Hong Kong Island(SM1-3) and b) Southern edge of the territorial waters (SM17-19) (Table 3.1, Figure 3.2). Onthe other hand, significant increases in nitrate nitrogen (NO3-N), nitrite nitrogen (NO2-N) and TINwere found along the eastern coast of Lantau Island (SM10-13) (Figure 3.2)
3.8 The level of E. coli in the southern waters has remained low and stable with a fewexceptions such as the stations SM4 and SM9 which showed long-term increasing trends (Figure3.2). While the increase at SM9 may be related to the SCISTW outfall discharges, that at SM4may indicate bacterial pollution from Sok Kwu Wan in Lamma Island.
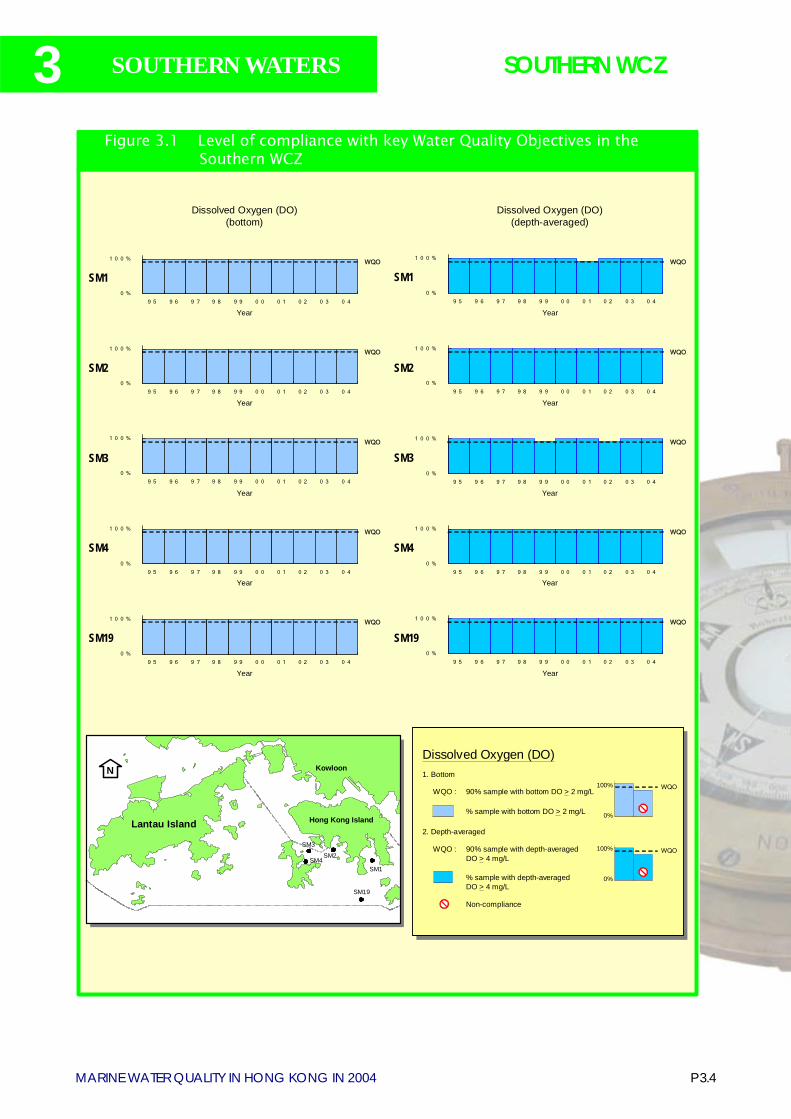
3
P 3.4MARINE WATER QUALITY IN HONG KONG IN 2004
SOUTHERN WATERS SOUTHERN WCZ
0 %
1 0 0 %
9 5 9 6 9 7 9 8 9 9 0 0 0 1 0 2 0 3 0 4
SM1WQO
Year
0 %
1 0 0 %
9 5 9 6 9 7 9 8 9 9 0 0 0 1 0 2 0 3 0 4
SM1WQO
Year
0 %
1 0 0 %
9 5 9 6 9 7 9 8 9 9 0 0 0 1 0 2 0 3 0 4
SM2WQO
Year
0 %
1 0 0 %
9 5 9 6 9 7 9 8 9 9 0 0 0 1 0 2 0 3 0 4
SM2WQO
Year
0 %
1 0 0 %
9 5 9 6 9 7 9 8 9 9 0 0 0 1 0 2 0 3 0 4
SM19WQO
Year
WQO
0 %
1 0 0 %
9 5 9 6 9 7 9 8 9 9 0 0 0 1 0 2 0 3 0 4
SM19
Year
Dissolved Oxygen (DO)
% sample with bottom DO > 2 mg/L
90% sample with bottom DO > 2 mg/LWQO :
2. Depth-averaged
1. Bottom
90% sample with depth-averagedDO > 4 mg/L
WQO :
Non-compliance
% sample with depth-averagedDO > 4 mg/L
WQO
WQO
0 %
1 0 0 %
9 5 9 6 9 7 9 8 9 9 0 0 0 1 0 2 0 3 0 4
SM3WQO
Year
0 %
1 0 0 %
9 5 9 6 9 7 9 8 9 9 0 0 0 1 0 2 0 3 0 4
SM3WQO
Year
0 %
1 0 0 %
9 5 9 6 9 7 9 8 9 9 0 0 0 1 0 2 0 3 0 4
SM4WQO
Year
0 %
1 0 0 %
9 5 9 6 9 7 9 8 9 9 0 0 0 1 0 2 0 3 0 4
SM4WQO
Year
Dissolved Oxygen (DO)(bottom)
Dissolved Oxygen (DO)(depth-averaged)
100%
0%
100%
0%
Figure 3.1 Level of compliance with key Water Quality Objectives in the Southern WCZ
Hong Kong Island
Kowloon
SM2
SM19
SM1SM4
SM3
N
Lantau Island
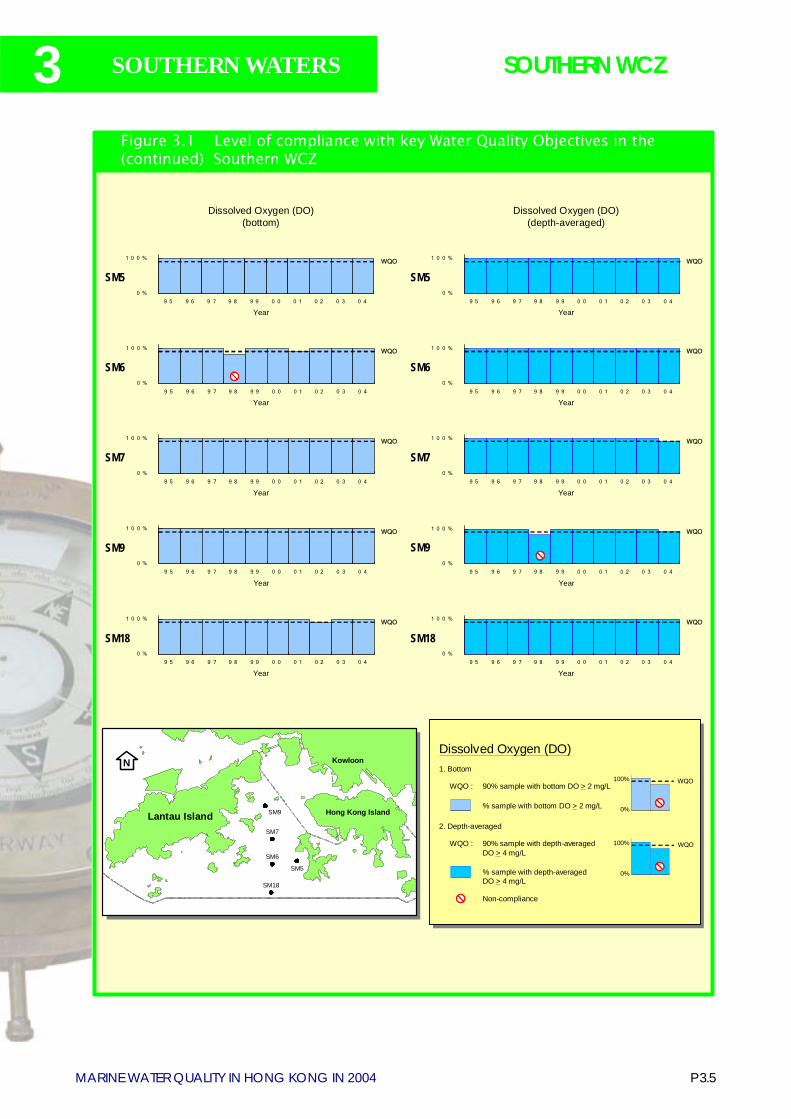
P 3.5MARINE WATER QUALITY IN HONG KONG IN 2004
3 SOUTHERN WATERS SOUTHERN WCZ
Dissolved Oxygen (DO)(bottom)
Dissolved Oxygen (DO)(depth-averaged)
0 %
1 0 0 %
9 5 9 6 9 7 9 8 9 9 0 0 0 1 0 2 0 3 0 4
SM5WQO
Year
0 %
1 0 0 %
9 5 9 6 9 7 9 8 9 9 0 0 0 1 0 2 0 3 0 4
SM5WQO
Year
0 %
1 0 0 %
9 5 9 6 9 7 9 8 9 9 0 0 0 1 0 2 0 3 0 4
SM6WQO
Year
0 %
1 0 0 %
9 5 9 6 9 7 9 8 9 9 0 0 0 1 0 2 0 3 0 4
SM6WQO
Year
WQO
0 %
1 0 0 %
9 5 9 6 9 7 9 8 9 9 0 0 0 1 0 2 0 3 0 4
SM7
Year
0 %
1 0 0 %
9 5 9 6 9 7 9 8 9 9 0 0 0 1 0 2 0 3 0 4
SM7WQO
Year
Dissolved Oxygen (DO)
% sample with bottom DO > 2 mg/L
90% sample with bottom DO > 2 mg/LWQO :
2. Depth-averaged
1. Bottom
90% sample with depth-averagedDO > 4 mg/L
WQO :
Non-compliance
% sample with depth-averagedDO > 4 mg/L
WQO
WQO
Hong Kong Island
Kowloon
SM5
0 %
1 0 0 %
9 5 9 6 9 7 9 8 9 9 0 0 0 1 0 2 0 3 0 4
SM18WQO
Year
WQO
0 %
1 0 0 %
9 5 9 6 9 7 9 8 9 9 0 0 0 1 0 2 0 3 0 4
SM18
Year
0 %
1 0 0 %
9 5 9 6 9 7 9 8 9 9 0 0 0 1 0 2 0 3 0 4
SM9WQO
Year
0 %
1 0 0 %
9 5 9 6 9 7 9 8 9 9 0 0 0 1 0 2 0 3 0 4
SM9WQO
Year
100%
0%
100%
0%
Figure 3.1 Level of compliance with key Water Quality Objectives in the (continued) Southern WCZ
N
Lantau Island
SM18
SM6
SM7
SM9
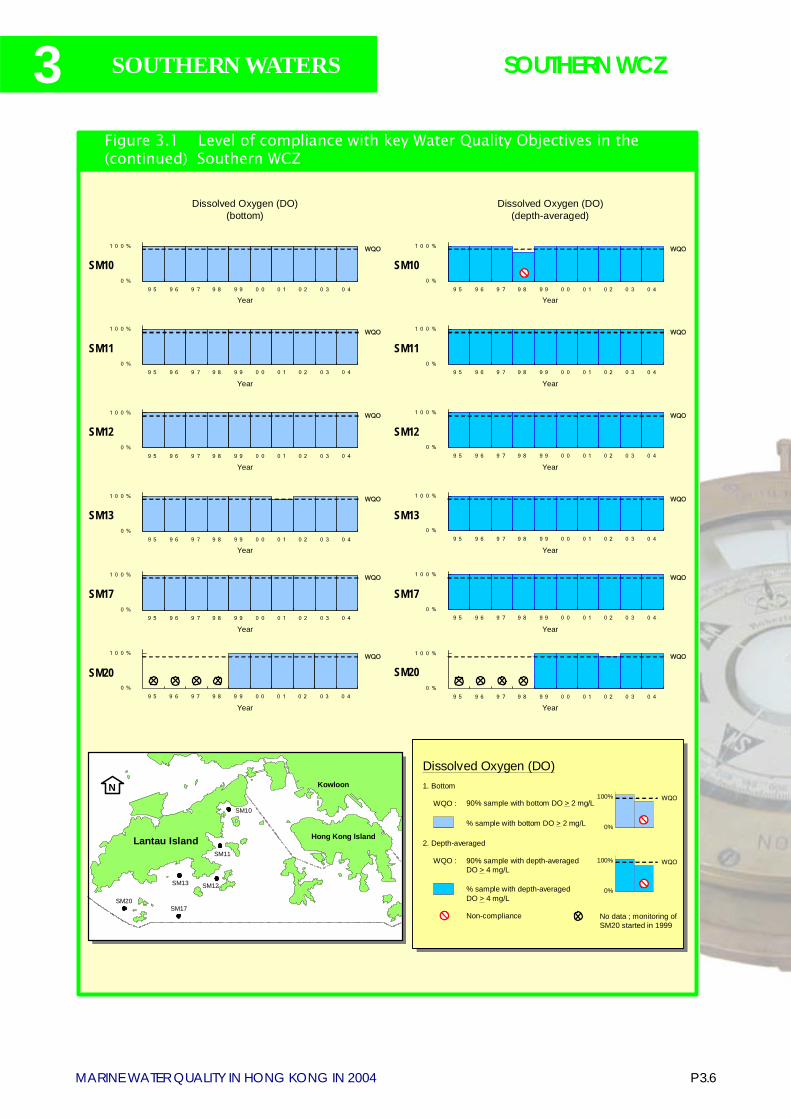
3
P 3.6MARINE WATER QUALITY IN HONG KONG IN 2004
SOUTHERN WATERS SOUTHERN WCZ
0 %
1 0 0 %
9 5 9 6 9 7 9 8 9 9 0 0 0 1 0 2 0 3 0 4
0 %
1 0 0 %
9 5 9 6 9 7 9 8 9 9 0 0 0 1 0 2 0 3 0 4
SM20WQO
Year
0 %
1 0 0 %
9 5 9 6 9 7 9 8 9 9 0 0 0 1 0 2 0 3 0 4
SM20WQO
Year
0 %
1 0 0 %
9 5 9 6 9 7 9 8 9 9 0 0 0 1 0 2 0 3 0 4
SM17WQO
Year
WQO
0 %
1 0 0 %
9 5 9 6 9 7 9 8 9 9 0 0 0 1 0 2 0 3 0 4
SM17
Year
Dissolved Oxygen (DO)(bottom)
Dissolved Oxygen (DO)(depth-averaged)
SM10WQO
Year
0 %
1 0 0 %
9 5 9 6 9 7 9 8 9 9 0 0 0 1 0 2 0 3 0 4
SM10WQO
Year
0 %
1 0 0 %
9 5 9 6 9 7 9 8 9 9 0 0 0 1 0 2 0 3 0 4
SM11WQO
Year
0 %
1 0 0 %
9 5 9 6 9 7 9 8 9 9 0 0 0 1 0 2 0 3 0 4
SM11WQO
Year
0 %
1 0 0 %
9 5 9 6 9 7 9 8 9 9 0 0 0 1 0 2 0 3 0 4
SM12WQO
Year
0 %
1 0 0 %
9 5 9 6 9 7 9 8 9 9 0 0 0 1 0 2 0 3 0 4
SM12WQO
Year
WQO
0 %
1 0 0 %
9 5 9 6 9 7 9 8 9 9 0 0 0 1 0 2 0 3 0 4
SM13
Year
0 %
1 0 0 %
9 5 9 6 9 7 9 8 9 9 0 0 0 1 0 2 0 3 0 4
SM13WQO
Year
Hong Kong Island
Kowloon
Dissolved Oxygen (DO)
% sample with bottom DO > 2 mg/L
90% sample with bottom DO > 2 mg/LWQO :
2. Depth-averaged
1. Bottom
90% sample with depth-averagedDO > 4 mg/L
WQO :
Non-compliance
% sample with depth-averagedDO > 4 mg/L
WQO
WQO
No data ; monitoring ofSM20 started in 1999
100%
0%
100%
0%
Figure 3.1 Level of compliance with key Water Quality Objectives in the (continued) Southern WCZ
N
SM17
SM13 SM12
SM11
SM10
Lantau Island
SM20
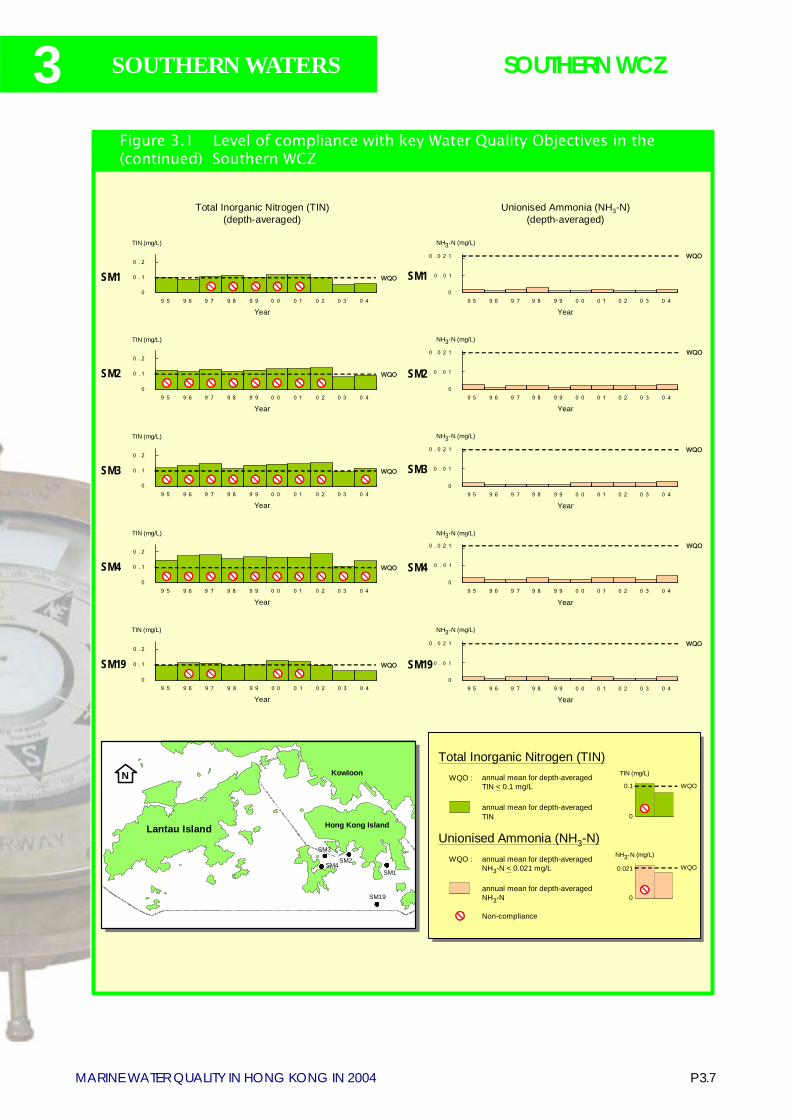
P 3.7MARINE WATER QUALITY IN HONG KONG IN 2004
3 SOUTHERN WATERS SOUTHERN WCZ
0
0 . 1
0 . 2
9 5 9 6 9 7 9 8 9 9 0 0 0 1 0 2 0 3 0 4
NH3-N (mg/L)
SM190
0 . 0 2 1
9 5 9 6 9 7 9 8 9 9 0 0 0 1 0 2 0 3 0 4
Year
WQO
0
0 . 1
0 . 2
9 5 9 6 9 7 9 8 9 9 0 0 0 1 0 2 0 3 0 4
SM19
Year
TIN (mg/L)
WQO
Total Inorganic Nitrogen (TIN)(depth-averaged)
Unionised Ammonia (NH3-N)(depth-averaged)
SM20
0 . 0 2 1
9 5 9 6 9 7 9 8 9 9 0 0 0 1 0 2 0 3 0 4
Year
NH3-N (mg/L)
WQO
0
0 . 1
0 . 2
9 5 9 6 9 7 9 8 9 9 0 0 0 1 0 2 0 3 0 4
SM2
Year
TIN (mg/L)
WQO
0
0 . 0 2 1
9 5 9 6 9 7 9 8 9 9 0 0 0 1 0 2 0 3 0 4
Year
NH3-N (mg/L)
WQO
SM1SM1
Year
TIN (mg/L)
WQO
SM40
0 . 0 2 1
9 5 9 6 9 7 9 8 9 9 0 0 0 1 0 2 0 3 0 4
Year
NH3-N (mg/L)
WQO
0
0 . 1
0 . 2
9 5 9 6 9 7 9 8 9 9 0 0 0 1 0 2 0 3 0 4
SM4
Year
TIN (mg/L)
WQO
0
0 . 0 2 1
9 5 9 6 9 7 9 8 9 9 0 0 0 1 0 2 0 3 0 4
Year
NH3-N (mg/L)
WQO
SM30
0 . 1
0 . 2
9 5 9 6 9 7 9 8 9 9 0 0 0 1 0 2 0 3 0 4
SM3
Year
TIN (mg/L)
WQO
Hong Kong Island
Kowloon
SM2
SM19
SM1
Total Inorganic Nitrogen (TIN)
annual mean for depth-averagedTIN
annual mean for depth-averagedTIN < 0.1 mg/L
WQO :
annual mean for depth-averagedNH3-N < 0.021 mg/L
WQO :
Non-compliance
annual mean for depth-averagedNH3-N
Unionised Ammonia (NH3-N)
0
0.1 WQO
TIN (mg/L)
0
0.021 WQO
NH3-N (mg/L)SM4
SM3
0 . 0 1
0 . 0 1
0 . 0 1
0 . 0 1
0 . 0 1
0.1
0
0.021
0
Figure 3.1 Level of compliance with key Water Quality Objectives in the (continued) Southern WCZ
N
Lantau Island
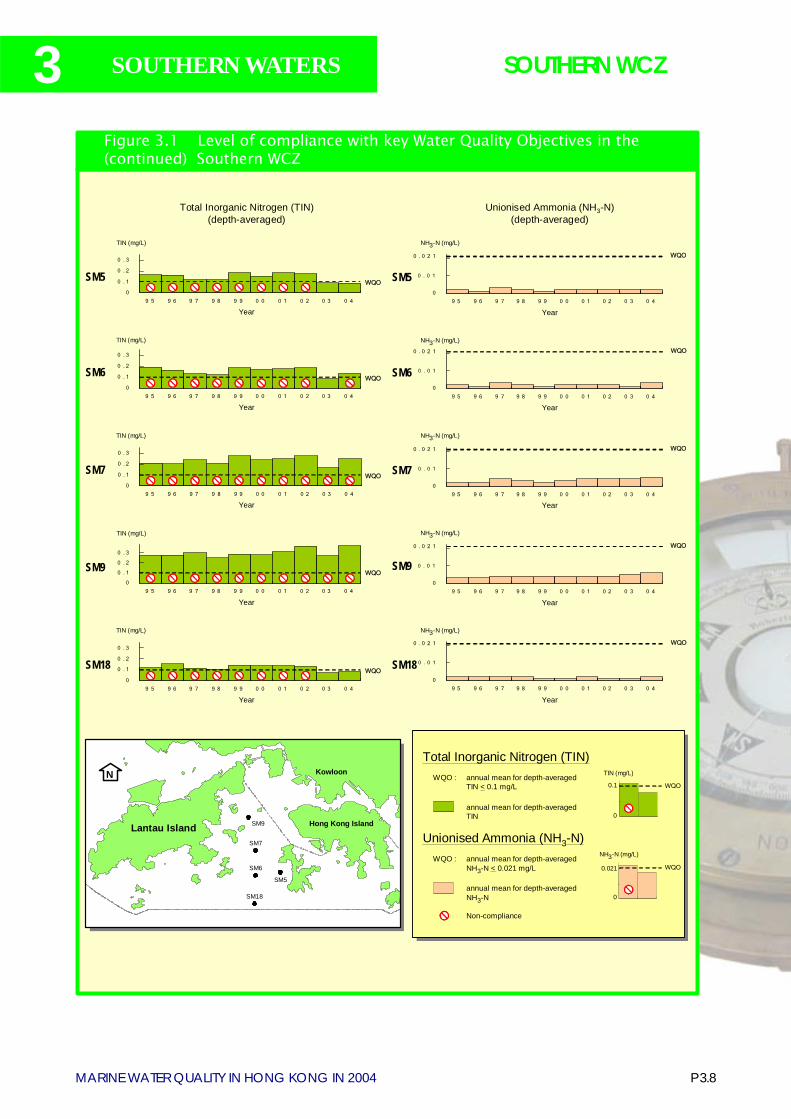
3
P 3.8MARINE WATER QUALITY IN HONG KONG IN 2004
SOUTHERN WATERS SOUTHERN WCZ
Hong Kong Island
Kowloon
SM18
SM6
SM5
SM7
SM9
Total Inorganic Nitrogen (TIN)
annual mean for depth-averagedTIN
annual mean for depth-averagedTIN < 0.1 mg/L
WQO :
annual mean for depth-averagedNH3-N < 0.021 mg/L
WQO :
Non-compliance
annual mean for depth-averagedNH3-N
Unionised Ammonia (NH3-N)
0
0.1 WQO
TIN (mg/L)
0
0.021 WQO
NH3-N (mg/L)
0
0 . 0 2 1
9 5 9 6 9 7 9 8 9 9 0 0 0 1 0 2 0 3 0 4
SM18
Year
NH3-N (mg/L)
WQO
0
0 . 1
0 . 2
0 . 3
9 5 9 6 9 7 9 8 9 9 0 0 0 1 0 2 0 3 0 4
SM18
Year
TIN (mg/L)
WQO
NH3-N (mg/L)
SM70
0 . 0 2 1
9 5 9 6 9 7 9 8 9 9 0 0 0 1 0 2 0 3 0 4
Year
WQO
0
0 . 1
0 . 2
0 . 3
9 5 9 6 9 7 9 8 9 9 0 0 0 1 0 2 0 3 0 4
SM7
Year
TIN (mg/L)
WQO
0
0 . 0 2 1
9 5 9 6 9 7 9 8 9 9 0 0 0 1 0 2 0 3 0 4
SM6
Year
WQO
0
0 . 1
0 . 2
0 . 3
9 5 9 6 9 7 9 8 9 9 0 0 0 1 0 2 0 3 0 4
SM6
Year
WQO
NH3-N (mg/L)TIN (mg/L)
0
0 . 0 2 1
9 5 9 6 9 7 9 8 9 9 0 0 0 1 0 2 0 3 0 4
SM5
Year
NH3-N (mg/L)
WQO
0
0 . 1
0 . 2
0 . 3
9 5 9 6 9 7 9 8 9 9 0 0 0 1 0 2 0 3 0 4
SM5
Year
TIN (mg/L)
WQO
0
0 . 0 2 1
9 5 9 6 9 7 9 8 9 9 0 0 0 1 0 2 0 3 0 4
Year
NH3-N (mg/L)
WQO
SM90
0 . 1
0 . 2
0 . 3
9 5 9 6 9 7 9 8 9 9 0 0 0 1 0 2 0 3 0 4
SM9
Year
TIN (mg/L)
WQO
Total Inorganic Nitrogen (TIN)(depth-averaged)
Unionised Ammonia (NH3-N)(depth-averaged)
0.1
0
0.021
0
0 . 0 1
0 . 0 1
0 . 0 1
0 . 0 1
0 . 0 1
Figure 3.1 Level of compliance with key Water Quality Objectives in the (continued) Southern WCZ
N
Lantau Island
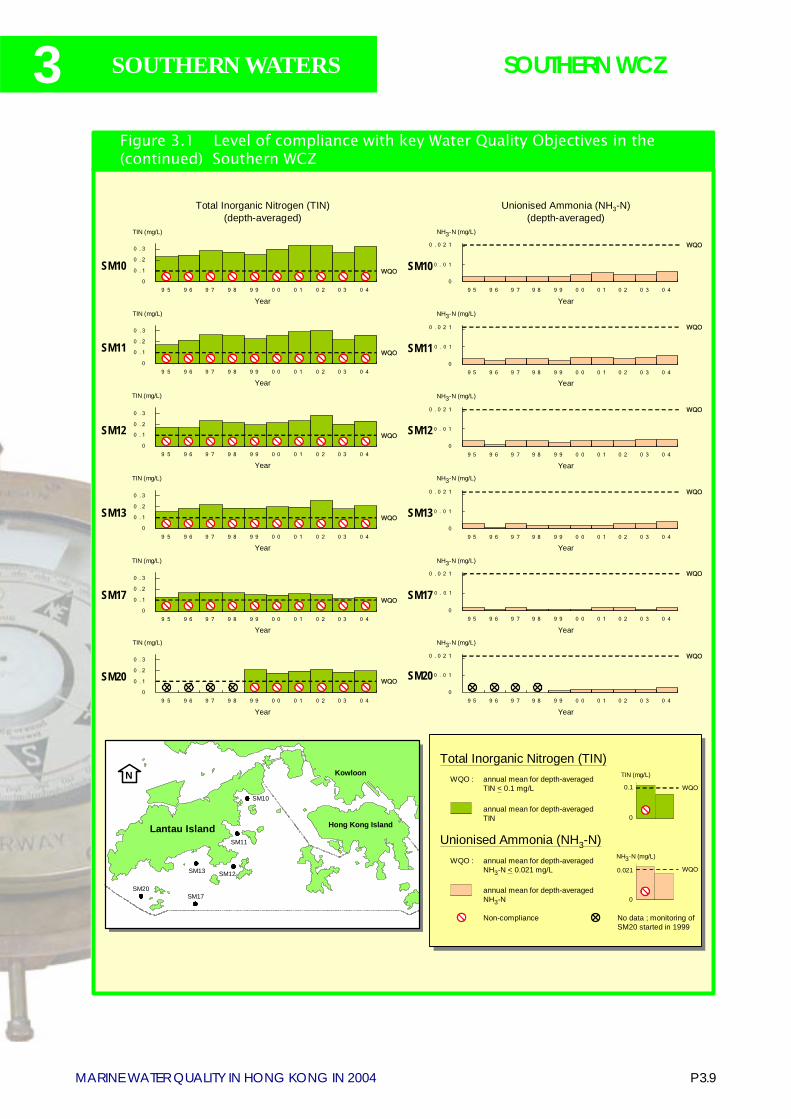
P 3.9MARINE WATER QUALITY IN HONG KONG IN 2004
3 SOUTHERN WATERS SOUTHERN WCZ
Total Inorganic Nitrogen (TIN)(depth-averaged)
Unionised Ammonia (NH3-N)(depth-averaged)
NH3-N (mg/L)
SM130
0 . 0 2 1
9 5 9 6 9 7 9 8 9 9 0 0 0 1 0 2 0 3 0 4
Year
WQO
0
0 . 1
0 . 2
0 . 3
9 5 9 6 9 7 9 8 9 9 0 0 0 1 0 2 0 3 0 4
SM13
Year
TIN (mg/L)
WQO
0
0 . 0 2 1
9 5 9 6 9 7 9 8 9 9 0 0 0 1 0 2 0 3 0 4
SM12
Year
NH3-N (mg/L)
WQO
0
0 . 1
0 . 2
0 . 3
9 5 9 6 9 7 9 8 9 9 0 0 0 1 0 2 0 3 0 4
SM12
Year
TIN (mg/L)
WQO
0
0 . 0 2 1
9 5 9 6 9 7 9 8 9 9 0 0 0 1 0 2 0 3 0 4
SM11
Year
NH3-N (mg/L)
WQO
0
0 . 1
0 . 2
0 . 3
9 5 9 6 9 7 9 8 9 9 0 0 0 1 0 2 0 3 0 4
SM11
Year
TIN (mg/L)
WQO
0
0 . 0 2 1
9 5 9 6 9 7 9 8 9 9 0 0 0 1 0 2 0 3 0 4
SM10
Year
NH3-N (mg/L)
WQO
0
0 . 1
0 . 2
0 . 3
9 5 9 6 9 7 9 8 9 9 0 0 0 1 0 2 0 3 0 4
SM10
Year
TIN (mg/L)
WQO
0
0 . 0 2 1
9 5 9 6 9 7 9 8 9 9 0 0 0 1 0 2 0 3 0 4
Year
NH3-N (mg/L)
WQO
SM200
0 . 1
0 . 2
0 . 3
9 5 9 6 9 7 9 8 9 9 0 0 0 1 0 2 0 3 0 4
SM20
Year
TIN (mg/L)
WQO
0
0 . 0 2 1
9 5 9 6 9 7 9 8 9 9 0 0 0 1 0 2 0 3 0 4
SM17
Year
NH3-N (mg/L)
WQO
0
0 . 1
0 . 2
0 . 3
9 5 9 6 9 7 9 8 9 9 0 0 0 1 0 2 0 3 0 4
SM17
Year
TIN (mg/L)
WQO
SM10
Hong Kong Island
KowloonTotal Inorganic Nitrogen (TIN)
annual mean for depth-averagedTIN
annual mean for depth-averagedTIN < 0.1 mg/L
WQO :
annual mean for depth-averagedNH3-N < 0.021 mg/L
WQO :
Non-compliance
annual mean for depth-averagedNH3-N
Unionised Ammonia (NH3-N)
0
0.1 WQO
TIN (mg/L)
0
0.021 WQO
NH3-N (mg/L)
No data ; monitoring ofSM20 started in 1999
0.1
0
0.021
0
0 . 0 1
0 . 0 1
0 . 0 1
0 . 0 1
0 . 0 1
0 . 0 1
Figure 3.1 Level of compliance with key Water Quality Objectives in the (continued) Southern WCZ
N
SM17
SM13 SM12
SM11
Lantau Island
SM20
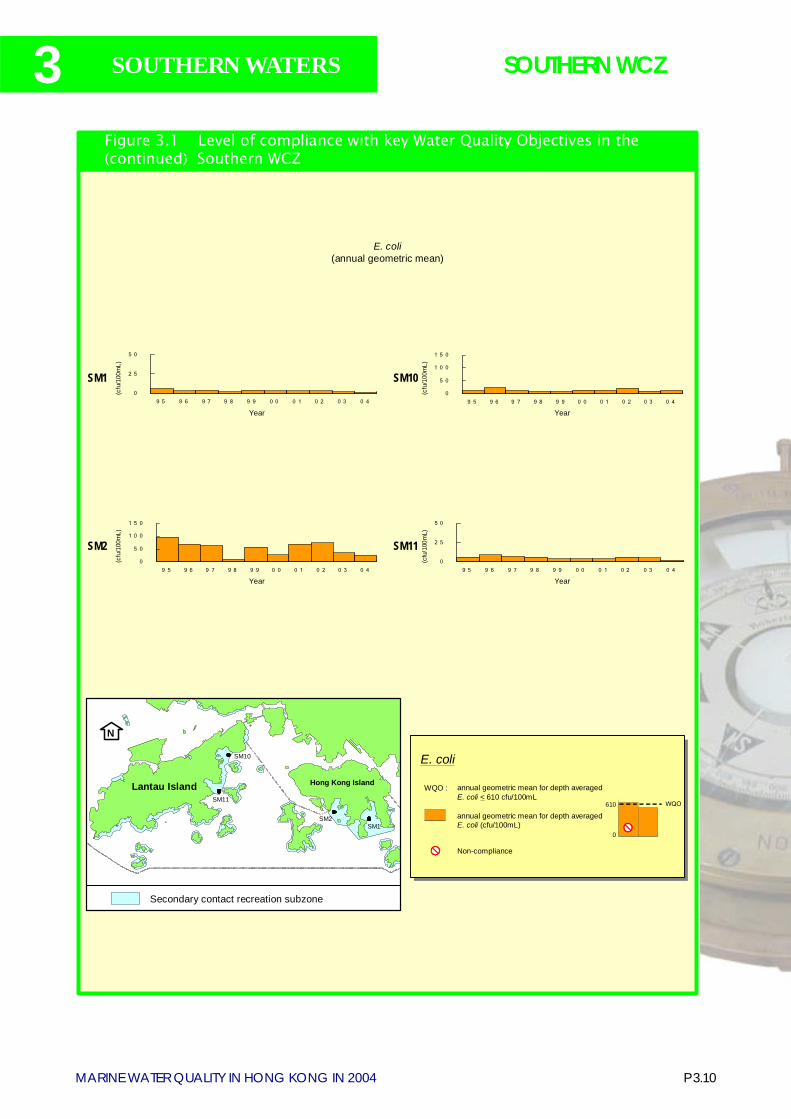
3
P 3.10MARINE WATER QUALITY IN HONG KONG IN 2004
SOUTHERN WATERS SOUTHERN WCZ
E. coli(annual geometric mean)
0
2 5
5 0
9 5 9 6 9 7 9 8 9 9 0 0 0 1 0 2 0 3 0 4
SM1
Year
(cfu
/100
mL)
0
2 5
5 0
9 5 9 6 9 7 9 8 9 9 0 0 0 1 0 2 0 3 0 4
SM11
Year
(cfu
/100
mL)
0
5 0
1 0 0
1 5 0
9 5 9 6 9 7 9 8 9 9 0 0 0 1 0 2 0 3 0 4
SM10
Year(c
fu/1
00m
L)
0
5 0
1 0 0
1 5 0
9 5 9 6 9 7 9 8 9 9 0 0 0 1 0 2 0 3 0 4
SM2
Year
(cfu
/100
mL)
E. coli
annual geometric mean for depth averagedE. coli (cfu/100mL)
annual geometric mean for depth averagedE. coli < 610 cfu/100mL
WQO :
Non-compliance
0
610 WQO
Hong Kong Island
Kowloon
SM2SM1
Secondary contact recreation subzone
610
0
Figure 3.1 Level of compliance with key Water Quality Objectives in the (continued) Southern WCZ
SM10
N
Lantau IslandSM11
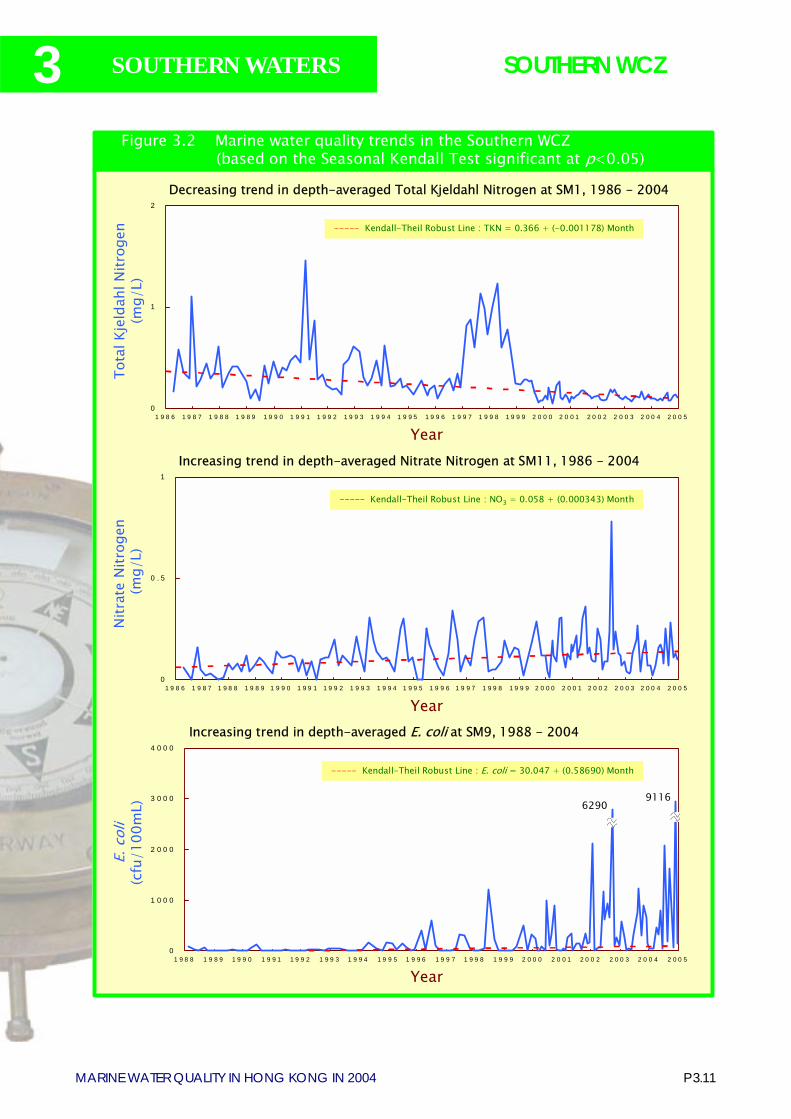
P 3.11MARINE WATER QUALITY IN HONG KONG IN 2004
3 SOUTHERN WATERS SOUTHERN WCZ
Increasing trend in depth-averaged E. coli at SM9, 1988 - 2004
Year
E. c
oli
(cfu
/100
mL)
0
1 0 0 0
2 0 0 0
3 0 0 0
4 0 0 0
1 9 8 8 1 9 8 9 1 9 9 0 1 9 9 1 1 9 9 2 1 9 9 3 1 9 9 4 1 9 9 5 1 9 9 6 1 9 9 7 1 9 9 8 1 9 9 9 2 0 0 0 2 0 0 1 2 0 0 2 2 0 0 3 2 0 0 4 2 0 0 5
----- Kendall-Theil Robust Line : E. coli = 30.047 + (0.58690) Month
Figure 3.2 Marine water quality trends in the Southern WCZ(based on the Seasonal Kendall Test significant at p<0.05)
Year
Decreasing trend in depth-averaged Total Kjeldahl Nitrogen at SM1, 1986 - 2004
Tota
l Kje
ldah
lNitr
ogen
(mg/
L)
0
1
2
1 9 8 6 1 9 8 7 1 9 8 8 1 9 8 9 1 9 9 0 1 9 9 1 1 9 9 2 1 9 9 3 1 9 9 4 1 9 9 5 1 9 9 6 1 9 9 7 1 9 9 8 1 9 9 9 2 0 0 0 2 0 0 1 2 0 0 2 2 0 0 3 2 0 0 4 2 0 0 5
----- Kendall-Theil Robust Line : TKN = 0.366 + (-0.001178) Month
Increasing trend in depth-averaged Nitrate Nitrogen at SM11, 1986 - 2004
Year
Nitr
ate
Nitr
ogen
(m
g/L)
0
0 . 5
1
1 9 8 6 1 9 8 7 1 9 8 8 1 9 8 9 1 9 9 0 1 9 9 1 1 9 9 2 1 9 9 3 1 9 9 4 1 9 9 5 1 9 9 6 1 9 9 7 1 9 9 8 1 9 9 9 2 0 0 0 2 0 0 1 2 0 0 2 2 0 0 3 2 0 0 4 2 0 0 5
----- Kendall-Theil Robust Line : NO3 = 0.058 + (0.000343) Month
a
62909116
a

3
P 3.12MARINE WATER QUALITY IN HONG KONG IN 2004
SOUTHERN WATERS SOUTHERN WCZ
Table 3.Table 3.Table 3.Table 3.Table 3.11111Results of the Seasonal Kendall Test for water quality trends in theSouthern WCZ, 1986 - 2004
Note 1. Results of the Seasonal Kendall Test shown are statistically significant at p < 0.052. � indicates no significant trend is detected3. NA (Not Applicable) indicates the measurement was not made due to shallow water4. Test applied to past 19 years� data from each monitoring station unless stated otherwise
5. SM20 has six years� data only, which is insufficient to perform Seasonal Kendall Test6. ! represents a significant increase over time7. " represents a significant decrease over time
Monitoring Station SM1 SM2 SM3 SM4 SM5 SM6 SM7 SM9
Monitoring Period 1986
I 2004
1986 I
2004
1986 I
2004
1986 I
2004
1986 I
2004
1986 I
2004
1986 I
2004
1988 I
2004 Parameter Water Depth Surface - - ! ! ! ! ! ! Temperature (°C) Middle ! ! ! ! ! ! ! ! Bottom ! ! ! ! ! ! ! ! Average ! ! ! ! ! ! ! ! Surface - - - - - - - - Salinity Middle - - - - - - - -
Bottom - - - - - - - - Average - - - - - - - -
Surface " - " " - - - - Dissolved Oxygen (mg/L) Middle - - - - - - - - Bottom - - - - - - - - Average - - " " - - - - Surface " - " " - - - - Dissolved Oxygen (%) Middle - - - - - - - - Bottom - - - - - - - - Average - - - - - - - - Surface - - - - - - - - pH Middle - - - - - - - - Bottom - - - - - - - - Average - - - - - - - - Secchi disc depth (m) - - - - - - - - Surface ! ! ! ! ! ! ! ! Turbidity (NTU) Middle ! ! ! ! ! ! ! ! Bottom ! ! ! ! ! ! ! ! Average ! ! ! ! ! ! ! ! Surface - - - - - - - - Suspended Solids (mg/L) Middle - - - - - - - - Bottom - - ! - - ! - - Average - - - - - - - - Surface " - " " - - - - Total volatile solids (mg/L) Middle " " - - - - - - Bottom - - - - - - - - Average " " - " - - - - Surface - - - - - - - - 5-day Biochemical Oxygen Demand (mg/L) Middle - - - - - - - - Bottom - - - - - - - - Average - - - - - - - - Surface - - - - - - - - Ammonia nitrogen (mg/L) Middle - - - - - - - - Bottom - - - - - - - - Average - - - - - - - - Surface - - - - - - - - Nitrite nitrogen (mg/L) Middle - - - - - - - - Bottom - - - - - - - - Average - - - - - - - - Surface - - - - - - - - Nitrate nitrogen (mg/L) Middle - - - - - - - - Bottom - - - - - - - - Average - - - - - - - - Surface - - - - - - - - Total inorganic nitrogen (mg/L) Middle - - - - - - - - Bottom - - - - - - - - Average - - - - - - - - Surface " " " " " " " - Total Kjeldahl nitrogen (mg/L) Middle " " " " - " - - Bottom " " " " " " - - Average " " " " " " - - Surface " " " " - - - - Total nitrogen (mg/L) Middle " " " " - - - - Bottom " " " " - - - - Average " " " - - - - - Surface - - - - - - - - Orthophosphate phosphorus (mg/L) Middle - - - - - - - - Bottom - - - - - - - - Average - - - - - - - - Surface " " " " " " - " Total phosphorus (mg/L) Middle " " " " " - - - Bottom " " " " " " - " Average " " " " " " - " Surface - - - - - - - - Silica (mg/L) Middle - - - - - - - - Bottom - - - - - - - - Average - - - - - - - - Surface - - - - - - - ! Chlorophyll-a (µg/L) Middle - - - - ! - - ! Bottom - - - - - - - - Average - - - - - - - - Surface - - - ! - - ! ! E. coli (cfu/100mL) Middle - - - ! - - - ! Bottom - - - ! - - ! ! Average - - - ! - - - !
Surface - ! ! ! - - ! ! Faecal coliforms (cfu/100mL) Middle - - - ! - - ! ! Bottom - - - ! - - ! ! Average - ! - ! ! - ! !
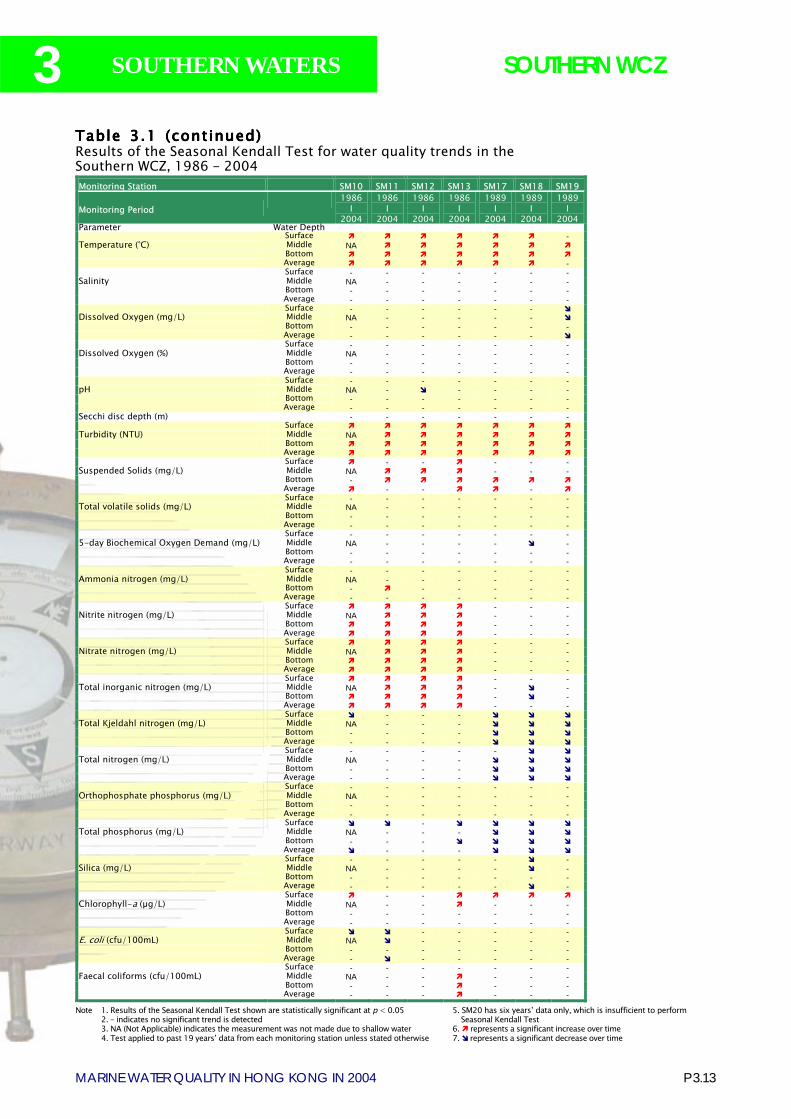
P 3.13MARINE WATER QUALITY IN HONG KONG IN 2004
3 SOUTHERN WATERS SOUTHERN WCZ
Table 3.Table 3.Table 3.Table 3.Table 3.11111 (continued) (continued) (continued) (continued) (continued)Results of the Seasonal Kendall Test for water quality trends in theSouthern WCZ, 1986 - 2004
Note 1. Results of the Seasonal Kendall Test shown are statistically significant at p < 0.052. � indicates no significant trend is detected3. NA (Not Applicable) indicates the measurement was not made due to shallow water4. Test applied to past 19 years� data from each monitoring station unless stated otherwise
5. SM20 has six years� data only, which is insufficient to perform Seasonal Kendall Test6. ! represents a significant increase over time7. " represents a significant decrease over time
Monitoring Station SM10 SM11 SM12 SM13 SM17 SM18 SM19
Monitoring Period 1986
I 2004
1986 I
2004
1986 I
2004
1986 I
2004
1989 I
2004
1989 I
2004
1989 I
2004 Parameter Water Depth Surface ! ! ! ! ! ! - Temperature (°C) Middle NA ! ! ! ! ! ! Bottom ! ! ! ! ! ! ! Average ! ! ! ! ! ! - Surface - - - - - - - Salinity Middle NA - - - - - -
Bottom - - - - - - - Average - - - - - - -
Surface - - - - - - " Dissolved Oxygen (mg/L) Middle NA - - - - - " Bottom - - - - - - - Average - - - - - - " Surface - - - - - - - Dissolved Oxygen (%) Middle NA - - - - - - Bottom - - - - - - - Average - - - - - - - Surface - - - - - - - pH Middle NA - " - - - - Bottom - - - - - - - Average - - - - - - - Secchi disc depth (m) - - - - - - - Surface ! ! ! ! ! ! ! Turbidity (NTU) Middle NA ! ! ! ! ! ! Bottom ! ! ! ! ! ! ! Average ! ! ! ! ! ! ! Surface ! - - ! - - - Suspended Solids (mg/L) Middle NA ! ! ! - - - Bottom - ! ! ! ! ! ! Average ! - - ! ! - ! Surface - - - - - - - Total volatile solids (mg/L) Middle NA - - - - - - Bottom - - - - - - - Average - - - - - - - Surface - - - - - - - 5-day Biochemical Oxygen Demand (mg/L) Middle NA - - - - " - Bottom - - - - - - - Average - - - - - - - Surface - - - - - - - Ammonia nitrogen (mg/L) Middle NA - - - - - - Bottom - ! - - - - - Average - - - - - - - Surface ! ! ! ! - - - Nitrite nitrogen (mg/L) Middle NA ! ! ! - - - Bottom ! ! ! ! - - - Average ! ! ! ! - - - Surface ! ! ! ! - - - Nitrate nitrogen (mg/L) Middle NA ! ! ! - - - Bottom ! ! ! ! - - - Average ! ! ! ! - - - Surface ! ! ! ! - - - Total inorganic nitrogen (mg/L) Middle NA ! ! ! - " - Bottom ! ! ! ! - " - Average ! ! ! ! - - - Surface " - - - " " " Total Kjeldahl nitrogen (mg/L) Middle NA - - - " " " Bottom - - - - " " " Average - - - - " " " Surface - - - - - " " Total nitrogen (mg/L) Middle NA - - - " " " Bottom - - - - " " " Average - - - - " " " Surface - - - - - - - Orthophosphate phosphorus (mg/L) Middle NA - - - - - - Bottom - - - - - - - Average - - - - - - - Surface " " - " " " " Total phosphorus (mg/L) Middle NA - - - " " " Bottom - - - " " " " Average " - - - " " " Surface - - - - - " - Silica (mg/L) Middle NA - - - - " - Bottom - - - - - - - Average - - - - - " - Surface ! - - ! ! ! ! Chlorophyll-a (µg/L) Middle NA - - ! - - - Bottom - - - - - - - Average - - - - - - - Surface " " - - - - - E. coli (cfu/100mL) Middle NA " - - - - - Bottom - - - - - - - Average - " - - - - -
Surface - - - - - - - Faecal coliforms (cfu/100mL) Middle NA - - ! - - - Bottom - - - ! - - - Average - - - ! - - -
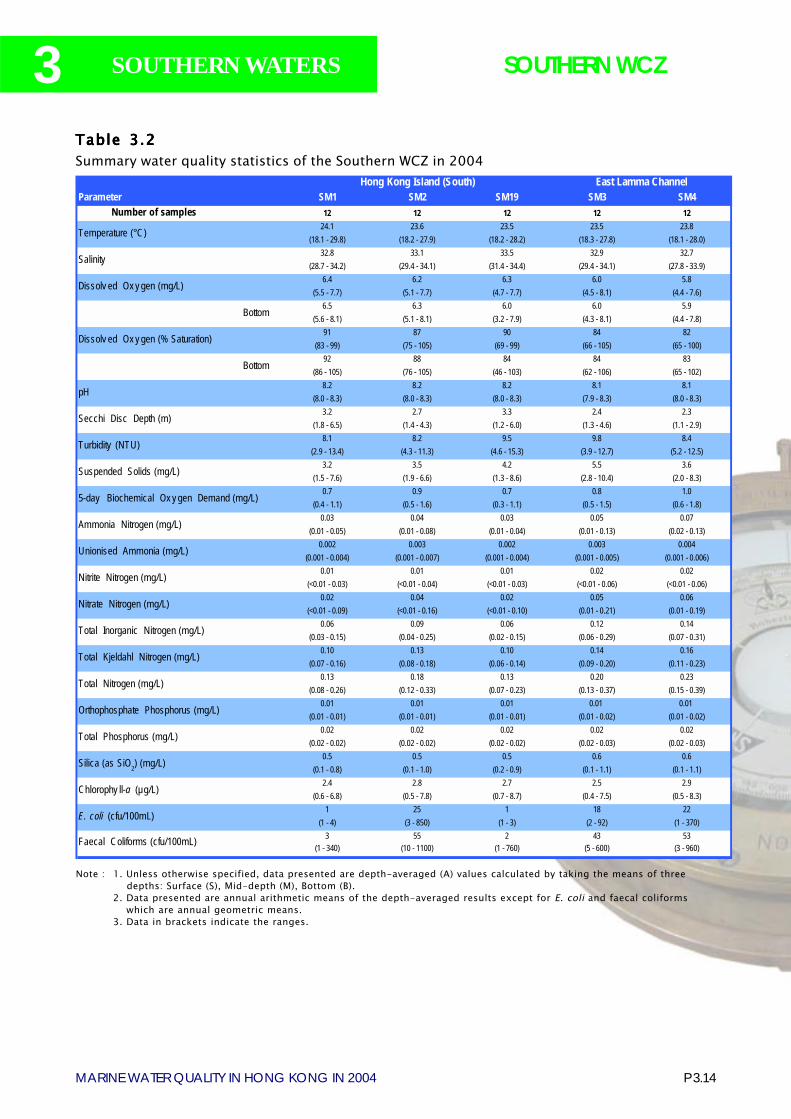
3
P 3.14MARINE WATER QUALITY IN HONG KONG IN 2004
SOUTHERN WATERS SOUTHERN WCZ
Table Table Table Table Table 33333.....22222Summary water quality statistics of the Southern WCZ in 2004
Note : 1. Unless otherwise specified, data presented are depth-averaged (A) values calculated by taking the means of threedepths: Surface (S), Mid-depth (M), Bottom (B).
2. Data presented are annual arithmetic means of the depth-averaged results except for E. coli and faecal coliformswhich are annual geometric means.
3. Data in brackets indicate the ranges.
Parameter SM1 SM2 SM19 SM3 SM4Number of samples 12 12 12 12 12
24.1 23.6 23.5 23.5 23.8(18.1 - 29.8) (18.2 - 27.9) (18.2 - 28.2) (18.3 - 27.8) (18.1 - 28.0)
32.8 33.1 33.5 32.9 32.7(28.7 - 34.2) (29.4 - 34.1) (31.4 - 34.4) (29.4 - 34.1) (27.8 - 33.9)
6.4 6.2 6.3 6.0 5.8(5.5 - 7.7) (5.1 - 7.7) (4.7 - 7.7) (4.5 - 8.1) (4.4 - 7.6)
6.5 6.3 6.0 6.0 5.9(5.6 - 8.1) (5.1 - 8.1) (3.2 - 7.9) (4.3 - 8.1) (4.4 - 7.8)
91 87 90 84 82(83 - 99) (75 - 105) (69 - 99) (66 - 105) (65 - 100)
92 88 84 84 83(86 - 105) (76 - 105) (46 - 103) (62 - 106) (65 - 102)
8.2 8.2 8.2 8.1 8.1(8.0 - 8.3) (8.0 - 8.3) (8.0 - 8.3) (7.9 - 8.3) (8.0 - 8.3)
3.2 2.7 3.3 2.4 2.3(1.8 - 6.5) (1.4 - 4.3) (1.2 - 6.0) (1.3 - 4.6) (1.1 - 2.9)
8.1 8.2 9.5 9.8 8.4(2.9 - 13.4) (4.3 - 11.3) (4.6 - 15.3) (3.9 - 12.7) (5.2 - 12.5)
3.2 3.5 4.2 5.5 3.6(1.5 - 7.6) (1.9 - 6.6) (1.3 - 8.6) (2.8 - 10.4) (2.0 - 8.3)
0.7 0.9 0.7 0.8 1.0(0.4 - 1.1) (0.5 - 1.6) (0.3 - 1.1) (0.5 - 1.5) (0.6 - 1.8)
0.03 0.04 0.03 0.05 0.07(0.01 - 0.05) (0.01 - 0.08) (0.01 - 0.04) (0.01 - 0.13) (0.02 - 0.13)
0.002 0.003 0.002 0.003 0.004(0.001 - 0.004) (0.001 - 0.007) (0.001 - 0.004) (0.001 - 0.005) (0.001 - 0.006)
0.01 0.01 0.01 0.02 0.02(<0.01 - 0.03) (<0.01 - 0.04) (<0.01 - 0.03) (<0.01 - 0.06) (<0.01 - 0.06)
0.02 0.04 0.02 0.05 0.06(<0.01 - 0.09) (<0.01 - 0.16) (<0.01 - 0.10) (0.01 - 0.21) (0.01 - 0.19)
0.06 0.09 0.06 0.12 0.14(0.03 - 0.15) (0.04 - 0.25) (0.02 - 0.15) (0.06 - 0.29) (0.07 - 0.31)
0.10 0.13 0.10 0.14 0.16(0.07 - 0.16) (0.08 - 0.18) (0.06 - 0.14) (0.09 - 0.20) (0.11 - 0.23)
0.13 0.18 0.13 0.20 0.23(0.08 - 0.26) (0.12 - 0.33) (0.07 - 0.23) (0.13 - 0.37) (0.15 - 0.39)
0.01 0.01 0.01 0.01 0.01(0.01 - 0.01) (0.01 - 0.01) (0.01 - 0.01) (0.01 - 0.02) (0.01 - 0.02)
0.02 0.02 0.02 0.02 0.02(0.02 - 0.02) (0.02 - 0.02) (0.02 - 0.02) (0.02 - 0.03) (0.02 - 0.03)
0.5 0.5 0.5 0.6 0.6(0.1 - 0.8) (0.1 - 1.0) (0.2 - 0.9) (0.1 - 1.1) (0.1 - 1.1)
2.4 2.8 2.7 2.5 2.9(0.6 - 6.8) (0.5 - 7.8) (0.7 - 8.7) (0.4 - 7.5) (0.5 - 8.3)
1 25 1 18 22(1 - 4) (3 - 850) (1 - 3) (2 - 92) (1 - 370)
3 55 2 43 53(1 - 340) (10 - 1100) (1 - 760) (5 - 600) (3 - 960)
East Lamma ChannelHong Kong Island (South)
Bottom
Temperature (°C)
Salinity
Dissolv ed Ox y gen (mg/L)
Bottom
Total Phosphorus (mg/L)
Silica (as SiO2) (mg/L)
pH
Total Kjeldahl Nitrogen (mg/L)
Total Nitrogen (mg/L)
Faecal Coliforms (cfu/100mL)
E. coli (cfu/100mL)
Chlorophy ll-a (µg/L)
5-day Biochemical Ox y gen Demand (mg/L)
Orthophosphate Phosphorus (mg/L)
Total Inorganic Nitrogen (mg/L)
Nitrate Nitrogen (mg/L)
Dissolv ed Ox y gen (% Saturation)
Secchi Disc Depth (m)
Unionised Ammonia (mg/L)
Nitrite Nitrogen (mg/L)
Turbidity (NTU)
Suspended Solids (mg/L)
Ammonia Nitrogen (mg/L)
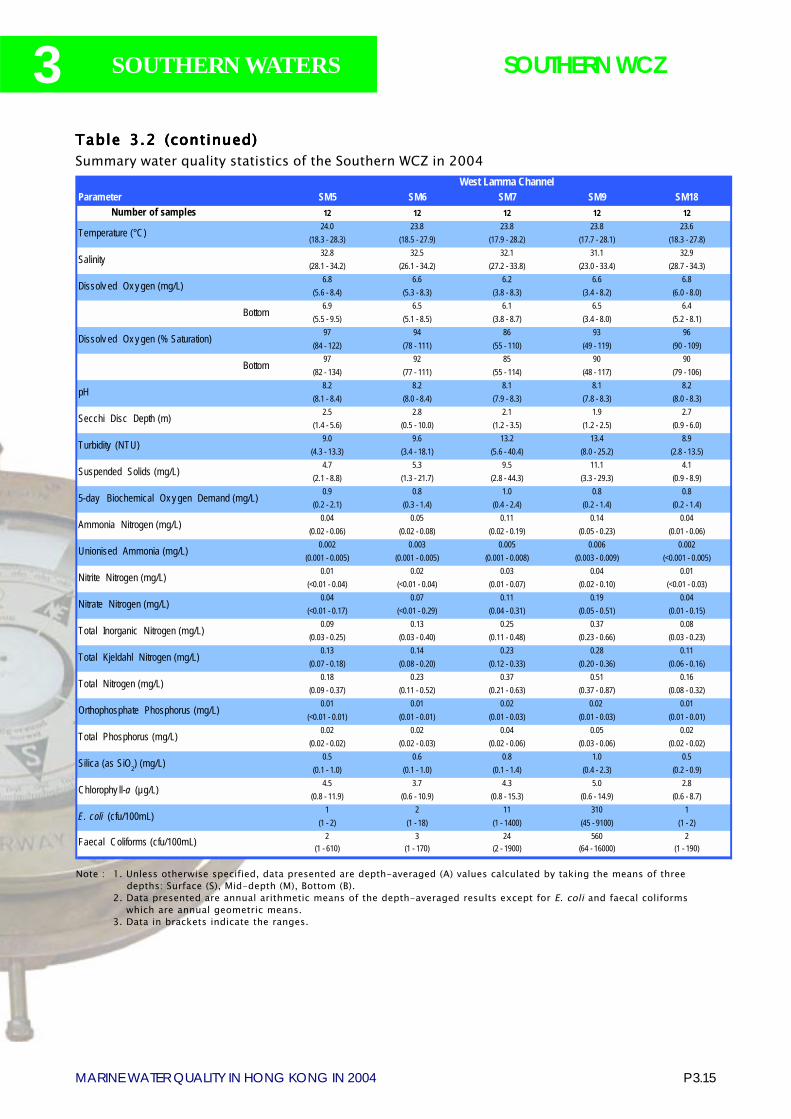
P 3.15MARINE WATER QUALITY IN HONG KONG IN 2004
3 SOUTHERN WATERS SOUTHERN WCZ
Table Table Table Table Table 33333.....2 (continued)2 (continued)2 (continued)2 (continued)2 (continued)Summary water quality statistics of the Southern WCZ in 2004
Note : 1. Unless otherwise specified, data presented are depth-averaged (A) values calculated by taking the means of threedepths: Surface (S), Mid-depth (M), Bottom (B).
2. Data presented are annual arithmetic means of the depth-averaged results except for E. coli and faecal coliformswhich are annual geometric means.
3. Data in brackets indicate the ranges.
Parameter SM5 SM6 SM7 SM9 SM18Number of samples 12 12 12 12 12
24.0 23.8 23.8 23.8 23.6(18.3 - 28.3) (18.5 - 27.9) (17.9 - 28.2) (17.7 - 28.1) (18.3 - 27.8)
32.8 32.5 32.1 31.1 32.9(28.1 - 34.2) (26.1 - 34.2) (27.2 - 33.8) (23.0 - 33.4) (28.7 - 34.3)
6.8 6.6 6.2 6.6 6.8(5.6 - 8.4) (5.3 - 8.3) (3.8 - 8.3) (3.4 - 8.2) (6.0 - 8.0)
6.9 6.5 6.1 6.5 6.4(5.5 - 9.5) (5.1 - 8.5) (3.8 - 8.7) (3.4 - 8.0) (5.2 - 8.1)
97 94 86 93 96(84 - 122) (78 - 111) (55 - 110) (49 - 119) (90 - 109)
97 92 85 90 90(82 - 134) (77 - 111) (55 - 114) (48 - 117) (79 - 106)
8.2 8.2 8.1 8.1 8.2(8.1 - 8.4) (8.0 - 8.4) (7.9 - 8.3) (7.8 - 8.3) (8.0 - 8.3)
2.5 2.8 2.1 1.9 2.7(1.4 - 5.6) (0.5 - 10.0) (1.2 - 3.5) (1.2 - 2.5) (0.9 - 6.0)
9.0 9.6 13.2 13.4 8.9(4.3 - 13.3) (3.4 - 18.1) (5.6 - 40.4) (8.0 - 25.2) (2.8 - 13.5)
4.7 5.3 9.5 11.1 4.1(2.1 - 8.8) (1.3 - 21.7) (2.8 - 44.3) (3.3 - 29.3) (0.9 - 8.9)
0.9 0.8 1.0 0.8 0.8(0.2 - 2.1) (0.3 - 1.4) (0.4 - 2.4) (0.2 - 1.4) (0.2 - 1.4)
0.04 0.05 0.11 0.14 0.04(0.02 - 0.06) (0.02 - 0.08) (0.02 - 0.19) (0.05 - 0.23) (0.01 - 0.06)
0.002 0.003 0.005 0.006 0.002(0.001 - 0.005) (0.001 - 0.005) (0.001 - 0.008) (0.003 - 0.009) (<0.001 - 0.005)
0.01 0.02 0.03 0.04 0.01(<0.01 - 0.04) (<0.01 - 0.04) (0.01 - 0.07) (0.02 - 0.10) (<0.01 - 0.03)
0.04 0.07 0.11 0.19 0.04(<0.01 - 0.17) (<0.01 - 0.29) (0.04 - 0.31) (0.05 - 0.51) (0.01 - 0.15)
0.09 0.13 0.25 0.37 0.08(0.03 - 0.25) (0.03 - 0.40) (0.11 - 0.48) (0.23 - 0.66) (0.03 - 0.23)
0.13 0.14 0.23 0.28 0.11(0.07 - 0.18) (0.08 - 0.20) (0.12 - 0.33) (0.20 - 0.36) (0.06 - 0.16)
0.18 0.23 0.37 0.51 0.16(0.09 - 0.37) (0.11 - 0.52) (0.21 - 0.63) (0.37 - 0.87) (0.08 - 0.32)
0.01 0.01 0.02 0.02 0.01(<0.01 - 0.01) (0.01 - 0.01) (0.01 - 0.03) (0.01 - 0.03) (0.01 - 0.01)
0.02 0.02 0.04 0.05 0.02(0.02 - 0.02) (0.02 - 0.03) (0.02 - 0.06) (0.03 - 0.06) (0.02 - 0.02)
0.5 0.6 0.8 1.0 0.5(0.1 - 1.0) (0.1 - 1.0) (0.1 - 1.4) (0.4 - 2.3) (0.2 - 0.9)
4.5 3.7 4.3 5.0 2.8(0.8 - 11.9) (0.6 - 10.9) (0.8 - 15.3) (0.6 - 14.9) (0.6 - 8.7)
1 2 11 310 1(1 - 2) (1 - 18) (1 - 1400) (45 - 9100) (1 - 2)
2 3 24 560 2(1 - 610) (1 - 170) (2 - 1900) (64 - 16000) (1 - 190)
Dissolv ed Ox y gen (% Saturation)
Secchi Disc Depth (m)
Unionised Ammonia (mg/L)
Nitrite Nitrogen (mg/L)
Turbidity (NTU)
Suspended Solids (mg/L)
Ammonia Nitrogen (mg/L)
Faecal Coliforms (cfu/100mL)
E. coli (cfu/100mL)
Chlorophy ll-a (µg/L)
5-day Biochemical Ox y gen Demand (mg/L)
Orthophosphate Phosphorus (mg/L)
Total Inorganic Nitrogen (mg/L)
Nitrate Nitrogen (mg/L)
Bottom
Total Phosphorus (mg/L)
Silica (as SiO2) (mg/L)
pH
Total Kjeldahl Nitrogen (mg/L)
Total Nitrogen (mg/L)
West Lamma Channel
Bottom
Temperature (°C)
Salinity
Dissolv ed Ox y gen (mg/L)

3
P 3.16MARINE WATER QUALITY IN HONG KONG IN 2004
SOUTHERN WATERS SOUTHERN WCZ
Table Table Table Table Table 33333.....2 (continued)2 (continued)2 (continued)2 (continued)2 (continued)Summary water quality statistics of the Southern WCZ in 2004
Note : 1. Unless otherwise specified, data presented are depth-averaged (A) values calculated by taking the means of threedepths: Surface (S), Mid-depth (M), Bottom (B).
2. Data presented are annual arithmetic means of the depth-averaged results except for E. coli and faecal coliformswhich are annual geometric means.
3. Data in brackets indicate the ranges.
Soko IslandsParameter SM10 SM11 SM12 SM13 SM17 SM20
Number of samples 12 12 12 12 12 1224.3 24.3 24.2 24.2 23.6 23.9
(18.4 - 28.6) (18.1 - 28.7) (18.5 - 28.6) (18.4 - 28.5) (18.3 - 27.9) (18.5 - 28.4)30.7 31.2 31.1 31.2 32.2 31.4
(22.3 - 33.5) (24.6 - 33.7) (22.7 - 33.9) (22.3 - 33.9) (27.5 - 34.2) (26.8 - 34.0)7.5 7.7 7.5 7.8 7.2 6.9
(4.7 - 10.3) (4.2 - 10.3) (4.3 - 9.2) (4.7 - 10.3) (4.5 - 9.3) (4.1 - 8.9)7.6 7.7 7.6 7.9 6.8 6.9
(4.8 - 10.6) (4.3 - 9.7) (4.3 - 9.8) (4.9 - 10.2) (4.0 - 10.4) (4.1 - 8.6)107 110 106 110 101 98
(70 - 152) (62 - 157) (63 - 135) (70 - 157) (66 - 132) (60 - 135)107 109 106 112 96 97
(72 - 154) (63 - 148) (64 - 138) (72 - 157) (58 - 146) (60 - 131)8.1 8.2 8.2 8.2 8.2 8.2
(7.9 - 8.4) (7.9 - 8.4) (7.9 - 8.5) (7.9 - 8.5) (7.9 - 8.3) (7.9 - 8.4)1.6 1.8 1.7 1.9 2.0 1.8
(0.8 - 2.3) (1.1 - 2.8) (0.8 - 2.7) (1.0 - 4.4) (1.0 - 3.0) (0.7 - 3.3)13.6 11.7 11.6 11.1 11.7 18.8
(10.2 - 19.7) (9.2 - 15.0) (8.2 - 16.0) (8.2 - 24.2) (6.7 - 25.7) (9.3 - 69.1)10.2 7.1 10.3 7.6 7.4 18.9
(6.3 - 20.0) (5.0 - 10.8) (3.0 - 40.8) (3.0 - 27.0) (3.4 - 25.7) (3.1 - 106)1.4 1.5 1.5 1.4 0.9 1.2
(0.2 - 3.8) (0.4 - 3.2) (0.4 - 3.1) (0.5 - 3.3) (0.4 - 1.7) (0.4 - 4.0)0.11 0.09 0.08 0.06 0.03 0.04
(0.04 - 0.23) (0.04 - 0.21) (0.03 - 0.18) (0.03 - 0.15) (0.01 - 0.06) (0.01 - 0.11)0.006 0.005 0.004 0.004 0.002 0.003
(0.002 - 0.008) (0.002 - 0.007) (0.002 - 0.007) (0.001 - 0.006) (<0.001 - 0.004) (0.001 - 0.005)0.04 0.03 0.03 0.03 0.02 0.03
(0.01 - 0.08) (<0.01 - 0.08) (<0.01 - 0.07) (<0.01 - 0.07) (<0.01 - 0.06) (<0.01 - 0.07)0.17 0.13 0.12 0.11 0.07 0.13
(0.06 - 0.41) (0.02 - 0.28) (0.02 - 0.33) (<0.01 - 0.37) (<0.01 - 0.24) (<0.01 - 0.32) 0.32 0.26 0.23 0.21 0.13 0.20
(0.13 - 0.56) (0.10 - 0.49) (0.09 - 0.48) (0.05 - 0.46) (0.03 - 0.32) (0.03 - 0.41)0.29 0.27 0.24 0.21 0.14 0.18
(0.19 - 0.40) (0.20 - 0.36) (0.17 - 0.33) (0.14 - 0.29) (0.11 - 0.19) (0.11 - 0.27)0.51 0.44 0.40 0.35 0.24 0.34
(0.35 - 0.86) (0.31 - 0.65) (0.21 - 0.70) (0.17 - 0.71) (0.14 - 0.44) (0.14 - 0.51)0.02 0.02 0.01 0.01 0.01 0.01
(<0.01 - 0.04) (<0.01 - 0.04) (<0.01 - 0.03) (<0.01 - 0.03) (0.01 - 0.02) (<0.01 - 0.02)0.04 0.04 0.03 0.03 0.02 0.04
(0.02 - 0.07) (0.02 - 0.05) (0.02 - 0.05) (0.02 - 0.04) (0.02 - 0.03) (0.02 - 0.10)0.9 0.7 0.7 0.7 0.6 0.8
(0.1 - 2.7) (0.1 - 2.8) (0.1 - 2.5) (0.1 - 2.4) (0.1 - 1.9) (0.1 - 2.5)9.5 10.7 9.8 8.2 4.2 5.0
(1.7 - 35.0) (1.7 - 33.3) (1.0 - 29.0) (1.1 - 21.7) (0.6 - 9.2) (0.5 - 14.7)11 2 10 2 1 1
(1 - 140) (1 - 40) (2 - 86) (1 - 43) (1 - 3) (1 - 6)23 6 25 5 2 3
(3 - 230) (1 - 100) (5 - 260) (1 - 450) (1 - 400) (1 - 130)
Temperature (°C)
Salinity
Dissolv ed Ox y gen (mg/L)
Dissolv ed Ox y gen (% Saturation)
Faecal Coliforms (cfu/100mL)
E. coli (cfu/100mL)
Chlorophy ll-a (µg/L)
5-day Biochemical Ox y gen Demand (mg/L)
Orthophosphate Phosphorus (mg/L)
Total Inorganic Nitrogen (mg/L)
Unionised Ammonia (mg/L)
Nitrite Nitrogen (mg/L)
Nitrate Nitrogen (mg/L)
Ammonia Nitrogen (mg/L)
Total Phosphorus (mg/L)
Silica (as SiO2) (mg/L)
pH
Total Kjeldahl Nitrogen (mg/L)
Total Nitrogen (mg/L)
Secchi Disc Depth (m)
Turbidity (NTU)
Suspended Solids (mg/L)
Lantau Island (East) Lantau Island (South)
Bottom
Bottom
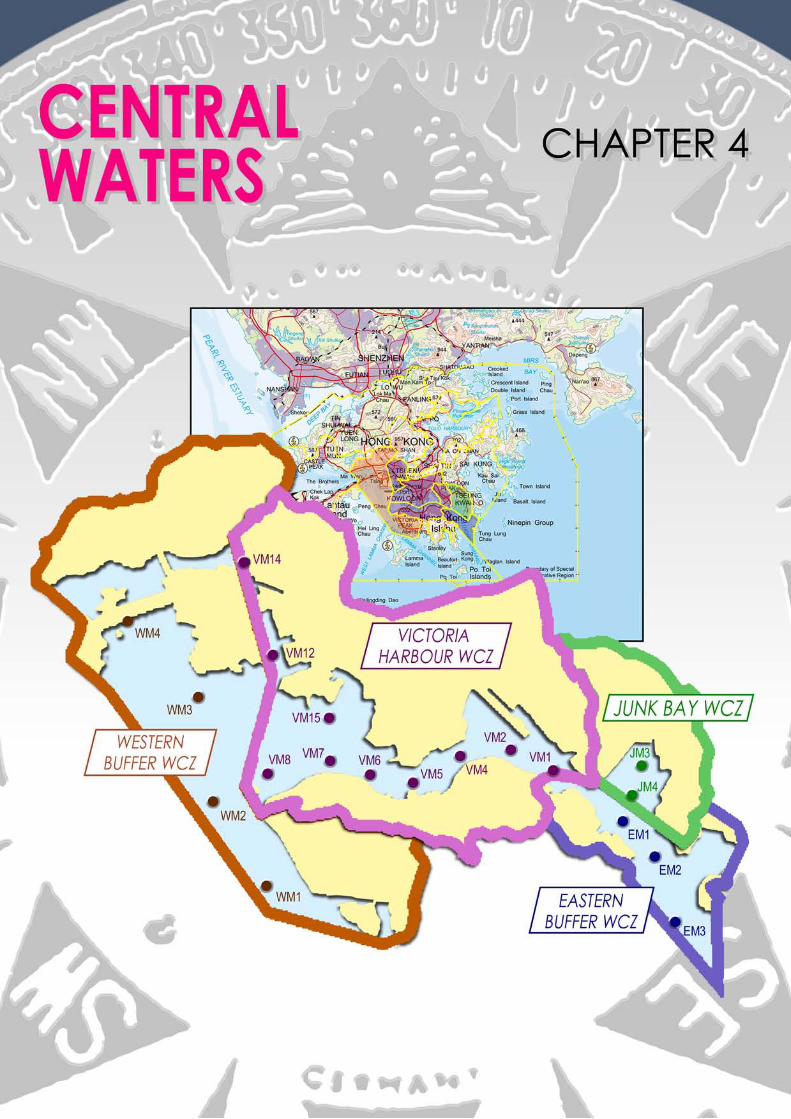
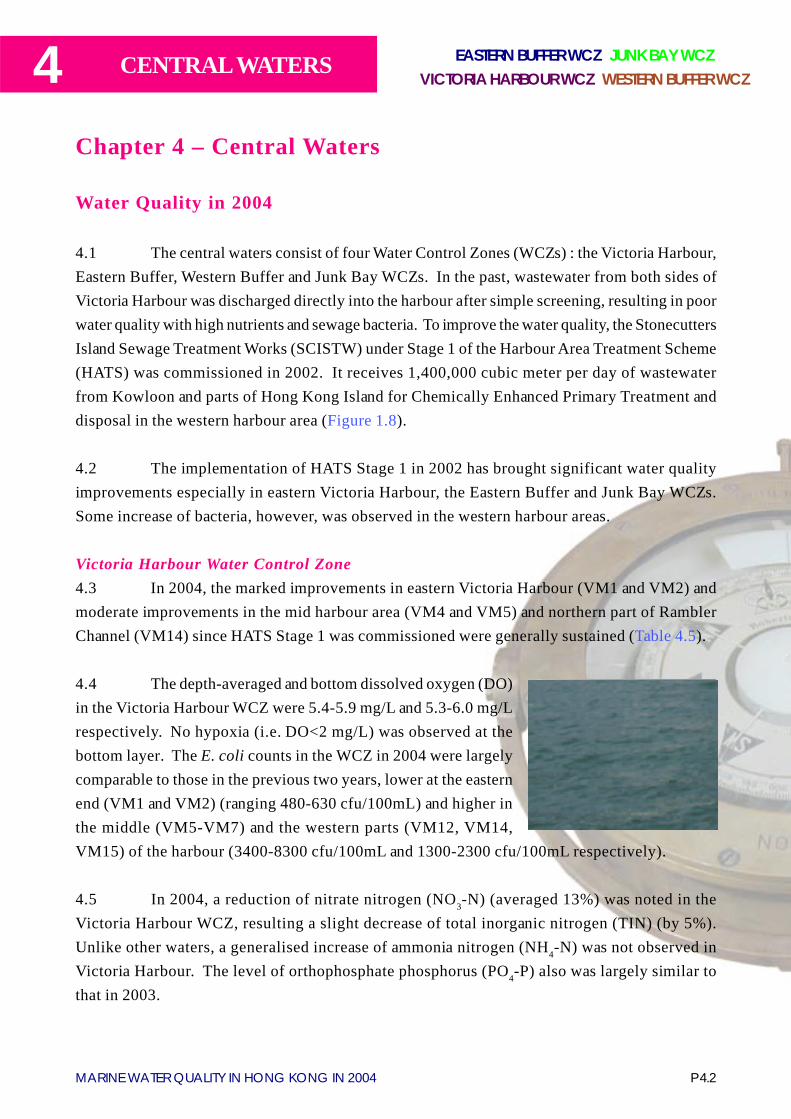
4
P 4.2MARINE WATER QUALITY IN HONG KONG IN 2004
CENTRAL WATERS
Chapter 4 – Central Waters
Water Quality in 2004
4.1 The central waters consist of four Water Control Zones (WCZs) : the Victoria Harbour,Eastern Buffer, Western Buffer and Junk Bay WCZs. In the past, wastewater from both sides ofVictoria Harbour was discharged directly into the harbour after simple screening, resulting in poorwater quality with high nutrients and sewage bacteria. To improve the water quality, the StonecuttersIsland Sewage Treatment Works (SCISTW) under Stage 1 of the Harbour Area Treatment Scheme(HATS) was commissioned in 2002. It receives 1,400,000 cubic meter per day of wastewaterfrom Kowloon and parts of Hong Kong Island for Chemically Enhanced Primary Treatment anddisposal in the western harbour area (Figure 1.8).
4.2 The implementation of HATS Stage 1 in 2002 has brought significant water qualityimprovements especially in eastern Victoria Harbour, the Eastern Buffer and Junk Bay WCZs.Some increase of bacteria, however, was observed in the western harbour areas.
Victoria Harbour Water Control Zone4.3 In 2004, the marked improvements in eastern Victoria Harbour (VM1 and VM2) andmoderate improvements in the mid harbour area (VM4 and VM5) and northern part of RamblerChannel (VM14) since HATS Stage 1 was commissioned were generally sustained (Table 4.5).
4.4 The depth-averaged and bottom dissolved oxygen (DO)in the Victoria Harbour WCZ were 5.4-5.9 mg/L and 5.3-6.0 mg/Lrespectively. No hypoxia (i.e. DO<2 mg/L) was observed at thebottom layer. The E. coli counts in the WCZ in 2004 were largelycomparable to those in the previous two years, lower at the easternend (VM1 and VM2) (ranging 480-630 cfu/100mL) and higher inthe middle (VM5-VM7) and the western parts (VM12, VM14,VM15) of the harbour (3400-8300 cfu/100mL and 1300-2300 cfu/100mL respectively).
4.5 In 2004, a reduction of nitrate nitrogen (NO3-N) (averaged 13%) was noted in theVictoria Harbour WCZ, resulting a slight decrease of total inorganic nitrogen (TIN) (by 5%).Unlike other waters, a generalised increase of ammonia nitrogen (NH4-N) was not observed inVictoria Harbour. The level of orthophosphate phosphorus (PO4-P) also was largely similar tothat in 2003.
EASTERN BUFFER WCZ JUNK BAY WCZVICTORIA HARBOUR WCZ WESTERN BUFFER WCZ
iwp12
印章
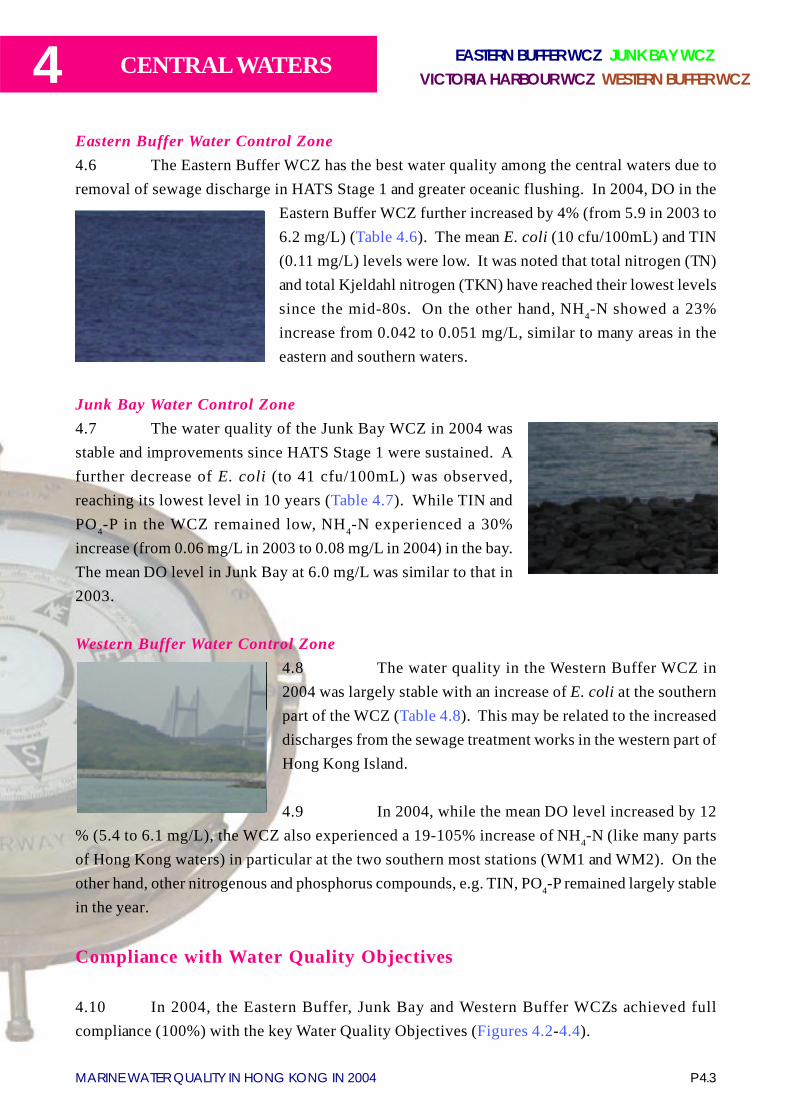
P 4.3MARINE WATER QUALITY IN HONG KONG IN 2004
4 CENTRAL WATERS
Eastern Buffer Water Control Zone4.6 The Eastern Buffer WCZ has the best water quality among the central waters due toremoval of sewage discharge in HATS Stage 1 and greater oceanic flushing. In 2004, DO in the
Eastern Buffer WCZ further increased by 4% (from 5.9 in 2003 to6.2 mg/L) (Table 4.6). The mean E. coli (10 cfu/100mL) and TIN(0.11 mg/L) levels were low. It was noted that total nitrogen (TN)and total Kjeldahl nitrogen (TKN) have reached their lowest levelssince the mid-80s. On the other hand, NH4-N showed a 23%increase from 0.042 to 0.051 mg/L, similar to many areas in theeastern and southern waters.
Junk Bay Water Control Zone4.7 The water quality of the Junk Bay WCZ in 2004 wasstable and improvements since HATS Stage 1 were sustained. Afurther decrease of E. coli (to 41 cfu/100mL) was observed,reaching its lowest level in 10 years (Table 4.7). While TIN andPO4-P in the WCZ remained low, NH4-N experienced a 30%increase (from 0.06 mg/L in 2003 to 0.08 mg/L in 2004) in the bay.The mean DO level in Junk Bay at 6.0 mg/L was similar to that in2003.
Western Buffer Water Control Zone4.8 The water quality in the Western Buffer WCZ in2004 was largely stable with an increase of E. coli at the southernpart of the WCZ (Table 4.8). This may be related to the increaseddischarges from the sewage treatment works in the western part ofHong Kong Island.
4.9 In 2004, while the mean DO level increased by 12% (5.4 to 6.1 mg/L), the WCZ also experienced a 19-105% increase of NH4-N (like many partsof Hong Kong waters) in particular at the two southern most stations (WM1 and WM2). On theother hand, other nitrogenous and phosphorus compounds, e.g. TIN, PO4-P remained largely stablein the year.
Compliance with Water Quality Objectives
4.10 In 2004, the Eastern Buffer, Junk Bay and Western Buffer WCZs achieved fullcompliance (100%) with the key Water Quality Objectives (Figures 4.2-4.4).
EASTERN BUFFER WCZ JUNK BAY WCZVICTORIA HARBOUR WCZ WESTERN BUFFER WCZ
iwp12
印章
iwp12
印章
iwp12
印章
4
P 4.4MARINE WATER QUALITY IN HONG KONG IN 2004
CENTRAL WATERS EASTERN BUFFER WCZ JUNK BAY WCZVICTORIA HARBOUR WCZ WESTERN BUFFER WCZ
4.11 The WQO compliance of the Victoria Harbour WCZ was 87%, slightly lower than thatin 2003 (93%). While the compliance with the objective for unionized ammonia was 100%, thatfor DO and TIN were both at 80% (Figure 4.1).
Long-term Water Quality Trends
4.12 The long-term water quality changes in the Victoria Harbour WCZ are summarised inTable 4.1. For E. coli bacteria, the increasing trends observed in the eastern harbour area werearrested in 2002 after the implementation of HATS Stage 1, while those in mid harbour also ceasedin 2003. A significant decline in TKN and TN was generally observed, except at the two westernstations VM5 and VM8. On the other hand, an increase of nitrate nitrogen (NO3-N) was detectedin the western part of the harbour. Signs of water quality improvements: an increase in DO,decreases in nutrients (TN, total phosphorus (TP)) and organics (5-day Biochemical OxygenDemand (BOD5)) were also evident in the north Rambler Channel (VM14).
4.13 In the Eastern Buffer and Junk Bay WCZs, all monitoring stations showed significantimproving trends in TKN, TN and TP (Tables 4.2 and 4.3). Long-term increases in E. coli bacteriawere generally observed in the Western Buffer WCZ (Table 4.4). On the other hand, significantdeclines in TKN, TN, TP and silica were noted at most monitoring stations since the 80s.
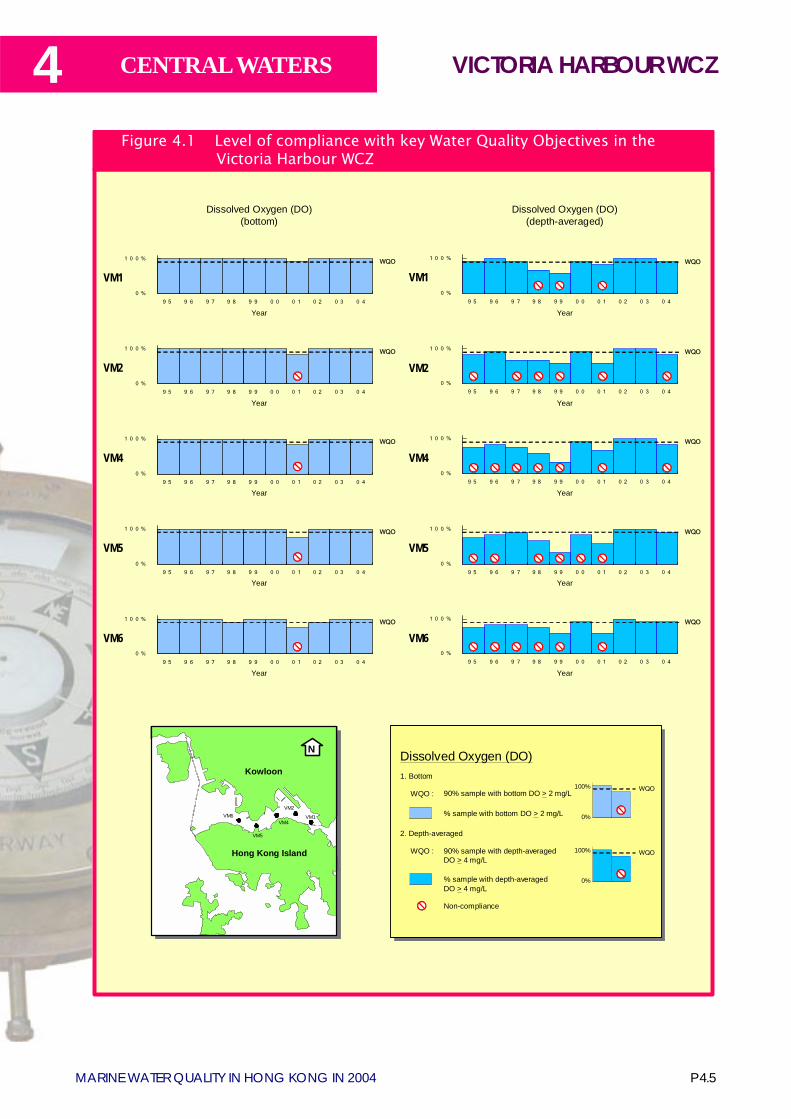
P 4.5MARINE WATER QUALITY IN HONG KONG IN 2004
4 CENTRAL WATERS VICTORIA HARBOUR WCZ
Dissolved Oxygen (DO)(bottom)
Dissolved Oxygen (DO)(depth-averaged)
0 %
1 0 0 %
9 5 9 6 9 7 9 8 9 9 0 0 0 1 0 2 0 3 0 4
VM1WQO
Year
WQO
0 %
1 0 0 %
9 5 9 6 9 7 9 8 9 9 0 0 0 1 0 2 0 3 0 4
VM1
Year
0 %
1 0 0 %
9 5 9 6 9 7 9 8 9 9 0 0 0 1 0 2 0 3 0 4
VM2WQO
Year
0 %
1 0 0 %
9 5 9 6 9 7 9 8 9 9 0 0 0 1 0 2 0 3 0 4
VM4WQO
Year
0 %
1 0 0 %
9 5 9 6 9 7 9 8 9 9 0 0 0 1 0 2 0 3 0 4
VM5WQO
Year
WQO
0 %
1 0 0 %
9 5 9 6 9 7 9 8 9 9 0 0 0 1 0 2 0 3 0 4
VM6
Year
0 %
1 0 0 %
9 5 9 6 9 7 9 8 9 9 0 0 0 1 0 2 0 3 0 4
VM2WQO
Year
0 %
1 0 0 %
9 5 9 6 9 7 9 8 9 9 0 0 0 1 0 2 0 3 0 4
VM4WQO
Year
0 %
1 0 0 %
9 5 9 6 9 7 9 8 9 9 0 0 0 1 0 2 0 3 0 4
VM5WQO
Year
0 %
1 0 0 %
9 5 9 6 9 7 9 8 9 9 0 0 0 1 0 2 0 3 0 4
VM6WQO
Year
Dissolved Oxygen (DO)
% sample with bottom DO > 2 mg/L
90% sample with bottom DO > 2 mg/LWQO :
2. Depth-averaged
1. Bottom
90% sample with depth-averagedDO > 4 mg/L
WQO :
Non-compliance
% sample with depth-averagedDO > 4 mg/L
WQO
WQO
VM2
Hong Kong Island
VM6
VM5
VM4
Kowloon
VM1
N
100%
0%
100%
0%
Figure 4.1 Level of compliance with key Water Quality Objectives in the Victoria Harbour WCZ
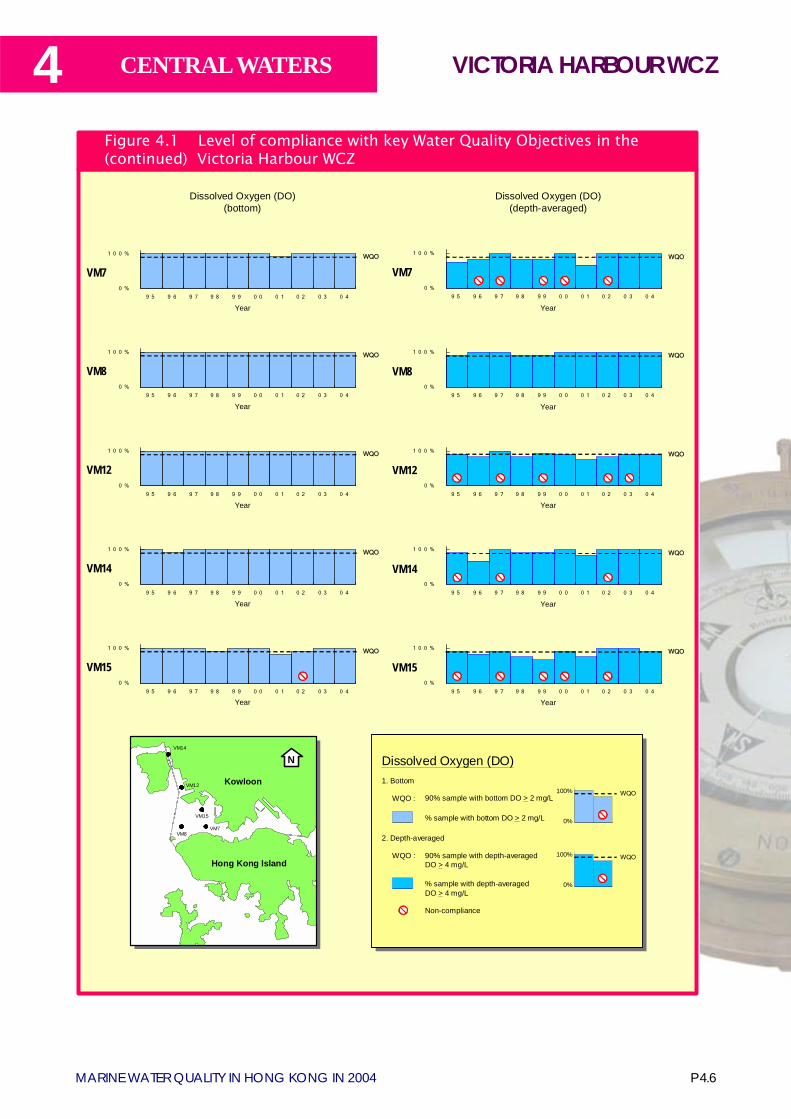
4
P 4.6MARINE WATER QUALITY IN HONG KONG IN 2004
CENTRAL WATERS
Dissolved Oxygen (DO)(bottom)
Dissolved Oxygen (DO)(depth-averaged)
0 %
1 0 0 %
9 5 9 6 9 7 9 8 9 9 0 0 0 1 0 2 0 3 0 4
VM8WQO
Year
0 %
1 0 0 %
9 5 9 6 9 7 9 8 9 9 0 0 0 1 0 2 0 3 0 4
VM8WQO
Year
Dissolved Oxygen (DO)
% sample with bottom DO > 2 mg/L
90% sample with bottom DO > 2 mg/LWQO :
2. Depth-averaged
1. Bottom
90% sample with depth-averagedDO > 4 mg/L
WQO :
Non-compliance
% sample with depth-averagedDO > 4 mg/L
WQO
WQO
Hong Kong Island
Kowloon
N
VM7
VM14
VM15
VM8
VM12
WQO
0 %
1 0 0 %
9 5 9 6 9 7 9 8 9 9 0 0 0 1 0 2 0 3 0 4
VM14
Year
0 %
1 0 0 %
9 5 9 6 9 7 9 8 9 9 0 0 0 1 0 2 0 3 0 4
VM14WQO
Year
0 %
1 0 0 %
9 5 9 6 9 7 9 8 9 9 0 0 0 1 0 2 0 3 0 4
VM12WQO
Year
0 %
1 0 0 %
9 5 9 6 9 7 9 8 9 9 0 0 0 1 0 2 0 3 0 4
VM12WQO
Year
0 %
1 0 0 %
9 5 9 6 9 7 9 8 9 9 0 0 0 1 0 2 0 3 0 4
VM7WQO
Year
WQO
0 %
1 0 0 %
9 5 9 6 9 7 9 8 9 9 0 0 0 1 0 2 0 3 0 4
VM7
Year
WQO
0 %
1 0 0 %
9 5 9 6 9 7 9 8 9 9 0 0 0 1 0 2 0 3 0 4
VM15
Year
0 %
1 0 0 %
9 5 9 6 9 7 9 8 9 9 0 0 0 1 0 2 0 3 0 4
VM15WQO
Year
100%
0%
100%
0%
Figure 4.1 Level of compliance with key Water Quality Objectives in the (continued) Victoria Harbour WCZ
VICTORIA HARBOUR WCZ
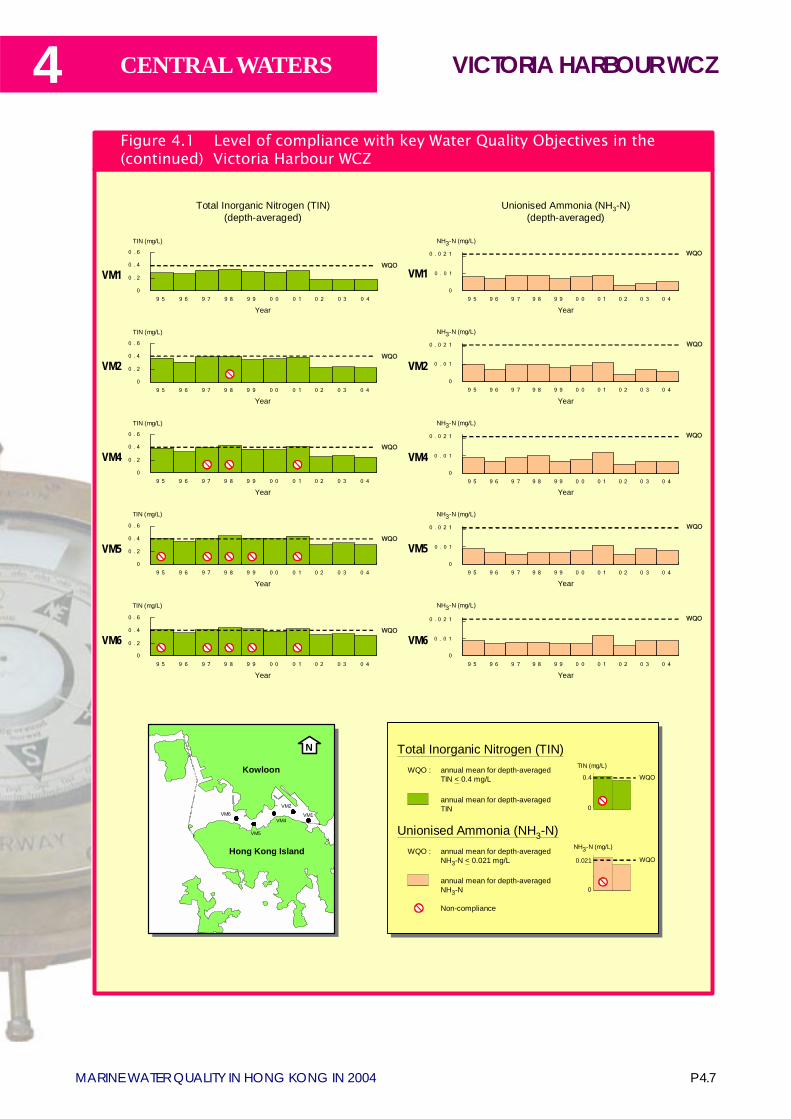
P 4.7MARINE WATER QUALITY IN HONG KONG IN 2004
4 CENTRAL WATERS
0
0.3
Total Inorganic Nitrogen (TIN)(depth-averaged)
Unionised Ammonia (NH3-N)(depth-averaged)
Total Inorganic Nitrogen (TIN)
annual mean for depth-averagedTIN
annual mean for depth-averagedTIN < 0.4 mg/L
WQO :
annual mean for depth-averagedNH3-N < 0.021 mg/L
WQO :
Non-compliance
annual mean for depth-averagedNH3-N
Unionised Ammonia (NH3-N)
WQO
TIN (mg/L)
0
0.021 WQO
NH3-N (mg/L)
0
0 . 0 2 1
9 5 9 6 9 7 9 8 9 9 0 0 0 1 0 2 0 3 0 4
VM2
Year
NH3-N (mg/L)
WQO
0
0 . 0 2 1
9 5 9 6 9 7 9 8 9 9 0 0 0 1 0 2 0 3 0 4
VM4
Year
NH3-N (mg/L)
WQO
0
0 . 0 2 1
9 5 9 6 9 7 9 8 9 9 0 0 0 1 0 2 0 3 0 4
VM5
Year
NH3-N (mg/L)
WQO
NH3-N (mg/L)
VM60
0 . 0 2 1
9 5 9 6 9 7 9 8 9 9 0 0 0 1 0 2 0 3 0 4
Year
WQO
0
0 . 2
0 . 4
0 . 6
9 5 9 6 9 7 9 8 9 9 0 0 0 1 0 2 0 3 0 4
VM6
Year
TIN (mg/L)
WQO
0
0 . 2
0 . 4
0 . 6
9 5 9 6 9 7 9 8 9 9 0 0 0 1 0 2 0 3 0 4
VM5
Year
TIN (mg/L)
WQO
0
0 . 2
0 . 4
0 . 6
9 5 9 6 9 7 9 8 9 9 0 0 0 1 0 2 0 3 0 4
VM2
Year
TIN (mg/L)
WQO
0
0 . 0 2 1
9 5 9 6 9 7 9 8 9 9 0 0 0 1 0 2 0 3 0 4
Year
NH3-N (mg/L)
WQO
VM10
0 . 2
0 . 4
0 . 6
9 5 9 6 9 7 9 8 9 9 0 0 0 1 0 2 0 3 0 4
VM1
Year
TIN (mg/L)
WQO
0
0 . 2
0 . 4
0 . 6
9 5 9 6 9 7 9 8 9 9 0 0 0 1 0 2 0 3 0 4
VM4
Year
TIN (mg/L)
WQO
VM2
Hong Kong Island
VM6
VM5
VM4
Kowloon
VM1
N
0 . 0 1
0 . 0 1
0 . 0 1
0 . 0 1
0 . 0 1
0.4
0
0.021
0
Figure 4.1 Level of compliance with key Water Quality Objectives in the (continued) Victoria Harbour WCZ
VICTORIA HARBOUR WCZ
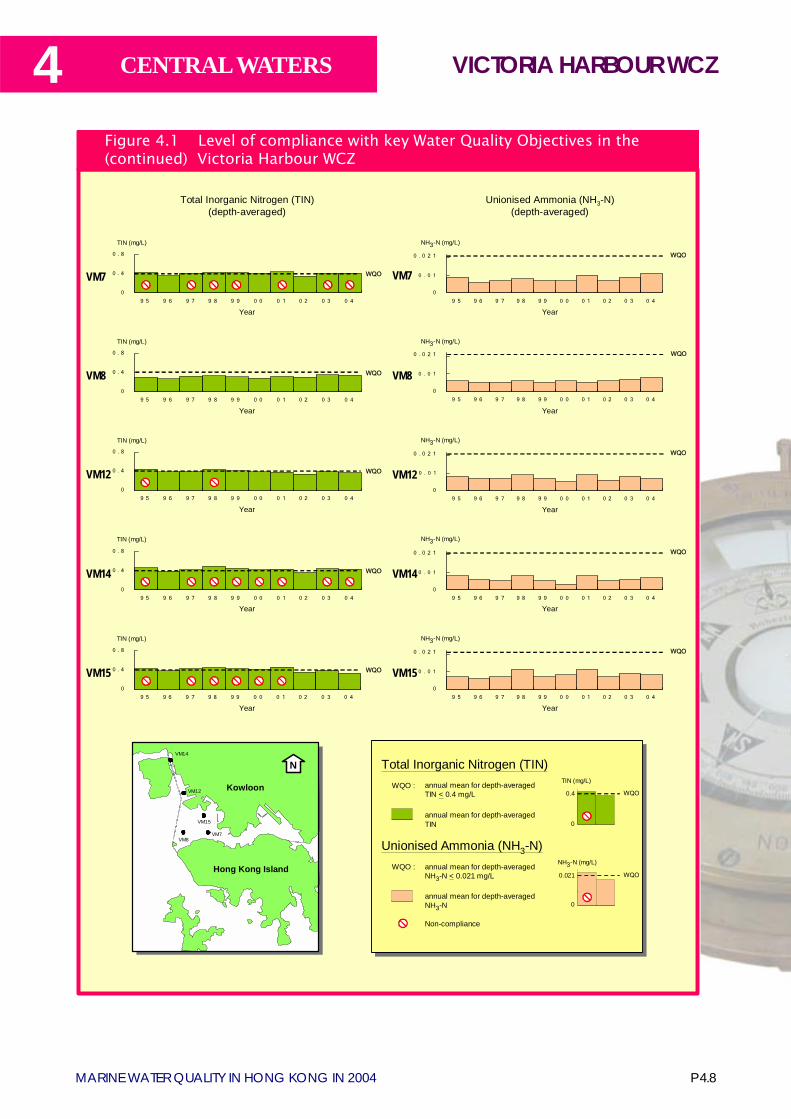
4
P 4.8MARINE WATER QUALITY IN HONG KONG IN 2004
CENTRAL WATERS
0
0.3
Hong Kong Island
Kowloon
N
VM7
VM14
VM15
VM8
Total Inorganic Nitrogen (TIN)(depth-averaged)
Unionised Ammonia (NH3-N)(depth-averaged)
0
0 . 0 2 1
9 5 9 6 9 7 9 8 9 9 0 0 0 1 0 2 0 3 0 4
VM8
Year
NH3-N (mg/L)
WQO
0
0 . 4
0 . 8
9 5 9 6 9 7 9 8 9 9 0 0 0 1 0 2 0 3 0 4
VM8
Year
TIN (mg/L)
WQO
Total Inorganic Nitrogen (TIN)
annual mean for depth-averagedTIN
annual mean for depth-averagedTIN < 0.4 mg/L
WQO :
annual mean for depth-averagedNH3-N < 0.021 mg/L
WQO :
Non-compliance
annual mean for depth-averagedNH3-N
Unionised Ammonia (NH3-N)
WQO
TIN (mg/L)
0
0.021 WQO
NH3-N (mg/L)
NH3-N (mg/L)
VM140
0 . 0 2 1
9 5 9 6 9 7 9 8 9 9 0 0 0 1 0 2 0 3 0 4
Year
WQO
0
0 . 4
0 . 8
9 5 9 6 9 7 9 8 9 9 0 0 0 1 0 2 0 3 0 4
VM14
Year
TIN (mg/L)
WQO
0
0 . 0 2 1
9 5 9 6 9 7 9 8 9 9 0 0 0 1 0 2 0 3 0 4
VM12
Year
NH3-N (mg/L)
WQO
0
0 . 4
0 . 8
9 5 9 6 9 7 9 8 9 9 0 0 0 1 0 2 0 3 0 4
VM12
Year
TIN (mg/L)
WQO
0
0 . 0 2 1
9 5 9 6 9 7 9 8 9 9 0 0 0 1 0 2 0 3 0 4
Year
NH3-N (mg/L)
WQO
VM70
0 . 4
0 . 8
9 5 9 6 9 7 9 8 9 9 0 0 0 1 0 2 0 3 0 4
VM7
Year
TIN (mg/L)
WQO
NH3-N (mg/L)
VM150
0 . 0 2 1
9 5 9 6 9 7 9 8 9 9 0 0 0 1 0 2 0 3 0 4
Year
WQO
0
0 . 4
0 . 8
9 5 9 6 9 7 9 8 9 9 0 0 0 1 0 2 0 3 0 4
VM15
Year
TIN (mg/L)
WQO
VM12 0.4
0
0.021
0
0 . 0 1
0 . 0 1
0 . 0 1
0 . 0 1
0 . 0 1
Figure 4.1 Level of compliance with key Water Quality Objectives in the (continued) Victoria Harbour WCZ
VICTORIA HARBOUR WCZ
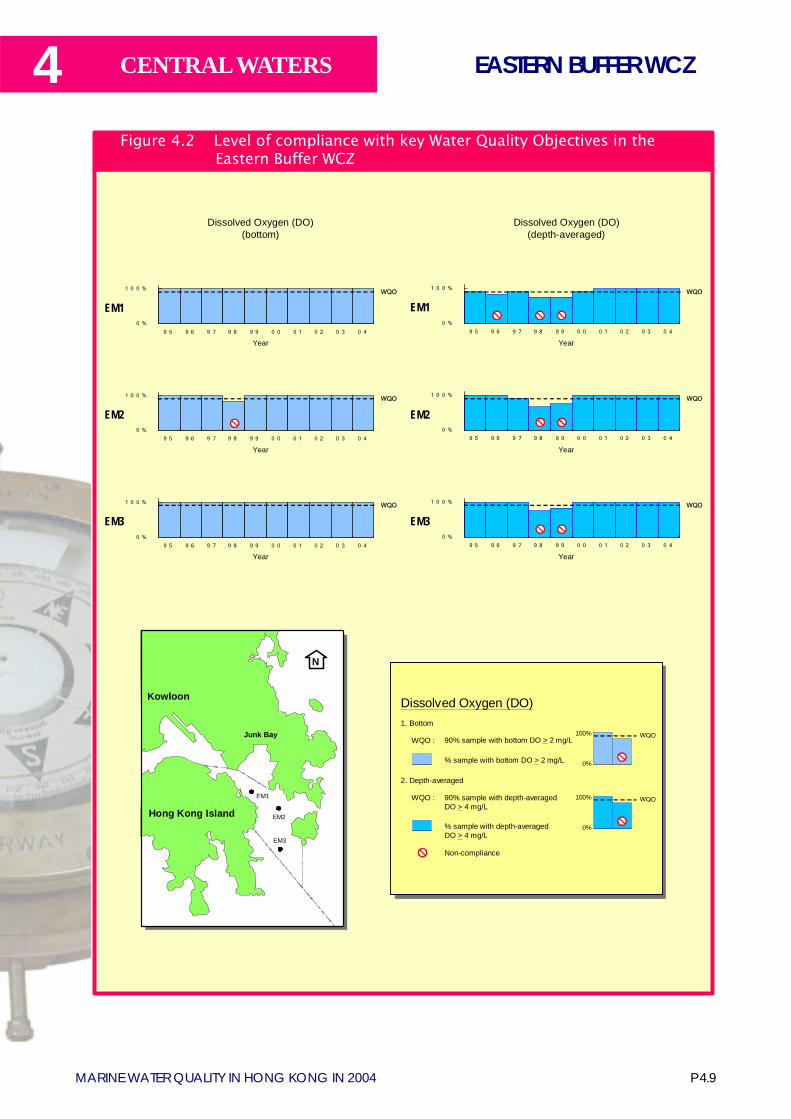
P 4.9MARINE WATER QUALITY IN HONG KONG IN 2004
4 CENTRAL WATERS EASTERN BUFFER WCZ
Dissolved Oxygen (DO)(bottom)
Dissolved Oxygen (DO)(depth-averaged)
0 %
1 0 0 %
9 5 9 6 9 7 9 8 9 9 0 0 0 1 0 2 0 3 0 4
EM1WQO
Year
0 %
1 0 0 %
9 5 9 6 9 7 9 8 9 9 0 0 0 1 0 2 0 3 0 4
EM1WQO
Year
0 %
1 0 0 %
9 5 9 6 9 7 9 8 9 9 0 0 0 1 0 2 0 3 0 4
EM2WQO
Year
0 %
1 0 0 %
9 5 9 6 9 7 9 8 9 9 0 0 0 1 0 2 0 3 0 4
EM2WQO
Year
0 %
1 0 0 %
9 5 9 6 9 7 9 8 9 9 0 0 0 1 0 2 0 3 0 4
EM3WQO
Year
0 %
1 0 0 %
9 5 9 6 9 7 9 8 9 9 0 0 0 1 0 2 0 3 0 4
EM3WQO
Year
Dissolved Oxygen (DO)
% sample with bottom DO > 2 mg/L
90% sample with bottom DO > 2 mg/LWQO :
2. Depth-averaged
1. Bottom
90% sample with depth-averagedDO > 4 mg/L
WQO :
Non-compliance
% sample with depth-averagedDO > 4 mg/L
WQO
WQO
N
EM2
EM1
EM3
Hong Kong Island
Kowloon
Junk Bay 100%
0%
100%
0%
Figure 4.2 Level of compliance with key Water Quality Objectives in the Eastern Buffer WCZ
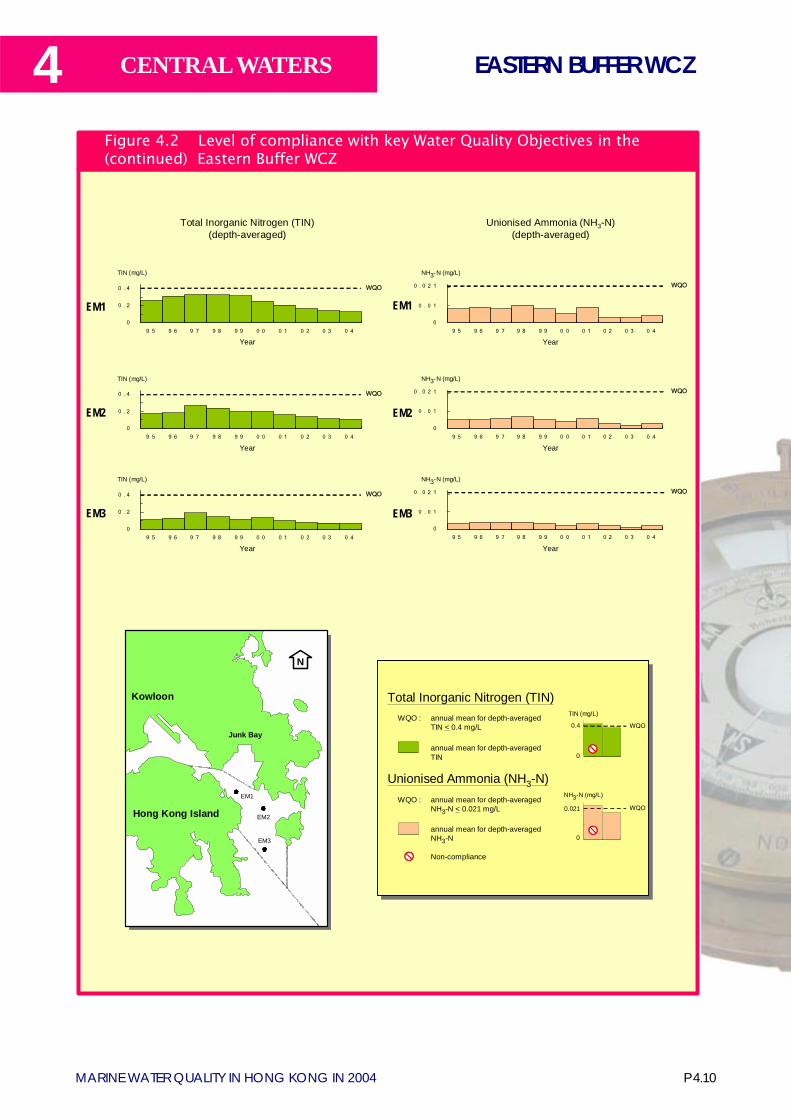
4
P 4.10MARINE WATER QUALITY IN HONG KONG IN 2004
CENTRAL WATERS
0
0.3
N
EM2
EM1
EM3
Hong Kong Island
Kowloon
Junk Bay
0
0 . 0 2 1
9 5 9 6 9 7 9 8 9 9 0 0 0 1 0 2 0 3 0 4
EM3
Year
NH3-N (mg/L)
WQO
0
0 . 2
0 . 4
9 5 9 6 9 7 9 8 9 9 0 0 0 1 0 2 0 3 0 4
EM3
Year
TIN (mg/L)
WQO
Total Inorganic Nitrogen (TIN)(depth-averaged)
Unionised Ammonia (NH3-N)(depth-averaged)
Total Inorganic Nitrogen (TIN)
annual mean for depth-averagedTIN
annual mean for depth-averagedTIN < 0.4 mg/L
WQO :
annual mean for depth-averagedNH3-N < 0.021 mg/L
WQO :
Non-compliance
annual mean for depth-averagedNH3-N
Unionised Ammonia (NH3-N)
WQO
TIN (mg/L)
0
0.021 WQO
NH3-N (mg/L)
0
0 . 0 2 1
9 5 9 6 9 7 9 8 9 9 0 0 0 1 0 2 0 3 0 4
EM2
Year
NH3-N (mg/L)
WQO
0
0 . 2
0 . 4
9 5 9 6 9 7 9 8 9 9 0 0 0 1 0 2 0 3 0 4
EM2
Year
TIN (mg/L)
WQO
0
0 . 0 2 1
9 5 9 6 9 7 9 8 9 9 0 0 0 1 0 2 0 3 0 4
Year
NH3-N (mg/L)
WQO
EM10
0 . 2
0 . 4
9 5 9 6 9 7 9 8 9 9 0 0 0 1 0 2 0 3 0 4
EM1
Year
TIN (mg/L)
WQO
0.4
0
0.021
0
0 . 0 1
0 . 0 1
0 . 0 1
Figure 4.2 Level of compliance with key Water Quality Objectives in the (continued) Eastern Buffer WCZ
EASTERN BUFFER WCZ
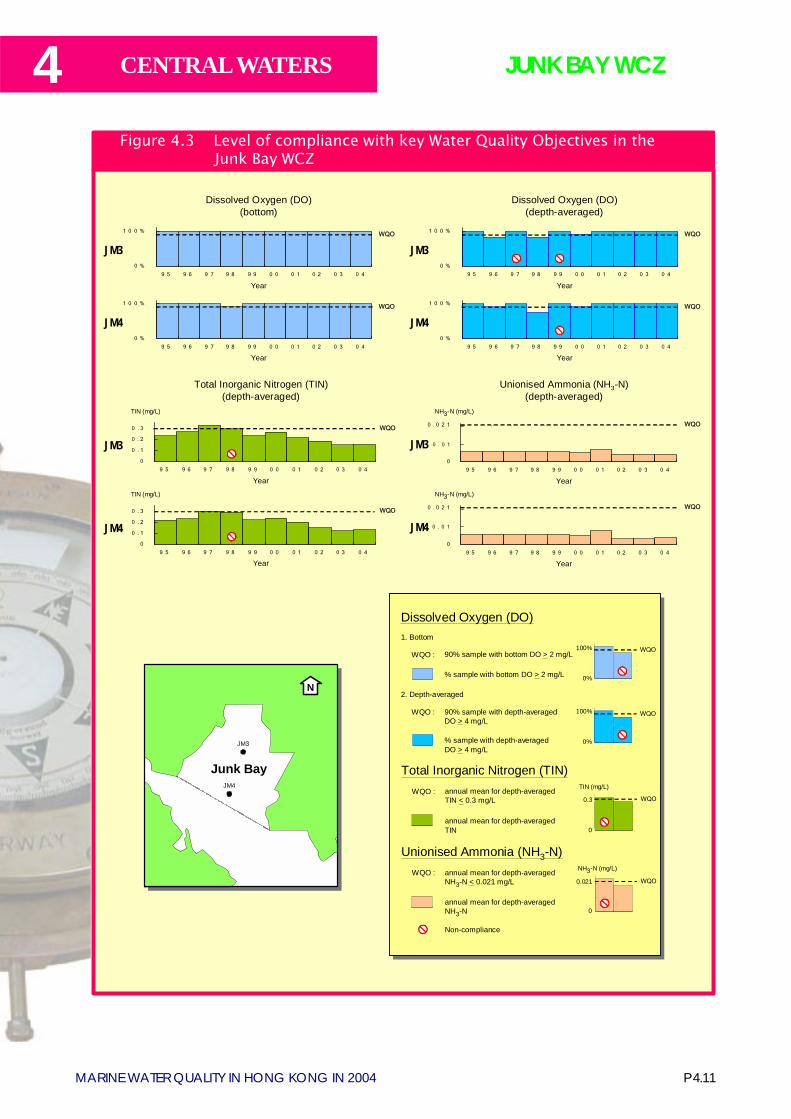
P 4.11MARINE WATER QUALITY IN HONG KONG IN 2004
4 CENTRAL WATERS JUNK BAY WCZ
0
0 . 1
0 . 2
0 . 3
9 5 9 6 9 7 9 8 9 9 0 0 0 1 0 2 0 3 0 4
0 %
1 0 0 %
9 5 9 6 9 7 9 8 9 9 0 0 0 1 0 2 0 3 0 4
Dissolved Oxygen (DO)(bottom)
Dissolved Oxygen (DO)(depth-averaged)
JM3WQO
Year
0 %
1 0 0 %
9 5 9 6 9 7 9 8 9 9 0 0 0 1 0 2 0 3 0 4
JM3WQO
Year
0 %
1 0 0 %
9 5 9 6 9 7 9 8 9 9 0 0 0 1 0 2 0 3 0 4
JM4WQO
Year
0 %
1 0 0 %
9 5 9 6 9 7 9 8 9 9 0 0 0 1 0 2 0 3 0 4
JM4WQO
Year
Total Inorganic Nitrogen (TIN)(depth-averaged)
Unionised Ammonia (NH3-N)(depth-averaged)
0
0 . 0 2 1
9 5 9 6 9 7 9 8 9 9 0 0 0 1 0 2 0 3 0 4
Year
NH3-N (mg/L)
WQO
JM3JM3
Year
TIN (mg/L)
WQO
0
0 . 0 2 1
9 5 9 6 9 7 9 8 9 9 0 0 0 1 0 2 0 3 0 4
Year
NH3-N (mg/L)
WQO
JM40
0 . 1
0 . 2
0 . 3
9 5 9 6 9 7 9 8 9 9 0 0 0 1 0 2 0 3 0 4
JM4
Year
TIN (mg/L)
WQO
Dissolved Oxygen (DO)
% sample with bottom DO > 2 mg/L
90% sample with bottom DO > 2 mg/LWQO :
2. Depth-averaged
1. Bottom
90% sample with depth-averagedDO > 4 mg/L
WQO :
% sample with depth-averagedDO > 4 mg/L
WQO
WQO
Total Inorganic Nitrogen (TIN)
annual mean for depth-averagedTIN
annual mean for depth-averagedTIN < 0.3 mg/L
WQO :
annual mean for depth-averagedNH3-N < 0.021 mg/L
WQO :
Non-compliance
annual mean for depth-averagedNH3-N
Unionised Ammonia (NH3-N)
WQO
0
0.3TIN (mg/L)
WQO
0
0.021NH3-N (mg/L)
Junk BayJM4
JM3
N
100%
0%
100%
0%
0.3
0
0.021
0
0 . 0 1
0 . 0 1
Figure 4.3 Level of compliance with key Water Quality Objectives in the Junk Bay WCZ
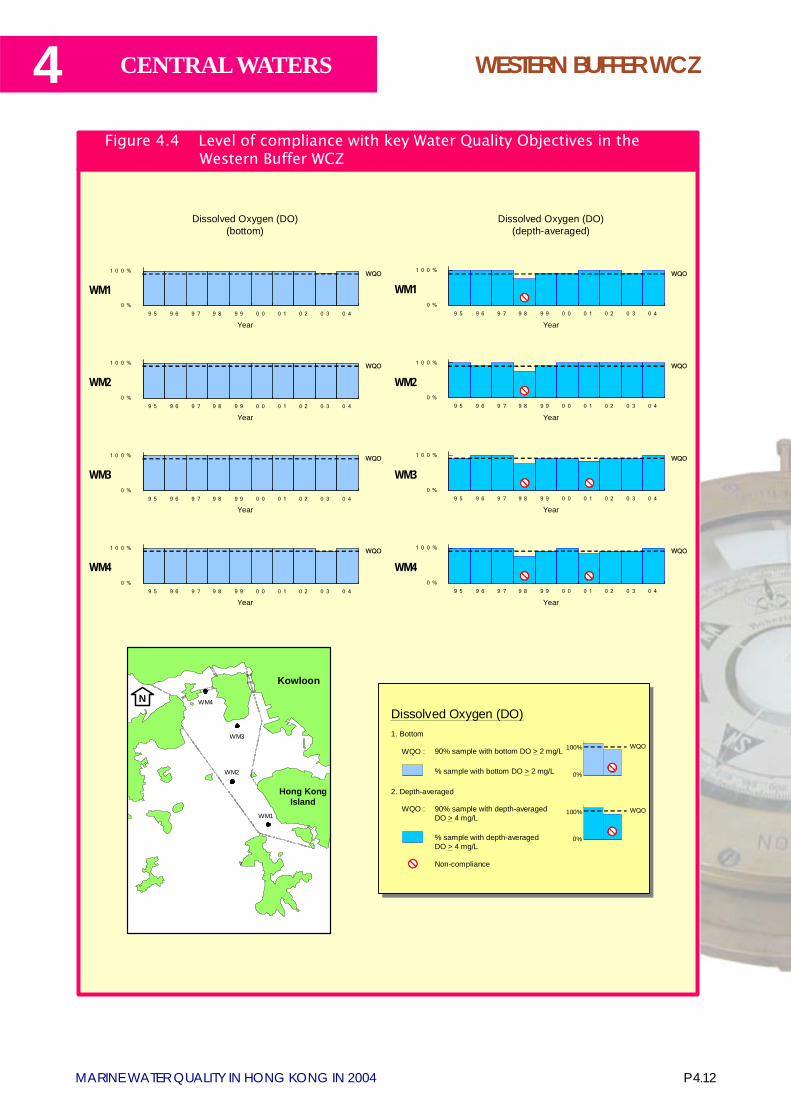
4
P 4.12MARINE WATER QUALITY IN HONG KONG IN 2004
CENTRAL WATERS WESTERN BUFFER WCZ
Dissolved Oxygen (DO)(bottom)
Dissolved Oxygen (DO)(depth-averaged)
0 %
1 0 0 %
9 5 9 6 9 7 9 8 9 9 0 0 0 1 0 2 0 3 0 4
WM1WQO
Year
0 %
1 0 0 %
9 5 9 6 9 7 9 8 9 9 0 0 0 1 0 2 0 3 0 4
WM1WQO
Year
0 %
1 0 0 %
9 5 9 6 9 7 9 8 9 9 0 0 0 1 0 2 0 3 0 4
WM2WQO
Year
0 %
1 0 0 %
9 5 9 6 9 7 9 8 9 9 0 0 0 1 0 2 0 3 0 4
WM2WQO
Year
0 %
1 0 0 %
9 5 9 6 9 7 9 8 9 9 0 0 0 1 0 2 0 3 0 4
WM3WQO
Year
0 %
1 0 0 %
9 5 9 6 9 7 9 8 9 9 0 0 0 1 0 2 0 3 0 4
WM3WQO
Year
0 %
1 0 0 %
9 5 9 6 9 7 9 8 9 9 0 0 0 1 0 2 0 3 0 4
WM4WQO
Year
0 %
1 0 0 %
9 5 9 6 9 7 9 8 9 9 0 0 0 1 0 2 0 3 0 4
WM4WQO
Year
Dissolved Oxygen (DO)
% sample with bottom DO > 2 mg/L
90% sample with bottom DO > 2 mg/LWQO :
2. Depth-averaged
1. Bottom
90% sample with depth-averagedDO > 4 mg/L
WQO :
Non-compliance
% sample with depth-averagedDO > 4 mg/L
WQO
WQO100%
0%
100%
0%
N
WM1
WM3
WM2
WM4
Kowloon
Hong KongIsland
Figure 4.4 Level of compliance with key Water Quality Objectives in the Western Buffer WCZ
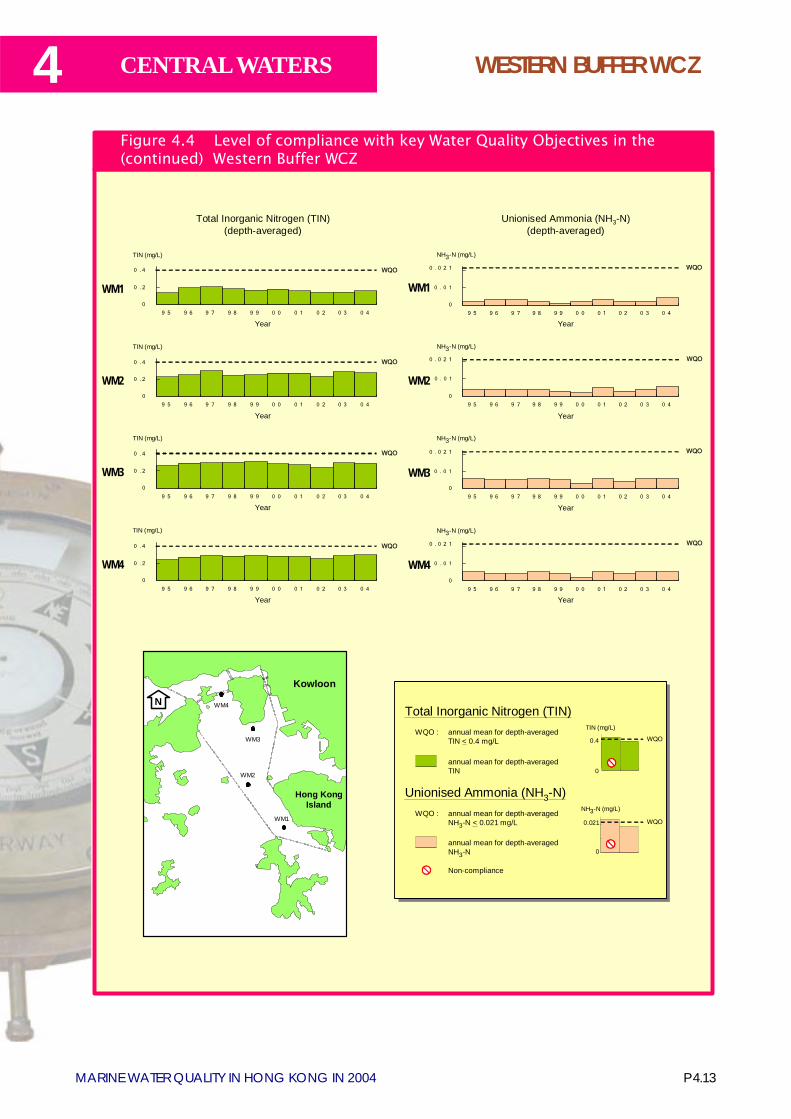
P 4.13MARINE WATER QUALITY IN HONG KONG IN 2004
4 CENTRAL WATERS WESTERN BUFFER WCZ
0
0.3
Total Inorganic Nitrogen (TIN)(depth-averaged)
Unionised Ammonia (NH3-N)(depth-averaged)
Total Inorganic Nitrogen (TIN)
annual mean for depth-averagedTIN
annual mean for depth-averagedTIN < 0.4 mg/L
WQO :
annual mean for depth-averagedNH3-N < 0.021 mg/L
WQO :
Non-compliance
annual mean for depth-averagedNH3-N
Unionised Ammonia (NH3-N)
WQO
TIN (mg/L)
0
0.021 WQO
NH3-N (mg/L)
0
0 . 0 2 1
9 5 9 6 9 7 9 8 9 9 0 0 0 1 0 2 0 3 0 4
WM4
Year
NH3-N (mg/L)
WQO
0
0 . 2
0 . 4
9 5 9 6 9 7 9 8 9 9 0 0 0 1 0 2 0 3 0 4
WM4
Year
TIN (mg/L)
WQO
0
0 . 0 2 1
9 5 9 6 9 7 9 8 9 9 0 0 0 1 0 2 0 3 0 4
WM2
Year
NH3-N (mg/L)
WQO
0
0 . 2
0 . 4
9 5 9 6 9 7 9 8 9 9 0 0 0 1 0 2 0 3 0 4
WM2
Year
TIN (mg/L)
WQO
0
0 . 0 2 1
9 5 9 6 9 7 9 8 9 9 0 0 0 1 0 2 0 3 0 4
Year
NH3-N (mg/L)
WQO
WM10
0 . 2
0 . 4
9 5 9 6 9 7 9 8 9 9 0 0 0 1 0 2 0 3 0 4
WM1
Year
TIN (mg/L)
WQO
0
0 . 0 2 1
9 5 9 6 9 7 9 8 9 9 0 0 0 1 0 2 0 3 0 4
WM3
Year
NH3-N (mg/L)
WQO
0
0 . 2
0 . 4
9 5 9 6 9 7 9 8 9 9 0 0 0 1 0 2 0 3 0 4
WM3
Year
TIN (mg/L)
WQO
0.4
0
0.021
0
0 . 0 1
0 . 0 1
0 . 0 1
0 . 0 1
Figure 4.4 Level of compliance with key Water Quality Objectives in the (continued) Western Buffer WCZ
N
WM1
WM3
WM2
WM4
Kowloon
Hong KongIsland
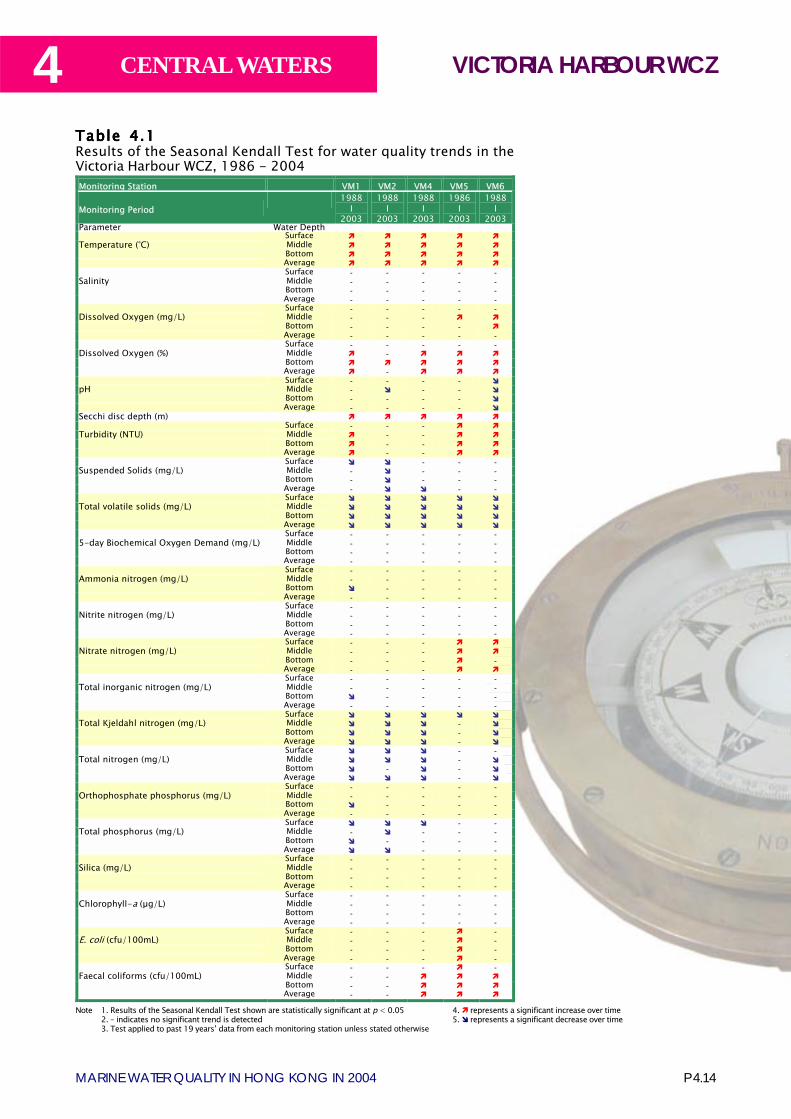
4
P 4.14MARINE WATER QUALITY IN HONG KONG IN 2004
CENTRAL WATERS
Table Table Table Table Table 44444.....11111Results of the Seasonal Kendall Test for water quality trends in theVictoria Harbour WCZ, 1986 - 2004
Note 1. Results of the Seasonal Kendall Test shown are statistically significant at p < 0.052. � indicates no significant trend is detected3. Test applied to past 19 years� data from each monitoring station unless stated otherwise
4. ! represents a significant increase over time5. " represents a significant decrease over time
Monitoring Station VM1 VM2 VM4 VM5 VM6
Monitoring Period 1988
I 2003
1988 I
2003
1988 I
2003
1986 I
2003
1988 I
2003 Parameter Water Depth Surface ! ! ! ! ! Temperature (°C) Middle ! ! ! ! ! Bottom ! ! ! ! ! Average ! ! ! ! ! Surface - - - - - Salinity Middle - - - - -
Bottom - - - - - Average - - - - -
Surface - - - - - Dissolved Oxygen (mg/L) Middle - - - ! ! Bottom - - - - ! Average - - - - - Surface - - - - - Dissolved Oxygen (%) Middle ! - ! ! ! Bottom ! ! ! ! ! Average ! - ! ! ! Surface - - - - " pH Middle - " - - " Bottom - - - - " Average - - - - " Secchi disc depth (m) ! ! ! ! ! Surface - - - ! ! Turbidity (NTU) Middle ! - - ! ! Bottom ! - - ! ! Average ! - - ! ! Surface " " - - - Suspended Solids (mg/L) Middle - " - - - Bottom - " - - - Average - " " - - Surface " " " " " Total volatile solids (mg/L) Middle " " " " " Bottom " " " " " Average " " " " " Surface - - - - - 5-day Biochemical Oxygen Demand (mg/L) Middle - - - - - Bottom - - - - - Average - - - - - Surface - - - - - Ammonia nitrogen (mg/L) Middle - - - - - Bottom " - - - - Average - - - - - Surface - - - - - Nitrite nitrogen (mg/L) Middle - - - - - Bottom - - - - - Average - - - - - Surface - - - ! ! Nitrate nitrogen (mg/L) Middle - - - ! ! Bottom - - - ! - Average - - - ! ! Surface - - - - - Total inorganic nitrogen (mg/L) Middle - - - - - Bottom " - - - - Average - - - - - Surface " " " " " Total Kjeldahl nitrogen (mg/L) Middle " " " - " Bottom " " " - " Average " " " - " Surface " " " - - Total nitrogen (mg/L) Middle " " " - " Bottom " - " - " Average " " " - " Surface - - - - - Orthophosphate phosphorus (mg/L) Middle - - - - - Bottom " - - - - Average - - - - - Surface " " " - - Total phosphorus (mg/L) Middle - " - - - Bottom " - - - - Average " " - - - Surface - - - - - Silica (mg/L) Middle - - - - - Bottom - - - - - Average - - - - - Surface - - - - - Chlorophyll-a (µg/L) Middle - - - - - Bottom - - - - - Average - - - - - Surface - - - ! - E. coli (cfu/100mL) Middle - - - ! - Bottom - - - ! - Average - - - ! -
Surface - - - ! - Faecal coliforms (cfu/100mL) Middle - - ! ! ! Bottom - - ! ! ! Average - - ! ! !
VICTORIA HARBOUR WCZ
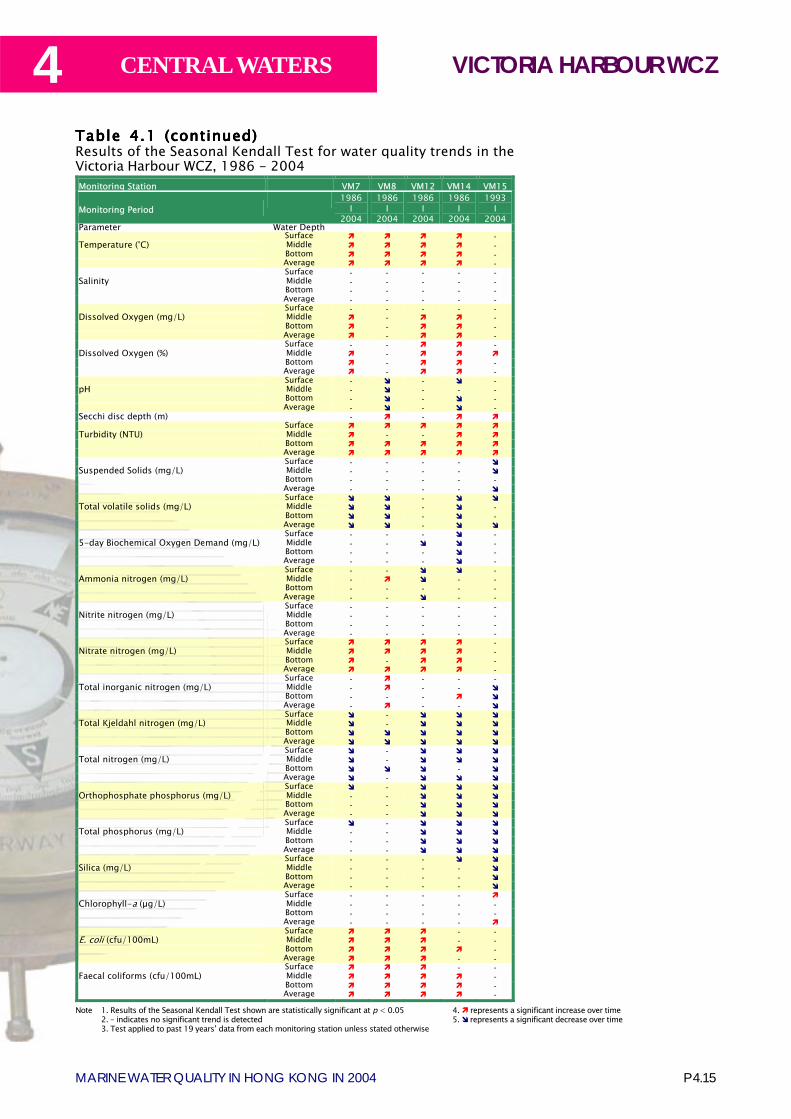
P 4.15MARINE WATER QUALITY IN HONG KONG IN 2004
4 CENTRAL WATERS
Table Table Table Table Table 44444.....1 (continued)1 (continued)1 (continued)1 (continued)1 (continued)Results of the Seasonal Kendall Test for water quality trends in theVictoria Harbour WCZ, 1986 - 2004
Note 1. Results of the Seasonal Kendall Test shown are statistically significant at p < 0.052. � indicates no significant trend is detected3. Test applied to past 19 years� data from each monitoring station unless stated otherwise
4. ! represents a significant increase over time5. " represents a significant decrease over time
Monitoring Station VM7 VM8 VM12 VM14 VM15
Monitoring Period 1986
I 2004
1986 I
2004
1986 I
2004
1986 I
2004
1993 I
2004 Parameter Water Depth Surface ! ! ! ! - Temperature (°C) Middle ! ! ! ! - Bottom ! ! ! ! - Average ! ! ! ! - Surface - - - - - Salinity Middle - - - - -
Bottom - - - - - Average - - - - -
Surface - - - - - Dissolved Oxygen (mg/L) Middle ! - ! ! - Bottom ! - ! ! - Average ! - ! ! - Surface - - ! ! - Dissolved Oxygen (%) Middle ! - ! ! ! Bottom ! - ! ! - Average ! - ! ! - Surface - " - " - pH Middle - " - - - Bottom - " - " - Average - " - " - Secchi disc depth (m) - ! - ! ! Surface ! ! ! ! ! Turbidity (NTU) Middle ! - - ! ! Bottom ! ! ! ! ! Average ! ! ! ! ! Surface - - - - " Suspended Solids (mg/L) Middle - - - - " Bottom - - - - - Average - - - - " Surface " " - " " Total volatile solids (mg/L) Middle " " - " - Bottom " " - " - Average " " - " " Surface - - - " - 5-day Biochemical Oxygen Demand (mg/L) Middle - - " " - Bottom - - - " - Average - - - " - Surface - - " " - Ammonia nitrogen (mg/L) Middle - ! " - - Bottom - - - - - Average - - " - - Surface - - - - - Nitrite nitrogen (mg/L) Middle - - - - - Bottom - - - - - Average - - - - - Surface ! ! ! ! - Nitrate nitrogen (mg/L) Middle ! ! ! ! - Bottom ! - ! ! - Average ! ! ! ! - Surface - ! - - - Total inorganic nitrogen (mg/L) Middle - ! - - " Bottom - - - ! " Average - ! - - " Surface " - " " " Total Kjeldahl nitrogen (mg/L) Middle " - " " " Bottom " " " " " Average " " " " " Surface " - " " " Total nitrogen (mg/L) Middle " - " " " Bottom " " " - " Average " - " " " Surface " - " " " Orthophosphate phosphorus (mg/L) Middle - - " " " Bottom - - " " " Average - - " " " Surface " - " " " Total phosphorus (mg/L) Middle - - " " " Bottom - - " " " Average - - " " " Surface - - - " " Silica (mg/L) Middle - - - - " Bottom - - - - " Average - - - - " Surface - - - - ! Chlorophyll-a (µg/L) Middle - - - - - Bottom - - - - - Average - - - - ! Surface ! ! ! - - E. coli (cfu/100mL) Middle ! ! ! - - Bottom ! ! ! ! - Average ! ! ! - -
Surface ! ! ! - - Faecal coliforms (cfu/100mL) Middle ! ! ! ! - Bottom ! ! ! ! - Average ! ! ! ! -
VICTORIA HARBOUR WCZ
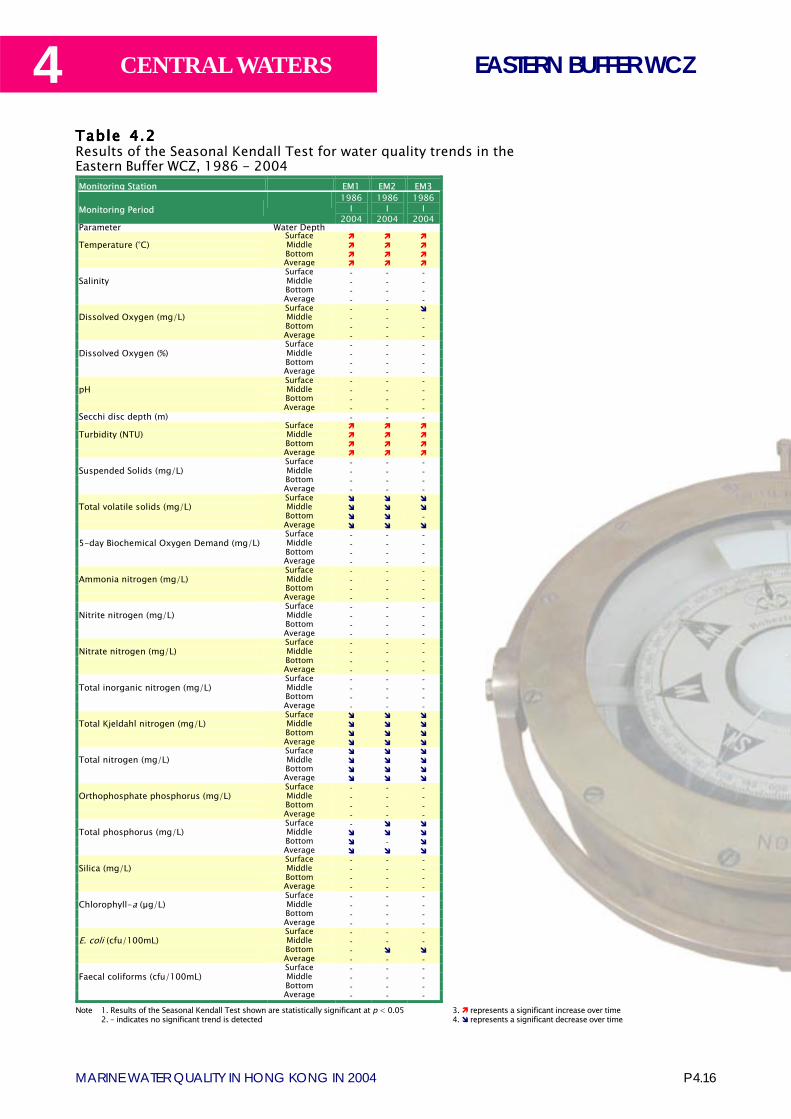
4
P 4.16MARINE WATER QUALITY IN HONG KONG IN 2004
CENTRAL WATERS
Table Table Table Table Table 44444.....22222Results of the Seasonal Kendall Test for water quality trends in theEastern Buffer WCZ, 1986 - 2004
Note 1. Results of the Seasonal Kendall Test shown are statistically significant at p < 0.052. � indicates no significant trend is detected
3. ! represents a significant increase over time4. " represents a significant decrease over time
Monitoring Station EM1 EM2 EM3
Monitoring Period 1986
I 2004
1986 I
2004
1986 I
2004 Parameter Water Depth Surface ! ! ! Temperature (°C) Middle ! ! ! Bottom ! ! ! Average ! ! ! Surface - - - Salinity Middle - - -
Bottom - - - Average - - -
Surface - - " Dissolved Oxygen (mg/L) Middle - - - Bottom - - - Average - - - Surface - - - Dissolved Oxygen (%) Middle - - - Bottom - - - Average - - - Surface - - - pH Middle - - - Bottom - - - Average - - - Secchi disc depth (m) - - - Surface ! ! ! Turbidity (NTU) Middle ! ! ! Bottom ! ! ! Average ! ! ! Surface - - - Suspended Solids (mg/L) Middle - - - Bottom - - - Average - - - Surface " " " Total volatile solids (mg/L) Middle " " " Bottom " " - Average " " " Surface - - - 5-day Biochemical Oxygen Demand (mg/L) Middle - - - Bottom - - - Average - - - Surface - - - Ammonia nitrogen (mg/L) Middle - - - Bottom - - - Average - - - Surface - - - Nitrite nitrogen (mg/L) Middle - - - Bottom - - - Average - - - Surface - - - Nitrate nitrogen (mg/L) Middle - - - Bottom - - - Average - - - Surface - - - Total inorganic nitrogen (mg/L) Middle - - - Bottom - - - Average - - - Surface " " " Total Kjeldahl nitrogen (mg/L) Middle " " " Bottom " " " Average " " " Surface " " " Total nitrogen (mg/L) Middle " " " Bottom " " " Average " " " Surface - - - Orthophosphate phosphorus (mg/L) Middle - - - Bottom - - - Average - - - Surface - " " Total phosphorus (mg/L) Middle " " " Bottom " - " Average " " " Surface - - - Silica (mg/L) Middle - - - Bottom - - - Average - - - Surface - - - Chlorophyll-a (µg/L) Middle - - - Bottom - - - Average - - - Surface - - - E. coli (cfu/100mL) Middle - - - Bottom - " " Average - - -
Surface - - - Faecal coliforms (cfu/100mL) Middle - - - Bottom - - - Average - - -
EASTERN BUFFER WCZ
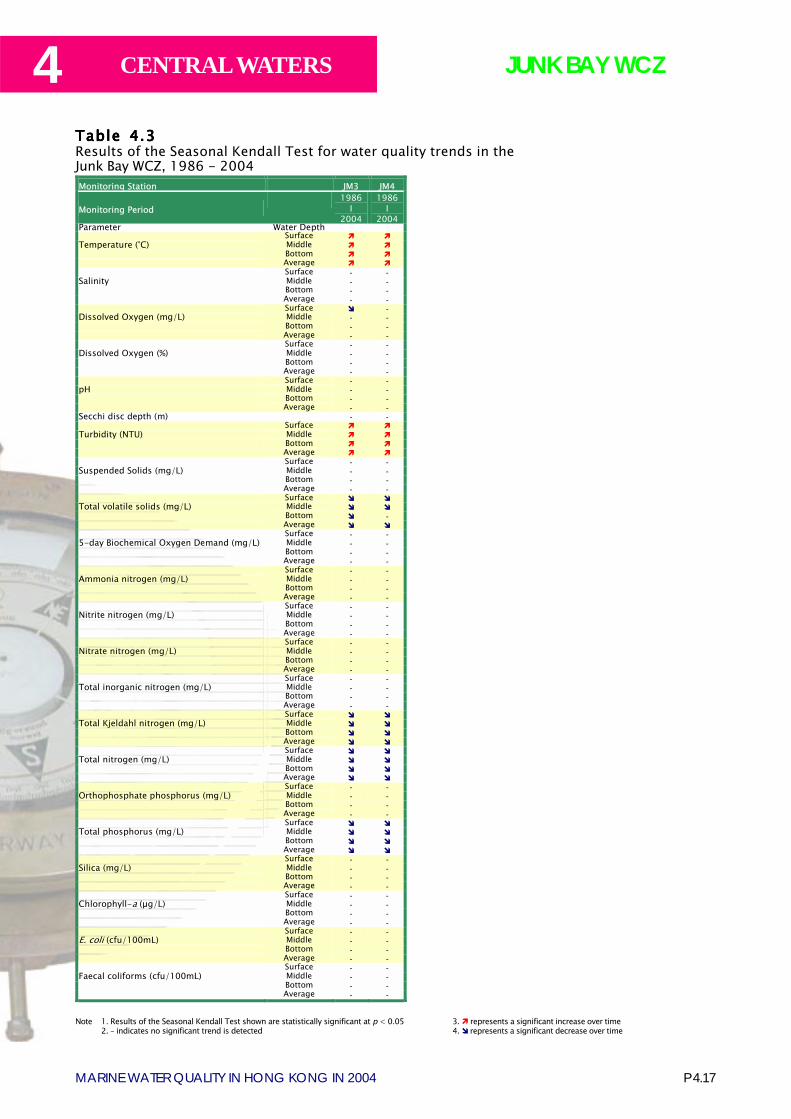
P 4.17MARINE WATER QUALITY IN HONG KONG IN 2004
4 CENTRAL WATERS
Table Table Table Table Table 44444.....33333Results of the Seasonal Kendall Test for water quality trends in theJunk Bay WCZ, 1986 - 2004
Note 1. Results of the Seasonal Kendall Test shown are statistically significant at p < 0.052. � indicates no significant trend is detected
3. ! represents a significant increase over time4. " represents a significant decrease over time
Monitoring Station JM3 JM4
Monitoring Period 1986
I 2004
1986 I
2004 Parameter Water Depth Surface ! ! Temperature (°C) Middle ! ! Bottom ! ! Average ! ! Surface - - Salinity Middle - -
Bottom - - Average - -
Surface " - Dissolved Oxygen (mg/L) Middle - - Bottom - - Average - - Surface - - Dissolved Oxygen (%) Middle - - Bottom - - Average - - Surface - - pH Middle - - Bottom - - Average - - Secchi disc depth (m) - - Surface ! ! Turbidity (NTU) Middle ! ! Bottom ! ! Average ! ! Surface - - Suspended Solids (mg/L) Middle - - Bottom - - Average - - Surface " " Total volatile solids (mg/L) Middle " " Bottom " - Average " " Surface - - 5-day Biochemical Oxygen Demand (mg/L) Middle - - Bottom - - Average - - Surface - - Ammonia nitrogen (mg/L) Middle - - Bottom - - Average - - Surface - - Nitrite nitrogen (mg/L) Middle - - Bottom - - Average - - Surface - - Nitrate nitrogen (mg/L) Middle - - Bottom - - Average - - Surface - - Total inorganic nitrogen (mg/L) Middle - - Bottom - - Average - - Surface " " Total Kjeldahl nitrogen (mg/L) Middle " " Bottom " " Average " " Surface " " Total nitrogen (mg/L) Middle " " Bottom " " Average " " Surface - - Orthophosphate phosphorus (mg/L) Middle - - Bottom - - Average - - Surface " " Total phosphorus (mg/L) Middle " " Bottom " " Average " " Surface - - Silica (mg/L) Middle - - Bottom - - Average - - Surface - - Chlorophyll-a (µg/L) Middle - - Bottom - - Average - - Surface - - E. coli (cfu/100mL) Middle - - Bottom - - Average - -
Surface - - Faecal coliforms (cfu/100mL) Middle - - Bottom - - Average - -
JUNK BAY WCZ

4
P 4.18MARINE WATER QUALITY IN HONG KONG IN 2004
CENTRAL WATERS
Table Table Table Table Table 44444.....44444Results of the Seasonal Kendall Test for trends in water quality parameters measured in theWestern Buffer WCZ, 1986 - 2004
Note 1. Results of the Seasonal Kendall Test shown are statistically significant at p < 0.052. � indicates no significant trend is detected3. Test applied to past 19 years� data from each monitoring station unless stated otherwise
4. ! represents a significant increase over time5. " represents a significant decrease over time
Monitoring Station WM1 WM2 WM3 WM4
Monitoring Period 1988
I 2004
1988 I
2004
1986 I
2004
1986 I
2004 Parameter Water Depth Surface ! ! ! ! Temperature (°C) Middle ! ! ! ! Bottom ! ! ! ! Average ! ! ! ! Surface - - - - Salinity Middle - - - -
Bottom ! - - - Average ! - - -
Surface - - - - Dissolved Oxygen (mg/L) Middle - - - - Bottom - - - - Average - - - - Surface - - - - Dissolved Oxygen (%) Middle - - - - Bottom - - - - Average - - - - Surface - - - - pH Middle - - - - Bottom - - - - Average - - - - Secchi disc depth (m) - - - - Surface ! ! ! ! Turbidity (NTU) Middle ! ! ! ! Bottom ! ! ! ! Average ! ! ! ! Surface - - - - Suspended Solids (mg/L) Middle - - - - Bottom ! - - - Average ! - - - Surface - - " - Total volatile solids (mg/L) Middle - - " - Bottom - - - - Average - - - - Surface - - - - 5-day Biochemical Oxygen Demand (mg/L) Middle - - - - Bottom - - - - Average - - - - Surface - - - - Ammonia nitrogen (mg/L) Middle - - - - Bottom " - - - Average - - - - Surface - - - - Nitrite nitrogen (mg/L) Middle - - - - Bottom - - - - Average - - - - Surface - - ! ! Nitrate nitrogen (mg/L) Middle - - - ! Bottom - - - - Average - - ! ! Surface - ! ! ! Total inorganic nitrogen (mg/L) Middle - ! - - Bottom - - - - Average - ! - ! Surface " " " " Total Kjeldahl nitrogen (mg/L) Middle " " " " Bottom " " " " Average " " " " Surface - - - - Total nitrogen (mg/L) Middle " - - - Bottom " " " " Average " - " - Surface - - - - Orthophosphate phosphorus (mg/L) Middle - - - - Bottom - - - - Average - - - - Surface " " " - Total phosphorus (mg/L) Middle " " " - Bottom " " " - Average " " " - Surface " - " - Silica (mg/L) Middle - " - - Bottom - - - - Average - " " - Surface ! ! ! ! Chlorophyll-a (µg/L) Middle - ! ! - Bottom - ! - - Average ! ! - - Surface - ! ! ! E. coli (cfu/100mL) Middle - ! ! ! Bottom " ! ! ! Average - ! ! !
Surface " ! ! ! Faecal coliforms (cfu/100mL) Middle - ! ! ! Bottom - ! ! ! Average - ! ! !
WESTERN BUFFER WCZ
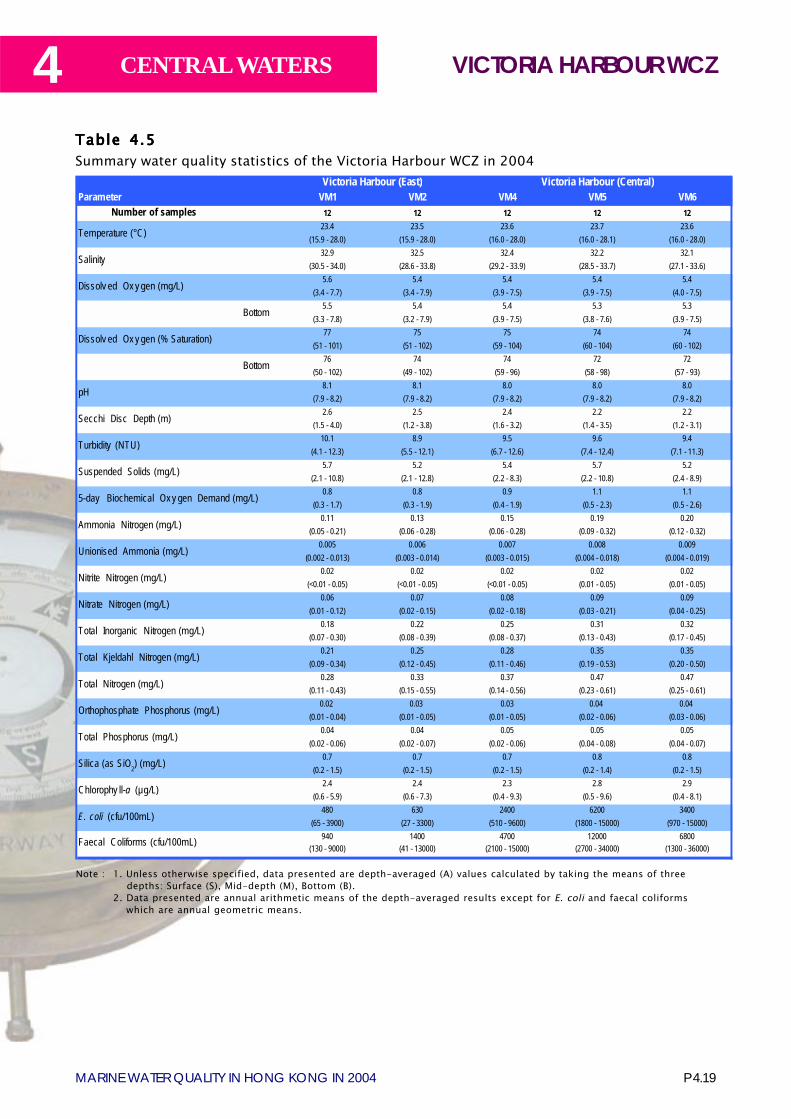
P 4.19MARINE WATER QUALITY IN HONG KONG IN 2004
4 CENTRAL WATERS
Table Table Table Table Table 44444.....55555Summary water quality statistics of the Victoria Harbour WCZ in 2004
Note : 1. Unless otherwise specified, data presented are depth-averaged (A) values calculated by taking the means of threedepths: Surface (S), Mid-depth (M), Bottom (B).
2. Data presented are annual arithmetic means of the depth-averaged results except for E. coli and faecal coliformswhich are annual geometric means.
Parameter VM1 VM2 VM4 VM5 VM6Number of samples 12 12 12 12 12
23.4 23.5 23.6 23.7 23.6(15.9 - 28.0) (15.9 - 28.0) (16.0 - 28.0) (16.0 - 28.1) (16.0 - 28.0)
32.9 32.5 32.4 32.2 32.1(30.5 - 34.0) (28.6 - 33.8) (29.2 - 33.9) (28.5 - 33.7) (27.1 - 33.6)
5.6 5.4 5.4 5.4 5.4(3.4 - 7.7) (3.4 - 7.9) (3.9 - 7.5) (3.9 - 7.5) (4.0 - 7.5)
5.5 5.4 5.4 5.3 5.3(3.3 - 7.8) (3.2 - 7.9) (3.9 - 7.5) (3.8 - 7.6) (3.9 - 7.5)
77 75 75 74 74(51 - 101) (51 - 102) (59 - 104) (60 - 104) (60 - 102)
76 74 74 72 72(50 - 102) (49 - 102) (59 - 96) (58 - 98) (57 - 93)
8.1 8.1 8.0 8.0 8.0(7.9 - 8.2) (7.9 - 8.2) (7.9 - 8.2) (7.9 - 8.2) (7.9 - 8.2)
2.6 2.5 2.4 2.2 2.2(1.5 - 4.0) (1.2 - 3.8) (1.6 - 3.2) (1.4 - 3.5) (1.2 - 3.1)
10.1 8.9 9.5 9.6 9.4(4.1 - 12.3) (5.5 - 12.1) (6.7 - 12.6) (7.4 - 12.4) (7.1 - 11.3)
5.7 5.2 5.4 5.7 5.2(2.1 - 10.8) (2.1 - 12.8) (2.2 - 8.3) (2.2 - 10.8) (2.4 - 8.9)
0.8 0.8 0.9 1.1 1.1(0.3 - 1.7) (0.3 - 1.9) (0.4 - 1.9) (0.5 - 2.3) (0.5 - 2.6)
0.11 0.13 0.15 0.19 0.20(0.05 - 0.21) (0.06 - 0.28) (0.06 - 0.28) (0.09 - 0.32) (0.12 - 0.32)
0.005 0.006 0.007 0.008 0.009(0.002 - 0.013) (0.003 - 0.014) (0.003 - 0.015) (0.004 - 0.018) (0.004 - 0.019)
0.02 0.02 0.02 0.02 0.02(<0.01 - 0.05) (<0.01 - 0.05) (<0.01 - 0.05) (0.01 - 0.05) (0.01 - 0.05)
0.06 0.07 0.08 0.09 0.09(0.01 - 0.12) (0.02 - 0.15) (0.02 - 0.18) (0.03 - 0.21) (0.04 - 0.25)
0.18 0.22 0.25 0.31 0.32(0.07 - 0.30) (0.08 - 0.39) (0.08 - 0.37) (0.13 - 0.43) (0.17 - 0.45)
0.21 0.25 0.28 0.35 0.35(0.09 - 0.34) (0.12 - 0.45) (0.11 - 0.46) (0.19 - 0.53) (0.20 - 0.50)
0.28 0.33 0.37 0.47 0.47(0.11 - 0.43) (0.15 - 0.55) (0.14 - 0.56) (0.23 - 0.61) (0.25 - 0.61)
0.02 0.03 0.03 0.04 0.04(0.01 - 0.04) (0.01 - 0.05) (0.01 - 0.05) (0.02 - 0.06) (0.03 - 0.06)
0.04 0.04 0.05 0.05 0.05(0.02 - 0.06) (0.02 - 0.07) (0.02 - 0.06) (0.04 - 0.08) (0.04 - 0.07)
0.7 0.7 0.7 0.8 0.8(0.2 - 1.5) (0.2 - 1.5) (0.2 - 1.5) (0.2 - 1.4) (0.2 - 1.5)
2.4 2.4 2.3 2.8 2.9(0.6 - 5.9) (0.6 - 7.3) (0.4 - 9.3) (0.5 - 9.6) (0.4 - 8.1)
480 630 2400 6200 3400(65 - 3900) (27 - 3300) (510 - 9600) (1800 - 15000) (970 - 15000)
940 1400 4700 12000 6800(130 - 9000) (41 - 13000) (2100 - 15000) (2700 - 34000) (1300 - 36000)
Victoria Harbour (East) Victoria Harbour (Central)
Bottom
Bottom
Total Phosphorus (mg/L)
Silica (as SiO2) (mg/L)
pH
Total Kjeldahl Nitrogen (mg/L)
Total Nitrogen (mg/L)
Secchi Disc Depth (m)
Turbidity (NTU)
Suspended Solids (mg/L)
Faecal Coliforms (cfu/100mL)
E. coli (cfu/100mL)
Chlorophy ll-a (µg/L)
5-day Biochemical Ox y gen Demand (mg/L)
Orthophosphate Phosphorus (mg/L)
Total Inorganic Nitrogen (mg/L)
Unionised Ammonia (mg/L)
Nitrite Nitrogen (mg/L)
Nitrate Nitrogen (mg/L)
Ammonia Nitrogen (mg/L)
Temperature (°C)
Salinity
Dissolv ed Ox y gen (mg/L)
Dissolv ed Ox y gen (% Saturation)
VICTORIA HARBOUR WCZ
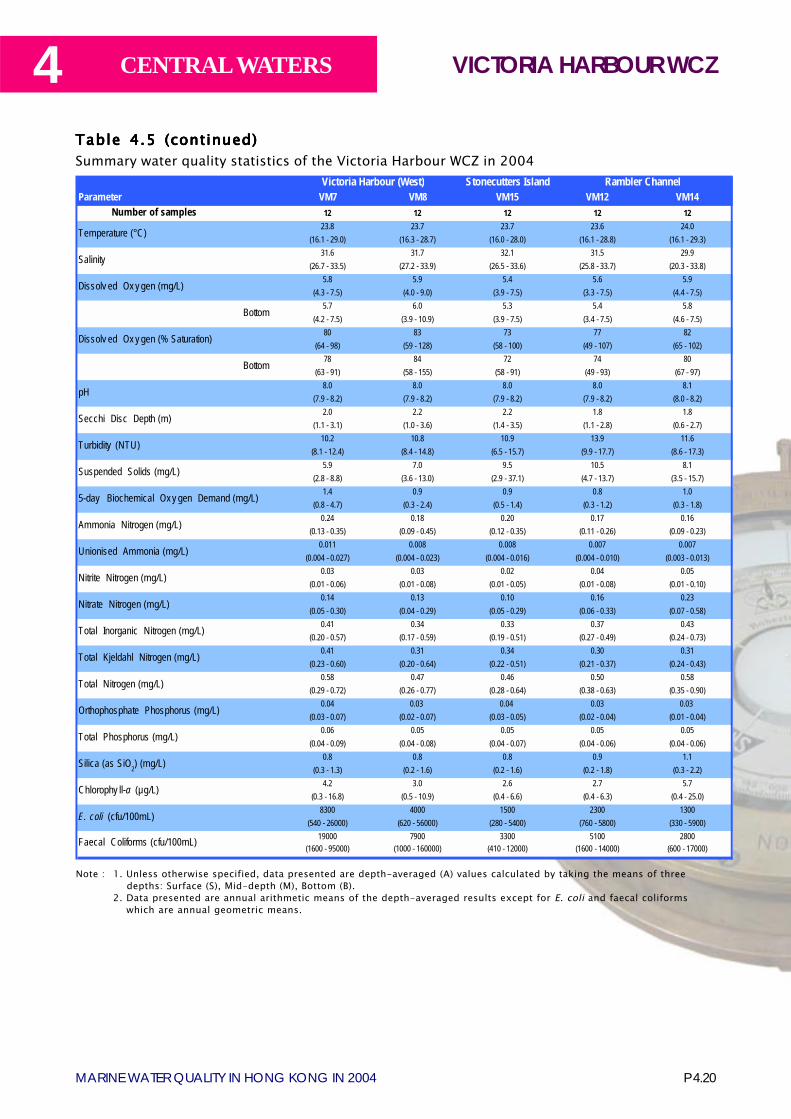
4
P 4.20MARINE WATER QUALITY IN HONG KONG IN 2004
CENTRAL WATERS
Table Table Table Table Table 44444.....5 (continued)5 (continued)5 (continued)5 (continued)5 (continued)Summary water quality statistics of the Victoria Harbour WCZ in 2004
Note : 1. Unless otherwise specified, data presented are depth-averaged (A) values calculated by taking the means of threedepths: Surface (S), Mid-depth (M), Bottom (B).
2. Data presented are annual arithmetic means of the depth-averaged results except for E. coli and faecal coliformswhich are annual geometric means.
Stonecutters IslandParameter VM7 VM8 VM15 VM12 VM14
Number of samples 12 12 12 12 1223.8 23.7 23.7 23.6 24.0
(16.1 - 29.0) (16.3 - 28.7) (16.0 - 28.0) (16.1 - 28.8) (16.1 - 29.3)31.6 31.7 32.1 31.5 29.9
(26.7 - 33.5) (27.2 - 33.9) (26.5 - 33.6) (25.8 - 33.7) (20.3 - 33.8)5.8 5.9 5.4 5.6 5.9
(4.3 - 7.5) (4.0 - 9.0) (3.9 - 7.5) (3.3 - 7.5) (4.4 - 7.5)5.7 6.0 5.3 5.4 5.8
(4.2 - 7.5) (3.9 - 10.9) (3.9 - 7.5) (3.4 - 7.5) (4.6 - 7.5)80 83 73 77 82
(64 - 98) (59 - 128) (58 - 100) (49 - 107) (65 - 102)78 84 72 74 80
(63 - 91) (58 - 155) (58 - 91) (49 - 93) (67 - 97)8.0 8.0 8.0 8.0 8.1
(7.9 - 8.2) (7.9 - 8.2) (7.9 - 8.2) (7.9 - 8.2) (8.0 - 8.2)2.0 2.2 2.2 1.8 1.8
(1.1 - 3.1) (1.0 - 3.6) (1.4 - 3.5) (1.1 - 2.8) (0.6 - 2.7)10.2 10.8 10.9 13.9 11.6
(8.1 - 12.4) (8.4 - 14.8) (6.5 - 15.7) (9.9 - 17.7) (8.6 - 17.3)5.9 7.0 9.5 10.5 8.1
(2.8 - 8.8) (3.6 - 13.0) (2.9 - 37.1) (4.7 - 13.7) (3.5 - 15.7)1.4 0.9 0.9 0.8 1.0
(0.8 - 4.7) (0.3 - 2.4) (0.5 - 1.4) (0.3 - 1.2) (0.3 - 1.8)0.24 0.18 0.20 0.17 0.16
(0.13 - 0.35) (0.09 - 0.45) (0.12 - 0.35) (0.11 - 0.26) (0.09 - 0.23)0.011 0.008 0.008 0.007 0.007
(0.004 - 0.027) (0.004 - 0.023) (0.004 - 0.016) (0.004 - 0.010) (0.003 - 0.013)0.03 0.03 0.02 0.04 0.05
(0.01 - 0.06) (0.01 - 0.08) (0.01 - 0.05) (0.01 - 0.08) (0.01 - 0.10)0.14 0.13 0.10 0.16 0.23
(0.05 - 0.30) (0.04 - 0.29) (0.05 - 0.29) (0.06 - 0.33) (0.07 - 0.58) 0.41 0.34 0.33 0.37 0.43
(0.20 - 0.57) (0.17 - 0.59) (0.19 - 0.51) (0.27 - 0.49) (0.24 - 0.73)0.41 0.31 0.34 0.30 0.31
(0.23 - 0.60) (0.20 - 0.64) (0.22 - 0.51) (0.21 - 0.37) (0.24 - 0.43)0.58 0.47 0.46 0.50 0.58
(0.29 - 0.72) (0.26 - 0.77) (0.28 - 0.64) (0.38 - 0.63) (0.35 - 0.90)0.04 0.03 0.04 0.03 0.03
(0.03 - 0.07) (0.02 - 0.07) (0.03 - 0.05) (0.02 - 0.04) (0.01 - 0.04)0.06 0.05 0.05 0.05 0.05
(0.04 - 0.09) (0.04 - 0.08) (0.04 - 0.07) (0.04 - 0.06) (0.04 - 0.06)0.8 0.8 0.8 0.9 1.1
(0.3 - 1.3) (0.2 - 1.6) (0.2 - 1.6) (0.2 - 1.8) (0.3 - 2.2)4.2 3.0 2.6 2.7 5.7
(0.3 - 16.8) (0.5 - 10.9) (0.4 - 6.6) (0.4 - 6.3) (0.4 - 25.0)8300 4000 1500 2300 1300
(540 - 26000) (620 - 56000) (280 - 5400) (760 - 5800) (330 - 5900)19000 7900 3300 5100 2800
(1600 - 95000) (1000 - 160000) (410 - 12000) (1600 - 14000) (600 - 17000)
Victoria Harbour (West) Rambler Channel
Temperature (°C)
Salinity
Faecal Coliforms (cfu/100mL)
E. coli (cfu/100mL)
Chlorophy ll-a (µg/L)
5-day Biochemical Ox y gen Demand (mg/L)
Orthophosphate Phosphorus (mg/L)
Total Inorganic Nitrogen (mg/L)
Unionised Ammonia (mg/L)
Nitrite Nitrogen (mg/L)
Total Phosphorus (mg/L)
Silica (as SiO2) (mg/L)
Bottom
Bottom
Dissolv ed Ox y gen (mg/L)
Dissolv ed Ox y gen (% Saturation)
pH
Total Kjeldahl Nitrogen (mg/L)
Total Nitrogen (mg/L)
Secchi Disc Depth (m)
Turbidity (NTU)
Suspended Solids (mg/L)
Nitrate Nitrogen (mg/L)
Ammonia Nitrogen (mg/L)
VICTORIA HARBOUR WCZ
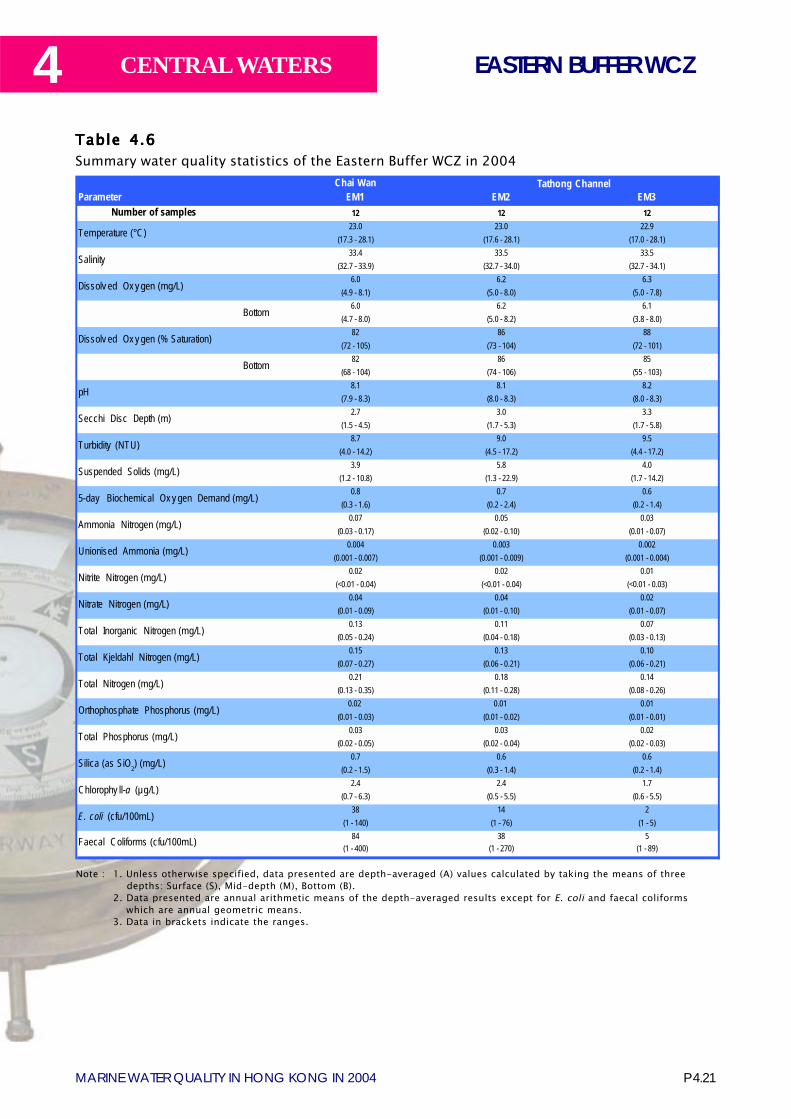
P 4.21MARINE WATER QUALITY IN HONG KONG IN 2004
4 CENTRAL WATERS
Table Table Table Table Table 44444.....66666Summary water quality statistics of the Eastern Buffer WCZ in 2004
Note : 1. Unless otherwise specified, data presented are depth-averaged (A) values calculated by taking the means of threedepths: Surface (S), Mid-depth (M), Bottom (B).
2. Data presented are annual arithmetic means of the depth-averaged results except for E. coli and faecal coliformswhich are annual geometric means.
3. Data in brackets indicate the ranges.
Chai WanParameter EM1 EM2 EM3
Number of samples 12 12 1223.0 23.0 22.9
(17.3 - 28.1) (17.6 - 28.1) (17.0 - 28.1)33.4 33.5 33.5
(32.7 - 33.9) (32.7 - 34.0) (32.7 - 34.1)6.0 6.2 6.3
(4.9 - 8.1) (5.0 - 8.0) (5.0 - 7.8)6.0 6.2 6.1
(4.7 - 8.0) (5.0 - 8.2) (3.8 - 8.0)82 86 88
(72 - 105) (73 - 104) (72 - 101)82 86 85
(68 - 104) (74 - 106) (55 - 103)8.1 8.1 8.2
(7.9 - 8.3) (8.0 - 8.3) (8.0 - 8.3)2.7 3.0 3.3
(1.5 - 4.5) (1.7 - 5.3) (1.7 - 5.8)8.7 9.0 9.5
(4.0 - 14.2) (4.5 - 17.2) (4.4 - 17.2)3.9 5.8 4.0
(1.2 - 10.8) (1.3 - 22.9) (1.7 - 14.2)0.8 0.7 0.6
(0.3 - 1.6) (0.2 - 2.4) (0.2 - 1.4)0.07 0.05 0.03
(0.03 - 0.17) (0.02 - 0.10) (0.01 - 0.07)0.004 0.003 0.002
(0.001 - 0.007) (0.001 - 0.009) (0.001 - 0.004)0.02 0.02 0.01
(<0.01 - 0.04) (<0.01 - 0.04) (<0.01 - 0.03)0.04 0.04 0.02
(0.01 - 0.09) (0.01 - 0.10) (0.01 - 0.07) 0.13 0.11 0.07
(0.05 - 0.24) (0.04 - 0.18) (0.03 - 0.13)0.15 0.13 0.10
(0.07 - 0.27) (0.06 - 0.21) (0.06 - 0.21)0.21 0.18 0.14
(0.13 - 0.35) (0.11 - 0.28) (0.08 - 0.26)0.02 0.01 0.01
(0.01 - 0.03) (0.01 - 0.02) (0.01 - 0.01)0.03 0.03 0.02
(0.02 - 0.05) (0.02 - 0.04) (0.02 - 0.03)0.7 0.6 0.6
(0.2 - 1.5) (0.3 - 1.4) (0.2 - 1.4)2.4 2.4 1.7
(0.7 - 6.3) (0.5 - 5.5) (0.6 - 5.5)38 14 2
(1 - 140) (1 - 76) (1 - 5)84 38 5
(1 - 400) (1 - 270) (1 - 89)
Silica (as SiO2) (mg/L)
Tathong Channel
Temperature (°C)
Salinity
Dissolv ed Ox y gen (mg/L)
Suspended Solids (mg/L)
Bottom
Bottom
Total Phosphorus (mg/L)
Dissolv ed Ox y gen (% Saturation)
Faecal Coliforms (cfu/100mL)
E. coli (cfu/100mL)
Chlorophy ll-a (µg/L)
5-day Biochemical Ox y gen Demand (mg/L)
Orthophosphate Phosphorus (mg/L)
Total Inorganic Nitrogen (mg/L)
Unionised Ammonia (mg/L)
Nitrite Nitrogen (mg/L)
Nitrate Nitrogen (mg/L)
Ammonia Nitrogen (mg/L)
pH
Total Kjeldahl Nitrogen (mg/L)
Total Nitrogen (mg/L)
Secchi Disc Depth (m)
Turbidity (NTU)
EASTERN BUFFER WCZ
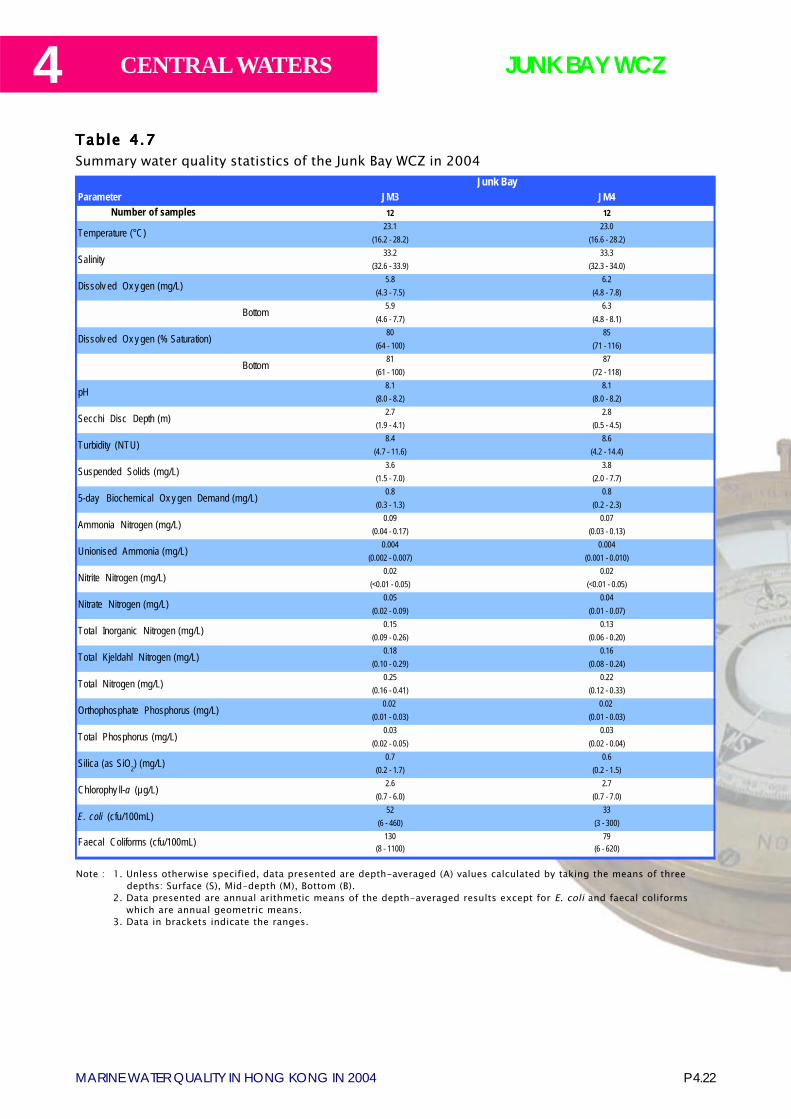
4
P 4.22MARINE WATER QUALITY IN HONG KONG IN 2004
CENTRAL WATERS
Table Table Table Table Table 44444.....77777Summary water quality statistics of the Junk Bay WCZ in 2004
Note : 1. Unless otherwise specified, data presented are depth-averaged (A) values calculated by taking the means of threedepths: Surface (S), Mid-depth (M), Bottom (B).
2. Data presented are annual arithmetic means of the depth-averaged results except for E. coli and faecal coliformswhich are annual geometric means.
3. Data in brackets indicate the ranges.
Parameter JM3 JM4Number of samples 12 12
23.1 23.0(16.2 - 28.2) (16.6 - 28.2)
33.2 33.3(32.6 - 33.9) (32.3 - 34.0)
5.8 6.2(4.3 - 7.5) (4.8 - 7.8)
5.9 6.3(4.6 - 7.7) (4.8 - 8.1)
80 85(64 - 100) (71 - 116)
81 87(61 - 100) (72 - 118)
8.1 8.1(8.0 - 8.2) (8.0 - 8.2)
2.7 2.8(1.9 - 4.1) (0.5 - 4.5)
8.4 8.6(4.7 - 11.6) (4.2 - 14.4)
3.6 3.8(1.5 - 7.0) (2.0 - 7.7)
0.8 0.8(0.3 - 1.3) (0.2 - 2.3)
0.09 0.07(0.04 - 0.17) (0.03 - 0.13)
0.004 0.004(0.002 - 0.007) (0.001 - 0.010)
0.02 0.02(<0.01 - 0.05) (<0.01 - 0.05)
0.05 0.04(0.02 - 0.09) (0.01 - 0.07)
0.15 0.13(0.09 - 0.26) (0.06 - 0.20)
0.18 0.16(0.10 - 0.29) (0.08 - 0.24)
0.25 0.22(0.16 - 0.41) (0.12 - 0.33)
0.02 0.02(0.01 - 0.03) (0.01 - 0.03)
0.03 0.03(0.02 - 0.05) (0.02 - 0.04)
0.7 0.6(0.2 - 1.7) (0.2 - 1.5)
2.6 2.7(0.7 - 6.0) (0.7 - 7.0)
52 33(6 - 460) (3 - 300)
130 79(8 - 1100) (6 - 620)
Nitrate Nitrogen (mg/L)
Salinity
Dissolv ed Ox y gen (mg/L)
Dissolv ed Ox y gen (% Saturation)
pH
Total Phosphorus (mg/L)
Silica (as SiO2) (mg/L)
Bottom
Bottom
Total Kjeldahl Nitrogen (mg/L)
Total Nitrogen (mg/L)
Secchi Disc Depth (m)
Turbidity (NTU)
Suspended Solids (mg/L)
Nitrite Nitrogen (mg/L)
Junk Bay
Temperature (°C)
Faecal Coliforms (cfu/100mL)
E. coli (cfu/100mL)
Chlorophy ll-a (µg/L)
5-day Biochemical Ox y gen Demand (mg/L)
Orthophosphate Phosphorus (mg/L)
Total Inorganic Nitrogen (mg/L)
Unionised Ammonia (mg/L)
Ammonia Nitrogen (mg/L)
JUNK BAY WCZ
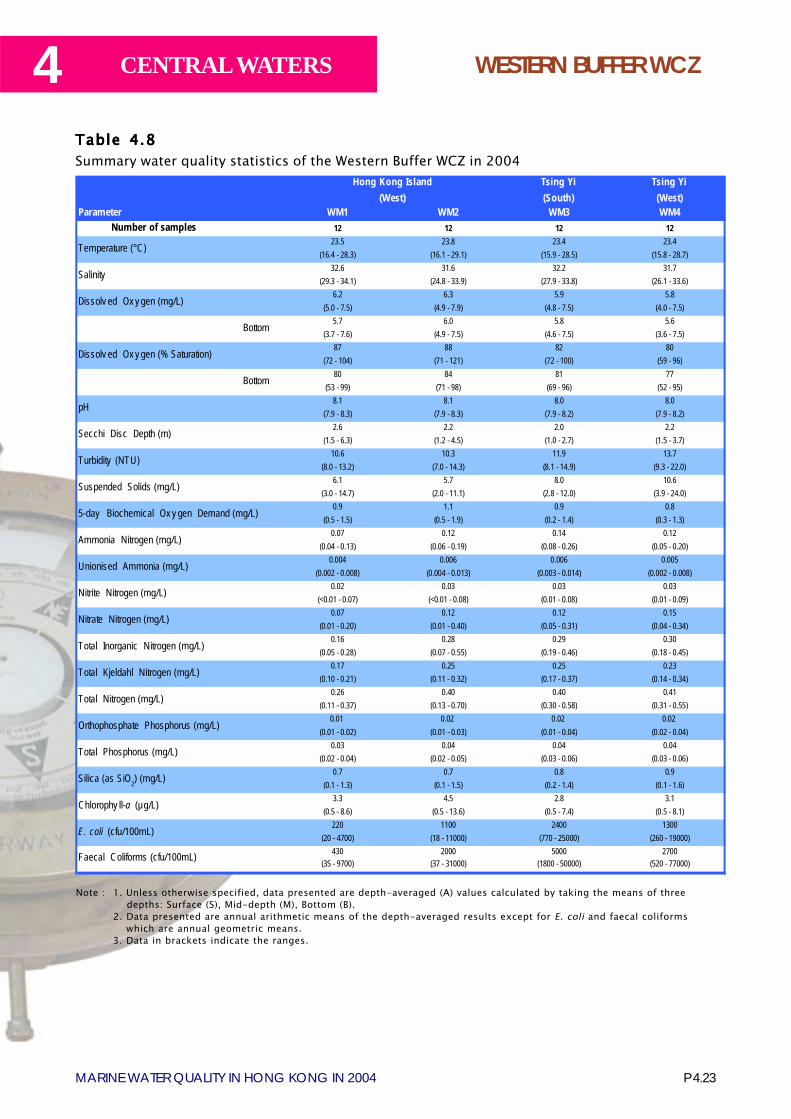
P 4.23MARINE WATER QUALITY IN HONG KONG IN 2004
4 CENTRAL WATERS
Table Table Table Table Table 44444.....88888Summary water quality statistics of the Western Buffer WCZ in 2004
Note : 1. Unless otherwise specified, data presented are depth-averaged (A) values calculated by taking the means of threedepths: Surface (S), Mid-depth (M), Bottom (B).
2. Data presented are annual arithmetic means of the depth-averaged results except for E. coli and faecal coliformswhich are annual geometric means.
3. Data in brackets indicate the ranges.
Parameter WM1 WM2 WM3 WM4Number of samples 12 12 12 12
23.5 23.8 23.4 23.4(16.4 - 28.3) (16.1 - 29.1) (15.9 - 28.5) (15.8 - 28.7)
32.6 31.6 32.2 31.7(29.3 - 34.1) (24.8 - 33.9) (27.9 - 33.8) (26.1 - 33.6)
6.2 6.3 5.9 5.8(5.0 - 7.5) (4.9 - 7.9) (4.8 - 7.5) (4.0 - 7.5)
5.7 6.0 5.8 5.6(3.7 - 7.6) (4.9 - 7.5) (4.6 - 7.5) (3.6 - 7.5)
87 88 82 80(72 - 104) (71 - 121) (72 - 100) (59 - 96)
80 84 81 77(53 - 99) (71 - 98) (69 - 96) (52 - 95)
8.1 8.1 8.0 8.0(7.9 - 8.3) (7.9 - 8.3) (7.9 - 8.2) (7.9 - 8.2)
2.6 2.2 2.0 2.2(1.5 - 6.3) (1.2 - 4.5) (1.0 - 2.7) (1.5 - 3.7)
10.6 10.3 11.9 13.7(8.0 - 13.2) (7.0 - 14.3) (8.1 - 14.9) (9.3 - 22.0)
6.1 5.7 8.0 10.6(3.0 - 14.7) (2.0 - 11.1) (2.8 - 12.0) (3.9 - 24.0)
0.9 1.1 0.9 0.8(0.5 - 1.5) (0.5 - 1.9) (0.2 - 1.4) (0.3 - 1.3)
0.07 0.12 0.14 0.12(0.04 - 0.13) (0.06 - 0.19) (0.08 - 0.26) (0.05 - 0.20)
0.004 0.006 0.006 0.005(0.002 - 0.008) (0.004 - 0.013) (0.003 - 0.014) (0.002 - 0.008)
0.02 0.03 0.03 0.03(<0.01 - 0.07) (<0.01 - 0.08) (0.01 - 0.08) (0.01 - 0.09)
0.07 0.12 0.12 0.15(0.01 - 0.20) (0.01 - 0.40) (0.05 - 0.31) (0.04 - 0.34)
0.16 0.28 0.29 0.30(0.05 - 0.28) (0.07 - 0.55) (0.19 - 0.46) (0.18 - 0.45)
0.17 0.25 0.25 0.23(0.10 - 0.21) (0.11 - 0.32) (0.17 - 0.37) (0.14 - 0.34)
0.26 0.40 0.40 0.41(0.11 - 0.37) (0.13 - 0.70) (0.30 - 0.58) (0.31 - 0.55)
0.01 0.02 0.02 0.02(0.01 - 0.02) (0.01 - 0.03) (0.01 - 0.04) (0.02 - 0.04)
0.03 0.04 0.04 0.04(0.02 - 0.04) (0.02 - 0.05) (0.03 - 0.06) (0.03 - 0.06)
0.7 0.7 0.8 0.9(0.1 - 1.3) (0.1 - 1.5) (0.2 - 1.4) (0.1 - 1.6)
3.3 4.5 2.8 3.1(0.5 - 8.6) (0.5 - 13.6) (0.5 - 7.4) (0.5 - 8.1)
220 1100 2400 1300(20 - 4700) (18 - 11000) (770 - 25000) (260 - 19000)
430 2000 5000 2700(35 - 9700) (37 - 31000) (1800 - 50000) (520 - 77000)
Tsing Yi(West)
Tsing Yi(South)
Hong Kong Island(West)
Temperature (°C)
Faecal Coliforms (cfu/100mL)
E. coli (cfu/100mL)
Chlorophy ll-a (µg/L)
5-day Biochemical Ox y gen Demand (mg/L)
Orthophosphate Phosphorus (mg/L)
Total Inorganic Nitrogen (mg/L)
Unionised Ammonia (mg/L)
Ammonia Nitrogen (mg/L)
Total Phosphorus (mg/L)
Silica (as SiO2) (mg/L)
Bottom
Bottom
Salinity
Dissolv ed Ox y gen (mg/L)
Dissolv ed Ox y gen (% Saturation)
pH
Total Kjeldahl Nitrogen (mg/L)
Total Nitrogen (mg/L)
Secchi Disc Depth (m)
Turbidity (NTU)
Suspended Solids (mg/L)
Nitrite Nitrogen (mg/L)
Nitrate Nitrogen (mg/L)
WESTERN BUFFER WCZ
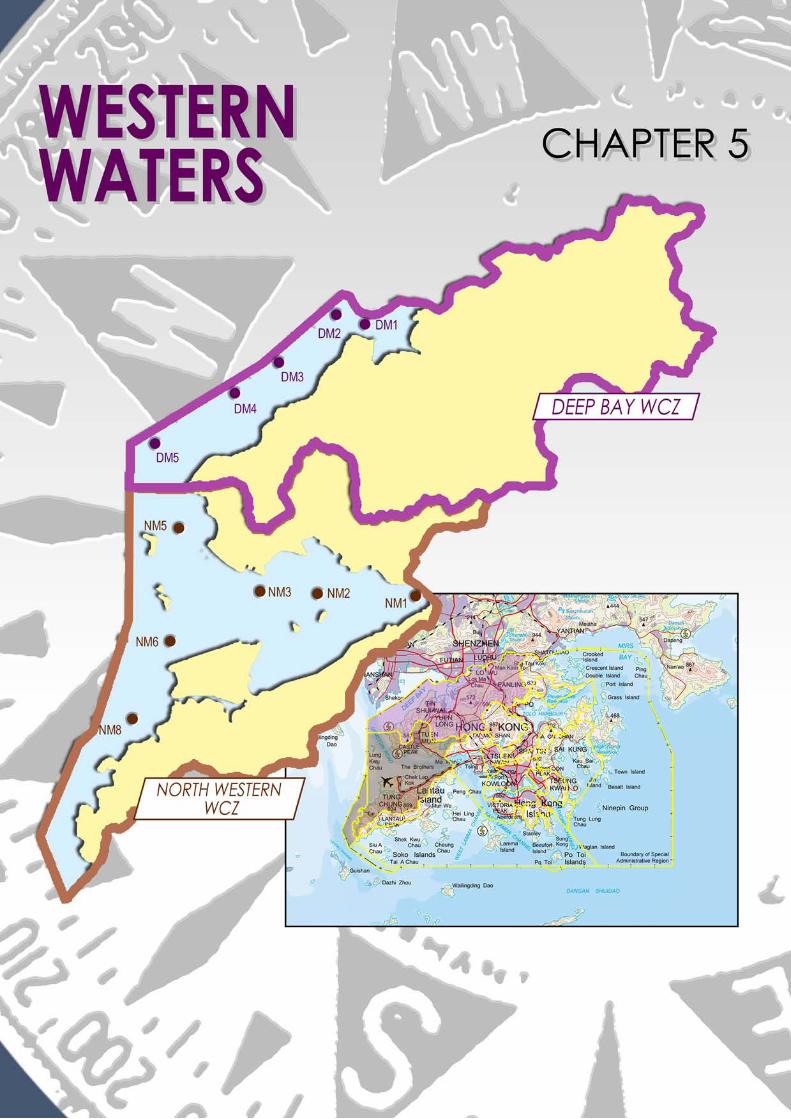
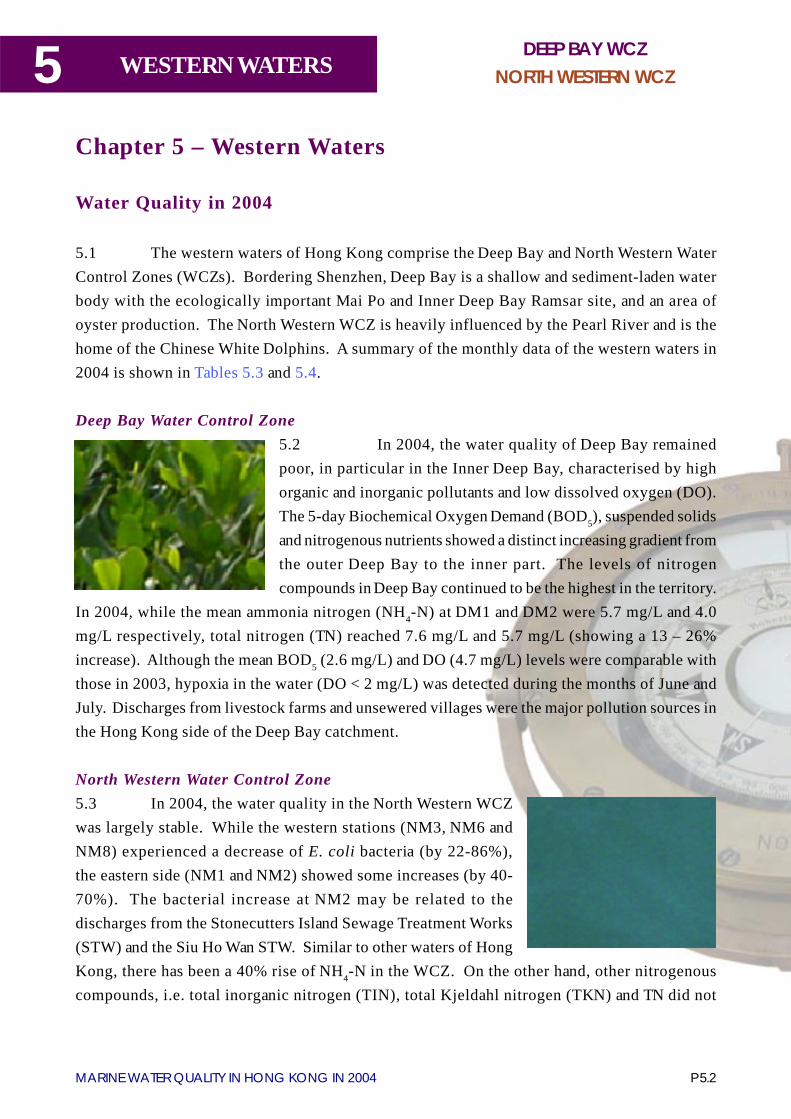
5
P 5.2MARINE WATER QUALITY IN HONG KONG IN 2004
WESTERN WATERS
Chapter 5 – Western Waters
Water Quality in 2004
5.1 The western waters of Hong Kong comprise the Deep Bay and North Western WaterControl Zones (WCZs). Bordering Shenzhen, Deep Bay is a shallow and sediment-laden waterbody with the ecologically important Mai Po and Inner Deep Bay Ramsar site, and an area ofoyster production. The North Western WCZ is heavily influenced by the Pearl River and is thehome of the Chinese White Dolphins. A summary of the monthly data of the western waters in2004 is shown in Tables 5.3 and 5.4.
Deep Bay Water Control Zone5.2 In 2004, the water quality of Deep Bay remainedpoor, in particular in the Inner Deep Bay, characterised by highorganic and inorganic pollutants and low dissolved oxygen (DO).The 5-day Biochemical Oxygen Demand (BOD5), suspended solidsand nitrogenous nutrients showed a distinct increasing gradient fromthe outer Deep Bay to the inner part. The levels of nitrogencompounds in Deep Bay continued to be the highest in the territory.
In 2004, while the mean ammonia nitrogen (NH4-N) at DM1 and DM2 were 5.7 mg/L and 4.0mg/L respectively, total nitrogen (TN) reached 7.6 mg/L and 5.7 mg/L (showing a 13 – 26%increase). Although the mean BOD5 (2.6 mg/L) and DO (4.7 mg/L) levels were comparable withthose in 2003, hypoxia in the water (DO < 2 mg/L) was detected during the months of June andJuly. Discharges from livestock farms and unsewered villages were the major pollution sources inthe Hong Kong side of the Deep Bay catchment.
North Western Water Control Zone5.3 In 2004, the water quality in the North Western WCZwas largely stable. While the western stations (NM3, NM6 andNM8) experienced a decrease of E. coli bacteria (by 22-86%),the eastern side (NM1 and NM2) showed some increases (by 40-70%). The bacterial increase at NM2 may be related to thedischarges from the Stonecutters Island Sewage Treatment Works(STW) and the Siu Ho Wan STW. Similar to other waters of HongKong, there has been a 40% rise of NH4-N in the WCZ. On the other hand, other nitrogenouscompounds, i.e. total inorganic nitrogen (TIN), total Kjeldahl nitrogen (TKN) and TN did not
DEEP BAY WCZNORTH WESTERN WCZ
iwp12
印章
iwp12
印章
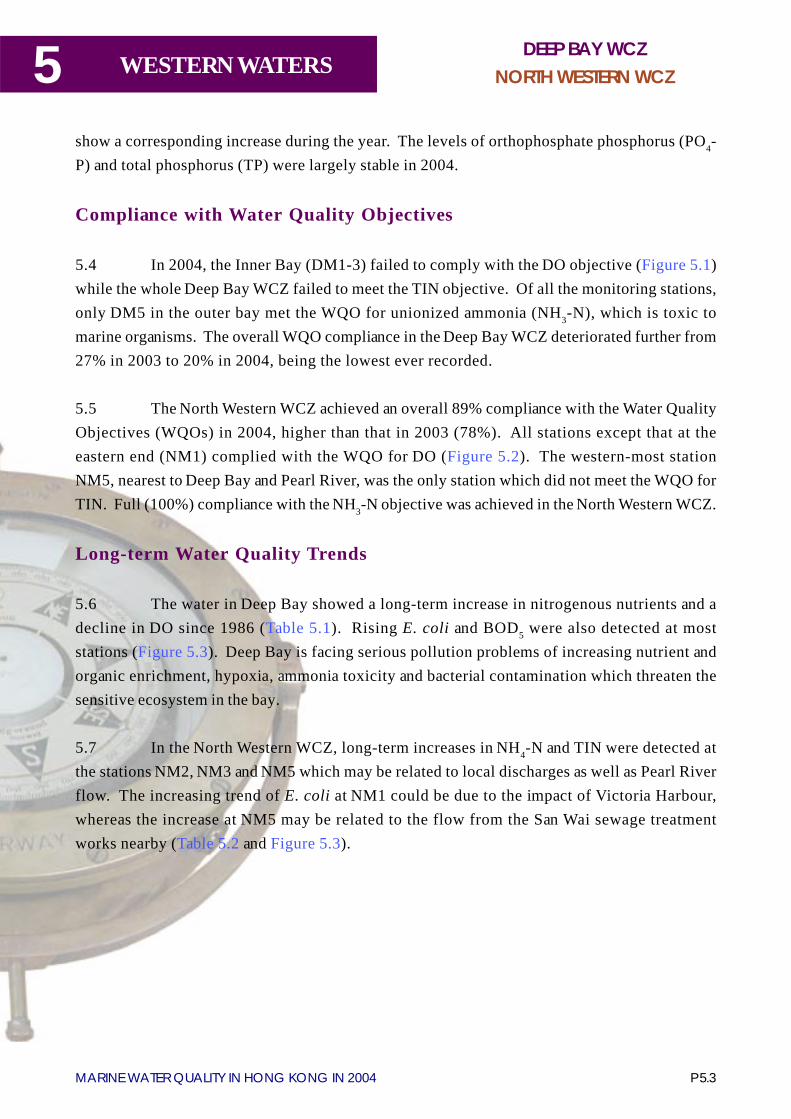
P 5.3MARINE WATER QUALITY IN HONG KONG IN 2004
5 WESTERN WATERS
show a corresponding increase during the year. The levels of orthophosphate phosphorus (PO4-P) and total phosphorus (TP) were largely stable in 2004.
Compliance with Water Quality Objectives
5.4 In 2004, the Inner Bay (DM1-3) failed to comply with the DO objective (Figure 5.1)while the whole Deep Bay WCZ failed to meet the TIN objective. Of all the monitoring stations,only DM5 in the outer bay met the WQO for unionized ammonia (NH3-N), which is toxic tomarine organisms. The overall WQO compliance in the Deep Bay WCZ deteriorated further from27% in 2003 to 20% in 2004, being the lowest ever recorded.
5.5 The North Western WCZ achieved an overall 89% compliance with the Water QualityObjectives (WQOs) in 2004, higher than that in 2003 (78%). All stations except that at theeastern end (NM1) complied with the WQO for DO (Figure 5.2). The western-most stationNM5, nearest to Deep Bay and Pearl River, was the only station which did not meet the WQO forTIN. Full (100%) compliance with the NH3-N objective was achieved in the North Western WCZ.
Long-term Water Quality Trends
5.6 The water in Deep Bay showed a long-term increase in nitrogenous nutrients and adecline in DO since 1986 (Table 5.1). Rising E. coli and BOD5 were also detected at moststations (Figure 5.3). Deep Bay is facing serious pollution problems of increasing nutrient andorganic enrichment, hypoxia, ammonia toxicity and bacterial contamination which threaten thesensitive ecosystem in the bay.
5.7 In the North Western WCZ, long-term increases in NH4-N and TIN were detected atthe stations NM2, NM3 and NM5 which may be related to local discharges as well as Pearl Riverflow. The increasing trend of E. coli at NM1 could be due to the impact of Victoria Harbour,whereas the increase at NM5 may be related to the flow from the San Wai sewage treatmentworks nearby (Table 5.2 and Figure 5.3).
DEEP BAY WCZNORTH WESTERN WCZ
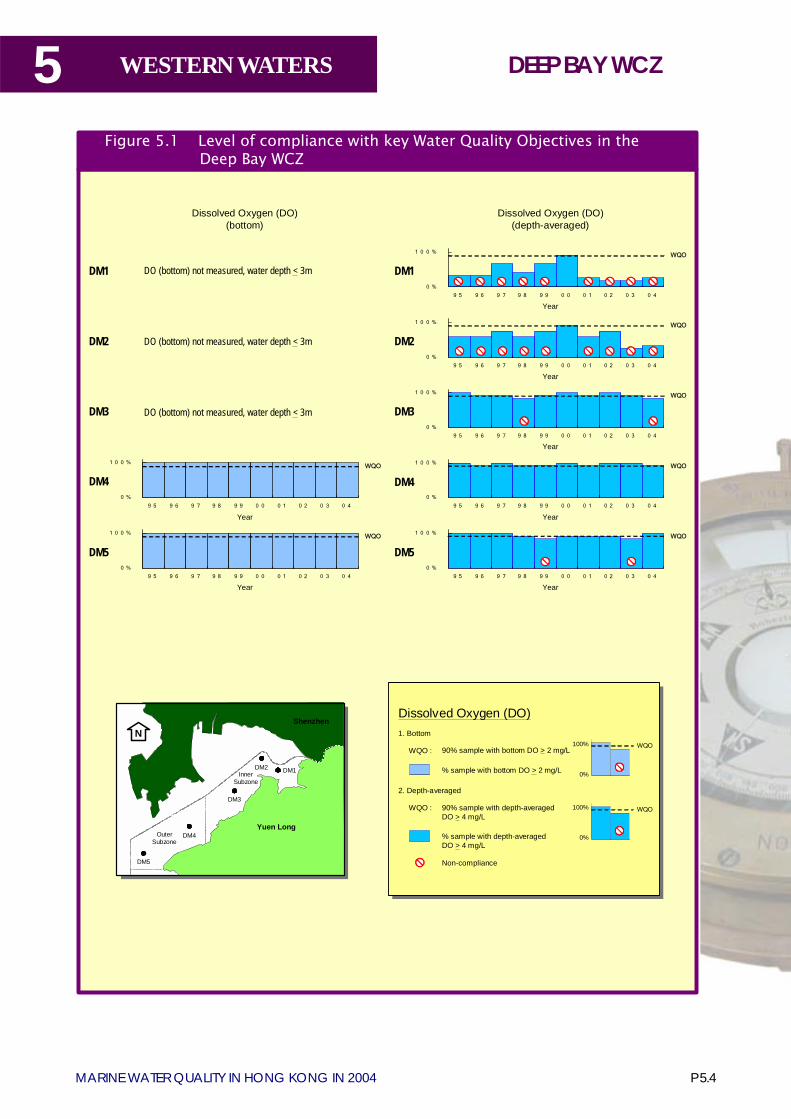
5
P 5.4MARINE WATER QUALITY IN HONG KONG IN 2004
WESTERN WATERS DEEP BAY WCZ
Dissolved Oxygen (DO)(bottom)
0 %
1 0 0 %
9 5 9 6 9 7 9 8 9 9 0 0 0 1 0 2 0 3 0 4
DM4WQO
Year
0 %
1 0 0 %
9 5 9 6 9 7 9 8 9 9 0 0 0 1 0 2 0 3 0 4
DM3WQO
Year
0 %
1 0 0 %
9 5 9 6 9 7 9 8 9 9 0 0 0 1 0 2 0 3 0 4
DM5WQO
Year
0 %
1 0 0 %
9 5 9 6 9 7 9 8 9 9 0 0 0 1 0 2 0 3 0 4
DM4WQO
Year
0 %
1 0 0 %
9 5 9 6 9 7 9 8 9 9 0 0 0 1 0 2 0 3 0 4
DM5WQO
Year
Dissolved Oxygen (DO)(depth-averaged)
OuterSubzone
InnerSubzone
DM5
DM4
DM3
DM1DM2
Shenzhen
Yuen Long
0 %
1 0 0 %
9 5 9 6 9 7 9 8 9 9 0 0 0 1 0 2 0 3 0 4
DM1WQO
Year
N
0 %
1 0 0 %
9 5 9 6 9 7 9 8 9 9 0 0 0 1 0 2 0 3 0 4
DM2WQO
Year
DM3
DM1
DM2
DO (bottom) not measured, water depth < 3m
DO (bottom) not measured, water depth < 3m
DO (bottom) not measured, water depth < 3m
Dissolved Oxygen (DO)
% sample with bottom DO > 2 mg/L
90% sample with bottom DO > 2 mg/LWQO :
2. Depth-averaged
1. Bottom
90% sample with depth-averagedDO > 4 mg/L
WQO :
Non-compliance
% sample with depth-averagedDO > 4 mg/L
WQO
WQO100%
0%
100%
0%
Figure 5.1 Level of compliance with key Water Quality Objectives in the Deep Bay WCZ
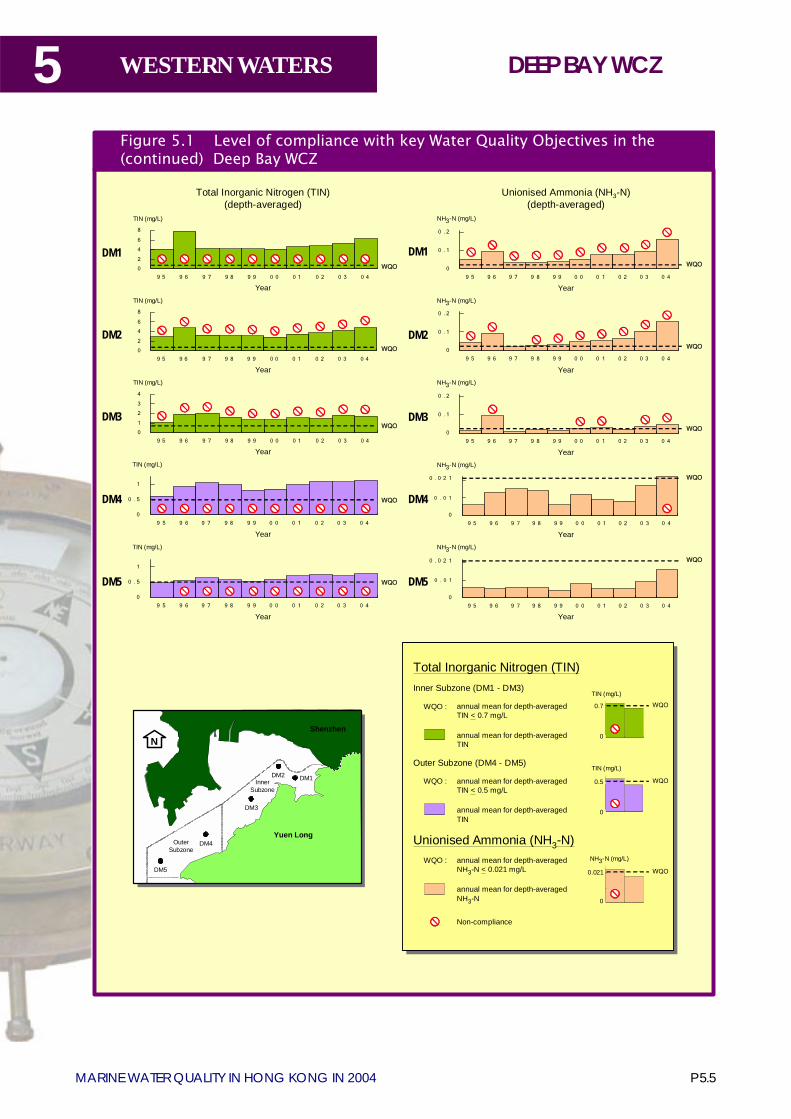
P 5.5MARINE WATER QUALITY IN HONG KONG IN 2004
5 WESTERN WATERS
Figure 5.1 Level of compliance with key Water Quality Objectives in the (continued) Deep Bay WCZ
0
1
2
3
4
9 5 9 6 9 7 9 8 9 9 0 0 0 1 0 2 0 3 0 4
WQO
Total Inorganic Nitrogen (TIN)(depth-averaged)
Unionised Ammonia (NH3-N)(depth-averaged)
0
0 . 1
0 . 2
9 5 9 6 9 7 9 8 9 9 0 0 0 1 0 2 0 3 0 4
DM2
Year
NH3-N (mg/L)
WQO
0
0 . 1
0 . 2
9 5 9 6 9 7 9 8 9 9 0 0 0 1 0 2 0 3 0 4
DM3
Year
NH3-N (mg/L)
WQO
0
0 . 0 2 1
9 5 9 6 9 7 9 8 9 9 0 0 0 1 0 2 0 3 0 4
DM4
Year
NH3-N (mg/L)
WQO
NH3-N (mg/L)
DM50
0 . 0 2 1
9 5 9 6 9 7 9 8 9 9 0 0 0 1 0 2 0 3 0 4
Year
WQO
0
0 . 5
1
9 5 9 6 9 7 9 8 9 9 0 0 0 1 0 2 0 3 0 4
DM5
Year
TIN (mg/L)
WQO
0
0 . 5
1
9 5 9 6 9 7 9 8 9 9 0 0 0 1 0 2 0 3 0 4
DM4
Year
TIN (mg/L)
WQO
0
2
4
6
8
9 5 9 6 9 7 9 8 9 9 0 0 0 1 0 2 0 3 0 4
DM2
Year
TIN (mg/L)
WQO
0
0 . 1
0 . 2
9 5 9 6 9 7 9 8 9 9 0 0 0 1 0 2 0 3 0 4
Year
NH3-N (mg/L)
WQO
DM10
2
4
6
8
9 5 9 6 9 7 9 8 9 9 0 0 0 1 0 2 0 3 0 4
DM1
Year
TIN (mg/L)
WQO
DM3
Year
TIN (mg/L)
Non-compliance
Total Inorganic Nitrogen (TIN)
annual mean for depth-averagedTIN < 0.7 mg/L
WQO :
annual mean for depth-averagedNH3-N < 0.021 mg/L
WQO :
annual mean for depth-averagedNH3-N
Unionised Ammonia (NH3-N)
0
0.7 WQO
TIN (mg/L)
0
0.021 WQO
NH3-N (mg/L)
Inner Subzone (DM1 - DM3)
Outer Subzone (DM4 - DM5)
annual mean for depth-averagedTIN
annual mean for depth-averagedTIN
annual mean for depth-averagedTIN < 0.5 mg/L
WQO :
0
0.5 WQO
TIN (mg/L)
OuterSubzone
InnerSubzone
DM5
DM4
DM3
DM1DM2
Shenzhen
Yuen Long
N
0.5
0
0.021
0
0 . 0 1
0.7
0
0 . 0 1
DEEP BAY WCZ
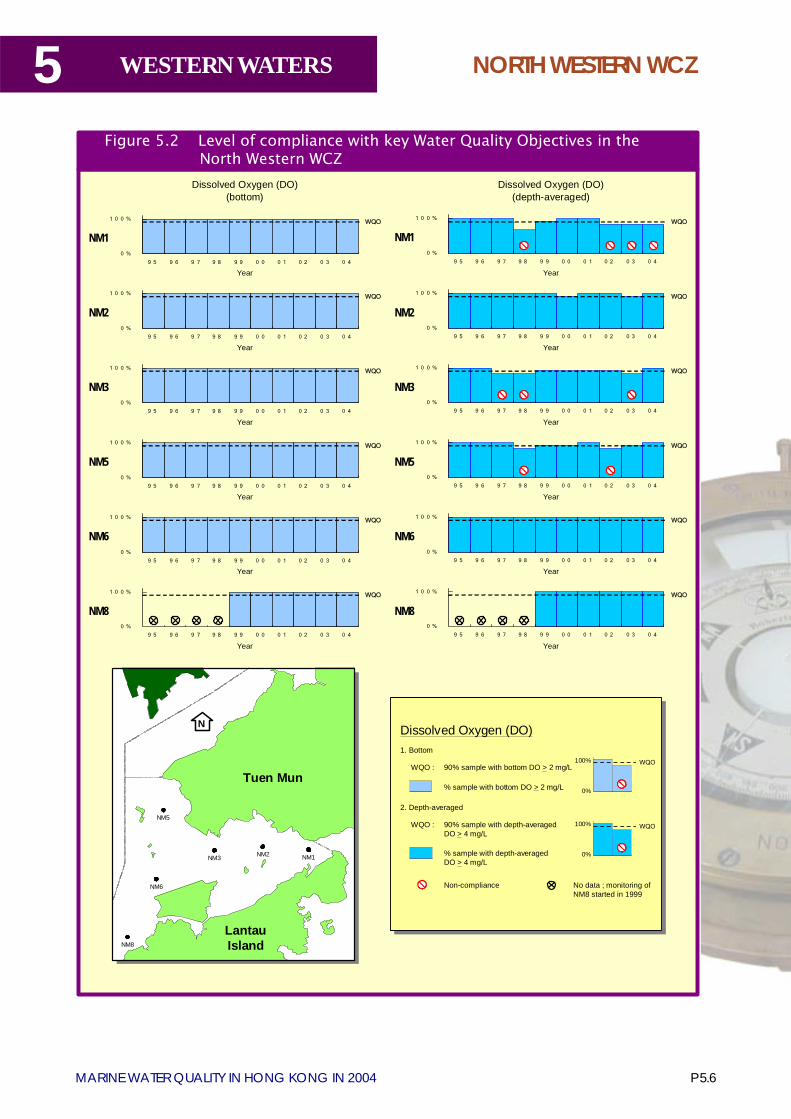
5
P 5.6MARINE WATER QUALITY IN HONG KONG IN 2004
WESTERN WATERS NORTH WESTERN WCZ
Dissolved Oxygen (DO)(bottom)
Dissolved Oxygen (DO)(depth-averaged)
0 %
1 0 0 %
9 5 9 6 9 7 9 8 9 9 0 0 0 1 0 2 0 3 0 4
NM1WQO
Year
0 %
1 0 0 %
9 5 9 6 9 7 9 8 9 9 0 0 0 1 0 2 0 3 0 4
NM1WQO
Year
0 %
1 0 0 %
9 5 9 6 9 7 9 8 9 9 0 0 0 1 0 2 0 3 0 4
NM2WQO
Year
0 %
1 0 0 %
9 5 9 6 9 7 9 8 9 9 0 0 0 1 0 2 0 3 0 4
NM2WQO
Year
0 %
1 0 0 %
9 5 9 6 9 7 9 8 9 9 0 0 0 1 0 2 0 3 0 4
NM3WQO
Year
0 %
1 0 0 %
9 5 9 6 9 7 9 8 9 9 0 0 0 1 0 2 0 3 0 4
NM3WQO
Year
0 %
1 0 0 %
9 5 9 6 9 7 9 8 9 9 0 0 0 1 0 2 0 3 0 4
NM5WQO
Year
0 %
1 0 0 %
9 5 9 6 9 7 9 8 9 9 0 0 0 1 0 2 0 3 0 4
NM5WQO
Year
WQO
0 %
1 0 0 %
9 5 9 6 9 7 9 8 9 9 0 0 0 1 0 2 0 3 0 4
NM6
Year
0 %
1 0 0 %
9 5 9 6 9 7 9 8 9 9 0 0 0 1 0 2 0 3 0 4
NM6WQO
Year
Non-compliance No data ; monitoring ofNM8 started in 1999
Dissolved Oxygen (DO)
% sample with bottom DO > 2 mg/L
90% sample with bottom DO > 2 mg/LWQO :
2. Depth-averaged
1. Bottom
90% sample with depth-averagedDO > 4 mg/L
WQO :
% sample with depth-averagedDO > 4 mg/L
WQO
WQO
WQO
0 %
1 0 0 %
9 5 9 6 9 7 9 8 9 9 0 0 0 1 0 2 0 3 0 4
NM8
Year
0 %
1 0 0 %
9 5 9 6 9 7 9 8 9 9 0 0 0 1 0 2 0 3 0 4
NM8WQO
Year
100%
0%
100%
0%
N
NM2NM3
NM5
NM6
NM1
NM8
Tuen Mun
LantauIsland
Figure 5.2 Level of compliance with key Water Quality Objectives in the North Western WCZ
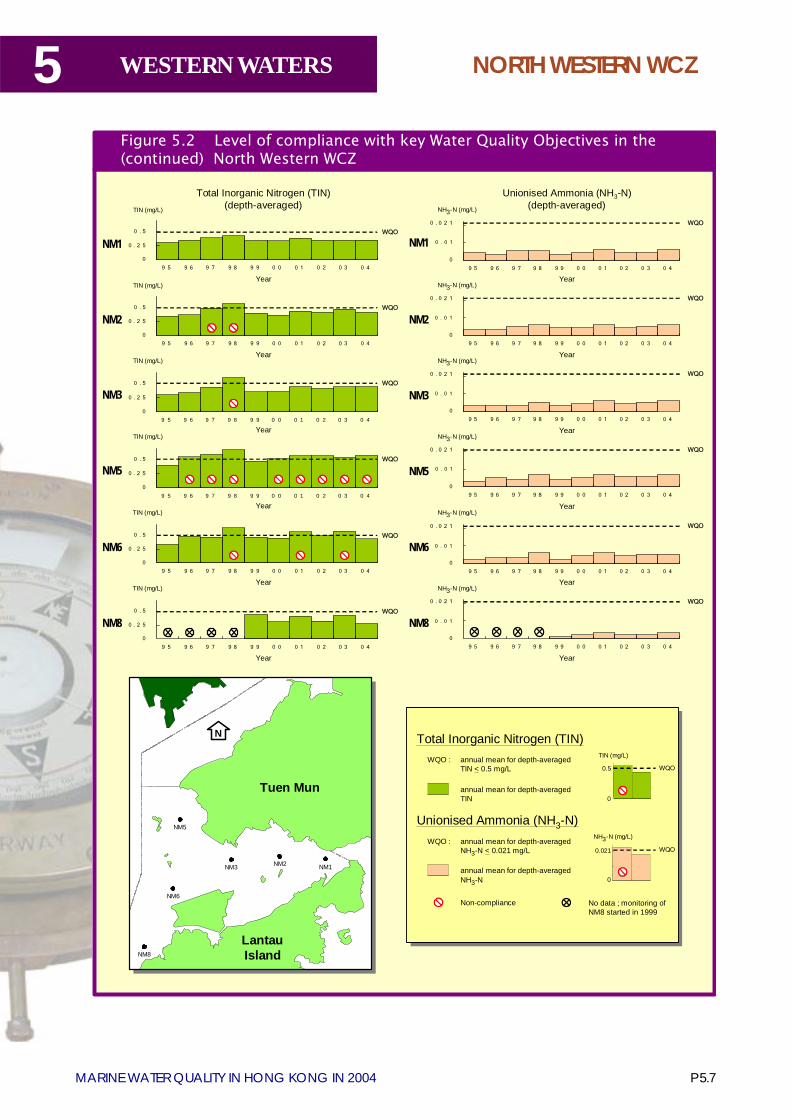
P 5.7MARINE WATER QUALITY IN HONG KONG IN 2004
5 WESTERN WATERS NORTH WESTERN WCZ
N
NM2NM3
NM5
NM6
NM1
NM8
Tuen Mun
LantauIsland
Total Inorganic Nitrogen (TIN)(depth-averaged)
Unionised Ammonia (NH3-N)(depth-averaged)
Non-compliance No data ; monitoring of NM8 started in 1999
Total Inorganic Nitrogen (TIN)
annual mean for depth-averagedTIN
annual mean for depth-averagedTIN < 0.5 mg/L
WQO :
annual mean for depth-averagedNH3-N < 0.021 mg/L
WQO :
annual mean for depth-averagedNH3-N
Unionised Ammonia (NH3-N)
0
0.5 WQO
TIN (mg/L)
0
0.021 WQO
NH3-N (mg/L)
0
0 . 0 2 1
9 5 9 6 9 7 9 8 9 9 0 0 0 1 0 2 0 3 0 4
NM8
Year
NH3-N (mg/L)
WQO
0
0 . 2 5
0 . 5
9 5 9 6 9 7 9 8 9 9 0 0 0 1 0 2 0 3 0 4
NM8
Year
TIN (mg/L)
WQO
NH3-N (mg/L)
NM60
0 . 0 2 1
9 5 9 6 9 7 9 8 9 9 0 0 0 1 0 2 0 3 0 4
Year
WQO
0
0 . 2 5
0 . 5
9 5 9 6 9 7 9 8 9 9 0 0 0 1 0 2 0 3 0 4
NM6
Year
TIN (mg/L)
WQO
0
0 . 0 2 1
9 5 9 6 9 7 9 8 9 9 0 0 0 1 0 2 0 3 0 4
NM2
Year
NH3-N (mg/L)
WQO
0
0 . 2 5
0 . 5
9 5 9 6 9 7 9 8 9 9 0 0 0 1 0 2 0 3 0 4
NM2
Year
TIN (mg/L)
WQO
0
0 . 0 2 1
9 5 9 6 9 7 9 8 9 9 0 0 0 1 0 2 0 3 0 4
Year
NH3-N (mg/L)
WQO
NM10
0 . 2 5
0 . 5
9 5 9 6 9 7 9 8 9 9 0 0 0 1 0 2 0 3 0 4
NM1
Year
TIN (mg/L)
WQO
0
0 . 0 2 1
9 5 9 6 9 7 9 8 9 9 0 0 0 1 0 2 0 3 0 4
NM3
Year
NH3-N (mg/L)
WQO
0
0 . 2 5
0 . 5
9 5 9 6 9 7 9 8 9 9 0 0 0 1 0 2 0 3 0 4
NM3
Year
TIN (mg/L)
WQO
0
0 . 0 2 1
9 5 9 6 9 7 9 8 9 9 0 0 0 1 0 2 0 3 0 4
NM5
Year
NH3-N (mg/L)
WQO
0
0 . 2 5
0 . 5
9 5 9 6 9 7 9 8 9 9 0 0 0 1 0 2 0 3 0 4
NM5
Year
TIN (mg/L)
WQO
0.5
0
0.021
0
0 . 0 1
0 . 0 1
0 . 0 1
0 . 0 1
0 . 0 1
0 . 0 1
Figure 5.2 Level of compliance with key Water Quality Objectives in the (continued) North Western WCZ
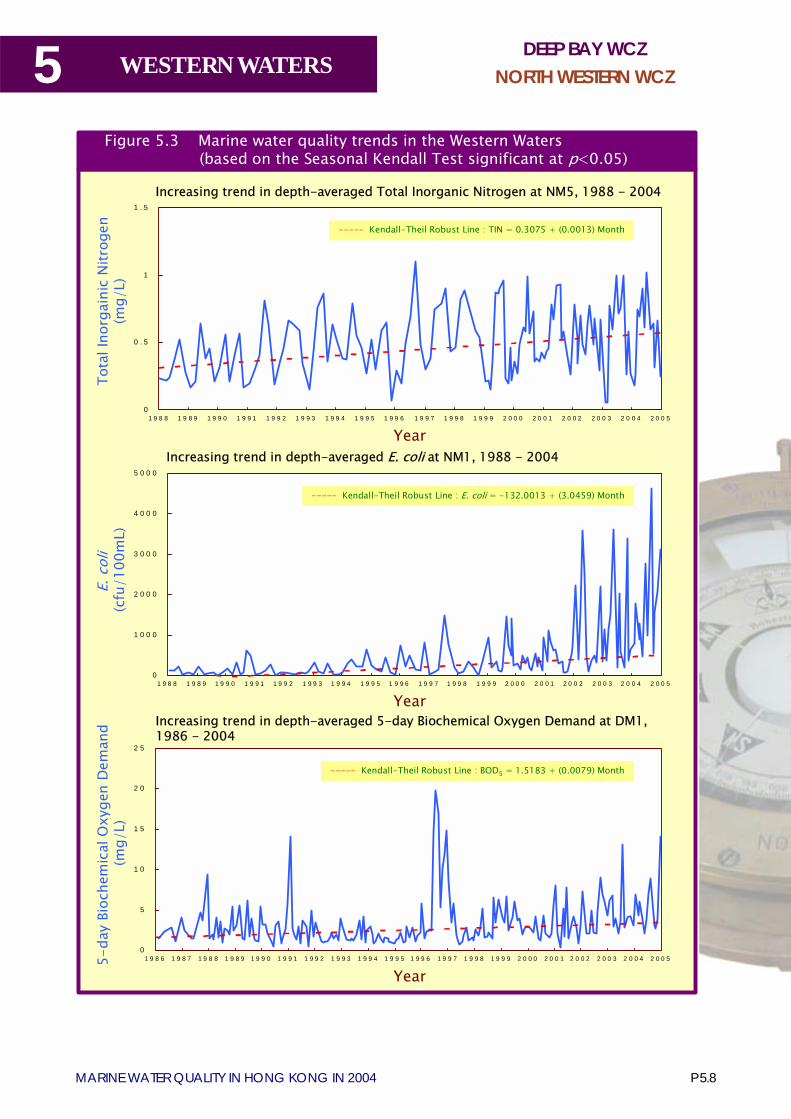
5
P 5.8MARINE WATER QUALITY IN HONG KONG IN 2004
WESTERN WATERSDEEP BAY WCZ
NORTH WESTERN WCZ
Increasing trend in depth-averaged 5-day Biochemical Oxygen Demand at DM1, 1986 - 2004
Year
5-da
y Bi
oche
mic
al O
xyge
n D
eman
d (m
g/L)
0
5
1 0
1 5
2 0
2 5
1 9 8 6 1 9 8 7 1 9 8 8 1 9 8 9 1 9 9 0 1 9 9 1 1 9 9 2 1 9 9 3 1 9 9 4 1 9 9 5 1 9 9 6 1 9 9 7 1 9 9 8 1 9 9 9 2 0 0 0 2 0 0 1 2 0 0 2 2 0 0 3 2 0 0 4 2 0 0 5
----- Kendall-Theil Robust Line : BOD5 = 1.5183 + (0.0079) Month
Figure 5.3 Marine water quality trends in the Western Waters(based on the Seasonal Kendall Test significant at p<0.05)
Year
Increasing trend in depth-averaged Total Inorganic Nitrogen at NM5, 1988 - 2004
Tota
l Ino
rgai
nic
Nitr
ogen
(mg/
L)
0
0 . 5
1
1 . 5
1 9 8 8 1 9 8 9 1 9 9 0 1 9 9 1 1 9 9 2 1 9 9 3 1 9 9 4 1 9 9 5 1 9 9 6 1 9 9 7 1 9 9 8 1 9 9 9 2 0 0 0 2 0 0 1 2 0 0 2 2 0 0 3 2 0 0 4 2 0 0 5
----- Kendall-Theil Robust Line : TIN = 0.3075 + (0.0013) Month
Increasing trend in depth-averaged E. coli at NM1, 1988 - 2004
Year
0
1 0 0 0
2 0 0 0
3 0 0 0
4 0 0 0
5 0 0 0
1 9 8 8 1 9 8 9 1 9 9 0 1 9 9 1 1 9 9 2 1 9 9 3 1 9 9 4 1 9 9 5 1 9 9 6 1 9 9 7 1 9 9 8 1 9 9 9 2 0 0 0 2 0 0 1 2 0 0 2 2 0 0 3 2 0 0 4 2 0 0 5
----- Kendall-Theil Robust Line : E. coli = -132.0013 + (3.0459) Month
E. c
oli
(cfu
/100
mL)
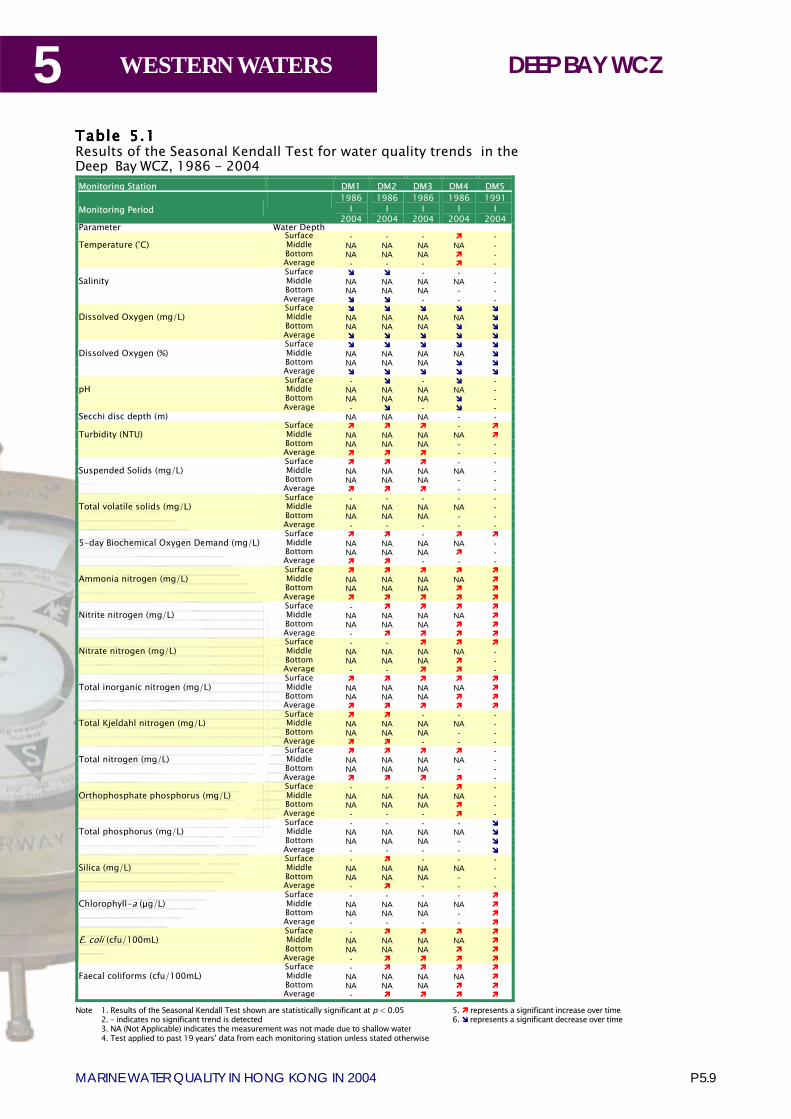
P 5.9MARINE WATER QUALITY IN HONG KONG IN 2004
5 WESTERN WATERS
Table Table Table Table Table 55555.....11111Results of the Seasonal Kendall Test for water quality trends in theDeep Bay WCZ, 1986 - 2004
Note 1. Results of the Seasonal Kendall Test shown are statistically significant at p < 0.052. � indicates no significant trend is detected3. NA (Not Applicable) indicates the measurement was not made due to shallow water4. Test applied to past 19 years� data from each monitoring station unless stated otherwise
5. ! represents a significant increase over time6. " represents a significant decrease over time
Monitoring Station DM1 DM2 DM3 DM4 DM5
Monitoring Period 1986
I 2004
1986 I
2004
1986 I
2004
1986 I
2004
1991 I
2004 Parameter Water Depth Surface - - - ! - Temperature (°C) Middle NA NA NA NA - Bottom NA NA NA ! - Average - - - ! - Surface " " - - - Salinity Middle NA NA NA NA -
Bottom NA NA NA - - Average " " - - -
Surface " " " " " Dissolved Oxygen (mg/L) Middle NA NA NA NA " Bottom NA NA NA " " Average " " " " " Surface " " " " " Dissolved Oxygen (%) Middle NA NA NA NA " Bottom NA NA NA " " Average " " " " " Surface - " - " - pH Middle NA NA NA NA - Bottom NA NA NA " - Average - " - " - Secchi disc depth (m) NA NA NA - - Surface ! ! ! - ! Turbidity (NTU) Middle NA NA NA NA ! Bottom NA NA NA - - Average ! ! ! - - Surface ! ! ! - - Suspended Solids (mg/L) Middle NA NA NA NA - Bottom NA NA NA - - Average ! ! ! - - Surface - - - - - Total volatile solids (mg/L) Middle NA NA NA NA - Bottom NA NA NA - - Average - - - - - Surface ! ! - ! ! 5-day Biochemical Oxygen Demand (mg/L) Middle NA NA NA NA - Bottom NA NA NA ! - Average ! ! - - - Surface ! ! ! ! ! Ammonia nitrogen (mg/L) Middle NA NA NA NA ! Bottom NA NA NA ! ! Average ! ! ! ! ! Surface - ! ! ! ! Nitrite nitrogen (mg/L) Middle NA NA NA NA ! Bottom NA NA NA ! ! Average - ! ! ! ! Surface - - ! ! ! Nitrate nitrogen (mg/L) Middle NA NA NA NA - Bottom NA NA NA ! - Average - - ! ! - Surface ! ! ! ! ! Total inorganic nitrogen (mg/L) Middle NA NA NA NA ! Bottom NA NA NA ! ! Average ! ! ! ! ! Surface ! ! - - - Total Kjeldahl nitrogen (mg/L) Middle NA NA NA NA - Bottom NA NA NA - - Average ! ! - - - Surface ! ! ! ! - Total nitrogen (mg/L) Middle NA NA NA NA - Bottom NA NA NA - - Average ! ! ! ! - Surface - - - ! - Orthophosphate phosphorus (mg/L) Middle NA NA NA NA - Bottom NA NA NA ! - Average - - - ! - Surface - - - - " Total phosphorus (mg/L) Middle NA NA NA NA " Bottom NA NA NA - " Average - - - - " Surface - ! - - - Silica (mg/L) Middle NA NA NA NA - Bottom NA NA NA - - Average - ! - - - Surface - - - - ! Chlorophyll-a (µg/L) Middle NA NA NA NA ! Bottom NA NA NA - ! Average - - - - ! Surface - ! ! ! ! E. coli (cfu/100mL) Middle NA NA NA NA ! Bottom NA NA NA ! ! Average - ! ! ! !
Surface - ! ! ! ! Faecal coliforms (cfu/100mL) Middle NA NA NA NA ! Bottom NA NA NA ! ! Average - ! ! ! !
DEEP BAY WCZ
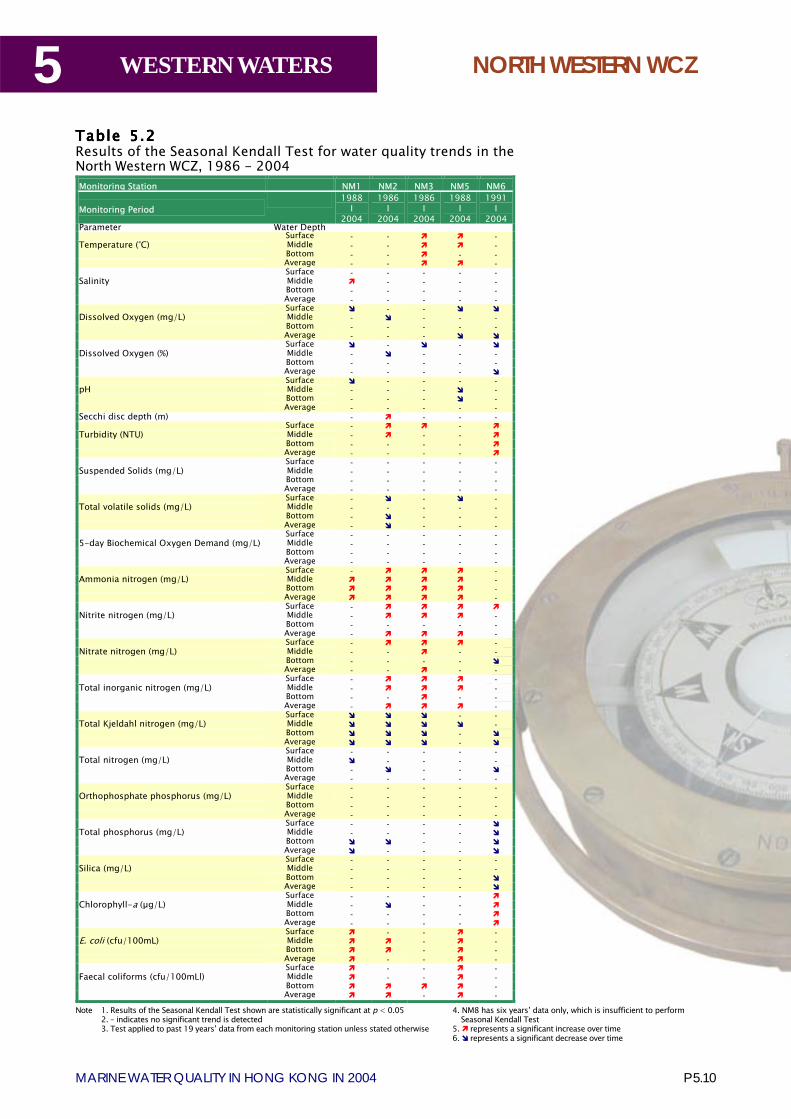
5
P 5.10MARINE WATER QUALITY IN HONG KONG IN 2004
WESTERN WATERS
Table Table Table Table Table 55555.....22222Results of the Seasonal Kendall Test for water quality trends in theNorth Western WCZ, 1986 - 2004
Note 1. Results of the Seasonal Kendall Test shown are statistically significant at p < 0.052. � indicates no significant trend is detected3. Test applied to past 19 years� data from each monitoring station unless stated otherwise
4. NM8 has six years� data only, which is insufficient to perform Seasonal Kendall Test5. ! represents a significant increase over time6. " represents a significant decrease over time
Monitoring Station NM1 NM2 NM3 NM5 NM6
Monitoring Period 1988
I 2004
1986 I
2004
1986 I
2004
1988 I
2004
1991 I
2004 Parameter Water Depth Surface - - ! ! - Temperature (°C) Middle - - ! ! - Bottom - - ! - - Average - - ! ! - Surface - - - - - Salinity Middle ! - - - -
Bottom - - - - - Average - - - - -
Surface " - - " " Dissolved Oxygen (mg/L) Middle - " - - - Bottom - - - - - Average - - - " " Surface " - " - " Dissolved Oxygen (%) Middle - " - - - Bottom - - - - - Average - - - - " Surface " - - - - pH Middle - - - " - Bottom - - - " - Average - - - - - Secchi disc depth (m) - ! - - - Surface - ! ! - ! Turbidity (NTU) Middle - ! - - ! Bottom - - - - ! Average - - - - ! Surface - - - - - Suspended Solids (mg/L) Middle - - - - - Bottom - - - - - Average - - - - - Surface - " - " - Total volatile solids (mg/L) Middle - - - - - Bottom - " - - - Average - " - - - Surface - - - - - 5-day Biochemical Oxygen Demand (mg/L) Middle - - - - - Bottom - - - - - Average - - - - - Surface - ! ! ! - Ammonia nitrogen (mg/L) Middle ! ! ! ! - Bottom ! ! ! ! - Average ! ! ! ! - Surface - ! ! ! ! Nitrite nitrogen (mg/L) Middle - ! ! ! - Bottom - - - - - Average - ! ! ! - Surface - ! ! ! - Nitrate nitrogen (mg/L) Middle - - ! - - Bottom - - - - " Average - - ! - - Surface - ! ! ! - Total inorganic nitrogen (mg/L) Middle - ! ! ! - Bottom - - ! - - Average - ! ! ! - Surface " " " - - Total Kjeldahl nitrogen (mg/L) Middle " " " " - Bottom " " " - " Average " " " - " Surface - - - - - Total nitrogen (mg/L) Middle " - - - - Bottom - " - - " Average - - - - - Surface - - - - - Orthophosphate phosphorus (mg/L) Middle - - - - - Bottom - - - - - Average - - - - - Surface - - - - " Total phosphorus (mg/L) Middle - - - - " Bottom " " - - " Average " - - - " Surface - - - - - Silica (mg/L) Middle - - - - - Bottom - - - - " Average - - - - " Surface - - - - ! Chlorophyll-a (µg/L) Middle - " - - ! Bottom - - - - ! Average - - - - ! Surface ! - - ! - E. coli (cfu/100mL) Middle ! ! - ! - Bottom ! ! - ! - Average ! - - ! -
Surface ! - - ! - Faecal coliforms (cfu/100mLl) Middle ! - - ! - Bottom ! ! ! ! - Average ! ! - ! -
NORTH WESTERN WCZ
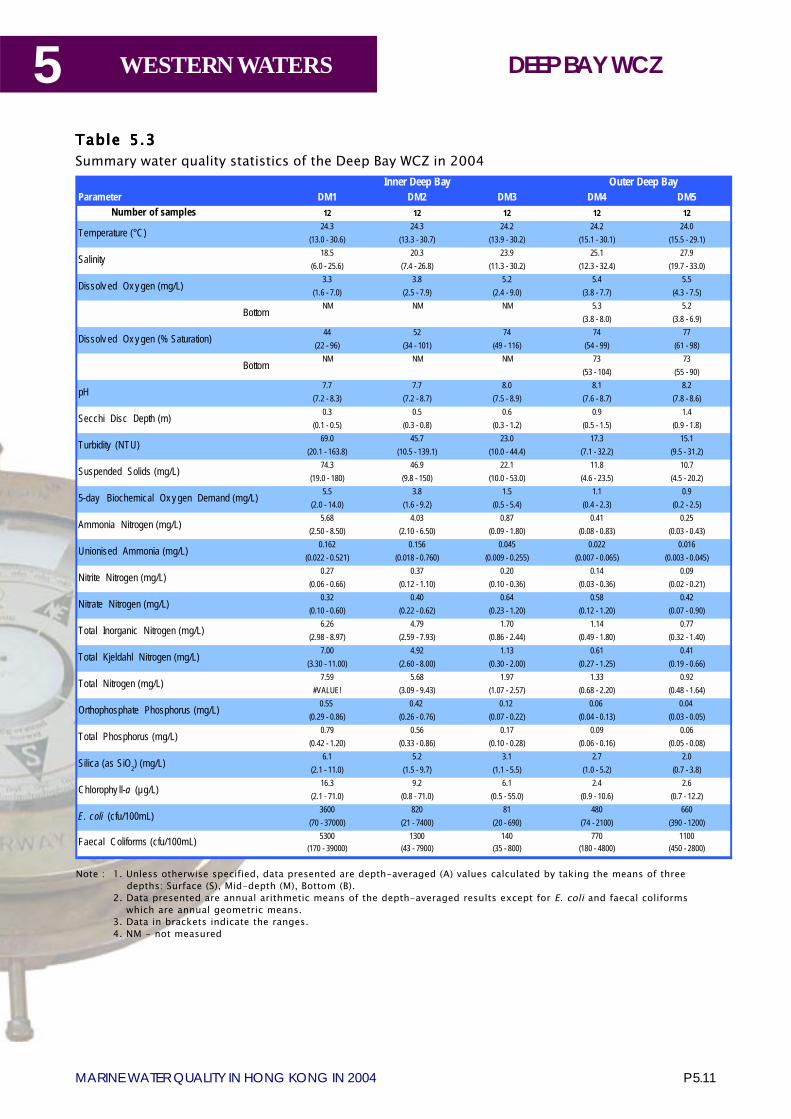
P 5.11MARINE WATER QUALITY IN HONG KONG IN 2004
5 WESTERN WATERS
Table Table Table Table Table 55555.....33333Summary water quality statistics of the Deep Bay WCZ in 2004
Note : 1. Unless otherwise specified, data presented are depth-averaged (A) values calculated by taking the means of threedepths: Surface (S), Mid-depth (M), Bottom (B).
2. Data presented are annual arithmetic means of the depth-averaged results except for E. coli and faecal coliformswhich are annual geometric means.
3. Data in brackets indicate the ranges.4. NM - not measured
Parameter DM1 DM2 DM3 DM4 DM5Number of samples 12 12 12 12 12
24.3 24.3 24.2 24.2 24.0(13.0 - 30.6) (13.3 - 30.7) (13.9 - 30.2) (15.1 - 30.1) (15.5 - 29.1)
18.5 20.3 23.9 25.1 27.9(6.0 - 25.6) (7.4 - 26.8) (11.3 - 30.2) (12.3 - 32.4) (19.7 - 33.0)
3.3 3.8 5.2 5.4 5.5(1.6 - 7.0) (2.5 - 7.9) (2.4 - 9.0) (3.8 - 7.7) (4.3 - 7.5)
NM NM NM 5.3 5.2(3.8 - 8.0) (3.8 - 6.9)
44 52 74 74 77(22 - 96) (34 - 101) (49 - 116) (54 - 99) (61 - 98)
NM NM NM 73 73(53 - 104) (55 - 90)
7.7 7.7 8.0 8.1 8.2(7.2 - 8.3) (7.2 - 8.7) (7.5 - 8.9) (7.6 - 8.7) (7.8 - 8.6)
0.3 0.5 0.6 0.9 1.4(0.1 - 0.5) (0.3 - 0.8) (0.3 - 1.2) (0.5 - 1.5) (0.9 - 1.8)
69.0 45.7 23.0 17.3 15.1(20.1 - 163.8) (10.5 - 139.1) (10.0 - 44.4) (7.1 - 32.2) (9.5 - 31.2)
74.3 46.9 22.1 11.8 10.7(19.0 - 180) (9.8 - 150) (10.0 - 53.0) (4.6 - 23.5) (4.5 - 20.2)
5.5 3.8 1.5 1.1 0.9(2.0 - 14.0) (1.6 - 9.2) (0.5 - 5.4) (0.4 - 2.3) (0.2 - 2.5)
5.68 4.03 0.87 0.41 0.25(2.50 - 8.50) (2.10 - 6.50) (0.09 - 1.80) (0.08 - 0.83) (0.03 - 0.43)
0.162 0.156 0.045 0.022 0.016(0.022 - 0.521) (0.018 - 0.760) (0.009 - 0.255) (0.007 - 0.065) (0.003 - 0.045)
0.27 0.37 0.20 0.14 0.09(0.06 - 0.66) (0.12 - 1.10) (0.10 - 0.36) (0.03 - 0.36) (0.02 - 0.21)
0.32 0.40 0.64 0.58 0.42(0.10 - 0.60) (0.22 - 0.62) (0.23 - 1.20) (0.12 - 1.20) (0.07 - 0.90)
6.26 4.79 1.70 1.14 0.77(2.98 - 8.97) (2.59 - 7.93) (0.86 - 2.44) (0.49 - 1.80) (0.32 - 1.40)
7.00 4.92 1.13 0.61 0.41(3.30 - 11.00) (2.60 - 8.00) (0.30 - 2.00) (0.27 - 1.25) (0.19 - 0.66)
7.59 5.68 1.97 1.33 0.92#VALUE! (3.09 - 9.43) (1.07 - 2.57) (0.68 - 2.20) (0.48 - 1.64)
0.55 0.42 0.12 0.06 0.04(0.29 - 0.86) (0.26 - 0.76) (0.07 - 0.22) (0.04 - 0.13) (0.03 - 0.05)
0.79 0.56 0.17 0.09 0.06(0.42 - 1.20) (0.33 - 0.86) (0.10 - 0.28) (0.06 - 0.16) (0.05 - 0.08)
6.1 5.2 3.1 2.7 2.0(2.1 - 11.0) (1.5 - 9.7) (1.1 - 5.5) (1.0 - 5.2) (0.7 - 3.8)
16.3 9.2 6.1 2.4 2.6(2.1 - 71.0) (0.8 - 71.0) (0.5 - 55.0) (0.9 - 10.6) (0.7 - 12.2)
3600 820 81 480 660(70 - 37000) (21 - 7400) (20 - 690) (74 - 2100) (390 - 1200)
5300 1300 140 770 1100(170 - 39000) (43 - 7900) (35 - 800) (180 - 4800) (450 - 2800)
Outer Deep BayInner Deep Bay
Temperature (°C)
Faecal Coliforms (cfu/100mL)
E. coli (cfu/100mL)
Chlorophy ll-a (µg/L)
5-day Biochemical Ox y gen Demand (mg/L)
Orthophosphate Phosphorus (mg/L)
Total Inorganic Nitrogen (mg/L)
Unionised Ammonia (mg/L)
Total Phosphorus (mg/L)
Silica (as SiO2) (mg/L)
Bottom
Bottom
Total Kjeldahl Nitrogen (mg/L)
Total Nitrogen (mg/L)
Secchi Disc Depth (m)
Turbidity (NTU)
Suspended Solids (mg/L)
Nitrite Nitrogen (mg/L)
Nitrate Nitrogen (mg/L)
Salinity
Dissolv ed Ox y gen (mg/L)
Dissolv ed Ox y gen (% Saturation)
pH
Ammonia Nitrogen (mg/L)
DEEP BAY WCZ
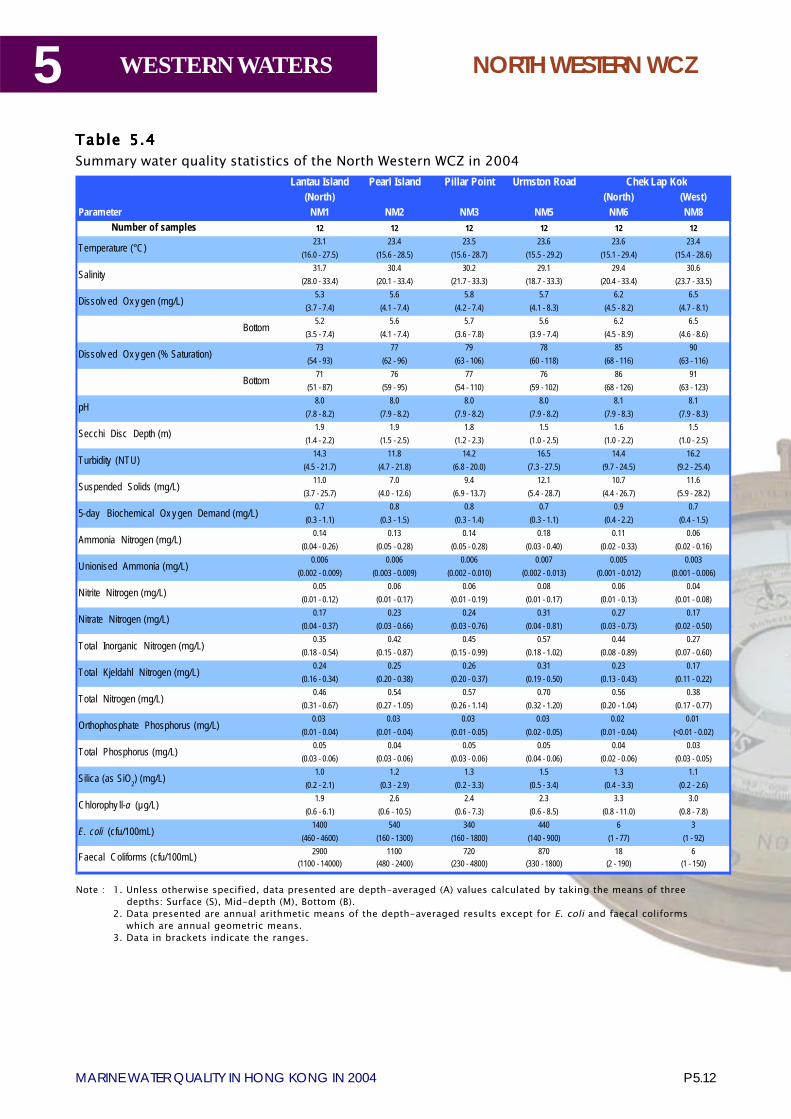
5
P 5.12MARINE WATER QUALITY IN HONG KONG IN 2004
WESTERN WATERS
Table Table Table Table Table 55555.....44444Summary water quality statistics of the North Western WCZ in 2004
Note : 1. Unless otherwise specified, data presented are depth-averaged (A) values calculated by taking the means of threedepths: Surface (S), Mid-depth (M), Bottom (B).
2. Data presented are annual arithmetic means of the depth-averaged results except for E. coli and faecal coliformswhich are annual geometric means.
3. Data in brackets indicate the ranges.
Lantau Island Pearl Island Pillar Point Urmston Road(North) (North) (West)
Parameter NM1 NM2 NM3 NM5 NM6 NM8Number of samples 12 12 12 12 12 12
23.1 23.4 23.5 23.6 23.6 23.4(16.0 - 27.5) (15.6 - 28.5) (15.6 - 28.7) (15.5 - 29.2) (15.1 - 29.4) (15.4 - 28.6)
31.7 30.4 30.2 29.1 29.4 30.6(28.0 - 33.4) (20.1 - 33.4) (21.7 - 33.3) (18.7 - 33.3) (20.4 - 33.4) (23.7 - 33.5)
5.3 5.6 5.8 5.7 6.2 6.5(3.7 - 7.4) (4.1 - 7.4) (4.2 - 7.4) (4.1 - 8.3) (4.5 - 8.2) (4.7 - 8.1)
5.2 5.6 5.7 5.6 6.2 6.5(3.5 - 7.4) (4.1 - 7.4) (3.6 - 7.8) (3.9 - 7.4) (4.5 - 8.9) (4.6 - 8.6)
73 77 79 78 85 90(54 - 93) (62 - 96) (63 - 106) (60 - 118) (68 - 116) (63 - 116)
71 76 77 76 86 91(51 - 87) (59 - 95) (54 - 110) (59 - 102) (68 - 126) (63 - 123)
8.0 8.0 8.0 8.0 8.1 8.1(7.8 - 8.2) (7.9 - 8.2) (7.9 - 8.2) (7.9 - 8.2) (7.9 - 8.3) (7.9 - 8.3)
1.9 1.9 1.8 1.5 1.6 1.5(1.4 - 2.2) (1.5 - 2.5) (1.2 - 2.3) (1.0 - 2.5) (1.0 - 2.2) (1.0 - 2.5)
14.3 11.8 14.2 16.5 14.4 16.2(4.5 - 21.7) (4.7 - 21.8) (6.8 - 20.0) (7.3 - 27.5) (9.7 - 24.5) (9.2 - 25.4)
11.0 7.0 9.4 12.1 10.7 11.6(3.7 - 25.7) (4.0 - 12.6) (6.9 - 13.7) (5.4 - 28.7) (4.4 - 26.7) (5.9 - 28.2)
0.7 0.8 0.8 0.7 0.9 0.7(0.3 - 1.1) (0.3 - 1.5) (0.3 - 1.4) (0.3 - 1.1) (0.4 - 2.2) (0.4 - 1.5)
0.14 0.13 0.14 0.18 0.11 0.06(0.04 - 0.26) (0.05 - 0.28) (0.05 - 0.28) (0.03 - 0.40) (0.02 - 0.33) (0.02 - 0.16)
0.006 0.006 0.006 0.007 0.005 0.003(0.002 - 0.009) (0.003 - 0.009) (0.002 - 0.010) (0.002 - 0.013) (0.001 - 0.012) (0.001 - 0.006)
0.05 0.06 0.06 0.08 0.06 0.04(0.01 - 0.12) (0.01 - 0.17) (0.01 - 0.19) (0.01 - 0.17) (0.01 - 0.13) (0.01 - 0.08)
0.17 0.23 0.24 0.31 0.27 0.17(0.04 - 0.37) (0.03 - 0.66) (0.03 - 0.76) (0.04 - 0.81) (0.03 - 0.73) (0.02 - 0.50)
0.35 0.42 0.45 0.57 0.44 0.27(0.18 - 0.54) (0.15 - 0.87) (0.15 - 0.99) (0.18 - 1.02) (0.08 - 0.89) (0.07 - 0.60)
0.24 0.25 0.26 0.31 0.23 0.17(0.16 - 0.34) (0.20 - 0.38) (0.20 - 0.37) (0.19 - 0.50) (0.13 - 0.43) (0.11 - 0.22)
0.46 0.54 0.57 0.70 0.56 0.38(0.31 - 0.67) (0.27 - 1.05) (0.26 - 1.14) (0.32 - 1.20) (0.20 - 1.04) (0.17 - 0.77)
0.03 0.03 0.03 0.03 0.02 0.01(0.01 - 0.04) (0.01 - 0.04) (0.01 - 0.05) (0.02 - 0.05) (0.01 - 0.04) (<0.01 - 0.02)
0.05 0.04 0.05 0.05 0.04 0.03(0.03 - 0.06) (0.03 - 0.06) (0.03 - 0.06) (0.04 - 0.06) (0.02 - 0.06) (0.03 - 0.05)
1.0 1.2 1.3 1.5 1.3 1.1(0.2 - 2.1) (0.3 - 2.9) (0.2 - 3.3) (0.5 - 3.4) (0.4 - 3.3) (0.2 - 2.6)
1.9 2.6 2.4 2.3 3.3 3.0(0.6 - 6.1) (0.6 - 10.5) (0.6 - 7.3) (0.6 - 8.5) (0.8 - 11.0) (0.8 - 7.8)
1400 540 340 440 6 3(460 - 4600) (160 - 1300) (160 - 1800) (140 - 900) (1 - 77) (1 - 92)
2900 1100 720 870 18 6(1100 - 14000) (480 - 2400) (230 - 4800) (330 - 1800) (2 - 190) (1 - 150)
Chek Lap Kok
Bottom
Bottom
Total Phosphorus (mg/L)
Temperature (°C)
Salinity
Dissolv ed Ox y gen (mg/L)
Dissolv ed Ox y gen (% Saturation)
Silica (as SiO2) (mg/L)
pH
Total Kjeldahl Nitrogen (mg/L)
Total Nitrogen (mg/L)
Secchi Disc Depth (m)
Turbidity (NTU)
Suspended Solids (mg/L)
Faecal Coliforms (cfu/100mL)
E. coli (cfu/100mL)
Chlorophy ll-a (µg/L)
5-day Biochemical Ox y gen Demand (mg/L)
Orthophosphate Phosphorus (mg/L)
Total Inorganic Nitrogen (mg/L)
Unionised Ammonia (mg/L)
Nitrite Nitrogen (mg/L)
Nitrate Nitrogen (mg/L)
Ammonia Nitrogen (mg/L)
NORTH WESTERN WCZ

6
P 6.2MARINE WATER QUALITY IN HONG KONG IN 2004
SEDIMENT QUALITY
Chapter 6 – Sediment
6.1 Sediments in the sea bottom are often regarded as the ultimate sink of pollutants in themarine environment. They are also an important habitat for a variety of marine life, includingecologically and commercially important species. The organic and inorganic pollutants accumulatedin sediments may pose a potential threat to marine organisms and human health, and therefore needto be monitored regularly.
6.2 In 2004, the Environmental Protection Department(EPD) monitored marine sediments twice, at 45 stations in openwaters (Figure 1.3) and 15 stations in typhoons shelters (Figure 1.4). Sediment samples were collected using a grab sampler. Fieldmeasurements, e.g. electrochemical potential, were done on boardthe monitoring vessel and laboratory tests were conducted on over60 physical, chemical and biological parameters (Table 1.3). Asummary of the marine sediment quality in the territory in the past 5 years (2000–2004) is shownin Tables 6.1–6.6.
6.3 The marine sediments in Hong Kong consist mainly of silt. The sediments in the easternwaters, in particular the deeper and inshore water of Mirs Bay, are of a finer consistency, with90% (w/w) of the sediment particles below the size of 63µm (Figure 6.1). In areas with strongercurrents such as the North Western water and Victoria Harbour, the sediment particles are coarserand only about 40-80% of the particles are smaller than 63µm.
6.4 The marine sediments in Hong Kong are generally anoxic, i.e. with negativeelectrochemical potential. Highly anoxic sediments (below -300mV) were found in the VictoriaHarbour WCZ (-326mV to -363mV), inner Mirs Bay, i.e. Double Haven and Crooked Harbour
(-326mV to -358mV), and Tolo Harbour (-310mV to -324mV) asshown in Figure 6.2. The low electrochemical potential in VictoriaHarbour was mainly related to organic deposition from effluentdischarges. Double Haven and Crooked Harbour in Mirs Bay andTolo Harbour had many fish culture zones (Figure 1.6). Sedimentsin these areas were subject to the long-term effects of organicpollution from fish excreta, fishfeed and other sources.
6.5 In assessing contamination of marine sediments by contaminants, guideline values in the‘Environment, Transport and Work Bureau Technical Circular ETWB(W) No. 34/2002 -
iwp12
印章
iwp12
印章
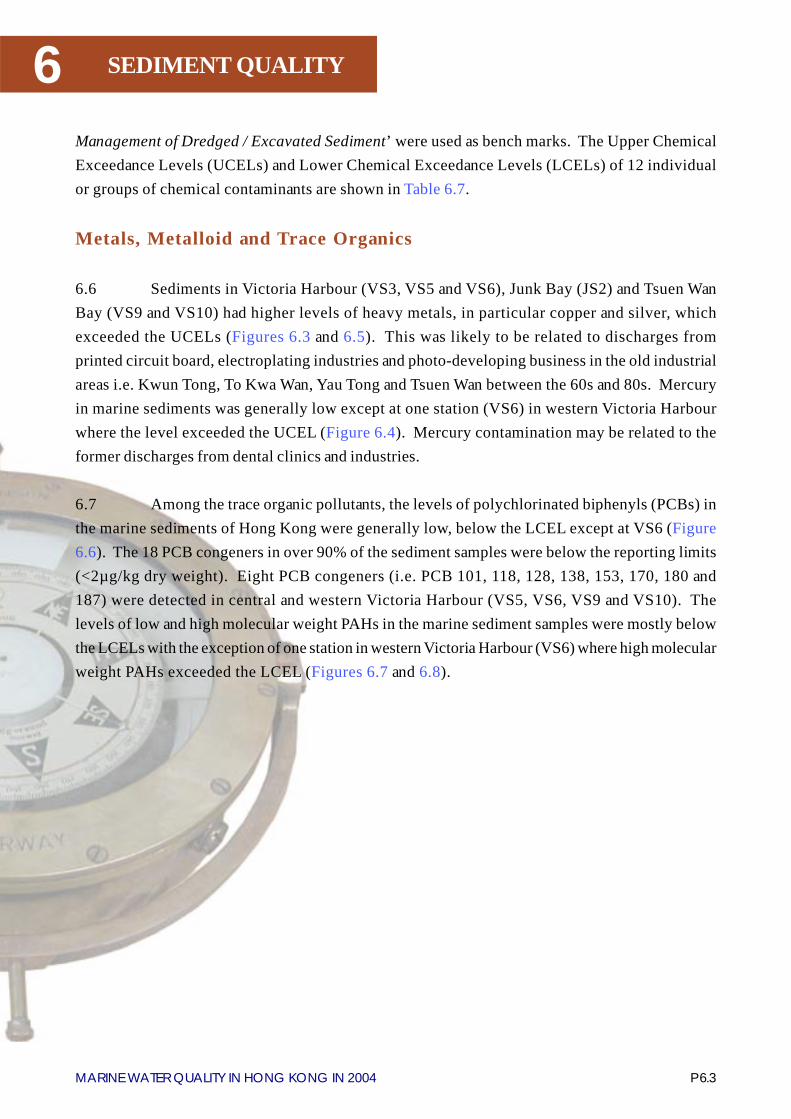
P 6.3MARINE WATER QUALITY IN HONG KONG IN 2004
6 SEDIMENT QUALITY
Management of Dredged / Excavated Sediment’ were used as bench marks. The Upper ChemicalExceedance Levels (UCELs) and Lower Chemical Exceedance Levels (LCELs) of 12 individualor groups of chemical contaminants are shown in Table 6.7.
Metals, Metalloid and Trace Organics
6.6 Sediments in Victoria Harbour (VS3, VS5 and VS6), Junk Bay (JS2) and Tsuen WanBay (VS9 and VS10) had higher levels of heavy metals, in particular copper and silver, whichexceeded the UCELs (Figures 6.3 and 6.5). This was likely to be related to discharges fromprinted circuit board, electroplating industries and photo-developing business in the old industrialareas i.e. Kwun Tong, To Kwa Wan, Yau Tong and Tsuen Wan between the 60s and 80s. Mercuryin marine sediments was generally low except at one station (VS6) in western Victoria Harbourwhere the level exceeded the UCEL (Figure 6.4). Mercury contamination may be related to theformer discharges from dental clinics and industries.
6.7 Among the trace organic pollutants, the levels of polychlorinated biphenyls (PCBs) inthe marine sediments of Hong Kong were generally low, below the LCEL except at VS6 (Figure6.6). The 18 PCB congeners in over 90% of the sediment samples were below the reporting limits(<2µg/kg dry weight). Eight PCB congeners (i.e. PCB 101, 118, 128, 138, 153, 170, 180 and187) were detected in central and western Victoria Harbour (VS5, VS6, VS9 and VS10). Thelevels of low and high molecular weight PAHs in the marine sediment samples were mostly belowthe LCELs with the exception of one station in western Victoria Harbour (VS6) where high molecularweight PAHs exceeded the LCEL (Figures 6.7 and 6.8).
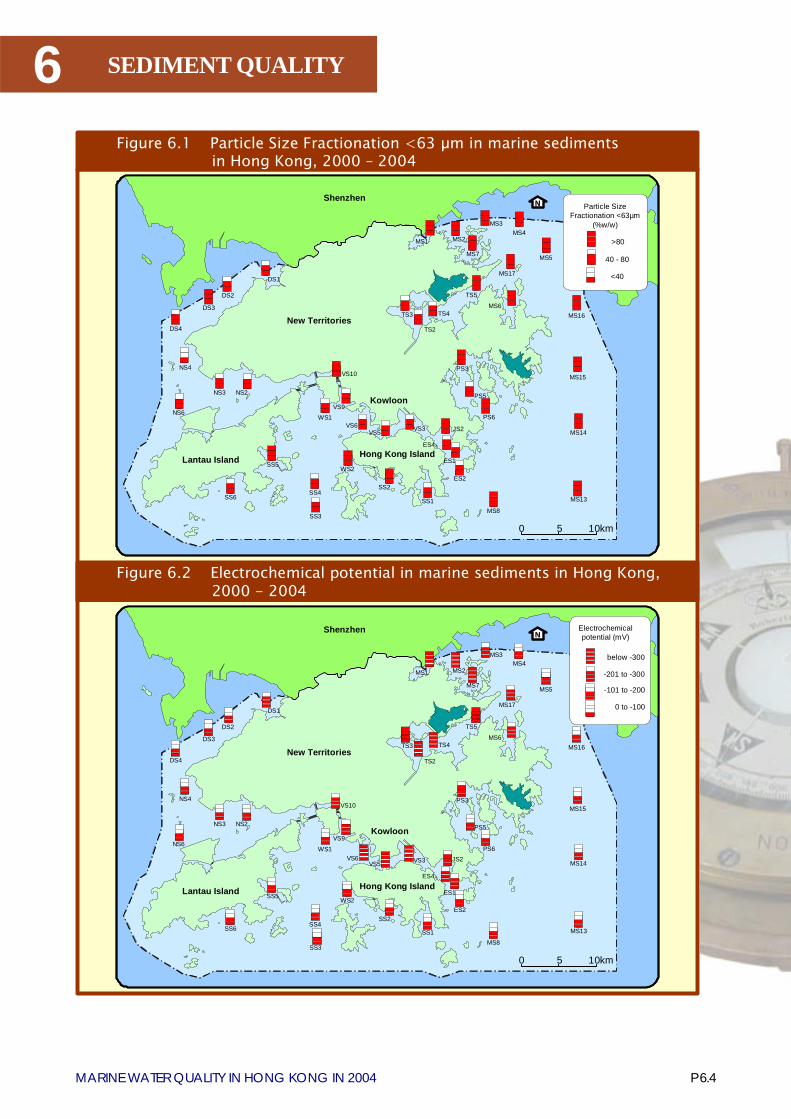
6
P 6.4MARINE WATER QUALITY IN HONG KONG IN 2004
SEDIMENT QUALITY
Figure 6.1 Particle Size Fractionation <63 µm in marine sedimentsin Hong Kong, 2000 – 2004
Figure 6.2 Electrochemical potential in marine sediments in Hong Kong,2000 - 2004
0 5 10km
DS1
DS2
DS3
DS4
NS4
NS3
NS6
NS2
WS1
WS2SS5
SS6SS4
SS3
SS2
SS1
VS10
VS9
VS6VS5 VS3
ES1
ES2
MS8
MS13
MS14
PS6
PS5
PS3
TS2
TS3 TS4
TS5
MS16
MS15
MS17
MS7 MS5
MS4MS2
MS3
MS1
N
JS2
ES4
MS6
Shenzhen
New Territories
Lantau Island Hong Kong Island
Particle Size Fractionation <63µm
(%w/w)
>80
40 - 80
<40
Kowloon
0 5 10km
DS1
DS2
DS3
DS4
NS4
NS3
NS6
NS2
WS1
WS2SS5
SS6SS4
SS3
SS2
SS1
VS10
VS9
VS6VS5 VS3
ES1
ES2
MS8
MS13
MS14
PS6
PS5
PS3
TS2
TS3 TS4
TS5
MS16
MS15
MS17
MS7 MS5
MS4MS2
MS3
MS1
N
JS2
ES4
MS6
Shenzhen
New Territories
Lantau Island Hong Kong Island
Electrochemical potential (mV)
below -300
0 to -100
-201 to -300
-101 to -200
Kowloon

P 6.5MARINE WATER QUALITY IN HONG KONG IN 2004
6 SEDIMENT QUALITY
0 5 10km
DS1
DS2
DS3
DS4
NS4
NS3
NS6
NS2
WS1
WS2SS5
SS6SS4
SS3
SS2
SS1
VS10
VS9
VS6VS5 VS3
ES1
ES2
MS8
MS13
MS14
PS6
PS5
PS3
TS2
TS3 TS4
TS5
MS16
MS15
MS17
MS7 MS5
MS4MS2
MS3
MS1
N
JS2
ES4
MS6
Shenzhen
New Territories
Lantau Island Hong Kong Island
Copper(mg/kg dry weight)
>110
66 - 110
0 - 65
Kowloon
0 5 10km
DS1
DS2
DS3
DS4
NS4
NS3
NS6
NS2
WS1
WS2SS5
SS6 SS4
SS3
SS2
SS1
VS10
VS9
VS6VS5 VS3
ES1
ES2
MS8MS13
MS14
PS6
PS5
PS3
TS2
TS3 TS4
TS5
MS16
MS15
MS17
MS7 MS5
MS4MS2
MS3
MS1
N
JS2
ES4
MS6
Shenzhen
New Territories
Lantau Island Hong Kong Island
Mercury(mg/kg dry weight)
>1.0
0.6 - 1.0
0.0 - 0.5
Kowloon
Figure 6.4 Mercury in marine sediments in Hong Kong, 2000 - 2004
Figure 6.3 Copper in marine sediments in Hong Kong, 2000 - 2004
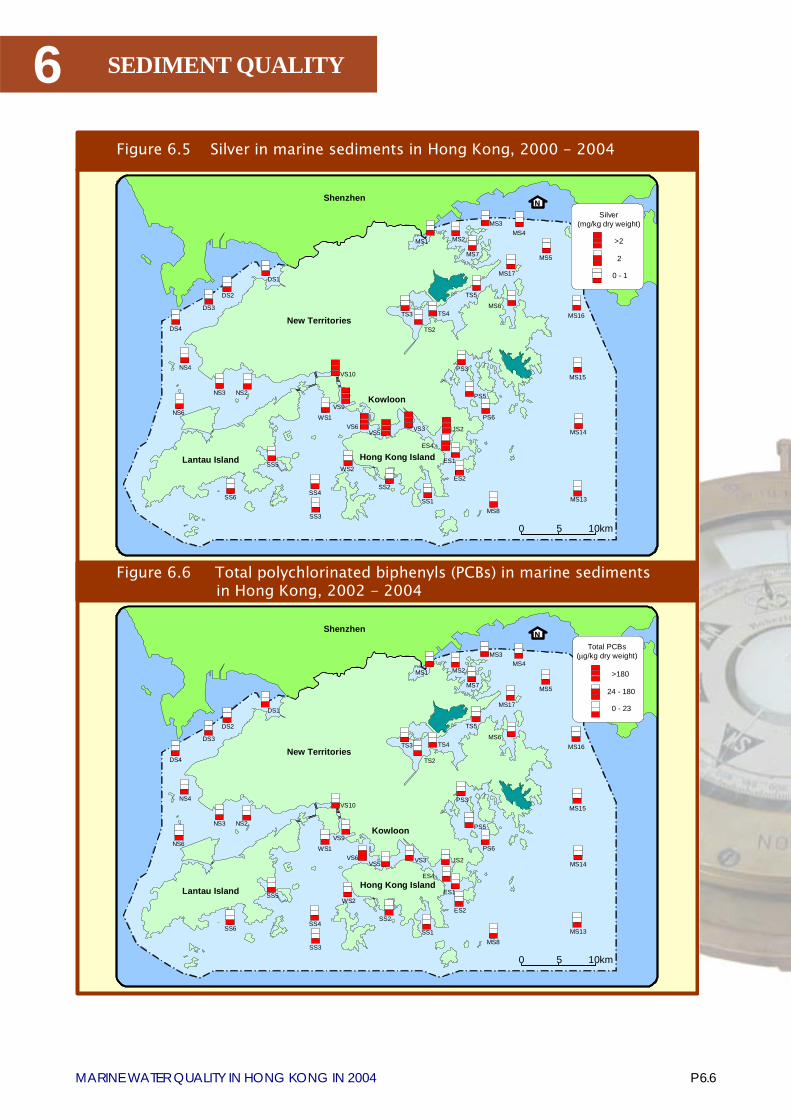
6
P 6.6MARINE WATER QUALITY IN HONG KONG IN 2004
SEDIMENT QUALITY
0 5 10km
DS1
DS2
DS3
DS4
NS4
NS3
NS6
NS2
WS1
WS2SS5
SS6SS4
SS3
SS2
SS1
VS10
VS9
VS6VS5 VS3
ES1
ES2
MS8
MS13
MS14
PS6
PS5
PS3
TS2
TS3 TS4
TS5
MS16
MS15
MS17
MS7 MS5
MS4MS2
MS3
MS1
N
JS2
ES4
MS6
Shenzhen
New Territories
Lantau Island Hong Kong Island
Silver(mg/kg dry weight)
>2
2
0 - 1
Kowloon
Figure 6.5 Silver in marine sediments in Hong Kong, 2000 - 2004
Figure 6.6 Total polychlorinated biphenyls (PCBs) in marine sediments in Hong Kong, 2002 - 2004
0 5 10km
DS1
DS2
DS3
DS4
NS4
NS3
NS6
NS2
WS1
WS2SS5
SS6SS4
SS3
SS2
SS1
VS10
VS9
VS6VS5 VS3
ES1
ES2
MS8MS13
MS14
PS6
PS5
PS3
TS2
TS3 TS4
TS5
MS16
MS15
MS17
MS7 MS5
MS4MS2
MS3
MS1
N
JS2
ES4
MS6
Shenzhen
New Territories
Lantau Island Hong Kong Island
Total PCBs(μg/kg dry weight)
>180
24 - 180
0 - 23
Kowloon
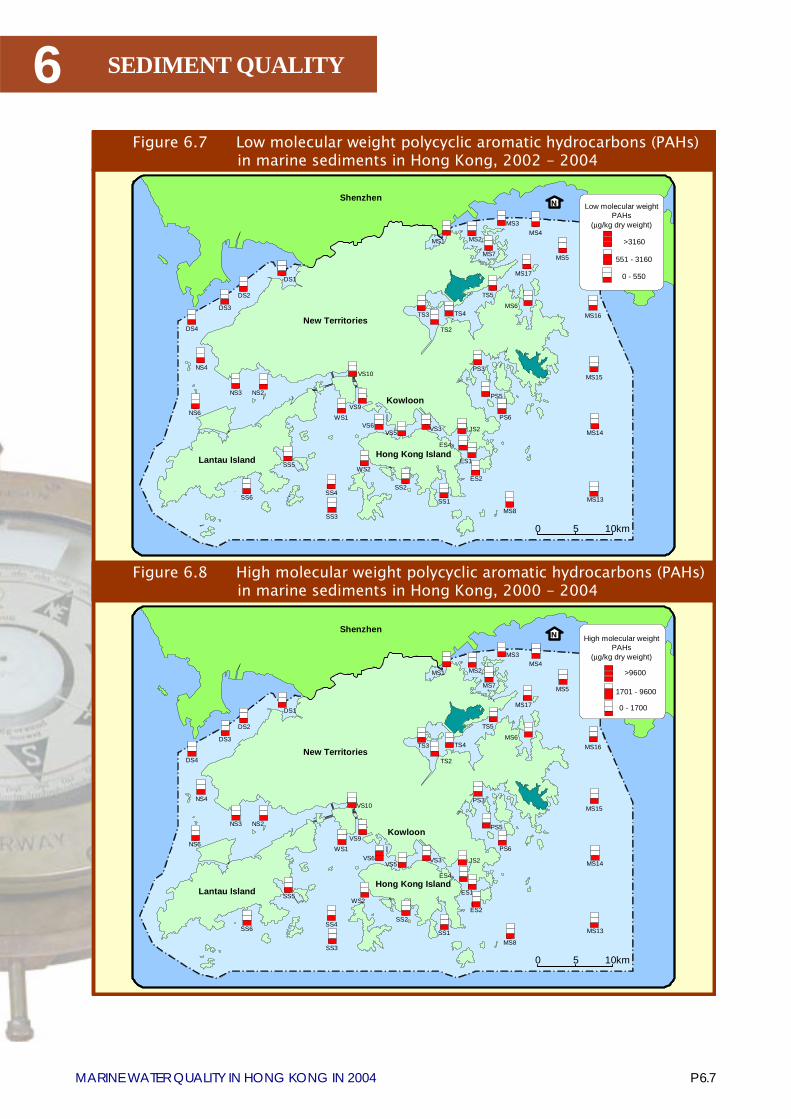
P 6.7MARINE WATER QUALITY IN HONG KONG IN 2004
6 SEDIMENT QUALITY
0 5 10km
DS1
DS2
DS3
DS4
NS4
NS3
NS6
NS2
WS1
WS2SS5
SS6SS4
SS3
SS2
SS1
VS10
VS9
VS6VS5 VS3
ES1
ES2
MS8
MS13
MS14
PS6
PS5
PS3
TS2
TS3 TS4
TS5
MS16
MS15
MS17
MS7 MS5
MS4MS2
MS3
MS1
N
JS2
ES4
MS6
Shenzhen
New Territories
Lantau Island Hong Kong Island
Low molecular weight PAHs
(μg/kg dry weight)
>3160
551 - 3160
0 - 550
Kowloon
0 5 10km
DS1
DS2
DS3
DS4
NS4
NS3
NS6
NS2
WS1
WS2SS5
SS6SS4
SS3
SS2
SS1
VS10
VS9
VS6VS5 VS3
ES1
ES2
MS8
MS13
MS14
PS6
PS5
PS3
TS2
TS3 TS4
TS5
MS16
MS15
MS17
MS7 MS5
MS4MS2
MS3
MS1
N
JS2
ES4
MS6
Shenzhen
New Territories
Lantau IslandHong Kong Island
High molecular weight PAHs
(μg/kg dry weight)
>9600
0 - 1700
1701 - 9600
Kowloon
Figure 6.8 High molecular weight polycyclic aromatic hydrocarbons (PAHs)in marine sediments in Hong Kong, 2000 - 2004
Figure 6.7 Low molecular weight polycyclic aromatic hydrocarbons (PAHs)in marine sediments in Hong Kong, 2002 - 2004
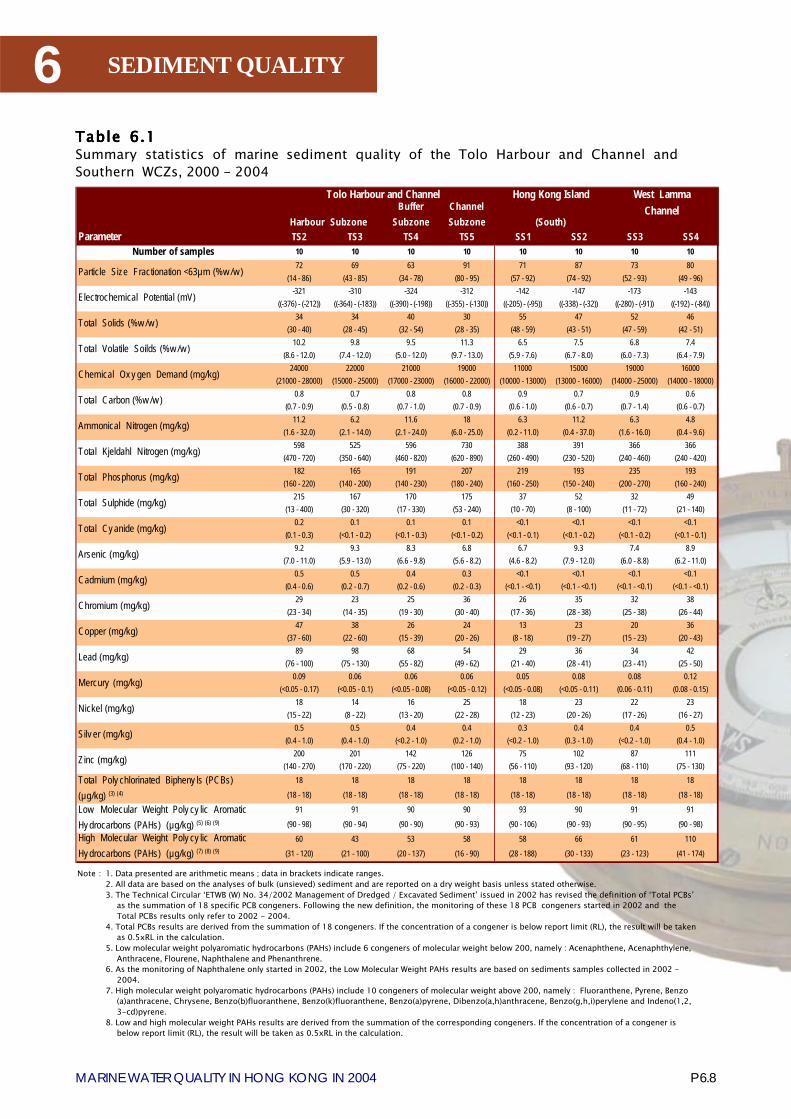
6
P 6.8MARINE WATER QUALITY IN HONG KONG IN 2004
SEDIMENT QUALITY
BufferSubzone
ChannelSubzone
Parameter TS2 TS3 TS4 TS5 SS1 SS2 SS3 SS4Number of samples 10 10 10 10 10 10 10 10
72 69 63 91 71 87 73 80(14 - 86) (43 - 85) (34 - 78) (80 - 95) (57 - 92) (74 - 92) (52 - 93) (49 - 96)
-321 -310 -324 -312 -142 -147 -173 -143((-376) - (-212)) ((-364) - (-183)) ((-390) - (-198)) ((-355) - (-130)) ((-205) - (-95)) ((-338) - (-32)) ((-280) - (-91)) ((-192) - (-84))
34 34 40 30 55 47 52 46(30 - 40) (28 - 45) (32 - 54) (28 - 35) (48 - 59) (43 - 51) (47 - 59) (42 - 51)
10.2 9.8 9.5 11.3 6.5 7.5 6.8 7.4(8.6 - 12.0) (7.4 - 12.0) (5.0 - 12.0) (9.7 - 13.0) (5.9 - 7.6) (6.7 - 8.0) (6.0 - 7.3) (6.4 - 7.9)
24000 22000 21000 19000 11000 15000 19000 16000(21000 - 28000) (15000 - 25000) (17000 - 23000) (16000 - 22000) (10000 - 13000) (13000 - 16000) (14000 - 25000) (14000 - 18000)
0.8 0.7 0.8 0.8 0.9 0.7 0.9 0.6(0.7 - 0.9) (0.5 - 0.8) (0.7 - 1.0) (0.7 - 0.9) (0.6 - 1.0) (0.6 - 0.7) (0.7 - 1.4) (0.6 - 0.7)
11.2 6.2 11.6 18 6.3 11.2 6.3 4.8(1.6 - 32.0) (2.1 - 14.0) (2.1 - 24.0) (6.0 - 25.0) (0.2 - 11.0) (0.4 - 37.0) (1.6 - 16.0) (0.4 - 9.6)
598 525 596 730 388 391 366 366(470 - 720) (350 - 640) (460 - 820) (620 - 890) (260 - 490) (230 - 520) (240 - 460) (240 - 420)
182 165 191 207 219 193 235 193(160 - 220) (140 - 200) (140 - 230) (180 - 240) (160 - 250) (150 - 240) (200 - 270) (160 - 240)
215 167 170 175 37 52 32 49(13 - 400) (30 - 320) (17 - 330) (53 - 240) (10 - 70) (8 - 100) (11 - 72) (21 - 140)
0.2 0.1 0.1 0.1 <0.1 <0.1 <0.1 <0.1(0.1 - 0.3) (<0.1 - 0.2) (<0.1 - 0.3) (<0.1 - 0.2) (<0.1 - 0.1) (<0.1 - 0.2) (<0.1 - 0.2) (<0.1 - 0.1)
9.2 9.3 8.3 6.8 6.7 9.3 7.4 8.9(7.0 - 11.0) (5.9 - 13.0) (6.6 - 9.8) (5.6 - 8.2) (4.6 - 8.2) (7.9 - 12.0) (6.0 - 8.8) (6.2 - 11.0)
0.5 0.5 0.4 0.3 <0.1 <0.1 <0.1 <0.1(0.4 - 0.6) (0.2 - 0.7) (0.2 - 0.6) (0.2 - 0.3) (<0.1 - <0.1) (<0.1 - <0.1) (<0.1 - <0.1) (<0.1 - <0.1)
29 23 25 36 26 35 32 38(23 - 34) (14 - 35) (19 - 30) (30 - 40) (17 - 36) (28 - 38) (25 - 38) (26 - 44)
47 38 26 24 13 23 20 36(37 - 60) (22 - 60) (15 - 39) (20 - 26) (8 - 18) (19 - 27) (15 - 23) (20 - 43)
89 98 68 54 29 36 34 42(76 - 100) (75 - 130) (55 - 82) (49 - 62) (21 - 40) (28 - 41) (23 - 41) (25 - 50)
0.09 0.06 0.06 0.06 0.05 0.08 0.08 0.12(<0.05 - 0.17) (<0.05 - 0.1) (<0.05 - 0.08) (<0.05 - 0.12) (<0.05 - 0.08) (<0.05 - 0.11) (0.06 - 0.11) (0.08 - 0.15)
18 14 16 25 18 23 22 23(15 - 22) (8 - 22) (13 - 20) (22 - 28) (12 - 23) (20 - 26) (17 - 26) (16 - 27)
0.5 0.5 0.4 0.4 0.3 0.4 0.4 0.5(0.4 - 1.0) (0.4 - 1.0) (<0.2 - 1.0) (0.2 - 1.0) (<0.2 - 1.0) (0.3 - 1.0) (<0.2 - 1.0) (0.4 - 1.0)
200 201 142 126 75 102 87 111(140 - 270) (170 - 220) (75 - 220) (100 - 140) (56 - 110) (93 - 120) (68 - 110) (75 - 130)
18 18 18 18 18 18 18 18
(18 - 18) (18 - 18) (18 - 18) (18 - 18) (18 - 18) (18 - 18) (18 - 18) (18 - 18)
91 91 90 90 93 90 91 91
(90 - 98) (90 - 94) (90 - 90) (90 - 93) (90 - 106) (90 - 93) (90 - 95) (90 - 98)
60 43 53 58 58 66 61 110
(31 - 120) (21 - 100) (20 - 137) (16 - 90) (28 - 188) (30 - 133) (23 - 123) (41 - 174)
West LammaChannel
Tolo Harbour and Channel
Harbour Subzone
Hong Kong Island
(South)
Mercury (mg/kg)
Nickel (mg/kg)
Cadmium (mg/kg)
Chromium (mg/kg)
Copper (mg/kg)
Lead (mg/kg)
Particle Size Fractionation <63µm (%w /w )
Electrochemical Potential (mV)
Total Solids (%w /w )
Total Kjeldahl Nitrogen (mg/kg)
Ammonical Nitrogen (mg/kg)
Total Volatile Soilds (%w /w )
Total Carbon (%w /w )
High Molecular Weight Poly cy lic AromaticHy drocarbons (PAHs) (µg/kg) (7) (8) (9)
Low Molecular Weight Poly cy lic AromaticHy drocarbons (PAHs) (µg/kg) (5) (6) (9)
Chemical Ox y gen Demand (mg/kg)
Total Phosphorus (mg/kg)
Total Sulphide (mg/kg)
Arsenic (mg/kg)
Silv er (mg/kg)
Total Cy anide (mg/kg)
Zinc (mg/kg)
Total Poly chlorinated Bipheny ls (PCBs)(µg/kg) (3) (4)
Table Table Table Table Table 6.16.16.16.16.1Summary statistics of marine sediment quality of the Tolo Harbour and Channel andSouthern WCZs, 2000 - 2004
Note : 1. Data presented are arithmetic means ; data in brackets indicate ranges.2. All data are based on the analyses of bulk (unsieved) sediment and are reported on a dry weight basis unless stated otherwise.3. The Technical Circular �ETWB (W) No. 34/2002 Management of Dredged / Excavated Sediment� issued in 2002 has revised the definition of �Total PCBs�
as the summation of 18 specific PCB congeners. Following the new definition, the monitoring of these 18 PCB congeners started in 2002 and theTotal PCBs results only refer to 2002 - 2004.
4. Total PCBs results are derived from the summation of 18 congeners. If the concentration of a congener is below report limit (RL), the result will be takenas 0.5xRL in the calculation.
5. Low molecular weight polyaromatic hydrocarbons (PAHs) include 6 congeners of molecular weight below 200, namely : Acenaphthene, Acenaphthylene,Anthracene, Flourene, Naphthalene and Phenanthrene.
6. As the monitoring of Naphthalene only started in 2002, the Low Molecular Weight PAHs results are based on sediments samples collected in 2002 -2004.
7. High molecular weight polyaromatic hydrocarbons (PAHs) include 10 congeners of molecular weight above 200, namely : Fluoranthene, Pyrene, Benzo(a)anthracene, Chrysene, Benzo(b)fluoranthene, Benzo(k)fluoranthene, Benzo(a)pyrene, Dibenzo(a,h)anthracene, Benzo(g,h,i)perylene and Indeno(1,2,3-cd)pyrene.
8. Low and high molecular weight PAHs results are derived from the summation of the corresponding congeners. If the concentration of a congener isbelow report limit (RL), the result will be taken as 0.5xRL in the calculation.
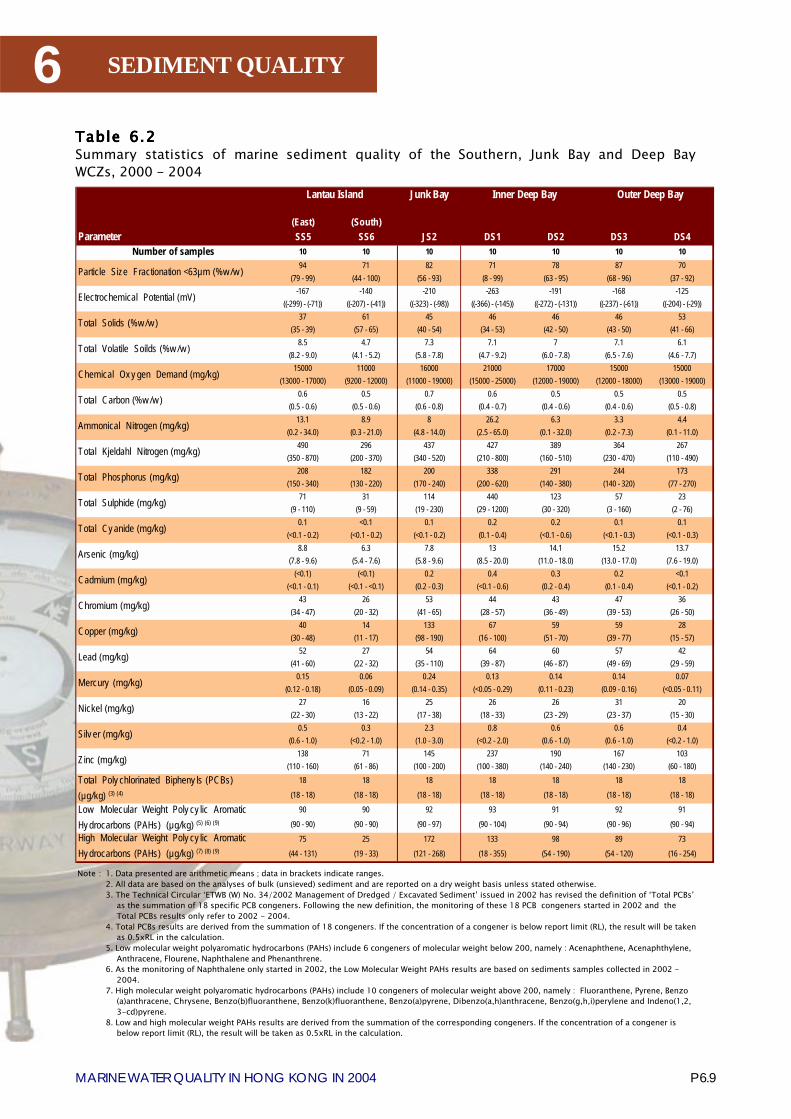
P 6.9MARINE WATER QUALITY IN HONG KONG IN 2004
6 SEDIMENT QUALITY
Junk Bay
(East) (South)Parameter SS5 SS6 JS2 DS1 DS2 DS3 DS4
Number of samples 10 10 10 10 10 10 1094 71 82 71 78 87 70
(79 - 99) (44 - 100) (56 - 93) (8 - 99) (63 - 95) (68 - 96) (37 - 92)-167 -140 -210 -263 -191 -168 -125
((-299) - (-71)) ((-207) - (-41)) ((-323) - (-98)) ((-366) - (-145)) ((-272) - (-131)) ((-237) - (-61)) ((-204) - (-29))37 61 45 46 46 46 53
(35 - 39) (57 - 65) (40 - 54) (34 - 53) (42 - 50) (43 - 50) (41 - 66)8.5 4.7 7.3 7.1 7 7.1 6.1
(8.2 - 9.0) (4.1 - 5.2) (5.8 - 7.8) (4.7 - 9.2) (6.0 - 7.8) (6.5 - 7.6) (4.6 - 7.7)15000 11000 16000 21000 17000 15000 15000
(13000 - 17000) (9200 - 12000) (11000 - 19000) (15000 - 25000) (12000 - 19000) (12000 - 18000) (13000 - 19000)0.6 0.5 0.7 0.6 0.5 0.5 0.5
(0.5 - 0.6) (0.5 - 0.6) (0.6 - 0.8) (0.4 - 0.7) (0.4 - 0.6) (0.4 - 0.6) (0.5 - 0.8)13.1 8.9 8 26.2 6.3 3.3 4.4
(0.2 - 34.0) (0.3 - 21.0) (4.8 - 14.0) (2.5 - 65.0) (0.1 - 32.0) (0.2 - 7.3) (0.1 - 11.0)490 296 437 427 389 364 267
(350 - 870) (200 - 370) (340 - 520) (210 - 800) (160 - 510) (230 - 470) (110 - 490)208 182 200 338 291 244 173
(150 - 340) (130 - 220) (170 - 240) (200 - 620) (140 - 380) (140 - 320) (77 - 270)71 31 114 440 123 57 23
(9 - 110) (9 - 59) (19 - 230) (29 - 1200) (30 - 320) (3 - 160) (2 - 76)0.1 <0.1 0.1 0.2 0.2 0.1 0.1
(<0.1 - 0.2) (<0.1 - 0.2) (<0.1 - 0.2) (0.1 - 0.4) (<0.1 - 0.6) (<0.1 - 0.3) (<0.1 - 0.3)8.8 6.3 7.8 13 14.1 15.2 13.7
(7.8 - 9.6) (5.4 - 7.6) (5.8 - 9.6) (8.5 - 20.0) (11.0 - 18.0) (13.0 - 17.0) (7.6 - 19.0)(<0.1) (<0.1) 0.2 0.4 0.3 0.2 <0.1
(<0.1 - 0.1) (<0.1 - <0.1) (0.2 - 0.3) (<0.1 - 0.6) (0.2 - 0.4) (0.1 - 0.4) (<0.1 - 0.2)43 26 53 44 43 47 36
(34 - 47) (20 - 32) (41 - 65) (28 - 57) (36 - 49) (39 - 53) (26 - 50)40 14 133 67 59 59 28
(30 - 48) (11 - 17) (98 - 190) (16 - 100) (51 - 70) (39 - 77) (15 - 57)52 27 54 64 60 57 42
(41 - 60) (22 - 32) (35 - 110) (39 - 87) (46 - 87) (49 - 69) (29 - 59)0.15 0.06 0.24 0.13 0.14 0.14 0.07
(0.12 - 0.18) (0.05 - 0.09) (0.14 - 0.35) (<0.05 - 0.29) (0.11 - 0.23) (0.09 - 0.16) (<0.05 - 0.11)27 16 25 26 26 31 20
(22 - 30) (13 - 22) (17 - 38) (18 - 33) (23 - 29) (23 - 37) (15 - 30)0.5 0.3 2.3 0.8 0.6 0.6 0.4
(0.6 - 1.0) (<0.2 - 1.0) (1.0 - 3.0) (<0.2 - 2.0) (0.6 - 1.0) (0.6 - 1.0) (<0.2 - 1.0)138 71 145 237 190 167 103
(110 - 160) (61 - 86) (100 - 200) (100 - 380) (140 - 240) (140 - 230) (60 - 180)18 18 18 18 18 18 18
(18 - 18) (18 - 18) (18 - 18) (18 - 18) (18 - 18) (18 - 18) (18 - 18)
90 90 92 93 91 92 91
(90 - 90) (90 - 90) (90 - 97) (90 - 104) (90 - 94) (90 - 96) (90 - 94)
75 25 172 133 98 89 73
(44 - 131) (19 - 33) (121 - 268) (18 - 355) (54 - 190) (54 - 120) (16 - 254)
Mercury (mg/kg)
Nickel (mg/kg)
Cadmium (mg/kg)
Chromium (mg/kg)
Copper (mg/kg)
Lead (mg/kg)
Total Cy anide (mg/kg)
Inner Deep Bay Outer Deep Bay
Particle Size Fractionation <63µm (%w /w )
Electrochemical Potential (mV)
Total Solids (%w /w )
Total Kjeldahl Nitrogen (mg/kg)
Ammonical Nitrogen (mg/kg)
Total Volatile Soilds (%w /w )
Total Carbon (%w /w )
Lantau Island
High Molecular Weight Poly cy lic AromaticHy drocarbons (PAHs) (µg/kg) (7) (8) (9)
Low Molecular Weight Poly cy lic AromaticHy drocarbons (PAHs) (µg/kg) (5) (6) (9)
Chemical Ox y gen Demand (mg/kg)
Total Phosphorus (mg/kg)
Total Sulphide (mg/kg)
Arsenic (mg/kg)
Silv er (mg/kg)
Zinc (mg/kg)
Total Poly chlorinated Bipheny ls (PCBs)(µg/kg) (3) (4)
Table Table Table Table Table 66666.2.2.2.2.2Summary statistics of marine sediment quality of the Southern, Junk Bay and Deep BayWCZs, 2000 - 2004
Note : 1. Data presented are arithmetic means ; data in brackets indicate ranges.2. All data are based on the analyses of bulk (unsieved) sediment and are reported on a dry weight basis unless stated otherwise.3. The Technical Circular �ETWB (W) No. 34/2002 Management of Dredged / Excavated Sediment� issued in 2002 has revised the definition of �Total PCBs�
as the summation of 18 specific PCB congeners. Following the new definition, the monitoring of these 18 PCB congeners started in 2002 and theTotal PCBs results only refer to 2002 - 2004.
4. Total PCBs results are derived from the summation of 18 congeners. If the concentration of a congener is below report limit (RL), the result will be takenas 0.5xRL in the calculation.
5. Low molecular weight polyaromatic hydrocarbons (PAHs) include 6 congeners of molecular weight below 200, namely : Acenaphthene, Acenaphthylene,Anthracene, Flourene, Naphthalene and Phenanthrene.
6. As the monitoring of Naphthalene only started in 2002, the Low Molecular Weight PAHs results are based on sediments samples collected in 2002 -2004.
7. High molecular weight polyaromatic hydrocarbons (PAHs) include 10 congeners of molecular weight above 200, namely : Fluoranthene, Pyrene, Benzo(a)anthracene, Chrysene, Benzo(b)fluoranthene, Benzo(k)fluoranthene, Benzo(a)pyrene, Dibenzo(a,h)anthracene, Benzo(g,h,i)perylene and Indeno(1,2,3-cd)pyrene.
8. Low and high molecular weight PAHs results are derived from the summation of the corresponding congeners. If the concentration of a congener isbelow report limit (RL), the result will be taken as 0.5xRL in the calculation.

6
P 6.10MARINE WATER QUALITY IN HONG KONG IN 2004
SEDIMENT QUALITY
Port Island Mirs Bay
(North)Parameter PS3 PS5 PS6 MS1 MS2 MS7 MS17 MS3
Number of samples 10 10 10 10 10 10 10 1087 40 83 86 93 92 92 90
(55 - 96) (8 - 68) (73 - 90) (78 - 92) (83 - 98) (85 - 99) (84 - 98) (73 - 98)-231 -135 -179 -326 -349 -358 -232 -243
((-324) - (-110)) ((-249) - (-51)) ((-281) - (-33)) ((-379) - (-230)) ((-385) - (-243)) ((-388) - (-319)) ((-342) - (-143)) ((-346) - (-135))37 57 47 40 32 30 36 38
(32 - 53) (44 - 63) (43 - 51) (32 - 46) (30 - 35) (27 - 34) (34 - 42) (35 - 41)12.1 7.6 9.5 8.3 10.5 11.3 10.1 9.8
(8.2 - 14.0) (5.5 - 9.9) (8.8 - 11.0) (7.4 - 10.0) (9.2 - 12.0) (9.6 - 12.0) (9.1 - 11.0) (8.3 - 11.0)19000 12000 15000 20000 19000 19000 18000 18000
(15000 - 22000) (7200 - 17000) (12000 - 19000) (14000 - 22000) (17000 - 20000) (17000 - 21000) (14000 - 19000) (14000 - 20000)1 1.3 1 0.7 0.7 0.8 0.8 0.8
(0.5 - 1.2) (0.3 - 2.2) (0.4 - 1.3) (0.6 - 0.8) (0.7 - 0.9) (0.7 - 0.9) (0.7 - 1.2) (0.7 - 0.9)8.1 9.2 6.6 17.6 16.7 11.9 8 5.2
(3.7 - 15.0) (3.8 - 15.0) (2.2 - 14.0) (0.2 - 50.0) (5.0 - 25.0) (1.3 - 18.0) (0.2 - 16.0) (0.2 - 11.0)635 366 469 549 658 686 633 593
(420 - 780) (300 - 510) (270 - 600) (270 - 760) (510 - 720) (630 - 780) (420 - 760) (380 - 700)208 165 193 188 205 201 217 202
(170 - 240) (120 - 210) (110 - 250) (150 - 230) (180 - 240) (170 - 240) (190 - 270) (170 - 230)82 15 37 197 175 104 56 31
(44 - 200) (3 - 36) (14 - 59) (31 - 350) (43 - 340) (64 - 190) (26 - 77) (10 - 55)<0.1 <0.1 <0.1 0.1 0.1 0.1 0.1 <0.1
(<0.1 - 0.1) (<0.1 - 0.1) (<0.1 - 0.2) (<0.1 - 0.2) (<0.1 - 0.2) (<0.1 - 0.2) (<0.1 - 0.2) (<0.1 - 0.2)6.6 4.6 6.3 9.5 7.5 7.3 6.9 7.3
(4.7 - 9.7) (2.5 - 8.2) (5.1 - 9.3) (7.5 - 12.0) (5.8 - 9.4) (5.7 - 10.0) (5.3 - 8.8) (5.1 - 9.6)(<0.1) (<0.1) <0.1 0.3 0.2 0.2 <0.1 <0.1
(<0.1 - <0.1) (<0.1 - <0.1) (<0.1 - <0.1) (0.2 - 0.4) (0.1 - 0.3) (0.1 - 0.2) (<0.1 - 0.1) (<0.1 - 0.1)28 21 29 29 35 35 36 34
(20 - 35) (16 - 30) (23 - 34) (26 - 32) (28 - 40) (32 - 38) (28 - 41) (27 - 39)24 10 14 40 22 21 17 15
(19 - 31) (5 - 17) (11 - 21) (32 - 45) (19 - 26) (18 - 25) (13 - 20) (12 - 19)39 25 34 51 47 43 45 39
(34 - 44) (18 - 37) (31 - 38) (38 - 55) (39 - 51) (36 - 49) (34 - 53) (32 - 49)0.1 <0.05 <0.05 0.09 0.07 0.07 0.05 0.05
(0.06 - 0.18) (<0.05 - 0.07) (<0.05 - 0.09) (0.07 - 0.15) (<0.05 - 0.09) (0.06 - 0.11) (<0.05 - 0.08) (<0.05 - 0.07)17 15 20 18 23 24 27 24
(9 - 22) (9 - 24) (17 - 23) (15 - 21) (20 - 26) (21 - 26) (21 - 31) (19 - 28)0.4 0.4 0.3 0.7 0.4 0.4 0.3 0.3
(0.2 - 1.0) (<0.2 - 1.0) (<0.2 - 1.0) (0.8 - 1.0) (0.2 - 1.0) (<0.2 - 1.0) (<0.2 - 1.0) (<0.2 - 1.0)98 60 79 106 100 94 95 91
(77 - 130) (36 - 98) (67 - 100) (80 - 120) (77 - 110) (78 - 100) (66 - 120) (60 - 160)18 18 18 18 18 18 18 18
(18 - 18) (18 - 18) (18 - 18) (18 - 18) (18 - 18) (18 - 18) (18 - 18) (18 - 18)
90 90 90 90 91 90 90 90
(90 - 90) (90 - 90) (90 - 90) (90 - 90) (90 - 95) (90 - 90) (90 - 90) (90 - 90)
63 28 42 52 63 79 51 48
(29 - 103) (19 - 37) (21 - 89) (29 - 93) (34 - 109) (32 - 200) (29 - 78) (21 - 94)
High Molecular Weight Poly cy lic AromaticHy drocarbons (PAHs) (µg/kg) (7) (8) (9)
Low Molecular Weight Poly cy lic AromaticHy drocarbons (PAHs) (µg/kg) (5) (6) (9)
Chemical Ox y gen Demand (mg/kg)
Total Phosphorus (mg/kg)
Total Sulphide (mg/kg)
Arsenic (mg/kg)
Silv er (mg/kg)
Total Cy anide (mg/kg)
Zinc (mg/kg)
Total Poly chlorinated Bipheny ls (PCBs)(µg/kg) (3) (4)
Particle Size Fractionation <63µm (%w /w )
Electrochemical Potential (mV)
Total Solids (%w /w )
Total Kjeldahl Nitrogen (mg/kg)
Ammonical Nitrogen (mg/kg)
Total Volatile Soilds (%w /w )
Total Carbon (%w /w )
Mercury (mg/kg)
Nickel (mg/kg)
Cadmium (mg/kg)
Chromium (mg/kg)
Copper (mg/kg)
Lead (mg/kg)
Inner PortShelter
OuterPort Shelter
StarlingInlet
Crooked Island
Table Table Table Table Table 6.36.36.36.36.3Summary statistics of marine sediment quality of the Port Shelter and Mirs Bay WCZs,2000 - 2004
Note : 1. Data presented are arithmetic means ; data in brackets indicate ranges.2. All data are based on the analyses of bulk (unsieved) sediment and are reported on a dry weight basis unless stated otherwise.3. The Technical Circular �ETWB (W) No. 34/2002 Management of Dredged / Excavated Sediment� issued in 2002 has revised the definition of �Total PCBs�
as the summation of 18 specific PCB congeners. Following the new definition, the monitoring of these 18 PCB congeners started in 2002 and theTotal PCBs results only refer to 2002 - 2004.
4. Total PCBs results are derived from the summation of 18 congeners. If the concentration of a congener is below report limit (RL), the result will be takenas 0.5xRL in the calculation.
5. Low molecular weight polyaromatic hydrocarbons (PAHs) include 6 congeners of molecular weight below 200, namely : Acenaphthene, Acenaphthylene,Anthracene, Flourene, Naphthalene and Phenanthrene.
6. As the monitoring of Naphthalene only started in 2002, the Low Molecular Weight PAHs results are based on sediments samples collected in 2002 -2004.
7. High molecular weight polyaromatic hydrocarbons (PAHs) include 10 congeners of molecular weight above 200, namely : Fluoranthene, Pyrene, Benzo(a)anthracene, Chrysene, Benzo(b)fluoranthene, Benzo(k)fluoranthene, Benzo(a)pyrene, Dibenzo(a,h)anthracene, Benzo(g,h,i)perylene and Indeno(1,2,3-cd)pyrene.
8. Low and high molecular weight PAHs results are derived from the summation of the corresponding congeners. If the concentration of a congener isbelow report limit (RL), the result will be taken as 0.5xRL in the calculation.
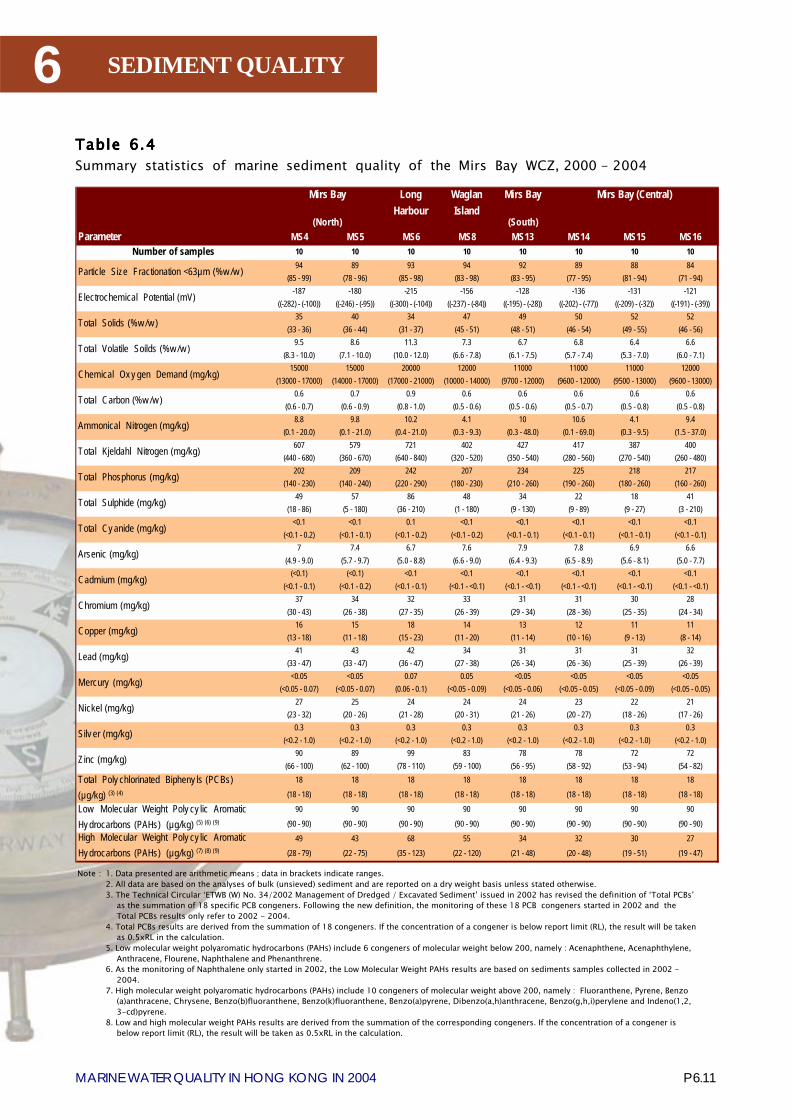
P 6.11MARINE WATER QUALITY IN HONG KONG IN 2004
6 SEDIMENT QUALITY
Mirs Bay
(South)Parameter MS4 MS5 MS6 MS8 MS13 MS14 MS15 MS16
Number of samples 10 10 10 10 10 10 10 1094 89 93 94 92 89 88 84
(85 - 99) (78 - 96) (85 - 98) (83 - 98) (83 - 95) (77 - 95) (81 - 94) (71 - 94)-187 -180 -215 -156 -128 -136 -131 -121
((-282) - (-100)) ((-246) - (-95)) ((-300) - (-104)) ((-237) - (-84)) ((-195) - (-28)) ((-202) - (-77)) ((-209) - (-32)) ((-191) - (-39))35 40 34 47 49 50 52 52
(33 - 36) (36 - 44) (31 - 37) (45 - 51) (48 - 51) (46 - 54) (49 - 55) (46 - 56)9.5 8.6 11.3 7.3 6.7 6.8 6.4 6.6
(8.3 - 10.0) (7.1 - 10.0) (10.0 - 12.0) (6.6 - 7.8) (6.1 - 7.5) (5.7 - 7.4) (5.3 - 7.0) (6.0 - 7.1)15000 15000 20000 12000 11000 11000 11000 12000
(13000 - 17000) (14000 - 17000) (17000 - 21000) (10000 - 14000) (9700 - 12000) (9600 - 12000) (9500 - 13000) (9600 - 13000)0.6 0.7 0.9 0.6 0.6 0.6 0.6 0.6
(0.6 - 0.7) (0.6 - 0.9) (0.8 - 1.0) (0.5 - 0.6) (0.5 - 0.6) (0.5 - 0.7) (0.5 - 0.8) (0.5 - 0.8)8.8 9.8 10.2 4.1 10 10.6 4.1 9.4
(0.1 - 20.0) (0.1 - 21.0) (0.4 - 21.0) (0.3 - 9.3) (0.3 - 48.0) (0.1 - 69.0) (0.3 - 9.5) (1.5 - 37.0)607 579 721 402 427 417 387 400
(440 - 680) (360 - 670) (640 - 840) (320 - 520) (350 - 540) (280 - 560) (270 - 540) (260 - 480)202 209 242 207 234 225 218 217
(140 - 230) (140 - 240) (220 - 290) (180 - 230) (210 - 260) (190 - 260) (180 - 260) (160 - 260)49 57 86 48 34 22 18 41
(18 - 86) (5 - 180) (36 - 210) (1 - 180) (9 - 130) (9 - 89) (9 - 27) (3 - 210)<0.1 <0.1 0.1 <0.1 <0.1 <0.1 <0.1 <0.1
(<0.1 - 0.2) (<0.1 - 0.1) (<0.1 - 0.2) (<0.1 - 0.2) (<0.1 - 0.1) (<0.1 - 0.1) (<0.1 - 0.1) (<0.1 - 0.1)7 7.4 6.7 7.6 7.9 7.8 6.9 6.6
(4.9 - 9.0) (5.7 - 9.7) (5.0 - 8.8) (6.6 - 9.0) (6.4 - 9.3) (6.5 - 8.9) (5.6 - 8.1) (5.0 - 7.7)(<0.1) (<0.1) <0.1 <0.1 <0.1 <0.1 <0.1 <0.1
(<0.1 - 0.1) (<0.1 - 0.2) (<0.1 - 0.1) (<0.1 - <0.1) (<0.1 - <0.1) (<0.1 - <0.1) (<0.1 - <0.1) (<0.1 - <0.1)37 34 32 33 31 31 30 28
(30 - 43) (26 - 38) (27 - 35) (26 - 39) (29 - 34) (28 - 36) (25 - 35) (24 - 34)16 15 18 14 13 12 11 11
(13 - 18) (11 - 18) (15 - 23) (11 - 20) (11 - 14) (10 - 16) (9 - 13) (8 - 14)41 43 42 34 31 31 31 32
(33 - 47) (33 - 47) (36 - 47) (27 - 38) (26 - 34) (26 - 36) (25 - 39) (26 - 39)<0.05 <0.05 0.07 0.05 <0.05 <0.05 <0.05 <0.05
(<0.05 - 0.07) (<0.05 - 0.07) (0.06 - 0.1) (<0.05 - 0.09) (<0.05 - 0.06) (<0.05 - 0.05) (<0.05 - 0.09) (<0.05 - 0.05)27 25 24 24 24 23 22 21
(23 - 32) (20 - 26) (21 - 28) (20 - 31) (21 - 26) (20 - 27) (18 - 26) (17 - 26)0.3 0.3 0.3 0.3 0.3 0.3 0.3 0.3
(<0.2 - 1.0) (<0.2 - 1.0) (<0.2 - 1.0) (<0.2 - 1.0) (<0.2 - 1.0) (<0.2 - 1.0) (<0.2 - 1.0) (<0.2 - 1.0)90 89 99 83 78 78 72 72
(66 - 100) (62 - 100) (78 - 110) (59 - 100) (56 - 95) (58 - 92) (53 - 94) (54 - 82)18 18 18 18 18 18 18 18
(18 - 18) (18 - 18) (18 - 18) (18 - 18) (18 - 18) (18 - 18) (18 - 18) (18 - 18)
90 90 90 90 90 90 90 90
(90 - 90) (90 - 90) (90 - 90) (90 - 90) (90 - 90) (90 - 90) (90 - 90) (90 - 90)
49 43 68 55 34 32 30 27
(28 - 79) (22 - 75) (35 - 123) (22 - 120) (21 - 48) (20 - 48) (19 - 51) (19 - 47)
(North)
Mirs Bay LongHarbour
WaglanIsland
Mirs Bay (Central)
Mercury (mg/kg)
Nickel (mg/kg)
Cadmium (mg/kg)
Chromium (mg/kg)
Copper (mg/kg)
Lead (mg/kg)
Particle Size Fractionation <63µm (%w /w )
Electrochemical Potential (mV)
Total Solids (%w /w )
Total Kjeldahl Nitrogen (mg/kg)
Ammonical Nitrogen (mg/kg)
Total Volatile Soilds (%w /w )
Total Carbon (%w /w )
High Molecular Weight Poly cy lic AromaticHy drocarbons (PAHs) (µg/kg) (7) (8) (9)
Low Molecular Weight Poly cy lic AromaticHy drocarbons (PAHs) (µg/kg) (5) (6) (9)
Chemical Ox y gen Demand (mg/kg)
Total Phosphorus (mg/kg)
Total Sulphide (mg/kg)
Arsenic (mg/kg)
Silv er (mg/kg)
Total Cy anide (mg/kg)
Zinc (mg/kg)
Total Poly chlorinated Bipheny ls (PCBs)(µg/kg) (3) (4)
Table Table Table Table Table 66666.4.4.4.4.4Summary statistics of marine sediment quality of the Mirs Bay WCZ, 2000 - 2004
Note : 1. Data presented are arithmetic means ; data in brackets indicate ranges.2. All data are based on the analyses of bulk (unsieved) sediment and are reported on a dry weight basis unless stated otherwise.3. The Technical Circular �ETWB (W) No. 34/2002 Management of Dredged / Excavated Sediment� issued in 2002 has revised the definition of �Total PCBs�
as the summation of 18 specific PCB congeners. Following the new definition, the monitoring of these 18 PCB congeners started in 2002 and theTotal PCBs results only refer to 2002 - 2004.
4. Total PCBs results are derived from the summation of 18 congeners. If the concentration of a congener is below report limit (RL), the result will be takenas 0.5xRL in the calculation.
5. Low molecular weight polyaromatic hydrocarbons (PAHs) include 6 congeners of molecular weight below 200, namely : Acenaphthene, Acenaphthylene,Anthracene, Flourene, Naphthalene and Phenanthrene.
6. As the monitoring of Naphthalene only started in 2002, the Low Molecular Weight PAHs results are based on sediments samples collected in 2002 -2004.
7. High molecular weight polyaromatic hydrocarbons (PAHs) include 10 congeners of molecular weight above 200, namely : Fluoranthene, Pyrene, Benzo(a)anthracene, Chrysene, Benzo(b)fluoranthene, Benzo(k)fluoranthene, Benzo(a)pyrene, Dibenzo(a,h)anthracene, Benzo(g,h,i)perylene and Indeno(1,2,3-cd)pyrene.
8. Low and high molecular weight PAHs results are derived from the summation of the corresponding congeners. If the concentration of a congener isbelow report limit (RL), the result will be taken as 0.5xRL in the calculation.
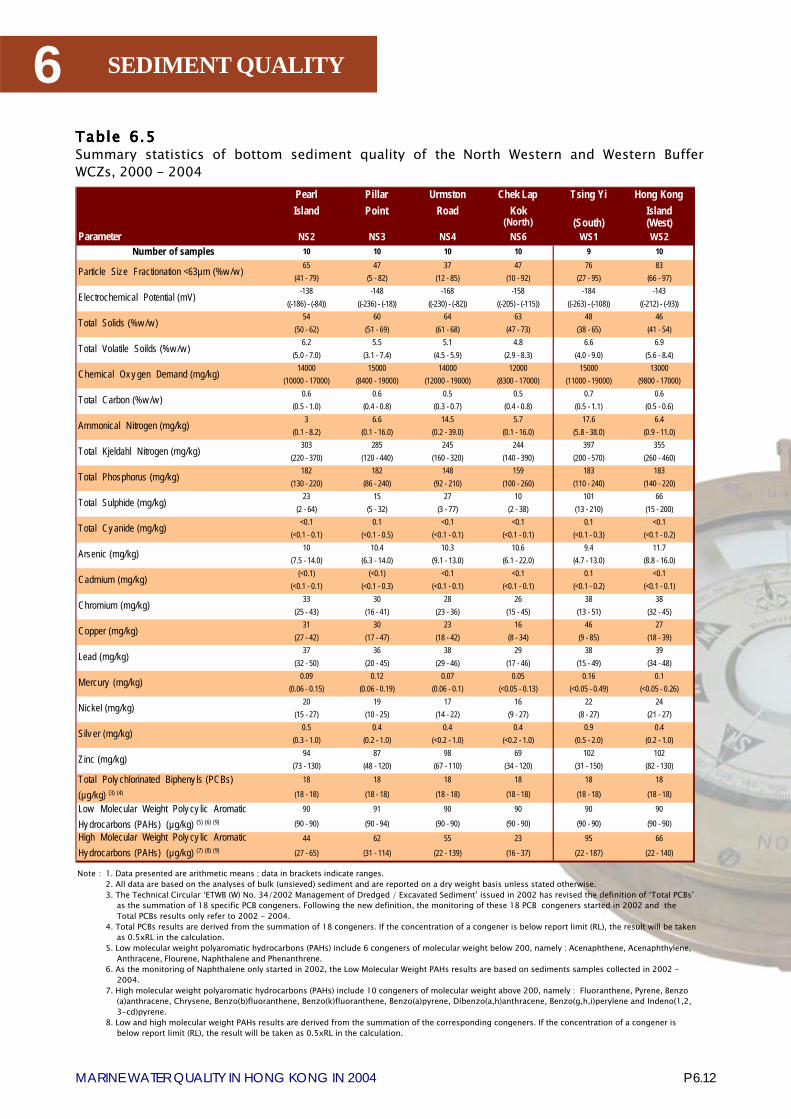
6
P 6.12MARINE WATER QUALITY IN HONG KONG IN 2004
SEDIMENT QUALITY
Chek LapKok
Tsing Yi Hong KongIsland
(North) (South) (West)Parameter NS2 NS3 NS4 NS6 WS1 WS2
Number of samples 10 10 10 10 9 1065 47 37 47 76 83
(41 - 79) (5 - 82) (12 - 85) (10 - 92) (27 - 95) (66 - 97)-138 -148 -168 -158 -184 -143
((-186) - (-84)) ((-236) - (-18)) ((-230) - (-82)) ((-205) - (-115)) ((-263) - (-108)) ((-212) - (-93))54 60 64 63 48 46
(50 - 62) (51 - 69) (61 - 68) (47 - 73) (38 - 65) (41 - 54)6.2 5.5 5.1 4.8 6.6 6.9
(5.0 - 7.0) (3.1 - 7.4) (4.5 - 5.9) (2.9 - 8.3) (4.0 - 9.0) (5.6 - 8.4)14000 15000 14000 12000 15000 13000
(10000 - 17000) (8400 - 19000) (12000 - 19000) (8300 - 17000) (11000 - 19000) (9800 - 17000)0.6 0.6 0.5 0.5 0.7 0.6
(0.5 - 1.0) (0.4 - 0.8) (0.3 - 0.7) (0.4 - 0.8) (0.5 - 1.1) (0.5 - 0.6)3 6.6 14.5 5.7 17.6 6.4
(0.1 - 8.2) (0.1 - 16.0) (0.2 - 39.0) (0.1 - 16.0) (5.8 - 38.0) (0.9 - 11.0)303 285 245 244 397 355
(220 - 370) (120 - 440) (160 - 320) (140 - 390) (200 - 570) (260 - 460)182 182 148 159 183 183
(130 - 220) (86 - 240) (92 - 210) (100 - 260) (110 - 240) (140 - 220)23 15 27 10 101 66
(2 - 64) (5 - 32) (3 - 77) (2 - 38) (13 - 210) (15 - 200)<0.1 0.1 <0.1 <0.1 0.1 <0.1
(<0.1 - 0.1) (<0.1 - 0.5) (<0.1 - 0.1) (<0.1 - 0.1) (<0.1 - 0.3) (<0.1 - 0.2)10 10.4 10.3 10.6 9.4 11.7
(7.5 - 14.0) (6.3 - 14.0) (9.1 - 13.0) (6.1 - 22.0) (4.7 - 13.0) (8.8 - 16.0)(<0.1) (<0.1) <0.1 <0.1 0.1 <0.1
(<0.1 - 0.1) (<0.1 - 0.3) (<0.1 - 0.1) (<0.1 - 0.1) (<0.1 - 0.2) (<0.1 - 0.1)33 30 28 26 38 38
(25 - 43) (16 - 41) (23 - 36) (15 - 45) (13 - 51) (32 - 45)31 30 23 16 46 27
(27 - 42) (17 - 47) (18 - 42) (8 - 34) (9 - 85) (18 - 39)37 36 38 29 38 39
(32 - 50) (20 - 45) (29 - 46) (17 - 46) (15 - 49) (34 - 48)0.09 0.12 0.07 0.05 0.16 0.1
(0.06 - 0.15) (0.06 - 0.19) (0.06 - 0.1) (<0.05 - 0.13) (<0.05 - 0.49) (<0.05 - 0.26)20 19 17 16 22 24
(15 - 27) (10 - 25) (14 - 22) (9 - 27) (8 - 27) (21 - 27)0.5 0.4 0.4 0.4 0.9 0.4
(0.3 - 1.0) (0.2 - 1.0) (<0.2 - 1.0) (<0.2 - 1.0) (0.5 - 2.0) (0.2 - 1.0)94 87 98 69 102 102
(73 - 130) (48 - 120) (67 - 110) (34 - 120) (31 - 150) (82 - 130)18 18 18 18 18 18
(18 - 18) (18 - 18) (18 - 18) (18 - 18) (18 - 18) (18 - 18)
90 91 90 90 90 90
(90 - 90) (90 - 94) (90 - 90) (90 - 90) (90 - 90) (90 - 90)
44 62 55 23 95 66
(27 - 65) (31 - 114) (22 - 139) (16 - 37) (22 - 187) (22 - 140)
High Molecular Weight Poly cy lic AromaticHy drocarbons (PAHs) (µg/kg) (7) (8) (9)
Low Molecular Weight Poly cy lic AromaticHy drocarbons (PAHs) (µg/kg) (5) (6) (9)
Silv er (mg/kg)
Zinc (mg/kg)
Arsenic (mg/kg)
Total Cy anide (mg/kg)
Total Poly chlorinated Bipheny ls (PCBs)(µg/kg) (3) (4)
Total Carbon (%w /w )
Nickel (mg/kg)
Cadmium (mg/kg)
Chromium (mg/kg)
Copper (mg/kg)
PearlIsland
PillarPoint
UrmstonRoad
Chemical Ox y gen Demand (mg/kg)
Mercury (mg/kg)
Particle Size Fractionation <63µm (%w /w )
Electrochemical Potential (mV)
Total Solids (%w /w )
Total Kjeldahl Nitrogen (mg/kg)
Ammonical Nitrogen (mg/kg)
Total Volatile Soilds (%w /w )
Lead (mg/kg)
Total Phosphorus (mg/kg)
Total Sulphide (mg/kg)
Table Table Table Table Table 66666.5.5.5.5.5Summary statistics of bottom sediment quality of the North Western and Western BufferWCZs, 2000 - 2004
Note : 1. Data presented are arithmetic means ; data in brackets indicate ranges.2. All data are based on the analyses of bulk (unsieved) sediment and are reported on a dry weight basis unless stated otherwise.3. The Technical Circular �ETWB (W) No. 34/2002 Management of Dredged / Excavated Sediment� issued in 2002 has revised the definition of �Total PCBs�
as the summation of 18 specific PCB congeners. Following the new definition, the monitoring of these 18 PCB congeners started in 2002 and theTotal PCBs results only refer to 2002 - 2004.
4. Total PCBs results are derived from the summation of 18 congeners. If the concentration of a congener is below report limit (RL), the result will be takenas 0.5xRL in the calculation.
5. Low molecular weight polyaromatic hydrocarbons (PAHs) include 6 congeners of molecular weight below 200, namely : Acenaphthene, Acenaphthylene,Anthracene, Flourene, Naphthalene and Phenanthrene.
6. As the monitoring of Naphthalene only started in 2002, the Low Molecular Weight PAHs results are based on sediments samples collected in 2002 -2004.
7. High molecular weight polyaromatic hydrocarbons (PAHs) include 10 congeners of molecular weight above 200, namely : Fluoranthene, Pyrene, Benzo(a)anthracene, Chrysene, Benzo(b)fluoranthene, Benzo(k)fluoranthene, Benzo(a)pyrene, Dibenzo(a,h)anthracene, Benzo(g,h,i)perylene and Indeno(1,2,3-cd)pyrene.
8. Low and high molecular weight PAHs results are derived from the summation of the corresponding congeners. If the concentration of a congener isbelow report limit (RL), the result will be taken as 0.5xRL in the calculation.

P 6.13MARINE WATER QUALITY IN HONG KONG IN 2004
6 SEDIMENT QUALITY
Chai Wan (East) (Central) (West)Parameter ES1 ES2 ES4 VS3 VS5 VS6 VS9 VS10
Number of samples 10 10 10 10 10 9 10 1051 68 57 57 69 57 79 82
(39 - 94) (15 - 92) (27 - 87) (10 - 91) (28 - 93) (43 - 79) (57 - 90) (29 - 97)-203 -161 -270 -326 -363 -343 -234 -250
((-246) - (-151)) ((-202) - (-107)) ((-349) - (-187)) ((-421) - (-213)) ((-409) - (-258)) ((-409) - (-218)) ((-365) - (-100)) ((-365) - (-148))64 56 54 50 44 51 47 42
(51 - 70) (44 - 66) (45 - 66) (39 - 73) (31 - 66) (41 - 70) (40 - 53) (34 - 60)5 5.8 6.3 6.7 8.7 7.5 7.1 7.9
(3.8 - 6.6) (4.3 - 7.6) (4.9 - 8.1) (3.2 - 8.2) (5.2 - 12.0) (5.0 - 8.8) (6.0 - 8.4) (4.8 - 9.0)12000 13000 16000 17000 25000 25000 18000 20000
(9400 - 27000) (8000 - 21000) (11000 - 21000) (7300 - 23000) (15000 - 32000) (13000 - 32000) (12000 - 23000) (13000 - 27000)1 0.7 0.7 0.7 0.8 1 0.7 0.6
(0.3 - 1.8) (0.5 - 0.9) (0.3 - 1.1) (0.5 - 0.9) (0.5 - 1.1) (0.7 - 1.6) (0.6 - 0.8) (0.4 - 0.8)10.2 6.2 8 10.8 34.3 15.3 18.3 15.5
(1.5 - 22.0) (2.3 - 9.7) (2.5 - 17.0) (0.4 - 22.0) (1.5 - 86.0) (5.3 - 42.0) (1.1 - 49.0) (3.3 - 34.0)311 366 423 468 584 437 329 462
(190 - 430) (250 - 530) (290 - 620) (220 - 590) (360 - 690) (300 - 580) (160 - 460) (270 - 630)155 183 178 174 196 226 164 215
(100 - 210) (130 - 230) (120 - 240) (120 - 220) (130 - 240) (190 - 280) (120 - 200) (150 - 260)72 55 222 318 747 247 108 300
(3 - 140) (7 - 150) (15 - 360) (200 - 590) (170 - 1700) (120 - 490) (0.3 - 460) (110 - 1100)<0.1 <0.1 0.2 0.1 0.3 0.2 0.1 0.3
(<0.1 - 0.2) (<0.1 - 0.2) (<0.1 - 0.4) (<0.1 - 0.2) (<0.1 - 0.8) (<0.1 - 0.3) (<0.1 - 0.3) (<0.1 - 0.5)5.4 6.3 6 6 7.8 8.9 6.6 9.9
(3.5 - 7.0) (4.9 - 8.2) (4.1 - 8.1) (0.9 - 9.4) (6.2 - 8.5) (6.6 - 11.0) (4.0 - 9.3) (6.6 - 11.0)(<0.1) (<0.1) 0.2 0.3 0.7 0.4 0.4 0.8
(<0.1 - 0.2) (<0.1 - <0.1) (<0.1 - 0.3) (<0.1 - 0.6) (0.3 - 1.0) (0.2 - 0.6) (<0.1 - 1.3) (0.4 - 2.4)23 29 33 38 54 45 54 103
(15 - 36) (20 - 38) (23 - 54) (12 - 70) (28 - 70) (32 - 60) (33 - 76) (56 - 190)41 27 78 111 177 130 122 277
(17 - 87) (16 - 48) (52 - 140) (27 - 230) (84 - 250) (76 - 210) (11 - 280) (130 - 760)25 29 36 41 61 97 45 63
(21 - 32) (21 - 44) (23 - 69) (21 - 59) (42 - 84) (51 - 130) (25 - 81) (42 - 76)0.19 0.07 0.17 0.29 0.39 1.65 0.18 0.2
(0.06 - 1) (<0.05 - 0.14) (0.09 - 0.3) (<0.05 - 0.72) (0.2 - 0.52) (0.29 - 8) (<0.05 - 0.39) (0.13 - 0.29)13 19 16 16 23 20 29 45
(10 - 18) (14 - 25) (8 - 22) (6 - 27) (12 - 31) (14 - 28) (19 - 43) (23 - 110)0.7 0.5 1.9 3.2 7.4 3.8 3.0 8.2
(0.2 - 2.0) (<0.2 - 1.0) (1.0 - 3.0) (1.0 - 6.0) (3.0 - 11.0) (1.6 - 6.0) (0.9 - 8.0) (4.0 - 14.0)65 74 96 128 230 193 123 199
(46 - 100) (54 - 110) (63 - 140) (17 - 210) (110 - 340) (120 - 250) (62 - 210) (110 - 260)18 18 18 18 19 28 19 22
(18 - 18) (18 - 18) (18 - 18) (18 - 19) (18 - 23) (18 - 45) (18 - 23) (18 - 30)
96 91 94 102 119 141 90 92
(90 - 126) (90 - 94) (90 - 101) (90 - 124) (90 - 181) (113 - 169) (90 - 90) (90 - 99)
120 58 147 324 548 1724 116 200
(21 - 391) (30 - 132) (74 - 265) (66 - 689) (278 - 985) (357 - 5780) (16 - 281) (119 - 339)
Rambler ChannelVictoria HarbourEastern Buffer
Tathong Channel
Mercury (mg/kg)
Nickel (mg/kg)
Cadmium (mg/kg)
Chromium (mg/kg)
Copper (mg/kg)
Lead (mg/kg)
Particle Size Fractionation <63µm (%w /w )
Electrochemical Potential (mV)
Total Solids (%w /w )
Total Kjeldahl Nitrogen (mg/kg)
Ammonical Nitrogen (mg/kg)
Total Volatile Soilds (%w /w )
Total Carbon (%w /w )
High Molecular Weight Poly cy lic AromaticHy drocarbons (PAHs) (µg/kg) (7) (8) (9)
Low Molecular Weight Poly cy lic AromaticHy drocarbons (PAHs) (µg/kg) (5) (6) (9)
Chemical Ox y gen Demand (mg/kg)
Total Phosphorus (mg/kg)
Total Sulphide (mg/kg)
Arsenic (mg/kg)
Silv er (mg/kg)
Total Cy anide (mg/kg)
Zinc (mg/kg)
Total Poly chlorinated Bipheny ls (PCBs)(µg/kg) (3) (4)
Table Table Table Table Table 66666.6.6.6.6.6Summary statistics of marine sediment quality of the Eastern Buffer and Victoria HarbourWCZs, 2000 - 2004
Note : 1. Data presented are arithmetic means ; data in brackets indicate ranges.2. All data are based on the analyses of bulk (unsieved) sediment and are reported on a dry weight basis unless stated otherwise.3. The Technical Circular �ETWB (W) No. 34/2002 Management of Dredged / Excavated Sediment� issued in 2002 has revised the definition of �Total PCBs�
as the summation of 18 specific PCB congeners. Following the new definition, the monitoring of these 18 PCB congeners started in 2002 and theTotal PCBs results only refer to 2002 - 2004.
4. Total PCBs results are derived from the summation of 18 congeners. If the concentration of a congener is below report limit (RL), the result will be takenas 0.5xRL in the calculation.
5. Low molecular weight polyaromatic hydrocarbons (PAHs) include 6 congeners of molecular weight below 200, namely : Acenaphthene, Acenaphthylene,Anthracene, Flourene, Naphthalene and Phenanthrene.
6. As the monitoring of Naphthalene only started in 2002, the Low Molecular Weight PAHs results are based on sediments samples collected in 2002 -2004.
7. High molecular weight polyaromatic hydrocarbons (PAHs) include 10 congeners of molecular weight above 200, namely : Fluoranthene, Pyrene, Benzo(a)anthracene, Chrysene, Benzo(b)fluoranthene, Benzo(k)fluoranthene, Benzo(a)pyrene, Dibenzo(a,h)anthracene, Benzo(g,h,i)perylene and Indeno(1,2,3-cd)pyrene.
8. Low and high molecular weight PAHs results are derived from the summation of the corresponding congeners. If the concentration of a congener isbelow report limit (RL), the result will be taken as 0.5xRL in the calculation.
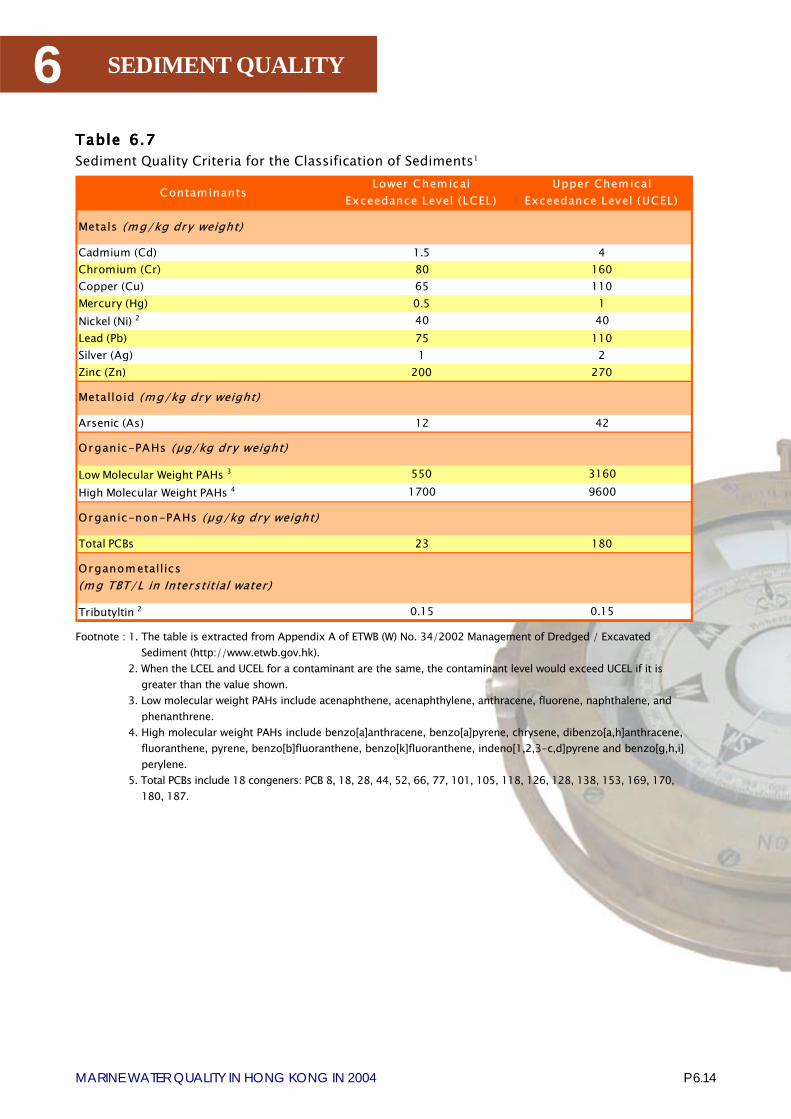
6
P 6.14MARINE WATER QUALITY IN HONG KONG IN 2004
SEDIMENT QUALITY
Contam inantsLower Chem ical
Exceedance Level (LCEL)Upper Chem ical
Exceedance Level (UCEL)
Metals (m g/kg dry weight)
Cadmium (Cd) 1.5 4Chromium (Cr) 80 160Copper (Cu) 65 110Mercury (Hg) 0.5 1Nickel (Ni) 2 40 40Lead (Pb) 75 110Silver (Ag) 1 2Zinc (Zn) 200 270
Metalloid (mg/kg dry weight)
Arsenic (As) 12 42
Organic-PAHs (µg/kg dry weight)
Low Molecular Weight PAHs 3 550 3160High Molecular Weight PAHs 4 1700 9600
Organic-non-PAHs (µg/kg dry weight)
Total PCBs 23 180
Organom etallics(m g TBT/L in Interstitial water )
Tributyltin 2 0.15 0.15
Footnote : 1. The table is extracted from Appendix A of ETWB (W) No. 34/2002 Management of Dredged / ExcavatedSediment (http://www.etwb.gov.hk).
2. When the LCEL and UCEL for a contaminant are the same, the contaminant level would exceed UCEL if it isgreater than the value shown.
3. Low molecular weight PAHs include acenaphthene, acenaphthylene, anthracene, fluorene, naphthalene, andphenanthrene.
4. High molecular weight PAHs include benzo[a]anthracene, benzo[a]pyrene, chrysene, dibenzo[a,h]anthracene,fluoranthene, pyrene, benzo[b]fluoranthene, benzo[k]fluoranthene, indeno[1,2,3-c,d]pyrene and benzo[g,h,i]perylene.
5. Total PCBs include 18 congeners: PCB 8, 18, 28, 44, 52, 66, 77, 101, 105, 118, 126, 128, 138, 153, 169, 170,180, 187.
Table Table Table Table Table 66666.....77777Sediment Quality Criteria for the Classification of Sediments1
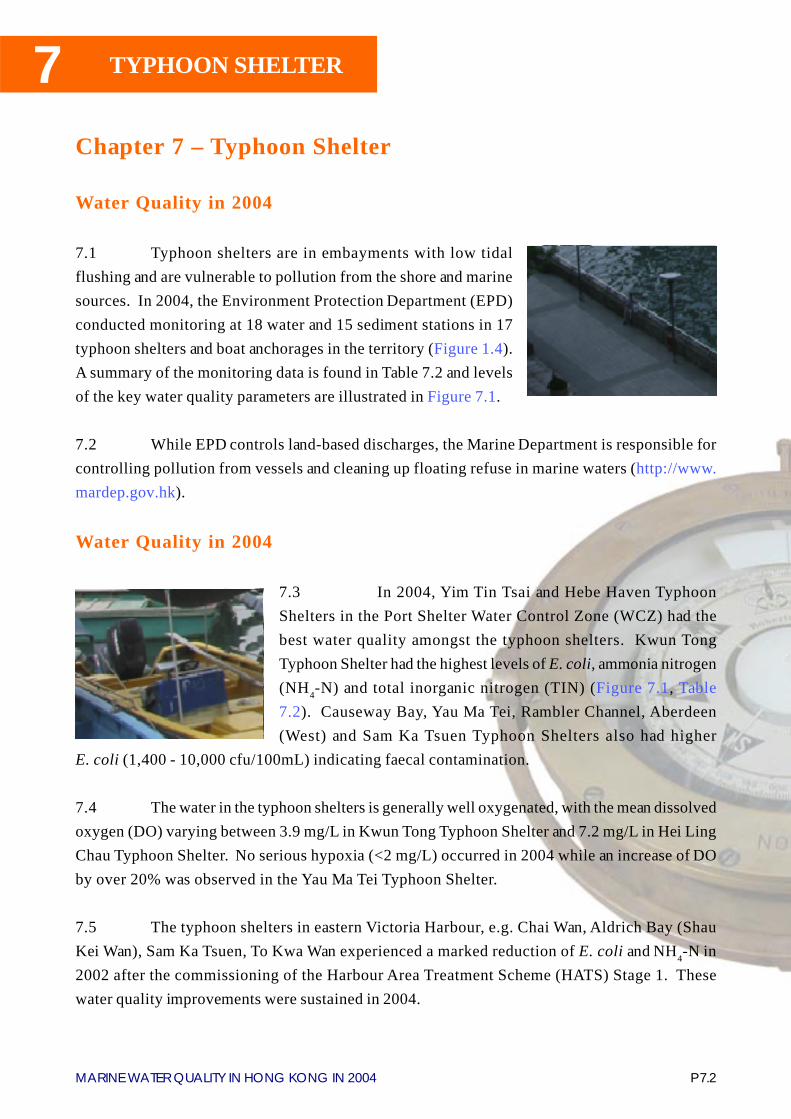
7
P 7.2MARINE WATER QUALITY IN HONG KONG IN 2004
TYPHOON SHELTER
Chapter 7 – Typhoon Shelter
Water Quality in 2004
7.1 Typhoon shelters are in embayments with low tidalflushing and are vulnerable to pollution from the shore and marinesources. In 2004, the Environment Protection Department (EPD)conducted monitoring at 18 water and 15 sediment stations in 17typhoon shelters and boat anchorages in the territory (Figure 1.4).A summary of the monitoring data is found in Table 7.2 and levelsof the key water quality parameters are illustrated in Figure 7.1.
7.2 While EPD controls land-based discharges, the Marine Department is responsible forcontrolling pollution from vessels and cleaning up floating refuse in marine waters (http://www.mardep.gov.hk).
Water Quality in 2004
7.3 In 2004, Yim Tin Tsai and Hebe Haven TyphoonShelters in the Port Shelter Water Control Zone (WCZ) had thebest water quality amongst the typhoon shelters. Kwun TongTyphoon Shelter had the highest levels of E. coli, ammonia nitrogen(NH4-N) and total inorganic nitrogen (TIN) (Figure 7.1, Table7.2). Causeway Bay, Yau Ma Tei, Rambler Channel, Aberdeen(West) and Sam Ka Tsuen Typhoon Shelters also had higher
E. coli (1,400 - 10,000 cfu/100mL) indicating faecal contamination.
7.4 The water in the typhoon shelters is generally well oxygenated, with the mean dissolvedoxygen (DO) varying between 3.9 mg/L in Kwun Tong Typhoon Shelter and 7.2 mg/L in Hei LingChau Typhoon Shelter. No serious hypoxia (<2 mg/L) occurred in 2004 while an increase of DOby over 20% was observed in the Yau Ma Tei Typhoon Shelter.
7.5 The typhoon shelters in eastern Victoria Harbour, e.g. Chai Wan, Aldrich Bay (ShauKei Wan), Sam Ka Tsuen, To Kwa Wan experienced a marked reduction of E. coli and NH4-N in2002 after the commissioning of the Harbour Area Treatment Scheme (HATS) Stage 1. Thesewater quality improvements were sustained in 2004.
iwp12
印章
iwp12
印章
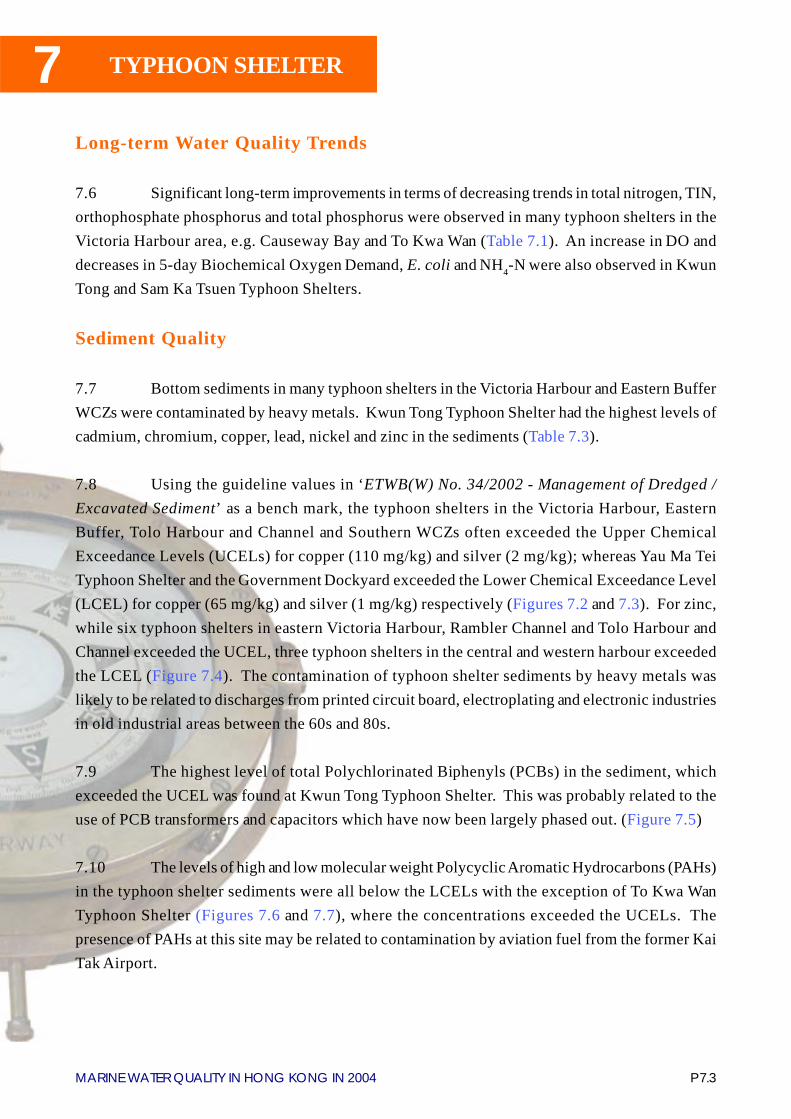
P 7.3MARINE WATER QUALITY IN HONG KONG IN 2004
7 TYPHOON SHELTER
Long-term Water Quality Trends
7.6 Significant long-term improvements in terms of decreasing trends in total nitrogen, TIN,orthophosphate phosphorus and total phosphorus were observed in many typhoon shelters in theVictoria Harbour area, e.g. Causeway Bay and To Kwa Wan (Table 7.1). An increase in DO anddecreases in 5-day Biochemical Oxygen Demand, E. coli and NH4-N were also observed in KwunTong and Sam Ka Tsuen Typhoon Shelters.
Sediment Quality
7.7 Bottom sediments in many typhoon shelters in the Victoria Harbour and Eastern BufferWCZs were contaminated by heavy metals. Kwun Tong Typhoon Shelter had the highest levels ofcadmium, chromium, copper, lead, nickel and zinc in the sediments (Table 7.3).
7.8 Using the guideline values in ‘ETWB(W) No. 34/2002 - Management of Dredged /Excavated Sediment’ as a bench mark, the typhoon shelters in the Victoria Harbour, EasternBuffer, Tolo Harbour and Channel and Southern WCZs often exceeded the Upper ChemicalExceedance Levels (UCELs) for copper (110 mg/kg) and silver (2 mg/kg); whereas Yau Ma TeiTyphoon Shelter and the Government Dockyard exceeded the Lower Chemical Exceedance Level(LCEL) for copper (65 mg/kg) and silver (1 mg/kg) respectively (Figures 7.2 and 7.3). For zinc,while six typhoon shelters in eastern Victoria Harbour, Rambler Channel and Tolo Harbour andChannel exceeded the UCEL, three typhoon shelters in the central and western harbour exceededthe LCEL (Figure 7.4). The contamination of typhoon shelter sediments by heavy metals waslikely to be related to discharges from printed circuit board, electroplating and electronic industriesin old industrial areas between the 60s and 80s.
7.9 The highest level of total Polychlorinated Biphenyls (PCBs) in the sediment, whichexceeded the UCEL was found at Kwun Tong Typhoon Shelter. This was probably related to theuse of PCB transformers and capacitors which have now been largely phased out. (Figure 7.5)
7.10 The levels of high and low molecular weight Polycyclic Aromatic Hydrocarbons (PAHs)in the typhoon shelter sediments were all below the LCELs with the exception of To Kwa WanTyphoon Shelter (Figures 7.6 and 7.7), where the concentrations exceeded the UCELs. Thepresence of PAHs at this site may be related to contamination by aviation fuel from the former KaiTak Airport.
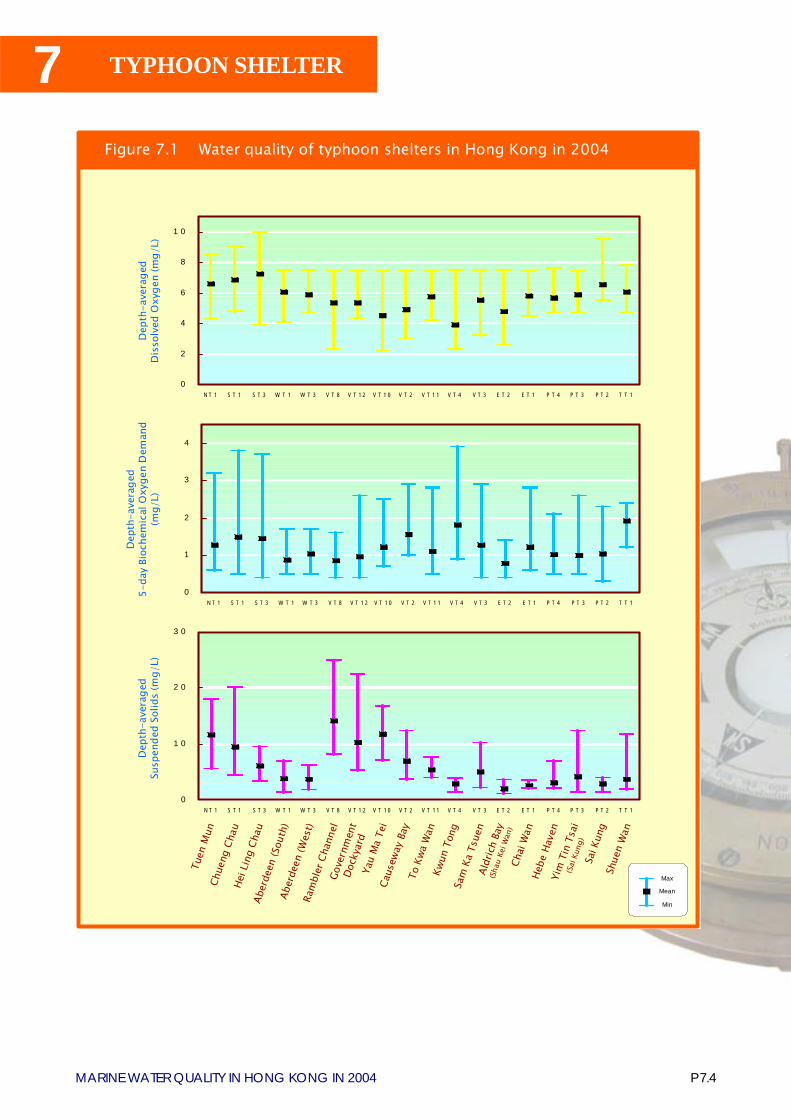
7
P 7.4MARINE WATER QUALITY IN HONG KONG IN 2004
TYPHOON SHELTER
0
2
4
6
8
1 0
N T 1 S T 1 S T 3 W T 1 W T 3 V T 8 V T 1 2 V T 1 0 V T 2 V T 1 1 V T 4 V T 3 E T 2 E T 1 P T 4 P T 3 P T 2 T T 1
Dep
th-a
vera
ged
Dis
solv
ed O
xyge
n (m
g/L)
Dep
th-a
vera
ged
5-da
y Bi
oche
mic
al O
xyge
n D
eman
d(m
g/L)
0
1
2
3
4
N T 1 S T 1 S T 3 W T 1 W T 3 V T 8 V T 1 2 V T 1 0 V T 2 V T 1 1 V T 4 V T 3 E T 2 E T 1 P T 4 P T 3 P T 2 T T 1
Tuen
Mun
Chue
ngCh
au
Ram
bler
Cha
nnel
Caus
eway
Bay
To K
waW
an
Sai K
ung
Kwun
Tong
Yau
Ma
Tei
Aldr
ich
Bay
(Sha
uKe
i Wan
)
Sam
Ka
Tsue
n
Chai
Wan
Yim
Tin
Tsai
(Sai
Kung
)
Shue
nW
an
Aber
deen
(Sou
th)
Aber
deen
(Wes
t)
Hei L
ing
Chau
Gove
rnm
ent
Dock
yard
Hebe
Have
n
0
1 0
2 0
3 0
N T 1 S T 1 S T 3 W T 1 W T 3 V T 8 V T 1 2 V T 1 0 V T 2 V T 1 1 V T 4 V T 3 E T 2 E T 1 P T 4 P T 3 P T 2 T T 1
Dep
th-a
vera
ged
Susp
ende
d So
lids
(mg/
L)Figure 7.1 Water quality of typhoon shelters in Hong Kong in 2004
Mean
Min
Max
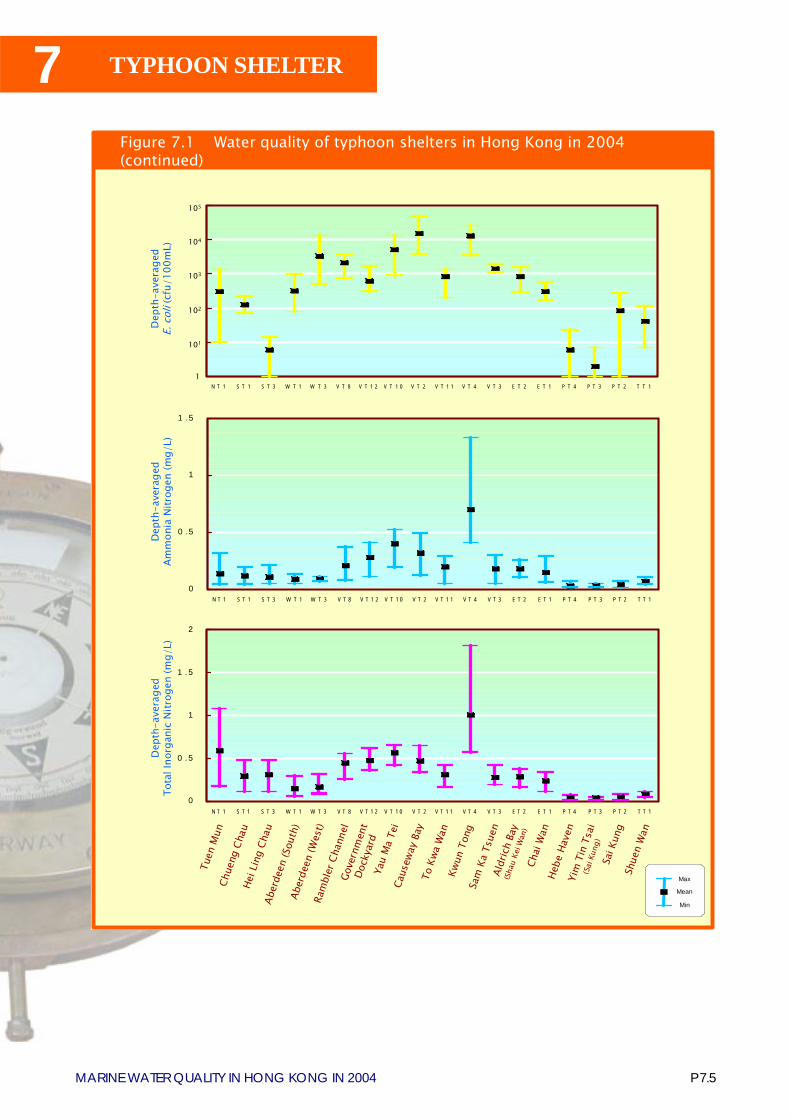
P 7.5MARINE WATER QUALITY IN HONG KONG IN 2004
7 TYPHOON SHELTER
Mean
Min
Max
N T 1 S T 1 S T 3 W T 1 W T 3 V T 8 V T 1 2 V T 1 0 V T 2 V T 1 1 V T 4 V T 3 E T 2 E T 1 P T 4 P T 3 P T 2 T T 1
102
103
104
105
1
Dep
th-a
vera
ged
E. c
oli (
cfu/
100m
L)D
epth
-ave
rage
dAm
mon
ia N
itrog
en (m
g/L)
0
0 .5
1
1 .5
N T 1 S T 1 S T 3 W T 1 W T 3 V T 8 V T 1 2 V T 1 0 V T 2 V T 1 1 V T 4 V T 3 E T 2 E T 1 P T 4 P T 3 P T 2 T T 1
0
0 .5
1
1 .5
2
N T 1 S T 1 S T 3 W T 1 W T 3 V T 8 V T 1 2 V T 1 0 V T 2 V T 1 1 V T 4 V T 3 E T 2 E T 1 P T 4 P T 3 P T 2 T T 1
Dep
th-a
vera
ged
Tota
l Ino
rgan
ic N
itrog
en (m
g/L)
101
Tuen
Mun
Chue
ngCh
au
Ram
bler
Cha
nnel
Caus
eway
Bay
To K
waW
an
Sai K
ung
Kwun
Tong
Yau
Ma
Tei
Aldr
ich
Bay
(Sha
uKe
i Wan
)
Sam
Ka
Tsue
n
Chai
Wan
Yim
Tin
Tsai
(Sai
Kung
)
Shue
nW
an
Aber
deen
(Sou
th)
Aber
deen
(Wes
t)
Hei L
ing
Chau
Gove
rnm
ent
Dock
yard
Hebe
Have
n
Figure 7.1 Water quality of typhoon shelters in Hong Kong in 2004(continued)
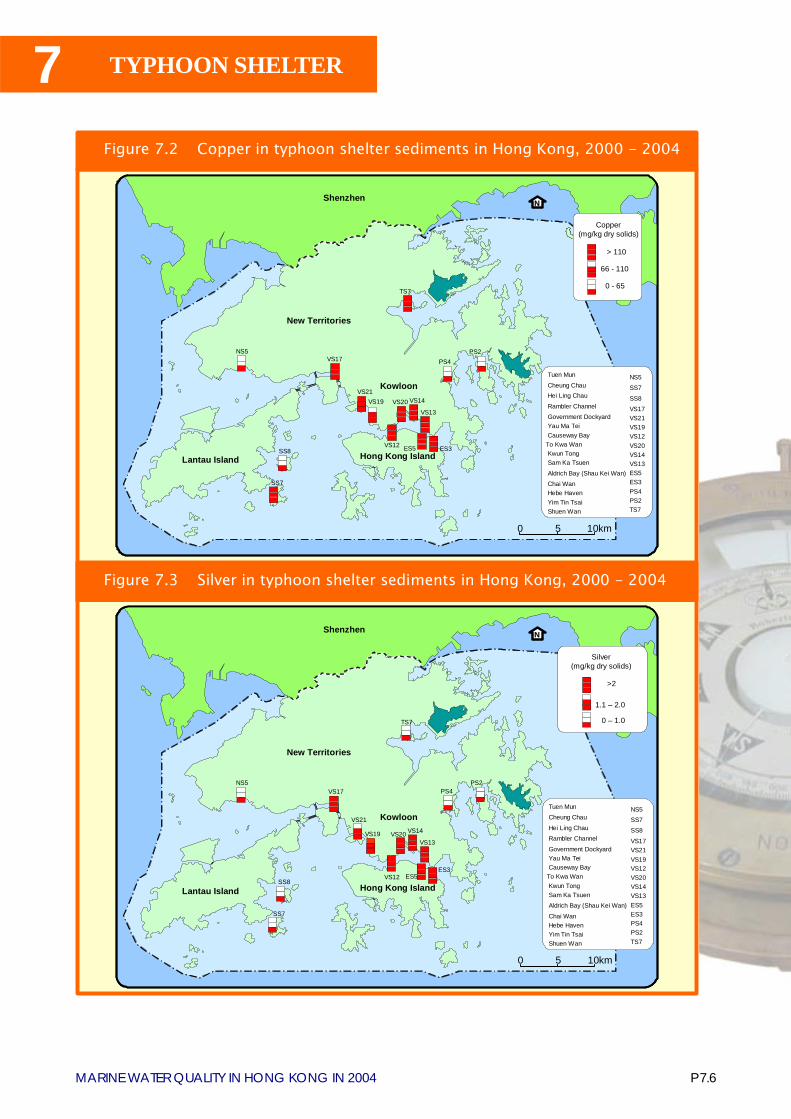
7
P 7.6MARINE WATER QUALITY IN HONG KONG IN 2004
TYPHOON SHELTER
0 5 10km
NShenzhen
New Territories
Lantau Island Hong Kong Island
Kowloon
TS7
PS2
VS13
VS14VS20VS19
ES5ES3
SS7
NS5VS17
VS12
Silver(mg/kg dry solids)
>2
1.1 – 2.0
0 – 1.0
VS21
SS8
PS4
Tuen MunCheung Chau
Hei Ling ChauRambler Channel
Government DockyardYau Ma TeiCauseway Bay
To Kwa WanKwun TongSam Ka TsuenAldrich Bay (Shau Kei Wan)
Chai WanHebe Haven Yim Tin TsaiShuen Wan
NS5SS7SS8
VS17VS21VS19VS12VS20VS14VS13ES5ES3PS4PS2TS7
Figure 7.3 Silver in typhoon shelter sediments in Hong Kong, 2000 - 2004
0 5 10km
NShenzhen
New Territories
Lantau Island Hong Kong Island
Kowloon
TS7
PS2
VS13
VS14VS20VS19
ES5 ES3
SS7
NS5VS17
VS12
Copper(mg/kg dry solids)
> 110
66 - 110
0 - 65
SS8
PS4
VS21
Tuen Mun
Cheung ChauHei Ling Chau
Rambler ChannelGovernment DockyardYau Ma TeiCauseway Bay
To Kwa WanKwun TongSam Ka Tsuen
Aldrich Bay (Shau Kei Wan)Chai WanHebe Haven Yim Tin TsaiShuen Wan
NS5SS7
SS8VS17VS21VS19VS12VS20VS14VS13ES5ES3PS4PS2TS7
Figure 7.2 Copper in typhoon shelter sediments in Hong Kong, 2000 - 2004

P 7.7MARINE WATER QUALITY IN HONG KONG IN 2004
7 TYPHOON SHELTER
0 5 10km
NShenzhen
New Territories
Lantau Island Hong Kong Island
Kowloon
TS7
PS2
VS13
VS14VS20VS19
ES5 ES3
SS7
NS5VS17
VS12
Zinc(mg/kg dry solids)
>270
201 - 270
0 - 200
SS8
PS4
VS21
Tuen MunCheung Chau
Hei Ling ChauRambler Channel
Government DockyardYau Ma TeiCauseway BayTo Kwa WanKwun TongSam Ka Tsuen
Aldrich Bay (Shau Kei Wan)Chai WanHebe Haven Yim Tin TsaiShuen Wan
NS5
SS7SS8
VS17VS21VS19VS12VS20VS14VS13ES5ES3PS4PS2TS7
Figure 7.4 Zinc in typhoon shelter sediments in Hong Kong, 2000 - 2004
0 5 10km
NShenzhen
New Territories
Lantau Island Hong Kong Island
Kowloon
TS7
PS2
VS13
VS14VS20VS19
ES5 ES3
SS7
NS5VS17
VS12
Total PCBs(μg/kg dry solids)
>180
24 - 180
0 - 23
SS8
PS4
VS21
Tuen MunCheung Chau
Hei Ling ChauRambler Channel
Government DockyardYau Ma TeiCauseway Bay
To Kwa WanKwun TongSam Ka TsuenAldrich Bay (Shau Kei Wan)
Chai WanHebe Haven Yim Tin TsaiShuen Wan
NS5SS7
SS8VS17VS21VS19VS12VS20VS14VS13ES5ES3PS4PS2TS7
Figure 7.5 Total polychlorinated biphenyls (PCBs) in typhoon shelter sediments in Hong Kong, 2002 - 2004
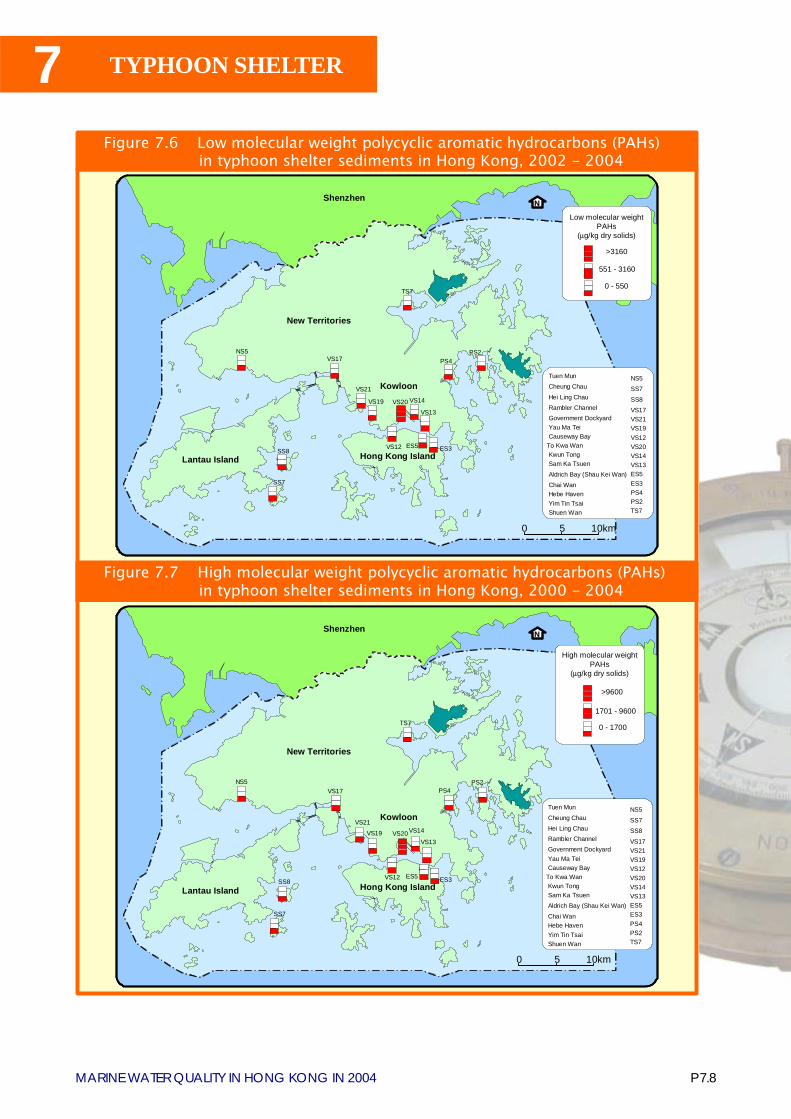
7
P 7.8MARINE WATER QUALITY IN HONG KONG IN 2004
TYPHOON SHELTER
0 5 10km
NShenzhen
New Territories
Lantau Island Hong Kong Island
Kowloon
TS7
PS2
VS13
VS14VS20VS19
ES5 ES3
SS7
NS5VS17
VS12
Low molecular weight PAHs
(μg/kg dry solids)
>3160
551 - 3160
0 - 550
SS8
VS21
PS4
Tuen MunCheung Chau
Hei Ling ChauRambler ChannelGovernment DockyardYau Ma TeiCauseway Bay
To Kwa WanKwun TongSam Ka Tsuen
Aldrich Bay (Shau Kei Wan)Chai WanHebe Haven Yim Tin TsaiShuen Wan
NS5SS7
SS8VS17VS21VS19VS12VS20VS14VS13ES5ES3PS4PS2TS7
0 5 10km
NShenzhen
New Territories
Lantau Island Hong Kong Island
Kowloon
TS7
PS2
VS13
VS14VS20VS19
ES5 ES3
SS7
NS5VS17
VS12SS8
VS21
PS4
Tuen Mun
Cheung ChauHei Ling ChauRambler ChannelGovernment DockyardYau Ma TeiCauseway Bay
To Kwa WanKwun TongSam Ka TsuenAldrich Bay (Shau Kei Wan)
Chai WanHebe Haven Yim Tin TsaiShuen Wan
NS5
SS7SS8
VS17VS21VS19VS12VS20VS14VS13ES5ES3PS4PS2TS7
High molecular weight PAHs
(μg/kg dry solids)
>9600
0 - 1700
1701 - 9600
Figure 7.7 High molecular weight polycyclic aromatic hydrocarbons (PAHs) in typhoon shelter sediments in Hong Kong, 2000 - 2004
Figure 7.6 Low molecular weight polycyclic aromatic hydrocarbons (PAHs) in typhoon shelter sediments in Hong Kong, 2002 - 2004
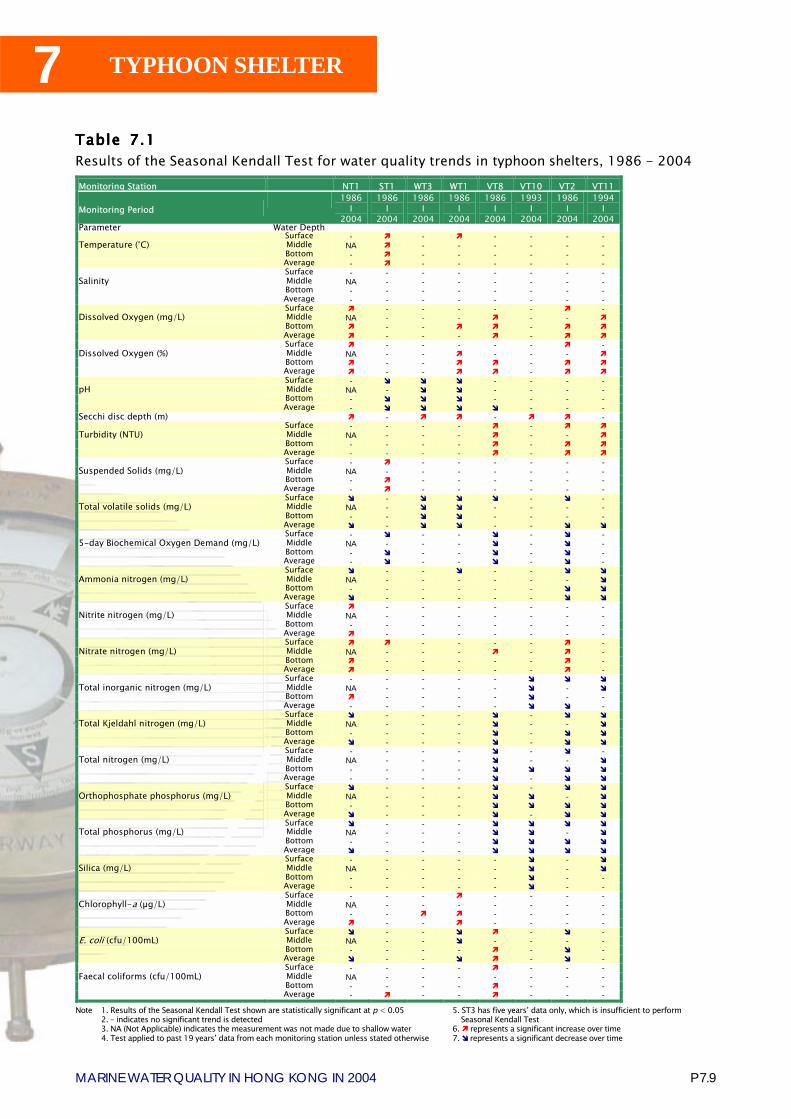
P 7.9MARINE WATER QUALITY IN HONG KONG IN 2004
7 TYPHOON SHELTER
Table Table Table Table Table 77777.....11111Results of the Seasonal Kendall Test for water quality trends in typhoon shelters, 1986 - 2004
Note 1. Results of the Seasonal Kendall Test shown are statistically significant at p < 0.052. � indicates no significant trend is detected3. NA (Not Applicable) indicates the measurement was not made due to shallow water4. Test applied to past 19 years� data from each monitoring station unless stated otherwise
5. ST3 has five years� data only, which is insufficient to perform Seasonal Kendall Test6. ! represents a significant increase over time7. " represents a significant decrease over time
Monitoring Station NT1 ST1 WT3 WT1 VT8 VT10 VT2 VT11
Monitoring Period 1986
I 2004
1986 I
2004
1986 I
2004
1986 I
2004
1986 I
2004
1993 I
2004
1986 I
2004
1994 I
2004 Parameter Water Depth Surface - ! - ! - - - - Temperature (°C) Middle NA ! - - - - - - Bottom - ! - - - - - - Average - ! - - - - - - Surface - - - - - - - - Salinity Middle NA - - - - - - -
Bottom - - - - - - - - Average - - - - - - - -
Surface ! - - - - - ! - Dissolved Oxygen (mg/L) Middle NA - - - ! - - ! Bottom ! - - ! ! - ! ! Average ! - - - ! - ! ! Surface ! - - - - - ! - Dissolved Oxygen (%) Middle NA - - ! - - - ! Bottom ! - - ! ! - ! ! Average ! - - ! ! - ! ! Surface - " " " - - - - pH Middle NA - " " - - - - Bottom - " " " - - - - Average - " " " " - - - Secchi disc depth (m) ! - ! ! - ! ! - Surface - - - - ! - ! ! Turbidity (NTU) Middle NA - - - ! - - ! Bottom - - - - ! - ! ! Average - - - - ! - ! ! Surface - ! - - - - - - Suspended Solids (mg/L) Middle NA - - - - - - - Bottom - ! - - - - - - Average - ! - - - - - - Surface " - " " " - " - Total volatile solids (mg/L) Middle NA - " " - - - - Bottom - - " " - - - - Average " - " " - - " " Surface - " - - " - " - 5-day Biochemical Oxygen Demand (mg/L) Middle NA - - - " - " - Bottom - " - - " - " - Average - " - - " - " - Surface " - - " - - " " Ammonia nitrogen (mg/L) Middle NA - - - - - - " Bottom - - - - - - " " Average " - - - - - " " Surface ! - - - - - - - Nitrite nitrogen (mg/L) Middle NA - - - - - - - Bottom - - - - - - - - Average ! - - - - - - - Surface ! ! - - - - ! - Nitrate nitrogen (mg/L) Middle NA - - - ! - ! - Bottom ! - - - - - ! - Average ! - - - - - ! - Surface - - - - - " " " Total inorganic nitrogen (mg/L) Middle NA - - - - " - " Bottom ! - - - - " - - Average - - - - - " " - Surface " - - - " - " " Total Kjeldahl nitrogen (mg/L) Middle NA - - - " - - " Bottom - - - - " - " " Average " - - - " - " " Surface - - - - " - " - Total nitrogen (mg/L) Middle NA - - - " - - " Bottom - - - - " " " " Average - - - - " - " " Surface " - - - " - " " Orthophosphate phosphorus (mg/L) Middle NA - - - " " - " Bottom - - - - " " " " Average " - - - " - " " Surface " - - - " " " " Total phosphorus (mg/L) Middle NA - - - " " - " Bottom - - - - " " " " Average " - - - " " " " Surface - - - - - " - " Silica (mg/L) Middle NA - - - - " - " Bottom - - - - - " - - Average - - - - - " - - Surface - - - ! - - - - Chlorophyll-a (µg/L) Middle NA - - - - - - - Bottom - - ! ! - - - - Average ! - - ! - - - - Surface " - - " ! - " - E. coli (cfu/100mL) Middle NA - - " - - - - Bottom - - - - ! - " - Average " - - " ! - " -
Surface - - - - ! - - - Faecal coliforms (cfu/100mL) Middle NA - - - - - - - Bottom - - - - ! - - - Average - ! - - ! - - -
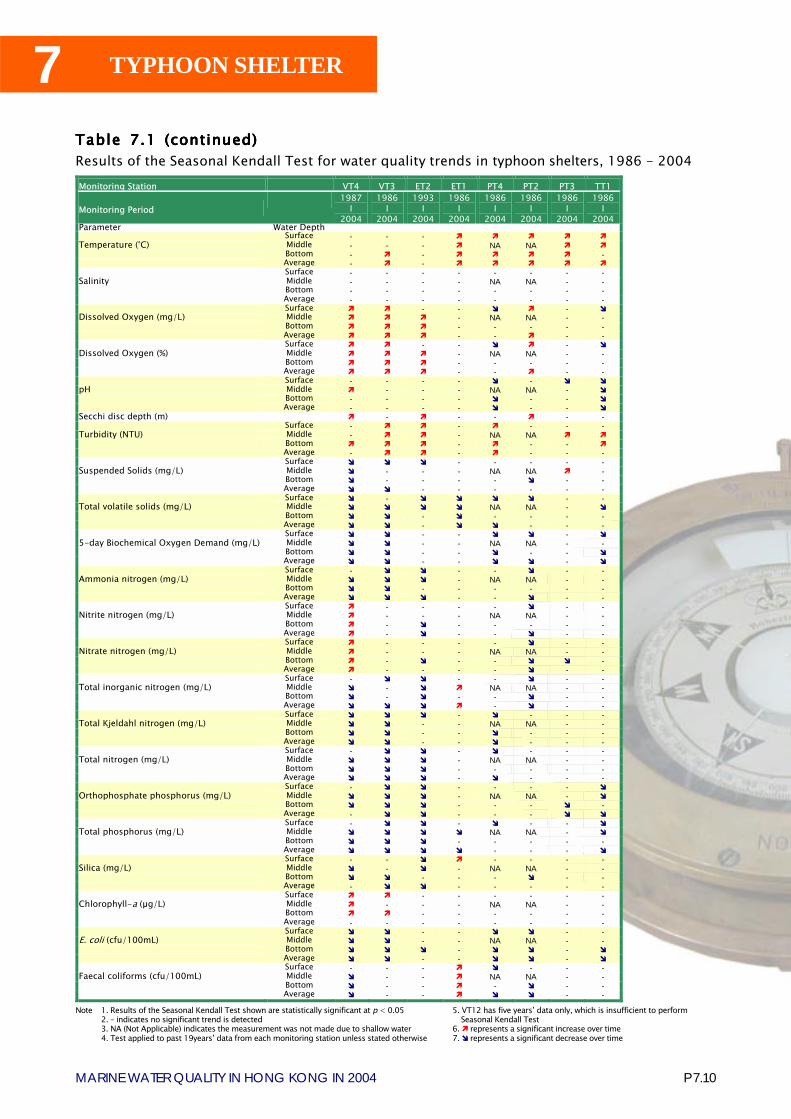
7
P 7.10MARINE WATER QUALITY IN HONG KONG IN 2004
TYPHOON SHELTER
Table Table Table Table Table 77777.....1 (continued)1 (continued)1 (continued)1 (continued)1 (continued)Results of the Seasonal Kendall Test for water quality trends in typhoon shelters, 1986 - 2004
Note 1. Results of the Seasonal Kendall Test shown are statistically significant at p < 0.052. � indicates no significant trend is detected3. NA (Not Applicable) indicates the measurement was not made due to shallow water4. Test applied to past 19years� data from each monitoring station unless stated otherwise
5. VT12 has five years� data only, which is insufficient to perform Seasonal Kendall Test6. ! represents a significant increase over time7. " represents a significant decrease over time
Monitoring Station VT4 VT3 ET2 ET1 PT4 PT2 PT3 TT1
Monitoring Period 1987
I 2004
1986 I
2004
1993 I
2004
1986 I
2004
1986 I
2004
1986 I
2004
1986 I
2004
1986 I
2004 Parameter Water Depth Surface - - - ! ! ! ! ! Temperature (°C) Middle - - - ! NA NA ! ! Bottom - ! - ! ! ! ! - Average - ! - ! ! ! ! ! Surface - - - - - - - - Salinity Middle - - - - NA NA - -
Bottom - - - - - - - - Average - - - - - - - -
Surface ! ! - - " ! - " Dissolved Oxygen (mg/L) Middle ! ! ! - NA NA - - Bottom ! ! ! - - - - - Average ! ! ! - - ! - - Surface ! ! - - " ! - " Dissolved Oxygen (%) Middle ! ! ! - NA NA - - Bottom ! ! ! - - - - - Average ! ! ! - - ! - - Surface - - - - " - " " pH Middle ! - - - NA NA - " Bottom - - - - " - - " Average - - - - " - - " Secchi disc depth (m) ! - ! - - ! - - Surface - ! ! - ! - - - Turbidity (NTU) Middle - ! ! - NA NA ! ! Bottom ! ! ! - ! - - ! Average - ! ! - ! - - - Surface " " " - - - - - Suspended Solids (mg/L) Middle " - - - NA NA ! - Bottom " - - - - " - - Average " " - - - - - - Surface " - " " " " - - Total volatile solids (mg/L) Middle " " " " NA NA - " Bottom " " - " - - - - Average " " - " " - - - Surface " " - - " " - " 5-day Biochemical Oxygen Demand (mg/L) Middle " " - - NA NA - - Bottom " " - - " - - " Average " " - - " " - " Surface - " " - - " - - Ammonia nitrogen (mg/L) Middle " " " - NA NA - - Bottom " " - - - - - - Average " " " - - " - - Surface ! - - - - " - - Nitrite nitrogen (mg/L) Middle ! - - - NA NA - - Bottom ! - " - - - - - Average ! - " - - " - - Surface ! - - - - " - - Nitrate nitrogen (mg/L) Middle ! - - - NA NA - - Bottom ! - " - - " " - Average ! - - - - " - - Surface - " " - - " - - Total inorganic nitrogen (mg/L) Middle " - " ! NA NA - - Bottom " - " - - " - - Average " " " ! - " - - Surface " " " - " - - - Total Kjeldahl nitrogen (mg/L) Middle " " - - NA NA - - Bottom " " - - " - - - Average " " - - " - - - Surface - " " - " - - - Total nitrogen (mg/L) Middle " " " - NA NA - - Bottom " " " - - - - - Average " " " - " - - - Surface - " " - - - - " Orthophosphate phosphorus (mg/L) Middle " " " - NA NA - " Bottom " " " - - - " - Average - " " - - - " " Surface - " " - " - - " Total phosphorus (mg/L) Middle " " " " NA NA - " Bottom " " " - - - - - Average " " " " - - - " Surface - - " ! - - - - Silica (mg/L) Middle " - " - NA NA - - Bottom " " - - - " - - Average - " " - - - - - Surface ! ! - - - - - - Chlorophyll-a (µg/L) Middle ! - - - NA NA - - Bottom ! ! - - - - - - Average - - - - - - - - Surface " " - - " " - - E. coli (cfu/100mL) Middle " " - - NA NA - - Bottom " " " - " " - " Average " " - - " " - "
Surface - - - ! " - - - Faecal coliforms (cfu/100mL) Middle " - - ! NA NA - - Bottom " - - ! - " - - Average " - - ! " " - -

P 7.11MARINE WATER QUALITY IN HONG KONG IN 2004
7 TYPHOON SHELTER
Table Table Table Table Table 77777.....22222Summary water quality statistics of typhoon shelters in 2004
Note : 1. Unless otherwise specified, data presented are depth-averaged (A) values calculated by taking the means of three depths: Surface(S), Mid-depth (M), Bottom (B).
2. Data presented are annual arithmetic means of the depth-averaged results except for E.coli and faecal coliforms which are annualgeometric means.
3. Data in brackets indicate the ranges.4. NM - not measured
Tuen MunParameter NT1 ST1 ST3 WT1 WT3 VT8
Nu m ber o f sam pl es 6 6 6 6 6 624.5 24.4 24.3 23.8 23.7 23.4
(15.6 - 29.4) (19.3 - 29.0) (19.3 - 28.8) (18.0 - 27.5) (18.0 - 27.7) (16.1 - 27.7)28.4 30.7 30.8 32.0 32.0 31.0
(19.2 - 33.1) (23.1 - 33.7) (25.1 - 33.5) (28.4 - 34.1) (28.0 - 34.1) (26.1 - 33.2)6.6 6.8 7.2 6.1 5.9 5.4
(4.3 - 8.5) (4.8 - 9.0) (3.9 - 10.0) (4.1 - 7.5) (4.7 - 7.5) (2.3 - 7.4)N.M. 6.9 7.2 5.9 5.9 5.4
(5.0 - 9.4) (3.8 - 10.1) (4.3 - 7.5) (5.0 - 7.5) (2.2 - 7.4)88 95 102 84 81 70
(65 - 125) (72 - 133) (57 - 149) (61 - 99) (71 - 98) (34 - 85)N.M. 96 100 81 81 71
(74 - 139) (56 - 151) (63 - 94) (73 - 89) (33 - 86)8.0 8.1 8.1 8.1 8.1 8.0
(7.9 - 8.4) (7.9 - 8.5) (7.9 - 8.4) (8.0 - 8.3) (8.0 - 8.3) (7.9 - 8.1)1.5 1.8 2.0 2.6 2.6 1.7
(0.8 - 2.3) (1.0 - 3.3) (1.1 - 3.4) (1.2 - 5.3) (1.6 - 4.2) (1.0 - 3.8)15.9 11.5 10.1 8.4 8.6 12.7
(9.4 - 33.7) (9.4 - 13.4) (8.5 - 12.2) (6.7 - 9.9) (6.9 - 10.5) (8.5 - 19.8)11.6 9.4 6.1 3.8 3.8 14.2
(5.5 - 18.0) (4.5 - 20.2) (3.4 - 9.5) (1.3 - 6.9) (1.8 - 6.1) (8.2 - 25.0)1.3 1.5 1.5 0.9 1.1 0.9
(0.6 - 3.2) (0.5 - 3.8) (0.4 - 3.7) (0.5 - 1.7) (0.5 - 1.7) (0.4 - 1.6)0.14 0.12 0.11 0.09 0.09 0.21
(0.04 - 0.32) (0.04 - 0.19) (0.05 - 0.21) (0.05 - 0.13) (0.07 - 0.11) (0.08 - 0.37)0.006 0.006 0.006 0.005 0.005 0.008
(0.003 - 0.013) (0.004 - 0.006) (0.004 - 0.007) (0.002 - 0.012) (0.003 - 0.011) (0.003 - 0.019)0.08 0.02 0.03 0.01 0.01 0.04
(0.01 - 0.19) (<0.01 - 0.05) (<0.01 - 0.07) (<0.01 - 0.02) (<0.01 - 0.03) (0.01 - 0.09)0.37 0.16 0.16 0.05 0.06 0.20
(0.05 - 0.83) (0.03 - 0.29) (0.03 - 0.29) (0.01 - 0.16) (0.02 - 0.19) (0.06 - 0.38) 0.59 0.30 0.31 0.15 0.17 0.45
(0.18 - 1.08) (0.11 - 0.48) (0.11 - 0.48) (0.06 - 0.30) (0.09 - 0.31) (0.26 - 0.55)0.30 0.28 0.27 0.19 0.21 0.37
(0.16 - 0.43) (0.23 - 0.37) (0.19 - 0.38) (0.13 - 0.25) (0.16 - 0.25) (0.26 - 0.61)0.76 0.46 0.46 0.25 0.28 0.61
(0.29 - 1.18) (0.25 - 0.69) (0.30 - 0.63) (0.15 - 0.41) (0.18 - 0.42) (0.35 - 0.80)0.03 0.02 0.02 0.01 0.01 0.03
(<0.01 - 0.05) (0.01 - 0.03) (<0.01 - 0.03) (0.01 - 0.02) (0.01 - 0.02) (0.01 - 0.06)0.05 0.04 0.04 0.03 0.03 0.06
(0.03 - 0.06) (0.03 - 0.05) (0.02 - 0.05) (0.02 - 0.03) (0.02 - 0.03) (0.04 - 0.09)1.4 0.9 0.8 0.4 0.4 0.9
(0.1 - 3.4) (0.1 - 2.6) (0.1 - 2.5) (0.2 - 0.9) (0.2 - 0.6) (0.3 - 1.4)6.2 7.6 9.4 2.1 2.5 4.7
(1.1 - 18.0) (1.4 - 27.0) (1.6 - 30.0) (0.4 - 4.3) (0.4 - 4.8) (0.6 - 14.3)120 120 4 220 1800 1900
(10 - 1300) (71 - 220) (1 - 14) (79 - 960) (510 - 13000) (730 - 3400)440 270 6 610 3000 4400
(60 - 8800) (140 - 480) (1 - 45) (170 - 3800) (720 - 23000) (1000 - 18000)
Hei LingChau
Aberdeen(South)
Aberdeen(West)
RamblerChannel
Bottom
Dissolv ed Ox y gen (% Saturation)
Bottom
CheungChau
Temperature (°C)
Salinity
pH
Secchi Disc Depth (m)
Dissolv ed Ox y gen (mg/L)
Turbidity (NTU)
Suspended Solids (mg/L)
Ammonia Nitrogen (mg/L)
Unionised Ammonia (mg/L)
Nitrite Nitrogen (mg/L)
5-day Biochemical Ox y gen Demand (mg/L)
Orthophosphate Phosphorus (mg/L)
Nitrate Nitrogen (mg/L)
Total Inorganic Nitrogen (mg/L)
Total Kjeldahl Nitrogen (mg/L)
Total Nitrogen (mg/L)
E.coli (cfu/100mL)
Faecal Coliforms (cfu/100mL)
Total Phosphorus (mg/L)
Silica (as SiO2) (mg/L)
Chlorophy ll-a (µg/L)
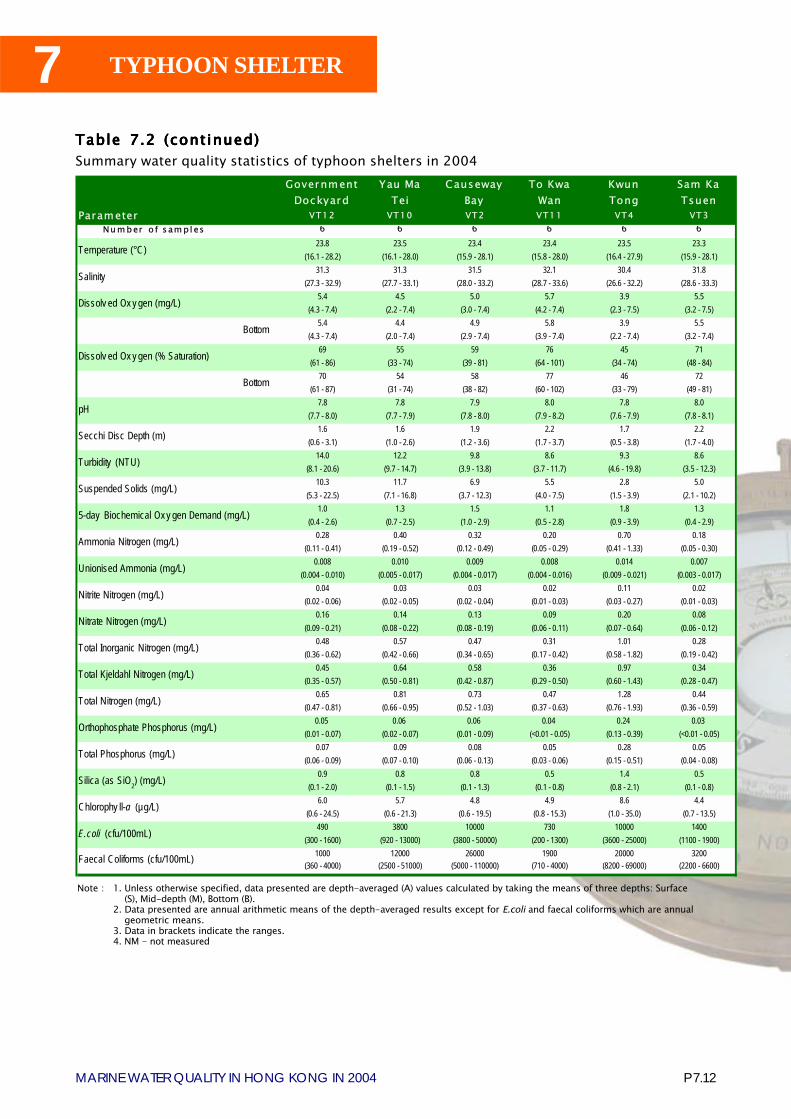
7
P 7.12MARINE WATER QUALITY IN HONG KONG IN 2004
TYPHOON SHELTER
Table Table Table Table Table 7.2 7.2 7.2 7.2 7.2 (continued)(continued)(continued)(continued)(continued)Summary water quality statistics of typhoon shelters in 2004
Note : 1. Unless otherwise specified, data presented are depth-averaged (A) values calculated by taking the means of three depths: Surface(S), Mid-depth (M), Bottom (B).
2. Data presented are annual arithmetic means of the depth-averaged results except for E.coli and faecal coliforms which are annualgeometric means.
3. Data in brackets indicate the ranges.4. NM - not measured
Parameter VT12 VT10 VT2 VT11 VT4 VT3Nu m ber o f s am pl es 6 6 6 6 6 6
23.8 23.5 23.4 23.4 23.5 23.3(16.1 - 28.2) (16.1 - 28.0) (15.9 - 28.1) (15.8 - 28.0) (16.4 - 27.9) (15.9 - 28.1)
31.3 31.3 31.5 32.1 30.4 31.8(27.3 - 32.9) (27.7 - 33.1) (28.0 - 33.2) (28.7 - 33.6) (26.6 - 32.2) (28.6 - 33.3)
5.4 4.5 5.0 5.7 3.9 5.5(4.3 - 7.4) (2.2 - 7.4) (3.0 - 7.4) (4.2 - 7.4) (2.3 - 7.5) (3.2 - 7.5)
5.4 4.4 4.9 5.8 3.9 5.5(4.3 - 7.4) (2.0 - 7.4) (2.9 - 7.4) (3.9 - 7.4) (2.2 - 7.4) (3.2 - 7.4)
69 55 59 76 45 71(61 - 86) (33 - 74) (39 - 81) (64 - 101) (34 - 74) (48 - 84)
70 54 58 77 46 72(61 - 87) (31 - 74) (38 - 82) (60 - 102) (33 - 79) (49 - 81)
7.8 7.8 7.9 8.0 7.8 8.0(7.7 - 8.0) (7.7 - 7.9) (7.8 - 8.0) (7.9 - 8.2) (7.6 - 7.9) (7.8 - 8.1)
1.6 1.6 1.9 2.2 1.7 2.2(0.6 - 3.1) (1.0 - 2.6) (1.2 - 3.6) (1.7 - 3.7) (0.5 - 3.8) (1.7 - 4.0)
14.0 12.2 9.8 8.6 9.3 8.6(8.1 - 20.6) (9.7 - 14.7) (3.9 - 13.8) (3.7 - 11.7) (4.6 - 19.8) (3.5 - 12.3)
10.3 11.7 6.9 5.5 2.8 5.0(5.3 - 22.5) (7.1 - 16.8) (3.7 - 12.3) (4.0 - 7.5) (1.5 - 3.9) (2.1 - 10.2)
1.0 1.3 1.5 1.1 1.8 1.3(0.4 - 2.6) (0.7 - 2.5) (1.0 - 2.9) (0.5 - 2.8) (0.9 - 3.9) (0.4 - 2.9)
0.28 0.40 0.32 0.20 0.70 0.18(0.11 - 0.41) (0.19 - 0.52) (0.12 - 0.49) (0.05 - 0.29) (0.41 - 1.33) (0.05 - 0.30)
0.008 0.010 0.009 0.008 0.014 0.007(0.004 - 0.010) (0.005 - 0.017) (0.004 - 0.017) (0.004 - 0.016) (0.009 - 0.021) (0.003 - 0.017)
0.04 0.03 0.03 0.02 0.11 0.02(0.02 - 0.06) (0.02 - 0.05) (0.02 - 0.04) (0.01 - 0.03) (0.03 - 0.27) (0.01 - 0.03)
0.16 0.14 0.13 0.09 0.20 0.08(0.09 - 0.21) (0.08 - 0.22) (0.08 - 0.19) (0.06 - 0.11) (0.07 - 0.64) (0.06 - 0.12)
0.48 0.57 0.47 0.31 1.01 0.28(0.36 - 0.62) (0.42 - 0.66) (0.34 - 0.65) (0.17 - 0.42) (0.58 - 1.82) (0.19 - 0.42)
0.45 0.64 0.58 0.36 0.97 0.34(0.35 - 0.57) (0.50 - 0.81) (0.42 - 0.87) (0.29 - 0.50) (0.60 - 1.43) (0.28 - 0.47)
0.65 0.81 0.73 0.47 1.28 0.44(0.47 - 0.81) (0.66 - 0.95) (0.52 - 1.03) (0.37 - 0.63) (0.76 - 1.93) (0.36 - 0.59)
0.05 0.06 0.06 0.04 0.24 0.03(0.01 - 0.07) (0.02 - 0.07) (0.01 - 0.09) (<0.01 - 0.05) (0.13 - 0.39) (<0.01 - 0.05)
0.07 0.09 0.08 0.05 0.28 0.05(0.06 - 0.09) (0.07 - 0.10) (0.06 - 0.13) (0.03 - 0.06) (0.15 - 0.51) (0.04 - 0.08)
0.9 0.8 0.8 0.5 1.4 0.5(0.1 - 2.0) (0.1 - 1.5) (0.1 - 1.3) (0.1 - 0.8) (0.8 - 2.1) (0.1 - 0.8)
6.0 5.7 4.8 4.9 8.6 4.4(0.6 - 24.5) (0.6 - 21.3) (0.6 - 19.5) (0.8 - 15.3) (1.0 - 35.0) (0.7 - 13.5)
490 3800 10000 730 10000 1400(300 - 1600) (920 - 13000) (3800 - 50000) (200 - 1300) (3600 - 25000) (1100 - 1900)
1000 12000 26000 1900 20000 3200(360 - 4000) (2500 - 51000) (5000 - 110000) (710 - 4000) (8200 - 69000) (2200 - 6600)
E.coli (cfu/100mL)
Faecal Coliforms (cfu/100mL)
Total Phosphorus (mg/L)
Silica (as SiO2) (mg/L)
Chlorophy ll-a (µg/L)
Orthophosphate Phosphorus (mg/L)
Nitrate Nitrogen (mg/L)
Total Inorganic Nitrogen (mg/L)
Total Kjeldahl Nitrogen (mg/L)
Total Nitrogen (mg/L)
Ammonia Nitrogen (mg/L)
Unionised Ammonia (mg/L)
Nitrite Nitrogen (mg/L)
5-day Biochemical Ox y gen Demand (mg/L)
pH
Secchi Disc Depth (m)
Turbidity (NTU)
Suspended Solids (mg/L)
Bottom
Dissolv ed Ox y gen (% Saturation)
Bottom
Temperature (°C)
Salinity
GovernmentDockyard
Sam KaTsuen
Dissolv ed Ox y gen (mg/L)
CausewayBay
Yau MaTei
To KwaWan
KwunTong
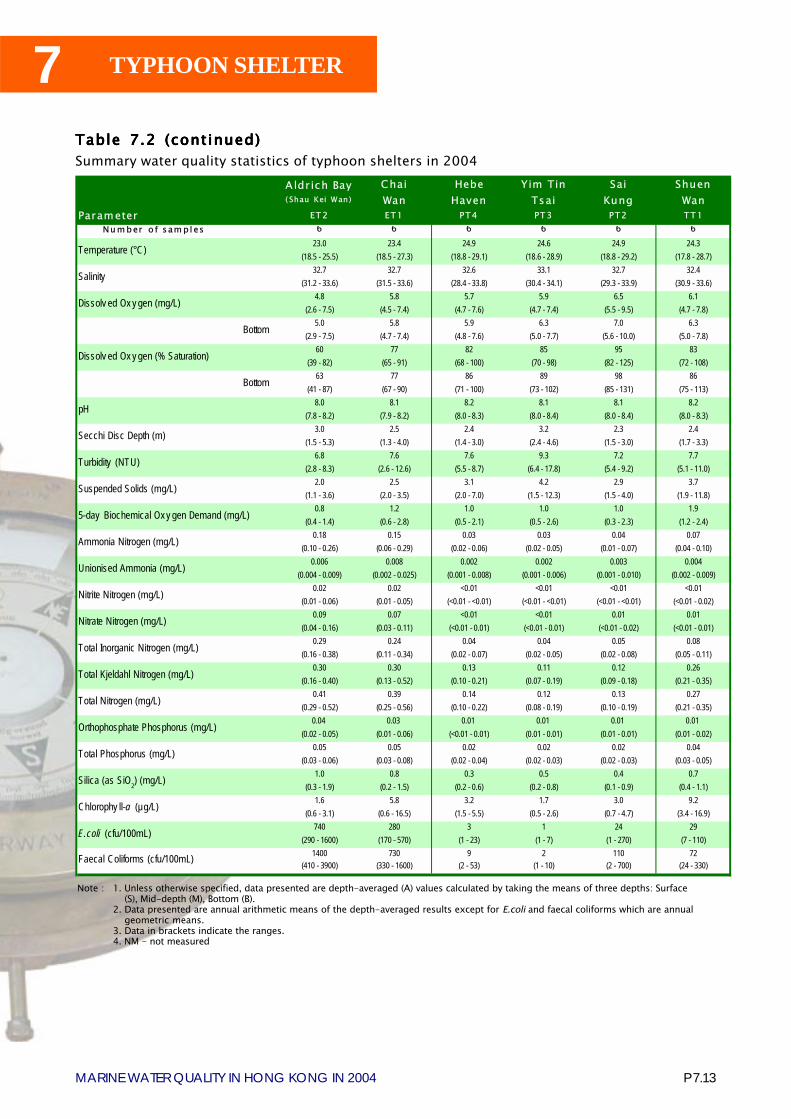
P 7.13MARINE WATER QUALITY IN HONG KONG IN 2004
7 TYPHOON SHELTER
Table Table Table Table Table 77777.....22222 (continued) (continued) (continued) (continued) (continued)Summary water quality statistics of typhoon shelters in 2004
Note : 1. Unless otherwise specified, data presented are depth-averaged (A) values calculated by taking the means of three depths: Surface(S), Mid-depth (M), Bottom (B).
2. Data presented are annual arithmetic means of the depth-averaged results except for E.coli and faecal coliforms which are annualgeometric means.
3. Data in brackets indicate the ranges.4. NM - not measured
Parameter ET2 ET1 PT4 PT3 PT2 TT1Nu m ber o f sam pl es 6 6 6 6 6 6
23.0 23.4 24.9 24.6 24.9 24.3(18.5 - 25.5) (18.5 - 27.3) (18.8 - 29.1) (18.6 - 28.9) (18.8 - 29.2) (17.8 - 28.7)
32.7 32.7 32.6 33.1 32.7 32.4(31.2 - 33.6) (31.5 - 33.6) (28.4 - 33.8) (30.4 - 34.1) (29.3 - 33.9) (30.9 - 33.6)
4.8 5.8 5.7 5.9 6.5 6.1(2.6 - 7.5) (4.5 - 7.4) (4.7 - 7.6) (4.7 - 7.4) (5.5 - 9.5) (4.7 - 7.8)
5.0 5.8 5.9 6.3 7.0 6.3(2.9 - 7.5) (4.7 - 7.4) (4.8 - 7.6) (5.0 - 7.7) (5.6 - 10.0) (5.0 - 7.8)
60 77 82 85 95 83(39 - 82) (65 - 91) (68 - 100) (70 - 98) (82 - 125) (72 - 108)
63 77 86 89 98 86(41 - 87) (67 - 90) (71 - 100) (73 - 102) (85 - 131) (75 - 113)
8.0 8.1 8.2 8.1 8.1 8.2(7.8 - 8.2) (7.9 - 8.2) (8.0 - 8.3) (8.0 - 8.4) (8.0 - 8.4) (8.0 - 8.3)
3.0 2.5 2.4 3.2 2.3 2.4(1.5 - 5.3) (1.3 - 4.0) (1.4 - 3.0) (2.4 - 4.6) (1.5 - 3.0) (1.7 - 3.3)
6.8 7.6 7.6 9.3 7.2 7.7(2.8 - 8.3) (2.6 - 12.6) (5.5 - 8.7) (6.4 - 17.8) (5.4 - 9.2) (5.1 - 11.0)
2.0 2.5 3.1 4.2 2.9 3.7(1.1 - 3.6) (2.0 - 3.5) (2.0 - 7.0) (1.5 - 12.3) (1.5 - 4.0) (1.9 - 11.8)
0.8 1.2 1.0 1.0 1.0 1.9(0.4 - 1.4) (0.6 - 2.8) (0.5 - 2.1) (0.5 - 2.6) (0.3 - 2.3) (1.2 - 2.4)
0.18 0.15 0.03 0.03 0.04 0.07(0.10 - 0.26) (0.06 - 0.29) (0.02 - 0.06) (0.02 - 0.05) (0.01 - 0.07) (0.04 - 0.10)
0.006 0.008 0.002 0.002 0.003 0.004(0.004 - 0.009) (0.002 - 0.025) (0.001 - 0.008) (0.001 - 0.006) (0.001 - 0.010) (0.002 - 0.009)
0.02 0.02 <0.01 <0.01 <0.01 <0.01(0.01 - 0.06) (0.01 - 0.05) (<0.01 - <0.01) (<0.01 - <0.01) (<0.01 - <0.01) (<0.01 - 0.02)
0.09 0.07 <0.01 <0.01 0.01 0.01(0.04 - 0.16) (0.03 - 0.11) (<0.01 - 0.01) (<0.01 - 0.01) (<0.01 - 0.02) (<0.01 - 0.01)
0.29 0.24 0.04 0.04 0.05 0.08(0.16 - 0.38) (0.11 - 0.34) (0.02 - 0.07) (0.02 - 0.05) (0.02 - 0.08) (0.05 - 0.11)
0.30 0.30 0.13 0.11 0.12 0.26(0.16 - 0.40) (0.13 - 0.52) (0.10 - 0.21) (0.07 - 0.19) (0.09 - 0.18) (0.21 - 0.35)
0.41 0.39 0.14 0.12 0.13 0.27(0.29 - 0.52) (0.25 - 0.56) (0.10 - 0.22) (0.08 - 0.19) (0.10 - 0.19) (0.21 - 0.35)
0.04 0.03 0.01 0.01 0.01 0.01(0.02 - 0.05) (0.01 - 0.06) (<0.01 - 0.01) (0.01 - 0.01) (0.01 - 0.01) (0.01 - 0.02)
0.05 0.05 0.02 0.02 0.02 0.04(0.03 - 0.06) (0.03 - 0.08) (0.02 - 0.04) (0.02 - 0.03) (0.02 - 0.03) (0.03 - 0.05)
1.0 0.8 0.3 0.5 0.4 0.7(0.3 - 1.9) (0.2 - 1.5) (0.2 - 0.6) (0.2 - 0.8) (0.1 - 0.9) (0.4 - 1.1)
1.6 5.8 3.2 1.7 3.0 9.2(0.6 - 3.1) (0.6 - 16.5) (1.5 - 5.5) (0.5 - 2.6) (0.7 - 4.7) (3.4 - 16.9)
740 280 3 1 24 29(290 - 1600) (170 - 570) (1 - 23) (1 - 7) (1 - 270) (7 - 110)
1400 730 9 2 110 72(410 - 3900) (330 - 1600) (2 - 53) (1 - 10) (2 - 700) (24 - 330)
Yim TinTsai
ChaiWan
Bottom
Temperature (°C)
Salinity
Aldr ich Bay( Shau Kei Wan)
Dissolv ed Ox y gen (mg/L)
Bottom
Dissolv ed Ox y gen (% Saturation)
Nitrite Nitrogen (mg/L)
5-day Biochemical Ox y gen Demand (mg/L)
pH
Secchi Disc Depth (m)
Turbidity (NTU)
Suspended Solids (mg/L)
E.coli (cfu/100mL)
Faecal Coliforms (cfu/100mL)
Total Phosphorus (mg/L)
Silica (as SiO2) (mg/L)
Chlorophy ll-a (µg/L)
ShuenWan
SaiKung
HebeHaven
Orthophosphate Phosphorus (mg/L)
Nitrate Nitrogen (mg/L)
Total Inorganic Nitrogen (mg/L)
Total Kjeldahl Nitrogen (mg/L)
Total Nitrogen (mg/L)
Ammonia Nitrogen (mg/L)
Unionised Ammonia (mg/L)

7
P 7.14MARINE WATER QUALITY IN HONG KONG IN 2004
TYPHOON SHELTER
TuenMun
CheungChau
Hei LingChau
RamblerChannel
GovernmentDockyard
Yau MaTei
CausewayBay
Parameter NS5 SS7 SS8 10 VS17 VS21 10 VS19 VS12Number of samples 10 10 6 10 6 10 10
67.15 66.32 93.56 72.68 96.66 75.65 79.29(39-85) (7-97) (87-99) (42-86) (89-100) (59-93) (27-98)-196.7 -220.2 -183 -293 -317.2 -366.6 -350.7
((-286)-(-85)) ((-300)-(-130)) ((-278)-(-25)) ((-366)-(-184)) ((-388)-(-97)) ((-407)-(-270)) ((-407)-(-266))47.5 45.2 38.7 45.4 36.8 49.2 41.9
(39-58) (34-68) (34-45) (40-53) (31-44) (41-59) (33-68)7 7.51 8.1 8.06 8.45 7.13 8.7
(5.8-8.4) (3.8-8.5) (7.4-8.8) (7.0-8.9) (7.4-9.4) (6.0-8.1) (3.9-11.0)18900 21200 14200 28500 16890 21400 29600
(15000-22000) (10000-27000) (13000-16000) (20000-41000) (9900-21000) (13000-26000) (26000-32000)0.66 0.8 0.51 0.88 0.55 0.78 0.85
(0.5-0.9) (0.6-1.7) (0.5-0.6) (0.7-1.1) (0.5-0.8) (0.5-0.9) (0.7-1.0)8.78 10.86 11.61 15.77 12.52 31.7 36.6
(0.1-28) (2-20) (2-22) (0.1-36) (2-29) (11-48) (4-67)344 447 430 485 358 442 606
(170-580) (180-550) (290-540) (320-640) (310-410) (300-570) (290-820)193 323 187 228 204 216 217
(86-330) (230-510) (160-220) (160-300) (180-230) (160-240) (150-250)122.9 179.2 108.8 863 197.32 329.9 436(1-370) (22-280) (48-200) (200-2500) (8.-630) (26-960) (180-960)0.14 0.19 <0.1 0.39 0.14 0.1 0.17
(<0.1-0.3) (<0.1-0.3) (<0.1-0.2) (0.2-0.6) (<0.1-0.3) (<0.1-0.2) (<0.1-0.3)8.88 8.41 8.25 8.15 8.8 6.37 8.34
(6.8-11.0) (4.4-11.0) (6.9-12.0) (5.2-10.0) (7.3-9.7) (4.0-8.8) (2.9-12.0)0.24 0.16 <0.1 1.08 0.31 0.46 0.94
(<0.1-0.4) (<0.1-0.3) (<0.1-0.1) (0.5-1.5) (0.1-0.5) (0.1-0.9) (0.2-1.2)34.3 55.8 42.9 198.5 53.2 41.8 69.8
(26-49) (14-70) (34-58) (85-310) (50-56) (26-54) (15-92)45.2 142.8 40 339 127.9 97.9 259.8
(13-83) (41-250) (33-55) (130-490) (29-180) (33-160) (48-410)44.8 63.2 53.9 81.2 51.6 52.4 81.6
(27-60) (39-99) (41-78) (54-110) (34-65) (24-79) (24-110)0.08 0.31 0.17 0.39 0.15 0.3 0.72
(<0.05-0.12) (0.10-0.60) (0.12-0.39) (0.14-1.50) (<0.05-0.21) (0.1-0.74) (0.18-0.95)19.6 18.1 26.4 85.4 31.7 23.7 27
(16-22) (7-23) (22-33) (39-150) (28-36) (18-32) (7-39)0.5 0.5 0.5 8.7 1.6 2 7
(0.2-1.0) (0.3-1.0) (0.5-1.0) (3.0-18.0) (1.0-2.0) (1.0-3.7) (0.8-9.0)137.5 162.5 141 294 210 201.9 292.6
(87-200) (65-210) (120-160) (170-380) (110-270) (99-340) (66-380)18 18.17 18 34.17 20.67 23.33 29.17
(18-18) (18-19) (18-18) (18-48) (18-25) (18-30) (18-55)
90 100 90 114.4 95.83 111.83 116.83
(90-90) (90-118) (90-90) (96-142) (90-117) (98-132) (90-150)
135.9 563.06 80.76 990.5 194.65 656 604.75
(19-291) (128-1427) (38-150) (358-2141) (49-5284) (64-1409) (169-999)
High Molecular Weight Poly cy lic AromaticHy drocarbons (PAHs) (µg/kg) (7) (8) (9)
Low Molecular Weight Poly cy lic AromaticHy drocarbons (PAHs) (µg/kg) (5) (6) (9)
Chemical Ox y gen Demand (mg/kg)
Total Phosphorus (mg/kg)
Total Sulphide (mg/kg)
Arsenic (mg/kg)
Silv er (mg/kg)
Total Cy anide (mg/kg)
Zinc (mg/kg)
Total Poly chlorinated Bipheny ls (PCBs)(µg/kg) (3) (4)
Nickel (mg/kg)
Cadmium (mg/kg)
Chromium (mg/kg)
Copper (mg/kg)
Lead (mg/kg)
Particle Size Fractionation <63µm (%w /w )
Electrochemical Potential (mV)
Total Solids (%w /w )
Mercury (mg/kg)
Total Kjeldahl Nitrogen (mg/kg)
Ammonical Nitrogen (mg/kg)
Total Volatile Soilds (%w /w )
Total Carbon (%w /w )
Table Table Table Table Table 77777.....33333Summary statistics of bottom sediment quality of typhoon shelters, 2000 - 2004
Note : 1. Data presented are arithmetic means ; data in brackets indicate ranges.2. All data are based on the analyses of bulk (unsieved) sediment and are reported on a dry weight basis unless stated otherwise.3. The Technical Circular �ETWB (W) No. 34/2002 Management of Dredged / Excavated Sediment� issued in 2002 has revised the definition of �Total PCBs� as
the summation of 18 specific PCB congeners. Following the new definition, the monitoring of these 18 PCB congeners started in 2002 and the Total PCBsresults only refer to 2002 to 2004.
4. Total PCBs results are derived from the summation of 18 congeners. If the concentration of a congener is below report limit (RL), the result will be taken as0.5xRL in the calculation.
5. Low molecular weight polyaromatic hydrocarbons (PAHs) include 6 congeners of molecular weight below 200, namely : Acenaphthene, Acenaphthylene,Anthracene, Flourene, Naphthalene and Phenanthrene.
6. As the monitoring of Naphthalene only started in 2002, the Low Molecular Weight PAHs results are based on sediments samples collected in 2002 to 2004.7. High molecular weight polyaromatic hydrocarbons (PAHs) include 10 congeners of molecular weight above 200, namely : Fluoranthene, Pyrene, Benzo(a)
anthracene, Chrysene, Benzo(b)fluoranthene, Benzo(k)fluoranthene, Benzo(a)pyrene, Dibenzo(a,h)anthracene, Benzo(g,h,i)perylene and Indeno(1,2,3-cd)pyrene.
8. Low and high molecular weight PAHs results are derived from the summation of the corresponding congeners. If the concentration of a congener is belowreport limit (RL), the result will be taken as 0.5xRL in the calculation.
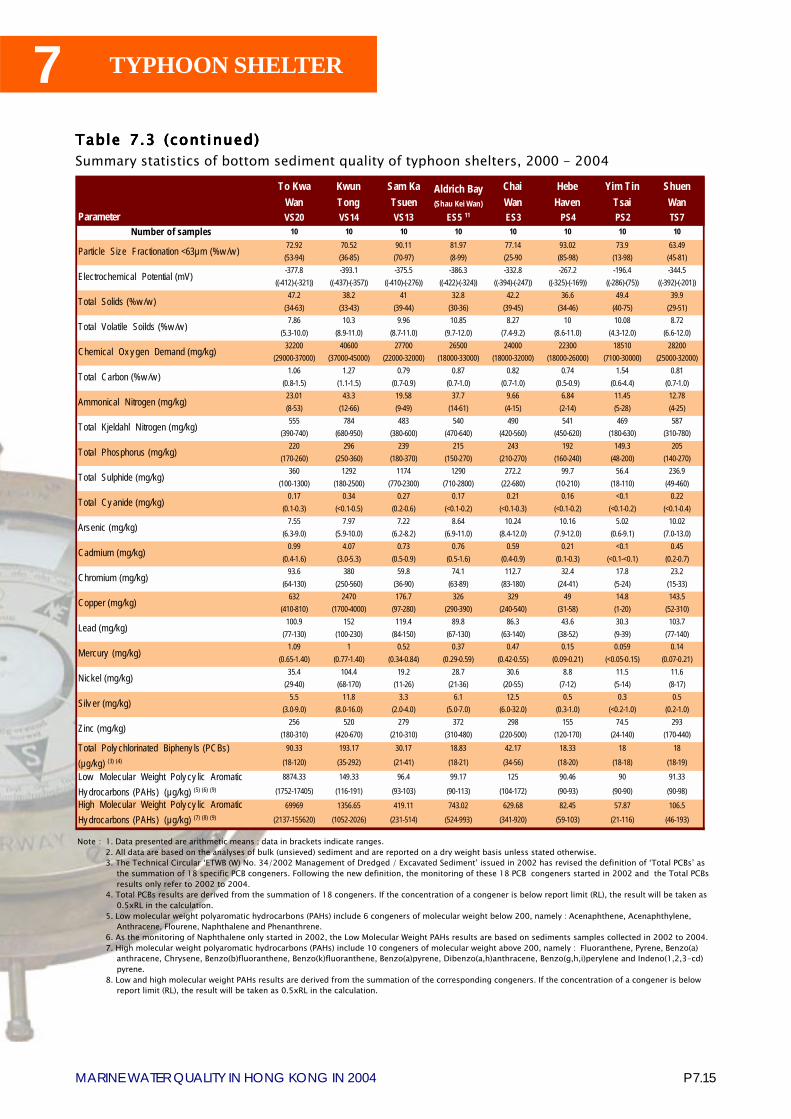
P 7.15MARINE WATER QUALITY IN HONG KONG IN 2004
7 TYPHOON SHELTER
To KwaWan
KwunTong
Sam KaTsuen
Aldrich Bay(Shau Kei Wan)
ChaiWan
HebeHaven
Yim TinTsai
ShuenWan
Parameter VS20 VS14 VS13 ES5 11 ES3 PS4 PS2 TS7Number of samples 10 10 10 10 10 10 10 10
72.92 70.52 90.11 81.97 77.14 93.02 73.9 63.49(53-94) (36-85) (70-97) (8-99) (25-90 (85-98) (13-98) (45-81)-377.8 -393.1 -375.5 -386.3 -332.8 -267.2 -196.4 -344.5
((-412)-(-321)) ((-437)-(-357)) ((-410)-(-276)) ((-422)-(-324)) ((-394)-(-247)) ((-325)-(-169)) ((-286)-(75)) ((-392)-(-201))47.2 38.2 41 32.8 42.2 36.6 49.4 39.9
(34-63) (33-43) (39-44) (30-36) (39-45) (34-46) (40-75) (29-51)7.86 10.3 9.96 10.85 8.27 10 10.08 8.72
(5.3-10.0) (8.9-11.0) (8.7-11.0) (9.7-12.0) (7.4-9.2) (8.6-11.0) (4.3-12.0) (6.6-12.0)32200 40600 27700 26500 24000 22300 18510 28200
(29000-37000) (37000-45000) (22000-32000) (18000-33000) (18000-32000) (18000-26000) (7100-30000) (25000-32000)1.06 1.27 0.79 0.87 0.82 0.74 1.54 0.81
(0.8-1.5) (1.1-1.5) (0.7-0.9) (0.7-1.0) (0.7-1.0) (0.5-0.9) (0.6-4.4) (0.7-1.0)23.01 43.3 19.58 37.7 9.66 6.84 11.45 12.78(8-53) (12-66) (9-49) (14-61) (4-15) (2-14) (5-28) (4-25)555 784 483 540 490 541 469 587
(390-740) (680-950) (380-600) (470-640) (420-560) (450-620) (180-630) (310-780)220 296 239 215 243 192 149.3 205
(170-260) (250-360) (180-370) (150-270) (210-270) (160-240) (48-200) (140-270)360 1292 1174 1290 272.2 99.7 56.4 236.9
(100-1300) (180-2500) (770-2300) (710-2800) (22-680) (10-210) (18-110) (49-460)0.17 0.34 0.27 0.17 0.21 0.16 <0.1 0.22
(0.1-0.3) (<0.1-0.5) (0.2-0.6) (<0.1-0.2) (<0.1-0.3) (<0.1-0.2) (<0.1-0.2) (<0.1-0.4)7.55 7.97 7.22 8.64 10.24 10.16 5.02 10.02
(6.3-9.0) (5.9-10.0) (6.2-8.2) (6.9-11.0) (8.4-12.0) (7.9-12.0) (0.6-9.1) (7.0-13.0)0.99 4.07 0.73 0.76 0.59 0.21 <0.1 0.45
(0.4-1.6) (3.0-5.3) (0.5-0.9) (0.5-1.6) (0.4-0.9) (0.1-0.3) (<0.1-<0.1) (0.2-0.7)93.6 380 59.8 74.1 112.7 32.4 17.8 23.2
(64-130) (250-560) (36-90) (63-89) (83-180) (24-41) (5-24) (15-33)632 2470 176.7 326 329 49 14.8 143.5
(410-810) (1700-4000) (97-280) (290-390) (240-540) (31-58) (1-20) (52-310)100.9 152 119.4 89.8 86.3 43.6 30.3 103.7
(77-130) (100-230) (84-150) (67-130) (63-140) (38-52) (9-39) (77-140)1.09 1 0.52 0.37 0.47 0.15 0.059 0.14
(0.65-1.40) (0.77-1.40) (0.34-0.84) (0.29-0.59) (0.42-0.55) (0.09-0.21) (<0.05-0.15) (0.07-0.21)35.4 104.4 19.2 28.7 30.6 8.8 11.5 11.6
(29-40) (68-170) (11-26) (21-36) (20-55) (7-12) (5-14) (8-17)5.5 11.8 3.3 6.1 12.5 0.5 0.3 0.5
(3.0-9.0) (8.0-16.0) (2.0-4.0) (5.0-7.0) (6.0-32.0) (0.3-1.0) (<0.2-1.0) (0.2-1.0)256 520 279 372 298 155 74.5 293
(180-310) (420-670) (210-310) (310-480) (220-500) (120-170) (24-140) (170-440)90.33 193.17 30.17 18.83 42.17 18.33 18 18
(18-120) (35-292) (21-41) (18-21) (34-56) (18-20) (18-18) (18-19)
8874.33 149.33 96.4 99.17 125 90.46 90 91.33
(1752-17405) (116-191) (93-103) (90-113) (104-172) (90-93) (90-90) (90-98)
69969 1356.65 419.11 743.02 629.68 82.45 57.87 106.5
(2137-155620) (1052-2026) (231-514) (524-993) (341-920) (59-103) (21-116) (46-193)
High Molecular Weight Poly cy lic AromaticHy drocarbons (PAHs) (µg/kg) (7) (8) (9)
Low Molecular Weight Poly cy lic AromaticHy drocarbons (PAHs) (µg/kg) (5) (6) (9)
Chemical Ox y gen Demand (mg/kg)
Total Phosphorus (mg/kg)
Total Sulphide (mg/kg)
Arsenic (mg/kg)
Silv er (mg/kg)
Total Cy anide (mg/kg)
Zinc (mg/kg)
Total Poly chlorinated Bipheny ls (PCBs)(µg/kg) (3) (4)
Particle Size Fractionation <63µm (%w /w )
Electrochemical Potential (mV)
Total Solids (%w /w )
Total Kjeldahl Nitrogen (mg/kg)
Ammonical Nitrogen (mg/kg)
Total Volatile Soilds (%w /w )
Total Carbon (%w /w )
Mercury (mg/kg)
Nickel (mg/kg)
Cadmium (mg/kg)
Chromium (mg/kg)
Copper (mg/kg)
Lead (mg/kg)
Table Table Table Table Table 7.3 7.3 7.3 7.3 7.3 (continued)(continued)(continued)(continued)(continued)Summary statistics of bottom sediment quality of typhoon shelters, 2000 - 2004
Note : 1. Data presented are arithmetic means ; data in brackets indicate ranges.2. All data are based on the analyses of bulk (unsieved) sediment and are reported on a dry weight basis unless stated otherwise.3. The Technical Circular �ETWB (W) No. 34/2002 Management of Dredged / Excavated Sediment� issued in 2002 has revised the definition of �Total PCBs� as
the summation of 18 specific PCB congeners. Following the new definition, the monitoring of these 18 PCB congeners started in 2002 and the Total PCBsresults only refer to 2002 to 2004.
4. Total PCBs results are derived from the summation of 18 congeners. If the concentration of a congener is below report limit (RL), the result will be taken as0.5xRL in the calculation.
5. Low molecular weight polyaromatic hydrocarbons (PAHs) include 6 congeners of molecular weight below 200, namely : Acenaphthene, Acenaphthylene,Anthracene, Flourene, Naphthalene and Phenanthrene.
6. As the monitoring of Naphthalene only started in 2002, the Low Molecular Weight PAHs results are based on sediments samples collected in 2002 to 2004.7. High molecular weight polyaromatic hydrocarbons (PAHs) include 10 congeners of molecular weight above 200, namely : Fluoranthene, Pyrene, Benzo(a)
anthracene, Chrysene, Benzo(b)fluoranthene, Benzo(k)fluoranthene, Benzo(a)pyrene, Dibenzo(a,h)anthracene, Benzo(g,h,i)perylene and Indeno(1,2,3-cd)pyrene.
8. Low and high molecular weight PAHs results are derived from the summation of the corresponding congeners. If the concentration of a congener is belowreport limit (RL), the result will be taken as 0.5xRL in the calculation.
P 8.2MARINE WATER QUALITY IN HONG KONG IN 2004
8 PHYTOPLANKTON& RED TIDES
Chapter 8 – Phytoplankton & Red Tides
Introduction
8.1 Phytoplankton is a critical component of coastal ecosystemsand represents the first biological response to the nutrient enrichmentproblem. Phytoplankton monitoring can track the biologicalconsequences of nutrient enrichment over time and therefore forms anessential part of coastal eutrophication management.
8.2 The Environmental Protection Department (EPD) conducts long-term monitoring ofphytoplankton at 25 stations covering nine Water Control Zones (WCZs) in the territory (Figure8.1). Monthly phytoplankton samples are collected from 1m below water surface. Detailedidentification and enumeration of phytoplankton taxa are carried out using light and electronmicroscopes.
Composition of phytoplankton
8.3 A total of 84 phytoplankton species was recordedin Hong Kong waters in 2004. Of these, 49 were diatoms (58%), 24were dinoflagellates (29%), 11 were from other minor groups (13%)including Cyanophyta, Chrysophyta and Prozotoa. The most dominantdiatom species were Skeletonema costatum, Chaetoceros spp. andPseudo-nitzschia delicatissima which constituted 60-82% of the
diatom population in the Eastern Buffer, Victoria Harbour, Southern, North Western, WesternBuffer and Deep Bay WCZs (Table 8.1). The most abundant dinoflagellate species were Scrippsiellaspp., Gymnodinium vestifici and Prorocentrum micans comprising more than 60% of thedinoflagellate populations in 8 out of the 9 WCZs (i.e. Mirs Bay, Eastern Buffer, Port Shelter,Victoria Harbour, Southern, North Western, Western Buffer and Deep Bay) (Table 8.1). Themajority of the other phytoplankton groups were made up of small flagellates (>65%) in all theWCZs (Table 8.1).
8.4 Of the samples examined in 2004, diatoms constituted the largest component ofphytoplankton in term of species number (i.e. 48-65%) followed by dinoflagellates (22-37%) andother phytoplanktons (13-17%) (Figure 8.2). In terms of cell density, diatom was also the largest
iwp12
印章
iwp12
印章
P 8.3MARINE WATER QUALITY IN HONG KONG IN 2004
8 PHYTOPLANKTON& RED TIDES
phytoplankton group in five WCZs, i.e. Western Buffer (71%), Southern (66%), Victoria Harbour(62%), Mirs Bay (58%) and Tolo Harbour & Channel (48%) (Figure 8.3). Other minorphytoplankton groups formed the majority in three WCZs, i.e. Deep Bay (63%), Eastern Buffer(57%) and North Western (54%). The general pattern was similar with that recorded in 2003.
Abundance of phytoplankton groups
8.5 Figure 8.4 shows the annual mean densities of total phytoplankton at 25 sampling stationsin 2004. In general, the total phytoplankton densities were 2-6 times higher at stations in ToloHarbour & Channel than those in other WCZs. Diatom densities were found to be higher at stationsin Tolo Harbour & Channel (Figure 8.5); whereas dinoflagellate densities were generally higher inEastern in-shore waters (Figure 8.6). Like diatoms, other minor phytoplankton groups were alsomore abundant in Tolo Harbour & Channel than other waters in Hong Kong (Figures 8.7).
Occurrence of red tides
8.6 Red tides and algal blooms are natural phenomena whichoccur in both polluted and unpolluted waters. In Hong Kong, red tidesoccur more frequently in the eastern waters and southern waters (Figure8.8). From 1980 to 2004, some 297 of 709 red tides (42%) occurredin the Tolo Harbour and Channel WCZ, and 130 (18%) in the MirsBay WCZ, 93 (13%) in the Port Shelter WCZ and 117 (17%) in theSouthern WCZ respectively.
8.7 Red tides increased significantly in the 80s and reached a peak in 1988, when a total of88 incidents was reported (Figure 8.9). In the last ten years, red tides fluctuated between 19 and45 incidents per year. A total of 34 red tides was recorded in 2004 (14 more than in 2003). Ofthese, 20 occurred in the eastern waters and 9 in the Southern WCZ. There was no red tiderelated fish kill in 2004.
8.8 Among all red tide cases recorded between 1980 and 2004, 451 were caused bydinoflagellates (64%); 124 were by diatoms (18%) and 111 were by other minor phytoplanktongroups (16%) (Figure 8.10) (Note: The causative species of some red tides were unknown). Redtides caused by dinoflagellates formed a peak in spring, i.e. between March and May; whereasthose caused by diatoms occurred more frequently in summer, i.e. between May and August. Redtides formed by other minor phytoplankton groups mostly occurred in the winter and spring months(Figure 8.10).
iwp12
印章
P 8.4MARINE WATER QUALITY IN HONG KONG IN 2004
8 PHYTOPLANKTON& RED TIDES
Red tide causative species
8.9 A total of 80 red tide species have been identified from Hong Kong waters since 1980(Table 8.2). The most common species was the dinoflagellate Noctiluca scintillans, whichaccounted for 28% of the reported red tides. The diatom Skeletonema costatum and dinoflagellateGonyaulax polygramma were also frequently encountered. The number of red tide species variedconsiderably between different WCZs: ranging from 54 species in Tolo Harbour and Channel tosix species in Deep Bay.
8.10 A total of 17 red tide species was recorded from different waters in 2004. Of these,Prorocentrum micans, Skeletonema costatum and Trichodesmium erythraeum were more widelydistributed than others. The species compositions in the Tolo Harbour & Channel WCZ and SouthernWCZ were more diverse (i.e. there were more species) than in other WCZs.

P 8.5M
ARIN
E WA
TER QUA
LITY IN HO
NG
KON
G IN
2004
8PH
YTO
PLANK
TON
& R
ED TID
ES
N
0 5 10km
DM3
DM5
NM3 NM1
WM3
WM2
SM17
SM6
SM3
SM19
VM7VM4
EM2
MM14
PM7
Hong Kong IslandLantau Island
New Territories
Kowloon
Shenzhen
PM3
TM4
TM3 TM6 MM16
TM8
MM4
MM2
MM17
VM1
Boundary of the Hong Kong Special Administrative Region
Figure 8.1 Phytoplankton monitoring stations in Hong Kong waters in 2004
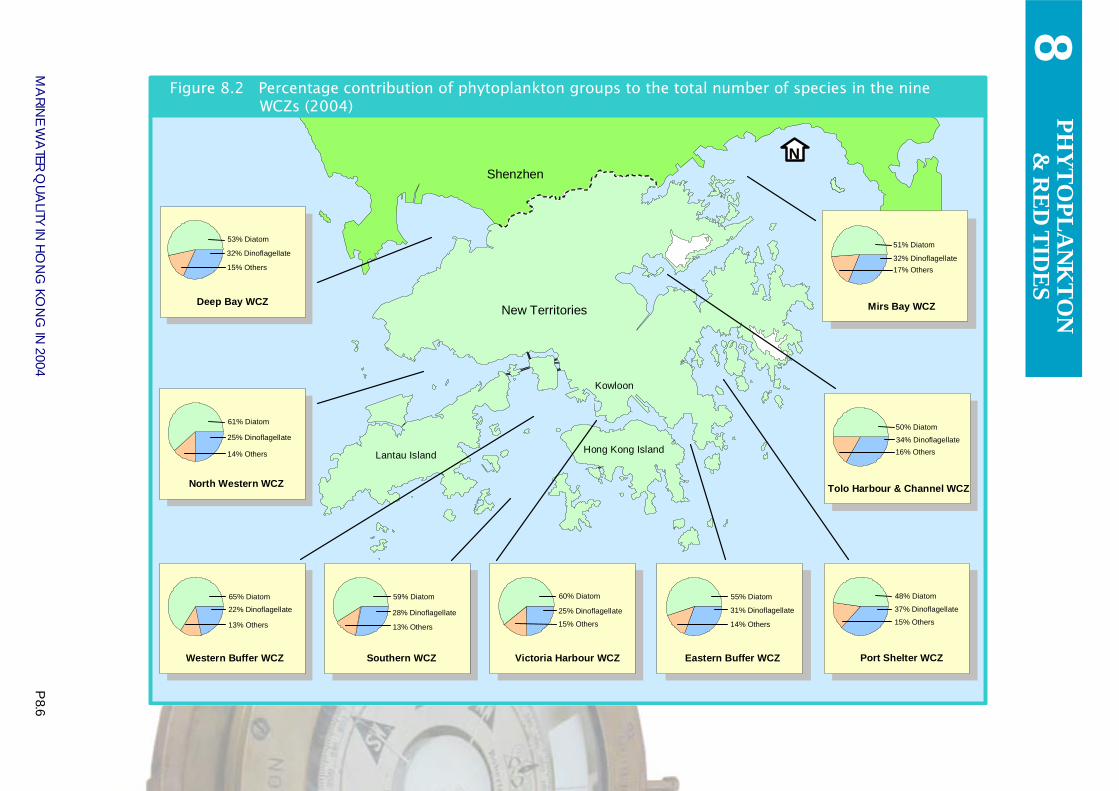
P 8.6M
ARIN
E WA
TER QUA
LITY IN HO
NG
KON
G IN
2004
8PH
YTO
PLANK
TON
& R
ED TID
ES
48% Diatom
37% Dinoflagellate
15% Others
Port Shelter WCZ
50% Diatom
34% Dinoflagellate16% Others
Tolo Harbour & Channel WCZ
51% Diatom
32% Dinoflagellate17% Others
Mirs Bay WCZ
65% Diatom
22% Dinoflagellate
13% Others
Western Buffer WCZ
59% Diatom
28% Dinoflagellate
13% Others
Southern WCZ
60% Diatom
25% Dinoflagellate
15% Others
Victoria Harbour WCZ
55% Diatom
31% Dinoflagellate
14% Others
Eastern Buffer WCZ
53% Diatom
32% Dinoflagellate
15% Others
Deep Bay WCZ
61% Diatom
25% Dinoflagellate
14% Others
North Western WCZ
Shenzhen
New Territories
Lantau Island Hong Kong Island
Kowloon
N
Figure 8.2 Percentage contribution of phytoplankton groups to the total number of species in the nine WCZs (2004)
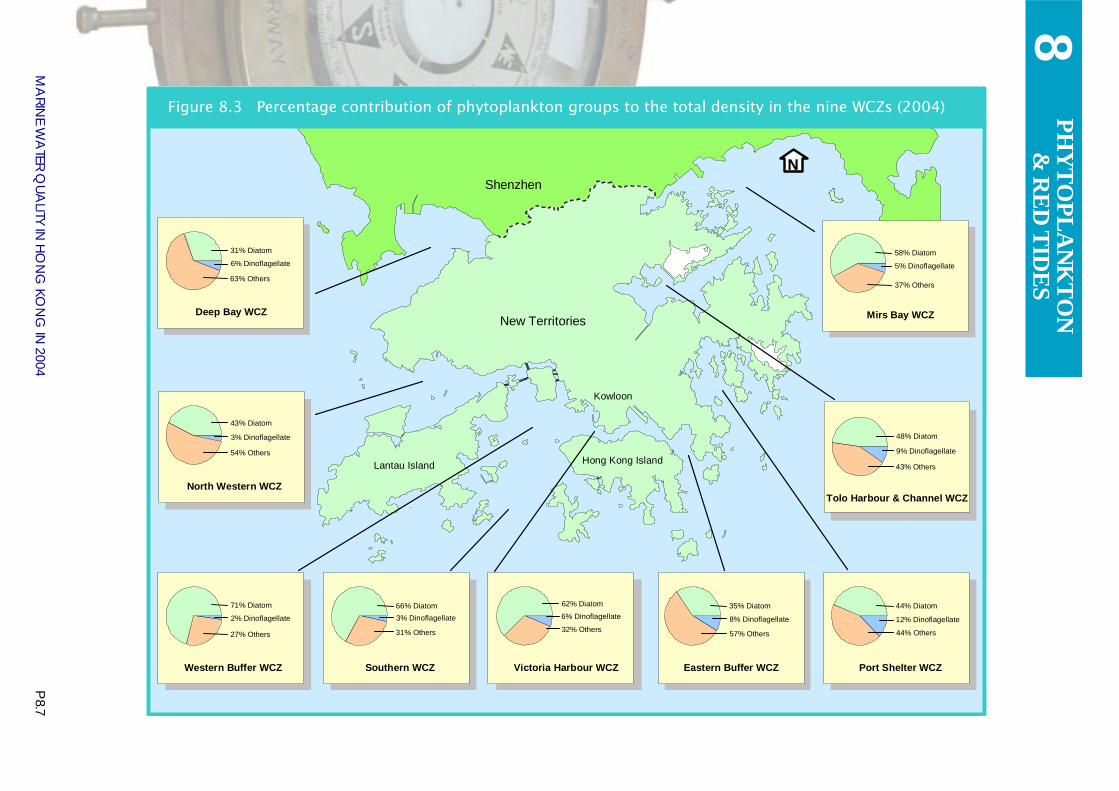
P 8.7M
ARIN
E WA
TER QUA
LITY IN HO
NG
KON
G IN
2004
8PH
YTO
PLANK
TON
& R
ED TID
ES
Shenzhen
New Territories
Lantau Island Hong Kong Island
Kowloon
44% Diatom
12% Dinoflagellate
44% Others
Port Shelter WCZ
35% Diatom
8% Dinoflagellate
57% Others
Eastern Buffer WCZ
62% Diatom
6% Dinoflagellate
32% Others
Victoria Harbour WCZ
66% Diatom3% Dinoflagellate
31% Others
Southern WCZ
71% Diatom
2% Dinoflagellate
27% Others
Western Buffer WCZ
58% Diatom
5% Dinoflagellate
37% Others
Mirs Bay WCZ
48% Diatom
9% Dinoflagellate
43% Others
Tolo Harbour & Channel WCZ
43% Diatom
3% Dinoflagellate
54% Others
North Western WCZ
31% Diatom
6% Dinoflagellate
63% Others
Deep Bay WCZ
N
Figure 8.3 Percentage contribution of phytoplankton groups to the total density in the nine WCZs (2004)
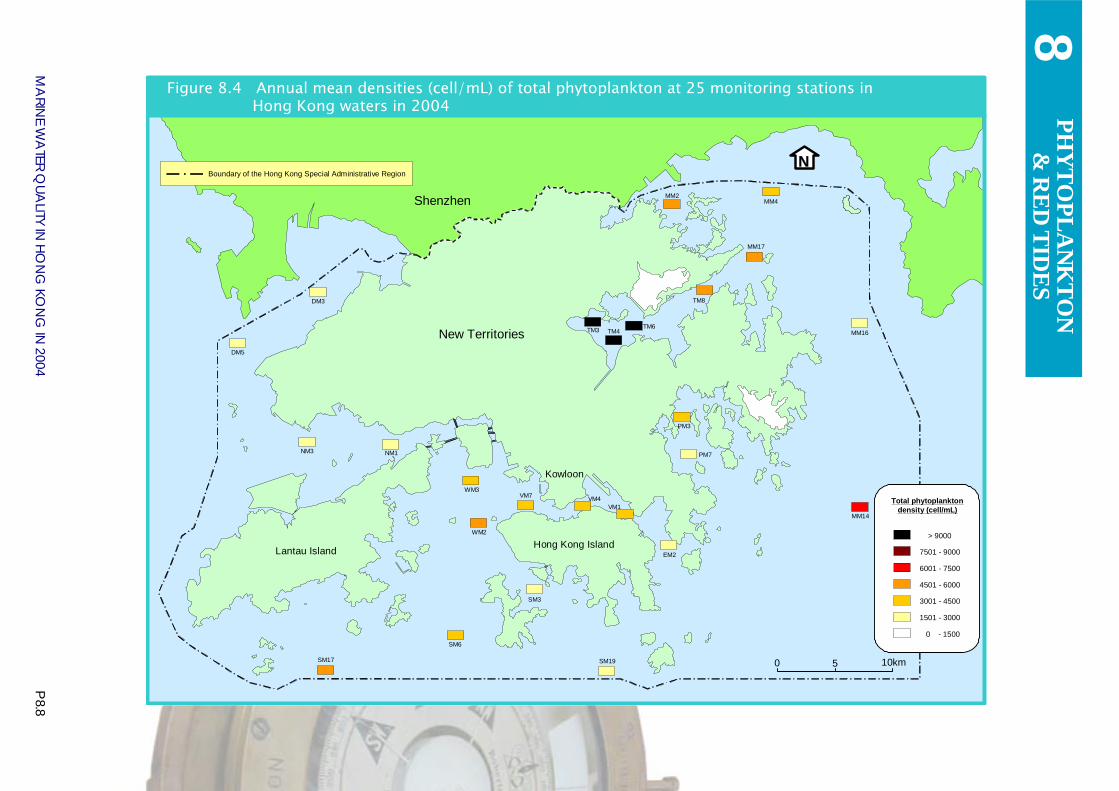
P 8.8M
ARIN
E WA
TER QUA
LITY IN HO
NG
KON
G IN
2004
8PH
YTO
PLANK
TON
& R
ED TID
ES
N
0 5 10km
Hong Kong IslandLantau Island
New Territories
Kowloon
Shenzhen
DM3
DM5
NM3 NM1
WM3
WM2
SM17
SM6
SM3
SM19
VM7 VM4VM1
EM2
MM14
PM7
PM3
TM4TM3 TM6
TM8
MM16
MM17
MM4MM2
Total phytoplanktondensity (cell/mL)
> 9000
7501 - 9000
6001 - 7500
4501 - 6000
3001 - 4500
1501 - 3000
0 - 1500
Boundary of the Hong Kong Special Administrative Region
Figure 8.4 Annual mean densities (cell/mL) of total phytoplankton at 25 monitoring stations in Hong Kong waters in 2004
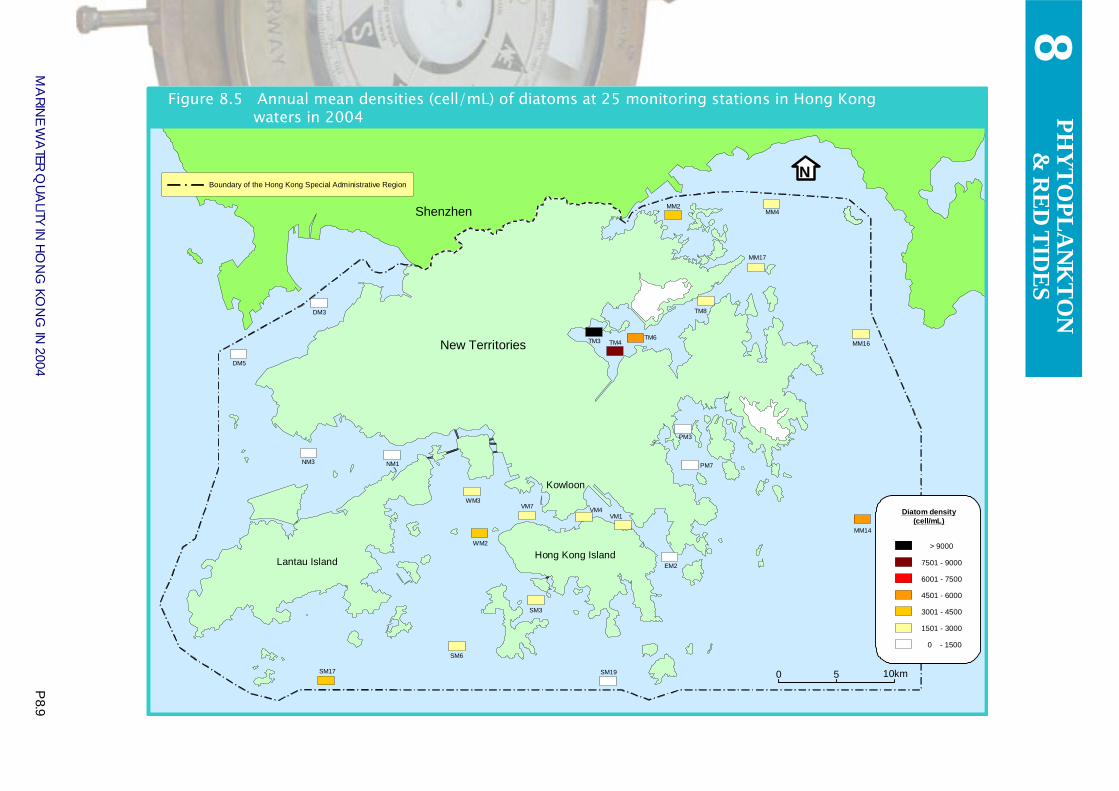
P 8.9M
ARIN
E WA
TER QUA
LITY IN HO
NG
KON
G IN
2004
8PH
YTO
PLANK
TON
& R
ED TID
ES
N
0 5 10km
Hong Kong IslandLantau Island
New Territories
Kowloon
Shenzhen
MM14
Diatom density(cell/mL)
> 9000
7501 - 9000
6001 - 7500
4501 - 6000
3001 - 4500
1501 - 3000
0 - 1500
TM8
MM16
MM17
MM4MM2
DM3
DM5
NM3 NM1
WM3
WM2
SM17
SM6
SM3
SM19
VM7 VM4VM1
EM2
PM7
PM3
TM4TM3 TM6
Boundary of the Hong Kong Special Administrative Region
Figure 8.5 Annual mean densities (cell/mL) of diatoms at 25 monitoring stations in Hong Kong waters in 2004
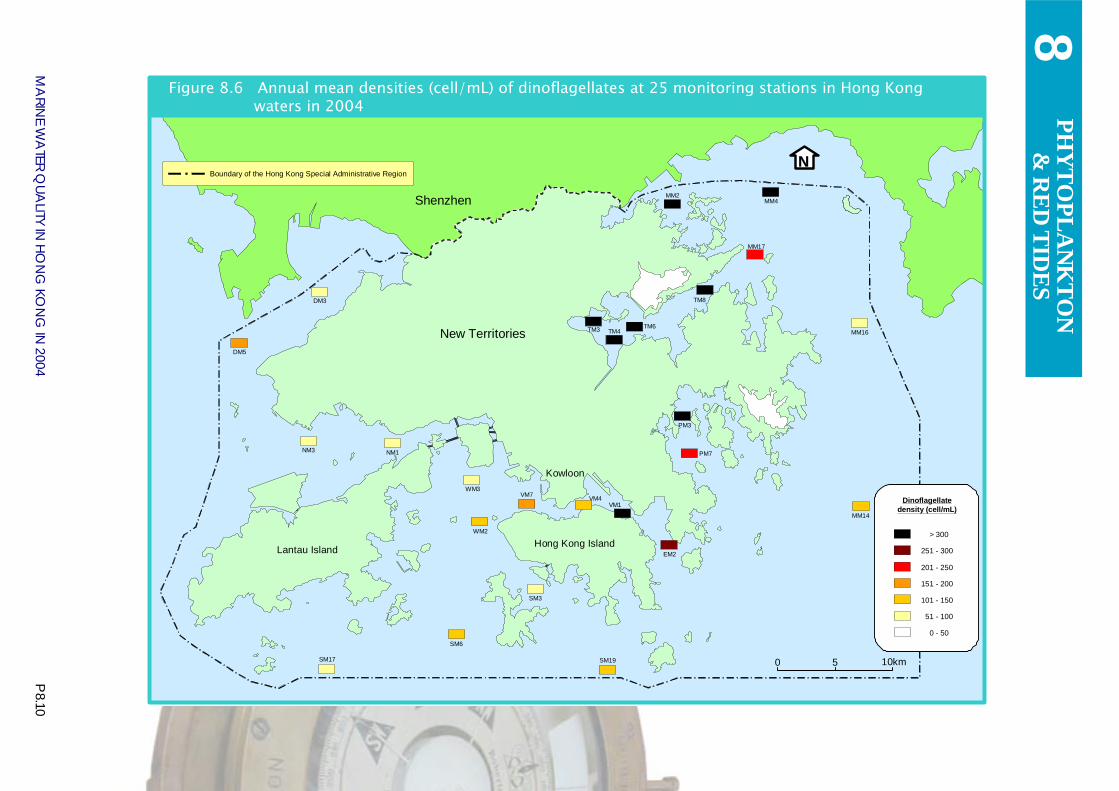
P 8.10M
ARIN
E WA
TER QUA
LITY IN HO
NG
KON
G IN
2004
8PH
YTO
PLANK
TON
& R
ED TID
ES
N
0 5 10km
Hong Kong IslandLantau Island
New Territories
Kowloon
Shenzhen
EM2
MM14
PM7
PM3
TM4TM3 TM6
TM8
MM16
MM17
MM4MM2
Dinoflagellatedensity (cell/mL)
> 300
251 - 300
201 - 250
151 - 200
101 - 150
51 - 100
0 - 50
DM3
DM5
NM3 NM1
WM3
WM2
SM17
SM6
SM3
SM19
VM7 VM4VM1
Boundary of the Hong Kong Special Administrative Region
Figure 8.6 Annual mean densities (cell/mL) of dinoflagellates at 25 monitoring stations in Hong Kong waters in 2004
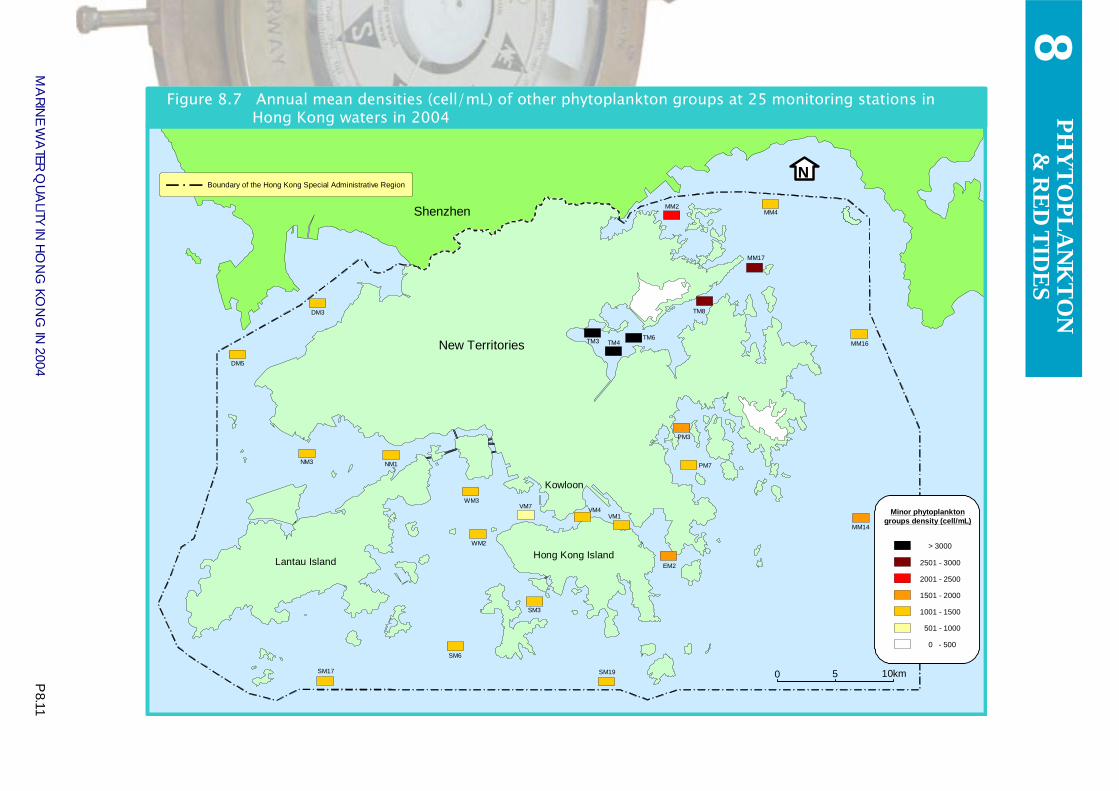
P 8.11M
ARIN
E WA
TER QUA
LITY IN HO
NG
KON
G IN
2004
8PH
YTO
PLANK
TON
& R
ED TID
ES
N
0 5 10km
Hong Kong IslandLantau Island
New Territories
Kowloon
Shenzhen
MM14
Minor phytoplanktongroups density (cell/mL)
> 3000
2501 - 3000
2001 - 2500
1501 - 2000
1001 - 1500
501 - 1000
0 - 500
DM3
DM5
NM3 NM1
WM3
WM2
SM17
SM6
SM3
SM19
VM7 VM4VM1
EM2
PM7
PM3
TM4TM3 TM6
TM8
MM16
MM17
MM4MM2
Boundary of the Hong Kong Special Administrative Region
Figure 8.7 Annual mean densities (cell/mL) of other phytoplankton groups at 25 monitoring stations in Hong Kong waters in 2004
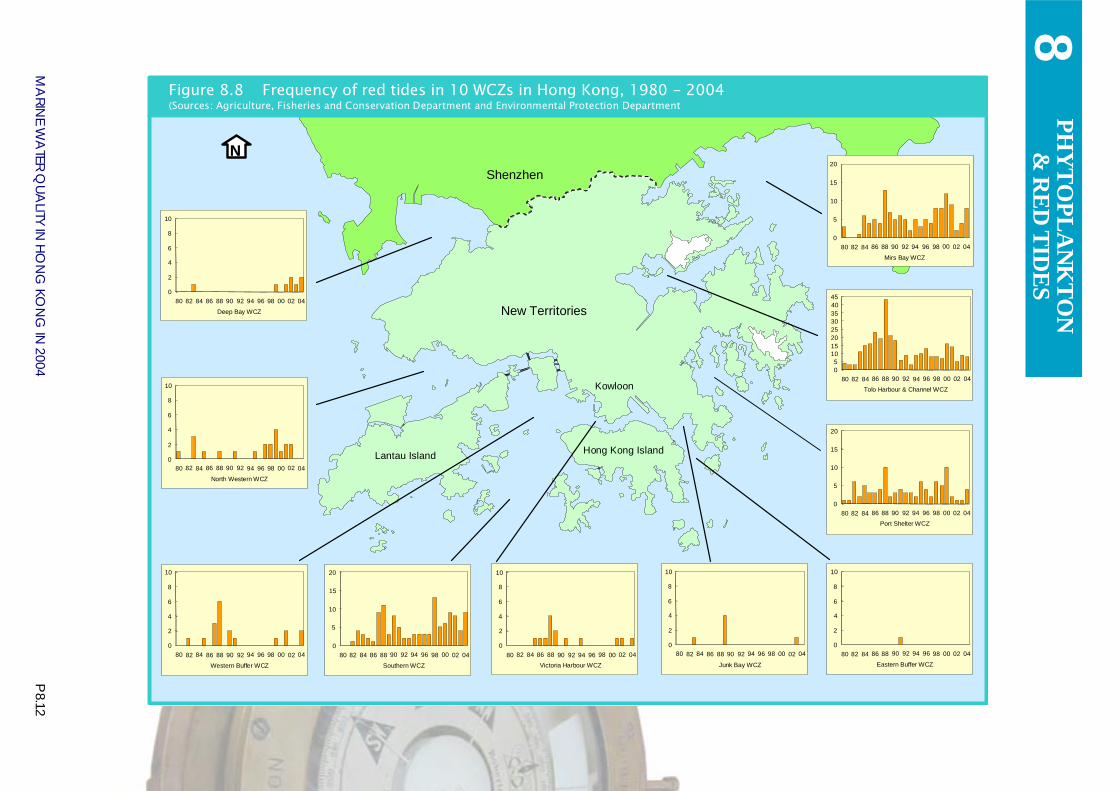
P 8.12M
ARIN
E WA
TER QUA
LITY IN HO
NG
KON
G IN
2004
8PH
YTO
PLANK
TON
& R
ED TID
ES
Shenzhen
New Territories
Lantau Island Hong Kong Island
Kowloon
N
0
2
4
6
8
10
80 82 84 86 88 90 92 94 96 98 00 02 04
Deep Bay WCZ
0
2
4
6
8
10
80 82 84 86 88 90 92 94 96 98 00 02 04
North Western WCZ
0
2
4
6
8
10
80 82 84 86 88 90 92 94 96 98 00 02 04
Western Buffer WCZ
0
5
10
15
20
80 82 84 86 88 90 92 94 96 98 00 02 04Southern WCZ
0
2
4
6
8
10
80 82 84 86 88 90 92 94 96 98 00 02 04Victoria Harbour WCZ
0
2
4
6
8
10
80 82 84 86 88 90 92 94 96 98 00 02 04
Junk Bay WCZ
0
2
4
6
8
10
80 82 84 86 88 90 92 94 96 98 00 02 04
Eastern Buffer WCZ
0
5
10
15
20
80 82 84 86 88 90 92 94 96 98 00 02 04Port Shelter WCZ
05
1015202530354045
80 82 84 86 88 90 92 94 96 98 00 02 04
Tolo Harbour & Channel WCZ
0
5
10
15
20
80 82 84 86 88 90 92 94 96 98 00 02 04
Mirs Bay WCZ
Figure 8.8 Frequency of red tides in 10 WCZs in Hong Kong, 1980 - 2004(Sources: Agriculture, Fisheries and Conservation Department and Environmental Protection Department
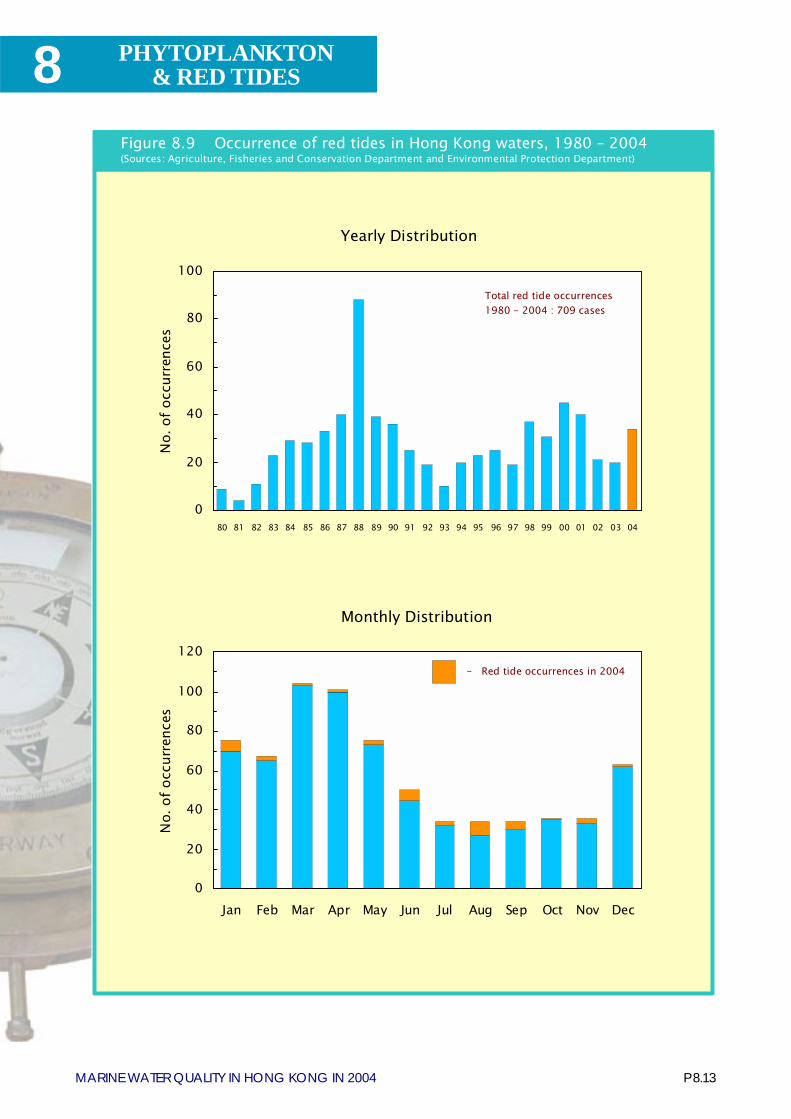
P 8.13MARINE WATER QUALITY IN HONG KONG IN 2004
8 PHYTOPLANKTON& RED TIDES
Figure 8.9 Occurrence of red tides in Hong Kong waters, 1980 � 2004(Sources: Agriculture, Fisheries and Conservation Department and Environmental Protection Department)
0
20
40
60
80
100
80 81 82 83 84 85 86 87 88 89 90 91 92 93 94 95 96 97 98 99 00 01 02 03 04
No.
of o
ccur
renc
es
0
20
40
60
80
100
120
Jan Feb Mar Apr May Jun Jul Aug Sep Oct Nov Dec
No.
of o
ccur
renc
es
Yearly Distribution
Monthly Distribution
Total red tide occurrences1980 - 2004 : 709 cases
- Red tide occurrences in 2004
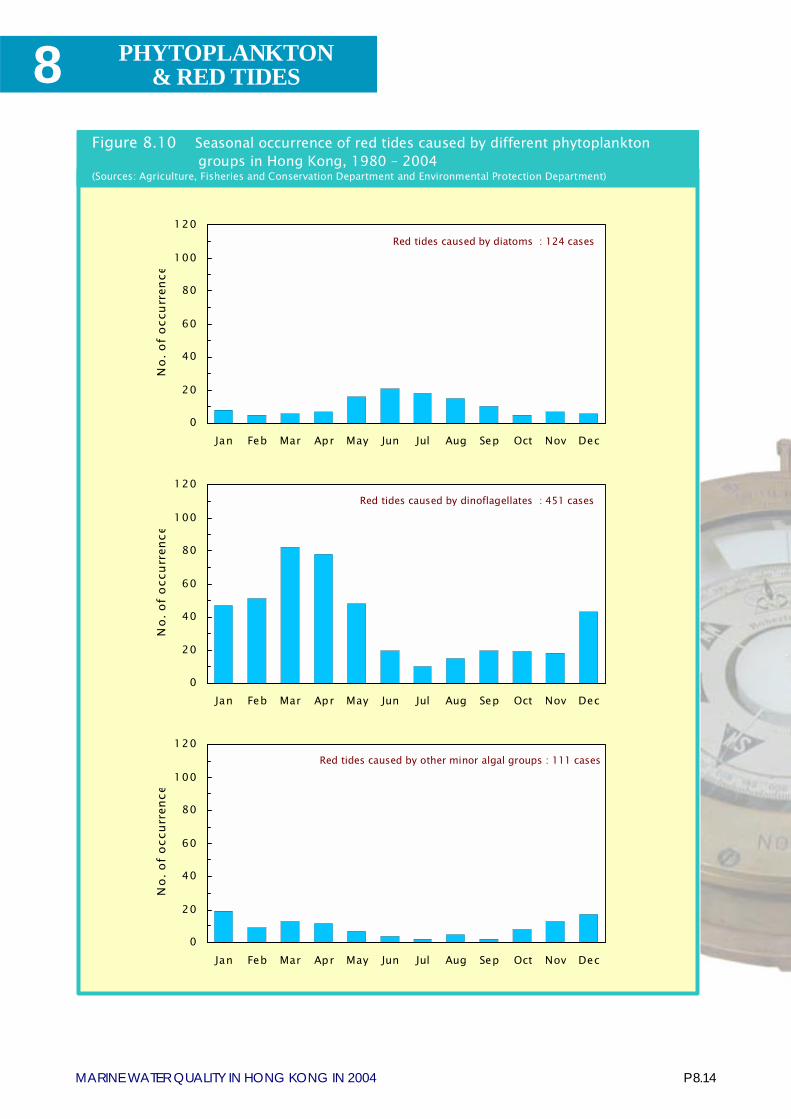
P 8.14MARINE WATER QUALITY IN HONG KONG IN 2004
8 PHYTOPLANKTON& RED TIDES
Figure 8.10 Seasonal occurrence of red tides caused by different phytoplankton groups in Hong Kong, 1980 � 2004
(Sources: Agriculture, Fisheries and Conservation Department and Environmental Protection Department)
0
20
40
60
80
100
120
Jan Feb Mar Apr May Jun Jul Aug Sep Oct Nov Dec
No.
of
occu
rren
ce
Red tides caused by other minor algal groups : 111 cases
0
20
40
60
80
100
120
Jan Feb Mar Apr May Jun Jul Aug Sep Oct Nov Dec
No.
of
occu
rren
ce
Red tides caused by dinoflagellates : 451 cases
0
20
40
60
80
100
120
Jan Feb Mar Apr May Jun Jul Aug Sep Oct Nov Dec
No.
of
occu
rren
ce
Red tides caused by diatoms : 124 cases
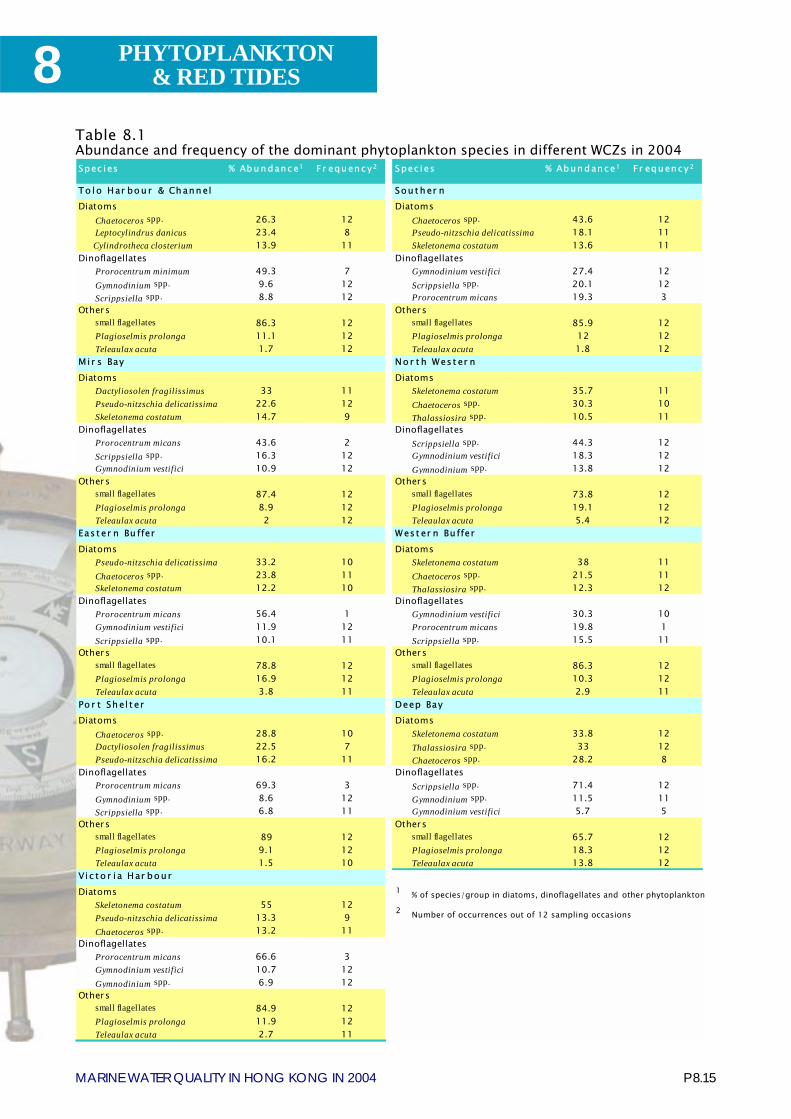
P 8.15MARINE WATER QUALITY IN HONG KONG IN 2004
8 PHYTOPLANKTON& RED TIDES
Spec i es % Abu n danc e1 F r equ en c y 2 Spec i es % Abun dan ce1 Fr equ en cy 2
To lo Har bo u r & Ch ann el Sou t h er nDiatoms Diatoms
Chaetoceros spp. 26.3 12 Chaetoceros spp. 43.6 12 Leptocylindrus danicus 23.4 8 Pseudo-nitzschia delicatissima 18.1 11Cylindrotheca closterium 13.9 11 Skeletonema costatum 13.6 11
Dinoflagellates Dinoflagellates Prorocentrum minimum 49.3 7 Gymnodinium vestifici 27.4 12 Gymnodinium spp. 9.6 12 Scrippsiella spp. 20.1 12 Scrippsiella spp. 8.8 12 Prorocentrum micans 19.3 3
Others Others small flagellates 86.3 12 small flagellates 85.9 12 Plagioselmis prolonga 11.1 12 Plagioselmis prolonga 12 12 Teleaulax acuta 1.7 12 Teleaulax acuta 1.8 12
Mi r s Bay No r t h Wes t er nDiatoms Diatoms
Dactyliosolen fragilissimus 33 11 Skeletonema costatum 35.7 11 Pseudo-nitzschia delicatissima 22.6 12 Chaetoceros spp. 30.3 10 Skeletonema costatum 14.7 9 Thalassiosira spp. 10.5 11
Dinoflagellates Dinoflagellates Prorocentrum micans 43.6 2 Scrippsiella spp. 44.3 12 Scrippsiella spp. 16.3 12 Gymnodinium vestifici 18.3 12 Gymnodinium vestifici 10.9 12 Gymnodinium spp. 13.8 12
Others Others small flagellates 87.4 12 small flagellates 73.8 12 Plagioselmis prolonga 8.9 12 Plagioselmis prolonga 19.1 12 Teleaulax acuta 2 12 Teleaulax acuta 5.4 12
Eas t er n Bu ffer W es t er n Bu fferDiatoms Diatoms
Pseudo-nitzschia delicatissima 33.2 10 Skeletonema costatum 38 11 Chaetoceros spp. 23.8 11 Chaetoceros spp. 21.5 11 Skeletonema costatum 12.2 10 Thalassiosira spp. 12.3 12
Dinoflagellates Dinoflagellates Prorocentrum micans 56.4 1 Gymnodinium vestifici 30.3 10 Gymnodinium vestifici 11.9 12 Prorocentrum micans 19.8 1 Scrippsiella spp. 10.1 11 Scrippsiella spp. 15.5 11
Others Others small flagellates 78.8 12 small flagellates 86.3 12 Plagioselmis prolonga 16.9 12 Plagioselmis prolonga 10.3 12 Teleaulax acuta 3.8 11 Teleaulax acuta 2.9 11
Po r t Sh el t er Deep BayDiatoms Diatoms
Chaetoceros spp. 28.8 10 Skeletonema costatum 33.8 12 Dactyliosolen fragilissimus 22.5 7 Thalassiosira spp. 33 12 Pseudo-nitzschia delicatissima 16.2 11 Chaetoceros spp. 28.2 8
Dinoflagellates Dinoflagellates Prorocentrum micans 69.3 3 Scrippsiella spp. 71.4 12 Gymnodinium spp. 8.6 12 Gymnodinium spp. 11.5 11 Scrippsiella spp. 6.8 11 Gymnodinium vestifici 5.7 5
Others Others small flagellates 89 12 small flagellates 65.7 12 Plagioselmis prolonga 9.1 12 Plagioselmis prolonga 18.3 12 Teleaulax acuta 1.5 10 Teleaulax acuta 13.8 12
Vi c t o r i a Har bo urDiatoms
Skeletonema costatum 55 12 Pseudo-nitzschia delicatissima 13.3 9 Chaetoceros spp. 13.2 11
Dinoflagellates Prorocentrum micans 66.6 3 Gymnodinium vestifici 10.7 12 Gymnodinium spp. 6.9 12
Others small flagellates 84.9 12 Plagioselmis prolonga 11.9 12 Teleaulax acuta 2.7 11
Table 8.1Abundance and frequency of the dominant phytoplankton species in different WCZs in 2004
1 % of species/group in diatoms, dinoflagellates and other phytoplankton
2 Number of occurrences out of 12 sampling occasions
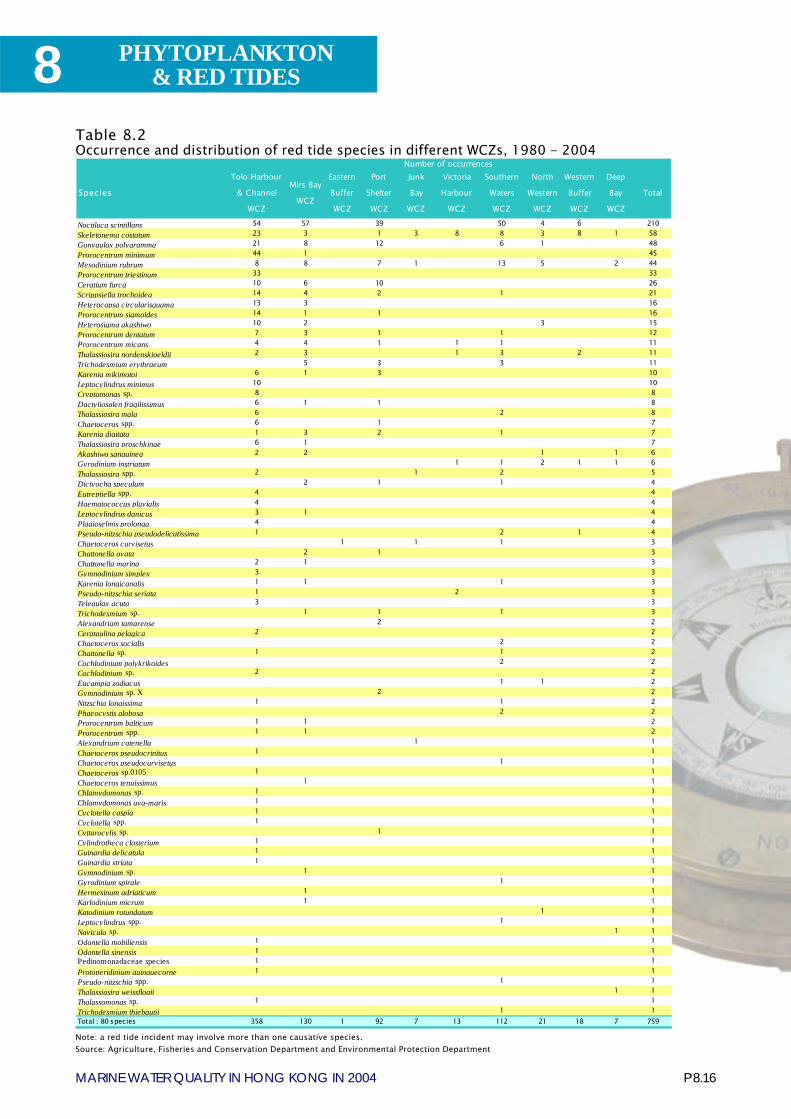
P 8.16MARINE WATER QUALITY IN HONG KONG IN 2004
8 PHYTOPLANKTON& RED TIDES
Table 8.2Occurrence and distribution of red tide species in different WCZs, 1980 - 2004
Note: a red tide incident may involve more than one causative species.Source: Agriculture, Fisheries and Conservation Department and Environmental Protection Department
Species
Tolo Harbour
& Channel
WCZ
Mirs Bay
WCZ
Eastern
Buffer
WCZ
Port
Shelter
WCZ
Junk
Bay
WCZ
Victoria
Harbour
WCZ
Southern
Waters
WCZ
North
Western
WCZ
Western
Buffer
WCZ
Deep
Bay
WCZ
Total
Noctiluca scintillans 54 57 39 50 4 6 210Skeletonema costatum 23 3 1 3 8 8 3 8 1 58Gonyaulax polygramma 21 8 12 6 1 48Prorocentrum minimum 44 1 45Mesodinium rubrum 8 8 7 1 13 5 2 44Prorocentrum triestinum 33 33Ceratium furca 10 6 10 26Scrippsiella trochoidea 14 4 2 1 21Heterocapsa circularisquama 13 3 16Prorocentrum sigmoides 14 1 1 16Heterosigma akashiwo 10 2 3 15Prorocentrum dentatum 7 3 1 1 12Prorocentrum micans 4 4 1 1 1 11Thalassiosira nordenskioeldii 2 3 1 3 2 11Trichodesmium erythraeum 5 3 3 11Karenia mikimotoi 6 1 3 10Leptocylindrus minimus 10 10Cryptomonas sp. 8 8Dactyliosolen fragilissimus 6 1 1 8Thalassiosira mala 6 2 8Chaetoceros spp. 6 1 7Karenia digitata 1 3 2 1 7Thalassiosira proschkinae 6 1 7Akashiwo sanguinea 2 2 1 1 6Gyrodinium instriatum 1 1 2 1 1 6Thalassiosira spp. 2 1 2 5Dictyocha speculum 2 1 1 4Eutreptiella spp. 4 4Haematococcus pluvialis 4 4Leptocylindrus danicus 3 1 4Plagioselmis prolonga 4 4Pseudo-nitzschia pseudodelicatissima 1 2 1 4Chaetoceros curvisetus 1 1 1 3Chattonella ovata 2 1 3Chattonella marina 2 1 3Gymnodinium simplex 3 3Karenia longicanalis 1 1 1 3Pseudo-nitzschia seriata 1 2 3Teleaulax acuta 3 3Trichodesmium sp. 1 1 1 3Alexandrium tamarense 2 2Cerataulina pelagica 2 2Chaetoceros socialis 2 2Chattonella sp. 1 1 2Cochlodinium polykrikoides 2 2Cochlodinium sp. 2 2Eucampia zodiacus 1 1 2Gymnodinium sp. X 2 2Nitzschia longissima 1 1 2Phaeocystis globosa 2 2Prorocentrum balticum 1 1 2Prorocentrum spp. 1 1 2Alexandrium catenella 1 1Chaetoceros pseudocrinitus 1 1Chaetoceros pseudocurvisetus 1 1Chaetoceros sp.0105 1 1Chaetoceros tenuissimus 1 1Chlamydomonas sp. 1 1Chlamydomonas uva-maris 1 1Cyclotella caspia 1 1Cyclotella spp. 1 1Cyttarocylis sp. 1 1Cylindrotheca closterium 1 1Guinardia delicatula 1 1Guinardia striata 1 1Gymnodinium sp. 1 1Gyrodinium spirale 1 1Hermesinum adriaticum 1 1Karlodinium micrum 1 1Katodinium rotundatum 1 1Leptocylindrus spp. 1 1Navicula sp. 1 1Odontella mobiliensis 1 1Odontella sinensis 1 1Pedinomonadaceae species 1 1Protoperidinium quinquecorne 1 1Pseudo-nitzschia spp. 1 1Thalassiosira weissflogii 1 1Thalassomonas sp. 1 1Trichodesmium thiebautii 1 1Total : 80 species 358 130 1 92 7 13 112 21 18 7 759
Number of occurrences
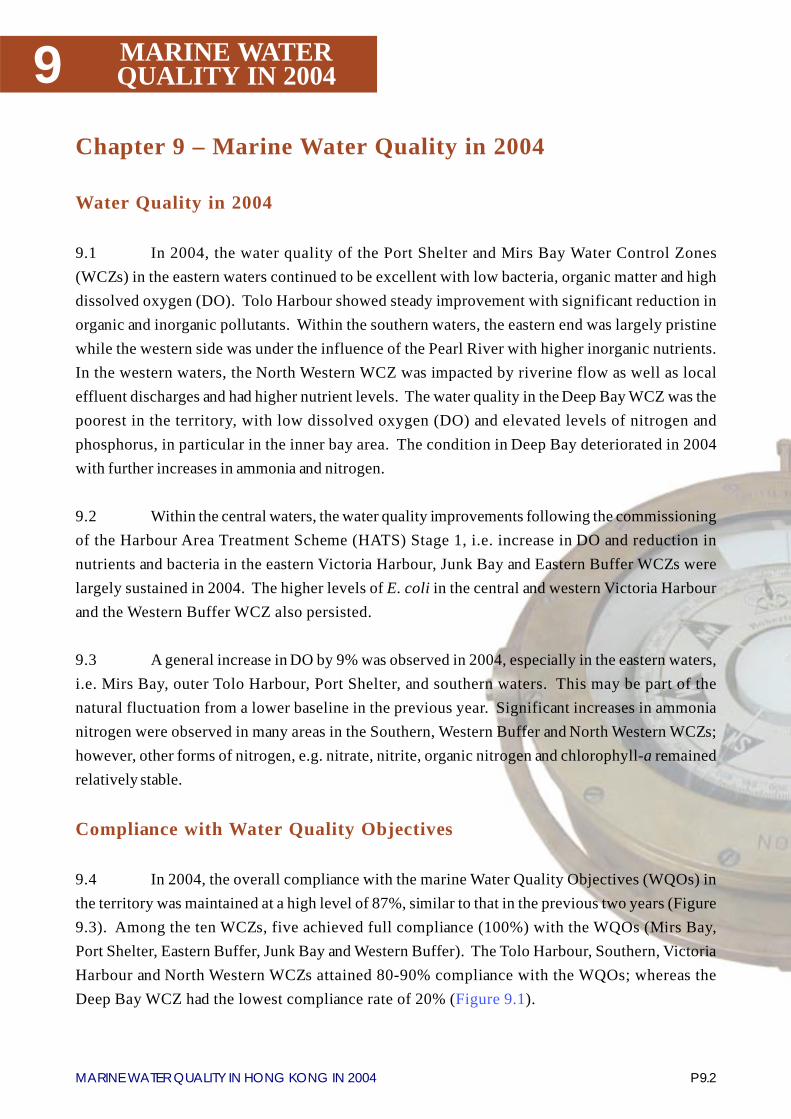
P 9.2MARINE WATER QUALITY IN HONG KONG IN 2004
9 MARINE WATERQUALITY IN 2004
Chapter 9 – Marine Water Quality in 2004
Water Quality in 2004
9.1 In 2004, the water quality of the Port Shelter and Mirs Bay Water Control Zones(WCZs) in the eastern waters continued to be excellent with low bacteria, organic matter and highdissolved oxygen (DO). Tolo Harbour showed steady improvement with significant reduction inorganic and inorganic pollutants. Within the southern waters, the eastern end was largely pristinewhile the western side was under the influence of the Pearl River with higher inorganic nutrients.In the western waters, the North Western WCZ was impacted by riverine flow as well as localeffluent discharges and had higher nutrient levels. The water quality in the Deep Bay WCZ was thepoorest in the territory, with low dissolved oxygen (DO) and elevated levels of nitrogen andphosphorus, in particular in the inner bay area. The condition in Deep Bay deteriorated in 2004with further increases in ammonia and nitrogen.
9.2 Within the central waters, the water quality improvements following the commissioningof the Harbour Area Treatment Scheme (HATS) Stage 1, i.e. increase in DO and reduction innutrients and bacteria in the eastern Victoria Harbour, Junk Bay and Eastern Buffer WCZs werelargely sustained in 2004. The higher levels of E. coli in the central and western Victoria Harbourand the Western Buffer WCZ also persisted.
9.3 A general increase in DO by 9% was observed in 2004, especially in the eastern waters,i.e. Mirs Bay, outer Tolo Harbour, Port Shelter, and southern waters. This may be part of thenatural fluctuation from a lower baseline in the previous year. Significant increases in ammonianitrogen were observed in many areas in the Southern, Western Buffer and North Western WCZs;however, other forms of nitrogen, e.g. nitrate, nitrite, organic nitrogen and chlorophyll-a remainedrelatively stable.
Compliance with Water Quality Objectives
9.4 In 2004, the overall compliance with the marine Water Quality Objectives (WQOs) inthe territory was maintained at a high level of 87%, similar to that in the previous two years (Figure9.3). Among the ten WCZs, five achieved full compliance (100%) with the WQOs (Mirs Bay,Port Shelter, Eastern Buffer, Junk Bay and Western Buffer). The Tolo Harbour, Southern, VictoriaHarbour and North Western WCZs attained 80-90% compliance with the WQOs; whereas theDeep Bay WCZ had the lowest compliance rate of 20% (Figure 9.1).
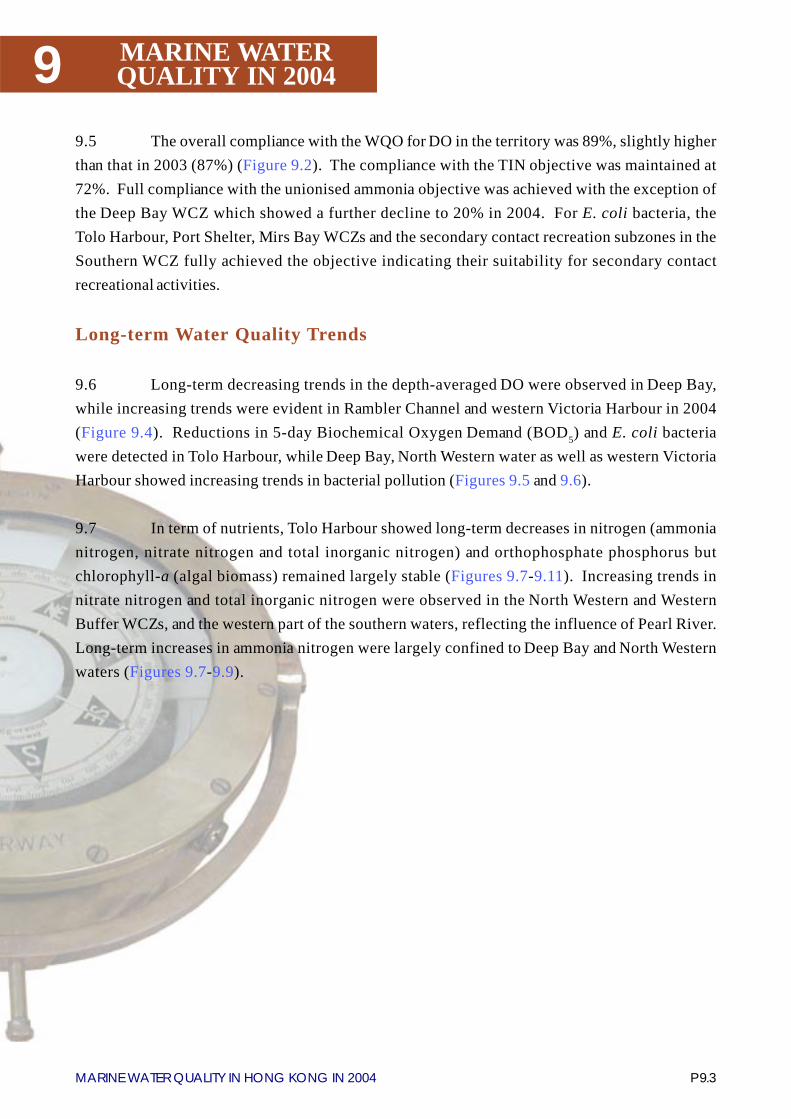
P 9.3MARINE WATER QUALITY IN HONG KONG IN 2004
9 MARINE WATERQUALITY IN 2004
9.5 The overall compliance with the WQO for DO in the territory was 89%, slightly higherthan that in 2003 (87%) (Figure 9.2). The compliance with the TIN objective was maintained at72%. Full compliance with the unionised ammonia objective was achieved with the exception ofthe Deep Bay WCZ which showed a further decline to 20% in 2004. For E. coli bacteria, theTolo Harbour, Port Shelter, Mirs Bay WCZs and the secondary contact recreation subzones in theSouthern WCZ fully achieved the objective indicating their suitability for secondary contactrecreational activities.
Long-term Water Quality Trends
9.6 Long-term decreasing trends in the depth-averaged DO were observed in Deep Bay,while increasing trends were evident in Rambler Channel and western Victoria Harbour in 2004(Figure 9.4). Reductions in 5-day Biochemical Oxygen Demand (BOD5) and E. coli bacteriawere detected in Tolo Harbour, while Deep Bay, North Western water as well as western VictoriaHarbour showed increasing trends in bacterial pollution (Figures 9.5 and 9.6).
9.7 In term of nutrients, Tolo Harbour showed long-term decreases in nitrogen (ammonianitrogen, nitrate nitrogen and total inorganic nitrogen) and orthophosphate phosphorus butchlorophyll-a (algal biomass) remained largely stable (Figures 9.7-9.11). Increasing trends innitrate nitrogen and total inorganic nitrogen were observed in the North Western and WesternBuffer WCZs, and the western part of the southern waters, reflecting the influence of Pearl River.Long-term increases in ammonia nitrogen were largely confined to Deep Bay and North Westernwaters (Figures 9.7-9.9).
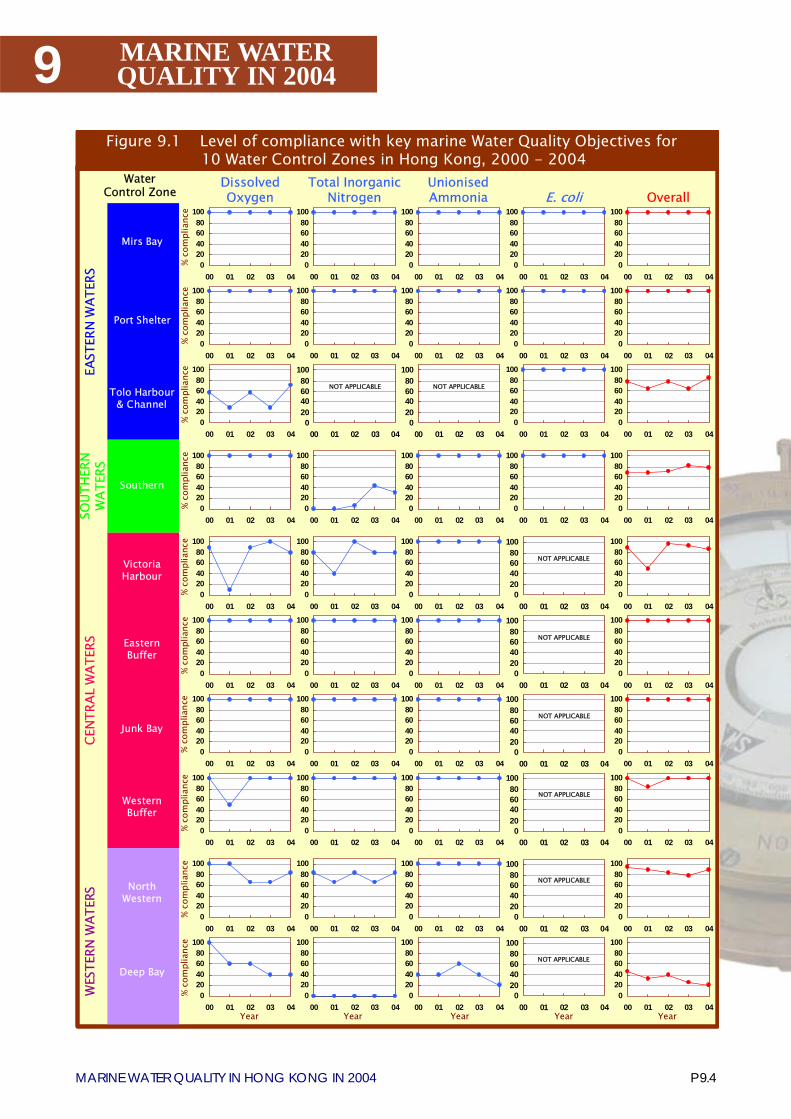
P 9.4MARINE WATER QUALITY IN HONG KONG IN 2004
9 MARINE WATERQUALITY IN 2004
WaterControl Zone Overall
DissolvedOxygen E. coli
UnionisedAmmonia
Total InorganicNitrogen
YearYear YearYearYear
SOUT
HERN
WAT
ERS
EAST
ERN
WAT
ERS
CENT
RAL
WAT
ERS
WES
TERN
WAT
ERS
020406080
100
00 01 02 03 040
20406080
100
00 01 02 03 040
20406080
100
00 01 02 03 040
20406080
100
00 01 02 03 040
20406080
100
00 01 02 03 04
Southern
% co
mpl
ianc
e
020406080
100
00 01 02 03 040
20406080
100
00 01 02 03 040
20406080
100
00 01 02 03 040
20406080
100
00 01 02 03 040
20406080
100
00 01 02 03 04
Port Shelter
% co
mpl
ianc
e
020406080
100
00 01 02 03 040
20406080
100
00 01 02 03 040
20406080
100
00 01 02 03 040
20406080
100
00 01 02 03 040
20406080
100
00 01 02 03 04
Mirs Bay
% co
mpl
ianc
e
020406080
100
00 01 02 03 040
20406080
100
00 01 02 03 040
20406080
100
00 01 02 03 040
20406080
100
00 01 02 03 04
Tolo Harbour& Channel
020406080
100
00 01 02 03 04
NOT APPLICABLE
% co
mpl
ianc
e
NOT APPLICABLE
020406080
100
00 01 02 03 040
20406080
100
00 01 02 03 040
20406080
100
00 01 02 03 040
20406080
100
00 01 02 03 040
20406080
100
00 01 02 03 04
Deep Bay
% co
mpl
ianc
e
NOT APPLICABLE
020406080
100
00 01 02 03 040
20406080
100
00 01 02 03 040
20406080
100
00 01 02 03 040
20406080
100
00 01 02 03 040
20406080
100
00 01 02 03 04
Junk Bay
% co
mpl
ianc
e
NOT APPLICABLE
020406080
100
00 01 02 03 040
20406080
100
00 01 02 03 040
20406080
100
00 01 02 03 040
20406080
100
00 01 02 03 040
20406080
100
00 01 02 03 04
NorthWestern
% co
mpl
ianc
e
NOT APPLICABLE
020406080
100
00 01 02 03 040
20406080
100
00 01 02 03 040
20406080
100
00 01 02 03 040
20406080
100
00 01 02 03 040
20406080
100
00 01 02 03 04
EasternBuffer
% co
mpl
ianc
e
NOT APPLICABLE
020406080
100
00 01 02 03 040
20406080
100
00 01 02 03 040
20406080
100
00 01 02 03 040
20406080
100
00 01 02 03 040
20406080
100
00 01 02 03 04
VictoriaHarbour
% co
mpl
ianc
e
NOT APPLICABLE
020406080
100
00 01 02 03 040
20406080
100
00 01 02 03 040
20406080
100
00 01 02 03 040
20406080
100
00 01 02 03 040
20406080
100
00 01 02 03 04
WesternBuffer
% co
mpl
ianc
e
NOT APPLICABLE
Figure 9.1 Level of compliance with key marine Water Quality Objectives for 10 Water Control Zones in Hong Kong, 2000 - 2004
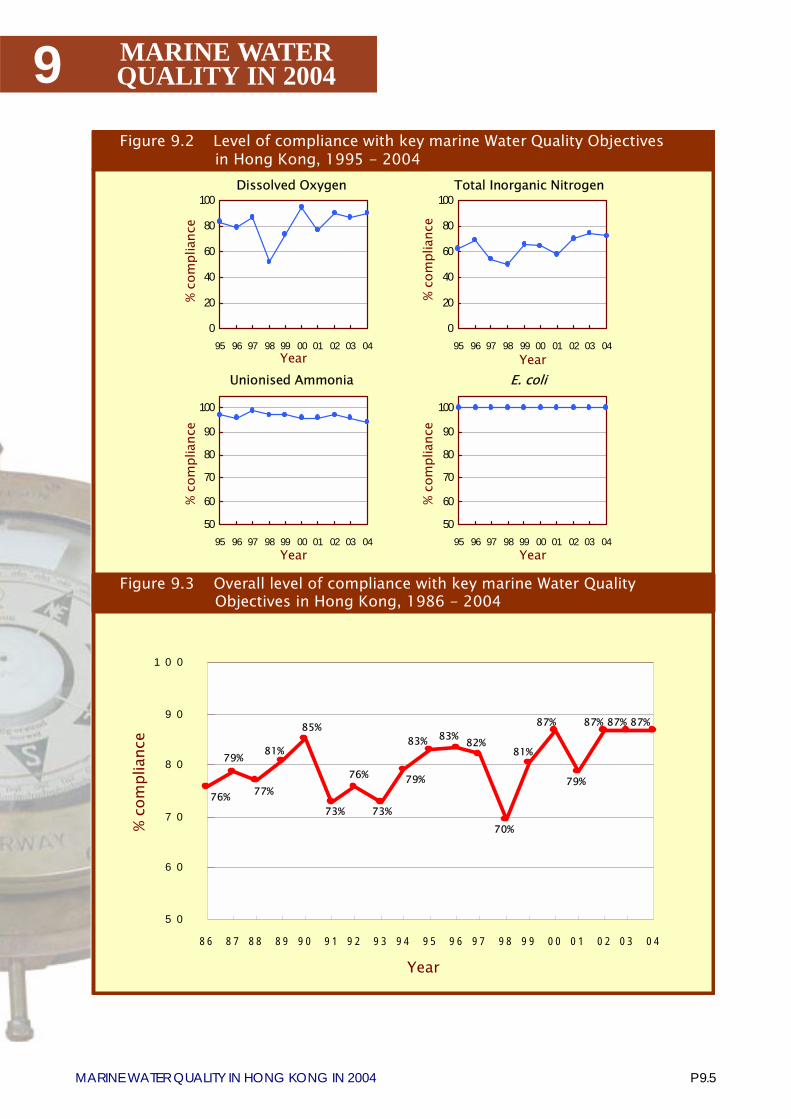
P 9.5MARINE WATER QUALITY IN HONG KONG IN 2004
9 MARINE WATERQUALITY IN 2004
Figure 9.3 Overall level of compliance with key marine Water QualityObjectives in Hong Kong, 1986 - 2004
0
20
40
60
80
100
95 96 97 98 99 00 01 02 03 04
% co
mpl
ianc
e
Year
Dissolved Oxygen
0
20
40
60
80
100
95 96 97 98 99 00 01 02 03 04
% co
mpl
ianc
e
Year
Total Inorganic Nitrogen
50
60
70
80
90
100
95 96 97 98 99 00 01 02 03 04Year
% co
mpl
ianc
e
Unionised Ammonia
50
60
70
80
90
100
95 96 97 98 99 00 01 02 03 04Year
% co
mpl
ianc
e
E. coli
5 0
6 0
7 0
8 0
9 0
1 0 0
8 6 8 7 8 8 8 9 9 0 9 1 9 2 9 3 9 4 9 5 9 6 9 7 9 8 9 9 0 0 0 1 0 2 0 3 0 4
Year
% co
mpl
ianc
eFigure 9.2 Level of compliance with key marine Water Quality Objectives
in Hong Kong, 1995 - 2004
83%
79%
82%83%
70%
81%
87% 87%
79%
87%
79%
77%
81%
73%
76%
85%
76%73%
87%
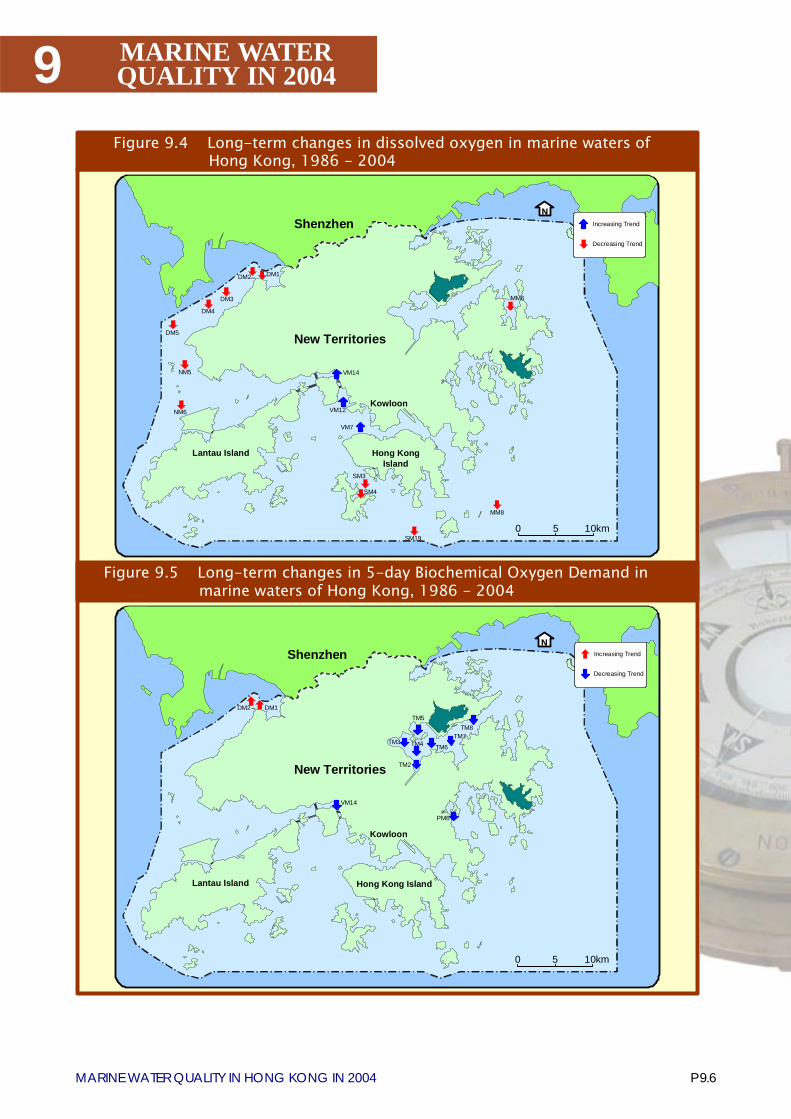
P 9.6MARINE WATER QUALITY IN HONG KONG IN 2004
9 MARINE WATERQUALITY IN 2004
Figure 9.5 Long-term changes in 5-day Biochemical Oxygen Demand in marine waters of Hong Kong, 1986 - 2004
Figure 9.4 Long-term changes in dissolved oxygen in marine waters of Hong Kong, 1986 - 2004
New Territories
Kowloon
Hong Kong Island
Shenzhen
0 5 10km
N
Lantau Island
Increasing Trend
Decreasing Trend
VM14
TM7
TM5
TM4
TM8
TM2
TM3TM6
PM6
DM2
New Territories
Kowloon
Hong Kong Island
Shenzhen
0 5 10km
N
Lantau Island
Increasing Trend
Decreasing Trend
NM6
DM5
DM4
DM3
DM2
VM14
DM1
SM19
MM6
MM8
SM4
VM12
VM7
NM5
SM3
DM1
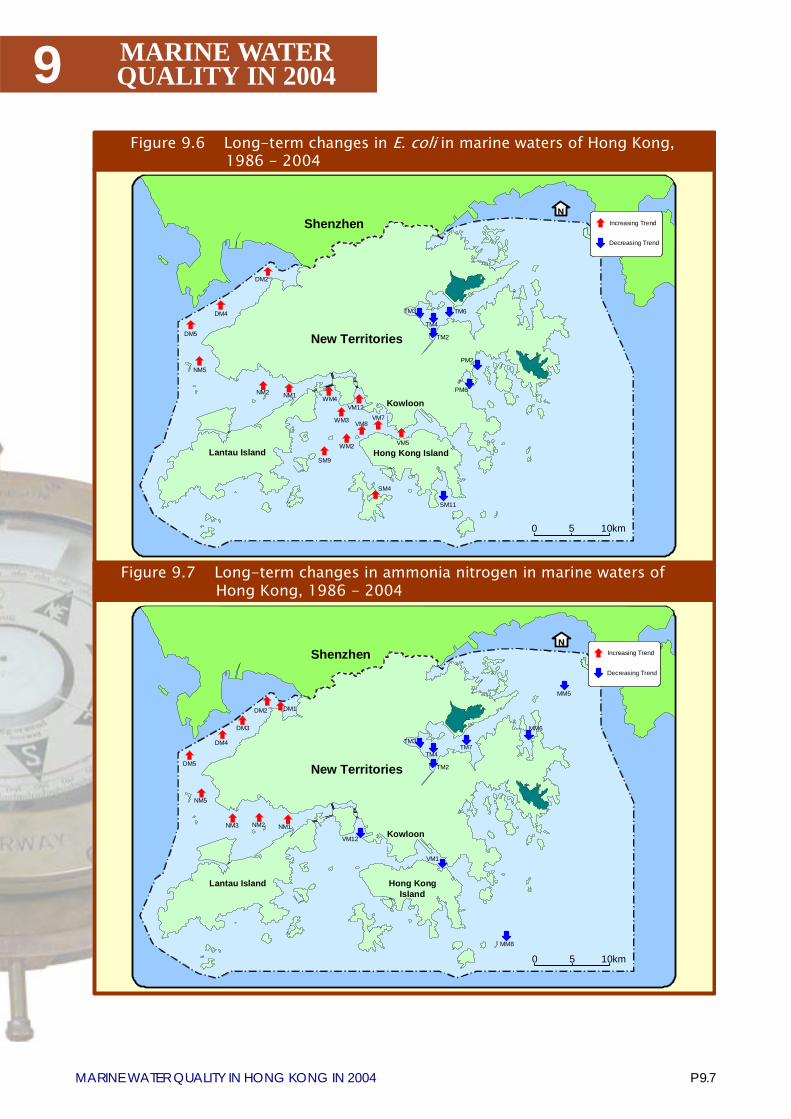
P 9.7MARINE WATER QUALITY IN HONG KONG IN 2004
9 MARINE WATERQUALITY IN 2004
Figure 9.7 Long-term changes in ammonia nitrogen in marine waters ofHong Kong, 1986 - 2004
Figure 9.6 Long-term changes in E. coli in marine waters of Hong Kong, 1986 - 2004
New Territories
Kowloon
Hong Kong Island
Shenzhen
0 5 10km
N
Lantau Island
Increasing Trend
Decreasing Trend
NM1
NM5
DM5
DM4
DM2
WM2
SM9
VM12
WM3
WM4
VM5
VM7VM8
PM2
PM6
SM4
New Territories
Kowloon
Hong Kong Island
Shenzhen
0 5 10km
N
Lantau Island
DM4
DM1
NM3
Increasing Trend
Decreasing Trend
DM3
DM2
NM5
DM5
NM2
MM8
MM6
MM5
NM2
TM4
TM2
TM3 TM6
SM11
NM1
VM1
VM12
TM4
TM2
TM3TM7
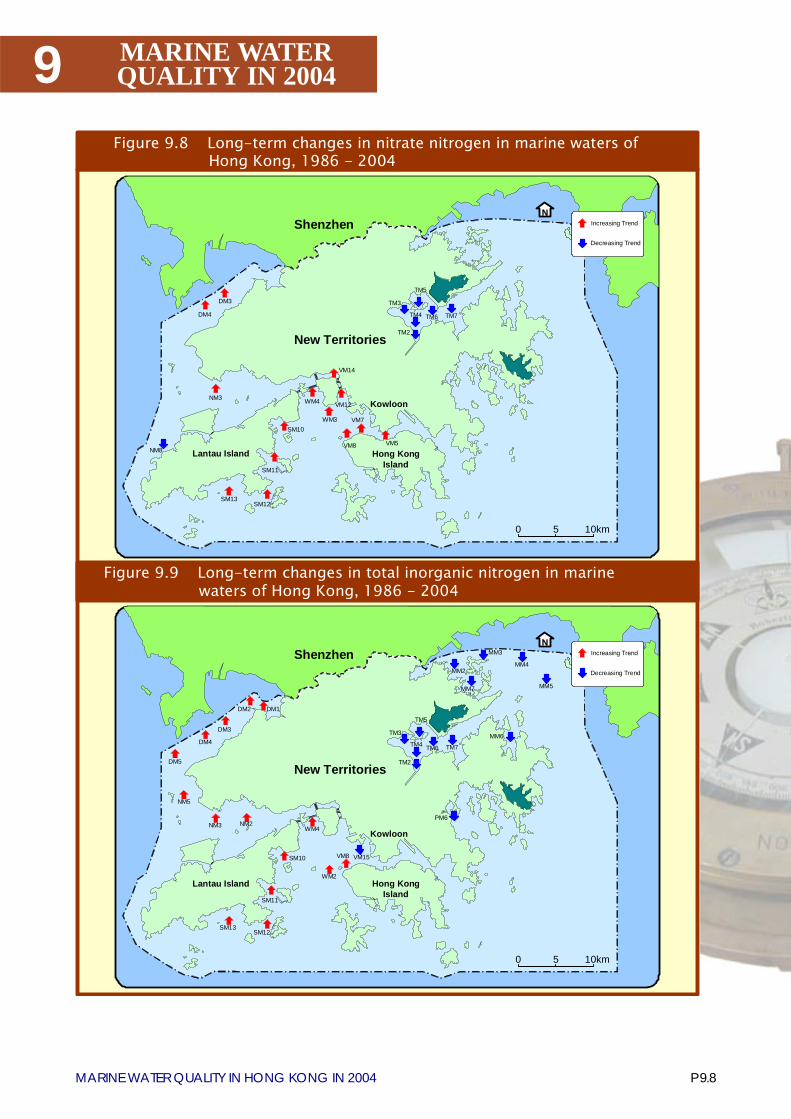
P 9.8MARINE WATER QUALITY IN HONG KONG IN 2004
9 MARINE WATERQUALITY IN 2004
Figure 9.9 Long-term changes in total inorganic nitrogen in marine waters of Hong Kong, 1986 - 2004
Figure 9.8 Long-term changes in nitrate nitrogen in marine waters of Hong Kong, 1986 - 2004
New Territories
Kowloon
Hong Kong Island
Shenzhen
0 5 10km
N
Lantau Island
DM4
VM14
WM4NM3
SM12
SM11
SM13
Increasing Trend
Decreasing Trend
SM10
VM8
VM12
WM3 VM7
VM5
TM2
TM3
TM5
TM4 TM6
DM3
New Territories
Kowloon
Hong Kong Island
Shenzhen
0 5 10km
N
Lantau Island
DM4
DM3
DM2 DM1
WM4NM2
NM5
SM12
SM11
SM13
Increasing Trend
Decreasing Trend
SM10
DM5
MM6
MM7
MM3
VM8
NM8
NM3
WM2
TM2
TM3
TM5
TM4 TM6 TM7
TM7
MM2MM4
MM5
PM6
VM15
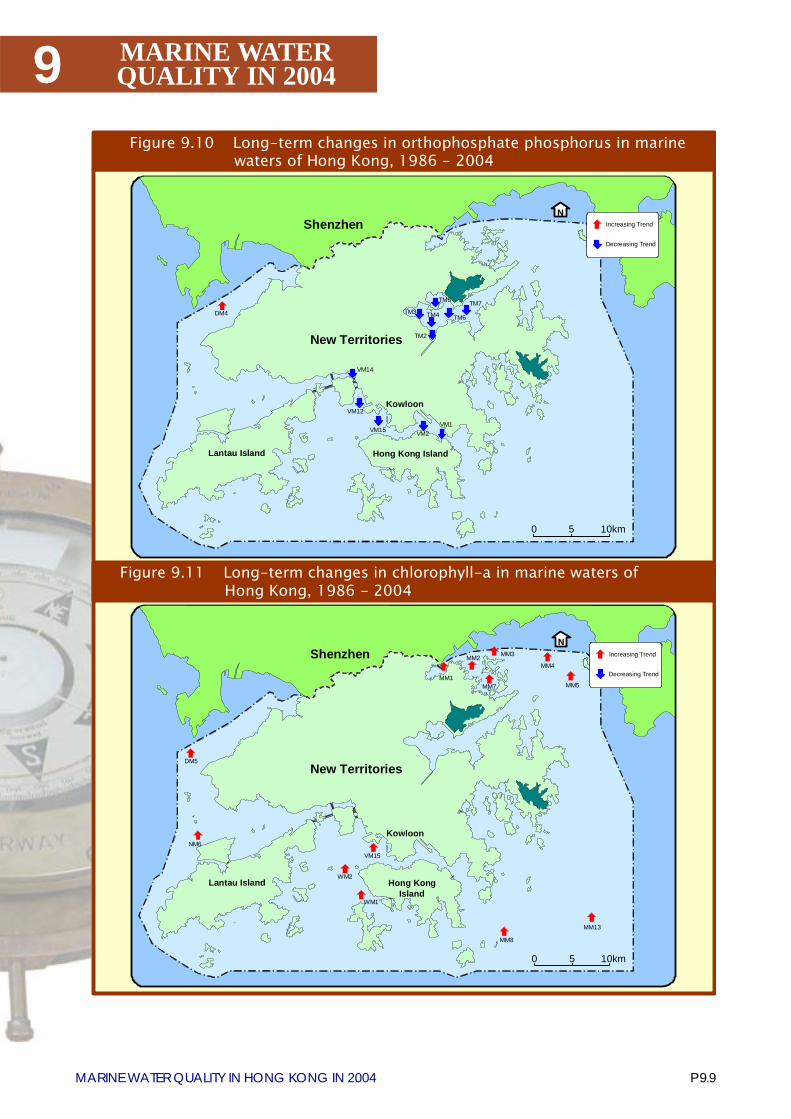
P 9.9MARINE WATER QUALITY IN HONG KONG IN 2004
9 MARINE WATERQUALITY IN 2004
Figure 9.11 Long-term changes in chlorophyll-a in marine waters of Hong Kong, 1986 - 2004
Figure 9.10 Long-term changes in orthophosphate phosphorus in marinewaters of Hong Kong, 1986 - 2004
New Territories
Kowloon
Hong Kong Island
Shenzhen
0 5 10km
N
Lantau Island
Increasing Trend
Decreasing Trend
VM15
NM6
MM1
MM2 MM3
MM4
MM7 MM5
MM8
MM13
WM1
DM5
WM2
New Territories
Kowloon
Hong Kong Island
Shenzhen
0 5 10km
N
Lantau Island
TM2
VM14
VM15
Increasing Trend
Decreasing Trend
VM1
TM7TM3
TM5
TM4 TM6
VM12
DM4
VM2

P 9.10MARINE WATER QUALITY IN HONG KONG IN 2004
9 MARINE WATERQUALITY IN 2004
Figure 9.13 Long-term changes in pH in marine waters of Hong Kong,1986 - 2004
Figure 9.12 Long-term changes in temperature in marine waters ofHong Kong, 1986 - 2004
New Territories
Kowloon
Hong Kong Island
Shenzhen
0 5 10km
N
Lantau Island
DM4
DM2
VM8
VM14
VM6
PM6
TM5
Increasing Trend
Decreasing Trend
New Territories
Kowloon
Hong Kong Island
Shenzhen
0 5 10km
Lantau Island
TM7
SM9
VM12WM3
VM14
WM4
SM10 VM8
SM18
SM7
WM2
TM8
VM5VM6VM7
SM5
VM1VM2
VM4
WM1
TM2
TM3
EM3
PM2
TM6
TM5
TM4
EM1
EM2
JM4
JM3
PM1
PM9PM7
PM8
PM6
PM4
NIncreasing Trend
Decreasing Trend
SM6
SM11
SM12
SM17
NM5
MM17
MM8MM13
MM4
NM3
DM4
SM1
SM2SM3
SM4SM13
PM3
TM7