
Electrical detection of the temperature induced melting transition of a DNA hairpin covalently...
11
Published online 15 July 2008 Nucleic Acids Research, 2008, Vol. 36, No. 15 e98 doi:10.1093/nar/gkn436 Electrical detection of the temperature induced melting transition of a DNA hairpin covalently attached to gold interdigitated microelectrodes Greg P. Brewood 1, *, Yaswanth Rangineni 2 , Daniel J. Fish 1 , Ashwini S. Bhandiwad 1 , David R. Evans 3 , Raj Solanki 2,4 and Albert S. Benight 1,4,5 1 Portland Bioscience, Inc., Portland, OR 97201, 2 Department of Electrical & Computer Engineering, Portland State University, 3 SHARP Laboratories of America, Inc., Camas, WA 98607, 4 Department of Physics and 5 Department of Chemistry, Portland State University, Portland, OR 97207, USA Received October 10, 2007; Revised and Accepted June 24, 2008 ABSTRACT The temperature induced melting transition of a self- complementary DNA strand covalently attached at the 5’ end to the surface of a gold interdigitated microelectrode (GIME) was monitored in a novel, label-free, manner. The structural state of the hairpin was assessed by measuring four different electronic properties of the GIME (capacitance, impedance, dissipation factor and phase angle) as a function of temperature from 258C to 808C. Consistent changes in all four electronic properties of the GIME were observed over this temperature range, and attribu- ted to the transition of the attached single-stranded DNA (ssDNA) from an intramolecular, folded hairpin structure to a melted ssDNA. The melting curve of the self-complementary single strand was also mea- sured in solution using differential scanning calori- metry (DSC) and UV absorbance spectroscopy. Temperature dependent electronic measurements on the surface and absorbance versus temperature values measured in solution experiments were ana- lyzed assuming a two-state process. The model ana- lysis provided estimates of the thermodynamic transition parameters of the hairpin on the surface. Two-state analyses of optical melting data and DSC measurements provided evaluations of the ther- modynamic transition parameters of the hairpin in solution. Comparison of surface and solution mea- surements provided quantitative evaluation of the effect of the surface on the thermodynamics of the melting transition of the DNA hairpin. INTRODUCTION There is a substantial demand for analytical platforms cap- able of detecting specific DNA sequence markers. Struc- tural transitions associated with specific nucleic acid interactions often serve as the central feature for sensing external samples. However, prior to building a sensor to detect external samples, inherent features of the sensing element on the specific detection platform must be cali- brated. That is, when DNA transitions comprise the sensing element, selected sequences can be designed to provide molecular transitions with specifically desired features. Eva- luation of thermodynamic parameters and melting proper- ties of the DNA on the surface where the reaction takes place is required for optimal design of sensing elements. In contrast to the same hybridization reactions that occur on the surface, reactions of DNA in solution are easier to characterize. Thermodynamic parameters of these reactions can be evaluated directly from solution measurements and employed to calibrate signals measured by the sensor for the same reactions on the surface. A standard measure of the solution thermodynamic stability of short duplex DNAs is the melting temperature, T m . Melting temperature is defined to be the point where half of the DNA exists in the duplex state and half exists as single strands. Solution T m s are used both to design and characterize DNAs in hybridization reactions. Under com- parable conditions, when one strand of the duplex is attached to a surface, T m is reportedly different (>108C in some cases) than for the same duplex DNA in solution (1,2). Although this effect on T m crudely reflects the influ- ence of the surface on the stability of the duplex, it provides little insight into how thermodynamics of the hybridization reaction are affected by the surface. *To whom correspondence should be addressed. Tel: +503 725 2350; Fax: +503 725 2305; Email: [email protected] ß 2008 The Author(s) This is an Open Access article distributed under the terms of the Creative Commons Attribution Non-Commercial License (http://creativecommons.org/licenses/ by-nc/2.0/uk/) which permits unrestricted non-commercial use, distribution, and reproduction in any medium, provided the original work is properly cited. by guest on December 9, 2013 http://nar.oxfordjournals.org/ Downloaded from
Transcript of Electrical detection of the temperature induced melting transition of a DNA hairpin covalently...

Published online 15 July 2008 Nucleic Acids Research, 2008, Vol. 36, No. 15 e98doi:10.1093/nar/gkn436
Electrical detection of the temperatureinduced melting transition of a DNA hairpincovalently attached to gold interdigitatedmicroelectrodesGreg P. Brewood1,*, Yaswanth Rangineni2, Daniel J. Fish1, Ashwini S. Bhandiwad1,
David R. Evans3, Raj Solanki2,4 and Albert S. Benight1,4,5
1Portland Bioscience, Inc., Portland, OR 97201, 2Department of Electrical & Computer Engineering, Portland StateUniversity, 3SHARP Laboratories of America, Inc., Camas, WA 98607, 4Department of Physics and 5Department ofChemistry, Portland State University, Portland, OR 97207, USA
Received October 10, 2007; Revised and Accepted June 24, 2008
ABSTRACT
The temperature induced melting transition of a self-complementary DNA strand covalently attached atthe 5’ end to the surface of a gold interdigitatedmicroelectrode (GIME) was monitored in a novel,label-free, manner. The structural state of the hairpinwas assessed by measuring four different electronicproperties of the GIME (capacitance, impedance,dissipation factor and phase angle) as a function oftemperature from 258C to 808C. Consistent changesin all four electronic properties of the GIME wereobserved over this temperature range, and attribu-ted to the transition of the attached single-strandedDNA (ssDNA) from an intramolecular, folded hairpinstructure to a melted ssDNA. The melting curve ofthe self-complementary single strand was also mea-sured in solution using differential scanning calori-metry (DSC) and UV absorbance spectroscopy.Temperature dependent electronic measurementson the surface and absorbance versus temperaturevalues measured in solution experiments were ana-lyzed assuming a two-state process. The model ana-lysis provided estimates of the thermodynamictransition parameters of the hairpin on the surface.Two-state analyses of optical melting data and DSCmeasurements provided evaluations of the ther-modynamic transition parameters of the hairpin insolution. Comparison of surface and solution mea-surements provided quantitative evaluation of theeffect of the surface on the thermodynamics of themelting transition of the DNA hairpin.
INTRODUCTION
There is a substantial demand for analytical platforms cap-able of detecting specific DNA sequence markers. Struc-tural transitions associated with specific nucleic acidinteractions often serve as the central feature for sensingexternal samples. However, prior to building a sensor todetect external samples, inherent features of the sensingelement on the specific detection platform must be cali-brated. That is, whenDNA transitions comprise the sensingelement, selected sequences can be designed to providemolecular transitions with specifically desired features. Eva-luation of thermodynamic parameters and melting proper-ties of the DNA on the surface where the reaction takesplace is required for optimal design of sensing elements.In contrast to the same hybridization reactions that
occur on the surface, reactions of DNA in solution areeasier to characterize. Thermodynamic parameters ofthese reactions can be evaluated directly from solutionmeasurements and employed to calibrate signals measuredby the sensor for the same reactions on the surface. Astandard measure of the solution thermodynamic stabilityof short duplex DNAs is the melting temperature, Tm.Melting temperature is defined to be the point where halfof the DNA exists in the duplex state and half exists assingle strands. Solution Tms are used both to design andcharacterize DNAs in hybridization reactions. Under com-parable conditions, when one strand of the duplex isattached to a surface, Tm is reportedly different (>108Cin some cases) than for the same duplex DNA in solution(1,2). Although this effect on Tm crudely reflects the influ-ence of the surface on the stability of the duplex, it provideslittle insight into how thermodynamics of the hybridizationreaction are affected by the surface.
*To whom correspondence should be addressed. Tel: +503 725 2350; Fax: +503 725 2305; Email: [email protected]
� 2008 The Author(s)
This is an Open Access article distributed under the terms of the Creative Commons Attribution Non-Commercial License (http://creativecommons.org/licenses/
by-nc/2.0/uk/) which permits unrestricted non-commercial use, distribution, and reproduction in any medium, provided the original work is properly cited.
by guest on Decem
ber 9, 2013http://nar.oxfordjournals.org/
Dow
nloaded from
General models of nucleic acid helical stability have beendeduced that are applicable to estimate thermodynamicparameters of short duplex DNAs with well definedsequences. These approaches rely on established sets ofnearest-neighbor (n-n) stability parameters evaluatedfrom solution melting experiments (3,4). Employing theseparameters for stability calculations of short duplex DNAsin solution is standard practice and in most cases, predic-tions provide reasonable agreement with experimentalresults in solution (3–13). Stabilities are often calculatedusing the n-n solution parameters. An implicit assumptionunderlying the use of the n-n model to predict extents ofhybridization on different sensing platforms is that thethermodynamic rules governing strand annealing remainthe same in the vicinity of the surface (if even in a relativesense), compared with in solution. Even so, different sur-faces are likely to contribute to the overall stabilities ofreaction products in different ways. For different sensingplatforms, effects of the surface on molecular propertiesand interaction chemistries just above the surface areexpected to be inherently complex in nature.In this study, a DNA oligonucleotide was designed with
complementary sequences on each end so as to promoteformation of a stable intramolecular structure, with 20 bpin the stem and a four base loop, at temperatures belowthe melting temperature. The DNA was synthesized with a50-C6-thiol linker for attachment to the surface of goldinterdigitated microelectrodes (GIME). The temperatureinduced melting transition from the surface-attached hair-pin structure to the melted, single-stranded species wasthen detected using impedance spectroscopy.The solution stability of the hairpin was determined
by differential scanning calorimetry (DSC) and UV absor-bance spectroscopy in the same buffer as in the surface-based electronic measurements. Thermodynamic para-meters derived from solution measurements were used togenerate theoretical two-state model curves fit to the impe-dance spectroscopy transition data. Comparison of thecurves derived from the two measurements indicated thehairpin to be more stable on the surface.
MATERIALS AND METHODS
DNA
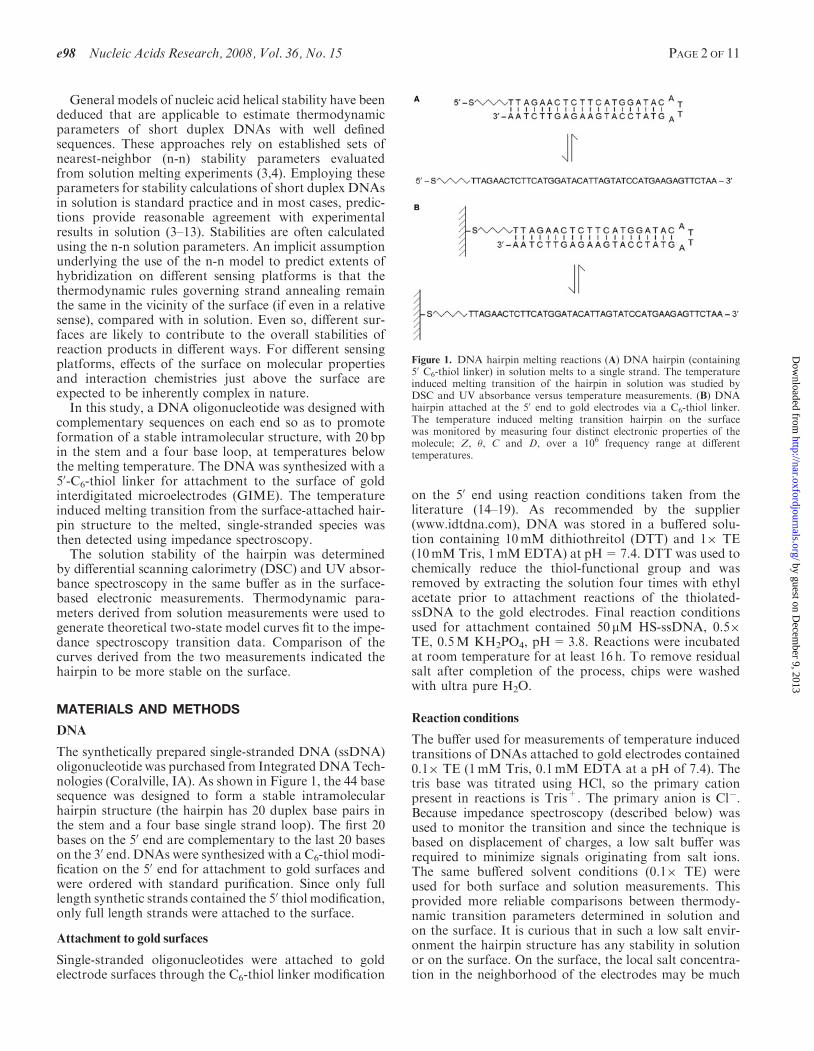
The synthetically prepared single-stranded DNA (ssDNA)oligonucleotide was purchased from IntegratedDNATech-nologies (Coralville, IA). As shown in Figure 1, the 44 basesequence was designed to form a stable intramolecularhairpin structure (the hairpin has 20 duplex base pairs inthe stem and a four base single strand loop). The first 20bases on the 50 end are complementary to the last 20 baseson the 30 end. DNAs were synthesized with a C6-thiol modi-fication on the 50 end for attachment to gold surfaces andwere ordered with standard purification. Since only fulllength synthetic strands contained the 50 thiol modification,only full length strands were attached to the surface.
Attachment to gold surfaces
Single-stranded oligonucleotides were attached to goldelectrode surfaces through the C6-thiol linker modification
on the 50 end using reaction conditions taken from theliterature (14–19). As recommended by the supplier(www.idtdna.com), DNA was stored in a buffered solu-tion containing 10mM dithiothreitol (DTT) and 1� TE(10mM Tris, 1mM EDTA) at pH=7.4. DTT was used tochemically reduce the thiol-functional group and wasremoved by extracting the solution four times with ethylacetate prior to attachment reactions of the thiolated-ssDNA to the gold electrodes. Final reaction conditionsused for attachment contained 50 mM HS-ssDNA, 0.5�TE, 0.5M KH2PO4, pH=3.8. Reactions were incubatedat room temperature for at least 16 h. To remove residualsalt after completion of the process, chips were washedwith ultra pure H2O.
Reaction conditions
The buffer used for measurements of temperature inducedtransitions of DNAs attached to gold electrodes contained0.1� TE (1mM Tris, 0.1mM EDTA at a pH of 7.4). Thetris base was titrated using HCl, so the primary cationpresent in reactions is Tris+. The primary anion is Cl�.Because impedance spectroscopy (described below) wasused to monitor the transition and since the technique isbased on displacement of charges, a low salt buffer wasrequired to minimize signals originating from salt ions.The same buffered solvent conditions (0.1� TE) wereused for both surface and solution measurements. Thisprovided more reliable comparisons between thermody-namic transition parameters determined in solution andon the surface. It is curious that in such a low salt envir-onment the hairpin structure has any stability in solutionor on the surface. On the surface, the local salt concentra-tion in the neighborhood of the electrodes may be much
Figure 1. DNA hairpin melting reactions (A) DNA hairpin (containing50 C6-thiol linker) in solution melts to a single strand. The temperatureinduced melting transition of the hairpin in solution was studied byDSC and UV absorbance versus temperature measurements. (B) DNAhairpin attached at the 50 end to gold electrodes via a C6-thiol linker.The temperature induced melting transition hairpin on the surfacewas monitored by measuring four distinct electronic properties of themolecule; Z, �, C and D, over a 106 frequency range at differenttemperatures.
e98 Nucleic Acids Research, 2008, Vol. 36, No. 15 PAGE 2 OF 11
by guest on Decem
ber 9, 2013http://nar.oxfordjournals.org/
Dow
nloaded from

higher as electrodes could recruit counterions out of solu-tion to the surface. This would result in a higher ionicstrength in the local region of the electrode. However,the hairpin is apparently stable in solution under thesame low salt conditions, which is also surprising.
Differential scanning calorimetry
Measurements of the excess heat capacity, �Cp, of DNAsolutions as a function of temperature were made using aNano-DSCTM (Calorimetry Sciences Corp., Lindon, UT).�Cp is the amount by which the apparent specific heat fora solution containing a solute exceeds the baseline specificheat of a solution with no added solute (20). A plot of �Cp
versus temperature is the DSCmelting curve. The transitiontemperature or Tm of a DSC melting curve is the tempera-ture at which the maximum peak height is observed on thebaseline-corrected �Cp versus temperature curve. The inte-grated area under the concentration corrected DSC meltingcurve provides the DSC transition enthalpy,
�Hcal ¼
Z�CpdT 1
The DSC transition entropy values are determined fromthe integrated area under the plotted curve of �Cp/Tversus temperature,
�Scal ¼
Z�Cp
TdT 2
For DSC melting curves, DNA samples in 0.1� TE bufferwere heated and cooled at a rate of 1208C/h over the tem-perature range from 158C to 1058C. Two heating (melting)curves and two cooling curves were collected for everysample. Data were analyzed using the CpCalcTM, version2.1 software package from Applied ThermodynamicsCorp., USA. The analysis yielded values of the enthalpy,�Hcal, and entropy, �Scal for the melting transition.These evaluated parameters were used subsequently intwo-state model analyses of the acquired data.
UV absorbance spectroscopy
Optical melting curves were collected as the absorbance at268 nm versus temperature using a Hewlett-PackardTM
8452a diode array spectrophotometer with a 89090APeltierTM temperature station. Absorbance values weremeasured at a heating rate of 1208C/h over the tempera-ture range from 208C to 1008C. Values of thermodynamictransition parameters were estimated from graphical ana-lysis of the differential melting curves as previouslyreported (21). Reported parameters are average valuesobtained from multiple (at least two) independent meltingexperiments.
Gold interdigitated microelectrodes
Interdigitated electrodes are comprised of micrometer sizedintertwined gold fingers that provide maximum interactionover a small area. A micrograph of a GIME is shownin Figure 2A. Each gold electrode ‘finger’ had dimensions(width� length� height)=1 mm� 100 mm� 0.2mm. Thecorresponding surface area provided a sufficiently large
substrate for attachment of ssDNA. A schematic of aGIME cross-section depicting well dimensions, DNAattachment to their modified gold surfaces and the sourceof electrical measurements is shown in Figure 2B. Eachchip had a total of 50 electrodes, 25 for each polarity anda gap spacing of 1 mm between each electrode. Smalldimensions of the sensors allows for simultaneous probingof several sets of GIMEs leading to increases in sensitivity,higher signal-to-noise ratios and greater reliability of col-lected data. Quality and efficiency of collected electricalsignals is influenced by electrode length, gap size andtotal number of electrodes.
Electrical measurements
Dielectric response of macromolecules placed in an exter-nal electrical potential can be measured using impedancespectroscopy. However, it is essential that the moleculesbe bound to the electrode surface so that polarizationchanges induced in the molecules can be detected. Mole-cules not bound to the surface, but suspended in buffersolution, are likely to undergo oscillations in response tothe applied alternating electric field. This produces a broadsignal devoid of specific molecular signatures. GIMEswere fabricated following standard processes commonlyemployed throughout the microelectronic industry. Elec-trodes were fabricated on top of a 100 nm thick layer ofsilicon oxide grown on silicon wafers. Measurements atelevated temperatures were difficult due to evaporationof the liquid sample during the course of temperaturedependent experiments. To minimize evaporation, glasstubing cut in half along the longitudinal axis, was placedon top of the chip to produce a cavity sealed around theedges. A small hole at one end of this enclosure allowedthe fluid in the cavity to expand and provided a portthrough which to add solutions to the cavity. For externalconnection, contact arms of the GIMEs protruded beyondthe cavity.
Impedance measurements
Impedance spectroscopy generally involves small-signalmeasurement of the electrical response of a material ofinterest and subsequent analysis of the response to yielduseful information regarding physicochemical propertiesof the system (22). An alternating electric field was uti-lized to probe electrical properties of the immobilizedmolecules and their interfaces with electrically conductingelectrodes. Measurements were made using a circuit com-posed of GIMEs and an impedance meter (HP 4192A)while varying temperature and frequency of the appliedalternating electric field. Impedance measurements weremade on a probe station that was equipped with a sampleholder that could be heated. For actual measurements, achip was placed on the holder and the GIMEs were con-tacted at the protruding arms with fine wire tips. Initially,room temperature measurements were made and servedas the base line. Subsequently, measurements of four elec-tronic parameters over a wide frequency range (describedbelow) were recorded at 30, 40, 50, 60, 70 and 808C.At each temperature the four electrical parameters, Z, �,
D and C were monitored over a frequency range from
PAGE 3 OF 11 Nucleic Acids Research, 2008, Vol. 36, No. 15 e98
by guest on Decem
ber 9, 2013http://nar.oxfordjournals.org/
Dow
nloaded from

5Hz to 13MHz. Impedance (Z) is the complex resistance,(i.e. resistance when the phase difference between theapplied voltage and current is nonzero); Phase angle (�)is the phase difference between the voltage and the current;dissipation factor (D) is the ratio between the complexresistance and resistance when the phase is zero; and capa-citance (C) is the charge per unit voltage. To minimizecontributions from buffer components and circuit parasi-tics, room temperature values for each of the four para-meters were subtracted from corresponding valuesmeasured at different temperatures.
RESULTS
Solution measurements
Multiple temperature dependent measurements of thebehavior of DNA samples were acquired using two differ-ent techniques. Both optical absorbance spectroscopy andDSC are consistent with the DNA forming a hairpin insolution. Subsequent to solution measurements, the DNAsample was diluted and the electrical conductivity of thesolution measured to confirm the salt concentration(data not shown). Conductivity measurements wereentirely consistent with the extremely low salt condition
(1mM Tris). It is quite remarkable that intramolecularhairpins could form under these conditions.
Optical melting curves
A plot of the absorbance measured at 268 nm versus tem-perature for the self-complementary single strand in 0.1�TE buffered solvent is shown in Figure 3A. Optical meltingcurves exhibited sigmoidal transitions with distinct lowerlinear base lines, attributed to the duplex hairpin and upperlinear base lines corresponding to melted single strands.The normalized optical melting curve, representing thefraction of melted hairpin (a) versus temperature, isshown in Figure 3B. The derivative curve, da/dT versustemperature, is shown in Figure 3C (dash–dot line). Thetemperature at the maximum peak height of the derivativecurve is the melting temperature, Tm. Thermodynamicparameters for the melting transition were evaluated bygraphical analysis of the derivative curve in Figure 3cusing Equation (S9) of the Supplementary Material.Values of graphically evaluated thermodynamic para-meters are given in Table 1.
Thermodynamic transition parameters estimated fromgraphical analysis of optical melting implicitly assumethe hairpin melting process is two-state, i.e. there are no
200 nm
1 micron
E
+/(−) − /(+)
1 micron
A
B
Figure 2. GIMEs (A) Micrograph image of an interdigitated electrode comprised of micron-sized intertwined metal fingers that allow a maximuminteraction over a small area. Each chip had a total of 100 electrodes, 50 for each polarity, and a gap ‘spacing’ of 1 mm between the interdigitatedelectrodes. (B) Schematic cross-section of two interdigitated electrodes. The width of each ‘finger’ is 1mm and the length is 100 mm. The heights of theelectrodes are 200 nm and provided a large surface area for attachment of the ssDNA allowing enhanced sensitivity. DNAs attached to the surfaceare subjected to an alternating electric field, ~E, and electrical measurements are measured.
e98 Nucleic Acids Research, 2008, Vol. 36, No. 15 PAGE 4 OF 11
by guest on Decem
ber 9, 2013http://nar.oxfordjournals.org/
Dow
nloaded from

partially melted intermediate states. Consequently, derivedparameters are inherently model-dependent. Accuracyof the two-state model and thermodynamic parametersevaluated from analysis of optical melting curves can bequantitatively ascertained by comparison with values mea-sured by DSC.
DSCmelting curves
DSC measurements provide measures of the excess heatcapacity changes during the temperature induced meltingreaction and thereby provide direct measurements oftransition thermodynamic parameters. DSC thermody-namic parameters are model-independent, therefore. Aplot of the excess heat capacity, �Cp, versus temperatureobtained by DSC is co-plotted in Figure 3C for compar-ison (solid line). To compare the optical and DSC shapes,the derivative melting curve obtained from optical mea-surements (and displayed in Figure 3C) was scaled andshifted to align with the DSC Tm. The two curves arequite comparable and thermodynamic parameters evalu-ated by DSC and optical melting are listed in Table 1.There is a slightly more prominent shoulder on the DSCcurve. As expected for a hairpin melting transition, Tm
values measured by both techniques are equivalent withinexperimental error. However, thermodynamic parametersextracted from both types of melting curve measurementswere lower than anticipated for the presumed hairpinstructure. The greatly decreased thermodynamic stabilityin the low salt environment might be expected.An alternate explanation for the observed smaller than
expected enthalpy of melting is that the hairpin hasdegraded. Although an obvious possibility, we considerit quite remote for the following reasons. Multiple surfaceand solution experiments (at least four replicates) wereconducted. All gave consistent results and throughout noevidence of degradation was observed whatsoever. In sucha low Na+ environment, it would be expected that signifi-cantly lower values of the thermodynamic parametersmight be obtained due to a lower stability. However, it isquite remarkable that intramolecular hairpins actuallyform under these conditions.Comparisons of parameter values in Table 1 reveal the
optical values of �H8 and �S8 are in agreement with thoseobtained from DSC measurements. It should be notedthe choice of baselines has a significant effect on thevalue of the peak height on the derivative melting curve,from which �H8 is examined. Likewise, parameters
A
B
C
Figure 3. Melting curves. (A) Raw absorbance measured at 268 nm as afunction of temperature for the hairpin molecule in Figure 1A. Data werecollected for one cooling cycle and two separate heating cycles and aver-aged. Measurements were made over a temperature range from 208C to1008C at a heating rate of 1208C/h. (B) Fraction of broken base pairs a (T)versus temperature obtained from the raw absorbances versus tempera-ture in (A). This curve was obtained by normalizing the fractional absor-bance change versus temperature between lower and upper linearbaselines (23). (C) Comparison of the optical and DSC melting curves.The plot of the fraction of broken base pairs (a) versus temperature curvewas smoothed by fitting a sigmoidal curve to the data in (B) and thesmooth derivative plot of da/dT versus temperature was obtained(dash–dot line). The DSCmelting curve of the excess molar heat capacity,�Cp versus temperature (solid line) is also shown for comparison.Integration of this curve gives a direct measurement of the heat involvedin the melting transition. The curve shown is an average of four differentscans; two from heating and two cooling cycles. The Tm values are slightlydifferent but the curve shapes are similar.
Table 1. Thermodynamic transition parameters measured by DSC and
graphically estimated from A268 versus temperature measurements in a
buffered 0.1� TE solution
�H8(kcal/mol)
�S8(cal/Kmol)
�G8(258C)(kcal/mol)
Tm (8C)
DSC 72.0� 1.9 224� 6 5.3� 2.6 48.6� 0.8UV Absorbance 73.3� 0.8 229� 2 5.1� 1.0 47.0� 0.1
Evaluated solution parameters (�G8 values) were used to fit the two-state model to the melting transition of the DNA hairpin attached tothe gold surface and monitored by impedance spectroscopy.
PAGE 5 OF 11 Nucleic Acids Research, 2008, Vol. 36, No. 15 e98
by guest on Decem
ber 9, 2013http://nar.oxfordjournals.org/
Dow
nloaded from

obtained fromDSCmeasurements are dependent upon thepre- and post-transition baselines. Therefore, it is essentialthat baseline regions from both optical and DSC techni-ques be consistently analyzed. The thermodynamic para-meters combined with the comparable Tm values measuredby optical and DSC melting indicates essentially the samereaction was monitored by both techniques. Agreementbetween the experimental Tm and thermodynamic para-meters obtained from the model-dependent (optical melt-ing) analysis and directly measured by DSC are notinconsistent with the two-state assumption. The data arerather high quality in that the relative errors of measuredthermodynamic parameters evaluated by DSC or UVabsorbance are <3%.Directly measured thermodynamic parameters evalu-
ated in solution using DSC (and given in Table 1) wereused in a two-state fit of the model to the melting transi-tions measured electronically on the surface. In analysis ofboth solution and surface melting data it is assumed onlytwo molecular states occur throughout the transition (i.e.the duplex hairpin and melted single strands). Contribu-tions of partially melted intermediates to the melting pro-cess and melting curve shape are presumed to be minimal.Validity of this assumption was obtained from results ofboth solution and surface melting measurements thatshowed quite comparable qualitative behavior. Quantita-tive differences were presumably due to a combination ofsurface effects and temperature dependent features of theparticular electrical signals used to monitor the hairpinmelting transition.
Melting curves on GIMEs
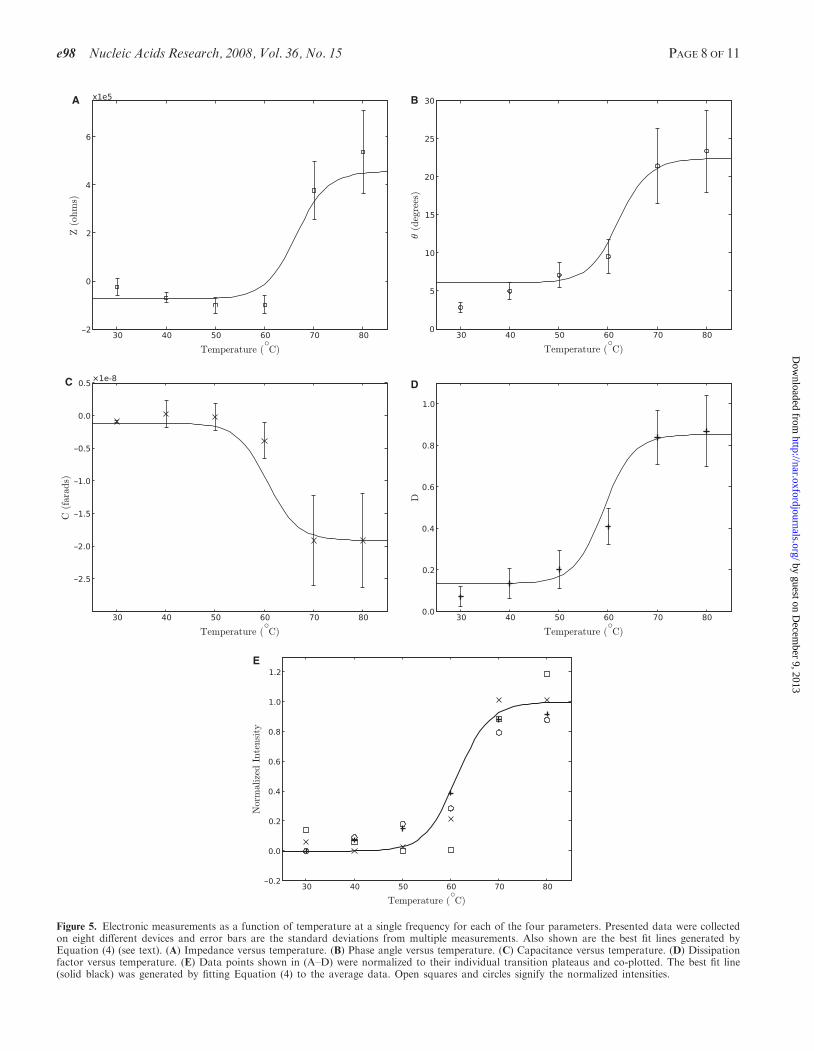
The hairpin to single strand melting transition of thesurface-attached DNA was monitored electronically as afunction of temperature. Measurements were collected oneight different GIME devices and produced entirely con-sistent results. Temperature was varied from 308C to 808Cwhile distinct (albeit different) changes in Z, �, D and Cwere observed. Changes in each electrical parameter weremonitored, at distinct frequencies displaying the largestchanges, to produce the temperature profiles shown inFigure 5. Melting transitions were consistent with a two-state model. Typical frequency scans of the four electricalparameters, Z, �, D and C, at six different temperaturesaveraged over similar data collected on eight differentdevices are shown in Figure 4.
Analysis and comparison of solution and surface meltingtransitions
Each electrical signal measured as a function of tempera-ture displayed a consistent trend. At temperatures belowTm, average measured intensities were essentially constantand distinct from signal intensities measured aboveTm that were clearly at a different average intensity.Electrical melting curves were analyzed assuming thatthe temperature dependent molecular process on the sur-face occurs in a two-state manner.For reactions in solution, derivation of equilibrium
properties associated with hairpin melting transitionshave been described previously (5,23). The same analysis
is extended here to include effects of the surface in theunimolecular hairpin melting reaction. The thermody-namic stability of a DNA hairpin reaction constrainedto a surface is assumed here to consist of three distinctand separate components; the Stem, Loop and Surface asshown in Equation (3). Details of the model analysis areprovided in the Supplementary Material. The total freeenergy of the hairpin melting reaction is given by,
�Gtotal ¼ �Gstem þ�Gloop þ�Gsurface
¼ �Gsoln þ�Gsurface 3
�Gstem is the free energy that arises from formation of theduplex stem, �Gloop is the free energy due to formation ofthe loop and �Gsurface is a term that arises from interac-tions of the hairpin molecule with the surface. For a hair-pin in solution, �Gstem and �Gloop are combined into asingle term denoted �Gsoln that represents the stability ofthe hairpin in the solution environment. �Gsoln valueswere calculated from thermodynamic enthalpy andentropy parameters measured in solution experiments.
Experimentally measured melting curves, or plots of thefraction of observed signal change, �, versus temperature,were fit using a two-state model as described in theSupplementary Material (Equation S13) and used herein.
� ¼Ktot
1þ Ktot¼
AKsoln
1þ AKsoln4
where Ktot is defined to be the equilibrium constant forreactions occurring on the surface. The equilibrium con-stant can be written as the product of two terms as
Ktot ¼ eð��Gtot=RTÞ
¼ eð��Gsurface=RTÞ � eð��Gsoln=RTÞ5
The single fitting parameter, A ¼ eð��G surface=RTÞ, is consid-ered to be a correction factor for effects due to the surfacecompared with melting in solution. Using a standardbounded minimization protocol [Jones, Eric, Oliphant,Travis and Pearu Peterson. (2001–) SciPy: Open sourcescientific tools for Python (www.scipy.org)], optimizedfits yielded values of A.
Thermodynamic parameters, �Hcal and �Scal deter-mined by DSC melting curve analysis in the same bufferedsolution, were used in the fitting procedure. In thisapproach, melting transitions for the hairpins measuredon the surface were fit with the two-state model by varyingparameter A, from which the value of Ktot was determinedaccording to Equation (5). Extracted values of A thatproduced the best fits to the data, are summarized inTable 2 and the fits produced are shown as solid blacklines in Figure 5.
The value of A includes surface contributions to thehairpin melting reaction as measured by a specific electricparameter. Although A is expected to depend on a numberof yet poorly understood factors, reported measurementsindicate that the electrical properties provide a monitor ofthe same melting transition that occurs in solution, withadded effects of the surface. These effects on different elec-tric parameters can be quantitatively assessed through thevalues of A.
e98 Nucleic Acids Research, 2008, Vol. 36, No. 15 PAGE 6 OF 11
by guest on Decem
ber 9, 2013http://nar.oxfordjournals.org/
Dow
nloaded from
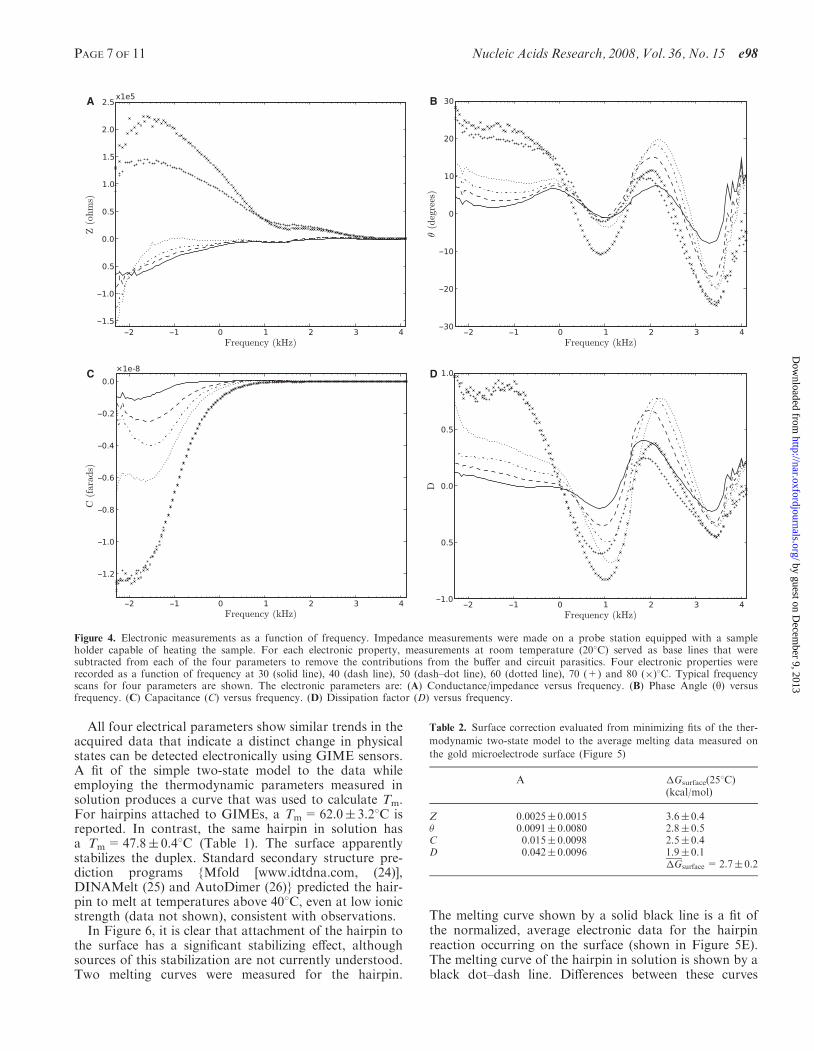
All four electrical parameters show similar trends in theacquired data that indicate a distinct change in physicalstates can be detected electronically using GIME sensors.A fit of the simple two-state model to the data whileemploying the thermodynamic parameters measured insolution produces a curve that was used to calculate Tm.For hairpins attached to GIMEs, a Tm=62.0� 3.28C isreported. In contrast, the same hairpin in solution hasa Tm=47.8� 0.48C (Table 1). The surface apparentlystabilizes the duplex. Standard secondary structure pre-diction programs {Mfold [www.idtdna.com, (24)],DINAMelt (25) and AutoDimer (26)} predicted the hair-pin to melt at temperatures above 408C, even at low ionicstrength (data not shown), consistent with observations.
In Figure 6, it is clear that attachment of the hairpin tothe surface has a significant stabilizing effect, althoughsources of this stabilization are not currently understood.Two melting curves were measured for the hairpin.
The melting curve shown by a solid black line is a fit ofthe normalized, average electronic data for the hairpinreaction occurring on the surface (shown in Figure 5E).The melting curve of the hairpin in solution is shown by ablack dot–dash line. Differences between these curves
A B
C D
Figure 4. Electronic measurements as a function of frequency. Impedance measurements were made on a probe station equipped with a sampleholder capable of heating the sample. For each electronic property, measurements at room temperature (208C) served as base lines that weresubtracted from each of the four parameters to remove the contributions from the buffer and circuit parasitics. Four electronic properties wererecorded as a function of frequency at 30 (solid line), 40 (dash line), 50 (dash–dot line), 60 (dotted line), 70 (+) and 80 (�)8C. Typical frequencyscans for four parameters are shown. The electronic parameters are: (A) Conductance/impedance versus frequency. (B) Phase Angle (y) versusfrequency. (C) Capacitance (C) versus frequency. (D) Dissipation factor (D) versus frequency.
Table 2. Surface correction evaluated from minimizing fits of the ther-
modynamic two-state model to the average melting data measured on
the gold microelectrode surface (Figure 5)
A �Gsurface(258C)(kcal/mol)
Z 0.0025� 0.0015 3.6� 0.4� 0.0091� 0.0080 2.8� 0.5C 0.015� 0.0098 2.5� 0.4D 0.042� 0.0096 1.9� 0.1
�Gsurface =2.7� 0.2
PAGE 7 OF 11 Nucleic Acids Research, 2008, Vol. 36, No. 15 e98
by guest on Decem
ber 9, 2013http://nar.oxfordjournals.org/
Dow
nloaded from
A B
C
E
D
Figure 5. Electronic measurements as a function of temperature at a single frequency for each of the four parameters. Presented data were collectedon eight different devices and error bars are the standard deviations from multiple measurements. Also shown are the best fit lines generated byEquation (4) (see text). (A) Impedance versus temperature. (B) Phase angle versus temperature. (C) Capacitance versus temperature. (D) Dissipationfactor versus temperature. (E) Data points shown in (A–D) were normalized to their individual transition plateaus and co-plotted. The best fit line(solid black) was generated by fitting Equation (4) to the average data. Open squares and circles signify the normalized intensities.
e98 Nucleic Acids Research, 2008, Vol. 36, No. 15 PAGE 8 OF 11
by guest on Decem
ber 9, 2013http://nar.oxfordjournals.org/
Dow
nloaded from

determined by the melting temperatures clearly indicatethat the GIME has a stabilizing effect on the hairpin melt-ing transition. Although origins of stabilization arisingfrom attachment of the hairpin DNA to the gold surfaceare unknown, the observed increase in stability is consis-tent with reported observations of increased stabilitiesfor DNA hybridization reactions occurring on surfaces.Higher melting temperatures were reported for a shortDNA duplex formed with one strand attached to a surfacecompared with the same duplex in solution. This indicatedstabilization of the duplex on the surface (1). Halperinet al. (27) developed a model that assumed the surfaceto be an impenetrable wall, thereby reducing the num-ber of configurations available to a terminally anchoredssDNA. Increased stability was attributed to a reductionin the configurational entropy of the surface attachedDNA hybridization products. This explanation is entirelyconsistent with our observations but many details remainelusive and a more thorough characterization of such sur-face reactions, including specific effects of the surfacecharge should be performed.
DISCUSSION
Results demonstrated that intramolecular structural tran-sitions of hairpins attached to GIMEs can be measuredelectronically using impedance spectroscopy. Addition ofa C6-thiol group to the end of the single strand for attach-ment of the DNA oligonucleotide to the surface is theonly modification required. Experimental measurementsdetected a change in four different electrical parametersas a function of temperature. Because measured transi-tions for each electrical property occurred at nearly iden-tical temperatures, detected signal changes were attributedto melting of the DNA hairpins.
Presumably the GIMEs are sensitive to differences incharge densities near the surface and as such, can detectphysical changes in structure between the duplex hairpinand single strand states of a DNA strand. The phosphatebackbone of DNA is negatively charged so the hybridiza-tion event (formation of the duplex stem of the hairpin)could dramatically increase the charge density near thesurface. The distance over which this effect extends isunknown. Conceivably, electrodes could be tuned to opti-mize a clear difference in measured signal between aduplex hairpin and a fully extended bimolecular duplexthat can form between the single strand on the surfaceand a second complementary single strand in solution.Analytical characterizations arising from measurements
by impedance spectroscopy involve detection of net dis-placements of charged species in a solution to which theelectrode is in contact. As such, a low salt buffer wasrequired to minimize the signal originating from saltions. In this regard, detected signals were isolated on indi-vidual DNA polyions in the same solution. It is essentialthat the molecules be bound to the electrode surface sothat polarization changes induced in the molecules can bedetected. Molecules (of all types) not bound to the surface,but suspended in buffer solution, also undergo oscillationsin response to the applied alternating electric field.However, this produces a broad signal devoid of specificmolecular signatures.In the analytical approach employed herein, potential
effects of the surface on thermodynamic stabilities of reac-tion products are investigated. Effects are characterized bya single thermodynamic term, or correction factor (shownin Table 2). This factor, in turn, can be used to indepen-dently predict stabilities of reaction products on a parti-cular surface based on the solution thermodynamiccharacteristics of the reactants and products formed.Conversely, perturbations from solution stabilitiescaused by surface effects can be utilized to calibrate bio-sensor output. If reaction thermodynamics are well char-acterized in solution, observed differences on the surfacefrom solution behavior can be attributed to ‘surface spe-cific’ effects on the sensing reaction inherent to any parti-cular platform. Assuming effects of the surface can beconsidered independent and separable, the total thermo-dynamic stability on the surface can be partitioned into‘surface dependent’ and ‘surface independent’ parts, thelatter being the solution values of experiments. Thisapproach provides a foundation for inter-comparison ofacquired signals from different platforms that may havedistinctly different surface features. Although it isexpected that effects of interactions between surfaces andreactions occurring just above the surfaces are complex innature, it is assumed herein that the two components areseparable only as a first approximation. Physical proper-ties and fine features specific to individual surface poten-tials is a more challenging problem that will not beaddressed.Diagnostic detection using probes that form hairpins
has been employed to detect single-stranded DNA targetsin solution (17,28). The hybridization process in this con-text is indirectly detected through a physical change in thestructure of the hairpin that allows hybridization of the
Figure 6. Comparison of solution and surface melting curves. The melt-ing curve for the hairpin attached to the surface shown in Figure 5E isshown by a solid line. The dash–dot line is the melting curve for the samehairpin in solution generated from measured thermodynamic transitionparameters evaluated in DSC measurements and assuming a two statetransition. The significant difference in the Tm values is attributed toeffects of the surface on the hairpin melting transition.
PAGE 9 OF 11 Nucleic Acids Research, 2008, Vol. 36, No. 15 e98
by guest on Decem
ber 9, 2013http://nar.oxfordjournals.org/
Dow
nloaded from

target to the probe. Such strategies provide the impetus tofurther develop the electrical technique into a biosensorbased on detection of the bifunctional structural transi-tions in DNA hairpins. Similar strategies have been imple-mented in a number of DNA detection technologies.For example, molecular beacons use ssDNAs that formhairpins that can be detected optically because the DNAhas a fluorophore on one end that is quenched by a fluor-escence quencher on the other end when the ssDNA is inthe hairpin conformation (28). Molecular beacon probesare designed with loops that contain significant por-tions complementary to the targets in solution. When notarget complementary to the hairpin probe is present insolution, the ssDNA probe remains in the duplex hairpinstate that puts the quencher molecule in the immediatevicinity of the fluorophore and thereby quenches the fluor-escence resulting in relatively low intensity signals. Whentargets complementary to the probe are present in solu-tion, hybridization will occur between the probes andcomplementary targets that are thermodynamically morestable than the hairpin species. In this conformation, thequencher and fluorescent molecules are far apart fromeach other so very little quenching of the signal occurs.Probes in this conformation generate much higher inten-sity signals.In order for hairpin probes coupled to GIMEs to serve
as effective electronic biosensors, successful discriminationbetween a full length, perfectly matched duplex and the(smaller) duplex hairpin attached to the surface must bedemonstrated. In solution conditions, targets that are per-fectly complementary to the hairpin are more stable thanthe hairpin itself and compete for reaction sites on thehairpin sequence. Understanding how the surface termaffects the same competition reaction between perfectmatch probe-target pairs and duplex hairpins on the sur-face is an important step towards validation of the GIMEplatform. Sequence dependent thermodynamics dictatesthat the fully complementary sequence will have a higherstability than the hairpin even in the presence of the sur-face. Differential detection of each duplex species usingGIME and impedance spectroscopy are underway todemonstrate that this platform can efficiently detect eachspecies in solution and can provide reliable characteriza-tion via differences between the two signals. That the dif-ferent electrical signals provide somewhat uniquetemperature dependent signatures makes it attractive toexplore the extent to which these distinct changes arerelated to different physical characteristics of the struc-tural changes that accompany the melting transition.Interpretations of the electrical measurements on thislevel may be difficult to actually achieve, but are at leastconceivable from these measurements.It remains to be shown that electrical measurements
can be employed in place of fluorescence detection to dis-cern between a single strand in a duplex hairpin, intra-molecular structure and the same strand in a longerduplex structure with a second complementary singlestrand. If this can be demonstrated, GIMEs may consti-tute an alternative label free sensing platform for DNAhybridization.
SUPPLEMENTARY DATA
Supplementary Data are available at NAR Online.
ACKNOWLEDGEMENTS
We thank the reviewers for instructional comments. Wealso gratefully acknowledge Dr Jim Goodarzi for carefulreading of the manuscript and useful suggestions and SabaAlemayehu for expert technical assistance. Funding to paythe Open Access publication charges for this article wasprovided by Portland Bioscience Inc.
Conflict of interest statement. None declared.
REFERENCES
1. Finot,E., Bourillot,E., Meunier-Prest,R., Lacroute,Y., Legay,G.,Cherkaoui-Malki,M., Latruffe,N., Siri,O., Braunstein,P. andDereux,A. (2003) Performance of interdigitated nanoelectrodes forelectrochemical DNA biosensor. Ultramicroscopy, 97, 441–449.
2. Meunier-Prest,R., Raveau,S., Finot,E., Legay,G., Cherkaoui-Malki,M. and Latruffe,N. (2003) Direct measurement of the meltingtemperature of supported DNA by electrochemical method. NucleicAcids Res., 31, e150.
3. SantaLucia,J. Jr. (1998) A unified view of polymer, dumbbell, andoligonucleotide DNA nearest-neighbor thermodynamics. Proc. NatlAcad. Sci. USA, 95, 1460–1465.
4. SantaLucia,J. Jr and Hicks,D. (2004) The thermodynamics of DNAstructural motifs. Annu. Rev. Biophys. Biomol. Struct., 33, 415–440.
5. Breslauer,K.J. (1994) Extracting thermodynamic data from equili-brium melting curves for oligonucleotide order-disorder transitions.Methods Mol. Biol., 26, 347–372.
6. Breslauer,K.J., Frank,R., Blocker,H. and Marky,L.A. (1986)Predicting DNA duplex stability from the base sequence. Proc. NatlAcad. Sci. USA, 83, 3746–3750.
7. Hall,T.S., Pancoska,P., Riccelli,P.V., Mandell,K. and Benight,A.S.(2001) Sequence context and thermodynamic stability of a singlebasepair mismatch in short deoxyoligonucleotide duplexes. J. Am.Chem. Soc., 123, 11811–11812.
8. Hillen,W., Goodman,T.C., Benight,A.S., Wartell,R.M. andWells,R.D. (1981) High resolution experimental and theoreticalthermal denaturation studies on small overlapping restriction frag-ments containing the Escherichia coli lactose genetic control region.J. Biol. Chem., 256, 2762–2766.
9. Marky,L.A. and Breslauer,K.J. (1982) Calorimetric determinationof base-stacking enthalpies in double-helical DNA molecules.Biopolymers, 21, 2185–2194.
10. Marky,L.A. and Breslauer,K.J. (1987) Calculating thermodynamicdata for transitions of any molecularity from equilibrium meltingcurves. Biopolymers, 26, 1601–1620.
11. Owczarzy,R., Vallone,P.M., Gallo,F.J., Paner,T.M., Lane,M.J. andBenight,A.S. (1997) Predicting sequence-dependent melting stabilityof short duplex DNA oligomers. Biopolymers, 44, 217–239.
12. Wartell,R.M. and Benight,A.S. (1985) Thermal denaturation ofDNA molecules: a comparison of theory with experiment. Phys.Rep., 126, 67–107.
13. Dimitrov,R. and Zuker,M. (2004) Prediction of hybridization andmelting for double-stranded nucleic acids. Biophys. J., 87, 215–226.
14. Herne,T.M. and Tarlov,M.J. (1997) Characterization of DNA ProbesImmobilized on Gold Surfaces. J. Am. Chem. Soc., 119, 8916–8920.
15. Yang,M., McGovern,M.E. and Thompson,M. (1997) Genosensortechnology and the detection of interfacial nucleic acid chemistry.Analytica Chimica Acta, 346, 259–275.
16. de-los-Santos-Alvarez,P.M., Jesus Lobo-Castanon,M., Miranda-Ordieres,A.J. and Tunon-Blanco,P. (2004) Current strategies forelectrochemical detection of DNA with solid electrodes. Anal.Bioanal. Chem., 378, 104–118.
17. Fan,C., Plaxco,K.W. and Heeger,A.J. (2003) Electrochemicalinterrogation of conformational changes as a reagentless method for
e98 Nucleic Acids Research, 2008, Vol. 36, No. 15 PAGE 10 OF 11
by guest on Decem
ber 9, 2013http://nar.oxfordjournals.org/
Dow
nloaded from

the sequence-specific detection of DNA. Proc. Natl Acad. Sci. USA,100, 9135–9137.
18. Pividori,M.I., Merkoci,A. and Alegret,S. (2000) Electrochemicalgenosensor design: immobilisation of oliognucleotides onto transducersurfaces and detection methods. Biosens. Bioelectron., 15, 291–303.
19. Wang,J. (2002) Electrochemical nucleic acid biosensors. Anal. Chim.Acta., 469, 63–71.
20. Sturtevant,J.M. (1987) Biochemical applications of differentialscanning calorimetry. Ann. Rev. Phys. Chem., 38, 463–488.
21. Vallone,P.M., Paner,T.M., Hilario,J., Lane,M.J., Faldasz,B.D. andBenight,A.S. (1999) Melting studies of short DNA hairpins:influence of loop sequence and adjoining base pair identity onhairpin thermodynamic stability. Biopolymers, 50, 425–442.
22. Macdonald,J.R. (1992) Impedance Spectrscopy. Ann. Biomed. Eng.,20, 289–305.
23. Owczarzy,R. (1999) Predictions of short DNA duplex thermo-dynamics and evaluation of next nearest neighbor interactions.Ph.D. Thesis. University of Illinois at Chicago, Chicago.
24. Zuker,M. (2003) Mfold web server for nucleic acid folding andhybridization prediction. Nucleic Acids Res., 31, 3406–3415.
25. Markham,N.R. and Zuker,M. (2005) DINAMelt web server fornucleic acid melting prediction. Nucleic Acids Res., 33, W577–W581.
26. Vallone,P.M. and Butler,J.M. (2004) AutoDimer: a screening toolfor primer-dimer and hairpin structures. BioTechniques, 37,226–231.
27. Halperin,A., Buhot,A. and Zhulina,E.B. (2006) On the hybridiza-tion isotherms of DNA microarrays: the Langmuir model and itsextensions. J. Phys.: CondensMatter, 18, S463–S490.
28. Tyagi,S. and Kramer,F.R. (1996) Molecular beacons: probes thatfluoresce upon hybridization. Nat. Biotechnol., 14, 303–308.
PAGE 11 OF 11 Nucleic Acids Research, 2008, Vol. 36, No. 15 e98
by guest on Decem
ber 9, 2013http://nar.oxfordjournals.org/
Dow
nloaded from