Near real-time electrochemical analysis of carcinogenic cell lines using planar microelectrodes
10
Int. J. Electrochem. Sci., 7 (2012) 5633 - 5642 International Journal of ELECTROCHEMICAL SCIENCE www.electrochemsci.org Near Real-Time Electrochemical Analysis of Carcinogenic Cell Lines Using Planar Microelectrodes Nahrizul Adib Kadri 1,* , Mohd Azhar Abdul Razak 2 , Fatimah Ibrahim 1 1 Department of Biomedical Engineering, Faculty of Engineering, University of Malaya, 50603 Kuala Lumpur, Malaysia 2 Faculty of Electrical Engineering, Universiti Teknologi Malaysia, 81310 UTM Skudai, Johor, Malaysia * E-mail: [email protected] Received: 5 April 2012 / Accepted: 13 May 2012 / Published: 1 June 2012 Physical manipulation of polarizable particles generated by the transient force when placed in non- uniform electrical fields is termed dielectrophoresis. The electrophysiological make-up of the particle and the surrounding medium decides the magnitude of the force; hence specific DEP profile may be acquired for any polarizable particles based on the electrical properties of the membrane and cytoplasm alone. Any changes to these parameters may be detected, in turn, by observing the corresponding DEP spectra. The reason DEP is not applied widely in spite of its non-invasiveness primarily is that the process is time consuming. The proposed DEP-based lab-on-chip application of semi-automated cell electrophysiology characterization allowed concurrent DEP experiments to be conducted serially, which significantly reduced the required experiment time. This capability is achieved via the employment of a planar microelectrode with modified dot microarray geometry. The results showed that the system is capable of producing a complete DEP spectrum profile for K562 leukemic cells between the 1 kHz to 1 MHz frequency range in less than 10 minutes. Keywords: Lab-on-a-chip; Dielectrophoresis; AC electrokinetics; Cancer 1. INTRODUCTION Dielectrophoresis (DEP) is a phenomenon in which a transient force of specific strength is exerted on a dielectric particle when it is subjected to a non-uniform electric field. The magnitude of the generated transient force is dependent on the electrophysiological make-up of the surrounding media and the particle itself, both externally (membrane surface) and internally (internal compartments, if any). DEP is also typically grouped as part of AC electrokinetics, and has been used for manipulating various types of cells and particles since its description by Pohl in 1951 [1].
Transcript of Near real-time electrochemical analysis of carcinogenic cell lines using planar microelectrodes
Int. J. Electrochem. Sci., 7 (2012) 5633 - 5642
International Journal of
ELECTROCHEMICAL SCIENCE
www.electrochemsci.org
Near Real-Time Electrochemical Analysis of Carcinogenic Cell
Lines Using Planar Microelectrodes
Nahrizul Adib Kadri1,*
, Mohd Azhar Abdul Razak2, Fatimah Ibrahim
1
1 Department of Biomedical Engineering, Faculty of Engineering, University of Malaya, 50603 Kuala
Lumpur, Malaysia 2
Faculty of Electrical Engineering, Universiti Teknologi Malaysia, 81310 UTM Skudai, Johor,
Malaysia *E-mail: [email protected]
Received: 5 April 2012 / Accepted: 13 May 2012 / Published: 1 June 2012
Physical manipulation of polarizable particles generated by the transient force when placed in non-
uniform electrical fields is termed dielectrophoresis. The electrophysiological make-up of the particle
and the surrounding medium decides the magnitude of the force; hence specific DEP profile may be
acquired for any polarizable particles based on the electrical properties of the membrane and
cytoplasm alone. Any changes to these parameters may be detected, in turn, by observing the
corresponding DEP spectra. The reason DEP is not applied widely in spite of its non-invasiveness
primarily is that the process is time consuming. The proposed DEP-based lab-on-chip application of
semi-automated cell electrophysiology characterization allowed concurrent DEP experiments to be
conducted serially, which significantly reduced the required experiment time. This capability is
achieved via the employment of a planar microelectrode with modified dot microarray geometry. The
results showed that the system is capable of producing a complete DEP spectrum profile for K562
leukemic cells between the 1 kHz to 1 MHz frequency range in less than 10 minutes.
Keywords: Lab-on-a-chip; Dielectrophoresis; AC electrokinetics; Cancer
1. INTRODUCTION
Dielectrophoresis (DEP) is a phenomenon in which a transient force of specific strength is
exerted on a dielectric particle when it is subjected to a non-uniform electric field. The magnitude of
the generated transient force is dependent on the electrophysiological make-up of the surrounding
media and the particle itself, both externally (membrane surface) and internally (internal
compartments, if any). DEP is also typically grouped as part of AC electrokinetics, and has been used
for manipulating various types of cells and particles since its description by Pohl in 1951 [1].

Int. J. Electrochem. Sci., Vol. 7, 2012
5634
DEP is capable of producing specific cellular profiles based on the electrophysiological
properties, hence DEP has been employed, among others, to separate live and dead yeast cells [2,3],
various bacterial [4-9] and viral [10-14] strains, DNA molecules [15], spores [16,17], and algae [18].
Other types of molecules such as nano-sized latex spheres [19,20] and biopolymers [21] have also
been the subject of DEP characterization studies. In addition, numerous studies focused on the use of
DEP in characterizing the myriad of mammalian cells, including neurons [22-24], leukocytes [25-27],
erythrocytes [28,29], platelets [30,31], and even human spermatozoa [32]. Although this in itself
provides a much needed alternative method for cell detecting and sorting assays, a worthier cause of
DEP usage would be in detecting and collecting abnormal particles from a given cell population.
Similar studies on separating these cells have been conducted as early as the recognition of DEP as
marker-less cell sorting technique in the 1980s. A study by Mischel et al. for example, had
successfully separated malignant melanocytes from normal cell populations and showed that the
electrical behavior of malignant melanocytes is markedly dependent upon the type of cell line, age, and
drug treatment (e.g., chlorpromazine) and may be separated from normal cells using DEP [33].
In spite of the advantages, DEP is yet to be adopted by the biotechnology industry, because of
two reasons, namely the time-consuming processes involved, and the lack of applications to conduct
high volume cell assays [34]. Many studies have focused on reducing the time taken to conduct DEP
experiments by automating some experimental processes (e.g. [35,36]), but were limited to recording
DEP features on single particles. A semi-automated system well-based DEP system [34], was designed
to address the high volume limitation and was successfully used in many DEP-based experimental
studies (e.g. [17,34,37,38]). However, it still takes between 120-240 min to construct a statistically
acceptable DEP spectrum for a given cell sample.
This study presents the method and development of a semi-automated, DEP application that is
capable of conducting DEP studies and the subsequent analyses for carcinogenic cell samples of 1 x
107 cells per ml at a much lesser time. The data point resolution of the DEP spectra will be similar to
those acquired when using the aforementioned well-based system. The developed application is also
capable of completing DEP studies close to real-time, due to the speed in conducting DEP studies and
analyzing the acquired data.
2. THEORY
When exerted on a homogeneous spherical particle, the DEP force (FDEP) is typically expressed
as:
23 Re2 ΕKrF mDEP (1)
Where r is the radius of the particle, m the permittivity of the surrounding medium, K the
complex Clausius-Mossotti factor, and E the electric field strength expressed in root mean squared
(RMS) value. The Clausius-Mossotti factor is a measure of the effective polarizability strength:

Int. J. Electrochem. Sci., Vol. 7, 2012
5635
**
**
2 mp
mpK
(2)
where *
p and *
m are the complex permittivities of the particle and the medium, respectively.
In addition,
j* (3)
where is the conductivity, the permittivity, and the angular frequency of the electric
field.
The analytical expressions mentioned above explain the DEP behavior of spheres in a given
solution; however, it is considered to be too complex to be expanded in order for the dielectric
properties to be directly calculated and correlated in a useful manner [39]. The common method of
correlating the relevant cellular electrical parameters with the DEP behavior is by estimating the
electrophysiological properties performed by best-fit numerical analysis [40], and has been
successfully used in many DEP characterization studies (e.g. [37,38,41,42]). The estimation method
has also been shown to be useful in characterizing multiple cell populations within a heterogeneous
cell sample [43]. Figure 1 shows a typical DEP spectrum for a sample cell population using the said
numerical analysis, with the characteristic ‘crossover’ occurring at about 40 kHz.
Figure 1. A typical shape of the DEP spectrum based on the single shell model
3. METHODS
3.1. Device assembly
The BioMEMS application assembly consisted of a DEP chamber, where the DEP effects may
be observed and recorded, sandwiched between two conductive layers (Figure 2). The bottom

Int. J. Electrochem. Sci., Vol. 7, 2012
5636
conductive layer was fabricated from Au-plated microscope glass slides, while the top conductive
layer was made from indium tin oxide (ITO) coated glass slides of slightly smaller dimensions, and
acted as the counter electrode. The DEP chamber was fabricated from UV-sensitive polyresin, and the
thickness determined the height of the chamber, which is about 200 µm.
Figure 2. The BioMEMS application assembly, with the schematic design of the electrode overlaid
Using typical photolithography methods, a specific microarray design was patterned onto the
Au-coated glass slides. The planar electrode geometry used was similar to the dot array design
previously used by Fatoyinbo et al. [44], in order to produce axisymmetrical electrical field gradients
over each of the dots. The DEP force generated should consequently be axisymmetrical as well, greater
at the electrode edge and decreasing in magnitude towards the center of the dot. This should provide a
correlation between particle motion and relative particle polarisability; which is determined based
upon images captured from a digital camera attached to the microscope.
3.2. Preparation of cell samples
Human leukemic K562 cell lines used in the study were sourced from LGC Standards
(Teddington, UK), and all reagents and solutions were from Sigma Aldrich Co., (St. Louis, USA),
unless stated otherwise.
Int. J. Electrochem. Sci., Vol. 7, 2012
5637
The cell culture medium were prepared using RPMI solution (GIBCO® RPMI Media 1640,
Invitrogen Ltd., Paisley, UK), supplemented with 10% heat-inactivated fetal bovine serum (FBS)
(PAA, Pasching, Austria), 1% penicillin-streptomycin, and 1% L-glutamine. The cells were cultured at
37oC and 5% CO2, and may be used for experiments once confluence was reached. For DEP
experiments, cells were transferred in conductive medium made of 8.5% sucrose and 0.3% dextrose,
with the desired conductivity value adjusted using 150 mM KCl solution, verified by a conductivity
meter. If the conductivity was set at 10 mS/m, the crossover frequency for K562 cells should lie
between 10 to 100 kHz (based on previous findings by e.g. [38,45]). Cell samples were ‘washed’ twice
by centrifugation at 180 g for 5 minutes, and subsequently resuspended in the DEP conductive
medium. Cell sample concentration was adjusted to about 10 million cells per ml prior to the
commencement of DEP experiments.
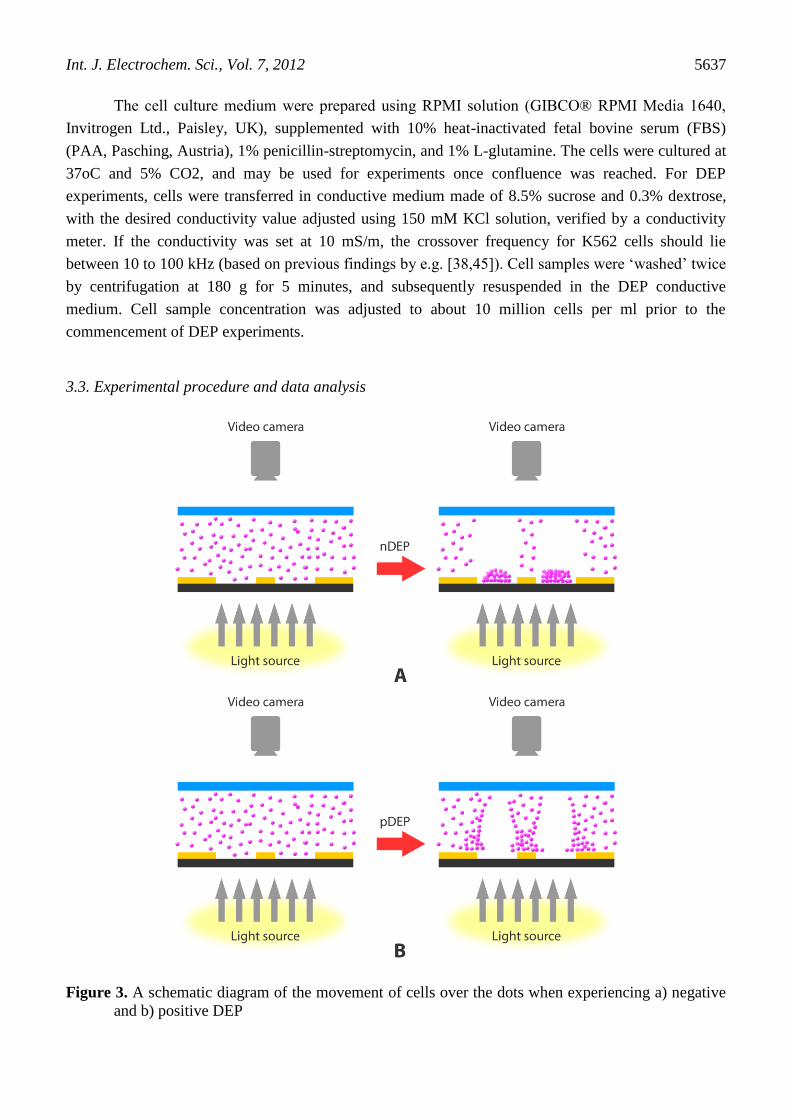
3.3. Experimental procedure and data analysis
Figure 3. A schematic diagram of the movement of cells over the dots when experiencing a) negative
and b) positive DEP

Int. J. Electrochem. Sci., Vol. 7, 2012
5638
Figure 4. The captured images and the corresponding histogram plots for dots experiencing negative
(top) and positive (bottom) DEP
About 15 µl of cell suspension was slowly delivered using a syringe through the inlet of the
DEP chamber. If the chamber has been satisfactorily assembled, it should be filled with the solution
uniformly via capillary action. The electrode and the ITO were connected to the positive and negative
connectors of the signal generator, respectively. The AC signal was applied for 15 seconds at each
chosen frequency value to produce the electric fields with the corresponding gradient strength.
To create the corresponding DEP spectrum, a correlation between the particle movement and
its relative polarizability is required. This was done by analyzing the captured images of particle
movement over each of the dots for the duration of signal application. Figure 3 shows the schematic
diagram of cell movement as a result of applying electrical signal, which created negative DEP effects
for the particles in use. On the other hand, positive DEP repels the particles towards the edges of the
dot. The algorithm used was similar to the Cumulative Modal Intensity Shift (CMIS) used previously
[44], whereby the changes in the peak values were determined, both before and after the application of
the signal. A change in the negative direction indicated negative DEP effects, and vice versa.
Electrophysiological properties, namely conductance and capacitance, of the membrane and inner
compartments (if any) may be determined using a best-fit model constructed from Equation (1). Figure
4 shows the change in the histogram values for cells experiencing negative DEP, where a collection of
cells was produced at the center of each of the dots.

Int. J. Electrochem. Sci., Vol. 7, 2012
5639
4. RESULTS
The extent of normalized shifts in the pixel values, when plotted against the frequency at which
the images were taken from, was used to construct the corresponding DEP spectrum for the K562 cell
population used in the study (Figure 5). The plot showed the typical S-shape associated with DEP
electrophysiological profile, which is similar to the previously published data for K562 cells in similar
experimental conditions [38,45]. Notably, the crossover frequency occurs at the predicted 10 to 100
kHz range (about 40 kHz in this particular case). From the best-fit model constructed from Equation
(1), it is inferred that the electrophysiological properties of the cellular membrane were close to the
previously determined values for K562 cells of about 200 S and 7 mF/m2 for conductance and
capacitance, respectively.
Figure 5. Typical DEP spectra for K562 cell population (cell concentration 1x10⁷ cells per ml,
electrical field 10 Vp-p, KCl conductive medium 10 mS/m). Dotted line indicates best fit model
using the real part of the Clausius-Mossotti factor
5. DISCUSSION
As shown in Figure 5 each data points were constructed from eight dots having the same DEP
effects at the same frequency. Since the electric field was generated for between 15-20 seconds, the
whole DEP experiment for this particular carcinogenic cell line was completed in less than 10 minutes,
including the time taken for manually transferring the cells through the inlet of the chamber. This is
significant improvement over previously used DEP-based techniques (e.g. [17,34,37,38,46]), which
may take anywhere from 1 to 3 hours to complete the necessary experimental procedures in
constructing DEP plots of similar data points resolution. This enhancement will further improve the
chances of DEP becoming a complementary diagnostic tool in cancer studies, since it is of importance
Int. J. Electrochem. Sci., Vol. 7, 2012
5640
that a non-invasive technique be developed and capable of producing the desired outcome in the
shortest time possible.
The BioMEMs application discussed in this study is capable of recording DEP events at a
resolution of 8-by-n data points between the frequency range of 10 kHz and 1 MHz within 10 min. The
hardware components should also be compatible with any lab-on-chip modules utilizing AC
electrokinetics and microfluidics. The significant reduction in time to complete DEP experiments
should encourage others to conduct real-time DEP experiments and analysis for any carcinogenic cell
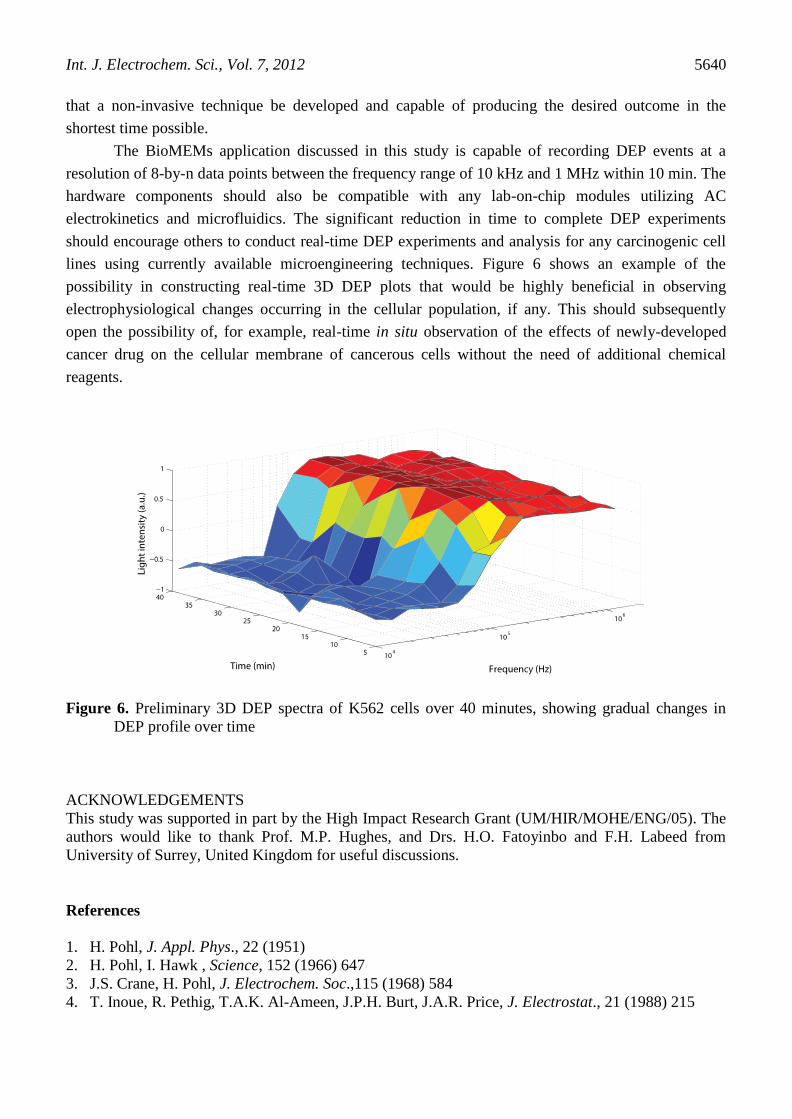
lines using currently available microengineering techniques. Figure 6 shows an example of the
possibility in constructing real-time 3D DEP plots that would be highly beneficial in observing
electrophysiological changes occurring in the cellular population, if any. This should subsequently
open the possibility of, for example, real-time in situ observation of the effects of newly-developed
cancer drug on the cellular membrane of cancerous cells without the need of additional chemical
reagents.
Figure 6. Preliminary 3D DEP spectra of K562 cells over 40 minutes, showing gradual changes in
DEP profile over time
ACKNOWLEDGEMENTS
This study was supported in part by the High Impact Research Grant (UM/HIR/MOHE/ENG/05). The
authors would like to thank Prof. M.P. Hughes, and Drs. H.O. Fatoyinbo and F.H. Labeed from
University of Surrey, United Kingdom for useful discussions.
References
1. H. Pohl, J. Appl. Phys., 22 (1951)
2. H. Pohl, I. Hawk , Science, 152 (1966) 647
3. J.S. Crane, H. Pohl, J. Electrochem. Soc.,115 (1968) 584
4. T. Inoue, R. Pethig, T.A.K. Al-Ameen, J.P.H. Burt, J.A.R. Price, J. Electrostat., 21 (1988) 215

Int. J. Electrochem. Sci., Vol. 7, 2012
5641
5. M. Washizu, Y. Kurahashi, H. Iochi, O. Kurosawa, S. Aizawa, S. Kudo, Y. Magariyama, H.
Hotani, Ieee T. Ind. Appl., 29 (1993) 286
6. G.H. Markx, Y. Huang, X.F. Zhou, R. Pethig , Microbiol-UK, 140 (1994) 585
7. G.H. Markx, P.A. Dyda, R. Pethig,J. Biotechnol., 51 (1996) 175
8. P. Gascoyne, C. Mahidol, M. Ruchirawat, J. Satayavivad, P. Watcharasit, F.F. Becker, Lab Chip,
(2002) 70
9. J. Suehiro, D. Noutomi, M. Shutou, M. Hara, J. Electrostatic, 58 (2003) 229
10. N.G. Green, H. Morgan, J. Phys. D Appl. Phys., 30 (1997) L41
11. M.P. Hughes, H. Morgan, J. Phys. D Appl. Phys.,31 (1998) 2205
12. M.P. Hughes,H. Morgan, F.J. Rixon, J.P.H. Burt, R. Pethig, Bba-Gen Subjects,1425 (1998) 119
13. H. Morgan, M.P. Hughes, N.G. Green , Biophys. J.,77 (1999) 516
14. S. Archer, H. Morgan, F.J. Rixon, Biophys. J., 76 (1999) 2833
15. M. Washizu, O. Kurosawa, I. Arai, S. Suzuki, N. Shimamoto, Ieee T. Ind. Appl., 31 (1995) 447
16. G.P. Archer, W.B. Betts, T. Haigh, Microbios, 73 (1993) 165
17. F.H. Labeed, H.O. Fatoyinbo, M.P. Hughes, S.P. Martin, P. Pashby, J. Environ. Monitor., 9 (2007)
87
18. Y. Hubner, K.F. Hoettges, M.P. Hughes, J. Environ. Monitor., 5 (2003) 861
19. H. Morgan, N.G. Green , J. Phys. Chem. B, 103 (1999) 41
20. Z.Y. Qiu, N. Markarian, B. Khusid, A. Acrivos, J. Appl. Phys., 92 (2002) 2829
21. M. Washizu, S. Suzuki, O. Kurosawa, T. Nishizaka, T. Shinohara, Ieee T. Ind. Appl., 30 (1994) 835
22. T. Heida, W. Rutten, E. Marani, Adv. Anat. Embryol. Cell Biol.,173 (2003) 11
23. T. Heida,W.L.C. Rutten,E. Marani, Ieee T. Bio-Med. Eng., 48 (2001) 921
24. S. Prasad, X. Zhang, M. Yang, Y.C. Ni, V. Parpura , O.S. Cengzis, O. Mihrimah, J. Neurosci.
Meth., 135 (2004) 79
25. J. Yang, Y. Huang, X.J. Wang, X.B. Wang, F.F. Becker, P.R. Gascoyne, Biophys. J., 76 (1999)
3307
26. J. Yang, Y. Huang, X.B. Wang, F.F. Becker, P.R. Gascoyne, Biophys. J., 78 (2000) 2680
27. P.R.C. Gascoyne, X.B. Wang, J. Yang, Y. Huang, J. Vykoukal, F.F. Becker, Anal. Chem., 72
(2000) 832
28. J. Auerswald, H.F. Knapp, Microelectron. Eng., 67-8 (2003) 879
29. Y. Hubner, K.F. Hoettges, G.E.N. Kass, S.L. Ogin, M.P. Hughes, Iee P-Nanobiotechnol., 152
(2005) 150
30. J. Rhoads, H. Pohl, R. Buckner , J. Biol. Phys., 4 (1976) 93
31. H.T. Soh, M.S. Pommer, Y.T. Zhang, N. Keerthi, D. Chen, C.D. Meinhart, J.A. Thomson,
Electrophoresis, 29 (2008) 1213
32. G. Fuhr,T. Muller, V. Baukloh, K. Lucas, Hum. Reprod., 13 (1998) 136
33. M. Mischel, F. Rouge, I. Lamprecht, C. Aubert, G. Prota, Arch. Dermatol. Res., 275 (1983) 141
34. M.P. Hughes, K.F. Hoettges, Y. Hubner, L.M. Broche, S.L. Ogin, G.E.N. Kass, Anal. Chem., 80
(2008) 2063
35. G. De Gasperis, X.B. Wang, J. Yang, F.F. Becker, P.R.C. Gascoyne, Meas. Sci. Technol., 9 (1998)
518
36. R. Holzel, Bba-Gen Subjects, 1425 (1998) 311
37. F.H. Labeed, H.M. Coley, M.P. Hughes , Bba-Gen Subjects, 1760 (2006) 922
38. F.H. Labeed, H.M. Coley, H. Thomas, M.P. Hughes, Biophys. J., 85 (2003) 2028
39. T.B. Jones, Electromechanics of Particles, Cambridge University Press, Cambridge (1995)
40. Y. Huang, X.B. Wang, F.F. Becker, P.R.C. Gascoyne, Bba-Biomembranes, 1282 (1996) 76
41. L. Duncan, H. Shelmerdine, M.P. Hughes, H.M. Coley, Y. Hubner, F.H. Labeed, Phys. Med. Biol.,
53 (2008) N1
42. F.H. Labeed, S. Chin, M.P. Hughes, H.M. Coley, Int. J. Nanomedicine, 1 (2006) 333
43. L.M. Broche, F.H. Labeed, M.P. Hughes, Phys. Med. Bio., 50 (2005) 2267

Int. J. Electrochem. Sci., Vol. 7, 2012
5642
44. H.O. Fatoyinbo, K.F. Hoeftges, M.P. Hughes, Electrophoresis, 29 (2008) 3
45. L. Altomare, M. Borgatti, G. Medoro, N. Manaresi, M. Tartagni, R. Guerrieri, R.Gambari,
Biotechnol. and Bioeng., 82 (2003) 474
46. F.H. Labeed, L.M. Broche, N. Bhadal, M.P. Lewis, S. Porter, MP. Hughes, Oral Oncol., 43 (2007)
199
© 2012 by ESG (www.electrochemsci.org)