development of frp based composite fibre for fibre reinforced ...

Journal of Neuroscience Methods, 3 (1980) 37--48 © Elsevier/North-Holland Biomedical Press
37
T H E E L E C T R I C A L C H A R A C T E R I S T I C S O F C A R B O N F I B R E M I C R O E L E C T R O D E S
K. FOX, M. ARMSTRONG-JAMES and J. MILLAR
Department of Physiology, The London Hospital Medical College, Turner Street, London E1 2AD (U.K.)
(Received March 17th, 1980} (Accepted May 19th, 1980)
Key words: recording microelectrodes -- carbon fibre microelectrodes -- iontophoresis
The impedance of carbon fibre-containing microelectrodes was measured at a range of frequencies. From this and other data an equivalent circuit model for the microelectrodes was constructed. Various parameters of the model that contribute to the overall noise performance of the microelectrodes when recording extracellular nerve action potentials were discussed.
INTRODUCTION
A r ecen t p a p e r ( A r m s t r o n g - J a m e s and Millar, 1979) descr ibed the con- s t ruc t ion o f m ic roe l ec t rodes con ta in ing a single c a r b o n f ibre (d i ame te r 7--8 p m ) in the r ecord ing barrel . These m i c roe l ec t rodes a p p e a r to have similar r ecord ing quali t ies in t he cent ra l ne rvous s y s t e m to tungs ten mic roe l ec t rodes (Ges te land e t al., 1959 ; F r a n k and Becker , 1964 ; Merrill and Ainswor th , 1972) b u t are easier to c o n s t r u c t , and can be used in mul t iba r re l mic roe lec - t rodes in i o n t o p h o r e t i c s tudies (Curt is , 1964) . In the p re sen t paper , we descr ibe s o m e o f the electr ical charac ter i s t ics o f these mic roe l ec t rodes .
METHODS
Resis tance o f carbon fibres Single c a r b o n f ibres were r e m o v e d f r o m large bund les using f ine jewel ler ' s
fo rceps and laid across a piece o f clean w a x - c o a t e d l a b o r a t o r y p a p e r wi th the i r ends d ipp ing in to t w o small m e r c u r y puddles . (The f ibres m a y be ob- t a ined f r o m Cour tau lds , C a r b o n Fibres Division, P.O. Box 16, C o v e n t r y , CV6 5AE, U.K.) . A DC signal o f a few mil l ivol ts was appl ied across silver wires d ipp ing in to the m e r c u r y and the resul t ing cu r r en t read o f f wi th an accura te a m m e t e r (So la r t ron 7040) . T h e d is tance b e t w e e n the m e r c u r y pudd les was m e a s u r e d and hence res is tance per un i t length o f t he f ibres ob- t a ined .

38
impedance o f carbon fibre microelectrodes Single-barrel carbon fibre microelectrodes were prepared as described ear-
lier (Armstrong-James and Millar, 1979). After the carbon tips had been cut off with forceps, they were further etched to the desired final length in a bead of dilute (~0.1 M) chromic acid with a current of about 500 pA AC (50 Hz). The impedance was measured by using a potential divider system as shown in Fig. 1. A 100 mV sine wave was applied to a precision (-+1%) 1 M resistor in series with the electrode, and the voltage drop monitored with an FET voltage follower (input resistance >1012 ~ ) . Alternatively, the 100 mV was applied to the indifferent electrode (silver--silver chloride) and the preci- sion resistor grounded. Peak-to-peak voltages were measured on an oscillo- scope. In later experiments the voltage across the microelectrode was held constant at 5 mV and the source voltage altered. The results obtained from both techniques gave similar results. The impedance measured in this way is, of course, the impedance for the complete system of microelectrode--saline bath--indifferent electrode. However, the impedance of the saline and indif- ferent electrode is low compared to that of the microelectrode, and can be ignored for most purposes.
Noise levels A 'Neurolog' NL100-NL103 AC coupled differential voltage follower
probe was used in these experiments. The peak-to-peak noise voltage was estimated visually after suitable gain and filtering from an oscilloscope dis- play at low sweep speeds. In differential mode, the peak total system noise with both channels A and B connected to the probe ground was found to be ~ 1 0 gV at a bandwidth of 10 Hz to 10 kHz. Microelectrode noise was esti- mated by connecting channel A to a carbon fibre microelectrode in a saline
Mercury or S a l i n e ~ 1M~ |
Silver Chlor ided ~__ = silver wire
Glass p i p e t t e - - Carbon fiber . - - o CRO
Insulation --- .-
Sintered Ag.AgCI d i s k - - - / j /
// 0 .9%Sal ine
Fig. 1. Appara tus used to measure mJcroeleetrode impedance. A sine wave is app] ied via a reversing switch to a 1 M ~ resistor in series wi th the microelectrode and a saline bath. The voltage drop across the microe lec t rode is mon i to red with an F E T (Field Ef fec t Tran- sistor) headstage.
39
bath (as in Fig. 1), with a silver--silver chloride indifferent electrode con- nected to the probe ground. Channel B was left grounded and A-B recording mode used.
RESULTS
Resistance of carbon fibres
The DC current--voltage curves for carbon fibres were straight lines with a slope resistance of 250 Ft/mm +10% up to +1.0 V. The resistivity of graphite is quoted (Weast, 1977) as 1375 p~2/cm. Thus, for a cylindrical fibre with a diameter between 7 and 8 pm, the resistance should be between 357 ~2/mm and 273 ~2/mm. The experimental value is close to the predicted value, indicating that carbon fibres are a low resistance form of graphite. The resis- tance of the fibres was, however, very small compared to the total imped- ance of the complete microelectrodes (see below).
Impedance of single-barrel carbon fibre microelectrodes
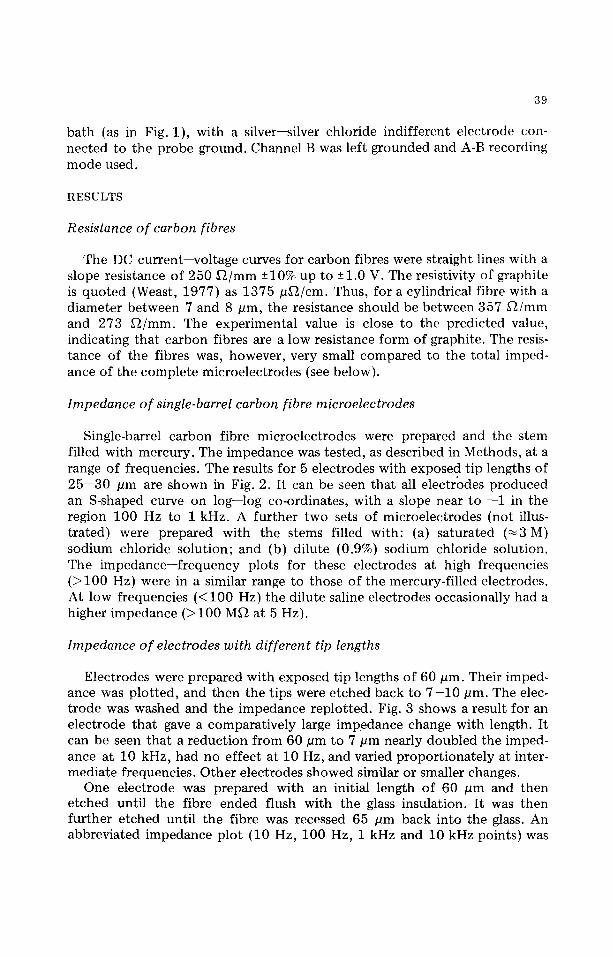
Single-barrel carbon fibre microelectrodes were prepared and the stem filled with mercury. The impedance was tested, as described in Methods, at a range of frequencies. The results for 5 electrodes with exposed tip lengths of 25--30 pm are shown in Fig. 2. It can be seen that all electrodes produced an S-shaped curve on log--log co-ordinates, with a slope near to --1 in the region 100 Hz to 1 kHz. A further two sets of microelectrodes (not illus- trated) were prepared with the stems filled with: (a) saturated (~3 M) sodium chloride solution; and (b) dilute (0.9%) sodium chloride solution. The impedance--frequency plots for these electrodes at high frequencies (>100 Hz) were in a similar range to those of the mercury-filled electrodes. At low frequencies (<100 Hz) the dilute saline electrodes occasionally had a higher impedance (>100 M~2 at 5 Hz).
Impedance of electrodes with different tip lengths
Electrodes were prepared with exposed tip lengths of 60 pm. Their imped- ance was plotted, and then the tips were etched back to 7--10 pm. The elec- trode was washed and the impedance replotted. Fig. 3 shows a result for an electrode that gave a comparatively large impedance change with length. It can be seen that a reduction from 60 pm to 7 pm nearly doubled the imped- ance at 10 kHz, had no effect at 10 Hz, and varied proportionately at inter- mediate frequencies. Other electrodes showed similar or smaller changes.
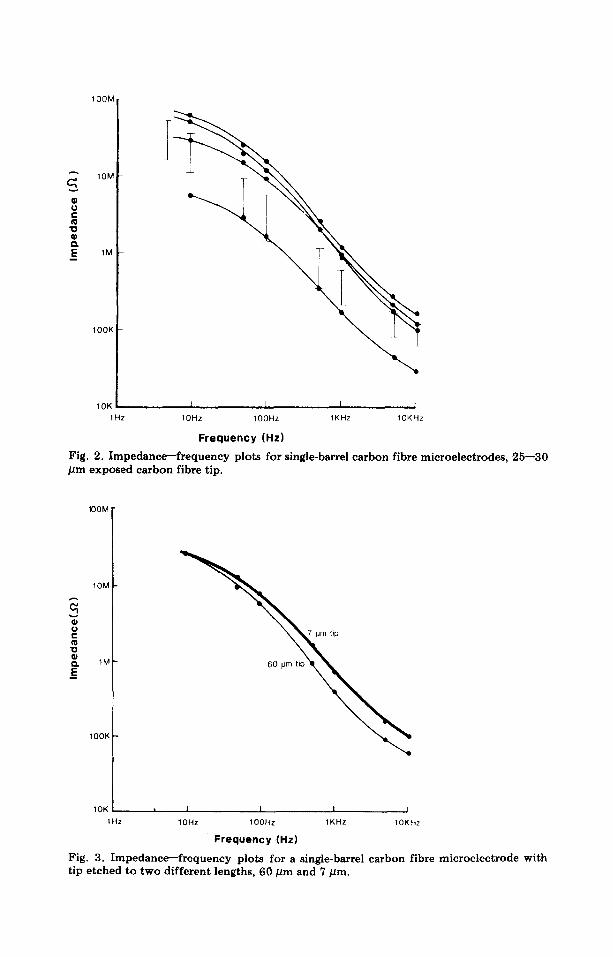
One electrode was prepared with an initial length of 60 pm and then etched until the fibre ended flush with the glass insulation. It was then further etched until the fibre was recessed 65 pm back into the glass. An abbreviated impedance plot (10 Hz, 100 Hz, 1 kHz and 10 kHz points) was
lOOM
IOM
U C t~ "0
Q. E 1M
lOOK
1OK t J J l
1Hz 10Hz 100Hz 1KHz IOKHz
Frequency (Hz)
Fig. 2. Impedance--frequency plots for single-barrel carbon fibre microelectrodes, 25--30 /zm exposed carbon fibre tip.
4) U
"0
O. _E
"lOOM
IOM
1M
lOOK
~ tip
60 pm tip
1OK I I I I I
1Hz 10Hz IOOHz 1K Hz 1 OK Fiz
Frequency (Hz)
Fig. 3. Impedance--frequency plots for a single-barrel carbon fibre microelectrode with tip etched to two different lengths, 60/~m and 7/lm.

41
C
r ,
E D
1 0 0 M
10M
1M
. . . . . . . . 6 4 pm tip e x p o s e d
. . . . 0 pm t ip e x p o s e d
- - 6 4 }Jm tip r e c e s s e d i ns i de g l a s s
",. x
Q \
l O O K
1OK
1Hz
" " ' . . . . . .
I I I
1 0 H z I O O H z 1KHz 1OKHz
Frequency (Hz)
Fig. 4. Impedance--frequency plots for a single-barrel carbon fibre microelectrode etched to different tip lengths.
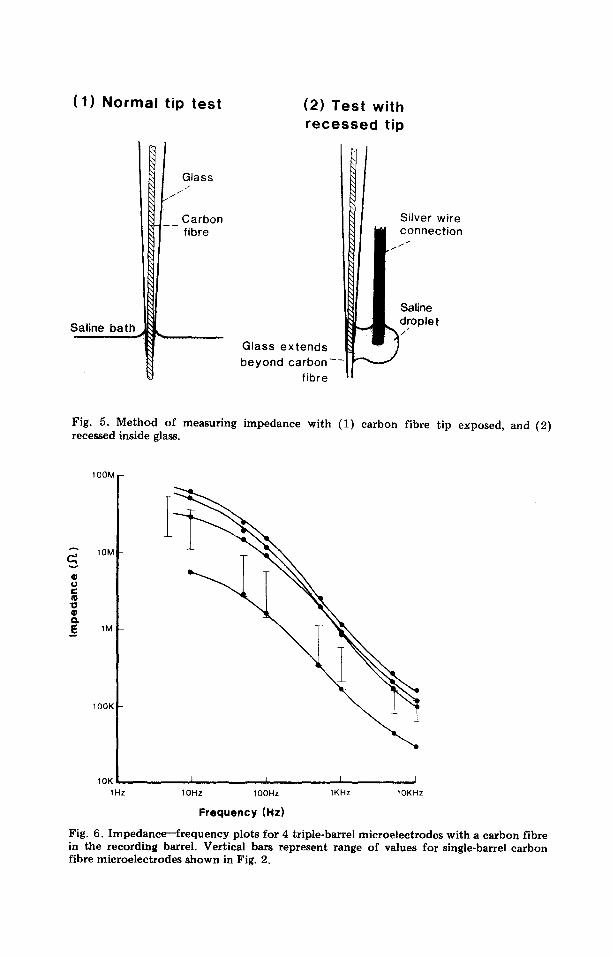
prepared for each length (Fig. 4). When the fibre was recessed inside the glass, the impedance was tested using a drop of saline in contact with the side of the electrode, not the tip, as shown in Fig. 5. This electrode had an abnormally low impedance, but otherwise the shape of the impedance curve at 60 pm tip was normal. The electrode was still able to transmit a signal with the carbon flush with the glass and even across the glass wall 60 pm back from the tip.
Impedance of three-barrelled electrodes
Three-barrelled microelectrodes with a carbon fibre in one barrel were prepared. All barrels were stem-filled with 0.9% saline and the impedance tested as for single-barrel microelectrodes. The results of measurements on 4 triple microelectrodes are shown in Fig. 6. These graphs indicate the approximate range of impedances found. For comparison, the range of impedance values of single-barrel microelectrodes from Fig. 2 is shown as a vertical bar at each test frequency.
(1) Normal tip test
tl 9'ass 1 - /
| ~.J_ C a r b o n
Sal ine b a t h
(2) Test with recessed tip
Si lver w i re c o n n e c t i o n
t /
Saline d r o p l e t
G lass e x t e n d s b e y o n d c a r b o n -
f i b re
Fig. 5. Method of measuring impedance with (1) carbon fibre tip exposed, and (2) recessed inside glass.
lOOM
IOM
0 U c
Q. _E ~M
lOOK
10K I . . . . . . . I I .... J I H z 10Hz IOOHz I K H z IOKHz
Frequency (Hz)
Fig. 6. Impedance--frequency plots for 4 triple-barrel microelectrodes with a carbon fibre in the recording barrel. Vertical bars represent range of values for single-barrel carbon fibre microelectrodes shown in Fig. 2,
43
The effects of different electrolytes in the stem of the microelectrode
In order to connect the carbon fibre protruding into the stem of the microelectrodes to the preamplifier, a conduct ing fluid must be used. In early work on single microelectrodes (cf. Fig. 2), mercury was used, with a bare silver wire dipping into it. In later work, concentra ted salt ( - 2 M NaC1) solution with a chlorided silver wire for contact was used, and in work on multibarrel microelectrodes, some electrodes were filled with concentra ted saline and some with 0.9% saline. A few electrodes filled with dilute saline were more noisy than those filled with concentra ted saline. We have, how- ever, been unable to show any systematic noise differences between elec- trodes filled with dilute and concentra ted saline, and none at all between electrodes filled with mercury and concentra ted saline.
DISCUSSION
The impedance--f requency plots for carbon fibre microelectrodes of Fig. 2 have a slope of approximately --1 in the region 100 Hz to 1 kHz. If the electrodes were acting as pure capacitors, a straight line with a slope of --1 would be expected, since for a capacitor, the reactive impedance has a peak value
1 (Z) = 27rfC " log(z) = --1 log(27rfC) .
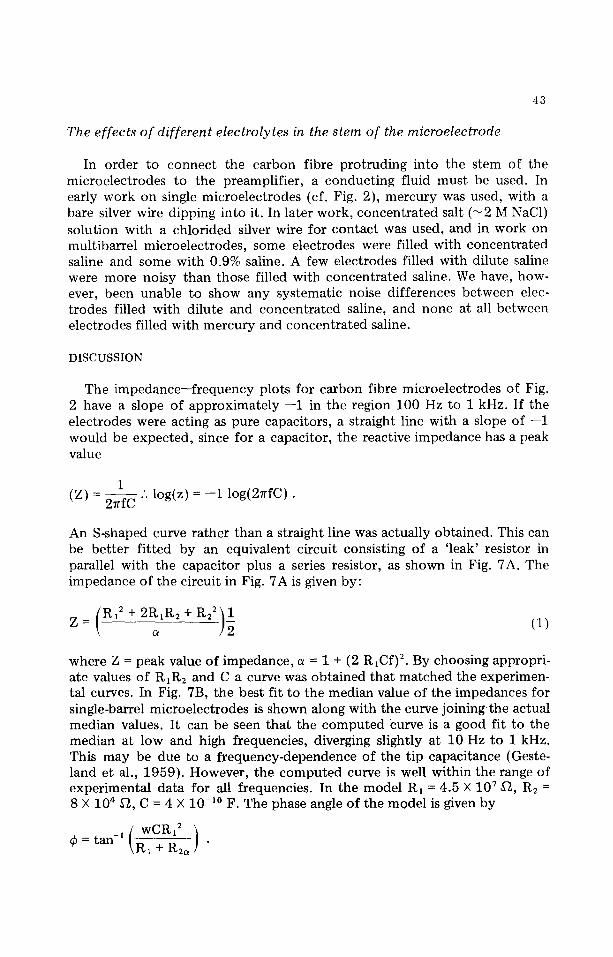
An S-shaped curve rather than a straight line was actually obtained. This can be bet ter f i t ted by an equivalent circuit consisting of a 'leak' resistor in parallel with the capacitor plus a series resistor, as shown in Fig. 7A. The impedance of the circuit in Fig. 7A is given by:
z=(R12+ 2R~R2 + R:2) 1 (1)
where Z = peak value of impedance, a = 1 + (2 RICf) 2. By choosing appropri- ate values of RIR2 and C a curve was obtained that matched the experimen- tal curves. In Fig. 7B, the best fit to the median value of the impedances for single-barrel microelectrodes is shown along with the curve joining the actual median values. It can be seen that the computed Curve is a good fit to the median at low and high frequencies, diverging slightly at 10 Hz to 1 kHz. This may be due to a f requency-dependence of the tip capacitance (Geste- land et al., 1959). However, the computed curve is well within the range of experimental data for all frequencies. In the model R, = 4.5 X 10⁷ fit, R: -- 8 X 10⁴ gt, C = 4 X 10 - '° F. The phase angle of the model is given by
= tan-l \R1 + R2~ / "
44
q~ O e- "O @ e~
A
lOOM
IOM
1M
~ Range of actual values
w ComDuted values • Actual median
lOOK
;OK L, I I I I
1Hz 10Hz 100Hz 1K Hz 10K Hz
Frequency ( H z )
B Fig . 7. A : equivalent circuit for carbon fibre microelectrode. B: impedance--frequency plot o f model (solid line) and median values o f actual impedance shown by microelec- trodes from Fig . 2.
This suggests that the phase shift of high frequencies (1 kHz -- 10 kHz) is different to that of lower frequencies. Thus, if the microelectrodes were used to record nerve spikes and slow waves, the phase relationship of the two would be distorted. The carbon fibre microelectrodes are probably therefore best used only for spike recording.
If the network in Fig. 7 is a realistic equivalent circuit for the microelec- trode, we may ask what are the physical structures responsible for the vari- ous circuit components. The capacitance term is almost certainly due to the formation of an electrolytic double layer at the carbon fibre--saline inter-
45
face. With two capacitances in series, the smaller one dominates the imped- ance, so we can ignore the relatively large capacitance at the interface between the fibre and the fluid in the stem of the microelectrode and con- centrate on the capacitance at the tip. For a large number of different water- based electrolytes and different metals, the capacitance at the interface between electrolyte and conductor is between 0.15 and 0.2 Fm -2 (Bockris and Drazic, 1972). This is because the capacitance is determined mainly by a layer of water molecules at the interface, all orientated such that their dipole moments are aligned with the electric field generated by the interface. For a microelectrode with an exposed tip of 25 pm, the surface area of the tip (assuming a flat end) would be 2~rl + ~r 2, i.e. 679 pm 2 if r = 4 pm and 1 = 25 pm. Assuming 0.2 Fm -2 for the double layer, one obtains 1.35 X 10 -l° F for the tip capacitance. This is much less than that observed experimentally, and for that there could be two explanations. Firstly, the surface area of the car- bon could be greater than contains pores or cracks of tron microscopy have been fibres (Johnson and Tyson,
that of the equivalent cylinder, i.e. the carbon some kind. X-ray diffraction and scanning elec- used to investigate the fine structure of carbon 1969). These studies have shown that fibres may
consist of fine fibrils 5--10 nm in width with smaller crevices between them. During manufacture, the fibres are etched to produce a rough surface for better adhesion of epoxy resins. Thus, the actual surface area in electrochem- ical terms could be several times the nominal one. Secondly, part .of the large capacitance could be due to charge stored on the very thin glass just proxi- mal to the tip. Evidence for this view comes from the observation that differ- ences in exposed tip length (cf. Fig. 3) can only account for a small propor- t ion of the observed difference between different electrodes (cf. Fig. 2), and that when the carbon fibre has been etched back into the glass, the glass wall can still transmit a signal, albeit with a higher impedance (Figs. 4 and 5).
In a carbon fibre microelectrode, the glass near the tip will have been stretched to the breaking thickness of the glass at a relatively large diameter. It may well be that the dielectric properties of such thin glass are different to those of glass in bulk, in particular in its ability to adsorb water molecules and thus contribute to the electrolytic capacitance of the microelectrode. Variations in electrode manufacture (such as length of first pull, oven tem- perature etc.) which affect the dimensions of the tip and in particular the length of carbon with glass collapsed around it, would then account largely for the impedance differences between electrodes. Probably both factors, i.e. increased surface area of the carbon and capacitative coupling through the glass, contribute to the large tip capacitance.
The parallel resistance R1 appear to vary between electrodes but not in one electrode with different tip lengths (Figs. 2, 3). It may be that carbon fibres are anisotropic in electrical properties, i.e. that their resistance along the fibre axis is less than the transverse resistance along a radius. Electrodes with different tip lengths would have the same cross-sectional area of fibre exposed and if this was the only important characteristic for Rh R1 would
46
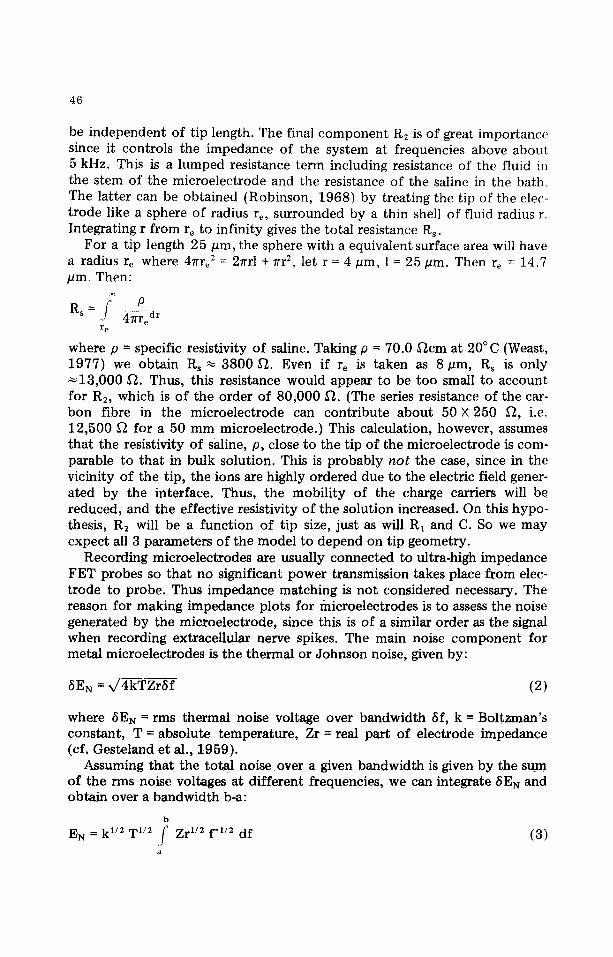
be independent of tip length. The final component R2 is of great importance since it controls the impedance of the system at frequencies above about 5 kHz. This is a lumped resistance term including resistance of the fluid in the stem of the microelectrode and the resistance of the saline in the bath. The latter can be obtained (Robinson, 1968) by treating the tip of the elec- trode like a sphere of radius re, surrounded by a thin shell of fluid radius r. Integrating r from re to infinity gives the total resistance Rs.
For a tip length 25 pm, the sphere with a equivalent surface area will have a radius re where 47rre 2 = 2~rl + ~r 2, let r = 4 pm, 1 = 25/~m. Then re = 14.7 pm. Then:
oo
= . f ] P Rs d r
r e
where p = specific resistivity of saline. Taking p = 70.0 f~cm at 20 ° C (Weast, 1977) we obtain Rs ~ 3800 ~2. Even if re is taken as 8 gm, Rs is only ~13,000 f~. Thus, this resistance would appear to be too small to account for R:, which is of the order of 80,000 ~2. (The series resistance of the car- bon fibre in the microelectrode can contribute about 50 ×250 f~, i.e. 12,500 f~ for a 50 mm microelectrode.) This calculation, however, assumes that the resistivity of saline, p, close to the tip of the microelectrode is com- parable to that in bulk solution. This is probably not the case, since in the vicinity of the tip, the ions are highly ordered due to the electric field gener- ated by the interface. Thus, the mobili ty of the charge carriers will be reduced, and the effective resistivity of the solution increased. On this hypo- thesis, R2 will be a funct ion of tip size, just as will R1 and C. So we may expect all 3 parameters of the model to depend on tip geometry.
Recording microelectrodes are usually connected to ultra-high impedance FET probes so that no significant power transmission takes place from elec- trode to probe. Thus impedance matching is not considered necessary. The reason for making impedance plots for inicroelectrodes is to assess the noise generated by the microelectrode, since this is of a similar order as the signal when recording extracellular nerve spikes. The main noise component for metal microelectrodes is the thermal or Johnson noise, given by:
~iEN = x/4kTZr~f (2)
where (~E N = rms thermal noise voltage over bandwidth 5f, k = Boltzman's constant, T = absolute temperature, Zr = real part of electrode impedance (cf. Gesteland et al., 1959).
Assuming that the total noise over a given bandwidth is given by the sum of the rms noise voltages at different frequencies, we can integrate SEN and obtain over a bandwidth b-a:
b
EN = k 1/2 T v2 .( Zr 1/2 f - tn df a
(3)
47
where Zr is given by
i ) Zr= - ~ - + R z ,
= 1 + (27rCRlf) 2 in our model (Fig. 6). Eqn. 3 when integrated from a = 10 Hz to b = 10,000 Hz gives EN ~ 5.1
pV rms from 10 Hz to 10,000 Hz. The experimentally measured noise is about twice this value (10.5 pV), which is a fair agreement, but which could indicate that factors other than thermal noise are involved. The experimental noise value for the complete system of <25 pV peak-to-peak is comparable with good tungsten microelectrodes (Merrill and Ainsworth, 1972). The same equivalent circuit acts as a model for both single-barrel and triple-barrel electrodes, and therefore one can expect (and we have found) similar low- noise recording characteristics in multibarrel electrodes with a carbon fibre recording channel.
There seems to be little difference in recording quality or noise between electrodes stem-filled with mercury, or for electrodes filled with concen- trated salt solution with a chlorided silver wire, and therefore the latter should probably be used for reasons of economy and safety. In most tests we have found little difference between electrodes filled with concentra ted NaC1 solution and dilute (0.9%) NaC1 solution, but occasionally dilute saline-filled electrodes have failed to record well, and it might be bet ter to use concen- t rated saline. On the other hand, in multibarrel electrodes, concentrated saline may crystallize at the top of the stem, and if these crystals reach the iontophoresis barrels, chemical or electrical contaminat ion may occur between barrels. On balance, therefore, we would advise that dilute saline should be used in iontophoresis (multibarrel) electrodes, and concentra ted saline in single electrodes.
In conclusion, it would appear that the circuit shown in Fig. 7 is a good model for the carbon fibre electrode in a saline bath with a chlorided silver indifferent electrode. The predicted (thermal) noise from this model at 10 Hz to 10 kHz is about half the experimental ly measured noise of ~10 .5 pV rms. This low noise is caused by the very large tip capacitance that is proba- bly due to the porous surface of the carbon fibre at the tip, and also to the anomalous behaviour of the thin glass membrane just proximal to the tip.
ACKNOWLEDGEMENTS
We are most grateful to Ms. J. Abbot t and Mrs. I. Sampson for technical help, and to Courtauld, for a generous free sample of 'Grafil ' fibres. The integral in eqn. 3 of the Discussion was evaluated by Dr. U. Ehrenmark.
REFERENCES
Armstrong-James, M. and Millar, J. (1979) Carbon fibre microelectrodes, J. neurosci. Meth., 1: 279--287.

48
Bockris, J.O.'M. and Drazic, D. (1972) Electrochemical Science, Taylor and Francis, London, Barnes and Noble, New York, N.Y.
Curtis, D.R. (1964) Microelectrophoresis. In W.L. Nastuk (Ed.), Physical Techniques m Biological Research, Vol. 5, Academic Press, New York.
Frank, K. and Becket, M.C. (1964) Microelectrodes for recording and stimulation. In W.L. Nastuk (Ed.), Physical Techniques in Biological Research, Vol. 5, Academic Press, New York.
Gesteland, R.C., Howland, B., Lettvin, J.Y. and Pitts, W.H. (1959)Comments on micro- electrodes. Proc. IRE, 47: 1856--1862.
Johnson, D.J. and Tyson, C.N. (1969) The fine structure of graphitised fibres, Brit. J. appl. Phys., 2: 787--795.
Merrill, E.G. and Ainsworth, A. (1972) Glass-coated platinum-plated tungsten microelec- trodes, Med. and biol. Engng., 10: 662--672.
Robinson, D.A. (1968) The electrical properties of metal microelectrodes, Proc. IEEE, 56: 1065--1071.
Weast, R.C. (Ed.) (1977) Handbook of Chemistry and Physics, C.R.C. Handbook, 58th edn., C.R.C. Press, Cleveland, Ohio.
Copyright © 2022 FDOKUMEN