Distribution of oxygen in surface sediments from central Sagami Bay, Japan: In situ measurements by...
14
Deep-Sea Research I 52 (2005) 1974–1987 Instruments and Methods Distribution of oxygen in surface sediments from central Sagami Bay, Japan: In situ measurements by microelectrodes and planar optodes Ronnie N Glud a, , Frank Wenzho¨ fer a,c , Anders Tengberg a,d , Mathias Middelboe a , Kazumasa Oguri b , Hiroshi Kitazato b a Marine Biological Laboratory, University of Copenhagen, Strandpromenaden 5, DK-3000 Helsingør, Denmark b Institute for Research on Earth Evolution, Japan Agency for Marine Earth-Science and Technology (JAMSTEC), Natsusshima-cho 2-15, Yokosuka 237-0061, Japan c Max Planck Institute for Marine Microbiology, Celsiusstr. 1, D-28359 Bremen, Germany d Department of Chemistry, Marine Chemistry, Go¨teborg University, Kemiva¨gen 10, 412 96 Go¨teborg, Sweden Received 10 January 2005; received in revised form 2 May 2005; accepted 2 May 2005 Available online 14 July 2005 Abstract Distributions of oxygen in surface sediments from central Sagami Bay were quantified using an autonomous vehicle carrying both a profiling microelectrode instrument and a planar optode module. Measurements were performed at 16 sites (either by microelectrodes or optodes) along a 175 m long transect and in total 45 electrode microprofiles and 6 O 2 images (each covering 6.9 5.1 cm of surface sediment) were obtained. The data revealed an extensive small-scale variation of the in situ O 2 distribution. The diffusive O 2 uptake (DOU) as derived from the microelectrode data varied by a factor 410 with an average value of 2.671.6 mmol m 2 d 1 (n ¼ 45) corresponding to 8% of the estimated average primary production for the area. There was no significant difference in the average O 2 penetration depth as quantified from the microprofiles and the planar optode images (Po0:05). The O 2 penetration depth of the combined dataset varied between 0.5 and 9.2 mm with an average value of 3.971.5 mm (n ¼ 347). Even though the organic carbon rich sediments of central Sagami Bay may exhibit higher horizontal heterogeneity than normally encountered in deep-sea sediments, the data document that extrapolation from a few in situ data points should be done with caution. A detailed statistical analysis of the spatial autocorrelation in the O 2 penetration depth documented that measurements performed less than 2 cm apart were autocorrelated. This implies that the aerobic benthic activity at the investigated site varied in patches with a characteristic size of a few cm. The presented data represent a detailed in situ study on small-scale spatial variability in ARTICLE IN PRESS www.elsevier.com/locate/dsr 0967-0637/$ - see front matter r 2005 Elsevier Ltd. All rights reserved. doi:10.1016/j.dsr.2005.05.004 Corresponding author. E-mail address: [email protected] (R.N. Glud).
-
Upload
independent -
Category
Documents
-
view
4 -
download
0
Transcript of Distribution of oxygen in surface sediments from central Sagami Bay, Japan: In situ measurements by...
ARTICLE IN PRESS
0967-0637/$ - se
doi:10.1016/j.ds
�CorrespondiE-mail addre
Deep-Sea Research I 52 (2005) 1974–1987
www.elsevier.com/locate/dsr
Instruments and Methods
Distribution of oxygen in surface sediments from centralSagami Bay, Japan: In situ measurements by
microelectrodes and planar optodes
Ronnie N Gluda,�, Frank Wenzhofera,c, Anders Tengberga,d, Mathias Middelboea,Kazumasa Ogurib, Hiroshi Kitazatob
aMarine Biological Laboratory, University of Copenhagen, Strandpromenaden 5, DK-3000 Helsingør, DenmarkbInstitute for Research on Earth Evolution, Japan Agency for Marine Earth-Science and Technology (JAMSTEC),
Natsusshima-cho 2-15, Yokosuka 237-0061, JapancMax Planck Institute for Marine Microbiology, Celsiusstr. 1, D-28359 Bremen, Germany
dDepartment of Chemistry, Marine Chemistry, Goteborg University, Kemivagen 10, 412 96 Goteborg, Sweden
Received 10 January 2005; received in revised form 2 May 2005; accepted 2 May 2005
Available online 14 July 2005
Abstract
Distributions of oxygen in surface sediments from central Sagami Bay were quantified using an autonomous vehicle
carrying both a profiling microelectrode instrument and a planar optode module. Measurements were performed at 16
sites (either by microelectrodes or optodes) along a �175m long transect and in total 45 electrode microprofiles and 6
O2 images (each covering 6.9� 5.1 cm of surface sediment) were obtained. The data revealed an extensive small-scale
variation of the in situ O2 distribution. The diffusive O2 uptake (DOU) as derived from the microelectrode data varied
by a factor 410 with an average value of 2.671.6mmolm�2 d�1 (n ¼ 45) corresponding to �8% of the estimated
average primary production for the area.
There was no significant difference in the average O2 penetration depth as quantified from the microprofiles and the
planar optode images (Po0:05). The O2 penetration depth of the combined dataset varied between 0.5 and 9.2mm with
an average value of 3.971.5mm (n ¼ 347). Even though the organic carbon rich sediments of central Sagami Bay may
exhibit higher horizontal heterogeneity than normally encountered in deep-sea sediments, the data document that
extrapolation from a few in situ data points should be done with caution. A detailed statistical analysis of the spatial
autocorrelation in the O2 penetration depth documented that measurements performed less than 2 cm apart were
autocorrelated. This implies that the aerobic benthic activity at the investigated site varied in patches with a
characteristic size of a few cm. The presented data represent a detailed in situ study on small-scale spatial variability in
e front matter r 2005 Elsevier Ltd. All rights reserved.
r.2005.05.004
ng author.
ss: [email protected] (R.N. Glud).
ARTICLE IN PRESS
R.N. Glud et al. / Deep-Sea Research I 52 (2005) 1974–1987 1975
sediment O2 distribution and document that planar O2 optode images provide a tool to access spatial heterogeneity of
natural sediments.
r 2005 Elsevier Ltd. All rights reserved.
Keywords: Oxygen; Benthic mineralization; In situ; Microsensing; Planar optodes; Lander
1. Introduction
The benthic O2 consumption rate provides arobust measure of the total benthic organic carbondegradation rate (e.g. Thamdrup and Canfield,2000), and the oxygen distribution gives importantinformation on the general biogeochemistry ofmarine sediments (e.g. Rysgaard et al., 2004). Thetotal benthic O2 uptake has traditionally beenmeasured on recovered sediment cores or in situ byautonomous vehicles carrying benthic chambers tothe seafloor (e.g. Smith et al., 2001). Total benthicO2 consumption rates may also be measured by anewly developed approach ‘‘the eddy correlationtechnique’’, where simultaneous measurements ofthe vertical flow component and the oxygenconcentration at a given point in the turbulentwater phase allow the calculation of an instanta-neous vertical O2 flux across a seafloor area ofmany square meters (Berg et al., 2003). This non-invasive technique can supply high-quality fluxdata for sediments with a high benthic O2
exchange rate, but as for benthic chamber incuba-tions it gives no information on the benthic O2
distribution or the interstitial O2 dynamic. Suchinsights have been provided by interfacial O2
microprofiles obtained by O2 microsensors appliedeither in the laboratory or in situ (e.g. Rasmussenand Jørgensen, 1992; Reimers et al., 1986).Microprofile data, however, supply detailed in-formation only at a single point, and naturallyoccurring heterogeneity often compromise extra-polation to larger sediment areas, even afterseveral profiles at a given site are obtained (e.g.Glud et al., 1998).The introduction of planar optodes to aquatic
science now makes it possible to image two-dimensional O2 distributions at a similar spatialresolution as the microelectrode techniques (Gludet al., 1996). Thereby small scale 2D spatialvariability (mm to cm) in benthic O2 distribution
has been resolved both in the laboratory (Gludet al., 1999a; Precht et al., 2004) and in situ by anon-line, inverted periscope instrument (Glud et al.,2001). The few planar optode investigationsperformed so far have documented that thebenthic O2 distribution of coastal sedimentsexhibit a previously unresolved small-scale spatialvariability with important implications for benthicsolute dynamics and carbon mineralization (e.g.Fenchel and Glud, 2000; Wenzhofer and Glud,2004).At present we have only very limited informa-
tion on the in situ spatial variability in benthic O2
distribution at any significant water depth. This ispartly due to logistic difficulties in obtainingmultiple deployments separated by well-defineddistances at a given location and until now the lackof appropriate technology. In the present studywe, on the basis on multiple O2 microprofiles andO2 optode images obtained along a �175mtransect, discuss the spatial heterogeneity in thesediment O2 distribution at 1450m water depth.
2. Materials and methods
2.1. Study site
Sagami bay is a �3000 km2 large embaymentwhere the inner part is connected to Tokyo Bay,while the outer part faces the Pacific Ocean(Fig. 1). During 1996–1999 the semi-enclosed baywas studied intensively by a large interdiciplinaryresearch team focusing on water column processes,benthic–pelagic coupling and to a lesser extentbenthic biogeochemistry (Kitazato et al., 2003).The present study was conducted in the central
basin at �1450m water depth, close to the ‘‘OBBIIstation’’ (35100.860N 139121.590E) (Kitazato et al.,2003) between 24 September and 10 October 2003,from the research vessel ‘‘R.V. Natsushima’’.

ARTICLE IN PRESS
Fig. 1. The location of Sagami Bay with the investigated site (OBBII) indicated by a black dot. The black triangle indicates the seep
area closest to the OBBII.
R.N. Glud et al. / Deep-Sea Research I 52 (2005) 1974–19871976
Because of high nutrient loading the surfacewaters in this area are relatively productive. Theaverage depth-integrated Chl a concentration is�40mgm�2 (0–50m depth), and the annualaverage gross sedimentation rate of organicmatter measured 350m above the seafloor is�240mgm�2 d�1 (Kanda et al., 2003; Masuzawaet al., 2003). The water column-based mineraliza-tion leads to an O2 minimum zone at �1200mdepth and a relatively invariable O2 concentrationof �50mM at 1450m depth (Kitazato et al., 2003).The Bay is known for several cold seep areas inshallower water (Greene et al., 1997), but these werenot included in the present investigation (Fig. 1).
2.2. Lander description
The two measuring modules, the microprofilingunit and the planar optode module (Fig. 2), weremounted on a tripod (side length 1.4m) equippedwith 6 flotation spheres. The internal distancebetween the centres of the two modules was 95 cm.The weight of the instrument was balanced so thatthe instrument fell through the water column witha speed of 26mmin�1. On one occasion the twomodules started measuring at the landing spot butotherwise a ROV—the ‘‘Hyperdolphine’’ (http://www.jamstec.go.jp/jamstec-e/rov/hyper.html)—moved the instrument to an undisturbed spot prior
ARTICLE IN PRESS
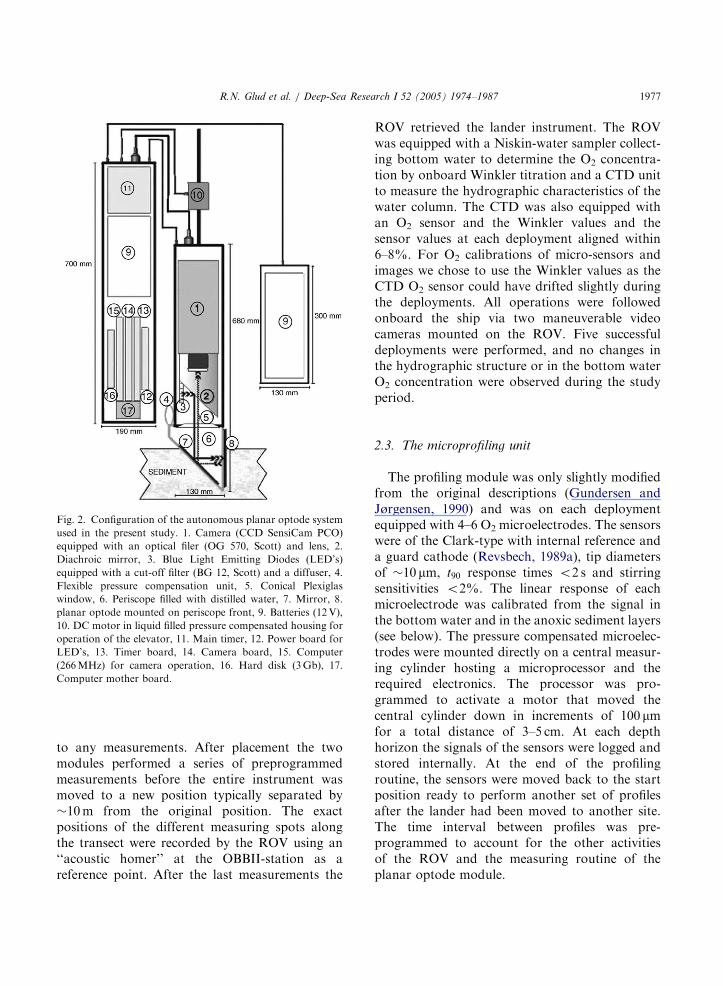
Fig. 2. Configuration of the autonomous planar optode system
used in the present study. 1. Camera (CCD SensiCam PCO)
equipped with an optical filer (OG 570, Scott) and lens, 2.
Diachroic mirror, 3. Blue Light Emitting Diodes (LED’s)
equipped with a cut-off filter (BG 12, Scott) and a diffuser, 4.
Flexible pressure compensation unit, 5. Conical Plexiglas
window, 6. Periscope filled with distilled water, 7. Mirror, 8.
planar optode mounted on periscope front, 9. Batteries (12V),
10. DC motor in liquid filled pressure compensated housing for
operation of the elevator, 11. Main timer, 12. Power board for
LED’s, 13. Timer board, 14. Camera board, 15. Computer
(266MHz) for camera operation, 16. Hard disk (3Gb), 17.
Computer mother board.
R.N. Glud et al. / Deep-Sea Research I 52 (2005) 1974–1987 1977
to any measurements. After placement the twomodules performed a series of preprogrammedmeasurements before the entire instrument wasmoved to a new position typically separated by�10m from the original position. The exactpositions of the different measuring spots alongthe transect were recorded by the ROV using an‘‘acoustic homer’’ at the OBBII-station as areference point. After the last measurements the
ROV retrieved the lander instrument. The ROVwas equipped with a Niskin-water sampler collect-ing bottom water to determine the O2 concentra-tion by onboard Winkler titration and a CTD unitto measure the hydrographic characteristics of thewater column. The CTD was also equipped withan O2 sensor and the Winkler values and thesensor values at each deployment aligned within6–8%. For O2 calibrations of micro-sensors andimages we chose to use the Winkler values as theCTD O2 sensor could have drifted slightly duringthe deployments. All operations were followedonboard the ship via two maneuverable videocameras mounted on the ROV. Five successfuldeployments were performed, and no changes inthe hydrographic structure or in the bottom waterO2 concentration were observed during the studyperiod.
2.3. The microprofiling unit
The profiling module was only slightly modifiedfrom the original descriptions (Gundersen andJørgensen, 1990) and was on each deploymentequipped with 4–6 O2 microelectrodes. The sensorswere of the Clark-type with internal reference anda guard cathode (Revsbech, 1989a), tip diametersof �10 mm, t90 response times o2 s and stirringsensitivities o2%. The linear response of eachmicroelectrode was calibrated from the signal inthe bottom water and in the anoxic sediment layers(see below). The pressure compensated microelec-trodes were mounted directly on a central measur-ing cylinder hosting a microprocessor and therequired electronics. The processor was pro-grammed to activate a motor that moved thecentral cylinder down in increments of 100 mmfor a total distance of 3–5 cm. At each depthhorizon the signals of the sensors were logged andstored internally. At the end of the profilingroutine, the sensors were moved back to the startposition ready to perform another set of profilesafter the lander had been moved to another site.The time interval between profiles was pre-programmed to account for the other activitiesof the ROV and the measuring routine of theplanar optode module.

ARTICLE IN PRESS
R.N. Glud et al. / Deep-Sea Research I 52 (2005) 1974–19871978
2.4. The planar optode unit
The planar optode module applied in thepresent study represents an autonomous prototypedeveloped from an interactive module originallydesigned for coastal on-line operations (Gludet al., 2001). The pressure compensated water-filled inverted periscope was mounted on a 6000mpressure resistant cylinder which carried theexcitation light source (25 blue Light EmittingDiodes), optical filters, and an electrically cooledand fast-gate-able, 12 bit CCD camera (SensiCamfrom PCO computer optics, http://www.pco.de/).The optical path between the camera inside thepressure case and the planar optode mounted onthe front window of the periscope was ensured bya 5 cm-thick conical Plexiglas window and amirror (Fig. 2). Another larger pressure casehosted the controlling electronics. This includeda small size 266MHz computer with a 3Gb harddisk (Cool Monster, Jumptec, http://www.jump-tec.de), a timer board assuring correct timingbetween the excitation light and the camera shutter(Padco-06 from Spectrum http://www.spec.de),and the camera controller board (PCO computeroptics). The large pressure case also contained a12V (12Ah) battery and the main timer (Millen-ium II from Crouzet, http://www.crouzet.com)that was used to activate a DC motor controllingthe periscope elevator and the entire camerasystem simply by switching on/off power at pre-programmed time intervals. Another smallerpressure case contained additional batteries(12V, 9Ah, see Fig. 2). Data obtained by thepresent prototype had, for different technicalreasons (see ‘‘Section 4’’) higher noise level thannormally encountered when planar optodes areapplied in the laboratory, or on our interactivecoastal module (Glud et al., 2001; Wenzhofer andGlud, 2004). In order to partly overcome the noise,at each measuring spot we obtained 3� 8 imagesand performed detailed analysis only on theaverage images obtained at each session. Ingeneral the averaging procedure lowered the SDof the pixel-to-pixel variation of calibrated imagesfrom 21% for a single image to approximately�4% for the averaged image (depending on theoptode and the camera settings). The averaging
had no effect on the measured O2 distribution butonly improved the image quality. The availablepower allowed for �20 sessions of oxygen imagingat the given temperature and configuration.The planar optode foils were mounted on the
front of the periscope head (Fig. 2) and werebased on the O2 quenchable luminophore, ruthe-nium (III)-Tris-4,7-diphenyl-1,10-phenathroline(Ru(diph)3) embedded in plasticized PVC(O-nitrophenyloctylether) immobilized on a trans-parent polyester support foil (Mylar, Dupont,USA). In order to avoid interference from scatter-ing particles in the sediments the cured sensinglayer was covered by an optically insulating blacksilicone layer. The three layered planar optodeshad a total thickness of �200 mm, consisting of the�175 mm thick support foil, the 10 mm thick layerof immobilized luminophore, and the �15–20 mmthick layer of optical insulation. The camera wasequipped with a wide-angle lens (Tevidon 1.4/25)covering an area of 6.9� 5.1 cm whereby the pixelresolution was 108� 108 mm.During a typical deployment the system col-
lected a series of calibration images in the bottomwater before driving the periscope head down tothe end position. The tripod legs were adjustedonboard prior to lander deployment so that theend-position of the unit ensured approximatealignment between the sediment surface and thehorizontal center line of the planar optode. Duringsuccessive positioning of the lander by the ROV itwas ensured that one set of anoxic calibrationimages was obtained (i.e. the entire planar optodewindow placed deep in the sediment); the operationwas followed online via the video cameras of theROV. Along with digital still camera images thevideo recordings were used for assisting subsequentalignment of the sediment surface and the planaroptode images using fixed points on the periscopehead and pinholes in the measuring foil.During the present study we only used intensity-
based imaging for quantifying the 2D O2 distribu-tion. The luminescent signal images were calibratedinto O2 images by a modified Stern–Volmer equation(Carraway et al., 1991; Klimant et al., 1995)
I
I0¼ aþ
1
ð1þ K svCÞð1� aÞ, (1)

ARTICLE IN PRESS
R.N. Glud et al. / Deep-Sea Research I 52 (2005) 1974–1987 1979
where I0 and I are the luminescent intensities atanoxia and in the presence of O2 at a concentrationC, respectively, K sv is the quenching coefficient anda is the fraction of non-quenchable luminescentsignal which was assumed to be an image constant of0.2 in the present study. Using the images obtainedin the bottom water and in the anoxic sediment, I0,and K sv for all �307.000 pixels of the acquiredimages were calculated and used for the subsequentimage calibration. In the following, calibratedimages are referred to as O2 images. No smoothingprocedures were applied to the images.
2.5. Calculations
From the microelectrode profiles the diffusiveO2 uptake (DOU) was calculated from Fick’s firstlaw of diffusion DOU ¼ D0ðdC=dZÞ, where D0 isthe molecular diffusion coefficient of O2 at the insitu temperature, salinity and hydrostatic pressureand, C, is the O2 concentration at depth Z withinthe diffusive boundary layer (DBL) (Jørgensenand Revsbech, 1985; Rasmussen and Jørgensen,1992).The O2 penetration depth can be directly
inferred from the obtained microprofiles account-ing for the DBL thickness. As for most other insitu studies we estimated the DBL thickness asdescribed by (Jørgensen and Revsbech, 1985).Here the sediment surface (i.e. the lower DBLboundary) is identified from microprofiles as adistinct change in the linear O2 gradient of theDBL. The change is caused for two reasons (i) thefact that diffusion coefficient of the interstitum isreduced due to a change in tortuosity and (ii) thatdissolved O2 is consumed within the interstice(Jørgensen and Revsbech, 1985; Revsbech, 1989b).Further, the upper boundary of the DBL is definedas the depth at which the extrapolated, linear O2
gradient of the DBL reaches the constant value ofthe turbulent water mass (Jørgensen and Re-vsbech, 1985). The O2 penetration depth wasquantified as the distance between the estimatedsediment surface and the depth at which the sensorsignal reached a constant low value (anoxicsignal).Oxygen microprofiles were extracted from the
planar optode O2 images with a custom-made
software package. In order to further improvequality of the extracted microprofiles five neigh-boring profiles were extracted and averaged, thusthe extracted profiles represent a distance on theO2 images of 540 mm (5� 108 mm) from theseprofiles the O2 penetration depth was determinedas described above. The horizontal pattern in theO2 penetration depth from the combined datasetwas analyzed by spatial autocorrelation estimatedas Moran’s I coefficients (Moran, 1950; Legendreand Legendre, 1998) using 73 size classes (fromvalues separated by o0.005m and up to valuesseparated by 4150m). Moran’s I expresses thedegree of autocorrelation, and the sign indicates acorrelation that either is negative or positive. Thesize class at which the coefficient changes signindicates the size of patches with autocorrelatedvalues. The approach has been used previously toinvestigate scaling of microbial activity andbiomass (e.g. Rysgaard et al., 2001; Middelboeet al., submitted).
3. Results
3.1. Microelectrode profiles
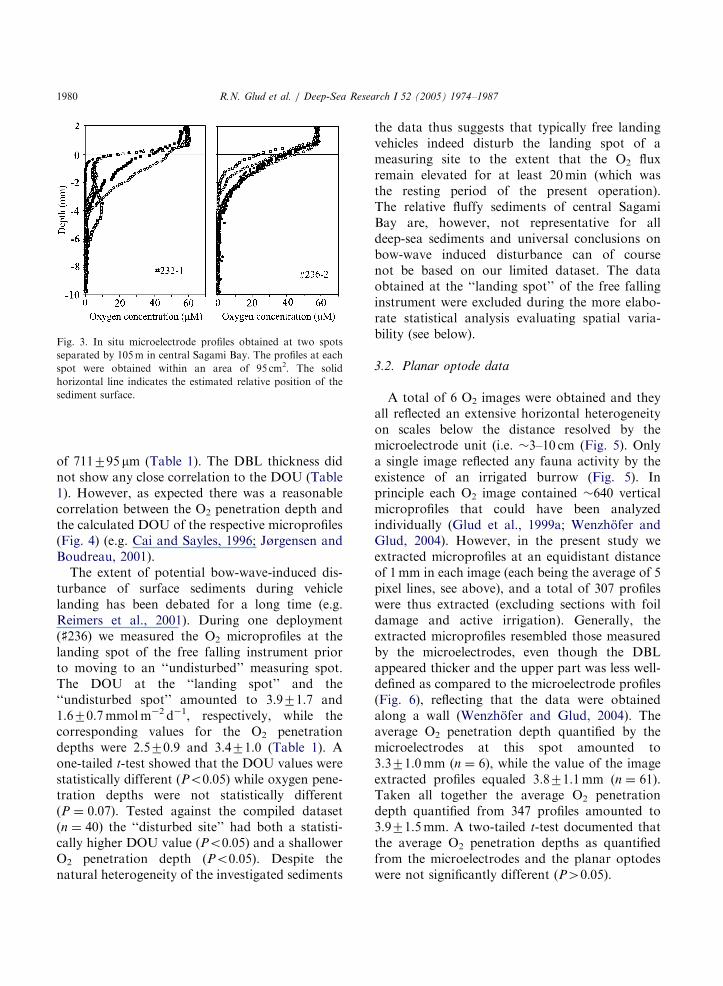
A total number of 45 in situ O2 microprofileswere obtained during 5 dives. At each dive from 1to 3 sites were investigated, and the microelectrodedata were thus obtained at 10 different spots, eachcovering an area of � 95 cm2 (equivalent to thecircular base of the electronic casing carrying thesensors). The shortest horizontal distance resolvedby the profiling unit (i.e. the distance between twoneighboring microelectrodes) was 3.2 cm. Overallthe small-scale spatial heterogeneity of the inves-tigated sediments was quite extensive and evenmeasurements performed at one spot (area of�95 cm2) differed quite substantially (Fig. 3). Forall obtained electrode microprofiles the DOUvaried between 0.7 and 7.6mmolm�2 d�1 with anaverage value of 2.671.6mmolm�2 d�1 and theequivalent values for the oxygen penetration depthwere 1.0 and 6.8mm with an average value of3.571.3mm (Table 1). The DBL thickness asestimated from the measured profiles variedbetween 600 and 900 mm, with an average value
ARTICLE IN PRESS
Fig. 3. In situ microelectrode profiles obtained at two spots
separated by 105m in central Sagami Bay. The profiles at each
spot were obtained within an area of 95 cm2. The solid
horizontal line indicates the estimated relative position of the
sediment surface.
R.N. Glud et al. / Deep-Sea Research I 52 (2005) 1974–19871980
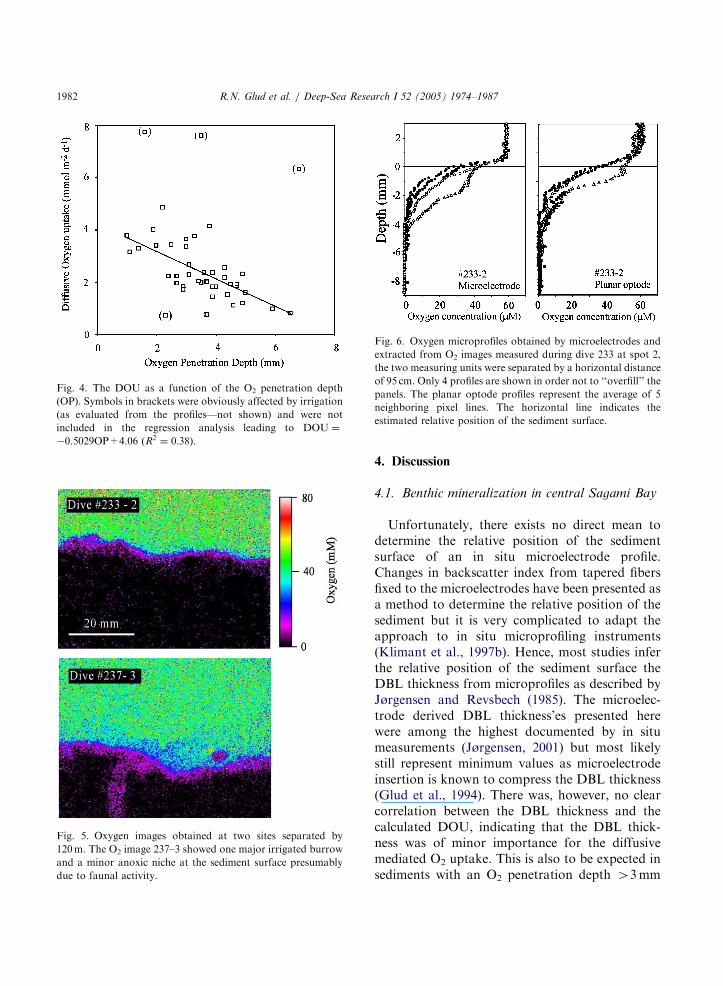
of 711795 mm (Table 1). The DBL thickness didnot show any close correlation to the DOU (Table1). However, as expected there was a reasonablecorrelation between the O2 penetration depth andthe calculated DOU of the respective microprofiles(Fig. 4) (e.g. Cai and Sayles, 1996; Jørgensen andBoudreau, 2001).The extent of potential bow-wave-induced dis-
turbance of surface sediments during vehiclelanding has been debated for a long time (e.g.Reimers et al., 2001). During one deployment(]236) we measured the O2 microprofiles at thelanding spot of the free falling instrument priorto moving to an ‘‘undisturbed’’ measuring spot.The DOU at the ‘‘landing spot’’ and the‘‘undisturbed spot’’ amounted to 3.971.7 and1.670.7mmolm�2 d�1, respectively, while thecorresponding values for the O2 penetrationdepths were 2.570.9 and 3.471.0 (Table 1). Aone-tailed t-test showed that the DOU values werestatistically different (Po0:05) while oxygen pene-tration depths were not statistically different(P ¼ 0:07). Tested against the compiled dataset(n ¼ 40) the ‘‘disturbed site’’ had both a statisti-cally higher DOU value (Po0:05) and a shallowerO2 penetration depth (Po0:05). Despite thenatural heterogeneity of the investigated sediments
the data thus suggests that typically free landingvehicles indeed disturb the landing spot of ameasuring site to the extent that the O2 fluxremain elevated for at least 20min (which wasthe resting period of the present operation).The relative fluffy sediments of central SagamiBay are, however, not representative for alldeep-sea sediments and universal conclusions onbow-wave induced disturbance can of coursenot be based on our limited dataset. The dataobtained at the ‘‘landing spot’’ of the free fallinginstrument were excluded during the more elabo-rate statistical analysis evaluating spatial varia-bility (see below).
3.2. Planar optode data
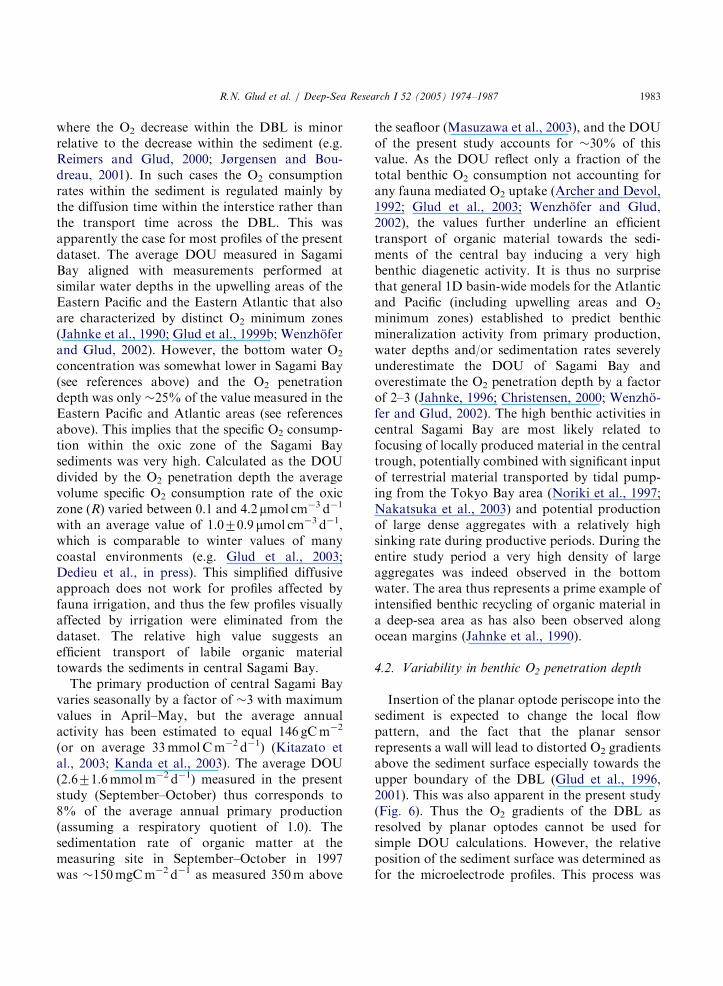
A total of 6 O2 images were obtained and theyall reflected an extensive horizontal heterogeneityon scales below the distance resolved by themicroelectrode unit (i.e. �3–10 cm (Fig. 5). Onlya single image reflected any fauna activity by theexistence of an irrigated burrow (Fig. 5). Inprinciple each O2 image contained �640 verticalmicroprofiles that could have been analyzedindividually (Glud et al., 1999a; Wenzhofer andGlud, 2004). However, in the present study weextracted microprofiles at an equidistant distanceof 1mm in each image (each being the average of 5pixel lines, see above), and a total of 307 profileswere thus extracted (excluding sections with foildamage and active irrigation). Generally, theextracted microprofiles resembled those measuredby the microelectrodes, even though the DBLappeared thicker and the upper part was less well-defined as compared to the microelectrode profiles(Fig. 6), reflecting that the data were obtainedalong a wall (Wenzhofer and Glud, 2004). Theaverage O2 penetration depth quantified by themicroelectrodes at this spot amounted to3.371.0mm (n ¼ 6), while the value of the imageextracted profiles equaled 3.871.1mm (n ¼ 61).Taken all together the average O2 penetrationdepth quantified from 347 profiles amounted to3.971.5mm. A two-tailed t-test documented thatthe average O2 penetration depths as quantifiedfrom the microelectrodes and the planar optodeswere not significantly different (P40:05).
ARTICLE IN PRESS
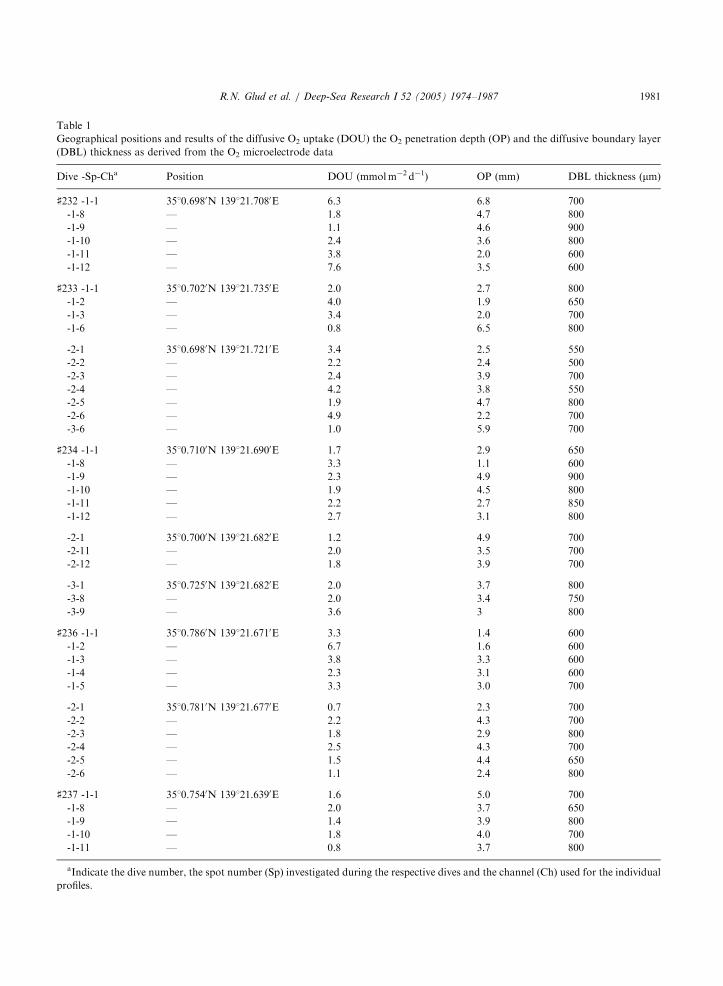
Table 1
Geographical positions and results of the diffusive O2 uptake (DOU) the O2 penetration depth (OP) and the diffusive boundary layer
(DBL) thickness as derived from the O2 microelectrode data
Dive -Sp-Cha Position DOU (mmolm�2 d�1) OP (mm) DBL thickness (mm)
]232 -1-1 3510.6980N 139121.7080E 6.3 6.8 700
-1-8 — 1.8 4.7 800
-1-9 — 1.1 4.6 900
-1-10 — 2.4 3.6 800
-1-11 — 3.8 2.0 600
-1-12 — 7.6 3.5 600
]233 -1-1 3510.7020N 139121.7350E 2.0 2.7 800
-1-2 — 4.0 1.9 650
-1-3 — 3.4 2.0 700
-1-6 — 0.8 6.5 800
-2-1 3510.6980N 139121.7210E 3.4 2.5 550
-2-2 — 2.2 2.4 500
-2-3 — 2.4 3.9 700
-2-4 — 4.2 3.8 550
-2-5 — 1.9 4.7 800
-2-6 — 4.9 2.2 700
-3-6 — 1.0 5.9 700
]234 -1-1 3510.7100N 139121.6900E 1.7 2.9 650
-1-8 — 3.3 1.1 600
-1-9 — 2.3 4.9 900
-1-10 — 1.9 4.5 800
-1-11 — 2.2 2.7 850
-1-12 — 2.7 3.1 800
-2-1 3510.7000N 139121.6820E 1.2 4.9 700
-2-11 — 2.0 3.5 700
-2-12 — 1.8 3.9 700
-3-1 3510.7250N 139121.6820E 2.0 3.7 800
-3-8 — 2.0 3.4 750
-3-9 — 3.6 3 800
]236 -1-1 3510.7860N 139121.6710E 3.3 1.4 600
-1-2 — 6.7 1.6 600
-1-3 — 3.8 3.3 600
-1-4 — 2.3 3.1 600
-1-5 — 3.3 3.0 700
-2-1 3510.7810N 139121.6770E 0.7 2.3 700
-2-2 — 2.2 4.3 700
-2-3 — 1.8 2.9 800
-2-4 — 2.5 4.3 700
-2-5 — 1.5 4.4 650
-2-6 — 1.1 2.4 800
]237 -1-1 3510.7540N 139121.6390E 1.6 5.0 700
-1-8 — 2.0 3.7 650
-1-9 — 1.4 3.9 800
-1-10 — 1.8 4.0 700
-1-11 — 0.8 3.7 800
aIndicate the dive number, the spot number (Sp) investigated during the respective dives and the channel (Ch) used for the individual
profiles.
R.N. Glud et al. / Deep-Sea Research I 52 (2005) 1974–1987 1981
ARTICLE IN PRESS
Fig. 4. The DOU as a function of the O2 penetration depth
(OP). Symbols in brackets were obviously affected by irrigation
(as evaluated from the profiles—not shown) and were not
included in the regression analysis leading to DOU ¼
�0.5029OP+4.06 (R2 ¼ 0:38).
Fig. 5. Oxygen images obtained at two sites separated by
120m. The O2 image 237–3 showed one major irrigated burrow
and a minor anoxic niche at the sediment surface presumably
due to faunal activity.
Fig. 6. Oxygen microprofiles obtained by microelectrodes and
extracted from O2 images measured during dive 233 at spot 2,
the two measuring units were separated by a horizontal distance
of 95 cm. Only 4 profiles are shown in order not to ‘‘overfill’’ the
panels. The planar optode profiles represent the average of 5
neighboring pixel lines. The horizontal line indicates the
estimated relative position of the sediment surface.
R.N. Glud et al. / Deep-Sea Research I 52 (2005) 1974–19871982
4. Discussion
4.1. Benthic mineralization in central Sagami Bay
Unfortunately, there exists no direct mean todetermine the relative position of the sedimentsurface of an in situ microelectrode profile.Changes in backscatter index from tapered fibersfixed to the microelectrodes have been presented asa method to determine the relative position of thesediment but it is very complicated to adapt theapproach to in situ microprofiling instruments(Klimant et al., 1997b). Hence, most studies inferthe relative position of the sediment surface theDBL thickness from microprofiles as described byJørgensen and Revsbech (1985). The microelec-trode derived DBL thickness’es presented herewere among the highest documented by in situmeasurements (Jørgensen, 2001) but most likelystill represent minimum values as microelectrodeinsertion is known to compress the DBL thickness(Glud et al., 1994). There was, however, no clearcorrelation between the DBL thickness and thecalculated DOU, indicating that the DBL thick-ness was of minor importance for the diffusivemediated O2 uptake. This is also to be expected insediments with an O2 penetration depth 43mm
ARTICLE IN PRESS
R.N. Glud et al. / Deep-Sea Research I 52 (2005) 1974–1987 1983
where the O2 decrease within the DBL is minorrelative to the decrease within the sediment (e.g.Reimers and Glud, 2000; Jørgensen and Bou-dreau, 2001). In such cases the O2 consumptionrates within the sediment is regulated mainly bythe diffusion time within the interstice rather thanthe transport time across the DBL. This wasapparently the case for most profiles of the presentdataset. The average DOU measured in SagamiBay aligned with measurements performed atsimilar water depths in the upwelling areas of theEastern Pacific and the Eastern Atlantic that alsoare characterized by distinct O2 minimum zones(Jahnke et al., 1990; Glud et al., 1999b; Wenzhoferand Glud, 2002). However, the bottom water O2
concentration was somewhat lower in Sagami Bay(see references above) and the O2 penetrationdepth was only �25% of the value measured in theEastern Pacific and Atlantic areas (see referencesabove). This implies that the specific O2 consump-tion within the oxic zone of the Sagami Baysediments was very high. Calculated as the DOUdivided by the O2 penetration depth the averagevolume specific O2 consumption rate of the oxiczone (R) varied between 0.1 and 4.2 mmol cm�3 d�1
with an average value of 1.070.9 mmol cm�3 d�1,which is comparable to winter values of manycoastal environments (e.g. Glud et al., 2003;Dedieu et al., in press). This simplified diffusiveapproach does not work for profiles affected byfauna irrigation, and thus the few profiles visuallyaffected by irrigation were eliminated from thedataset. The relative high value suggests anefficient transport of labile organic materialtowards the sediments in central Sagami Bay.The primary production of central Sagami Bay
varies seasonally by a factor of �3 with maximumvalues in April–May, but the average annualactivity has been estimated to equal 146 gCm�2
(or on average 33mmolCm�2 d�1) (Kitazato etal., 2003; Kanda et al., 2003). The average DOU(2.671.6mmolm�2 d�1) measured in the presentstudy (September–October) thus corresponds to8% of the average annual primary production(assuming a respiratory quotient of 1.0). Thesedimentation rate of organic matter at themeasuring site in September–October in 1997was �150mgCm�2 d�1 as measured 350m above
the seafloor (Masuzawa et al., 2003), and the DOUof the present study accounts for �30% of thisvalue. As the DOU reflect only a fraction of thetotal benthic O2 consumption not accounting forany fauna mediated O2 uptake (Archer and Devol,1992; Glud et al., 2003; Wenzhofer and Glud,2002), the values further underline an efficienttransport of organic material towards the sedi-ments of the central bay inducing a very highbenthic diagenetic activity. It is thus no surprisethat general 1D basin-wide models for the Atlanticand Pacific (including upwelling areas and O2
minimum zones) established to predict benthicmineralization activity from primary production,water depths and/or sedimentation rates severelyunderestimate the DOU of Sagami Bay andoverestimate the O2 penetration depth by a factorof 2–3 (Jahnke, 1996; Christensen, 2000; Wenzho-fer and Glud, 2002). The high benthic activities incentral Sagami Bay are most likely related tofocusing of locally produced material in the centraltrough, potentially combined with significant inputof terrestrial material transported by tidal pump-ing from the Tokyo Bay area (Noriki et al., 1997;Nakatsuka et al., 2003) and potential productionof large dense aggregates with a relatively highsinking rate during productive periods. During theentire study period a very high density of largeaggregates was indeed observed in the bottomwater. The area thus represents a prime example ofintensified benthic recycling of organic material ina deep-sea area as has also been observed alongocean margins (Jahnke et al., 1990).
4.2. Variability in benthic O2 penetration depth
Insertion of the planar optode periscope into thesediment is expected to change the local flowpattern, and the fact that the planar sensorrepresents a wall will lead to distorted O2 gradientsabove the sediment surface especially towards theupper boundary of the DBL (Glud et al., 1996,2001). This was also apparent in the present study(Fig. 6). Thus the O2 gradients of the DBL asresolved by planar optodes cannot be used forsimple DOU calculations. However, the relativeposition of the sediment surface was determined asfor the microelectrode profiles. This process was
ARTICLE IN PRESS
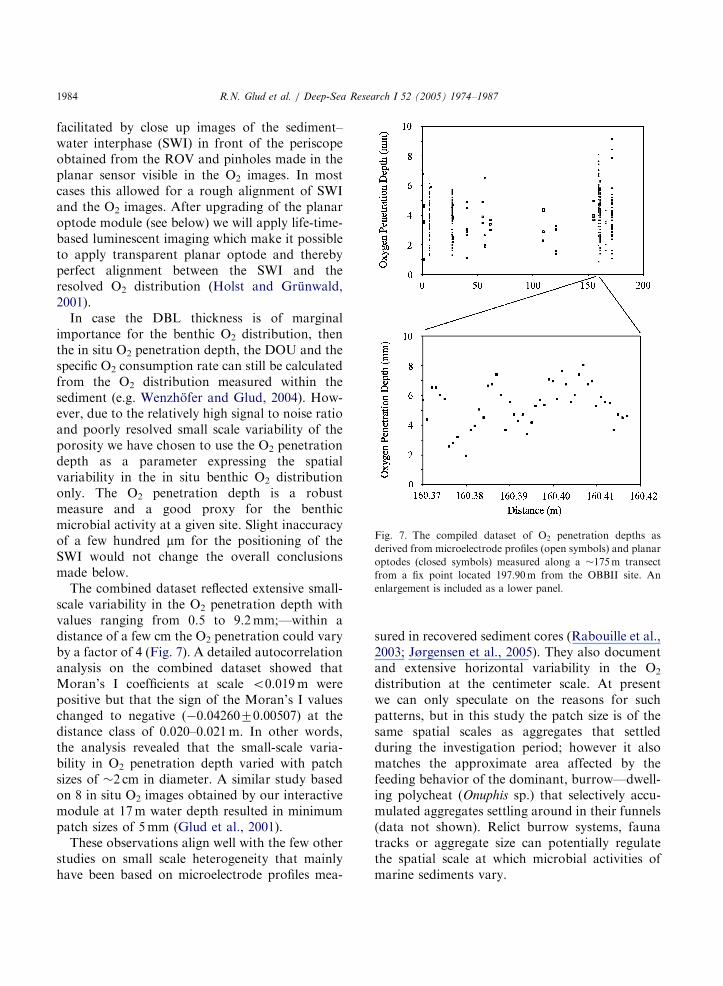
Fig. 7. The compiled dataset of O2 penetration depths as
derived from microelectrode profiles (open symbols) and planar
optodes (closed symbols) measured along a �175m transect
from a fix point located 197.90m from the OBBII site. An
enlargement is included as a lower panel.
R.N. Glud et al. / Deep-Sea Research I 52 (2005) 1974–19871984
facilitated by close up images of the sediment–water interphase (SWI) in front of the periscopeobtained from the ROV and pinholes made in theplanar sensor visible in the O2 images. In mostcases this allowed for a rough alignment of SWIand the O2 images. After upgrading of the planaroptode module (see below) we will apply life-time-based luminescent imaging which make it possibleto apply transparent planar optode and therebyperfect alignment between the SWI and theresolved O2 distribution (Holst and Grunwald,2001).In case the DBL thickness is of marginal
importance for the benthic O2 distribution, thenthe in situ O2 penetration depth, the DOU and thespecific O2 consumption rate can still be calculatedfrom the O2 distribution measured within thesediment (e.g. Wenzhofer and Glud, 2004). How-ever, due to the relatively high signal to noise ratioand poorly resolved small scale variability of theporosity we have chosen to use the O2 penetrationdepth as a parameter expressing the spatialvariability in the in situ benthic O2 distributiononly. The O2 penetration depth is a robustmeasure and a good proxy for the benthicmicrobial activity at a given site. Slight inaccuracyof a few hundred mm for the positioning of theSWI would not change the overall conclusionsmade below.The combined dataset reflected extensive small-
scale variability in the O2 penetration depth withvalues ranging from 0.5 to 9.2mm;—within adistance of a few cm the O2 penetration could varyby a factor of 4 (Fig. 7). A detailed autocorrelationanalysis on the combined dataset showed thatMoran’s I coefficients at scale o0.019m werepositive but that the sign of the Moran’s I valueschanged to negative (�0.0426070.00507) at thedistance class of 0.020–0.021m. In other words,the analysis revealed that the small-scale varia-bility in O2 penetration depth varied with patchsizes of �2 cm in diameter. A similar study basedon 8 in situ O2 images obtained by our interactivemodule at 17m water depth resulted in minimumpatch sizes of 5mm (Glud et al., 2001).These observations align well with the few other
studies on small scale heterogeneity that mainlyhave been based on microelectrode profiles mea-
sured in recovered sediment cores (Rabouille et al.,2003; Jørgensen et al., 2005). They also documentand extensive horizontal variability in the O2
distribution at the centimeter scale. At presentwe can only speculate on the reasons for suchpatterns, but in this study the patch size is of thesame spatial scales as aggregates that settledduring the investigation period; however it alsomatches the approximate area affected by thefeeding behavior of the dominant, burrow—dwell-ing polycheat (Onuphis sp.) that selectively accu-mulated aggregates settling around in their funnels(data not shown). Relict burrow systems, faunatracks or aggregate size can potentially regulatethe spatial scale at which microbial activities ofmarine sediments vary.
ARTICLE IN PRESS
R.N. Glud et al. / Deep-Sea Research I 52 (2005) 1974–1987 1985
In an accompanying paper we performed asimilar autocorrelation analysis on the abundanceof benthic bacteria and viruses sampled at thesame site, but in that case there was no significantcorrelation at scales below 150m (Middelboeet al., submitted). In that study samples were,however, obtained only down to a spatial distanceof 3.0 cm, and the spatial pattern in diageneticactivity revealed in the present study was thus notresolved. Our present understanding of the spatialvariability in microbial activity is still very limited,but planar optodes provide a tool to overcome andto quantify the natural heterogeneity of benthicdiagenetic activity.We cannot completely exclude the possibility
that periscope insertion affects the benthic O2
distribution and potentially the statistical analysis.Indeed laboratory experiments have documented atransient O2 smearing during periscope insertioncaused by O2 molecules dissolved in the planaroptode itself (Glud et al., 2001) and time seriesduring the present study confirmed this observa-tion. However, the O2 dissolved in the planarsensor and introduced to suboxic layers by sensorinsertion was consumed within minutes and thesubsequent images reflected a steady-state O2
distribution. Vertical O2 profiles extracted fromsuch images were similar to microelectrode profilesmeasured in parallel. Periscope insertion willnevertheless lead to some unavoidable particlesmearing, but the potential impact on particlesmearing on benthic O2 distribution is difficult toevaluate.
4.3. Optimization of in situ planar optode module
The autonomous planar optode module pre-sented here allowed the first detailed study ofsmall-scale spatial variability in benthic diageneticactivities of a deep-sea sediment. However, themodule is a prototype, and our deployments andthe subsequent data analysis showed that furtherimprovement would increase the applicabilityand the data quality of the instrument. Therelatively low success rate (6 O2 images out of 17measuring sessions—35%) as compared to otherlander deployments was primarily caused bypoorly defined periscope insertion. The module
had only an end-stop, and often the image windowwent too deep into the sediment or obtainedimages only in the bottom water; only in 6 casesdid the sediment surface align with the central partof the image window. In an optimized modulepresently under construction, a profiling optionintegrated with surface detection sensors willovercome this problem. Further, improvementsof the timer circuits, use of high impedanceconnectors, fewer and more powerful LED’s andmodified boards will lower the inherent noise ofthe system, increasing the image quality to thelevel we know from the laboratory and ourcoastal module. For O2 depleted environments,as central Sagami Bay, it would also be anadvantage to apply planar optodes based onplatinum porphyrins, which have significantlyhigher sensitivity at low O2 concentrations ascompared to the presently applied ruthenium-based sensor (Klimant et al., 1997b; Precht et al.,2004). This would significantly improve the signalto noise ratio in O2 depleted environments (Oguriet al., submitted). Further, we will include theoption of using lifetime-based luminescent imagingallowing application of transparent planar optodesfor precise alignment between anomalies in O2
distribution and sediment structure (Holst andGrunwald, 2001).
Acknowlegdements
We would like to thank the captain and crewonboard ‘‘R.V. Natsushima’’ for excellent supportand help during instrument deployment. AnniGlud is thanked for technically assistance andskillful sensor fabrication, while Søren E. Larsen isthanked for help with the statistical analysis andBjorn Grunwald for software development andsupport. Further, we would like to acknowledgethe constructive critic of three anonymous re-viewers. The study was financially supported bygrants from the Danish Natural Science ResearchCouncil, the Carlsberg Foundation, the SwedishResearch Council (621-2002-5166) and the EUCommission (contract numbers EVK3-CT2001-00210, EVK-CT2002-0076, GOCE-CT2003-505564).The support is gratefully acknowledged.
ARTICLE IN PRESS
R.N. Glud et al. / Deep-Sea Research I 52 (2005) 1974–19871986
References
Archer, D., Devol, A., 1992. Benthic oxygen fluxes on the
Washington shelf and slope: a comparison of in situ
microelectrode and chamber flux measurements. Limnology
and Oceanography 37, 614–629.
Berg, P., Røy, H., Janssen, F., Mayer, V., Jørgensen, B.B.,
Huettel, M., de Beer, D., 2003. Oxygen uptake by aquatic
sediments measured with a novel non-invasive eddy-
correlation technique. Marine Ecology Progress Series 261,
75–83.
Cai, W.J., Sayles, F.L., 1996. Oxygen penetration depths and
fluxes in marine sediments. Marine Chemistry 52, 123–131.
Carraway, E.R., Demas, J.N., DeGraff, B.A., Bacon, J.R.,
1991. Photophysics and photochemistry of oxygen sensors
based on luminescent transition metal complexes. Analytical
Chemistry 63, 337–342.
Christensen, J.P., 2000. A relationship between deep-sea
benthic oxygen demand and oceanic primary productivity.
Oceanologica Acta 23, 65–82.
Dedieu, K., Rabouille, C., Thouzeau, G., Mesnage, V.,
Chauvaud, L., Clavier, J., Jean, F., Ogier, S. (in press).
Benthic O2 distribution and dynamics in a Mediterranean
lagoon: in situ micorelectrode study. Estuarine and Coastal
Shelf Science.
Fenchel, T., Glud, R.N., 2000. Benthic primary production and
O2–CO2 dynamics in a shallow-water sediment: spatial and
temporal heterogeneity. Ophelia 53, 159–171.
Glud, R.N., Gundersen, J.K., Revsbech, N.P., Jørgensen, B.B.,
1994. Effects on the benthic diffusive boundary layer
imposed by microelectrodes. Limnology and Oceanography
39, 462–467.
Glud, R.N., Ramsing, N.B., Gundersen, J.K., Klimant, I.,
1996. Planar optrodes, a new tool for fine scale measure-
ments of two-dimensional O2 distribution in benthic
communities. Marine Ecology Progress Series 140, 217–226.
Glud, R.N., Holby, O., Hofmann, F., Canfield, D., 1998.
Benthic mineralization and exchange in Arctic sediments
(Svalbard, Norway). Marine Ecology Progress Series 173,
237–251.
Glud, R.N., Kuhl, M., Kohls, O., Ramsing, N.B., 1999a.
Heterogeneity of oxygen production and consumption in a
photosynthetic microbial mat as studied by planar optodes.
Journal of Phycology 35, 270–279.
Glud, R.N., Gundersen, J.K., Holby, O., 1999b. Benthic in situ
respiration in the upwelling area off Central Chile. Marine
Ecology Progress Series 186, 9–18.
Glud, R.N., Tengberg, A., Kuhl, M., Hall, P.O.J., Klimant, I.,
Holst, G., 2001. An in situ instrument for planar O2 optode
measurements at benthic interfaces. Limnology and Ocea-
nography 46, 2073–2080.
Glud, R.N., Gundersen, J.K., Røy, H., Jørgensen, B.B., 2003.
Seasonal dynamics of benthic O2 uptake in a semienclosed
bay: importance of diffusion and faunal activity. Limnology
and Oceanography 48, 1265–1276.
Greene, H.G., Barry, J.P., Hashimoto, J., Fujiwara, Y.,
Kochevar, R.E., Robinson, B.H., 1997. A submersible-based
comparison of cold-seep regions in Sagami and Monterey
Bays. JAMSTEC Journal of Deep-Sea Research 13, 395–415.
Gundersen, J.K., Jørgensen, B.B., 1990. Microstructure of
diffusive boundary layers and the oxygen uptake of the sea-
floor. Nature 345, 604–607.
Holst, G., Grunwald, B., 2001. Luminescence lifetime imaging
with transparent oxygen optodes. Sensors and Actuators B
74, 78–90.
Jahnke, R.A., 1996. The global ocean flux of particulate organic
carbon: a real distribution and magnitude. Global Biogeo-
chemical Cycles 10, 71–88.
Jahnke, R.A., Reimers, C.E., Craven, D.B., 1990. Intensifica-
tion of recycling of organic matter at the sea floor near
ocean margins. Nature 348, 50–54.
Jørgensen, B.B., 2001. Life in the diffusive boundary layer. In:
Boudreau, B.P., Jørgensen, B.B. (Eds.), The Benthic Bound-
ary Layer. Oxford University Press, Oxford, pp. 348–373.
Jørgensen, B.B., Boudreau, B.P., 2001. Diagenesis and sedi-
ment–water exchange. In: Boudreau, B.P., Jørgensen, B.B.
(Eds.), The Benthic Boundary Layer. Oxford University
Press, Oxford, pp. 211–238.
Jørgensen, B.B., Revsbech, N.P., 1985. Diffusive boundary
layers and the oxygen uptake of sediments and detritus.
Limnology and Oceanography 30, 111–122.
Jørgensen, B.B., Glud, R.N., Holby, O., 2005. Oxygen
distribution and bioirrigation in Arctic fjord sediments
(Svalbard, Barents Sea). Marine Ecology Progress Series
292, 49–58.
Kanda, J., Fujiwara, S., Kitazato, H., Okada, Y., 2003.
Seasonal and annual variation in the primary production
regime in the central part of Sagami Bay. Progress in
Oceanography 57, 17–29.
Kitazato, H., Nakatsuka, T., Shimanaga, M., Kanda, J., Soh,
W., Kato, Y., Okada, Y., Yamaoka, A., Masuzawa, T.,
Suzuki, K., Shirayama, Y., 2003. Long-term monitoring of
the sedimentary processes in the central part of Sagami Bay,
Japan: rationale, logistics and overview of results. Progress
in Oceanography 57, 3–16.
Klimant, I., Meyer, V., Kuhl, M., 1995. Fiber-optic oxygen
microsensors, a new tool in aquatic biology. Limnology and
Oceanography 40, 1159–1165.
Klimant, I., Holst, G., Kuhl, M., 1997b. A simple fiberoptic
sensor to detect the penetration of microensors into
sediments and other biogeochemical systems. Limnology
and Oceanography 42, 1638–1643.
Legendre, P., Legendre, L., 1998. Developments in Environ-
mental Ecology, 20. Numerical Ecology, second English ed.
Elsevier Science, Amsterdam.
Masuzawa, T., Li, T., Duan, Y., Yamamoto, M., Hibi, Y.,
Nakatsuka, T., Kitazato, H., Kato, Y., 2003. Temporal
variation in mass fluxes and major components of sinking
particles in Sagami Bay, off Japan. Progress in Oceano-
graphy 57, 59–75.
Middelboe, M., Glud, R.N., Wenzhofer, F., Oguri, K.,
Kitazato, H., submitted. Spatial distribution and activity
of viruses in the deep-sea sediments of Sagami Bay, Japan.
Deep-Sea Research I.
ARTICLE IN PRESS
R.N. Glud et al. / Deep-Sea Research I 52 (2005) 1974–1987 1987
Moran, P.A.P., 1950. Notes on continuous stochastic phenom-
ena. Biometrika 37, 17–23.
Nakatsuka, T., Masuzawa, T., Kanda, J., Kitazato, H.,
Shirayama, Y., Shimanaga, M., Yamaoka, A., 2003.
Particle dynamics in the deep water column of Sagami
Bay, Japan. I: origins of apparent flux of sinking particles.
Progress in Oceanography 57, 31–47.
Noriki, S., Skimizu, M., Hamahara, K., Narita, H., Saino, T.,
Yanagi, T., 1997. Transportation of particulate material
through the mouth of Tokyo bay to the open ocean. Journal
of Oceanography 53, 571–577.
Oguri, K., Kitazato, H., Glud, R.N., submitted. Planar oxygen
optode used with platinum Octaetylporphyrin UV-LED
excitation light source for high-resolution imaging in low
oxygen environments. Marine Chemistry.
Precht, E., Franke, U., Polerecky, L., Huettel., M., 2004. Oxygen
dynamics in permeable sediments with wave-driven pore
water exchange. Limnology and Oceanography 49, 693–705.
Rabouille, C., Denis, L., Didieu, K., Stora, G., Lansard, B.,
Grenz, C., 2003. Oxygen demand in coastal marine
sediments: comparing in situ microelectrodes and labora-
tory core incubations. Journal of Experimental Marine
Biology and Ecology 285/286, 49–69.
Rasmussen, H., Jørgensen, B.B., 1992. Microelectrode studies
of seasonal oxygen uptake in a coastal sediment: role of
molecular diffusion. Marine Ecology Progress Series 261,
289–303.
Reimers, C.E., Glud, R.N., 2000. In situ chemical sensor
measurements at the sediment–water interface. In: Varney,
M. (Ed.), Chemical Sensors in Oceanography. Gordon and
Breach Science Publishers, London, New York.
Reimers, C.E., Fischer, K.M., Merewether, R., Smith, K.L.,
Jahnke, R.A., 1986. Oxygen microprofiles measured in situ
in deep ocean sediments. Nature 320, 741–744.
Reimers, C.E., Jahnke, R.A., Thomsen, L., 2001. In situ
sampling in the benthic boundary layer. In: Boudreau, B.P.,
Jørgensen, B.B. (Eds.), The Benthic Boundary Layer.
Oxford University Press, Oxford.
Revsbech, N.P., 1989a. An oxygen microelectrode with a guard
cathode. Limnology and Oceanography 34, 474–478.
Revsbech, N.P., 1989b. Diffusion characteristics of microbial
communities determined by use of oxygen microsensors.
Journal of Microbial Methods 9, 111–122.
Rysgaard, S., Kuhl, M., Glud, R.N., Hansen, J.W., 2001.
Biomass, production and horizontal patchniness of sea ice
algae in a high Arctic fjord (Young Sound, NE Greenland).
Marine Ecology Progress Series 223, 15–26.
Rysgaard, S., Glud, R.N., Risgaard-Petersen, N., Dalsgaard,
T., 2004. Denitrification and anammox activity in Arctic
marine sediments. Limnology and Oceanography 49,
1493–1502.
Smith Jr., K.L., Kaufmann, R.S., Baldwin, R.J., Carlucci, A.F.,
2001. Pelagic-benthic coupling in the abyssal eastern
North Pacific: an 8-year time-series study of food
supply and demand. Limnology and Oceanography 46,
543–556.
Thamdrup, B., Canfield, D.E., 2000. Benthic respiration in
aquatic sediments. In: Sala, O.E.R., Jackson, R.B., Moon-
ey, H.A., Howarth, R.W. (Eds.), Methods in Ecosystem
Science. Springer, New York, pp. 86–103.
Wenzhofer, F., Glud, R.N., 2002. Benthic carbon mineraliza-
tion in the Atlantic: a synthesis based on in situ data from
the last decade. Deep-Sea Research I 49, 1255–1279.
Wenzhofer, F., Glud, R.N., 2004. Small-scale spatial and
temporal variability in coastal benthic O2 dynamics: effects
of fauna activity. Limnology and Oceanography 49,
1471–1481.
Further reading
Klimant, I., Kuhl, M., Glud, R.N., Holst, G., 1997. Optical
measurements of oxygen and temperature in microscale:
strategies and biological applications. Sensors and Actua-
tors B 38–39, 29–37.