In Central Obesity, Weight Loss Restores Platelet Sensitivity to Nitric Oxide and Prostacyclin
10
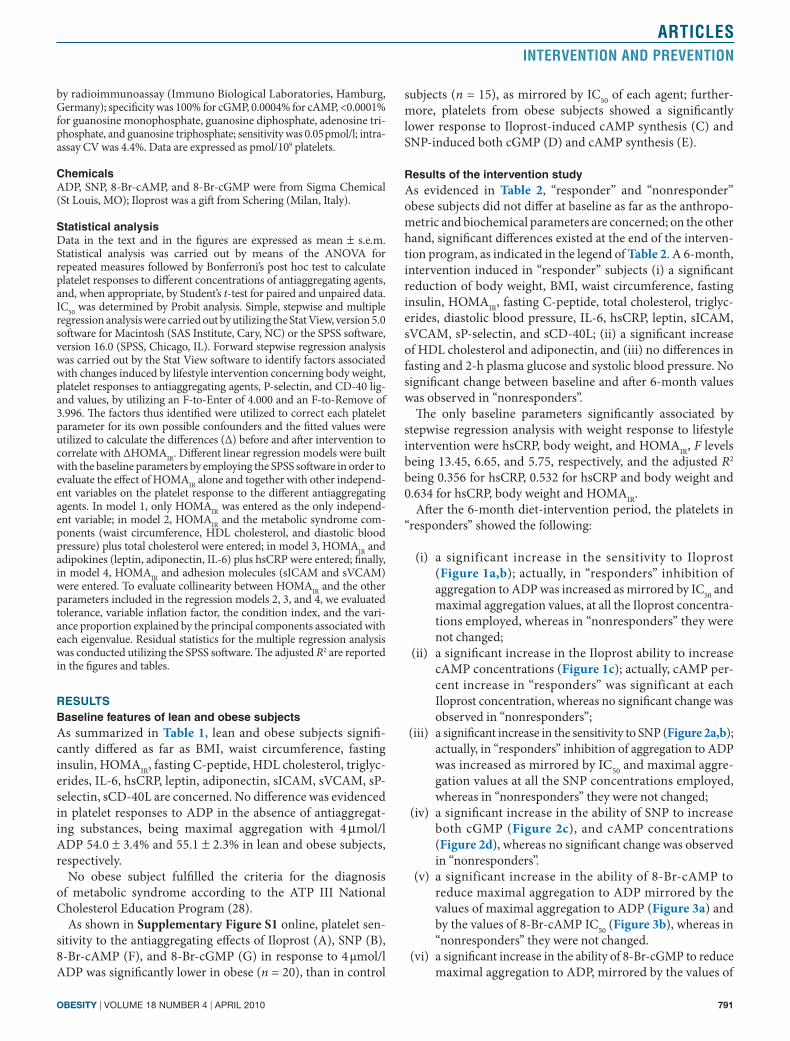
788 VOLUME 18 NUMBER 4 | APRIL 2010 | www.obesityjournal.org ARTICLES nature publishing group INTERVENTION AND PREVENTION INTRODUCTION Obesity—a classical condition of insulin resistance—is a relevant risk factor for cardiac, cerebral, and lower limb vas- cular events (1,2). e INTERHEART and the Norfolk cohort studies underlined the role of central obesity in the risk of coronary heart disease, compelling to conclude that waist circumference should be preferred to BMI in the evaluation of the cardiovascular risk (3,4). is recommendation has a biological basis. Actually, abdominal fat deposition is charac- terized by a greater ability to release cytokines and free fatty acids than subcutaneous fat deposition, and therefore is more deeply involved in the pathogenesis of both atherothrombosis and insulin resistance (5,6). Central obesity has been considered by the International Diabetes Federation as an essential component of the metabolic syndrome, a cluster of cardiovascular risk factors also including glucose and lipid abnormalities and arterial hypertension (7). Also, the role of central obesity in the pathogenesis of athero- thrombosis, however, is played independently of the other com- ponents of the metabolic syndrome, because central obesity per se induces endothelial dysfunction and a prothrombotic state at least in part attributable to platelet defects (1). Platelets play a pivotal influence in atherothrombosis not only for their central role in hemostasis, but also through the release of cytokines, chemokines, growth factors, and proin- flammatory mediators (8,9). us, platelets are also involved in inflammation, which is one of the most important patho- genetical mechanisms of atherogenesis (10). Persistent plate- let activation has been observed in obese subjects, involving an increased synthesis of proaggregating isoprostanes as a In Central Obesity, Weight Loss Restores Platelet Sensitivity to Nitric Oxide and Prostacyclin Isabella Russo 1 , Monica Traversa 1 , Katia Bonomo 1 , Alessandro De Salve 1 , Luigi Mattiello 1 , Paola Del Mese 1 , Gabriella Doronzo 1 , Franco Cavalot 1 , Mariella Trovati 1 and Giovanni Anfossi 1 Central obesity shows impaired platelet responses to the antiaggregating effects of nitric oxide (NO), prostacyclin, and their effectors—guanosine 3′,5′-cyclic monophosphate (cGMP) and adenosine 3′,5′-cyclic monophosphate (cAMP). The influence of weight loss on these alterations is not known. To evaluate whether a diet-induced body-weight reduction restores platelet sensitivity to the physiological antiaggregating agents and reduces platelet activation in subjects affected by central obesity, we studied 20 centrally obese subjects before and after a 6-month diet intervention aiming at reducing body weight by 10%, by measuring (i) insulin sensitivity (homeostasis model assessment of insulin resistance (HOMA IR )); (ii) plasma lipids; (iii) circulating markers of inflammation of adipose tissue and endothelial dysfunction, and of platelet activation (i.e., soluble CD-40 ligand (sCD-40L) and soluble P-selectin (sP-selectin)); (iv) ability of the NO donor sodium nitroprusside (SNP), the prostacyclin analog Iloprost and the cyclic nucleotide analogs 8-bromoguanosine 3′,5′-cyclic monophosphate (8-Br-cGMP) and 8-bromoadenosine 3′,5′-cyclic monophosphate (8-Br-cAMP) to reduce platelet aggregation in response to adenosine-5-diphosphate (ADP); and (v) ability of SNP and Iloprost to increase cGMP and cAMP. The 10 subjects who reached the body-weight target showed significant reductions of insulin resistance, adipose tissue, endothelial dysfunction, and platelet activation, and a significant increase of the ability of SNP, Iloprost, 8-Br-cGMP, and 8-Br-cAMP to reduce ADP-induced platelet aggregation and of the ability of SNP and Iloprost to increase cyclic nucleotide concentrations. No change was observed in the 10 subjects who did not reach the body-weight target. Changes of platelet function correlated with changes of HOMA IR . Thus, in central obesity, diet-induced weight loss reduces platelet activation and restores the sensitivity to the physiological antiaggregating agents, with a correlation with improvements in insulin sensitivity. Obesity (2010) 18, 788–797. doi:10.1038/oby.2009.302 1 Department of Clinical and Biological Sciences, Internal Medicine Unit, University of Turin, San Luigi Gonzaga Hospital, Orbassano, Italy. Correspondence: Mariella Trovati ([email protected]) Received 26 February 2009; accepted 26 July 2009; published online 15 October 2009. doi:10.1038/oby.2009.302
-
Upload
independent -
Category
Documents
-
view
1 -
download
0
Transcript of In Central Obesity, Weight Loss Restores Platelet Sensitivity to Nitric Oxide and Prostacyclin

788 VOLUME 18 NUMBER 4 | apRiL 2010 | www.obesityjournal.org
articles nature publishing group
intervention and Prevention
IntroductIonObesity—a classical condition of insulin resistance—is a relevant risk factor for cardiac, cerebral, and lower limb vas-cular events (1,2). The INTERHEART and the Norfolk cohort studies underlined the role of central obesity in the risk of coronary heart disease, compelling to conclude that waist circumference should be preferred to BMI in the evaluation of the cardiovascular risk (3,4). This recommendation has a biological basis. Actually, abdominal fat deposition is charac-terized by a greater ability to release cytokines and free fatty acids than subcutaneous fat deposition, and therefore is more deeply involved in the pathogenesis of both atherothrombosis and insulin resistance (5,6).
Central obesity has been considered by the International Diabetes Federation as an essential component of the metabolic
syndrome, a cluster of cardiovascular risk factors also including glucose and lipid abnormalities and arterial hypertension (7).
Also, the role of central obesity in the pathogenesis of athero-thrombosis, however, is played independently of the other com-ponents of the metabolic syndrome, because central obesity per se induces endothelial dysfunction and a prothrombotic state at least in part attributable to platelet defects (1).
Platelets play a pivotal influence in atherothrombosis not only for their central role in hemostasis, but also through the release of cytokines, chemokines, growth factors, and proin-flammatory mediators (8,9). Thus, platelets are also involved in inflammation, which is one of the most important patho-genetical mechanisms of atherogenesis (10). Persistent plate-let activation has been observed in obese subjects, involving an increased synthesis of proaggregating isoprostanes as a
in Central Obesity, Weight Loss Restores platelet Sensitivity to Nitric Oxide and prostacyclinIsabella Russo1, Monica Traversa1, Katia Bonomo1, Alessandro De Salve1, Luigi Mattiello1, Paola Del Mese1, Gabriella Doronzo1, Franco Cavalot1, Mariella Trovati1 and Giovanni Anfossi1
Central obesity shows impaired platelet responses to the antiaggregating effects of nitric oxide (NO), prostacyclin, and their effectors—guanosine 3′,5′-cyclic monophosphate (cGMP) and adenosine 3′,5′-cyclic monophosphate (cAMP). The influence of weight loss on these alterations is not known. To evaluate whether a diet-induced body-weight reduction restores platelet sensitivity to the physiological antiaggregating agents and reduces platelet activation in subjects affected by central obesity, we studied 20 centrally obese subjects before and after a 6-month diet intervention aiming at reducing body weight by 10%, by measuring (i) insulin sensitivity (homeostasis model assessment of insulin resistance (HOMAIR)); (ii) plasma lipids; (iii) circulating markers of inflammation of adipose tissue and endothelial dysfunction, and of platelet activation (i.e., soluble CD-40 ligand (sCD-40L) and soluble P-selectin (sP-selectin)); (iv) ability of the NO donor sodium nitroprusside (SNP), the prostacyclin analog Iloprost and the cyclic nucleotide analogs 8-bromoguanosine 3′,5′-cyclic monophosphate (8-Br-cGMP) and 8-bromoadenosine 3′,5′-cyclic monophosphate (8-Br-cAMP) to reduce platelet aggregation in response to adenosine-5-diphosphate (ADP); and (v) ability of SNP and Iloprost to increase cGMP and cAMP. The 10 subjects who reached the body-weight target showed significant reductions of insulin resistance, adipose tissue, endothelial dysfunction, and platelet activation, and a significant increase of the ability of SNP, Iloprost, 8-Br-cGMP, and 8-Br-cAMP to reduce ADP-induced platelet aggregation and of the ability of SNP and Iloprost to increase cyclic nucleotide concentrations. No change was observed in the 10 subjects who did not reach the body-weight target. Changes of platelet function correlated with changes of HOMAIR. Thus, in central obesity, diet-induced weight loss reduces platelet activation and restores the sensitivity to the physiological antiaggregating agents, with a correlation with improvements in insulin sensitivity.
Obesity (2010) 18, 788–797. doi:10.1038/oby.2009.302
1Department of Clinical and Biological Sciences, Internal Medicine Unit, University of Turin, San Luigi Gonzaga Hospital, Orbassano, Italy. Correspondence: Mariella Trovati ([email protected])
Received 26 February 2009; accepted 26 July 2009; published online 15 October 2009. doi:10.1038/oby.2009.302

obesity | VOLUME 18 NUMBER 4 | apRiL 2010 789
articlesintervention and Prevention
consequence of an increased oxidative stress (11). This fact confirms the pivotal role of reactive oxygen species in plate-let activation (11). Platelet function, however, is the result of a balance between pro- and antiaggregating mechanisms (8,12). In our laboratory, we mainly investigated the relationships between obesity and platelet sensitivity to antagonists, and we described that platelets from obese subjects are resistant to physiological antiaggregating agents, i.e., nitric oxide (NO) and prostacyclin, and to their effectors, i.e., the cyclic nucleotides guanosine 3′,5′-cyclic monophosphate (cGMP) and adenosine 3′,5′-cyclic monophosphate (cAMP) (13–15).
We observed in more detail a multistep resistance to antiag-gregation, including the ability of insulin to increase NO pro-duction (16), the ability of NO to increase cGMP synthesis, and the ability of cGMP to reduce platelet aggregation (16) in obese subjects. Similarly, we observed in obese subjects an impaired ability of prostacyclin to increase cAMP synthesis, and an impaired ability of cAMP to reduce platelet func-tion (14,15). It is known that NO increases cAMP via cGMP, because cGMP inhibits a specific cAMP phospho diesterase (16). In this light, we also observed a reduced ability of NO to increase cAMP in platelets from obese subjects (14). Other authors observed that obese subjects show a reduction in the ability of insulin to inhibit platelet interactions with col-lagen (17,18). The simultaneous presence of platelet activa-tion and platelet resistance to antiaggregating agents can be considered as a “platelet dysfunction” characterizing human obesity (19).
Interestingly, we observed that platelet resistance to the physiological antiaggregating agents is independently cor-related with a measure of insulin resistance, the homeostasis model assessment (HOMAIR) index, suggesting a close rela-tionship between platelet dysfunction and body sensitivity to insulin (14,15).
The influence of lifestyle interventions aiming to reduce body weight by diet and exercise on obesity-related health compli-cations is a matter of great interest (20). It has been observed that intentional weight loss reduces total mortality and cardio-vascular events (21), likely through a beneficial influence on lipids, such as high-density lipoprotein (HDL) cholesterol and triglycerides (22), blood pressure (23), endothelial dysfunction (24), low-grade inflammation (25), and type 2 diabetes mel-litus development (26,27).
So far, few studies have evaluated whether weight loss also modifies the prothrombotic tendency of obese subjects. It has been observed in obese women that weight loss reduces the synthesis of prothrombotic isoprostanes (11), but it is not known whether weight loss also increases platelet sensitivity to the physiological antiaggregating agents.
This study has been designed to evaluate whether a 6-month diet-intervention program aiming to reduce body weight of at least 10% in subjects affected by central obesity not only reduces insulin resistance, adipose tissue and endothelial dys-function, and inflammation, but also reduces platelet activa-tion and restores platelet sensitivity to NO and prostacyclin and to their effectors cGMP and cAMP.
Methods and ProceduressubjectsAmong the obese subjects attending our metabolic clinic to loose weight, we chose 20 consecutive subjects (9 men and 11 women, aged 39.6 ± 1.25 years), affected by central obesity—defined as waist cir-cumference >88 cm in women and 102 cm in men (28)—who were not taking any drug that could influence platelet function in the previous 4 weeks, were not smokers, did not follow diet-reduction programs during the past 6 months, did not have a family history of diabetes mellitus, and were otherwise healthy on the basis of medical history, physical examination, and standard diagnostic procedures; in particular, they did not present arterial hypertension, impaired fasting glucose, or impaired glucose tolerance. As controls for base-line parameters, we employed 15 healthy normal-weight volunteers (8 men; 7 women, aged 40.9 ± 2.1 years). Anthropometric measure-ments and biochemical parameter determinations were carried out as described below. Subjects’ characteristics are evidenced in Table 1. Patients and controls gave their informed consent to the biochemical investigations and the study was approved by our institutional review committee.
Intervention studyAfter the initial evaluation, obese patients followed our standard policy for weight reduction for 6 months, receiving detailed oral and written advices explaining how to follow a diet aiming to induce a weight reduc-tion ≥10%. All information were enforced at the subsequent monthly visits carried out by the same trained physician.
The intervention program consisted of a hypocaloric diet (1,200–1,800 kcal/day) with personal goal settings, advising to increase consumption of vegetables, fresh fruit, grains, low-fat dairy products, fish, legumes, poultry, lean meats and to avoid foods high in saturated fats. The recommended diet composition was 50–60% complex carbo-hydrates, 15–20% proteins, <30% total fat, including <10% saturated fat, 10–15% monounsaturated fat, and 5–8% polyunsaturated fat, according to the American Diabetes Association advices to reduce body weight and lower the cardiovascular risk (29), enforced by an American Heart Association Scientific Statement (30). The intervention program was mainly focused on diet, without an emphasis on the role of physical activity greater than a generic recommendation to walk for at least 30 min every day. Each subject was examined every month by the same trained examiner with clinical evaluation and measurement of blood pressure, heart rate, and anthropometric parameters. At the 6th month from the beginning of the lifestyle intervention, 10 out of the 20 obese subjects obtained the expected reduction of body weight (i.e., >10% of the initial weight). Obese subjects were therefore divided into “respond-ers” and “nonresponders”.
study designIn control subjects at baseline, and in obese subjects before and at the end of the intervention program, we measured (i) body weight, BMI, waist circumference, blood pressure; (ii) plasma glucose before and after a 75-g oral glucose tolerance test, total and HDL cholesterol, trig-lycerides, insulin, C-peptide, and HOMAIR; (iii) inflammation markers: high-sensitivity C-reactive protein (hsCRP) and soluble interleukin (IL)-6; (iv) adipocytokines: leptin and adiponectin; (v) endothelial dysfunction markers: serum soluble intracellular adhesion molecule-1 (sICAM) and soluble vascular cell adhesion molecule-1 (sVCAM); (vi) platelet activation markers: soluble P-selectin (sP-selectin) and soluble CD-40 ligand (sCD-40L); (vii) ability of the stable prostacyc-lin analog Iloprost to increase platelet cAMP; (viii) ability of the NO donor sodium nitroprusside (SNP) to increase cGMP and cAMP; (ix) ability of Iloprost, SNP, and cyclic nucleotide permeable ana-logues 8-bromoadenosine 3′,5′-cyclic monophosphate (8-Br-cAMP) and 8-bromoguanosine 3′,5′-cyclic monophosphate (8-Br-cGMP) to reduce platelet aggregation in response to adenosine-5-diphosphate (ADP).

790 VOLUME 18 NUMBER 4 | apRiL 2010 | www.obesityjournal.org
articlesintervention and Prevention
Biochemical parametersEach measurement was performed after a 12-h overnight fast. Plasma glucose, total and HDL cholesterol, and triglycerides were measured by automated chemistry by the central laboratory of our Hospital. The other parameters were measured by the laboratory of our Unit. Plasma insulin was measured by radioimmunoassay kit (Biochem Immuno System, Bologna, Italy); specificity: 100% for human insulin, 14% for human proinsulin, and 0.0002% for C-peptide and glucagon. C-peptide was measured by radioimmunoassay (Biochem Immuno System); spe-cificity: 100% for human C-peptide, 3.2% for human proinsulin, and absent for glucagon. Insulin sensitivity in the fasting state was esti-mated using HOMAIR index by the following formula: fasting plasma glucose (mmol/l) × fasting serum insulin (μU/ml) divided by 22.5 (31). HOMAIR is commonly used in clinical studies as a reliable marker of insulin resistance (32).
Serum samples for detection of markers of platelet activation, endothe-lial dysfunction, and inflammation as well as for adipocytokines were stored at −80 °C until assayed.
hsCRP was determined by a immunonephelometric kit (CardioPhase hsCRP from Dade Behring Marburg, Marburg, Germany); detection
limit was 0.17 mg/l, and measuring range 0.175–1,100 mg/l; the interassay coefficients of variation (CVs) at 11.5 and 47.9 mg/l were 6.1 and 3.5%, respectively. Soluble IL-6 was determined by Bender MedSystems (Vienna, Austria); lowest limit of detection was 0.92 pg/ml, intra-assay CV was 6.2%, interassay CV was 7.0%, and no crossreactivity with other proteins was detected.
Adiponectin was measured by enzyme immunoassay kit from R&D (Minneapolis, MN): lowest detection limit was 0.246 ng/ml, intra-assay CV was 3.4%, interassay CV was 5.8%, and no crossreactivity with other proteins was detected. Leptin was measured by enzyme immunoassay kit from Cayman Chemical (Ann Arbor, MI): lowest detection limit was 1 ng/ml, intra-assay CV was 5.6%, interassay CV was 8.5%, and no cross-reactivity with other proteins was detected.
sICAM and sVCAM were measured by the enzyme-linked immuno-sorbent assay kits of Bender MedSystems. For sICAM, lowest detection limit was 2.17 ng/ml, intra-assay CV was 9.5%, interassay CV was 12.9%, and no crossreactivity with other proteins was detected. For sVCAM, lowest detection limit was 0.59 ng/ml, intra-assay CV was 3.1%, interassay CV was 5.2%, and no crossreactivity with other proteins was detected.
sP-selectin and sCD-40L were measured by the enzyme-linked immu-nosorbent assay kits from Bender MedSystems. For serum sP-selectin, lowest detection limit was 0.85 ng/ml, intra-assay CV was 6.5%, interassay CV was 5.5%, and no crossreactivity with other proteins was detected, in particular with sE-selectin and sL-selectin. For serum sCD-40L, lowest detection limit was 0.062 ng/ml, intra-assay CV was 6.8%, interassay CV was 14.2%, and no crossreactivity with other proteins was detected.
Platelet aggregation studiesFor studies concerning platelet sensitivity to antiaggregating agents, a venous blood sample was withdrawn without stasis after overnight fast, and anticoagulated with 3.8% sodium citrate, pH 7.4 (vol/vol: 1/9). Platelet-rich plasma was obtained by a 20-min centrifugation at 100 g at room temperature; platelet-poor plasma was prepared by a further 10-min centrifugation at 2,000 g. Platelet counts were determined on a S-plus Coulter Counter (Coulter Electronics, Hertfordshire, UK). Platelet aggregation was carried out according to Born’s method (33) using a model 500 Chrono Log aggregometer S (Chrono-Log, Havertown, PA) with constant stirring at 900 r.p.m. Aggregation was induced in platelet-rich plasma by ADP at the final concentration of 4 μmol/l, without or with preincubation with (i) Iloprost (3 min, final concentrations: 0.31–5 nmol/l); (ii) SNP (3 min, final concentrations: 10–100 μmol/l); (iii) 8-Br-cAMP (3–20 min, final concentrations: 100–500 μmol/l), and (iv) 8-Br-cGMP (3–20 min, final concentrations: 100–500 μmol/l). Maximal aggregation to ADP and half-maximal inhibitory concentration (IC50) of each antagonist were evaluated as described (15,16).
Platelet content of cyclic nucleotidesPlatelet cAMP was measured in platelet-rich plasma samples (500 μl) incubated at 37 °C for 3 min without stirring in the presence of 0.31–5 nmol/l of Iloprost or 10–100 μmol/l of SNP. Platelet reactions were stopped with 30% trichloroacetic acid (100 μl). Precipitated pro-teins were removed by a 20-min centrifugation at 2,000g at 4 °C. After addition of 1 mol/l HCl (100 μl), the supernatant was submitted to 10 extractions with ethylic ether to remove trichloroacetic acid. Samples were then lyophilized and kept at −70 °C until determination. cAMP measurement was carried out by radioimmunoassay (Diagnostic Products, Los Angeles, CA); specificity of 100% for cAMP, <0.1% for cGMP, <0.001% for adenosine monophosphate, guanosine diphos-phate, adenosine triphosphate, and guanosine triphosphate; sensitiv-ity <0.01 pmol/0.1 ml; intra- and interassay CVs were 4.8%. Data are expressed as pmol/109 platelets.
Platelet cGMP was measured in platelet-rich plasma samples (500 μl) incubated at 37 °C for 3 min without stirring in the pres-ence of 10–100 μmol/l SNP. Platelet reactions were stopped with 30% trichloroacetic acid (100 μl) and samples were processed as previously indicated for cAMP detection. cGMP measurement was carried out
table 1 Baseline features of the investigated subjects
Lean control subjects (N = 15)
Obese subjects (N = 20) P
M/F 7/8 9/11
Age (years) 40.9 ± 2.1 39.6 ± 1.25 NS
BMI (kg/m2) 22.3 ± 1.6 34.7 ± 1.0 <0.0001
Waist circumference (cm)
82.1 ± 2.9 102.9 ± 2.2 <0.0001
Fasting glucose (mmol/l)
4.7 ± 0.3 5.1 ± 0.2 NS
Fasting insulin (µU/ml)
7.6 ± 2.3 29.4 ± 2.86 <0.0001
HOMAIR 1.4 ± 0.2 6.6 ± 0.7 <0.0001
Fasting C-peptide (ng/ml)
2.2 ± 0.3 3.8 ± 0.2 <0.0001
Total cholesterol (mmol/l)
4.7 ± 0.3 5.2 ± 0.2 NS
HDL cholesterol (mmol/l)
1.6 ± 0.1 1.2 ± 0.1 <0.008
Triglycerides (mmol/l)
1.14 ± 0.02 1.6 ± 0.15 <0.004
SBP/DBP (mm Hg) 128.0 ± 3/ 83 ± 2
128.3 ± 2.0/ 82.5 ± 1.2
NS
IL-6 (pg/ml) 2.0 ± 0.1 5.8 ± 0.4 <0.0001
hsCRP (mg/l) 1.4 ± 0.1 5.3 ± 0.1 <0.0001
Leptin (ng/ml) 12.4 ± 0.8 55.8 ± 6.4 <0.0001
Adiponectin (µg/ml) 12.9 ± 0.6 5.6 ± 0.5 <0.0001
sICAM (ng/ml) 130.5 ± 4.9 223.9 ± 11.4 <0.0001
sVCAM (ng/ml) 419.2 ± 27.2 1,137.1 ± 72.9 <0.0001
sP-Selectin (ng/ml) 214.7 ± 11.7 820.7 ± 52.7 <0.0001
sCD-40L (ng/ml) 2.0 ± 0.2 5.5 ± 0.3 <0.0001
DBP, diastolic blood pressure; HDL, high-density lipoprotein; HOMAIR, homeo-stasis model assessment of insulin resistance; hsCRP, high-sensitivity C-reactive protein; IL-6, interleukin-6; SBP, systolic blood pressure; sCD-40L, soluble CD-40 ligand; sICAM, soluble intracellular adhesion molecule-1; sP-selectin; soluble P-selectin; sVCAM, soluble vascular cell adhesion molecule-1.
obesity | VOLUME 18 NUMBER 4 | apRiL 2010 791
articlesintervention and Prevention
by radio immunoassay (Immuno Biological Laboratories, Hamburg, Germany); specificity was 100% for cGMP, 0.0004% for cAMP, <0.0001% for guanosine monophosphate, guanosine diphosphate, adenosine tri-phosphate, and guanosine triphosphate; sensitivity was 0.05 pmol/l; intra-assay CV was 4.4%. Data are expressed as pmol/109 platelets.
chemicalsADP, SNP, 8-Br-cAMP, and 8-Br-cGMP were from Sigma Chemical (St Louis, MO); Iloprost was a gift from Schering (Milan, Italy).
statistical analysisData in the text and in the figures are expressed as mean ± s.e.m. Statistical analysis was carried out by means of the ANOVA for repeated measures followed by Bonferroni’s post hoc test to calculate platelet responses to different concentrations of antiaggregating agents, and, when appropriate, by Student’s t-test for paired and unpaired data. IC50 was determined by Probit analysis. Simple, stepwise and multiple regression analysis were carried out by utilizing the Stat View, version 5.0 software for Macintosh (SAS Institute, Cary, NC) or the SPSS software, version 16.0 (SPSS, Chicago, IL). Forward stepwise regression analysis was carried out by the Stat View software to identify factors associated with changes induced by lifestyle intervention concerning body weight, platelet responses to antiaggregating agents, P-selectin, and CD-40 lig-and values, by utilizing an F-to-Enter of 4.000 and an F-to-Remove of 3.996. The factors thus identified were utilized to correct each platelet parameter for its own possible confounders and the fitted values were utilized to calculate the differences (Δ) before and after intervention to correlate with ΔHOMAIR. Different linear regression models were built with the baseline parameters by employing the SPSS software in order to evaluate the effect of HOMAIR alone and together with other independ-ent variables on the platelet response to the different antiaggregating agents. In model 1, only HOMAIR was entered as the only independ-ent variable; in model 2, HOMAIR and the metabolic syndrome com-ponents (waist circumference, HDL cholesterol, and diastolic blood pressure) plus total cholesterol were entered; in model 3, HOMAIR and adipokines (leptin, adiponectin, IL-6) plus hsCRP were entered; finally, in model 4, HOMAIR and adhesion molecules (sICAM and sVCAM) were entered. To evaluate collinearity between HOMAIR and the other parameters included in the regression models 2, 3, and 4, we evaluated tolerance, variable inflation factor, the condition index, and the vari-ance proportion explained by the principal components associated with each eigenvalue. Residual statistics for the multiple regression analysis was conducted utilizing the SPSS software. The adjusted R2 are reported in the figures and tables.
resultsBaseline features of lean and obese subjectsAs summarized in Table 1, lean and obese subjects signifi-cantly differed as far as BMI, waist circumference, fasting insulin, HOMAIR, fasting C-peptide, HDL cholesterol, triglyc-erides, IL-6, hsCRP, leptin, adiponectin, sICAM, sVCAM, sP-selectin, sCD-40L are concerned. No difference was evidenced in platelet responses to ADP in the absence of antiaggregat-ing substances, being maximal aggregation with 4 μmol/l ADP 54.0 ± 3.4% and 55.1 ± 2.3% in lean and obese subjects, respectively.
No obese subject fulfilled the criteria for the diagnosis of meta bolic syndrome according to the ATP III National Cholesterol Education Program (28).
As shown in Supplementary Figure S1 online, platelet sen-sitivity to the antiaggregating effects of Iloprost (A), SNP (B), 8-Br-cAMP (F), and 8-Br-cGMP (G) in response to 4 µmol/l ADP was significantly lower in obese (n = 20), than in control
subjects (n = 15), as mirrored by IC50 of each agent; further-more, platelets from obese subjects showed a significantly lower response to Iloprost-induced cAMP synthesis (C) and SNP-induced both cGMP (D) and cAMP synthesis (E).
results of the intervention studyAs evidenced in Table 2, “responder” and “nonresponder” obese subjects did not differ at baseline as far as the anthropo-metric and biochemical parameters are concerned; on the other hand, significant differences existed at the end of the interven-tion program, as indicated in the legend of Table 2. A 6-month, intervention induced in “responder” subjects (i) a significant reduction of body weight, BMI, waist circumference, fasting insulin, HOMAIR, fasting C-peptide, total cholesterol, triglyc-erides, diastolic blood pressure, IL-6, hsCRP, leptin, sICAM, sVCAM, sP-selectin, and sCD-40L; (ii) a significant increase of HDL cholesterol and adiponectin, and (iii) no differences in fasting and 2-h plasma glucose and systolic blood pressure. No significant change between baseline and after 6-month values was observed in “nonresponders”.
The only baseline parameters significantly associated by stepwise regression analysis with weight response to lifestyle intervention were hsCRP, body weight, and HOMAIR, F levels being 13.45, 6.65, and 5.75, respectively, and the adjusted R2 being 0.356 for hsCRP, 0.532 for hsCRP and body weight and 0.634 for hsCRP, body weight and HOMAIR.
After the 6-month diet-intervention period, the platelets in “responders” showed the following:
(i) a significant increase in the sensitivity to Iloprost ( Figure 1a,b); actually, in “responders” inhibition of aggregation to ADP was increased as mirrored by IC50 and maximal aggregation values, at all the Iloprost concentra-tions employed, whereas in “nonresponders” they were not changed;
(ii) a significant increase in the Iloprost ability to increase cAMP concentrations (Figure 1c); actually, cAMP per-cent increase in “responders” was significant at each Iloprost concentration, whereas no significant change was observed in “nonresponders”;
(iii) a significant increase in the sensitivity to SNP ( Figure 2a,b); actually, in “responders” inhibition of aggregation to ADP was increased as mirrored by IC50 and maximal aggre-gation values at all the SNP concentrations employed, whereas in “nonresponders” they were not changed;
(iv) a significant increase in the ability of SNP to increase both cGMP (Figure 2c), and cAMP concentrations ( Figure 2d), whereas no significant change was observed in “nonresponders”.
(v) a significant increase in the ability of 8-Br-cAMP to reduce maximal aggregation to ADP mirrored by the values of maximal aggregation to ADP (Figure 3a) and by the values of 8-Br-cAMP IC50 (Figure 3b), whereas in “ nonresponders” they were not changed.
(vi) a significant increase in the ability of 8-Br-cGMP to reduce maximal aggregation to ADP, mirrored by the values of

792 VOLUME 18 NUMBER 4 | apRiL 2010 | www.obesityjournal.org
articlesintervention and Prevention
maximal aggregation to ADP, which were lower at all the 8-Br-cGMP concentrations employed (Figure 4a) and by values of 8-Br-cGMP IC50 (Figure 4b), whereas in “non-responders” they were not changed.
The forward stepwise regression, carried out to identify the different factors associated with platelet responses to the antiaggregating agents and their respective weight, evaluated as adjusted R2, showed that the following parameters pre-sented a significant association: for IC50 Iloprost, HOMAIR: F level 17.24, adjusted R2 0.39; for IC50 SNP, HOMAIR, and hsCRP: F levels 9.08 and 5.94, respectively, and adjusted R2 0.34 with HOMAIR, 0.48 with HOMAIR + hsCRP; for IC50 8-Br-cAMP, HOMAIR, IL-6, adiponectin, leptin, ICAM, and total cholesterol: F levels 15.65, 5.35, 10.26, 10.9, 17.20, and 8.29, respectively, and adjusted R2 0.52 with HOMAIR, 0.63 with HOMAIR + IL-6, 0.69 with HOMAIR + IL-6 + adiponectin,
0.77 with HOMAIR + IL-6 + adiponectin + leptin, 0.84 with HOMAIR + IL-6 + adiponectin + leptin + ICAM, 0.88 with HOMAIR + IL-6 + adiponectin + leptin + ICAM + total cho-lesterol; for IC50 8-Br-cGMP, HOMAIR and IL-6: F levels 13.59 and 7.37, respectively, and adjusted R2 0.42 with HOMAIR, 0.57 with HOMAIR and IL-6.
Thus, for all the four dependent variables, HOMAIR was a uniform predictor of platelet responses to all antiaggregating agents.
Table 3 shows the linear regression models carried out con-sidering the baseline data of the 20 obese subjects. Compared to model 1, in model 2 the total predicted variance slightly increased for Iloprost and SNP, but decreased for 8-Br-cAMP and 8-Br-cGMP; in model 3 the total predicted variance increased for SNP, 8-Br-cAMP, and 8-Br-cGMP, but decreased for Iloprost; in model 4 again, the total predicted variance increased for SNP, 8-Br-cAMP, and 8-Br-cGMP, but decreased for Iloprost.
table 2 anthropometric and biochemical parameters of responder and nonresponder subjects at baseline and after 6-month intervention
Responders Nonresponders
Before After P Before After P
N 10 10
M/F 5/5 5/5
Age (years) 38.4 ± 3.4 40.9 ± 1.8
Weight (kg) 98.3 ± 3.5 84.7 ± 1.8 <0.0001 91.3 ± 4.0 92.5 ± 4.07 NS
BMI (kg/m2) 35 ± 1.5 30.3 ± 1.1 <0.0001 34.4 ± 1.3 35.4 ± 1.3 NS
Waist circumference (cm) 102.7 ± 3.5 92.8 ± 2.4 <0.0001 103.1 ± 2.8 105.6 ± 2.4 NS
Glucose 0′ (mmol/l) 5.3 ± 0.3 4.7 ± 0.1 NS 5.1 ± 0.4 5.4 ± 0.3 NS
Glucose 120′ (mmol/l) 5.4 ± 0.7 4.6 ± 0.2 NS 5.5 ± 0.6 6 ± 0.5 NS
Fasting insulin (µU/ml) 34.4 ± 4.9 16.2 ± 1.9 <0.003 24.4 ± 2.3 28.7 ± 3.2 NS
HOMAIR 7.7 ± 1.2 3.3 ± 0.4 <0.002 5.5 ± 0.7 6.8 ± 0.9 NS
Fasting C-peptide (ng/ml) 3.8 ± 0.2 3.0 ± 0.2 <0.0001 3.9 ± 0.4 4.1 ± 0.4 NS
Total cholesterol (mmol/l) 5.3 ± 0.2 4.6 ± 0.2 <0.002 5.1 ± 0.3 4.8 ± 0.3 NS
HDL cholesterol (mmol/l) 1.1 ± 0.08 1.4 ± 0.1 <0.0001 1.2 ± 0.07 1.2 ± 0.08 NS
Triglycerides (mmol/l) 1.6 ± 0.3 1.0 ± 0.1 <0.008 1.5 ± 0.1 1.7 ± 0.2 NS
SBP/DBP (mm Hg) 129 ± 3/82 ± 2 120.5 ± 3/78.5 ± 2 NS/<0.05 127.5 ± 3/83 ± 2 133.5 ± 3/87 ± 2 NS/NS
IL-6 (pg/ml) 5.6 ± 0.6 3.7 ± 0.5 <0.0001 6.0 ± 0.7 6.3 ± 0.7 NS
hsCRP (mg/l) 6.5 ± 1.5 3.5 ± 0.8 <0.0001 4.0 ± 1.0 5.0 ± 1.0 NS
Leptin (ng/ml) 54.9 ± 10.9 23.3 ± 5.9 < 0.001 56.6 ± 7.5 58.1 ± 7.1 NS
Adiponectin (µg/ml) 5.3 ± 1.2 9.3 ± 0.3 <0.021 6.8 ± 0.6 6.0 ± 0.5 NS
sICAM (ng/ml) 225.4 ± 15.72 121.9 ± 20.13 <0.0001 221.9 ± 15.7 238.2 ± 30.2 NS
sVCAM (ng/ml) 1,093.8 ± 77.8 685.1 ± 54.9 <0.0001 1,168.6 ± 122.14 1,055.6 ± 131.9 NS
sP-Selectin (ng/ml) 808.6 ± 67.3 425.6 ± 63.7 <0.0001 825.6 ± 78.8 793.2 ± 81.7 NS
sCD-40L (ng/ml) 5.9 ± 0.5 2.1 ± 0.5 <0.0001 5.3 ± 0.4 5.1 ± 0.5 NS
At baseline responder and nonresponder subjects did not differ as far as the anthropometric and biochemical parameters are concerned. At the end of intervention the following differences were observed (Students’ t-test for unpaired data): waist circumference P < 0.001; glucose 0′ P < 0.04; glucose 120′ P < 0.018; fasting insulin P < 0.003; HOMAIR P < 0.002; fasting C-peptide P < 0.024; triglycerides P < 0.006; SBP P < 0.007; DBP P < 0.008; IL-6 P < 0.007; leptin P < 0.001; adiponectin P < 0.0001; sICAM P < 0.005; sVCAM P < 0.018; sP-selectin P < 0.002; sCD-40L P < 0.0001.DBP, diastolic blood pressure; HDL, high-density lipoprotein; HOMAIR, homeostasis model assessment of insulin resistance; hsCRP, high-sensitivity C-reactive protein; IL-6, interleukin-6; SBP, systolic blood pressure; sCD-40L, soluble CD-40 ligand; sICAM, soluble intracellular adhesion molecule-1; sP-selectin; soluble P-selectin; sVCAM, soluble vascular cell adhesion molecule-1.

obesity | VOLUME 18 NUMBER 4 | apRiL 2010 793
articlesintervention and Prevention
HOMAIR was the only parameter significantly related with the IC50 of Iloprost, SNP, 8-Br-cAMP, and 8-Br-cGMP in all mod-els (with the exception of model 3 for SNP), i.e., both when considered alone (model 1) and when associated with waist circumference, total cholesterol, HDL cholesterol, and diastolic blood pressure (model 2) or with leptin, adiponectin, IL-6, and hsCRP (model 3), or with sICAM and sVCAM (model 4). In model 3 of SNP, HOMAIR was borderline significant (P = 0.07). By looking at the R2 of the different models, one can observe that (i) the explained variance is highest for 8-Br-cAMP in all models compared to other antiaggregating agents; (ii) the explained variance increases in model 2 (metabolic syndrome components + total cholesterol) for Iloprost and SNP; (iii) the explained variance increases in model 3 (cytokines and hsCRP) for SNP, 8-Br-cAMP, and 8-Br-cGMP; (iv) in model 4 (adhe-sion molecules) the explained variance is slightly decreased for
Iloprost and slightly increased for SNP, 8-Br-cAMP, and 8-Br-cGMP; (v) the effect of HOMAIR is highest in models 1, 2, and 4, whereas in model 3 the effect of HOMAIR is lower; (vi) the effect of the other independent variables was inconstant and occa-sionally significant only in model 3 for SNP, 8-Br-cAMP, and 8-Br-cGMP. Collinearity statistics in models 2, 3, and 4 showed that tolerance was >0.5 and variable inflation factor < 2 for all
0
0
00
***
**
0.31Iloprost (nmol/l)
0.62 2.5
100
200
300
Pla
tele
t cA
MP
(% o
f bas
al v
alue
s)
400
500
00 0.31
Iloprost (nmol/l)0.62 2.5
100
200
300
Pla
tele
t cA
MP
(% o
f bas
al v
alue
s)
400
500
0.5
Ilopr
ost I
C-5
0 (n
mol
/l)
1
1.5
2
2.5
0
0.5
Ilopr
ost I
C-5
0 (n
mol
/l)
1
1.5
2
2.5
0 0.31Iloprost (nmol/l)
Responders Nonresponders
0.62 2.5
20
40
60
80
100 ***
**
**
Max
imal
agg
rega
tion
to A
DP
(% o
f bas
al v
alue
s)
00 0.31
Iloprost (nmol/l)0.62 2.5
20
40
60
80
100
Max
imal
agg
rega
tion
to A
DP
(% o
f bas
al v
alue
s)
a
b
Before After 6 months
c
Figure 1 Iloprost platelet antiaggregating effects in response to 4 µmol/l ADP (a: maximal aggregation and b: IC50) and (c) Iloprost ability to increase platelet cAMP before and after a 6-month diet intervention in obese subjects “responders” (n = 10) and “nonresponders” (n = 10). Significances were tested, when appropriate, with unpaired Student’s t-test and with ANOVA for repeated measures followed by Bonferroni’s t-test. Unpaired Student’s t-test in all panels: *P < 0.02; **P < 0.0001. ANOVA for repeated measures—in “responders”: a—before intervention, P = 0.0001, Bonferroni’s t-test P < 0.05 for 0.62 and 2.5 nmol/l; after intervention, P = 0.0001, Bonferroni’s t-test: P < 0.05 for each concentration; c—before intervention, P = 0.0001, Bonferroni’s t-test P < 0.05 for 2.5 nmol/l; after intervention, P = 0.0001, Bonferroni’s t-test P < 0.05 for 0.62 and 2.5 nmol/l. In “nonresponders”: a—before and after intervention, P = 0.0001, Bonferroni’s t-test P < 0.05 for 2.5 nmol/l; c—before intervention, P = 0.0001, Bonferroni’s t-test P < 0.05 for 2.5 nmol/l; after intervention, P = 0.0001, Bonferroni’s t-test P < 0.05 for 0.62 and 2.5 nmol/l. ADP, adenosine-5-diphosphate; cAMP, adenosine 3′,5′-cyclic monophosphate; IC50, inhibitory concentration.
0
0
10
20
30
40
0
0
50
100
150
200
250
300
0
*****
* *****
***
**
10SNP (µmol/l)
40 100
0 10SNP (µmol/l)
40 100
100
200
300
Pla
tele
t cG
MP
(% o
f bas
al v
alue
s)P
late
let c
AM
P(%
of b
asal
val
ues)
0
50
100
150
200
250
300
0 10SNP (µmol/l)
40 100
Pla
tele
t cA
MP
(% o
f bas
al v
alue
s)
400
500
00 10
SNP (µmol/l)40 100
100
200
300
Pla
tele
t cG
MP
(% o
f bas
al v
alue
s)
400
500
SN
P IC
-50
(µm
ol/l)
0
10
20
30
40
SN
P IC
-50
(µm
ol/l)
0 10SNP (µmol/l)
Responders Nonresponders
40 100
20
40
60
80
100
***
******
***
Max
imal
agg
rega
tion
to A
DP
(% o
f bas
al v
alue
s)
00 10
SNP (µmol/l)40 100
20
40
60
80
100
Max
imal
agg
rega
tion
to A
DP
(% o
f bas
al v
alue
s)
a
b
Before After 6 months
c
d
Figure 2 SNP platelet antiaggregating effects in response to 4 µmol/l ADP (a: maximal aggregation and b: IC50) and SNP ability to increase both (c) cGMP and (d) cAMP before and after a 6-month diet intervention in obese subjects “responders” (n = 10) and “nonresponders” (n = 10). Significances were tested, when appropriate, with unpaired Student’s t-test and with ANOVA for repeated measures followed by Bonferroni’s t-test. Unpaired Student’s t-test: *P < 0.04; **P < 0.005; ***P < 0.0001. ANOVA for repeated measures—in “responders”: a and c—before and after intervention, P = 0.0001, Bonferroni’s t-test P < 0.05 for each concentration; d—before intervention, P = 0.0001, Bonferroni’s t-test P < 0.05 for 40 and 100 µmol/l; after intervention, P = 0.0001, Bonferroni’s t-test P < 0.05 for each concentration. In “nonresponders”: a—before and after intervention, P = 0.0001, Bonferroni’s t-test P < 0.05 for each concentration; c—before intervention, P = 0.0001, Bonferroni’s t-test P < 0.05 for 40 and 100 µmol/l; after intervention, P = 0.0001, Bonferroni’s t-test P < 0.05 for 100 µmol/l; d—before and after intervention, P = 0.0001, Bonferroni’s t-test P < 0.05 for 40 and 100 µmol/l. ADP, adenosine-5-diphosphate; cAMP, adenosine 3′,5′-cyclic monophosphate; cGMP, guanosine 3′,5′-cyclic monophosphate; IC50, inhibitory concentration; SNP, sodium nitroprusside.

794 VOLUME 18 NUMBER 4 | apRiL 2010 | www.obesityjournal.org
articlesintervention and Prevention
the included variables and that in none of the models a condi-tion index >15 and an explained variance >0.50 in more than one independent variable could be observed. Residual statistics showed that both crude and standardized residual average was always equal to 0.000 and that in no case the residuals were >3 s.d. The Durbin–Watson test values for Iloprost, SNP, 8-Br-cAMP, and 8-Br-cGMP were, respectively, as follows: in model 1, 1.962, 1.982, 1.467, and 0.996; in model 2, 1.876, 1.821, 1.199, and 0.985; in model 3, 1.662, 1.901, 1.347, and 0.913; and in model 4, 1.883, 1.959, 1.741, and 1.630.
In obese subjects (n = 20), significant correlations were found between differences before and after the intervention (i.e., Δ values) of HOMAIR and Δ values of IC50 of Iloprost, SNP, 8-Br-cAMP, and 8-Br-cGMP, and of sP-selectin and sCD-40L (see Supplementary Figure S2 online). Platelet parameters were corrected for the confounders identified for each of them by forward stepwise regression.
dIscussIonThis study confirms that central obesity is characterized not only by insulin resistance, subclinical inflammation, and endothe-lial dysfunction (5,6,34), but also by platelet dysfunction (8,11,13–19,35), showing increased serum concentrations of sCD-40L and sP-selectin (reliable markers of platelet activa-tion) and reduced platelet sensitivity to the major physiologi-cal antiaggregating molecules, i.e., NO and prostacyclin, and to their effectors, i.e., cGMP and cAMP.
Furthermore, the study shows for the first time that a modest weight loss obtained by a diet intervention corrects not only insulin resistance, subclinical inflammation, adipose tissue, and endothelial dysfunction—as already described (24,25)—but also peculiar aspects of platelet dysfunction.
Actually, when subjects lost ≥10% of their initial body weight, they presented (i) significant reductions in serum
0
20
40
60
80
100
120
0
20
40
60
80
100
3 min
10 min
20 min
Max
imal
agg
rega
tion
to A
DP
(%
of b
asal
val
ues)
120
0
0
100
200
300
8-B
r-cA
MP
IC-5
0 (µ
mol
/l)
400
500
0
100
200
300
8-B
r-cA
MP
IC-5
0 (µ
mol
/l)
400
500
0 100
**
***
***
***
***
*
*
8-Br-cAMP (µmol/l)
Responders Nonresponders
1,000
20
40
60
80
100
120
a
0
20
40
60
80
100
120
0
20
40
60
80
100M
axim
al a
ggre
gatio
n to
AD
P (
% o
f bas
al v
alue
s)
120
00 100
8-Br-cAMP (µmol/l)1,000
20
40
60
80
100
120
b
Before After 6 months
Figure 3 8-Br-cAMP platelet antiaggregating effects in response to 4 µmol/l ADP (a: maximal aggregation and b: IC50) before and after a 6-month diet intervention in obese subjects “responders” (n = 10) and “nonresponders” (n = 10). Significances were tested, when appropriate, with unpaired Student’s t-test and with ANOVA for repeated measures followed by Bonferroni’s t-test. Unpaired Student’s t-test: *P < 0.02; **P < 0.008; ***P < 0.0001. ANOVA for repeated measures—in “responders”: a at 3, 10, and 20 min—before intervention, P = 0.0001, Bonferroni’s t-test P < 0.05 for 1,000 µmol/l; after intervention, P = 0.0001, Bonferroni’s t-test P < 0.05 for each concentration. In “nonresponders”: a at 3, 10, and 20 min—before and after intervention, P = 0.0001, Bonferroni’s t-test P < 0.05 for 1,000 µmol/l. ADP, adenosine-5-diphosphate; 8-Br-cAMP, 8-bromoadenosine 3′,5′-cyclic monophosphate; IC50, inhibitory concentration.
0
20
40
60
80
100
0
20
40
60
80
3 min
10 min
20 min
Max
imal
agg
rega
tion
to A
DP
(%
of b
asal
val
ues)
100
0
0
100
200
300
8-B
r-cG
MP
IC-5
0 (µ
mol
/l)400
500
0
100
200
300
8-B
r-cG
MP
IC-5
0 (µ
mol
/l)
400
500
0 100
*
**
***
***
***
*
*
8-Br-cGMP (µmol/l)
Responders Nonresponders
1,000
20
40
60
80
100
a
0
20
40
60
80
100
0
20
40
60
80
Max
imal
agg
rega
tion
to A
DP
(%
of b
asal
val
ues)
100
00 100
8-Br-cGMP (µmol/l)1,000
20
40
60
80
100
b
Before After 6 months
Figure 4 8-Br-cGMP platelet antiaggregating effects in response to 4 µmol/l ADP (a: maximal aggregation, and b: IC50) before and after a 6-month diet intervention in obese subjects “responders” (n = 10) and “nonresponders” (n = 10). Significances were tested with unpaired Student’s t-test and, when appropriate, with ANOVA for repeated measures followed by Bonferroni’s t-test. Unpaired Student’s t-test: *P < 0.02; **P < 0.002; ***P < 0.0001. ANOVA for repeated measures—in “responders”: a at 3, 10, and 20 min—before and after intervention, P = 0.0001, Bonferroni’s t-test P < 0.05 for each concentration. In “nonresponders”: a at 3 min—before and after intervention, P = 0.0001, Bonferroni’s t-test P < 0.05 for 1,000 µmol/l; a at 10 and 20 min—before and after intervention, P = 0.0001, Bonferroni’s t-test P < 0.05 for each concentration. ADP, adenosine-5-diphosphate; 8-Br-cGMP, 8-bromoguanosine 3′,5′-cyclic monophosphate; IC50, inhibitory concentration.

obesity | VOLUME 18 NUMBER 4 | apRiL 2010 795
articlesintervention and Prevention
concentrations of sCD-40L and sP-selectin; (ii) a significant increase in the ability of prostacyclin, NO, cAMP, and cGMP to reduce platelet responses to ADP; (iii) a significant increase in the ability of prostacyclin and NO to induce the synthesis of antiaggregating cyclic nucleotides. On the contrary, failure to reduce body weight was accompanied by failure to modify the above-mentioned parameters. Because all the obese subjects underwent the same program of diet intervention, it is likely that failure to reduce body weight was due to lack of compli-ance to lifestyle recommendations.
This study confirms that impairment of platelet responses to platelet antagonists in obese subjects is correlated with HOMAIR, suggesting a tight link to insulin resistance per se (14,15). It is known that platelets are targets of insulin action and site of insulin resistance, as we have extensively reviewed elsewhere (36,37).
In particular, the insulin receptors in human platelets have a concentration per surface area similar to that described in other cells and their number and affinity are reduced in insulin-resistant states, as reviewed (36); furthermore, also in platelets tyrosine phosphorylation of insulin receptor is accompanied by activation of the insulin–receptor substrate-1/PI3-K/Akt path-way, a phenomenon impaired in insulin-resistant states (18). We previously observed that insulin reduces platelet sensitivity to all the aggregating agents, both in vitro and in vivo, that this
effect depends on the insulin ability to activate the NO/cGMP/PKG pathway—which is a PI3-K-mediated event—and that patients affected by the insulin-resistant states of obesity and type 2 diabetes with obesity are resistant to this insulin action (16,38–40). In obese subjects and in type 2 diabetic patients, other authors observed an impairment of the insulin-in-duced reduction of platelet interactions with collagen (17,18). In the light of these observations, it is intriguing to observe that HOMAIR is the parameter more strongly associated with platelet responses to antiaggregating agents, even taking into consideration the role of the different parameters usually asso-ciated with the insulin-resistance syndrome (i.e., cytokines, adipocytokines, lipids, arterial hypertension, adhesion mol-ecules). The forward stepwise regression, however, shows that HOMAIR alone explains not >35–50% of the impaired platelet response to the antiaggregating agents in central obesity, com-pelling to conclude that insulin resistance per se is deeply—but not exclusively involved in the platelet dysfunction observed in central obesity. It is interesting to observe that HOMAIR remains strongly associated with platelet resistance to antiag-gregating agents also when adiponectin is considered. This fact should be emphasized, as adiponectin, owing to its insulin-sen-sitizing, anti-inflammatory, and anti atherosclerotic properties, is considered the “key adipokine in the metabolic syndrome” (41) and acts as an endogenous antithrombotic factor. Actually,
table 3 linear regression models in which the response to the different antiaggregating agents was entered as dependent variable and the indicated factors as independent variables
Iloprost SNP 8-Br-cAMP 8-Br-cGMP
R2 β P R2 β P R2 β P R2 β P
Model 1 0.388 0.002 0.343 0.004 0.517 0.0001 0.416 0.001
HOMAIR 0.648 0.002 0.614 0.004 0.736 0.0001 0.668 0.001
Model 2 0.445 0.018 0.456 0.016 0.506 0.008 0.302 0.070
HOMAIR 0.731 0.001 0.703 0.001 0.766 0.0001 0.679 0.004
Waist circumference
−0.128 0.497 0.237 0.213 0.146 0.412 −0.126 0.548
Total cholesterol 0.086 0.647 −0.315 0.104 −0.265 0.146 −0.145 0.491
HDL cholesterol 0.322 0.096 0.244 0.193 −0.023 0.894 0.076 0.714
Diastolic blood pressure
0.245 0.216 0.130 0.498 0.046 0.799 0.011 0.959
Model 3 0.267 0.092 0.443 0.018 0.760 0.0001 0.505 0.009
HOMAIR 0.624 0.020 0.400 0.075 0.432 0.007 0.638 0.006
Leptin 0.165 0.451 0.136 0.474 0.318 0.020 0.001 0.995
Adiponectin 0.039 0.870 −0.138 0.515 −0.385 0.013 0.074 0.709
Interleukin-6 −0.008 0.971 0.138 0.464 0.285 0.033 0.428 0.026
hsCRP 0.132 0.534 0.408 0.040 0.064 0.599 −0.127 0.468
Model 4 0.325 0.025 0.389 0.012 0.535 0.001 0.480 0.004
HOMAIR 0.670 0.004 0.593 0.006 0.661 0.001 0.567 0.005
sICAM 0.100 0.645 0.007 0.974 −0.292 0.118 −0.363 0.070
sVCAM 0.019 0.927 0.327 0.117 0.108 0.539 0.260 0.174
The adjusted R2 of the models are shown.8-Br-cAMP, 8-bromo-cyclic AMP; 8-Br-cGMP, 8-bromo-cyclic GMP; HOMAIR, homeostasis model assessment of insulin resistance; hsCRP, high-sensitivity C-reactive protein; sICAM, soluble intracellular adhesion molecule-1; SNP, sodium nitroprussiate; sVCAM, soluble vascular cell adhesion molecule-1.

796 VOLUME 18 NUMBER 4 | apRiL 2010 | www.obesityjournal.org
articlesintervention and Prevention
adiponectin knockout mice show an accelerated thrombus formation on carotid arterial injury and an enhanced platelet aggregation, which are attenuated with adenovirus-mediated supplementation of adiponectin (42). Our study therefore sug-gest that the relationships between HOMAIR and platelet dys-function are not (or not entirely) mediated by adiponectin.
Furthermore, this study also shows for the first time that changes in platelet-related parameters induced by weight loss correlate with changes in insulin sensitivity. This is true both for platelet sensitivity to antagonists, and for the circulating levels of sCD-40L and sP-selectin.
CD-40L is a trimeric transmembrane protein, member of the tumor necrosis factor family (43), stored in resting plate-lets and exposed on their surface after activation; its binding to CD-40 molecule at the endothelial surface activates inflam-mation and induces CD-40L shedding by proteolytic cleavage, with release of the soluble fragment (sCD-40L), which is con-sidered as a platelet-derived marker of the cardiovascular risk able to link thrombosis and inflammation (44). sP-selectin is another protein derived from activated platelets able to pre-dict cardiovascular events (45). Therefore, this study suggests that the reduction of sCD-40L and of sP-selectin is one of the mechanisms by which weight loss reduces the cardiovascular risk, likely through an increase of insulin sensitivity.
As previously mentioned, subjects affected by central obesity involved in our study did not meet the criteria necessary to be defined affected by the metabolic syndrome, even if they presented—when compared to lean controls—insulin resist-ance and significant elevations of the parameters characteriz-ing the syndrome itself. In these obese subjects, diet-induced weight loss restored a wide spectrum of cardiovascular risk factors, and platelet dysfunction, in particular.
Furthermore, our study adds elements also to the current debate concerning the link between insulin resistance and cardio vascular disease, because it shows that—in patients affected by central obesity—insulin resistance is strictly asso-ciated with platelet dysfunction and that changes in insulin sensitivity correlate with changes in platelet function. In particular, owing to the role of platelets in atherothrombosis (8,9), the results of this study clarify one of the pathophysio-logical mechanisms explaining why HOMAIR index represents a relevant cardiovascular risk factor (46).
In conclusion, this study suggests that platelet dysfunction should be added to the wide list of vascular abnormalities linked to the reduced insulin action (34,35) and clearly shows that a diet-induced body-weight reduction >10% restores plate-let function by improving insulin sensitivity. The results of this study, therefore, in agreement with other evidences (30,47,48), further support the key role of diet-induced weight loss in the reduction of the cardiometabolic risk.
suPPleMentary MaterIalSupplementary material is linked to the online version of the paper at http://www.nature.com/oby
acknowledgMentsThis study was supported by a grant from italian Ministero dell’istruzione, Università e Ricerca (MiUR) COFiN 2004 within the project “The molecular
basis of insulin resistance and their importance in the pathogenesis of the alterations of the vessel wall” (Local Coordinator: Giovanni anfossi, National Coordinator: amalia Bosia), and by a grant from Regione piemonte to Giovanni anfossi.
dIsclosure The authors declared no conflict of interest.
© 2009 The Obesity Society
reFerences1. Grundy SM. Obesity, metabolic syndrome, and coronary atherosclerosis.
Circulation 2002;105:2696–2698.2. McGill HC Jr, McMahan CA, Herderick EE et al. Pathobiological
Determinants of Atherosclerosis in Youth (PDAY) Research Group. Obesity accelerates the progression of coronary atherosclerosis in young men. Circulation 2002;105:2712–2718.
3. Yusuf S, Hawken S, Ôunpuu S et al. INTERHEART Study Investigators: effect of potentially modifiable risk factors associated with myocardial infarction in 52 countries (the INTERHEART study): case–control study. Lancet 2004;364:937–952.
4. Canoy D, Boekholdt SM, Wareham N et al. Body fat distribution and risk of coronary heart disease in men and women in the European Prospective Investigation Into Cancer and Nutrition in Norfolk cohort: a population-based prospective study. Circulation 2007;116:2933–2943.
5. Van Gaal LF, Mertens IL, De Block CE. Mechanisms linking obesity with cardiovascular disease. Nature 2006;444:875–880.
6. Després JP, Lemieux I. Abdominal obesity and metabolic syndrome. Nature 2006;444:881–887.
7. Alberti KG, Zimmet P, Shaw J; IDF Epidemiology Task Force Consensus Group. The metabolic syndrome–a new worldwide definition. Lancet 2005;366:1059–1062.
8. Davì G, Patrono C. Platelet activation and atherothrombosis. N Engl J Med 2007;357:2482–2494.
9. Colwell JA, Nesto RW. The platelet in diabetes: focus on prevention of ischemic events. Diabetes Care 2003;26:2181–2188.
10. Ross R. Atherosclerosis–an inflammatory disease. N Engl J Med 1999;340:115–126.
11. Davì G, Guagnano MT, Ciabattoni G et al. Platelet activation in obese women: role of inflammation and oxidant stress. JAMA 2002;288: 2008–2014.
12. Jin RC, Voetsch B, Loscalzo J. Endogenous mechanisms of inhibition of platelet function. Microcirculation 2005;12:247–258.
13. Anfossi G, Mularoni EM, Burzacca S et al. Platelet resistance to nitrates in obesity and obese NIDDM, and normal platelet sensitivity to both insulin and nitrates in lean NIDDM. Diabetes Care 1998;21: 121–126.
14. Anfossi G, Russo I, Massucco P et al. Impaired synthesis and action of antiaggregating cyclic nucleotides in platelets from obese subjects: possible role in platelet hyperactivation in obesity. Eur J Clin Invest 2004;34:482–489.
15. Russo I, Del Mese P, Doronzo G et al. Platelet resistance to the antiaggregatory cyclic nucleotides in central obesity involves reduced phosphorylation of vasodilator-stimulated phosphoprotein. Clin Chem 2007;53:1053–1060.
16. Trovati M, Mularoni EM, Burzacca S et al. Impaired insulin-induced platelet antiaggregating effect in obesity and in obese NIDDM patients. Diabetes 1995;44:1318–1322.
17. Westerbacka J, Yki-Järvinen H, Turpeinen A et al. Inhibition of platelet-collagen interaction: an in vivo action of insulin abolished by insulin resistance in obesity. Arterioscler Thromb Vasc Biol 2002;22:167–172.
18. Ferreira IA, Mocking AI, Feijge MA et al. Platelet inhibition by insulin is absent in type 2 diabetes mellitus. Arterioscler Thromb Vasc Biol 2006;26:417–422.
19. Bhatt DL. What makes platelets angry: diabetes, fibrinogen, obesity, and impaired response to antiplatelet therapy? J Am Coll Cardiol 2008;52: 1060–1061.
20. Poirier P, Giles TD, Bray GA et al. Obesity and cardiovascular disease: pathophysiology, evaluation, and effect of weight loss. Arterioscler Thromb Vasc Biol 2006;26:968–976.
21. Williamson DF, Thompson TJ, Thun M et al. Intentional weight loss and mortality among overweight individuals with diabetes. Diabetes Care 2000;23:1499–1504.

obesity | VOLUME 18 NUMBER 4 | apRiL 2010 797
articlesintervention and Prevention
22. Poobalan A, Aucott L, Smith WC et al. Effects of weight loss in overweight/obese individuals and long-term lipid outcomes–a systematic review. Obes Rev 2004;5:43–50.
23. Stevens VJ, Obarzanek E, Cook NR et al. Trials for the Hypertension Prevention Research Group. Long-term weight loss and changes in blood pressure: results of the Trials of Hypertension Prevention, phase II. Ann Intern Med 2001;134:1–11.
24. Sciacqua A, Candigliota M, Ceravolo R et al. Weight loss in combination with physical activity improves endothelial dysfunction in human obesity. Diabetes Care 2003;26:1673–1678.
25. Esposito K, Pontillo A, Di Palo C et al. Effect of weight loss and lifestyle changes on vascular inflammatory markers in obese women: a randomized trial. JAMA 2003;289:1799–1804.
26. Tuomilehto J, Lindström J, Eriksson JG et al. Finnish Diabetes Prevention Study Group. Prevention of type 2 diabetes mellitus by changes in lifestyle among subjects with impaired glucose tolerance. N Engl J Med 2001;344:1343–1350.
27. Knowler WC, Barrett-Connor E, Fowler SE et al. Diabetes Prevention Program Research Group. Reduction in the incidence of type 2 diabetes with lifestyle intervention or metformin. N Engl J Med 2002;346:393–403.
28. Expert Panel on Detection, Evaluation, and Treatment of High Blood Cholesterol in Adults. Executive summary of the third report of the National Cholesterol Education Program (NCEP) Expert Panel on Detection, Evaluation, and Treatment of High Blood Cholesterol in Adults (Adult Treatment Panel III). JAMA 2001;285:2486–2497.
29. Klein S, Sheard NF, Pi-Sunyer X et al.; American Diabetes Association. Weight management through lifestyle modification for the prevention and management of type 2 diabetes: rationale and strategies. A statement of the American Diabetes Association, the North American Association for the Study of Obesity, and the American Society for Clinical Nutrition. Diabetes Care 2004;27:2067–2073.
30. Lichtenstein AH, Appel LJ, Brands M et al. Summary of American Heart Association Diet and Lifestyle Recommendations revision 2006. Arterioscler Thromb Vasc Biol 2006;26:2186–2191.
31. Matthews DR, Hosker JP, Rudenski AS et al. Homeostasis model assessment: insulin resistance and beta-cell function from fasting plasma glucose and insulin concentrations in man. Diabetologia 1985;28:412–419.
32. Haffner SM, Miettinen H, Stern MP. The homeostasis model in the San Antonio Heart Study. Diabetes Care 1997;20:1087–1092.
33. Born GV. Aggregation of blood platelets by adenosine diphosphate and its reversal. Nature 1962;194:927–929.
34. Dandona P, Aljada A, Chaudhuri A, Mohanty P, Garg R. Metabolic syndrome: a comprehensive perspective based on interactions between obesity, diabetes, and inflammation. Circulation 2005;111:1448–1454.
35. Alessi MC, Juhan-Vague I. Metabolic syndrome, haemostasis and thrombosis. Thromb Haemost 2008;99:995–1000.
36. Trovati M, Anfossi G. Insulin, insulin resistance and platelet function: similarities with insulin effects on cultured vascular smooth muscle cells. Diabetologia 1998;41:609–622.
37. Anfossi G, Trovati M. Pathophysiology of platelet resistance to anti-aggregating agents in insulin resistance and type 2 diabetes: implications for anti-aggregating therapy. Cardiovasc Hematol Agents Med Chem 2006;4:111–128.
38. Trovati M, Anfossi G, Cavalot F et al. Insulin directly reduces platelet sensitivity to aggregating agents. Studies in vitro and in vivo. Diabetes 1988;37:780–786.
39. Trovati M, Massucco P, Mattiello L et al. Insulin increases guanosine-3′,5′-cyclic monophosphate in human platelets. A mechanism involved in the insulin anti-aggregating effect. Diabetes 1994;43: 1015–1019.
40. Trovati M, Massucco P, Mattiello L et al. The insulin-induced increase of guanosine-3′,5′-cyclic monophosphate in human platelets is mediated by nitric oxide. Diabetes 1996;45:768–770.
41. Whitehead JP, Richards AA, Hickman IJ, Macdonald GA, Prins JB. Adiponectin–a key adipokine in the metabolic syndrome. Diabetes Obes Metab 2006;8:264–280.
42. Kato H, Kashiwagi H, Shiraga M et al. Adiponectin acts as an endogenous antithrombotic factor. Arterioscler Thromb Vasc Biol 2006;26: 224–230.
43. van Kooten C, Banchereau J. CD40-CD40 ligand. J Leukoc Biol 2000;67: 2–17.
44. Vishnevetsky D, Kiyanista VA, Gandhi PJ. CD40 ligand: a novel target in the fight against cardiovascular disease. Ann Pharmacother 2004;38: 1500–1508.
45. Burger PC, Wagner DD. Platelet P-selectin facilitates atherosclerotic lesion development. Blood 2003;101:2661–2666.
46. Bonora E, Formentini G, Calcaterra F et al. HOMA-estimated insulin resistance is an independent predictor of cardiovascular disease in type 2 diabetic subjects: prospective data from the Verona Diabetes Complications Study. Diabetes Care 2002;25:1135–1141.
47. Grundy SM, Cleeman JI, Daniels SR et al.; American Heart Association. Diagnosis and management of the metabolic syndrome: an American Heart Association/National Heart, Lung, and Blood Institute Scientific Statement. Circulation 2005;112:2735–2752.
48. Lichtenstein AH, Appel LJ, Brands M et al.; American Heart Association Nutrition Committee. Diet and lifestyle recommendations revision 2006: a scientific statement from the American Heart Association Nutrition Committee. Circulation 2006;114:82–96.