Cell-ECM traction force modulates endogenous tension at cell-cell contacts

Accepted Manuscript
Title: Everolimus restores gefitinib sensitivity in resistantnon-small cell lung cancer cell lines
Authors: Silvia La Monica, Maricla Galetti, Roberta R.Alfieri, Andrea Cavazzoni, Andrea Ardizzoni, Marcello Tiseo,Marzia Capelletti, Matteo Goldoni, Sara Tagliaferri, AntonioMutti, Claudia Fumarola, Mara Bonelli, Daniele Generali,Pier Giorgio Petronini
PII: S0006-2952(09)00340-2DOI: doi:10.1016/j.bcp.2009.04.033Reference: BCP 10170
To appear in: BCP
Received date: 4-3-2009Revised date: 28-4-2009Accepted date: 30-4-2009
Please cite this article as: La Monica S, Galetti M, Alfieri RR, Cavazzoni A,Ardizzoni A, Tiseo M, Capelletti M, Goldoni M, Tagliaferri S, Mutti A, FumarolaC, Bonelli M, Generali D, Petronini PG, Everolimus restores gefitinib sensitivity inresistant non-small cell lung cancer cell lines, Biochemical Pharmacology (2008),doi:10.1016/j.bcp.2009.04.033
This is a PDF file of an unedited manuscript that has been accepted for publication.As a service to our customers we are providing this early version of the manuscript.The manuscript will undergo copyediting, typesetting, and review of the resulting proofbefore it is published in its final form. Please note that during the production processerrors may be discovered which could affect the content, and all legal disclaimers thatapply to the journal pertain.
peer
-004
9726
8, v
ersi
on 1
- 3
Jul 2
010
Author manuscript, published in "Biochemical Pharmacology 78, 5 (2009) 460" DOI : 10.1016/j.bcp.2009.04.033

Page 1 of 35
Accep
ted
Man
uscr
ipt
1 2 3 4 5 6 7 8 9 10 11 12 13 14 15 16 17 18 19 20 21 22 23 24 25 26 27 28 29 30 31 32 33 34 35 36 37 38 39 40 41 42 43 44 45 46 47 48 49 50 51 52 53 54 55 56 57 58 59 60 61 62 63 64 65
Everolimus restores gefitinib sensitivity in resistant non-small cell lung cancer cell lines
Silvia La Monica1*, Maricla Galetti1*, Roberta R. Alfieri1#, Andrea Cavazzoni,1 Andrea
Ardizzoni2, Marcello Tiseo2, Marzia Capelletti2, Matteo Goldoni3, Sara Tagliaferri3, Antonio
Mutti3, Claudia Fumarola,1 Mara Bonelli1, Daniele Generali4, Pier Giorgio Petronini1
1Department of Experimental Medicine, University of Parma, Parma, Italy
2Division of Medical Oncology, University Hospital of Parma, Italy
3Department of Clinical Medicine, Nephrology and Health Science, Laboratory of Industrial
Toxicology, University Hospital of Parma, Italy
4Centro di Medicina Molecolare, Istituti ad indirizzo oncologico Ospitalieri di Cremona,
Cremona, Italy
* These authors contributed in equal part to this study
Corresponding author: Roberta R. Alfieri, Department of Experimental Medicine,
University of Parma, Via Volturno 39 43100 Parma, Italy Phone: +39-521-033766 Fax: +39-
521-033742. E-mail: [email protected]
* Manuscriptpe
er-0
0497
268,
ver
sion
1 -
3 Ju
l 201
0

Page 2 of 35
Accep
ted
Man
uscr
ipt
1 2 3 4 5 6 7 8 9 10 11 12 13 14 15 16 17 18 19 20 21 22 23 24 25 26 27 28 29 30 31 32 33 34 35 36 37 38 39 40 41 42 43 44 45 46 47 48 49 50 51 52 53 54 55 56 57 58 59 60 61 62 63 64 65
2
ABSTRACT
The epidermal growth factor receptor (EGFR) is a validated target for therapy in non-small
cell lung cancer (NSCLC). Most patients, however, either do not benefit or develop resistance
to specific inhibitors of the EGFR tyrosine kinase activity, such as gefitinib or erlotinib. The
mammalian target of rapamycin (mTOR) is a key intracellular kinase integrating proliferation
and survival pathways and has been associated with resistance to EGFR tyrosine kinase
inhibitors. In this study, we assessed the effects of combining the mTOR inhibitor everolimus
(RAD001) with gefitinib on a panel of NSCLC cell lines characterized by gefitinib-resistance
and able to maintain pS6K phosphorylation after gefitinib treatment.
Everolimus plus gefitinib induced a significant decrease in the activation of MAPK and
mTOR signaling pathways downstream of EGFR and resulted in a growth-inhibitory effect
rather than in an enhancement of cell death. A synergistic effect was observed in those cell
lines characterized by high proliferative index and low doubling time. These data suggest that
treatment with everolimus and gefitinib might be of value in the treatment of selected NSCLC
patients that exhibit high tumor proliferative activity.
Keywords: Lung cancer, EGFR, gefitinib, everolimus
peer
-004
9726
8, v
ersi
on 1
- 3
Jul 2
010

Page 3 of 35
Accep
ted
Man
uscr
ipt
1 2 3 4 5 6 7 8 9 10 11 12 13 14 15 16 17 18 19 20 21 22 23 24 25 26 27 28 29 30 31 32 33 34 35 36 37 38 39 40 41 42 43 44 45 46 47 48 49 50 51 52 53 54 55 56 57 58 59 60 61 62 63 64 65
3
1. Introduction
Lung cancer is the main cause of cancer deaths in the developed world in both men and
women, and non-small cell lung cancer (NSCLC) accounts for about 80-85% of all lung
cancers [1]. Current treatments, including chemotherapy, radiotherapy and surgery, have
provided only limited improvement in the natural history of the disease. New treatments are
thus needed to improve survival of NSCLC patients [2].
Inhibition of the Epidermal Growth Factor Receptor (EGFR) pathway has been proposed as a
novel molecular targeted approach for NSCLC. Two main strategies targeting EGFR have
been developed: small-molecule inhibitors of the tyrosine kinase domain (tyrosine kinase
inhibitors [TKIs], as erlotinib and gefitinib), and monoclonal antibody (cetuximab), directed
against the extracellular domain of EGFR, that inhibits its phosphorylation/activation and
stimulates internalization [3].
Clinical data have shown that 10-20% of patients with refractory advanced NSCLC responded
to gefitinib or erlotinib [4]. A higher probability of response appears to be associated with
certain biological and clinical characteristics (such as adenocarcinoma histotype, female sex,
never smoking status and Asian ethnic origin) and with biological features of the tumor [5].
In particular, molecular analysis showed that in most cases, responders harbored specific
mutations in the region that encodes the catalytic domain of EGFR [6].
By contrast, acquired resistance to EGFR TKIs involves in same cases the recurrent T790M
mutation, which affects the catalytic domain of the kinase weakening the interaction of the
inhibitor with its target [7]. Tumor cells can develop other mechanisms of resistance to EGFR
TKIs such as the activation of alternative tyrosine kinase receptors (IGF-1R), amplification of
the MET gene and constitutive activation of signaling pathways downstream of EGFR (i.e. K-
RAS mutations) [8, 9].
peer
-004
9726
8, v
ersi
on 1
- 3
Jul 2
010

Page 4 of 35
Accep
ted
Man
uscr
ipt
1 2 3 4 5 6 7 8 9 10 11 12 13 14 15 16 17 18 19 20 21 22 23 24 25 26 27 28 29 30 31 32 33 34 35 36 37 38 39 40 41 42 43 44 45 46 47 48 49 50 51 52 53 54 55 56 57 58 59 60 61 62 63 64 65
4
Two major intracellular signaling pathways activated by EGFR, the PI3K/AKT/mTOR and
the RAS/RAF/MAPK cascades, have a central role in controlling cell survival and modulating
cell growth and proliferation [10]. These pathways represent potential novel therapeutic
targets.
NSCLC cell lines responsive to EGFR TKIs with growth arrest or apoptosis show a down-
regulation of the PI3K/AKT/mTOR pathway [11]. However, deregulation of the AKT-
dependent pathway has been well documented in a variety of human tumors [12] and has been
associated with resistance to EGFR TKIs in NSCLC cell lines [13]. Deregulation of the
PI3K/AKT/mTOR pathway could result from several alterations, including PI3K isoform
gene amplification, activating mutations of PI3K subunits, AKT gene amplification and
overexpression, as well as loss of function of PTEN [8, 14]. Frequent AKT activation and
mTOR phosphorylation were found in 51% of NSCLC patients and in 74% of NSCLC cell
lines [15].
The inhibition of mammalian target of rapamycin mTOR signaling pathway could be a
promising therapeutic option. Everolimus (RAD001) is an orally bioavailable derivative of
rapamycin that is in current use as a post-transplant immunosuppressive agent and has been
shown to inhibit the proliferation of tumor cell growth in preclinical studies, and phase I/II
clinical trials in lung cancer are under way. In particular, at a daily dose of 10 mg, Everolimus
was reported to be active and safe in pretreated advanced NSCLC patients [16, 17]. The
crucial role of the constitutive activation of the PI3K/AKT pathway in the development and
maintenance of an EGFR-resistant phenotype supports the hypothesis that a combination of
EGFR TKIs and mTOR inhibitors may be the best choice for treatment. Clinical trials testing
this strategy in advanced NSCLC are ongoing and only preliminary results are available [18-
20].
peer
-004
9726
8, v
ersi
on 1
- 3
Jul 2
010

Page 5 of 35
Accep
ted
Man
uscr
ipt
1 2 3 4 5 6 7 8 9 10 11 12 13 14 15 16 17 18 19 20 21 22 23 24 25 26 27 28 29 30 31 32 33 34 35 36 37 38 39 40 41 42 43 44 45 46 47 48 49 50 51 52 53 54 55 56 57 58 59 60 61 62 63 64 65
5
To better support in vivo studies and to further clarify their interaction, we assessed the effects
of combining the mTOR inhibitor everolimus with gefitinib on an extended panel of NSCLC
cell lines characterized by gefitinib resistance.
peer
-004
9726
8, v
ersi
on 1
- 3
Jul 2
010

Page 6 of 35
Accep
ted
Man
uscr
ipt
1 2 3 4 5 6 7 8 9 10 11 12 13 14 15 16 17 18 19 20 21 22 23 24 25 26 27 28 29 30 31 32 33 34 35 36 37 38 39 40 41 42 43 44 45 46 47 48 49 50 51 52 53 54 55 56 57 58 59 60 61 62 63 64 65
6
2. Materials and methods
2.1 Cell culture
The human NSCLC cell lines H292, H322, H460, H1299, H1975, H596, H1650, Calu-1,
Calu-3, SKMES-1 and SKLU-1 were cultured as recommended. All media were
supplemented with 2 mM glutamine, 10% fetal bovine serum (FBS Gibco, Life
Technologies). Cell lines were from the American Type Culture Collection (Manassas, VA,
USA) and were maintained under standard cell culture conditions at 37°C in a water-saturated
atmosphere of 5% CO2 in air.
2.2 Drug treatment
Gefitinib (ZD1839/ Iressa) was synthesized as described elsewhere [21]. Everolimus
(RAD001) was provided by Novartis International AG (Basel, Switzerland). In all assays, the
drugs were dissolved in DMSO immediately before the addition to cell cultures. The
concentration of DMSO never exceeded 0.1% (v/v) and equal amounts of the solvent were
added to control cells.
2.3 Antibodies and reagents
Monoclonal anti-EGFR, polyclonal anti-phospho-EGFR (tyr1068), polyclonal anti-phospho-
mTOR (ser2248), polyclonal anti-phospho-AKT (ser273), polyclonal anti-AKT, polyclonal
anti-phospho-S6K (thr389), polyclonal anti-S6K, monoclonal anti-phospho-p44/42 MAPK,
monoclonal anti-p44/42 MAPK, polyclonal anti-PI3K, polyclonal anti-PTEN antibodies were
from Cell Signaling Technology (Beverly, MA, USA). Monoclonal anti-actin (AC-40)
antibody was from Sigma-Aldrich (St. Louis, MO, USA). Horseradish peroxidase-conjugated
(HRP) secondary antibodies and the enhanced chemiluminescence system (ECL) were from
peer
-004
9726
8, v
ersi
on 1
- 3
Jul 2
010

Page 7 of 35
Accep
ted
Man
uscr
ipt
1 2 3 4 5 6 7 8 9 10 11 12 13 14 15 16 17 18 19 20 21 22 23 24 25 26 27 28 29 30 31 32 33 34 35 36 37 38 39 40 41 42 43 44 45 46 47 48 49 50 51 52 53 54 55 56 57 58 59 60 61 62 63 64 65
7
Millipore (Millipore, MA, USA). Reagents for electrophoresis and blotting analysis were
obtained from BIO-RAD Laboratories.
2.4 Western blot analysis
Procedures for protein extraction, solubilization, and protein analysis by 1-D PAGE are
described elsewhere [22]. Briefly, 30-50 µg proteins from lysates were resolved by 5-15%
SDS-PAGE and transferred to PDVF membranes. The membranes were then incubated with
primary antibody, washed and then incubated with HRP-anti-mouse or HRP-anti-rabbit
antibodies. Immunoreactive bands were visualized using an enhanced chemiluminescence
system.
2.5 Determination of cell growth
Cell number was evaluated by cell counting in a Burker hemocytometer by trypan blue
exclusion and by crystal violet staining as described [23]. In brief, cells were fixed with 1%
formaldehyde and stained with 0.1% crystal violet in PBS. The unbound dye was removed by
washing with water. Bound crystal violet was solubilized with 0.2% TritonX-100 in PBS.
Light extinction which increases linearly with the cell number was analyzed at 570 nm.
Proliferation rates were estimated by the growth rate quotient as calculated by the equation:
GRQ= (N-N0)/ t*1/N0; doubling time (hr) was calculated according to the formula
t*ln(2)/ln(N/N0), where N is the final cell number; N0 is the initial cell number and t is the
time elapsed between the two counting.
MTT and colony formation by viable cells were determined as described elsewhere [24].
2.6 Detection of apoptosis
peer
-004
9726
8, v
ersi
on 1
- 3
Jul 2
010

Page 8 of 35
Accep
ted
Man
uscr
ipt
1 2 3 4 5 6 7 8 9 10 11 12 13 14 15 16 17 18 19 20 21 22 23 24 25 26 27 28 29 30 31 32 33 34 35 36 37 38 39 40 41 42 43 44 45 46 47 48 49 50 51 52 53 54 55 56 57 58 59 60 61 62 63 64 65
8
Apoptosis was assessed by: (a) morphology on stained (Hoechst 33342, PI) or unstained cells
using light-, phase contrast- and fluorescence-microscopy; (b) activation of caspase-3
(detection of cleavage products), by Western Blotting procedure as previously described [24].
2.7 Statistical Analysis
Using a non-linear regression fit method (Levemberg-Marquardt algorithm), we calculated
the dose-response curves of single compounds from the Hill function [1]:
[1]
where %IN is the % growth inhibition, %IN0 the amplitude of the signal (e.g. the saturation
growth inhibition value), k is the value where %IN was the half of %IN0 , and n the
cooperativity index, which takes into account of possible affinity changes of target sites [25].
In the case that %IN0 did not reach 100%, we calculated from the fitting parameters the value
of IC50 as that point in which 50% growth inhibition was expected by fitting curve.
Under the hypothesis that everolimus and gefitinib bind at different target sites and can be
considered as independent, to study the combined effects of drugs we used the Bliss
independence criterion for in vitro co-exposure.
The Bliss criterion is expressed by the following equation:
E(x,y) = E(x) + E(y) – E(x)*E(y), [2]
where E(x) is the effect of the concentration x of the first compound (between 0 and 1), E(y)
the same for the second compound at concentration y, and E(x,y) is the combined effect .
)(%% 0 nn
n
xk
xININ
peer
-004
9726
8, v
ersi
on 1
- 3
Jul 2
010

Page 9 of 35
Accep
ted
Man
uscr
ipt
1 2 3 4 5 6 7 8 9 10 11 12 13 14 15 16 17 18 19 20 21 22 23 24 25 26 27 28 29 30 31 32 33 34 35 36 37 38 39 40 41 42 43 44 45 46 47 48 49 50 51 52 53 54 55 56 57 58 59 60 61 62 63 64 65
9
If the combination effect is higher than the expected value from [2], the interaction is
synergistic, while if this effect is lower, the interaction is antagonistic. Otherwise, the effect is
additive and there is no interaction between drugs.
To test the differences between experimental and theoretical points, we applied the method
suggested by Goldoni and Johansson [26]. Briefly, the theoretical value was calculated by the
experimental points of single dose-response curves [E(x) and E(y), respectively], and its SD
was estimated by error propagation of experimental SD calculated separately on E(x) and
E(y). Finally, the significance of the differences between theoretical and experimental values
was assessed by Student t tests [26]. For all non-linear fits, Origin 6.0 (Originlab,
Northampton, USA) was used. For all the statistical tests, SPSS 15.0 (SPSS, Chicago, USA)
was used. A p value of 0.05 was always considered as significant.
peer
-004
9726
8, v
ersi
on 1
- 3
Jul 2
010

Page 10 of 35
Accep
ted
Man
uscr
ipt
1 2 3 4 5 6 7 8 9 10 11 12 13 14 15 16 17 18 19 20 21 22 23 24 25 26 27 28 29 30 31 32 33 34 35 36 37 38 39 40 41 42 43 44 45 46 47 48 49 50 51 52 53 54 55 56 57 58 59 60 61 62 63 64 65
10
3. Results
The IC50 values for gefitinib in the 11 NSCLC cell lines were determined by MTT assay as
previously reported [24, 27]; cells showing IC50<1 M were considered sensitive (H322,
H292, Calu-3) and cell lines with IC50>7 M (SKLU-1, Calu-1, H1650, H596, H1975,
H1299, SKMES-1, H460) were considered resistant (Table 1).
Cell lines were also characterized for EGFR, K-RAS, PI3K gene and PTEN protein status. The
H1975 cell line carrying the L858R and T790M mutations was resistant to gefitinib [7]; the
H1650 cell line, despite harboring a delE746_A750 activating mutation in the exon 19 of the
EGFR gene, was resistant to gefitinib and erlotinib as previously reported [28-30]; K-RAS
mutations were found in four of the tested resistant cell lines.
We did not observe any basal expression of PTEN protein in the H1650 cell line as also
reported by Janmaat et al [31].
We first evaluated the effect of gefitinib on EGFR autophosphorylation on Calu-3 (sensitive)
and H1650 and SKLU-1 (both resistant) cell lines. As shown in Fig. 1A, in all the cell lines
tested, EGF stimulation induced a significant phosphorylation of tyr1068 as evaluated by
Western blot analysis. Gefitinib inhibited EGFR autophosphorylation starting from 0.01 M
in Calu-3 and H1650 and from 0.1 M in SKLU-1 cells. At 1 M the inhibition was almost
complete in both sensitive and resistant cell lines indicating that other mechanisms were
involved in the different sensitivity to gefitinib. Moreover, EGFR levels were not related to
gefitinib responsiveness, for example Calu-3, a sensitive cell line showed similar EGFR levels
to those of SKMES-1, a highly resistant cell line (see Fig. 1B).
We then analyzed (Fig. 1B) the AKT/mTOR and MAPK pathways in cells exposed to 1 M
gefitinib, a concentration that completely inhibits EGFR autophosphorylation. In the sensitive
cell lines Calu-3, H292, H322, gefitinib inhibited the phosphorylation of p44/42 MAPK, AKT
peer
-004
9726
8, v
ersi
on 1
- 3
Jul 2
010

Page 11 of 35
Accep
ted
Man
uscr
ipt
1 2 3 4 5 6 7 8 9 10 11 12 13 14 15 16 17 18 19 20 21 22 23 24 25 26 27 28 29 30 31 32 33 34 35 36 37 38 39 40 41 42 43 44 45 46 47 48 49 50 51 52 53 54 55 56 57 58 59 60 61 62 63 64 65
11
and S6K; in contrast, in the H460, SKMES-1, H1299, H596 and H1650 cell lines, gefitinib
inhibited the phosphorylation of p44/42 MAPK but had little influence on S6K
phosphorylation. The T790M mutation in the H1975 cell line conferred resistance to gefitinib
enhancing the receptor catalytic activity [32], indeed in this cell line no difference was
observed between untreated and gefitinib-treated cells. Surprisingly, in both Calu-1 and
SKLU-1 (resistant cell lines) gefitinib was effective in reducing the activity of the two
signaling pathways analyzed.
We selected the five cell lines (H460, H596, H1299, H1650, SKMES-1) characterized by
maintaining S6K phosphorylation after gefitinib treatment, and we evaluated the effect of
everolimus on the AKT/mTOR pathway and on cancer cell growth.
The effect of everolimus on the mTOR signaling pathway is shown in Fig. 2A. In cells
exposed for 24 hr to 100 nM everolimus, S6K phosphorylation was completely inhibited,
whereas p-p44/42 MAPK were not affected. A concomitant increase in AKT phosphorylation
was observed in H460, H596 and SKMES-1 cells. We then determined cell number by crystal
violet staining on cells treated for 6 days with increasing concentrations of drug from 0.01 to
100 nM. As shown in Fig. 2B, everolimus inhibited in a dose-dependent manner cell
proliferation, although to different extents in the different cell models. No apoptotic
morphology was observed even when the concentration of everolimus was increased to 1 M
(result not shown). It is of note that SKMES-1 and H1650, showing higher basal level of p-
AKT, were highly sensitive to everolimus.
To further explore the relationship between the inhibition of AKT/mTOR signaling and the
different sensitivity to everolimus, we examined p-AKT, p-S6K, and p-p44/42 MAPK in
H1299 (IC50: 2.3 nM) and in SKMES-1 (IC50: 0.14 nM) exposed to different concentrations of
everolimus, ranging from 0.01 to 100 nM (Fig. 2C). The phosphorylation of S6K was
inhibited by everolimus in a dose-dependent manner with an almost complete inhibition at 1
peer
-004
9726
8, v
ersi
on 1
- 3
Jul 2
010

Page 12 of 35
Accep
ted
Man
uscr
ipt
1 2 3 4 5 6 7 8 9 10 11 12 13 14 15 16 17 18 19 20 21 22 23 24 25 26 27 28 29 30 31 32 33 34 35 36 37 38 39 40 41 42 43 44 45 46 47 48 49 50 51 52 53 54 55 56 57 58 59 60 61 62 63 64 65
12
nM. A significant increase in the level of p-AKT was observed only in the SKMES-1, this cell
line also displayed a higher basal level of p-AKT. No modulation on the p-p44/42 MAPK
level was detected in both cell models tested.
In an attempt to restore sensitivity to gefitinib of resistant cell lines we evaluated the effect of
a combined treatment with gefitinib with everolimus. As shown in Fig. 3, gefitinib inhibited
MAPK signaling, but failed to prevent the activation of S6K, whereas everolimus caused a
complete suppression of S6K phosphorylation without influencing MAPK activation.
Combined treatment suppressed both signaling pathways in all the cell models tested.
The pure dose-response curves of growth inhibition of H460, SKMES-1, H1299, H596 and
H1650 in the presence of gefitinib or everolimus are illustrated in Fig. 4. We also show in this
figure, the dose-response curves of gefitinib in the presence of a fixed concentration of
everolimus for all cell lines. The fixed concentration of everolimus was 0.01-1 nM depending
on the cell line. However, different concentrations of everolimus combined with a fixed
gefitinib concentration gave similar results in term of synergism or additivity (results not
shown).
Comparing the experimental combination points with that expected by the Bliss criterion,
only additive effects were observed with the H596 and H1650 cell lines. In fact, no significant
differences between experimental and theoretical points were observed. By contrast,
synergistic effects on growth inhibition were observed for H1299 at gefitinib 1 M (p<0.05),
5 M (p<0.01) and 10 M (p<0.01), for H460 with all tested gefitinib concentrations (1 M
p<0.05, 2.5-5-10-20 M, p<0.01) and finally for SKMES-1 at gefitinib concentrations of 2.5-
5 M (p<0.05). Clonogenic assay performed on H460 cells confirmed the results obtained by
crystal violet staining (Fig. 5).
peer
-004
9726
8, v
ersi
on 1
- 3
Jul 2
010

Page 13 of 35
Accep
ted
Man
uscr
ipt
1 2 3 4 5 6 7 8 9 10 11 12 13 14 15 16 17 18 19 20 21 22 23 24 25 26 27 28 29 30 31 32 33 34 35 36 37 38 39 40 41 42 43 44 45 46 47 48 49 50 51 52 53 54 55 56 57 58 59 60 61 62 63 64 65
13
In the three cell lines sensitive to gefitinib (H322, H292 and Calu-3) as well as in the resistant
Calu-1 and SKLU-1 cell lines (not maintaining S6K phosphorylation following gefitinib
treatment) Bliss analysis showed that gefitinib is additive with everolimus (data not shown).
The effect of the combination of gefitinib and everolimus as a function of the protocol was
then analyzed. The efficacy of the two drugs in combination was measured after six days of
treatment adopting different schedules of administration (“simultaneous”, “gefitinib before”,
“gefitinib after”, “gefitinib before simultaneous” and “everolimus before simultaneous”). In
SKMES-1 and H1650 cells, the “simultaneous” schedule was the only one producing
synergistic or additive effects on cell proliferation (data not shown).
Considering that the cell lines analyzed showed a different growth rate quotient with
significantly different doubling times (Fig. 6A), we checked whether different proliferation
rates of the cells affected the growth inhibition induced by the combined treatment. Growth
rate was varied by modifying the number of SKMES-1 cells initially plated. SKMES-1 were
seeded at different cell densities, treated with everolimus and gefitinib for 3 days and growth
inhibition was then evaluated and plotted as a function of growth rate quotient. As shown in
Fig. 6B, cells having a higher value of GRQ were more responsive to the combined treatment.
This result is consistent with the lack of apoptosis (evaluated by caspase-3 activation and
morphological analysis) under any of the tested treatments at all time points analyzed
suggesting that the combined everolimus-gefitinib treatment exerts, at least until ten days, a
cytostatic and not a cytotoxic effect. Taken together, these results indicate that in selected
high proliferating non-small cell lung cancer cell lines the combination of gefitinib with
everolimus increases the growth-inhibitory effect.
peer
-004
9726
8, v
ersi
on 1
- 3
Jul 2
010

Page 14 of 35
Accep
ted
Man
uscr
ipt
1 2 3 4 5 6 7 8 9 10 11 12 13 14 15 16 17 18 19 20 21 22 23 24 25 26 27 28 29 30 31 32 33 34 35 36 37 38 39 40 41 42 43 44 45 46 47 48 49 50 51 52 53 54 55 56 57 58 59 60 61 62 63 64 65
14
4. Discussion
Intrinsic and acquired resistance to EGFR-targeting agents is an important issue in clinical
practice. Clear evidence exists for the involvement of constitutive activation of the PI3K/AKT
signaling pathway in lung carcinogenesis and in resistance to tyrosine-kinase inhibitors [15].
Of the eleven NSCLC cell lines tested, three (H322, H292, Calu-3) having an IC50<1 M
were considered highly sensitive to gefitinib, while the others, with an IC50>7 M were
considered resistant. The gefitinib concentration of 1 M was used as cutoff for sensitivity
because this concentration approaches levels observed in serum from patients under treatment
with 250 mg/day [6]. In line with other reports [28, 33, 34] no association between
responsiveness to gefitinib and EGFR level was observed.
The response of sensitive cell lines to gefitinib was previously correlated with dependence on
AKT and MAPK activation in response to EGFR signaling [34] and on inhibition of both
PI3K/AKT/mTOR and MAPK pathways following gefitinib treatment [28, 35, 36]. In the
three highly sensitive cell lines we observed a marked reduction on p-p44/42 MAPK, on p-
AKT, and on p-S6K following gefitinib treatment (Fig. 1B). In contrast, in five resistant cell
lines (H460, SKMES-1, H1299, H596, H1650) there was no reduction in the phosphorylation
of S6K suggesting that the maintenance of this survival pathway is related to resistance to
gefitinib.
The presence of a mutation in the PI3K gene in H596 and the deletion of PTEN in the H1650
cells could justify the persistent phosphorylation of AKT after treatment with gefitinib (Fig.
1B and Fig. 3). However in H460, SKMES-1 and H1299 p-AKT was significantly reduced.
This result is in contrast to that reported by Engelman J.A. et al [11] on the reduction of p-
AKT levels solely in sensitive NSCLC cell lines in which gefitinib inhibited growth.
peer
-004
9726
8, v
ersi
on 1
- 3
Jul 2
010

Page 15 of 35
Accep
ted
Man
uscr
ipt
1 2 3 4 5 6 7 8 9 10 11 12 13 14 15 16 17 18 19 20 21 22 23 24 25 26 27 28 29 30 31 32 33 34 35 36 37 38 39 40 41 42 43 44 45 46 47 48 49 50 51 52 53 54 55 56 57 58 59 60 61 62 63 64 65
15
Although H460, SKMES-1, Calu-1 and SKLU-1 harbor mutations in the K-RAS gene,
gefitinib was able to reduce the phosphorylation of p44/42 MAPK as previously reported for
the H460 cell line [31] indicating that K-RAS mutations cannot sustain an EGFR-independent
MAPK pathway activity.
The rapamycin derivative everolimus is a potent inhibitor of tumor cell proliferation in vitro
and in animal models of cancer [37]. In general, rapamycin and everolimus are cytostatic. In
KLN-205 and A549 NSCLC cells, rapamycin induced cell cycle arrest and blocked
proliferation but did not induce apoptosis [38]. In H460, H596, H1299, H1650, SKMES-1
characterized by maintaining S6K phosphorylation after gefitinib treatment, everolimus
inhibited phosphorylation of S6K and slowed proliferation, albeit to different extents
especially at the lower doses. This result is in agreement with that reported by Sun et al on
H460 and H1299 cell lines treated with rapamycin [39]. The high basal level of p-AKT
observed in H1650 and SKMES-1 may be associated with the higher sensitivity to everolimus
as reported in ovarian cancer cells [40] and in breast cancer cells [41].
An increase in AKT phosphorylation after everolimus treatment was observed in H460, H596
and SKMES-1 cells. It is recognized that mTOR inhibition induces insulin receptor substrate-
1 expression and inhibits a normally negative feedback loop resulting in AKT activation in
some cancer cell lines [39, 42].
It is noteworthy that up-regulation of pAKT induced by everolimus in H596 and SKMES-1
cells was reduced in the presence of gefitinib, but to a lesser extent in H460 cells.
In vitro studies with rapamycin and erlotinib in the gefitinib-resistant H460, Calu-6 and
SW1573 NSCLC cell lines [43] showed a synergistic growth inhibition associated with a
down-modulation of rapamycin-stimulated AKT activity.
peer
-004
9726
8, v
ersi
on 1
- 3
Jul 2
010
Page 16 of 35
Accep
ted
Man
uscr
ipt
1 2 3 4 5 6 7 8 9 10 11 12 13 14 15 16 17 18 19 20 21 22 23 24 25 26 27 28 29 30 31 32 33 34 35 36 37 38 39 40 41 42 43 44 45 46 47 48 49 50 51 52 53 54 55 56 57 58 59 60 61 62 63 64 65
16
However, in H460 treated with rapamycin and gefitinib, Janmaat et al. [31] did not observe an
inhibition of AKT phosphorylation, and an enhanced cytotoxicity was obtained only when
gefitinib was associated with the PI3 kinase inhibitor LY294002.
The association between mTOR inhibitors (rapamycin, everolimus or temsirolimus) and anti-
EGFR drugs (gefitinib, erlotinib or cetuximab) has also been tested in human cancer cell lines
derived from different types of tumors [43-47].
In particular Bianco et al. [44] showed that in resistant human GEO colon, PC3 prostate and
MDA-MB-468 breast cancer cells the everolimus and gefitinib combined therapy restored the
anti-proliferative effect induced by anti-EGFR drugs and induced, in colon cells, a strong
reduction of AKT activation. Moreover, the combined treatment potentiated the
antiangiogenic effect of everolimus alone. This result was also confirmed on pancreatic
cancer cells [45] with a combination of gefitinib and rapamycin.
In our experimental models, we demonstrated in a panel of NSCLC cell lines that the
everolimus and gefitinib combination exerted a cytostatic and not a cytotoxic effect
independently from inhibition of AKT phosphorylation. The effect of the combination was
deeply studied on the basis of a plausible interaction model (e.g. Bliss) and we showed that
the combination was exactly additive for H596 and H1650 and synergistic for H460, SKMES-
1 and H1299 with suppression of proliferation rather than enhancement of cell death in
contrast to the findings of Buck et al [43] on a single NSCLC model (Calu-6 cells).
The authors suggested that the synergy for rapamycin with erlotinib was linked to the
capability of erlotinib to promote apoptosis by reducing the rapamycin-stimulated AKT
activity, although this conclusion was supported by observations on only one of the models
responsive to the double treatment. On the other hand, we did not detect cell death, although
AKT levels were partially reduced by the combined treatment.
peer
-004
9726
8, v
ersi
on 1
- 3
Jul 2
010

Page 17 of 35
Accep
ted
Man
uscr
ipt
1 2 3 4 5 6 7 8 9 10 11 12 13 14 15 16 17 18 19 20 21 22 23 24 25 26 27 28 29 30 31 32 33 34 35 36 37 38 39 40 41 42 43 44 45 46 47 48 49 50 51 52 53 54 55 56 57 58 59 60 61 62 63 64 65
17
Preliminary clinical data on combining mTOR inhibitors with EGFR-TKIs might be
promising on NSCLC patients. In a phase I trial, 10 advanced NSCLC patients received the
combination of everolimus and gefitinib administered orally and daily and the maximum-
tolerated dose of everolimus was 5 mg daily when combined with gefitinib at a dose of 250
mg [19]. To date, only preliminary results from the subsequent phase II trial are available. In
that trial, untreated or platinum-based pretreated advanced NSCLC patients, all current or
former smokers, were enrolled. The results are promising; in particular, positive responses
were observed in male former smokers and in one K-RAS mutated patient, all features
negative for response to EGFR-TKIs [48].
In this study we provide new insights regardless a rationale applicability of the combined
treatment based on tumor growth rate. Indeed cells showing higher proliferation index are
more responsive to treatment than are cells with a low level of proliferation. We propose that
proliferation index might be a good marker for selecting those patients who will benefit from
the combined treatment.
Tumor proliferative activity, in general evaluated by Ki-67 expression, is a prognostic marker
in different type of tumours included NSCLC and it is considered of potential interest in
defining populations at high or low risk of recurrence [49]. No data are available about the
possible correlation between high tumor proliferation and response to EGFR inhibitors.
Nevertheless in this context, it has been recently reported that 18F-FDG PET, which reflects
glucose metabolism and proliferative activity of tumor cells [50], may predict response to
gefitinib in the treatment of advanced NSCLC patient [51].
In conclusion, our observations on combinations of everolimus and gefitinib on various
NSCLC lines in vitro may help devise new therapies for selected high Ki-67 expressing lung
cancer patients by targeting the AKT/mTOR pathway in an attempt to overcome gefitinib
resistance.
peer
-004
9726
8, v
ersi
on 1
- 3
Jul 2
010

Page 18 of 35
Accep
ted
Man
uscr
ipt
1 2 3 4 5 6 7 8 9 10 11 12 13 14 15 16 17 18 19 20 21 22 23 24 25 26 27 28 29 30 31 32 33 34 35 36 37 38 39 40 41 42 43 44 45 46 47 48 49 50 51 52 53 54 55 56 57 58 59 60 61 62 63 64 65
18
Acknowledgements
Grant support: Ministero della Salute (Programma straordinario di ricerca oncologica 2006);
Regione Emilia Romagna; Associazione Marta Nurizzo, Brugherio MI; Associazione Chiara
Tassoni, Parma; A.VO.PRO.RI.T., Parma; Associazione Davide Rodella, Montichiari BS,
Lega Italiana per la lotta contro i tumori, Sezione di Parma and CONAD, Bologna.
peer
-004
9726
8, v
ersi
on 1
- 3
Jul 2
010

Page 19 of 35
Accep
ted
Man
uscr
ipt
1 2 3 4 5 6 7 8 9 10 11 12 13 14 15 16 17 18 19 20 21 22 23 24 25 26 27 28 29 30 31 32 33 34 35 36 37 38 39 40 41 42 43 44 45 46 47 48 49 50 51 52 53 54 55 56 57 58 59 60 61 62 63 64 65
19
REFERENCES
[1] Jemal A, Siegel R, Ward E, Hao Y, Xu J, Murray T, et al. Cancer statistics, 2008. CA
Cancer J Clin 2008;58:71-96.
[2] Carney DN. Lung cancer--time to move on from chemotherapy. N Engl J Med
2002;346:126-8.
[3] Bunn PA, Jr. Current therapeutic approaches in lung cancer. Clin Lung Cancer 2002;4
Suppl 1:S4.
[4] Giaccone G. Epidermal growth factor receptor inhibitors in the treatment of non-
small-cell lung cancer. J Clin Oncol 2005;23:3235-42.
[5] Ciardiello F, Tortora G. EGFR antagonists in cancer treatment. N Engl J Med
2008;358:1160-74.
[6] Sharma SV, Bell DW, Settleman J, Haber DA. Epidermal growth factor receptor
mutations in lung cancer. Nat Rev Cancer 2007;7:169-81.
[7] Pao W, Miller VA, Politi KA, Riely GJ, Somwar R, Zakowski MF, et al. Acquired
resistance of lung adenocarcinomas to gefitinib or erlotinib is associated with a second
mutation in the EGFR kinase domain. PLoS Med 2005;2:e73.
[8] Camp ER, Summy J, Bauer TW, Liu W, Gallick GE, Ellis LM. Molecular
mechanisms of resistance to therapies targeting the epidermal growth factor receptor.
Clin Cancer Res 2005;11:397-405.
[9] Engelman JA, Settleman J. Acquired resistance to tyrosine kinase inhibitors during
cancer therapy. Curr Opin Genet Dev 2008;18:73-9.
[10] Jorissen RN, Walker F, Pouliot N, Garrett TP, Ward CW, Burgess AW. Epidermal
growth factor receptor: mechanisms of activation and signalling. Exp Cell Res
2003;284:31-53.
peer
-004
9726
8, v
ersi
on 1
- 3
Jul 2
010

Page 20 of 35
Accep
ted
Man
uscr
ipt
1 2 3 4 5 6 7 8 9 10 11 12 13 14 15 16 17 18 19 20 21 22 23 24 25 26 27 28 29 30 31 32 33 34 35 36 37 38 39 40 41 42 43 44 45 46 47 48 49 50 51 52 53 54 55 56 57 58 59 60 61 62 63 64 65
20
[11] Engelman JA, Janne PA, Mermel C, Pearlberg J, Mukohara T, Fleet C, et al. ErbB-3
mediates phosphoinositide 3-kinase activity in gefitinib-sensitive non-small cell lung
cancer cell lines. Proc Natl Acad Sci U S A 2005;102:3788-93.
[12] Hay N. The Akt-mTOR tango and its relevance to cancer. Cancer Cell 2005;8:179-83.
[13] Morgillo F, Lee HY. Resistance to epidermal growth factor receptor-targeted therapy.
Drug Resist Updat 2005;8:298-310.
[14] Marinov M, Fischer B, Arcaro A. Targeting mTOR signaling in lung cancer. Crit Rev
Oncol Hematol 2007;63:172-82.
[15] Balsara BR, Pei J, Mitsuuchi Y, Page R, Klein-Szanto A, Wang H, et al. Frequent
activation of AKT in non-small cell lung carcinomas and preneoplastic bronchial
lesions. Carcinogenesis 2004;25:2053-9.
[16] Johnson BE, Jackman D, Janne PA. Rationale for a phase I trial of erlotinib and the
mammalian target of rapamycin inhibitor everolimus (RAD001) for patients with
relapsed non small cell lung cancer. Clin Cancer Res 2007;13:s4628-31.
[17] Papadimitrakopoulou V, Soria JC, Douillard JY, Giaccone G, Wolf J., Crino L., et al.
A phase II study of RAD001 (R) (everolimus) monotherapy in patients with advanced
non-small cell lung cancer (NSCLC) failing prior platinum-based chemotherapy (C) or
prior C and EGFR inhibitors (EGFR-I). J Clin Oncol 2007;25 (18 supplem):406s.
[18] Gridelli C, Maione P, Rossi A. The potential role of mTOR inhibitors in non-small
cell lung cancer. Oncologist 2008;13:139-47.
[19] Milton DT, Riely GJ, Azzoli CG, Gomez JE, Heelan RT, Kris MG, et al. Phase 1 trial
of everolimus and gefitinib in patients with advanced nonsmall-cell lung cancer.
Cancer 2007;110:599-605.
[20] Riely GJ, Kris MG, Zhao B, Akhurst T, Milton DT, Moore E, et al. Prospective
assessment of discontinuation and reinitiation of erlotinib or gefitinib in patients with
peer
-004
9726
8, v
ersi
on 1
- 3
Jul 2
010

Page 21 of 35
Accep
ted
Man
uscr
ipt
1 2 3 4 5 6 7 8 9 10 11 12 13 14 15 16 17 18 19 20 21 22 23 24 25 26 27 28 29 30 31 32 33 34 35 36 37 38 39 40 41 42 43 44 45 46 47 48 49 50 51 52 53 54 55 56 57 58 59 60 61 62 63 64 65
21
acquired resistance to erlotinib or gefitinib followed by the addition of everolimus.
Clin Cancer Res 2007;13:5150-5.
[21] Carmi C, Cavazzoni A, Zuliani V, Lodola A, Bordi F, Plazzi PV, et al. 5-benzylidene-
hydantoins as new EGFR inhibitors with antiproliferative activity. Bioorg Med Chem
Lett 2006;16:4021-5.
[22] Cavazzoni A, Petronini PG, Galetti M, Roz L, Andriani F, Carbognani P, et al. Dose-
dependent effect of FHIT-inducible expression in Calu-1 lung cancer cell line.
Oncogene 2004;23:8439-46.
[23] Gillies RJ, Didier N, Denton M. Determination of cell number in monolayer cultures.
Anal Biochem 1986;159:109-13.
[24] Cavazzoni A, Alfieri RR, Carmi C, Zuliani V, Galetti M, Fumarola C, et al. Dual
mechanisms of action of the 5-benzylidene-hydantoin UPR1024 on lung cancer cell
lines. Mol Cancer Ther 2008;7:361-70.
[25] Goldoni M, Vettori MV, Alinovi R, Caglieri A, Ceccatelli S, Mutti A. Models of
neurotoxicity: extrapolation of benchmark doses in vitro. Risk Anal 2003;23:505-14.
[26] Goldoni M, Johansson C. A mathematical approach to study combined effects of
toxicants in vitro: evaluation of the Bliss independence criterion and the Loewe
additivity model. Toxicol In Vitro 2007;21:759-69.
[27] Tiseo M, Capelletti M, De Palma G, Franciosi V, Cavazzoni A, Mozzoni P, et al.
Epidermal growth factor receptor intron-1 polymorphism predicts gefitinib outcome in
advanced non-small cell lung cancer. J Thorac Oncol 2008;3:1104-11.
[28] Van Schaeybroeck S, Kyula J, Kelly DM, Karaiskou-McCaul A, Stokesberry SA, Van
Cutsem E, et al. Chemotherapy-induced epidermal growth factor receptor activation
determines response to combined gefitinib/chemotherapy treatment in non-small cell
lung cancer cells. Mol Cancer Ther 2006;5:1154-65.
peer
-004
9726
8, v
ersi
on 1
- 3
Jul 2
010

Page 22 of 35
Accep
ted
Man
uscr
ipt
1 2 3 4 5 6 7 8 9 10 11 12 13 14 15 16 17 18 19 20 21 22 23 24 25 26 27 28 29 30 31 32 33 34 35 36 37 38 39 40 41 42 43 44 45 46 47 48 49 50 51 52 53 54 55 56 57 58 59 60 61 62 63 64 65
22
[29] Deng J, Shimamura T, Perera S, Carlson NE, Cai D, Shapiro GI, et al. Proapoptotic
BH3-only BCL-2 family protein BIM connects death signaling from epidermal growth
factor receptor inhibition to the mitochondrion. Cancer Res 2007;67:11867-75.
[30] Guo A, Villen J, Kornhauser J, Lee KA, Stokes MP, Rikova K, et al. Signaling
networks assembled by oncogenic EGFR and c-Met. Proc Natl Acad Sci U S A
2008;105:692-7.
[31] Janmaat ML, Rodriguez JA, Gallegos-Ruiz M, Kruyt FA, Giaccone G. Enhanced
cytotoxicity induced by gefitinib and specific inhibitors of the Ras or phosphatidyl
inositol-3 kinase pathways in non-small cell lung cancer cells. Int J Cancer
2006;118:209-14.
[32] Yun CH, Mengwasser KE, Toms AV, Woo MS, Greulich H, Wong KK, et al. The
T790M mutation in EGFR kinase causes drug resistance by increasing the affinity for
ATP. Proc Natl Acad Sci U S A 2008;105:2070-5.
[33] Parra HS, Cavina R, Latteri F, Zucali PA, Campagnoli E, Morenghi E, et al. Analysis
of epidermal growth factor receptor expression as a predictive factor for response to
gefitinib ('Iressa', ZD1839) in non-small-cell lung cancer. Br J Cancer 2004;91:208-
12.
[34] Ono M, Hirata A, Kometani T, Miyagawa M, Ueda S, Kinoshita H, et al. Sensitivity to
gefitinib (Iressa, ZD1839) in non-small cell lung cancer cell lines correlates with
dependence on the epidermal growth factor (EGF) receptor/extracellular signal-
regulated kinase 1/2 and EGF receptor/Akt pathway for proliferation. Mol Cancer
Ther 2004;3:465-72.
[35] Paez JG, Janne PA, Lee JC, Tracy S, Greulich H, Gabriel S, et al. EGFR mutations in
lung cancer: correlation with clinical response to gefitinib therapy. Science
2004;304:1497-500.
peer
-004
9726
8, v
ersi
on 1
- 3
Jul 2
010
Page 23 of 35
Accep
ted
Man
uscr
ipt
1 2 3 4 5 6 7 8 9 10 11 12 13 14 15 16 17 18 19 20 21 22 23 24 25 26 27 28 29 30 31 32 33 34 35 36 37 38 39 40 41 42 43 44 45 46 47 48 49 50 51 52 53 54 55 56 57 58 59 60 61 62 63 64 65
23
[36] Sordella R, Bell DW, Haber DA, Settleman J. Gefitinib-sensitizing EGFR mutations
in lung cancer activate anti-apoptotic pathways. Science 2004;305:1163-7.
[37] Boulay A, Zumstein-Mecker S, Stephan C, Beuvink I, Zilbermann F, Haller R, et al.
Antitumor efficacy of intermittent treatment schedules with the rapamycin derivative
RAD001 correlates with prolonged inactivation of ribosomal protein S6 kinase 1 in
peripheral blood mononuclear cells. Cancer Res 2004;64:252-61.
[38] Boffa DJ, Luan F, Thomas D, Yang H, Sharma VK, Lagman M, et al. Rapamycin
inhibits the growth and metastatic progression of non-small cell lung cancer. Clin
Cancer Res 2004;10:293-300.
[39] Sun SY, Rosenberg LM, Wang X, Zhou Z, Yue P, Fu H, et al. Activation of Akt and
eIF4E survival pathways by rapamycin-mediated mammalian target of rapamycin
inhibition. Cancer Res 2005;65:7052-8.
[40] Mabuchi S, Altomare DA, Cheung M, Zhang L, Poulikakos PI, Hensley HH, et al.
RAD001 inhibits human ovarian cancer cell proliferation, enhances cisplatin-induced
apoptosis, and prolongs survival in an ovarian cancer model. Clin Cancer Res
2007;13:4261-70.
[41] Noh WC, Mondesire WH, Peng J, Jian W, Zhang H, Dong J, et al. Determinants of
rapamycin sensitivity in breast cancer cells. Clin Cancer Res 2004;10:1013-23.
[42] O'Reilly KE, Rojo F, She QB, Solit D, Mills GB, Smith D, et al. mTOR inhibition
induces upstream receptor tyrosine kinase signaling and activates Akt. Cancer Res
2006;66:1500-8.
[43] Buck E, Eyzaguirre A, Brown E, Petti F, McCormack S, Haley JD, et al. Rapamycin
synergizes with the epidermal growth factor receptor inhibitor erlotinib in non-small-
cell lung, pancreatic, colon, and breast tumors. Mol Cancer Ther 2006;5:2676-84.
peer
-004
9726
8, v
ersi
on 1
- 3
Jul 2
010

Page 24 of 35
Accep
ted
Man
uscr
ipt
1 2 3 4 5 6 7 8 9 10 11 12 13 14 15 16 17 18 19 20 21 22 23 24 25 26 27 28 29 30 31 32 33 34 35 36 37 38 39 40 41 42 43 44 45 46 47 48 49 50 51 52 53 54 55 56 57 58 59 60 61 62 63 64 65
24
[44] Bianco R, Garofalo S, Rosa R, Damiano V, Gelardi T, Daniele G, et al. Inhibition of
mTOR pathway by everolimus cooperates with EGFR inhibitors in human tumours
sensitive and resistant to anti-EGFR drugs. Br J Cancer 2008;98:923-30.
[45] Azzariti A, Porcelli L, Gatti G, Nicolin A, Paradiso A. Synergic antiproliferative and
antiangiogenic effects of EGFR and mTor inhibitors on pancreatic cancer cells.
Biochem Pharmacol 2008;75:1035-44.
[46] Jimeno A, Kulesza P, Wheelhouse J, Chan A, Zhang X, Kincaid E, et al. Dual EGFR
and mTOR targeting in squamous cell carcinoma models, and development of early
markers of efficacy. Br J Cancer 2007;96:952-9.
[47] Johansson G, Mahller YY, Collins MH, Kim MO, Nobukuni T, Perentesis J, et al.
Effective in vivo targeting of the mammalian target of rapamycin pathway in
malignant peripheral nerve sheath tumors. Mol Cancer Ther 2008;7:1237-45.
[48] Kris MG, Riely GJ, Azzoli CG, Heelan RT, Krug LM, Pao W, et al. Combined
inhibition of mTOR and EGFR with everolimus (RAD001) and gefitinib in patients
with non-small cell lung cancer who have smoked cigarettes: A phase II trial. J Clin
Oncol 2007;25 (18 supplem):403s.
[49] Martin B, Paesmans M, Mascaux C, Berghmans T, Lothaire P, Meert AP, et al. Ki-67
expression and patients survival in lung cancer: systematic review of the literature
with meta-analysis. Br J Cancer 2004;91:2018-25.
[50] Vesselle H, Salskov A, Turcotte E, Wiens L, Schmidt R, Jordan CD, et al.
Relationship between non-small cell lung cancer FDG uptake at PET, tumor histology,
and Ki-67 proliferation index. J Thorac Oncol 2008;3:971-8.
[51] Sunaga N, Oriuchi N, Kaira K, Yanagitani N, Tomizawa Y, Hisada T, et al.
Usefulness of FDG-PET for early prediction of the response to gefitinib in non-small
cell lung cancer. Lung Cancer 2008;59:203-10.
peer
-004
9726
8, v
ersi
on 1
- 3
Jul 2
010

Page 25 of 35
Accep
ted
Man
uscr
ipt
1 2 3 4 5 6 7 8 9 10 11 12 13 14 15 16 17 18 19 20 21 22 23 24 25 26 27 28 29 30 31 32 33 34 35 36 37 38 39 40 41 42 43 44 45 46 47 48 49 50 51 52 53 54 55 56 57 58 59 60 61 62 63 64 65
25
FIGURE CAPTIONS.
Figure 1: Effects of gefitinib on EGFR signalling pathways.
(A) Calu-3, H1650 and SKLU-1 cells were incubated for 2 hr with the indicated
concentrations of gefitinib before stimulation with 0.1 g/ml EGF for 5 min. Western blot
analysis was performed by using monoclonal antibodies directed to p-tyr1068 and to total
EGFR. The immunoreactive spots at each point were quantified by densitometric analysis,
ratios of phosphotyrosine/total EGFR were calculated and values are expressed as percentage
of inhibition versus control.
(B) NSCLC cell lines were pre-incubated for 2 hr with gefitinib 1 M and then stimulated
with 0.1 g/ml EGF for 5 min. The cells were lysed and Western blot analysis was performed
on lysate proteins by using monoclonal antibodies directed against p-EGFR (tyr1068), EGFR,
p-p44/42 MAPK, p44/42 MAPK, p-AKT (ser273), AKT, p-S6K (thr389), S6K, and actin.
Data are from a representative experiment. The experiment, repeated three times, yielded
similar results.* Cell lines sensitive to gefitinib.
Figure 2: Effect of everolimus on PI3K/AKT/mTOR, MAPK signaling pathways and on cell
proliferation
(A) H460, H596, H1299, H1650 and SKMES-1 cells were treated with 100 nM everolimus
for 24 hr and then cells were lysed and Western blot analysis was performed on lysate
proteins by using monoclonal antibodies directed against PI3K, PTEN, p-AKT (ser273),
AKT, p-mTOR (ser2448), p-S6K (thr389), S6K, p-p44/42 MAPK, p44/42 MAPK and actin.
Data are from a representative experiment. The experiment, repeated three times, yielded
similar results.
peer
-004
9726
8, v
ersi
on 1
- 3
Jul 2
010

Page 26 of 35
Accep
ted
Man
uscr
ipt
1 2 3 4 5 6 7 8 9 10 11 12 13 14 15 16 17 18 19 20 21 22 23 24 25 26 27 28 29 30 31 32 33 34 35 36 37 38 39 40 41 42 43 44 45 46 47 48 49 50 51 52 53 54 55 56 57 58 59 60 61 62 63 64 65
26
(B) H460, H596, H1299, H1650 and SKMES-1 cells were exposed for six days to different
concentrations of everolimus (from 0.01 to 100 nM) and then cell number was assessed using
crystal violet staining as described in Materials and Methods. Data are expressed as percent
inhibition of cell proliferation versus control cells. IC50 values are also indicated. The mean
values of three independent measurements (± SD) are shown. (C) H1299 and SKMES-1 cells
were treated with different concentrations of everolimus (from 0.01 to 100 nM) for 24 hr and
then cells were lysed and Western blot analysis was performed on lysate proteins by using
monoclonal antibodies directed against p-AKT (ser273), AKT, p-S6K (thr389), S6K, p-
p44/42 MAPK, p44/42 MAPK and actin. Data are from a representative experiment. The
experiment, repeated three times, yielded similar results.
Figure 3: Effect of gefitinib-everolimus combined treatment on PI3K/AKT/mTOR, MAPK
signaling pathways.
H460, H596, H1299, H1650 and SKMES-1 cells were treated with 1 M gefitinib, 1 nM
everolimus or combination of both for 24 hr and then cells were lysed and Western blot
analysis was performed on lysate proteins by using monoclonal antibodies directed against, p-
AKT (ser273), AKT, p-S6K (thr389), S6K, p-p44/42 MAPK, p44/42 MAPK and actin. Data
are from a representative experiment. The experiment, repeated three times, yielded similar
results.
Figure 4: Interaction between gefitinib and everolimus on the growth inhibition dose-
response curves.
Curves of growth inhibitory effects of gefitinib (left), everolimus (middle) and combined
treatment versus theoretical Bliss additivity curve (right) are reported. In the combined
treatment, everolimus was 0.01 nM in H460 and SKMES-1, 0.1 nM in H1650 and 1 nM in
H1299 and H596. Cells were treated with the drugs for six days and then cell number was
assessed using crystal violet staining as described in Materials and Methods. Data are
peer
-004
9726
8, v
ersi
on 1
- 3
Jul 2
010
Page 27 of 35
Accep
ted
Man
uscr
ipt
1 2 3 4 5 6 7 8 9 10 11 12 13 14 15 16 17 18 19 20 21 22 23 24 25 26 27 28 29 30 31 32 33 34 35 36 37 38 39 40 41 42 43 44 45 46 47 48 49 50 51 52 53 54 55 56 57 58 59 60 61 62 63 64 65
27
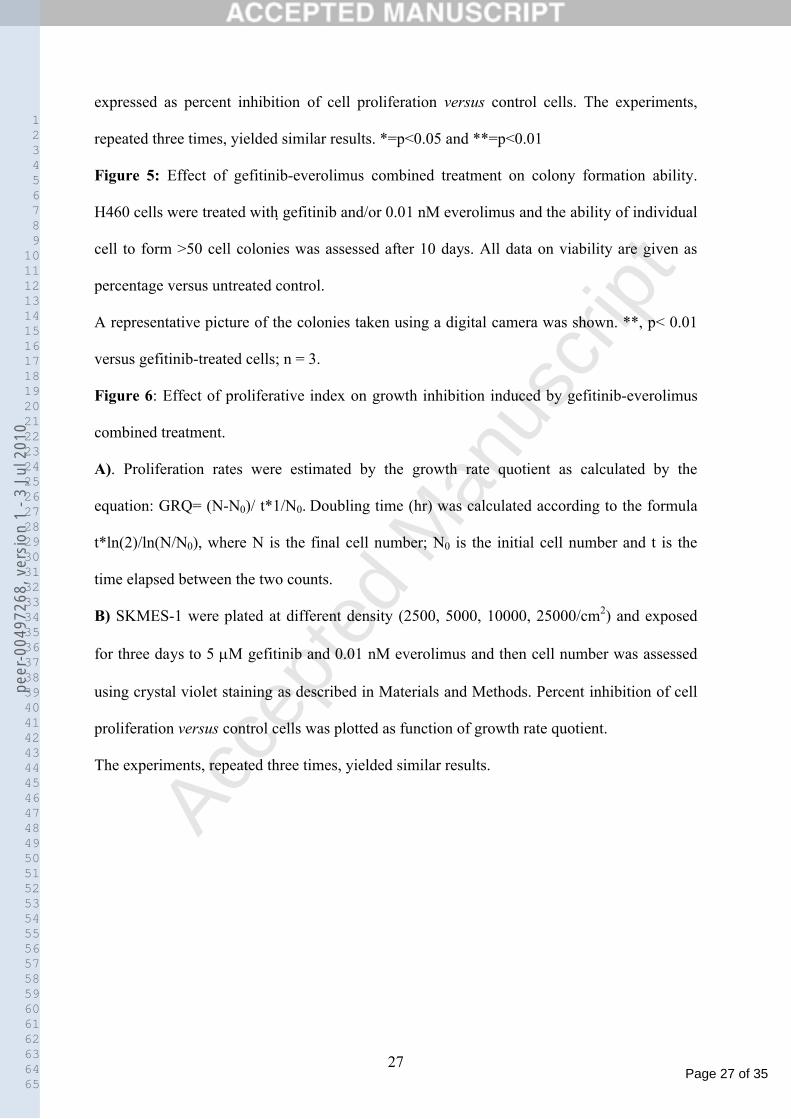
expressed as percent inhibition of cell proliferation versus control cells. The experiments,
repeated three times, yielded similar results. *=p<0.05 and **=p<0.01
Figure 5: Effect of gefitinib-everolimus combined treatment on colony formation ability.
H460 cells were treated with gefitinib and/or 0.01 nM everolimus and the ability of individual
cell to form >50 cell colonies was assessed after 10 days. All data on viability are given as
percentage versus untreated control.
A representative picture of the colonies taken using a digital camera was shown. **, p< 0.01
versus gefitinib-treated cells; n = 3.
Figure 6: Effect of proliferative index on growth inhibition induced by gefitinib-everolimus
combined treatment.
A). Proliferation rates were estimated by the growth rate quotient as calculated by the
equation: GRQ= (N-N0)/ t*1/N0. Doubling time (hr) was calculated according to the formula
t*ln(2)/ln(N/N0), where N is the final cell number; N0 is the initial cell number and t is the
time elapsed between the two counts.
B) SKMES-1 were plated at different density (2500, 5000, 10000, 25000/cm2) and exposed
for three days to 5 M gefitinib and 0.01 nM everolimus and then cell number was assessed
using crystal violet staining as described in Materials and Methods. Percent inhibition of cell
proliferation versus control cells was plotted as function of growth rate quotient.
The experiments, repeated three times, yielded similar results.
peer
-004
9726
8, v
ersi
on 1
- 3
Jul 2
010

Page 28 of 35
Accep
ted
Man
uscr
ipt
Table 1pe
er-0
0497
268,
ver
sion
1 -
3 Ju
l 201
0

Page 29 of 35
Accep
ted
Man
uscr
ipt
Figure 1pe
er-0
0497
268,
ver
sion
1 -
3 Ju
l 201
0

Page 30 of 35
Accep
ted
Man
uscr
ipt
Figure 2pe
er-0
0497
268,
ver
sion
1 -
3 Ju
l 201
0

Page 31 of 35
Accep
ted
Man
uscr
ipt
Figure 3pe
er-0
0497
268,
ver
sion
1 -
3 Ju
l 201
0

Page 32 of 35
Accep
ted
Man
uscr
ipt
Figure 4pe
er-0
0497
268,
ver
sion
1 -
3 Ju
l 201
0

Page 33 of 35
Accep
ted
Man
uscr
ipt
Figure 5pe
er-0
0497
268,
ver
sion
1 -
3 Ju
l 201
0

Page 34 of 35
Accep
ted
Man
uscr
ipt
Figure 6pe
er-0
0497
268,
ver
sion
1 -
3 Ju
l 201
0

Page 35 of 35
Accep
ted
Man
uscr
ipt
Graphical Abstractpe
er-0
0497
268,
ver
sion
1 -
3 Ju
l 201
0
Copyright © 2022 FDOKUMEN