Improved diagnostic accuracy in differentiating malignant and benign lesions using single-voxel...
9
Improved diagnostic accuracy in differentiating malignant and benign lesions using single-voxel proton MRS of the breast at 3 T MRI S. Suppiah a, b , K. Rahmat a, * , M.N. Mohd-Shah a , C.A. Azlan a , L.K. Tan a , Y.F.A. Aziz a , A. Vijayananthan a , A.L. Wui a , C.H. Yip c a Department of Biomedical Imaging, University Malaya Research Imaging Centre (UMRIC), Kuala Lumpur, Malaysia b Department of Imaging, Faculty of Medicine and Health Sciences, Universiti Putra, Malaysia c Department of Surgery, Faculty of Medicine, University of Malaya, Kuala Lumpur, Malaysia article information Article history: Received 14 November 2012 Received in revised form 19 March 2013 Accepted 5 April 2013 AIM: To investigate the diagnostic accuracy of single-voxel proton magnetic resonance spectroscopy (SV 1 H MRS) by quantifying total choline-containing compounds (tCho) in differentiating malignant from benign lesions, and subsequently, to analyse the relationship of tCho levels in malignant breast lesions with their histopathological subtypes. MATERIALS AND METHODS: A prospective study of SV 1H MRS was performed following dynamic contrast-enhanced magnetic resonance imaging (DCE-MRI) in 61 women using a 3 T MR system. All lesions (n ¼ 57) were analysed for characteristics of morphology, contrast- enhancement kinetics, and tCho peak heights at SV 1 H MRS that were two-times above baseline. Subsequently, the tCho in selected lesions (n ¼ 32) was quantified by calculating the area under the curve, and a tCho concentration equal to or greater than the cut-off value was considered to represent malignancy. The relationship between tCho in invasive ductal carci- nomas (IDCs) and their Bloom & Richardson grading of malignancy was assessed. RESULTS: Fifty-two patients (57 lesions; 42 malignant and 15 benign) were analysed. The sensitivity, specificity, positive predictive value (PPV), and negative predictive value (NPV), of predicting malignancy were 100, 73.3, 91.3, and 100%, respectively, using DCE-MRI and 95.2, 93.3, 97.6, and 87.5%, respectively, using SV 1 H MRS. The tCho cut-off for receiver operating characteristic (ROC) curve was 0.33 mmol/l. The relationship between tCho levels in malignant breast lesions with their histopathological subtypes was not statistically significant (p ¼ 0.3). CONCLUSION: Good correlation between tCho peaks and malignancy, enables SV 1 H MRS to be used as a clinically applicable, simple, yet non-invasive tool for improved specificity and diagnostic accuracy in detecting breast cancer. Ó 2013 The Royal College of Radiologists. Published by Elsevier Ltd. All rights reserved. Introduction Single-voxel proton magnetic resonance spectroscopy (SV 1 H MRS) enables non-invasive assessment of the biochemical composition of breast lesions. Previous studies conducted using 1.5 T MR systems 1e6 reported the presence of the resonance of total choline (tCho)-containing compounds at 3.2 parts per million (ppm), which includes contributions from choline, phosphocholine, glycerophosphocholine, and taurine as reliable biomarkers of breast cancer. 7 This is because choline-containing metabolites detected in breast lesions are an indicator of the increased cellular metabolism noted in malignant breast tumours. * Guarantor and correspondent: K. Rahmat, Department of Biomedical Imaging, University Malaya Research Imaging Centre (UMRIC), Faculty of Medicine, University of Malaya, 50603 Kuala Lumpur, Malaysia. Tel.: þ603 79492091; fax: þ603 79494603. E-mail address: [email protected] (K. Rahmat). Contents lists available at SciVerse ScienceDirect Clinical Radiology journal homepage: www.clinicalradiologyonline.net 0009-9260/$ e see front matter Ó 2013 The Royal College of Radiologists. Published by Elsevier Ltd. All rights reserved. http://dx.doi.org/10.1016/j.crad.2013.04.002 Clinical Radiology xxx (2013) e1ee9 Please cite this article in press as: Suppiah S, et al., Improved diagnostic accuracy in differentiating malignant and benign lesions using single- voxel proton MRS of the breast at 3 T MRI, Clinical Radiology (2013), http://dx.doi.org/10.1016/j.crad.2013.04.002
Transcript of Improved diagnostic accuracy in differentiating malignant and benign lesions using single-voxel...
at SciVerse ScienceDirect
Clinical Radiology xxx (2013) e1ee9
Contents lists available
Clinical Radiology
journal homepage: www.cl inicalradiologyonl ine.net
Improved diagnostic accuracy in differentiating malignantand benign lesions using single-voxel proton MRS of thebreast at 3 T MRIS. Suppiah a,b, K. Rahmat a,*, M.N. Mohd-Shah a, C.A. Azlan a, L.K. Tan a, Y.F.A. Aziz a,A. Vijayananthan a, A.L. Wui a, C.H. Yip c
aDepartment of Biomedical Imaging, University Malaya Research Imaging Centre (UMRIC), Kuala Lumpur, MalaysiabDepartment of Imaging, Faculty of Medicine and Health Sciences, Universiti Putra, MalaysiacDepartment of Surgery, Faculty of Medicine, University of Malaya, Kuala Lumpur, Malaysia
article information
Article history:Received 14 November 2012Received in revised form19 March 2013Accepted 5 April 2013
* Guarantor and correspondent: K. Rahmat, DImaging, University Malaya Research Imaging CMedicine, University of Malaya, 50603 Kuala Lum79492091; fax: þ603 79494603.
E-mail address: [email protected] (K. R
0009-9260/$ e see front matter � 2013 The Royal Cohttp://dx.doi.org/10.1016/j.crad.2013.04.002
Please cite this article in press as: Suppiah Svoxel proton MRS of the breast at 3 T MRI, C
AIM: To investigate the diagnostic accuracy of single-voxel proton magnetic resonancespectroscopy (SV 1H MRS) by quantifying total choline-containing compounds (tCho) indifferentiating malignant from benign lesions, and subsequently, to analyse the relationship oftCho levels in malignant breast lesions with their histopathological subtypes.MATERIALS AND METHODS: A prospective study of SV 1H MRS was performed following
dynamic contrast-enhanced magnetic resonance imaging (DCE-MRI) in 61 women using a 3 TMR system. All lesions (n ¼ 57) were analysed for characteristics of morphology, contrast-enhancement kinetics, and tCho peak heights at SV 1H MRS that were two-times abovebaseline. Subsequently, the tCho in selected lesions (n ¼ 32) was quantified by calculating thearea under the curve, and a tCho concentration equal to or greater than the cut-off value wasconsidered to represent malignancy. The relationship between tCho in invasive ductal carci-nomas (IDCs) and their Bloom & Richardson grading of malignancy was assessed.RESULTS: Fifty-two patients (57 lesions; 42 malignant and 15 benign) were analysed. The
sensitivity, specificity, positive predictive value (PPV), and negative predictive value (NPV), ofpredicting malignancy were 100, 73.3, 91.3, and 100%, respectively, using DCE-MRI and 95.2,93.3, 97.6, and 87.5%, respectively, using SV 1H MRS. The tCho cut-off for receiver operatingcharacteristic (ROC) curve was 0.33 mmol/l. The relationship between tCho levels in malignantbreast lesions with their histopathological subtypes was not statistically significant (p ¼ 0.3).CONCLUSION: Good correlation between tCho peaks and malignancy, enables SV 1H MRS to
be used as a clinically applicable, simple, yet non-invasive tool for improved specificity anddiagnostic accuracy in detecting breast cancer.
� 2013 The Royal College of Radiologists. Published by Elsevier Ltd. All rights reserved.
Introduction composition of breast lesions. Previous studies conducted
Single-voxel protonmagnetic resonance spectroscopy (SV1HMRS) enablesnon-invasive assessmentof thebiochemical
epartment of Biomedicalentre (UMRIC), Faculty ofpur, Malaysia. Tel.: þ603
ahmat).
llege of Radiologists. Published by
, et al., Improved diagnostic alinical Radiology (2013), htt
using 1.5 T MR systems1e6 reported the presence of theresonance of total choline (tCho)-containing compounds at3.2 parts per million (ppm), which includes contributionsfrom choline, phosphocholine, glycerophosphocholine, andtaurine as reliable biomarkers of breast cancer.7 This isbecause choline-containing metabolites detected in breastlesions are an indicator of the increased cellular metabolismnoted in malignant breast tumours.
Elsevier Ltd. All rights reserved.
ccuracy in differentiating malignant and benign lesions using single-p://dx.doi.org/10.1016/j.crad.2013.04.002

S. Suppiah et al. / Clinical Radiology xxx (2013) e1ee9e2
Current practices include dynamic contrast-enhancedmagnetic resonance imaging (DCE-MRI) as part of thestandard breast imaging protocol.8 Previously, MRS breaststudies at 1.5 T have shown that it is a useful adjunct tostandard breast MRI protocols. More recent studies haveshown MRS breast at 3 T has the added advantage ofproviding better spatial resolution for lesion localization.9 Italso provides improved spectral resolution of metabolites ofthe MR spectrum for better detection of tCho peaks.10, 11
Standard breast imaging protocols enable the analysis ofthe morphological and kinetic patterns of benign and ma-lignant breast lesions detected at MRI. The high sensitivityof breast MRI but its limited specificity poses a diagnosticchallenge for radiologists, producing a high false-positiverate of cancer detection leading to unnecessary biopsiesbeing performed.1,8 The ratio of mass to non-mass lesionsdiffered significantly between true-positive (7.0 : 1.0) andfalse-positive findings (1.2: 1.0), giving a low positive pre-dictive value (PPV) of 51.7% for non-mass lesions detectedon standard MRI.12 DCE-MRI sensitivity has been reportedto be as high as 94e100%, but with variable specificity in therange of 37e97%.13 By adding MRS to standard breast im-aging, the specificity for the detection of breast cancer canbe consistently improved from 70% up to 92%.4,6 High fieldscanning has been proven to be of use in improving diag-nostic specificity.10 Although MRS breast at 3 T is gainingmomentum as a useful diagnostic tool, there are numerousmethods recommended for performing and interpretingit.5e7,14 This leads to uncertainty as to which protocol to beutilized for maximum diagnostic accuracy. Therefore, itposes a problem to radiologists as there is a necessity forselecting a fast, accurate, and clinically applicable protocol.
Therefore, the aim of the present studywas to investigatethe diagnostic accuracy of SV 1H MRS at 3 T by quantifyingtCho-containing compounds in differentiating malignantfrom benign lesions. Subsequently, the relationship be-tween tCho levels in malignant breast lesions werecompared with their histopathological subtypes.
Materials and methods
Hospital ethical committee approval and writteninformed consent were obtained. Sixty-one women (meanage 49.7 years old, range 20e83 years old) were prospec-tively recruited based on findings of breast lesion(s) onclinical examination, mammography, and/or ultrasound.Sixty-five lesions were detected over 22 months and, afterexclusion criteria were applied, 57 lesions in 52 patientswere obtained for the study cohort (42 malignant: meansize 3.6 cm, size range 1.2e15.8 cm; 15 benign: mean size1.9 cm, size range 0.7e3.8 cm). Nine patients were excludeddue to five having erratic MRS spectra, two did not haveconclusive histology results, one patient defaulted biopsy,and one patient did not have a lesion detected at MRI.
Single-voxel tCho spectra of all breast lesions and normalbreast tissue were obtained and correlated with the finalhistology results with the reference standard being surgeryor core-biopsy results. The lesions were analysed for
Please cite this article in press as: Suppiah S, et al., Improved diagnostic avoxel proton MRS of the breast at 3 T MRI, Clinical Radiology (2013), htt
morphological and dynamic contrast enhancement kineticscharacteristics. Subsequently, selected spectra of malignantand benign lesions, as well as of normal breast tissue,(n ¼ 32) were assessed for their tCho content and whetherthis corresponded to their histopathological findings. In-clusion criteria were women who had a breast lumpdetected either by clinical palpation or by radiologicalinvestigation, i.e., mammography/ultrasound, and thatlesion was going to be either biopsied or excised. Exclusioncriteria were women who had a contraindication to MRI,women who had undergone previous surgery/radiotherapyon the lesion-containing breast, and those who only hadmicrocalcifications on mammogram and no solid mass le-sions seen at breast ultrasound. Thirty-two spectra wereanalysed for tCho content after the mathematical softwarefor tCho area under the curve quantificationwas acquired inthe later phase of the study period.
Studies were performed on a clinical 3 T MR system(Signa� HDx MR Systems; GE Healthcare, Milwaukee, WI,USA) with a dedicated bilateral eight-channel double breastcoil using the manufacturer’s proton MRS acquisition soft-ware, breast spectroscopic examination (BREASE).
Study protocol/sequences
Standard breast MRI protocolThe imaging protocol comprised of unenhanced axial T1-
weighted, T2-weighted, and short tau inversion recovery(STIR) sequences as well as a 3D high-resolution dynamic,contrast-enhanced with T1-weighted fat-suppressed se-quences. Axial T2-weighted and STIR images had 4 mmslice thickness, and 40 cm field of view (FOV). Prior tospectroscopy, six-phase contrast-enhanced MR mammog-raphy using 0.2 mmol/kg intravenous gadopentate dime-glumine (Magnevist; Schering, Berlin, Germany) wasperformed [10� flip angle,1.4 mm slice thickness, 40 cm FOV,256 � 256 matrix size, 4.2 ms time-to-repeat (TR), and2.5 ms time-to-echo (TE)]. Six consecutive scans were per-formed for 1 min each with no intersection gap. The region-of-interest (ROI) was placed on the most enhancing regionof the target lesions that were detected. Subsequently, dy-namic contrast enhancement kinetic curves were plottedusing functional tool (FuncTool) on the manufacturer-provided software [Volume Imaging for BReast Assess-meNT (VIBRANT)] to assess for the contrast medium uptake.
MRSThe contrast-enhanced images were scrutinized to iden-
tify solid, enhancing lesions suitable for spectroscopic ex-amination. SpectroscopicVOIplacementwas thenperformedand adjusted to maximize coverage of the enhancing lesionwhilst minimizing coverage of adjacent adipose tissue(minimumVOI size was 10� 10� 10mm). Saturation bandswere then positioned around the selected VOI to reducesignal coming from the surrounding breast tissue (Fig 1a). Anautomatic pre-scan was undertaken by selecting a homoge-neous VOI in the enhancing lesion. Once full- width half-maximum (FWHM) of <6 Hz was achieved, image acquisi-tion was performed. A point-resolved spectroscopy (PRESS)
ccuracy in differentiating malignant and benign lesions using single-p://dx.doi.org/10.1016/j.crad.2013.04.002

Figure 1 MRI of a 28-year-old woman (patient 35) who presented with palpable left breast lump. (a) High-resolution contrast-enhanced imagein the axial plane showed a heterogeneously enhancing lesion (red arrow) in the left breast. A VOI was placed in the enhancing solid lesion tooptimize coverage of the most enhancing part and to minimize the inclusion of adjacent adipose tissue. Saturation bands were placed around thelesion before MRS data were acquired. /MR spectrum for the lesion showed lipid peak at 1.3 ppm (white arrow), choline at 3.2 ppm (yellowarrow) and water peak at 4.74 ppm (blue arrow). This lesion was revealed to be a grade 3 IDC. (b) Voxel selection and placement for MRS ofnormal tissue. Saturation bands were placed around normal-appearing breast tissue before MRS data were acquired for purpose of control data./MR spectrum for normal breast tissue showing absent choline metabolite peak at 3.2 ppm (yellow arrow) and a well-suppressed water peakat 4.74 ppm (blue arrow).
S. Suppiah et al. / Clinical Radiology xxx (2013) e1ee9 e3
sequence [TR/TE: 2000 ms/155 ms and with number ofexcitations (NEX) 56 times], single-shot unsuppressed spec-trumwas performed in the VOI. An automaticwater- and fat-suppressed (AWS) sequence, which is a chemical shiftselective imaging sequence (CHESS), was included to detecttCho resonance at 3.2ppm(Fig1a). The total time taken for allspectroscopic preparation steps and acquisitions wasapproximately 5e6 min. The control spectra were acquiredfrom VOI placed in healthy-appearing glandular tissue withsaturation bands placed around it. The spectra of normalbreast tissues were not expected to have a choline peak at3.2 ppm (Fig 1b).
Data interpretation
For the MR spectra that were acquired, chemical shiftswere corrected using awater signal at 4.74 ppm. The spectrawere shifted accordingly using spectral offsetmanipulations.
The MRI images were interpreted by two radiologists(K.R. and Y.F.) with 8e12 years of subspecialty experience inbreast imaging. Objective morphological assessment of thelesions using the American College of Radiology (ACR) BI-RADS�-MRI (Breast ImagingdReporting and Data System
Please cite this article in press as: Suppiah S, et al., Improved diagnostic avoxel proton MRS of the breast at 3 T MRI, Clinical Radiology (2013), htt
for MRI) lexicon and final assessment categories from 1 to 6for each lesion were made. The American College of Radi-ology’s BI-RADS-MRI lexicon,15 was specifically used as atool to standardize the image interpretation and appro-priate MRI BI-RADS category was documented and scoreswere given based on morphological features and kineticscharacteristics scoring system.16,17 The scores were thencorrelated with the histopathological reference standardbased on core-biopsy histology results but upgraded tosurgical histopathology results where applicable. DCE-MRIcharacteristics were interpreted as explained by Kuhlet al.18 and correlated with BI-RADS MRI descriptors ofmalignancy.19
Initially, the presence of tCho in a lesionwas identified bya peak height at 3.2 ppm that was two-times above baselinenoise.7 Subsequently, selected spectra were analysed tocalculate the area under the curve of tCho peak at 3.2 ppmusing Spectroscopic Analysis for General Electric (SAGE) andMATLAB (Mathworks, Natick, MA, USA) softwares. Theextracted peaks in the region of 3.2 ppm, SD � 0.2 werefitted with a Voigt line-shape curve-fitting algorithm tocalculate the area under the curve. Curve fits giving R2
values of 0.695e1.000 were considered to be good curve
ccuracy in differentiating malignant and benign lesions using single-p://dx.doi.org/10.1016/j.crad.2013.04.002

Table 1Summary of benign and malignant lesions subgroup pathology.
Benign lesions No. oflesions
Malignant lesions No. oflesions
Fibroadenomas 6 DCIS 6Fibrocystic disease 5 IDC Grade 1 4Sclerosing adenosis 2 IDC Grade 2 15Intraductal papilloma 2 IDC Grade 3 12
Lobular carcinoma 2Malignant phyllodes 2Breast Osteosarcoma 1
Total 15 42
S. Suppiah et al. / Clinical Radiology xxx (2013) e1ee9e4
fits, and R2 <0.695 were considered poor fits. For lesionswith poor curve fit, any measured value of the area underthe curve was considered background noise, therefore,these were considered to have no detectable tCho. The tCholevels detected on MRS peaks in these lesions were thencorrelated with histopathological results. The radiologistswere blinded to the patient data and histopathological re-sults at the time of analysis of the tCho peaks.
Statistical analysis
Data were entered and tabulated into a computerspreadsheet (Excel; Microsoft, Redmond, WA, USA). Statis-tical analysis was performed using statistical software SPSSversion 17.0 (Chicago, IL, USA). Statistical tests involving thecomparison of two categorical variables, e.g., significanttCho peak detection versus malignant histology were per-formed using Pearson’s chi-squared test. In cases wherecounts in the cells of the contingency tables were low,Fisher’s exact test was used instead. For comparison ofcontinuous variables, e.g., calculated tCho peak values, in-dependent sample t-tests were employed, except whenthere were more than two groups, in which case analysis ofvariance (ANOVA) was used. A p-value of <0.05 wasconsidered to be statistically significant with a confidencelevel set at 95%. Receiver-operator characteristic (ROC)curves were used for continuous data with a binaryoutcome to determine the sensitivity of data cut-off points.
Kappa values for inter- and intra-observer variabilitywere calculated and showed good agreement. For categor-ical variables, both intra- and interobserver agreement wasgood to excellent (Kappa value range ¼ 0.78e0.85,p < 0.05). For scale variables, Spearman’s correlation wereused to look for intra- and interobserver agreement, andfound good agreement for all variables measured (Spear-man’s rho range ¼ 0.81e0.88, p < 0.05). It was also notedthat in most categorical and scale variables, the intra-observer agreement yielded a higher agreement valuethan their interobserver counterpart.
Results
Sixty-one women were recruited for the study and post-processing was performed on 65 detected lesions. Therewere several lesions/spectra with suboptimal examinations(n ¼ 5) or without definite histopathology results (n ¼ 3),which were discarded from the final analysis. The fivesuboptimal examinations showed erratic spectrum withreduced signal to noise ratios (SNR) due to patient move-ment or breathing artefacts, and were discarded from thefinal analysis.
As a result, 52 patients and 57 lesions (42 malignant and15 benign; Table 1) were used in the final analysis. In thehistopathologically proven malignant group, 30 patientsunderwent mastectomies, eight patients opted for breastconservative surgery, and four patients refused surgery.
The MRS spectra for all lesions were initially analysedqualitatively. Forty out of the forty-two histopathologicallyprovenmalignant lesions demonstrated a tCho peak; and 14
Please cite this article in press as: Suppiah S, et al., Improved diagnostic avoxel proton MRS of the breast at 3 T MRI, Clinical Radiology (2013), htt
out of the 15 benign lesions did not have a significant tChopeak. Fig 2 shows an example of an invasive ductalcarcinoma (IDC) with suspicious morphology, demon-strated a washout pattern on kinetic curve and significanttCho on MRS. Two malignant lesions that did not demon-strate a significant choline peak were a 2.1 cm low-gradeIDC with prominent ductal carcinoma in situ (DCIS)component (patient 37) and a 1.8 cm low-grade DCIS (pa-tient 39). One benign fibroadenoma gave a false-positivefinding. A significant choline peak was also detected in amalignant phyllodes tumour.20 Fig 3 shows the typicalbenign features and absent choline peak on the spectra of abenign fibrocystic lesion. Significant tCho peak abovebaseline detected by MRS produced a sensitivity, specificity,PPV, and negative predictive value (NPV) of 95.2, 93.3, 97.6,and 87.5%, respectively (Table 2).
Consequently, selected spectra (n ¼ 32) were analysedfor good curve fit and the area under the curve was calcu-lated for each spectra. All malignant lesions showed goodcurve fit, with R2 values between 0.695 and 1.0 (Table 3)compared to benign lesions, which mostly had R2 valuesbelow 0.695 (Table 4). ROC curves showed that an R2 valueof 0.695 gave a sensitivity of 100% and specificity of 94%(Fig 4). Normalized arbitrary units (nAU) for lesions with R2
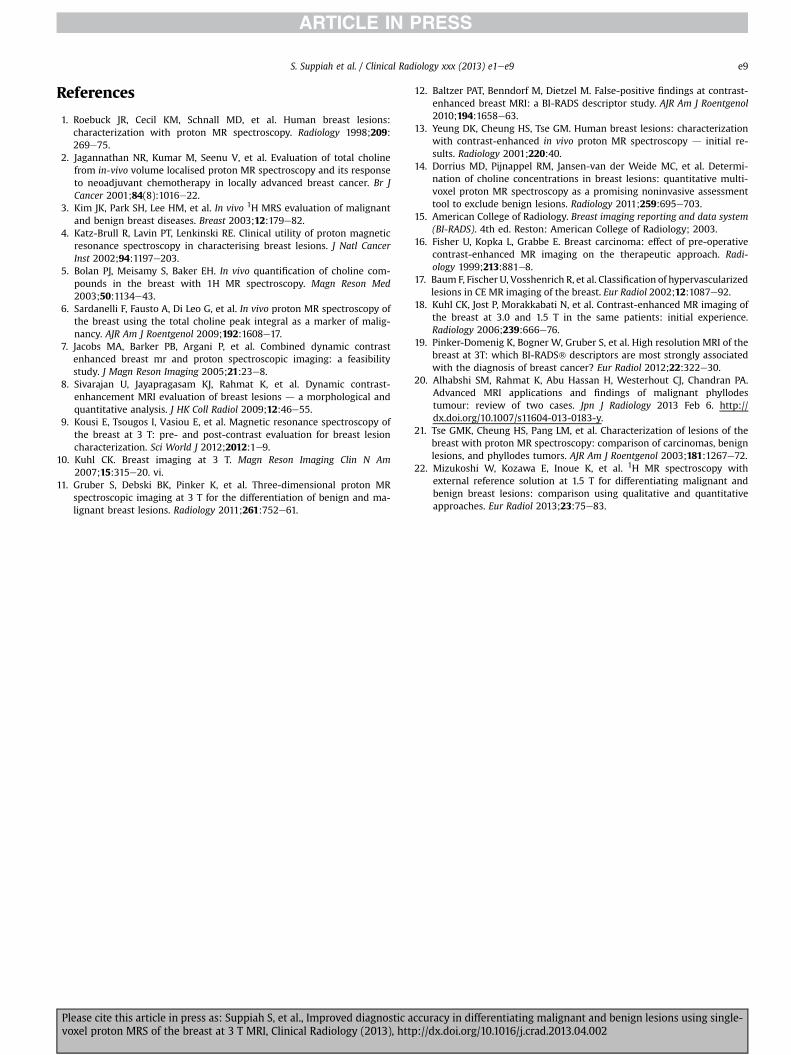
values <0.695 were considered to be not applicable. Fig 5shows the ROC curve for arbitrary units (AU) and nAUcorrelated with malignancy. Independent sample t-testshowed that nAU values significantly correlated with ma-lignancy (p ¼ 0.003). The mean nAU for malignant lesionswas higher than themean for non-malignant lesions (Fig 6).Lesions 20 and 29 had the highest nAU values, from patients37 and 47, who had grade 1 IDC and grade 2 IDC, respec-tively. Lesion 22 (from patient 38) was a benign fibroade-noma measuring 3.8 cm, which showed a good curve fit(R2 ¼ 0.92) and relatively higher nAU value compared withthe rest of the non-malignant lesions.
The optimal threshold for normalized tCho level was0.33 AU/mldequivalent to 0.33 mmol/l, which gave a goodtrade-off between sensitivity and specificity for the detec-tion of malignancy. It was also noted that the meannormalized tCho value for grade 1 IDCs was the highestcompared with grade 2 and grade 3 IDCs. The meannormalized tCho values for grade 1 (n ¼ 1), grade 2 (n ¼ 5),and grade 3 IDCs (n ¼ 6) were 3.9 � 4.07 AU/ml;2.96 � 2.41 AU/ml; and 1.38 � 0.90 AU/ml, respectively.However, the ANOVA test did not show that the normalized
ccuracy in differentiating malignant and benign lesions using single-p://dx.doi.org/10.1016/j.crad.2013.04.002

Figure 2 A 63-year-old woman (patient 47) with grade 2 invasive ductal carcinoma. Left mammogram in the caudo-cranial (a) and medio-lateraloblique (b) views showed an irregular, lobulated, high-density mass in the left upper inner quadrant (white arrow). (c) Colour Doppler ultra-sound showed a corresponding hypoechoic solid mass with several penetrating vessels at the 10 o’clock position of the left breast (white arrow).(d) Sagittal contrast-enhanced maximum intensity projection (MIP) images, showed a 5.1 cm irregular mass in the left upper quadrant (redsquare). (e) Kinetic curve analysis demonstrated rapid uptake with washout pattern (type 3 kinetic curve; true-positive DCE-MRI finding).(f) MRS showed elevated choline peak at 3.2 ppm (yellow arrow) (true-positive MRS finding).
S. Suppiah et al. / Clinical Radiology xxx (2013) e1ee9 e5
tCho for the three different histopathological grades of IDCsto be statistically significant (p ¼ 0.3).
The lesions were also assessed for their morphology andDCE-MRI kinetics characteristics. Lesions that had equivocalDCE findings but suspicious morphology or demonstratedwashout kinetics pattern after 3 min post-contrast mediumadministration were interpreted as malignant.18,19 For totalscoring, taking into account morphological features com-bined with DCE-MRI contrast wash-out, lesions with a scoreof >5 over 8 criteria were interpreted as malignant16,17; thesensitivity, specificity, PPV, and NPV were 100, 73.3, 91.3,and 100%, respectively (Table 2).
Discussion
MRS breast at 3 T has been shown to demonstrate betterdiagnostic efficacy and has the advantage of better spectralresolution to detect tCho peaks; therefore, there isimproved specificity and PPV for better detection of breastcarcinoma.9,11 The present study achieved 93.3% specificityby qualitative analysis of tCho peak height and 86.7%specificity for tCho values above 0.33 mmol/l by quantifi-cation of the area under the curve of the tCho peak; which iscompatible with prior breast MRS study results of between
Please cite this article in press as: Suppiah S, et al., Improved diagnostic avoxel proton MRS of the breast at 3 T MRI, Clinical Radiology (2013), htt
88.5e100% performed by Sardanelli et al.,6 Bolan et al.,5 Tseet al.21 and Kim et al.3
SVS 1HMRSwas chosen as it has a fast acquisition time ofless than6mincompared tomultivoxelMRS,whichgenerallytakes longer, i.e., approximately 10 min.14 SVS 1HMRS is alsoeasier to interpret as there is only one spectrum to analyse.The ROI is chosen carefully by selecting the most enhancingpartof thebreast lesion forvoxelplacement; therefore, givingan accurate representation of tCho level within the lesion.
Using an optimized threshold of the absolute tCho peakintegral expressed as arbitrary units is a simple and effec-tive method to quantify tCho in breast lesions. A 0.941sensitivity and 0.867 specificity was achieved with anormalized tCho equal to 0.33 AU/ml, which is comparableto a previous study conducted by Sardanelli et al.,6 whichachieved 0.842 sensitivity and 0.885 specificity with anormalized tCho equal to 0.85 AU/ml. A recent MRS study at1.5 T by Mizukoshi et al.22 in 2013 reported an tCho value of0.61 mmol/l as an optimal cut-off point, which achieved68% sensitivity and 79.4% specificity 22. In the present study,the optimal threshold for normalized tCho was 0.33 AU/ml,corresponding to approximately 0.33 mmol/l, and provideda good trade-off between sensitivity and specificity for thedetection of malignancy. At 3 T, metabolite peaks at MRS are
ccuracy in differentiating malignant and benign lesions using single-p://dx.doi.org/10.1016/j.crad.2013.04.002

Figure 3 A 50-year-old woman (patient 27) presented with a left breast lesion that was revealed to be fibrocystic disease. (a) T2-weighted axialimage showed the high signal lesion (red arrow) in the left upper outer quadrant. (b) Sagittal post-gadolinium multiplanar reformatted (MPR)image demonstrated the 3 cm lesion (red arrow) in the left upper outer quadrant. (c) Axial image of T1 fat-saturation contrast-enhanced MRIdemonstrated a well-defined, fairly homogeneously enhancing oval lesion in the left upper outer quadrant (red arrow). (d) MRS showed nosignificant elevation of choline peak at 3.2 ppm (yellow arrow; true-negative MRS finding).
S. Suppiah et al. / Clinical Radiology xxx (2013) e1ee9e6
better discernible, which enables even low values of tChopeaks to be significant for malignancy. Thus, lesions withnormalized tCho levels of �0.33 mmol/l should be biopsiedto rule out malignancy.
Figure 4 ROC curve using test variable of R2 for discriminating ma-lignant from non-malignant tissue.
Please cite this article in press as: Suppiah S, et al., Improved diagnostic avoxel proton MRS of the breast at 3 T MRI, Clinical Radiology (2013), htt
The VOI was placed after administration of gadolinium,which did not adversely affect the ability to detect cholinepeaks in malignant lesions as tCho peaks were detected inthe majority of malignant lesions. By injecting contrastmedium prior to MRS, the voxel prescription was focusedon the most metabolically active part of the tumour andadipose tissue was avoided. Kousi et al.9 also recommendedperforming MRS after gadolinium administration because itimproved small lesion localization and enabled better voxelprescription. They performed MRS before and after contrastmedium injection, and achieved a sensitivity/specificity of42.8%/84.6% and 78.5%/92.0%, respectively, for detecting
Table 2Diagnostic accuracy of using morphology and dynamic contrast-enhancedmagnetic resonance imaging (DCE-MRI) scoring versus magnetic resonancespectroscopy (MRS).
Grouping variable PPV(%)
NPV(%)
Sensitivity(%)
Specificity(%)
Scoring systemScores of >5 versus
scores <591.3 100.0 100.0 73.3
MRSCholine peak detection
versus no peak97.6 87.5 95.2 93.3
PPV, positive predictive value; NPV, negative predictive value.
ccuracy in differentiating malignant and benign lesions using single-p://dx.doi.org/10.1016/j.crad.2013.04.002

Table 3Quantitative analysis of malignant lesions.
Lesion no. Patient no. Age (years) LLD (cm) R2 VOI (ml) Absolute tChoPeak Integral (AU)
Normalized tChoPeak Integral (AU/ml)
Histopathology findings
1 26 54 5.8 0.98 1.75 5.25 3.28 IDC grade 22 27 65 1.8 0.91 1.89 1.62 1.02 IDC grade 14 28 53 5.4 0.97 2.59 1.39 0.92 IDC grade 36 29 55 5.2 0.98 3.42 2.49 1.66 IDC grade 38 30 65 1.8 0.91 1.89 1.62 1.02 IDC grade 19 31 43 2.0 0.71 6.40 0.95 0.59 IDC grade 211 32 65 2.6 0.98 3.42 3.14 2.09 IDC grade 213 33 45 2.5 0.92 3.14 2.86 1.91 IDC grade 217 35 45 5.8 0.90 6.00 1.28 0.85 IDC grade 320 37 39 2.1 0.75 2.98 10.8 6.78 IDC grade 123 39 59 1.8 0.76 2.94 0.94 0.63 DCIS grade 125 40 68 3.1 0.77 3.69 0.85 0.57 IDC grade 327 44 31 7.5 0.89 10.02 11.51 3.05 IDC grade 328 46 62 1.4 0.99 1.31 1.30 1.30 DCIS grade 329 47 63 5.1 0.99 4.36 12.2 6.92 IDC grade 230 48 65 3.2 0.81 5.38 1.97 1.23 IDC grade 331 50 32 15.8 0.94 7.36 0.14 0.09 Malignant phyllodesMean 52.5 4.6 0.88 4.11 3.61 2.04SD 11.7 3.5 0.11 2.26 3.95 2.00Median 54.0 3.2 0.91 3.42 1.97 1.3025th percentile 44.0 2.1 0.77 2.77 1.12 0.7475th percentile 64.0 5.8 0.98 5.69 4.20 2.57
LLD, largest lesion diameter; VOI, volume of interest; R2, best spectral curve fit; tCho, total choline containing compounds; AU, arbitrary unit.
S. Suppiah et al. / Clinical Radiology xxx (2013) e1ee9 e7
tCho presence. In addition, an intermediate TE value of155 ms was chosen, which provided a good trade-off be-tween satisfactory SNR and clearly resolvable choline peaksat 3.2 ppmwhile minimizing possible relaxation losses andmotion-related artefacts associated with longer TEs.
Normalized tCho levels were detected in the range of0.09e6.92 AU/ml within 17 malignant and one benign le-sions. This finding is comparable to the study performed bySardanelli et al.,6 which detected tCho levels between
Table 4Quantitative analysis of non-malignant lesions.
Lesion no. Patient no. Age (years) LLD (cm) R2 VOI (ml)
3 27 65 NA 0.04 3.495 28 53 NA 0.59 3.697 29 55 NA 0.03 3.4210 31 48 NA 0.51 2.9812 32 65 NA 0.21 2.6614 33 45 NA 0.48 3.1416 34 20 NA 0.69 3.6918 35 45 NA �0.02 6.0019 37 39 NA 0.23 2.2424 39 59 NA 0.07 2.9426 40 68 NA 0.29 3.6915 34 20 2.3 0.69 4.5621 37 39 1.4 0.17 3.4522 38 20 3.8 0.92 2.9832 57 46 1.3 0.55 2.02Mean 31.3 2.2 0.58 3.25SD 13.3 1.2 0.31 1.06Median 29.5 2.1 0.62 3.2125th percentile 20.0 1.4 0.27 2.2675th percentile 44.3 2.7 0.86 4.28
LLD, largest lesion diameter; VOI, volume of interest; R2, best spectral curve fit; tChFCD, fibrocystic disease.
Please cite this article in press as: Suppiah S, et al., Improved diagnostic avoxel proton MRS of the breast at 3 T MRI, Clinical Radiology (2013), htt
0.38e19.8 AU/ml. It also concurs with studies by Bolanet al.5 and Roebuck et al.,1 which detected levels between0.4e10 and 0.4e5.8mmol/l, respectively, using phantoms ofknown choline concentration to study and further quantifythe tCho to millimoles per litre units.
Although there was some overlap of values amongbenign and malignant lesions (Fig 6), malignant lesions hada higher mean normalized tCho value of 2.04 � 2 AU/ml,compared with non-malignant lesions that had a mean
Absolute tChoPeak Integral (AU)
Normalized tChoPeak Integral (AU/ml)
Histopathology findings
0.00 0.00 Normal tissue0.00 0.00 Normal tissue0.00 0.00 Normal tissue0.00 0.00 Normal tissue0.00 0.00 Normal tissue0.00 0.00 Normal tissue0.00 0.00 Normal tissue0.00 0.00 Normal tissue0.00 0.00 Normal tissue0.00 0.00 Normal tissue0.00 0.00 Normal tissue0.00 0.00 FA0.00 0.00 FA1.76 1.10 FA0.00 0.00 FCD0.12 0.090.45 0.320.00 0.000.00 0.000.00 0.00
o, total choline containing compounds; AU, arbitrary unit; FA, fibroadenoma;
ccuracy in differentiating malignant and benign lesions using single-p://dx.doi.org/10.1016/j.crad.2013.04.002
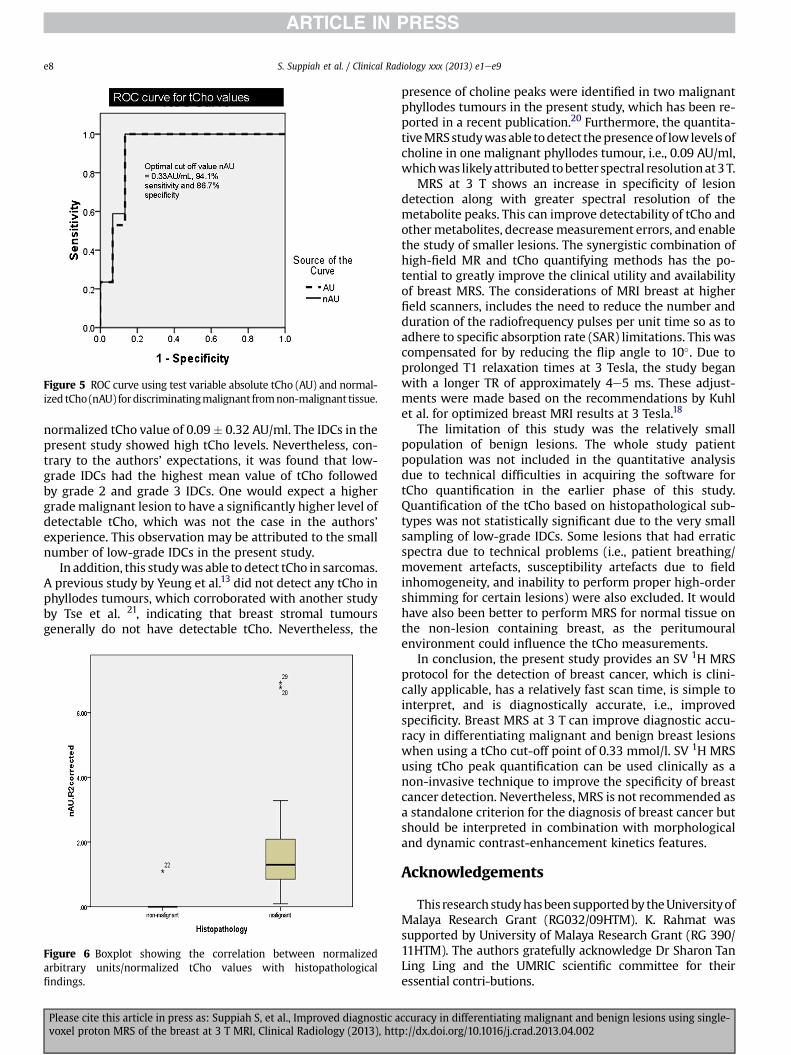
Figure 5 ROC curve using test variable absolute tCho (AU) and normal-ized tCho (nAU) fordiscriminatingmalignant fromnon-malignant tissue.
S. Suppiah et al. / Clinical Radiology xxx (2013) e1ee9e8
normalized tCho value of 0.09� 0.32 AU/ml. The IDCs in thepresent study showed high tCho levels. Nevertheless, con-trary to the authors’ expectations, it was found that low-grade IDCs had the highest mean value of tCho followedby grade 2 and grade 3 IDCs. One would expect a highergrademalignant lesion to have a significantly higher level ofdetectable tCho, which was not the case in the authors’experience. This observation may be attributed to the smallnumber of low-grade IDCs in the present study.
In addition, this studywas able to detect tCho in sarcomas.A previous study by Yeung et al.13 did not detect any tCho inphyllodes tumours, which corroborated with another studyby Tse et al. 21, indicating that breast stromal tumoursgenerally do not have detectable tCho. Nevertheless, the
Figure 6 Boxplot showing the correlation between normalizedarbitrary units/normalized tCho values with histopathologicalfindings.
Please cite this article in press as: Suppiah S, et al., Improved diagnostic avoxel proton MRS of the breast at 3 T MRI, Clinical Radiology (2013), htt
presence of choline peaks were identified in two malignantphyllodes tumours in the present study, which has been re-ported in a recent publication.20 Furthermore, the quantita-tiveMRSstudywasable todetect thepresenceof lowlevels ofcholine in one malignant phyllodes tumour, i.e., 0.09 AU/ml,whichwas likelyattributed tobetter spectral resolutionat3T.
MRS at 3 T shows an increase in specificity of lesiondetection along with greater spectral resolution of themetabolite peaks. This can improve detectability of tCho andothermetabolites, decreasemeasurement errors, and enablethe study of smaller lesions. The synergistic combination ofhigh-field MR and tCho quantifying methods has the po-tential to greatly improve the clinical utility and availabilityof breast MRS. The considerations of MRI breast at higherfield scanners, includes the need to reduce the number andduration of the radiofrequency pulses per unit time so as toadhere to specific absorption rate (SAR) limitations. This wascompensated for by reducing the flip angle to 10�. Due toprolonged T1 relaxation times at 3 Tesla, the study beganwith a longer TR of approximately 4e5 ms. These adjust-ments were made based on the recommendations by Kuhlet al. for optimized breast MRI results at 3 Tesla.18
The limitation of this study was the relatively smallpopulation of benign lesions. The whole study patientpopulation was not included in the quantitative analysisdue to technical difficulties in acquiring the software fortCho quantification in the earlier phase of this study.Quantification of the tCho based on histopathological sub-types was not statistically significant due to the very smallsampling of low-grade IDCs. Some lesions that had erraticspectra due to technical problems (i.e., patient breathing/movement artefacts, susceptibility artefacts due to fieldinhomogeneity, and inability to perform proper high-ordershimming for certain lesions) were also excluded. It wouldhave also been better to perform MRS for normal tissue onthe non-lesion containing breast, as the peritumouralenvironment could influence the tCho measurements.
In conclusion, the present study provides an SV 1H MRSprotocol for the detection of breast cancer, which is clini-cally applicable, has a relatively fast scan time, is simple tointerpret, and is diagnostically accurate, i.e., improvedspecificity. Breast MRS at 3 T can improve diagnostic accu-racy in differentiating malignant and benign breast lesionswhen using a tCho cut-off point of 0.33 mmol/l. SV 1H MRSusing tCho peak quantification can be used clinically as anon-invasive technique to improve the specificity of breastcancer detection. Nevertheless, MRS is not recommended asa standalone criterion for the diagnosis of breast cancer butshould be interpreted in combination with morphologicaland dynamic contrast-enhancement kinetics features.
Acknowledgements
This researchstudyhasbeensupportedby theUniversityofMalaya Research Grant (RG032/09HTM). K. Rahmat wassupported by University of Malaya Research Grant (RG 390/11HTM). The authors gratefully acknowledge Dr Sharon TanLing Ling and the UMRIC scientific committee for theiressential contri-butions.
ccuracy in differentiating malignant and benign lesions using single-p://dx.doi.org/10.1016/j.crad.2013.04.002
S. Suppiah et al. / Clinical Radiology xxx (2013) e1ee9 e9
References
1. Roebuck JR, Cecil KM, Schnall MD, et al. Human breast lesions:characterization with proton MR spectroscopy. Radiology 1998;209:269e75.
2. Jagannathan NR, Kumar M, Seenu V, et al. Evaluation of total cholinefrom in-vivo volume localised proton MR spectroscopy and its responseto neoadjuvant chemotherapy in locally advanced breast cancer. Br JCancer 2001;84(8):1016e22.
3. Kim JK, Park SH, Lee HM, et al. In vivo 1H MRS evaluation of malignantand benign breast diseases. Breast 2003;12:179e82.
4. Katz-Brull R, Lavin PT, Lenkinski RE. Clinical utility of proton magneticresonance spectroscopy in characterising breast lesions. J Natl CancerInst 2002;94:1197e203.
5. Bolan PJ, Meisamy S, Baker EH. In vivo quantification of choline com-pounds in the breast with 1H MR spectroscopy. Magn Reson Med2003;50:1134e43.
6. Sardanelli F, Fausto A, Di Leo G, et al. In vivo proton MR spectroscopy ofthe breast using the total choline peak integral as a marker of malig-nancy. AJR Am J Roentgenol 2009;192:1608e17.
7. Jacobs MA, Barker PB, Argani P, et al. Combined dynamic contrastenhanced breast mr and proton spectroscopic imaging: a feasibilitystudy. J Magn Reson Imaging 2005;21:23e8.
8. Sivarajan U, Jayapragasam KJ, Rahmat K, et al. Dynamic contrast-enhancement MRI evaluation of breast lesions d a morphological andquantitative analysis. J HK Coll Radiol 2009;12:46e55.
9. Kousi E, Tsougos I, Vasiou E, et al. Magnetic resonance spectroscopy ofthe breast at 3 T: pre- and post-contrast evaluation for breast lesioncharacterization. Sci World J 2012;2012:1e9.
10. Kuhl CK. Breast imaging at 3 T. Magn Reson Imaging Clin N Am2007;15:315e20. vi.
11. Gruber S, Debski BK, Pinker K, et al. Three-dimensional proton MRspectroscopic imaging at 3 T for the differentiation of benign and ma-lignant breast lesions. Radiology 2011;261:752e61.
Please cite this article in press as: Suppiah S, et al., Improved diagnostic avoxel proton MRS of the breast at 3 T MRI, Clinical Radiology (2013), htt
12. Baltzer PAT, Benndorf M, Dietzel M. False-positive findings at contrast-enhanced breast MRI: a BI-RADS descriptor study. AJR Am J Roentgenol2010;194:1658e63.
13. Yeung DK, Cheung HS, Tse GM. Human breast lesions: characterizationwith contrast-enhanced in vivo proton MR spectroscopy d initial re-sults. Radiology 2001;220:40.
14. Dorrius MD, Pijnappel RM, Jansen-van der Weide MC, et al. Determi-nation of choline concentrations in breast lesions: quantitative multi-voxel proton MR spectroscopy as a promising noninvasive assessmenttool to exclude benign lesions. Radiology 2011;259:695e703.
15. American College of Radiology. Breast imaging reporting and data system(BI-RADS). 4th ed. Reston: American College of Radiology; 2003.
16. Fisher U, Kopka L, Grabbe E. Breast carcinoma: effect of pre-operativecontrast-enhanced MR imaging on the therapeutic approach. Radi-ology 1999;213:881e8.
17. Baum F, Fischer U, Vosshenrich R, et al. Classification of hypervascularizedlesions in CE MR imaging of the breast. Eur Radiol 2002;12:1087e92.
18. Kuhl CK, Jost P, Morakkabati N, et al. Contrast-enhanced MR imaging ofthe breast at 3.0 and 1.5 T in the same patients: initial experience.Radiology 2006;239:666e76.
19. Pinker-Domenig K, Bogner W, Gruber S, et al. High resolution MRI of thebreast at 3T: which BI-RADS� descriptors are most strongly associatedwith the diagnosis of breast cancer? Eur Radiol 2012;22:322e30.
20. Alhabshi SM, Rahmat K, Abu Hassan H, Westerhout CJ, Chandran PA.Advanced MRI applications and findings of malignant phyllodestumour: review of two cases. Jpn J Radiology 2013 Feb 6. http://dx.doi.org/10.1007/s11604-013-0183-y.
21. Tse GMK, Cheung HS, Pang LM, et al. Characterization of lesions of thebreast with proton MR spectroscopy: comparison of carcinomas, benignlesions, and phyllodes tumors. AJR Am J Roentgenol 2003;181:1267e72.
22. Mizukoshi W, Kozawa E, Inoue K, et al. 1H MR spectroscopy withexternal reference solution at 1.5 T for differentiating malignant andbenign breast lesions: comparison using qualitative and quantitativeapproaches. Eur Radiol 2013;23:75e83.
ccuracy in differentiating malignant and benign lesions using single-p://dx.doi.org/10.1016/j.crad.2013.04.002