Coral Calcification Under Ocean Acidification and Global Change
Barbosa JHO et al. / SWI: calcification and hemosiderin
Radiol Bras. 2015 Mar/Abr;48(2):93–100 93
0100-3984 © Colégio Brasileiro de Radiologia e Diagnóstico por Imagem
Original Article
Susceptibility weighted imaging: differentiating betweencalcification and hemosiderin*
Imagem ponderada em suscetibilidade magnética: diferenciando calcificação de hemossiderina
Barbosa JHO, Santos AC, Salmon CEG. Susceptibility weighted imaging: differentiating between calcification and hemosiderin. Radiol Bras. 2015 Mar/
Abr;48(2):93–100.
Abstract
Resumo
Objective: To present a detailed explanation on the processing of magnetic susceptibility weighted imaging (SWI), demonstrating the
effects of echo time and sensitive mask on the differentiation between calcification and hemosiderin.
Materials and Methods: Computed tomography and magnetic resonance (magnitude and phase) images of six patients (age range 41–
54 years; four men) were retrospectively selected. The SWI images processing was performed using the Matlab’s own routine.
Results: Four out of the six patients showed calcifications at computed tomography images and their SWI images demonstrated
hyperintense signal at the calcification regions. The other patients did not show any calcifications at computed tomography, and SWI
revealed the presence of hemosiderin deposits with hypointense signal.
Conclusion: The selection of echo time and of the mask may change all the information on SWI images, and compromise the diagnostic
reliability. Amongst the possible masks, the authors highlight that the sigmoid mask allows for contrasting calcifications and hemosiderin
on a single SWI image.
Keywords: SWI; Magnetic resonance imaging; Magnetic susceptibility; Calcification; Hemosiderin.
Objetivo: Expor em detalhes o processamento da imagem ponderada em suscetibilidade magnética (susceptibility weighted imaging –
SWI), destacando o efeito da escolha do tempo de eco e da máscara sensível à diferenciação de calcificação e hemossiderina simul-
taneamente.
Materiais e Métodos: Imagens de tomografia computadorizada e por ressonância magnética (magnitude e fase) foram selecionadas,
retrospectivamente, de seis pacientes (idades entre 41 e 54 anos; quatro homens). O processamento das imagens SWI foi realizado
em rotina própria no programa Matlab.
Resultados: Dos seis pacientes estudados, quatro apresentaram calcificações nas imagens de tomografia computadorizada. Nestes, as
imagens SWI mostraram sinal hiperintenso para as regiões de calcificações. Os outros dois pacientes não apresentaram calcificações
nas imagens de tomografia computadorizada e apresentaram depósito de hemossiderina com sinal hipointenso na imagem SWI.
Conclusão: A escolha do tempo de eco e da máscara pode alterar toda a informação da imagem SWI e comprometer a confiabilidade
diagnóstica. Dentre as possíveis máscaras, destacamos que a máscara sigmoide permite contrastar calcificação e hemossiderina em
uma única imagem SWI.
Unitermos: SWI; Ressonância magnética; Suscetibilidade magnética; Calcificação; Hemossiderina.
* Study developed at Universidade de São Paulo – Programa de Pós-Graduação
em Física Aplicada a Medicina e Biologia, Ribeirão Preto, SP, Brazil. Financial sup-
port: Fundação de Amparo à Pesquisa do Estado de São Paulo (Fapesp), Conselho
Nacional de Desenvolvimento Científico e Tecnológico (CNPq) and Coordenação de
Aperfeiçoamento de Pessoal de Nível Superior (Capes).
1. Master, Fellow PhD degree, Faculdade de Filosofia, Ciências e Letras de Ribei-
rão Preto da Universidade de São Paulo (FFCLRP-USP), Ribeirão Preto, SP, Brazil.
2. PhD, Professor, Faculdade de Medicina de Ribeirão Preto da Universidade de
São Paulo (FMRP-USP), Ribeirão Preto, SP, Brazil.
3. PhD, Professor, Faculdade de Filosofia, Ciências e Letras de Ribeirão Preto da
Universidade de São Paulo (FFCLRP-USP), Ribeirão Preto, SP, Brazil.
Mailing Address: Jeam Haroldo Oliveira Barbosa. Faculdade de Filosofia, Ciências
e Letras de Ribeirão Preto – Universidade de São Paulo. Avenida Bandeirantes,
3900, Monte Alegre. Ribeirão Preto, SP, Brasil, 14040-901. E-mail: jeamharoldo@
hotmail.com.
Received February 18, 2014. Accepted after revision August 5, 2014.
based on the significant differences between transverse re-
laxation (T2) and/or longitudinal relaxation (T1) in the study
region. However, relaxometry-weighted images cannot dif-
ferentiate between hemosiderin and calcifications since both
reduce the relaxation times due to inhomogeneity of the
magnetic field generated by paramagnetic and diamagnetic
atoms, respectively. On the other hand, susceptibility-
weighted imaging (SWI) enhances the contrast of calcifica-
tions and hemosiderin deposits(1,2). Thus, SWI has supple-
mented the clinical diagnosis of neurological disorders
(cranioencephalic trauma and harmful clots), hemorrhagic
disorders (vascular malformation, cerebral infarction and
neoplasias) and neuroinfectious conditions (neurotoxoplas-
mosis and neurocysticercosis)(3).
The SWI is generated by means of multiplication of mag-
nitude image by a mask with values between 0 and 1 obtained
from the phase image. Both images are generally acquired
with a conventional clinical gradient echo (GE) sequence
Jeam Haroldo Oliveira Barbosa1, Antonio Carlos Santos2, Carlos Ernesto Garrido Salmon3
http://dx.doi.org/10.1590/0100-3984.2014.0010
INTRODUCTION
In the clinical practice, the most frequently utilized mag-
netic resonance imaging modality is fundamentally weighted
by relaxation time of tissues. At these images, the contrast is
Barbosa JHO et al. / SWI: calcification and hemosiderin
Radiol Bras. 2015 Mar/Abr;48(2):93–10094
the sensitive mask to differentiate between calcification and
hemosiderin, simultaneously in six patients with different di-
agnostic hypotheses. Additionally, the authors evaluated the
effectiveness of this procedure, considering CT as the gold
standard.
MATERIALS AND METHODS
Subjects
Six patients (four men and two women; age range be-
tween 41 and 54 years) were selected to illustrate the appli-
cation of SWI as well the technique validity. The retrospec-
tive selection was made after the images acquisition, according
to the following criteria: a) diagnostic suspicion of neurotoxo-
plasmosis, ventricular cysts and hemosiderin deposition; b)
neurological CT and MRI studies at an interval of at least 3
months (except for one patient with suspected neurotoxo-
plasmosis, with an interval of 10 months between examina-
tions); c) absence of artifacts at both imaging modalities; d)
reports issued and reviewed by at least two neuroradiologists,
and confirmation of the diagnostic suspicion.
Imaging parameters
MRI scans were performed in the axial plane with a 3D-
GE (PRESTO) sequence, in a 3.0T magnetic field (Achieva;
Philips), with 8-channel SENSE head coil. Phase and mag-
nitude data were stored. The sequence parameters were the
following: TE, 23.1 ms; repetition time (TR), 16.3 ms; flip
angle, 10°; spatial resolution, 0.57 × 0.57 × 0.85 mm3; field
of view (FOV), 218 × 218 × 127 mm3; SENSE, 2.
The CT images were acquired in a Brilliance Big Bore
(Philips) apparatus in the axial plane, with the following
parameters: 257 mAs/120 kV; spatial resolution, 0.39 × 0.39
× 5.0 mm3; FOV, 199 × 199 × 150 mm3.
SWI processing
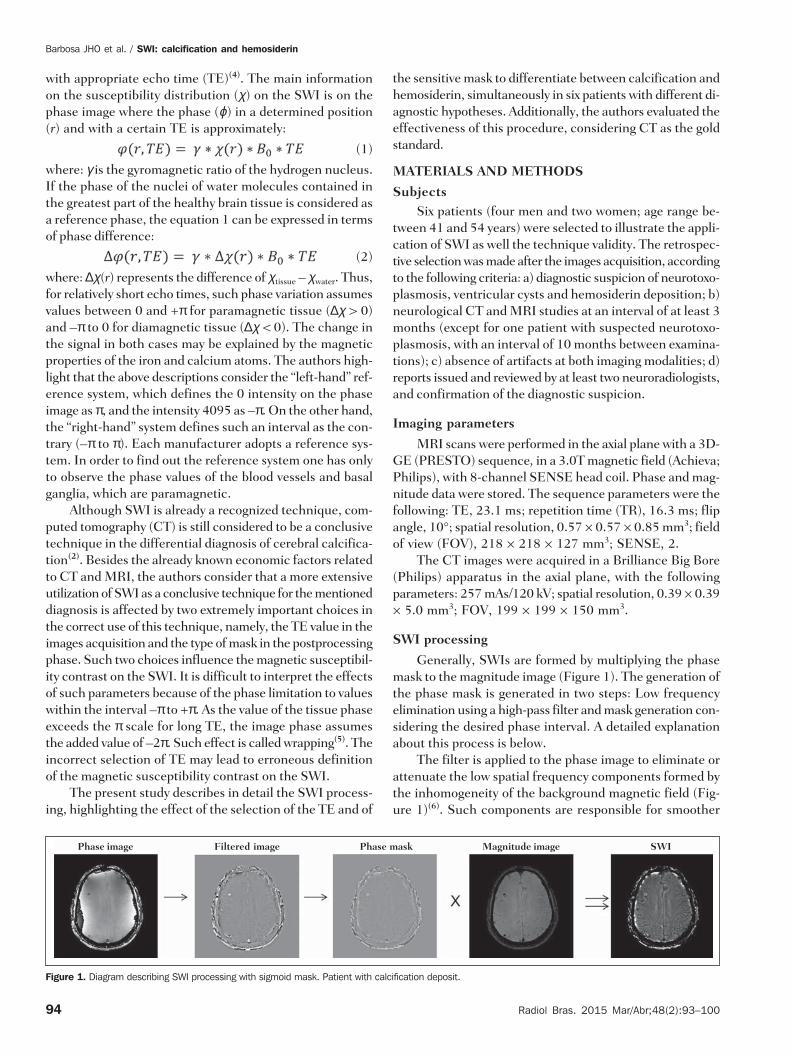
Generally, SWIs are formed by multiplying the phase
mask to the magnitude image (Figure 1). The generation of
the phase mask is generated in two steps: Low frequency
elimination using a high-pass filter and mask generation con-
sidering the desired phase interval. A detailed explanation
about this process is below.
The filter is applied to the phase image to eliminate or
attenuate the low spatial frequency components formed by
the inhomogeneity of the background magnetic field (Fig-
ure 1)(6). Such components are responsible for smoother
Figure 1. Diagram describing SWI processing with sigmoid mask. Patient with calcification deposit.
Phase image Filtered image Phase mask Magnitude image SWI
with appropriate echo time (TE)(4). The main information
on the susceptibility distribution (χ) on the SWI is on the
phase image where the phase (ϕ) in a determined position
(r) and with a certain TE is approximately:
(1)
where: γ is the gyromagnetic ratio of the hydrogen nucleus.
If the phase of the nuclei of water molecules contained in
the greatest part of the healthy brain tissue is considered as
a reference phase, the equation 1 can be expressed in terms
of phase difference:
(2)
where: ∆χ(r) represents the difference of χtissue – χwater. Thus,
for relatively short echo times, such phase variation assumes
values between 0 and +π for paramagnetic tissue (∆χ > 0)
and –π to 0 for diamagnetic tissue (∆χ < 0). The change in
the signal in both cases may be explained by the magnetic
properties of the iron and calcium atoms. The authors high-
light that the above descriptions consider the “left-hand” ref-
erence system, which defines the 0 intensity on the phase
image as π, and the intensity 4095 as –π. On the other hand,
the “right-hand” system defines such an interval as the con-
trary (–π to π). Each manufacturer adopts a reference sys-
tem. In order to find out the reference system one has only
to observe the phase values of the blood vessels and basal
ganglia, which are paramagnetic.
Although SWI is already a recognized technique, com-
puted tomography (CT) is still considered to be a conclusive
technique in the differential diagnosis of cerebral calcifica-
tion(2). Besides the already known economic factors related
to CT and MRI, the authors consider that a more extensive
utilization of SWI as a conclusive technique for the mentioned
diagnosis is affected by two extremely important choices in
the correct use of this technique, namely, the TE value in the
images acquisition and the type of mask in the postprocessing
phase. Such two choices influence the magnetic susceptibil-
ity contrast on the SWI. It is difficult to interpret the effects
of such parameters because of the phase limitation to values
within the interval –π to +π. As the value of the tissue phase
exceeds the π scale for long TE, the image phase assumes
the added value of –2π. Such effect is called wrapping(5). The
incorrect selection of TE may lead to erroneous definition
of the magnetic susceptibility contrast on the SWI.
The present study describes in detail the SWI process-
ing, highlighting the effect of the selection of the TE and of

Barbosa JHO et al. / SWI: calcification and hemosiderin
Radiol Bras. 2015 Mar/Abr;48(2):93–100 95
spatial variations on the images, thus they do not represent
local variables, rather global, such as total contrast and av-
erage pixel intensity. The background magnetic field is gen-
erated by outside sources, such as, inhomogeneity of the
static magnetic field (B0) and non-uniformity of the
radiofrequency field. Several types of high-pass filters can
be used, here we applied a simple version as suggested by
Haacke et al.(7). In this case, the filtered phase image is cal-
culated from the original complex image in the 2D k-space,
truncating it in the central n x n points, adding zeros in the
elements outside the truncated region and then making the
subtraction of the resultant truncated phase image and the
original phase image, in the real space. The window size (n
× n) will depend on the relation between signal-noise ratio
loss on the phase image and the background field elimina-
tion, a convenient value is 64 × 64 considering brain im-
ages with a FOV close to 256 mm.
The phase mask generation is the most important step
in SWI processing. The paramagnetic or diamagnetic con-
trast weighting is defined in this step. The phase image may
assume only values of –π to +π by the Fourier transform prop-
erties and limitations of the system of MRI signal acquisi-
tion. Thus, discontinuity values of up to 2π may be observed
on the phase image, in case the value exceeds such limits.
Such effect is more common for long echo times, as shown
on Figure 2. Such figure presents phase images with TE =
23 ms (Figure 2A) and TE = 40 ms (Figure 2B), the latter
obtained by means of simulation of phase evolution from the
first one. According to the equation 2 for values of suscepti-
bility difference between hemosiderin and white matter (∆χ= 0.25 ppm)(8), one can observe in the chart on Figure 2,
that the phase difference for TE = 23 ms is approximately
–π/2, and for TE = 40 ms this value should be +π. Wrap-
ping is also observed for the susceptibility difference between
calcifications and white matter (∆χ = –0.15 ppm)(8), shown
on the chart: for TE = 23 ms, the phase is π/2 and for TE =
40 ms the phase is –2π/3. Thus, the phase evolved with the
TE and according to the tissue susceptibility difference.
The wrapping suggests undesirable TE values for the
differentiation of hemosiderin deposition and calcification
lesions, depending on the magnetic field strengths. For 3T,
as exemplified on Figure 2, with echo times approaching
13 and 27 ms, the phase difference in the central region of
both types of lesions tend to a single value, making a cor-
rect distinction more difficult. Additionally, depending on
the interval where the selected TE is situated, intensities will
alternate between both types of lesions.
The phase mask is based on the linear relation between
the phase evolution and the magnetic susceptibility (equa-
tion 1), valid for all the points of the image acquired in a
determined magnetic field (B0) and with a single TE. Such
mask is applied to enhance the differences on the phase
images on the basis of magnitude images with a more ana-
tomical aspect of easier interpretation.
Different masks may be defined, always with values be-
tween 0 and 1 (Figure 3). A common example that is easy
to be illustrated is the negative mask, assuming a unitary value
for phases > 0 and from 0 to 1 for phase values in the inter-
val [–π, 0]. Another example is the positive mask, assuming
1 for phase values < 0 and 0 to 1 for the interval [0, π]. The
previous masks may be individually utilized to enhance a
specific type of lesion. On the other hand, the sigmoid mask(9)
is more general and allows for differentiation between para-
magnetic and diamagnetic tissues on a single susceptibility-
weighted image. Such mask follows the behavior of the sig-
moid function described on equation 3:
Figure 2. Wrapping effect on phase image of a patient with hemosiderin deposit. A and B phase images with TE = 23 ms and 40 ms, respectively. The chart includes
phase values simulated with the “left hand” system for regions with hemosiderin and calcification deposits, considering a 3T field. The highlighted spots on the chart
indicate phase values for TE = 23 ms and TE = 40 ms.
Hemosiderin Calcification

Barbosa JHO et al. / SWI: calcification and hemosiderin
Radiol Bras. 2015 Mar/Abr;48(2):93–10096
(3)
The adjustment parameters “a” and “b” are freely selected
as to achieve a good contrast-noise ratio(9). In this paper, a
sigmoid mask (parameters a = 0.5 and b = –0.15) was used
to differentiate paramagnetic and diamagnetic tissues.
Subsequently, the phase mask is multiplied n times over
the magnitude image to generate the susceptibility-weighted
image. The number n of multiplications should be selected
to optimize the contrast-noise ratio at SWI, as demonstrated
by Reichenbach et al., such number should be close to 4(10).
Figure 4 exemplifies the change of the contrast-noise for the
use of sigmoid mask multiplied 4, 6 and 8 times over the
magnitude image of a patient with hemosiderin deposition.
In the present study, the SWI processing was performed
in a home-made Matlab routine. In summary, a high-pass
(HP) filter with window size 64 × 64(11) was selected and a
sigmoid mask × 4 was applied(10).
Figure 3. Phase masks defined
with values between 0 and 1 ac-
cording to the phase values.
Negative Positive Sigmoid
Figure 4. Susceptibility-weighted images of a patient with hemosiderin deposit (indicated with the dashed line), with different sigmoid mask multiplications A: n = 4;
B: n = 6; C: n = 8. The chart includes signal intensity values for SWI along the profile indicated by the dotted line on the magnified image.
A B C
Sig
nal
in
ten
sity
(u
.a)
Position along the region
Effect of the spatial distribution of the phase in regions
adjacent to the lesion
In addition to the punctual dependence between the
phase difference and the tissue susceptibility difference, as
approached by equation 1, the ∆ϕ(r,TE) is also affected in
the adjacent areas, a fact that is frequently observed at the
sections inferiorly and superiorly to the hemosiderin deposit
or calcification (Figure 5). A more general way to write the
equation 2 is to express ∆ϕ(r,TE) as a function linearly de-
pendent of the perturbation in the main magnetic field ∆B(r)
along the B0 vector; the other components are not consid-
ered:
(4)
As calcification and hemosiderin deposits with spheri-
cal geometry centered at the origin are considered, the per-
turbation of the magnetic field at an arbitrary point result-
ing from such deposits might be written as follows(12):

Barbosa JHO et al. / SWI: calcification and hemosiderin
Radiol Bras. 2015 Mar/Abr;48(2):93–100 97
for r ≤ a (5a)
for r > a (5b)
where: a indicates the radius of the spherical lesion, and θ is
the angle between the position vector (r) and the main mag-
netic field axis (z axis).
Using the equations 4, 5a and 5b, the authors simulated
the effect of the phase evolution on the sections inferiorly
and superiorly to the calcification and hemosiderin deposi-
tion with a 10 mm radius, and considering a 3T magnetic
field intensity and TE = 23 ms. In such simulation, ∆χ =
0.25 ppm for hemosiderin, and ∆χ = –0.20 ppm for calcifi-
cation were assumed.
Figure 5. SWI filtered phase images (64 × 64) of a patient with calcification and other with CT-proved hemosiderin deposit. These images demonstrate the non-local
of the phase evolution the on the section inferiorly and superiorly to the hemosiderin deposit and with opposite behavior for calcification and hemosiderin.
Calcification Hemosiderin
Cra
nio
caudal d
irectio
n
RESULTS
Only four (1, 2, 3 and 4) out of the six patients presented
calcifications at the CT images. For such patients, the sus-
ceptibility-weighted images presented hyperintense signal on
the calcification regions (Figure 6, continuous arrows). The
other two patients (5 and 6) did not present any detectable
calcifications at the CT images and presented hemosiderin
deposits with hypointensity at SWI(Figure 6, dotted arrows).
The HP filter failed to filter some wrapping artifacts on
the SWI of the patients 2 and 4. Generally, such artifacts
occurred in regions of great magnetic susceptibility differ-
ence, as the region of the nasal sinuses and ears.
Figure 7 shows the phase evolution effect inferiorly and
superiorly to the radius of the simulated calcification and

Barbosa JHO et al. / SWI: calcification and hemosiderin
Radiol Bras. 2015 Mar/Abr;48(2):93–10098
hemosiderin deposition. Regions outside the lesion show
phase values induced by the adjacent lesion.
DISCUSSION
SWI has been suggested to identify cerebral hemosid-
erin and calcification deposition(2). The proposed analysis
allowed for the differentiation of such deposits by means of
SWI using a sigmoid mask, and the results were validated
by CT image.
Hemosiderin deposits include Fe+3 atoms, which are
paramagnetic and distort the local magnetic Field at mo-
lecular level(12). The magnetic field distortion causes a dif-
ferent interaction between each nuclear spin of the tissue and
the local magnetic field. Therefore, the phase resulting from
the voxel with hemosiderin deposit evolves much more than
the normal tissue in the adjacent voxel. Calcifications con-
tain Ca+2 diamagnetic atoms which also distort the magnetic
field leading to spins phase evolution. The phase evolution
MaskMagnitude SWI CT
1
2
3
4
5
6
Figure 6. Magnitude, mask (multiplied 4
times), SWI and CT images on each one of
the columns for all the individuals involved
in the present study. The SWI processed
with sigmoid mask and the respective CT
image demonstrate the regions of calcifi-
cation (continuous arrow) or hemosiderin
(dotted arrow), depending on the case.

Barbosa JHO et al. / SWI: calcification and hemosiderin
Radiol Bras. 2015 Mar/Abr;48(2):93–100 99
caused by the calcification occurs contrarily to Fe+3 depos-
its. Therefore, for a determined TE, it is possible to differ-
entiate hemosiderin deposit and calcification (Figure 2).
For TE = 23 ms at 3 T the calcifications demonstrated
hyperintense signal at SWI with sigmoid mask, in agreement
with reports on calcifications in oligodendrogliomas, physi-
ological lesions and cysticercosis(13), and in prostate can-
cer(14). SWI with longer TEs may yield results opposite to
the above mentioned results. Recently, Zulfiqar et al. utilized
TE = 40 ms and reported hypointense signal for calcifica-
tions in oligodendrogliomas at SWI with negative mask(15).
Additionally, they concluded that, amongst the techniques
for diagnosis of cerebral calcifications by MRI, SWI was the
most frequently indicated modality to detect calcifications
in oligodendrogliomas with results confirmed by CT im-
age(15). Other authors utilized TE = 25 ms and also reported
hypointense signal for calcifications at SWI with negative
mask(16), however, the static magnetic field was less intense
(1.5 T). As shown on the equation 2, the phase evolution
was weaker for smaller magnetic fields. Additionally, it is
important to highlight that phase images may assume oppo-
site values as the “right hand” system is utilized. Thus, the
authors point out that the results reported in the literature
on this matter should be cautiously considered with a view
on their application to each clinical center reality.
Also, the most MRI scanner manufacturers include the
SWI sequence acquisition with automated postprocessing in
their products, so the utilization of this imaging modality is
increasing in the clinical practice. However, the authors high-
light that the SWI is postprocessed and depends on the se-
lection of a type of mask and some parameters which many
times may be occult to radiologists. Clinical diagnoses might
Figure 7. Image of calcification and
hemosiderin deposit with spherical
geometry to simulate the phase evo-
lution effect on the sections inferi-
orly and superiorly to the sphere with
a 10 mm-radius. 3T and TE = 23
ms were considered.
Calcification Hemosiderin Sphere
Cra
nio
cau
dal d
irectio
n

Barbosa JHO et al. / SWI: calcification and hemosiderin
Radiol Bras. 2015 Mar/Abr;48(2):93–100100
be erroneously produced in the absence of knowledge about
variable and/or inappropriately selected parameters.
The authors suggest a standardization of the use of SWI
by a correct TE selection for the construction of a phase mask
capable of enhance the contrast of both hemosiderin and
calcification in order to avoid possible errors in clinical di-
agnoses. For example: For the acquisition, a GE sequence
using TE = 23 ms for 3 T magnetic field and storing the
phase and magnitude data with a reference “left-hand” system;
for the SWI processing, a HP filter with a window size of 64
× 64 and using sigmoid mask with four multiplications.
The presence of magnetic susceptibility artifacts in the
region of the nasal sinuses and ears of patients 2 and 4 (Fig-
ure 6) did not impair the diagnosis and differentiation be-
tween hemosiderin deposition and calcifications. In some
cases, however, such artifacts prevent a complete visualiza-
tion of the brain. The use of shorter TE, filter with larger
window size, and other filters might remove such artifacts(8).
CONCLUSION
SWI is a technique that produces postprocessed images
weighting the magnetic susceptibility contrast of the phase
image on the magnitude image. The TE and mask selection
may change all the SWI information, affecting the diagnos-
tic reliability. Amongst the possible masks, the authors high-
light that the use of the sigmoid mask allows for enhancing
the calcification and hemosiderin contrast on a single SWI.
REFERENCES
1. Gupta D, Saini J, Kesavadas C, et al. Utility of susceptibility-
weighted MRI in differentiating Parkinson’s disease and atypical
parkinsonism. Neuroradiology. 2010;52:1087–94.
2. Berberat J, Grobholz R, Boxheimer L, et al. Differentiation between
calcification and hemorrhage in brain tumors using susceptibility-
weighted imaging: a pilot study. AJR Am J Roentgenol. 2014;202:
847–50.
3. Mittal S, Wu Z, Neelavalli J, et al. Susceptibility-weighted imag-
ing: technical aspects and clinical applications, part 2. AJNR Am J
Neuroradiol. 2009;30:232–52.
4. Haacke EM, Xu Y, Cheng YC, et al. Susceptibility weighted imag-
ing (SWI). Magn Reson Med. 2004;52:612–8.
5. Haacke EM, Reichenbach JR. Susceptibility weighted imaging in
MRI: basic concepts and clinical applications. Hoboken, NJ: Wiley-
Blackwell; 2011.
6. Wang Y, Yu Y, Li D, et al. Artery and vein separation using suscep-
tibility-dependent phase in contrast-enhanced MRA. J Magn Reson
Imaging. 2000;12:661–70.
7. Haacke EM, Mittal S, Wu Z, et al. Susceptibility-weighted imag-
ing: technical aspects and clinical applications, part 1. AJNR Am J
Neuroradiol. 2009;30:19–30.
8. Schweser F, Deistung A, Lehr BW, et al. Differentiation between
diamagnetic and paramagnetic cerebral lesions based on magnetic
susceptibility mapping. Med Phys. 2010;37:5165–78.
9. Martínez Santiesteban FM, Swanson SD, Noll DC, et al. Object
orientation independence of susceptibility weighted imaging by using
a sigmoid-type phase window. Proc Intl Soc Mag Reson Med. 2006;
14:2399.
10. Reichenbach J, Haacke EM. High-resolution BOLD venographic
imaging: a window into brain function. NMR Biomed. 2001;14:453–
67.
11. Haacke EM, Makki M, Ge Y, et al. Characterizing iron deposition
in multiple sclerosis lesions using susceptibility weighted imaging.
J Magn Reson Imaging. 2009;29:537–44.
12. Schenck JF. The role of magnetic susceptibility in magnetic reso-
nance imaging: MRI magnetic compatibility of the first and second
kinds. Med Phys. 1996;23:815–50.
13. Wu Z, Mittal S, Kish K, et al. Identification of calcification with
MRI using susceptibility-weighted imaging: a case study. J Magn
Reson Imaging. 2009;29:177–82.
14. Bai Y, Wang MY, Han YH, et al. Susceptibility weighted imaging: a
new tool in the diagnosis of prostate cancer and detection of pros-
tatic calcification. PLoS One. 2013;8:e53237.
15. Zulfiqar M, Dumrongpisutikul N, Intrapiromkul J, et al. Detection
of intratumoral calcification in oligodendrogliomas by susceptibil-
ity-weighted MR imaging. AJNR Am J Neuroradiol. 2012;33:858–
64.
16. Zhu WZ, Qi JP, Zhan CJ, et al. Magnetic resonance susceptibility
weighted imaging in detecting intracranial calcification and hem-
orrhage. Chin Med J (Engl). 2008;121:2021–5.
Copyright © 2022 FDOKUMEN