Improved Data-Driven Stochastic Subspace Identification with ...
16
Citation: Liu, X.; Zhao, S.; Wang, P.; Wang, R.; Huang, M. Improved Data-Driven Stochastic Subspace Identification with Autocorrelation Matrix Modal Order Estimation for Bridge Modal Parameter Extraction Using GB-SAR Data. Buildings 2022, 12, 253. https://doi.org/10.3390/ buildings12020253 Academic Editors: Minshui Huang and Jianfeng Gu Received: 13 January 2022 Accepted: 18 February 2022 Published: 21 February 2022 Publisher’s Note: MDPI stays neutral with regard to jurisdictional claims in published maps and institutional affil- iations. Copyright: © 2022 by the authors. Licensee MDPI, Basel, Switzerland. This article is an open access article distributed under the terms and conditions of the Creative Commons Attribution (CC BY) license (https:// creativecommons.org/licenses/by/ 4.0/). buildings Article Improved Data-Driven Stochastic Subspace Identification with Autocorrelation Matrix Modal Order Estimation for Bridge Modal Parameter Extraction Using GB-SAR Data Xianglei Liu 1 , Songxue Zhao 1 , Peipei Wang 2 , Runjie Wang 1, * and Ming Huang 1 1 Key Laboratory for Urban Geomatics of National Administration of Surveying, Mapping and Geoinformation, Engineering Research Center of Representative Building and Architectural Heritage Database, Ministry of Education, Beijing University of Civil Engineering and Architecture, Beijing 100044, China; [email protected] (X.L.); [email protected] (S.Z.); [email protected] (M.H.) 2 Software Engineering Center Chinese Academy of Sciences, Beijing 100190, China; [email protected] * Correspondence: [email protected] Abstract: With the advantage of non-contact measurement, ground-based synthetic aperture radar (GB-SAR) has been widely used to obtain the dynamic deflection of various bridges. Data-driven stochastic subspace recognition (Data-SSI), a popularized time-domain technique, is commonly used for modal parameter identification of bridges. To improve the computational efficiency and accuracy of the Data-SSI method for bridge modal parameter estimation using GB-SAR, this paper proposes an improved Data-SSI method. First, boxplot data filtering is applied to screen out the error points to generate a Hankel matrix. Second, the Hankel matrix compression method is presented to reduce the ill-conditioned vectors in the column vectors of the Hankel matrix to improve calculation efficiency. Finally, the exact modal order (EMO) modal estimation algorithm based on the autocorrelation matrix is adopted to reduce the generation of false modes and improve the calculation efficiency. The results of simulation and field experiments show that the natural frequency values for the improved Data-SSI method are 2.3208 and 2.3189 and the damping ratio coefficient values are 8.10 and 8.08, under windows 1 and 2, respectively. The operation times using the improved Data-SSI method are 2.02 s and 7.61 s under windows 1 and 2, respectively. This proves that the proposed improved Data-SSI method has higher accuracy and computational efficiency. Keywords: bridge; modal parameter extraction; GB-SAR; dynamic deflection; Data-SSI; modal order estimation 1. Introduction Bridge dynamic deflection is one of the most important indicators to reflect bridge structural abnormality, including the quality, operating state, and stiffness, and further provide obvious feedback on the overall deformation of bridges [1]. Compared with the traditional contact transducers, such as piezoelectric accelerometers, optical fiber sensors, strain gauges, and inductance meters, ground-based synthetic aperture radar (GB-SAR), a non-contact measurement technology, can perform all-weather, large-scale, and long- distance dynamic deflection measurement for the monitored bridges [2–4]. By treating the reflection points as virtual sensors, the traditional point sensors can be reduced or even eliminated [4]. Accurate comparison has been carried out between GB-SAR and accelerom- eters on various large bridges, which showed that the accuracy of GB-SAR was better than 0.1 mm [5,6]. With the advantages of a wide frequency response range, high sensitivity of the displacement and easy installation, GB-SAR has been widely applied in non-contact dynamic deflection monitoring of various bridges. Structural modal parameters are impor- tant indices to reflect the dynamic characteristics of the monitored bridge, which can be identified from the corresponding dynamic deflection. It is of great significance to under- stand the current characteristics of the monitored bridges with the determined structural Buildings 2022, 12, 253. https://doi.org/10.3390/buildings12020253 https://www.mdpi.com/journal/buildings
-
Upload
khangminh22 -
Category
Documents
-
view
3 -
download
0
Transcript of Improved Data-Driven Stochastic Subspace Identification with ...

�����������������
Citation: Liu, X.; Zhao, S.; Wang, P.;
Wang, R.; Huang, M. Improved
Data-Driven Stochastic Subspace
Identification with Autocorrelation
Matrix Modal Order Estimation for
Bridge Modal Parameter Extraction
Using GB-SAR Data. Buildings 2022,
12, 253. https://doi.org/10.3390/
buildings12020253
Academic Editors: Minshui Huang
and Jianfeng Gu
Received: 13 January 2022
Accepted: 18 February 2022
Published: 21 February 2022
Publisher’s Note: MDPI stays neutral
with regard to jurisdictional claims in
published maps and institutional affil-
iations.
Copyright: © 2022 by the authors.
Licensee MDPI, Basel, Switzerland.
This article is an open access article
distributed under the terms and
conditions of the Creative Commons
Attribution (CC BY) license (https://
creativecommons.org/licenses/by/
4.0/).
buildings
Article
Improved Data-Driven Stochastic Subspace Identification withAutocorrelation Matrix Modal Order Estimation for BridgeModal Parameter Extraction Using GB-SAR DataXianglei Liu 1, Songxue Zhao 1, Peipei Wang 2, Runjie Wang 1,* and Ming Huang 1
1 Key Laboratory for Urban Geomatics of National Administration of Surveying, Mapping and Geoinformation,Engineering Research Center of Representative Building and Architectural Heritage Database, Ministry ofEducation, Beijing University of Civil Engineering and Architecture, Beijing 100044, China;[email protected] (X.L.); [email protected] (S.Z.); [email protected] (M.H.)
2 Software Engineering Center Chinese Academy of Sciences, Beijing 100190, China; [email protected]* Correspondence: [email protected]
Abstract: With the advantage of non-contact measurement, ground-based synthetic aperture radar(GB-SAR) has been widely used to obtain the dynamic deflection of various bridges. Data-drivenstochastic subspace recognition (Data-SSI), a popularized time-domain technique, is commonly usedfor modal parameter identification of bridges. To improve the computational efficiency and accuracyof the Data-SSI method for bridge modal parameter estimation using GB-SAR, this paper proposesan improved Data-SSI method. First, boxplot data filtering is applied to screen out the error points togenerate a Hankel matrix. Second, the Hankel matrix compression method is presented to reduce theill-conditioned vectors in the column vectors of the Hankel matrix to improve calculation efficiency.Finally, the exact modal order (EMO) modal estimation algorithm based on the autocorrelation matrixis adopted to reduce the generation of false modes and improve the calculation efficiency. The resultsof simulation and field experiments show that the natural frequency values for the improved Data-SSImethod are 2.3208 and 2.3189 and the damping ratio coefficient values are 8.10 and 8.08, underwindows 1 and 2, respectively. The operation times using the improved Data-SSI method are 2.02 sand 7.61 s under windows 1 and 2, respectively. This proves that the proposed improved Data-SSImethod has higher accuracy and computational efficiency.
Keywords: bridge; modal parameter extraction; GB-SAR; dynamic deflection; Data-SSI; modalorder estimation
1. Introduction
Bridge dynamic deflection is one of the most important indicators to reflect bridgestructural abnormality, including the quality, operating state, and stiffness, and furtherprovide obvious feedback on the overall deformation of bridges [1]. Compared with thetraditional contact transducers, such as piezoelectric accelerometers, optical fiber sensors,strain gauges, and inductance meters, ground-based synthetic aperture radar (GB-SAR),a non-contact measurement technology, can perform all-weather, large-scale, and long-distance dynamic deflection measurement for the monitored bridges [2–4]. By treating thereflection points as virtual sensors, the traditional point sensors can be reduced or eveneliminated [4]. Accurate comparison has been carried out between GB-SAR and accelerom-eters on various large bridges, which showed that the accuracy of GB-SAR was better than0.1 mm [5,6]. With the advantages of a wide frequency response range, high sensitivity ofthe displacement and easy installation, GB-SAR has been widely applied in non-contactdynamic deflection monitoring of various bridges. Structural modal parameters are impor-tant indices to reflect the dynamic characteristics of the monitored bridge, which can beidentified from the corresponding dynamic deflection. It is of great significance to under-stand the current characteristics of the monitored bridges with the determined structural
Buildings 2022, 12, 253. https://doi.org/10.3390/buildings12020253 https://www.mdpi.com/journal/buildings

Buildings 2022, 12, 253 2 of 16
modal parameters, which can provide a basis to perform state evaluation and abnormalmonitoring of the bridges [7,8].
The stochastic subspace identification (SSI) method, an extension of the subspace statespace system identification method, has been widely used in operational modal analysis(OMA) [8,9]. As the latest development of the time domain identification method, the SSImethod can directly extract structural modal parameters from the output response signalof the structure under environmental excitation. With the characteristics of robustness,high identification accuracy, and stability, the SSI method can be used to accurately identifythe frequency and damping ratio of the response signal. It has been widely used toextract modal parameters from the dynamic deflection of the monitored bridges [10–18].Data-driven stochastic subspace identification (Data-SSI) and covariance-driven stochasticsubspace identification (COV-SSI) are the two favorite modal parameter identificationtechniques [8,11]. They are all derived from the different weight matrices before thesingular value decomposition (SVD). Compared with the COV-SSI method, the Data-SSImethod has the ability to process a large amount of input and output data at the same time,which can ensure higher stability and accuracy. Furthermore, for the Data-SSI method,the state space matrices can be identified with robust numerical methods, such as SVD,least squares, and quadrature rectangle (QR) decomposition. Therefore, Data-SSI hasbeen validated as one of the most robust and accurate identification methods to extractmore effective information in many experiments and engineering applications [6]. Georgeet al. proved that the Data-SSI method is accurate and effective to identify the structuralabnormality in a structural abnormal monitoring experiment for simple structures withfew components [9]. Dilena and Morassi performed a dynamic deflection measurementexperiment for a cracked steel beam, which had a high accuracy in obtaining the crackposition using Data-SSI method [7]. Boonyapinyo used the Data-SSI method to extract themodal parameters of a bridge model excited with the wind, and the results showed thatthe bridge coupling aerodynamic derivative extracted by the Data-SSI method was closerto the true value than the COV-SSI method [19].
However, the accuracy of Data-SSI is limited by the noise existing in monitored data.During the dynamic deflection acquisition of the monitored bridges using GB-SAR, noiseand abnormal data due to environmental incentives will inevitably be generated. Moreover,modal omissions and false modalities may be caused for mode estimation using the singularvalue average method, due to empirical judgment for dividing the singular value inflectionpoint of the projection matrix. In addition, the steady-state graph modal estimation methodis still based on empirical judgments; it has a complicated structure and requires a largeamount of calculation. Ubertini proposed a Data-SSI method to filter the error modalities forautomatic modal identification of two field bridges. The results indicated that the Data-SSImethod used is effective for natural frequency identification [20]. Hoofar et al. proposed animproved Data-SSI with a weight matrix to perform structural health monitoring and modalparameter identification for Alamosa Canyon Bridge; the experimental results showedthat the improved Data-SSI has a high robustness [21]. However, as the Hankel matrixis directly composed of dynamic response signals, the number of columns of the Hankelmatrix tends to infinity, which requires a large amount of memory, theoretically. Moreover,QR-decomposition and SVD decomposition operations increase the computational burdenin the identification process greatly.
For the bridge dynamic deflection value collected by GB-SAR, it has an importantimpact on the collected data of the noise generated by the environmental excitation. Thetraditional Data-SSI method not only has a low calculation efficiency, but also containsill-conditioned column vectors during the process of generating the Hankel matrix. Theyeasily produce false modals and reduce the accuracy of the results. Therefore, to efficientlyobtain the accurate structural modal parameters of the monitored bridge based on thedynamic deflection collected by GB-SAR, in this study, an improved Data-SSI method withautocorrelation matrix modal order estimation is proposed. In order to reduce the influenceof noise and abnormal data for the dynamic deflection of the monitored bridge obtained by

Buildings 2022, 12, 253 3 of 16
GB-SAR, boxplot data filtering is used to screen out the error points to generate the Hankelmatrix. To reduce the ill-conditioned vectors in the column vectors of the Hankel matrix,the Hankel matrix compression method is presented to improve calculation efficiency. Toreduce the generation of false modes and improve the calculation efficiency, an exact modalorder (EMO) estimation algorithm based on the autocorrelation matrix is adopted.
2. Methodology
The entire workflow of the improved Data-SSI method is shown in Figure 1, whichcan be used to extract the accurate structural modal parameters of the bridges based onthe dynamic deflection acquired by GB-SAR. It includes the following three key steps:(1) boxplot data filtering is adopted to reduce the effects of noise and abnormal data togenerate the Hankel matrix, (2) the Hankel matrix compression method is presented toreduce the ill-conditioned vectors in the column vectors of the Hankel matrix, whichcan improve calculation efficiency, and (3) an EMO estimation algorithm based on theautocorrelation matrix is adopted to reduce the generation of false modes and improve thecalculation efficiency.
Figure 1. Workflow of the improved Data-SSI method.

Buildings 2022, 12, 253 4 of 16
More detailed Data-SSI algorithm principles and processes can be found in [10,11].This article will not discuss them further due to space limitations.
2.1. Boxplot Data Filtering
As a basic tool for visualizing the arrangement and statistical characteristics of data, aboxplot can provide univariate information for multivariate display [22]. The noise andabnormal data often are produced to pollute the obtained dynamic deflection, which aremuch larger (or smaller) than the vibration amplitude of the bridge itself. Therefore, in thisstudy, boxplot filtering is performed to remove these abnormal data.
A schematic diagram of the working principle of boxplot filtering is shown in Figure 2.For a set of original signals, it needs to calculate 5 important values to build a box-plotmodel, including the median M, upper quartile UQ, lower quartile LQ, upper limit UL,and lower limit LL. In this study, the dynamic deflection is sorted in descending order inthe boxplot. Therefore, M, UQ, and LQ can be easily found individually. UL and LL areobtained by the following equations:
UL = UQ + k× IQR (1)
LL = LQ− k× IQR (2)
IQR = UQ− LQ (3)
Figure 2. Schematic diagram of the working principle of box-plot filtering.
For the coefficient k in Equations (1) and (2), Frigge et al. have explored k in depth andconducted experiments with a large number of small-to-medium Gaussian samples [23].The experiment mainly discusses the effect of k being 1, 1.5, 2, and 3 on the removalefficiency of data outliers under different sample sizes. The results show that when k = 1.5,the outer proportion of each sample is about 25%, which is more suitable for removingoutliers. Although the values of k and n (sample size) both affect the outlier removal rate ofthe boxplot, k = 1.5 is suitable and works well for any data size [23].
The skewness and distribution of the data can be estimated according to the positionsof LQ, UQ, and M. Potential outliers in the input dataset can be calculated and removeddirectly by filtering the boxplot data. During the calculation of statistical data, due topotential outliers being considered, the boxplot has the ability to identify and resist theoutliers in the data.
2.2. Hankel Matrix Compression
For the traditional Data-SSI method, the Hankel matrix is mainly constructed fromthe output data of structural dynamic response under environmental excitation [13]. Thepurpose of Hankel matrix construction is to obtain column subspace through projection.However, if some column vectors in the matrix have some small values, the subspacemay lead to low-resolution projections, which will affect the identification results. Inaddition, theoretically, the number of columns of the Hankel matrix tends to infinity,which undoubtedly increases the computational pressure and memory consumption of thecomputer [24,25]. In this study, the “ill-conditioned” column vectors can be regarded ascolumn vectors with lower specifications, which not only consumes computing memory,

Buildings 2022, 12, 253 5 of 16
but may also cause invalid matrix projection. Therefore, it can compress the Hankel matrixby eliminating the “ill-conditioned” column vectors in the matrix.
Denote the denoised signal {x′} using boxplot filtering, and construct the Hankelmatrix with Equation (4).
H =
[Yp
Yf
]=
x0 x1 . . . xj−1x1 x2 . . . xj. . . . . . . . . . . .
xi−1 xi . . . xi+j−2
xi xi+1 . . . xi+j−1xi+1 xi+2 . . . xi+j. . . . . . . . . . . .
x2i−1 x2i . . . x2i+j−2
(4)
where H is the constructed Hankel matrix and Yp is the row space representing the “past”composed by the upper half of the matrix. Yf is the row space of representing the “future”composed by the lower half of the matrix. i is the row and j is the column of matrix H.
The choice of parameter i depends on various factors related to the type of structureto be identified, including the length s of the input signal and the sampling frequency f s.The choice of i is related to the lowest frequency f1 of the considered structural system.Assuming that there are nc or more cycles of the lowest frequency f1 within the range ofsignal length i, then:
if s
f1 > nc (5)
Since it contains at least one cycle, i can be expressed as:
i ≥ ncf sf1
= ncβ (6)
β =f sf1
(7)
Although a larger value of i can make a larger time window to ensure the algorithmis more stable, too large a value of i will lead to a decrease in computational efficiency.Therefore, to extract enough information from the observable range space, the numberof rows of the “future” output matrix is relatively large. According to Equation (6), theminimum value of i can be determined through a complete minimum frequency cycle, butthe value of i in different situations needs to be judged empirically.
The Hankel matrix can be divided into m column vectors according to each column,and further calculate the norm of each column vector. Define hmax as the largest norm. The“ill-conditioned” column vector with too low values can be deleted to limit the number ofmatrix column vectors using Equation (8).
‖hi‖ ≥ αhhmax, i ∈ (1, mh) (8)
where hi represents any i-th column vector in the Hankel matrix. ah represents the compres-sion ratio of the matrix between the range of (0, 1) and hmax represents the largest columnvector in the Hankel matrix. mh represents the number of columns of the Hankel matrix.
2.3. Autocorrelation Matrix EMO Estimation Algorithm
For the EMO method, it is basically flat for the white noise power spectral densitycurve [26]. Since the power spectral density of the input signal can be represented withthe eigenvalues of the autocorrelation matrix (Rx), the connection point between thesignal and the noise subspace will change significantly. This kind of change cannot bedirectly identified because it is impossible to define a threshold for the changed signal
Buildings 2022, 12, 253 6 of 16
and the corresponding signal-to-noise ratio (SNR). Therefore, the relative difference RDof continuous eigenvalues can be used to enhance the discrimination between the noisesubspace and signal.
RD =λi − λi−1
λi+1(i = 2, 3, · · · , M− 1) (9)
where λi is the i-th eigenvalue and the diagonal matrix of eigenvalues is sorted in descend-ing order. M is the number of eigenvalues and we define RDI as the row number sequenceI of the RD.
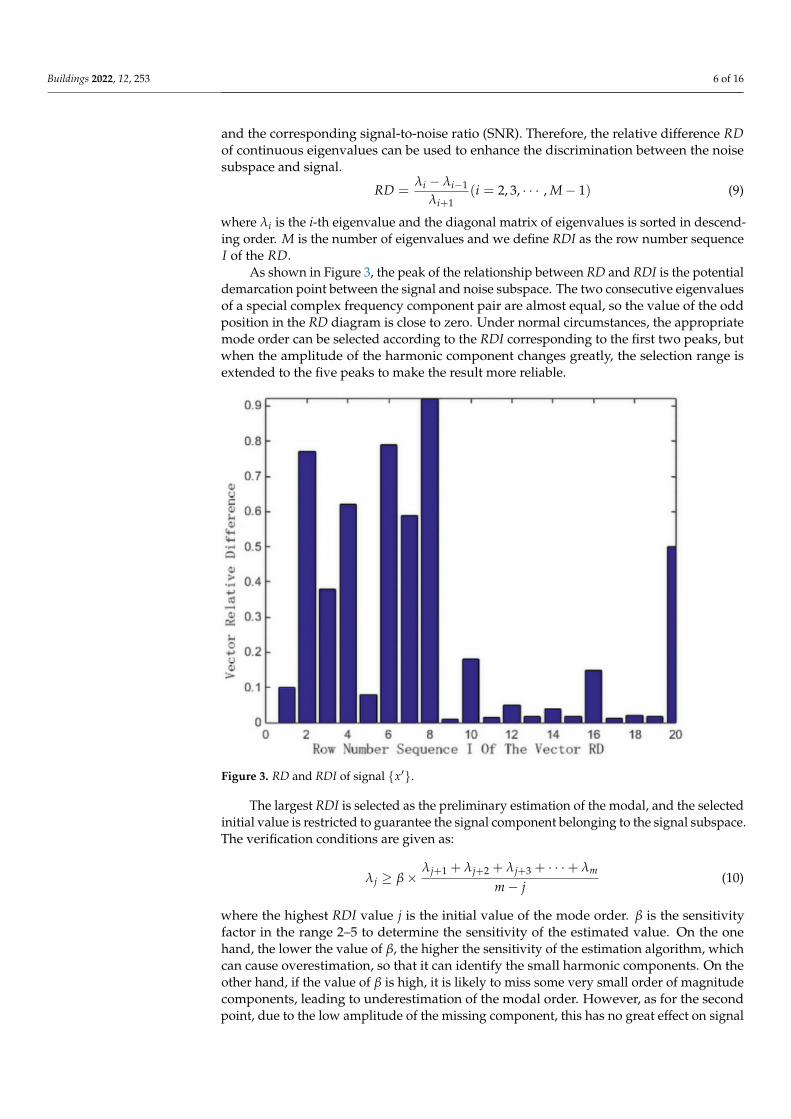
As shown in Figure 3, the peak of the relationship between RD and RDI is the potentialdemarcation point between the signal and noise subspace. The two consecutive eigenvaluesof a special complex frequency component pair are almost equal, so the value of the oddposition in the RD diagram is close to zero. Under normal circumstances, the appropriatemode order can be selected according to the RDI corresponding to the first two peaks, butwhen the amplitude of the harmonic component changes greatly, the selection range isextended to the five peaks to make the result more reliable.
Figure 3. RD and RDI of signal {x′}.
The largest RDI is selected as the preliminary estimation of the modal, and the selectedinitial value is restricted to guarantee the signal component belonging to the signal subspace.The verification conditions are given as:
λj ≥ β×λj+1 + λj+2 + λj+3 + · · ·+ λm
m− j(10)
where the highest RDI value j is the initial value of the mode order. β is the sensitivityfactor in the range 2–5 to determine the sensitivity of the estimated value. On the onehand, the lower the value of β, the higher the sensitivity of the estimation algorithm, whichcan cause overestimation, so that it can identify the small harmonic components. On theother hand, if the value of β is high, it is likely to miss some very small order of magnitudecomponents, leading to underestimation of the modal order. However, as for the secondpoint, due to the low amplitude of the missing component, this has no great effect on signal
Buildings 2022, 12, 253 7 of 16
reconstruction. If the algorithm fails to verify, the second highest value in the remainingpeak value is used as the estimated value, and the condition judgment is performed again.
The main steps of the proposed EMO estimation algorithm are as follows:
1. Construct order Hankel matrix X of order based on signal {x′},
X =
x′(0) x′(1) · · · x′(m− 1)x′(1) x′(2) · · · x′(m)
......
. . ....
x′(n−m) x′(n−m + 1) · · · x′(n− 1)
(11)
2. Construct autocorrelation matrix Rx,
Rx =X
n−m× XH (12)
where X is the Hankel matrix of order m, n is the length of the signal {x′}, and XH
represents the Hermitian transpose of the matrix X;3. Carry out eigenvalue decomposition on Rx and make the eigenvalue λ in descending order;4. Calculate RD of continuous eigenvalues in descending order according to Equation (9)
and draw a histogram of RD and the corresponding eigenvalue row number RDI;5. Select the maximum value of RDI corresponding to five peaks as the initial value of
the modal order estimation;6. According to Equation (10), determine whether the spectral components belong to the
signal subspace. If the initial modal order value satisfies the verification condition,modal order is RDI/2. Otherwise, select the next highest RDI as the new value ofmodal order estimation, execute step 4 in sequence until the selected RDI satisfies theverification condition.
Each mode of Rx can be represented by using two main eigenvalues [27]. Therefore,the dominant eigenvalue will be twice the value of the modal order in the signal. Comparedwith the main eigenvalues, the remaining eigenvalues of Rx are very small for the noisesubspace. When the value of i is twice that of the modal order, the value of RDI will riserapidly. The reason is that λi is a major eigenvalue belonging to signal subspace, and it isalso quite low due to belonging to the noise subspace. After λi to λm, the average value ofconsecutive eigenvalues is also much smaller than λi. In the EMO algorithm, this logic isused to accurately estimate the modal order.
3. Simulation Experiment3.1. Modal Order Estimation Validation
To validate the accuracy of the autocorrelation matrix EMO estimation algorithm formodal order estimation, a simulated signal S1 was selected with known modal parameters,which has 4 frequency components. Signal S1 was used to test the strong anti-noise abilityof the autocorrelation matrix EMO estimation algorithm, which was added with Gaussiannoise under SNRs of 15, 20, and 25 db.
S1 = 2 cos(2π ∗ 0.25t + 1.5π)· exp(−0.17t) + 2 cos(2π ∗ 0.33t + 1.5π)· exp(−0.12t)+2 cos(2π ∗ 0.78t + 0.5π)· exp(−0.13t) + 2 cos(2π ∗ 0.87t + 0.5π)· exp(−0.0702t)
(13)
Table 1 shows the modal parameters of signal S1 obtained by the autocorrelation matrixEMO estimation algorithm, matrix pencil (MP) algorithm and eigen-system realizationalgorithm (ERA) [4,28–30]. The inspection of this table highlights the following. (1) Asthe parameterized methods for the above three methods, the accuracy of the frequencyand attenuation coefficient (AF) obtained by the autocorrelation matrix EMO estimationalgorithm is comparable to that of the MP method and the ERA method. (2) For thesimulated signal with lower SNR, the modal order was overestimated using the MP methodand the ERA method, which can cause false modes and mathematical modes. For example,

Buildings 2022, 12, 253 8 of 16
for the simulated signal with SNR of 15 db, the modal order 4 can be accurately estimatedusing the autocorrelation matrix EMO estimation algorithm, which is consistent with thetrue modal order of signal S1. However, with the MP and ERA methods, modal orderswere 107 and 113, respectively. Therefore, an independent algorithm is needed to filterout redundant modes. The results show that the autocorrelation matrix EMO estimationalgorithm can more accurately identify the modal order of the simulated signal S1 withvarious SNRs, which has a stronger anti-noise performance.
Table 1. Comparison of modal order and modal parameters among the autocorrelation matrix EMOestimation algorithm, MP method, and ERA method.
SNR 15 dB 20 dB 25 dB
Method ModalOrder
Frequency(Hz) AF Modal
OrderFrequency
(Hz) AF ModalOrder
Frequency(Hz) AF
Actualvalue
none
0.230 0.140
none
0.230 0.140
none
0.230 0.1400.290 0.090 0.290 0.090 0.290 0.0900.460 0.110 0.460 0.110 0.460 0.1100.690 0.030 0.690 0.030 0.690 0.030
EMOestimation 4
0.2301 0.1410
4
0.2307 0.1400
4
0.2301 0.14100.2902 0.0908 0.2900 0.0920 0.2901 0.09100.4603 0.1101 0.4602 0.1100 0.4609 0.11200.6900 0.0315 0.6900 0.0300 0.6902 0.0320
ERA 113
0.2304 0.1420
104
0.2311 0.1402
54
0.2497 0.14100.2901 0.0990 0.2919 0.0922 0.3304 0.09200.4609 0.1110 0.4604 0.1102 0.7802 0.11100.6900 0.0315 0.6907 0.0308 0.6904 0.0300
MP 107
0.2300 0.1402
59
0.2300 0.1400
8
0.2298 0.14100.2901 0.0918 0.2901 0.0906 0.2900 0.09100.4602 0.1103 0.4600 0.1107 0.4600 0.11100.6900 0.0319 0.6901 0.0301 0.6900 0.0301
3.2. Sensitivity and Efficiency Validation
To verify the sensitivity and efficiency of the improved Data-SSI method. Signal S2was simulated to make comparison with the traditional Data-SSI method and the Fouriermethod, which has 3 frequency components.
S2 = 2 cos(2π ∗ 0.4t + 1.5π)· exp(−0.17t) + 2 cos(2π ∗ 0.28t + 0.5π)· exp(−0.05t)+2 cos(2π ∗ 0.75t + 4.5π)· exp(−0.13t)
(14)
Table 2 shows the frequency and attenuation factor obtained by the Fourier method,the traditional Data- SSI method, and the improved Data-SSI method. In this study, S2 wasadded with Gaussian noise under the SNRs of 15 db and 20 db. The frequency and AF of S2are identified with the average of 50 independent simulation estimations. For the Fouriermethod, the length and distance of the window are set to 500 and 50, respectively. For theimproved Data-SSI method and the traditional Data-SSI method, the rows and columnsof the Hankel matrix are set to 200 and 1000. The inspection from this table highlightsthe following. (1) Compared with the traditional Data-SSI, there is a great improvementfor the obtained frequency and attenuation factor using the improved Data-SSI method.Especially, for the two close low-frequency parts, there is an improvement of more than 2%.The results show that the improved Data-SSI method has a better sensitivity to distinguishsignals with close frequency. (2) The improved Data-SSI method can effectively identifythe three different frequency parts. In this study, the 0.3 Hz mode and the 0.35 Hz modewere identified as a mixed mode by using the Fourier method. Therefore, for the modalanalysis of a dense frequency system, the Fourier method cannot effectively detect allmodes, especially for the modes with close frequencies in the signal, which is not suitablefor short-range mode signal estimation.
Buildings 2022, 12, 253 9 of 16
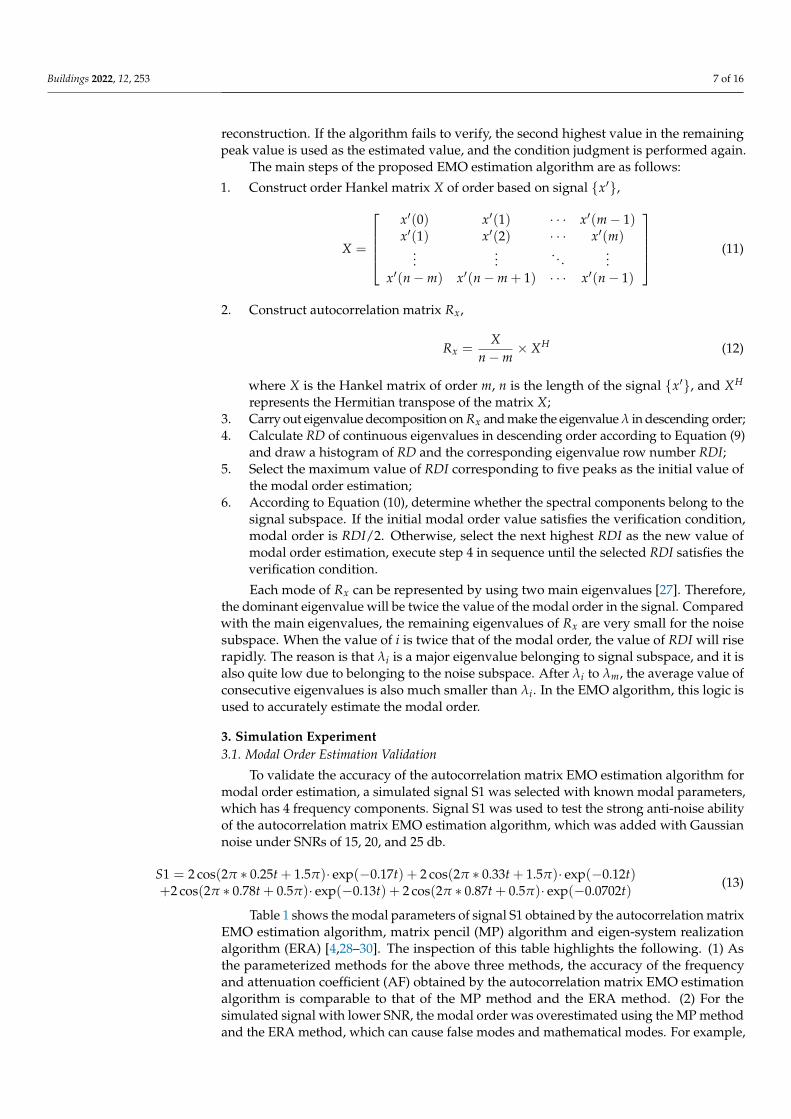
Table 2. Sensitivity analysis among the improved Data-SSI method, traditional Data-SSI method, andFourier method.
SNR 15 dB 20 dB
MethodEstimated Value Std (%) Estimated Value Std (%)
F (Hz) AF F (Hz) AF F (Hz) AF F (Hz) AF
Actualvalue
0.30 0.15 0.30 0.150.35 0.03 0.35 0.030.67 0.11 0.67 0.11
ImprovedData-SSI
0.308 0.153 0.27 1.12 0.299 0.150 0.11 0.820.350 0.033 0.05 0.40 0.349 0.030 0.04 0.250.670 0.111 0.09 0.17 0.670 0.113 0.05 0.37
TraditionalData-SSI
0.310 0.151 2.27 3.71 0.301 0.153 2.14 4.110.3541 0.032 2.13 3.18 0.351 0.031 2.12 4.090.6701 0.112 0.06 0.19 0.679 0.112 0.05 0.39
Fourier0.3503 0.032 0.01 0.10 0.353 0.032 0.01 0.030.6701 0.111 1.37 1.08 0.674 0.116 0.55 0.43
Table 3 shows the estimated modal order and the corresponding calculation timefor signals S1 and S2 with different SNRs between the improved Data-SSI method andtraditional Data-SSI method. The inspection from Table 3 highlights the following. (1) Forthe traditional Data-SSI method, there is a problem that the initial value of the modal orderis overestimated. Therefore, to obtain the accurate modal order, a separate algorithm isneeded to filter out the true modals from the initial values. During the process, the modalorder is changed to a higher value from the initial value. Different state matrices can begenerated using these modal orders, of which the common eigenvalues represent the mainmodals of the signal. Therefore, although the traditional Data-SSI method can be used toobtain the accurate modal order, it requires a lot of calculation time for the establishment ofstate matrices and the corresponding eigenvalue decomposition. (2) Due to the accurateestimation of the modal order using the improved Data-SSI method, it is not necessary toperform refinement screening operations to reduce false modalities, which can improvethe calculation efficiency. As shown in Table 3, the calculation time is less than 1.51 s forsignals S1 and S2 with different SNRs, which has an efficiency improvement of more thantwo times. The results indicate that the improved Data-SSI method is more competitive incomputational efficiency than the traditional Data-SSI method.
Table 3. Comparison of the computation time and modal order between the improved Data-SSImethod and the traditional SSI method.
SimulationSignal SNR (dB)
Traditional Data-SSI Method Improved Data-SSI Method
Initial ModalOrder
Final ModalOrder
CalculationTime (s) Modal Order Calculation
Time (s)
S115 42 4 3.21 4 1.5120 42 4 3.14 4 1.2125 42 4 3.54 4 1.26
S215 57 3 3.10 3 1.1220 60 3 3.19 3 1.1625 51 3 3.09 3 0.91
4. Field Experiment and Analysis4.1. Dynamic Deflection Acquisition
The Beishatan Bridge, located in the northwest of Beijing, China, was selected as theexperimental bridge in this study. Beishatan Bridge comprises the right sub-bridge (RSB)and left sub-bridge (LSB) with the same length and width, as shown in Figure 4. Since

Buildings 2022, 12, 253 10 of 16
the bridge has been determined to be damaged, it is periodically monitored to ensure itsoperation safety. The currently known damaged area (15 m from the RSB) has a maximumdeflection change of about 8 cm. The image structural interferometry (IBIS-S) instrument, aground-based microwave interferometric radar, was used to obtain the dynamic deflectionof the two sub-bridges in this experiment [4]. Without installation of multiple units on themonitored bridges, it has a higher range resolution of up to 0.5 m and a higher accuracy ofup to 0.01 mm [31,32]. The measurement condition of the RSB is shown in Figure 4a. Theinstrument was assumed to be diagonally below the bridge, and the altitude angle of theinstrument was 32◦. To obtain the dynamic deflection of the same position of the LSB, thesame altitude angle and distance were used as shown in Figure 4b.
Figure 4. Layout of IBIS-S to obtain dynamic deflection. (a) Layout of IBIS-S of RSB and (b) layout ofIBIS-S of LSB.
The obtained dynamic deflections of the two sub-bridges are shown in Figure 5a,b.Each group contains the dynamic deflection of 6 points with the sampling frequency of98 Hz. During the acquisition of dynamic deflection, there are many sources of interferencethat can generate noise and abnormal data to pollute the obtained dynamic deflection. Forexample, for the dynamic deflection of points Rbin 42 and 48 shown by the red rectangle inFigure 5b, they were deviated from baseline (0 mm) at the beginning caused by the passingvehicles. Therefore, it is necessary to eliminate the effects of noise and abnormal data in thedynamic deflection obtained using GB-SAR.
In order to control the influence of other environmental variables on the experiment,the duration of the whole experiment was less than 40 min. Except for the processes ofsunrise and sunset, the temperature changes on the surfaces of similar structures at thesame location were not significant within a time interval of 40 min. Therefore, the effect oftemperature on the experiment was negligible.

Buildings 2022, 12, 253 11 of 16
Figure 5. The acquired dynamic deflection of the Beishatan Bridge. (a) Dynamic deflection of theRSB and (b) dynamic deflection of the LSB.
4.2. Results and Analysis
Figure 6 shows the results of boxplot data filtering for dynamic deflections of BeishatanBridge. The inspection from this figure highlights the following. (1) As shown in Figure 6a,Rbin 49 and Rbin 19 of the RSB have no valid data remaining between UL and LL afterthe boxplot, which is presumed to be caused by environmental impact and some otherinterference sources. Results on these two points are no longer discussed in later studies asno valid data are available. (2) As shown in Figure 6b, only the part with the maximumdisplacement less than 10 mm is shown. It can be seen more clearly from the enlargedpart in the upper-right corner; although Rbin 42 and Rbin 48 still have some valid dataafter the boxplot, the valid data content is too low. At the same time, there was a largedeviation for the sample quartiles of points Rbin 42 and Rbin 48 of the LSB, which weredirectly discarded in this study. One of the important reasons for the large deviation ofthese values is the difference in material and flatness around the reflection point. Otherinfluencing factors such as wind, temperature, and ground vibration (vehicle passing nearGB-SAR) also contribute. The results for the rest of the points indicate that the boxplot datafiltering method has a good ability to reduce the influence of abnormal data.
The lowest frequency fmin of 2.123 Hz was obtained by Fourier transform for theoriginal data set. The sampling frequency f s of the data was 98 Hz, and the minimumvalue of i was calculated to be 46 by Equation (6). Through a complete cycle of the lowestfrequency, the minimum proportion of the “future” subspace of the Hankel matrix can becalculated as hmin = 0.47 for the required modal recognition. According to the Hankelmatrix compression method described in Section 2.2, the empirical values i = 200, h = 0.85were used for modal parameter estimation in this experiment.
As shown in Table 4, the modal parameters of the obtained dynamic deflection forBeishatan Bridge were estimated using the improved Data-SSI, the traditional Data-SSI,and Fourier transform. Window 1 and window 2 represent the same real-time signal ofthe RSB in different time windows. Window 1 intercepts the signal from 20 s to 70 s fora total of 50 s, and window 2 intercepts the same signal from 20 s to 220 s for a total of200 s. To study the modal parameters of the RSB, the experiment fits the reference valuesof the modal parameters through the data of the LSB, including the natural frequency f of2.318 Hz and the damping ratio coefficient ζ of 8.3%. The inspection of this table highlightsthe following. (1) The improved Data-SSI and the traditional Data-SSI method can correctlyestimate the first-order natural frequency. The natural frequencies of the improved Data-SSIand the traditional Data-SSI method are 2.3208 Hz and 2.3266 Hz under window 1, and2.3189 Hz and 2.3181 Hz under window 2, which are better than the results of the Fouriertransform. (2) Compared with the traditional Data-SSI method and Fourier transform, the

Buildings 2022, 12, 253 12 of 16
damping ratio coefficient values from the improved Data-SSI method are 8.10% and 8.08%under windows 1 and 2, respectively. They are more accurately estimated compared withthe reference values. Table 5 shows the operation time for modal parameter identificationbetween the improved Data-SSI and traditional Data-SSI methods. Compared with thetraditional Data-SSI method, the operation times are 2.02 s and 7.61 s under windows 1 and2 using the improved Data-SSI method, respectively. It is proved that the efficiency of theproposed method has a great improvement with the help of Hankel matrix compression.
Figure 6. Results of boxplot data filtering for dynamic deflections of Beishatan Bridge. (a) Results ofboxplot data filtering of dynamic deflections for the RSB and (b) results of boxplot data filtering ofdynamic deflections for the LSB.
Table 4. Estimated modal parameters of Beishatan Bridge for the improved Data-SSI, traditionalData-SSI, and Fourier transform.
WindowsReference Values of LSB Improved Data-SSI Traditional Data-SSI Fourier Transform
f (Hz) ζ (%) f (Hz) ζ (%) f (Hz) ζ (%) f (Hz) ζ (%)
Window 1 2.318 8.3 2.3208 8.10 2.3266 7.77 2.3497 7.73Window 2 2.318 8.3 2.3189 8.08 2.3181 7.96 2.3497 8.10
Buildings 2022, 12, 253 13 of 16
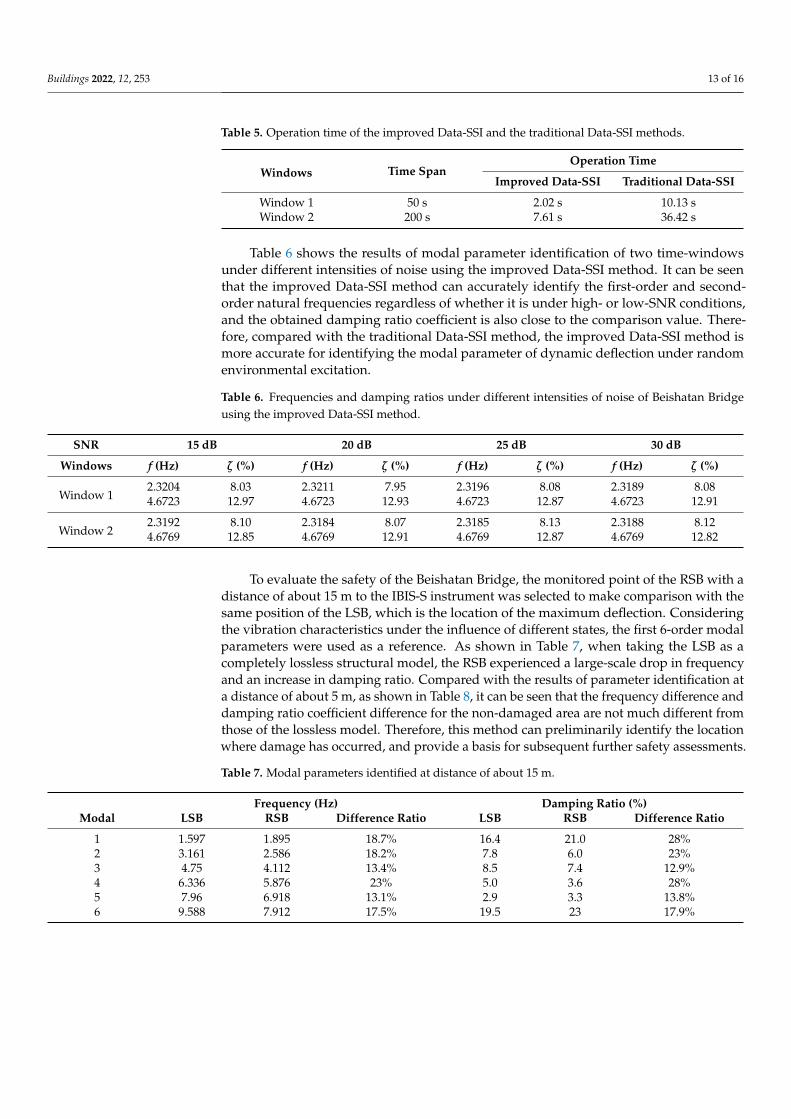
Table 5. Operation time of the improved Data-SSI and the traditional Data-SSI methods.
Windows Time SpanOperation Time
Improved Data-SSI Traditional Data-SSI
Window 1 50 s 2.02 s 10.13 sWindow 2 200 s 7.61 s 36.42 s
Table 6 shows the results of modal parameter identification of two time-windowsunder different intensities of noise using the improved Data-SSI method. It can be seenthat the improved Data-SSI method can accurately identify the first-order and second-order natural frequencies regardless of whether it is under high- or low-SNR conditions,and the obtained damping ratio coefficient is also close to the comparison value. There-fore, compared with the traditional Data-SSI method, the improved Data-SSI method ismore accurate for identifying the modal parameter of dynamic deflection under randomenvironmental excitation.
Table 6. Frequencies and damping ratios under different intensities of noise of Beishatan Bridgeusing the improved Data-SSI method.
SNR 15 dB 20 dB 25 dB 30 dB
Windows f (Hz) ζ (%) f (Hz) ζ (%) f (Hz) ζ (%) f (Hz) ζ (%)
Window 12.3204 8.03 2.3211 7.95 2.3196 8.08 2.3189 8.084.6723 12.97 4.6723 12.93 4.6723 12.87 4.6723 12.91
Window 22.3192 8.10 2.3184 8.07 2.3185 8.13 2.3188 8.124.6769 12.85 4.6769 12.91 4.6769 12.87 4.6769 12.82
To evaluate the safety of the Beishatan Bridge, the monitored point of the RSB with adistance of about 15 m to the IBIS-S instrument was selected to make comparison with thesame position of the LSB, which is the location of the maximum deflection. Consideringthe vibration characteristics under the influence of different states, the first 6-order modalparameters were used as a reference. As shown in Table 7, when taking the LSB as acompletely lossless structural model, the RSB experienced a large-scale drop in frequencyand an increase in damping ratio. Compared with the results of parameter identification ata distance of about 5 m, as shown in Table 8, it can be seen that the frequency difference anddamping ratio coefficient difference for the non-damaged area are not much different fromthose of the lossless model. Therefore, this method can preliminarily identify the locationwhere damage has occurred, and provide a basis for subsequent further safety assessments.
Table 7. Modal parameters identified at distance of about 15 m.
Frequency (Hz) Damping Ratio (%)Modal LSB RSB Difference Ratio LSB RSB Difference Ratio
1 1.597 1.895 18.7% 16.4 21.0 28%2 3.161 2.586 18.2% 7.8 6.0 23%3 4.75 4.112 13.4% 8.5 7.4 12.9%4 6.336 5.876 23% 5.0 3.6 28%5 7.96 6.918 13.1% 2.9 3.3 13.8%6 9.588 7.912 17.5% 19.5 23 17.9%

Buildings 2022, 12, 253 14 of 16
Table 8. Modal parameters identified at distance of about 5 m.
Frequency (Hz) Damping Ratio (%)Modal LSB RSB Difference Ratio LSB RSB Difference Ratio
1 1.587 1.568 1.9% 3.9 3.7 5.1%2 3.170 3286 3.66% 7.6 6.9 9.2%3 4.762 4.512 5.24% 7.8 7.61 2.4%4 6.364 6.276 1.4% 6.1 6.2 1.6%5 8.073 7.918 1.9% 18.5 18.1 2.16%6 9.561 9.712 1.6% 4.5 4.4 2.2%
5. Conclusions
With the advantages of robustness, numerical stability, and high identification accu-racy, the Data-SSI method has been successfully applied to modal parameter extractionof various civil engineering structures under operating conditions. To improve the com-putational efficiency and accuracy of the Data-SSI method for bridge modal parameterestimation using GB-SAR, an improved Data-SSI with autocorrelation matrix modal orderestimation was proposed in this study. The results presented in this study clearly highlightthe following.
1. Compared with the Hankel matrix constructed directly from the original data, a box-plot filter can be used to construct a more stable Hankel matrix to improve the accuracyof the bridge dynamic deflection. The results indicate that the boxplot has a goodability to reduce the influence of the environmental noise and abnormal data.
2. The small ill-conditioned column vectors can be filtered and deleted in the Hankelmatrix using the improved Data-SSI method. Therefore, as the number of columnsof the Hankel matrix is reduced, it not only speeds up the generation of the Hankelmatrix, but also produces fewer projection errors.
3. The maximum value of RDI is adopted to judge the modal order after SVD decom-position. The results of simulation and field experiments show that it has a strongeranti-noise performance and a more competitive advantage in computational efficiencythan the traditional Data-SSI method.
After the natural frequency and damping ratio of the structure are accurately identified,the operating state of the bridge can be further obtained and safety assessment can becarried out by means of finite element analysis or other methods.
Author Contributions: Conceptualization, X.L., M.H. and R.W.; methodology, X.L., M.H. and S.Z.;validation, X.L., S.Z. and R.W.; formal analysis, S.Z. and P.W.; data curation, X.L.; writing—originaldraft preparation, S.Z. and P.W.; writing—review and editing, X.L., S.Z. and R.W.; supervision, X.L.and R.W. funding acquisition, X.L. All authors have read and agreed to the published version ofthe manuscript.
Funding: This research was funded by the Ministry of Science and Technology of the People’sRepublic of China, grant number 2018YFE0206100; the National Natural Science Foundation of China,grant numbers 41871367 and 42171416; the Fundamental Research Funds for Beijing Universitiesgrant number X20150; and the BUCEA Postgraduate Innovation Project.
Institutional Review Board Statement: Not applicable.
Informed Consent Statement: Not applicable.
Data Availability Statement: Not applicable.
Conflicts of Interest: The authors declare no conflict of interest.

Buildings 2022, 12, 253 15 of 16
References1. He, H.; Zhou, Y.; Cao, J.; Zhang, J. Calibration Method for Dynamic Deflection Measurement of Bridges by Photogrammetry. J.
Phys. Conf. 2018, 1061, 012004. [CrossRef]2. Hsieh, K.H.; Halling, M.W.; Barr, P.J. Overview of vibrational structural health monitoring with representative case studies. J.
Bridge Eng. 2006, 11, 707–715. [CrossRef]3. Gentile, C.; Bernardini, G. An interferometric radar for non-contact measurement of deflections on civil engineering structures:
Laboratory and full-scale tests. Struct. Infrastruct. Eng. 2010, 6, 521–534. [CrossRef]4. Tarchi, D.; Rudolf, H.; Pieraccini, M.; Atzeni, C. Remote monitoring of buildings using a ground-based SAR: Application to
cultural heritage survey. Int. J. Remote Sens. 2000, 21, 3545–3551. [CrossRef]5. Gökdag, H.; Kopmaz, O. A new damage detection approach for beam-type structures based on the combination of continuous
and discrete wavelet transforms. J. Sound Vib. 2009, 324, 1158–1180. [CrossRef]6. Hearn, G.; Testa, R.B. Modal Analysis for Damage Assessment in Structures. J. Sound Vib. 1991, 24, 3042–3063.7. Dilena, M.; Morassi, A. The use of antiresonances for crack detection in beams. J. Sound Vib. 2004, 276, 195–214. [CrossRef]8. Reynders, E.; Maes, K.; Lombaert, G.; De Roeck, G. Uncertainty quantification in operational modal analysis with stochastic
subspace identification: Validation and applications. Mech. Syst. Signal Process. 2016, 66, 13–30. [CrossRef]9. Peeters, B.; De Roeck, G. Reference-based stochastic subspace identification for output-only modal analysis. Mech. Syst. Signal
Process. 1999, 13, 855–878. [CrossRef]10. Van Overschee, P.; De Moor, B.L. Subspace Identification for Linear Systems: Theory—Implementation—Applications; Springer Science
& Business Media: Berlin, Germany, 2012.11. De Moor, B.; Van Overschee, P. Numerical algorithms for subspace state space system identification. In Trends Control; Springer:
Berlin, Germany, 1995; pp. 385–422.12. Arun, K.S.; Kung, S.Y. Balanced approximation of stochastic systems. SIAM J. Matrix Anal. Appl. 1990, 11, 42–68. [CrossRef]13. Yu, D.J.; Ren, W.X. EMD-based stochastic subspace identification of structures from operational vibration measurements. Eng.
Struct. 2005, 27, 1741–1751. [CrossRef]14. Magalhães, F.; Caetano, E.; Cunha, Á. Challenges in the application of stochastic modal identification methods to a cable-stayed
bridge. J. Bridge Eng. 2007, 12, 746–754. [CrossRef]15. Peeters, B.; De Roeck, G.; Pollet, T.; Schueremans, L. Stochastic subspace techniques applied to parameter identification of civil
engineering structures. In Proceedings of the New Advances in Modal Synthesis of Large Structures: Nonlinear, Damped andNondeterministic Cases, Lyon, France, 5–6 October 1995; pp. 151–162.
16. Peeters, B.; De Roeck, G. The performance of time domain system identification methods applied to operational data. InProceedings of the DAMAS, Sheffield, UK, 30 June–2 July 1997; p. 97.
17. Peeters, B.; De Roeck, G.; Hermans, L.; Wauters, T.; Krämer, C.; De Smet, C. Comparison of system identification methods usingoperational data of a bridge test. Proc. Int. Semin. Modal Anal. 1999, 2, 923–930.
18. Peeters, B.; De Roeck, G. Stochastic system identification for operational modal analysis: A review. J. Dyn. Sys. Meas. Control 2001,123, 659–667. [CrossRef]
19. Boonyapinyo, V.; Janesupasaeree, T. Data-driven stochastic subspace identification of flutter derivatives of bridge decks. J. Wind.Eng. Ind. Aerodyn. 2010, 98, 784–799. [CrossRef]
20. Ubertini, F.; Materazzi, A.L.; Gentile, C.; Pelliccia, F. Automatic identification of modal parameters: Application to a rein-forced concrete arch bridge. In Proceedings of the EACS 2012—5th European Conference on Structural Control, Genoa, Italy,18–20 June 2012.
21. Shokravi, H.; Shokravi, H.; Bakhary, N.; Rahimian Koloor, S.S.; Petru, M. A comparative study of the data-driven stochasticsubspace methods for health monitoring of structures: A bridge case study. Appl. Sci. 2020, 10, 3132. [CrossRef]
22. Aggarwal, C.C.; Bhuiyan, M.A.; Al Hasan, M. Frequent Pattern Mining Algorithms: A Survey Frequent Pattern Mining; Springer:Cham, Switzerland, 2014; pp. 19–64.
23. Frigge, M.; Hoaglin, D.C.; Iglewicz, B. Some implementations of the boxplot. Am. Stat. 1989, 43, 50–54.24. Reynders, E.; De Roeck, G. Reference-based combined deterministic–stochastic subspace identification for experimental and
operational modal analysis. Mech. Syst. Signal Process. 2008, 22, 617–637. [CrossRef]25. Magalhaes, F.; Cunha, A.; Caetano, E. Online automatic identification of the modal parameters of a long span arch bridge. Mech.
Syst. Signal Process. 2009, 23, 316–329. [CrossRef]26. Jain, S.K.; Singh, S.N. Exact model order ESPRIT technique for harmonics and interharmonics estimation. IEEE Trans. Instrum.
Meas. 2012, 61, 1915–1923. [CrossRef]27. Jain, S.K.; Jain, P.; Singh, S.N. A fast harmonic phasor measurement method for smart grid applications. IEEE Trans. Smart Grid
2016, 8, 493–502. [CrossRef]28. Hua, Y.; Sarkar, T.K. Matrix pencil method for estimating parameters of exponentially damped/undamped sinusoids in noise.
IEEE Trans. Acoust. Speech Signal Process. 1990, 38, 814–824. [CrossRef]29. Sarkar, T.K.; Pereira, O. Using the matrix pencil method to estimate the parameters of a sum of complex exponentials. IEEE
Antennas Propag. Mag. 1995, 37, 48–55. [CrossRef]

Buildings 2022, 12, 253 16 of 16
30. Juang, J.N.; Pappa, R.S. An eigensystem realization algorithm for modal parameter identification and model reduction. J. Guid.Control Dyn. 1985, 8, 620–627. [CrossRef]
31. Rödelsperger, S.; Läufer, G.; Gerstenecker, C.; Becker, M. Monitoring of displacements with ground-based microwave interferom-etry: IBIS-S and IBIS-L. J. Appl. Geod. 2010, 4, 41–54. [CrossRef]
32. Suksmono, A.B.; Bharata, E.; Lestari, A.A.; Yarovoy, A.G.; Ligthart, L.P. Compressive stepped-frequency continuous-waveground-penetrating radar. IEEE Geosci. Remote Sens. Lett. 2010, 7, 665–669. [CrossRef]