Importance of seasonality and small streams for the landscape regulation of dissolved organic carbon...
11
Importance of seasonality and small streams for the landscape regulation of dissolved organic carbon export A. A ˚ gren, 1 I. Buffam, 2 M. Jansson, 1 and H. Laudon 1 Received 23 November 2006; revised 19 April 2007; accepted 8 May 2007; published 19 July 2007. [1] The regulation of the spatial and seasonal variation in terrestrial dissolved organic carbon (DOC) exports was studied in a 68 km 2 boreal stream system in northern Sweden. A total of 1213 DOC samples were collected in 15 subcatchments over a 3 year period (2003–2005). The mean annual DOC exports from the 15 subcatchments (0.03 – 21.72 km 2 ) ranged from 14.8 to 99.1 kg ha 1 yr 1 . Many catchment characteristics determined the spatial variation in DOC exports. The relative importance of the different catchment characteristics varied greatly between seasons because of differing hydrological conditions. During winter base flow the spatial variation was linked to patterns in wetland coverage. During snowmelt in spring the spatial variation was connected to characteristics describing size and location, i.e., median stream size, silty sediment distribution, stream order, altitude, and proportion of catchment above highest postglacial coastline (HC). During the snow-free season the spatial variation in DOC exports was regulated by the amount of wetlands and forests, particularly forests made up of Norway spruce (Picea abies). Median stream size also influenced the exports during this season. A striking result in this study was the effect of size implying that small headwaters may be the largest contributor to the terrestrial DOC export, per unit area. Citation: A ˚ gren, A., I. Buffam, M. Jansson, and H. Laudon (2007), Importance of seasonality and small streams for the landscape regulation of dissolved organic carbon export, J. Geophys. Res., 112, G03003, doi:10.1029/2006JG000381. 1. Introduction [2] Dissolved organic carbon (DOC) that is exported from soils to surface waters has many effects on the ecology of aquatic systems. It is a source of nutrients and energy for heterotrophic bacteria, and the mineralization of allochtho- nous DOC turns aquatic systems into net sources of CO 2 to the atmosphere [Duarte and Prairie, 2005]. In northern Sweden the episodic stream water pH decline during spring flood and autumn storm episodes is mainly driven by the organic acids associated with increasing DOC [Laudon et al., 2000; Laudon and Bishop, 2002]. DOC also affects the export and toxicity of metals [Bishop et al., 1995], but its effect on metals is complicated and double-edged. For example, the lowering of pH by the organic acids increases the aluminum levels in the aquatic system because of increased mobility and the low pH also changes the alumi- num into a more toxic form. At the same time, DOC decreases the toxicity of metals by binding Al into a less toxic organic form [Cory et al., 2006]. The organic carbon thereby affects the survival of fish during acid episodes by decreasing the toxicity of Al [Laudon et al., 2005]. Given the large impact of DOC in the aquatic ecosystems, it is important to understand the regulation of the terrestrial carbon exports. [3] Terrestrial DOC export is determined by interacting catchment characteristics such as soil type, vegetation, and hydrology [Cronan et al., 1999; Dillon and Molot, 1997]. Consequently, there are large variations in the DOC export on spatial [Clark et al., 2004; Dawson et al., 2004; Mulholland, 2003] and temporal [Hope et al., 1994; Laudon et al., 2004a] scales. Wetland coverage is often a good predictor of stream water DOC concentrations and fluxes. Riparian wetlands, in particular, can be a major source of DOC in forested catch- ments, especially during high-flow situations [Bishop et al., 2004; Hinton et al., 1998]. [4] Although wetlands often have a high export of DOC, leaching from forest floors has also been reported to control the terrestrial carbon export and DOC concentrations in surface waters [Clark et al., 2004; Hinton et al., 1997; Hongve, 1999; Schiff et al., 1998; Thurman, 1985]. The amount of DOC exported depends on the type of forest. Leaching is higher from Norway spruce stands compared to Scots pine stands because of the higher production of litter in the spruce forest floor [Strobel et al., 2001]. Deciduous litter is most easily degraded, and the DOC yield from deciduous litter has been found to be higher than from spruce litter [Hongve, 1999; Hongve et al., 2000]. [5] Catchment area is another important parameter linked to the spatial variation in the DOC export. Interstream variation in DOC concentrations is higher for small streams than large rivers [Driscoll et al., 1988; Sedell and Dahm, 1990; Temnerud and Bishop, 2005; Wolock et al., 1997]. A JOURNAL OF GEOPHYSICAL RESEARCH, VOL. 112, G03003, doi:10.1029/2006JG000381, 2007 Click Here for Full Articl e 1 Department of Ecology and Environmental Science, Umea ˚ University, Umea ˚, Sweden. 2 Department of Forest Ecology, Swedish University of Agricultural Sciences, Umea ˚, Sweden. Copyright 2007 by the American Geophysical Union. 0148-0227/07/2006JG000381$09.00 G03003 1 of 11
-
Upload
independent -
Category
Documents
-
view
4 -
download
0
Transcript of Importance of seasonality and small streams for the landscape regulation of dissolved organic carbon...
Importance of seasonality and small streams for the landscape
regulation of dissolved organic carbon export
A. Agren,1 I. Buffam,2 M. Jansson,1 and H. Laudon1
Received 23 November 2006; revised 19 April 2007; accepted 8 May 2007; published 19 July 2007.
[1] The regulation of the spatial and seasonal variation in terrestrial dissolved organiccarbon (DOC) exports was studied in a 68 km2 boreal stream system in northernSweden. A total of 1213 DOC samples were collected in 15 subcatchments over a 3 yearperiod (2003–2005). The mean annual DOC exports from the 15 subcatchments(0.03–21.72 km2) ranged from 14.8 to 99.1 kg ha�1 yr�1. Many catchment characteristicsdetermined the spatial variation in DOC exports. The relative importance of thedifferent catchment characteristics varied greatly between seasons because of differinghydrological conditions. During winter base flow the spatial variation was linked topatterns in wetland coverage. During snowmelt in spring the spatial variation wasconnected to characteristics describing size and location, i.e., median stream size, siltysediment distribution, stream order, altitude, and proportion of catchment above highestpostglacial coastline (HC). During the snow-free season the spatial variation in DOCexports was regulated by the amount of wetlands and forests, particularly forests made upof Norway spruce (Picea abies). Median stream size also influenced the exports duringthis season. A striking result in this study was the effect of size implying that smallheadwaters may be the largest contributor to the terrestrial DOC export, per unit area.
Citation: Agren, A., I. Buffam, M. Jansson, and H. Laudon (2007), Importance of seasonality and small streams for the landscape
regulation of dissolved organic carbon export, J. Geophys. Res., 112, G03003, doi:10.1029/2006JG000381.
1. Introduction
[2] Dissolved organic carbon (DOC) that is exportedfrom soils to surface waters has many effects on the ecologyof aquatic systems. It is a source of nutrients and energy forheterotrophic bacteria, and the mineralization of allochtho-nous DOC turns aquatic systems into net sources of CO2 tothe atmosphere [Duarte and Prairie, 2005]. In northernSweden the episodic stream water pH decline during springflood and autumn storm episodes is mainly driven by theorganic acids associated with increasing DOC [Laudon etal., 2000; Laudon and Bishop, 2002]. DOC also affects theexport and toxicity of metals [Bishop et al., 1995], but itseffect on metals is complicated and double-edged. Forexample, the lowering of pH by the organic acids increasesthe aluminum levels in the aquatic system because ofincreased mobility and the low pH also changes the alumi-num into a more toxic form. At the same time, DOCdecreases the toxicity of metals by binding Al into a lesstoxic organic form [Cory et al., 2006]. The organic carbonthereby affects the survival of fish during acid episodes bydecreasing the toxicity of Al [Laudon et al., 2005]. Giventhe large impact of DOC in the aquatic ecosystems, it is
important to understand the regulation of the terrestrialcarbon exports.[3] Terrestrial DOC export is determined by interacting
catchment characteristics such as soil type, vegetation, andhydrology [Cronan et al., 1999; Dillon and Molot, 1997].Consequently, there are large variations in the DOC export onspatial [Clark et al., 2004; Dawson et al., 2004;Mulholland,2003] and temporal [Hope et al., 1994; Laudon et al., 2004a]scales. Wetland coverage is often a good predictor of streamwater DOC concentrations and fluxes. Riparian wetlands, inparticular, can be a major source of DOC in forested catch-ments, especially during high-flow situations [Bishop et al.,2004; Hinton et al., 1998].[4] Although wetlands often have a high export of DOC,
leaching from forest floors has also been reported to controlthe terrestrial carbon export and DOC concentrations insurface waters [Clark et al., 2004; Hinton et al., 1997;Hongve, 1999; Schiff et al., 1998; Thurman, 1985]. Theamount of DOC exported depends on the type of forest.Leaching is higher from Norway spruce stands compared toScots pine stands because of the higher production of litterin the spruce forest floor [Strobel et al., 2001]. Deciduouslitter is most easily degraded, and the DOC yield fromdeciduous litter has been found to be higher than fromspruce litter [Hongve, 1999; Hongve et al., 2000].[5] Catchment area is another important parameter linked
to the spatial variation in the DOC export. Interstreamvariation in DOC concentrations is higher for small streamsthan large rivers [Driscoll et al., 1988; Sedell and Dahm,1990; Temnerud and Bishop, 2005; Wolock et al., 1997]. A
JOURNAL OF GEOPHYSICAL RESEARCH, VOL. 112, G03003, doi:10.1029/2006JG000381, 2007ClickHere
for
FullArticle
1Department of Ecology and Environmental Science, Umea University,Umea, Sweden.
2Department of Forest Ecology, Swedish University of AgriculturalSciences, Umea, Sweden.
Copyright 2007 by the American Geophysical Union.0148-0227/07/2006JG000381$09.00
G03003 1 of 11
major factor in reducing the variability of DOC concen-trations in rivers with distance downstream is mixing ofdifferent sources. DOC concentrations and export also oftendecrease with distance downstream [Mattsson et al., 2003;Temnerud and Bishop, 2005; Wolock et al., 1997]. Possiblereasons for a downstream decrease in DOC include chang-ing hydrological pathways in soils and increasing propor-tion of postglacial sediments deposited in the lower lyingparts of a catchment that reduce the export because of DOCadsorption on the mineral surfaces [Kalbitz et al., 2000].[6] In addition to the spatial variation in DOC export
caused by catchment vegetation and soil properties, thereare considerable temporal variations linked to hydrologicalvariations. The highest export is connected to high-flowepisodes [Meybeck, 1982; Schiff et al., 1998]. However,hydrological events can have a different impact on DOCdepending upon soil types or other catchment character-istics. For example, in forested catchments the stream DOC
levels often increase during spring flood because of risingwater tables flushing out DOC-rich water previously storedin the soil [Hornberger et al., 1994]. In boreal streams thatdrain wetlands the DOC levels sometimes decrease duringspring flood because of dilution by snowmelt water thatreaches the streams with minimal soil contact due toimpermeable soil frost and/or saturated surfaces [Laudonet al., 2004a; Schiff et al., 1998].[7] Catchment DOC export is regulated by a combination
of parameters that vary in time and space. To what extentthe different factors will affect the DOC export from acatchment depends on the spatial distribution of catchmentcharacteristics and the hydrological regime. We carried out astudy to assess (1) how the terrestrial DOC export wasdetermined by different catchment properties, (2) how DOCexport was dependent on, and varied with, seasonal hydro-logical conditions, and (3) whether small headwaters werelarger contributors to catchment export than streams of
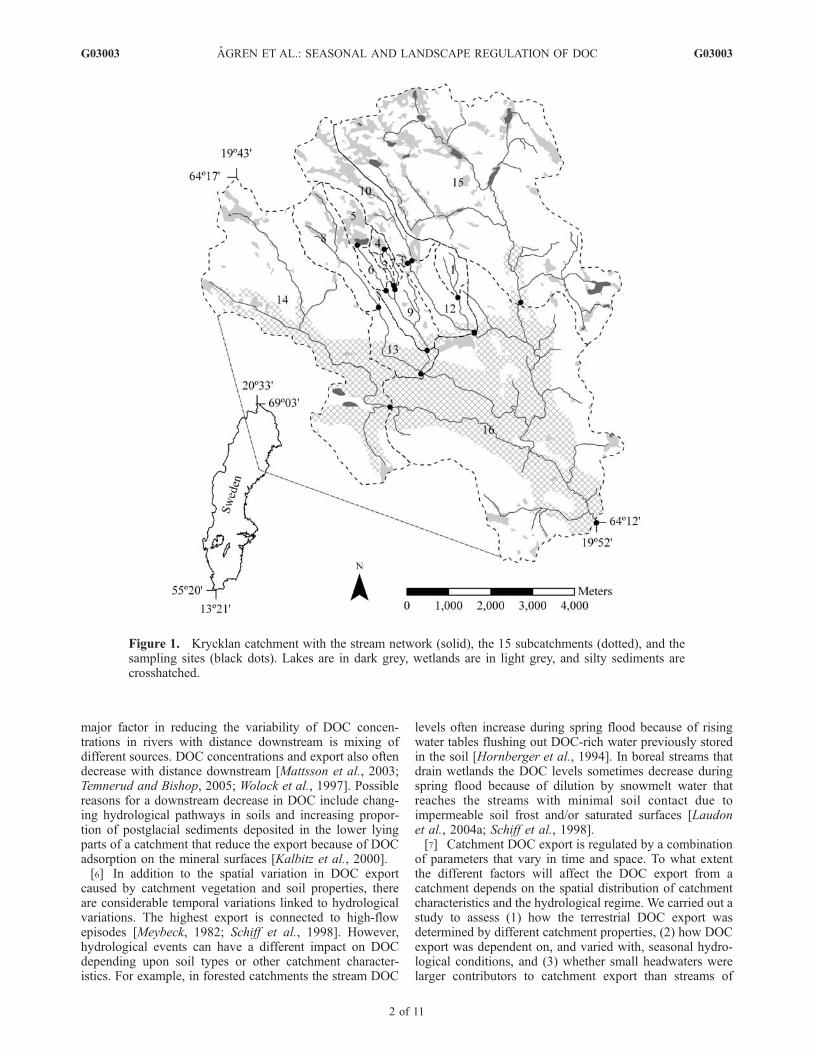
Figure 1. Krycklan catchment with the stream network (solid), the 15 subcatchments (dotted), and thesampling sites (black dots). Lakes are in dark grey, wetlands are in light grey, and silty sediments arecrosshatched.
G03003 AGREN ET AL.: SEASONAL AND LANDSCAPE REGULATION OF DOC
2 of 11
G03003
higher order. The study was carried out using data from15 subcatchments in the 68 km2 Krycklan experimentalcatchment in northern Sweden.
2. Material and Methods
2.1. Study Area
[8] The Krycklan catchment is a forested watershedsituated in the central boreal zone. The whole catchmentis 68 km2 and consists of 15 subcatchments which rangefrom 0.03 to 21.72 km2 (Figure 1). The bedrock consists ofSvecofennian rocks with 94% metasediments/metagray-wacke, 4% acid and intermediate metavolcanic rocks, and3% basic metavolcanic rocks. The quaternary deposits aredominated by till (Table 1). Wetlands are common in theupper flatter parts of the catchment and cover between 0 and76% of the subcatchments. Approximately 56% of theKrycklan catchment area is below the highest postglacialcoastline (HC). The postglacial sediments in these parts ofthe catchment are dominated by silt which covers up to 59%of the lower lying subcatchments. The silty sediments weredeposited in the distal part of a postglacial delta. Thesediment deposits form a thick layer through which thelarger traversing streams have deeply incised channelsforming ravines and bluffs of up to 30 m height. Agricul-tural land covers only 1% of the total catchment. Forestcovers most of the catchment (on average 84%, rangingfrom 24 to 100% between subcatchments) and is composedof about 40 vol % Norway spruce (Picea abies), 50 vol %Scots pine (Pinus sylvestris), and 10 vol % deciduous foreststands, mainly birch (Betula ssp.). The forest soil is pre-dominantly well-developed iron podzol. Surface waters(sum of lake and stream area) cover 0.1–4.7% of thesubcatchments. Stream order ranges from first to fourthorder. Mean annual air temperature is 1.3�C, and the annualprecipitation is 600 mm of which about approximately 50%becomes runoff. The area has on average 5 months of snowcover, and about 35% of the precipitation falls as snow[Lofvenius et al., 2003].
2.2. Sampling and Calculations
[9] Site 7 is used as an index site. In the 0.5 km2 Nyangetcatchment (composed of site 7 and up-stream sites 2 and 4,
Figure 1), soil hydrologic parameters, streamflow, andchemistry have been monitored since 1980. Discharge hasbeen monitored continuously (every 10 s) at site 7 using a90� V notch in a heated dam house. Discrete dischargemeasurements using salt dilution or bucket flow (N = 259)at the 15 sites were used to assess the intersite uncertainty inthe discharge between the 15 sites. Daily discharge wascalculated using continuous registration of the stream waterlevel and established height-discharge rating curves. A totalof 1213 water samples were collected in streams in the15 subcatchments (Figure 1) from January 2003 to December2005. Samples were collected in acid-washed 250 mL high-density polyethylene bottles after multiple rinses with streamwater. Samples were taken frequently during the high-flowsnowmelt season (every 2 days) and less frequently duringthe rest of the year (weekly to monthly sampling). Sampleswere kept cool and dark up to 1 week but typically lessthan 2 days until processing. During 2003 and 2005,samples were frozen until analysis without filtration. Dur-ing 2004, samples were filtered through a 0.45 mm mixedcellulose ester (MCE) filter and were then frozen untilanalyzed. A comparison between sites covering theextremes of observed flows showed that there was nomeasurable difference in the concentration because offiltering. This result is in agreement with other studies ofSwedish surface waters [Ingri, 1996; Ivarsson and Jansson,1995; Laudon and Bishop, 1999] which found particulateorganic carbon concentration to be negligible relative to thedissolved fraction. Thus we use the term DOC for allsamples in this study. Samples were acidified and spargedto remove inorganic carbon before DOC was measuredusing a Shimadzu total organic carbon-VPCH analyzer.[10] Flow values were averaged to give a daily mean
discharge. Higher-frequency samples (every 3 hours for24 hours) taken at 8 of the 15 sites during spring floodand autumn low flow revealed little variation in DOCconcentration on this timescale (mean coefficient of varia-tion 4%) and no clear diurnal pattern (I. Buffam, unpub-lished data, 2005). We therefore assume that only a minorbias, if any, is introduced by our DOC sampling regime,which involves sampling different sites at different times ofday, or in the transferring of the high-resolution flowmeasurement to daily mean discharge.
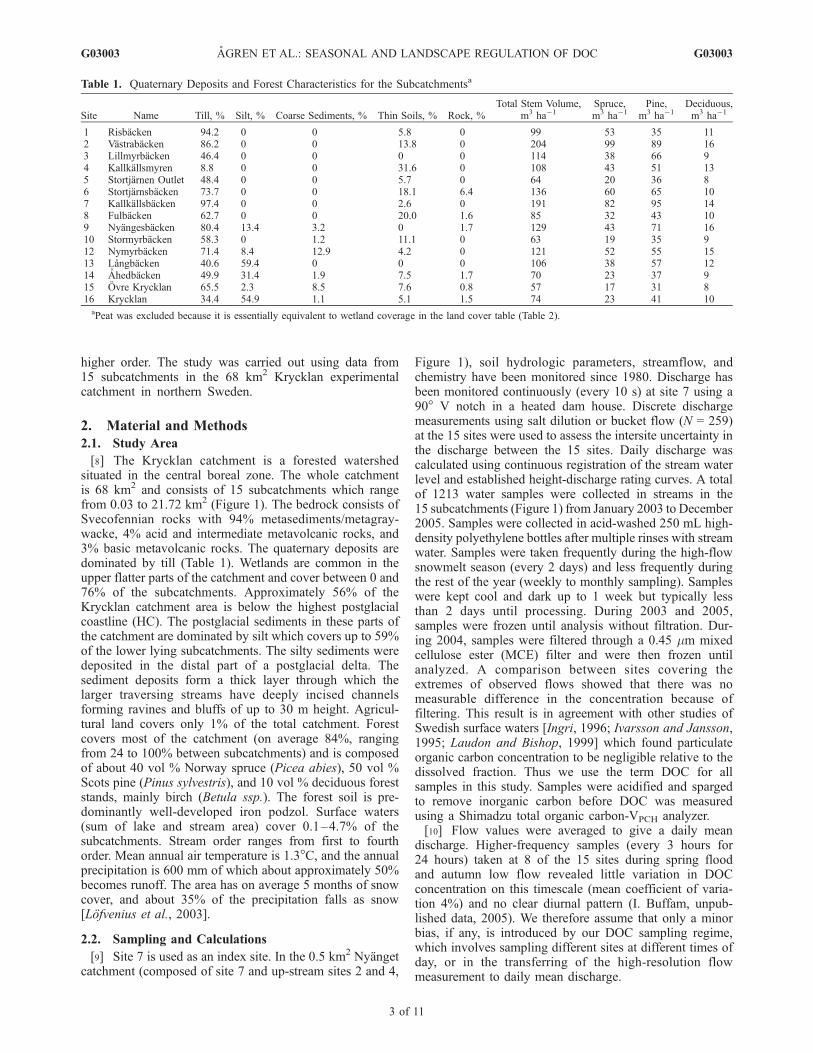
Table 1. Quaternary Deposits and Forest Characteristics for the Subcatchmentsa
Site Name Till, % Silt, % Coarse Sediments, % Thin Soils, % Rock, %Total Stem Volume,
m3 ha�1Spruce,m3 ha�1
Pine,m3 ha�1
Deciduous,m3 ha�1
1 Risbacken 94.2 0 0 5.8 0 99 53 35 112 Vastrabacken 86.2 0 0 13.8 0 204 99 89 163 Lillmyrbacken 46.4 0 0 0 0 114 38 66 94 Kallkallsmyren 8.8 0 0 31.6 0 108 43 51 135 Stortjarnen Outlet 48.4 0 0 5.7 0 64 20 36 86 Stortjarnsbacken 73.7 0 0 18.1 6.4 136 60 65 107 Kallkallsbacken 97.4 0 0 2.6 0 191 82 95 148 Fulbacken 62.7 0 0 20.0 1.6 85 32 43 109 Nyangesbacken 80.4 13.4 3.2 0 1.7 129 43 71 1610 Stormyrbacken 58.3 0 1.2 11.1 0 63 19 35 912 Nymyrbacken 71.4 8.4 12.9 4.2 0 121 52 55 1513 Langbacken 40.6 59.4 0 0 0 106 38 57 1214 Ahedbacken 49.9 31.4 1.9 7.5 1.7 70 23 37 915 Ovre Krycklan 65.5 2.3 8.5 7.6 0.8 57 17 31 816 Krycklan 34.4 54.9 1.1 5.1 1.5 74 23 41 10aPeat was excluded because it is essentially equivalent to wetland coverage in the land cover table (Table 2).
G03003 AGREN ET AL.: SEASONAL AND LANDSCAPE REGULATION OF DOC
3 of 11
G03003

[11] The DOC sample was assigned to the day of thesampling. Daily values of DOC were obtained by linearinterpolation. A previous comparison between linear inter-polation of DOC and flow-dependent regression showedthat the two methods produced comparable results (at most10% discrepancy) [Laudon et al., 2004a]. The daily terres-trial carbon exports were then calculated by multiplying thedaily discharge with the linearly interpolated daily DOC.Seasonal exports were obtained by summarizing dailyexports. All 15 stream sites were sampled for DOC duringthe same day. Specific discharge at site 7 was used toestimate the discharge in all subcatchments, assuming thatspecific runoff was the same in all catchments. SeasonalDOC export was analyzed for three seasons: the snowmeltseason, the snow-free season, and the snow covered season.The snowmelt season, which is characterized by high flow,was defined as the period from the steep incline in thehydrograph due to the first snowmelt to the first summerbase flow situation (16 March to 4 June 2003, 15 April to10 June 2004, and 5 April to 3 June 2005). The snow-freeseason, which is characterized by low flow with occasionalepisodes due to rain, was defined as the period from the firstsummer base flow situation to the end of the last event ofthe fall, i.e., establishment of the winter base flow (5 June to25 November 2003, 11 June to 21 November 2004, and4 June to 24 November 2005). The snow covered season,which is characterized by a stable low flow, was subse-quently defined as the period from the end of the last eventof the fall to the steep incline in the hydrograph due to thefirst snowmelt (26 November 2002 to 15 March 2003,22 November 2003 to 14 April 2004, and 25 November2004 to 4 April 2005). This division was based on previousstudies showing the dependence of DOC concentrationon these major hydrological variations [Heikkinen, 1990;Mulholland and Hill, 1997].[12] Because many of the sampling sites are connected
with upstream catchments, we calculated the transport forthe different subcatchments as shown in Figure 2. Thesubcatchment area is defined as the grey area.
[13] We consider that the calculated transport representsthe terrestrial DOC export. We assume no in-stream loss ofDOC because during high flow when the largest exportsoccurred, the in-stream transit time was generally less than10 hours, which is too short for substantial degradation ofthe highly recalcitrant allochthonous DOC [Hessen andTranvik, 1998; Kohler et al., 2002].
2.3. Catchment Characteristics
[14] Maps, complemented with field observations, wereused to characterize the subcatchments. A parameter ‘‘me-dian stream size’’ was generated for each subcatchmentusing a raster stream network developed for the Krycklancatchment based on gridded elevation data (DEM) with agrid resolution of 50 m. The stream network consisted of1654 stream cells, and for each stream cell the catchmentarea draining through the particular stream cell was calcu-lated. Median stream size was calculated as the medianvalue of the distribution of drainage areas for all stream gridcells within a particular subcatchment and is expressed inunits of area. The DEM was also used to calculate theproportion of the subcatchment above HC (areas withaltitude higher than 257.5 m above sea level (asl)). Thedigital Swedish topography map (1:100,000) (Lantmateriet,Gavle, Sweden) was used to define the parameters: streamorder at the sampling point; the altitude of the samplingpoint; and the proportion of surface water, forest, wetland,and agricultural areas within each subcatchment. The soilmap (1:100,000) (Geological Survey of Sweden, Uppsala,Sweden) was used to define the proportion of silt, sand,glaciofluvial sediments, till, thin soils, rock, and gravelwithin each subcatchment. A problem for the statisticalanalysis was that many of the sediment types were onlyfound in one or a few of the subcatchments, which meantthat we could not find any statistically significant relation-ships for those parameters. Sand, gravel, and glaciofluvialsediments (ice river alluvium, mostly gravel and sand) weretherefore added into a joint parameter called coarse sedi-ments, which increased the number of observations and thepower in the statistical analysis. Forest information forthe watershed was estimated from satellite data from thenational forest inventory by the k nearest-neighbor method[Reese et al., 2003]. The total stem volume and the volumeofNorway spruce (Picea abies), Scots pine (Pinus sylvestris),and deciduous forest, mainly birch (Betula ssp.), were used.A total of 17 different landscape characteristics were used tocharacterize the subcatchments (Tables 1 and 2).
2.4. Statistical Analyses
2.4.1. Principal Component Analysis[15] The catchment characteristics in Tables 1 and 2 were
studied in order to explain the spatial difference in theterrestrial DOC export between subcatchments. Since manyof the catchment characteristics covary, we used principalcomponent analysis (PCA) to obtain independent variables,the principal components, which describe the variation ofthe catchment characteristics between the subcatchments.Before the PCA was performed, the data were preprocessedand transformed to achieve normally distributed data inorder to fulfill important linear assumptions. The coverageof agricultural area could not be transformed into normaldistribution and was therefore excluded from the analysis.
Figure 2. Example of the transport calculations forconnected catchments. The transport calculated from theupstream site (A) was subtracted from the transportcalculated at the downstream site (B) to obtain the DOCcontribution from the downstream catchment represented bythe grey area.
G03003 AGREN ET AL.: SEASONAL AND LANDSCAPE REGULATION OF DOC
4 of 11
G03003
The relationships between catchment characteristics andDOC export were analyzed using stepwise multiple linearregressions (stepwise criteria; probability of F to enter p �0.05 and probability of F to remove p � 0.10). Regressionswere considered significant if p < 0.05. Diagnostic checkswere done to assure that the regression analysis did notviolate classical assumptions, for example, White’s test ofheteroskedasticity [Gupta, 1999].2.4.2. Partial Correlations[16] Partial correlations were used to further investigate
the impact of individual variables on the DOC export. Thepartial correlations coefficients describe the linear relation-ship between two variables while controlling for the effectsof one or more additional variables. Using that method, wecan identify false correlations, i.e., when confoundingfactors create a relationship where none actually exists,and uncover hidden relationships. Correlations were con-sidered significant if p < 0.05 and strongly significant if p <0.01. SPSS 14.0 was used for all statistical calculations.
2.5. Uncertainty Analyses
[17] On the basis of replicate injections the error in theprecision of the DOC analyses was on average 2% and atworst 5%. As a conservative measure, 5% was used for theuncertainty in the DOC analysis.[18] In extrapolation of discharge from a single stream
site, there were two main potential sources of error/uncertainty arising: The first, which was incorporated intothe Monte Carlo analysis, was intersite differences in annualdischarge (‘‘bias’’), and the second, which was handledseparately, was differences in response to snowmelt andprecipitation events, named ‘‘flashiness.’’ Bias (due todifferences in subcatchment evapotranspiration, for in-stance) was estimated on the basis of discrete dischargemeasurements at the 15 sites which were compared to thecontinuous measurements at site 7. The mean absolute valueof bias for the remaining 14 sites was calculated to 12%.This is probably a high estimate because it is based on aseries of individual measurements rather than total annualdischarge. Over longer time periods (e.g., seasonal orannual) the effects of having different daily discharges will
tend to even out, e.g., some days with flow higher thansite 7, other days with flow lower than site 7. The bias of12% is also higher than the standard deviation of 8% in theannual discharge from seven boreal catchments in northernSweden found by Laudon et al. [2004a]. In general, thelonger the time period in consideration, the lower the errorin mean Q. If there is a consistent overall difference indischarge between the given site and site 7, this bias willremain, however, even when we consider long time periods.The uncertainty in discharge for site 7 was estimated to be5% based on comparing manual, instantaneous measure-ments to the data logger measurements and allowing forpossible errors in the catchment area calculation [Laudon etal., 2004b].[19] The uncertainties in the DOC exports for the 3 year
study period were estimated using Monte Carlo simulations.The combined error from both DOC analyses and uncer-tainty in discharge calculation was calculated using 10,000realizations with random parameters generated from thedistributions discussed above.[20] An additional consideration for DOC export calcu-
lation is intersite differences in flow regime (‘‘flashiness’’):Even if two streams have the same total annual discharge,on any given day they are likely to have different dischargebased on subcatchment hydrology characteristics. In a directcomparison of specific discharge between the reference siteand any other site on the same day, we found a largedifference, averaging about 30% (I. Buffam, unpublisheddata, 2005). In general, the wetland-dominated and verysmall catchments were more flashy (with higher peaks andlower base flows), while discharge in the larger catchmentswas more smoothed over time. To estimate how thisaffected our calculations of annual/seasonal DOC exports,we calculated the DOC exports using three sets of 2003–2005 discharge records from site 7: (1) measured dailydischarge at site 7, (2) flashy flow regime, and (3) smoothedflow regime. All had the same total Q for the entire periodof record, but the flashy and smoothed records approximatethe extremes, which we measured at the other sites whichwere most different. The flashy and smooth data sets were
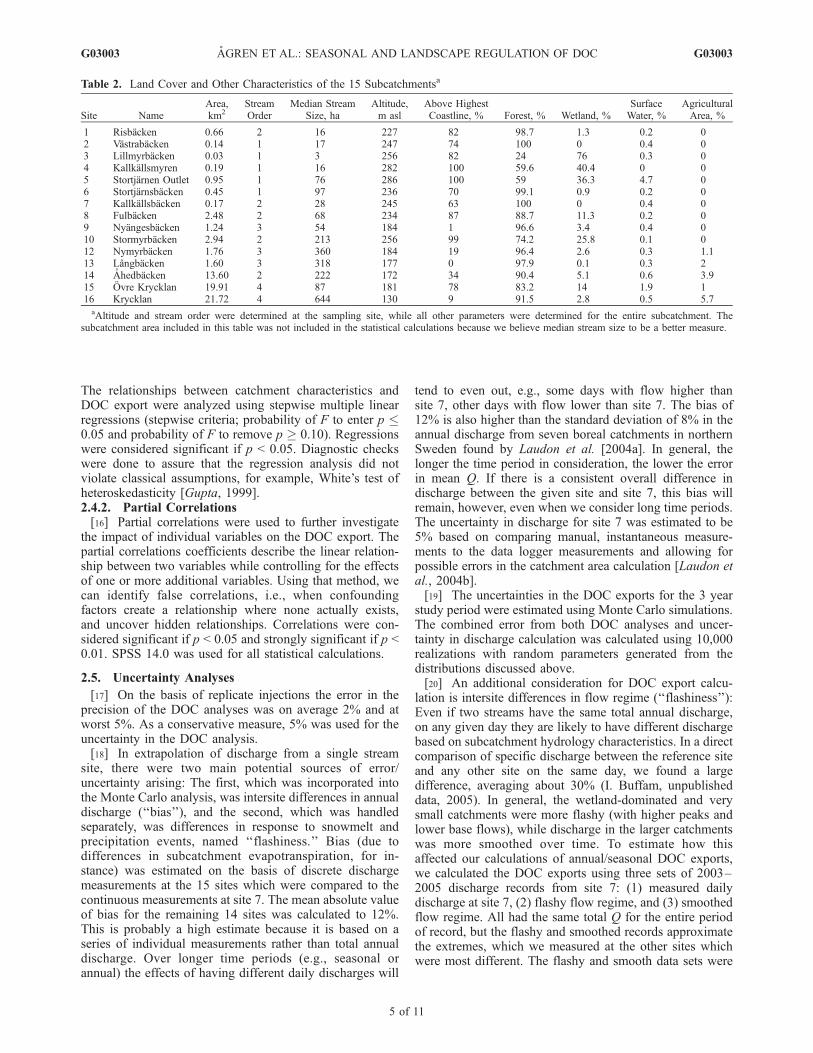
Table 2. Land Cover and Other Characteristics of the 15 Subcatchmentsa
Site NameArea,km2
StreamOrder
Median StreamSize, ha
Altitude,m asl
Above HighestCoastline, % Forest, % Wetland, %
SurfaceWater, %
AgriculturalArea, %
1 Risbacken 0.66 2 16 227 82 98.7 1.3 0.2 02 Vastrabacken 0.14 1 17 247 74 100 0 0.4 03 Lillmyrbacken 0.03 1 3 256 82 24 76 0.3 04 Kallkallsmyren 0.19 1 16 282 100 59.6 40.4 0 05 Stortjarnen Outlet 0.95 1 76 286 100 59 36.3 4.7 06 Stortjarnsbacken 0.45 1 97 236 70 99.1 0.9 0.2 07 Kallkallsbacken 0.17 2 28 245 63 100 0 0.4 08 Fulbacken 2.48 2 68 234 87 88.7 11.3 0.2 09 Nyangesbacken 1.24 3 54 184 1 96.6 3.4 0.4 010 Stormyrbacken 2.94 2 213 256 99 74.2 25.8 0.1 012 Nymyrbacken 1.76 3 360 184 19 96.4 2.6 0.3 1.113 Langbacken 1.60 3 318 177 0 97.9 0.1 0.3 214 Ahedbacken 13.60 2 222 172 34 90.4 5.1 0.6 3.915 Ovre Krycklan 19.91 4 87 181 78 83.2 14 1.9 116 Krycklan 21.72 4 644 130 9 91.5 2.8 0.5 5.7aAltitude and stream order were determined at the sampling site, while all other parameters were determined for the entire subcatchment. The
subcatchment area included in this table was not included in the statistical calculations because we believe median stream size to be a better measure.
G03003 AGREN ET AL.: SEASONAL AND LANDSCAPE REGULATION OF DOC
5 of 11
G03003

generated using the following transformation of the originaldischarge record (with F = 1.26 and F = 0.81, respectively):
QNi
n
i¼1
¼ 1=fð ÞemþF lnQi�mð Þ ð1Þ
where
QNi normalized transformed discharge on day i, used,e.g., for flashy and smoothed flow regime;
Qi discharge on day i in original discharge record, ndays in length;
F parameter describing the ‘‘flashiness’’ of the trans-formation (for F > 1 the transformed Q will be flashy,whereas for F < 1 the transformed Q will besmoothed);
f normalization factor applied to correct the trans-formed data set to give the same total discharge as theoriginal record during the period of interest;
m mean of natural log transformed daily discharges inoriginal discharge record for all days n in entirerecord:
m ¼ 1=nð ÞXn
i¼1
lnQi ð2Þ
[21] We found that the uncertainties in discharge duringthe spring flood season and especially during the snowcovered season were systematic and dependent on thecatchment size. That implies that some of the observedcorrelations between size and DOC export could be anartifact of this systematic error, i.e., that the export fromsmall catchments was overestimated. The flashy andsmoothed records approximate the extremes for the sites,which were most different. Assuming that the smallestcatchment was the most ‘‘flashy’’ and the largest catchmentwas the most ‘‘smoothed,’’ the smallest catchment wasassigned the maximum overestimation, and the largestcatchment was assigned the largest underestimation forthe different seasons. The other sites were then ranked bysize, and the overestimation and underestimation of DOCwere interpolated from the maximum errors. New DOCvalues for the 15 sites were calculated according to thepossible overestimation/underestimation, and the seasonalregressions were redone. That result was then compared tothe original statistical analysis.[22] Another factor adding uncertainty to the calculation
is the sampling frequency of the DOC measurements. Theterrestrial export calculations are most sensitive to gaps inDOC measurements during high-flow situations and arehence not dramatically affected by the low sampling fre-quency during winter. During the snowmelt season, sampleswere collected frequently (every 2 days), and sampling gapswere not assumed to bias the results during that season.However, during the snow-free season, there are numerouslow- and high-flow situations, and because the DOC con-centration is related to discharge, gaps between the meas-urements can cause calculation uncertainty. To assess themagnitude of this uncertainty, linear regressions were usedto identify the relationship between DOC concentration anddaily average discharge during the snow-free season. Onesmall site (site 2) and one large site (site 16) were used topredict daily DOC concentrations from runoff data:
Site 2
DOC mg L�1� �
¼ 11:9þ 7:9 Q mm d�1� �
r2 ¼ 0:72 ð3Þ
Site 16
DOC mg L�1� �
¼ 6:4þ 6:0 Q mm d�1� �
r2 ¼ 0:71 ð4Þ
[23] The flow-predicted concentrations were then used tocalculate DOC export for these two sites. The exportobtained in this way was then compared to the exportobtained using linear interpolated measurements in orderto estimate errors associated with sampling gaps.
3. Results
[24] The mean annual DOC exports from the 15 sub-catchments (0.03–21.72 km2) ranged from 14.8 to 99.1 kgha�1 yr�1. Annual discharge varied greatly between the3 years in this study. Total runoff was 210 mm yr�1 duringthe dry year 2003, 326 mm yr�1 during the wet year 2004,and 271 mm yr�1 during 2005. Because the interannualvariations in DOC export are strongly regulated by vari-ability in flow, the export of terrestrial DOC was hencehighest during 2004 and lowest during 2003. In addition tothe interannual variation, seasonal variations (average sea-sonal export for all 3 years) could easily be detected.Seasonal variations in DOC export were again primarilydriven by variations in discharge, with low exports duringthe low-flow snow covered season and higher exportsduring snowmelt and snow-free seasons. The spatial vari-ability was also substantial with the terrestrial DOC exportper unit area from site 3 being more than 6 times that of site16 (Figure 3). The causes of these spatial variations werefurther explored with PCA and partial correlations.
3.1. PCA
[25] The PCA of all catchment variables (Tables 1 and 2)resulted in five principal components that together explained90% of the variance in the catchment parameters. Stepwiselinear regression between average annual DOC export (perunit area) and the five principal components showed that78% of the variation in DOC was explained by principalcomponents 1 and 3 (PC1 and PC3). The rotated componentmatrix (varimax rotation with Kaiser normalization, con-verged in 8 iterations) showed that PC1 was most highlycorrelated with silt (0.93), altitude (�0.89), percent aboveHC (�0.89), median stream size (0.86), and stream order(0.72). PC3 was most highly correlated with forest (0.74)and wetland (�0.73). To further separate catchment char-acteristics, another PCA was performed on those sevenparameters. This analysis resulted in two principal compo-nents that together explained 85% of the variance of theseven parameters. In the initial solution, all seven variablescorrelated highly with the first principal component. Be-cause we were interested in how the different variablesaffect the DOC export, they were separated using varimaxrotation. The rotated component matrix (using varimaxrotation with Kaiser normalization, converged in 3 itera-tions) showed that the new PC1 was most highly correlatedwith silt (0.90), median stream size (0.88), altitude (�0.88),
G03003 AGREN ET AL.: SEASONAL AND LANDSCAPE REGULATION OF DOC
6 of 11
G03003

proportion of catchment above HC (�0.81), and streamorder (0.78). PC2 was most highly correlated with forest(�0.98) and wetland (0.96). The rotated component matrix(Figure 4) was easier to interpret because the variables couldbe separated into two gradients describing variations in thelandscape. We therefore used the rotated component matrixfor regression analyses. PC1 will hereafter be referred to asthe size-location gradient, and PC2 will be referred to as theforest-wetland gradient.[26] Stepwise linear regression between DOC export and
PC1 and PC2 gave the following results:
mean annual DOC export ¼ 34:8þ 12:1 PC2� 8:8 PC1
r2 ¼ 0:79 ð5Þ
mean DOC export during snowmelt season
¼ 13:2� 2:9 PC1þ 2:7 PC2
r2 ¼ 0:79 ð6Þ
mean DOC export during snow�free season
¼ 19:5þ 7:7 PC2� 5:3 PC1
r2 ¼ 0:74 ð7Þ
mean DOC export during snow covered season
¼ 2þ 1:8 PC2
r2 ¼ 0:67 ð8Þ
Figure 3. DOC export per unit area (kg C ha�1 yr�1) from the 15 subcatchments (inside boxes, plainnumbers), the amount of annual DOC export (kg yr�1) per subcatchment area (inside boxes, boldnumbers), and the cumulative amount of annual DOC export (kg yr–1) per catchment area (along arrows,italic numbers).
Figure 4. (left) PCA score plot of the two PCs of the second PCA, rotated solution. (right) PCA loadingplot of the two principal components of the second PCA, rotated solution. PC1 describes a size-locationgradient, and PC2 describes a wetland-forest gradient.
G03003 AGREN ET AL.: SEASONAL AND LANDSCAPE REGULATION OF DOC
7 of 11
G03003

[27] The diagnostic checks of the regressions aboveshowed no breakdowns of the classical assumptions.[28] The importance of the different catchment character-
istics for the terrestrial DOC export varied between thedifferent seasons. During the snow covered season, 67% ofthe intersite variation in DOC export was explained by theforest-wetland gradient (PC2). During snowmelt the size-location gradient (PC1) was the dominating factor andexplained 43% of the variation in DOC export, while theforest-wetland gradient (PC2) added an additional 36% tothe model. During the snow-free season the forest-wetlandgradient explained 50%, and the size-location gradientexplained an additional 24% of the DOC export variation.
3.2. Correlations With Individual Landscape Elements
[29] Wetland coverage was the single variable mosthighly correlated with DOC export, annually and for eachseason (Table 3). In order to examine effects of othervariables we also analyzed partial correlations, controllingfor wetland coverage. While no additional landscape vari-ables were correlated with DOC export during the snowcovered season, other important variables emerged for theother seasons and annual export (Table 3). Forest cover waspositively correlated with DOC export. Because the partialcorrelation for forest was positive, we additionally ranpartial correlations between DOC export and all forestparameters, while controlling for wetland variation. Thevolume of Norway spruce was found to have a partialcorrelation of 0.60 (p < 0.05) to annual DOC export. Duringsnowmelt and snow-free seasons the partial correlation was0.59 and 0.57 (p < 0.05), respectively. All other forestparameters were not significant.[30] Annual DOC export was negatively correlated with
catchment area (Figure 5). It should be noted that in Figure 5the DOC export and areas used are not calculated forindependent subcatchments but for the actual drainage area,including all subcatchments upstream of the samplingpoints. This relationship indicates that small headwaters
may be the largest contributor to the terrestrial DOC export,per unit area.
3.3. Uncertainty Analyses
[31] The Monte Carlo analysis showed that the uncertaintyin the annual terrestrial carbon export, due to uncertaintyfrom both DOC analyses and discharge calculation, was±13%, except for site 7 where the uncertainty was ±7%. Theuncertainties given above are calculated as coefficient ofvariation (standard deviation divided by mean) for thedistribution of values calculated by Monte Carlo analysis.The additional uncertainty due to intersite differences inflow regime (‘‘flashiness’’) showed that the maximum erroris low for annual exports (±2%) and for the snow-freeseason (±1%) but higher during spring season (±12%) andespecially during the snow covered season (±40%). Theuncertainties are largest during the snow covered seasonbecause the discharge is spatially variable at low flow.Recalculation of the regressions with the potential maxi-mum overestimation/underestimation of discharge data dueto flashiness showed that the new regressions gave resultssimilar to the original statistical analysis. We thereforeconclude that the uncertainty due to ‘‘flashiness’’ does notaffect the major conclusions of this study.[32] The added uncertainty in the DOC concentrations
during the snow-free season due to infrequent sampling wasestimated to be around 12% (11 and 13% for sites 2 and 16,respectively). Sometimes the interpolated values were over-estimated and sometimes they were underestimated. As aresult, over the 3 year period of this study these differencesaveraged out, and the error was close to 0%. The absolutevalue of deviation between interpolated and predictedvalues during the snow-free season was 12% over the3 years. However, that uncertainty is unlikely to affect thespatial analysis as it is a systematic error, which affects all
Figure 5. Relationship between area (ha) and annual DOCexport (kg ha�1 yr�1) for the actual drainage area of thesampling points.
Table 3. Pearson Correlations Between Terrestrial Export of DOC
and Seven Catchment Variables and Partial Correlations With
Control for Wetlanda
C Export
MeanAnnual Snowmelt
SnowFree
SnowCovered
Pearson CorrelationWetland 0.84b 0.75b 0.82b 0.86b
Forest �0.80b �0.71b �0.78b �0.83b
Altitude 0.73c 0.81c 0.70c 0.53c
Percent above HC 0.63c 0.72c 0.60c NSMedian stream size �0.56c �0.63c �0.54c NSStream order �0.63c �0.68b �0.60c NSSilt NS �0.65b NS NS
Partial Correlation, Control for WetlandForest 0.69b 0.58c 0.73b NSAltitude 0.60c 0.71b NS NSPercent above HC NS 0.59c NS NSMedian stream size �0.57c �0.62c NS NSStream order NS �0.58c NS NSSilt NS �0.64c NS NS
aNS, nonsignificant.bFor p < 0.01.cFor p < 0.05.
G03003 AGREN ET AL.: SEASONAL AND LANDSCAPE REGULATION OF DOC
8 of 11
G03003
sites similarly, because the sites were always sampled on thesame dates, i.e., during the same flow situations.
4. Discussion
[33] DOC export in temperate and boreal rivers throughoutthe world generally varies between 10 and 100 kg ha�1 yr�1
[Hope et al., 1994]. The fact that the 15 Krycklan subcatch-ments cover almost that entire range (Figure 3) corroboratesthe large variability in DOC reported for other small catch-ments [Sedell and Dahm, 1990; Temnerud and Bishop, 2005;Wolock et al., 1997].
4.1. Snow Covered Season
[34] There were also substantial variations in DOC exportbetween the different seasons. Krycklan has on average5 months of snow cover [Lofvenius et al., 2003], but theflow is low during winter and contributed only 9% (6–11%)to the annual discharge. Consequently, only 3–13% of theannual DOC export occurred during this season. Theprincipal component regression indicated that the forest-wetland gradient (PC2) determined the spatial variation inDOC export during the snow covered season (equation (8)).During winter base flow the majority of the water thatreaches streams is groundwater [Stottlemyer and Toczydlowski,1991]. The low groundwater table during winter in theKrycklan catchment [Nyberg et al., 2001] implies that thewater reaching the streams has drained deeper soil in bothwetlands and forests. Consequently, the amount of DOCleached from forest soils is low during this part of the yearsince deep soils of the forests are relatively poor in DOCand flow through the Riparian zone en route to the streamalso intersects deep DOC-poor layers. In wetlands, on theother hand, the maximum pore water DOC concentrationoccurs significantly below the water table [Schiff et al.,1998] so deep groundwater from wetlands is especially richin DOC during winter base flow [Laudon et al., 2004a].These differences between wetlands and forests were high-lighted by the partial correlations analyses in this study(Table 3), which showed that the only parameter thatsignificantly correlated with DOC export during the snowcovered season was the proportion of wetlands. Hence thecoverage of wetlands regulated the spatial variation in DOCexports during the snow covered season with the highestDOC export occurring in catchments with high wetlandcoverage.
4.2. Snowmelt Season
[35] The snowmelt season is the major annual hydrolog-ical event in this region, and on average, 40% (36–45%) ofthe annual discharge and 28–65% of the DOC exportsoccurred during this �2 month season in the Krycklancatchments. DOC concentrations and export from forestedareas increased during the snowmelt season (Table 3). Thisincrease has been explained by rising of near-stream watertables flushing out old DOC-rich water previously stored inthe soil [Bishop et al., 2004; Laudon et al., 2004b]. Withhigher water tables, more organic-rich upper soil horizonsare intersected, particularly in the Riparian zone peat layerof forested streams [Bishop et al., 1995]. Riparian peatlayers often cover less than 5% of the catchment areas innorthern Sweden but are still a major source of DOC in
forested catchments, especially during high-flow situations[Bishop and Pettersson, 1996].[36] DOC export from wetlands also increased compared
to the winter base flow (Table 3) because of higherdischarge, but the increase was less pronounced than inthe forested areas. This discrepancy was due to a decrease inDOC concentration in streams draining wetland-dominatedareas [Laudon et al., 2004a; Schiff et al., 1997] because ofdilution by DOC-poor meltwater [Bishop et al., 1995;Buffam et al., 2007]. The mechanisms behind this dilutioncould be overland flow over frozen and/or saturated wetlandsurfaces [Hayashi et al., 2004] but also dilution of the DOCby snowmelt water in the shallow peat layers [Schiff et al.,1998].[37] The different response in concentrations between
forested and wetland areas during the spring flood seasonresulted in similar DOC concentrations at all sites [see alsoBuffam et al., 2007]. Thus the forest-wetland gradient wasnot as important for the spatial variation in DOC exportduring the snowmelt season as during the winter base flowwhen wetland explained most of the spatial variation.Instead, the principal components regressions showed thatthe size-location gradient (PC1) was most important duringsnowmelt and explained 48% of the spatial variation inDOC export, while the forest-wetland gradient (PC2) addedan additional 33% to the model (equation (6)). High DOCexport was associated with small stream size, low streamorder, low proportion of silty sediments and a high altitude,and high proportion of the watershed situated above HC(Table 3).[38] Processes that explain this pattern are connected to
the size of the catchment but also differences in thequaternary deposits between upstream and downstreamcatchments. Upstream catchments, particularly those aboveHC, had higher DOC exports than downstream catchmentsdominated by silty deposits. Several characteristics poten-tially contribute to this spatial variation. Deep groundwaterhas lower DOC than water from shallow soil horizons[Cronan and Aiken, 1985; Schiff et al., 1998; Thurman,1985] and the relatively large input of deep groundwaterinto larger streams, suggested by increasing levels of basecations downstream in the Krycklan catchment [Buffam etal., 2007], could explain the decrease in DOC export fromlow-order to high-order streams. Moreover, the greaterdistances to streams in larger catchments also increase thesubsurface water transit time, increasing the potential fordecomposition and oxidation of organic carbon [Wolock etal., 1997].[39] In addition, the dominating quaternary deposits
change from unsorted till at the higher altitudes to siltysediments downstream in the Krycklan catchment. Silt has ahigher specific surface area and is therefore rich in mineraladsorption sites for DOC, which may increase the mineral-ization of DOC in the soil and decrease DOC concentrations[Kalbitz et al., 2000]. The Riparian soil conditions alsodiffered between areas underlain by till, where there was apeat buildup near the stream channel, compared to the lowerlying sediment areas, where there were more deeply incisedstream channels and thinner soil organic surface layers. Thisdistinction presumably results in less interaction betweensubsurface flow and DOC-rich pools in the sediment areas.All of these characteristics and mechanisms are likely to
G03003 AGREN ET AL.: SEASONAL AND LANDSCAPE REGULATION OF DOC
9 of 11
G03003

affect stream DOC flux to some degree. Collectively, theycontribute to a high export of DOC in upstream catchmentscompared to downstream catchments. Other investigationsin the region have also noted the effect of stream size[Temnerud and Bishop, 2005] and changes in soil type withhigher DOC concentrations in the ‘‘hilly terrain streams’’compared to nearby ‘‘sediment plain streams’’ [Ivarssonand Jansson, 1994, 1995]. It should be pointed out, how-ever, that the major reason why these soil characteristicsstrongly determined the differences in DOC export betweenthe Krycklan subcatchments during spring was that theimportance of the forest-wetland gradient was reduced.
4.3. Snow-Free Season
[40] The snow-free season is �5 months long, and 51%(44–55%) of the annual discharge and 39–63% of theannual DOC exports occurred during this season. Thehydrology is characterized by low flow interrupted by anumber of high-flow episodes due to rainstorms. Duringthis season the spatial variation was mainly driven by theforest-wetland gradient. However, the correlations in thisstudy showed that although wetlands were more importantthan forests for variation in DOC export, forest coverageshowed a strong positive partial correlation to the DOCexport. This result suggests that leaching from forest floorsor the organic-rich Riparian zone [Bishop et al., 2004]contributes significantly to the DOC export during high-flow events. DOC is produced during summer within theforest soils due to degradation and solubilization of litter,stimulated by high temperature and oxygenated soils [Kalbitzet al., 2000; Lundstrom, 1993]. Furthermore, the partialcorrelations analysis showed that the abundance of Norwayspruce determined the spatial variation in DOC exportduring the snow-free season, while abundance of pine anddeciduous forest did not. The importance of Norway sprucefor DOC export agrees with the higher production of litterand subsequent higher leaching from the spruce forest floorcompared to that of the pine stands [Strobel et al., 2001].The negligible impact of deciduous forests was probablydue to the relatively small proportion and variation (7–15%)of deciduous forests between the different subcatchments.[41] The export of DOC in the different subcatchments
was dependent on different catchment characteristics, whichwere expressed differently during different seasons. Thuswe should not expect a simple annual relationship betweenDOC export and the terrestrial catchment characteristics.The annual pattern is the sum of all the complex seasonalvariations discussed in sections 4.1, 4.2, and 4.3. Becausethe amount of DOC exported is controlled by runoff[Meybeck, 1982; Schiff et al., 1998] and over half of theannual discharge occurred during the snow-free season, it isnot surprising that the annual pattern mostly resembled thesnow-free season (equations (5) and (7)). The mean annualexport regression showed that the forest-wetland gradient(PC2) explained 52% of the spatial variation in annual DOCexports. The partial correlations showed that it was not onlywetland coverage that was of importance, forest coveragewas also a significant parameter in determining the spatialvariation in annual DOC exports. It is reasonable that thevariation in the main sources of organic carbon determinesmost of the spatial variation in DOC exports, and many
studies have found a relationship between the terrestrialexport and these parameters [Aitkenhead et al., 1999; Clarket al., 2004; Dosskey and Bertsch, 1994; Hope et al., 1994].However, the effect of size (median stream size and streamorder) and location (altitude and proportion of catchmentabove highest postglacial coastline (HC) and the amount ofsilty sediment deposits) are clearly important on an annualbasis because the size-location gradient explained another27% of the variance. The size-location gradient can beviewed upon as a gradient describing the importance ofwhat happens between the sources and the stream. Thisgradient incorporates information about flow path depth anddistance to streams (stream size) as well as mineral bindingsites (silty soils), which together regulate the amount ofDOC that reaches the streams.[42] This study also demonstrated that small headwaters
were the largest contributors to the terrestrial DOC export,per unit area, in the Krycklan catchment (Figure 5 andTable 3). A negative correlation between DOC export andcatchment area as found in this study was also identified in astudy of DOC export from 86 of Finland’s main rivers andtheir subcatchments [Mattsson et al., 2005]. There are manyreasons for size to come out as an important factor. It ismost likely not drainage area per se that is of importance butvariables that covary with stream and catchment size (e.g.,stream morphology, soil type, and altitude) that give rise tothe trend of decreasing DOC export with increasing streamsize. The importance of headwater catchments for DOCexport is further underlined by the observation that mostwater enters stream networks via relatively small streams. Inthe 68 km2 Krycklan catchment, for instance, over half ofthe water entering the stream network enters via streamswith subcatchments 2 km2 or smaller. Small headwatercatchments might thus have a disproportionately largeinfluence on terrestrial DOC export.
[43] Acknowledgments. We wish to thank Peder Blomkvist and theKrycklan crew for their help with field work. The financial support for thiswork was provided by Swedish Science Foundation, Formas, and SwedishEPA to H.L.
ReferencesAitkenhead, J. A., D. Hope, and M. F. Billett (1999), The relationshipbetween dissolved organic carbon in stream water and soil organic carbonpools at different spatial scales, Hydrol. Processes, 13(8), 1289–1302.
Bishop, K., and C. Pettersson (1996), Organic carbon in the boreal springflood from adjacent subcatchments, Environ. Int., 22(5), 535–540.
Bishop, K., Y. H. Lee, C. Pettersson, and B. Allard (1995), Terrestrialsources of Methylmercury in surface waters: The importance of the Ri-parian zone on the Svartberget catchment, Water Air Soil Pollut., 80(5),435–444.
Bishop, K., J. Seibert, S. Koher, and H. Laudon (2004), Resolving thedouble paradox of rapidly mobilized old water with highly variable re-sponses in runoff chemistry, Hydrol. Processes, 18(1), 185–189.
Buffam, I., H. Laudon, J. Temnerud, C.-M. Morth, and K. Bishop (2007),Landscape-scale variability of acidity and dissolved organic carbon dur-ing spring flood in a boreal stream network, J. Geophys. Res., 112,G01022, doi:10.1029/2006JG000218.
Clark, M. J., M. S. Cresser, R. Smart, P. J. Chapman, and A. C. Edwards(2004), The influence of catchment characteristics on the seasonality ofcarbon and nitrogen species concentrations in upland rivers of northernScotland, Biogeochemistry, 68(1), 1–19.
Cory, N., I. Buffam, H. Laudon, S. Kohler, and K. Bishop (2006), Land-scape control of stream water aluminum in a boreal catchment duringspring flood, Environ. Sci. Technol., 40(11), 3494–3500.
Cronan, C. S., and G. R. Aiken (1985), Chemistry and transport of solublehumic substances in forested watersheds of the Adirondack Park, NewYork, Geochim. Cosmochim. Acta, 49(8), 1697–1705.
G03003 AGREN ET AL.: SEASONAL AND LANDSCAPE REGULATION OF DOC
10 of 11
G03003
Cronan, C. S., J. T. Piampiano, and H. H. Patterson (1999), Influence ofland use and hydrology on exports of carbon and nitrogen in a MaineRiver Basin, J. Environ. Qual., 28(3), 953–961.
Dawson, J. J. C., M. F. Billett, D. Hope, S. M. Palmer, and C. M. Deacon(2004), Sources and sinks of aquatic carbon in a peatland stream con-tinuum, Biogeochemistry, 70(1), 71–92.
Dillon, P. J., and L. A. Molot (1997), Effect of landscape form on export ofdissolved organic carbon, iron, and phosphorus from forested streamcatchments, Water Resour. Res., 33(11), 2591–2600.
Dosskey, M. G., and P. M. Bertsch (1994), Forest sources and pathways oforganic-matter transport to a blackwater stream: A hydrologic approach,Biogeochemistry, 24(1), 1–19.
Driscoll, C. T., N. M. Johnson, G. E. Likens, and M. C. Feller (1988),Effects of acidic deposition on the chemistry of headwater streams: Acomparison between Hubbard Brook, New Hampshire, and JamiesonCreek, British Columbia, Water Resour. Res., 24(2), 195–200.
Duarte, C. M., and Y. T. Prairie (2005), Prevalence of heterotrophy andatmospheric CO2 emissions from aquatic ecosystems, Ecosystems, 8(7),862–870.
Gupta, V. (1999), SPSS for Beginners, 608 pp., Lightning Source Inc.,La Vergne, Tenn.
Hayashi, M., W. L. Quinton, A. Pietroniro, and J. J. Gibson (2004), Hydro-logic functions of wetlands in a discontinuous permafrost basin indicatedby isotopic and chemical signatures, J. Hydrol., 296(1–4), 81–97.
Heikkinen, K. (1990), Seasonal-changes in iron transport and nature ofdissolved organic-matter in a humic river in northern Finland, Earth Surf.Processes Landforms, 15(7), 583–596.
Hessen, D. O., and L. J. Tranvik (1998), Aquatic Humic Substances: Ecol-ogy and Biogeochemistry, 346 pp., Springer, Berlin.
Hinton, M. J., S. L. Schiff, and M. C. English (1997), The significance ofstorms for the concentration and export of dissolved organic carbon fromtwo Precambrian Shield catchments, Biogeochemistry, 36(1), 67–88.
Hinton, M. J., S. L. Schiff, and M. C. English (1998), Sources and flow-paths of dissolved organic carbon during storms in two forested water-sheds of the Precambrian Shield, Biogeochemistry, 41(2), 175–197.
Hongve, D. (1999), Production of dissolved organic carbon in forestedcatchments, J. Hydrol., 224(3), 91–99.
Hongve, D., P. A. W. van Hees, and U. S. Lundstrom (2000), Dissolvedcomponents in precipitation water percolated through forest litter, Eur. J.Soil Sci., 51(4), 667–677.
Hope, D., M. F. Billett, and M. S. Cresser (1994), A review of the export ofcarbon in river water: Fluxes and processes, Environ. Pollut., 84(3),301–324.
Hornberger, G. M., K. E. Bencala, and D. M. Mcknight (1994), Hydro-logical controls on dissolved organic-carbon during snowmelt in theSnake River near Montezuma, Colorado, Biogeochemistry, 25(3), 147–165.
Ingri, J. (1996), Kalixalvens hydrogeokemi, Technol. Rep. 2, 126 pp., LuleaUniv., Lulea, Sweden.
Ivarsson, H., andM. Jansson (1994), Regional variation of dissolved organic-matter in running waters in central northern Sweden, Hydrobiologia,286(1), 37–51.
Ivarsson, H., and M. Jansson (1995), Sources of acidity in running waters incentral northern Sweden, Water Air Soil Pollut., 84(3–4), 233–251.
Kalbitz, K., S. Solinger, J. H. Park, B. Michalzik, and E. Matzner (2000),Controls on the dynamics of dissolved organic matter in soils: A review,Soil Sci., 165(4), 277–304.
Kohler, S., I. Buffam, A. Jonsson, and K. Bishop (2002), Photochemicaland microbial processing of stream and soilwater dissolved organic mat-ter in a boreal forested catchment in northern Sweden, Aquat. Sci., 64(3),269–281.
Laudon, H., and K. H. Bishop (1999), Quantifying sources of acid neutra-lisation capacity depression during spring flood episodes in northernSweden, Environ. Pollut., 105(3), 427–435.
Laudon, H., and K. Bishop (2002), Episodic stream water pH decline dur-ing autumn storms following a summer drought in northern Sweden,Hydrol. Processes, 16(9), 1725–1733.
Laudon, H., O. Westling, and K. Bishop (2000), Cause of pH decline instream water during spring melt runoff in northern Sweden, Can. J. Fish.Aquat. Sci., 57(9), 1888–1900.
Laudon, H., S. Kohler, and I. Buffam (2004a), Seasonal TOC export fromseven boreal catchments in northern Sweden, Aquat. Sci., 66(2), 223–230.
Laudon, H., J. Seibert, S. Kohler, and K. Bishop (2004b), Hydrologicalflow paths during snowmelt: Congruence between hydrometric measure-ments and oxygen 18 in meltwater, soil water, and runoff, Water Resour.Res., 40, W03102, doi:10.1029/2003WR002455.
Laudon, H., A. B. S. Poleo, L. A. Vollestad, and K. Bishop (2005), Survivalof brown trout during spring flood in DOC-rich streams in northernSweden: The effect of present acid deposition and modelled pre-industrialwater quality, Environ. Pollut., 135(1), 121–130.
Lofvenius, M. O., M. Kluge, and T. Lundmark (2003), Snow and soil frostdepth in two types of shelterwood and a clear-cut area, Scand. J. For.Res., 18(1), 54–63.
Lundstrom, U. S. (1993), The role of organic-acids in the soil solutionchemistry of a podzolized soil, J. Soil Sci., 44(1), 121–133.
Mattsson, T., L. Finer, P. Kortelainen, and T. Sallantaus (2003), Brookwaterquality and background leaching from unmanaged forested catchments inFinland, Water Air Soil Pollut., 147(1–4), 275–297.
Mattsson, T., P. Kortelainen, and A. Raike (2005), Export of DOM fromboreal catchments: Impacts of land use cover and climate, Biogeochem-istry, 76(2), 373–394.
Meybeck, M. (1982), Carbon, nitrogen and phosphorus transport by worldrivers, Am. J. Sci., 282, 401–450.
Mulholland, P. J. (2003), Large-scale patterns in dissolved organic carbonconcentratrion, flux, and sources, in Aquatic Ecosystems, edited byS. Findlay and R. Sinsabaugh, pp. 139–159, Elsevier Sci., New York.
Mulholland, P. J., and W. R. Hill (1997), Seasonal patterns in streamwaternutrient and dissolved organic carbon concentrations: Separating catch-ment flow path and in-stream effects, Water Resour. Res., 33(6), 1297–1306.
Nyberg, L., M. Stahli, P. E. Mellander, and K. H. Bishop (2001), Soil frosteffects on soil water and runoff dynamics along a boreal forest transect:1. Field investigations, Hydrol. Processes, 15(6), 909–926.
Reese, H., M. Nilsson, T. G. Pahlen, O. Hagner, S. Joyce, U. Tingelof,M. Egberth, and H. Olsson (2003), Countrywide estimates of forest vari-ables using satellite data and field data from the national forest inventory,Ambio, 32(8), 542–548.
Schiff, S. L., R. Aravena, S. E. Trumbore, M. J. Hinton, R. Elgood, and P. J.Dillon (1997), Export of DOC from forested catchments on the Precam-brian Shield of central Ontario: Clues from C-13 and C-14, Biogeochem-istry, 36(1), 43–65.
Schiff, S., R. Aravena, E. Mewhinney, R. Elgood, B. Warner, P. Dillon, andS. Trumbore (1998), Precambrian shield wetlands: Hydrologic control ofthe sources and export of dissolved organic matter, Clim. Change, 40(2),167–188.
Sedell, J. R., and C. N. Dahm (1990), Spatial and temporal scales of dis-solved organic carbon in streams and rivers, in Organic Acids in AquaticEcosystems: Dahlem Workshop Reports on Organic Acids in AquaticEcosystems, Berlin 1989, May 7–12, edited by E. M. Perdue and E. T.Gjessing, pp. 261–279, John Wiley, Chichester, U.K.
Stottlemyer, R., and D. Toczydlowski (1991), Stream chemistry and hydro-logic pathways during snowmelt in a small watershed adjacent LakeSuperior, Biogeochemistry, 13(3), 177–197.
Strobel, B. W., H. C. B. Hansen, O. K. Borggaard, M. K. Andersen, andK. Raulund-Rasmussen (2001), Composition and reactivity of DOC inforest floor soil solutions in relation to tree species and soil type,Biogeochemistry, 56(1), 1–26.
Temnerud, J., and K. Bishop (2005), Spatial variation of streamwater chem-istry in two Swedish boreal catchments: Implications for environmentalassessment, Environ. Sci. Technol., 39(6), 1463–1469.
Thurman, E. M. (1985), Organic Geochemistry of Natural Waters, 497 pp.,Martinus Nijhoff, Dordrecht, Netherlands.
Wolock, D. M., J. Fan, and G. B. Lawrence (1997), Effects of basin size onlow-flow stream chemistry and subsurface contact time in the NeversinkRiver watershed, New York, Hydrol. Processes, 11(9), 1273–1286.
�����������������������A. Agren, M. Jansson, and H. Laudon, Department of Ecology and
Environmental Science, Umea University, SE-901 87 Umea, Sweden.([email protected])I. Buffam, Department of Forest Ecology, Swedish University of
Agricultural Sciences, SE-901 83 Umea, Sweden.
G03003 AGREN ET AL.: SEASONAL AND LANDSCAPE REGULATION OF DOC
11 of 11
G03003