Hydrogeomorphic controls on phosphorus retention in streams
17
Hydrogeomorphic controls on phosphorus retention in streams Martin W. Doyle Department of Geography, University of North Carolina, Chapel Hill, North Carolina, USA Emily H. Stanley Center for Limnology, University of Wisconsin, Madison, Wisconsin, USA Jon M. Harbor Department of Earth and Atmospheric Sciences, Purdue University, West Lafayette, Indiana, USA Received 3 February 2003; accepted 17 March 2003; published 10 June 2003. [1] We compared the relative influences of biochemical uptake processes and dynamic hydrology and geomorphology (hydrogeomorphology) on molybdate reactive phosphorus (MRP) retention within a stream. MRP concentrations were measured upstream and downstream of a 4.5-km reach undergoing dynamic channel adjustment in response to downstream dam removal. Geomorphic adjustments following removal produced measurable changes in velocity and depth, and decreases in MRP retention. Paired upstream and downstream measurements of MRP concentration were used to compute three retention metrics: uptake rate, mass transfer coefficient, and uptake length, which were used as model parameters. Modeling results showed that changes in channel morphology alone following dam removal could result in an approximate 40% increase in downstream MRP concentrations compared with conditions with the dam in place. However, empirical and modeling results indicate that hydrogeomorphology can control nutrient retention on the reach scale only when uptake processes are either sufficiently great or when uptake rates have limited variability. Review of published phosphorus retention values revealed greater variability in biochemical uptake rates than in hydrogeomorphology. Thus uptake rates should exert a stronger control on reach-scale MRP retention than changing channel morphology or hydrology. These results suggest that maintaining or restoring channel conditions that are conducive to biochemical uptake are of greater priority than restoration of hydrologic or geomorphic conditions alone. INDEX TERMS: 1803 Hydrology: Anthropogenic effects; 1860 Hydrology: Runoff and streamflow; 1871 Hydrology: Surface water quality; 1065 Geochemistry: Trace elements (3670); KEYWORDS: nutrient spiraling, nutrient cycling, ecohydrology Citation: Doyle, M. W., E. H. Stanley, and J. M. Harbor, Hydrogeomorphic controls on phosphorus retention in streams, Water Resour. Res., 39(6), 1147, doi:10.1029/2003WR002038, 2003. 1. Introduction 1.1. Geomorphology and Stream Ecology [2] Geomorphic forms and processes play a major role in structuring ecological dynamics in streams and rivers [e.g., Vannote et al., 1980; Frissell et al., 1986]. The relationship between geomorphic forcing factors and ecological responses are best understood with respect to the distribu- tion and abundance of large conspicuous organisms, partic- ularly fish and riparian trees [e.g., Gregory et al., 1991; Hupp, 1992; Shields et al., 1994; Pitlick and Van Steeter, 1998]. Yet the influence of channel form also extends to food web structure [Power et al., 1995; D’Angelo et al., 1997], energy flow [Vannote et al., 1980; Rosenfeld and Hudson, 1997], and nutrient cycling [Alexander et al., 2000; Peterson et al., 2001]. [3] The relationship between channel morphology and nutrient dynamics has been studied by comparing transport and transformation of nutrients in separate field sites with distinct channel characteristics, and between-site differ- ences are attributed in part to variation in channel mor- phology or hydrology [e.g., Martı ´ and Sabater, 1996; Wollheim et al., 2001]. However, differences among sites are unlikely to be limited to channel form alone. Temper- ature, ambient water chemistry, community composition, and other attributes vary from site to site, and may cause significant between-site differences in nutrient dynamics independent of any effects of channel form. Because cross- site studies cannot isolate geomorphic effects on in-stream processes, the influence of channel form alone on nutrient retention (i.e., retention per unit length) in streams is not yet apparent. [4] Opportunities to isolate hydrologic and geomorphic effects by holding all variables constant and varying chan- nel form are typically limited to flume-based studies. Unfortunately, the small size of most flume systems is insufficient for detecting changes in nutrient retention. As an alternative approach, we took advantage of a large-scale Copyright 2003 by the American Geophysical Union. 0043-1397/03/2003WR002038$09.00 HWC 1 - 1 WATER RESOURCES RESEARCH, VOL. 39, NO. 6, 1147, doi:10.1029/2003WR002038, 2003
Transcript of Hydrogeomorphic controls on phosphorus retention in streams

Hydrogeomorphic controls on phosphorus retention in streams
Martin W. Doyle
Department of Geography, University of North Carolina, Chapel Hill, North Carolina, USA
Emily H. Stanley
Center for Limnology, University of Wisconsin, Madison, Wisconsin, USA
Jon M. Harbor
Department of Earth and Atmospheric Sciences, Purdue University, West Lafayette, Indiana, USA
Received 3 February 2003; accepted 17 March 2003; published 10 June 2003.
[1] We compared the relative influences of biochemical uptake processes and dynamichydrology and geomorphology (hydrogeomorphology) on molybdate reactive phosphorus(MRP) retention within a stream. MRP concentrations were measured upstream anddownstream of a 4.5-km reach undergoing dynamic channel adjustment in response todownstream dam removal. Geomorphic adjustments following removal producedmeasurable changes in velocity and depth, and decreases in MRP retention. Pairedupstream and downstream measurements of MRP concentration were used to computethree retention metrics: uptake rate, mass transfer coefficient, and uptake length, whichwere used as model parameters. Modeling results showed that changes in channelmorphology alone following dam removal could result in an approximate 40% increase indownstream MRP concentrations compared with conditions with the dam in place.However, empirical and modeling results indicate that hydrogeomorphology can controlnutrient retention on the reach scale only when uptake processes are either sufficientlygreat or when uptake rates have limited variability. Review of published phosphorusretention values revealed greater variability in biochemical uptake rates than inhydrogeomorphology. Thus uptake rates should exert a stronger control on reach-scaleMRP retention than changing channel morphology or hydrology. These results suggestthat maintaining or restoring channel conditions that are conducive to biochemical uptakeare of greater priority than restoration of hydrologic or geomorphic conditionsalone. INDEX TERMS: 1803 Hydrology: Anthropogenic effects; 1860 Hydrology: Runoff and
streamflow; 1871 Hydrology: Surface water quality; 1065 Geochemistry: Trace elements (3670); KEYWORDS:
nutrient spiraling, nutrient cycling, ecohydrology
Citation: Doyle, M. W., E. H. Stanley, and J. M. Harbor, Hydrogeomorphic controls on phosphorus retention in streams,
Water Resour. Res., 39(6), 1147, doi:10.1029/2003WR002038, 2003.
1. Introduction
1.1. Geomorphology and Stream Ecology
[2] Geomorphic forms and processes play a major role instructuring ecological dynamics in streams and rivers [e.g.,Vannote et al., 1980; Frissell et al., 1986]. The relationshipbetween geomorphic forcing factors and ecologicalresponses are best understood with respect to the distribu-tion and abundance of large conspicuous organisms, partic-ularly fish and riparian trees [e.g., Gregory et al., 1991;Hupp, 1992; Shields et al., 1994; Pitlick and Van Steeter,1998]. Yet the influence of channel form also extends tofood web structure [Power et al., 1995; D’Angelo et al.,1997], energy flow [Vannote et al., 1980; Rosenfeld andHudson, 1997], and nutrient cycling [Alexander et al., 2000;Peterson et al., 2001].[3] The relationship between channel morphology and
nutrient dynamics has been studied by comparing transport
and transformation of nutrients in separate field sites withdistinct channel characteristics, and between-site differ-ences are attributed in part to variation in channel mor-phology or hydrology [e.g., Martı́ and Sabater, 1996;Wollheim et al., 2001]. However, differences among sitesare unlikely to be limited to channel form alone. Temper-ature, ambient water chemistry, community composition,and other attributes vary from site to site, and may causesignificant between-site differences in nutrient dynamicsindependent of any effects of channel form. Because cross-site studies cannot isolate geomorphic effects on in-streamprocesses, the influence of channel form alone on nutrientretention (i.e., retention per unit length) in streams is notyet apparent.[4] Opportunities to isolate hydrologic and geomorphic
effects by holding all variables constant and varying chan-nel form are typically limited to flume-based studies.Unfortunately, the small size of most flume systems isinsufficient for detecting changes in nutrient retention. Asan alternative approach, we took advantage of a large-scale
Copyright 2003 by the American Geophysical Union.0043-1397/03/2003WR002038$09.00
HWC 1 - 1
WATER RESOURCES RESEARCH, VOL. 39, NO. 6, 1147, doi:10.1029/2003WR002038, 2003

ecosystem manipulation (a dam removal) to investigate therelationship between channel form and phosphorus (in theform of molybdate reactive phosphorus (MRP)) retention.Channel morphology within a single study reach changeddramatically over a relatively short period of time inresponse to the dam removal [Doyle et al., 2003]. Thechannel shifted from an impoundment (i.e., a broad, slowflowing channel), to an incised, rapidly flowing channelover an 11-month period, allowing us to relate hydrologyand channel geomorphology (hereinafter referred to ashydrogeomorphology) to MRP retention within a singlestudy reach. Because biotic and abiotic uptake processeslikely changed along with hydrogeomorphology, we alsosupplemented our field-based investigation with a simplemodeling exercise and meta-analysis of published data toexamine the relative importance of biochemical uptakeprocesses versus channel form in governing nutrient reten-tion in streams.
1.2. Theoretical Framework: NutrientSpiraling Metrics
[5] Nutrient spiraling describes the coupled processes ofcycling and downstream transport of nutrients in streamecosystems (Webster and Patten [1979]; Newbold et al.[1981]; see also the review by Stream Solute Workshop[1990]). Three parameters are commonly used to quantifydifferent aspects of the spiraling process in streams. Thefirst metric is uptake rate (U, in units of M L�2 T�1), thearea-specific rate of nutrient uptake characteristic ofthe stream under unenriched conditions. Values of U canvary between habitats or cover types within a single streamdue to local fluctuations in biotic demand [Munn and Meyer,1990; Kemp and Dodds, 2002a]. The second metric is themass transfer coefficient, Vf, (L T�1) (also referred to as‘piston velocity’), which is a function of uptake rate (U) andnutrient concentration (C):
Vf ¼U
Cð1Þ
The mass transfer coefficient can be conceptualized as thevelocity at which a nutrient moves through the watercolumn toward the sediment and thus represents demandfor nutrients relative to the concentration in the watercolumn [Hall et al., 2002]. The final metric is uptakelength, Sw:
SW ¼ uhC
U¼ uh
Vf
ð2Þ
where u and h are the flow velocity and depth,respectively. Uptake length is the average distance anutrient molecule travels in the water column before beingsequestered in the benthic compartment, and thus itrepresents a whole-reach-scale measure of nutrient uptake.Of the three parameters, it is the only one that is a functionof flow characteristics. Together, these three metrics can beused to describe nutrient retention of a stream with eachmetric providing unique information about the uptakeprocess.[6] Typically, Sw is calculated using a simple exponen-
tial decay relation of longitudinal changes in nutrient
concentrations in a stream reach [Stream Solute Workshop,1990]:
C Lð Þ ¼ C0e�LSW ð3Þ
where C0 is the nutrient concentration from incoming flowand C(L) is the concentration at some distance L down-stream. Once Sw has been determined, Vf and U can then becalculated from measurements of reach depth (h), velocity(u), and nutrient concentration (C) using equations (2) and(1), respectively.[7] Many studies report Sw as the primary spiraling metric
of interest [e.g., Martı́ et al., 1997; Haggard et al., 2001],and not surprisingly variability in Sw has been attributed toboth biochemical and hydrogeomorphic effects. Recentstudies emphasize Vf as a more appropriate parameter foramong-stream comparisons because it normalizes for theeffects of hydrogeomorphology (i.e., it does not includeflow velocity and depth), and thus represents the variabilityin nutrient retention explained by biochemical changes[Wollheim et al., 2001; Hall et al., 2002]. To examine therelative influence of Vf and hydrogeomorphology onnutrient retention, we developed a third equation for con-centration by substituting equation (2) into equation (3):
C Lð Þ ¼ C0e�LVf
uh ð4Þ
Equation (4) shows that nutrient concentration changes alonga reach of length L are a function of the relative importance ofuptake processes, reflected in the Vf term, and channelhydrogeomorphology, reflected in the u*h term.[8] Vf can be affected by seasonality [Mulholland et al.,
1985], channel substrate type [Martı́ and Sabater, 1996],disturbance regimes [Aumen et al., 1990; Grimm, 1987], aswell as other influences (summarized by Martı́ and Sabater[1996]), many of which vary systematically in a down-stream direction [Wollheim et al., 2001] and over time.Similarly, hydrogeomorphology can vary at a station as afunction of discharge [Leopold et al., 1964], systematicallydownstream through a watershed [Leopold et al., 1964;Alexander et al., 2000], or dynamically as channel mor-phology changes through time [Galay, 1983; Knighton,1998]. Given that both the numerator and denominatorterms of equation (4) can vary within and among sites, itis reasonable to assume that downstream nutrient concen-tration C(L) may be controlled by biochemical processes insome situations and hydrogeomorphic constraints in othersettings. The question then becomes: Is this assumptioncorrect, and if so, what are the conditions that favor onetype of control over the other?[9] The dominant role of hydrogeomorphology on
nutrient retention has been emphasized in several cross-sitestudies. For example, Alexander et al. [2000] showed thatnitrogen retention was inversely related to mean streamdepth. When this finding was coupled with the well-knownrelation of increasing stream depth with distance down-stream [Leopold et al., 1964], Alexander et al. demonstratedthat headwater streams were more effective at retainingnitrogen than downstream reaches and attributed this tosystematic hydrogeomorphic variations in watersheds. Sim-ilarly, uptake length is often correlated with discharge acrossa range of stream sizes [Butturini and Sabater, 1998;
HWC 1 - 2 DOYLE ET AL.: HYDROGEOMORPHIC CONTROLS ON PHOSPHORUS RETENTION

Peterson et al., 2001]. An earlier synthesis of nutrientretention literature suggested that channel morphologycould dominate uptake processes [Stream Solute Workshop,1990, p. 113]:
In a comparison of two streams differing in flow by a factor of 100(e.g., a first-order tributary and a third-channel in the samecatchment), the expected difference in uptake length would beabout ten-fold and the difference in water column turnover timewould be about six-fold. Although both streams have (byassumption) an identical ability to retain nutrients on a unit areabasis, the smaller stream might be considered far more retentive perunit length in that any added nutrient is sequestered more quicklyand within a much smaller distance.
While this synthesis and later empirical studies suggest thatchannel hydrogeomorphology governs nutrient retentionwithin a reach, the argument is based on the fundamentalassumption that different channels have an identical abilityto retain nutrients (i.e., that Vf is the same). However,differences in Vf may be quite large due either to changes inbiological processes (U) or nutrient concentration (C), andits variation relative to hydrogeomorphic variation remainsuncertain. Key to understanding nutrient retention instreams and rivers thus becomes a matter of identifyingthe circumstances in which one set of controls has primacyover the other.[10] The goal of our study was to isolate the relative
influences of biochemical process, background nutrientconcentration, and hydrogeomorphology on MRP retentionin streams. Specifically we sought to (1) document changesin MRP retention at a single field site undergoing drasticgeomorphic changes, (2) describe these changes in terms ofcommonly used uptake metrics so as to compare changes atour site to those observed at other sites, and (3) usemodeling in combination with parameter constraints fromother field sites to predict whether hydrogeomorphologycan be a significant factor in controlling MRP retention.
2. Methods
2.1. Study Site
[11] The study was conducted along a 4.5-km reach ofthe Koshkonong River, a fifth-order stream draining 360km2 in south-central Wisconsin (Figure 1). The RockdaleDam was located within the study reach (at station 0), andits corresponding impoundment extended upstream 2040meters covering 42 ha with maximum and mean depths of1.5 and 0.6 m, respectively. Average channel width anddepth outside of the reservoir were 17.3 and 1.4 m,respectively. Bed substrate outside the reservoir was com-posed of a highly variable mixture of silt, fine sand, andlimited areas of coarse gravel. Sediment within the reservoirwas primarily silt. The dam was located on a distinct breakin river long-profile slope, between an upstream gentlesection (0.0007 slope) and a downstream steeper section(0.004 slope). Nutrient concentrations in the study reachwere elevated due to widespread agriculture in the basinand the presence of the town of Cambridge approximately1.5 km upstream of the study reach. Suspended sedimentand particulate P concentrations varied from 0.010 to 0.50mg/L and 0.005 to 0.065 mg/L, respectively, on samplingdates. The suspended sediment-particulate P relationshipremained constant throughout the study and at both sites,suggesting limited sorption of dissolved P in the watercolumn (E. Stanley and M. Doyle, unpublished data, 2003).
[12] On 12 September 2000 the Rockdale Dam wasbreached and the majority of the structure was removed.Changes in channel morphology resulting from the removalof the Rockdale Dam were pronounced immediatelyupstream of the dam, converting the reservoir from wideshallow flow to a single-thread narrow channel (Figure 2).Channel change within the reservoir was accomplishedthrough the formation of a headcut, which migratedupstream at an average rate of 40 m per month for 11months. Upstream of the headcut the reservoir sedimentsurface was mostly undisturbed by the removal. Down-stream of the headcut, a combination of vertical bed erosionand bank erosion resulted in the formation of a relativelynarrow and deep channel. The headcut thus represented theupstream terminus of channel adjustments, and also repre-sented a distinct change between channel morphologies andflow conditions within a reach with constant discharge. Adetailed examination of the geomorphic impacts of this dam
Figure 1. Study site at the Rockdale Dam on theKoshkonong River. Lines across channel and reservoirindicate location of surveyed cross sections. Dam is locatedat station 0, and phosphorus samples were collected at crosssections �380 and 4180, which are the distances from thedam in meters.
DOYLE ET AL.: HYDROGEOMORPHIC CONTROLS ON PHOSPHORUS RETENTION HWC 1 - 3

removal is provided by Doyle et al. [2003]. The importantimplication of the geomorphic adjustments relative tonutrient retention is that the study reach underwent theconversion from a wide, shallow channel with low flowvelocity and fine bed sediment to a narrow, deep channelwith relatively rapid flow and coarse bed sediment.
2.2. Field Methodology, Hydraulic, andLaboratory Analyses
[13] Water samples were collected at stations 4180 mupstream and 380 m downstream of the dam. Samples wereeither taken automatically using an ISCO
1
automated sam-pler or collected by hand in acid-washed polyethylenebottles. All samples were filtered through preashed 0.7-mmglass fiber filters, and MRP was determined using theascorbic acid method [American Public Health Association(APHA), 1995]. Molybdate-based techniques will react withP in multiple forms, including orthophosphate, colloidal P,and organic P that can pass through the filter [Haygarth etal., 1997]. Although this method is sensitive to multipleforms of P, we are focusing on the MRP fraction as the mostlikely indicator of concentrations of biologically availableand chemically reactive P. Samples collected throughout aday using the ISCO sampler were averaged to obtain a meandaily value. Grab samples (n = 3) were averaged and used torepresent the entire day of sampling.[14] Discharge measurements were made periodically
throughout the study, and were used in conjunction with apair of staff gauges to develop stage-discharge ratingcurves. Discharge was calculated using water stagesobserved while collecting water samples, and was then usedin standard step-backwater hydraulic analysis (U.S. ArmyCorps of Engineers Hydrologic Engineering Center-RiverAnalysis System (HEC-RAS) numerical model) to quantifyflow hydraulics (e.g., flow velocity, depth, width) at eachchannel cross section for each day that water samples werecollected. Chloride (Cl) concentrations were determined forwater samples from 11 dates (i.e., approximately monthly)
with a Dionex DX-500 ion chromatograph to assess poten-tial groundwater dilution between the upstream and down-stream stations.[15] Channel cross sections were surveyed from 3 months
prior to and for nearly 1 year following dam removal (May2000 and August 2001) to quantify changing channel form.Geomorphic surveys were not conducted each time watersamples were collected, and were thus assigned to representchannel conditions during specific time intervals duringwhich samples were collected. The survey from May2000 was used to represent physical channel conditionsprior to dam removal for hydraulic analysis. From the dayof removal (12 September 2000) to 1 November 2000, thepreremoval channel and reservoir sediment conditions wereleft unchanged in the hydraulic analysis, but the dam wasremoved. This represented conditions observed in the fieldas a channel began to form in the reservoir sediment. Adistinct channel within the reservoir sediment was formedby 1 November 2001, and May 2001 survey results wereused to represent channel conditions from 1 November2000 to 30 June 2001. The August 2001 survey was thenused to represent channel conditions for the remainder ofthe study (1 July 2001 to 22 October 2001). For estimatinglong-term equilibrium conditions, the channel geometry atthe most upstream channel cross section (4180 m upstreamof dam) was extrapolated through the reservoir at a uniformslope between that cross section and the base of the dam.
2.3. Reach Nutrient Retention
[16] We calculated empirical values of the three metrics ofnutrient retention for each day of sampling based on naturaldeclines in MRP along the study reach. Because parameterswere calculated using ambient concentrations rather than viashort-term nutrient additions, values reported herein are netrates (U, Vf) and lengths (Sw) [see also Martı́ et al., 1997].Using upstream and downstream MRP concentrations andthe discharge measurement, the quantity of MRP retained inthe reach was calculated as the difference between upstreamand downstream loads. This method does not allow theidentification of specific processes driving MRP removalfrom the water column. Thus MRP losses due to both bioticand abiotic uptake in the streambed and water column(including P sorption onto particle surfaces) are lumped intoestimates of uptake and retention. Results from the hydraulicanalysis were used to compute the area of wetted channelbed, and the reach-scale uptake rate (U) equaled the MRPload retained divided by the area of channel bed. The reachmass transfer coefficient (Vf) was calculated as U divided bythe average of the MRP concentration at the upstream anddownstream sampling sites. For uptake length Sw , a singlevalue of u*h is needed. However, channel morphologyvaried throughout the study reach, resulting in great spatialvariability in u*h for a given sampling date. We calculatedu*h at each cross section, then weighted each value by thelength of channel that the cross section represented. The u*hvalue used for calculating Sw was then the average of theweighted u*h values for the reach.[17] Values of retention metrics were compared to u*h
and average reach nutrient concentration, C, which repre-sent the known independent variables of the system.Although other studies have related retention metrics todischarge [e.g., Wollheim et al., 2001], we chose u*h for our
Figure 2. Changes in channel morphology and flowconditions following dam removal on the KoshkonongRiver: (a) Facing upstream from the Rockdale Dampreremoval, (b) one day postremoval, 13 September 2000,(c) November 2000 (2 months postremoval), (d) May 2001(8 months postremoval).
HWC 1 - 4 DOYLE ET AL.: HYDROGEOMORPHIC CONTROLS ON PHOSPHORUS RETENTION

analysis because it appears in the equations relating changesin nutrient concentration to the metrics of interest (e.g.,equation (3)). Finally, we also related Sw to Vf to examinehow much variation in uptake length could be explained byuptake processes [Wollheim et al., 2001].
2.4. Modeling of MRP Retention
[18] We used forms of equation (3) to evaluate the abilityof each metric to predict the concentration at the down-stream end of the study reach given the incoming concen-tration of MRP and hydraulic conditions. To model nutrientretention using uptake rate, U, we used the initial nutrientconcentration C0 at the upstream station, and a single valueof U (the mean of the empirical values) to calculate thedownstream changes in MRP concentrations, C(L), usingthe following equation derived from equations (1) and (4)
C Lð Þ ¼ Ce�LUuhC ð5Þ
where C(L) is the MRP concentration at a cross section (i.e.,model node), and C is the MRP concentration at the crosssection immediately upstream. This model approach wasthen applied throughout the entire study reach using thesurvey cross sections as model nodes. To test the ability of thedifferent parameters to predict changes in nutrient concentra-tions, we applied the same model approach, but usedequation (4) along with the mean of the empirical values ofVf, and then used equation (3) with the mean of the empiricalvalues of Sw. Model accuracy was tested by comparing thepredicted MRP concentration at the downstream end of thereach to observed concentrations. Because concentration atthe downstream end of the reach is strongly controlled by theconcentration entering the reach, we also considered theability of the model to predict the percent MRP retainedwithin the reach as a more rigorous test of the model.[19] The primary limitations of this computational
approach are the lumped value for U, Vf, and Sw for theentire reach, which neglects any spatial or temporal varia-tion in biochemical processing. However, lumped spatialvalues for uptake parameters have generally been assumedin previous studies of nutrient retention [e.g., Martı́ andSabater, 1996; Hall et al., 2002], and only recently havespatially explicit uptake rates become quantified [Kemp andDodds, 2002b]. In addition, our method also ignores anylateral sources or sinks of MRP (although no tributariesentered the study reach between sampling locations) andneglects the effects of transient storage. Thus it wasassumed that all longitudinal changes in nutrient concen-tration are a result of changes in flow characteristics (i.e.,channel morphology) and biochemical nutrient retentiononly.
3. Results
3.1. Channel Morphology and Hydraulic Changes
[20] The removal of the Rockdale Dam and the corre-sponding channel adjustments altered the velocities anddepths of flows throughout the study (Figure 3). Removalof the dam without altering channel morphology (‘‘nodam’’) increased velocity 50 m upstream of the dam, butdid not affect the other sections. As the headcut migratedpast 160 m upstream of the dam, reflected in the 1 May2001 values, depth and velocity increased as flow was
concentrated into a narrow channel. At the cross section380 m upstream of the dam, dam removal reduced waterdepth and increased flow velocity through May 2001.Because depth decreased and velocity increased, there waslittle change in the velocity-depth product. However, oncethe headcut migrated past this section, channel depth andvelocity increased by over an order of magnitude (Figure 3).Thus while dam removal itself did not change the velocity-depth product within the reservoir (due to depth decreasingand velocity increasing), channel formation via headcutmigration altered flow conditions substantially because bothvelocity and depth were increased.[21] As the channel in the reservoir continued to develop
through time, depths and velocities were decreased becauseof reduced energy gradient and increased channel width.Projected final equilibrium channel conditions had reducedu*h values at the sections between the dam and 700 mupstream of the dam. Upstream of this point, channelmorphology was only mildly impacted by dam removal,and corresponding velocities and depths showed littlechange over time.
3.2. Nutrient Dynamics
[22] MRP concentrations varied from 0.063 to 0.324 g/m3
at the upstream site (mean = 0.157 ± 0.010 SE), and from0.027 to 0.274 g/m3 at the downstream site (mean = 0.133 ±0.010). Upstream concentrations were always higher than atthe downstream site, indicating net retention through thereach for every sampling date (Table 1). Chloride concen-trations did not vary significantly between the upstream anddownstream sites (paired t test, p = 0.43), indicating nosystematic groundwater or lateral source influences to thestudy reach. Thus observed downstream decreases in MRPcannot be attributed to dilution.[23] Empirical values of uptake rate (U), mass transfer
coefficient (Vf), and uptake length (Sw) all varied over morethan an order of magnitude, with the least variation in U andgreatest in Sw (Figure 4, Tables 1 and 2). Uptake length wasof the order of tens of kilometers (mean Sw = 6.6 � 104 m).There were no apparent temporal trends associating any ofthe metrics with the date of sampling (Figure 4). Uptake ratewas related to u*h, although u*h explained little of thevariation (Figure 5, Table 3). Both Vf and Sw were related toMRP concentration, although concentration explained littleof the variation in either metric (Figure 5, Table 3). Finally,Sw was related more strongly to Vf than to u*h (Figure 6,Table 3).
3.3. Modeling Results
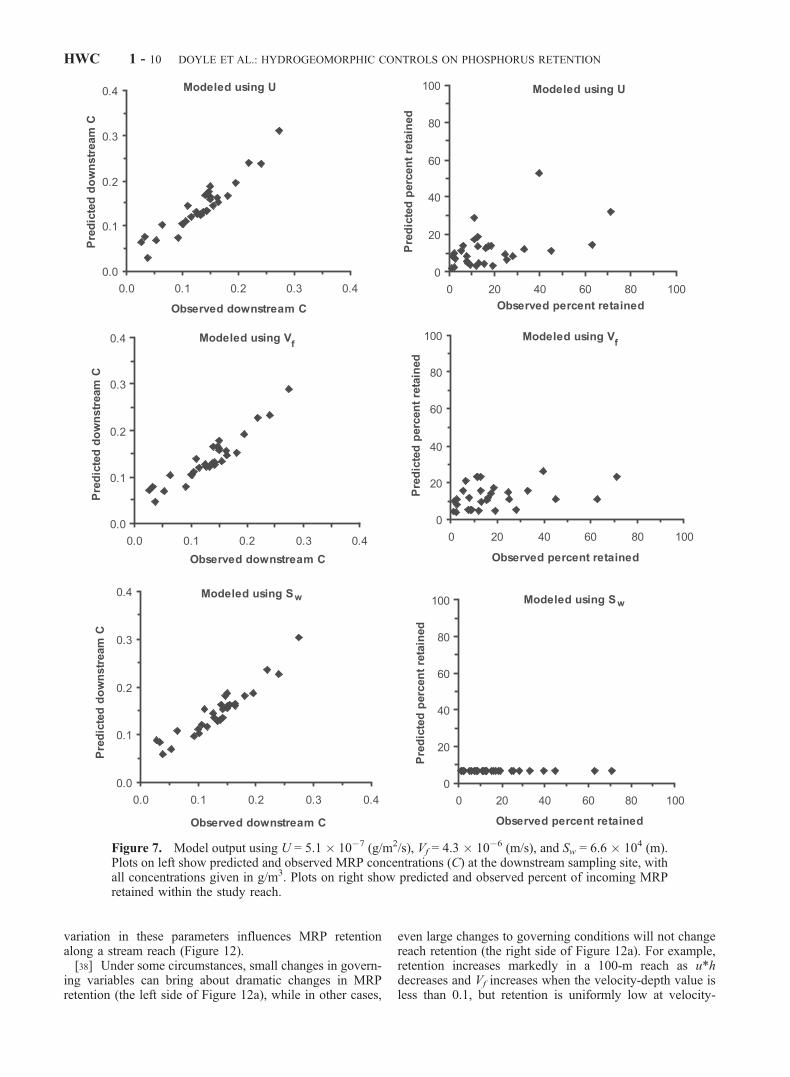
[24] Using mean values for all three retention metrics, wefound strong agreement between predicted and observedMRP concentrations at the downstream sampling station(Figure 7, Table 4). However, only modeling with Usuccessfully predicted the percent of MRP retained in thereach (Figure 7, Table 4). Modeling using Sw and equation(3) predicted a constant retention of 6.7% for all samplingdates.[25] Modeling results demonstrated the potential for var-
iable influence of both hydrology and geomorphology onMRP retention (Figure 8, Table 5). Removal of the daminitially resulted in reduction of retention ability, but only atthe downstream end of the former reservoir. Over time, theareas of the study reach where the reservoir was converted
DOYLE ET AL.: HYDROGEOMORPHIC CONTROLS ON PHOSPHORUS RETENTION HWC 1 - 5

to a channel via headcut migration and channel evolutionlost much of their ability to retain nutrients. With the dam inplace, the study reach would retain 10% of incoming MRPat a discharge of 5.4 m3/s and U of 5.1 � 10�7 g/m2/s(Table 5). In contrast, at final projected equilibrium con-ditions, only 3% of incoming MRP would be retained at thesame discharge and uptake rate. At lower modeled dis-charges, though, the retentive ability of the reach increased,making the effect of changing channel morphology moreevident. With the dam in place, the study reach would retain37% of incoming MRP at a discharge of 2.7 m3/s (the meanannual discharge), while the final equilibrium channelwould retain only 9%. That is, downstream MRP concen-trations were approximately 40% greater at final equili-brium conditions than conditions with the dam in place, and
these changes in downstream concentrations were due tochanges in channel morphology alone. Thus both variablechannel morphology and discharge affected MRP retention,and the effect of varying channel morphology was muchgreater at lower discharges than at higher discharges.[26] Biochemical processes could also exert a strong
control on MRP retention. At low uptake rates, modelresults revealed very little retention of MRP, regardless ofthe discharge or incoming MRP concentration. With ahigher uptake rate, however, influences of both hydrologyand geomorphology became more evident. Using the rangeof empirical uptake rates (4.0 � 10�8 to 1.9 � 10�6 g/m2/s),modeled trends in nutrient retention showed that the effectsof changes in channel morphology were much more evidentfor the higher uptake range than for the lower uptake range
Figure 3. Variation in velocity (u), depth (h), and velocity * depth (u*h) through time with Q = 2.7 m3/sat different points upstream (u/s) of the dam. Trends are consistent with those for other modeleddischarges.
HWC 1 - 6 DOYLE ET AL.: HYDROGEOMORPHIC CONTROLS ON PHOSPHORUS RETENTION

(Figure 9). That is, channel morphology had little impact onMRP retention if U was low (4.0 � 10�8 g/m2/s), but had avery large impact on MRP retention if U was high (1.9 �10�6 g/m2/s).
4. Discussion
4.1. Dam Removal and Nutrient Retention
[27] One of the most pressing concerns surrounding pro-posed dam removals is the fate of sediment released follow-ing dam removal and its ecological ramifications fordownstream aquatic habitats and communities [Heinz Center,2002]. However, how dam removal will impact nutrientdynamics has generally been overlooked [Stanley and Doyle,2002], despite nutrient loading being a significant environ-mental concern, particularly in the midwestern United States[Mueller et al., 1997; Carpenter et al., 1998]. This studyshowed that the Rockdale Reservoir was an effective sink forMRP. While this section of the river continued to retain MRPfollowing dam removal, downstream concentrationsincreased by approximately 40% due to changes in channelmorphology alone. Similar increases in particulate phospho-rus and nitrate are also likely to occur [Stanley and Doyle,2002].
4.2. Modeling Predictions and Observations
[28] Results from predicted versus observed MRP con-centrations and percent retention illustrate the limitations of
each of the models and nutrient retention metrics (i.e.,equations (3), (4), and (5)). All of the equations accuratelypredicted MRP concentration at the downstream study site.However, much of what governs downstream concentrationis the upstream concentration. Because upstream concen-tration is an input to the model (i.e., C0), this produces asomewhat circular prediction. The more rigorous test ofpredicting the percent of MRP retained in the reach illus-trates the limitations of each of the models. For modelingusing equation (5), U was assumed to be constant for allcases and throughout the entire study reach, and C and u*hvaried within the study reach and between sampling dates. Incontrast, equation (4) uses a fixed value of Vf, and only u*hvaries. Finally, in equation (3), Sw is a constant parameter forall of the simulations. Because equation (5) has a greaternumber of variables than equations (4) or (3), it is notsurprising that it was the only model with significant modelprediction output (Table 4). Similarly, because equation (3)lumps all of these variables into a single parameter todescribe the entire study reach through time, Sw , equation(3) predicts no variation for all of the dates of sampling.[29] The primary implication of these model results lies in
the utility and application of the various metrics. To date,most studies have described nutrient retention in terms of Sw.While Sw is a very useful and descriptive metric, it is limitedbecause it quantifies retention for a particular combinationof uptake rate, concentration, and discharge. Further, valuesfor Sw at a site are not useful for predicting the percent
Table 1. Observed Molybdate Reactive Phosphorus (MRP) Concentrations and Empirical Values for Nutrient Retention Metrics U, Vf,
and Swa
DateDischarge,
m3/s MRP In, g/m3 MRP Out, g/m3Empirical UptakeRate U, g/m2/s
Empirical MassTransfer Coefficient
Vf, m/sEmpirical UptakeLength Sw, m
5/20/00 23.5 0.243 (0.001) 0.240 (0.002) 2.18E�07 9.02E�07 3.67E+059/11/00 2.0 0.063 (0.015) 0.038 (0.003) 2.11E�07 4.21E�06 9.23E+039/14/00 3.7 0.194 (0.012) 0.147 (0.007) 6.98E�07 4.09E�06 1.63E+049/15/00 2.9 0.154 (0.002) 0.126 (0.003) 3.48E�07 2.49E�06 2.25E+049/18/00 2.2 0.193 (0.001) 0.181 (0.001) 1.17E�07 6.28E�07 7.11E+049/25/00 4.0 0.128 (0.021) 0.106 (0.016) 3.45E�07 2.95E�06 2.39E+0410/2/00 2.0 0.093 (0.016) 0.027 (0.003) 5.98E�07 9.94E�06 4.14E+0310/16/00 2.0 0.164 (0.001) 0.143 (0.002) 1.89E�07 1.23E�06 3.33E+0410/23/00 2.0 0.104 (0.012) 0.092 (0.015) 1.05E�07 1.07E�06 3.82E+0410/30/00 2.0 0.175 (0.003) 0.155 (0.009) 1.77E�07 1.08E�06 3.82E+0411/20/00 2.7 0.145 (0.004) 0.127 (0.003) 2.41E�07 1.77E�06 3.39E+0411/29/00 2.7 0.173 (0.001) 0.164 (0.002) 1.18E�07 7.02E�07 8.54E+041/3/01 2.7b 0.165 (0.010) 0.110 (0.003) 7.16E�07 5.22E�06 1.15E+043/16/01 15.6 0.170 (0.004) 0.150 (0.002) 1.06E�06 6.64E�06 3.61E+043/17/01 13.7 0.166 (0.007) 0.151 (0.004) 7.05E�07 4.46E�06 4.80E+044/13/01 13.7b 0.126 (0.001) 0.115 (0.001) 5.01E�07 4.17E�06 5.14E+044/20/01 13.7b 0.074 (0.003) 0.053 (0.003) 9.71E�07 1.53E�05 1.40E+044/26/01 13.7b 0.110 (0.026) 0.102 (0.001) 3.92E�07 3.69E�06 5.81E+045/2/01 4.7 0.116 (0.015) 0.064 (0.019) 1.03E�06 1.15E�05 7.87E+035/4/01 4.7 0.201 (0.022) 0.150 (0.013) 9.99E�07 5.70E�06 1.58E+045/11/01 4.7 0.089 (0.026) 0.033 (0.006) 1.11E�06 1.82E�05 4.96E+035/23/01 4.7b 0.136 (0.003) 0.133 (0.001) 6.72E�08 4.99E�07 1.81E+056/14/01 16.6 0.173 (0.001) 0.140 (0.001) 1.86E�06 1.19E�05 2.14E+046/19/01 4.0 0.119 (0.007) 0.100 (0.007) 3.33E�07 3.03E�06 2.60E+046/29/01 4.0 0.177 (0.002) 0.163 (0.003) 2.36E�07 1.39E�06 5.67E+047/16/01 3.3 0.145 (0.001) 0.143 (0.001) 4.01E�08 2.78E�07 2.82E+058/7/01 3.7 0.252 (0.002) 0.219 (0.001) 6.15E�07 2.61E�06 3.25E+049/6/01 3.1 0.324 (0.001) 0.274 (0.001) 8.30E�07 2.78E�06 2.73E+049/26/01 16.3 0.200 (0.001) 0.195 (0.001) 2.63E�07 1.33E�06 1.93E+0510/22/01 4.8 0.142 (0.020) 0.138 (0.004) 8.42E�08 6.02E�07 1.74E+05
aFor MRP, values are means (standard errors).bDischarge was taken from that measured during prior sampling.
DOYLE ET AL.: HYDROGEOMORPHIC CONTROLS ON PHOSPHORUS RETENTION HWC 1 - 7

retention for the reach at different nutrient loading orhydrologic conditions, as illustrated by the prediction ofconstant percent retention for all sampling dates (Figure 7).In contrast, U allows a reasonable prediction of percentnutrient retention, but it does not adequately describe overallreach nutrient retention because it does not include concen-tration or hydrogeomorphic parameters. In all, each of theretention metrics is useful in describing specific attributes ofa streams’ retention. Thus we next examine these nutrientretention metrics in more detail, and in comparison to valuesderived from other studies.
4.3. Nutrient Retention Metrics
[30] The range of empirical uptake rates found for theKoshkonong River study site (4.0 � 10�8 to 1.9 � 10�6 g/m2/s) were comparable to or slightly less than thosepresented elsewhere in the literature [e.g., Munn and Meyer,1990; Mulholland et al., 1990; Martı́ and Sabater, 1996].
We attribute our slightly lower values to our measuring netretention rather than gross retention in the study reach.However, the empirical mass transfer coefficients (2.8 �10�7 to 1.8 � 10�5 m/s) were generally at least an order ofmagnitude less than those presented elsewhere (discussed indetail below). We expected these lesser values because ouruptake rates were comparable, but background MRP con-centrations were generally 1–2 orders of magnitude greaterthan those in other studies [e.g., Munn and Meyer, 1990;Martı́ and Sabater, 1996], thus reducing Vf by 1–2 ordersof magnitude. The combination of lower Vf values andsubstantially larger velocities and depths (discussed below)produced uptake lengths several orders of magnitude longerthan those presented in most other studies [e.g., Munn andMeyer, 1990; D’Angelo et al., 1991].[31] Uptake length, which accounts for both biochemical
and hydrogeomorphic processes, was related to Vf but not tou*h in the Koshkonong River. In contrast, Wollheim et al.[2001] found that most of the change in Sw was due tochanges in channel velocity and depth, and that variability
Figure 4. Empirical values forMRPuptake rate,U (g/m2/s),mass transfer coefficient, Vf (m/s), and uptake length, Sw (m),as a function of date of sampling.
Table 2. Summary Statistics of Empirical Values of U, Vf, and Sw
Uptake RateU, g/m2/s
Mass TransferCoefficient Vf, m/s
Uptake LengthSw , m
Average 5.1 � 10�7 4.3 � 10�6 6.6 � 104
Standard error 7.7 � 10�8 8.4 � 10�7 1.6 � 104
Maximum 1.9 � 10�6 1.8 � 10�5 3.7 � 105
Minimum 4.0 � 10�8 2.8 � 10�7 4.1 � 103
Maximum/minimum 46 65 89
Figure 5. Retention parameters uptake length (Sw), masstransfer coefficient (Vf), and uptake rate (U) as functions ofvelocity*depth (u*h) and MRP concentration (C).
Table 3. Summary Statistics of Relationships Between Retention
Metrics and u*h, and Retention Metrics and MRP Concentration
C a
R2 p
U versus u*h 0.14 0.04Vf versus u*h 0.06 0.18Sw versus u*h 0.12 0.07Sw versus Vf 0.68 <0.01U versus C 0.01 0.58Vf versus C 0.23 0.01Sw versus C 0.33 <0.01
aAll data were log transformed for normalization.
HWC 1 - 8 DOYLE ET AL.: HYDROGEOMORPHIC CONTROLS ON PHOSPHORUS RETENTION

in Vf determined the variation around the Sw versus dis-charge relationship. To understand these conflicting results,it is necessary to evaluate the variability in Vf and u*hreported in the literature.
4.4. Variability in Vf
[32] Of the three retention metrics, Vf is a more usefulmeasure for isolating and comparing the effect ofbiochemical processes on streams [Wollheim et al., 2001;Hall et al., 2002]. By comparing variability in Vf with thevariability in u*h, the relative influence of biochemicalprocesses (reflected in Vf) versus hydrogeomorphology(reflected in u*h) can be assessed.[33] Empirical values for the mass transfer coefficient for
Koshkonong River were generally less than values pre-sented elsewhere in the literature (Figure 10). Computed Vf
ranged from 6.2 � 10�6 to 1.9 � 10�4 m/s for 27 of 29previous studies, compared with values from the Koshko-nong site, which ranged from 2.8 � 10�7 to 1.8 � 10�5 m/s.The range of values of Vf measured at the KoshkonongRiver (Vf max/Vf min = 65) was greater than all otherprevious studies (Figure 11). Indeed, within-site variation inprevious studies did not exceed an order of magnitude (i.e.,Vf max/Vf min < 10) for 27 of 29 channels. For example,Mulholland et al. [1985] reported a twofold variation in Vf
between seasons for a relatively short reach of a first-orderstream (120 m), as did Martı́ and Sabater [1996] for sand-cobble and bedrock reaches. Munn and Meyer [1990]studied specific reach elements (20-m stream lengths ofcobble, gravel, debris dam, and rock outcrop) within twostreams, and showed little variation in Vf at one site, butgreater than an order of magnitude variation at another site.In all, Vf varies less than an order of magnitude within a sitefor many previous studies, and approximately equal to orslightly greater than an order of magnitude for only a fewother studies, including ours. However, studies of morecomplex, or longer reaches tend to exhibit greater variabilityin Vf than others. Of interest here is how this scale ofvariation compares to variation in u*h.
4.5. Effect of Channel Morphology and Hydrology
[34] The effect of variable channel morphology andhydrology on nutrient retention has been emphasized in
previous studies because morphologic characteristics controlhabitat suitability for biota with widely varying uptake rates[Munn and Meyer, 1990]. Hydrogeomorphology alsoinfluences the extent of water-sediment interaction, whichin turn affects nutrient retention [Stream Solute Workshop,1990; Alexander et al., 2000]. Unfortunately, there are twoconstraints on the pool of existing studies examining theeffects of hydrogeomorphology on nutrient retention. First,the variability in flow conditions, as expressed in thevelocity-depth product is quite limited. Only five studies[Webster et al., 1991; Maltchick et al., 1994; Butturini andSabater, 1998; Hall et al., 2002; this study] have consideredchannels with u*h ranges exceeding an order of magnitude(Figures 10 and 11), and our study is the only one thatexceeds 2 orders of magnitude. The limited range ofvelocity and depth values reported in the literature reflects abias toward small first- and second-order streams in nutrientretention studies and highlights a limited understanding ofnutrient retention dynamics in larger river channels.[35] Second, previous studies have relied on intersite
comparisons to examine the relative role of hydrogeomor-phology on nutrient retention [e.g., Munn and Meyer, 1990;Martı́ and Sabater, 1996]. At the Koshkonong River site, asingle reach with rapidly changing channel morphology andhydrology was used, thus minimizing variation in otherparameters likely to be important in between-site compar-isons. However, it must be acknowledged that thedisturbance of dam removal most likely caused largevariation in factors governing uptake processes (Figure 4).As such, variation in Vf at the Koshkonong site was greaterthan variation at other, much smaller and less heterogeneoussites. Surprisingly though, variation in Vf at our study sitewas still comparable to variation at other complex sites.[36] The results emphasize the coupled nature of channel
morphology and uptake processes for governing nutrientretention within a reach. For the Koshkonong River, mod-eling results illustrated that the effect of channel morphol-ogy on nutrient retention was most evident for higher ratesof uptake (i.e., large values of U and/or Vf). At lower uptakerates, even drastic changes in channel morphology wereinsufficient to exert substantial influence on nutrientretention. In contrast, changes in channel morphology thatdecreased the velocity-depth product, when coupled withhigher uptake rates, worked to exert a very strong influenceon reach nutrient retention. Thus it appears that channelmorphology and biochemical uptake processes work intandem to govern nutrient retention. However, it isimportant to assess whether, or perhaps when, uptakeprocesses or changes in channel morphology will governnutrient retention within a stream.
4.6. Uptake Processes Versus Channel Morphology
[37] The relative roles of biochemical uptake processesand channel morphology in determining downstreamnutrient concentration can be assessed by systematicallymanipulating values of Vf and u*h (i.e., equation (4)).Because existing studies are limited to a very narrow rangeof u*h values (Figure 10), it is difficult to use a meta-analysis approach to assess effects of variation in Vf andu*h over a range of channel conditions. Instead, usingrealistic values of Vf, u, h, and reach lengths, Vf can bevaried across a range of u*h values to examine how
Figure 6. MRP uptake length (Sw) as a function of masstransfer coefficient (Vf).
DOYLE ET AL.: HYDROGEOMORPHIC CONTROLS ON PHOSPHORUS RETENTION HWC 1 - 9
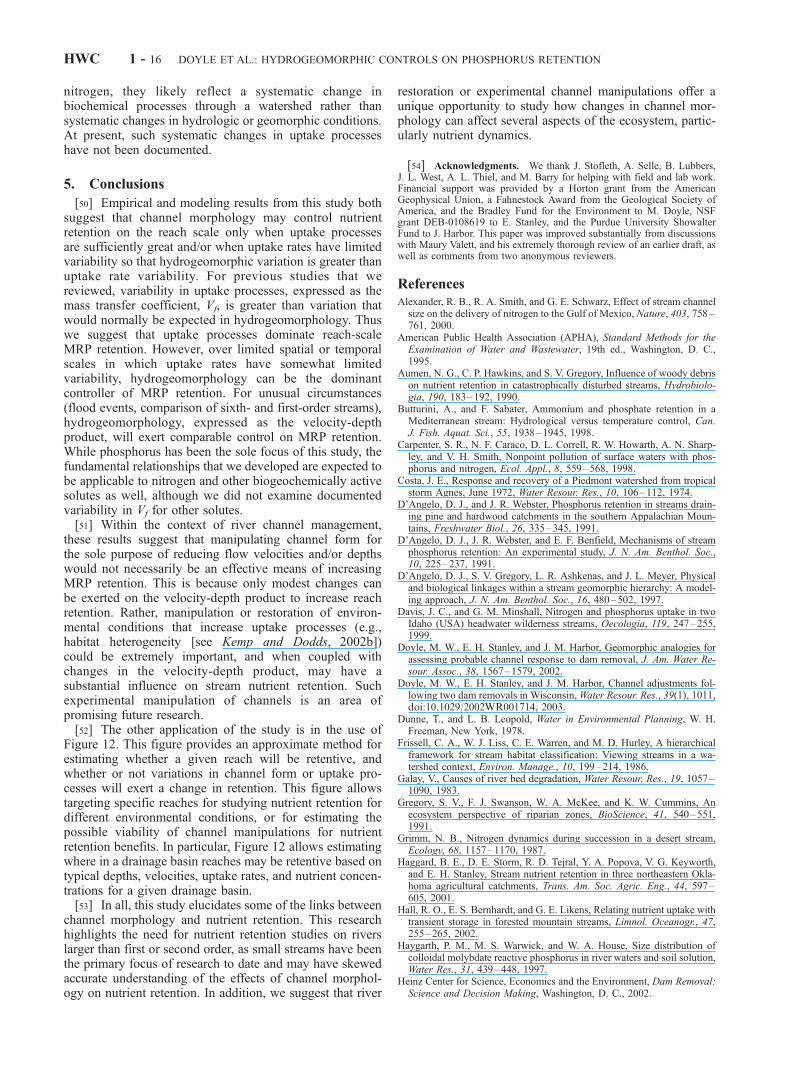
variation in these parameters influences MRP retentionalong a stream reach (Figure 12).[38] Under some circumstances, small changes in govern-
ing variables can bring about dramatic changes in MRPretention (the left side of Figure 12a), while in other cases,
even large changes to governing conditions will not changereach retention (the right side of Figure 12a). For example,retention increases markedly in a 100-m reach as u*hdecreases and Vf increases when the velocity-depth value isless than 0.1, but retention is uniformly low at velocity-
Figure 7. Model output using U = 5.1 � 10�7 (g/m2/s), Vf = 4.3 � 10�6 (m/s), and Sw = 6.6 � 104 (m).Plots on left show predicted and observed MRP concentrations (C) at the downstream sampling site, withall concentrations given in g/m3. Plots on right show predicted and observed percent of incoming MRPretained within the study reach.
HWC 1 - 10 DOYLE ET AL.: HYDROGEOMORPHIC CONTROLS ON PHOSPHORUS RETENTION

depth values greater than 1. Not surprisingly, as the lengthof reach increases, the ability of the reach to retain nutrientsincreases (see Figures 12a and 12b).[39] The effect of varying Vf is evident from the results of
the modeling exercise. The range of Vf values presented inthe literature (see Figure 10) results in drastically differentretention trends. For reaches on the order of 100 m, only Vf
values of 10�5 m/s or greater will result in MRP retentionunder realistic flow conditions (Figure 12a). For a 1000-mreach, MRP will be retained for Vf values greater than 10�6
m/s, but only for flows that have a velocity-depth productless than 1 to 10 m2/s (Figure 12b). That is, even if a reachhas extremely high values of Vf (e.g., 10
�3 m/s), the vastmajority of nutrients will not be retained if flow is too rapidand/or deep (e.g., u*h > �5 m2/s).[40] Figure 12 highlights the potential for dominant, or
possibly comparable, roles of channel morphology or uptakeprocesses inMRP retention. For example, for a 1000-m reachwith a mass transfer coefficient of 10�5 m/s, decreasing thevelocity-depth product from 0.1 to 0.01 (i.e., an order ofmagnitude) increases retention from 9% to 63%. Similarly,for the same length of reach but with a constant velocity-
depth product of 0.1, increasing the uptake rate from 10�5 to10�4 m/s also causes an increase in retention from 9% to63%. Thus for cases in which both uptake processes and thevelocity-depth product are influential on reach retention(e.g., the left portion of Figure 12a), changes in eitherhydrogeomorphology or uptake processes (i.e., mass trans-fer) can exert the same influence on overall reach retention.However, there are other cases (the right side of Figure 12a)where changes in either parameter will exert no change inreach retention because retention is negligible. Determiningwhen such combinations of Vf and u*h will occur for high orlow retention necessitates predicting systematic variation ineither parameter. To date, the vast majority of retentionstudies have been conducted on headwater streams, andsystematic variation in Vf through a watershed is unknown.However, it is possible to use hydrogeomorphic argumentsto constrain potential variation and potential systematicvariation in u*h for various conditions.
4.7. Potential Effect of Hydrogeomorphology
[41] Because of potentially variable influences of uptakeprocesses and hydrogeomorphology, it is important toexamine the possible range of the parameters that havebeen observed, and could be expected in natural channels.
Table 4. Summary Statistics of Observed and Modeled MRP
Concentrations at the Downstream End of the Study Reach (Cout)
and Percent MRP Retained in the Study Reacha
Metric Used in Model R2 p
Cout Observed Versus Cout PredictedU 0.80 <0.01Vf 0.80 <0.01Sw 0.81 <0.01
Percent Retained in Reach Observed Versus Percent Retained inReach Predicted
U 0.25 <0.01Vf 0.12 0.07Sw N/A N/A
aData for concentrations were log transformed for normalization, anddata for percent retention were arcsin-square root transformed fornormalization.
Figure 8. Modeled output of MRP concentration (C) assuming C0 = 0.157 g/m3 and U = 5.1 � 10�7
g/m2/s. Steeper slopes indicate higher amounts of retention for a channel segment.
Table 5. Effect of Channel Form and Discharge on Reach MRP
Retentiona
Predicted MRP Concentrationat Downstream End ofStudy Reach, g/m3
Q = 5.4 m3/s Q = 2.7 m3/s
Dam in place 0.141 (10%) 0.099 (37%)Dam removed, no channel changes 0.143 (9%) 0.105 (33%)May 2001 0.145 (8%) 0.117 (25%)August 2001 0.148 (6%) 0.130 (17%)Final equilibrium 0.152 (3%) 0.142 (9%)
aModel predictions for MRP concentrations at downstream end of studyreach assuming C0 = 0.157 g/m3 and U = 5.1 g/m2/s. Number inparentheses indicates percent of C0 retained.
DOYLE ET AL.: HYDROGEOMORPHIC CONTROLS ON PHOSPHORUS RETENTION HWC 1 - 11

We begin by assuming that for stream reaches of the order of102–103 m, mass transfer coefficients can vary by approx-imately an order of magnitude (Figures 10 and 11) due tovariations in channel habitats [Munn and Meyer, 1990],seasonal conditions [D’Angelo and Webster, 1991], anddisturbance regimes [Martı́ et al., 1997]. This assumption ismore valid for longer and more complex channel reachesthan for smaller homogenous channels, although variabilityin larger channels still is mostly unknown. Hydrogeomor-phology, as reflected in the velocity-depth product, can varyin three ways (Figure 13): (1) dynamically in time throughadjustments in channel form (e.g., this study, riverrestoration, channelization, channel avulsion), (2) at astation at various discharges [Leopold et al., 1964], thatis, channel depth and velocity change as a function ofdischarge, or (3) downstream at a given point in time[Leopold et al., 1964]; that is, channel depth and velocitychange as a function of distance downstream within adrainage basin. We use broad hydraulic, hydrologic, andgeomorphic characteristics of channels to estimate the rangeof u*h that may result from these temporal and spatialchanges.4.7.1. Dynamic Channel Morphology[42] Rivers are dynamic in their ability to adjust their
dimensions (Figure 13a) in response to changes in environ-
mental conditions (see reviews by Galay [1983] andKnighton [1998]). Indeed, the adjustments of the Koshko-nong River following the removal of the Rockdale Dam areexemplary of such changes [Doyle et al., 2002]. For a givendischarge, channel configuration controls how the flow isrouted through the channel, i.e., the depth and velocity offlow. For a given slope, wide channels have shallow, slowflow whereas narrow channels have deep, rapid flow.Manning’s equation [Knighton, 1998] provides a means bywhich to calculate how the velocity-depth product varieswith different channel morphologies:
u ¼ 1
nR2=3S1=2 ð6Þ
where R is hydraulic radius, S is slope, and n is an empiricalroughness coefficient. Using the width to depth ratio, F, torepresent channel morphology, and Manning’s equation tocalculate the velocity, u*h � F�0.6. This suggests that anorder ofmagnitude change in channel morphology, expressedas an order of magnitude change in F, will result in only halfan order of magnitude change in the velocity-depth product.[43] In reality, an order of magnitude change in F for a
given reach is unrealistic. In several cases of channelresponse to extreme disturbances, predisturbance andpostdisturbance width to depth ratios varied by less than a
Figure 9. Modeled and observed MRP concentrations versus distance through time. Light line showsmodel output with U = 1.9 � 10�6 g/m2/s (maximum of empirical values), and darker line shows modeloutput with U = 4.0 � 10�8 g/m2/s (minimum of empirical values). Triangles show observed MRPconcentration at upstream and downstream end of study reach. Distances are distance upstream from damwith upstream positive, and discharge is in m3/s. Note low slope of dark line and high slope of light line,indicating low retention and high retention, respectively.
HWC 1 - 12 DOYLE ET AL.: HYDROGEOMORPHIC CONTROLS ON PHOSPHORUS RETENTION

factor of 2 [Costa, 1974; Pitlick, 1993; Ritter et al., 1999].On the basis of these studies, variation in channel form canonly change the velocity-depth product by a factor ofapproximately 1.5, which is much less than the order-of-magnitude variation for the mass transfer coefficient thathas been reported in some studies (e.g., Figure 10). Thusdynamic channel morphology would not be expected to be agoverning factor in controlling nutrient retention insituations in which large changes in the mass transfercoefficient occur. Indeed, the results of our study supportthis in that Sw, representing reach MRP retention, wasrelated more strongly to Vf than u*h.4.7.2. At-a-Station Variation[44] As discharge fluctuates at a single point along a
channel (e.g., storm hydrographs), both velocity and depthchange (Figure 13b). One to two orders of magnitude
variation in at-a-station discharge due to seasonal changesin precipitation and evapotranspiration is common, exclud-ing very large infrequent events or extreme regional flowregimes, and most discharges at a site throughout a year arewithin 2 orders of magnitude [Mosley and McKerchar,1993]. Indeed, bank-full discharge generally exceeds themean annual discharge by approximately a factor of 7[Dunne and Leopold, 1978]. Relationships between at-a-station velocity, depth, and discharge are well known[Leopold et al., 1964; Knighton, 1998]. These relationshipssuggest that u � Q0.2 and h � Q0.4 [Knighton, 1998] withu*h � Q0.6. Thus a site experiencing discharge variations of2 orders of magnitude throughout a year would experienceapproximately only 1 order of magnitude variation in u*h.This variation in u*h is comparable to the assumed seasonalvariation for Vf [e.g., D’Angelo et al., 1991; D’Angelo and
Figure 10. Observed variation in (a) uptake rates and (b) velocity and depth ranges presented inprevious studies and in this study. Data are presented in order of increasing variation in Vf. Sources ofdata and assumptions made in calculations are (1) Hall et al. [2002] (all data from their Table 1), (2)Marti and Sabater [1996] (comparison of means of bed rock reaches and sand and cobble reaches ratherthan max and min of entire data sets), (3) Mullholand et al. [1990] (Vf max and min based on low andhigh enrichment; h calculated assuming width of 3 m as stated in their text), (4) Munn and Meyer [1990](Vf calculated using U values in their Table 2, and using MRP concentrations of 0.006 mg/L for HughWhite Creek and 0.015 mg/L for Watershed 3, as presented in their text, u*h back-calculated frompresented values of Sw and U in Table 2 and using equation (2)), (5) Webster et al. [1991], (6) Davis andMinshall [1999] (range presented for Vf is 95% confidence interval presented in their Table 3), (7)Mulholland et al. [1985], (8) Butturini and Sabater [1998] (back-calculated depth assuming width = 3.7m as presented in text of Marti and Sabater’s [1996] description of reach), (9) Maltchik et al. [1994](used surface flow for maximum values and discontinuous flow for minimum values), (10) D’Angelo andWebster [1991] (calculated Vf based on Sw data presented and back-calculated depths from discharge andvelocity data), (11) Sabater et al. [2000], (12) D’Angelo et al. [1991] (Vf calculated using uptake lengths,back-calculating depth from velocity and discharge data, and using MRP concentration of 0.03 mg/L asstated in their text), (13) this study.
DOYLE ET AL.: HYDROGEOMORPHIC CONTROLS ON PHOSPHORUS RETENTION HWC 1 - 13
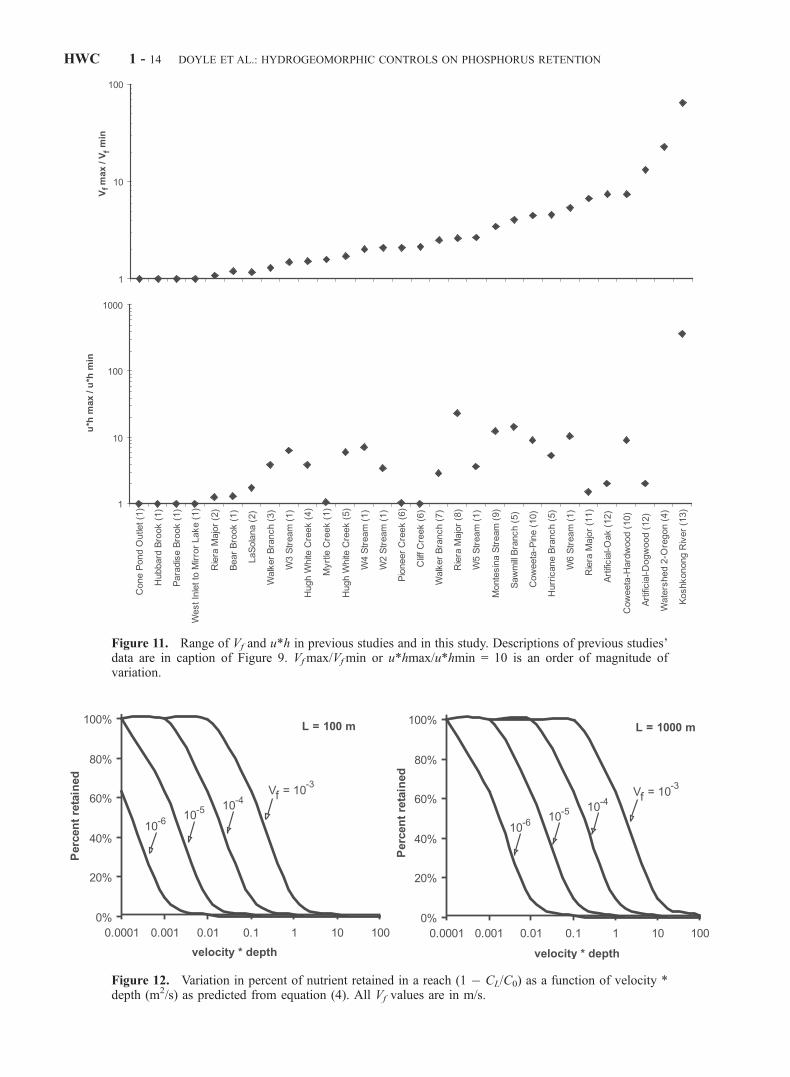
Figure 11. Range of Vf and u*h in previous studies and in this study. Descriptions of previous studies’data are in caption of Figure 9. Vfmax/Vfmin or u*hmax/u*hmin = 10 is an order of magnitude ofvariation.
Figure 12. Variation in percent of nutrient retained in a reach (1 � CL/C0) as a function of velocity *depth (m2/s) as predicted from equation (4). All Vf values are in m/s.
HWC 1 - 14 DOYLE ET AL.: HYDROGEOMORPHIC CONTROLS ON PHOSPHORUS RETENTION

Webster, 1991]. Thus uptake processes and channelmorphology are expected to exert comparable controls onreach nutrient retention. However, in cases where variationin Vf between seasons is less than an order of magnitude[e.g., Mulholland et al., 1985], discharge fluctuations willdominate nutrient retention. Overall variation in nutrientretention with discharge would thus be a function of bothvarying Vf [Martı́ et al., 1997] and varying velocities anddepths.[45] It should be noted, however, that under the cases of
high Vf values, short stream length, and very low velocitiesand depths (i.e., the left side of Figure 12a), small changesin discharge at a fairly constant mass transfer coefficient candrive large changes in reach retention. These are theconditions that have been studied most frequently inprevious work (see Figures 10 and 12). As such, thesestudies have suggested a critical role of discharge (i.e.,velocity and depth) in controlling nutrient retention.However, for low Vf conditions, and/or moderate or largevelocities and depths (e.g., greater than a third-orderstream), changes in discharge should have a reducedinfluence on reach retention. This further emphasizes theneed for studies exploring nutrient uptake at higher velocityand depth ranges.4.7.3. Downstream Variation at the Basin Scale[46] Like at-a-station morphology, downstream variation
in channel form (Figure 13c) is also well documented ingeomorphic literature [Knighton, 1998]. At the basin scale,depth and velocity increase due to changing channelmorphology and increasing discharge in the downstreamdirection. This regular variation has been the basis for the
prediction that nutrient retention should vary systematicallyin the downstream direction [Stream Solute Workshop,1990; Alexander et al., 2000; Wollheim et al., 2001].[47] Again using common geomorphic relationships, but
for changes in the downstream direction on the basin scale,depth and velocity vary as h � Q0.4 and u � Q0.1 [Knighton,1998], or u*h � Q0.5. This indicates that discharge wouldneed to increase by 2 orders of magnitude for changes inhydrogeomorphology to exert comparable control onnutrient retention as that exerted by uptake processes.[48] Assuming a relationship between discharge and
drainage area (A) of Q � A0.7 [Knighton, 1998] suggeststhat u*h � A0.35. To achieve variation in u*h of comparablemagnitude to Vf would require increasing drainage area by 3orders of magnitude. Thus we would only expect to seeflow conditions becoming a significant influence on nutrientretention when comparing channels with drainage areaswhich differ by a factor of 1000. However, this range ofdrainage areas is present only when comparing channelsvarying by 4 to 5 stream orders (e.g., first-order streamversus sixth-order stream [Leopold et al., 1964]). For lessdifferent channels (e.g., first-order versus third-order), u*hwill vary much less than an order of magnitude, and thuswill be less variable than Vf, suggesting that uptakeprocesses should dominate nutrient retention.[49] In the case of downstream variation in nutrient
retention at the basin scale, the effect of systematic hydro-geomorphic changes should not be discernible because ofthe more substantial variability in uptake processes. Thus ifsystematic downstream changes in nutrient retention arediscernible, as shown by Alexander et al. [2000] for
Figure 13. Potential variations in hydrogeomorphology and their relative influence (as u*h) ascompared with variation in Vf in determining variation in retention over time for a given channel area orover space. Hydrogeomorphology can vary in three ways: (a) dynamic channel adjustments, (b) withchanges in discharge at a station, or (c) longitudinally through a drainage basin.
DOYLE ET AL.: HYDROGEOMORPHIC CONTROLS ON PHOSPHORUS RETENTION HWC 1 - 15
nitrogen, they likely reflect a systematic change inbiochemical processes through a watershed rather thansystematic changes in hydrologic or geomorphic conditions.At present, such systematic changes in uptake processeshave not been documented.
5. Conclusions
[50] Empirical and modeling results from this study bothsuggest that channel morphology may control nutrientretention on the reach scale only when uptake processesare sufficiently great and/or when uptake rates have limitedvariability so that hydrogeomorphic variation is greater thanuptake rate variability. For previous studies that wereviewed, variability in uptake processes, expressed as themass transfer coefficient, Vf, is greater than variation thatwould normally be expected in hydrogeomorphology. Thuswe suggest that uptake processes dominate reach-scaleMRP retention. However, over limited spatial or temporalscales in which uptake rates have somewhat limitedvariability, hydrogeomorphology can be the dominantcontroller of MRP retention. For unusual circumstances(flood events, comparison of sixth- and first-order streams),hydrogeomorphology, expressed as the velocity-depthproduct, will exert comparable control on MRP retention.While phosphorus has been the sole focus of this study, thefundamental relationships that we developed are expected tobe applicable to nitrogen and other biogeochemically activesolutes as well, although we did not examine documentedvariability in Vf for other solutes.[51] Within the context of river channel management,
these results suggest that manipulating channel form forthe sole purpose of reducing flow velocities and/or depthswould not necessarily be an effective means of increasingMRP retention. This is because only modest changes canbe exerted on the velocity-depth product to increase reachretention. Rather, manipulation or restoration of environ-mental conditions that increase uptake processes (e.g.,habitat heterogeneity [see Kemp and Dodds, 2002b])could be extremely important, and when coupled withchanges in the velocity-depth product, may have asubstantial influence on stream nutrient retention. Suchexperimental manipulation of channels is an area ofpromising future research.[52] The other application of the study is in the use of
Figure 12. This figure provides an approximate method forestimating whether a given reach will be retentive, andwhether or not variations in channel form or uptake pro-cesses will exert a change in retention. This figure allowstargeting specific reaches for studying nutrient retention fordifferent environmental conditions, or for estimating thepossible viability of channel manipulations for nutrientretention benefits. In particular, Figure 12 allows estimatingwhere in a drainage basin reaches may be retentive based ontypical depths, velocities, uptake rates, and nutrient concen-trations for a given drainage basin.[53] In all, this study elucidates some of the links between
channel morphology and nutrient retention. This researchhighlights the need for nutrient retention studies on riverslarger than first or second order, as small streams have beenthe primary focus of research to date and may have skewedaccurate understanding of the effects of channel morphol-ogy on nutrient retention. In addition, we suggest that river
restoration or experimental channel manipulations offer aunique opportunity to study how changes in channel mor-phology can affect several aspects of the ecosystem, partic-ularly nutrient dynamics.
[54] Acknowledgments. We thank J. Stofleth, A. Selle, B. Lubbers,J. L. West, A. L. Thiel, and M. Barry for helping with field and lab work.Financial support was provided by a Horton grant from the AmericanGeophysical Union, a Fahnestock Award from the Geological Society ofAmerica, and the Bradley Fund for the Environment to M. Doyle, NSFgrant DEB-0108619 to E. Stanley, and the Purdue University ShowalterFund to J. Harbor. This paper was improved substantially from discussionswith Maury Valett, and his extremely thorough review of an earlier draft, aswell as comments from two anonymous reviewers.
ReferencesAlexander, R. B., R. A. Smith, and G. E. Schwarz, Effect of stream channelsize on the delivery of nitrogen to the Gulf of Mexico, Nature, 403, 758–761, 2000.
American Public Health Association (APHA), Standard Methods for theExamination of Water and Wastewater, 19th ed., Washington, D. C.,1995.
Aumen, N. G., C. P. Hawkins, and S. V. Gregory, Influence of woody debrison nutrient retention in catastrophically disturbed streams, Hydrobiolo-gia, 190, 183–192, 1990.
Butturini, A., and F. Sabater, Ammonium and phosphate retention in aMediterranean stream: Hydrological versus temperature control, Can.J. Fish. Aquat. Sci., 55, 1938–1945, 1998.
Carpenter, S. R., N. F. Caraco, D. L. Correll, R. W. Howarth, A. N. Sharp-ley, and V. H. Smith, Nonpoint pollution of surface waters with phos-phorus and nitrogen, Ecol. Appl., 8, 559–568, 1998.
Costa, J. E., Response and recovery of a Piedmont watershed from tropicalstorm Agnes, June 1972, Water Resour. Res., 10, 106–112, 1974.
D’Angelo, D. J., and J. R. Webster, Phosphorus retention in streams drain-ing pine and hardwood catchments in the southern Appalachian Moun-tains, Freshwater Biol., 26, 335–345, 1991.
D’Angelo, D. J., J. R. Webster, and E. F. Benfield, Mechanisms of streamphosphorus retention: An experimental study, J. N. Am. Benthol. Soc.,10, 225–237, 1991.
D’Angelo, D. J., S. V. Gregory, L. R. Ashkenas, and J. L. Meyer, Physicaland biological linkages within a stream geomorphic hierarchy: A model-ing approach, J. N. Am. Benthol. Soc., 16, 480–502, 1997.
Davis, J. C., and G. M. Minshall, Nitrogen and phosphorus uptake in twoIdaho (USA) headwater wilderness streams, Oecologia, 119, 247–255,1999.
Doyle, M. W., E. H. Stanley, and J. M. Harbor, Geomorphic analogies forassessing probable channel response to dam removal, J. Am. Water Re-sour. Assoc., 38, 1567–1579, 2002.
Doyle, M. W., E. H. Stanley, and J. M. Harbor, Channel adjustments fol-lowing two dam removals in Wisconsin,Water Resour. Res., 39(1), 1011,doi:10.1029/2002WR001714, 2003.
Dunne, T., and L. B. Leopold, Water in Environmental Planning, W. H.Freeman, New York, 1978.
Frissell, C. A., W. J. Liss, C. E. Warren, and M. D. Hurley, A hierarchicalframework for stream habitat classification: Viewing streams in a wa-tershed context, Environ. Manage., 10, 199–214, 1986.
Galay, V., Causes of river bed degradation, Water Resour. Res., 19, 1057–1090, 1983.
Gregory, S. V., F. J. Swanson, W. A. McKee, and K. W. Cummins, Anecosystem perspective of riparian zones, BioScience, 41, 540–551,1991.
Grimm, N. B., Nitrogen dynamics during succession in a desert stream,Ecology, 68, 1157–1170, 1987.
Haggard, B. E., D. E. Storm, R. D. Tejral, Y. A. Popova, V. G. Keyworth,and E. H. Stanley, Stream nutrient retention in three northeastern Okla-homa agricultural catchments, Trans. Am. Soc. Agric. Eng., 44, 597–605, 2001.
Hall, R. O., E. S. Bernhardt, and G. E. Likens, Relating nutrient uptake withtransient storage in forested mountain streams, Limnol. Oceanogr., 47,255–265, 2002.
Haygarth, P. M., M. S. Warwick, and W. A. House, Size distribution ofcolloidal molybdate reactive phosphorus in river waters and soil solution,Water Res., 31, 439–448, 1997.
Heinz Center for Science, Economics and the Environment, Dam Removal:Science and Decision Making, Washington, D. C., 2002.
HWC 1 - 16 DOYLE ET AL.: HYDROGEOMORPHIC CONTROLS ON PHOSPHORUS RETENTION

Hupp, C. R., Riparian vegetation recovery patterns following stream chan-nelization—A geomorphic perspective, Ecology, 73, 1209–1226, 1992.
Kemp, M. J., and W. K. Dodds, The influence of ammonium, nitrate, anddissolved oxygen concentrations on uptake, nitrification, and denitrifica-tion rates associated with prairie stream substrata, Limnol. Oceanogr., 47,1380–1393, 2002a.
Kemp, M. J., and W. K. Dodds, Comparisons of nitrification and denitri-fication in prairie and agriculturally influenced streams, Ecol. Appl., 12,998–1009, 2002b.
Knighton, D., Fluvial Forms and Processes: A New Perspective, OxfordUniv. Press, New York, 1998.
Leopold, L. B., M. G. Wolman, and J. P. Miller, Fluvial Processes inGeomorphology, W. H. Freeman, New York, 1964.
Maltchick, L., S. Molla, C. Casado, and C. Montes, Measurement of nu-trient spiraling in a Mediterranean stream: Comparison of two extremehydrological periods, Arch. Hydrobiol., 130, 215–227, 1994.
Martı́, E., and F. Sabater, High variability in temporal and spatial nutrientretention in Mediterranean streams, Ecology, 77, 854–869, 1996.
Martı́, E., N. B. Grimm, and S. G. Fisher, Pre- and post-flood retentionefficiency of nitrogen in a Sonoran Desert stream, J. N. Am. Benthol.Soc., 16, 805–819, 1997.
Mosley, M. P., and A. I. McKerchar, Streamflow, in Handbook of Hydrol-ogy, edited by D. R. Maidment, pp. 8.1–8.39, McGraw-Hill, New York,1993.
Mueller, D. K., B. C. Ruddy, and W. A. Battaglin, Logistic model of nitratein streams of the upper-midwest United States, J. Environ. Qual., 26,1223–1230, 1997.
Mulholland, P. J., J. D. Newbold, J. W. Elwood, L. A. Ferren, and F. R.Webster, Phosphorous spiraling in a woodland stream: Seasonal varia-tions, Ecology, 66, 1012–1023, 1985.
Mulholland, P. J., A. D. Steinman, and J. W. Elwood, Measurement ofphosphorus uptake length in streams: Comparison of radiotracer andstable PO4 releases, Can. J. Fish. Aquat. Sci., 47, 2351–2357, 1990.
Munn, N. L., and J. L. Meyer, Habitat-specific solute retention in two smallstreams: An intersite comparison, Ecology, 71, 2069–2082, 1990.
Newbold, J. D., J. W. Elwood, R. V. O’Neill, andW. VanWinkle, Measuringnutrient spiraling in streams, Can. J. Fish. Aquat. Sci., 38, 860–863,1981.
Peterson, B. J., et al., Control of nitrogen export from watersheds by head-water streams, Science, 292, 86–90, 2001.
Pitlick, J., Response and recovery of a subalpine stream following a cata-strophic flood, Geol. Soc. Am. Bull., 105, 657–670, 1993.
Pitlick, J., and M. M. Van Steeter, Geomorphology and endangered fishhabitats of the upper Colorado River: 2. Linking sediment transport tohabitat maintenance, Water Resour. Res., 34, 303–316, 1998.
Power, M. E., G. Parker, W. E. Dietrich, and A. Sun, How does floodplainwidth affect floodplain river ecology? A preliminary exploration usingsimulations, Geomorphology, 13, 301–317, 1995.
Ritter, D. F., R. C. Kochel, and J. R. Miller, The disruption of Grassy Creek:Implications concerning events and thresholds, Geomorphology, 29,323–338, 1999.
Rosenfeld, J. S., and J. J. Hudson, Primary production, bacterial production,and invertebrate biomass in pools and riffles in southern Ontario streams,Arch. Hydrobiol., 139, 301–316, 1997.
Sabater, F., A. Butturini, E. Marti, E. Munoz, A. Romani, J. Wray, and S.Sabater, Effects of riparian vegetation removal on nutrient retention ina Mediterranean stream, J. N. Am. Benthol. Soc., 19, 609–620, 2000.
Shields, F. D., S. S. Knight, and C. M. Cooper, Effects of channel incisionon base flow stream habitats and fishes, Environ. Manage., 18, 43–57,1994.
Stanley, E. H., and M. W. Doyle, A geomorphic perspective on nutrientretention following dam removal, BioScience, 52, 693–701, 2002.
Stream Solute Workshop, Concepts and methods for assessing solutedynamics in stream ecosystems, J. N. Am. Benthol. Soc., 9, 95–119,1990.
Vannote, R. L., G. W. Minshall, K. W. Cummins, J. R. Sedell, and C. E.Cushing, The river continuum concept, Can. J. Fish. Aquat. Sci., 37,130–137, 1980.
Webster, J. R., and B. C. Patten, Effects of watershed perturbation onstream potassium and calcium dynamics, Ecol. Monogr., 49, 51–72,1979.
Webster, J. R., D. J. D’Angelo, and G. T. Peters, Nitrate and phosphateuptake in streams at Coweeta Hydrologic Laboratory, Verh. Int. Ver.Limnol., 24, 1681–1686, 1991.
Wollheim, W. M., B. J. Peterson, L. A. Deegan, J. E. Hobbie, B. Hooker,W. B. Bowden, K. J. Arscott, A. E. Hershey, and J. C. Finlay, Influenceof stream size on ammonium and suspended particulate nitrogen proces-sing, Limnol. Oceanogr., 46, 1–13, 2001.
����������������������������M. W. Doyle, Department of Geography, University of North Carolina at
Chapel Hill, Campus Box 3220, Chapel Hill, NC 27599-3220, USA.([email protected])
J. M. Harbor, Department of Earth and Atmospheric Sciences, PurdueUniversity, 1397 Civil Engineering Building, West Lafayette, IN 47907,USA. ( [email protected])
E. H. Stanley, Center for Limnology, University of Wisconsin, 680 NorthPark Street, Madison, WI 53706-1492, USA. ([email protected])
DOYLE ET AL.: HYDROGEOMORPHIC CONTROLS ON PHOSPHORUS RETENTION HWC 1 - 17