Seasonality and environmental drivers of biological productivity
13
This article appeared in a journal published by Elsevier. The attached copy is furnished to the author for internal non-commercial research and education use, including for instruction at the authors institution and sharing with colleagues. Other uses, including reproduction and distribution, or selling or licensing copies, or posting to personal, institutional or third party websites are prohibited. In most cases authors are permitted to post their version of the article (e.g. in Word or Tex form) to their personal website or institutional repository. Authors requiring further information regarding Elsevier’s archiving and manuscript policies are encouraged to visit: http://www.elsevier.com/authorsrights
Transcript of Seasonality and environmental drivers of biological productivity

This article appeared in a journal published by Elsevier. The attachedcopy is furnished to the author for internal non-commercial researchand education use, including for instruction at the authors institution
and sharing with colleagues.
Other uses, including reproduction and distribution, or selling orlicensing copies, or posting to personal, institutional or third party
websites are prohibited.
In most cases authors are permitted to post their version of thearticle (e.g. in Word or Tex form) to their personal website orinstitutional repository. Authors requiring further information
regarding Elsevier’s archiving and manuscript policies areencouraged to visit:
http://www.elsevier.com/authorsrights

Author's personal copy
Seasonality and environmental drivers of biological productivity onthe western Hokkaido coast, Ishikari Bay, Japan
Julius I. Agboola a,d,*, Mario Uchimiya a, Isao Kudo a,b, Masato Osawa c, Kazuo Kido c
aGraduate School of Environmental Science, Hokkaido University, Kita 10 Nishi 5, Sapporo 060-0810, JapanbGraduate School of Fisheries Sciences, Hokkaido University, Hakodate 041-8611, JapancDepartment of Marine Geoscience, Geological Survey of Hokkaido, Otaru, JapandDepartment of Fisheries and Centre for Environment and Science Education (CESE), Lagos State University, Ojo, Lagos, Nigeria
a r t i c l e i n f o
Article history:Received 17 September 2012Accepted 19 March 2013Available online 27 March 2013
Keywords:temporal variationsnutrientschlorophyll aprimary productionIshikari Bay
a b s t r a c t
We report on a 16-month time series of the primary productivity, chlorophyll biomass and environ-mental variables in Ishikari Bay, the western Hokkaido coast, from September 2006 to December 2007.During productive summer and autumn seasons, the average phytoplankton biomass (as chlorophyll a)and productivity were 4.7 � 0.4 mg Chl a L�1 and 229.2 � 113.4 mg C L�1 d�1, and 5.9 � 6.0 mg Chl a L�1
and 138.9 � 202.6 mg C L�1 d�1, respectively. The water column salinity profiles suggested that nutrientupwelling from bottomwaters, especially in summer and autumn, when autotrophic production was at amaximum, was the major source of nutrients fueling the productivity in near-surface waters. Size-fractionation measurements showed that the micro-size fraction (>10 mm) accounted for > 80% of thetotal phytoplankton biomass and productivity. The strong correlation of POC with Chl a (r ¼ 0.875;P < 0.001; n ¼ 16) suggests that living phytoplankton in POC may outweigh detrital and bacterialbiomass. Stoichiometrical analysis of inorganic nutrients revealed a seasonal low (13) and high (25) DIN-to-PO4 ratio and a seasonal low (30) and high (37) Si-to-PO4 ratio, suggesting that phytoplankton growthwas possibly limited by nitrate and phosphate and not by silicic acid. We conclude that bottom-advectionof nutrients resulting from wind-driven mixing may have been a significant source of nutrient input inthis oligotrophic coastal system, and zooplankton grazing or other losses might be a crucial factor incontrolling the phytoplankton biomass and production, particularly in spring. Also, it is probable thatphytoplankton growth was not prevented by insufficient light in Ishikari Bay considering the values ofboth mean light intensity in the mixed layer (Im) and the mixing and euphotic depth ratio (Zmix:Zeu).
� 2013 Elsevier Ltd. All rights reserved.
1. Introduction
Coastal monitoring studies have received worldwide attentionover the last two decades due to the vulnerability of coastal systemsto natural and anthropogenic influences. Studies at confined coastalecosystems have focused on water quality and pollution problemsarising largely from human activities. In contrast, exposed coastalareas are generally not very sensitive to pollution due to the shortwater retention times that usually characterize such systems (Clark,2001). Long-term monitoring of primary productivity is importantbecause it is one of the essential variables necessary to understand
marine ecosystems and biogeochemistry. Marine primary produc-tivity is a key metric of ecosystem health and carbon functioning,and it is also commonly a function of phytoplankton biomass andincident solar flux and a scaling parameter that accounts for vari-ations in algal physiology. The magnitude and variability inphytoplankton productivity can strongly affect the production ofmarine living resources. It is therefore necessary to understand theenvironmental factors that drive primary productivity and theaccumulation of phytoplankton biomass in coastal waters. Factors,such as currents, winds, light, water temperature, and nutrientinputs, have all been identified as potentially important modulatorsof productivity in coastal waters (Morais et al., 2009; Barbosa et al.,2010; Domingues et al., 2012).
Phytoplankton biomass and primary productivity data havebeen extensively accumulated from the subarctic North Pacific bytime-series observation studies. In the western subarctic NorthPacific, primary productivity and phytoplankton structure have
* Corresponding author. Department of Fisheries and Centre for Environment andScience Education (CESE), Lagos State University, Ojo, Lagos, Nigeria.
E-mail addresses: [email protected], [email protected](J.I. Agboola).
Contents lists available at SciVerse ScienceDirect
Estuarine, Coastal and Shelf Science
journal homepage: www.elsevier .com/locate/ecss
0272-7714/$ e see front matter � 2013 Elsevier Ltd. All rights reserved.http://dx.doi.org/10.1016/j.ecss.2013.03.008
Estuarine, Coastal and Shelf Science 127 (2013) 12e23

Author's personal copy
been measured at various locations and during different seasons(Odate and Maita, 1988/89; Shiomoto and Maita, 1990; Odate andFuruya, 1995; Shiomoto et al., 1998; Shiomoto, 2000). However,the shortage of autumnal and winter observations in the westernNorth Pacific and the lack of time-series sites for the westernsubarctic North Pacific have been reported reasons for the limitedunderstanding of the complete seasonality of biological produc-tivity in these systems (Imai et al., 2002).
The time-series observations at station KNOT (44�N, 155�E) inthe western subarctic North Pacific Ocean have provided importantinformation about the seasonal changes in biological productivityand phytoplankton community structure. However, in coastal sys-tems around the western subarctic North Pacific, there is still adearth of published information on this subject. We thereforeconducted a time-series sampling program as part of a study on thedynamics of primary production processes in Ishikari Bay, a sub-arctic, oligotrophic system.
Despite its location in a subarctic region, the Ishikari Bay isconsidered because of an inflow of the Tsushima warm current,despite its location in a subarctic region (Yoshida et al., 1977).However, it receives a nutrient flux from the Ishikari River, thesecond largest river in this catchment area of Japan. Seasonalchanges in riverine nutrients, the distribution of chlorophyll a at 26gridded sampling stations in Ishikari Bay, and the influence of anearby port on phytoplankton biomass (chlorophyll a) build-uphave been reported previously (Agboola et al., 2009, 2010).
In the present study, we aimed to elucidate the environmentaldrivers of phytoplankton biomass and production at a station inIshikari Bay, outside the direct influence of riverine nutrient flux orother anthropogenic impact. We present here a 16-month period ofprimary productivity and chlorophyll a concentration, along withrelated changes in several biogeochemical variables (dissolvedinorganic carbon [DIC], concentration of dissolved inorganic mac-ronutrients, hydrogen ion concentration [pH], dissolved oxygen[DO], particulate organic carbon [POC], particulate organic nitrogen[PON], dissolved organic carbon [DOC], and dissolved organic ni-trogen [DON]). This study revealed that bottom-upwelling of
nutrients resulting from wind-driven mixing may have been asignificant source of nutrient input in this oligotrophic coastalsystem.
2. Materials and methods
2.1. Study area and sampling
Time-series observations were conducted at 43� 11.40 N,141� 2.30
E in Ishikari Bay off the Otaru coast (approximately 30 km from theIshikari River mouth and ca. 17 m in depth) in western Hokkaido,Japan (Fig. 1). A total of 16 samplings were conducted betweenSeptember 2006 and December 2007, monthly or bi-weekly(September 2006 and March 2007), except in June and November2007. The water samples were collected at the surface (1 m depth)and at the bottom (15 m depth) of thewater column in acid-cleaned10-L carboys and a 5-L Teflon-coated Lever action Niskin bottle sus-pended on a Kevlar line (S.E. Fitzwater et al.,1982). Physical variables(temperature, salinity, sigma T, Photosynthetically Active Radiance(PAR), and depth) weremeasured in situ by deploying a CTD profiler(AST-1000PK, Alec Electronics Co. Ltd.) and a PAR sensor (LI-193SB,Li-Cor) before mid-day.
Biogeochemical variables (dissolved inorganic carbon [DIC],dissolved inorganic nitrogen [DIN], hydrogen ion concentration[pH], dissolved oxygen [DO], phosphate [PO4], nitrate [NO3], silicicacid [Si(OH)4], particulate organic carbon [POC], particulate organicnitrogen [PON], dissolved organic carbon [DOC], and dissolvedorganic nitrogen [DON]) were measured in the laboratory induplicate. Concentration of chlorophyll a (as a proxy for phyto-plankton biomass), primary production, and phytoplankton growthrate (m) were determined to provide measurements of biologicalproductivity.
2.2. Underwater irradiance
Underwater irradiance was measured using a PAR sensor. Ver-tical profiles of PAR intensity were determined during nine out of
Fig. 1. Map of study area indicating the time series station at 43�N, 141�E in the western Hokkaido coast, Ishikari Bay, Japan.
J.I. Agboola et al. / Estuarine, Coastal and Shelf Science 127 (2013) 12e23 13

Author's personal copy
the 16 sampling occasions. The total diffuse attenuation coefficient,kd for downward irradiance was determined from Eq. (1):
EdðzÞ ¼ Edð0Þe�kdz (1)
where EdðzÞ and Edð0Þ are the values of downward photosyntheti-cally active radiation (PAR, 400e700 nm) at depth z(m) and justbelow the surface, respectively. The above equation is more satis-factory for monochromatic light but it can be used for a broadwaveband as a useful approximation (Kirk, 1986). Mean light in-tensity in the mixed layer for each sampling dates (Immmol photons m�2 s�1) was subsequently calculated according toEq. (2):
Im ¼ Io�1� eð�KeZmÞ
�ðKeZmÞ�1 (2)
where Zm (m) represents the depth of the mixed layer (Riley,1957; Domingues et al., 2012). The mixing layer ðZmÞ wasdetermined as the surface layer where sigma-t variations were<0.2 (Kudo et al., 2009) and varied for each of the sampling datesbetween 4.0 and 16. The value of the attenuation coefficient Kdwas used for calculating the euphotic zone depth ðZeu mÞ,defined as depth level with 1% of surface irradiance (Kirk, 1986).The ratio of mixing depth: euphotic depth ðZmix : Zeu Þ proposedby Cloern (1987) was used as proxy for light limitation. It isgenerally considered that for ðZmix : Zeu Þ values higher than 5,the development of phytoplankton blooms is prevented giventhat the cells will spend long period below the euphotic zones(Domingues et al., 2012).
2.3. Dissolved inorganic macronutrients
Duplicate water samples for nutrients were filtered using a 0.7-mm GF/F glass fiber filter and were collected in 10-mL tubes andstored frozen at�30 �C until analysis for NO3, NH4, PO4, and Si(OH)4in the laboratory (Parsons et al., 1984). Dissolved inorganic nitrogen(DIN) represents the sum of NO3, NH4 and NO2. The concentrationsof the dissolved inorganic macronutrients were determined using acontinuous flow nutrient analyzer (BRAN þ LUEBBE, QuAAtro).Detection limits were estimated at approximately 0.01 mMbased onthree times the standard deviation of the lowest concentrations ofthe samples. We compared concentration and molar ratios of dis-solved inorganic macronutrients with published criteria to assesspotential nutrient limitation (Dortch and Whitledge, 1992; Justic etal., 1995a, b), stoichiometric criteria of DIN, P and Si for phyto-plankton growth e Si:N:P ¼ 16:16:1 (Redfield et al., 1963;Brzezinski, 1985; Rahm et al., 1996) and phytoplankton half satu-ration constant. As suggested by Justic et al. (1995a, b), stoichio-metric limitation was determined according to the followingcriteria: (1) P limitation, if Si:PO4 > 22, DIN:PO4 > 22 and an esti-mated threshold value of 0.1 mM; (2) N limitation, if DIN:PO4 < 10,Si:DIN > 1 and an estimated threshold value of 1 mM; and (3) Silimitation, if Si:PO4 < 10, Si:DIN < 1 and an estimated thresholdvalue of 2 mM.
2.4. DOC and DON
Subsamples for DOC and DON analysis were filtered throughWhatman GF/F filters, and the filtrate was collected into acid-cleaned, pre-combusted glass bottles. The filtrate was dispensedinto glass ampoules that were subsequently sealed and frozenat �30 �C until analysis. DOC concentrations were measured by thehigh-temperature catalytic oxidation method using a ShimadzuTOC-5000A Total Organic Carbon analyzer. Sample measurements
were repeated from three to five times until CV (coefficient ofvariation) falls within 2% (Ogawa et al., 1999).
The DON concentration was determined by subtracting thevalue of dissolved inorganic nitrogen (DIN), that is, the nitrate, ni-trite, and ammonium concentrations, from the value of the totaldissolved nitrogen (TDN) concentration detected by a YANACO ECL-880US NOx analyzer for samples from the outlet of the TOCanalyzer.
2.5. POC and PON
Particulate organic carbon (POC) and nitrogen (PON) samples(500 mL) were filtered onto pre-combusted Whatman GF/F glassfiber filters (nominal pore size 0.7 mm) under low vacuum pressure(<100 kPa) or gravity. The samples were frozen until analysis andthenwere thawed, dried, fumed with concentrated HCl for 6 h, andre-dried. Particulate organic carbon and nitrogen were determinedwith a CHN analyzer (FISONS, NA 1500), according to the equip-ment instruction manual. There were no replicates for each mea-surement but based on the replicates of standard material (n ¼ 10),CV was 0.52 and 1.34% for C and N, respectively.
2.6. Phytoplankton biomass and primary productivity
Chlorophyll a (Chl a), used as a proxy for phytoplankton biomass(but see Domingues et al., 2008) was measured for total and size-fractionated Chl a. An aliquot (150 mL) of water was filtered,respectively, through Whatman GF/F (25 mm diameter, nominalpore size 0.7 mm), and 2- and 10-mmpore-sizeWhatman Nucleporepolycarbonate filters using parallel (separate) filtration under lowvacuum pressure (<250 mm Hg) or gravity. After filtration, chlo-rophyll a was immediately extracted by immersing the filter in N,N-dimethylformamide (Suzuki and Ishimaru, 1990) and was pre-served at �30 �C until further analysis by fluorometry. Chlorophylla concentrations were determined using a HITACHI F2000 fluo-rescence spectrophotometer, according to the method of Parsonset al. (1984).
Primary production was determined from 13C-NaHCO3 uptake(Hama et al., 1983), using a clean sampling technique (S.E.Fitzwater et al., 1982). An aliquot of 13C NaHCO3 (99 at% 13C;Shoko Corporation Limited, Japan) solution (0.2 M) was spiked tothe samples, equivalent to about 10% of the total inorganic carbonin the seawater. Seawater samples were analysed for total and>10-mm phytoplankton production. One bottle was used for thezero time and two bottles for 24-h in situ incubation carried out bysuspension in the water column (0e1 m) under prevailing lightconditions. Zero-time samples were filtered through 25-mmWhatman GF/F filters, pre-combusted at 450 �C for 4e5 h undergentle aspiration (<100 kPa), and the filtered samples wereimmediately frozen and stored at�30 �C until isotope analysis. Theincubated samples were also filtered, similar to the zero-timesample. The filters were freeze-dried, and then inorganic carbonwas removed by an acid treatment in an HCl vapor bath for 4e5 h.Finally, the filters were completely dried in a freeze dryer. Theisotopic ratios of 13C to 12C were determined by a combined systemof an EA1112 Elemental Analyzer and a DELTA V Conflo MassSpectrometer. Primary productivity was calculated according toHama et al. (1983).
In this study, the working definitions for the size fractions wereas follows: microphytoplankton: the plankton retained on a 10-mmfilter; nanophytoplankton: the plankton passing through 10-mmfilter but retained by 2-mm filter; and picophytoplankton: the ma-terial that passed through 2-mm filter but was retained on 0.7-mmWhatman GF/F filter.
J.I. Agboola et al. / Estuarine, Coastal and Shelf Science 127 (2013) 12e2314

Author's personal copy
2.7. Phytoplankton growth rate (m)
Phytoplankton growth rate (m) was estimated by dividingchlorophyll a (Chl a)-normalized photosynthesis (PB) by thephytoplankton carbon (C)-to-Chl a ratio (C:Chl a), yielding an es-timate of phytoplankton m. According to Marañón (2005), an esti-mate of m (d�1) attainable by a phytoplankton assemblage can becalculated according to Eq. (3)
m ¼ PB=C : Chl a (3)
where PB is the photosynthesis rate per unit of Chl a (mg C [mg Chla]�1 d�1), and C:Chl a is the phytoplankton carbon-to-Chl a ratio(mg C [mg Chl a]�1). We assumed that most of the POC were livingcarbon, and the POC value was used as phytoplankton carbon. Insupport of this choice, a Model II least squares linear regressionusing a geometric mean approach and a plot obtained a significantcorrelation between the dependent variables: Chl a and POC(Table 1).
2.8. Statistical analysis
Seasonal scale was applied to classify and analyze the data ob-tained from this study except for Kd, Im and Zmix : Zeu . The 16sampling dates from September 2006 to December 2007 weredivided into four seasons: spring (MarcheMay), summer (JulyeAugust), autumn (SeptembereNovember), and winter (DecembereFebruary). Sampling was not conducted in June or November 2007.Physical, chemical, and biological data were classified accordinglyand were compared for variability using one-way analysis of vari-ance (ANOVA), whereas Duncan’s multiple range test was used for
separation of means. We assumed a normally distributed variablessince observations were maintained at same geographical locationthroughout the sampling periods. Also, to better explain higherordered interaction expected in this study, Pearson’s productmoment correlation coefficient was used to evaluate relationshipsamong the variables.
3. Results
3.1. Environmental variables
The overall seasonal mean� SD values of the physical, chemical,and biological variables are presented in Table 2. The vertical profileof temperature across the sampling period was homogenous(Fig. 2a), whereas the salinity and sigma-t profiles showed inter-mittent mixing of bottom waters with the surface, especially insummer and autumn (Fig. 2b and c), indicating vertical mixing ofthe water column. The surface temperature ranged from 3.77 to23.13 �C (Fig. 3a), with lower values in the winter and spring andthe maximum value in the summer. Salinity was nearly homoge-nous across the sampling period, with a range of 31.00e33.65(Fig. 3b). Temperature values were significantly different(P< 0.001) across the seasons; salinity values were not significantlydifferent (P > 0.05). The dissolved oxygen concentration at thesurface ranged between 5.27 and 7.37ml L�1, (Fig. 3c), with a higherconcentration (>6.40 ml L�1) during winter and spring (Table 2).Seasonal pH values were the highest in summer (8.04 � 0.22)(Table 2 and Fig. 3d). Dissolved oxygen variation across seasons washighly significant (P < 0.001). In contrast, there was no significantdifference (P > 0.05) in the pH values across seasons.
Suspended particulate matter (SPM) ranged from 1.40 to19.40 mg L�1. The highest values were observed in spring(7.25 � 8.20 mg L�1) and autumn (6.80 � 5.71 mg L�1) (Table 1).Mean light intensity in the mixed layer (Im) varied significantly andranged between 76.87 mmol photons m�2 s�1 (March) and1286.97 mmol photons m�2 s�1 (May) with a mean value of780.54 � 457.04 mmol photons m�2 s�1, considering the wholesampling period (Table 3). The euphotic depth in Ishikari Bay wasgenerally higher than the mixing depth except in early March, May
Table 1Model II least squares linear regression results of Chl a and POC plot.
Model II Slope Y-axis intercept Correlationcoefficient
Geometric meanapproach
37.96 � 5.26 172.08 � 29.26 0.875
‘Chl a’ on the X-axis and ‘POC’ on the Y-axis. n ¼ 16; mean � SD.
Table 2Surface water seasonal mean � SD values of physical, chemical and biological variables and overall mean � SD values of light attenuation coefficient (Kd m-1), mean lightintensity in the mixed layer (Im mmol photons m�2 s�1), and mixing depth to euphotic depth ratio (Zmix:Zeu) during September 2006eDecember 2007 in the Ishikari Bay atlocation 43�N, 141�E.
Parameters Minemax Season
Autumn Winter Spring Summer
Temperature (�C) 3.8e23.8 18.8 � 3.7 4.7 � 1.1 7.6 � 4.3 21.5 � 3.3Salinity 31.0e33.9 32.6 � 0.9 32.7 � 0.6 32.8 � 0.2 33.4 � 0.8pH 7.5e8.2 7.9 � 0.3 7.9 � 0.1 7.8 � 0.2 8.0 � 0.2DO (mg l�1) 5.3e7.4 5.6 � 0.2 6.9 � 0.1 7.1 � 0.1 6.1 � 0.4NO3 (mM) 0.0e5.9 1.5 � 2.3 4.6 � 0.9 4.2 � 2.8 0.20 � 0.11NH4 (mM) 0.0e24.5 1.7 � 2.2 10.3 � 9.6 3.8 � 3.7 0.61 � 0.9PO4 (mM) 0.04e1.02 0.2 � 0.1 0.6 � 0.3 0.3 � 0.1 0.1 � 0.0Si(OH)4 (mM) 1.0e22.1 5.92 � 4.7 17.9 � 3.8 12.7 � 6.8 2.02 � 1.1DIC (mg C l�1) 16.1e32.7 24.3 � 5.7 23.8 � 2.1 23.3 � 2.3 24.1 � 0.5SPM (mg l�1) 0.4e19.2 6.8 � 5.7 2.5 � 0.9 7.3 � 8.2 5.6 � 5.9Chl a (mg l�1) 0.2e15.5 5.9 � 6.0 0.8 � 0.5 2.1 � 1.7 4.7 � 0.4Primary production (mg C l�1 d�1) 2.8e543.8 138.9 � 202.6 7.0 � 5.2 71.3 � 77.6 229.2 � 113.4Assimilation index (mg C mg�1 Chl a d�1) 3.0e62.0 20.9 � 10.6 9.7 � 4.9 33.1 � 17.6 47.7 � 20.3Phytoplankton growth rate, m (d�1) 0.02e0.80 0.28 � 0.23 0.05 � 0.05 0.19 � 0.17 0.58 � 0.30POC:Chl a 38.8e718.8 114.3 � 88.4 358.6 � 316.4 249.6 � 171.1 84.4 � 9.1
Overall mean � SD n-valueKd (m�1) 0.34 � 0.27 9Im (mmol photons m�2 s�1) 780.5 � 457.0 9Zmix:Zeu 1.01 � 0.78 9
N-values: autumn (n ¼ 6), winter (n ¼ 4), spring (n ¼ 4), summer (n ¼ 2).
J.I. Agboola et al. / Estuarine, Coastal and Shelf Science 127 (2013) 12e23 15

Author's personal copy
and December (Table 3). DIC concentrations were not significantlydifferent (P > 0.05) across seasons.
3.2. Nutrient concentration and relative ratio
Nutrient concentrations (DIN, PO4, Si(OH)4) were statisticallydifferent (P < 0.05) across seasons, whereas the differences innutrient ratios (N:P, Si:P, Si:N) were not statistically significant(P > 0.05) across seasons. The seasonal mean � SD concentration ispresented in Table 2.
Dissolved inorganic nitrogen (DIN: NH4 þ NO2 þ NO3) concen-trations ranged between 0.01 mM (below the limit of detection) and29.6 mM (Fig. 4e); the highest values were in winter and spring,whereas they were depleted through the summer period (Table 2).Across the seasons, the percentage contribution of NO3 (4.3 mM) toDIN (8.1 mM) at the surface was highest in the spring (53%), closely
followed in autumn (47%). The relative surface maximum of DIN inwinter was due to high NH4 concentration (24.5 mM) in January(Fig. 4b and e). Aside from this peak, NH4
þ concentrations were notsignificantly different (P > 0.05) across the sampling period.
Dissolved inorganic phosphate (PO4) varied between 0.04 mM inJuly (summer) and 1.02 mM in January (winter) (Fig. 4c) (Table 2).Like other nutrients, silicic acid concentration peaked in winter,followed by spring, and abruptly decreased in summer (from 22.1to 1.0 mM in September) (Fig. 4d).
The N:P ratio exhibited seasonal variations, with moderate ra-tios in autumn (13) and summer (15) and high ratios in winter (25)and spring (24) (Fig. 5a). In the autumn and summer seasons, theN:P ratios were close to the 16:1, an optimal algal growth ratio asindicated by the Redfield ratio (Redfield et al., 1963). Using thestoichiometric limitation criteria of Justic et al. (1995a,b) for N:P, Pwas limited in October (22.18, 28.16), December (23.41), January
Fig. 2. Vertical profiles of temperature (a), salinity (b) and sigma-t (c) during the time series observations in Ishikari Bay. Dark arrows indicate sampling depths (1 and 15 m).
J.I. Agboola et al. / Estuarine, Coastal and Shelf Science 127 (2013) 12e2316

Author's personal copy
(29.19), February (25.81), March (28.24), April (41.58), August(26.80) and December (23.41), whereas Nwas limited in September(0.07, 0.74), May (6.82) and July (2.90). Seasonal patterns of the Si:Pratios were similar to the N:P ratios. The Si:P ratios were largely>16:1 across sampling seasons. The Si:N ratios varied seasonallyand were largely greater than 1:1 across seasons.
In Fig. 5b, the molar quotients between the concentrations ofpotentially limiting nutrients are presented in a logarithmic plot(log N:P vs. log Si:N), along with the lines for Si:N¼ 1, N:P¼ 16, andSi:P ¼ 16. The atomic N:P, Si:P, and Si:N at the time-series locationin Ishikari Bay exhibited seasonal variations in stoichiometricnutrient limitation (Fig. 5b). Nitrogen appeared to be the mostlimited nutrient, with an N:Pmolar ratio of<16 in September (0.07,
0.74, 11.42), May (6.82) and July (2.90). In this study, silicic acid wasnot considered potentially limiting, as the Si:N molar ratios wereoften >1, except in January (0.7). However, concentration was<2 mM in July (1.22 mM), suggesting the only period of DSi potentiallimitation.
3.3. Dissolved and particulate organic matter
Particulate organic carbon was significantly related to particu-late organic nitrogen (r ¼ 0.987; P < 0001; n ¼ 15) (Fig. 6 andTable 4). No significant relationship was found between DOC andDON. The POC:PON ratio in summer was 6.3, slightly lower than theratios of 7.5 apiece for winter, spring and autumn seasons. Except insummer season when ratio was close to the C:N of 6.6, otherobserved seasonal ratios were greater than the Redfield ratio. TheDOC:DON ratios were w2e25 times higher than the Redfield C:Nratio line (6.6) in the sampling periods.
The POC and PON concentrations were not significantlydifferent (P < 0.01) with season. Also, DOC and DON were notsignificantly different (P > 0.05) across seasons.
3.4. Phytoplankton biomass (Chl a)
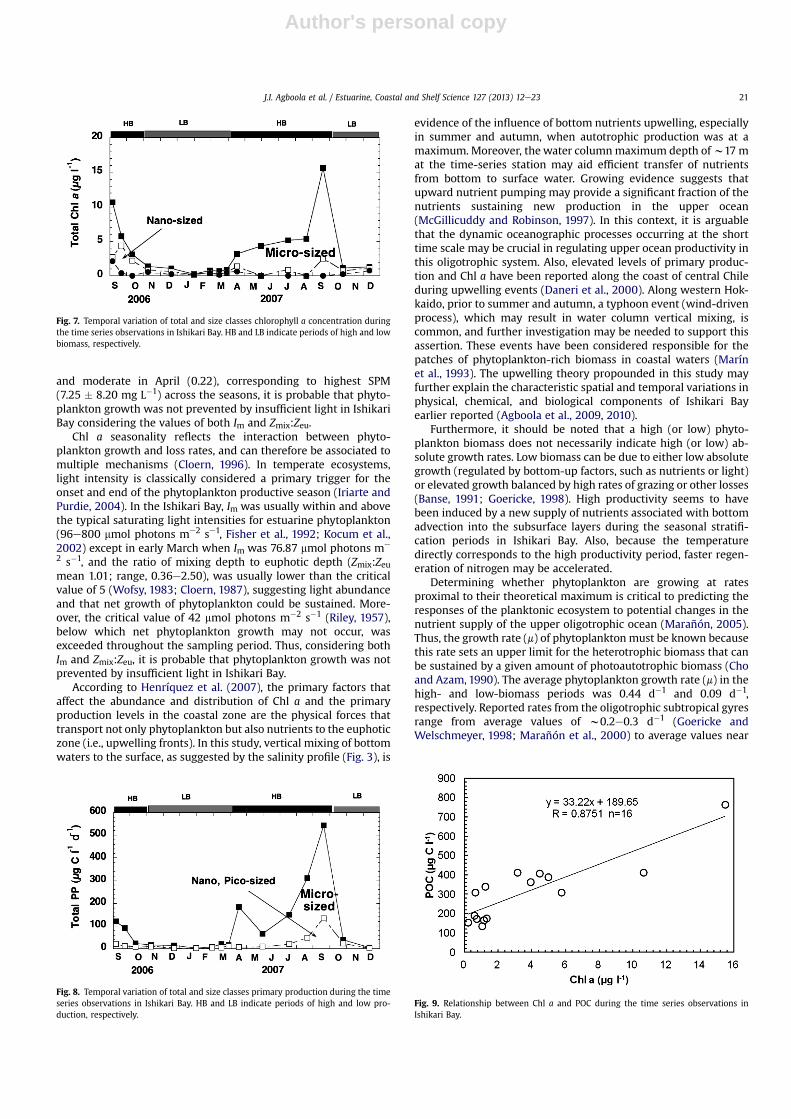
Total, micro-sized (>10 mm) and pico-sized (<2 mm) Chl a con-centrations peaked at the onset of this study in September 2006and in September 2007, whereas, nano-sized fraction (2e10 mm)Chl a peaked only peaked in October 2006 and in September 2007(Fig. 7a and b).
Micro-sized phytoplankton dominated and accounted for asignificant proportion of the phytoplankton biomass in the spring(71.4%), summer (97.6%), and autumn (67.3%) seasons (Fig. 7b). Inthe Ishikari Bay, the total and micro-sized fractions contributed>60% of the phytoplankton biomass during the summer andautumn seasons (figure not shown).
Total Chl a was significantly related to the micro-sized phyto-plankton contribution (r ¼ 0.876, P < 0.001, n ¼ 16). Similar to totalChl awhich exhibited strong correlation with temperature, pH andall nutrients, micro-sized phytoplankton only showed significantcorrelation with temperature contribution (r ¼ 0.602, P < 0.01,n ¼ 16), pH (r ¼ 0.600, P < 0.05, n ¼ 16), nitrate (r ¼ �0.576,P < 0.05, n ¼ 16), and silicate (r ¼ �0.561, P < 0.05, n ¼ 16). Nosignificant relationship was found with the pico and nano-sizedphytoplankton fractions (Table 4). Chl a concentrations were notsignificantly different (P > 0.05) across the seasons using one-wayANOVA.
3.5. Primary productivity and photosynthetic variables
From Fig. 7, phytoplankton production shows 2e3 clear peaks,including a peak during September 2006. The annual cycle ofprimary productivity was similar to that of Chl a, with thehighest production from summer to autumn, peaking at543.8 mg C L�1 d�1 in September 2007, and a minimum value of2.79 mg C L�1 d�1 in winter (January). Thus, carbon assimilation(13C uptake) closely followed the same temporal trend as Chl a inthis study. Total and micro-sized primary production showedclear peaks in April 2006 and September 2006/2007. Pico- andnano-sized fractions combined only peaked in September 2007(Fig. 8a and b).
Generally, micro-sized primary production contributed >50%to the total primary production across the seasons. The micro-sized fraction dominated and accounted for a significant pro-portion in the winter (50.3%), spring (70.7%), summer (85.5%),and autumn (67.0%) seasons (Fig. 8b). Also, the micro-sized pri-mary production in spring, summer, and autumn accounted for
Fig. 3. Temporal variations of some physico-chemical parameters in surface watersduring the time series observations in Ishikari Bay.
J.I. Agboola et al. / Estuarine, Coastal and Shelf Science 127 (2013) 12e23 17

Author's personal copy
>60% of the production in the sampling periods (figure notshown).
Total primary production was significantly correlated withmicro-sized primary production (r¼ 0.995; P< 0.0001; n¼ 16) andthe pico-plus nano-sized fractions (r ¼ 0.929; P < 0.0001; n ¼ 16).Similar to total primary production which exhibited strong corre-lation only with temperature, pH and SPM, micro-sized phyto-plankton contribution showed significant correlation withtemperature (r ¼ 0.609, P < 0.01, n ¼ 16), pH (r ¼ 0.686, P < 0.001,n ¼ 16), SPM(r ¼ 0.626, P < 0.01, n ¼ 16), and phosphate(r¼�0.503, P< 0.05, n¼ 16). Pico-plus nano-sized fraction showedsignificant correlation only with temperature (r ¼ 0.539, P < 0.05,n ¼ 16) (Table 4). Although there was a distinct difference in sea-sonal mean values, similar to Chl a, the primary production valueswere not significantly different (P > 0.05) across the seasons usingone-way ANOVA.
The phytoplankton growth rate m was not significantly different(P > 0.05) across seasons. In this study, the maximum phyto-plankton growth rate (m) was attained in the summer (0.58 d�1)and the minimum in the winter period (0.05 d�1) (see Table 2),suggesting possible seasonal influence on environmental driversfueling phytoplankton growth.
Assimilation index-chlorophyll a (Chl a)-normalized photosyn-thesis (PB) showed significant seasonal variation (P < 0.05) with amaximum PB value in the summer (47.7 mg C mg�1 Chl a d�1) and aminimum in the winter (9.7 mg C mg�1 Chl a d�1) (Table 2). Nosignificant variation in phytoplankton assimilation index wasobserved between biomass periods (P > 0.05).
3.6. POC:Chl a ratio
The POC concentration ranged from 762.0 mg C l�1 in September2006 to 134.2 mg C l�1 in December 2006. The particulate car-bon:Chl a ratio was lower in the summer season (Table 2), with aminimum (38.8) occurring in September 2006. The living phyto-plankton carbon concentration estimated from the POC:Chl a ratio(mean value, 76.1�31.8) and the total POC values were in the rangeof 309e762 mg C L�1 (mean ¼ 436.1 �148.4 mg l�1) in the period ofhigh biomass. POC was significantly related to Chl a (r ¼ 0.875;P < 0.001; n ¼ 16) (Table 3).
4. Discussion
The data reported in this study provides complete seasonalityfor the phytoplankton productivity and environmental drivers onthe western Hokkaido coast, at Ishikari Bay. The seasonal variationsin biological productivity at the lower trophic level at this time-series station were complex and were driven by a variety of phys-ical, chemical, and biological factors.
Table 3Pearson’s correlation matrix of some surface water variables during the time series observation in Ishikari Bay.
Chl a PP DIN PO4 Si(OH)4 POC PON DOC DON Temperature Season
Chl a 1PP 0.846** 1DIN �0.537* �0.390 1PO4 �0.526** �0.494 0.955** 1Si(OH)4 �0.631** �0.456 0.809** 0.774** 1POC 0.875** 0.893** �0.458 �0.522* �0.556* 1PON 0.881** 0.932** �0.433 �0.528* �0.519* 0.982** 1DOC 0.335 0.320 �0.096 �0.136 �0.130 0.199 0.268 1DON 0.489 0.182 �0.860** �0.686* �0.818** 0.403 0.426 �0.041 1Temperature 0.706** 0.606* �0.717** �0.736** �0.843** 0.613* 0.608* 0.466 0.623* 1Season �0.226 0.071 0.017 �0.107 0.026 0.028 0.088 �0.064 0.044 �0.178 1
*Correlation is significant at the 0.05 level (2-tailed). PP ¼ Primary Production.**Correlation is significant at the 0.01 level (2-tailed).
Fig. 4. Temporal variations of nitrate (a), ammonium (b), phosphate (c), silicate (d) anddissolved inorganic nitrogen during the time series observations in Ishikari Bay.
J.I. Agboola et al. / Estuarine, Coastal and Shelf Science 127 (2013) 12e2318

Author's personal copy
4.1. Physical
When the temperature was high in autumn (18.7 �C) andsummer (21.5 �C), there was a direct corresponding increase inautotrophic production. The micro-sized fraction of Chl a(r ¼ 0.730; P < 0.001; n ¼ 16) and production (r ¼ 0.606; P < 0.01;n ¼ 16), which dominated and accounted for >80% of the totalautotrophic production in this study were positively related totemperature and pH, and negatively related to nutrients. Incontrast, temperature was negatively related to all nutrientsmeasured (Tables 3 and 4).
4.2. Nutrients concentration and molar ratios
Nutrient concentrations (DIN, PO4, Si(OH)4) were significantlydifferent (P < 0.05) across seasons and biomass periods, whereasthe nutrient ratios (N:P, Si:P, Si:N) were not significantly different(P > 0.05) across seasons and biomass periods. According to Dortchand Whitledge (1992), deviations from Redfield ratios are consid-ered indices of potentially limiting factors. The stoichiometric ratiois an indication of a suggested limitation, and a probable limitationis assessed if the nutrient concentration is below a thresholdlimiting nutrient uptake. In this study, the data for inorganic nu-trients revealed a seasonal low (13) and high (25) DIN:PO4 ratio,
respectively, in autumn and winter, and a seasonal low (30) andhigh (37) Si:PO4 ratio, suggesting that phytoplankton growth waspossibly limited by either nitrate or phosphate. However, using thecriteria of Justic et al. (1995a,b), PO4 appears to be limiting only insummer and autumn seasons when production was at maximum,whereas, nitrogen seems limiting across the seasons.
Although, ambient concentrations of PO4 were generally>0.1 mM, except in summer when the values were lower (0.04e0.06 mM, range) than the threshold value (0.1 mM) estimated byJustic et al. (1995a,b), suggesting PO4 uptake in summer-autumnwhich accounted for >60% of the total phytoplankton biomassand production for the spring, summer and autumn seasons com-bined. Typical of most oligotrophic waters, phosphate concentra-tions were generally low and higher during the winter whencompared with the summer values (Badran and Foster, 1998;Rasheed et al., 2002). Thus, phosphate physiology may be ofimportance to the dynamics of phytoplankton in Ishikari Bay andthe western coastal waters of Hokkaido. Although, marine phyto-plankton take up all available phosphate in excess of requirementssuch that cellular P does not reflect what is needed for cell growthand division, here wemake a case for a potential limiting conditionand not an actual condition. It has long been known that microalgalcells are capable of “luxury uptake,” whereby surplus P is accu-mulated in excess of that required for immediate growth (Rhee,
(a)
13.32
24.74 24.33
14.85
28.40
33.24
41.8538.44
18.13
1.42 2.435.87
0
10
20
30
40
50
60
Autumn Winter Spring Summer
Nu
trie
nts
m
olar ra
tio
N:PSi:PSi:N
(b)
0.01
0.1
1
10
100
1000
0.01 0.1 1 10 100 1000
N:P molar ratio
Si:N
m
olar ratio
AutumnWinterSpringSummer
N<P<Si
P<N<Si
Si<P<N
N<P<Si
Fig. 5. Seasonal mean � SD of nutrient molar ratios (a) and Si:N:P molar ratio trends (b) during autumn, winter, spring and summer seasons in the Ishikari Bay during the timeseries observations. Diagonal line: aggregated ratio (Si:N:P ¼ 16:16:1). Vertical and horizontal lines: Redfield et al. (1963) ratio (N:P) and Brzezinski (1985) ratio (N:Si), respectively.Diagonal line: aggregated ratio (Si:N:P ¼ 16:16:1).
J.I. Agboola et al. / Estuarine, Coastal and Shelf Science 127 (2013) 12e23 19

Author's personal copy
1973; Tilman and Kilham, 1976). We also, acknowledge that not allphytoplankton cells are able to use luxury consumption of nutrientsand there is an ample variability in Ks values, both at intra- andinter-specific levels. Here, we concluded that except in summer,phosphate concentrations werewithin the reported half-saturation
constants for P uptake by planktonic populations (Km¼ 0.1e0.2 mM;Fisher et al., 1999).
Ratios of Si:N might also be important in structuring phyto-plankton communities. Whereas diatom blooms tend to occur atSi:N ratios � 1, most harmful species (e.g., flagellates or di-noflagellates) bloom at lower ratios (Kristiansen and Hoell, 2002).The Si:N ratios at our time-series station were highly variable,reaching as high as 67. In all of the observations, the Si:N ratio was>1, except in January, when value was 0.67, so, following thecriteria of Justic et al. (1995a,b), silicic acid was never a limitingcondition. We speculate a diatom dominated phytoplankton com-munity in the summereautumn and spring seasons when phyto-plankton biomass and production were high.
The nutrient ratios indicated that stoichiometric N limitationdominated in the high phytoplankton production and biomassperiods, corresponding largely to the autumn and summer seasons.The low nitrate and ammonium concentrations in the surface wa-ters, especially in the high phytoplankton biomass and productionbiomass periods, may be explained by phytoplankton uptake andstability of the water column. Supporting this assertion, ambientnitrate concentration was only lower than the threshold value(1.0 mM) suggested by Justic et al. (1995a,b) in summer season(0.20 � 0.11 mM).
4.3. Phytoplankton biomass and production
Phytoplankton biomass and productionwere highest in summerand autumn due to an absence of thermohaline stratification, highnutrient uptake (resulting in the observed low nutrient concen-tration in summer and autumn), the temperature, and light avail-ability. In essence, more production due to high nutrient uptake,exactly during the period of minimum nutrients was observed.However, in winter, wind-mixing, rapid flushing, reduced irradi-ance, and low temperatures resulted in low phytoplankton biomassand production. Despite some decreases in vertical mixing and anincrease in temperature, the typical spring bloom of temperateareas was not observed at this time-series station. Therefore, wehypothesize that, in addition to bottom-advection of nutrients bywind-driven mixing, zooplankton grazing or other losses might bea crucial factor in controlling the phytoplankton biomass and pro-duction, particularly in spring, during the initial stage of algalblooms, when phytoplankton start to respond to the increasinglight, temperature, and nutrient influx from tidal mixing and bot-tom upwelling. Even though Kd value was highest in March (1.00)
Fig. 6. Relationships between (a) particulate organic carbon and particulate organicnitrogen, and between (b) dissolved organic carbon and dissolved organic nitrogenduring time series observation in Ishikari Bay. Dark line represents the Redfield ratio ofC:N of 6.6. Linear regression equation represented.
Table 4Pearson’s correlation matrix of different phytoplankton size classes and some environmental variables during the time series observation in Ishikari Bay.
Variables Chlorophyll a Primary production
Total Chl a Pico Nano Micro Total PP Pico þ Nano Micro
Total Chl a 1Pico 0.256 1Nano 0.066 �0.068 1Micro 0.876** 0.089 �0.036 1Total PP 0.845** �0.138 0.082 0.766** 1Pico þ nano 0.826** �0.184 0.150 0.748** 0.929** 1Micro 0.829** �0.121 0.061 0.751** 0.995** 0.885** 1NH4 �0.405 �0.078 �0.008 �0.038 �0.292 �0.300 �0.282PO4 �0.524* 0.014 0.057 �0.222 �0.494 �0.415 �0.503*
Si(OH)4 �0.631** �0.102 0.096 �0.531* �0.456 �0.431 �0.451NO3 �0.627** �0.086 0.133 �0.576* �0.462 �0.367 �0.477SPM 0.449 �0.115 0.073 0.344 0.598* 0.445 0.626*
Temperature 0.706** 0.107 �0.110 0.602* 0.606* 0.539* 0.609*
pH 0.614* 0.370 0.083 0.600* 0.659** 0.508 0.686**
DO �0.406 �0.018 �0.025 �0.322 �0.296 �0.375 �0.266
*Correlation is significant at the 0.05 level (2-tailed). PP ¼ Primary Production.**Correlation is significant at the 0.01 level (2-tailed).
J.I. Agboola et al. / Estuarine, Coastal and Shelf Science 127 (2013) 12e2320
Author's personal copy
and moderate in April (0.22), corresponding to highest SPM(7.25 � 8.20 mg L�1) across the seasons, it is probable that phyto-plankton growth was not prevented by insufficient light in IshikariBay considering the values of both Im and Zmix:Zeu.
Chl a seasonality reflects the interaction between phyto-plankton growth and loss rates, and can therefore be associated tomultiple mechanisms (Cloern, 1996). In temperate ecosystems,light intensity is classically considered a primary trigger for theonset and end of the phytoplankton productive season (Iriarte andPurdie, 2004). In the Ishikari Bay, Im was usually within and abovethe typical saturating light intensities for estuarine phytoplankton(96e800 mmol photons me2 se1, Fisher et al., 1992; Kocum et al.,2002) except in early March when Im was 76.87 mmol photons me
2 s�1, and the ratio of mixing depth to euphotic depth (Zmix:Zeumean 1.01; range, 0.36e2.50), was usually lower than the criticalvalue of 5 (Wofsy, 1983; Cloern, 1987), suggesting light abundanceand that net growth of phytoplankton could be sustained. More-over, the critical value of 42 mmol photons m�2 s�1 (Riley, 1957),below which net phytoplankton growth may not occur, wasexceeded throughout the sampling period. Thus, considering bothIm and Zmix:Zeu, it is probable that phytoplankton growth was notprevented by insufficient light in Ishikari Bay.
According to Henríquez et al. (2007), the primary factors thataffect the abundance and distribution of Chl a and the primaryproduction levels in the coastal zone are the physical forces thattransport not only phytoplankton but also nutrients to the euphoticzone (i.e., upwelling fronts). In this study, vertical mixing of bottomwaters to the surface, as suggested by the salinity profile (Fig. 3), is
evidence of the influence of bottom nutrients upwelling, especiallyin summer and autumn, when autotrophic production was at amaximum. Moreover, the water columnmaximum depth ofw17 mat the time-series station may aid efficient transfer of nutrientsfrom bottom to surface water. Growing evidence suggests thatupward nutrient pumping may provide a significant fraction of thenutrients sustaining new production in the upper ocean(McGillicuddy and Robinson, 1997). In this context, it is arguablethat the dynamic oceanographic processes occurring at the shorttime scale may be crucial in regulating upper ocean productivity inthis oligotrophic system. Also, elevated levels of primary produc-tion and Chl a have been reported along the coast of central Chileduring upwelling events (Daneri et al., 2000). Along western Hok-kaido, prior to summer and autumn, a typhoon event (wind-drivenprocess), which may result in water column vertical mixing, iscommon, and further investigation may be needed to support thisassertion. These events have been considered responsible for thepatches of phytoplankton-rich biomass in coastal waters (Marínet al., 1993). The upwelling theory propounded in this study mayfurther explain the characteristic spatial and temporal variations inphysical, chemical, and biological components of Ishikari Bayearlier reported (Agboola et al., 2009, 2010).
Furthermore, it should be noted that a high (or low) phyto-plankton biomass does not necessarily indicate high (or low) ab-solute growth rates. Low biomass can be due to either low absolutegrowth (regulated by bottom-up factors, such as nutrients or light)or elevated growth balanced by high rates of grazing or other losses(Banse, 1991; Goericke, 1998). High productivity seems to havebeen induced by a new supply of nutrients associated with bottomadvection into the subsurface layers during the seasonal stratifi-cation periods in Ishikari Bay. Also, because the temperaturedirectly corresponds to the high productivity period, faster regen-eration of nitrogen may be accelerated.
Determining whether phytoplankton are growing at ratesproximal to their theoretical maximum is critical to predicting theresponses of the planktonic ecosystem to potential changes in thenutrient supply of the upper oligotrophic ocean (Marañón, 2005).Thus, the growth rate (m) of phytoplankton must be known becausethis rate sets an upper limit for the heterotrophic biomass that canbe sustained by a given amount of photoautotrophic biomass (Choand Azam, 1990). The average phytoplankton growth rate (m) in thehigh- and low-biomass periods was 0.44 d�1 and 0.09 d�1,respectively. Reported rates from the oligotrophic subtropical gyresrange from average values of w0.2e0.3 d�1 (Goericke andWelschmeyer, 1998; Marañón et al., 2000) to average values near
Fig. 7. Temporal variation of total and size classes chlorophyll a concentration duringthe time series observations in Ishikari Bay. HB and LB indicate periods of high and lowbiomass, respectively.
Fig. 8. Temporal variation of total and size classes primary production during the timeseries observations in Ishikari Bay. HB and LB indicate periods of high and low pro-duction, respectively.
Fig. 9. Relationship between Chl a and POC during the time series observations inIshikari Bay.
J.I. Agboola et al. / Estuarine, Coastal and Shelf Science 127 (2013) 12e23 21

Author's personal copy
(Malone et al., 1993; Quevedo and Anadó, 2001) or well above 1 d�1
(Laws et al., 1987).The strong correlation of POC with Chl a (r¼ 0.875) in this study
suggests that the living phytoplankton in POC far outweigheddetrital and bacterial biomasses (Tables 1 and 3, Fig. 9). The livingphytoplankton carbon concentrations estimated from the POC:Chla ratios in high phytoplankton biomass seasonswere in the range of39e131 were and partly within the range (30e50) suggested byParsons et al. (1984). Also, because low POC:PON ratios indicatethat the particulate organic matter is nitrogen-enriched and typicalof living material rather than detritus, a lower C:N ratio less thanthe Redfield ratio of 6.6 observed during high productivity periodsuggests that production in this oligotrophic system could aidproduction at higher trophic levels.
5. Conclusion
The annual cycle of mixing and irradiance drives a strong annualcycle of production in many oceanic ecosystems (e.g., Sverdrup,1953; Miller et al., 1991). In this study, the amplitudes of biolog-ical productivity seasonal cycles were reduced (i.e., phytoplanktonbiomass and productivity were not significantly different season-ally). In the absence of a strong mechanism of nutrient input intothis oligotrophic system, we conclude that bottom-advection ofnutrients resulting from wind-driven mixing may still be a signif-icant source of nutrients, and zooplankton grazing or other lossesmight be a crucial factor in controlling the phytoplankton biomassand production, particularly in spring. This conclusion further re-veals the distinct seasonal variation of phytoplankton productivityin the oligotrophic, subarctic coastal system of the Ishikari Bayearlier reported (Agboola et al., 2009, 2010). However, circulationdynamics, incident solar flux and a scaling parameter that accountsfor variations in phytoplankton physiology needs to be furtherstudied in this oligotrophic system.
Acknowledgement
We sincerely thank three anonymous reviewers for their helpfulcomments on an earlier draft of this paper. We also appreciate theassistance of colleagues from the Geological Survey Institute,Hokkaido, Japan during our samplings.
References
Agboola, J.I., Yoshi, S., Kudo, I., 2009. Seasonal change of riverine nutrients anddistribution of chlorophyll a in Ishikari Bay, subarctic oligotrophic coastalenvironment of Japan. Japanese-French Oceanographic Society Journal, La Mer47, 33e49.
Agboola, J.I., Uchimiya, M., Kudo, I., Kido, K., Osawa, M., 2010. Dynamics of pelagicvariables in two contrasting coastal systems in the western Hokkaido coast offOtaru port, Japan. Estuarine, Coastal and Shelf Science 86 (3), 477e484.
Badran, M.I., Foster, P., 1998. Environmental quality of the Jordanian coastal watersof the Gulf of Aqaba, Red Sea. Aquatic Ecosystem Health & Management 1 (1),75e89.
Banse, K., 1991. Rates of phytoplankton cell division in the field and in ironenrichment experiments. Limnology and Oceanography 36, 1886e1898.
Barbosa, A.B., Domingues, R.B., Galvão, H.M., 2010. Environmental forcing ofphytoplankton in a Mediterranean estuary (Guadiana estuary, south-westernIberia): a decadal study of climate and anthropogenic influences. Estuariesand Coasts 33, 324e341.
Brzezinski, M.A., 1985. The Si:C:N ratio of marine diatoms: inter-specific vari-ability and the effect of some environmental variable. Journal of Physiology21, 347e357.
Cho, B.C., Azam, F., 1990. Biogeochemical significance of bacterial biomass in theocean’s euphotic zone. Marine Ecology Progress Series 63, 253e259.
Clark, R.B., 2001. Marine Pollution, fifth ed. Oxford University Press, Oxford, p. 237.Cloern, J.E., 1987. Turbidity as a control on phytoplankton biomass and productivity
in estuaries. Continental Shelf Research 7, 1367e1381.Cloern, J.E., 1996. Phytoplankton bloom dynamics in coastal ecosystems: a review
with some general lessons from sustained investigation of San Francisco Bay,California. Reviews of Geophysics 34, 127e168.
Daneri, G., Dellarosa, V., Quiñones, R., Jacob, B., Montero, P., Ulloa, O., 2000. Primaryproduction and community respiration in the Humboldt Current System offChile and associated oceanic areas. Marine Ecology Progress Series 197, 41e49.
Domingues, R.B., Barbosa, A., Galvão, H., 2008. Constraints on the use of phyto-plankton as a biological quality element within the Water Framework Directivein Portuguese waters. Marine Pollution Bulletin 56, 1389e1395.
Domingues, R.B., Barbosa, A.B., Summer, U., Galvão, H.M., 2012. Phytoplanktoncomposition, growth and production in the Guarian estuary (SW Iberia):Unraveling changes induced after dam construction. Science of the TotalEnvironment 416, 300e313.
Dortch, Q., Whitledge, T.E., 1992. Does nitrogen or silicon limit phytoplanktonproduction in the Mississippi River plums and nearby regions? ContinentalShelf Research 22, 1293e1309.
Fisher, T.R., Peele, E.R., Ammerman, J.W., Harding Jr., L.W., 1992. Nutrient limitationof phytoplankton in Chesapeake Bay. Marine Ecology Progress Series 82, 51e63.
Fisher, T.R., Gustafson, A.B., Sellner, K., Lacouture, R., Haas, L.W.R., Wetzel, L.,Magnien, R., Everitt, D., Michaels, B., Karrh, R., 1999. Spatial and temporal vari-ation of resource limitation in Chesapeake Bay. Marine Biology 133, 763e778.
Fitzwater, S.E., Knauer, G.A., Martin, J.H., 1982. Metal contamination and primaryproduction: field and laboratory methods of control. Limnology and Oceanog-raphy 27, 544e551.
Goericke, R., 1998. Response of phytoplankton community structure and taxon-specific growth rates to seasonally varying physical forcing in the SargassoSea off Bermuda. Limnology and Oceanography 43, 921e935.
Goericke, R., Welschmeyer, N.A., 1998. Response of Sargasso Sea phytoplanktonbiomass, growth rates and primary production to seasonally varying physicalforcing. Journal of Plankton Research 20, 2223e2249.
Hama, T., Miyazaki, T., Ogawa, Y., Iwakuma, T., Takahashi, M., Osuki, A., Ichimura, S.,1983. Measurement of photosynthetic production of a marine phytoplanktonpopulation using a stable 13C isotope. Marine Biology 73, 31e36.
Henríquez, L.A., Daneri, G., M~unoz, C.A., Montero, P., Veas, R., Palma, A.T., 2007.Primary production and phytoplanktonic biomass in shallow marine environ-ments of central Chile: effect of coastal geomorphology. Estuarine, Coastal andShelf Science 73, 137e147.
Imai, K., Nojiri, Y., Tsurushima, N., Saino, T., 2002. Time series of seasonal variationof primary productivity at station KNOT (44�N, 155�E) in the sub-arctic westernNorth Pacific. Deep Sea Research Part II: Topical Studies in Oceanography 49,5395e5408.
Iriarte, A., Purdie, D.A., 2004. Factors controlling the timing ofmajor spring bloom eventsin an UK south coast estuary. Estuarine, Coastal and Shelf Science 61, 679e690.
Justic, D., Rabalais, N.N., Turner, R.E., 1995a. Stoichiometric nutrient balance andorigin of coastal eutrophication. Marine Pollution Bulletin 30, 41e46.
Justic, D., Rabalais, N.N., Turner, R.E., Dortch, Q., 1995b. Changes in nutrient struc-ture of river-dominated coastal waters, stoichiometric nutrient balance and itsconsequences. Estuarine, Coastal and Shelf Science 40, 339e356.
Kirk, T.O., 1986. Optical properties of picoplankton suspensions. In: Platt, T.,Li, W.K.W. (Eds.), Photosynthetic Picoplankton. Canadian Bulletin of Fisheriesand Aquatic Sciences 214, 501e520.
Kocum, E., Underwood, G.J.C., Nedwell, D.B., 2002. Simultaneous measurement ofphytoplankton primary production, nutrient and light availability along aturbid, eutrophic UK east coast estuary (the Colne Estuary). Marine EcologyProgress Series 231, 1e12.
Kristiansen, S., Hoell, E.E., 2002. The importance of silicon for marine production.Hydrobiologia 484, 21e31.
Kudo, I., Noiri, Y., Cochlan, W.P., Suzuki, K., Aramaki, T., Ono, T., Nojiri, Y., 2009.Primary productivity, bacterial productivity and nitrogen uptake in response toiron enrichment during the SEEDS II. Deep Sea Research Part II: Topical Studiesin Oceanography 56, 2755e2766.
Laws, E.A., Ditullio, G.R., Redalje, D.G., 1987. High phytoplankton growth and pro-duction rates in the North Pacific subtropical gyre. Limnology and Oceanog-raphy 32, 905e918.
Malone, T.C., Pike, S.E., Conley, D.J., 1993. Transient variations in phytoplanktonproductivity at the JGOFS Bermuda time series station. Deep Sea Research PartI: Oceanographic Research Papers 40, 903e924.
Marañón, E., 2005. Phytoplankton growth rates in the Atlantic subtropical gyres.Limnology and Oceanography 50 (1), 299e310.
Marañón, E., Varela, M.M., Mouriñ, O.B., Bale, A.J., 2000. Basin-scale variability ofphytoplankton biomass, production and growth in the Atlantic Ocean. Deep SeaResearch Part I: Oceanographic Research Papers 47, 825e857.
Marín, V., Rodríguez, L., Vallejo, L., Fuenteseca, J., Oyarce, E., 1993. Efectos de la sur-gencia costera sobre la productividad primaria primaveral de Bahí a Mejillonesdel Sur (Antofagasta, Chile). Revista Chilena de Historia Natural 66, 479e491.
McGillicuddy, D.J., Robinson, A.R., 1997. Eddy-induced nutrient supply and newproduction in the Sargasso Sea. Deep Sea Research Part I: OceanographicResearch Papers 44 (8), 1427e1450.
Miller, K.G., Wright, J.D., Fairbanks, R.G., 1991. Unlocking the Ice House: OligoceneeMiocene oxygen isotopes, eustasy, and margin erosion. Journal of GeophysicalResearch 96, 6829e6848.
Morais, P., Chícharo, M.A., Chícharo, L., 2009. Changes in a temperate estuary duringthe filling of the biggest European dam. Science of the Total Environment 407,2245e2259.
Odate, T., Furuya, K., 1995. Primary production and community respiration in thesubarctic of the western North Pacific. In: Sakai, H., Nozaki, Y. (Eds.),Biochemical Processes and Ocean Flux in the Western Pacific. Terra ScientificPublishing Company, Tokyo, pp. 239e253.
J.I. Agboola et al. / Estuarine, Coastal and Shelf Science 127 (2013) 12e2322

Author's personal copy
Odate, T., Maita, Y., 1988/89. Regional variation in the size composition of phyto-plankton communities in the western North Pacific Ocean, spring 1985. Bio-logical Oceanography 6, 65e77.
Ogawa, H., Fukuda, R., Koike, I., 1999. Vertical distributions of dissolved organiccarbon and nitrogen in the Southern Ocean. Deep Sea Research Part I: Ocean-ographic Research Papers 46, 1809e1826.
Parsons, T.R., Maita, Y., Lalli, C.M., 1984. A Manual of Chemical and BiologicalMethods for Seawater Analysis. Pergamon Press, New York.
Quevedo, M., Anadó, N.R., 2001. Protist control of phytoplankton growth in thesubtropical north-east Atlantic. Marine Ecology Progress Series 221, 29e38.
Rahm, L., Conley, D., Sanden, P., Wulff, F., Stalnacke, P., 1996. Time series analysis ofnutrient inputs to the Baltic Sea and changing DSi:DIN ratios. Marine EcologyProgress Series 130, 221e228.
Rasheed, M., Badran, M., Richter, C., Huettel, M., 2002. Effect of reef framework andbottom sediment on nutrient enrichment in a coral reef of the Gulf of Aqaba.Marine Ecology Progress Series 239, 277e285.
Redfield, A.C., Ketchum, B.H., Richards, F.A., 1963. The influence of organism on thecomposition of seawater. The Sea 2, 26e77.
Rhee, G.Y., 1973. A continuous culture study of phosphate uptake, growth rate, andpolyphosphate in Scenedesmus sp. Journal of Phycology 9, 495e506.
Riley, G.A., 1957. Phytoplankton of the North Central Sargasso Sea, 1950e52.Limnology and Oceanography 2, 252e270.
Shiomoto, A., 2000. Efficiency of water-column light utilization in the subarcticnorthwestern Pacific. Limnology and Oceanography 45, 982e987.
Shiomoto, A., Maita, Y., 1990. Uptake of nitrate and ammonia in the subarcticboundary and adjacent regions of the northwestern Pacific Ocean. Deep SeaResearch Part I: Oceanographic Research Papers 37, 1887e1897.
Shiomoto, A., Ishida, Y., Tamaki, M., Yamanaka, Y., 1998. Primary production andchlorophyll a in the northwestern Pacific Ocean in summer. Journal ofGeophysical Research 103, 24651e24661.
Suzuki, R., Ishimaru, T., 1990. An improved method for the determination ofphytoplankton chlorophyll using N,N-dimethylformamide. Journal of Ocean-ography 46, 190e194.
Sverdrup, H.U., 1953. On conditions for the vernal blooming of phytoplankton.Journal du Conseil 18, 287e295.
Tilman, D., Kilham, S.S., 1976. Phosphate and silicate growth and uptake kinetics ofthe diatoms Asterionella formosa and Cyclotella menaghiniana in batch andsemi-continuous culture. Journal of Phycology 12, 375e383.
Wofsy, S.C., 1983. A simple model to predict extinction coefficients and phyto-plankton biomass in eutrophic waters. Limnology and Oceanography 28,1144e1155.
Yoshida, K., Domon, K., Watanabe, T., 1977. Physical and chemical environment inIshikari Bay. Scientific Reports of the Hokkaido Fisheries Experimental Station34 (1e6) (in Japanese with English abstract).
J.I. Agboola et al. / Estuarine, Coastal and Shelf Science 127 (2013) 12e23 23