
Impacts of hydropower and climate change on drivers of ecological productivity of Southeast Asia's...
12
Ecological Modelling 272 (2014) 252–263 Contents lists available at ScienceDirect Ecological Modelling jo ur nal home p ag e: www.elsevier.com/locate/ecolmodel Impacts of hydropower and climate change on drivers of ecological productivity of Southeast Asia’s most important wetland Mauricio E. Arias a , Thomas A. Cochrane a,∗ , Matti Kummu b , Hannu Lauri c , Gordon W. Holtgrieve d , Jorma Koponen c , Thanapon Piman a,e a Department of Civil and Natural Resources Engineering, University of Canterbury, Private Bag 4800, Christchurch 8140, New Zealand b Water & Development Research Group, Aalto University, P.O. Box 15200, FIN-00075 Aalto, Finland c Environmental Impact Assessment Centre of Finland Ltd., Espoo, Finland d School of Aquatic and Fishery Sciences, University of Washington, Box 355020, Seattle, WA 98195-5020, United States e Climate Change and Adaptation Initiative, Mekong River Commission, P.O. Box 6101, Vientiane 01000, Lao Democratic People’s Republic a r t i c l e i n f o Article history: Received 24 May 2013 Received in revised form 10 October 2013 Accepted 12 October 2013 Keywords: Tonle Sap Flood-pulse hydrology Tropical wetland Floodplain ecology Net primary production Mekong a b s t r a c t The Tonle Sap is the largest lake in Southeast Asia and its fishery supports the livelihood and nutrition of millions of people in Cambodia. However, the hydrological and ecological drivers of this ecosystem are changing as a result of hydropower development on the Mekong River and global climate change. The objective of this study was to quantify the impacts of the Mekong’s future hydrological alterations on aquatic net primary production (NPP) of the Tonle Sap. A three-dimensional (3D) hydrodynamic model was used to evaluate eleven scenarios of hydropower development and climate change, with respect to water flows, suspended sediments, and floodplain habitat cover, which were identified as the key drivers of productivity change. We found that hydropower development would cause the most distinct changes in seasonality by reducing wet season water levels and increasing dry season water levels. Combined scenarios of hydropower and climate change revealed that areas of open water and rainfed/irrigated rice would expand by 35 ± 3% and 16 ± 5%, respectively, while optimal area for gallery forest would decrease by 40 ± 27%. The estimated annual net sedimentation was projected to decrease by 56 ± 3% from the 3.28 ± 0.93 million tons baseline values. Annual average NPP in the open water and in the floodplain was 1.07 ± 0.06 and 3.67 ± 0.61 million tons C, respectively, and a reduction of 34 ± 4% is expected. Our study concludes that Tonle Sap’s drivers of ecological productivity – habitat cover, sedimentation, and NPP – will face a significant change, and a decline of its ecosystem’s services should be expected if mitigation and adaptation strategies are not implemented. © 2013 Elsevier B.V. All rights reserved. 1. Introduction Floodplain wetlands are among the most productive and valuable ecosystems on earth; they provide critical ecosystem services to society, including flood regulation, food production, water treatment, nutrient storage, and wildlife habitat (Constanza et al., 1997). Nearly half of the world’s wetlands, however, have been lost to hydrological alterations and land reclamation (Junk et al., 2013), especially those in fertile floodplains. The majority of the remaining unregulated floodplains occur in the (sub-) tropics, where wetlands are under threat by fast growing economies with expanding agriculture and hydropower capacity. In addition to those pressures, global climate change is increasing the frequency and magnitude of floods and droughts (Dai, 2011; Hirabayashi ∗ Corresponding author. Tel.: +64 3 364 2378; fax: +64 3 364 2758. E-mail addresses: [email protected] (M.E. Arias), [email protected] (T.A. Cochrane). et al., 2013), augmenting the vulnerability of these ecosystems. In light of the critical condition of floodplain wetlands worldwide, it is crucial to quantify the impacts that hydrological alterations could have on the crucial services provided by these ecosystems. The Tonle Sap is a unique ecosystem with an enormous hydro- logical, biological, nutritional, and cultural value to Cambodia and the lower Mekong region. The Tonle Sap is composed of a 2600 km 2 permanent shallow lake, a 120 km long river that connects the lake to the Mekong River, and a 12,876 km 2 floodplain covered with a mosaic of natural and agricultural habitats that the Mekong replenishes with water and sediments annually (Fig. 1). These habitats are home to important populations of threatened animal species (Campbell et al., 2006; Davidson, 2006), and the ecosys- tem provides critical spawning and rearing habitat for one of the largest freshwater capture fisheries on the planet (Baran and Myschowoda, 2009; Cooperman et al., 2012), which is reported to provide up to 80% of the protein consumed by millions of peo- ple in the surrounding provinces of Cambodia and beyond (Hortle, 2007). 0304-3800/$ – see front matter © 2013 Elsevier B.V. All rights reserved. http://dx.doi.org/10.1016/j.ecolmodel.2013.10.015
-
Upload
independent -
Category
Documents
-
view
5 -
download
0
Transcript of Impacts of hydropower and climate change on drivers of ecological productivity of Southeast Asia's...

Ip
MGa
b
c
d
e
a
ARRA
KTFTFNM
1
vswebetweta
t
0h
Ecological Modelling 272 (2014) 252– 263
Contents lists available at ScienceDirect
Ecological Modelling
jo ur nal home p ag e: www.elsev ier .com/ locate /eco lmodel
mpacts of hydropower and climate change on drivers of ecologicalroductivity of Southeast Asia’s most important wetland
auricio E. Ariasa, Thomas A. Cochranea,∗, Matti Kummub, Hannu Lauri c,ordon W. Holtgrieved, Jorma Koponenc, Thanapon Pimana,e
Department of Civil and Natural Resources Engineering, University of Canterbury, Private Bag 4800, Christchurch 8140, New ZealandWater & Development Research Group, Aalto University, P.O. Box 15200, FIN-00075 Aalto, FinlandEnvironmental Impact Assessment Centre of Finland Ltd., Espoo, FinlandSchool of Aquatic and Fishery Sciences, University of Washington, Box 355020, Seattle, WA 98195-5020, United StatesClimate Change and Adaptation Initiative, Mekong River Commission, P.O. Box 6101, Vientiane 01000, Lao Democratic People’s Republic
r t i c l e i n f o
rticle history:eceived 24 May 2013eceived in revised form 10 October 2013ccepted 12 October 2013
eywords:onle Saplood-pulse hydrologyropical wetlandloodplain ecologyet primary productionekong
a b s t r a c t
The Tonle Sap is the largest lake in Southeast Asia and its fishery supports the livelihood and nutrition ofmillions of people in Cambodia. However, the hydrological and ecological drivers of this ecosystem arechanging as a result of hydropower development on the Mekong River and global climate change. Theobjective of this study was to quantify the impacts of the Mekong’s future hydrological alterations onaquatic net primary production (NPP) of the Tonle Sap. A three-dimensional (3D) hydrodynamic modelwas used to evaluate eleven scenarios of hydropower development and climate change, with respect towater flows, suspended sediments, and floodplain habitat cover, which were identified as the key driversof productivity change. We found that hydropower development would cause the most distinct changesin seasonality by reducing wet season water levels and increasing dry season water levels. Combinedscenarios of hydropower and climate change revealed that areas of open water and rainfed/irrigated ricewould expand by 35 ± 3% and 16 ± 5%, respectively, while optimal area for gallery forest would decrease
by 40 ± 27%. The estimated annual net sedimentation was projected to decrease by 56 ± 3% from the3.28 ± 0.93 million tons baseline values. Annual average NPP in the open water and in the floodplain was1.07 ± 0.06 and 3.67 ± 0.61 million tons C, respectively, and a reduction of 34 ± 4% is expected. Our studyconcludes that Tonle Sap’s drivers of ecological productivity – habitat cover, sedimentation, and NPP –will face a significant change, and a decline of its ecosystem’s services should be expected if mitigationare n
and adaptation strategies. Introduction
Floodplain wetlands are among the most productive andaluable ecosystems on earth; they provide critical ecosystemervices to society, including flood regulation, food production,ater treatment, nutrient storage, and wildlife habitat (Constanza
t al., 1997). Nearly half of the world’s wetlands, however, haveeen lost to hydrological alterations and land reclamation (Junkt al., 2013), especially those in fertile floodplains. The majority ofhe remaining unregulated floodplains occur in the (sub-) tropics,here wetlands are under threat by fast growing economies with
xpanding agriculture and hydropower capacity. In addition tohose pressures, global climate change is increasing the frequencynd magnitude of floods and droughts (Dai, 2011; Hirabayashi
∗ Corresponding author. Tel.: +64 3 364 2378; fax: +64 3 364 2758.E-mail addresses: [email protected] (M.E. Arias),
[email protected] (T.A. Cochrane).
304-3800/$ – see front matter © 2013 Elsevier B.V. All rights reserved.ttp://dx.doi.org/10.1016/j.ecolmodel.2013.10.015
ot implemented.© 2013 Elsevier B.V. All rights reserved.
et al., 2013), augmenting the vulnerability of these ecosystems. Inlight of the critical condition of floodplain wetlands worldwide,it is crucial to quantify the impacts that hydrological alterationscould have on the crucial services provided by these ecosystems.
The Tonle Sap is a unique ecosystem with an enormous hydro-logical, biological, nutritional, and cultural value to Cambodia andthe lower Mekong region. The Tonle Sap is composed of a 2600 km2
permanent shallow lake, a 120 km long river that connects thelake to the Mekong River, and a 12,876 km2 floodplain coveredwith a mosaic of natural and agricultural habitats that the Mekongreplenishes with water and sediments annually (Fig. 1). Thesehabitats are home to important populations of threatened animalspecies (Campbell et al., 2006; Davidson, 2006), and the ecosys-tem provides critical spawning and rearing habitat for one ofthe largest freshwater capture fisheries on the planet (Baran and
Myschowoda, 2009; Cooperman et al., 2012), which is reportedto provide up to 80% of the protein consumed by millions of peo-ple in the surrounding provinces of Cambodia and beyond (Hortle,2007).
M.E. Arias et al. / Ecological Modelling 272 (2014) 252– 263 253
map
boOT(1iTtopoWRScfteaod
idra(idS2cirtTafli
Fig. 1. Overview
The surface hydrology and flood-pulse in the Tonle Sap is driveny the Asian Monsoon regime, which brings approximately 65%f the total annual rainfall to the Mekong Basin between July andctober (MRC, 2005). More than half of the annual flow into theonle Sap comes directly from the Mekong via the Tonle Sap River53.5%), 34% from 11 tributaries in the Tonle Sap catchment, and2.5% from rainfall precipitation (Kummu et al., 2013). The Mekong
s also the source of 72% of the suspended sediments entering theonle Sap (Kummu et al., 2008). During the dry season (Octoberhrough May) the Tonle Sap River discharges up to 8000 m3 s−1
ut from the lake toward the Mekong (Fig. S1). At the end of thiseriod of “normal” flow, in May, the lake reaches a minimum depthf less than 1.5 m and a surface water area less than 2600 km2.hen the monsoon reaches the basin, the level of the Mekong
iver rises to a higher level than the Tonle Sap, forcing the Tonleap River to reverse its flow toward the lake. This phenomenonauses the lake’s water depth to increase by 5.6–9.0 m and its sur-ace area by 7517–12,876 km2. At the peak of the flood (betweenhe end of September and the beginning of October), the total floodxtends over 9637–15,278 km2. Flood duration varies proportion-lly to flood level throughout the floodplain, from a few days at theuter edge to 9–11 months in the gallery forest. The average flooduration over the entire floodplain is 3.9–6.7 months per year.
Nonetheless, the hydrology that drives the Tonle Sap systems changing. The Mekong basin is undergoing rapid hydropowerevelopment; reservoir active storage has increased three-fold inecent decades (from 7.9 km3 in 1990 to 29.9 km3 in 2010) andnother three-fold increase is expected in the foreseeable futureLauri et al., 2012; MRC, 2009; Piman et al., 2013). Moreover, theres evidence of an increase in the frequency of extreme floods androughts in the basin associated with changes to the El Nino-outhern Oscillation (Delgado et al., 2012; Räsänen and Kummu,013), but whether these observations are caused by climatehange or not has not been proven yet. There is much uncertaintyn the simulations of future climate change in this monsoon-drivenegion and there is no agreement as to what the general direc-ion of impacts could be (Kingston et al., 2011; Lauri et al., 2012;
hompson et al., 2013). Large tropical floodplains with unimodalnd predictable hydrology are typically described following theood-pulse concept (Junk et al., 1989), which states that geochem-cal and biological processes are dictated by the seasonal pulse of
of the Tonle Sap.
water. Recent studies on the water chemistry, vegetation, soils andfauna all suggest that the Tonle Sap acts like a classic flood-pulseecosystem (Arias et al., 2013; Brooks et al., 2009; Irvine et al., 2011).From this we therefore expect that changes in the flood-pulseshould have a direct impact on physical and chemical propertiesof the lake, which subsequently would impact primary and sec-ondary productivity (including fisheries). These connections havenot been comprehensively measured for the Tonle Sap, but giventhe imminent transformations that the drivers of productivity areundergoing, it is crucial to use available empirical evidence in con-junction with numerical models to examine resulting changes inproductivity.
Multiple modeling approaches have been used to simulate theinteraction between ecological and hydrological properties of largetropical wetlands. When data are limited, one approach is tosimulate responses at high trophic levels as a direct function ofhydrology, disregarding interactions with primary producers (e.g.,Linhoss et al., 2012). In contrast to the data limited approach above,detail information on multiple trophic levels has been used to sim-ulate the energy exchange within foodwebs (e.g., Angelini andAgostinho, 2005; Brown et al., 2006). Another approach consistsin simulating the interaction among compartments of water, sed-iments, and primary producers; models of this kind can representwetlands as single geographic units with multiple compartments(e.g., Weber et al., 1996), as spatially-explicit systems of links andnodes (e.g., Kuper et al., 2003), or as spatially-distributed modelswhere variables are represented by layers of pixel-based informa-tion covering the spatial extend of each ecosystem (e.g., Reyes et al.,2000; Fitz and Trimble, 2006). A further step in hydro-ecologicalmodels is to explicitly integrate hydrology and primary produc-tion with multiple trophic levels. This last type of models requiresdetailed ecological data that is unavailable for most large tropicalwetlands, hence these models have been primarily developed onlyfor the Everglades (DeAngelis et al., 1998; Gaff et al., 2000).
The development of ecological models of the Tonle Sap hasbeen minimal compared to other large tropical wetlands. Hydro-dynamic models have been applied to the Tonle Sap (Fujii et al.,
2003; Sarkkula et al., 2003; WB, 2004), but their applicability andlinkage to ecological models remains limited because of inadequateinformation relating the hydrology to the ecology. Among the fewnumerical models applied to the Tonle Sap, the 3D EIA is the only
2 Modelling 272 (2014) 252– 263
opTTptAdwqpflad
tfBmadpo
2
2
cmbflohedRcac
toT(tcGlflhsdtsaSd
2
mN
54 M.E. Arias et al. / Ecological
ne with peer-reviewed results linking hydrological and ecologicalrocesses (Lamberts and Koponen, 2008; Holtgrieve et al., 2013).he model platform has been developed since the 1970s and itsonle Sap application was initially created in the early 2000s asart of a project between the Mekong River Commission (MRC),he Finish Environment Institute, and the Environmental Impactssessment Centre of Finland Ltd (Sarkkula et al., 2003). The hydro-ynamic, sediment and dissolved oxygen components of the modelere shown to represent observed temporal and spatial variation
uite well (Sarkkula et al., 2003). Primary and fish production com-onents were added to the model in recent years based on generaloodplain ecological concepts, and the 3D EIA’s results show goodgreement with the available primary production and fish catchata (Koponen et al., 2010b; Holtgrieve et al., 2013).
The purpose of this study is to quantify future changes inhe Tonle Sap net primary production (NPP) that could resultrom hydropower development and climate change in the Mekongasin using the 3D EIA model. Comprehensive and published fieldeasurements of floodplain vegetation and aquatic productivity
re used to calibrate the model, a detailed sensitivity analysis isone, and future scenarios of hydrology and land cover based onublished information of climate change and hydropower devel-pment in the Mekong Basin are used to predict NPP changes.
. Methods
.1. Modeling approach
Because of the complexity of the system and the number of pro-esses that were considered, we used multiple data sources andodels to simulate daily NPP throughout the Tonle Sap (Fig. 2). The
aseline hydrology of the Mekong Basin and modifications to waterows caused by hydropower and climate change have been previ-usly simulated by Lauri et al. (2012) using the VMOD distributedydrological model. The VMOD model application represented thentire Mekong Basin on a 5 km grid resolution, and it generatedaily discharge rates from the Tonle Sap tributaries and the Mekongiver. Results from the VMOD model validation using daily dis-harge measurements (1993–1999) showed excellent agreementt Stung Treng in Northern Cambodia (Nash-Sutcliffe efficiencyoefficient of 0.941; Lauri et al., 2012).
The simulated daily flows at Stung Treng were then routedhrough the lower Mekong floodplains using the 2D applicationf the EIA model, which estimated the hydrodynamics driving theonle Sap, including water levels and the flow reversal in the riverVästilä et al., 2010). The changes in Tonle Sap water level werehen used in combination with a digital elevation map to estimatehanges in flood duration and habitat cover using the PULSEHABIS-based model (Arias et al., 2012). PULSEHAB uses a maximum
ikelihood approach to reclassify decadal spatial patterns of annualood duration into different habitats with spatial distributions thatave been determined empirically. PULSEHAB assumes that thepatial distribution of habitats is a response of decadal flooding con-itions rather than changes occurring on an annual basis; therefore,he classification rules were applied over a range of years repre-enting a broad spectrum of flood duration conditions. These mapsnd the simulated river flows were then used as inputs to the Tonleap 3D EIA model, which resulted in daily estimations of spatiallyistributed sedimentation and NPP.
.2. 3D EIA model description and input data
The 3D EIA is a distributed, three dimensional, and multi-layerodel that computes hydrodynamics, sediment movement andPP. Detailed descriptions of the model can be found elsewhere
Fig. 2. Modeling approaches used to estimate impacts on primary production in theTonle Sap. Detailed results of VMOD were presented by Lauri et al. (2012).
(Koponen et al., 2010a,b; Sarkkula et al., 2010), but here we providea summary describing the most relevant processes driving NPP(Fig. 3).
Water movement through the lake and floodplain is representedby the simplified Navier–Stokes (Eq. (1)) and the continuity equa-tions (Eq. (2)):
�d�vdt
= �∂�v∂t
+ ��v ◦ ∇�v = −∇p + ��g ◦ ¯I − 2� �ω × �v + ��m∇2�v (1)
�∂�v∂t
+ ∇ · (��v) = 0 (2)
where �v is the momentaneous flow velocity vector, � is the momen-taneous density of water, p is the momentaneous pressure, �g is thegravity acceleration vector, ¯I is the unit matrix of the coordinatesystem, �ω is the angular velocity vector of earth’s rotation, �m isthe kinematic molecular viscosity of water, t is time, ∇ is the gra-dient operator, ∇· is the divergence operator, and ∇2 is the LaPlaceoperator. The model solves the equations numerically using a finitedifference method; calculations are carried out in 1 km2 horizon-tal grid cells and a maximum of 14 vertical layers. The model useswater flows at the 14 main tributaries of the Tonle Sap (includingthe Tonle Sap River) as boundary conditions. Water level recordsfrom 1997 to 2005 at Kampong Luong were used to validate themodel hydrodynamics.
The 3D EIA model calculates the amount of sediment trans-
ported, deposited, and eroded throughout the floodplain as afunction of hydrodynamics, terrain, and land use/land cover(LULC). Sediment quantities and processes are a key componentof the model because they control turbidity and bioavailable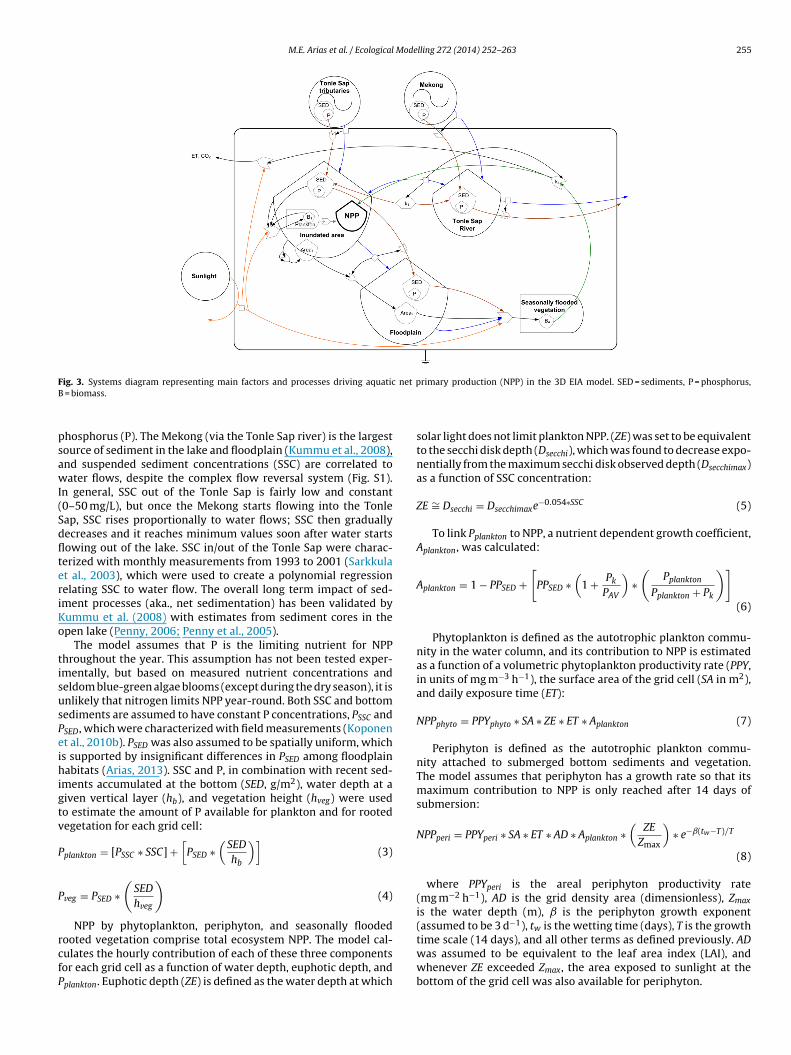
M.E. Arias et al. / Ecological Modelling 272 (2014) 252– 263 255
F net pB
psawI(SdflteriKo
tisusPeihigtv
P
P
rcfP
ig. 3. Systems diagram representing main factors and processes driving aquatic = biomass.
hosphorus (P). The Mekong (via the Tonle Sap river) is the largestource of sediment in the lake and floodplain (Kummu et al., 2008),nd suspended sediment concentrations (SSC) are correlated toater flows, despite the complex flow reversal system (Fig. S1).
n general, SSC out of the Tonle Sap is fairly low and constant0–50 mg/L), but once the Mekong starts flowing into the Tonleap, SSC rises proportionally to water flows; SSC then graduallyecreases and it reaches minimum values soon after water startsowing out of the lake. SSC in/out of the Tonle Sap were charac-erized with monthly measurements from 1993 to 2001 (Sarkkulat al., 2003), which were used to create a polynomial regressionelating SSC to water flow. The overall long term impact of sed-ment processes (aka., net sedimentation) has been validated byummu et al. (2008) with estimates from sediment cores in thepen lake (Penny, 2006; Penny et al., 2005).
The model assumes that P is the limiting nutrient for NPPhroughout the year. This assumption has not been tested exper-mentally, but based on measured nutrient concentrations andeldom blue-green algae blooms (except during the dry season), it isnlikely that nitrogen limits NPP year-round. Both SSC and bottomediments are assumed to have constant P concentrations, PSSC andSED, which were characterized with field measurements (Koponent al., 2010b). PSED was also assumed to be spatially uniform, whichs supported by insignificant differences in PSED among floodplainabitats (Arias, 2013). SSC and P, in combination with recent sed-
ments accumulated at the bottom (SED, g/m2), water depth at aiven vertical layer (hb), and vegetation height (hveg) were usedo estimate the amount of P available for plankton and for rootedegetation for each grid cell:
plankton = [PSSC ∗ SSC] +[
PSED ∗(
SED
hb
)](3)
veg = PSED ∗(
SED
hveg
)(4)
NPP by phytoplankton, periphyton, and seasonally flooded
ooted vegetation comprise total ecosystem NPP. The model cal-ulates the hourly contribution of each of these three componentsor each grid cell as a function of water depth, euphotic depth, andplankton. Euphotic depth (ZE) is defined as the water depth at whichrimary production (NPP) in the 3D EIA model. SED = sediments, P = phosphorus,
solar light does not limit plankton NPP. (ZE) was set to be equivalentto the secchi disk depth (Dsecchi), which was found to decrease expo-nentially from the maximum secchi disk observed depth (Dsecchimax)as a function of SSC concentration:
ZE ∼= Dsecchi = Dsecchimaxe−0.054∗SSC (5)
To link Pplankton to NPP, a nutrient dependent growth coefficient,Aplankton, was calculated:
Aplankton = 1 − PPSED +[
PPSED ∗(
1 + Pk
PAV
)∗(
Pplankton
Pplankton + Pk
)]
(6)
Phytoplankton is defined as the autotrophic plankton commu-nity in the water column, and its contribution to NPP is estimatedas a function of a volumetric phytoplankton productivity rate (PPY,in units of mg m−3 h−1), the surface area of the grid cell (SA in m2),and daily exposure time (ET):
NPPphyto = PPYphyto ∗ SA ∗ ZE ∗ ET ∗ Aplankton (7)
Periphyton is defined as the autotrophic plankton commu-nity attached to submerged bottom sediments and vegetation.The model assumes that periphyton has a growth rate so that itsmaximum contribution to NPP is only reached after 14 days ofsubmersion:
NPPperi = PPYperi ∗ SA ∗ ET ∗ AD ∗ Aplankton ∗(
ZE
Zmax
)∗ e−ˇ(tw−T)/T
(8)
where PPYperi is the areal periphyton productivity rate(mg m−2 h−1), AD is the grid density area (dimensionless), Zmax
is the water depth (m), is the periphyton growth exponent(assumed to be 3 d−1), tw is the wetting time (days), T is the growth
time scale (14 days), and all other terms as defined previously. ADwas assumed to be equivalent to the leaf area index (LAI), andwhenever ZE exceeded Zmax, the area exposed to sunlight at thebottom of the grid cell was also available for periphyton.
2 Mode
iP
A
Z
wv(sp
2
cLwl1napmttBsm(
2
f2odpOidtsNcabo
2
scorfssot
56 M.E. Arias et al. / Ecological
Rooted vegetation in the floodplain grows at a constant rate dur-ng the terrestrial phase (aka., Zmax = 0) as a function of the available
in the floodplain:
veg = 1 − PPSED +[
PPSED ∗(
1 + Pk
PAV
)∗(
Pveg
Pveg + Pk
)](9)
max = 0 → NPPveg = PPYveg ∗ SA ∗ Avegetation (10)
here Aveg is the nutrient dependent growth coefficient for rootedegetation and PPYveg is the areal rooted vegetation productivitymg h−1 m−2). Once a grid cell becomes flooded, rooted vegetationtops growing and a small fraction of PPYveg eventually becomesart of the aquatic phase NPP after decomposition.
.3. Land use/land cover (LULC) maps and parameters
Simulated baseline conditions and future scenarios used habitatover maps from PULSEHAB as the LULC map in the 3D EIA model.ULC maps on the 3D EIA model are not dynamic, situation whichas considered appropriate since PULSEHAB represented hydro-
ogical conditions over multiple years. Each LULC map includes0 different classes that cover most of the floodplain and perma-ent water. Each LULC class is associated with 9 parameters whichffect hydrodynamics, sedimentation, and NPP (Table S2). Threearameters (hveg, vegetation cover, LAI) were estimated from fieldeasurements in 2011–2012 taken in all 5 provinces surrounding
he Tonle Sap (Arias et al., 2013). LAI was estimated from vege-ation cover estimates and the solar zenith angle as described byreda (2003). The remaining parameters (vegetation drag, aeration,ediment oxygen demand, PPYveg, PPYperi, and PPYphyto) were esti-ated using published values from other large tropical floodplains
Lamberts and Koponen, 2008; Sarkkula and Koponen, 2010).
.4. NPP calibration and validation
The Tonle Sap 3D EIA model has been calibrated and validatedor water levels, water volume, and sedimentation (Kummu et al.,008; Sarkkula et al., 2003). In this paper we show the validationf daily water levels during 1997–2005. In addition, primary pro-uctivity rates were calibrated and validated with the primaryroduction field estimates presented by Holtgrieve et al. (2013).xygen metabolism was measured in sub-hourly time steps dur-
ng 234 days. These measurements were randomly split into twoatasets, one for calibration and one for validation. We calibratedhe model by adjusting PPYperi and PPYphyto so that the sum ofquares differences (SSD) between the simulated and measuredPP was minimized. Once the model was calibrated, SSD was cal-ulated with the validation dataset. Calibration and validation weressessed based on the normalized SSD (SSD divided by the num-er of observation) and the average percent difference between thebserved and simulated values.
.5. Simulation scenarios
Following the scenarios of basin wide hydrological impacts pre-ented by Lauri et al. (2012), we carried out simulations of baselineonditions and eleven future scenarios of hydropower devel-pment and/or climate change (Table 1). The baseline scenarioepresents simulated daily discharge for 1982–2005 whereas theuture scenarios represent conditions after the 2030s. Hydropower
cenarios represent the cumulative impact of 126 dams with activetorage greater than 2 × 10⁶ m3 that are at different stages of devel-pment (aka., operational, under construction, or proposed) alonghe Mekong and its tributaries (MRC, 2009; Piman et al., 2013).lling 272 (2014) 252– 263
Although hydropower dams were built in the basin during the base-line period, the active reservoir capacity in 2005 was only 10.6 km3
(Arias, 2013; MRC, 2009), which is only 2.2% of the 475 km3 of aver-age annual discharge from the Mekong (Adamson et al., 2009). Incontrast, the hydropower scenario from Lauri et al. (2012) consid-ered a total of 107.8 km3 of planned active storage. Climate changewas represented with downscaled precipitation and temperaturedata for the A1b climate change scenario, which represents a futurewith very rapid economic growth with a balance between fossiland non-fossil energy sources (Intergovernmental Panel on ClimateChange [IPCC], 2007). In order to assess uncertainty in climatechange modeling, the A1b scenario was simulated by five differentglobal circulation models (GCMs). Although downscaled climatechange projections also exist for the B1 scenario, Lauri et al. (2012)showed that the discharge variability among the five A1b simula-tions is inclusive of the B1 results. Baseline simulations were runfor 23 years, whereas all future simulations were run for 10 years.
SSC from tributaries were the same in the climate change sce-nario as in the baseline, but in the hydropower scenarios thesediment loads from the Mekong Basin (upstream from Tonle SapRiver) and Tonle Sap tributaries (Stung Sen, Sangker, and Pursat)with proposed dams were reduced according to the dam trappingefficiencies estimated by Kummu et al. (2010).
Comparisons among scenarios were done for the followingparameters: water levels, maximum annual flood extent, annualflood duration, LULC classes/habitat cover area extent, net sedi-mentation, and total lake/floodplain NPP. Water level comparisonsto historical measurements were done by estimating the differ-ence (aka. delta factors) in mean monthly water levels betweenfuture scenarios and the baseline scenario (hab bl). The delta fac-tors estimated were then compared to the monthly water levelsfor the historical observations representing average, dry, and wetyears. The definition of these hydrological representative years wasbased on a comparison of each year’s mean water levels to the over-all time series statistics. Flood duration and flood extent were alsocompared using these three hydrological representative years. Netsedimentation and NPP were analyzed annually and monthly forall simulated years.
2.6. Sensitivity analysis
A sensitivity analysis was done on 9 parameters that influ-ence NPP (listed in Table 4) following a combined Latin-hypercubeand one-factor-at-a-time sampling, method in which each of theparameters is sampled multiple times, simulations carried witheach of the sampled values, and then the overall impact of eachparameter on the model output calculated (Van Griensven et al.,2006). The baseline scenario (simulated from 1997 to 2001) was run91 times in which each of the 9 parameters was varied within therange of plausible values. Total NPP was then estimated and linearregressions were fit between NPP and each of the 9 parameters toassess model sensitivity. Furthermore, a local sensitivity test on theassumed reduction in sediment loads applied to the hydropowerscenarios was carried out by simulating the hab bl + rv scenariowith adjusted sediment loads from the tributaries correspondingto 0, 50, and 150% of the default sediment load reduction.
3. Results
3.1. Simulated water levels
Simulations with the 3D EIA model baseline scenario (hab bl)show a good representation of the observed daily water levels atthe lake during 1997–2005 (Fig. S3). No reliable measurementsat the lake exist prior to 1997. Overall, the Pearson correlation

M.E. Arias et al. / Ecological Modelling 272 (2014) 252– 263 257
Table 1Summary of 3D EIA simulation scenarios. See Lauri et al. (2012) for details on the global circulation models (GCMs) used.
Scenario name Scenario description Climate change impact Hydropower impact
hab bl Simulated baseline conditions (1982–2005). N Nhab bl+rv Baseline conditions (1982–2005) affected by hydropower development. Also used to
test model’s sensitivity to sediment reduction.N Y
mpA 2030s A1b climate change scenario from the MPI-ECHAM5 GCM without developmentplans.
Y N
ccA 2030s A1b climate change scenario from the CCCMA-CGCM3.1 GCM withoutdevelopment plans.
Y N
cnA 2030s A1b climate change scenario from the CNRM-CM3 GCM without developmentplans.
Y N
giA 2030s A1b climate change scenario from the GISS-AOM GCM without developmentplans.
Y N
ncA 2030s A1b climate change scenario from the NCAR-CCSM3 GCM without developmentplans.
Y N
ccA+rv 2030s A1b climate change scenario from the CCCMA-CGCM3.1 GCM and hydropowerdevelopment.
Y Y
cnA+rv 2030s A1b climate change scenario from the CNRM-CM3 GCM and hydropowerdevelopment
Y Y
giA+rv 2030s A1b climate change scenario from the GISS-AOM GCM and hydropowerdevelopment
Y Y
mpA+rv 2030s A1b climate change scenario from the MPI-ECHAM5 GCM and hydropowerdevelopment
Y Y
GCM
c0tbwt
rlTOu
Fw
ncA+rv 2030s A1b climate change scenario from the NCAR-CCSM3development
oefficient (r) between observed and simulated water levels was.972. At mid to high observed water levels (greater than 5 m asl.),he simulations are very accurate and there is an even distributionetween overestimated and underestimated water levels. At lowater levels (<3 m), however, there was a tendency for the model
o over-predict water levels.The simulation of the 5 GCMs of the A1b climate change scenario
esulted in an uncertainty envelope around the observed water
evel hydrographs of representative hydrological years (Fig. 4a–c).he largest difference among climate change scenarios occurs fromctober to December in dry years, while smallest disruptions andncertainty is expected for wet years. Hydropower developmentig. 4. Impact of climate change and hydropower on monthly average water levels of 3 reprhereas hydropower will dampen water level fluctuation.
and hydropower Y Y
simulations resulted in more prominent changes, mainly a reduc-tion of water levels during the wet season and an increase duringthe dry season (Fig. 4d and e). Disruptions caused by hydropowerwill be most intense during dry years, with higher water levels dur-ing the dry season in May–June (+0.87 ± 0.17 m), and lower waterlevels at the peak of the wet season in October (−0.4 ± 0.5 m).
3.2. Changes in flood duration and habitats under future
scenariosAs a response to climate change alone, no conclusive net changein maximum flood extent was quantified, but cumulative scenarios
esentative hydrological years in the Tonle Sap. Climate change increases uncertainty

258 M.E. Arias et al. / Ecological Modelling 272 (2014) 252– 263
l flood duration during an average hydrological year.
omtacam3
tta34caaab(
3
p7tltMsM(c5
Fig. 6. Average monthly sedimentation in the lake and floodplain is expected to
Fig. 5. Changes in spatial distribution of annua
f climate change and hydropower show a tendency to reduce theaximum flood extent by 529 ± 619 km2 (5 ± 6%; Fig. 5). Although
he relative change in flood extent is not large and rather vari-ble depending on scenario, patterns in annual flood duration couldhange drastically. The area of the floodplain that would be mostffected under cumulative scenarios is where flood duration is 9onths in average and dry years; this area will be reduced by
3 ± 42%.Small changes in water level, flood extent, and flood dura-
ion will result in substantial changes in the area where some ofhe most representative habitats are likely to occur (Table 2). As
response to climate change, the open water could expand by62 ± 266 km2 (14 ± 10%), while the gallery forest could shrink by00 ± 205 km2 (63 ± 31%). As a response to hydropower and climatehange combined more drastic changes are expected. Open waternd rainfed/irrigated rice will expand by 883 ± 76 km2 (35 ± 3%)nd 1184 ± 375 km2 (16 ± 5%), respectively. Overall, the optimalrea for seasonally flooded habitats will decrease; gallery foresty 261 ± 175 km2 (40 ± 27%), flooded shrublands by 492 ± 212 km2
13 ± 5%), and flooded grasslands by 108 ± 28 km2 (12 ± 3%).
.3. Changes in sediments
The estimated annual average net sedimentation in the flood-lain and open water combined is 3.28 ± 0.93 million tons, or65 ± 203 g m−2. Net sedimentation seasonal fluctuation followshe same patterns as incoming suspended sediments, with neg-igible sedimentation occurring from April to July, and with 70% ofhe annual total occurring between August and October (Fig. 6a).
inor seasonal changes are expected as a result of climate changecenario A1b, and overall, this will result in a small annual change.uch greater changes are expected as a response of hydropower
Fig. 6b); in both types of scenarios (hydropower scenario alone andombined with climate change), an annual reduction of more than0% in net sedimentation is expected.
decrease primarily as a response to hydropower.
3.4. Changes in primary production
Measured NPP was 0.89 ± 0.53 gC m−2 d−1 (Holtgrieve et al.,−2 −1
2013), while the model predicted 0.52 ± 0.13 gC m d for thesame locations and dates of the measurements. For the calibrationdataset, the normalized sum of squares difference (SSD) was 0.41
M.E. Arias et al. / Ecological Modelling 272 (2014) 252– 263 259
Table 2Expected shifts in aerial extent of the most representative habitats of the Tonle Sap. The largest shift in aerial extent will occur in the irrigated rice and abandoned fields, butthe largest relative changes will occur in the gallery forest and open water. See Table 1 for scenarios description.
Scenario Rainfed/irrigated rice Flooded grasslands Abandoned fields Flooded shrublands Gallery forest Open water
Total area in model (km2)
Baseline: 7511 866 4440 3921 657 2550
Changes from baseline
km2 % km2 % km2 % km2 % km2 % km2 %
ccA −479 −6 35 4 98 2 403 10 −476 −72 496 19cnA 989 13 −76 −9 −149 −3 −594 −15 −40 −6 −111 −4giA 4.9 0 −58 −7 624 14 −473 −12 −544 −83 460 18mpA 843 11 4.5 1 −1036 −23 281 7 −437 −66 444 17ncA −185 −2 12.5 1 −155 −3 403 10 −503 −77 523 20hab bl+rv 1259 17 −126 −15 −1249 −28 −526 −13 −143 −22 893 35ccA+rv 639 9 −118 −14 −854 −19 −360 −9 −130 −20 910 36cnA+rv 1646 22 −97 −11 −880 −20 −870 −22 −492 −75 742 29giA+rv 1284 17 −57 −7 −1234 −28 −267 −7 −482 −73 861 34mpA+rv 1434 19 −131 −15 −1434 −32 −541 −14 −158 −24 943 37ncA+rv 843 11 −123 −14 −1020 −2
Ffl
an
iNauaet9tGti
3
m
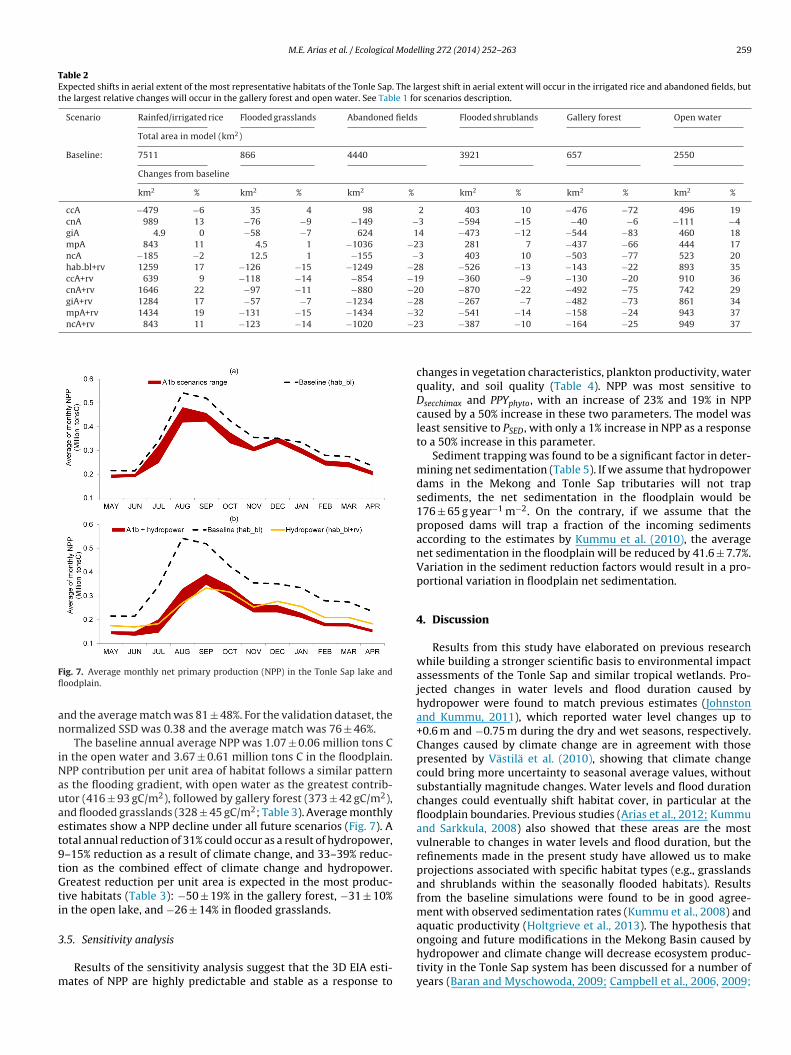
ig. 7. Average monthly net primary production (NPP) in the Tonle Sap lake andoodplain.
nd the average match was 81 ± 48%. For the validation dataset, theormalized SSD was 0.38 and the average match was 76 ± 46%.
The baseline annual average NPP was 1.07 ± 0.06 million tons Cn the open water and 3.67 ± 0.61 million tons C in the floodplain.PP contribution per unit area of habitat follows a similar patterns the flooding gradient, with open water as the greatest contrib-tor (416 ± 93 gC/m2), followed by gallery forest (373 ± 42 gC/m2),nd flooded grasslands (328 ± 45 gC/m2; Table 3). Average monthlystimates show a NPP decline under all future scenarios (Fig. 7). Aotal annual reduction of 31% could occur as a result of hydropower,–15% reduction as a result of climate change, and 33–39% reduc-ion as the combined effect of climate change and hydropower.reatest reduction per unit area is expected in the most produc-
ive habitats (Table 3): −50 ± 19% in the gallery forest, −31 ± 10%n the open lake, and −26 ± 14% in flooded grasslands.
.5. Sensitivity analysis
Results of the sensitivity analysis suggest that the 3D EIA esti-ates of NPP are highly predictable and stable as a response to
3 −387 −10 −164 −25 949 37
changes in vegetation characteristics, plankton productivity, waterquality, and soil quality (Table 4). NPP was most sensitive toDsecchimax and PPYphyto, with an increase of 23% and 19% in NPPcaused by a 50% increase in these two parameters. The model wasleast sensitive to PSED, with only a 1% increase in NPP as a responseto a 50% increase in this parameter.
Sediment trapping was found to be a significant factor in deter-mining net sedimentation (Table 5). If we assume that hydropowerdams in the Mekong and Tonle Sap tributaries will not trapsediments, the net sedimentation in the floodplain would be176 ± 65 g year−1 m−2. On the contrary, if we assume that theproposed dams will trap a fraction of the incoming sedimentsaccording to the estimates by Kummu et al. (2010), the averagenet sedimentation in the floodplain will be reduced by 41.6 ± 7.7%.Variation in the sediment reduction factors would result in a pro-portional variation in floodplain net sedimentation.
4. Discussion
Results from this study have elaborated on previous researchwhile building a stronger scientific basis to environmental impactassessments of the Tonle Sap and similar tropical wetlands. Pro-jected changes in water levels and flood duration caused byhydropower were found to match previous estimates (Johnstonand Kummu, 2011), which reported water level changes up to+0.6 m and −0.75 m during the dry and wet seasons, respectively.Changes caused by climate change are in agreement with thosepresented by Västilä et al. (2010), showing that climate changecould bring more uncertainty to seasonal average values, withoutsubstantially magnitude changes. Water levels and flood durationchanges could eventually shift habitat cover, in particular at thefloodplain boundaries. Previous studies (Arias et al., 2012; Kummuand Sarkkula, 2008) also showed that these areas are the mostvulnerable to changes in water levels and flood duration, but therefinements made in the present study have allowed us to makeprojections associated with specific habitat types (e.g., grasslandsand shrublands within the seasonally flooded habitats). Resultsfrom the baseline simulations were found to be in good agree-ment with observed sedimentation rates (Kummu et al., 2008) andaquatic productivity (Holtgrieve et al., 2013). The hypothesis that
ongoing and future modifications in the Mekong Basin caused byhydropower and climate change will decrease ecosystem produc-tivity in the Tonle Sap system has been discussed for a number ofyears (Baran and Myschowoda, 2009; Campbell et al., 2006, 2009;
260 M.E. Arias et al. / Ecological Modelling 272 (2014) 252– 263
Table 3Annual changes in net primary production per unit area for representative habitats. Values ranges (±) represent standard deviation among grid cells of the same habitat.
Scenario Rainfed/irrigated rice Flooded grasslands Abandoned fields Flooded shrublands Gallery forest Open water
NPP per unit area (gC/m2)
Baseline: 41 ± 41 328 ± 45 189 ± 65 315 ± 87 373 ± 42 416 ± 93
gC/m2 % change gC/m2 % change gC/m2 % change gC/m2 % change gC/m2 % change gC/m2 % change
ccA 34 ± 39 −5 300 ± 42 −7 168 ± 62 −6 291 ± 86 −1 315 ± 19 −55 306 ± 75 −20cnA 35 ± 43 7 307 ± 40 −11 170 ± 61 −7 306 ± 80 −8 374 ± 42 0 323 ± 71 −24giA 32 ± 40 −3 286 ± 38 −15 161 ± 64 −2 288 ± 76 −12 309 ± 15 −65 303 ± 74 −21mpA 43 ± 45 10 286 ± 39 −12 168 ± 53 −19 276 ± 81 −7 316 ± 21 −50 306 ± 74 −21ncA 36 ± 40 −2 293 ± 40 −10 161 ± 58 −11 281 ± 83 −4 311 ± 17 −59 305 ± 75 −20hab bl+rv 56 ± 42 3 198 ± 26 −42 182 ± 51 −22 198 ± 53 −39 202 ± 21 −50 246 ± 64 −32ccA+rv 35 ± 41 0 220 ± 29 −35 151 ± 50 −24 214 ± 59 −32 236 ± 25 −41 213 ± 55 −41cnA+rv 29 ± 41 1 204 ± 28 −38 132 ± 46 −29 206 ± 54 −38 217 ± 13 −70 211 ± 54 −42giA+rv 31 ± 41 1 204 ± 29 −36 129 ± 43 −34 202 ± 58 −33 221 ± 14 −68 209 ± 55 −42mpA+rv 37 ± 43 5 198 ± 26 −41 140 ± 43 −34 195 ± 54 −38 221 ± 23 −46 207 ± 55 −42ncA+rv 34 ± 41 0 209 ± 28 −38 143 ± 47 −28 204 ± 57 −35 229 ± 23 −45 210 ± 55 −41
Table 4Sensitivity of total floodplain and lake net primary production (NPP) to model parameters. Parameters ranked top to bottom according to magnitude of regression slope.Regressions with largest slope and smallest intercept have the greatest impact on floodplain-wide NPP.
Model parameter (x) Range values tested Linear regression Default valuea % change in NPP caused by a 50%increase from the default value
Dsecchimaxb 0–370 NPP = 3.01E+01x + 9.22E+03 250 23%
PPYphytoc 0–300 NPP = 4.46E+01x + 7.98E+03 110 19%
LAI d 1–10 NPP = 8.75E+02x + 1.26E+04 6.1 15%PPYperi
e 0–300 NPP = 3.05E+01x + 1.08E+04 103 11%PSSC
f 0.0001–0.01 NPP = 6.83E+05x + 1.37E+04 0.004 8%PPYveg
g 0–360 NPP = 1.65E+01x + 1.50E+04 114 6%Vegetation coverage 0.01–0.9 NPP = 2.31E+01x + 1.55E+04 66 5%hveg
h 0–18 NPP = −2.81E+02x + 1.82E+04 6.2 −5%PSED
i 0.001–0.007 NPP = 2.10E+06x + 2.87E+04 0.0002 1%
a Default value represents floodplain wide average, see Table 1 for values used in specific land use/land cover classes.b Secchi disk max depth (cm).c Phytoplankton productivity rate (mgC h−1 m−3).d Leaf area index (m2 m−2).e Periphyton productivity rate (mgC h−1 m−2).f Bioavailable P in suspended sediments (%).
Lve
4
efliflrmKittep
TS
g Terrestrial production rates (mgC h−1 m−2).h vegetation height (m).i Bioavailable P in bottom sediment (%).
amberts and Koponen, 2008; Lamberts, 2006), and this study pro-ides a scientifically-grounded mechanism to quantify the chain offfects that could lead to an eventual NPP decline.
.1. Hydrology, sediments, and habitats are the drivers of change
The basin’s hydrology controls the flow of sediments and nutri-nts as well as the flooding patterns that shape the landscape. Theood-pulse from the Mekong is expected to be dampened, reduc-
ng the peaks of sediment flows and reducing the extent of theoodplain. In addition, sediments are also major drivers of NPP byeplenishing the lake and floodplain with nutrients; yet, the sedi-ent load is projected to decrease due to reservoir trapping (e.g.
ummu et al., 2010) and we project that floodplain-wide net sed-mentation could decrease by 42%. Furthermore, modifications to
he annual flood duration throughout the floodplain could expandhe area of permanent water and rice fields while reducing thextent of seasonally flooded natural habitats; this will modify flood-lain vegetation characteristics (e.g., LAI and canopy height) thatable 5ensitivity of floodplain annual net sedimentation to dam suspended sediment trapping.
No sediment trapping 50
Net sedimentation (g year−1 m−2) 176 ± 65 1Change in sedimentation (%) – −2
play an important role in the floodplain’s NPP. Also, the increaseof fertilizer use in rice fields may affect ecological productivity inthe future, but this issue was not considered in this study. Themechanisms by which water, sediments, nutrients, and terrestrialproductivity limit NPP are unknown and should be subject to fur-ther research in order to improve future predictions. However, theavailable datasets of environmental attributes indicate that theTonle Sap follows the general principles described by the flood-pulse concept observed in other large tropical floodplains (Ariaset al., 2013; Brooks et al., 2009; Irvine et al., 2011) and that theecological principles underlying the 3D EIA model are valid.
4.2. Hydropower is a more immediate threat to the Tonle Sapecosystem than climate change
This is the first study that assesses the cumulative impact ofhydropower and climate change on the productivity of the TonleSap and the main outcome of this comparison is that the seasonalimpacts from hydropower overrule those from climate change.
% of default Default sediment trapping 150% of default
35 ± 51 103 ± 42 70 ± 313.1 ± 6.6% −41.6 ± 7.7% −60.6 ± 8.9%

Mode
ELambafatspbamv
btaabvt–2lrtttta
ttiosispte
4f
rdth(sodet
dlaiMpp
M.E. Arias et al. / Ecological
ven though the hydropower scenario used in this study and inauri et al. (2012) represents a large number of dams that are onlyt the planned stage, the recent development trends imply thatost of the hydropower potential in the basin could eventually
e exploited (Grumbine and Xu, 2011). Moreover, dam locationsnd operations are rather uncertain and modifications to theseactors could have an effect on the level of hydrological disturb-nce (Piman et al., 2012), as well as on the level of alterations tohe ecosystem services provided at the watershed and regionalcales (Arias et al., 2011; Ziv et al., 2012). With good regionallanning and coordination, guided hydropower development couldring an opportunity for developers, governments, scientists,nd conservationists to create sustainable solutions that opti-ize electricity generation along with ecological and nutritional
alues.Our results suggest that climate change in the next decades will
ring greater seasonal uncertainty, but not substantial changes tohe average seasonal trends. Other studies have found that inter-nnual variation in the basin’s hydrology has been intensifying fort least three decades (Delgado et al., 2012; Räsänen et al., 2013),ut it remains unclear what the driving factor in this increasedariability is and whether climate change plays role in it. Fur-hermore, how global climate change affects the Asian monsoon
driving the Mekong climate – is still uncertain (Ashfaq et al.,009; Kingston et al., 2011); thus, impacts of climate change on eco-
ogical productivity in basins affected by the Asian monsoon willemain somehow vague until further climatology studies resolvehese crucial issues. Yet, paleolimnological evidence has revealedhat sedimentation and primary production have varied at longeremporal scales (Day et al., 2011; Penny, 2006), which implies thathe Tonle Sap ecosystem has indeed been affected by past climatend environmental changes.
Hydropower and climate change alter ecosystem productivityhrough different pathways as demonstrated by the results fromhis study. On the one hand, for instance, reservoir sediment trapp-ng due to hydropower development could play a detrimental effectn downstream floodplains. On the other hand, A1b climate changecenarios resulted in negligible sedimentation changes, but a mean-ngful NPP decline, suggesting that water level and habitat coverhifts on their own are also important processes affecting ecologicalroductivity. Scrutinizing these different pathways is an impor-ant finding that would aid monitoring specific variables drivingnvironmental changes.
.3. Changes in primary production could alter ecosystemunction and livelihoods
The changes in the primary production and the other envi-onmental drivers assessed in this study could bring significantisruptions to the ecosystem services that the Tonle Sap provideso local livelihoods and the lower Mekong region. Other studiesave made a direct link between the basin’s future disruptionsmainly hydropower) and impacts on fish migrations and foodecurity (Kubiszewski et al., 2012; Orr et al., 2012; Ziv et al., 2012). Inur study, we emphasize this potential threat by showing that therivers of ecological productivity of the most important wetlandcosystem in the basin are highly vulnerable to ongoing disrup-ions.
Holtgrieve et al. (2013) point out that aquatic primary pro-uction of the Tonle Sap is within the typical range for tropical
akes. When the contribution from the floodplain is accounted for,verage NPP per unit of wet area is 2.63 ± 0.13 gC m−2 d−1, which
s nearly identical to the global average productivity reported byelack (1976). The average NPP from the Tonle Sap, however, sup-orts one of the largest harvests of freshwater organisms in thelanet, which suggests a high fraction of aquatic NPP is entering the
lling 272 (2014) 252– 263 261
food web (up to 69%), there is significant inputs of allochthonousorganic matter, or both (Holtgrieve et al., 2013). A reduction in NPPfrom decreased sedimentation combined with lower allochthonousinputs due to reduced flooding means the basal resources to sup-port fish production will be diminished in the future, potentiallycompromising the entire foodweb and the society that it supports.
4.4. “The Mekong story is a global story” (Kareiva, 2012)
The implications of this study expand far beyond the Mekong,as basins all around the globe – in the tropics and subtropics inparticular – are facing the combined pressure of water resourcesdevelopment and climate change. More than 18,000 large damsregulate 32% of the drainage in the (sub-) tropics (Sáenz andMulligan, 2013), and although these numbers seem already large,they are rapidly increasing in regions of Asia, South America, andAfrica. The case study presented in this paper shows how smallhydrological alternations could result in escalating effects on flood-plain ecosystems. Since large floodplains are controlled by the samehydrological and ecological principles, we suggest that hydrolog-ical alterations caused by water resources development could becausing ecological impacts at the global scale that have not beenquantified.
5. Conclusions
The primary drivers of ecological productivity of the Tonle Sapare changing due to climatic change and hydropower development.A decline of its ecosystem’s services should be expected if mitiga-tion and adaptation strategies are not implemented.
The 3D EIA model was used successfully to estimate water lev-els, flood duration, sedimentation, and net primary productionin the Tonle Sap. Published field observations (Arias et al., 2013;Holtgrieve et al., 2013) were critical to characterize, calibrate, andvalidate the model. The model’s estimates of baseline scenariosshowed good agreement with observed historical water levels, sed-imentation and primary production.
Future projections of water levels, habitat cover, sedimenta-tion, and NPP were carried out for 11 scenarios of basin-wideimpacts from climate change and hydropower development. Asa response to the combined impacts from both of these factors,seasonal water fluctuation is expected to decrease on average by0.25 ± 0.33 m (or 1428 ± 618 km2), floodplain sediment depositionwould decrease by 56 ± 3%, area feasible for gallery forest coulddecrease by 40 ± 27%, and NPP could decrease by 34 ± 4%. It isimportant, however, to recognize that these shifts would occurgradually in the upcoming decades, and that there is a great levelof uncertainty associated with hydrological and sediment trapp-ing projections in the Mekong caused by limited understanding ofthe drivers of its monsoon climate as well as discrepancies on thenumber, location, and operation of hydropower projects.
Targeted field monitoring programs are needed in the TonleSap to improve modeling efforts, verify projected results, and linkchanges in sedimentation, habitat and primary production to otherecosystem services. Moderately sensitive to model sediment inputsand their role in limiting euphotic depth, for example, imply thatmeasurements of suspended sediment concentrations would helpto improve model predictions.
The framework for applying the 3D EIA model and the lessonslearnt from the Tonle Sap are also transferable to other tropicalfloodplains around the world. This tool can be used for both scien-
tific investigations and comparative predictions on how potentialfuture changes in upstream hydrology can affect downstreamfloodplain NPP, and other factors which may be critical for main-taining healthy floodplain wetland ecosystems.
2 Mode
A
tERtt
A
fj
R
A
A
A
A
A
A
A
B
B
B
B
C
C
C
C
D
D
D
D
D
F
F
62 M.E. Arias et al. / Ecological
cknowledgements
Funding for this study was provided by the University of Can-erbury International Student Doctoral Scholarship and the Criticalcosystem Partnership Fund. Special thanks also to the Mekongiver Commission, H. de Moel, and P.J. Ward for providing much ofhe climate and hydrology data used in the models. Comments fromwo peer-reviewers helped improving the quality of this paper.
ppendix A. Supplementary data
Supplementary data associated with this article can beound, in the online version, at http://dx.doi.org/10.1016/.ecolmodel.2013.10.015.
eferences
damson, P.T., Rutherfurd, I.D., Peel, M.C., Conlan, I.A., 2009. The hydrology of theMekong River. In: The Mekong. Academic Press, San Diego, pp. 53–76.
ngelini, R., Agostinho, A.A., 2005. Food web model of the Upper Paraná River Flood-plain: description and aggregation effects. Ecological Modelling 181, 109–121.
rias, M.E., 2013. Impacts of Hydrological Alterations in the Mekong Basin to theTonle Sap Ecosystem. University of Canterbury, Christchurch, New Zealand (PhDthesis).
rias, M.E., Cochrane, T.A., Lawrence, K., Killeen, T.J., Farrell, T.A., 2011. Paying theforest for electricity: a modelling framework to market forest conservation aspayment for ecosystem services benefiting hydropower generation. Environ-mental Conservation 38, 473–484.
rias, M.E., Cochrane, T.A., Kummu, M., Killeen, T.J., Piman, T., Caruso, B.S., 2012.Quantifying changes in flooding and habitats in the Tonle Sap Lake (Cambodia)caused by water infrastructure development and climate change in the MekongBasin. Journal of Environmental Management 112, 53–66.
rias, M.E., Cochrane, T.A., Norton, D., Killeen, T.J., Khon, P., 2013. The flood pulseas the underlying driver of vegetation in the largest wetland and fishery of theMekong Basin. AMBIO 42, 864–876.
shfaq, M., Shi, Y., Tung, W., Trapp, R.J., Gao, X., Pal, J.S., Diffenbaugh, N.S., 2009.Suppression of south Asian summer monsoon precipitation in the 21st century.Geophysical Research Letters 36, L01704.
aran, E., Myschowoda, C., 2009. Dams and fisheries in the Mekong Basin. AquaticEcosystem Health & Management 12, 227–234.
reda, N.J.J., 2003. Ground-based measurements of leaf area index: a review of meth-ods, instruments and current controversies. Journal of Experimental Botany 54,2403–2417.
rooks, S.E., Allison, E.H., Gill, J.A., Reynolds, J.D., 2009. Reproductive and trophicecology of an assemblage of aquatic and semi-aquatic snakes in Tonle Sap,Cambodia. Copeia, 7–20.
rown, M.T., Cohen, M.J., Bardi, E., Ingwersen, W.W., 2006. Species diversity in theFlorida Everglades, USA: a systems approach to calculating biodiversity. AquaticSciences 68, 254–277.
ampbell, I., Poole, C., Giesen, W., Valbo-Jorgensen, J., 2006. Species diversity andecology of Tonle Sap Great Lake, Cambodia. Aquatic Sciences – Research AcrossBoundaries 68, 355–373.
ampbell, I.C., Say, S., Beardall, J., 2009. Tonle Sap lake, the heart of the lower Mekong.In: The Mekong. Academic Press, San Diego, pp. 251–272.
onstanza, R., d’Arge, R., de Groots, R., Farber, S., Grasso, M., Hannon, B., Limburg,K., Naeem, S., O’Neill, R., Paruelo, J., Raskin, R., Sutton, P., van den Belt, M., 1997.The value of the world’s ecosystem services and natural capital. Nature 387,253–260.
ooperman, M.S., So, N., Arias, M.E., Cochrane, T.A., Elliott, V., Hand, T., Hannah, L.,Holtgrieve, G.W., Kaufman, L., Koning, A.A., Koponen, J., Kum, V., McCann, K.,McIntyre, P.B., Bunnara, M., Ou, C., Rooney, N., Rose, K., Sabo, J., Winemiller, K.O.,2012. A watershed moment for the Mekong: newly announced community useand conservation areas for the Tonle Sap Lake may boost sustainability of theworld’s largest inland fishery. Cambodian Journal of Natural History, 101–106.
ai, A., 2011. Characteristics and trends in various forms of the Palmer DroughtSeverity Index during 1900–2008. Journal of Geophysical Research 116, D12115.
avidson, P.J., 2006. The Biodiversity of the Tonle Sap Biosphere Reserve: 2005 StatusReview.
ay, M.D., Hodell, D.A., Brenner, M., Curtis, J.H., 2011. Middle to late Holoceneinitiation of the annual flood pulse in Tonle Sap Lake, Cambodia. Journal ofPaleolimnology, 85–99.
eAngelis, D.L., Gross, L.J., Huston, M.A., Wolff, W.F., Fleming, D.M., Comiskey, E.J.,Sylvester, S.M., 1998. Landscape modeling for everglades ecosystem restoration.Ecosystems 1, 64–75.
elgado, J.M., Merz, B., Apel, H., 2012. A climate-flood link for the lower MekongRiver. Hydrology and Earth System Sciences 16, 1533–1541.
itz, H.C., Trimble, B., 2006. Documentation of the Everglades Landscape Model: ELMv2.5. South Florida Water Management District, West Palm Beach, USA.
ujii, H., Garsdal, H., Ward, P., Ishii, M., Morishita, K., Boivin, T., 2003. Hydrologicalroles of the Cambodian Floodplain of the Mekong River. International Journal ofRiver Basin Management 1, 1–14.
lling 272 (2014) 252– 263
Gaff, H., DeAngelis, D.L., Gross, L.J., Salinas, R., Shorrosh, M., 2000. A dynamiclandscape model for fish in the Everglades and its application to restoration.Ecological Modelling 127, 33–52.
Grumbine, R.E., Xu, J., 2011. Mekong hydropower development. Science 332, 178.Hirabayashi, Y., Mahendran, R., Koirala, S., Konoshima, L., Yamazaki, D., Watanabe, S.,
Kim, H., Kanae, S., 2013. Global flood risk under climate change. Natural ClimateChange 3, 816–821.
Holtgrieve, G.W., Arias, M.E., Irvine, K.N., Ward, E.J., Kummu, M., Koponen, J., Richey,J.E., Lamberts, D., 2013. Ecosystem metabolism and support of freshwater cap-ture fisheries in the Tonle Sap Lake, Cambodia. PLoS ONE 8, e71395.
Hortle, K.G., 2007. Consumption and the yield of fish and other aquatic animalsfrom the Lower Mekong Basin (No. MRC Technical Paper No. 16). Mekong RiverCommission, Vientiane, Lao PDR.
Intergovernmental Panel on Climate Change (IPCC), 2007. Climate Change 2007: ThePhysical Science Basis. Contribution of Working Group I to the Fourth Assess-ment Report of the Intergovernmental Panel on Climate Change. CambridgeUniv. Press, Cambridge, UK.
Irvine, K.N., Richey, J.E., Holtgrieve, G.W., Sarkkula, J., Sampson, M., 2011. Spatialand temporal variability of turbidity, dissolved oxygen, conductivity, tempera-ture, and fluorescence in the lower Mekong River–Tonle Sap system identifiedusing continuous monitoring. International Journal of River Basin Management9, 151–168.
Johnston, R., Kummu, M., 2011. Water resource models in the Mekong basin: areview. Water Resources Management, 1–27.
Junk, W.J., Bayley, P.B., Sparks, R.E., 1989. The flood pulse concept in river-floodplainsystems. In: International Large River Symposium, Canadian Special Publicationof Fisheries and Aquatic Sciences, pp. 110–127.
Junk, W.J., An, S., Finlayson, C.M., Gopal, B., Kvet, J., Mitchell, S.A., Mitsch, W.J.,Robarts, R.D., 2013. Current state of knowledge regarding the world’s wetlandsand their future under global climate change: a synthesis. Aquatic Sciences 75,151–167.
Kareiva, P.M., 2012. Dam choices: analyses for multiple needs. Proceedings of theNational Academy of Sciences 109, 5553–5554.
Kingston, D., Thompson, J., Kite, G., 2011. Uncertainty in climate change projectionsof discharge for the Mekong River Basin. Hydrology and Earth System Sciences15, 1459–1471.
Koponen, J., Kummu, M., Lauri, H., Virtanen, M., Inkala, A., Sarkkula, J., 2010a. 3DModelling User Guide (Final Report). DMS – Detailed Modelling Support Project.MRC Information Knowledge Management Programme/Finnish EnvironmentInstitute (SYKE)/EIA Centre of Finland Ltd.
Koponen, J., Lamberts, D., Sarkkula, J., Inkala, A., Junk, W.J., Halls, A.S., Kshatriya,M., 2010b. Primary and Fish Production Report (Final Report). DMS – DetailedModelling Support Project. MRC Information Knowledge Management Pro-gramme/Finnish Environment Institute (SYKE)/EIA Centre of Finland Ltd.
Kubiszewski, I., Constanza, R., Paquet, P., Halimi, S., 2012. Hydropower developmentin the lower Mekong basin: alternative approaches to deal with uncertainty.Regional Environmental Change 13 (1), 3–15.
Kummu, M., Sarkkula, J., 2008. Impact of the Mekong River flow alteration on theTonle Sap flood pulse. AMBIO 37, 185–192.
Kummu, M., Penny, D., Sarkkula, J., Koponen, J., 2008. Sediment: curse or bless-ing for Tonle Sap lake? AMBIO: A Journal of the Human Environment 37,158–163.
Kummu, M., Lu, X.X., Wang, J.J., Varis, O., 2010. Basin-wide sediment trappingefficiency of emerging reservoirs along the Mekong. Geomorphology 119,181–197.
Kummu, M., Tes, S., Yin, S., Adamson, P., Józsa, J., Koponen, J., Richey, J., Sarkkula,J., 2013. Water balance analysis for the Tonle Sap lake – floodplain system.Hydrological Processes, http://dx.doi.org/10.1002/hyp.9718.
Kuper, M., Mullon, C., Poncet, Y., Benga, E., 2003. Integrated modelling of the ecosys-tem of the Niger river inland delta in Mali. Ecological Modelling 164, 83–102.
Lamberts, D., 2006. The Tonle Sap lake as a productive ecosystem. InternationalJournal of Water Resources Development 22, 481–495.
Lamberts, D., Koponen, J., 2008. Flood pulse alterations and productivity of the TonleSap ecosystem: a model for impact assessment. AMBIO 37, 178–184.
Lauri, H., de Moel, H., Ward, P.J., Räsänen, T.A., Keskinen, M., Kummu, M., 2012. Futurechanges in Mekong River hydrology: impact of climate change and reservoiroperation on discharge. Hydrology and Earth System Sciences 16, 4603–4619.
Linhoss, A.C., Munoz-Carpena, R., Allen, M.S., Kiker, G., Mosepele, K., 2012. A floodpulse driven fish population model for the Okavango Delta, Botswana. EcologicalModelling 228, 27–38.
Melack, J.M., 1976. Primary productivity and fish yields in tropical lakes. Transac-tions of the American Fisheries Society 105, 575–580.
MRC, 2005. Overview of the hydrology of the Mekong Basin. MRC, Vientiane, LaoPDR.
MRC, 2009. Mekong River Commission Spatial Database. Mekong River Commission,Vientiane, Lao PDR.
Orr, S., Pittock, J., Chapagain, A., Dumaresq, D., 2012. Dams on the Mekong River:lost fish protein and the implications for land and water resources. Global Envi-ronmental Change 22, 925–932.
Penny, D., 2006. The Holocene history and development of the Tonle Sap, Cambodia.Quaternary Science Reviews 25, 310–322.
Penny, D., Cook, G., Im, S.S., 2005. Long-term rates of sediment accumulation in theTonle Sap, Cambodia: a threat to ecosystem health? Journal of Paleolimnology33, 95–103.
Piman, T., Cochrane, T.A., Arias, M.E., Green, A., Dat, N.D., 2012. Assessment of flowchanges from hydropower development and operations in Sekong, Sesan and

Mode
P
R
R
R
S
S
S
chemical seasonality of major cations in a Central Amazonian floodplain lake.
M.E. Arias et al. / Ecological
Srepok rivers of the Mekong basin. Journal of Water Resources Planning andManagement.
iman, T., Lennaerts, T., Southalack, P., 2013. Assessment of hydrological changes inthe lower Mekong basin from basin-wide development scenarios. HydrologicalProcesses 27, 2115–2125.
äsänen, T.A., Kummu, M., 2013. Spatiotemporal influences of ENSO on precipi-tation and flood pulse in the Mekong River Basin. Journal of Hydrology 476,154–168.
äsänen, T.A., Lehr, C., Mellin, I., Ward, P.J., Kummu, M., 2013. Palaeoclimatolog-ical perspective on river basin hydrometeorology: case of the Mekong Basin.Hydrology and Earth System Sciences 17, 2069–2081.
eyes, E., White, M.L., Martin, J.F., Kemp, G.P., Day, J.W., Aravamuthan, V., 2000.Landscape modeling of coastal habitat change in the Mississippi Delta. Ecology81, 2331–2349.
áenz, L., Mulligan, M., 2013. The role of Cloud Affected Forests (CAFs) on waterinputs to dams. Ecosystem Services 5, 69–77.
arkkula, J., Koponen, J., 2010. DMS – Detailed Modelling Support Project (Final
Report). MRC Information Knowledge Management Programme/Finnish Envi-ronment Institute (SYKE)/EIA Centre of Finland Ltd.arkkula, J., Koponen, J., Hellsten, S., Keskinen, M., Kiirikki, M., 2003. MRCS/WUP-FINModel Report: Modelling Tonle Sap watershed and lake processes for environ-mental change assessment. MRC/WUP-FIN.
lling 272 (2014) 252– 263 263
Sarkkula, J., Koponen, J., Lauri, H., Virtanen, M., 2010. Origin, fate and role ofMekong sediments (Final Report), DMS – Detailed Modelling Support Project.MRC Information Knowledge Management Programme/Finnish EnvironmentInstitute (SYKE)/EIA Centre of Finland Ltd.
Thompson, J.R., Green, A.J., Kingston, D.G., Gosling, S.N., 2013. Assessment of uncer-tainty in river flow projections for the Mekong River using multiple GCMs andhydrological models. Journal of Hydrology 486, 1–30.
Van Griensven, A., Meixner, T., Grunwald, S., Bishop, T., Diluzio, M., Srinivasan, R.,2006. A global sensitivity analysis tool for the parameters of multi-variablecatchment models. Journal of Hydrology 324, 10–23.
Västilä, K., Kummu, M., Sangmanee, C., Chinvanno, S., 2010. Modelling climatechange impacts on the flood pulse in the Lower Mekong floodplains. Journalof Water and Climate Change 01, 67–86.
WB, 2004. Modelled Observations on Development Scenarios in the Lower MekongBasin. World Bank, Vientiane, Lao PDR.
Weber, G.E., Furch, K., Junk, W.J., 1996. A simple modelling approach towards hydro-
Ecological Modelling 91, 39–56.Ziv, G., Baran, E., Nam, S., Rodriguez-Iturbe, I., Levin, S.A., 2012. Trading-off fish bio-
diversity, food security, and hydropower in the Mekong River Basin. Proceedingsof the National Academy of Sciences 109, 5609–5614.