Measuring to understand intangible performance drivers
39
MEASURING TO UNDERSTAND INTANGIBLE PERFORMANCE DRIVERS 1 Ulf Johanson, Maria Mårtensson, Matti Skoog [email protected] , [email protected] , [email protected] 2000-10-17 1 The present project is one of several subprojects in the MERITUM (Measuring Intangibles to Understand and Improve Innovation Management) project. The aim of the MERITUM project is to investigate the feasibility of measuring and reporting intangibles. Nine universities and research institutes in six European countries are currently participating in the project.The present project has been accomplished thanks to financial support from the European Commission, OECD, the Swedish Council for Work Life Research, Nutek, the Swedish Ministry of Trade and Industry , and the Swedish Public Relations Association.
Transcript of Measuring to understand intangible performance drivers

MEASURING TO UNDERSTAND
INTANGIBLE PERFORMANCE
DRIVERS1
Ulf Johanson, Maria Mårtensson, Matti Skoog
[email protected], [email protected], [email protected]
2000-10-17
1The present project is one of several subprojects in the MERITUM (Measuring Intangibles to Understand
and Improve Innovation Management) project. The aim of the MERITUM project is to investigate the
feasibility of measuring and reporting intangibles. Nine universities and research institutes in six European
countries are currently participating in the project.The present project has been accomplished thanks to
financial support from the European Commission, OECD, the Swedish Council for Work Life Research,
Nutek, the Swedish Ministry of Trade and Industry , and the Swedish Public Relations Association.

Measuring and Managing Intangibles – Eleven Swedish Qualitative Explanatory Case Studies.
Stockholm University, School of Business
Johanson, U., Mårtensson, M., & Skoog, M.
2
School of Business
Stockholm University
Abstract
The present qualitative study explores what 11 Swedish organizations have systematically worked at to increase
the understanding of the importance of intangibles as performance drivers. The present analysis is accomplished
using a combination of evolutionary theory, knowledge-based theory and organizational learning. The results
indicate that assets in an accounting sense seem to be of less interest than perceptions of activities that enable
future performance. These 'enablers' are often customer and employee perceptions of individual, organizational,
and relational competence. The way for the firms to ascertain a continuous organizational learning process with
respect to the value creation chain is to measure intangibles as well as to maintain organizational routines that
ensure the transformation of measurement results into action.

Measuring and Managing Intangibles – Eleven Swedish Qualitative Explanatory Case Studies.
Stockholm University, School of Business
Johanson, U., Mårtensson, M., & Skoog, M.
3
1. INTRODUCTION
Powerful forces are reshaping the economic and business world and many of these powers have
led to a fundamental shift in organizational processes. The prime forces of change include
globalization, higher degrees of complexity, new technology, increased competition, changing-
client demands, and changing economic and political structures. Such a development has
resulted in steep learning curves, in that companies struggle to adapt quickly, respond faster,
and to proactively shape their industries. Organizations are beginning to recognize that
technology-based competitive advantages are transient and that the only truly sustainable
competitive advantages they have are their intangible resources. The interest in intangibles has
grown rapidly in numerous fields, including economics, accounting, and strategic management.
The literature on intangibles exploded throughout the 1990s (Johanson et al., 1999) and many
firms, as well as influential organizations (e.g., the OECD, European Commission, Brookings
Institute, and the Conference Board), embraced intangibles wholeheartedly onto their agenda.
One of the main problems in understanding the importance of intangibles appears to be that,
while there is still a heavy reliance on financial information, there is a general lack of
information on intangibles. In response to this information gap or lack of understanding many
concepts and measurement models have been proposed over the years. A couple of the “older”
concepts are human resources (HR), human resource accounting (HRA) and utility analysis
(UA) those were proposed already in the 1960s. About 30 studies have been performed during
the past 20 years concerning the effects of HR measurements on decision-making and
learning (Johanson, 1999a). The studies reveal that measurements make a meaningful
difference on decision-making and individual managerial learning, whereas integration in the
organizational routines is seriously hampered or blocked entirely.
HRA and UA, as for many other concepts, continue to exist within a traditional financial
accounting framework. However, in the 1990s new and different models were proposed. Some
of these models include the balanced scorecard (BSC) (Kaplan & Norton, 1992), intellectual
capital (IC) (Edvinsson and Malone, 1997), and the intangible assets monitor (Sveiby, 1997). A
common feature linking these models is that although they still rely on measurements, financial
information is only looked upon as one element of the information that is needed. Up to now
there is a lack of rigorous scientific investigations on the consequences of the implementation of

Measuring and Managing Intangibles – Eleven Swedish Qualitative Explanatory Case Studies.
Stockholm University, School of Business
Johanson, U., Mårtensson, M., & Skoog, M.
4
these non-financial models (Johanson et al., 1999). Nevertheless, there is some evidence to
suggest that there is considerable enthusiasm to employ these models (e.g., the BSC for
managerial control) (Olve et al., 1997; Kaplan & Norton, 1999, Ax and Björnemark, 2000).
HRA, BSC, IC statements, the intangible assets monitor, and other models have sometimes
(though not often) been utilized in annual reports (Ehrvervsudviklingsrådet, 1997; Johanson et
al, 1999; Guthrie et al., 1999). Even if investors and analysts frequently state their strong
interest in taking information on intangibles into account (Epstein & Freedman, 1994; Mavrinac
& Boyle, 1996), it appears that what ultimately counts is conventional financial information
(Eccles & Mavrinac, 1995; Carlsson & Eliasson, 1991). Why is it that investors and analysts
stubbornly decline to rely on intangible information? Is it because of a fear that the external
reporting is not based on internal measurement routines (MR) utilized for managing the firm?
The concept MR refers in this paper to the evolutionary (Nelson & Winter, 1973 and 1982)
and knowledge-based theories (Grant, 1996; Roberts, 1999) indicating that the firm is
regarded as an institution for knowledge creation and exploitation through a set of rules and
routines.
The paper aims at investigating how MRs enhance the understanding of how intangibles
contribute to economic competence, i.e. the ability of the firm to create and exploit business
opportunities (Carlsson & Eliasson, 1991). This is to say that the unit of activity to be
analyzed is not primarily individuals but MRs. Measurement pertains to the process of
assigning numerals to resources. Resources could be assets, activities, or relations. The
concept of intangible resources will be discussed in greater detail later but it could be stated
already that the unit of analysis is the social construction of intangibles.
Boudreau (1998) proposes that human resource metrics are not linked to organizational
outcomes but many practitioners, policy making organizations, and individual firms have
argued in favor of utilizing some kind of measurement model for the purpose of not only
external reporting of intangibles but even management control. Most organizations are
transforming their management control systems continuously, and nowadays they are often
based on including more intangible aspects into their management control routines (Almqvist
and Skoog, 1999). Why do firms want to expand MRs into the intangible resource area? What

Measuring and Managing Intangibles – Eleven Swedish Qualitative Explanatory Case Studies.
Stockholm University, School of Business
Johanson, U., Mårtensson, M., & Skoog, M.
5
kinds of intangibles are measured? How are they measured? How are the measurements
utilized?
Regarding the management of intangibles, many MRs, such as the BSC, have been suggested
with the explicit objective of enhancing learning, i.e., to improve the understanding of
intangibles. After a review of the literature on experiences of putting intangibles into financial
and non-financial frameworks (Johanson et al., 1999), it is evident that no published study, at
least to our knowledge, has been reported on how non-financial models work in relation to
understanding the importance of intangibles and mobilizing action regarding intangibles.
Understanding and mobilizing can be seen as two aspects of managing. Ideally, understanding
is a precondition for mobilizing action. It is not self-evident to separate the two because, as
Schön (1986) suggests, action and learning might be a simultaneous process. Nevertheless, it
appears worthwhile to sever the two aspects since it increases our understanding of what is
actually going on in firms that have experience with measurement and management of
intangibles.
The present paper focuses on what firms do to expand MRs into the field of intangibles in
order to increase the understanding of the importance of intangibles. However, mobilizing
action with respect to intangibles might also be a part of the learning process regarding the
importance of intangibles. This means that even the mobilizing routines will be subject to
interest although it is not action per see that is of interest but action as a part of feedback in
the learning process.
The idea of the paper is to take advantage of the comparably long experience with measuring
intangibles in Sweden. The purpose is to determine what actions have been taken by a number
of “experienced” firms with respect to understanding the importance of intangibles as
performance drivers and in mobilizing these intangibles.
The paper starts with an outline of the theoretical framework that has served as a background in
the interpretation of empirical data. Before presenting the methodology that has been applied
we reflect upon definitions of intangibles as well as different models for measuring intangibles.

Measuring and Managing Intangibles – Eleven Swedish Qualitative Explanatory Case Studies.
Stockholm University, School of Business
Johanson, U., Mårtensson, M., & Skoog, M.
6
The major part of the article is devoted to empirical findings. In the concluding section
empirical data are subject to analysis by means of the theoretical framework.
2. THEORETICAL FRAMEWORK
To help understand the present research interest numerous theoretical frameworks can be
applied. A combination of knowledge-based theory, knowledge management, organizational
learning and evolutionary theory has served as a filter for analyzing empirical data in the
present exploratory investigation.
In an evolutionary theory approach the firm is characterized by relatively constant patterns of
behaviors or rules (Nelson & Winter, 1973 and 1982). These rules are subject to an
evolutionary process in the sense that they are evaluated, reproduced, eliminated, varied, and
selected. The rules may be grouped into three levels: at level 0, relatively fixed rules
(operating characteristics) govern short-term behavior; at level 1, there are investment rules,
recording rules, and influencing rules. Level 2 incorporates search rules that modify all lower-
ranking rules (including the search rules themselves). The rules affect physical states (the
physical capital stock), knowledge (the ‘contents of file drawers and human memories’) and
external states (the attitudes that are directed toward the firm from the external environment,
including customers, competitors, and the public).
Nelson & Winter define knowledge as being comprised of codified, public, and easily
communicated knowledge (termed information), including tacit knowledge (Polanyi, 1983).
Further, the knowledge-state is split into technological and economic competence. Economic
competence is defined as the ability of a firm to create and exploit business opportunities
(Carlsson & Eliasson, 1991).
Further, Winter (1986, p. 165) states that an organizational routine is a “relatively complex
pattern of behavior … triggered by a relatively small number of initiating signals or choices
and functioning as a recognizable unit in a relatively automatic fashion.” The provocative
feature with routines is their ability to support complex patterns of interactions between

Measuring and Managing Intangibles – Eleven Swedish Qualitative Explanatory Case Studies.
Stockholm University, School of Business
Johanson, U., Mårtensson, M., & Skoog, M.
7
individuals in the absence of directives or rules (Grant, 1996). Grant defines rules as standards
that regulate the interactions between individuals.
The evolutionary theory approach might suggest that measurements gradually extend into new
areas because there is an overall search rule stating that measurements are important and
contribute to the success of an organization.
Evolutionary theory is intimately related to knowledge-based theory. A firm’s distinctive
competence is based on the specialized resources, assets, and skills it possesses, and focuses
attention on their optimal utilization to build competitive advantage and economic wealth
(Penrose, in Rutihinda, 1996, p. 36). In an evolutionary approach the firm is regarded as an
institution for knowledge application. Knowledge creation is, according to Grant (1996), an
individual activity and the fundamental task for the organization is to coordinate specialized
individual knowledge. In the process of coordination four important mechanisms may be
identified: rules and directives, sequencing, routines, and group-related solving and decision-
making. The knowledge-based theory of the firm “postulates that knowledge is the only
resource that provides sustainable competitive advantage, and, therefore, the firm’s attention
and decision-making should focus primarily on knowledge and the competitive capabilities
derived from it” (Roberts, 1999). The firm is considered a knowledge integrating institution.
Its role is neither the acquisition nor the creation of organizational knowledge; this is the role
and prerequisite of the individual. Knowledge resides in and with individual people; the firm
merely integrates the individually owned knowledge by providing structural arrangements of
coordination and co-operation of specialized knowledge workers. In other words, the firm
focuses on the organizational processes flowing through these structural arrangements,
through which individuals engage in knowledge creation, storage, and deployment (Roberts,
1999; see also Grant, 1996).
Demarest (1997) introduces the concept ‘commercial knowledge,’ a concept related to
effective performance. He is defining the concept as “an explicitly developed and managed
network of imperatives, patterns, rules, and scripts embodied in some aspect of the firm, and
distributed throughout the firm, that creates marketplace performances” (Ibid., p. 377). The
term ‘imperatives’ refers to behavioral directives that are unchallenged; ‘patterns’ refer to
predictive models that have a certain longevity (e.g., “if a customer has never called with a

Measuring and Managing Intangibles – Eleven Swedish Qualitative Explanatory Case Studies.
Stockholm University, School of Business
Johanson, U., Mårtensson, M., & Skoog, M.
8
product complaint before, you can expect the following kinds of behavior…”). The difference
between rules and scripts is that rules might exist as general postulates while scripts are
coordinated sets of rules targeted at a particular context. Commercial knowledge is tacit,
shared by a group or embodied in raw materials, products and services, machinery and
mechanisms, business practices and processes, or in the environment and culture.
Coordinating knowledge means learning, and experiential learning theories of firms assert
that actions and beliefs change as a result of monitoring and interpreting consequences of past
actions (Docherty, 1996). This could also be a definition of organizational learning (OL). The
latter concept has been defined by numerous authors (e.g., Argyris & Schön, 1978; Hedberg,
1981; Schön, 1986; Levitt & March 1988; Senge, 1990). A mutual aspect of these proposals is
that OL not only refers to understanding but also to taking some sort of coordinated action
based on the new knowledge acquired. Johanson & Nilson (1995) hold that OL is present
when domination beliefs are changed and coordinated action has taken place.
A proactive approach to organizational learning is knowledge management that is often
described either as a strategically focused management tool or as an information handling tool
(Mårtensson, 2000). To create a knowledge management strategy, an organization needs to
build systems for capturing and transferring internal knowledge and best practices (Allerton,
1998). Knowledge management has to consider (1) the construction of knowledge; (2) the
transformation of tacit knowledge into processes, practices, and machinery (embodiment); (3)
the dissemination of embodied knowledge throughout the value chain; and (4) the application
of disseminated knowledge to particular problems (Demarest, 1997).
In the strategic management literature, a distinction is sometimes drawn between the
formulation and the implementation of a strategy. The purpose of formulating and
implementing strategy is to link the firm to the environment in a way that generates
competitive advantage to enhance the firm’s long-term goals. A common point of departure
for strategy formulation concerns analyses of external factors and in-house conditions. Next, a
strategy is sought that aims at utilizing the organization’s skills and other resources in the best
way possible. The implementation phase involves executing the strategy that has been
formulated (Grönhaug & Nordhaug, 1992), i.e. it refers to mobilizing attention and action by,
for example, employees and customers.
Measuring and Managing Intangibles – Eleven Swedish Qualitative Explanatory Case Studies.
Stockholm University, School of Business
Johanson, U., Mårtensson, M., & Skoog, M.
9
Coyne (1986) holds that there are four sources (differentials) of competitive advantage:
(1) Positional, for example, customer loyalty as a result of past actions. These states
contribute to a competitive edge because of the long time it normally takes for competitors
to copy them.
(2) Regulatory or legal entities such as patents and contracts.
(3) Functional, which is created from the competence of employees and others in the value
chain.
(4) Cultural, which comprises, for example, organizational habits, attitudes, beliefs, and
values.
A formulation or an understanding of the role of the intangible resources in a business may be
achieved by analyzing the competitive advantage observed in the market place, the capability
differentials that produce this advantage, and the intangible resources that act as a wellspring
(Hall 1992). The interest in increasing the understanding may refer to (1) the firm specific value
creation chain (i.e., which intangibles are critical to the success of the firm, how do they
interact, and how should they be managed?) and (2) the possibility of measuring those critical
intangibles and interactions.
3. DEFINITIONS, CLASSIFICATIONS, AND MEASUREMENTS OFINTANGIBLES
As is so often the case for many concepts, “intangibles” has no generally accepted definition.
Canibano & Sanchez (1998) state that the adjective “intangible” normally accompanies
different concepts, such as assets, investments, resources, or other phenomena. The
transformation of the adjective into a noun is suggestive of the absence of a broadly accepted
definition. Numerous definitions and classifications of intangibles have been proposed,
particularly during the last decade (Johanson et al., 1999). Not surprisingly, there is a lack of
consensus because constituents of what could be regarded as intangibles are dependent on the
purpose of addressing the concept, for example, accounting, statistics related to national
accounts, and management control. Furthermore, different theories about firms also affect the
way in which characteristics and hence definitions of intangibles are formulated. The various

Measuring and Managing Intangibles – Eleven Swedish Qualitative Explanatory Case Studies.
Stockholm University, School of Business
Johanson, U., Mårtensson, M., & Skoog, M.
10
definitions that have been suggested will not be discussed in the present paper (for a more
detailed report, see Johanson et al., 1999). Johanson (1999b) suggests that classifications
found in the literature or specified by different firms could be arranged according to the
following four categories.
A. A dichotomized proposal of classification is perhaps the most common one in the
literature. The characteristics of these dichotomies are, for example, legal ownership or
not; purchased externally or internally produced; and people dependent or people
independent (compare Hall, 1992).
B. When classifying intangible investments, the most common categorization appears to be
R&D, software, marketing, and organization. Examples of this classification are the
proposals made by the OECD (1992) and Statistics Netherlands (1998)
C. Many practitioners propose a simple three-way classification of human, market, and
structure capital. These suggestions are now widely dispersed (e.g., Petrash, 1996 and
Sveiby, 1997).
D. In recent literature, it has been suggested that integral components of intangibles include
not only static states and input factors but also processes and future opportunities.
Therefore, considering assets and activities, “facts” and perceptions are proposed to be a
more revealing classification. Haanes & Lowendahl (1997) categorize intangible resources
into competence and relational resources. Relational resources refer to reputation, client
loyalty, etc., which are conceived of as being fundamental to the performance of the firm.
Competence is defined as the ability to perform a given task and exists at both the individual
and organizational level. On the individual level, competence includes knowledge, skills, and
aptitudes; on the organizational level, it includes client-specific databases, technology,
routines, methods, procedures, and organizational culture.
Individual organizations and authors (Canibano et al., 1998; Johanson et al., 1999) have
suggested numerous procedures to measure intangibles. In the present paper only models with
a Swedish origin are selected. This is due to the assumption that the “Swedish” models may
have had a more significant impact on Swedish companies than those originating outside the
country.

Measuring and Managing Intangibles – Eleven Swedish Qualitative Explanatory Case Studies.
Stockholm University, School of Business
Johanson, U., Mårtensson, M., & Skoog, M.
11
Based on the external reporting on intangibles in 10 Danish (PLS Consult, Ramboll,
Sparekassen Nord Jylland) and Swedish (Skandia, Telia, ABB, Luftfartsverket, Sparbanken
Sverige, WM Data, Consultus) organizations, Erhvervsudviklingsrådet (1997) classifies a
number of measurements of intangibles based on three questions; How it is? What is done?,
and What is the output?
The intention with these measurements is to highlight value drivers linked to knowledge
embedded in people, customer relations, technology, and internal processes. The indices
suggest that much, if not all, is possible. ”There is an open invitation to all kinds of
measurements, and there is certainly the possibility to assemble indicators from at least four
themes that can justify measurements (Mouritsen, 1998 p. 10).”
Olve et al. (1998) present BSC applications found in 12 British and Swedish firms. They hold
that financial measures are normally outcome oriented, whereas renewal and development
measures contain performance drivers. The customer and the process focus comprise a
mixture of outcomes and performance drivers.
Roos & Roos (1997) interviewed executives in five small Northern-European countries in
order to develop an intellectual capital (IC) process model. The authors reported extremely
positive reactions toward IC and a number of strategically important process factors could be
identified. The authors concluded that to develop an IC routine the company must be mature
enough to go beyond solely financial indicators, have a clearly defined business orientation,
and a distinct operational commitment to moving ahead. The IC routine should also measure
only the IC change affecting the long-term earning capability and it must be rooted in the
language of the company. From the interview data, a classification scheme of IC and
measurements of different intangibles was also developed, containing measures linked to
human, organizational, customer and relational capital.
Sveiby (1997) proposes an intangible asset monitor in which financial capital, customer
capital, the organization, and the people are measured by means of growth/renewal,
efficiency, and stability. The monitor is often used as a complement to traditional annual
reports.

Measuring and Managing Intangibles – Eleven Swedish Qualitative Explanatory Case Studies.
Stockholm University, School of Business
Johanson, U., Mårtensson, M., & Skoog, M.
12
In association with 11 major Swedish companies, the Swedish Public Relations Association
(1996) offers measurements of intangibles into five segments that separate individually owned
from company owned resources, such as leadership, market, finance, employees and
community.
Since 1987, the business aspect of the SIFO group has been to serve as market leaders of
management control methods for intangibles in Sweden. They identify their model in terms of
Management of Intangible Assets (MIA) (Ennerfeldt et al., 1996), suggesting that the model
is a third generation offspring, where the first generation comprised organizational surveys
concerning ‘the invisible contract’ between employers and employees. The MIA mainly
comprises measurements of attitudes.
To conclude, although there is certainly no shortage of propositions on measurements of
intangibles, the extent to which these models are actually practiced remains obscure.
Hansson (1998) warns that BSC indicators suggested by different authors are too restricted
because they do not capture the unique drivers and processes fundamental to the firm’s
output. Examples of such drivers might be feelings, values, beliefs, relationships, fear, and
dreams. Lank (1997) appears to agree in part with the opinion of Hansson. Lank enumerates a
certain number of management measures that have gained acceptance in different
organizations. These management measures include training days per employee, total time
spent in training, number of personal development plans completed, number of performance
appraisals completed, and assessment against competency frameworks. Lank (1997) argues
that, even if flawed, these measures demonstrate management's belief in the importance of
individual learning, but points out that the development of intellectual capital (or the process
of knowledge management) requires a different perspective. To learn about that development
a new set of questions must be asked: How well do employees share their knowledge and
expertise with colleagues? What processes could be found which make it easy for them to do
so? What rewards and incentives contribute to the knowledge base? How is the value of
intellectual capital measured?
Measuring and Managing Intangibles – Eleven Swedish Qualitative Explanatory Case Studies.
Stockholm University, School of Business
Johanson, U., Mårtensson, M., & Skoog, M.
13
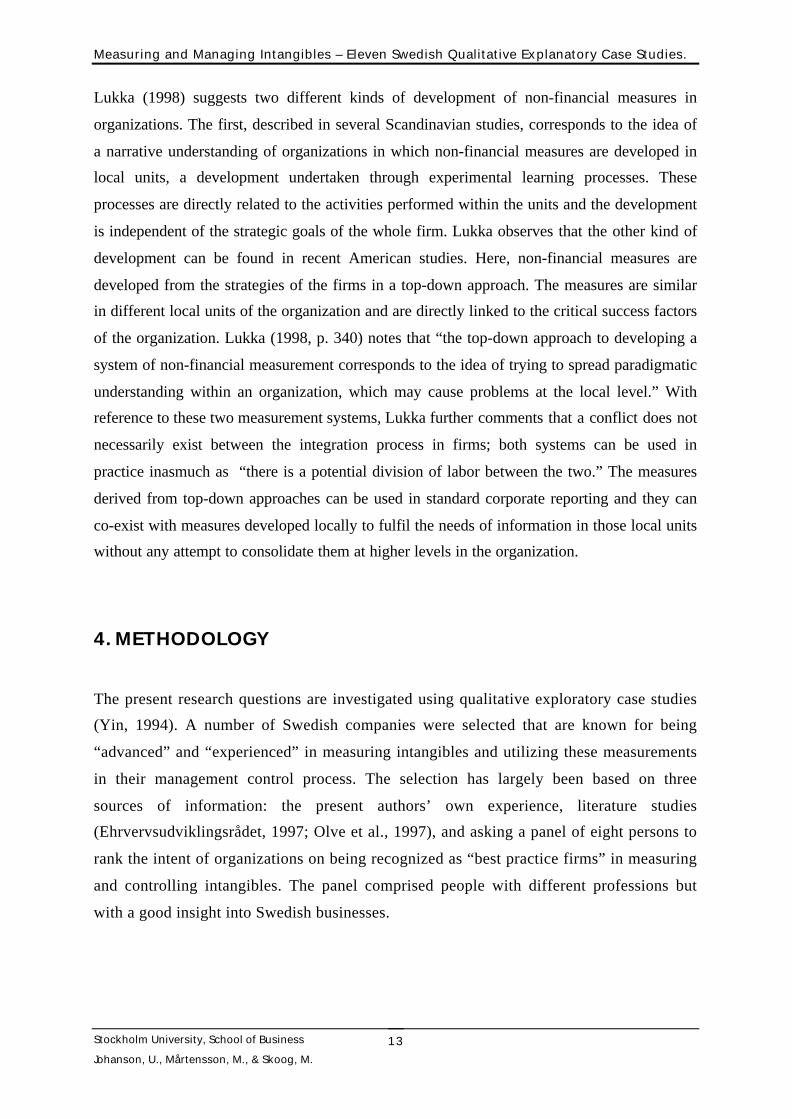
Lukka (1998) suggests two different kinds of development of non-financial measures in
organizations. The first, described in several Scandinavian studies, corresponds to the idea of
a narrative understanding of organizations in which non-financial measures are developed in
local units, a development undertaken through experimental learning processes. These
processes are directly related to the activities performed within the units and the development
is independent of the strategic goals of the whole firm. Lukka observes that the other kind of
development can be found in recent American studies. Here, non-financial measures are
developed from the strategies of the firms in a top-down approach. The measures are similar
in different local units of the organization and are directly linked to the critical success factors
of the organization. Lukka (1998, p. 340) notes that “the top-down approach to developing a
system of non-financial measurement corresponds to the idea of trying to spread paradigmatic
understanding within an organization, which may cause problems at the local level.” With
reference to these two measurement systems, Lukka further comments that a conflict does not
necessarily exist between the integration process in firms; both systems can be used in
practice inasmuch as “there is a potential division of labor between the two.” The measures
derived from top-down approaches can be used in standard corporate reporting and they can
co-exist with measures developed locally to fulfil the needs of information in those local units
without any attempt to consolidate them at higher levels in the organization.
4. METHODOLOGY
The present research questions are investigated using qualitative exploratory case studies
(Yin, 1994). A number of Swedish companies were selected that are known for being
“advanced” and “experienced” in measuring intangibles and utilizing these measurements
in their management control process. The selection has largely been based on three
sources of information: the present authors’ own experience, literature studies
(Ehrvervsudviklingsrådet, 1997; Olve et al., 1997), and asking a panel of eight persons to
rank the intent of organizations on being recognized as “best practice firms” in measuring
and controlling intangibles. The panel comprised people with different professions but
with a good insight into Swedish businesses.

Measuring and Managing Intangibles – Eleven Swedish Qualitative Explanatory Case Studies.
Stockholm University, School of Business
Johanson, U., Mårtensson, M., & Skoog, M.
14
In all, 11 organizations were approached. The sample comprises the following companies:
banks (2), software (2), construction (1), telecommunication (1), office equipment (1),
education consultant (1), public relations consultant (1), transportation (1), and
engineering (1). The majority of the companies are large or medium-sized (more than 500
employees), except for the two consulting firms that have a maximum of 100 employees.
In the large firms only one of the divisions has been subject to investigation. One of the
two Software companies and the Office Equipment Company have their headquarters in
the USA while the remaining firms are Swedish-based.
The methodology has similarities with grounded theory (Glaser & Strauss, 1967; Strauss
& Corbin, 1990; Parker & Roffey, 1997; Slagmulder, 1997). Documents and respondents
have been selected taking “saturation” into account, and previously acquired data have
been coded, classified, and reclassified simultaneously with the collection of newly
acquired data. Data have been collected using focused interviews (Gilbert, 1993) in
addition to studying documents describing the measurement and control routines. The
specific question areas used include the following:
1. About the development of the MR and the goal of measuring.
What caused the development of the present MR?
2. About the content.
What is measured?
How is it measured?
3. About the work.
Concerning measuring, who is doing what and when is it being done?
What is reported internally and externally?
What is accomplished to mobilise change based on measurement results?
4. About outcomes.
What is the outcome of measuring and reporting? Are decision-making, learning, and
company performance all significantly influenced?
Within each organization, from one to six persons were interviewed and a large number of
documents were studied. The organization selected the respondents. Because the present

Measuring and Managing Intangibles – Eleven Swedish Qualitative Explanatory Case Studies.
Stockholm University, School of Business
Johanson, U., Mårtensson, M., & Skoog, M.
15
interest was to find “best practice” cases, the bias in selecting respondents in favor of the
MR and the measurements actually used do not cause any difficulties. In total, 43
interviews were performed and about 70 documents were analyzed. Note that general
conclusions about all employees and about all aspects of the organization cannot be
drawn. This is not the point, however.
Three researchers normally took part in the interviews and in the assessment of the
documents. Each researcher wrote a note for each source. In these notes, data were
categorized in a way that appears to be fruitful to understanding what it is that is coming
about in the different organizations. The researchers have subsequently discussed and
compared their respective notes. From these discussions, several new categorizations have
emerged.
When gathering data an effort was made to obtain triangulation in two ways. First, data
triangulation, where documents, interviews, and literature were triangulated and, secondly,
investigator triangulation, where the notes from the interviews were compared among the
three participating researchers (Patton, 1987; Yin, 1994).
The selection of the theoretical framework was not done before the collection of data started.
Rather the selection was accomplished at the end of the data collecting process. At that time
some of the empirical findings led to associations with the selected theories. It became obvious
that the case firms were interested in learning about the value creation process (hence
organizational learning) as well as managing knowledge (knowledge based theories, knowledge
management). It was equally striking that the firms had for a number of years gradually built up
and established routines related to the measurement of intangibles (evolutionary theories). In the
present paper the selected theoretical framework is used to enhance the understanding of the
empirical findings.
5. EMPIRICAL FINDINGS
The general purpose of the MR in the studied organizations is to improve on the critical
success factors for the long-term competitiveness of the firm. Most of the firms in the present

Measuring and Managing Intangibles – Eleven Swedish Qualitative Explanatory Case Studies.
Stockholm University, School of Business
Johanson, U., Mårtensson, M., & Skoog, M.
16
sample executed continuous measurement of intangibles and data were subject to evaluation
by management at different levels. This results in enhancing the understanding of the critical
success factors and that the MR is subject to constant change. Managers are normally
committed to act in accordance with the measurement results, which further supports learning.
Empirical findings were divided into four categories: (1) How the routine was developed? (2)
What is measured and how are measurements performed? (3) How is learning from the
measurement routines accomplished? and (4) What has been obtained?
5.1. The development of the measurement routine
For most of the organizations, the development of the MR dates back some years but it is
impossible to determine when the process actually began. In all of the cases, a story is told
describing how the MR emerged. When listening to, or reading these stories, we note that the
start of the development of the MR is often dated back to the beginning of the 1990s. In the
Office Equipment Company, for instance, the development started already in the 1970s,
according to organizational documents and managers within the organization.
There are only two or three reinforcing factors that have been mentioned by each source of
information. These forces consist of (1) changes in the market place, (2) individual actors, (3)
organizational changes, and (4) an encouraging experience with quality assurance work.
The predominant initial mobilization force originates from market considerations. Except for
the two consultant companies and the software (A) firm, a severe economic crisis or increased
competition is alluded to as the main source for the mobilization of change. In the consultant
firms market reasons and the prospect of selling also determine the development of the MR.
The second most important category of initial driving forces involves the individual actors
who have proposed ideas for change. This has been mentioned in most of the cases. Actors

Measuring and Managing Intangibles – Eleven Swedish Qualitative Explanatory Case Studies.
Stockholm University, School of Business
Johanson, U., Mårtensson, M., & Skoog, M.
17
refer to either internal individuals or external consultants, but most often to a combination of
the two
The background of the internal actor differs considerably and may include human resource
departments, controllers, and line management. These internal actors played a significant role
as driving forces during the early stages in MR development. With reference to the external
actor the same consulting firm played (and still plays) a significant role in at least three of the
cases.
Remarkably, in some of the firms the people connected to financial matters are left far behind
in the developmental process. According to some of the persons interviewed, one of the
reasons for their lack of interest is related to their feeling of being threatened by the “new”
control routine. This type of behavior can be related to the concept of ‘defensive routines’
developed by Argyris (1990). These routines are developed by people in order to cope, or
actually avoid coping, with the “new” MR .
Although it might be expected that such labels as BSC and IC or labels of the model supplied
by the consultant firm should appear in interviews or in documents, this is not the case. The
firms practice their own labeling. Concepts proposed in the literature or by the consultant firm
are not even mentioned by the respondents (even if they sometimes are addressed in
documents), except in the education consultant company where the original concept name is
mentioned frequently. It is also evident that the organizations tend to mix different "original"
concept thoughts in the process of making them their own.
Type of organization Label
Office equipment The office equipment management model
PR consult ants Structure capital
Telecommunication The Telecommunication integrated measurement tools
Bank (A) Tools for the future
Bank (B) The benchmarking model
Transportation company Control indicators in the management process
Construction company Human capital index – a tool for development
Education consultants Intangible assets monitor

Measuring and Managing Intangibles – Eleven Swedish Qualitative Explanatory Case Studies.
Stockholm University, School of Business
Johanson, U., Mårtensson, M., & Skoog, M.
18
Software (A) The value creation system
Software (B) The management control model
Engineering The plan deploy review model
Table 1. Internal MR labels
All the different elements of the MR have been there for a long time but now they are brought
together. However, the fact that the different subroutines have been practiced for a lengthy
period does not exclude the possibility that the step to bring them together has been
influenced by, for example, BSC or IC at a meta level within the organization. The general
strive appear to be towards connectivity of different intangibles and in the next step towards
the financial result. In order to accomplish these connectivity’s, measurement parts are bound
to be brought together, i.e. the trend is based on a strive towards holism in the MR in relation
to the more traditional fragmental way of using different kind of measures within different
organizational units/functions.
5.2. What is measured?
Most of the 11 firms use some kind of diagram in their presentation of the most important
intangibles. These diagrams, which are repeatedly practiced, are also used as tools to illustrate
how intangibles interact with tangibles and with one another. Bank (A) provides the following
schematic diagram.
MarketCapital
HumanCapital
Customer utility
Businessman-ship
Collective competence
Learning
Development of work routines
Access{
LEADERSHIP
EMPLOYEES
TRADEMARK
Profit-ability

Measuring and Managing Intangibles – Eleven Swedish Qualitative Explanatory Case Studies.
Stockholm University, School of Business
Johanson, U., Mårtensson, M., & Skoog, M.
19
Figure 1. The interaction between different intangibles as presented by Bank (A).
Basic intangibles that the firms consider most important can normally be identified from these
diagrams and include:
Type of organization Classification
Office equipment Customer and
market
Human resource
management
Business process
management
Information
utilization and
quality tools
PR consult ants Customers Employees Structures Development
Telecommunication Market capital Human capital
Bank (A) Market capital Human capital
Bank (B) Customers Employees Processes Development
Transportation
company
Customers Employees Processes Development
Construction company Customers Employees
Education consultants Customers Employees
Software (A) Customers Employees Partners
Software (B) Customers Employees Structure Capital
Engineering Customers Employees Process
Table 2. Basic classifications proposed by the firms
All 11 firms suggest simple classifications in which employees and customers are considered
critical success factors. Some firms retain this basic dichotomy while others prefer to also
address internal processes and developmental issues. But, what lies underneath the surface?
Normally, firms are not concerned to make a further division of the basic categories of
intangibles. Rather, they define and classify measurements of intangibles. That is, the division
of the basic classes of intangibles that are addressed in the present text has been deduced from
how companies measure them.
Except for the two consultant companies and the one software (B) company, all others carry
out attitude surveys among their customers and employees. In other words, when intangibles

Measuring and Managing Intangibles – Eleven Swedish Qualitative Explanatory Case Studies.
Stockholm University, School of Business
Johanson, U., Mårtensson, M., & Skoog, M.
20
are measured, it is normally accomplished by asking customers and employees about their
subjective impressions of certain phenomena. The implication is that the importance of a
given intangible resource is determined based on the perception of it. The human and market
capital definitions of intangibles are typically vague. For example, What is ‘ability to sale’ or
what defines the borders of the ‘meeting with the customer’?
When trying to reveal critical intangibles, it is also apparent from the measurements that
numerous items are measured. Bank (A) claims that they measure all intangibles presumed
important for success. For human capital there are 28 such intangibles (measured by 72
questions).
Bank (A) categorizes the human capital into six main classes: customer utility, businessman-
ship, collective competence, learning, development of work routines, and leadership. When
looking more closely at the items, it is apparent that most could be classified as individual
human capital but that some refer to the working group. Some items could have easily been
classified under customer or process issues. This is to say that internal process and
development activities are recognized as important intangibles even if they are not recognized
as a separate class in the basic classification schema.
Additionally, it is obvious that the classes deduced from the measurements are not exclusive;
i.e., some of the items could have been classified into a category other than the one they were
assigned. On the surface, a firm’s classifications of intangibles appear simple and easily
communicated, but once the surface is penetrated a readily noticeable complex pattern
emerges. This is because there are numerous items and the classification schemata are not
easily comprehensible since classes are not fixed. An exception to the latter is the human
capital in the Construction firm. In this firm the MR has been developed from a theoretical
model. Consequently, the classification scheme of different elements of the human capital
comprises exclusive classes.
As can be recognized in the next illustration (Table 3), assets in the accounting sense are only
a small minority of the intangibles. The vast majority of intangibles involve other resources.
Further, the classes contain an elaborate mixture of individual and organizational human
capital (human, structure, and market capital) and competence and relational issues.

Measuring and Managing Intangibles – Eleven Swedish Qualitative Explanatory Case Studies.
Stockholm University, School of Business
Johanson, U., Mårtensson, M., & Skoog, M.
21
The customer/market oriented intangibles specified in Table 3 relate to each other such that
the first three categories are thought to affect customer loyalty. Whereas image is thought to
generate attraction, such products as goods or services also significantly affect the relation.
Additional to organizational routines, individuals perform the meeting or interaction with the
customer. Finally, the output is customer loyalty. Customer loyalty is looked upon as a main
asset for the future success of the company. Table 3 should also be viewed as an example of
the more complex structure that often is hidden underneath the simple surface division of
intangibles.
1. The company’s image(attraction)
1. Trust
2. Reliable advertising3. Service4. Attitudes5. Communication6. Supports business development
by IT proposals7. Employee competence8. Price9. Environment10. Internationalization
2. Products, goods and services(relation carriers)
1. Quality
2. Functionality3. Support4. Worth its price
3. Meeting of individuals androutines (interaction)
1. Sales activity 1. Availability
2. Information?3. Competence4. Service-minded
2. Delivery/Installation 1. Availability2. Quality of customer service3. Quality of technician’s
work4. Co-ordination?5. Time consumed
3. Problem solving 1. Availability2. Quality of customer service3. Quality of technician’s
work4. Co-ordination?5. Time consumed
4. Customer care 1. Availability2. Information?3. Competence4. Service-minded5. Relations development?
4. Loyalty (the outcome of 1-3) 1. Repeatedly choosing theTelecommunication company
2. Recommending theTelecommunication company
Measuring and Managing Intangibles – Eleven Swedish Qualitative Explanatory Case Studies.
Stockholm University, School of Business
Johanson, U., Mårtensson, M., & Skoog, M.
22
to others3. Quality in relations to
customers?Table 3. Market intangibles in the Telecommunication Company.
Haanes & Lowendahl (1997) criticize resource-based theory for its excessive focus on
resources. The “real challenge is to energize people in the organization to better utilize and
build on available resources” (Ibid. p. 203). The authors maintain that to gain a fuller
understanding of key organizational processes it is more effective to study activities instead of
resources. The PR Consultant, the Telecommunication Company and, particularly, the Office
Equipment Company address this issue. The latter firm states that “key enablers of our
business are leadership (setting, deploying, and managing direction), human resource
management (supporting employee motivation and satisfaction), business process
management (the Office equipment company business process architecture is a framework for
management, operational, and enabling processes), customer and market focus (satisfying
customers), and information utilization and quality tools (access to information that improves
the output of the work).” The enablers affect results and are process or routine oriented. The
results comprise employee and customer satisfaction as well as market share.
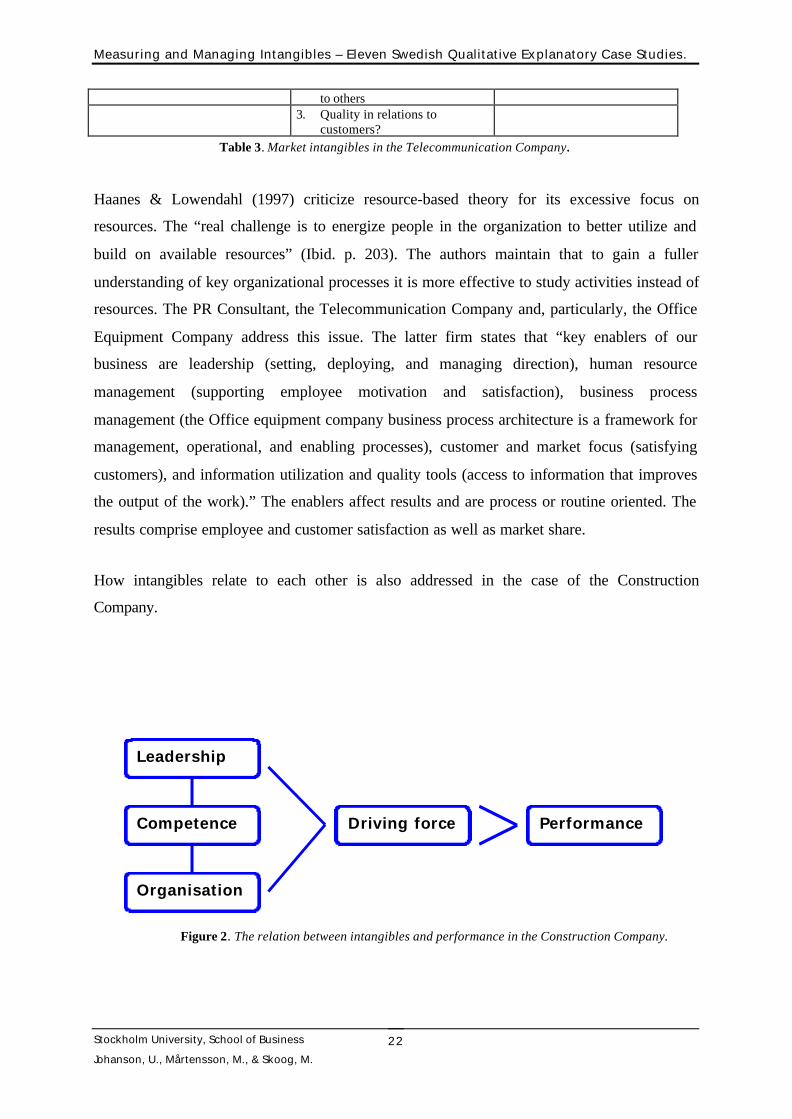
How intangibles relate to each other is also addressed in the case of the Construction
Company.
Figure 2. The relation between intangibles and performance in the Construction Company.
Leadership
Competence
Organisation
Driving force Performance

Measuring and Managing Intangibles – Eleven Swedish Qualitative Explanatory Case Studies.
Stockholm University, School of Business
Johanson, U., Mårtensson, M., & Skoog, M.
23
In relation to employees enabling intangibles include leadership, competence, and
organization. These enablers affect the driving force or the energy that employees are willing
to spend on their work. This active force is a part of the employee performance, which also
comprises quality, customer sensibility, and recommending the enterprise as an employer.
The diagrams provided by the case firms reveal not only an order between the different
categories of intangibles but also logic of action.
For the firms of the present study, intangibles consist of a mixture of individual competence
(knowledge and capabilities), organizational competence (databases, technology, routines,
and culture) and relational resources (relations, reputation, and loyalty). They measure those
intangibles that they believe are of crucial importance for obtaining results. The latter also
means that intangibles that are subject to measurement will change because of learning.
Measurements result in new discoveries which make earlier indicators inadequate.
5.3. How are measurements performed?
The continuity of the measurements differs from firm-to-firm, as can be seen in Table 4.
Type of organization Kind of attitude survey Regularity of HC survey Regularity of MC survey
Office equipment HC, MC Every half year 48 hours, 2 weeks, 40 days
and 3 months after delivery
PR consult ants Annually
Telecommunication HC, MC Annually Annually
Bank (A) HC, MC Monthly Monthly
Bank (B) HC, MC Annually Annually
Transportation company HC, MC Annually Daily
Construction company HC, MC Annually After project termination
Education consultants Annually Annually
Software (A) HC, MC Annually Annually
Software (B)
Engineering HC, MC Every 18th month Every 18th month
Table 4. Regularity of the performance measurements.
Data collection is typically achieved either by written questionnaires or by telephone
interviews. In some cases, the firm itself accomplishes the aggregation of data, whereas in
other cases it is achieved from the external consultant.

Measuring and Managing Intangibles – Eleven Swedish Qualitative Explanatory Case Studies.
Stockholm University, School of Business
Johanson, U., Mårtensson, M., & Skoog, M.
24
To give an example, the Telecommunication Company has conducted attitude surveys from
1996 to 1998 in about 100 different organizational units. Some aspects of the surveys have
been practiced for several years before 1996. The human capital questionnaire is standardized
throughout the Telecommunication Company, whereas the market capital measurement
differs between organizational units. Questions specific to the business area are appended at a
later time. About 80 questions are included in the human capital measurement. The response
rate is very high (about 94%). Human capital measurements are done once a year. Market
capital measurements are performed via telephone interviews conducted by external
consultants. In each of the sales areas, 400 customers are randomly allocated and when
responses are obtained from the first 100, all further interviews are cancelled.
5.4 How is learning from the measurement routine achieved?
Because the main objective of the companies is performance enhancement, comparisons are
made with the latest measurement figures. The figures are also used for the purpose of
benchmarking with other units within the organizations; for instance, in the
Telecommunication Company a top 10 unit list is presented annually.
Extensive databases have been established. In five of the organizations correlation analysis
has been performed, even when findings differed. Generally, an external consultant performs
the statistical analysis. For those organizations that had performed statistical analyses,
correlation’s are briefly highlighted in table 5.
Type of organization Type of statistical analysis
Office equipment Correlation between customer satisfaction and customer loyalty
PR consult ants No statistical analysis
Telecommunication Correlation between leadership and market capital
Bank (A) Correlation’s between leadership and human capital, human
capital and market capital, market capital and profitability
Bank (B)
Transportation company No statistical analysis

Measuring and Managing Intangibles – Eleven Swedish Qualitative Explanatory Case Studies.
Stockholm University, School of Business
Johanson, U., Mårtensson, M., & Skoog, M.
25
Construction company Correlation’s between leadership style, control, influence,
competence development and employee performance
Education consultants No statistical analysis
Software (A) Leadership issues are correlated to customers perceptions of the
firm, which is correlated to customer satisfaction
Software (B) No statistical analysis
Engineering No statistical analysis
Table 5. Internal statistical analysis
In the Telecommunication Company, combining market capital data for a certain business unit
with human capital data for employees working within that business is suggested to be very
revealing. A high leadership score also implies an augmented human capital score and, when
employees have a good understanding of customer needs, the human and market capital scores are
high. A manifold of calculations has been performed, resulting in 14 human capital indicators that
contribute to a high market capital within sales (although the correlation is very low concerning
indicators with a low ranking). The top five indicators concern leadership: the leaders are good at
listening; they are just one of the persons in the gang; they are easy to cooperate with; they are
good at dealing with new and unusual situations; and they are supportive of responsibility.
“Teams holding that they have a good leader receive high scores by customers.”
Leadership appears to be a central issue as to employee performance, market performance,
and financial performance. The representatives from the Telecommunication Company have
thus far been unable to statistically discover which key variables are affecting financial
performance. However, it is suggested that the connection is obvious at the “floor” level. In
Bank (A), as well as the Construction Company, correlation’s have been noted on financial
performance.
In Bank (A) a strong correlation between leadership and an empowerment index has been
found. The latter is correlated to financial outcome. (The empowerment index is based on the
following questions: Are you dedicated to work? Are you satisfied with your tasks? Have you
co-workers who are not afraid of being responsible? In the case that you acquire a certain
degree of responsibility do you get the support you need? Do you presently have the
competence that is needed? Are you authorized to make your own decisions?)

Measuring and Managing Intangibles – Eleven Swedish Qualitative Explanatory Case Studies.
Stockholm University, School of Business
Johanson, U., Mårtensson, M., & Skoog, M.
26
In the Construction Company with 9,000 responses in 1998 there are substantial differences
between different units for workers but not for salaried employees. A value creation chain
regarding the impact of human resources on profitability has been subject to a rigorous test in
the database of 1998 and 1999 respectively. Hypothesis regarding value creation items related
to the human resources have been subject to a statistical test. The following significant
correlation’s were found (p<0.01).
Leadership style
0.9
Driving force 0.8 Performance 0.4 Profitability
0.8
Control
Figure 3. The value creation chain in the Construction Company
The correlation with profitability (0.4 above) was calculated for the first time in 1998; the
other correlations were found even earlier. General conclusions regarding the correlation’s
between different intangibles and financial outcomes cannot be drawn because intangibles (e.g.,
leadership) are not measured uniformly among the sample organizations. For instance, whereas
the Telecommunication Company and the Construction Company involve personality
characteristics, Bank A includes even organizational-related issues in the measurement tool.
5.5 Communication of the measurement results
The MR comprises not only visions of how performance driving intangibles interact and
influence the outcomes and measurements of these intangibles, but it also consists of
subroutines of communicating visions and figures.
Many of the firms have explicitly pointed out that parts of the MR are under the business
protection policy but, despite the management control focus, the 11 firms specify parts of the
routine in different external reports. It should be noted that the Office Equipment Company and
the two consulting firms market their MR. The Construction Company provides the most

Measuring and Managing Intangibles – Eleven Swedish Qualitative Explanatory Case Studies.
Stockholm University, School of Business
Johanson, U., Mårtensson, M., & Skoog, M.
27
revealing information, which might be conditional on the explicit objective to inform investors
about intangibles.
Type of organization External reporting procedure
Office equipment Report to potential customers
PR consultants Brochure
Telecommunication No external report
Bank (A) Booklet. Nothing in the annual report
Bank (B) No external report
Transportation company Presentation in the annual report
Construction company Presentation in the annual report
Education consultants Presentation in the annual report
Software (A) No external report
Software (B) Presentation in the annual report
Engineering Supplement to the annual report
Table 6. External reporting
Every firm uses its personal label of the MR. However, these labels do not reveal the vision to
communicate and are not utilized very often throughout the company. Top management may
use the label but middle management is likely to use it infrequently and supervisors may not
use it at all. However, what is repeatedly practiced in most of the cases is one or a couple of
pictures describing the vision to communicate. The figure practiced by the Construction
Company has been shown earlier in the text (see figure 2.). This figure briefly describes how
different intangibles interact and what variables are being measured though it does not reveal
how understanding is encouraged or action is mobilized. The figures practiced by firms
normally concentrate on the content of the MR. An exception to this practice is the picture
utilized by the Telecommunication Company in which parts of the routine of increasing the
understanding (i.e., the statistical analysis) are noted.
Profit-ability
MC HC
Efficiency
Competence tocreate value
Value for thecustomer
1The company’simage
The unit’sperformance
2 Products
Correlation analysis provideknowledge about customerloyalty

Measuring and Managing Intangibles – Eleven Swedish Qualitative Explanatory Case Studies.
Stockholm University, School of Business
Johanson, U., Mårtensson, M., & Skoog, M.
28
Figure 4. Relations and correlation’s between intangibles and economic efficiency in the Telecommunication
Company
Every firm uses its own central figure to communicate important intangibles and their
connection to company success. However, the operation involved as to how the
communication of visions and figures is performed varies considerably. The communication
process takes place between managers and subordinates and between managerial teams and
subordinate groups. For the Office Equipment Company the communication process is highly
formalized into documented routines; in Bank B a dynamic group process is the primary
component of the MR.
The Telecommunication Company may again serve as an example. The measurements are
presented every year in January at a kick-off meeting in which all the managers in the
company are present. At the meeting, each manager is provided with a thick package of ratios
(graphs), including comparisons with other units in relation to their specific placing within the
overall human and market capital indexes. After the meeting, further discussions about
adequate activities to improve the scores are held at a local level. Together with his or her
personnel, every departmental manager performs a work plan to improve the index.
At the individual level, the following two kinds of dialogue are held between the individual
and the departmental manager:
- A monthly dialogue on results, resources, and competence.
- A second dialogue, the “target dialogue,” is performed annually. This dialogue normally
lasts between one and four hours. The discussion is standardized to the extent that a
3 Meeting the customer
4 Share of corecustomers
As a dependent variablein the correlationanalyses, an index basedon the followingquestions has been done.The total satisfaction ofthe customers and resultsin relation toexpectations

Measuring and Managing Intangibles – Eleven Swedish Qualitative Explanatory Case Studies.
Stockholm University, School of Business
Johanson, U., Mårtensson, M., & Skoog, M.
29
supporting document exists. The targets, according to the document, should be concrete,
measurable, encouraging, realistic, and time-limited. The output from the dialogue
comprises shortsighted sales targets in addition to long-term development targets. After
the target dialogue, a number of activities are performed. It is suggested that everything,
including a performance evaluation of the employee, should be documented. The target
dialogue was performed for the first time in 1998. The document, which is produced by an
external consultant, is a further development of earlier developmental dialogues. Whether
the target dialogue was actually performed by the departmental manager and his or her
staff was also studied in 1998.
5.6 Action in relation to the measurement routine
As a part of the MR, the ownership of every indicator is addressed in a clear manner in the
majority of the cases (i.e., the Office Equipment Company, the Telecommunication Company,
Bank A and B, the Transportation Company, and the Construction Company). For the two
banks, attention is given to ownership using group meetings; i.e., representatives of top
management visit each of the local offices to discuss how improvement could be attained. In
this way contracts on improvement are settled between both the employee and his or her
superior or the group and top management.
Contracts that are agreed upon comprise quantitative goals for the coming period. These goals
are related to single or many issues in the market capital or the human capital index.
In three cases (the Office Equipment, the Construction, and the Telecommunication
Company), employees and managers are rewarded through a salary bonus routine when
improvements have been actualized.
The most “advanced” example of the salary connection routine is found in the
Telecommunication Company. Managers’ salaries are partly subject to changes in scores. The
maximum salary bonus a manager can receive is a bonus that is equivalent to three monthly
wages, in which 60-75% of this bonus is due to financial performance (e.g., costs and

Measuring and Managing Intangibles – Eleven Swedish Qualitative Explanatory Case Studies.
Stockholm University, School of Business
Johanson, U., Mårtensson, M., & Skoog, M.
30
revenues). Half of the remaining bonus is based on improvements in human capital and the
other half is based on advancements in market capital.
The “target” dialogue also provides a basis for agreement on salaries with the employees. The
manager and the employees come to terms on the employees’ performance on a scale ranging
from 0 to 800. The performance score is then used as a platform for one part of the monthly
salary. This salary routine has been practiced for the past 3 years.
In some of the cases the MR in itself is subject to a follow up. Response rates on attitude
surveys are followed and analyzed. The response rates are in most cases between 80-95%
(e.g. in the Office Equipment Company the response rates with respect to the employee
survey is normally between 93 and 95%). In the Construction firm the MR is also followed-up
by means of a specific question with three response alternatives: I read the figures; I have
informed my subordinates; and I have taken action. The answers suggest that there is a strong
correlation between taking action and performance as well as response rates respectively. A
similar approach is used by Bank (A). Statistical analysis reveal that work satisfaction and
performance is significantly higher by those who have got feed-back on performance with
respect to what is regarded to be the central issues in the value creation chain. The feedback
routine is a significant subroutine to the measurement routine in order to ensure learning,
action and change.
Another approach to the follow up routine is demonstrated by the Office Equipment
Company. A self-assessment is accomplished annually taking three criteria into consideration;
(1) The units approach to following documented processes; (2) The pervasiveness of the
work; and (3) The results achieved. The assessment is subject to an audit by senior executives
from other sister companies in the world. The aim of the business assessment is to secure the
survival of the MR and it’s subroutines.
6. REFLECTIONS AND CONCLUSIONS
The firms in the present sample can be grouped into three categories:

Measuring and Managing Intangibles – Eleven Swedish Qualitative Explanatory Case Studies.
Stockholm University, School of Business
Johanson, U., Mårtensson, M., & Skoog, M.
31
1. The most advanced cases. These companies are regarded as most advanced due to the
impression that they have developed a deep and well-spread understanding of the importance
of intangibles as performance drivers, but also in mobilizing these intangibles into a
developed MR. Among these are the Office Equipment, the Telecommunication, the
Construction Company, and Bank A.
2. The two small enterprises--the consultant companies--which are not comparable with the
others because, firstly, the MRs do not have the same high proportions as in the other cases
and, secondly, the MRs are not documented.
3. The rest of the cases, the two software companies, the transportation company, the
engineering company, and bank B. In these cases the understanding of the importance of
intangibles as performance drivers are quite well recognized, but the mobilizing phase does
not seem to be that deep and well-spread within the company.
The discussion below will refer only to the companies belonging to the first category unless
otherwise specified.
Concerning the MR, most of the sources (i.e., respondents and documents) hold that the MRs
has become a part of the management control process in most of the units of the firms. “This
is currently a big issue. Many things have happened. It is the way in which management
control is obtained in this firm.” From another case, the following statement was reported.
“We do not reflect upon this any longer. It has become natural to us.” The case organizations
have by developing the MR provided structural arrangements of coordination and cooperation
that characterizes a knowledge based view of the firm (Roberts, 1999; and Grant, 1996).
Individuals can easily refer to communication situations in which data from the MR or data
from the routine itself have made significant differences. The MR “… provides people with
arguments for doing something,” and from another firm: “Before I always got excuses when I
made presentations. With this new way, I do not get any excuses. Rather, the discussion is
very rapidly turning into supplying suggestions with respect to improvements.” The MR is
thereby not only about learning but also about coordinated action based on the knowledge
acquired which was the definition of organizational learning provided in the beginning of the
paper (Johanson & Nilson, 1995)
Measuring and Managing Intangibles – Eleven Swedish Qualitative Explanatory Case Studies.
Stockholm University, School of Business
Johanson, U., Mårtensson, M., & Skoog, M.
32
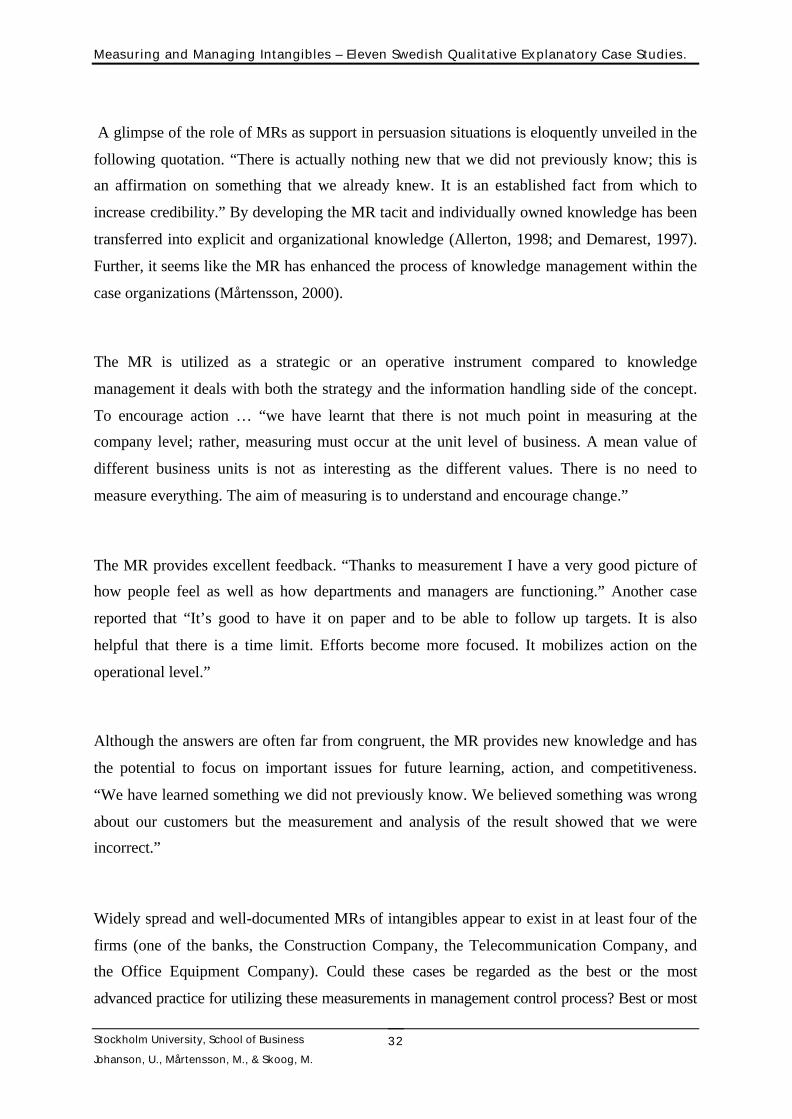
A glimpse of the role of MRs as support in persuasion situations is eloquently unveiled in the
following quotation. “There is actually nothing new that we did not previously know; this is
an affirmation on something that we already knew. It is an established fact from which to
increase credibility.” By developing the MR tacit and individually owned knowledge has been
transferred into explicit and organizational knowledge (Allerton, 1998; and Demarest, 1997).
Further, it seems like the MR has enhanced the process of knowledge management within the
case organizations (Mårtensson, 2000).
The MR is utilized as a strategic or an operative instrument compared to knowledge
management it deals with both the strategy and the information handling side of the concept.
To encourage action … “we have learnt that there is not much point in measuring at the
company level; rather, measuring must occur at the unit level of business. A mean value of
different business units is not as interesting as the different values. There is no need to
measure everything. The aim of measuring is to understand and encourage change.”
The MR provides excellent feedback. “Thanks to measurement I have a very good picture of
how people feel as well as how departments and managers are functioning.” Another case
reported that “It’s good to have it on paper and to be able to follow up targets. It is also
helpful that there is a time limit. Efforts become more focused. It mobilizes action on the
operational level.”
Although the answers are often far from congruent, the MR provides new knowledge and has
the potential to focus on important issues for future learning, action, and competitiveness.
“We have learned something we did not previously know. We believed something was wrong
about our customers but the measurement and analysis of the result showed that we were
incorrect.”
Widely spread and well-documented MRs of intangibles appear to exist in at least four of the
firms (one of the banks, the Construction Company, the Telecommunication Company, and
the Office Equipment Company). Could these cases be regarded as the best or the most
advanced practice for utilizing these measurements in management control process? Best or most

Measuring and Managing Intangibles – Eleven Swedish Qualitative Explanatory Case Studies.
Stockholm University, School of Business
Johanson, U., Mårtensson, M., & Skoog, M.
33
advanced can be defined and measured in numerous ways and there is at present no point in trying
to answer the question. The present paper is an attempt to understand what is happening in
Swedish firms that are thought to be more sophisticated in their measuring methods of intangibles.
What do these firms do to increase the understanding of intangible performance drivers and what
kinds of understanding has been penetrated thus far?
Itami and Roehl (1987) intimate that a characteristic of all successful organizations is the
recognition that there is a learning process that runs parallel with all operations, and that all
activities present the potential to both enhance or degrade the know-how and reputation of the
intangible resources. They further suggest that, at a strategic level, this view leads to the
selection of strategies that function to enrich the 'know-how stock' of the core competencies of
the business. This statement links organizational learning, knowledge-based, and evolutionary
theories to one another. This is to say that the learning processes affect intangibles. However,
intangibles are even the feedstock of competitive advantage (Hall, 1992; Becker, & Huselid,
1998). The competitive advantage is contingent on having obtained an excellent stock of
tangibles and intangibles from earlier investments or experiences, as well as having performed
better than others. The MR in the present cases is an instrument used to analyze performance,
i.e. enabling intangibles and thereby increasing the value of the stock of knowledge. The
interest from the firms lies in making tacit understanding explicit by utilizing an established
organizational routine, namely measuring. The strategy is to increase the understanding of the
actual value creation chain. As an organizational learning routine, the MR not only comprises
measurements but equally important consists of subroutines such as mobilizing attention to
the MR, performing surveys, statistical analysis, diffusion of measurement results,
determination of indicator ownership and contracts, and encouraging the accomplishment of
contracts through, for example, salary bonuses. All these subroutines are crucial to the
learning process; for example, with respect to statistical analysis it is suggested that this be the
kind of language that top management understands. In some of the cases even the search rule
is explicitly subject to a continuous evaluation.
Applying evolutionary theory, the MRs could be described as depicted in figure 5.
SEARCH RULE:
The idea that measurement is a way tounderstand and mobilize intangibleperformance drivers in the measurementroutine.

Measuring and Managing Intangibles – Eleven Swedish Qualitative Explanatory Case Studies.
Stockholm University, School of Business
Johanson, U., Mårtensson, M., & Skoog, M.
34
Figure 5. A summary of measurement supporting routines
At a basic level, classifications of intangibles are simple because they are utilized to aid in
visualization and thereby communicate how both intangibles and tangibles interact to realize
the visions of firms. These simple classifications, however, do not contain exhaustive or
exclusive classes since this is of no interest to firms.
However, intangibles are subject to division in the endeavor to find the performance drivers.
Statistics or investments based on historical “facts” seem to be of less interest than
perceptions of activities that enable future performance. These ‘enablers’ are not assets in an
accounting sense but are customer and employee perceptions of individual competence
(knowledge and capabilities), organizational competence (databases, technology, routines,
and culture) and relational competence (relations, reputation, and loyalty). This division of
intangibles is very near to what has been proposed in the knowledge-based literature. Some of
the firms distinguish between intangible enablers and intangible outcomes. This distinction,
however, is not observed in proposals appearing in the literature.
Intangibles that are subject to measurement are changed because of organizational learning
(e.g., Argyris & Schön, 1978; Hedberg, 1981; Schön, 1986; Levitt & March 1988; Senge,
1990), i.e. dominating beliefs has changed and coordinated action has taken place (Johanson

Measuring and Managing Intangibles – Eleven Swedish Qualitative Explanatory Case Studies.
Stockholm University, School of Business
Johanson, U., Mårtensson, M., & Skoog, M.
35
& Nilson, 1995). Measurements result in new discoveries with respect to what Demarest
(1997) calls the commercial knowledge. However, these new discoveries make earlier
indicators inadequate. Firms struggle between changing indicators due to increased
understanding and sticking to old indicators to be able to make longitudinal comparisons.
Core measurements performed to increase the understanding of the intangible performance
drivers are measurements that are not proposed in the HRA or UA literature (Johanson et al.,
1999). It is fully understandable that outside stakeholders (e.g., investors and analysts) reject
that sort of information, as long as the value creation chain remains tacit with single operative
managers. The case firms are primarily interested in understanding the importance of the
kinds of intangible that Haanes & Lowendahl (1997) identify. These are the kinds of
intangibles that the case firms hold are leveraging the stock of intangibles and tangibles. They
refer to what Coyne (1986) calls functional and cultural differentials. Even positional
differentials are measured though as an outcome indicator.
The way for the firms in the present cases to ascertain a continuous organizational learning
process with respect to the value creation chain is to measure intangibles as well as create and
maintain organizational routines that ensure the transformation of measurement results into
action. These routines have been subject to an evolutionary development that demonstrates
the linkage between the belief from the firms that a precondition for organizational learning is
not only the figures themselves but equally important the transformation of the measurements
into action.

Measuring and Managing Intangibles – Eleven Swedish Qualitative Explanatory Case Studies.
Stockholm University, School of Business
Johanson, U., Mårtensson, M., & Skoog, M.
36
LIST OF REFERENCES
Allerton, H.E., (1998). News you can use. Training & Development, 52(2): 9-10.
Almqvist, R., & Skoog, M (1999). Management Control Transformations – a conceptual approach, School ofBusiness, Stockholm University, Paper presented at the European Accounting Association annual congress,Bourdeaux 1999.
Argyris, C (1990). The dilemma of implementing controls: the case of managerial accounting. Accounting,Organizations and Society, 15(6), pp. 503-11.
Argyris, C., & Schön, D (1978). Organizational learning. A theory of action perspective. Reading, Mass:Addison-Wesely.
Ax & Björnemark (2000)
Becker, B.E., & Huselid, M.A. (1998). High performance work systems and firm performance: A synthesis ofresearch and managerial implications. Research in Personnel and Human Resources Management, Vol 16, pp.53-101.
Boudreau, J.W. (1998). Strategic Human Resource Management Measures: Key Linkages and thePeopleVantage Model. Journal of Human Resource Costing and Accounting, Vol 3, No. 2.
Canibano, L., & Sanchez, P. (1998). Measuring Intangibles to Understand and Improve Innovation Management. Aresearch proposal. Universidad Autonoma, Madrid.
Canibano, L., & Sanchez, P., and Garcia-Ayuso, M. (1999). The value relevance and mangerial implications ofintangibles: a literature review. IADE, Universidad Autonoma de Madrid-Univ. De Sevilla.
Carlsson, B., & Eliasson, G. (1991). The Nature and Importance of Economic Competence. Working paper,Cape Western Reserve University and IUI, Stockholm.
Coyne, K. P. (1986). Sustainable competitive advantage. What it is and what it isn’t. Business Horizons,Jan./Feb. pp. 54-61.
Demarest, M (1997). Understanding knowledge management. Long range planning, Vol. 30, No. 3, pp. 374-384
Docherty, P. (1996). Läroriket – vägar och vägval i en lärande organization. Arbetslivsinstitutet, Stockholm.
Eccles, R., & Mavrinac, S. (1995). Improving the Corporate Disclosure Process. Sloan Management Review.Vol. 36, No 4, pp. 11-25.
Edvinsson, L., & Malone, M.S. (1997). Intellectual Capital, Harper Business.
Ehrvervsudviklingsrådet (1997). Videnregenskaber. Rapportering of styrning af videnkapital (KnowledgeAccounting. Reporting and Controlling Knowledge Capital.) Copenhagen.

Measuring and Managing Intangibles – Eleven Swedish Qualitative Explanatory Case Studies.
Stockholm University, School of Business
Johanson, U., Mårtensson, M., & Skoog, M.
37
Ennerfelt, S., Paltschilk, M., & Tillberg, E. (1996). Vertyg för framtiden (Tools for the future). SIFO/SMG,Stockholm.
Epstein, M.J., & Freedman, M. (1994). Social Disclosure and the Individual Investor. Accounting, Auditing &Accountability Journal. Vol. 7, No. 4, pp. 94.109.
Gilbert, N. (1993) Researching Social life. Sage publications.
Glaser, B-G., & Strauss, A-L. (1967). The Discovery of Grounded Theory: Strategies for Qualitative Research.University of California, San Francisco, Aldine de Gruyter, New York.
Grant, R. (1996). Toward a knowledge-based theory of the firm. Strategic Management Journal, Vol. 17, pp.109-122.
Grönhaug, K., & Nordhaug, O. (1992). Strategy and competence in firms. European Management Journal. Vol.10, No. 4, pp. 438-444, Dec.
Guthrie, J., Petty, R., Ferrier, F., & Wells, R. (1999). There is no Accounting for Intellectual Capital in Australia:review of annual reporting practices and the internal measurement of Intangibles within Australianorganizations. Paper presented at the OECD conference in Amsterdam, June 1999.
Haanes, K., & Lowendahl, B. (1997). The Unit of Activity: Towards an Alternative to the Theories of the Firm.Strategy, Structure and Style. Eds. Thomas, H. et al., John Wiley & Sons Ltd.
Hall, R. (1992). The Strategic Analysis of Intangible Resources. Strategic Management Journal. Vol. 13, No. 2,pp. 135-144.
Hansson, J. (1998). Intellectual capital – the latest trick to make management scientific? Working paper. TheManagement School, Lancaster University, UK.
Hedberg, B. (1981). How organizations learn and unlearn. Chapter one in Starbuck & Nyström (Eds.)Handbook of organizational design. Oxford University Press.
Itami, H., & Roehl, T.W. (1987). Mobilizing Invisible Assets. Harvard University Press, Cambridge, Mass.
Johanson, U. (1999a). Why the Concept of Human Resource Costing and Accounting does not Work. PersonnelReview, Vol. 28, pp 91-107.
Johanson, U. (1999b). Mobilizing change by means of measuring intangibles. Work in progress. School ofBusiness. Stockholm University.
Johanson, U., Eklöv, G., Holmgren, M., & Mårtensson, M. (1999). Human Resource Costing and AccountingVersus the BSC. A literature Survey of Experience with the Concepts. A report to OECD. Stockholm University,School of Business.

Measuring and Managing Intangibles – Eleven Swedish Qualitative Explanatory Case Studies.
Stockholm University, School of Business
Johanson, U., Mårtensson, M., & Skoog, M.
38
Johanson, U., & Nilson, M. (1995). Human Resource Costing and Accounting and Organizational Learning.Personnel Economics Institute, School of Business, Stockholm University.
Kaplan, R.S., & Norton, D.P. (1992). The Balanced Scorecard – Measures that Drive Performance. HarvardBusiness Review. Vol. 70, No. 1, pp. 71-79.
Kaplan, R.S., & Norton, D. P. (1999). Implementation Experiences with the balanced Scorecard, Working paperpresented for the 2nd Intangible Conference,”Intangibles: Management, Measurement and Organization” SternSchool of Business, New York university, May 27-28, 1999.
Lank, E (1997). Leveraging invisible assets: the human factor. Long range Planning, Vol. 30, No 3, pp. 406-412.
Levitt, B., & March, J.G. (1988). Organizational learning. Annual Review of Sociology, Vol. 14, pp. 319-340.
Lukka, K. (1998). Total accounting in action: Reflections on Sten Jönsson’s Accounting for improvement.Accounting, Organizations and Society, vol23, no 3, pp 333-342.
Mavrinac, S., & Boyle, T. (1996). Sell-side Analysis, Non-financial Performance, Evaluation & the Accuracy ofShort-term Earnings Forecasts, Ernst & Young LLP Working Paper, Boston.
Mourtisen, J (1998). Driving growth: economic value added versus intellectual capital, Management AccountingResearch, Vol 9, Issue 4, Orlando, USA.
Mårtensson, M. (2000). A critical review of knowledge management as a management tool. Journal ofKnowledge Management. Vol.4. Issue3.
Nelson, R.R., & Winter, S.G. (1973). Toward an evolutionary theory of economic capabilities. AmericanEconomic Review, Vol. 63, pp. 440-449.
Nelson, R.R., & Winter, S.G. (1982). An Evolutionary Theory of Economic Change. Harvard University PressCambridge, Mass.
OECD (1992). Technology and the economy. The key relationships. The Technology/Economy Programme,Paris.
Olve, N.G., Roy, J., & Wetter, M. (1997). BSC i svensk praktik. (BSC in Swedish Practice.) Liber Ekonomi,Malmö.
Olve, N.G., Roy, J., & Wetter, M. (1998). Performance drivers. A practical guide to using the balancedscorecard. John Wiley & Sons.
Parker, L. D., & Roffey, B. H. (1997). Back to the Drawing Boards: Revisiting Grounded Theory and theeveryday Accountant’s and Manager’s Reality. Accounting, Auditing & Accountability Journal. Vol. 10, No. 2,pp. 212-247.

Measuring and Managing Intangibles – Eleven Swedish Qualitative Explanatory Case Studies.
Stockholm University, School of Business
Johanson, U., Mårtensson, M., & Skoog, M.
39
Patton, M.Q. (1987). How to Use Qualitative Methods in Evaluation. Newbury Park, CA: Sage Publications.
Petrash, G. (1996). Dow’s Journey to a Knowledge Value Management Culture. European ManagementJournal. Vol. 14, No. 4, pp. 365-373.
Polanyi, M. (1966 reprinted 1983). The tacit dimension. Gloucester, Mass. Peter Smith.
Roberts, H (1999). The bottom line of competence based management: Management accounting, control, andperformance measurement, Working paper, Norwegian School of Management, Oslo.
Roos, R., & Roos, J. (1997). Measuring your Company’s Intellectual Performance. Longe Range Planning. Vol.30, No. 3, pp. 413-426.
Roslender, R. (1997). Accounting for the worth of employees: Is the discipline finally ready to respond to thechallenge? Journal of Human Resource Costing and Accounting, Vol 2, No 1, pp 9-26.
Rutihinda, C. (1996). Resource-based Internationalization. Stockholm: Akademitryck AB.
Schön, D. (1986). The reflective practioner. Basic Books.
Senge, P. (1990). The fifth discipline? New York: Doubleday/Century Business.
Slagmulder, R. (1997). Using Management Control Routines to Achieve Alignment between StrategicInvestment Decisions and Strategy. Management Accounting Research, No. 8, pp. 103-139.
Statistics Netherlands (1998). Intangible investments. Division of Agriculture, Industry and the Environment.
Strauss, A., & Corbin, J. (1990). Basics of Qualitative Research – Grounded Theory Procedures andTechniques. Newbury Park, CA: Sage Publications.
Sveiby, K.E. (1997). The New Organizational Wealth. Managing & Measuring Knowledge-Based Assets.Berrett-Koehler Publishers, Inc., San Francisco.
The Swedish Public Relations Association (1996). Return on Communication. Stockholm.
Winter, S.G. (1986). The research program of the behavioral theory of the firm: Orthodox critique andevolutionary perspective. In B. Gilad and S. Kaish (Eds.) Handbook of Behavioral Economics, Vol. A. JAIPress, Greenwich, CT, pp. 151-188.
Yin, R.K. (1994). Case Study Research – Design and Methods. Second Edition. Thousand Oaks, CA: SagePublications.