
Reliability-Based Load and Resistance Factor Rating Using In-Service Data
Upload
khangminh22Category
view
3download
0
Seasonality Analysis of Load Factor Indian power system perspective

Seasonality analysis of load factor
Indian Power System perspective
Second Edition
Power System Operation Corporation Limited
(A Government of India Enterprise)
June 2021
All India and regionwise


Seasonality analysis of load factor in Indian Power System i | P a g e


Seasonality analysis of load factor in Indian Power System ii | P a g e


Seasonality analysis of load factor in Indian Power System iii | P a g e

Seasonality analysis of load factor in Indian Power System iv | P a g e
Table of Contents
List of Tables .................................................................................................................................. vi
List of Figures ................................................................................................................................ vii
Executive Summary ...................................................................................................................... xv
Data Source and Assumption ....................................................................................................... xix
What is new in the 2nd edition ....................................................................................................... xx
1. Introduction ........................................................................................................................... 1
2. Classification of Load Factor ................................................................................................... 1
3. Load Factor as per 18/19th Electric Power Survey (EPS) report of CEA .................................... 2
4. Diversity Factor ...................................................................................................................... 4
5. Methodology used for Seasonal decomposition ..................................................................... 7
5.1. Additive Method ............................................................................................................. 7
5.2. Seasonality Index ............................................................................................................ 8
6. Analysis of load factor ........................................................................................................... 10
7. International experience on Load Factor ............................................................................... 20
8. Findings and Way Forward .................................................................................................... 24
9. Contributing and reviewing members .................................................................................... 25
10. References ......................................................................................................................... 26
11. Annexure ........................................................................................................................... 27
11.1. All India ...................................................................................................................... 28
11.2. Northern Region ........................................................................................................ 34
11.3. Western Region ......................................................................................................... 40
11.4. Southern Region ........................................................................................................ 46
11.5. Eastern Region ........................................................................................................... 52
11.6. North Eastern Region ................................................................................................. 58
11.7. Uttar Pradesh ............................................................................................................. 64
11.8. Rajasthan ................................................................................................................... 70
11.9. Haryana ..................................................................................................................... 76
11.10. Punjab ....................................................................................................................... 82
11.11. Delhi .......................................................................................................................... 88
11.12. Uttarakhand ............................................................................................................... 94
11.13. Himachal Pradesh .................................................................................................... 100
11.14. Chandigarh ............................................................................................................... 106
11.15. Jammu & Kashmir (J&K) and Ladakh ........................................................................ 112
11.16. Maharashtra ............................................................................................................ 118
11.17. Gujarat ..................................................................................................................... 124
Seasonality analysis of load factor in Indian Power System v | P a g e
11.18. Madhya Pradesh ...................................................................................................... 130
11.19. Chhattisgarh ............................................................................................................ 136
11.20. Goa .......................................................................................................................... 142
11.21. Tamil Nadu ............................................................................................................... 148
11.22. Karnataka ................................................................................................................ 154
11.23. Andhra Pradesh + Telangana (AP+TEL) ..................................................................... 160
11.24. Andhra Pradesh ....................................................................................................... 166
11.25. Telangana ................................................................................................................ 172
11.26. Kerala ...................................................................................................................... 178
11.27. Puducherry .............................................................................................................. 184
11.28. West Bengal ............................................................................................................. 190
11.29. Bihar ........................................................................................................................ 196
11.30. Odisha...................................................................................................................... 202
11.31. Jharkhand ................................................................................................................ 208
11.32. DVC .......................................................................................................................... 214
11.33. Sikkim ...................................................................................................................... 220
11.34. Assam ...................................................................................................................... 226
11.35. Manipur ................................................................................................................... 232
11.36. Arunachal Pradesh ................................................................................................... 238
11.37. Meghalaya ............................................................................................................... 244
11.38. Mizoram .................................................................................................................. 250
11.39. Nagaland .................................................................................................................. 256
11.40. Tripura ..................................................................................................................... 262
Seasonality analysis of load factor in Indian Power System vi | P a g e
List of Tables
Table 1:All India/Regional Load Factor Pattern (As per 18th EPS) ....................................................... 2
Table 2:All India Yearly Energy supplied and Peak Demand met (as per CEA LGBR report) ............... 3
Table 3:Comparison of anticipated (as per 18th EPS) and load factor (as per CEA LGBR) .................... 3
Table 4:Anticipated Load factor based on 19th EPS report .................................................................. 3
Table 5:All India and Regional annual demand diversity over the years ............................................. 5
Table 6: Demand diversity for minimum all India demand .................................................................. 6
Table 7:Seasonality index- All India & Region wise .............................................................................. 8
Table 8:Daily, monthly and yearly loads factor of all India & regions ............................................... 11
Table 9:State wise load factor ............................................................................................................. 15
Table 10: Coefficient of the trend line for Minimum and Maximum loads ....................................... 19
Table 11: Annual load factor of European countries .......................................................................... 20
Seasonality analysis of load factor in Indian Power System vii | P a g e
List of Figures
Figure 1: Heat map of avg monthly all India diversity factor (w.r.t. max) ........................................... 5
Figure 2: Heat map of avg monthly all India diversity factor (w.r.t. min) ............................................ 6
Figure 3:All India Daily load factor & estimated trend ....................................................................... 10
Figure 4:All India demand-Maximum vs Average vs Minimum .......................................................... 11
Figure 5:Yearly duration curve for all India daily load factor ............................................................. 12
Figure 6:Heat map of monthly load factor (mean of daily load factor) ............................................. 13
Figure 7:Monthly and yearly mean load factor .................................................................................. 14
Figure 8: Daily load factor .................................................................................................................... 16
Figure 9:Monthly load factor ............................................................................................................... 16
Figure 10:Annual load factor ............................................................................................................... 17
Figure 11:Gradient of load factor ........................................................................................................ 18
Figure 12:Heatmap of average load factor of major countries of ENTSO-E from 2015-2018 ............ 21
Figure 13:Load Factor Variation in TEPCO,Japan ................................................................................ 22
Figure 14:Load Factor Variation in CEB,Sri Lanka ................................................................................ 22
Figure 15:Load Factor variation in California ISO, USA ....................................................................... 23
Figure 16:Seasonal decomposition of all India load factor trend ....................................................... 28
Figure 17:Linear fitting of all India Load factor trend ......................................................................... 29
Figure 18:Growth in Maximum, Minimum and Average demand alongwith all India Load Factor .. 29
Figure 19:Heatmap of all India monthly average load factor (mean of daily load factor) ................ 30
Figure 20:Duration curve of all India load factor ................................................................................ 30
Figure 21: Cycle-Sub series plot for Yearly/Monthly variation of all India Load Factor .................... 31
Figure 22:Concentration of all India Load factor ................................................................................. 31
Figure 23:Monthly Variation of Load Factor over the years for all India ........................................... 33
Figure 24:Variation of all India load factor .......................................................................................... 33
Figure 25:Seasonal decomposition of NR load factor trend ............................................................... 34
Figure 26:Linear fitting of NR Load factor trend ................................................................................. 35
Figure 27:Growth in Maximum, Minimum and Average demand alongwith NR Load Factor .......... 35
Figure 28:Heatmap of NR monthly average load factor (mean of daily load factor) ....................... 36
Figure 29:Duration curve of NR load factor ........................................................................................ 36
Figure 30:Cycle-Sub series plot for Yearly/Monthly variation of NR Load Factor ............................ 37
Figure 31:Concentration of NR Load factor ......................................................................................... 37
Figure 32:Monthly Variation of Load Factor over the years for NR ................................................... 39
Figure 33:Variation of Northern Region load factor ........................................................................... 39
Figure 34:Seasonal decomposition of WR load factor trend .............................................................. 40
Figure 35:Linear fitting of WR Load factor trend ................................................................................ 41
Figure 36:Growth in Maximum, Minimum and Average demand alongwith WR Load Factor ......... 41
Figure 37:Heatmap of WR monthly average load factor (mean of daily load factor) ...................... 42
Figure 38:Duration curve of WR load factor ....................................................................................... 42
Figure 39:Cycle-Sub series plot for Yearly/Monthly variation of WR Load Factor ........................... 43
Figure 40:Concentration of WR Load factor ........................................................................................ 43
Figure 41:Monthly Variation of Load Factor over the years for WR .................................................. 45
Figure 42:Variation of Western Region load factor ............................................................................ 45
Figure 43:Seasonal decomposition of SR load factor trend ................................................................ 46
Figure 44:Linear fitting of SR Load factor trend: ................................................................................. 47
Figure 45:Growth in Maximum, Minimum and Average demand alongwith SR Load Factor ........... 47
Figure 46:Heatmap of SR monthly average load factor (mean of daily load factor) ........................ 48
Figure 47:Duration curve of SR load factor ......................................................................................... 48
Figure 48:Cycle-Sub series plot for Yearly/Monthly variation of SR Load Factor ............................. 49

Seasonality analysis of load factor in Indian Power System viii | P a g e
Figure 49:Concentration of SR Load factor .......................................................................................... 49
Figure 50:Monthly Variation of Load Factor over the years for SR .................................................... 51
Figure 51:Variation of Southern Region load factor ........................................................................... 51
Figure 52:Seasonal decomposition of ER load factor trend ................................................................ 52
Figure 53:Linear fitting of ER Load factor trend .................................................................................. 53
Figure 54:Growth in Maximum, Minimum and Average demand alongwith ER Load Factor ........... 53
Figure 55:Heatmap of ER monthly average load factor (mean of daily load factor) ........................ 54
Figure 56:Duration curve of ER load factor ......................................................................................... 54
Figure 57:Cycle-Sub series plot for Yearly/Monthly variation of ER Load Factor ............................ 55
Figure 58:Concentration of ER Load factor .......................................................................................... 55
Figure 59:Monthly Variation of Load Factor over the years for ER .................................................... 57
Figure 60:Variation of Eastern Region load factor .............................................................................. 57
Figure 61:Seasonal decomposition of NER load factor trend ............................................................ 58
Figure 62:Linear fitting of NER Load factor trend ............................................................................... 59
Figure 63:Growth in Maximum, Minimum and Average demand alongwith NER Load Factor ........ 59
Figure 64:Heatmap of NER monthly average load factor (mean of daily load factor) ..................... 60
Figure 65:Duration curve of NER load factor: ..................................................................................... 60
Figure 66:Cycle-Sub series plot for Yearly/Monthly variation of NER Load Factor: ......................... 61
Figure 67:Concentration of NER Load factor ...................................................................................... 61
Figure 68:Monthly Variation of Load Factor over the years for NER ................................................. 63
Figure 69:Variation of NER load factor ................................................................................................ 63
Figure 70:Seasonal decomposition of Uttar Pradesh load factor trend ............................................. 64
Figure 71:Linear fitting of Uttar Pradesh Load factor trend ............................................................... 65
Figure 72:Growth in Max, Min and Avg. demand alongwith Uttar Pradesh Load Factor ................. 65
Figure 73:Heatmap of Uttar Pradesh monthly average load factor (mean of daily load factor) ..... 66
Figure 74:Duration curve of Uttar Pradesh load factor ...................................................................... 66
Figure 75:Cycle-Sub series plot for Yearly/Monthly variation of Uttar Pradesh Load Factor .......... 67
Figure 76:Concentration of Uttar Pradesh Load factor ....................................................................... 67
Figure 77:Monthly Variation of Load Factor over the years for Uttar Pradesh ................................. 69
Figure 78:Variation of Uttar Pradesh load factor ................................................................................ 69
Figure 79:Seasonal decomposition of Rajasthan load factor trend ................................................... 70
Figure 80:Linear fitting of Rajasthan Load factor trend ...................................................................... 71
Figure 81:Growth in Max, Min and Avg. demand alongwith Rajasthan Load Factor: ....................... 71
Figure 82:Heatmap of Rajasthan monthly average load factor (mean of daily load factor) ............. 72
Figure 83:Duration curve of Rajasthan load factor ............................................................................. 72
Figure 84:Cycle-Sub series plot for Yearly/Monthly variation of Rajasthan Load Factor ................. 73
Figure 85:Concentration of Rajasthan Load factor ............................................................................. 73
Figure 86:Monthly Variation of Load Factor over the years for Rajasthan ........................................ 75
Figure 87:Variation of Rajasthan load factor ...................................................................................... 75
Figure 88:Seasonal decomposition of Haryana load factor trend ...................................................... 76
Figure 89:Linear fitting of Haryana Load factor trend ........................................................................ 77
Figure 90:Growth in Maximum, Minimum and Average demand alongwith Haryana Load Factor . 77
Figure 91:Heatmap of Haryana monthly average load factor (mean of daily load factor) ............... 78
Figure 92:Duration curve of Haryana load factor ............................................................................... 78
Figure 93:Cycle-Sub series plot for Yearly/Monthly variation of Haryana Load Factor ................... 79
Figure 94:Concentration of Haryana Load factor ................................................................................ 79
Figure 95:Monthly Variation of Load Factor over the years for Haryana .......................................... 81
Figure 96:Variation of Haryana load factor ......................................................................................... 81
Figure 97:Seasonal decomposition of Punjab load factor trend ........................................................ 82
Figure 98:Linear fitting of Punjab Load factor trend ........................................................................... 83

Seasonality analysis of load factor in Indian Power System ix | P a g e
Figure 99:Growth in Maximum, Minimum and Average demand alongwith Punjab Load Factor ... 83
Figure 100:Heatmap of Punjab monthly average load factor (mean of daily load factor) ................ 84
Figure 101:Duration curve of Punjab load factor ................................................................................ 84
Figure 102:Cycle-Sub series plot for Yearly/Monthly variation of Punjab Load Factor .................... 85
Figure 103:Concentration of Punjab Load factor ................................................................................ 85
Figure 104:Monthly Variation of Load Factor over the years for Punjab ........................................... 87
Figure 105:Variation of Punjab load factor ......................................................................................... 87
Figure 106:Seasonal decomposition of Delhi load factor trend ......................................................... 88
Figure 107:Linear fitting of Delhi Load factor trend ............................................................................ 89
Figure 108:Growth in Maximum, Minimum and Average demand alongwith Delhi Load Factor .... 89
Figure 109:Heatmap of Delhi monthly average load factor (mean of daily load factor) ................... 90
Figure 110:Duration curve of Delhi load factor ................................................................................... 90
Figure 111:Cycle-Sub series plot for Yearly/Monthly variation of Delhi Load Factor ...................... 91
Figure 112:Concentration of Delhi Load factor ................................................................................... 91
Figure 113:Monthly Variation of Load Factor over the years for Delhi ............................................. 93
Figure 114:Variation of Delhi load factor ............................................................................................ 93
Figure 115:Seasonal decomposition of Uttarakhand load factor trend ............................................. 94
Figure 116:Linear fitting of Uttarakhand Load factor trend ............................................................... 95
Figure 117:Growth in Max, Min and Avg. demand alongwith Uttarakhand Load Factor ................. 95
Figure 118:Heatmap of Uttarakhand monthly average load factor (mean of daily load factor) ...... 96
Figure 119:Duration curve of Uttarakhand load factor ...................................................................... 96
Figure 120:Cycle-Sub series plot for Yearly/Monthly variation of Uttarakhand Load Factor .......... 97
Figure 121:Concentration of Uttarakhand Load factor ....................................................................... 97
Figure 122:Monthly Variation of Load Factor over the years for Uttarakhand ................................. 99
Figure 123:Variation of Uttarakhand load factor ................................................................................ 99
Figure 124:Seasonal decomposition of Himachal Pradesh load factor trend .................................. 100
Figure 125:Linear fitting of Himachal Pradesh Load factor trend: ................................................... 101
Figure 126:Growth in Max, Min and Avg. demand alongwith Himachal Pradesh Load Factor ....... 101
Figure 127:Heatmap of Himachal Pradesh monthly average (mean of daily load factor) .............. 102
Figure 128:Duration curve of Himachal Pradesh load factor ............................................................ 102
Figure 129:Cycle-Sub series plot for Yearly/Monthly variation of Himachal Pradesh Load Factor 103
Figure 130:Concentration of Himachal Pradesh Load factor ............................................................ 103
Figure 131:Monthly Variation of Load Factor over the years for Himachal Pradesh ...................... 105
Figure 132:Variation of Himachal Pradesh load factor ..................................................................... 105
Figure 133:Seasonal decomposition of Chandigarh load factor trend ............................................. 106
Figure 134:Linear fitting of Chandigarh Load factor trend ............................................................... 107
Figure 135:Growth in Max, Min and Avg. demand alongwith Chandigarh Load Factor .................. 107
Figure 136:Heatmap of Chandigarh monthly average load factor (mean of daily load factor) ...... 108
Figure 137:Duration curve of Chandigarh load factor ...................................................................... 108
Figure 138:Cycle-Sub series plot for Yearly/Monthly variation of Chandigarh Load Factor .......... 109
Figure 139:Concentration of Chandigarh Load factor ....................................................................... 109
Figure 140:Monthly Variation of Load Factor over the years for Chandigarh ................................. 111
Figure 141:Variation of Chandigarh load factor ................................................................................ 111
Figure 142:Seasonal decomposition of J&K and Ladakh load factor trend ...................................... 112
Figure 143:Linear fitting of J&K and Ladakh Load factor trend ........................................................ 113
Figure 144:Growth in Max, Min and Avg. demand alongwith J&K and Ladakh Load Factor .......... 113
Figure 145:Heatmap of J&K and Ladakh monthly average load factor (mean of daily load factor)114
Figure 146:Duration curve of J&K and Ladakh load factor ............................................................... 114
Figure 147:Cycle-Sub series plot for Yearly/Monthly variation of J&K and Ladakh Load Factor ... 115
Figure 148:Concentration of J&K and Ladakh Load factor ................................................................ 115
Seasonality analysis of load factor in Indian Power System x | P a g e
Figure 149:Monthly Variation of Load Factor over the years for J&K and Ladakh .......................... 117
Figure 150:Variation of J&K and Ladakh load factor ......................................................................... 117
Figure 151:Seasonal decomposition of Maharashtra load factor trend .......................................... 118
Figure 152:Linear fitting of Maharashtra Load factor trend ............................................................. 119
Figure 153: Growth in Max, Min and Avg. demand alongwith Maharashtra Load Factor .............. 119
Figure 154:Heatmap of monthly average load factor of Maharashtra (mean of daily load factor) 120
Figure 155:Duration curve of Maharashtra load factor .................................................................... 120
Figure 156:Cycle-Sub series plot for Yearly/Monthly variation of Maharashtra Load Factor ........ 121
Figure 157:Concentration of Maharashtra Load factor .................................................................... 121
Figure 158:Maharashtra Monthly Variation of Load Factor over the years .................................... 123
Figure 159:Variation of Maharashtra load factor ............................................................................. 123
Figure 160:Seasonal decomposition of Gujarat load factor trend ................................................... 124
Figure 161:Linear fitting of Gujarat Load factor trend ...................................................................... 125
Figure 162:Growth in Max, Min and Avg demand alongwith Gujarat Load Factor ......................... 125
Figure 163:Heatmap of Gujarat monthly average load factor (mean of daily load factor) ............. 126
Figure 164:Duration curve for Gujarat load factor............................................................................ 126
Figure 165:Cycle-Sub series plot for Yearly/Monthly variation of Gujarat Load Factor ................ 127
Figure 166:Concentration of Gujarat Load factor ............................................................................. 127
Figure 167:Monthly Variation of Load Factor over the years for Gujarat ........................................ 129
Figure 168:Variation of Gujarat load factor ...................................................................................... 129
Figure 169:Seasonal decomposition of Madhya Pradesh load factor trend .................................... 130
Figure 170:Linear fitting of Madhya Pradesh Load factor trend ...................................................... 131
Figure 171:Growth in Max, Min and Avg. demand alongwith Madhya Pradesh Load Factor ......... 131
Figure 172:Heatmap of Madhya Pradesh monthly average (mean of daily load factor) ................ 132
Figure 173:Duration curve for Madhya Pradesh load factor ............................................................ 132
Figure 174:Cycle-Sub series plot for Yearly/Monthly variation of Madhya Pradesh Load Factor . 133
Figure 175:Concentration of Madhya Pradesh Load factor .............................................................. 133
Figure 176:Monthly Variation of Load Factor over the years for Madhya Pradesh ........................ 135
Figure 177:Variation of Madhya Pradesh load factor ....................................................................... 135
Figure 178:Seasonal decomposition of Chhattisgarh load factor trend ........................................... 136
Figure 179:Linear fitting of Chhattisgarh Load factor trend ............................................................. 137
Figure 180:Growth in Max, Min and Avg demand alongwith Chhattisgarh Load Factor ............... 137
Figure 181:Heatmap of Chhattisgarh monthly average load factor (mean of daily load factor) .... 138
Figure 182:Duration curve for Chhattisgarh load factor ................................................................... 138
Figure 183:Cycle-Sub series plot for Yearly/Monthly variation of Chhattisgarh Load Factor ........ 139
Figure 184:Concentration of Chhattisgarh Load factor ..................................................................... 139
Figure 185:Monthly Variation of Load Factor over the years for Chhattisgarh ............................... 141
Figure 186:Variation of Chhattisgarh load factor .............................................................................. 141
Figure 187:Seasonal decomposition of Goa load factor trend ......................................................... 142
Figure 188:Linear fitting of Goa Load factor trend ............................................................................ 143
Figure 189:Growth in Maximum, Minimum and Average demand alongwith Goa Load Factor .... 143
Figure 190:Heatmap of Goa monthly average load factor (mean of daily load factor) ................... 144
Figure 191:Duration curve for Goa load factor ................................................................................. 144
Figure 192:Cycle-Sub series plot for Yearly/Monthly variation of Goa Load Factor ....................... 145
Figure 193:Concentration of Goa Load factor ................................................................................... 145
Figure 194:Monthly Variation of Load Factor over the years for Goa ............................................. 147
Figure 195:Variation of Goa load factor ............................................................................................ 147
Figure 196:Seasonal decomposition of Tamil Nadu load factor trend ............................................. 148
Figure 197:Linear fitting of Tamil Nadu Load factor trend ............................................................... 149
Figure 198:Growth in Max, Min and Avg. demand alongwith Tamil Nadu Load Factor.................. 149
Seasonality analysis of load factor in Indian Power System xi | P a g e
Figure 199:Heatmap of Tamil Nadu monthly average load factor (mean of daily load factor) ...... 150
Figure 200:Duration curve of Tamil Nadu load factor ...................................................................... 150
Figure 201:Cycle-Sub series plot for Yearly/Monthly variation of Tamil Nadu Load Factor .......... 151
Figure 202:Concentration of Tamil Nadu Load factor ....................................................................... 151
Figure 203:Monthly Variation of Load Factor over the years for Tamil Nadu ................................. 153
Figure 204:Variation of Tamil Nadu load factor ................................................................................ 153
Figure 205:Seasonal decomposition of Karnataka load factor trend ............................................... 154
Figure 206:Linear fitting of Karnataka Load factor trend ................................................................. 155
Figure 207:Growth in Max., Min and Avg. demand alongwith Karnataka Load Factor .................. 155
Figure 208:Heatmap of Karnataka monthly average load factor (mean of daily load factor) ........ 156
Figure 209:Duration curve of Karnataka load factor ........................................................................ 156
Figure 210:Cycle-Sub series plot for Yearly/Monthly variation of Karnataka Load Factor ............ 157
Figure 211:Concentration of Karnataka Load factor ......................................................................... 157
Figure 212:Monthly Variation of Load Factor over the years for Karnataka ................................... 159
Figure 213:Variation of Karnataka load factor .................................................................................. 159
Figure 214:Seasonal decomposition of AP+TEL load factor trend .................................................... 160
Figure 215:Linear fitting of AP+TEL Load factor trend: ..................................................................... 161
Figure 216:Growth in Max, Min and Avg demand alongwith AP+TEL Load Factor ......................... 161
Figure 217:Heatmap of AP+TEL monthly average load factor (mean of daily load factor) ............. 162
Figure 218:Duration curve of AP+TEL load factor ............................................................................. 162
Figure 219:Cycle-Sub series plot for Yearly/Monthly variation of AP+TEL Load Factor ................. 163
Figure 220:Concentration of AP+TEL Load factor ............................................................................. 163
Figure 221:Monthly Variation of Load Factor over the years for AP+TEL ........................................ 165
Figure 222:Variation of AP+TEL load factor ....................................................................................... 165
Figure 223:Seasonal decomposition of Andhra Pradesh load factor trend ..................................... 166
Figure 224:Linear fitting of Andhra Pradesh Load factor trend ........................................................ 167
Figure 225:Growth in Max, Min and Avg. demand alongwith Andhra Pradesh Load Factor .......... 167
Figure 226:Heatmap of Andhra Pradesh monthly average (mean of daily load factor) .................. 168
Figure 227:Duration curve of Andhra Pradesh load factor ............................................................... 168
Figure 228:Cycle-Sub series plot for Yearly/Monthly variation of Andhra Pradesh Load Factor ... 169
Figure 229:Concentration of Andhra Pradesh Load factor ............................................................... 169
Figure 230:Monthly Variation of Load Factor over the years for Andhra Pradesh .......................... 170
Figure 231:Variation of Andhra Pradesh load factor ........................................................................ 171
Figure 232:Seasonal decomposition of Telangana load factor trend ............................................... 172
Figure 233:Linear fitting of Telangana Load factor trend: ................................................................ 173
Figure 234:Growth in Max, Min and Avg. demand alongwith Telangana Load Factor .................. 173
Figure 235:Heatmap of Telangana monthly average load factor (mean of daily load factor) ........ 174
Figure 236:Duration curve of Telangana load factor ........................................................................ 174
Figure 237:Cycle-Sub series plot for Yearly/Monthly variation of Telangana Load Factor ............ 175
Figure 238:Concentration of Telangana Load factor ......................................................................... 175
Figure 239:Monthly Variation of Load Factor over the years for Telangana ................................... 176
Figure 240:Variation of Telangana load factor .................................................................................. 177
Figure 241:Seasonal decomposition of Kerala load factor trend ..................................................... 178
Figure 242:Linear fitting of Kerala Load factor trend: ....................................................................... 179
Figure 243:Growth in Max, Min and Avg. demand alongwith Kerala Load Factor .......................... 179
Figure 244:Heatmap of Kerala monthly average load factor (mean of daily load factor) ............... 180
Figure 245:Duration curve of Kerala load factor ............................................................................... 180
Figure 246:Cycle-Sub series plot for Yearly/Monthly variation of Kerala Load Factor ................... 181
Figure 247:Concentration of Kerala Load factor ............................................................................... 181
Figure 248:Monthly Variation of Load Factor over the years for Kerala .......................................... 183

Seasonality analysis of load factor in Indian Power System xii | P a g e
Figure 249:Variation of Kerala load factor ........................................................................................ 183
Figure 250:Seasonal decomposition of Puducherry load factor trend ............................................. 184
Figure 251:Linear fitting of Puducherry Load factor trend ............................................................... 185
Figure 252:Growth in Max, Min and Avg. demand alongwith Puducherry Load Factor ................. 185
Figure 253:Heatmap of Puducherry monthly average load factor (mean of daily load factor) ...... 186
Figure 254:Duration curve of Puducherry load factor ...................................................................... 186
Figure 255:Cycle-Sub series plot for Yearly/Monthly variation of Puducherry Load Factor .......... 187
Figure 256:Concentration of Puducherry Load factor ....................................................................... 187
Figure 257:Monthly Variation of Load Factor over the years for Puducherry ................................. 189
Figure 258:Variation of Puducherry load factor ................................................................................ 189
Figure 259:Seasonal decomposition of West Bengal load factor trend ........................................... 190
Figure 260:Linear fitting of West Bengal Load factor trend .............................................................. 191
Figure 261:Growth in Max, Min and Avg demand alongwith West Bengal Load Factor ................. 191
Figure 262:Heatmap of West Bengal monthly average load factor (mean of daily load factor)..... 192
Figure 263:Duration curve for West Bengal load factor ................................................................... 192
Figure 264:Cycle-Sub series plot for Yearly/Monthly variation of West Bengal Load Factor ........ 193
Figure 265:Concentration of West Bengal Load factor ..................................................................... 193
Figure 266:Monthly Variation of Load Factor over the years for West Bengal ............................... 195
Figure 267:Variation of West Bengal load factor .............................................................................. 195
Figure 268:Seasonal decomposition of Bihar load factor trend ....................................................... 196
Figure 269:Linear fitting of Bihar Load factor trend.......................................................................... 197
Figure 270:Growth in Maximum, Minimum and Average demand alongwith Bihar Load Factor: . 197
Figure 271:Heatmap of Bihar monthly average load factor (mean of daily load factor) ................ 198
Figure 272:Duration curve for Bihar load factor ............................................................................... 198
Figure 273:Cycle-Sub series plot for Yearly/Monthly variation of Bihar Load Factor .................... 199
Figure 274:Concentration of Bihar Load factor ................................................................................. 199
Figure 275:Monthly Variation of Load Factor over the years for Bihar ........................................... 201
Figure 276:Variation of Bihar load factor .......................................................................................... 201
Figure 277:Seasonal decomposition of Odisha load factor trend .................................................... 202
Figure 278:Linear fitting of Odisha Load factor trend ....................................................................... 203
Figure 279:Growth in Maximum, Minimum and Average demand alongwith Odisha Load Factor 203
Figure 280:Heatmap of Odisha monthly average load factor (mean of daily load factor) .............. 204
Figure 281:Duration curve of Odisha load factor .............................................................................. 204
Figure 282:Cycle-Sub series plot for Yearly/Monthly variation of Odisha Load Factor .................. 205
Figure 283:Concentration of Odisha Load factor .............................................................................. 205
Figure 284:Monthly Variation of Load Factor over the years for Odisha ......................................... 207
Figure 285:Variation of Odisha load factor ....................................................................................... 207
Figure 286:Seasonal decomposition of Jharkhand load factor trend ............................................... 208
Figure 287:Linear fitting of Jharkhand Load factor trend ................................................................. 209
Figure 288:Growth in Max, Min and Avg. demand alongwith Jharkhand Load Factor ................... 209
Figure 289:Heatmap of Jharkhand monthly average load factor (mean of daily load factor) ........ 210
Figure 290:Duration curve for Jharkhand load factor ....................................................................... 210
Figure 291:Cycle-Sub series plot for Yearly/Monthly variation of Jharkhand Load Factor ............ 211
Figure 292:Concentration of Jharkhand Load factor ......................................................................... 211
Figure 293:Monthly Variation of Load Factor over the years for Jharkhand ................................... 213
Figure 294:Variation of Jharkhand load factor .................................................................................. 213
Figure 295:Seasonal decomposition of DVC load factor trend ......................................................... 214
Figure 296:Linear fitting of DVC Load factor trend ........................................................................... 215
Figure 297:Growth in Maximum, Minimum and Average demand alongwith DVC Load Factor .... 215
Figure 298:Heatmap of DVC monthly average load factor (mean of daily load factor) .................. 216
Seasonality analysis of load factor in Indian Power System xiii | P a g e
Figure 299:Duration curve of DVC load factor .................................................................................. 216
Figure 300:Cycle-Sub series plot for Yearly/Monthly variation of DVC Load Factor ...................... 217
Figure 301:Concentration of DVC Load factor ................................................................................... 217
Figure 302:Monthly Variation of Load Factor over the years for DVC ............................................. 219
Figure 303:Variation of DVC load factor ............................................................................................ 219
Figure 304:Seasonal decomposition of Sikkim load factor trend. .................................................... 220
Figure 305:Linear fitting of Sikkim Load factor trend ....................................................................... 221
Figure 306:Growth in Maximum, Minimum and Average demand alongwith Sikkim Load Factor221
Figure 307:Heatmap of Sikkim monthly average load factor (mean of daily load factor) .............. 222
Figure 308:Duration curve of Sikkim load factor .............................................................................. 222
Figure 309:Cycle-Sub series plot for Yearly/Monthly variation of Sikkim Load Factor .................. 223
Figure 310:Concentration of Sikkim Load factor ............................................................................... 223
Figure 311:Monthly Variation of Load Factor over the years for Sikkim ......................................... 225
Figure 312:Variation of Sikkim load factor ........................................................................................ 225
Figure 313:Seasonal decomposition of Assam load factor trend ..................................................... 226
Figure 314:Linear fitting of Assam Load factor trend ....................................................................... 227
Figure 315:Growth in Maximum, Minimum and Average demand alongwith Assam Load Factor:227
Figure 316:Heatmap of Assam monthly average load factor (mean of daily load factor) .............. 228
Figure 317:Duration curve of Assam load factor ............................................................................... 228
Figure 318:Cycle-Sub series plot for Yearly/Monthly variation of Assam Load Factor .................. 229
Figure 319:Concentration of Assam Load factor ............................................................................... 229
Figure 320:Monthly Variation of Load Factor over the years for Assam ......................................... 231
Figure 321:Variation of Assam load factor ........................................................................................ 231
Figure 322:Seasonal decomposition of Manipur load factor trend .................................................. 232
Figure 323:Linear fitting of Manipur Load factor trend .................................................................... 233
Figure 324:Growth in Max, Min and Avg. demand alongwith Manipur Load Factor: ..................... 233
Figure 325:Heatmap of Manipur monthly average load factor (mean of daily load factor) ........... 234
Figure 326:Duration curve of Manipur load factor ........................................................................... 234
Figure 327:Cycle-Sub series plot for Yearly/Monthly variation of Manipur Load Factor ............... 235
Figure 328:Concentration of Manipur Load factor ........................................................................... 235
Figure 329:Monthly Variation of Load Factor over the years for Manipur ...................................... 237
Figure 330:Variation of Manipur load factor .................................................................................... 237
Figure 331:Seasonal decomposition of Arunachal Pradesh load factor trend ................................. 238
Figure 332:Linear fitting of Arunachal Pradesh Load factor trend ................................................... 239
Figure 333:Growth in Max, Min and Avg demand alongwith Arunachal Pradesh Load Factor ...... 239
Figure 334:Heatmap of Arunachal Pradesh monthly average (mean of daily load factor) ............. 240
Figure 335:Duration curve of Arunachal Pradesh load factor .......................................................... 240
Figure 336:Cycle-Sub series plot for Yearly/Monthly variation of Ar. Pradesh Load Factor ........... 241
Figure 337:Concentration of Arunachal Pradesh Load factor ........................................................... 241
Figure 338:Monthly Variation of Load Factor over the years for Arunachal Pradesh ..................... 243
Figure 339:Variation of Arunachal Pradesh load factor .................................................................... 243
Figure 340:Seasonal decomposition of Meghalaya load factor trend ............................................. 244
Figure 341:Linear fitting of Meghalaya Load factor trend ................................................................ 245
Figure 342:Growth in Max, Min and Avg. demand alongwith Meghalaya Load Factor .................. 245
Figure 343:Heatmap of Meghalaya monthly average load factor (mean of daily load factor) ....... 246
Figure 344:Duration curve of Meghalaya load factor ....................................................................... 246
Figure 345:Cycle-Sub series plot for Yearly/Monthly variation of Meghalaya Load Factor ........... 247
Figure 346:Concentration of Meghalaya Load factor ....................................................................... 247
Figure 347:Monthly Variation of Load Factor over the years for Meghalaya .................................. 249
Figure 348:Variation of Meghalaya load factor ................................................................................ 249

Seasonality analysis of load factor in Indian Power System xiv | P a g e
Figure 349:Seasonal decomposition of Mizoram load factor trend ................................................. 250
Figure 350:Linear fitting of Mizoram Load factor trend ................................................................... 251
Figure 351:Growth in Max, Min and Avg. demand alongwith Mizoram Load Factor:..................... 251
Figure 352:Heatmap of Mizoram monthly average load factor (mean of daily load factor) .......... 252
Figure 353:Duration curve of Mizoram load factor ........................................................................... 252
Figure 354:Cycle-Sub series plot for Yearly/Monthly variation of Mizoram Load Factor .............. 253
Figure 355:Concentration of Mizoram Load factor ........................................................................... 253
Figure 356:Monthly Variation of Load Factor over the years for Mizoram ..................................... 255
Figure 357:Variation of Mizoram load factor .................................................................................... 255
Figure 358:Seasonal decomposition of Nagaland load factor trend ................................................ 256
Figure 359:Linear fitting of Nagaland Load factor trend ................................................................... 257
Figure 360:Growth in Max, Min and Avg. demand alongwith Nagaland Load Factor ..................... 257
Figure 361:Heatmap of Nagaland monthly average load factor (mean of daily load factor).......... 258
Figure 362:Duration curve of Nagaland load factor .......................................................................... 258
Figure 363:Cycle-Sub series plot for Yearly/Monthly variation of Nagaland Load Factor .............. 259
Figure 364:Concentration of Nagaland Load factor .......................................................................... 259
Figure 365:Monthly Variation of Load Factor over the years for Nagaland .................................... 261
Figure 366:Variation of Nagaland load factor ................................................................................... 261
Figure 367:Seasonal decomposition of Tripura load factor trend .................................................... 262
Figure 368:Linear fitting of Tripura Load factor trend ...................................................................... 263
Figure 369:Growth in Max, Min and Avg. demand alongwith Tripura Load Factor ....................... 263
Figure 370:Heatmap of Tripura monthly average load factor (mean of daily load factor) ............. 264
Figure 371:Duration curve of Tripura load factor ............................................................................. 264
Figure 372:Cycle-Sub series plot for Yearly/Monthly variation of Tripura Load Factor ................. 265
Figure 373:Concentration of Tripura Load factor .............................................................................. 265
Figure 374:Monthly Variation of Load Factor over the years for Tripura ........................................ 267
Figure 375:Variation of Tripura load factor ....................................................................................... 267

Seasonality analysis of load factor in Indian Power System xv | P a g e
Executive Summary
Electricity demand/consumption characteristics in a power system are often defined by connected
load, estimated demand, maximum demand met, minimum demand met, average load, load factor,
diversity factor, utilization factor and so on. The above characteristics are influenced by factors such
as availability of generation resources, demographics, energy policy, network interconnections, access
to electricity, system reliability, market design, price of electricity, economic development, weather,
and other factors.
Load factor is defined as the ratio of the average load to the peak load during a certain period. It is
always less than unity. High load factor is desirable as it implies that the fixed cost, which is
proportional to the maximum demand, is distributed over a greater number of units (kWh) supplied.
This will lower the overall cost of the supply of electric energy. Thus, the system load factor affects
the overall economics of power system.
Load factor trends provides cues for policy interventions to channelize future investments towards
higher capacity utilization of assets. While evaluating different policy trajectories, the policy makers
could prefer the one that increases the load factor. Regulators are also deeply concerned about the
cost of supply and the utilization of assets. Load factor trends provides cues for regulatory
interventions through market design.
Load factor is one of the basic inputs in perspective planning. Load factor is relevant in the selection
of type of generation and transmission capacities for the system. It is required for techno economic
feasibility assessment of various investment proposals. System Operators refer the historical trends
of load factor to align the future maintenance and despatch strategies towards enhancing the system
load factor and minimizing operational risks.
Analysis of daily, monthly, and annual load factor has been carried out in this report using 5 minutes
SCADA data over the last twelve years (from 01.01.2009 to 31.12.2020) available at NLDC. Variation
of load factor for all India and regions along with their daily load factor trend is given below:
Region Daily Monthly Yearly Gradient*
NR 90% 84% 73% ↓
WR 92% 86% 79% ↓
SR 91% 86% 81% ↓
ER 85% 79% 73% ↓
NER 73% 67% 59% ↓
All India 92% 88% 83% ↓
*Gradient of daily load factor
Seasonality analysis of load factor in Indian Power System xvi | P a g e
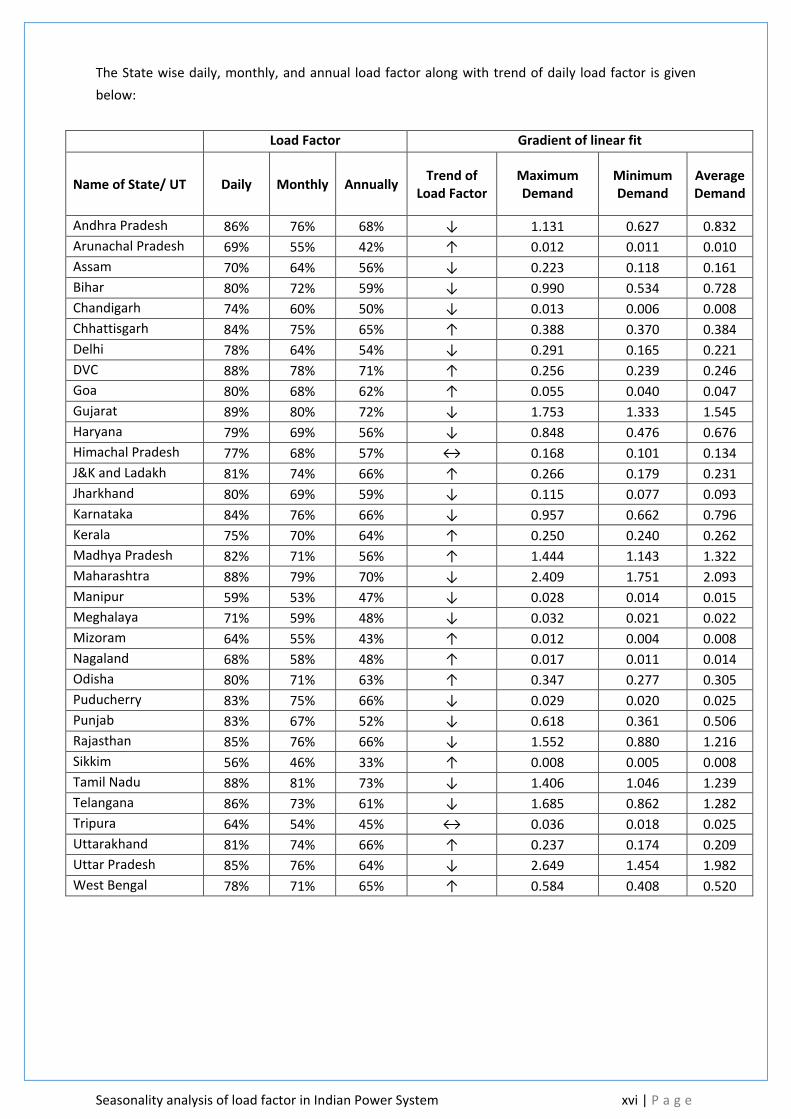
The State wise daily, monthly, and annual load factor along with trend of daily load factor is given
below:
Load Factor Gradient of linear fit
Name of State/ UT Daily Monthly Annually Trend of
Load Factor Maximum Demand
Minimum Demand
Average Demand
Andhra Pradesh 86% 76% 68% ↓ 1.131 0.627 0.832
Arunachal Pradesh 69% 55% 42% ↑ 0.012 0.011 0.010
Assam 70% 64% 56% ↓ 0.223 0.118 0.161
Bihar 80% 72% 59% ↓ 0.990 0.534 0.728
Chandigarh 74% 60% 50% ↓ 0.013 0.006 0.008
Chhattisgarh 84% 75% 65% ↑ 0.388 0.370 0.384
Delhi 78% 64% 54% ↓ 0.291 0.165 0.221
DVC 88% 78% 71% ↑ 0.256 0.239 0.246
Goa 80% 68% 62% ↑ 0.055 0.040 0.047
Gujarat 89% 80% 72% ↓ 1.753 1.333 1.545
Haryana 79% 69% 56% ↓ 0.848 0.476 0.676
Himachal Pradesh 77% 68% 57% ↔ 0.168 0.101 0.134
J&K and Ladakh 81% 74% 66% ↑ 0.266 0.179 0.231
Jharkhand 80% 69% 59% ↓ 0.115 0.077 0.093
Karnataka 84% 76% 66% ↓ 0.957 0.662 0.796
Kerala 75% 70% 64% ↑ 0.250 0.240 0.262
Madhya Pradesh 82% 71% 56% ↑ 1.444 1.143 1.322
Maharashtra 88% 79% 70% ↓ 2.409 1.751 2.093
Manipur 59% 53% 47% ↓ 0.028 0.014 0.015
Meghalaya 71% 59% 48% ↓ 0.032 0.021 0.022
Mizoram 64% 55% 43% ↑ 0.012 0.004 0.008
Nagaland 68% 58% 48% ↑ 0.017 0.011 0.014
Odisha 80% 71% 63% ↑ 0.347 0.277 0.305
Puducherry 83% 75% 66% ↓ 0.029 0.020 0.025
Punjab 83% 67% 52% ↓ 0.618 0.361 0.506
Rajasthan 85% 76% 66% ↓ 1.552 0.880 1.216
Sikkim 56% 46% 33% ↑ 0.008 0.005 0.008
Tamil Nadu 88% 81% 73% ↓ 1.406 1.046 1.239
Telangana 86% 73% 61% ↓ 1.685 0.862 1.282
Tripura 64% 54% 45% ↔ 0.036 0.018 0.025
Uttarakhand 81% 74% 66% ↑ 0.237 0.174 0.209
Uttar Pradesh 85% 76% 64% ↓ 2.649 1.454 1.982
West Bengal 78% 71% 65% ↑ 0.584 0.408 0.520
Seasonality analysis of load factor in Indian Power System xvii | P a g e
The major observations from this analysis are as below:
1. The all-India annual load factor remained in the narrow range of 83-86% in the last 12 years
while the daily all India diversity factor of maximum demand is increasing.
2. The high load factor could be attributed to a combination of benefits derived out of demand
side management in different States, the synchronous interconnection of regional grids to
form the national grid for sharing of generation capacity, rapid augmentation in transmission
capacity and transfer capability to facilitate exploitation of diversity in the State/regional
power system and. It moved in a narrow range over the years because the rate of growth of
energy and peak demand has been around the same.
3. Maximum demand is increasing with a faster rate than the average demand and minimum
demand.
4. All India daily load factor was above 90% for 70% of the time, however, in 2019 & 2020, it was
60% of the time. Variation between summer and winter is about 5-6%.
5. Daily all India Load factor is gradually decreasing. This could be attributed to significant
reduction in the peak and energy shortage consequent to rapid augmentation in the
conventional as well as new and renewable energy generation capacity in the grid.
6. Northern Region annual load factor shows a decreasing trend. It reduced from 79% in year
2009 to 63% in year 2020. Variation in daily load factor of Northern Region between summer
and winter is about 5-6% which indicates a higher proportion of weather sensitive and
agriculture load within the region.
7. Western Region annual load factor has a decreasing trend. It was 80% in year 2009 to 72% in
year 2020. Variation in daily load factor between seasons over the years is about 8-10%.
8. Southern Region annual load factor is between 69-84%. Variation in load factor is more
prominent in the Southern Region compared to other regions. It has decreased over the last
three years. Also, variation in daily load factor between seasons over the years is about 4-5%.
9. Eastern Region annual load factor has remained steady between 68-77%. Also, seasonal
variation in daily load factor is about 7-9%.
10. North-Eastern Region annual load factor varied between 59-64%. Variation in daily load factor
is about 8-10%. Daily Load factor is Maximum in July-August.
11. Most of the states having decreasing load factor trend except Kerala, Chhattisgarh, Madhya
Pradesh, Odisha and West Bengal.
12. There is minimal impact of seasonality on load factor pattern of Jharkhand and DVC.
13. Key takeaways from the load factor report for policy makers are as under:
a. Declining trend in the load factor in Indian power system points towards the need for
policies that encourage investments in flexible resources and energy storage
technologies.
b. Policies that encourage transnational interconnections to defer CAPEX and increase load
factor by exploiting the regional diversity may be given preference.
c. Demand elasticity could be enhanced by encouraging measures like demand response,
demand side management, staggering of supply hours to bulk consumers.
d. The impact of electrification of different sectors such as transportation and domestic
cooking on the load factor with its fallout on overall investments could be assessed.
Seasonality analysis of load factor in Indian Power System xviii | P a g e
14. Key takeaways from the load factor report for regulatory institutions are as under:
a. Declining load factor points towards need for regulatory interventions through
market design (intra- day market, ancillary services) and tariff design (peaking tariff,
peak hour capacity availability)
b. Enabling mechanisms to assess and harness the reserves available within the existing
capacity could be considered.
15. Key takeaways from the load factor report for perspective planning are as under:
a. Declining load factor is a signal for planning flexible generation (Hydro, Pumped
Storage, Gas, BESS) and transmission assets (Hybrid AC-DC, HVDC, FACTS etc.) instead
of base load or inelastic resources.
b. In an AC system low load factor signals a need for reviewing the reactive resources in
the grid.
16. Key takeaways from the load factor report for system operations are as under:
a. Historical trends of load factor could be referred for short-term and medium-term
operation planning.
b. Asset maintenance plans and despatch strategies could be aligned towards enhancing
the system load factor and minimizing operational risks.
Seasonality analysis of load factor in Indian Power System xix | P a g e
Data Source and Assumption 1. Demand met data considered for this analysis consist primarily of 5 minute and 15
minutes instant/average demand met data captured at National Load Despatch Centre (NLDC) from 2009-2020 through Supervisory Control and Data Acquisition (SCADA) system.
2. The data is stored at 1-minute interval which thereafter, is converted to 5 minute/15
minutes. Maximum demand met for day/months/years have been calculated by using 5/15 minutes instantaneous Demand data.
3. Some discrepancies in data creeps up due to failure of communication at some point of
time. In case of missing data following assumption have been made:
3.1. Loss of data for few hours: Previous day same hour data has been considered. 3.2. Loss of data for entire day: Previous day data has been considered. 3.3. Loss of data for more than a day: Same time period data of previous day has been
considered. 4. The samples collected at a particular time instant through SCADA could have minor
inherent skewedness in the range of seconds.
5. The drawl of a state from inter-state grid, is calculated at the periphery of the state through summation of telemetered power flow data of interconnections. Demand of each state has been calculated as the summation of internal (excluding auxiliary consumption) generation connected to state grid and drawl from the interstate grid. Hence the demand of a state includes, the intrastate transmission and distribution losses. Telemetry failures either from internal generation or from interconnections could result in erroneous demand computation. Generation from Distributed Energy Sources (DER) has not been considered for analysis in this report.
6. Software used: MATLAB and Microsoft Office.
7. Analysis of load factor for Andaman and Nicobar Islands and Lakshadweep, Dadra and
Nagar Haveli and Daman and Diu have not been carried out in this report.
8. Captive generating stations (Estimated installed capacity of 78GW Industrial captive
generation as on 31.03.2020 (source:CEA)) co-located with their loads are not included as
this is not monitored in real time. Similarly, rooftop solar is also excluded.

Seasonality analysis of load factor in Indian Power System xx | P a g e
What is new in the 2nd edition
First edition of the report titled “Electricity Load Factor in Indian Power Systems” was published in the
year 2016. The report presented load factor analysis through seasonality decomposition and linear
trends. It also shared demand diversity and duration curves. This report may be accessed from the
following link:
https://posoco.in/download/electricity-load-factor-in-india-power-system/?wpdmdl=709
In this 2nd edition, apart from seasonality decomposition, quarter-wise seasonality index analysis has
also been carried out which depicts the seasonal variation of regional and all India load factor
throughout the year. This analysis also brings out the load diversity that exists in the country.
Distribution of load factor (for All India, regional and state demand) has been presented through
heatmap and box plots also.
Load factor variation over the years has been analyzed in this report with the help of growth plot of
30 days moving average of maximum, minimum and average daily demand. Monthly average variation
of load factor has been shown along with the annual average in the Cycle Sub-Series plots. Data upto
December-2020 has been considered for analysis.
Sl. No.
Name of Plot
Graphical representation Description
1 Box plots
Graphical depiction of numerical data through their quartiles. Box plots are useful as they provide a visual summary of the data quickly identify median values, the dispersion of the data set, and signs of skewness.
where
Lower extreme: lowest data point excluding any outliers.
Lower quartile: Twenty-five percent of scores fall below the lower quartile value.
Median: Middle value of the dataset.
Inter Quartile Range (IQR): The distance between the top and bottom edges of the box is the IQR
Upper quartile: Seventy-five percent of the scores fall below the upper quartile value
Upper extreme: largest data point excluding any outliers.
Outlier : Outliers are values that are more than (1.5 * IQR)

Seasonality analysis of load factor in Indian Power System xxi | P a g e
away from the upper or lower quartiles.
2 Heatmaps
It shows magnitude of a parameter as color in two dimensions. Red colour indicates high value while blue colour indicates low value. The color variation gives obvious visual cues, how the parameter is clustered or it varies.
3 Growth
plots
Trend of monthly moving mean of minimum/maximum/average demand along with trend of load daily load factor. The trend may be referred to visualize the rate of increase in minimum/maximum/average demands.
4 Cycle-Sub
series plots
Monthly average of daily load factor vs-a-vis annual average of the daily load factor. This chart depicts the variation in annual load factor. It also highlights the months where energy intensity is higher or lower than the annual average.
5 Duration
curve
Duration curve shows the proportion of time for which the variable exceeded a certain value.
Seasonality analysis of load factor in Indian Power System 1 | P a g e
1. Introduction
Load factor is a widely-accepted indicator of system efficiency, calculated as the ratio of average load to peak load in a given time period. This ratio can be influenced through utility initiatives that increase the sale of energy and/or reduce the system peak. System efficiency refers to utilizing system assets to generate the largest possible value for customers/stakeholders. System load factor is a useful indicator of system efficiency, as increasing system load factor often means that total system costs are spread across a larger number of sales units, thus reducing the cost burden for individual customers. Load factor is formally defined as the ratio of average load (over a given period of time) to the maximum or peak load (during the same period). Load factor provides a measure of how “peaky” system load is and may indicate the degree of asset utilization on the grid; i.e., a higher load factor correlates with higher utilization of grid infrastructure. It is calculated as:
𝑳𝒐𝒂𝒅 𝑭𝒂𝒄𝒕𝒐𝒓 = 𝑨𝒗𝒆𝒓𝒂𝒈𝒆 𝒍𝒐𝒂𝒅 𝒊𝒏 𝒈𝒊𝒗𝒆𝒏 𝒕𝒊𝒎𝒆 𝒑𝒆𝒓𝒊𝒐𝒅
𝑷𝒆𝒂𝒌 𝒍𝒐𝒂𝒅
Thus, maximum load factor generally refers that the load profile is entirely flat and does not contain peaks or troughs. The previous report published by POSOCO “Electricity load factor in Indian power system” is available on POSOCO website. Same can be accessed via following link:
https://posoco.in/download/electricity-load-factor-in-india-power-system/?wpdmdl=709 Factors Affecting Load Factor:
• Traditional Variables used to predict electricity consumption
• Gross domestic product
• Weather factors (heating degree days, cooling degree days, seasonal differences)
• Individual customer sector growth
• Population growth
• Employment or other labor statistic
• Household size
2. Classification of Load Factor
Load factor can be calculated on a daily, monthly or annual basis. For the purpose of this analysis three types of load factors have been calculated viz; daily, monthly and yearly.
𝐃𝐚𝐢𝐥𝐲 𝐋𝐨𝐚𝐝 𝐅𝐚𝐜𝐭𝐨𝐫 =𝐃𝐚𝐢𝐥𝐲 𝐀𝐯𝐞𝐫𝐚𝐠𝐞 𝐋𝐨𝐚𝐝
𝐃𝐚𝐢𝐥𝐲 𝐌𝐚𝐱𝐢𝐦𝐮𝐦 𝐋𝐨𝐚𝐝
𝐌𝐨𝐧𝐭𝐡𝐥𝐲 𝐋𝐨𝐚𝐝 𝐅𝐚𝐜𝐭𝐨𝐫 =𝐌𝐨𝐧𝐭𝐡𝐥𝐲 𝐀𝐯𝐞𝐫𝐚𝐠𝐞 𝐋𝐨𝐚𝐝
𝐌𝐨𝐧𝐭𝐡𝐥𝐲 𝐌𝐚𝐱𝐢𝐦𝐮𝐦 𝐋𝐨𝐚𝐝
𝐀𝐧𝐧𝐮𝐚𝐥 𝐋𝐨𝐚𝐝 𝐅𝐚𝐜𝐭𝐨𝐫 =𝐀𝐧𝐧𝐮𝐚𝐥 𝐀𝐯𝐞𝐫𝐚𝐠𝐞 𝐋𝐨𝐚𝐝
𝐀𝐧𝐧𝐮𝐚𝐥 𝐌𝐚𝐱𝐢𝐦𝐮𝐦 𝐋𝐨𝐚𝐝

Seasonality analysis of load factor in Indian Power System 2 | P a g e
3. Load Factor as per 18/19th Electric Power Survey (EPS) report of
CEA
The load factor has also been assessed and forecasted by CEA in its 18th EPS report.
Same has been incorporated in the earlier report also. The extract from the same is given
below:
“The electric load factor of a power system depends on the pattern of utilization of different
classes of load. If the system feeds block industrial loads like Aluminum and other process
industries etc. having high electric load factor, the overall system load factor would also tend
to be high. In regard to estimation of electric load factor for future, if the pattern of
utilization of different classes of load does not differ appreciably from the past in terms
of percentage of total electric load, then it was assumed that the system load factor of the
past may continue. In case, the pattern is anticipated to change with respect to total electric
load due to gradual withdrawal of restrictions /cuts / load shedding & under frequency
conditions then it is necessary to estimate the future electric load factor. A broad analysis
to ascertain the influence of load mix on the load factor was undertaken. Based on the
analysis of future electric load mix, the load factor for each State/Union Territory has been
worked out.”
“The All India Annual Electric Load Factor (AELF) in the base year 2009-10 is around
82.7%. According to the 18th EPS, the All India AELF by 2011-12 would be 81.28% which is
expected to gradually reduce to 77.51% by the end of 2016-17, and by 2021-22 load factor
is anticipated to be 76.71%.”
Region 09-10 10-11 11-12 12-13 13-14 14-15 15-16 16-17 17-18 18-19 19-20
All India
83 83 81 80 80 79 78 78 77 77 77
NR 84 81 80 80 80 80 80 79 79 79 79
WR 79 78 77 76 76 75 74 73 72 72 72
SR 78 80 77 76 74 73 72 71 71 71 71
ER 78 81 80 80 79 78 78 77 77 76 76
NER 64 63 62 62 62 62 62 62 63 63 64
Table 1:All India/Regional Load Factor Pattern (As per 18th EPS)
As per the CEA LGBR report, Actual energy supplied and peak demand has been compiled
and based on which actual load factor has been calculated. A comparison of anticipated
load factor as per CEA 18th EPS report and actual load factor is given below:

Seasonality analysis of load factor in Indian Power System 3 | P a g e
Table 2:All India Yearly Energy supplied and Peak Demand met (as per CEA LGBR report)
(Source: https://cea.nic.in/l-g-b-r-report/?lang=en)
Table 3:Comparison of anticipated (as per 18th EPS) and load factor (as per CEA LGBR)
As per 19th EPS report, load factor for forthcoming years are given below:
Region
2015-16 2016-17 2017-18 2018-19 2019-20
Energy
supplied
(MU)
Peak
demand
(MW)
Energy
supplied
(MU)
Peak
demand
(MW)
Energy
supplied
(MU)
Peak
demand
(MW)
Energy
supplied
(MU)
Peak
demand
(MW)
Energy
supplied
(MU)
Peak
demand
(MW)
All India 1090851 148463 1135334 156934 1204697 160752 1267526 175528 1284444 182533
NR 324009 50622 343513 52612 365723 58448 377595 61726 389285 66559
WR 345967 48199 345127 48313 368081 50085 390136 55821 388836 59416
SR 283494 39875 305107 42232 319642 47210 338960 49534 344436 53579
ER 123646 18056 126868 18788 135490 20485 144616 22733 145902 23421
NER 13735 2367 14720 2475 15764 2520 16219 2850 15984 2989
Annual load factor (%)
Region
2015-16 2016-17 2017-18 2018-19 2019-20
Forecast Actual Forecast Actual Forecast Actual Forecast Actual Forecast Actual
All India 78 84 78 83 77 86 77 82 77 80
NR 80 73 79 75 79 71 79 70 79 67
WR 74 82 73 82 72 84 72 80 72 75
SR 72 81 71 82 71 77 71 78 71 73
ER 78 78 77 77 77 76 76 73 76 71
NER 62 66 62 68 63 71 63 65 64 61
All India Load Factor (%) as per 19th EPS report
Year 2021-
22 2022-
23 2023-
24 2024-
25 2025-
26 2026-
27
Load Factor 79.18 78.87 78.71 78.54 78.38 78.23
Table 4:Anticipated Load factor based on 19th EPS report

Seasonality analysis of load factor in Indian Power System 4 | P a g e
4. Diversity Factor
The load is time dependent and daily load diversity is caused by a marked and consistent
difference between the daily load cycles in two or more adjoining load areas, which results
in peaks at different times during the day e.g., one region may have a morning peak while
the other has an evening peak. Daily load diversity results in reduced operating expenses
and can be used or cancelled on short notice by an alert system dispatching group. The
benefits of daily diversity can be obtained by economy energy transactions or daily diversity
exchange agreements. It should be noted that this type of transaction reduces fuel expense
and unit startup and shutdown costs, but may or may not have any effect on capital
requirements.
Annual diversity usually results from difference in the weather patterns and/or demand
requirement between two or more regional areas. For example, one region may have its
annual peak load during the winter months, while other regional annual peak load occurs
during the summer. However, daily diversity of all India would be significantly impacted by
the difference between sun rise/ sun set timings at different geographical locations. Annual
load diversity affords an opportunity for capital savings in regard to reducing installed
generating-capacity requirements.
The diversity factor in power system is an important indicator of variation of maximum load
across different parts of the country in a given time period. Further, interconnection of grids
helps in harnessing this diversity and improving the load factor of the country. Diversity
factor is usually more than one. Demand diversity factor for maximum demand is calculated
as follows:
𝐀𝐥𝐥 𝐈𝐧𝐝𝐢𝐚 𝐃𝐞𝐦𝐚𝐧𝐝 𝐃𝐢𝐯𝐞𝐫𝐬𝐢𝐭𝐲 𝐅𝐚𝐜𝐭𝐨𝐫 = 𝐒𝐮𝐦 𝐨𝐟 𝐢𝐧𝐝𝐢𝐯𝐢𝐝𝐮𝐚𝐥 𝐫𝐞𝐠𝐢𝐨𝐧𝐚𝐥 𝐦𝐚𝐱𝐢𝐦𝐮𝐦 𝐝𝐞𝐦𝐚𝐧𝐝
𝐒𝐢𝐦𝐮𝐥𝐭𝐚𝐧𝐞𝐨𝐮𝐬 𝐦𝐚𝐱𝐢𝐦𝐮𝐦 𝐝𝐞𝐦𝐚𝐧𝐝
Minimum demand diversity has been calculated as per the following formula:
𝐀𝐥𝐥 𝐈𝐧𝐝𝐢𝐚 𝐃𝐞𝐦𝐚𝐧𝐝 𝐃𝐢𝐯𝐞𝐫𝐬𝐢𝐭𝐲 𝐅𝐚𝐜𝐭𝐨𝐫 = 𝐒𝐢𝐦𝐮𝐥𝐭𝐚𝐧𝐞𝐨𝐮𝐬 𝐦𝐢𝐧𝐢𝐦𝐮𝐦. 𝐝𝐞𝐦𝐚𝐧𝐝
𝐒𝐮𝐦 𝐨𝐟 𝐢𝐧𝐝𝐢𝐯𝐢𝐝𝐮𝐚𝐥 𝐫𝐞𝐠𝐢𝐨𝐧𝐚𝐥 𝐦𝐢𝐧𝐢𝐦𝐮𝐦. 𝐝𝐞𝐦𝐚𝐧𝐝

Seasonality analysis of load factor in Indian Power System 5 | P a g e
Regional as well as All India annual demand (maximum) diversity factor has been calculated from five-minute instantaneous SCADA data available at NLDC by averaging daily diversity factor for a year and same has been tabulated below.
Year/Region AI NR WR SR ER NER
2009 1.02 1.08 1.03 1.05 1.03 1.03
2010 1.01 1.09 1.02 1.02 1.02 1.03
2011 1.01 1.07 1.03 1.03 1.03 1.02
2012 1.01 1.07 1.03 1.02 1.01 1.00
2013 1.01 1.05 1.02 1.02 1.01 1.01
2014 1.02 1.05 1.02 1.03 1.02 1.02
2015 1.02 1.05 1.02 1.03 1.01 1.01
2016 1.02 1.05 1.01 1.02 1.02 1.03
2017 1.03 1.05 1.01 1.02 1.01 1.01
2018 1.03 1.05 1.01 1.03 1.00 1.02
2019 1.03 1.06 1.01 1.04 1.01 1.03
2020 1.04 1.07 1.01 1.03 1.02 1.02
Table 5:All India and Regional annual demand diversity over the years
The heat map of diversity in daily All India demand is given below. It seems load diversity of all India is
increasing with respect to its past data. One of the possible reasons may be load segregation by the
utilities due to increasing penetration of RE resources into the grid. Further, it is also imperative to
mention that all India electricity demand had witnessed significant reduction from late March 2020
onwards due to imposition of nationwide lockdown for containment of COVID-19. In energy terms,
the demand contracted by 25% in April 2020 and 15% in May 2020 on year-on-year basis. With gradual
reopening of the economy, the demand picked up and started exhibiting year-on-year growth from
September 2020 onwards.
Figure 1: Heat map of avg monthly all India diversity factor (w.r.t. max)
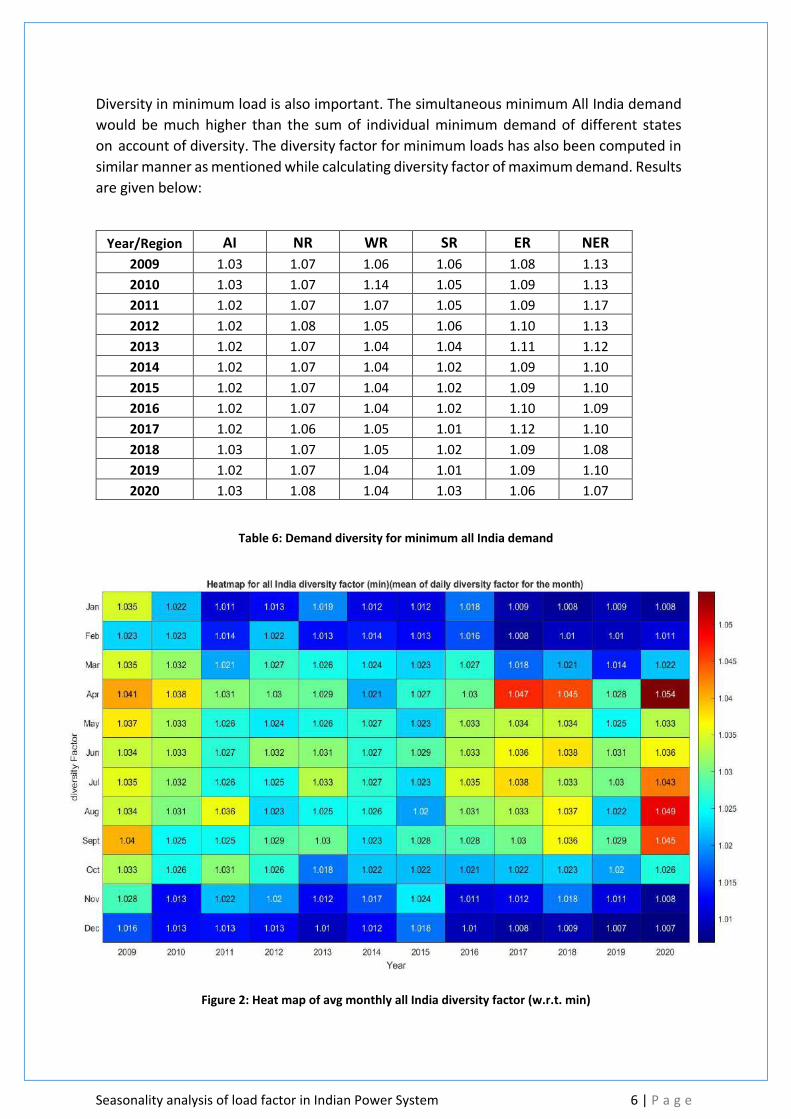
Seasonality analysis of load factor in Indian Power System 6 | P a g e
Diversity in minimum load is also important. The simultaneous minimum All India demand
would be much higher than the sum of individual minimum demand of different states
on account of diversity. The diversity factor for minimum loads has also been computed in
similar manner as mentioned while calculating diversity factor of maximum demand. Results
are given below:
Year/Region AI NR WR SR ER NER
2009 1.03 1.07 1.06 1.06 1.08 1.13
2010 1.03 1.07 1.14 1.05 1.09 1.13
2011 1.02 1.07 1.07 1.05 1.09 1.17
2012 1.02 1.08 1.05 1.06 1.10 1.13
2013 1.02 1.07 1.04 1.04 1.11 1.12
2014 1.02 1.07 1.04 1.02 1.09 1.10
2015 1.02 1.07 1.04 1.02 1.09 1.10
2016 1.02 1.07 1.04 1.02 1.10 1.09
2017 1.02 1.06 1.05 1.01 1.12 1.10
2018 1.03 1.07 1.05 1.02 1.09 1.08
2019 1.02 1.07 1.04 1.01 1.09 1.10
2020 1.03 1.08 1.04 1.03 1.06 1.07
Table 6: Demand diversity for minimum all India demand
Figure 2: Heat map of avg monthly all India diversity factor (w.r.t. min)
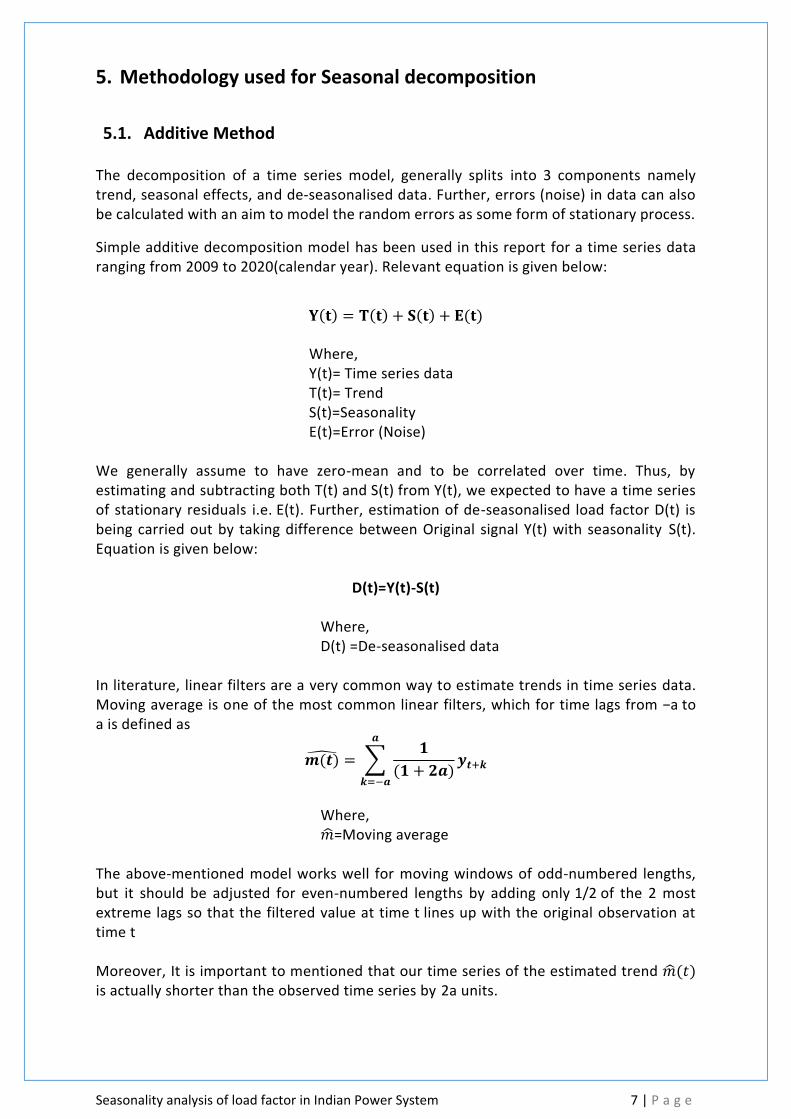
Seasonality analysis of load factor in Indian Power System 7 | P a g e
5. Methodology used for Seasonal decomposition
5.1. Additive Method
The decomposition of a time series model, generally splits into 3 components namely trend, seasonal effects, and de-seasonalised data. Further, errors (noise) in data can also be calculated with an aim to model the random errors as some form of stationary process.
Simple additive decomposition model has been used in this report for a time series data ranging from 2009 to 2020(calendar year). Relevant equation is given below:
𝐘(𝐭) = 𝐓(𝐭) + 𝐒(𝐭) + 𝐄(𝐭) Where, Y(t)= Time series data T(t)= Trend S(t)=Seasonality E(t)=Error (Noise) We generally assume to have zero-mean and to be correlated over time. Thus, by estimating and subtracting both T(t) and S(t) from Y(t), we expected to have a time series of stationary residuals i.e. E(t). Further, estimation of de-seasonalised load factor D(t) is being carried out by taking difference between Original signal Y(t) with seasonality S(t). Equation is given below:
D(t)=Y(t)-S(t)
Where, D(t) =De-seasonalised data In literature, linear filters are a very common way to estimate trends in time series data. Moving average is one of the most common linear filters, which for time lags from −a to a is defined as
𝒎(𝒕)̂ = ∑𝟏
(𝟏 + 𝟐𝒂)𝒚𝒕+𝒌
𝒂
𝒌=−𝒂
Where, �̂�=Moving average The above-mentioned model works well for moving windows of odd-numbered lengths, but it should be adjusted for even-numbered lengths by adding only 1/2 of the 2 most extreme lags so that the filtered value at time t lines up with the original observation at time t Moreover, It is important to mentioned that our time series of the estimated trend �̂�(𝑡) is actually shorter than the observed time series by 2a units.

Seasonality analysis of load factor in Indian Power System 8 | P a g e
In addition to specifying the time series to be filtered, we need to pass in the filter weights to estimate the actual trend of signal. After estimation of trend, estimate of effect of seasonality can be find out by taking the difference of Original signal by estimated trend.
S(t)=Y(t)- �̂�(𝒕)
This estimate of the seasonal effect for each time t also contains the random error E(t),
however, which can be seen by plotting the time series and careful comparison of
Equations of Y(t) and S(t).
Further, for estimating seasonal effect, we have carried out averaging of the estimates
of S(t) and repeating this sequence overall years with a sampling rate of 365 days.
5.2. Seasonality Index
A seasonality index is a measure of how a particular season through some cycle compares
with the average season of that cycle. Further, it made possible to create a trend equation
that reflects the average monthly/quarterly/yearly load factor and the growth rate in each
month/quarter/Year of the study period.
Seasonality index has been calculated as follows:
1. Total period load factor data (from 2009 to 2020) has been segregated into four
quarters namely Quarter-1(Jan-Mar), Quarter-2(Apr-Jun), Quarter-3(Jul-Sept) and
Quarter-4(Oct-Dec) for each year.
2. Average of each quarter for the mentioned period has been calculated.
3. Each quarter average has been divided by total average of all quarters to find out
seasonality index for each region.
Calculated seasonality index for each region is given below:
Seasonality Index
AI NR WR SR ER NER
Quarter-1 0.991 0.993 0.992 1.005 0.977 0.986
Quarter-2 1.009 0.988 1.023 1.017 1.010 0.950
Quarter-3 1.014 1.027 0.988 0.996 1.022 1.056
Quarter-4 0.986 0.991 0.996 0.982 0.992 1.008
Table 7:Seasonality index- All India & Region wise
Based on the above table, it is observed that during Quarter-3, Northern regional load
factor is having the highest seasonality index with respect to total average compared to

Seasonality analysis of load factor in Indian Power System 9 | P a g e
other quarters. However, in quarter-2, Northern region is having the lowest seasonality
index and its load factor would be .988 of total average value.
Similarly, Seasonality index for Western region is highest in Quarter -2 and lowest in
Quarter-3 with respect average value.
In Southern region also, Seasonality index is on higher side in Quarter- 2 compared to other
Quarters. Further, In Eastern region, Seasonality index is lowest in quarter -1 and steadily
increased in quarter-2 & 3 and again decreased in quarter-4. However, in North Eastern
region variation quite similar to Northern region i.e. it close to total average in Quarter -1
&2 and then starts decreasing.
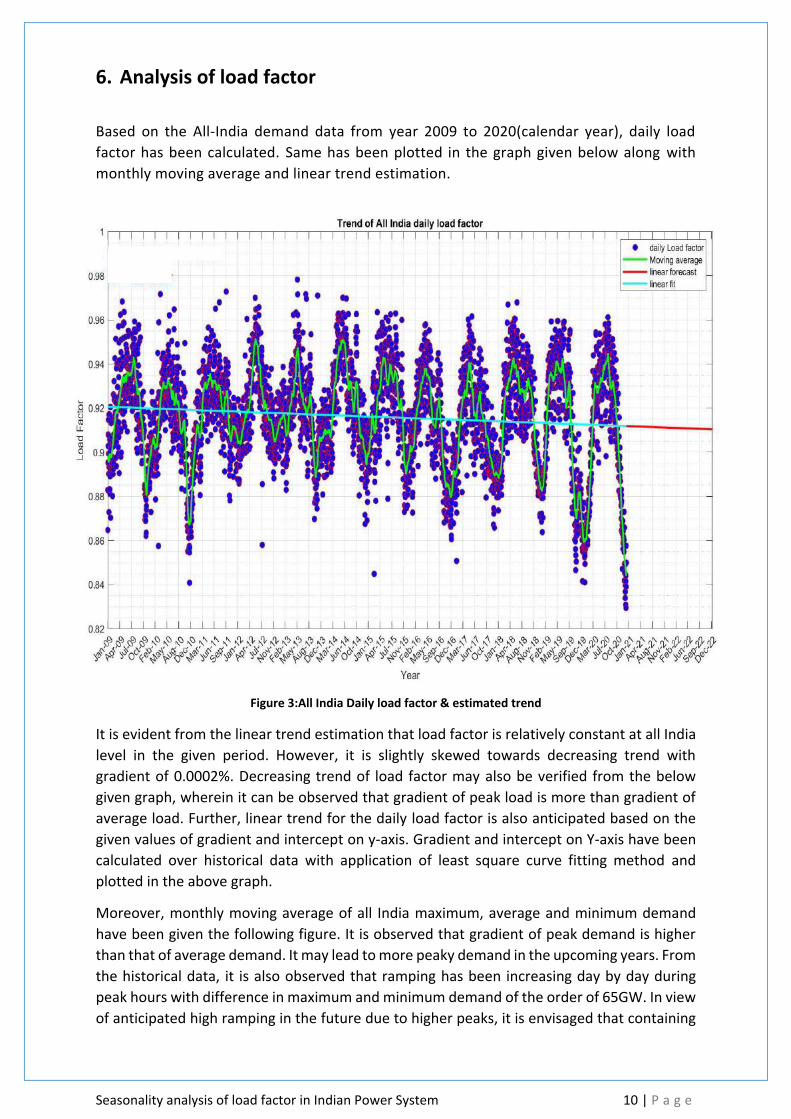
Seasonality analysis of load factor in Indian Power System 10 | P a g e
6. Analysis of load factor
Based on the All-India demand data from year 2009 to 2020(calendar year), daily load
factor has been calculated. Same has been plotted in the graph given below along with
monthly moving average and linear trend estimation.
Figure 3:All India Daily load factor & estimated trend
It is evident from the linear trend estimation that load factor is relatively constant at all India
level in the given period. However, it is slightly skewed towards decreasing trend with
gradient of 0.0002%. Decreasing trend of load factor may also be verified from the below
given graph, wherein it can be observed that gradient of peak load is more than gradient of
average load. Further, linear trend for the daily load factor is also anticipated based on the
given values of gradient and intercept on y-axis. Gradient and intercept on Y-axis have been
calculated over historical data with application of least square curve fitting method and
plotted in the above graph.
Moreover, monthly moving average of all India maximum, average and minimum demand
have been given the following figure. It is observed that gradient of peak demand is higher
than that of average demand. It may lead to more peaky demand in the upcoming years. From
the historical data, it is also observed that ramping has been increasing day by day during
peak hours with difference in maximum and minimum demand of the order of 65GW. In view
of anticipated high ramping in the future due to higher peaks, it is envisaged that containing

Seasonality analysis of load factor in Indian Power System 11 | P a g e
ramp during peak hours would be a challenge to keep all India frequency with in IEGC band.
Therefore, flexible ramp reserve requirement during morning and evening peak will be more
critical than base load requirement.
Figure 4:All India demand-Maximum vs Average vs Minimum
Details of regional and all India load factor with trend of daily load factor (from 01.01.2009
to 31.12.2020) increasing and decreasing are given below:
Region Daily Monthly Yearly Gradient*
NR 90% 84% 73% ↓
WR 92% 86% 79% ↓
SR 91% 86% 81% ↓
ER 85% 79% 73% ↓
NER 73% 67% 59% ↓
All India
92% 88% 83% ↓
Table 8:Daily, monthly and yearly loads factor of all India & regions
Note: :
• *: Sign of slope (m) of linear equation "y=mx + c" has been used to indicate the arrow direction. In case of positive slope, it is shown as "↑" and for negative slope it has been shown as "↓".

Seasonality analysis of load factor in Indian Power System 12 | P a g e
A) All India annual load factor has remained constant between 83-86%. This high load factor is due to a combination of benefits derived out of the integration of regional grids and load management done by different states. It is constant over the years because the growth of energy and peak demand has been around the same range. Daily load factor variation between summer and winter is about 5-6%.
B) Northern Region annual load factor has a decreasing trend i.e. 79% in year 2009 to 63% in year 2020 which could be on account of higher peak demand and lower minimum demand. Also, variation in daily load factor of Northern Region between summer and winter is about 5-6% which shows impact of weather sensitive loads and agriculture loads within the region.
C) Western Region annual load factor has a decreasing trend i.e. 80% in year 2009 to 72% in year 2020. Also, variation in daily load factor between seasons through-out the year is about 8-10%.
D) Southern Region annual load factor is between 69-84%. It has decreased over the last three years. Also, variation in daily load factor between seasons through-out the year is about 4-5%.
E) Eastern Region annual load factor has remained constant between 68-77%. Also, variation in daily load factor is about 7-9%.
F) North-Eastern Region annual load factor remained constant between 59-64%. Also, variation in daily load factor is about 8-10%. Daily Load factor is Maximum in July-August.
Further, as per the duration curve of the All India load factor, it has been inferred that around 6-8% of the time, load factor persists more than 94%. However, in the year 2020, around 40% of the time, all India load factor was below 90%. All India load factor duration curve for the year from 2009 to 2020 is given below:
Figure 5:Yearly duration curve for all India daily load factor
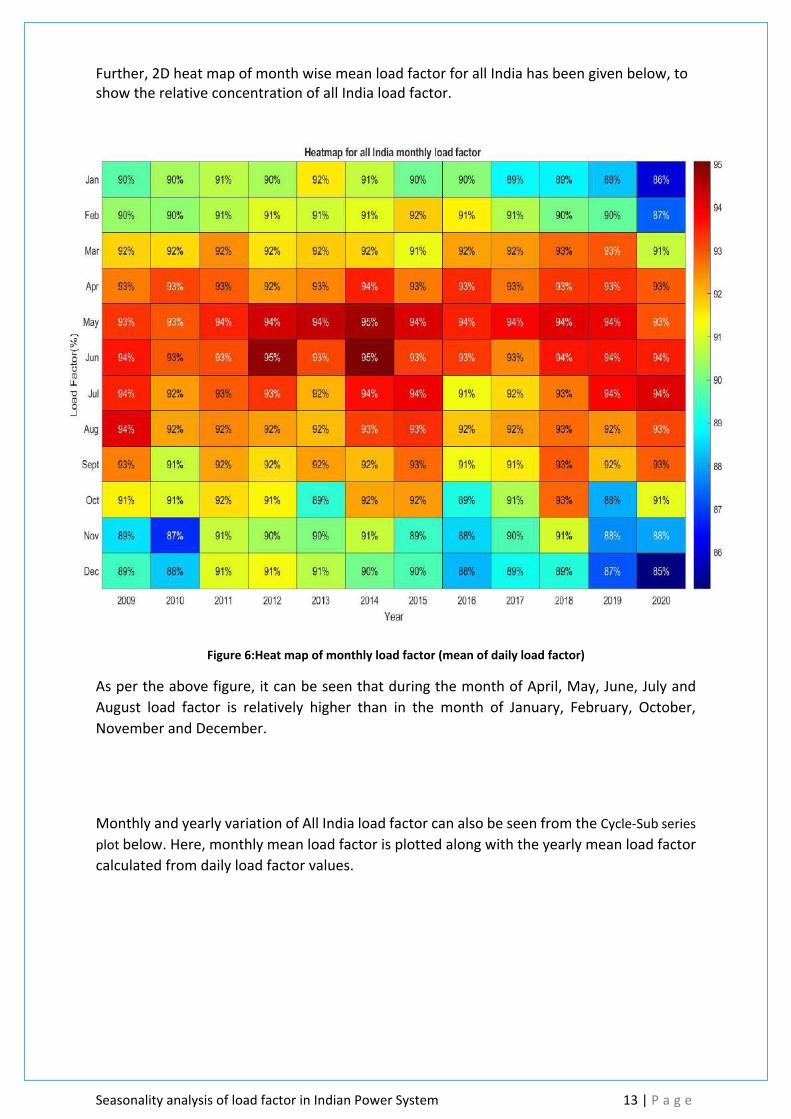
Seasonality analysis of load factor in Indian Power System 13 | P a g e
Further, 2D heat map of month wise mean load factor for all India has been given below, to show the relative concentration of all India load factor.
Figure 6:Heat map of monthly load factor (mean of daily load factor)
As per the above figure, it can be seen that during the month of April, May, June, July and
August load factor is relatively higher than in the month of January, February, October,
November and December.
Monthly and yearly variation of All India load factor can also be seen from the Cycle-Sub series
plot below. Here, monthly mean load factor is plotted along with the yearly mean load factor
calculated from daily load factor values.
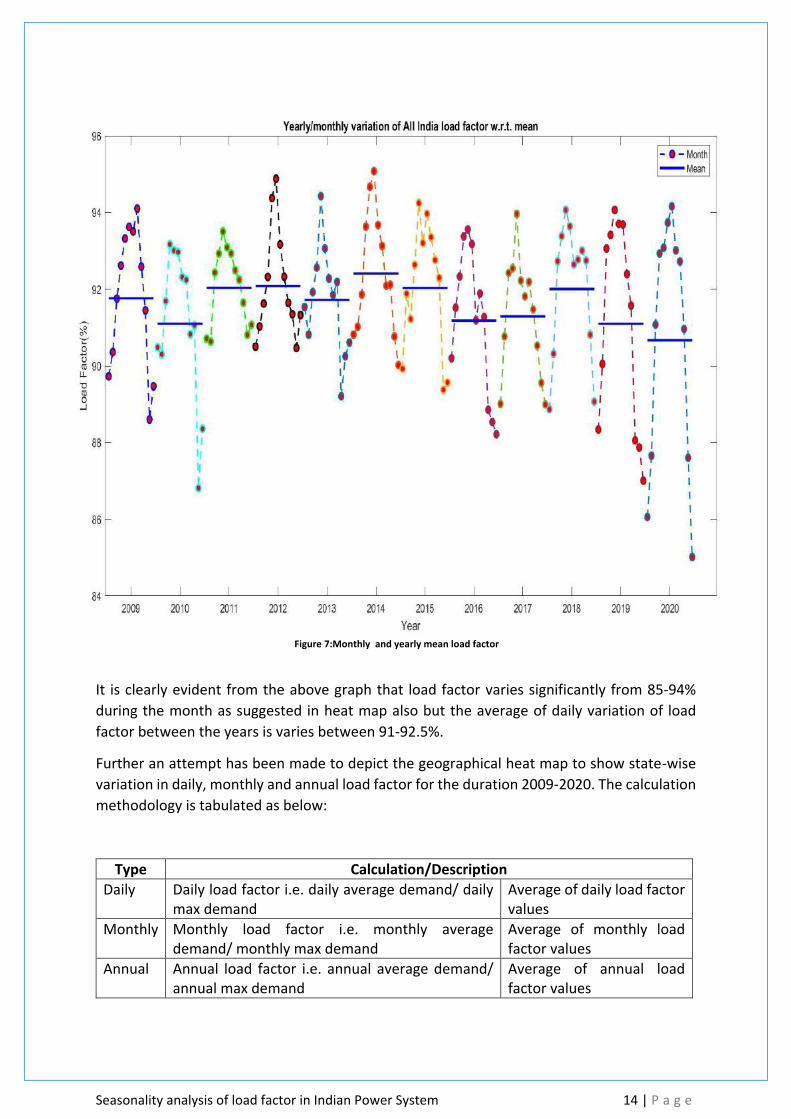
Seasonality analysis of load factor in Indian Power System 14 | P a g e
It is clearly evident from the above graph that load factor varies significantly from 85-94%
during the month as suggested in heat map also but the average of daily variation of load
factor between the years is varies between 91-92.5%.
Further an attempt has been made to depict the geographical heat map to show state-wise
variation in daily, monthly and annual load factor for the duration 2009-2020. The calculation
methodology is tabulated as below:
Type Calculation/Description
Daily Daily load factor i.e. daily average demand/ daily max demand
Average of daily load factor values
Monthly Monthly load factor i.e. monthly average demand/ monthly max demand
Average of monthly load factor values
Annual Annual load factor i.e. annual average demand/ annual max demand
Average of annual load factor values
Figure 7:Monthly and yearly mean load factor

Seasonality analysis of load factor in Indian Power System 15 | P a g e
Load Factor Gradient of linear fit
Name of State/ UT
Daily Monthly Annually Trend of Load Factor
Max DMD
Min DMD
Avg. DMD
Andhra Pradesh 86% 76% 68% ↓ 1.131 0.627 0.832
Arunachal Pradesh
69% 55% 42% ↑ 0.012 0.011 0.010
Assam 70% 64% 56% ↓ 0.223 0.118 0.161
Bihar 80% 72% 59% ↓ 0.990 0.534 0.728
Chandigarh 74% 60% 50% ↓ 0.013 0.006 0.008
Chhattisgarh 84% 75% 65% ↑ 0.388 0.370 0.384
Delhi 78% 64% 54% ↓ 0.291 0.165 0.221
DVC 88% 78% 71% ↑ 0.256 0.239 0.246
Goa 80% 68% 62% ↑ 0.055 0.040 0.047
Gujarat 89% 80% 72% ↓ 1.753 1.333 1.545
Haryana 79% 69% 56% ↓ 0.848 0.476 0.676
Himachal Pradesh
77% 68% 57% ↔ 0.168 0.101 0.134
J&K and Ladakh 81% 74% 66% ↑ 0.266 0.179 0.231
Jharkhand 80% 69% 59% ↓ 0.115 0.077 0.093
Karnataka 84% 76% 66% ↓ 0.957 0.662 0.796
Kerala 75% 70% 64% ↑ 0.250 0.240 0.262
Madhya Pradesh 82% 71% 56% ↑ 1.444 1.143 1.322
Maharashtra 88% 79% 70% ↓ 2.409 1.751 2.093
Manipur 59% 53% 47% ↓ 0.028 0.014 0.015
Meghalaya 71% 59% 48% ↓ 0.032 0.021 0.022
Mizoram 64% 55% 43% ↑ 0.012 0.004 0.008
Nagaland 68% 58% 48% ↑ 0.017 0.011 0.014
Odisha 80% 71% 63% ↑ 0.347 0.277 0.305
Puducherry 83% 75% 66% ↓ 0.029 0.020 0.025
Punjab 83% 67% 52% ↓ 0.618 0.361 0.506
Rajasthan 85% 76% 66% ↓ 1.552 0.880 1.216
Sikkim 56% 46% 33% ↑ 0.008 0.005 0.008
Tamil Nadu 88% 81% 73% ↓ 1.406 1.046 1.239
Telangana 86% 73% 61% ↓ 1.685 0.862 1.282
Tripura 64% 54% 45% ↔ 0.036 0.018 0.025
Uttarakhand 81% 74% 66% ↑ 0.237 0.174 0.209
Uttar Pradesh 85% 76% 64% ↓ 2.649 1.454 1.982
West Bengal 78% 71% 65% ↑ 0.584 0.408 0.520
Table 9:State wise load factor

Seasonality analysis of load factor in Indian Power System 16 | P a g e
Figure 8: Daily load factor
Figure 9:Monthly load factor
ArabianSea
Bayof
Bengal
Maharashtra
AndhraPradesh
Tamil Nadu
Odisha
Lakshadweep
Goa
Puducherry
Andaman
and NicobarIslands
Madhya PradeshWestBengal
Bihar
Jharkhand
Uttar Pradesh
Uttarakhand
Assam
Arunachal
Pradesh
Nagaland
Manipur
MizoramTripura
Sikkim
Meghalaya
Rajasthan
Gujarat
Haryana
HimachalPradesh
Punjab
Delhi
Chandigarh
Jammuand
Kashmir
Daman
and Diu
Dadra and Nagar Haveli
Telangana
Lowest (Blue) to Highest (Red)
Colour Gradient
Map not to scale
56% 93%
ArabianSea
Bayof
Bengal
Maharashtra
AndhraPradesh
Tamil Nadu
Odisha
Lakshadweep
Goa
Puducherry
Andaman
and NicobarIslands
Madhya PradeshWestBengal
Bihar
Jharkhand
Uttar Pradesh
Uttarakhand
Assam
Arunachal
Pradesh
Nagaland
Manipur
MizoramTripura
Sikkim
Meghalaya
Rajasthan
Gujarat
Haryana
HimachalPradesh
Punjab
Delhi
Chandigarh
Jammuand
Kashmir
Daman
and Diu
Dadra and Nagar Haveli
Telangana
Lowest (Blue) to Highest (Red)
Colour Gradient
Map not to scale
46% 85%

Seasonality analysis of load factor in Indian Power System 17 | P a g e
Figure 10:Annual load factor
From above heat maps, it is clearly seen that states like Uttar Pradesh, Telangana and Chhattisgarh
have significantly high daily load factor but lower monthly and further diminished annual load factor.
For the state like Punjab, annual load factor is much less than daily load factor due to high peak
demand during paddy season i.e only for three months in a year.
ArabianSea
Bayof
Bengal
Maharashtra
AndhraPradesh
Tamil Nadu
Odisha
Lakshadweep
Goa
Puducherry
Andaman
and NicobarIslands
Madhya PradeshWestBengal
Bihar
Jharkhand
Uttar Pradesh
Uttarakhand
Assam
Arunachal
Pradesh
Nagaland
Manipur
MizoramTripura
Sikkim
Meghalaya
Rajasthan
Gujarat
Haryana
HimachalPradesh
Punjab
Delhi
Chandigarh
Jammuand
Kashmir
Daman
and Diu
Dadra and Nagar Haveli
Telangana
Lowest (Blue) to Highest (Red)
Colour Gradient
Map not to scale
33% 76%

Seasonality analysis of load factor in Indian Power System 18 | P a g e
Similarly, state-wise variation of the gradient of daily load factor has also been shown in the
geographical heat map as shown below.
Figure 11:Gradient of load factor
States like Arunachal Pradesh, Chhattisgarh, Kerala, Madhya Pradesh and Sikkim are having
increasing load factor trend for the mentioned period.
Region-wise and state-wise analysis is given at Annexure.
Further, present daily ratio of all India minimum demand to maximum demand is in the range of 65-90% which varies based on the seasonal variation of the demand. The above said ratio was on lower side in winters and other side during summers. To observe in what proportion the minimum demand is increasing with the all India maximum demand, rate of change of minimum and maximum demand has been calculated and their ratio comes out to be 75%. Similarly, statewise slope has been calculated and given in the table on next page.
ArabianSea
Bayof
Bengal
Maharashtra
AndhraPradesh
Tamil Nadu
Odisha
Lakshadweep
Goa
Puducherry
Andaman
and
Nicobar
Islands
Madhya PradeshWestBengal
Bihar
Jharkhand
Uttar Pradesh
Uttarakhand
Assam
Arunachal
Pradesh
Nagaland
Manipur
MizoramTripura
Sikkim
Meghalaya
Rajasthan
Gujarat
Haryana
HimachalPradesh
Punjab
Delhi
Chandigarh
Jammu
andKashmir
Daman
and Diu
Dadra and Nagar Haveli
Telangana
Lowest (Blue) to Highest (Red)
Colour Gradient
Map not to scale

Seasonality analysis of load factor in Indian Power System 19 | P a g e
Name of the state
Slope of Maximum demand
Slope of Average demand
Slope of Minimum demand
Ratio(%)
A B C C/A
Andhra Pradesh 1.13 0.83 0.63 55
Arunachal Pradesh
0.01 0.01 0.01 92
Assam 0.22 0.16 0.12 53
Bihar 0.99 0.73 0.53 54
Chandigarh 0.01 0.01 0.01 46
Chhattisgarh 0.39 0.38 0.37 95
Delhi 0.29 0.22 0.17 57
DVC 0.26 0.25 0.24 93
Goa 0.06 0.05 0.04 73
Gujarat 1.75 1.55 1.33 76
Haryana 0.85 0.68 0.48 56
Himachal Pradesh
0.17 0.13 0.1 60
J&K,Ladakh 0.27 0.23 0.18 67
Jharkhand 0.12 0.09 0.08 67
Karnataka 0.96 0.8 0.66 69
Kerala 0.25 0.26 0.24 96
Madhya Pradesh 1.44 1.32 1.14 79
Maharashtra 2.41 2.09 1.75 73
Manipur 0.03 0.02 0.01 50
Meghalaya 0.03 0.02 0.02 66
Mizoram 0.01 0.01 0 33
Nagaland 0.02 0.01 0.01 65
Odisha 0.35 0.31 0.28 80
Puducherry 0.03 0.03 0.02 69
Punjab 0.62 0.51 0.37 59
Rajasthan 1.55 1.22 0.88 57
Sikkim 0.01 0.01 0.01 63
Tamil Nadu 1.41 1.24 1.05 74
Telangana 1.66 1.28 0.86 52
Tripura 0.04 0.03 0.02 50
Uttar Pradesh 2.65 1.98 1.45 55
Uttarakhand 0.24 0.21 0.17 73
West Bengal 0.58 0.52 0.41 70
Table 10: Coefficient of the trend line for Minimum and Maximum loads
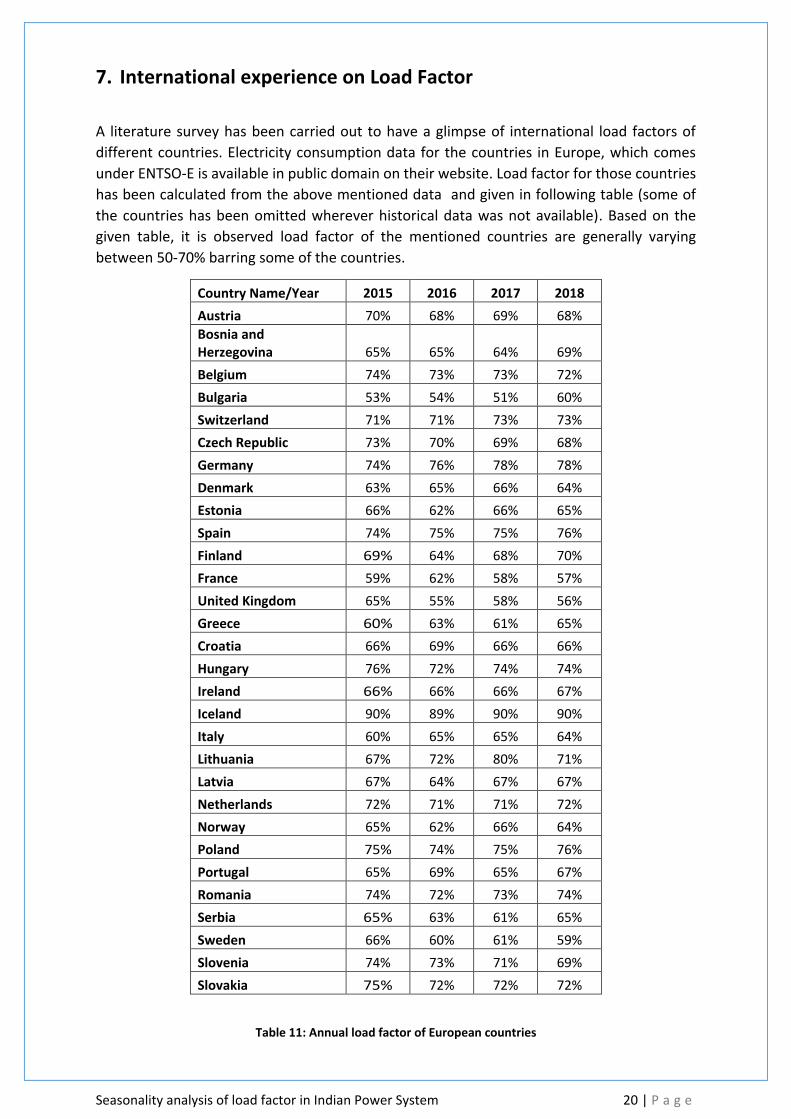
Seasonality analysis of load factor in Indian Power System 20 | P a g e
7. International experience on Load Factor
A literature survey has been carried out to have a glimpse of international load factors of
different countries. Electricity consumption data for the countries in Europe, which comes
under ENTSO-E is available in public domain on their website. Load factor for those countries
has been calculated from the above mentioned data and given in following table (some of
the countries has been omitted wherever historical data was not available). Based on the
given table, it is observed load factor of the mentioned countries are generally varying
between 50-70% barring some of the countries.
Country Name/Year 2015 2016 2017 2018
Austria 70% 68% 69% 68%
Bosnia and Herzegovina 65% 65% 64% 69%
Belgium 74% 73% 73% 72%
Bulgaria 53% 54% 51% 60%
Switzerland 71% 71% 73% 73%
Czech Republic 73% 70% 69% 68%
Germany 74% 76% 78% 78%
Denmark 63% 65% 66% 64%
Estonia 66% 62% 66% 65%
Spain 74% 75% 75% 76%
Finland 69% 64% 68% 70%
France 59% 62% 58% 57%
United Kingdom 65% 55% 58% 56%
Greece 60% 63% 61% 65%
Croatia 66% 69% 66% 66%
Hungary 76% 72% 74% 74%
Ireland 66% 66% 66% 67%
Iceland 90% 89% 90% 90%
Italy 60% 65% 65% 64%
Lithuania 67% 72% 80% 71%
Latvia 67% 64% 67% 67%
Netherlands 72% 71% 71% 72%
Norway 65% 62% 66% 64%
Poland 75% 74% 75% 76%
Portugal 65% 69% 65% 67%
Romania 74% 72% 73% 74%
Serbia 65% 63% 61% 65%
Sweden 66% 60% 61% 59%
Slovenia 74% 73% 71% 69%
Slovakia 75% 72% 72% 72%
Table 11: Annual load factor of European countries
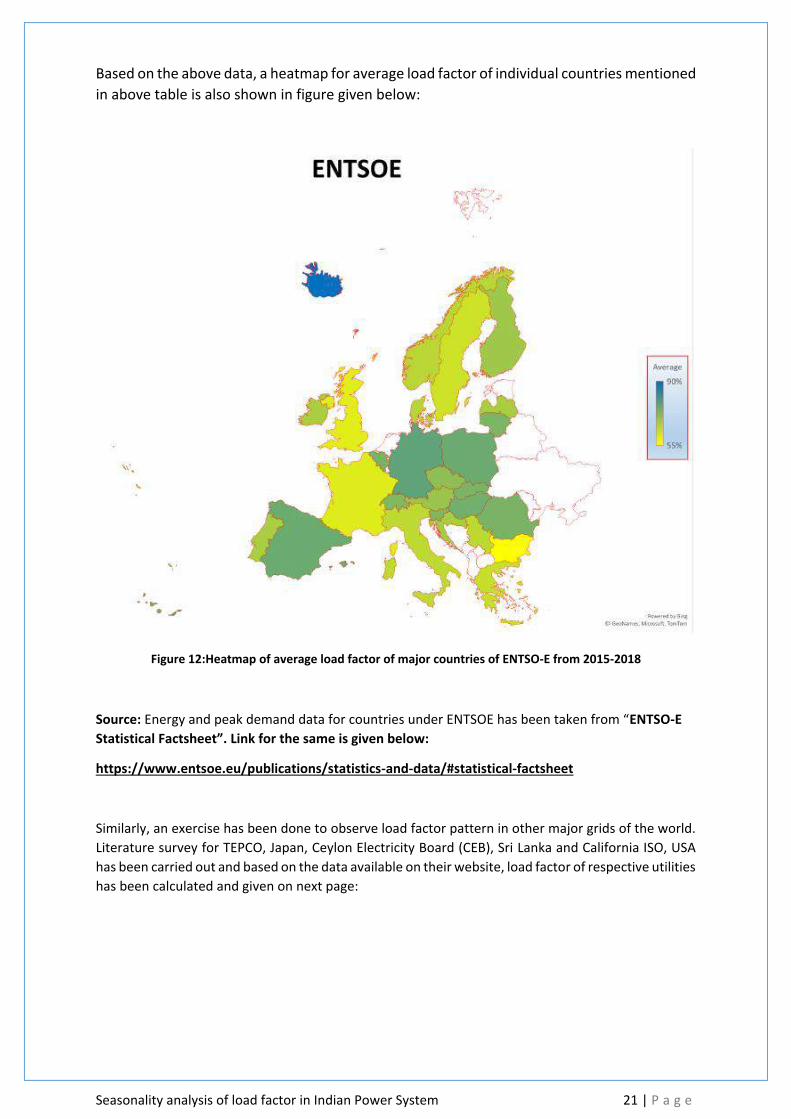
Seasonality analysis of load factor in Indian Power System 21 | P a g e
Based on the above data, a heatmap for average load factor of individual countries mentioned
in above table is also shown in figure given below:
Figure 12:Heatmap of average load factor of major countries of ENTSO-E from 2015-2018
Source: Energy and peak demand data for countries under ENTSOE has been taken from “ENTSO-E
Statistical Factsheet”. Link for the same is given below:
https://www.entsoe.eu/publications/statistics-and-data/#statistical-factsheet
Similarly, an exercise has been done to observe load factor pattern in other major grids of the world.
Literature survey for TEPCO, Japan, Ceylon Electricity Board (CEB), Sri Lanka and California ISO, USA
has been carried out and based on the data available on their website, load factor of respective utilities
has been calculated and given on next page:
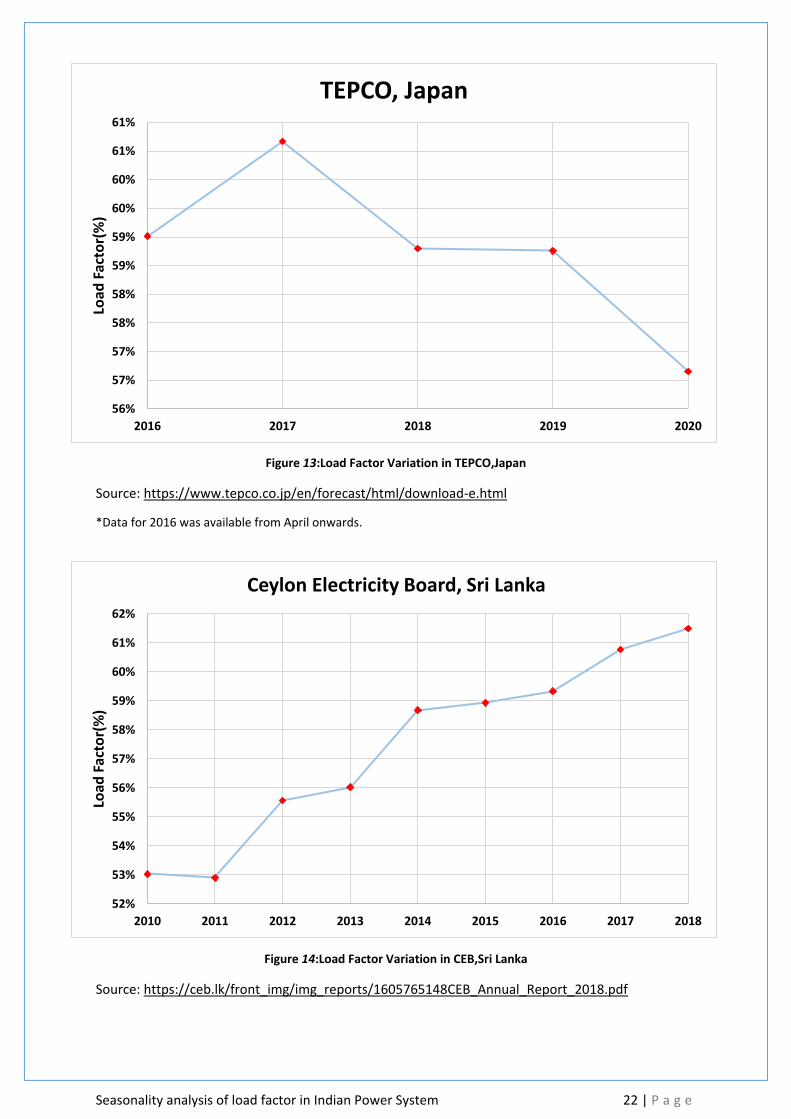
Seasonality analysis of load factor in Indian Power System 22 | P a g e
Figure 13:Load Factor Variation in TEPCO,Japan
Source: https://www.tepco.co.jp/en/forecast/html/download-e.html
*Data for 2016 was available from April onwards.
Figure 14:Load Factor Variation in CEB,Sri Lanka
Source: https://ceb.lk/front_img/img_reports/1605765148CEB_Annual_Report_2018.pdf
56%
57%
57%
58%
58%
59%
59%
60%
60%
61%
61%
2016 2017 2018 2019 2020
Load
Fac
tor(
%)
TEPCO, Japan
52%
53%
54%
55%
56%
57%
58%
59%
60%
61%
62%
2010 2011 2012 2013 2014 2015 2016 2017 2018
Load
Fac
tor(
%)
Ceylon Electricity Board, Sri Lanka
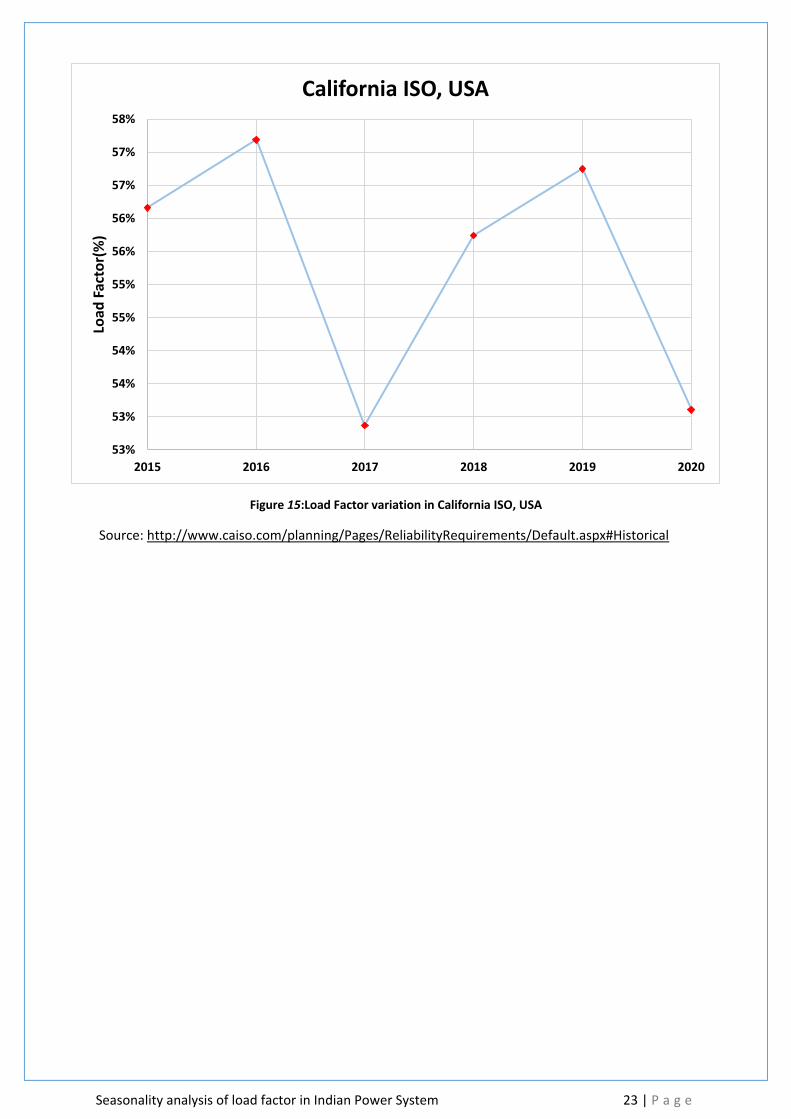
Seasonality analysis of load factor in Indian Power System 23 | P a g e
Figure 15:Load Factor variation in California ISO, USA
Source: http://www.caiso.com/planning/Pages/ReliabilityRequirements/Default.aspx#Historical
53%
53%
54%
54%
55%
55%
56%
56%
57%
57%
58%
2015 2016 2017 2018 2019 2020
Load
Fac
tor(
%)
California ISO, USA

Seasonality analysis of load factor in Indian Power System 24 | P a g e
8. Findings and Way Forward Major findings of this report are given below:
• All India demand load factor is decreasing as peak demand growth is surpassing the
energy consumption growth over the years.
• High RE penetration and variability, may affect demand load factor profile significantly.
• All India load diversity has been in increasing trend over the years. several factors like
increasing RE penetration, agriculture load shifting, rural electrification etc. are having
major role in the same.
• Integration of different grids and strengthening of inter-regional transmission network
would help in harnessing diversity among the different regions.
• It is expected that formation of SAARC grid in future would also help in harnessing the
diversity among the countries and reducing overall cost of supply in the region. More such
analysis is required to be done to understand the finer aspects of load factor and its impact
on power system.
• Further analysis showing the impact of load factor on cost of supply is required. It is
desirable that each state utility should work out load factor of their control area and same
needs to be incorporated in to their planning. It is also desirable that provisions for the
same may also be included in the regulations along with the future trajectory.
• Increase in penetration of Distributed Energy Resources (DER) and its impact assessment
may require a separate analysis for further understanding.

Seasonality analysis of load factor in Indian Power System 25 | P a g e
9. Contributing and reviewing members
Contributed by:
Sl.No. Name Region 1 Sh. Talluri Sudheer NLDC
2 Sh. Rohit Anand NLDC
3 Sh. Anuj Kumar NLDC
4 Sh. Rishabh Pandey NLDC
5 Sh. Pankaj Kumar NLDC
Reviewed by:
Sl.No. Name Region 1 Sh. S. K. Soonee POSOCO
2 Sh. K.V.S. Baba POSOCO
3 Sh. S. R. Narasimhan POSOCO
4 Sh. Debasis De NLDC
5 Sh. R.K. Porwal NLDC
6 Sh. Vivek Pandey NLDC
7 Sh. Ashok Kumar NLDC
8 Sh. Harish Rathour NLDC

Seasonality analysis of load factor in Indian Power System 26 | P a g e
10. References 1. Cleveland, R. B., Cleveland, W. S., McRae, J. E., & Terpenning, I. J., “STL: A seasonal-trend
decomposition procedure based on loess” in Journal of Official Statistics, 6(1), 3–
33(1990).
2. G. P. Watkins, “Electrical Rates: The Load Factor and the Density Factor” in The Quarterly
Journal of Economics, Vol. 30, No. 3 (May, 1916), pp. 519-545.
3. Dmitriy V. Antipov, Oksana M. Syardova, Aliya S. Aytasova, “Building an Additive Model
for determining the Seasonal Effect on the Quantity of Products Supplied by the Chemical
Industry Enterprises” in 2019 Amity International Conference on Artificial Intelligence
(AICAI).
4. G. H. McDaniel and A. F. Gabrielle, ‘‘Load diversity-its role in power system utilization,’’
IEEE Trans. Power App. Syst., vol. PAS-84, no. 7, pp. 626–635, Jul. 1965.
5. William Zarakas, Sanem Sergici,Kevin Arritt, David Kwok, “Assessment of Load Factor as a
System Efficiency Earning Adjustment Mechanism- A report ” Feb-2017.
6. USAID webinar on “Load Factor and Unserved Energy”, October-2019.
7. Dr. Ron Lembke, “Forecasting with Seasonality” handouts on seasonality, Sept-2015.
8. POSOCO on “Electricity Load Factor in Indian Power System” 2016.
9. Central Electricity Authority report, “18th and 19th Electric Power Survey”.
10. Documentation of MATLAB/R.
11. Indzara, Geographic Heat Map India v4.

Seasonality analysis of load factor in Indian Power System 27 | P a g e
11. Annexure

Seasonality analysis of load factor in Indian Power System 28 | P a g e
11.1. All India a) Average Load Factor (%):
Average Daily Load Factor from 2009-2020 92
Average Monthly Load Factor from 2009-2020 88
Average Annual Load Factor from 2009-2020 83
b) Highest/Lowest Load Factor Occurrence:
Month/Period of Highest Load Factor May-June
Month/Period of Lowest Load Factor Nov-Dec
c) Seasonal decomposition of load factor trend:
Figure 16:Seasonal decomposition of all India load factor trend

Seasonality analysis of load factor in Indian Power System 29 | P a g e
d) Linear fitting of Load factor trend:
Figure 17:Linear fitting of all India Load factor trend
e) Growth in Maximum, Minimum and Average alongwith Load Factor:
Figure 18:Growth in Maximum, Minimum and Average demand alongwith all India Load Factor
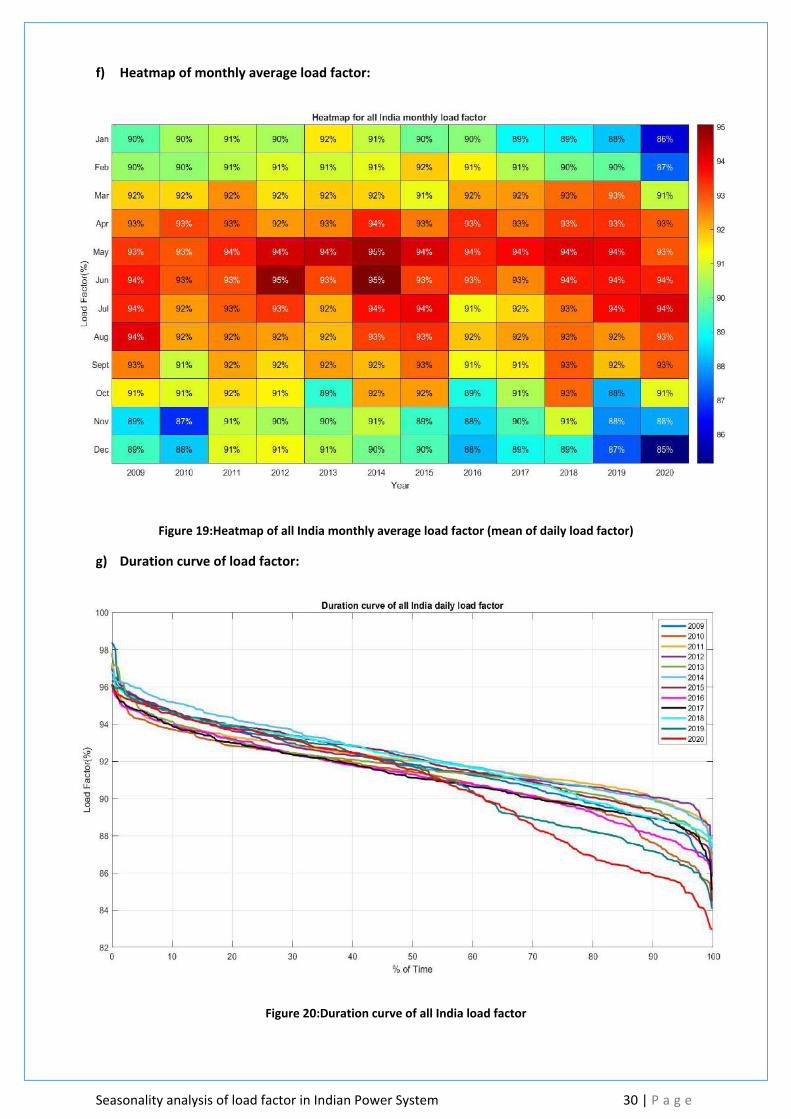
Seasonality analysis of load factor in Indian Power System 30 | P a g e
f) Heatmap of monthly average load factor:
Figure 19:Heatmap of all India monthly average load factor (mean of daily load factor)
g) Duration curve of load factor:
Figure 20:Duration curve of all India load factor
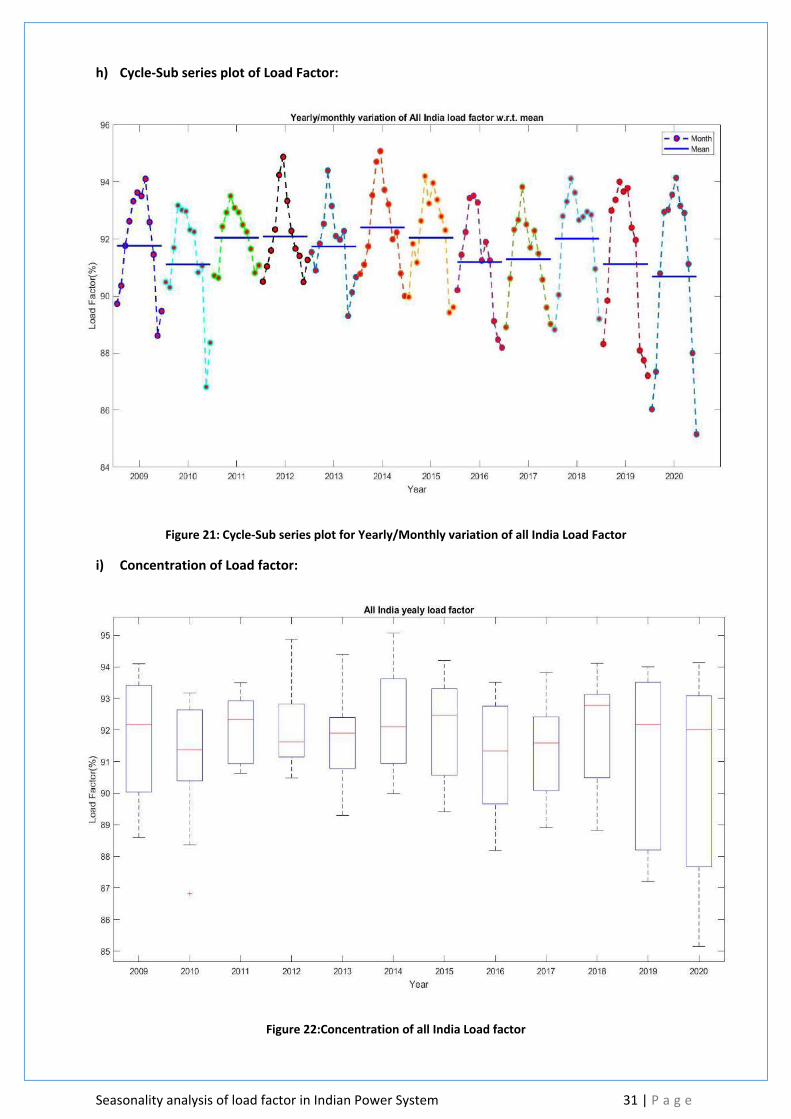
Seasonality analysis of load factor in Indian Power System 31 | P a g e
h) Cycle-Sub series plot of Load Factor:
Figure 21: Cycle-Sub series plot for Yearly/Monthly variation of all India Load Factor
i) Concentration of Load factor:
Figure 22:Concentration of all India Load factor
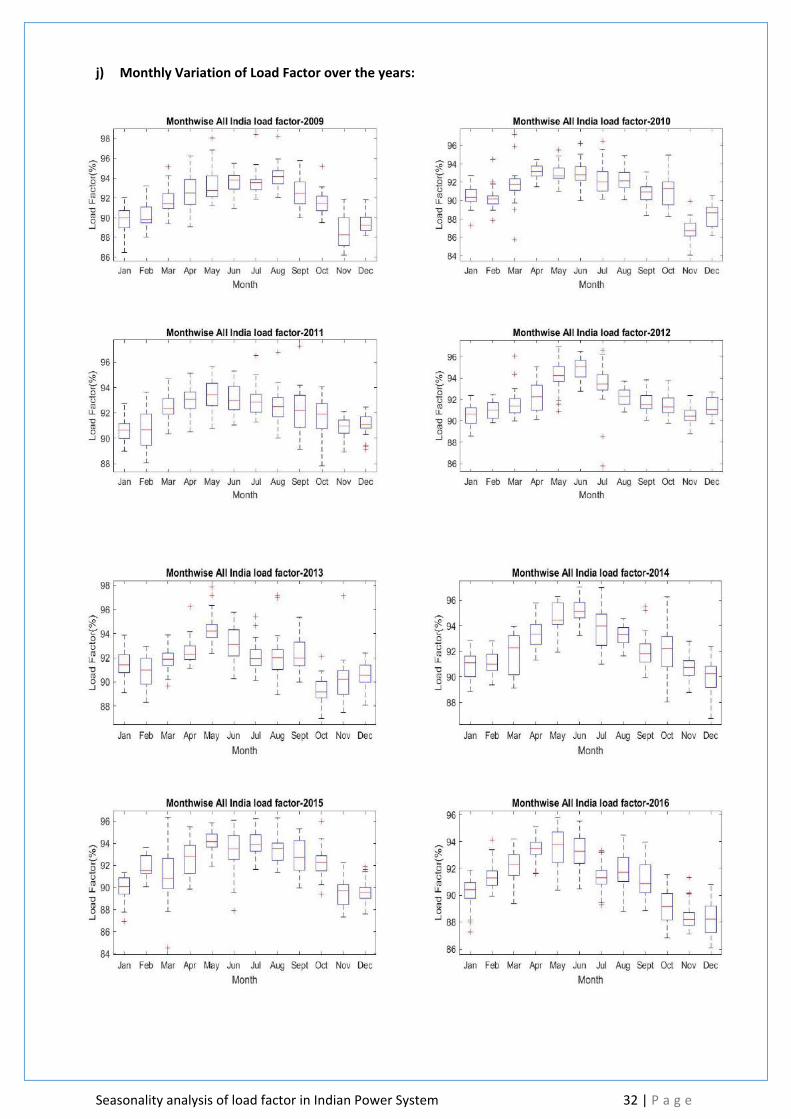
Seasonality analysis of load factor in Indian Power System 32 | P a g e
j) Monthly Variation of Load Factor over the years:
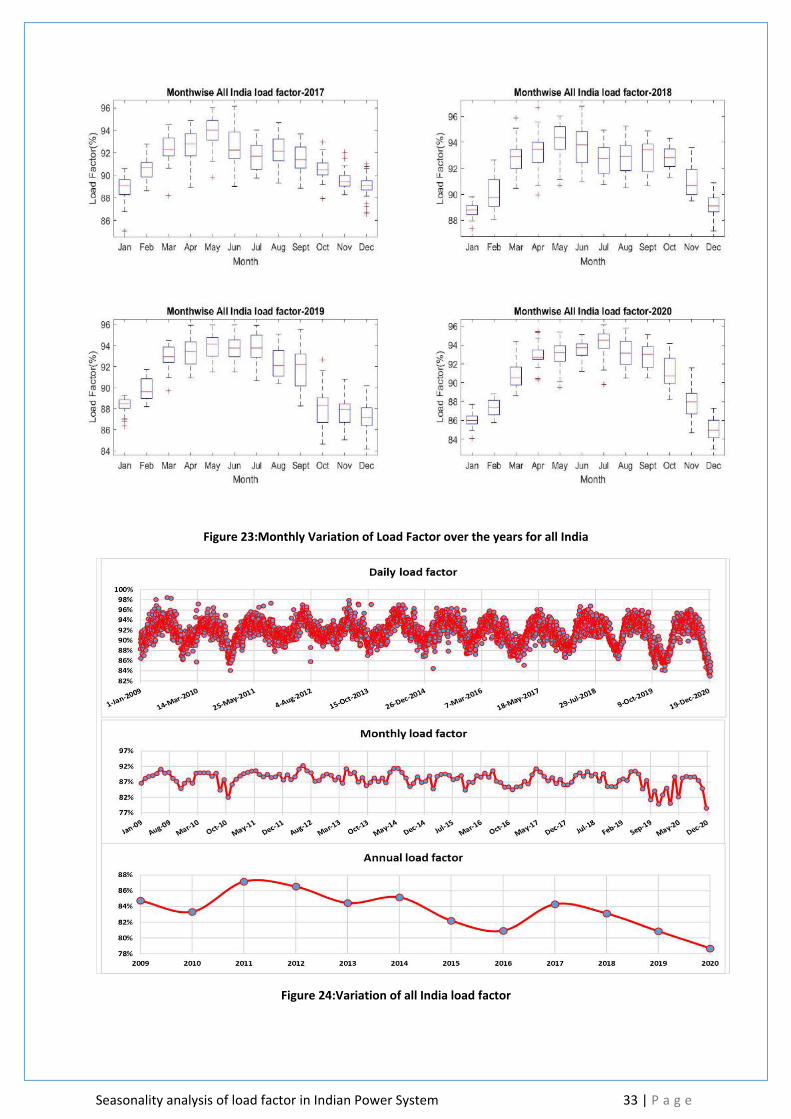
Seasonality analysis of load factor in Indian Power System 33 | P a g e
Figure 23:Monthly Variation of Load Factor over the years for all India
Figure 24:Variation of all India load factor

Seasonality analysis of load factor in Indian Power System 34 | P a g e
11.2. Northern Region a) Average Load Factor (%):
Average Daily Load Factor from 2009-2020 90
Average Monthly Load Factor from 2009-2020 84
Average Annual Load Factor from 2009-2020 73
b) Highest/Lowest Load Factor Occurrence:
Month/Period of Highest Load Factor Jul-Aug
Month/Period of Lowest Load Factor Dec-Jan
c) Seasonal decomposition of load factor trend:
Figure 25:Seasonal decomposition of NR load factor trend

Seasonality analysis of load factor in Indian Power System 35 | P a g e
d) Linear fitting of Load factor trend:
Figure 26:Linear fitting of NR Load factor trend
e) Growth in Maximum, Minimum and Average alongwith Load Factor:
Figure 27:Growth in Maximum, Minimum and Average demand alongwith NR Load Factor
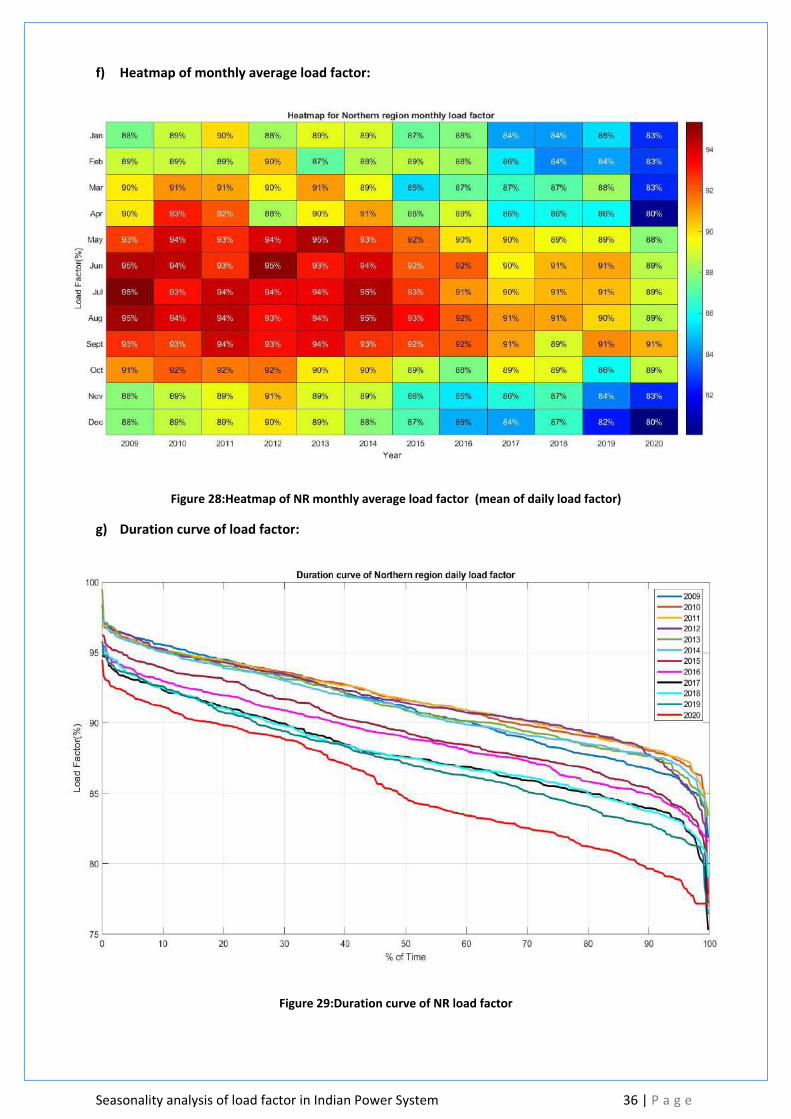
Seasonality analysis of load factor in Indian Power System 36 | P a g e
f) Heatmap of monthly average load factor:
Figure 28:Heatmap of NR monthly average load factor (mean of daily load factor)
g) Duration curve of load factor:
Figure 29:Duration curve of NR load factor
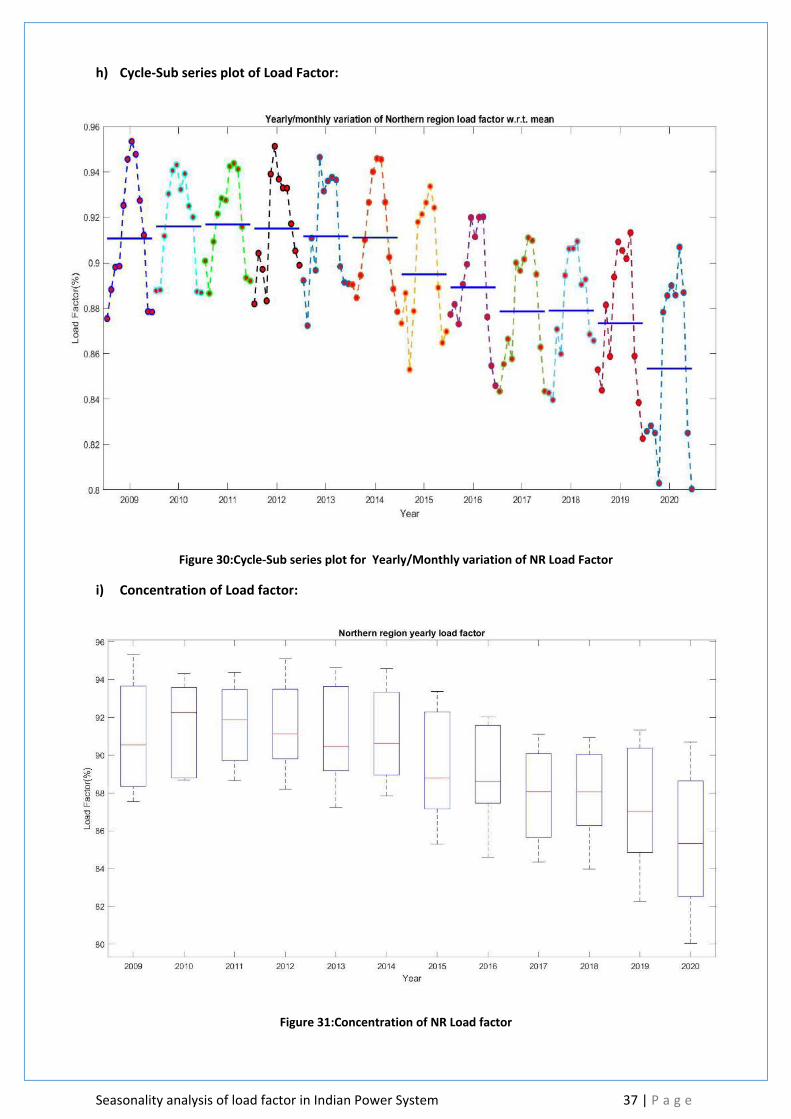
Seasonality analysis of load factor in Indian Power System 37 | P a g e
h) Cycle-Sub series plot of Load Factor:
Figure 30:Cycle-Sub series plot for Yearly/Monthly variation of NR Load Factor
i) Concentration of Load factor:
Figure 31:Concentration of NR Load factor
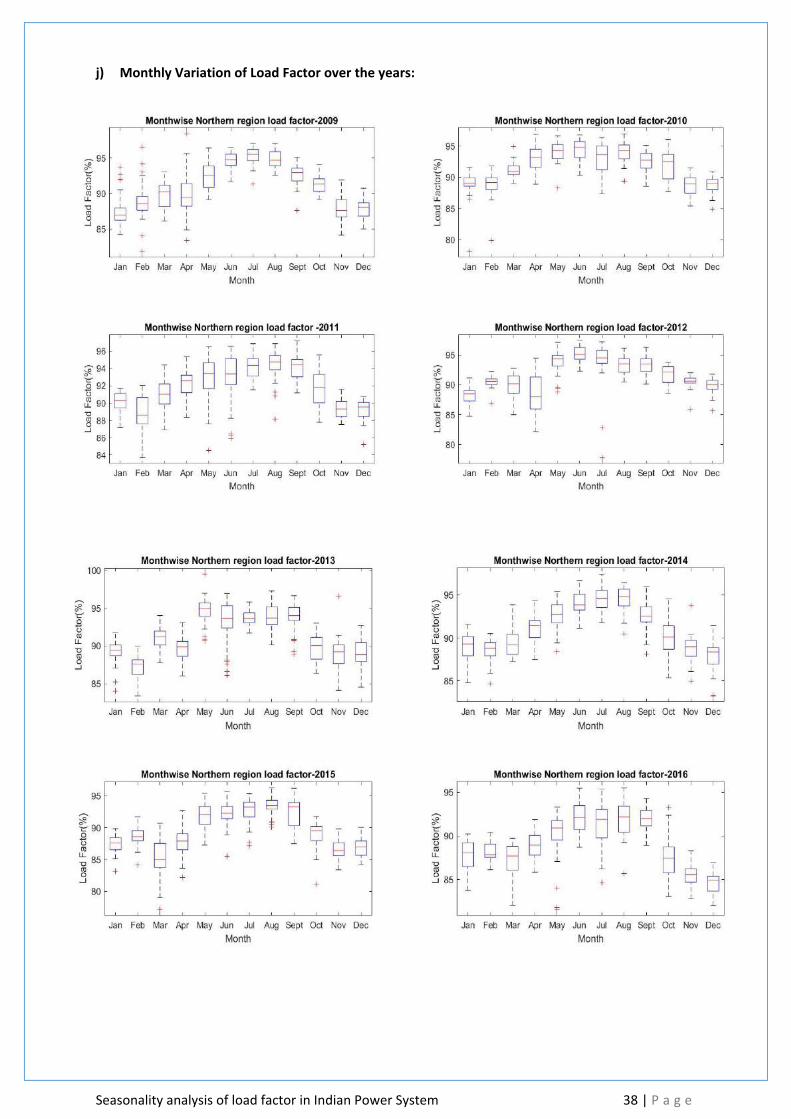
Seasonality analysis of load factor in Indian Power System 38 | P a g e
j) Monthly Variation of Load Factor over the years:

Seasonality analysis of load factor in Indian Power System 39 | P a g e
Figure 32:Monthly Variation of Load Factor over the years for NR
Figure 33:Variation of Northern Region load factor

Seasonality analysis of load factor in Indian Power System 40 | P a g e
11.3. Western Region a) Average Load Factor (%):
Average Daily Load Factor from 2009-2020 92
Average Monthly Load Factor from 2009-2020 86
Average Annual Load Factor from 2009-2020 79
b) Highest/Lowest Load Factor Occurrence:
Month/Period of Highest Load Factor Apr-May
Month/Period of Lowest Load Factor Dec-Jan
c) Seasonal decomposition of load factor trend:
Figure 34:Seasonal decomposition of WR load factor trend
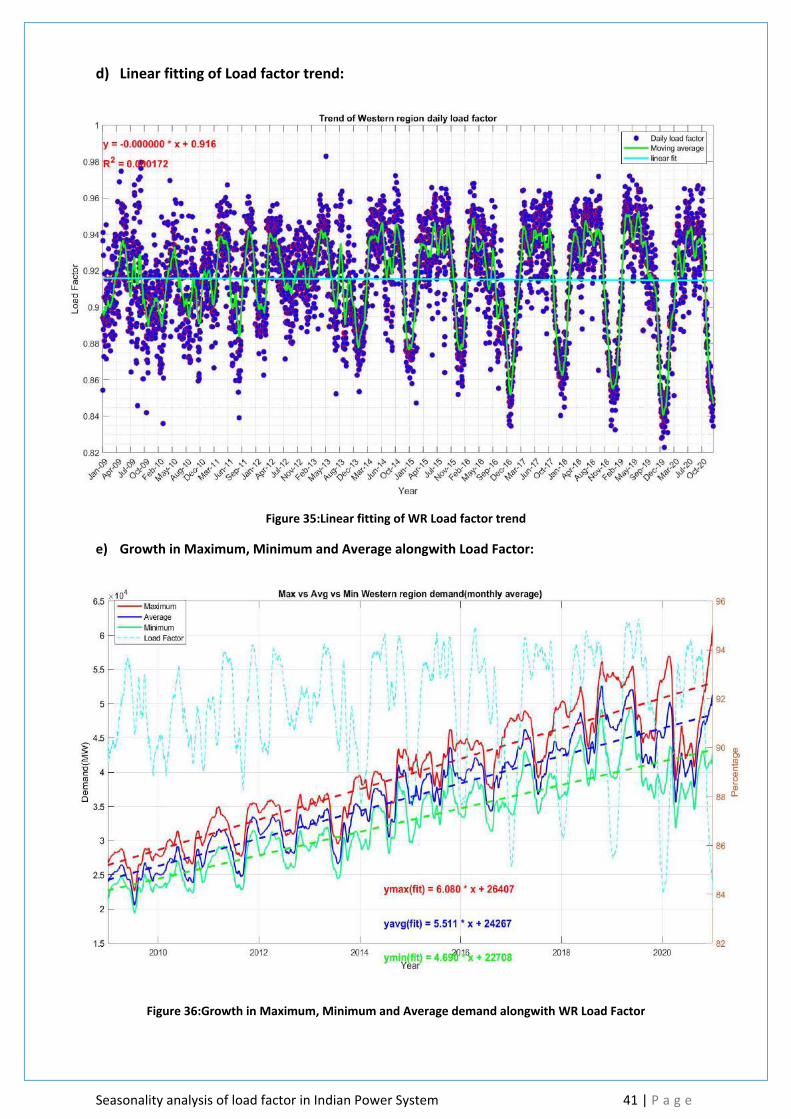
Seasonality analysis of load factor in Indian Power System 41 | P a g e
d) Linear fitting of Load factor trend:
Figure 35:Linear fitting of WR Load factor trend
e) Growth in Maximum, Minimum and Average alongwith Load Factor:
Figure 36:Growth in Maximum, Minimum and Average demand alongwith WR Load Factor
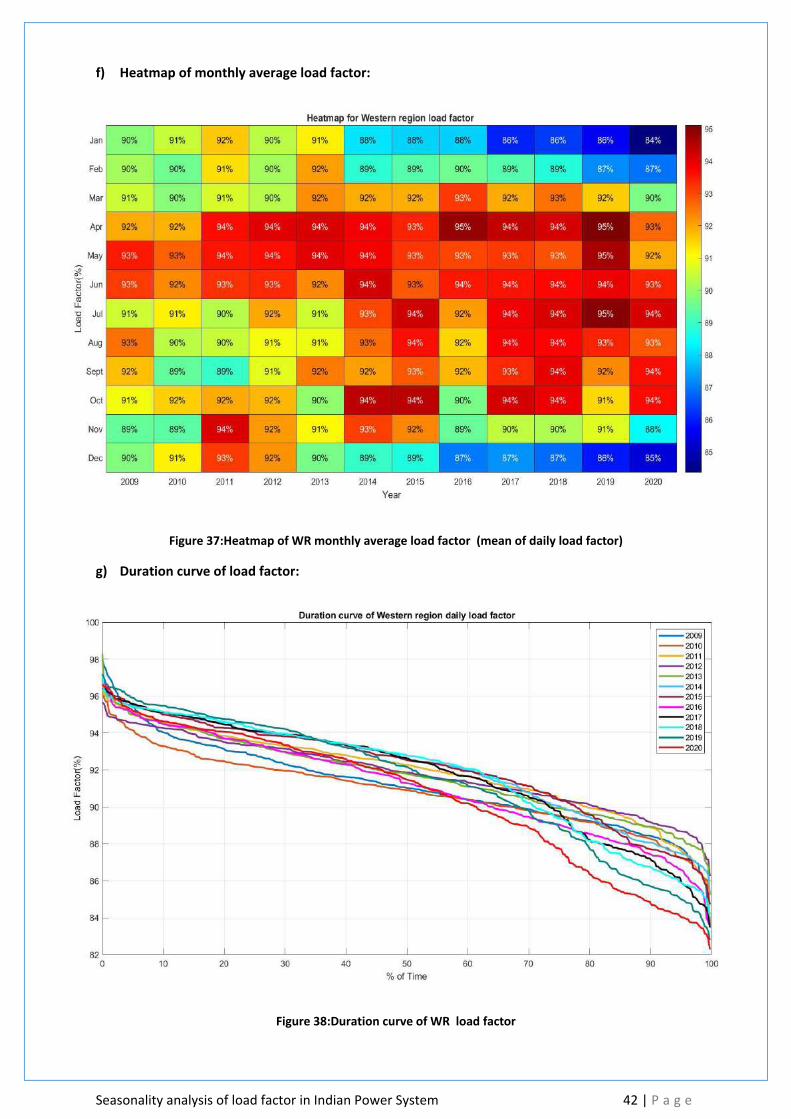
Seasonality analysis of load factor in Indian Power System 42 | P a g e
f) Heatmap of monthly average load factor:
Figure 37:Heatmap of WR monthly average load factor (mean of daily load factor)
g) Duration curve of load factor:
Figure 38:Duration curve of WR load factor

Seasonality analysis of load factor in Indian Power System 43 | P a g e
h) Cycle-Sub series plot of Load Factor:
Figure 39:Cycle-Sub series plot for Yearly/Monthly variation of WR Load Factor
i) Concentration of Load factor:
Figure 40:Concentration of WR Load factor

Seasonality analysis of load factor in Indian Power System 44 | P a g e
j) Monthly Variation of Load Factor over the years:

Seasonality analysis of load factor in Indian Power System 45 | P a g e
Figure 41:Monthly Variation of Load Factor over the years for WR
Figure 42:Variation of Western Region load factor

Seasonality analysis of load factor in Indian Power System 46 | P a g e
11.4. Southern Region a) Average Load Factor (%):
Average Daily Load Factor from 2009-2020 91
Average Monthly Load Factor from 2009-2020 86
Average Annual Load Factor from 2009-2020 81
b) Highest/Lowest Load Factor Occurrence:
Month/Period of Highest Load Factor Mar-Apr
Month/Period of Lowest Load Factor Dec-Jan
c) Seasonal decomposition of load factor trend:
Figure 43:Seasonal decomposition of SR load factor trend

Seasonality analysis of load factor in Indian Power System 47 | P a g e
d) Linear fitting of Load factor trend:
Figure 44:Linear fitting of SR Load factor trend:
e) Growth in Maximum, Minimum and Average alongwith Load Factor:
Figure 45:Growth in Maximum, Minimum and Average demand alongwith SR Load Factor
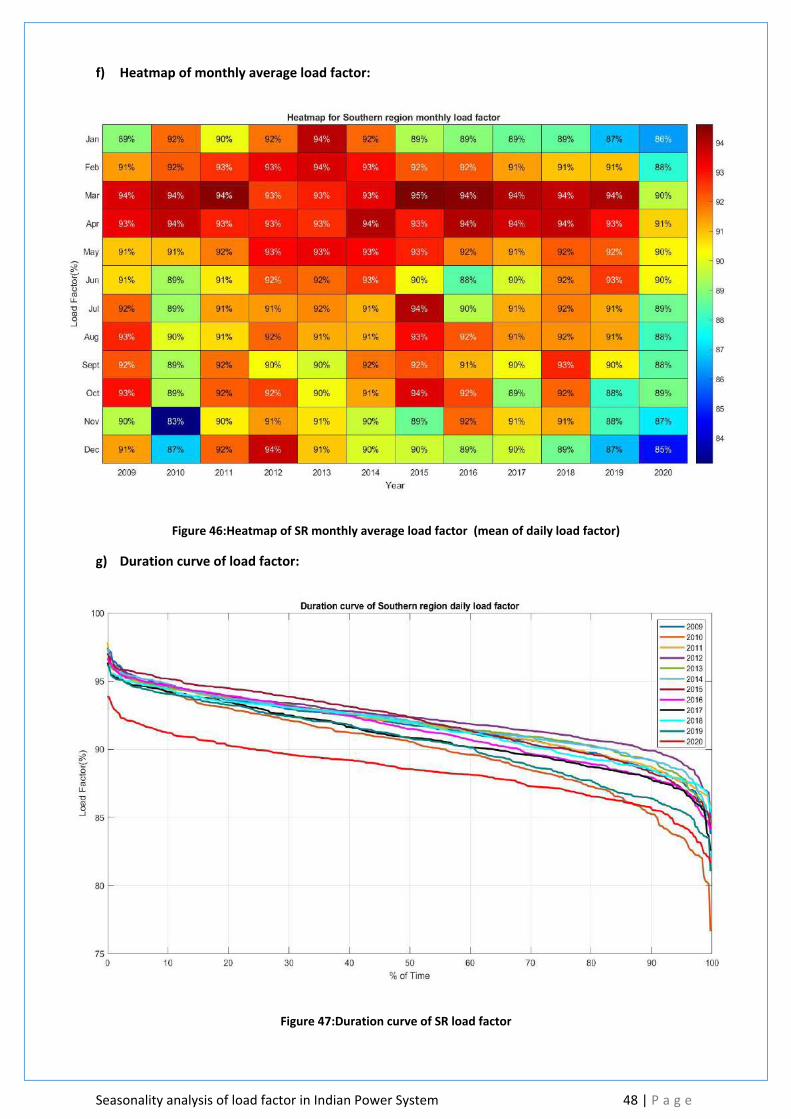
Seasonality analysis of load factor in Indian Power System 48 | P a g e
f) Heatmap of monthly average load factor:
Figure 46:Heatmap of SR monthly average load factor (mean of daily load factor)
g) Duration curve of load factor:
Figure 47:Duration curve of SR load factor

Seasonality analysis of load factor in Indian Power System 49 | P a g e
h) Cycle-Sub series plot of Load Factor:
Figure 48:Cycle-Sub series plot for Yearly/Monthly variation of SR Load Factor
i) Concentration of Load factor:
Figure 49:Concentration of SR Load factor

Seasonality analysis of load factor in Indian Power System 50 | P a g e
j) Monthly Variation of Load Factor over the years:

Seasonality analysis of load factor in Indian Power System 51 | P a g e
Figure 50:Monthly Variation of Load Factor over the years for SR
Figure 51:Variation of Southern Region load factor

Seasonality analysis of load factor in Indian Power System 52 | P a g e
11.5. Eastern Region a) Average Load Factor (%):
Average Daily Load Factor from 2009-2020 85
Average Monthly Load Factor from 2009-2020 79
Average Annual Load Factor from 2009-2020 73
b) Highest/Lowest Load Factor Occurrence:
Month/Period of Highest Load Factor Apr-May
Month/Period of Lowest Load Factor Nov-Dec
c) Seasonal decomposition of load factor trend:
Figure 52:Seasonal decomposition of ER load factor trend

Seasonality analysis of load factor in Indian Power System 53 | P a g e
d) Linear fitting of Load factor trend:
Figure 53:Linear fitting of ER Load factor trend
e) Growth in Maximum, Minimum and Average alongwith Load Factor:
Figure 54:Growth in Maximum, Minimum and Average demand alongwith ER Load Factor
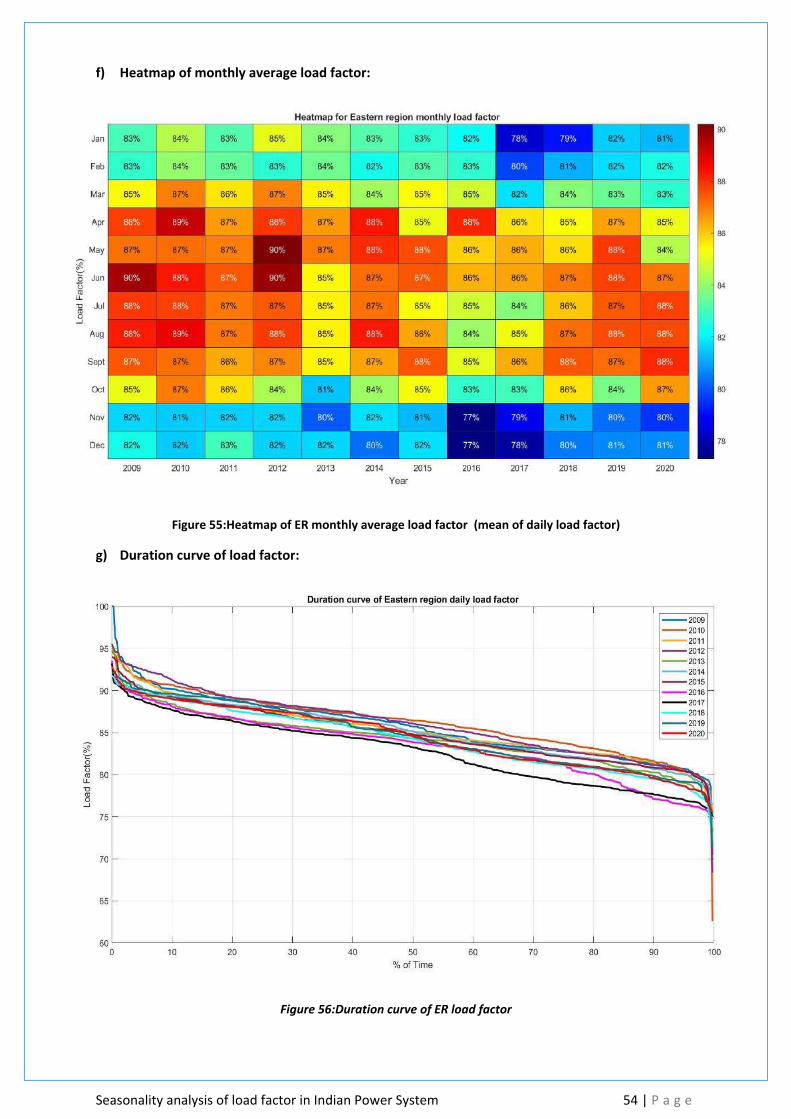
Seasonality analysis of load factor in Indian Power System 54 | P a g e
f) Heatmap of monthly average load factor:
Figure 55:Heatmap of ER monthly average load factor (mean of daily load factor)
g) Duration curve of load factor:
Figure 56:Duration curve of ER load factor

Seasonality analysis of load factor in Indian Power System 55 | P a g e
h) Cycle-Sub series plot of Load Factor:
Figure 57:Cycle-Sub series plot for Yearly/Monthly variation of ER Load Factor
i) Concentration of Load factor:
Figure 58:Concentration of ER Load factor

Seasonality analysis of load factor in Indian Power System 56 | P a g e
j) Monthly Variation of Load Factor over the years:

Seasonality analysis of load factor in Indian Power System 57 | P a g e
Figure 59:Monthly Variation of Load Factor over the years for ER
Figure 60:Variation of Eastern Region load factor
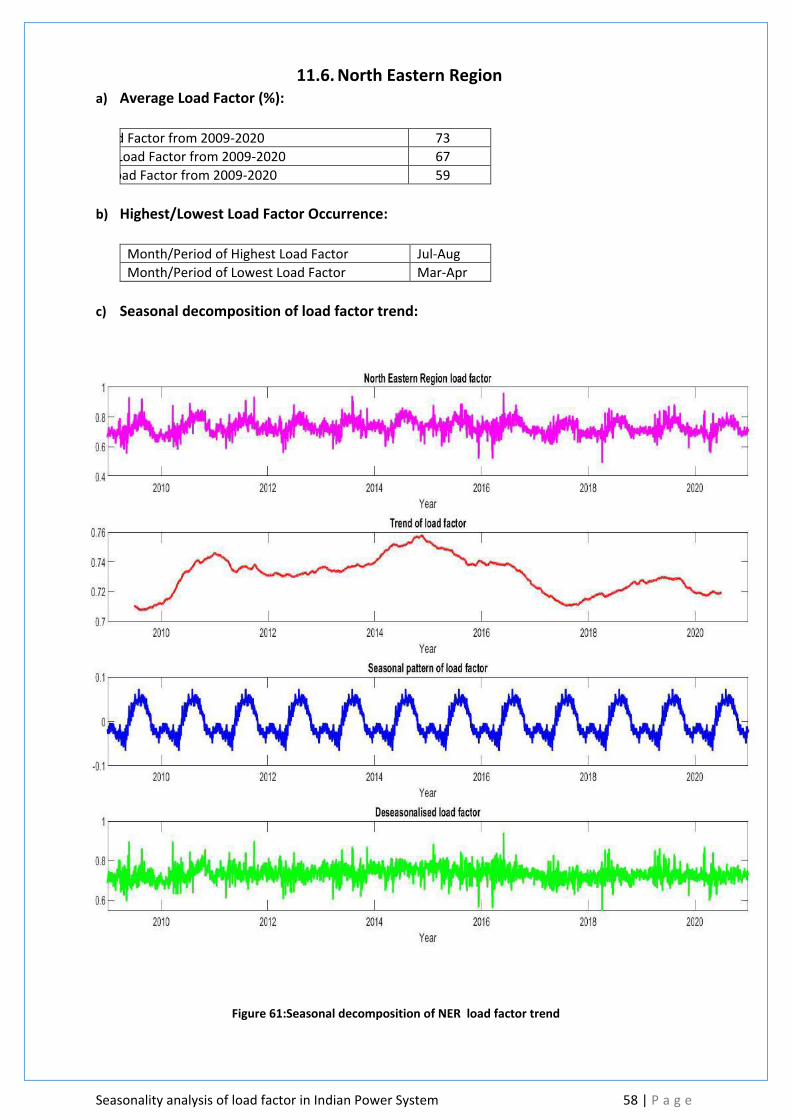
Seasonality analysis of load factor in Indian Power System 58 | P a g e
11.6. North Eastern Region a) Average Load Factor (%):
Average Daily Load Factor from 2009-2020 73
Average Monthly Load Factor from 2009-2020 67
Average Annual Load Factor from 2009-2020 59
b) Highest/Lowest Load Factor Occurrence:
Month/Period of Highest Load Factor Jul-Aug
Month/Period of Lowest Load Factor Mar-Apr
c) Seasonal decomposition of load factor trend:
Figure 61:Seasonal decomposition of NER load factor trend

Seasonality analysis of load factor in Indian Power System 59 | P a g e
d) Linear fitting of Load factor trend:
Figure 62:Linear fitting of NER Load factor trend
e) Growth in Maximum, Minimum and Average alongwith Load Factor:
Figure 63:Growth in Maximum, Minimum and Average demand alongwith NER Load Factor

Seasonality analysis of load factor in Indian Power System 60 | P a g e
f) Heatmap of monthly average load factor:
Figure 64:Heatmap of NER monthly average load factor (mean of daily load factor)
g) Duration curve of load factor:
Figure 65:Duration curve of NER load factor:

Seasonality analysis of load factor in Indian Power System 61 | P a g e
h) Cycle-Sub series plot of Load Factor:
Figure 66:Cycle-Sub series plot for Yearly/Monthly variation of NER Load Factor:
i) Concentration of Load factor:
Figure 67:Concentration of NER Load factor

Seasonality analysis of load factor in Indian Power System 62 | P a g e
j) Monthly Variation of Load Factor over the years:
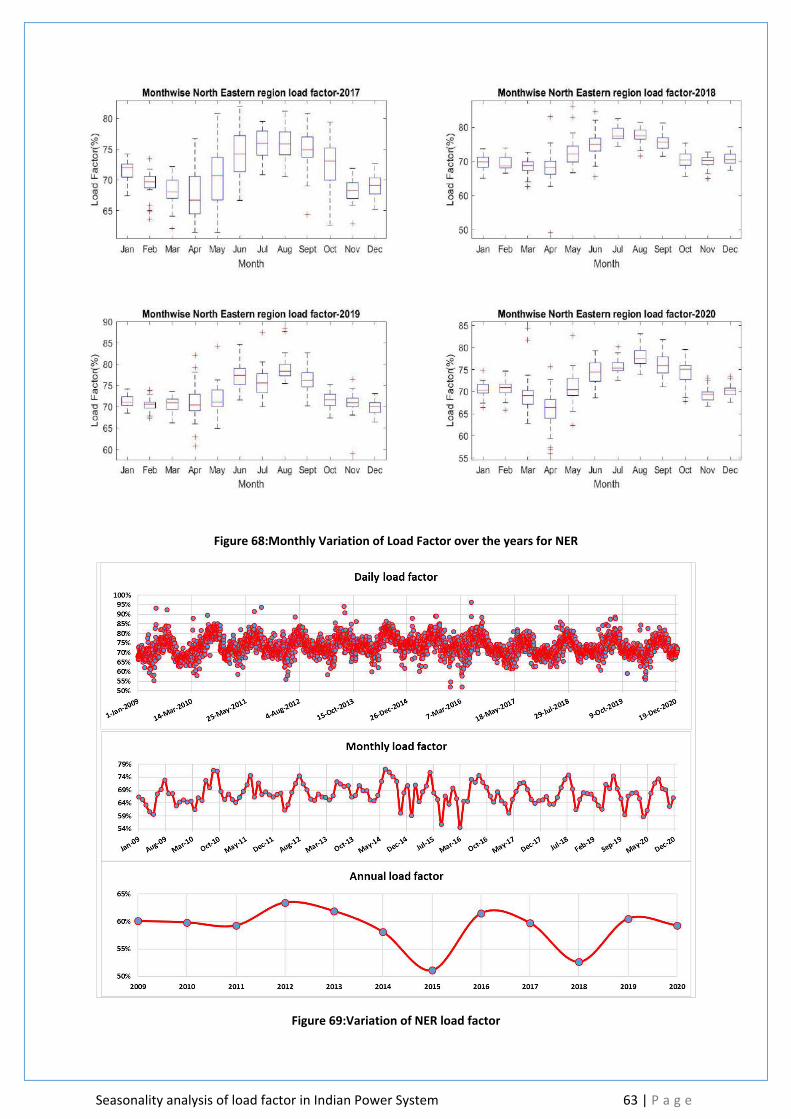
Seasonality analysis of load factor in Indian Power System 63 | P a g e
Figure 68:Monthly Variation of Load Factor over the years for NER
Figure 69:Variation of NER load factor
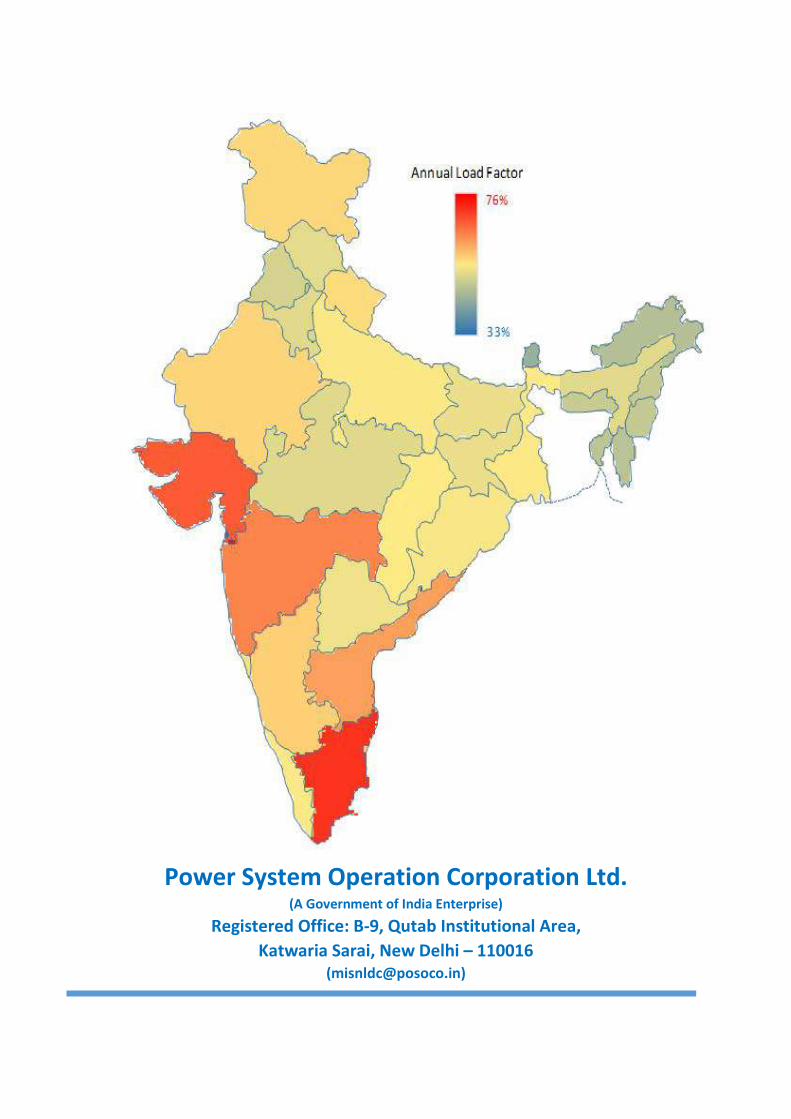
Power System Operation Corporation Ltd. (A Government of India Enterprise)
Registered Office: B-9, Qutab Institutional Area, Katwaria Sarai, New Delhi – 110016
Copyright © 2022 FDOKUMEN