Impaired Ig class switch in mice deficient for the X-linked lymphoproliferative disease gene Sap
26
doi:10.1182/blood-2004-07-2731 Prepublished online June 7, 2005; Tavtigian, Zhao-Qi Wang, Sylvain Latour and Luo Yin Umaima Al-Alem, Cuiling Li, Nathalie Forey, Francis Relouzat, Marie-Claude Fondaneche, Sean V lymphoproliferative disease gene sap Impaired Ig class switch in mice deficient for the X-linked (1930 articles) Signal Transduction (5019 articles) Immunobiology Articles on similar topics can be found in the following Blood collections http://bloodjournal.hematologylibrary.org/site/misc/rights.xhtml#repub_requests Information about reproducing this article in parts or in its entirety may be found online at: http://bloodjournal.hematologylibrary.org/site/misc/rights.xhtml#reprints Information about ordering reprints may be found online at: http://bloodjournal.hematologylibrary.org/site/subscriptions/index.xhtml Information about subscriptions and ASH membership may be found online at: articles must include the digital object identifier (DOIs) and date of initial publication. priority; they are indexed by PubMed from initial publication. Citations to Advance online prior to final publication). Advance online articles are citable and establish publication yet appeared in the paper journal (edited, typeset versions may be posted when available Advance online articles have been peer reviewed and accepted for publication but have not Copyright 2011 by The American Society of Hematology; all rights reserved. Washington DC 20036. by the American Society of Hematology, 2021 L St, NW, Suite 900, Blood (print ISSN 0006-4971, online ISSN 1528-0020), is published weekly For personal use only. by guest on June 1, 2013. bloodjournal.hematologylibrary.org From
-
Upload
independent -
Category
Documents
-
view
0 -
download
0
Transcript of Impaired Ig class switch in mice deficient for the X-linked lymphoproliferative disease gene Sap

doi:10.1182/blood-2004-07-2731Prepublished online June 7, 2005;
Tavtigian, Zhao-Qi Wang, Sylvain Latour and Luo YinUmaima Al-Alem, Cuiling Li, Nathalie Forey, Francis Relouzat, Marie-Claude Fondaneche, Sean V lymphoproliferative disease gene sapImpaired Ig class switch in mice deficient for the X-linked
(1930 articles)Signal Transduction � (5019 articles)Immunobiology �
Articles on similar topics can be found in the following Blood collections
http://bloodjournal.hematologylibrary.org/site/misc/rights.xhtml#repub_requestsInformation about reproducing this article in parts or in its entirety may be found online at:
http://bloodjournal.hematologylibrary.org/site/misc/rights.xhtml#reprintsInformation about ordering reprints may be found online at:
http://bloodjournal.hematologylibrary.org/site/subscriptions/index.xhtmlInformation about subscriptions and ASH membership may be found online at:
articles must include the digital object identifier (DOIs) and date of initial publication. priority; they are indexed by PubMed from initial publication. Citations to Advance online prior to final publication). Advance online articles are citable and establish publicationyet appeared in the paper journal (edited, typeset versions may be posted when available Advance online articles have been peer reviewed and accepted for publication but have not
Copyright 2011 by The American Society of Hematology; all rights reserved.Washington DC 20036.by the American Society of Hematology, 2021 L St, NW, Suite 900, Blood (print ISSN 0006-4971, online ISSN 1528-0020), is published weekly
For personal use only. by guest on June 1, 2013. bloodjournal.hematologylibrary.orgFrom

1
Immunobiology
Impaired Ig Class Switch in Mice Deficient for the X-Linked
Lymphoproliferative Disease Gene sap†
Umaima Al-Alem1,2, Cuiling Li1, Nathalie Forey1, Francis Relouzat3, Marie-Claude Fondanèche3,
Sean V. Tavtigian1, Zhao-Qi Wang1, Sylvain Latour3‡ and Luo Yin1
1International Agency for Research on Cancer, Lyon, France2Division of Pulmonary, Allergy, and Critical Care Medicine, Columbia University,
New York, USA3Unité INSERM 429, Hôpital Necker-Enfants Malades, Paris, France
†This work is supported in part by grants from the Association for International Cancer Research,
Association pour la Recherche sur le Cancer, GIS-Institut des Maladies Rares, Institut Nationale de
la Santé et de la Recherche Médicale, and the Swiss Federal Office of Public Health.‡S.L. is a scientist from the Centre National de la Recherche Scientifique (France).
Correspondence should be addressed to:
Dr Luo Yin or Dr Sylvain Latour
Unité INSERM 429, Hôpital Necker Enfants-Malades
149, rue de Sèvres, 75015 Paris, France
Phone: +33 (0)1 44 49 50 51; Fax: +33 (0)1 42 73 06 40; E-mail: [email protected]
Short running title: Impaired Ig class switch in sap-deficient mice
Word counts: total text, 3500; abstract, 136
Blood First Edition Paper, prepublished online June 7, 2005; DOI 10.1182/blood-2004-07-2731
Copyright © 2005 American Society of Hematology
For personal use only. by guest on June 1, 2013. bloodjournal.hematologylibrary.orgFrom

2
Abstract
X-linked lymphoproliferative disease is characterized by abnormal immune responses to Epstein-
Barr virus attributed to inactivating mutations of the SAP gene. Previous studies showed IgE
deficiency and low serum IgG levels in sap-deficient mice before and after viral infections, which
are associated with impaired CD4+ T helper function. In the present work, we find that SAP is
expressed in B cells and this expression is down-regulated after stimulation with LPS and IL-4. We
demonstrate that B cells from sap-deficient mice exhibit reduced IgG and IgA production in vitro.
This impairment correlates with decreased circular transcript levels of Iα, Iγ2a, Iγ2b, and Iγ3 after
stimulation, which indicate a defective Ig switch recombination in sap-deficient B cells. While XLP
is believed to cause defects in T, NKT, and NK cells, our results indicate that B cells are also
affected.
For personal use only. by guest on June 1, 2013. bloodjournal.hematologylibrary.orgFrom

3
Introduction
X-linked lymphoproliferative disease (XLP) is an inherited immunodeficiency with variable
phenotypes often associated with Epstein-Barr virus (EBV) infection. The most frequent clinical
manifestations of XLP are fatal or severe infectious mononucleosis, hypo- or agammaglobulinemia,
and non-Hodgkin lymphoma of Burkitt type.1,2 It has been demonstrated that inactivation or
dysfunction of SAP (also called SH2D1A or DSHP) is responsible for this disease.3-5
SAP, a small cytoplasmic protein that contains a single SH2-domain, is expressed at high levels in
T and NK cells. SAP interacts through its SH2 domain with tyrosine residues located in the
cytoplasmic domains of several molecules of the SLAM/CD2 receptor family, including SLAM,5
2B4,6 NTB-A,7 CD84 and Ly9,8,9 and CRACC.10 Earlier studies showed that SAP regulates the
signal transduction of the SLAM/CD2-family receptors by interfering with the recruitment of the
tyrosine phosphatase SHP-2.5,11 Recently, compelling evidence was provided that SAP behaves as
a signalling adapter permitting the recruitment of the protein tyrosine kinase FynT11-14 and the 5'
inositol phosphatase SHIP.12,15 In XLP patients, the SAP protein is either absent or structurally
altered due to germline mutations of the SAP gene, and may thus fail to regulate the above-
mentioned signalling events.3-5,16-19
sap-deficient mice have been generated to study the cellular basis of XLP. In two sap-deficient
mouse models, infection with lymphocytic choriomeningitis virus (LCMV) or T. gondii led to
hyper-proliferation of IFN-γ-producing T cells and decreased antibody responses.20-22 We have
reported the generation and characterization of a third sap-deficient mouse model that displays
hyper-activation of the CD8+ cells and decreased level of total serum IgE and IgG both before and
after murine gammaherpesvirus 68 (MHV-68)-infection.23 Moreover, a defect in NKT development
has been observed in the above mouse models and in humans.24-26 Previous investigations revealed
an altered in vivo Th2 cytokine profile in sap-deficient mice, indicating that impaired Th2
differentiation accounts for the uncontrolled expansion of Th1 cells20-23, as well as the impaired Ig
production by B cells20,21,27 and the lack of long-lived plasma cells/memory B cells in sap-deficient
mice.22 Only recently, the widely accepted hypothesis that XLP is exclusively a T and NK defect
was challenged by Morra et al., who demonstrated defective B cell responses in the absence of SAP
by an in vivo approach.28 In parallel, we have addressed the question of whether SAP has a direct
role in B cells by an in vitro assay. In the present study, we report the impaired Ig switch
recombination in sap-deficient B cells, indicating an intrinsic B cell defect.
For personal use only. by guest on June 1, 2013. bloodjournal.hematologylibrary.orgFrom

4
Materials and Methods
Mice
The generation of the sap-deficient mice in 129/Sv X C57BL/6 mixed background was previously
reported.23 The mutant mice were back-crossed to a C57BL/6 background for more than 10
generations. Mice were bred and housed under specific pathogen-free conditions at the IARC. Age-
matched mutant and wild-type male mice, aged two to six months, were used.
Flow cytometry
Single cell suspensions from indicated organs were depleted of erythrocytes by lysis in hemolytic
gey’s solution. 1.0 x 10⁶ cells were pre-incubated with Fc block (rat IgG2b anti-CD16/32, clone
2.4G2, BD/PharMingen, San Diego, CA) for 5 min at 4°C prior to staining with antibodies
conjugated to fluorescein isotyiocyanate (FITC), phycoerythrin (PE), tricolor (TC), allophycocyanin
(APC), or biotin. Biotin conjugates were visualized with fluochrome conjugated-Strepavidin
(BD/PharMingen). The following anti-mouse mAbs were purchased from BD/PharMingen, Caltag
(Burlingame, CA), or SouthernBiotech (Birmingham, AL): anti-B220 (RA3-6B2), anti-CD43 (S7),
anti-BP-1 (6C3), anti-CD24 (M1/69), anti-IgM (R6-60.2), anti-IgD (11-26c.2a), anti-CD5 (53-7.3)
anti-CD21/CD35 (7G6), anti-CD23 (B4B4), anti-CD69 (H1.2F3), anti-CD3e (500-A2), anti-CD4
(CT-CD4), anti-CD8a (CT-CD8a), anti-NK1.1 (PK136), anti-2B4. Ten thousand cells were
acquired on a FACSCalibre flow cytometer (BD Labware, Franklin Lakes, NJ) and analyzed with
WinMDI.
Positive selection of B cells and amplification of the sap transcript
Splenocytes were stained with anti-CD3-FITC (500-A2) and anti-CD19-Tricolor (6D5) (Caltag),
and sorted into CD19+ and CD3+ populations using FACSVantage SE (BD). Total RNA was
prepared from the sorted cells by RNeasy kit (QIAGEN, Hilden, Germany) and was reversed
transcribed by GeneAmp RT-PCR Core kit (Applied Biosystems/Roche, Branchburg, NJ). The
SAP,23 β–actin,29 and CD330 transcripts were amplified as described previously.
Negative selection of B cells and Western blot hybridization
Splenocytes were stained with PE-conjugated anti-mouse CD3e (500-A2), CD4 (GK1.5), CD8a
(53-6.7), NK1.1 (PK136), and 2B4 (BD/PharMingen). The cells positive for the above markers
were depleted by the MACS anti-PE MicroBeads and MACS separation columns (Milteni Biotec,
Bergisch Gladbach, Germany). After the depletion, plastic-adhering cells were removed by
For personal use only. by guest on June 1, 2013. bloodjournal.hematologylibrary.orgFrom
5
incubation at 37oC for 1.5 hr. SAP protein in cell extracts after immunoprecipitation was visualised
by immunoblotting using polyclonal rabbit anti-SAP antibodies as described previously.12
Purification and culture of the small resting B cells
B cells were purified in two stages. First, they were negatively selected from splenocytes by
immuno-magnetic depletion with mouse Pan T, CD4, and CD8 beads from Dynal Biotech (Oslo,
Norway). Second, small resting B cells were fractionated by centrifugation through a discontinuous
Percoll gradient.31 0.5 x 10⁶ cells/ml were stimulated in 96-well plates, 24-well plates or T75 cell
culture flasks with 10 µg/ml of LPS (Sigma, St. Louis, MO) or 1 µg/ml anti-mouse CD40
(BD/PharMingen), in combination with the following cytokines from R&D Systems (Menneapolis,
MN): 10 ng/ml of IL-4, 10 ng/ml of IFN-γ, or 0.5 ng/ml of transforming growth factor-β1 (TGF-
β1). To obtain an optimal cell growth, stimulation by TGF-β1 is carried out in the presence of 8
ng/ml of IL-4 and 0.25 ng/ml of IL-5, as described by Snapper et al.32 The cells were cultured in
RPMI 1640 medium or DMEM supplemented with 10% heat-inactivated fetal calf serum, 2 mM
glutamine, 0.1 mM non-essential amino acids, 0.1 mM β-mercaptolethanol, 1 mM sodium pyruvate,
100 U/ml penicillin, 100 µg/ml streptomycin (all from Invitrogen/GIBCO, Groningen, The
Netherlands). The proliferative response of B cells under the above conditions was measured by
assessing [3H] thymidine incorporation.
Measurement of immunoglobulin secretion and circular transcripts
Immunoglobulin (Ig) titers from the supernatant of cultured B cells (1.0 x 10⁶ cells/24 well at the
start of stimulation) were determined by ELISA as previously described,23 except for IgG2a, whose
counter part is IgG2c in C57BL/6 mouse background.33 For measuring IgG2c, goat anti-mouse IgG
(H+L) (Jackson Immunoresearch Laboratories, West Grove, PA) was used as capture antibody, and
HRP-conjugated goat anti-mouse IgG2c (SouthernBiotech) as detecting antibody. 20 x 106 cells
were harvested at different time points after stimulation. Total RNA was extracted from the
stimulated cells by TrizolTM Reagent (Invitrogen), and was reversed transcribed as described above.
The circular transcripts of Iα and all subtypes of Iγ were amplified following the protocols reported
by Kinoshita et al.34 The β–actin transcript was amplified by PCR conditions described
previously.29
For personal use only. by guest on June 1, 2013. bloodjournal.hematologylibrary.orgFrom

6
Results
Normal B cell development in sap-deficient mice
The striking defect in the three sap-deficient mouse models is the dysregulation in Ig production.20-
23 We previously showed comparable cell numbers and percentages of CD19+ as well as CD3+,
CD4+, and CD8+ populations in sap-deficient and wild-type littermate mice.23 In order to study
whether impaired Ig production is due to a lack of specific B cell subtypes, in addition to defective
CD4+ function, we analyzed the B cell subsets in the bone marrow, spleen, and peritoneal cavity. As
shown in Fig. 1, the proportions of early B cells in the bone marrow (using Hardy fraction
classification:35 B220/CD43/BP-1/CD24) (Fig. 1a), mature B cells in the spleen (B220+IgM+,
IgM+IgD+, IgM+CD5+, IgM+CD21+, and CD21+CD23+ cells) (Fig. 1b), and peritoneal B1
population (B220+CD5+) (Fig. 1c) were comparable in wild-type and mutant mice, indicating that
the major B cell sub-types develop normally in sap-deficient mice.
Expression of SAP in B cells
To address whether SAP plays a role in B cell function, we assessed SAP expression in wild-type B
cells. We purified B lymphocytes and performed RT-PCR and immunoprecipitation/immunoblot to
examine sap mRNA and SAP protein expressions. Using positive selection by FACS sorting, we
obtained a CD19+ population with less than 0.12% of the CD3+, CD4+, CD8+, NK1.1+, and 2B4+
cells (data not shown). Using negative selection, we obtained B cell preparations with less than 1%
of the above contaminants (data not shown). Semi-quantitative RT-PCR analysis of RNA prepared
from the sorted CD19+ cells and from the negatively enriched B cells revealed the presence of the
sap mRNA, albeit at a lower level than in thymocytes, splenocytes, or sorted CD3+ cells (Fig. 2a).
Interestingly, sap expression was down-regulated after B cell stimulation with LPS plus IL-4 (Fig.
2a). Due to the limited number of cells available from FACS-sorting, the SAP protein was studied
in negatively selected B cells. Consistent with the aforementioned expression of the sap mRNA
(Fig. 2a), the SAP protein was present at low levels in B cell extracts, and decreased gradually
following LPS plus IL-4 stimulation (Fig. 2b). To test the purity of the enriched B cells, CD3+
transcript was measured in the RNA samples by RT-PCR. While no amplification band was found
in the positively selected B cells or in the B cells after stimulation, a very faint amplification band
was detected in the negatively enriched B cell preparation (Fig. 2a). Subsequently, we performed a
mixing experiment to rule out the possibility that the sap-transcript or the SAP protein observed in
the above assays originate from trace T cell contamination. Purified B cells from sap-deficient mice
that are devoid of SAP were mixed with T cells from wild-type mice to mimic various extents of T
cell contamination and then examined for SAP protein expression. As shown in Fig. 2b, 1% and 2%
For personal use only. by guest on June 1, 2013. bloodjournal.hematologylibrary.orgFrom

7
of T cell contamination generate faint signals in comparison to SAP expression in wild-type B cell
preparations. Only when T cell contamination reaches 4% does T cell-derived SAP signal become
comparable with that from the wild-type B cells. Since, as shown by FACS analysis, T cells
represent less than 1% of the enriched B cell population used in our experiments, it could be
excluded as the source of the positive SAP signal in purified B cells.
Decreased IgG and IgA production in sap-deficient B cells
Since SAP was shown to be expressed in wild-type B cells, we investigated the impact of SAP-
deficiency on B cell function, in particular, Ig production. In order to eliminate any in vivo pre-
programming/interference, we used small resting B cells, which represent the mature naïve B cell
population. The small resting B cells were isolated from the spleen by negative selection followed
by density centrifugation. The resulting cell population was 92% B220+ and contained less than
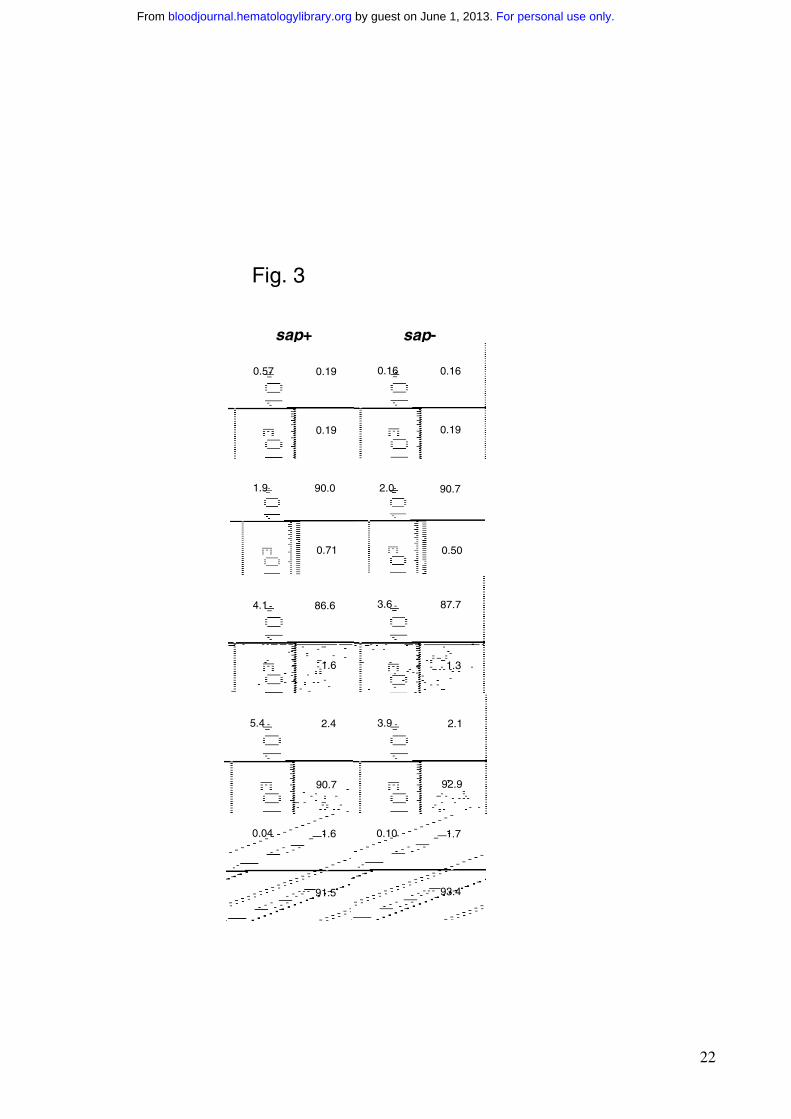
0.8% CD3+ cells (Fig. 3), as assessed by flow cytometry. Of the B220+ cells, 98% were IgM+, and
94% were IgM+IgD+ (Fig. 3). The percentages of the B220+CD43+ and B220+CD69+ populations,
representing the mature activated B cells, were low in both sap-deficient and wild-type cell
preparations (Fig. 3). In order to study Ig production, these isolated small resting B cells were
stimulated for 6 days with LPS in combination with IL-4, IFN-γ, or TGF-β1, and the secreted
immunoglobulins were measured by ELISA. As shown in Fig. 4, the IgM and IgE levels were
comparable in both genotypes; however, IgG and IgA production was impaired in sap-deficient B
cells under most conditions. In particular, the levels of secreted IgG2c (equivalent to IgG2a in
C57BL/6 background33), IgG2b, IgG3, and IgA were significantly lower in sap-deficient B cells
compared to wild-type B cells (Fig. 4).
In order to rule out the possibility that the decreased in vitro Ig production was due to poor
outgrowth of the sap-deficient B cells during culture, we assessed the proliferation rates of the
cultured cells by measuring the incorporated [3H]-thymidine. As shown in Fig. 5, the proliferation
rates of sap-deficient and wild-type B cells were comparable. Moreover, numbers of sap-deficient
and wild-type live B cells, determined by trypan blue exclusion, were similar at various time points
(data not shown).
Impaired Ig class switch recombination in sap-deficient B cells
Subsequently, we addressed whether the decreased IgG2c, IgG2b, IgG3, and IgA production is due
to a defect of Ig class switch recombination (CSR). Kinoshita et al. demonstrated that CSR can be
determined by measuring the abundance of RNA transcripts from the looped-out circular DNA.34
We studied the expression level of Iγ2a, Iγ2b, Iγ3, and Iα circular transcripts in sap-deficient and
For personal use only. by guest on June 1, 2013. bloodjournal.hematologylibrary.orgFrom
8
wild-type B cells activated by LPS in combination with IL-4, IFN-γ, or TGF-β1. All four
stimulation conditions led to detectable levels of Iγ2b and Iγ3 transcripts after 36 hours of treatment;
however, transcript levels were lower in sap-deficient B cells than in wild-type B cells (Fig. 6a).
Similarly, Iγ2a and Iα transcripts, which are clearly induced after three days of stimulation by IFN-γ
and TGF-β1, respectively, were found significantly lower in sap-deficient B cells than in wild-type
B cells (Fig. 6a). In addition, we analyzed the response of B cells following a more physiological
stimulation, anti-CD40 in combination with the three cytokines. All the aforementioned circular
transcripts were measured. Iγ2b and Iγ3 were undetectable (not shown). However, Iγ2a and Iα
transcripts were dramatically lower in anti-CD40+IFN-γ and anti-CD40+TGF-β1 stimulated sap-
deficient B cells as compared to wild-type B cells (Fig. 6b).
For personal use only. by guest on June 1, 2013. bloodjournal.hematologylibrary.orgFrom
9
Discussion
To study the role of SAP in the immune system, several laboratories including ours have generated
sap knockout mice.20,21,23 Although there are differences in the gene targeting strategies, all three
sap-deficient mice have basal Ig deficiencies. Previous investigations20,21 attributed the Ig
disregulation in sap-deficient mice to a defect in Th2 function. Following these studies, Cotty et al.
demonstrated that defective CD4+ T cell help is responsible for the lack of long-lived plasma cells
and memory B cells in sap-deficient mice,22 Hron et al. showed that only the T-dependent antibody
responses are impaired in sap-deficient mice,27 and more recently, Ma et al. reported the lack of
isotype-switched memory B cells in the peripheral blood of the XLP patients, which is associated
with defective IL-10 production by CD4+ T cells.36 However, whereas the T cell defect has been
unequivocally demonstrated, none of these studies have excluded the possibility of an intrinsic
functional defect in a subset of sap-deficient B cells. To address this question, we examined the B
cell compartment in sap-deficient mice. Purified small resting B cells were used to study in vitro Ig
production following stimulation with LPS and anti-CD40 in combination with IL-4, IFN-γ and
TGF-β1. We observed impaired IgG and IgA production in sap-deficient B cells, and we
demonstrated that this was not a result of either abnormal growth during the cell culture or altered
development of the major B cell sub-populations. Thus these data expand the role of SAP in
regulating cellular functions to include the B cell compartment. Consistent with our finding, a
recent study provides convincing evidence demonstrating the presence of defective B cell responses
in a sap-deficient background by adoptive transfer of wild-type and sap-deficient T and B cells.28
While some studies reported the absence of the SAP protein in B cell lysates,37,38 others showed that
SAP is expressed in B cells of the inter-follicular zone of the tonsil and lymph nodes of the
humans39 and in follicular GC B cells in the spleen and lymph nodes in humans4 or in the mouse.28
Moreover, it has been shown that the SAP protein is detectable in Hodgkin and non-Hodgkin
lymphoma, tonsillar B cells, some B cell lines, and Burkitt lymphoma cell lines.4,15,38,39 We
observed the expression of the sap mRNA and the SAP protein in B cells from wild-type mice,
although at very low levels (Fig. 2). We also showed that activation of wild-type, mature naïve B
cells by LPS in the presence of IL-4 down-regulates the transcript and the protein product of the sap
gene. This result indicates that SAP is a tightly controlled molecule, expressed transiently in
specific stage(s) of B cell differentiation. The exact subset of B cells expressing SAP and the
signaling pathways that are regulated by SAP in B cells remain to be elucidated. One plausible
model is that SAP regulates B cell function by interacting with SLAM, as engagement of SLAM in
B cells has been shown to enhance B-cell proliferation and Ig production.40 This is supported by the
result of Mikhalap et al., who showed that SAP and SLAM are co-expressed in B cells in the
For personal use only. by guest on June 1, 2013. bloodjournal.hematologylibrary.orgFrom

10
interfollicular zone.39 It is also possible that SAP interferes with B cell function through CD84
signaling, which is up-regulated in memory B cells and recruits SAP.8,9 Finally, all the SLAM
family members with the exception of 2B4 are expressed on B cells, and are therefore good
candidates for further investigation.
It is well established that LPS stimulation of B cells in the presence of cytokines can induce in vitro
isotype switching.41 Results in Fig. 4 demonstrate that sap-deficient B cells produce lower levels of
IgG2c, IgG2b, IgG3, and IgA in vitro than do wild-type B cells. This defect is not caused by
abnormal proliferation of sap-deficient B cells in response to the stimulation (Fig. 5); instead, it
reflects an impaired function of B cells. To exclude the possibility that the reduction in Ig
production of sap-deficient B cells was a result of a decrease in the number of memory B cells, we
used small resting B cells, which were principally B220+IgM+ (98%). The proportion of B220+IgM-
cells, which might represent the switched IgG+ or IgA+ cells, was very low and comparable in sap-
deficient and in wild-type B cell preparations. We also excluded the possibility that decreased Ig
production in sap-deficient B cells is due to a lower percentage of activated B cells before
stimulation, since percentages of the B220+CD43+ and B220+CD69+ populations are equally low in
sap-deficient and in wild-type B cells (Fig. 3). It is worth noting that the impairment of Ig
production in sap-deficient B cells is only partial. Consistent with our observations, Morra et al.
observed that while the follicular GC B cells are affected in sap-deficient mice, mature B cells
outside the GC and T-independent responses are normal.28 Therefore, one could speculate that the
absence of SAP leads to a defect in Ig class switch only in the subset of B cells expressing SAP and
that this defect is partially masked by the presence of functionally unaltered B cells in the total B
cell compartment.
To study the mechanism of the impaired Ig secretion, we measured the CSR rates in sap-deficient
and wild-type B cells to study the isotype switching process. After cytokine stimulation, CSR is
accompanied by looping-out DNA segments between the Cµ switch region and one of the
downstream switch regions of each CH gene, including its I promoter.34 Kinoshita et al. have shown
that the I promoter is active in the excised circular DNAs and directs the production of circular
transcripts, which are sensitive molecular markers of active CSR.34 We observed decreased levels of
Iγ2a, Iγ2b, Iγ3, and Iα circular transcripts in sap-deficient B cells stimulated with either LPS or anti-
CD40 in combination with IL-4, IFN-γ, or TGF-β1. This result indicates a defect in Ig class switch
in sap-deficient B cells, which is not Th1- or Th2-cytokine dependent. We further tested other
components of Ig transcriptional machinery, e.g. AID and T-bet, in sap-deficient mice. The
activation-induced cytidine deaminase (AID) gene is expressed in activated B cells and essential to
For personal use only. by guest on June 1, 2013. bloodjournal.hematologylibrary.orgFrom

11
both CSR and somatic hypermutation (SHM).42-44 The T-box transcription factor T-bet is involved
in IgG class switch, especially IgG2a, by regulating germ-line transcription.45,46 Interestingly, no
differences in AID and T-bet expression were observed between wild-type and sap-deficient B cells
(data not shown). Thus, other pathway(s), which remains to be determined, may be responsible for
the impaired Ig class switch in B cells from sap-deficient mice. In exploring the potential role for
SAP in CSR, one must consider the finding of Sylla et al., who demonstrated that the wild-type
form of the SAP protein has an affinity for Ku70 and Ku80 proteins,47 which are known to be
required for CSR.48,49 Therefore, one possibility is that SAP may be linked to some components of
the CSR machinery.
Taken together, the impaired in vitro Ig production in sap-deficient B cells and the decreased level
of CSR suggest a B cell dysfunction in sap-deficient mice in addition to the abnormal CD4+ T cell
help previously reported.20-22,27 Its presence in wild-type B cells further supports the concept that the
adaptor molecule SAP directly regulates B cell function. This significant finding may provide novel
insights into the pathology and/or mechanism of the XLP disease.
For personal use only. by guest on June 1, 2013. bloodjournal.hematologylibrary.orgFrom

12
Acknowledgements
This work is dedicated to our late colleague Jun Liang. We thank Dr Giovanni Romeo (IARC,
Lyon) for his encouragement and support, Mr Jean-Jacques Medard (IARC) for technical assistance,
Miss Lily Wang (IARC) and Dr Benoit Pasquier (Unité INSERM 429, Paris) for some of their
work, and Mrs Antoinette Trochard (IARC) for assistance in preparing the manuscript. We are
grateful to Drs Uzma Hasan, Eric Garcia (Schering-Plough, Dardilly, France), Mrs Francoise Le
Deist (INSERM 429) for help with FACS-sorting, and Drs Anne Durandy (INSERM 429), Bao
Vuong, and Paul Rothman (Columbia University, New York) for stimulating discussions and
critical reading of the manuscript.
For personal use only. by guest on June 1, 2013. bloodjournal.hematologylibrary.orgFrom

13
References
1. Purtilo DT, Cassel CK, Yang JP, Harper R. X-linked recessive progressive combined variable
immunodeficiency (Duncan's disease). Lancet. 1975;1:935-940.
2. Seemayer TA, Gross TG, Egeler RM, et al. X-Linked lymphoproliferative disease: twenty-five
years after the discovery. Pediatr Res. 1995;38:471-478.
3. Coffey AJ, Brooksbank RA, Brandau O, et al. Host response to EBV infection in X-linked
lymphoproliferative disease results from mutations in an SH2-domain encoding gene. Nat Genet.
1998;20:129-135.
4. Nichols KE, Harkin DP, Levitz S, et al. Inactivating mutations in an SH2 domain-encoding gene in
X-linked lymphoproliferative syndrome. Proc Natl Acad Sci USA. 1998;95:13765-13770.
5. Sayos J, Wu C, Morra M, et al. The X-linked lymphoproliferative-disease gene product SAP
regulates signals induced through the co-receptor SLAM. Nature. 1998;395:462-469.
6. Tangye SG, Lazetic S, Woollatt E, Sutherland GR, Lanier LL, Phillips JH. Cutting edge: human
2B4, an activating NK cell receptor, recruits the protein tyrosine phosphatase SHP-2 and the
adaptor signaling protein SAP. J Immunol. 1999;162:6981-6985.
7. Bottino C, Falco M, Parolini S, et al. GNTB-A, a novel SH2D1A-associated surface molecule
contributing to the inability of natural killer cells to kill Epstein-Barr virus-infected B cells in X-linked
lymphoproliferative disease. J Exp Med. 2001;194:235-246.
8. Sayos, J, Martin M, Chen A, et al. Cell surface receptors Ly-9 and CD84 recruit the X-linked
lymphoproliferative disease gene product SAP. Blood. 2001;97:3867-3874.
9. Tangye SG, van de Weerdt BC, Avery DT, Hodgkin PD. CD84 is up-regulated on a major
population of human memory B cells and recruits the SH2 domain containing proteins SAP and
EAT-2. Eur J Immunol. 2002;32:1640-1649.
10. Fraser CC, Howie D, Morra M, et al. Identification and characterization of SF2000 and SF2001,
two new members of the immune receptor SLAM/CD2 family. Immunogenetics. 2002;53:843-850.
For personal use only. by guest on June 1, 2013. bloodjournal.hematologylibrary.orgFrom

14
11. Li C, Iosef C, Jia CY, Han VK, Li SS. Dual functional roles for the XLP syndrome gene product
SAP/SH2D1A in signaling through the SLAM family of immune receptors. J Biol Chem.
2003;278:3852-3859.
12. Latour S, Gish G, Helgason CD, Humphries RK, Pawson T, Veillette A. Regulation of SLAM-
mediated signal transduction by SAP, the X-linked lymphoproliferative gene product. Nat Immunol.
2001;2:681-690.
13. Latour S, Roncagalli R, Chen R, et al. Binding of SAP SH2 domain to FynT SH3 domain
reveals a novel mechanism of receptor signalling in immune regulation. Nat Cell Biol. 2003;5:149-
154.
14. Chan B, Lanyi A, Song HK, et al. SAP couples Fyn to SLAM immune receptors. Nat Cell Biol.
2003;5:155-160.
15. Shlapatska LM, Mikhalap SV, Berdova AG, et al. CD150 association with either the SH2-
containing inositol phosphatase or the SH2-containing protein tyrosine phosphatase is regulated by
the adaptor protein SH2D1A. J Immunol. 2001;166:5480-5487.
16. Yin L, Ferrand V, Lavoué MF, et al. SH2D1A mutation analysis for diagnosis of XLP in typical
and atypical patients. Hum Genet. 1999;105:501-505.
17. Sumegi J, Huang D, Lanyi A, et al. Correlation of mutations of the SH2D1A gene and epstein-
barr virus infection with clinical phenotype and outcome in X-linked lymphoproliferative disease.
Blood. 2000;96:3118-3125.
18. Morra M, Simarro-Grande M, Martin M, et al. Characterization of SH2D1A missense mutations
identified in X-linked lymphoproliferative disease patients. J Biol Chem. 2001;276:36809-36816.
19. Latour S, Veillette A. Molecular and immunological basis of X-linked lymphoproliferative
disease. Immunol Rev. 2003;192:212-224.
20. Wu C, Nguyen KB, Pien GC, et al. SAP controls T cell responses to virus and terminal
differentiation of TH2 cells. Nat Immunol. 2001;2:410-414.
For personal use only. by guest on June 1, 2013. bloodjournal.hematologylibrary.orgFrom

15
21. Czar MJ, Kersh EN, Mijares LA, et al. Altered lymphocyte responses and cytokine production in
mice deficient in the X-linked lymphoproliferative disease gene SH2D1A/DSHP/SAP. Proc Natl Acad
Sci USA. 2001;98:7449-7454.
22. Crotty S, Kersh EN, Cannons J, Schwartzberg PL, Ahmed, R. SAP is required for generating
long-term humoral immunity. Nature. 2003;421:282-287.
23. Yin L, Al-Alem U, Liang J, et al. Mice deficient in the X-linked lymphoproliferative gene sap
exhibit increased susceptibility to murine gammaherpesvirus-68 and hypo-gammaglobulinemia. J
Med Virol. 2003;71:446-455.
24. Pasquier B, Yin L, Fondaneche MC, et al. Defective NKT cell development in mice and humans
lacking the adapter SAP, the X-linked lymphoproliferative syndrome gene product. J Exp Med.
2005;201:695-701.
25. Chung B, Aoukaty A, Dutz J, Terhorst C, Tan R. Cutting edge: Signaling lymphocytic
activation molecule-associated protein controls NKT cell functions. J Immunol. 2005;174:3153-
3157.
26. Nichols KE, Hom J, Gong SY, et al. Regulation of NKT cell development by SAP, the protein
defective in XLP. Nat Med. 2005;11:340-345.
27. Hron JD, Caplan L, Gerth AJ, Schwartzberg PL, Peng SL. SH2D1A regulates T-dependent
humoral autoimmunity. J Exp Med. 2004;200:261-266.
28. Morra M, Barrington RA, Abadia-Molina AC, et al. Defective B cell responses in the absence
of SH2D1A. Proc Natl Acad Sci USA. 2005;102:4819-4823
29. Pioli C, Gatta L, Ubaldi V, Doria G. Inhibition of IgG1 and IgE production by stimulation of the
B cell CTLA-4 receptor. J Immunol. 2000;165:5530-5536.
30. Varnum-Finney B, Xu L, Brashem-Stein C, et al. Pluripotent, cytokine-dependent,
hematopoietic stem cells are immortalized by constitutive Notch1 signaling. Nat Med. 2000;6:1278-
1281.
For personal use only. by guest on June 1, 2013. bloodjournal.hematologylibrary.orgFrom

16
31. Mond JJ, Brunswick M. Assays for B cell function. In: Coligan, JE, Kruisbeek AM, Margulies
DH, Shevach EM, Strober W, eds. Current Protocols in Immunology. Vol 1. New York, PA: John
Wiley & Sons, Inc.; 1991.
32. Snapper CM, Rosas FR, Zelazowski P, et al. B cells lacking relB are defective in proliferative
responses, but undergo normal B cell maturation to Ig secretion and Ig class switching. J Immunol.
1996; 184:1537-1541.
33. Martin RM, Brady JL, Lew AL. The need for IgG2c specific antiserum when isotyping
antibodies from C57BL/6 and NOD mice. J Immunol Meth. 1998; 212:187-192.
34. Kinoshita K, Harigai M, Fagarasan S, Muramatsu M, Honjo T. A hallmark of active class
switch recombination: transcripts directed by I promoters on looped-out circular DNAs. Proc Natl
Acad Sci USA. 2001;98:12620-12633.
35. Hardy RR, Li YS, Allman D, Asano M, Gui M, Hayakawa K. B-cell commitment, development and selection. Immunol Rev. 2000; 175:23-32.
36. Ma CS, Hare NJ, Nichols KE, et al. Impaired humoral immunity in X-linked lymphoproliferative
disease is associated with defective IL-10 production by CD4+ T cells. J Clin Invest. 2005;115:1049-
1059.
37. Gilmour K, Cranston CT, Jones A, et al. Diagnosis of X-linked lymphoproliferative disease by
analysis of SLAM-associated protein expression. Eur J Immunol. 2000;30:1691-1697.
38. Nagy N, Cerboni C, Mattsson K, et al. SH2D1A and SLAM protein expression in human
lymphocytes and derived cell lines. Int J Cancer. 2000;88:439-447.
39. Mikhalap SV, Shlapatska LM, Yurchenko OV, et al. The adaptor protein SH2D1A regulates
signaling through CD150 (SLAM) in B cells. Blood. 2004;104:4063-4070.
40. Punnonen J, Cocks BG, Carballido JM, et al. Soluble and membrane-bound forms of signaling
lymphocytic activation molecule (SLAM) induce proliferation and Ig synthesis by activated human B
lymphocytes. J Exp Med. 1997;185:993-1004.
For personal use only. by guest on June 1, 2013. bloodjournal.hematologylibrary.orgFrom

17
41. Snapper CM, Mond JJ. Towards a comprehensive view of immunoglobulin class switching.
Immunol Today. 1993;14:15-17.
42. Muramatsu M, Sankaranand VS, Anant S, et al. Specific expression of activation-induced
cytidine deaminase (AID), a novel member of the RNA-editing deaminase family in germinal
center B cells. J Biol Chem. 1999;274:18470-18476.
43. Muramatsu M, Kinoshita K, Fagarasan S, Yamada S, Shinkai Y, Honjo T. Class switch
recombination and hypermutation require activation-induced cytidine deaminase (AID), a potential
RNA editing enzyme. Cell. 2000;102:553-563.
44. Revy P. Muto T, Levy Y, et al. Activation-induced cytidine deaminase (AID) deficiency causes
the autosomal recessive form of the Hyper-IgM syndrome (HIGM2). Cell. 2000;102:565-575.
45. Peng SL, Szabo SJ, Glimcher LH. T-bet regulates IgG class switching and pathogenic
autoantibody production. Proc Natl Acad Sci USA. 2002;99:5545-5550.
46. Szabo SJ, Kim ST, Costa GL, Zhang X, Fathman CG, Glimcher LH. A novel transcription
factor, T-bet, directs Th1 lineage commitment. Cell. 2000;100:655-669.
47. Sylla BS, Murphy K, Cahir-McFarland E, Lane WS, Mosialos G, Kieff E. The X-linked
lymphoproliferative syndrome gene product SH2D1A associates with p62dok (Dok1) and activates NF-
κB. Proc Natl Acad Sci USA. 2000;97:7470-7475.
48. Manis JP, Gu Y, Lansford R, et al. Ku70 is required for late B cell development and
immunoglobulin heavy chain class switching. J Exp Med. 1998;187:2081–2089.
49. Casellas R, Nussenzweig A, Wuerffel R, et al. Ku80 is required for immunoglobulin isotype
switching. EMBO J. 1998;17:2404–2411.
For personal use only. by guest on June 1, 2013. bloodjournal.hematologylibrary.orgFrom

18
Legends
Figure 1. B cell sub-populations in the bone marrow (a), spleen (b), and peritoneal cavity (c).
a, Percentages of gated cells or percentages of each fraction by Hardy classification35 (A, B, C, and
C’) are indicated. b and c, Percentages of different B cell sub-populations are indicated in the
quadrants.
Figure 2. Expression of SAP in B cells. a, Expression of the sap transcript. RT-PCR products with
primers 91U and 457L23 from 1µg of total RNA extracted from the following cells: thymocytes (T),
splenocytes (S), sorted CD3+ cells (CD3), sorted CD19+ cells (B1), negatively selected B cells,
unstimulated (B2), and stimulated by LPS+IL-4 for 3 days (D3) and 6 days (D6) respectively. Mouse
fibroblast cell line NIH 3T12 (F) and mouse neuroblastoma cell line Neuro 2A (N) were used as
negative controls for sap expression. The transcript of the mouse β–actin gene was used as the
amplification control, and the transcript of mouse CD3 as the purity control of the enriched B cells. b,
Expression of the SAP protein. Upper part, SAP protein detected from thymocytes (T), splenocytes
(S), T cells selected by Dynal beads (Tcell), negatively selected B cells, unstimulated (B), and
stimulated with LPS+IL-4 for 6 hr (6h), 18 hr (18h), 3 days (D3) and 6 days (D6), respectively; lower
part, SAP protein detected from negatively selected wild-type B cells (B cells SAP+) and from
negatively selected sap-deficient B cells (B cells SAP-) mixed with wild-type T cells mimicking
various percentages of T cells contamination. The same amount of cell extract (0.5 mg protein) was
immunoprecipited by anti-SAP antibody and the Western blot was hybridized with the same anti-SAP
antibody
Figure 3. Purity of the isolated small resting B cell preparations. Left column, wild-type B cells
(sap+); right column, sap-deficient B cells (sap-). Percentage of cells positive for selected surface
markers is indicated in each quadrant.
Figure 4. Aberrant Ig production by sap-deficient B cells after in vitro activation. Small resting
B cells from wild-type (open circles) and from sap-deficient mice (filled circles) were stimulated for
6 days with LPS plus different cytokines as indicated. Each circle represents the concentration
(µg/ml) of secreted Ig in the supernatant of the cells stimulated by the given culture condition. The
average value of each isotype is indicated by a horizontal bar. Student T test *P<0.05.
Figure 5. Proliferation rates of the stimulated wild-type and sap-deficient B cells. Open and
filled columns represent the wild-type and sap-deficient B cells, respectively. Cells were cultured
For personal use only. by guest on June 1, 2013. bloodjournal.hematologylibrary.orgFrom

19
for 3 days or 6 days. Average values (CPM) of incorporated [3H]-thymidine, ± standard deviations,
are shown. A similar pattern was observed in three other independent experiments.
Figure 6. Circular transcripts generated by activated B cells. (a) Circular transcripts detected
after LPS plus cytokine stimulation. Iγ2b, Iγ3 were analyzed after 36 hrs’ stimulation; Iγ2a and Iα
after 3 days. (b) Iγ2a and Iα production after 3 days of stimulation with anti-CD40 plus cytokine.
RT-PCR products were amplified from 1µg of total RNA extracted from stimulated cells. The same
patterns were observed in at least three independent experiments. LB, large activated B cells
isolated by centrifugation on the Percoll gradient; SB, small resting B cells purified by Percoll
gradient; the remaining samples were from small resting B cells stimulated in vitro. W, wild-type B
cells; M, sap-deficient B cells. The transcript of the mouse β–actin gene was used as the
amplification control.
For personal use only. by guest on June 1, 2013. bloodjournal.hematologylibrary.orgFrom

/-
92.2
0.63
0.43 92.1
0.42
0.84
78.1
0.02
14.7 77.4
0.25
15.2
0.26
0.28
91.8 0.43
0.12
92.7
66.6
0.11
26.3 68.7
0.07
24.4
3
0
% of total cells in bone marrow
sap+ sap-
4
BP-1 C C’
BA
30.09.6 10.9
44.9
% of gated B220+/CD43+ cells
8.57.930.248.8
Fig. 1
(a)
(b)
(c)
sap+ sap-
sap+ sap-
3.6
CD
CD21/35-FITC
7.2 8.6
sap+
sap-
49.5 24.0
16.7
23.956.0
11.6
For personal use only. by guest on June 1, 2013. bloodjournal.hematologylibrary.orgFrom
CD2135FITC
CD21/35-FITC
23-
CD4
B22
CD23-
4.9
42.6
CD21/35-FITC
45.6
CD2
20

21
(a) LPS+IL-4
T S CD3 B1 B2 D3 D6 F N
LPS + IL-4T S Tcell B 6h 18h D3 D6
(b)
SAP
sap
β-actin
Fig. 2
B cells B cells SAP+ T cells SAP+ SAP- 1% 2% 4%
CD3
SAP
For personal use only. by guest on June 1, 2013. bloodjournal.hematologylibrary.orgFrom
22
sap+ sap-
90.0
0.71
1.9 90.7
0.50
2.0
4.1
1.6
86.6 87.73.6
1.3
1.6
91.5
0.04 1.7
93.4
0.10
2.4
90.7
5.4 2.13.9
92.9
0.19
0.19
0.57 0.16
0.19
0.16
Fig. 3
For personal use only. by guest on June 1, 2013. bloodjournal.hematologylibrary.orgFrom

23
IgG1
0
0.2
0.4
0.6
0.8
1
1.2
1.4
IgG2c
0
0.5
1
1.5
2
2.5
IgG2
0
0.5
1
1.5
2
2.5
3
IgG3
0
0.1
0.2
0.3
0.4
0.5
0.6
IgM
0
0.5
1
1.5
2
2.5
3
3.5
4
IgE
0
1
2
3
4
5
6
7
8
9
IgA
0
0.2
0.
0.7
1
LPS+IL-4Med LPS LPS+IFN-γ LPS+TGF-β1
Med LPS LPS+IFN-γLPS+IL-4
Med LPS LPS+IFN-γLPS+IL-4
*
*
*
*
*
*
Fig. 4
For personal use only. by guest on June 1, 2013. bloodjournal.hematologylibrary.orgFrom

24
Fig. 5
0
5000
1000
1500
sap
day 3
0
1000
2000
3000
4000
5000
day 6
Medium - +IL-4 +IFN +TGFLPS
sap-CP
For personal use only. by guest on June 1, 2013. bloodjournal.hematologylibrary.orgFrom

Unstimulated LPS LB SB - +IL-4 +IFN-γ +TGF-β1W M W M W M W M W M W M
Fig. 6
a(a)
a
αCD40 - +IL-4 +IFN-γ +TGF-β1
W M W M W M W M
(b)
For personal use only. by guest on June 1, 2013. bloodjournal.hematologylibrary.orgFrom
Iγ2
α
IIγ3
Iγ2b
n
β-actiIγ2
Iα
β-actin
25