Impacts of Fault Diagnosis Schemes on Distribution System Reliability
8
720 IEEE TRANSACTIONS ON SMART GRID, VOL. 3, NO. 2, JUNE 2012 Impacts of Fault Diagnosis Schemes on Distribution System Reliability Shahram Kazemi, Member, IEEE, Matti Lehtonen, and Mahmud Fotuhi-Firuzabad, Senior Member, IEEE Abstract—Design and development of fault diagnosis schemes (FDS) for electric power distribution systems are major steps in realizing the self-healing function of a smart distribution grid. The application of the FDS in the electric power distribution systems is mainly aimed at precise detecting and locating of the deteriorated components, thereby enhancing the quality and reliability of the electric power delivered to the customers. The impacts of two types of the FDS on distribution system reliability are compared and pre- sented in this paper. The first type is a representative of the FDS which diagnoses the deteriorated components after their failing. However, the second type is a representative of the FDS which can diagnose the failing components prior to a complete breakdown and while still in the incipient failure condition. To provide quanti- tative measures of the reliability impacts of these FDS, the compar- ative and sensitivity case studies are conducted on a typical Finnish urban distribution network. Index Terms—Fault diagnosis schemes, fault management, power distribution system, reliability assessment, smart grid. I. NOMENCLATURE ASUI Average system unavailability index. ECOST Expected cost of the power interruptions imposed on the customers. EENS Expected energy not supplied. FDS Fault diagnosis schemes. FMA Fault management activities. NCS Total number of the cable sections in the distribution network under study. PAFR Average share of the passive failure events in the total failure events of the cable sections PARR Average ratio of the time required for repairing the passively failed cable sections to that required for repairing the actively failed cable sections. Manuscript received February 21, 2011; revised June 06, 2011; accepted November 05, 2011. Date of publication February 29, 2012; date of current version May 21, 2012. This work was supported in part by the Fortum Foun- dation in Finland under Grant B2-11-032. Paper no. TSG-00054-2011. S. Kazemi is with the Departments of Electrical Engineering at Sharif Univer- sity of Technology, Tehran, Iran, and Aalto University, Espoo, Finland (e-mail: [email protected]). M. Lehtonen is with the Department of Electrical Engineering at Aalto Uni- versity, Espoo, Finland (e-mail: matti.lehtonen@aalto.fi). M. Fotuhi-Firuzabad is with the Department of Electrical Engineering at Sharif University of Technology, Tehran, Iran (e-mail: [email protected]). Color versions of one or more of the figures in this paper are available online at http://ieeexplore.ieee.org. Digital Object Identifier 10.1109/TSG.2011.2176352 PFDS Proactive fault diagnosis schemes. RFDS Reactive fault diagnosis schemes. SAIDI System average interruption duration index. SAIFI System average interruption frequency index. SGS Smart grid simulator. Time required to repair the cable section number , when it encounters with an active failure condition. Time required to repair the cable section number , when it encounters with a passive failure condition. Active failure rate of the cable section number . Passive failure rate of the cable section number . II. INTRODUCTION E LECTRIC utilities have traditionally performed the fault diagnosis activities based on the customers’ outage calls. Upon receiving the trouble calls from the customers, the op- erators look at the network configuration map and the protec- tion design manual to determine the outage area. Then, a repair crew has to be sent to patrol the outage area. When faced with a tripped circuit breaker and no indication as to where the fault lies, a repair crew has a range of options by which the faulted section is identified. In a manually operated distribution net- work, either “feeder splitting and fault reignition method” or “feeder splitting and insulation test method” can be used for finding the faulted section. The diagnosis of the fault in these manners can be an unsafe, rigorous and time-consuming task, which finally results in the poor quality and reliability of electric power delivered to the customers. In order to overcome these is- sues, various types of the FDS have been developed across the globe [1]. Some of the FDS mainly work based on the mea- surements of voltages and currents signals provided by devices such as the fault passage indicators installed along the distri- bution feeders [2]–[4]. Other FDS normally operate based on algorithms that use measurements of voltages and currents sig- nals provided by intelligent electronic devices located at a main substation [5]–[7]. The majority of the FDS which have been de- veloped over the past two decades are mainly RFDS [1]. These schemes diagnose the failed component after a complete break- down condition and following the reaction of protective devices 1949-3053/$31.00 © 2012 IEEE
-
Upload
independent -
Category
Documents
-
view
4 -
download
0
Transcript of Impacts of Fault Diagnosis Schemes on Distribution System Reliability
720 IEEE TRANSACTIONS ON SMART GRID, VOL. 3, NO. 2, JUNE 2012
Impacts of Fault Diagnosis Schemes on DistributionSystem Reliability
Shahram Kazemi, Member, IEEE, Matti Lehtonen, and Mahmud Fotuhi-Firuzabad, Senior Member, IEEE
Abstract—Design and development of fault diagnosis schemes(FDS) for electric power distribution systems are major steps inrealizing the self-healing function of a smart distribution grid. Theapplication of the FDS in the electric power distribution systems ismainly aimed at precise detecting and locating of the deterioratedcomponents, thereby enhancing the quality and reliability of theelectric power delivered to the customers. The impacts of two typesof the FDS on distribution system reliability are compared and pre-sented in this paper. The first type is a representative of the FDSwhich diagnoses the deteriorated components after their failing.However, the second type is a representative of the FDS which candiagnose the failing components prior to a complete breakdownand while still in the incipient failure condition. To provide quanti-tative measures of the reliability impacts of these FDS, the compar-ative and sensitivity case studies are conducted on a typical Finnishurban distribution network.
Index Terms—Fault diagnosis schemes, fault management,power distribution system, reliability assessment, smart grid.
I. NOMENCLATURE
ASUI Average system unavailability index.
ECOST Expected cost of the power interruptionsimposed on the customers.
EENS Expected energy not supplied.
FDS Fault diagnosis schemes.
FMA Fault management activities.
NCS Total number of the cable sections in thedistribution network under study.
PAFR Average share of the passive failure events inthe total failure events of the cable sections
PARR Average ratio of the time required forrepairing the passively failed cable sections tothat required for repairing the actively failedcable sections.
Manuscript received February 21, 2011; revised June 06, 2011; acceptedNovember 05, 2011. Date of publication February 29, 2012; date of currentversion May 21, 2012. This work was supported in part by the Fortum Foun-dation in Finland under Grant B2-11-032. Paper no. TSG-00054-2011.S. Kazemi is with the Departments of Electrical Engineering at Sharif Univer-
sity of Technology, Tehran, Iran, and Aalto University, Espoo, Finland (e-mail:[email protected]).M. Lehtonen is with the Department of Electrical Engineering at Aalto Uni-
versity, Espoo, Finland (e-mail: [email protected]).M. Fotuhi-Firuzabad is with the Department of Electrical Engineering at
Sharif University of Technology, Tehran, Iran (e-mail: [email protected]).Color versions of one or more of the figures in this paper are available online
at http://ieeexplore.ieee.org.Digital Object Identifier 10.1109/TSG.2011.2176352
PFDS Proactive fault diagnosis schemes.
RFDS Reactive fault diagnosis schemes.
SAIDI System average interruption duration index.
SAIFI System average interruption frequency index.
SGS Smart grid simulator.
Time required to repair the cable sectionnumber , when it encounters with an activefailure condition.
Time required to repair the cable sectionnumber , when it encounters with a passivefailure condition.
Active failure rate of the cable section number.
Passive failure rate of the cable sectionnumber .
II. INTRODUCTION
E LECTRIC utilities have traditionally performed the faultdiagnosis activities based on the customers’ outage calls.
Upon receiving the trouble calls from the customers, the op-erators look at the network configuration map and the protec-tion design manual to determine the outage area. Then, a repaircrew has to be sent to patrol the outage area. When faced witha tripped circuit breaker and no indication as to where the faultlies, a repair crew has a range of options by which the faultedsection is identified. In a manually operated distribution net-work, either “feeder splitting and fault reignition method” or“feeder splitting and insulation test method” can be used forfinding the faulted section. The diagnosis of the fault in thesemanners can be an unsafe, rigorous and time-consuming task,which finally results in the poor quality and reliability of electricpower delivered to the customers. In order to overcome these is-sues, various types of the FDS have been developed across theglobe [1]. Some of the FDS mainly work based on the mea-surements of voltages and currents signals provided by devicessuch as the fault passage indicators installed along the distri-bution feeders [2]–[4]. Other FDS normally operate based onalgorithms that use measurements of voltages and currents sig-nals provided by intelligent electronic devices located at a mainsubstation [5]–[7]. Themajority of the FDSwhich have been de-veloped over the past two decades are mainly RFDS [1]. Theseschemes diagnose the failed component after a complete break-down condition and following the reaction of protective devices
1949-3053/$31.00 © 2012 IEEE
KAZEMI et al.: IMPACTS OF FAULT DIAGNOSIS SCHEMES ON DISTRIBUTION SYSTEM RELIABILITY 721
against the over-current faults and other similar abnormal situa-tions. Although the fault diagnosis activities can now be accom-plished faster andmore precisely than before, but the componentfailures still result in extensive outages, substantial expensiveequipment repair and replacement, and unsafe conditions forthe public. However, regardless of some failure modes of thecomponents that are unavoidable (such as accidents), there aremany other failure modes of the components that often developover days to months before a complete breakdown occurs [8].This fact has been the basic idea for developing the PFDS [9],[10]. Using the PFDS, the failing components can be detectedwhile still in their incipient failure conditions. As a result, a re-pair crew can be dispatched to repair or replace the failing com-ponent, before a complete breakdown occurs. Hence, not onlythe quality and reliability of electric power delivered to the cus-tomers are improved but also the substantial expensive equip-ment repair and replacement and possible unsafe conditions canbe mitigated.Although many techniques and formulas have been purposed
in the literatures for developing the FDS, but always there hasbeen a lack of well documented materials related to the relia-bility impacts of such automation schemes. This issue has beenthe main motivation for developing this paper. It aims to com-pare the effects of representatives of the RFDS and the PFDSon the distribution system reliability. The paper is organized asfollows. After this introduction, the reliability evaluation proce-dure is discussed in Section III. Next, in Section IV, the resultsof comparative and sensitivity case studies which have beenconducted on a typical Finnish urban distribution network arepresented and discussed. Finally, a conclusion is provided inSection V.
III. RELIABILITY EVALUATION PROCEDURE
When comparing various reliability improvement measures,it is necessary to perform a course of quantitative reliability as-sessment studies in the related decision making process. In suchstudies, the processes that are followed for managing the faultednetwork can affect the approach to these studies. When an elec-tric power distribution network encounters a fault condition,specific activities designated as fault management activities arerequired to be carried out. Typical FMA involve the followingprocesses [11]:— protection system reaction;— fault notification;— approximate fault location;— decision making;— repair crew dispatching and traveling;— patrolling;— fault isolation;— service restoration;— repair or replacement;— return to normal operation.Distribution system reliability assessment is not a difficult
task as long as the detailed modeling of the FMA is not re-quired to be considered in the related analyses. However, thereliability evaluation procedure is complicated when the proce-dures involved in the FMA are altered due to the characteristics
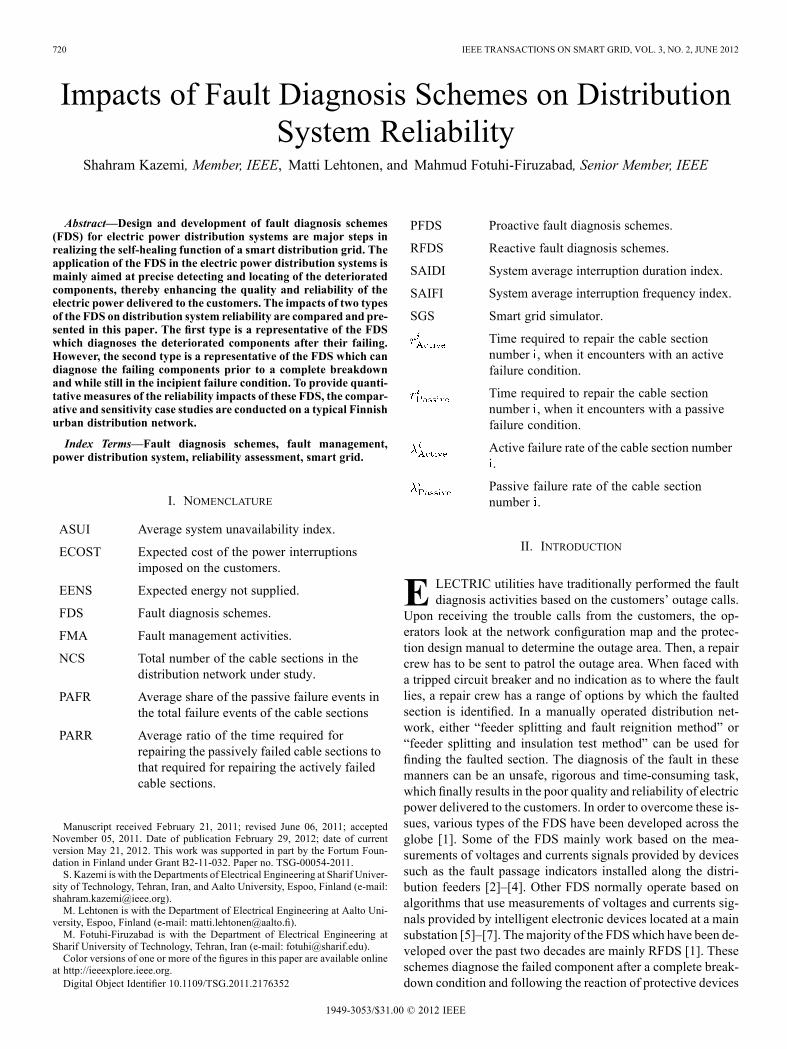
Fig. 1. A three-state Markov model for representing the failure modes of acomponent of an electric power distribution network.
of implemented solutions. An electric utility can invest on a spe-cific automation scheme to perform one or some of the FMA inmore efficient manner compared to what they have been doingso far. The current paper is mainly dealing with two automationschemes that have been developed and implemented in the realfields for automating two stages of the FMA, namely fault no-tification and approximate fault location activities. Employingeither one of these automation schemes will affect the proce-dures of electric utilities for performing the FMA. As a result,in this situation, the detailed reliability modeling of the FMA isrequired to gain the desired results. In addition, a suitable reli-ability model should be used for representing the failure modesof the components. A three-state Markov model has been de-veloped by the authors for reliability studies concerned in thispaper, as shown in Fig. 1.In the model shown in Fig. 1, the “Full-Up State” represents
the normal operating status of a component. In contrast, the“Breakdown State” and the “Degradation State” represent thefailure conditions. The breakdown state corresponds to an ac-tive failure situation in which the component encounters with asevere damage. Therefore, it is de-energized by means of pro-tection devices and forced to the outage condition. On the otherhand, the degradation state represents the passive failure sit-uation at which the component malfunctions, but the damageis still in the incipient condition and needs more time to com-pletely breakdowns. The component leaves its normal operatingstate to either the active failure state or the passive failure stateby rates equal to and , respectively. A pas-sively failed component will finally become an actively failedcomponent if the necessary repair or replacement activities arenot carried out well in advance. This phenomenon has been rep-resented by the transition rate in the model shown inFig. 1. The time periods required for returning a component toits normal operating status, when it is either in the active failurestate or the passive failure state, may not be the same. Therefore,two different repair or replacement rates have been assigned tothe failure states, i.e., and . The parameters ofthe proposed model can be estimated from the statistical anal-ysis of the failure cause of components and engineering prac-tices.
722 IEEE TRANSACTIONS ON SMART GRID, VOL. 3, NO. 2, JUNE 2012
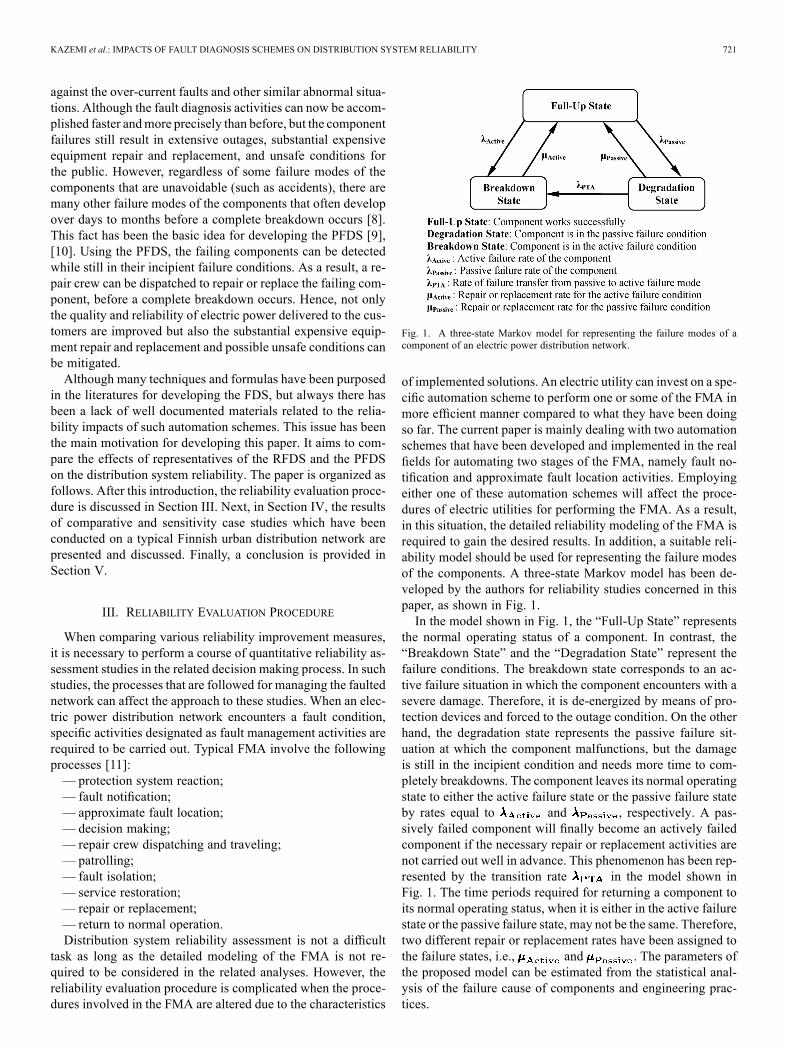
Fig. 2. Single-line diagram of a typical Finnish urban distribution networkwhich is used as a test system for quantitative reliability assessment studies.
A software package designated as “Smart Grid Simulator”(SGS) is used for directing the reliability case studies concernedin this paper. The SGS has been developed by the first authorto simulate the issues related to the smart grids. The reliabilityassessment module of the SGS mainly relies on the reliabilityevaluation techniques which have been already developed bythe authors in this area, e.g., [11]–[13]. More detailed infor-mation about the reliability evaluation techniques underlyingthe SGS can be found in [14]. Failure modes of each compo-nent of the network under study are simulated in the SGS. Foreach failure mode, the detailed reactions of protection and au-tomation schemes and their impacts on the different stages ofthe FMA are evaluated automatically. As a result, the time pe-riods required for accomplishing each step of the FMA andman-ners in which different load points have been affected are deter-mined. Based on these outcomes, the SGS calculates the relia-bility indices.
IV. STUDY RESULTS
A typical Finnish urban distribution network is used in thispaper as a test system for quantitative reliability assessmentstudies. The single-line diagram of the test system is shown inFig. 2. Table I contains the basic data of this test system. Moredetailed information about this test system can be found in [14].There are 144 distribution substations (20/0.4 kV) in this net-work which are supplied through 6 underground cable feedersoriginated from a subtransmission substation (110/20 kV).In order to assess the reliability performance of the test
system when the RFDS and the PFDS are employed, thefollowing cases are considered in the analyses:1) Case 1: The base case which aims to show the reliability
performance of the test system when there is no automationscheme for health monitoring of the network components. In
TABLE IBASIC DATA OF THE TEST SYSTEM
this situation, upon a component failure, the power interrup-tions are notified by the network operators through outage callsreceived from the customers. Then repair crews are sent to theoutage area. They halve the downstream sections of the operatedcircuit breaker by opening a suitable switching device. Then aninsulation test is performed to determine whether the fault is lo-cated upstream of the opened switching device or vice versa.This trial-and-error process is repeated until the faulted sectionis found. Then, the faulted section is isolated and the power ser-vice is restored for other healthy sections of the network throughthe proper switching actions. By the time these tasks are accom-plished, the precise fault location and the repair or replacementactivities are carried out. Finally, the network is returned to itsnormal operating status.2) Case 2: This case represents a situation when a typical
RFDS is implemented in the test system. The scheme proposedin [2] is used for such a purpose. This scheme has been devel-oped for detecting and locating a faulted cable section in theunderground cable distribution networks. When employing thisscheme on the test system, although a fault still results in thecircuit breaker operation and hence power interruption for cus-tomers, but the faulted cable section can be detected and locatedautomatically. As a result, the repair crews can be sent directlyto the faulted area. Then, the faulted cable section is isolatedand the power service is restored for other healthy sections ofthe network through the proper switching actions. After accom-plishing these tasks, the precise fault location and the repair ac-tivities are carried out. Finally, the network is returned to itsnormal operating status.3) Case 3: This case represents a situation when a typical
PFDS is implemented in the test system. The PFDS proposedin [10] is used for such a purpose, as its infrastructure has closesimilarities with the scheme used for Case 2. This schemeis capable of detecting and locating both active and passivefailure modes of the underground cable sections. The partialdischarges of the cable sections are monitored continuouslyin this scheme. Therefore, the passively failed cable sectionscan be detected and located automatically before they result inthe circuit breaker operation. As a result, it might be possibleto reconfigure the network such that the impacts on the cus-tomers due to ongoing fault isolation and repair activities areminimized. The efficiency of this scheme is considered to be

KAZEMI et al.: IMPACTS OF FAULT DIAGNOSIS SCHEMES ON DISTRIBUTION SYSTEM RELIABILITY 723
Fig. 3. Expected annual interruption frequencies (occ/yr) of distribution substations of the test system for different case studies (Note: Cases 1 and 2 have thesimilar results and hence they have been overlapped).
TABLE IIBASIC DATA FOR PERFORMING THE FMA IN EACH CASE STUDY
about 80% [10] and is defined as the ratio of passive failureevents that have been detected by the FDS over the total passivefailure events. Obviously, this parameter is equal to zero forCases 1 and 2.The basic data required for performing the FMA in the above
described case studies are assumed according to Table II. Thetypical data provided in Table II are based on the engineeringjudgments, the characteristics of the implemented FDS and alsoconsulting with some experts in this area.
The above described FDS have been developed for di-agnosing the cable faults. Therefore, to have a reasonablecomparison between these case studies, the reliability studiesconcerned in this paper are concentrated on the cable failureevents and the other components of the test system are assumedto be fully reliable. It is assumed that about 20% of the cablefailure events are active failures. In addition, the time requiredfor accomplishing the actual repair activities on a passivelyfailed cable section is also assumed to be the same as the casewhen it encounters with an active failure condition. However,the impacts of these two parameters are further analyzed laterin the paper.Figs. 3–5 respectively show the expected annual interruption
frequency, the expected annual interruption duration and the ex-pected annual interruption cost indices of the distribution sub-stations of the test system.As expected, when employing either the RFDS or the PFDS,
the reliability performance of the test system is improved. How-ever, these improvements are more dominants in Case 3 com-pared to those of Case 2. As it can be seen from Fig. 3, em-ploying the RFDS in Case 2 has no impact on the interrup-tion frequencies of the distribution substations of the test systemcompare to the base case study (Case 1).However, the interruption frequencies of the distribution sub-
stations of the test system decrease when employing the PFDSin Case 3. Actually, neither the protection system nor the RFDSimplemented in Case 2 can detect the passively failed cable sec-tions. As a result, after a period of time, the passively failedcable sections will suffer a complete breakdown. By the timethis occurs, the protection system reacts against this failure con-dition which results in the power interruption for the customers.Only after accomplishing this process, the faulted cable sectioncan be detected and located by the RFDS implemented in Case2.Figs. 4 and 5 show that employing the FDS in Case 2 and
Case 3 have reduced the effects of cable faults on annual inter-ruption durations and also annual interruption costs of distribu-

724 IEEE TRANSACTIONS ON SMART GRID, VOL. 3, NO. 2, JUNE 2012
Fig. 4. Expected annual interruption durations (hrs/yr) of distribution substations of the test system for different case studies.
Fig. 5. Expected annual interruption costs (EUR/yr) of distribution substations of the test system for different case studies.
tion substations of the test system. However, in contrast to theRFDS used in Case 2, the PFDS employed in Case 3 can detectand locate the passively failed cable sections well in advance.Hence, the necessary fault isolation and repair activities can bedone with the least impacts on the other distribution substationsconnected to the passively failed cable sections. As a result, thedegrees of reliability improvements are much better for Case 3compared to those of Case 2.The system oriented reliability indices of the test system
for different case studies are shown in Table III. The relativechanges of these indices for different pair of case studies havealso been presented in Table IV. The results shown in these ta-bles clearly show the great impacts of the RFDS and the PFDSon reliability performance of the test system. For Case 2, SAIFIremains unchanged while the other reliability indices improve.For Case 3, however, all the reliability indices improve. Thesetables once more show how the PFDS can result in much better
TABLE IIISYSTEM ORIENTED RELIABILITY INDICES OF THE TEST SYSTEM
reliability performance in the test system compared to those ofthe RFDS.It is expected that employing any FDS in the distribution net-
works would affect the overall burden on the utility repair crewsfor performing the FMA. Fig. 6 shows the results of such studywhen either the RFDS or the PFDS are employed in the test
KAZEMI et al.: IMPACTS OF FAULT DIAGNOSIS SCHEMES ON DISTRIBUTION SYSTEM RELIABILITY 725
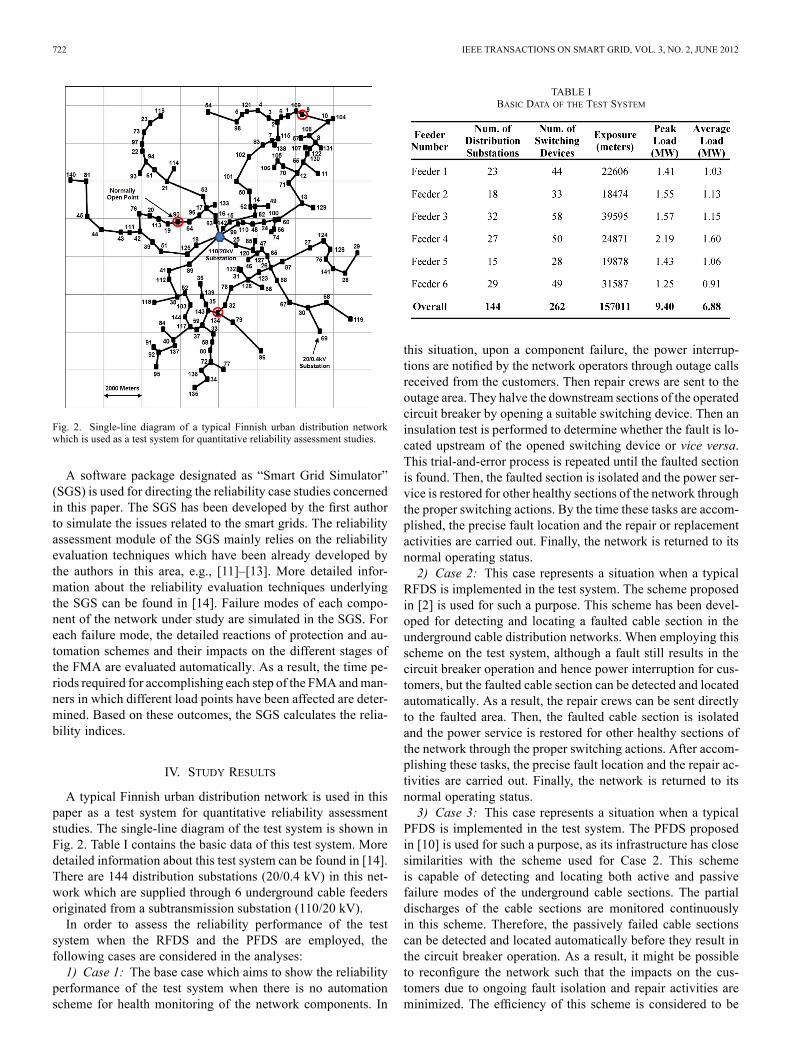
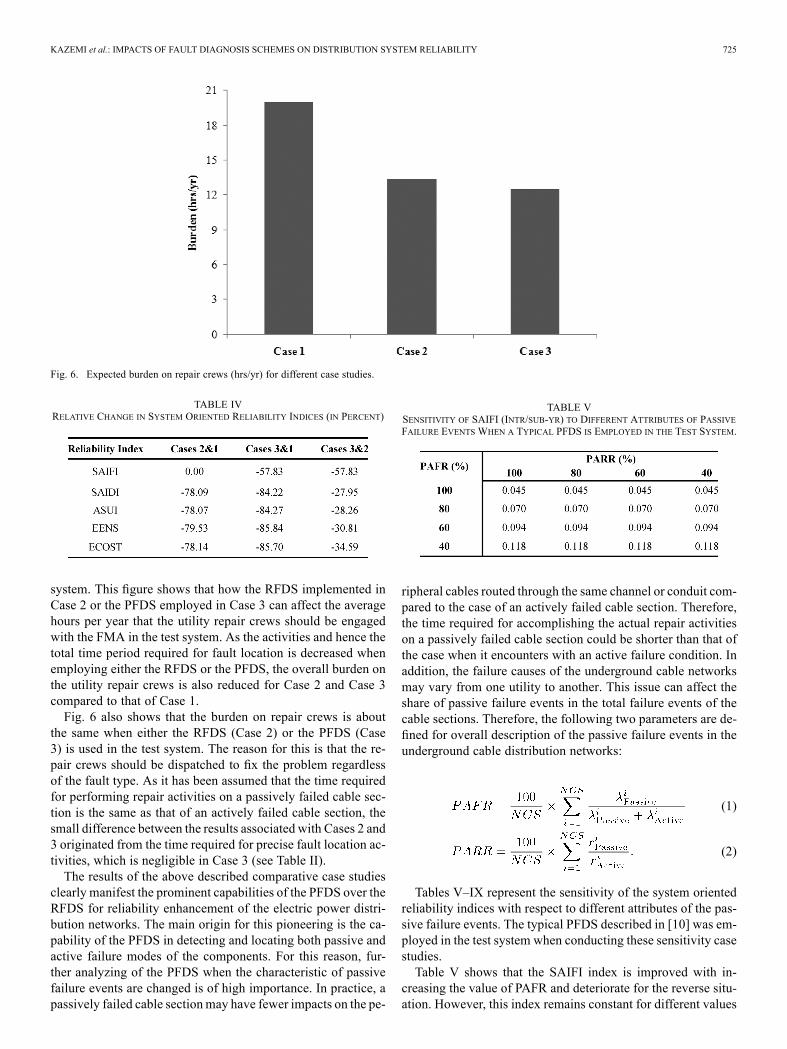
Fig. 6. Expected burden on repair crews (hrs/yr) for different case studies.
TABLE IVRELATIVE CHANGE IN SYSTEM ORIENTED RELIABILITY INDICES (IN PERCENT)
system. This figure shows that how the RFDS implemented inCase 2 or the PFDS employed in Case 3 can affect the averagehours per year that the utility repair crews should be engagedwith the FMA in the test system. As the activities and hence thetotal time period required for fault location is decreased whenemploying either the RFDS or the PFDS, the overall burden onthe utility repair crews is also reduced for Case 2 and Case 3compared to that of Case 1.Fig. 6 also shows that the burden on repair crews is about
the same when either the RFDS (Case 2) or the PFDS (Case3) is used in the test system. The reason for this is that the re-pair crews should be dispatched to fix the problem regardlessof the fault type. As it has been assumed that the time requiredfor performing repair activities on a passively failed cable sec-tion is the same as that of an actively failed cable section, thesmall difference between the results associated with Cases 2 and3 originated from the time required for precise fault location ac-tivities, which is negligible in Case 3 (see Table II).The results of the above described comparative case studies
clearly manifest the prominent capabilities of the PFDS over theRFDS for reliability enhancement of the electric power distri-bution networks. The main origin for this pioneering is the ca-pability of the PFDS in detecting and locating both passive andactive failure modes of the components. For this reason, fur-ther analyzing of the PFDS when the characteristic of passivefailure events are changed is of high importance. In practice, apassively failed cable sectionmay have fewer impacts on the pe-
TABLE VSENSITIVITY OF SAIFI (INTR/SUB-YR) TO DIFFERENT ATTRIBUTES OF PASSIVEFAILURE EVENTS WHEN A TYPICAL PFDS IS EMPLOYED IN THE TEST SYSTEM.
ripheral cables routed through the same channel or conduit com-pared to the case of an actively failed cable section. Therefore,the time required for accomplishing the actual repair activitieson a passively failed cable section could be shorter than that ofthe case when it encounters with an active failure condition. Inaddition, the failure causes of the underground cable networksmay vary from one utility to another. This issue can affect theshare of passive failure events in the total failure events of thecable sections. Therefore, the following two parameters are de-fined for overall description of the passive failure events in theunderground cable distribution networks:
(1)
(2)
Tables V–IX represent the sensitivity of the system orientedreliability indices with respect to different attributes of the pas-sive failure events. The typical PFDS described in [10] was em-ployed in the test system when conducting these sensitivity casestudies.Table V shows that the SAIFI index is improved with in-
creasing the value of PAFR and deteriorate for the reverse situ-ation. However, this index remains constant for different values
726 IEEE TRANSACTIONS ON SMART GRID, VOL. 3, NO. 2, JUNE 2012
TABLE VISENSITIVITY OF SAIDI (HRS/SUB-YR) TO DIFFERENT ATTRIBUTES OF PASSIVEFAILURE EVENTS WHEN A TYPICAL PFDS IS EMPLOYED IN THE TEST SYSTEM.
TABLE VIISENSITIVITY OF ASUI (%) TO DIFFERENT ATTRIBUTES OF PASSIVE FAILUREEVENTS WHEN A TYPICAL PFDS IS EMPLOYED IN THE TEST SYSTEM.
TABLE VIIISENSITIVITY OF EENS (KWHR/YR) TO DIFFERENT ATTRIBUTES OF PASSIVEFAILURE EVENTS WHEN A TYPICAL PFDS IS EMPLOYED IN THE TEST SYSTEM.
TABLE IXSENSITIVITY OF ECOST (EUR/YR) TO DIFFERENT ATTRIBUTES OF PASSIVEFAILURE EVENTS WHEN A TYPICAL PFDS IS EMPLOYED IN THE TEST SYSTEM.
of PARR. It should be noted that even in situations where allthe cable failure events are passive (i.e., ), cus-tomers will still experience power interruptions. There are twomain reasons for this phenomenon. The first one is the efficiencyof the employed scheme in diagnosing the passively failed cablesections. The efficiency of the PFDS used in these studies is 80%[10]. This value of efficiency means that the developed schemecan diagnose about 80% of all passive failure events and theremaining 20% will finally appear as the active failure events.The active failure events then result in a power interruption forcustomers due to the operation of protection devices, which arecounted by SAIFI. The second reason is the inherent limitationsin the distribution network for isolating and repairing the failed
TABLE XSENSITIVITY OF BURDEN ON REPAIR CREWS (HRS/YR) TO DIFFERENTATTRIBUTES OF PASSIVE FAILURE EVENTS WHEN A TYPICAL PFDS IS
EMPLOYED IN THE TEST SYSTEM.
cable sections, as it might not be possible to perform these ac-tivities without unavoidable power interruptions to some distri-bution substations.In contrast to SAIFI, the other system oriented reliability in-
dices presented in Tables VI–IX show some levels of sensitivityto both PAFR and PARR. In general, these reliability indices areimproved with increasing the value of PAFR and decreasing thevalue of PARR and deteriorate for the reverse situations.Table X shows the sensitivity of burden on the utility repair
crews to different attributes of the passive failure events. As itcan be seen from this table, for the situation where the averagetime required for repairing a passively failed cable section is al-most the same as that of an actively failed cable section, i.e.,
, the burden on the repair crews amplifies withincreasing the share of passive failure events. However, the sit-uation is different for cases where the average time required forrepairing a passively failed cable section is less than that of anactively failed cable section. In these situations, the burdens onrepair crews are lessened with increasing the value of PAFR anddecreasing the value of PARR and amplified for the reverse sit-uations. This behavior is resulted from different procedures thatthe utility repair crews should follow for performing the FMAwhen dealing with various failure modes of the cable sections.For an actively failed cable section, the repair crews first iso-late the faulted cable section and then reconfigure the networkin an optimal manner to restore power for distribution substa-tions which have been affected by the fault. However, for apassive failure situation, the repair crews first reconfigure thenetwork such that the minimum number of distribution substa-tions would be affected from ongoing fault isolation process,then they perform the necessary fault isolation and repair activ-ities. Normally, the time required for accomplishing the secondscenario is pretty more than that required for the first scenario.Therefore, as it can be seen from the first column of Table X,with increasing the share of passive failure events, the burdenon the utility repair crew is increased. However, this issue ismasked in situations where the time required for performing re-pair activities on a passively failed cable section is less than thatof an actively failed cable section, i.e., PFRR less than 100%,as this time reduction is far more than that of the previously de-scribed incremented time.
V. CONCLUSIONS
This paper aimed to compare the effects of two types of theFDS on the reliability performance of the electric power distri-
KAZEMI et al.: IMPACTS OF FAULT DIAGNOSIS SCHEMES ON DISTRIBUTION SYSTEM RELIABILITY 727
bution systems. The first one was a representative of the RFDSand the second one was a representative of the PFDS. The SGSwas used for conducting the quantitative reliability assessmentstudies on a typical Finnish urban distribution network whenemploying these FDS. The results of comparative case studiesshow that employing either the RFDS or the PFDS can im-prove the reliability performance of the electric power distribu-tion systems. However, the extents of improvements are muchbetter when employing the PFDS. The RFDS can detect and lo-cate the deteriorated components after their failing and hencemainly reduce the duration of power interruptions imposed onthe customers. In contrast, the PFDS can diagnose the failingcomponents prior to the breakdown condition and while theyare still in the incipient failure condition. As a result, the PFDScan reduce both frequency and duration of power interruptionsexperienced by the network customers. In addition, the substan-tial expensive equipment repair and replacement and possibleunsafe condition can be mitigated by using the PFDS. The re-sults also indicate that employing either the RFDS or the PFDScan reduce the overall burden on the utility repair crew for per-forming the FMA. The results of sensitivity case studies showthat when either the share of passive failure events in the totalfailure events is considerable or where the time required forperforming the repair activities on the passively failed compo-nents is far less than that of the actively failed components, themore improvement in the reliability indices are expected fromthe PFDS compared to the RFDS.
ACKNOWLEDGMENT
The authors would like to thank Dr. R. J. Millar for his greatassistance on providing the data required for quantitative relia-bility studies concerned in this paper.
REFERENCES[1] S. Kazemi, “Commonly used automation schemes for fault manage-
ment in theMV distribution networks,” Dept. Electr. Eng., Aalto Univ.,Espoo, Finland, Tech. Rep. VAHA1, 2009.
[2] A. Newbould, L. Hu, and K. Chapman, “Cable automation for urbandistribution systems,” in Proc. 2001 IEE Conf. Develop. Power Syst.Protection, pp. 319–322.
[3] A. Campoccia, M. L. Di Silvestre, I. Incontrera, E. R. Sanseverino, andC. Spataro, “Applicational aspects of a new diagnostic methodologyfor fault location in MV networks: Problems, solutions and improve-ments,” in Proc. 2005 Int. Conf. Future Power Syst., pp. 1–6.
[4] S. Bagley and D. Branca, “A new approach to find fault locations ondistribution feeder circuits,” in Proc. 2007 IEEE Rural Electr. PowerConf., pp. B5-1–B5-4.
[5] M. S. Choi, S. J. Lee, D. S. Lee, and B. G. Jin, “A new fault locationalgorithm using direct circuit analysis for distribution systems,” IEEETrans. Power Del., vol. 19, pp. 35–41, Jan. 2004.
[6] E. C. Senger, G. Manassero, C. Goldemberg, and E. L. Pellini, “Auto-mated fault location system for primary distribution networks,” IEEETrans. Power Del., vol. 20, pp. 1332–1340, Apr. 2005.
[7] X. Yang,M. S. Choi, S. J. Lee, C.W. Ten, and S. I. Lim, “Fault locationfor underground power cable using distributed parameter approach,”IEEE Trans. Power Syst., vol. 23, pp. 1809–1816, Nov. 2008.
[8] B. D. Russell, C. L. Benner, R. M. Cheney, C. F. Wallis, T. L. Anthony,and W. E. Muston, “Reliability improvement of distribution feedersthrough real-time, intelligent monitoring,” in Proc. 2009 IEEE PowerEnergy Soc. Gen. Meet., pp. 1–8.
[9] B. D. Russell and C. L. Benner, “Intelligent systems for improved relia-bility and failure diagnosis in distribution systems,” IEEE Trans. SmartGrid, vol. 1, pp. 48–56, Jun. 2010.
[10] P. C. J. M. van der Wielen and E. F. Steennis, “Smartening cable con-nections by an intelligent health monitor system,” in Proc. 2010 IEEEConf. Innov. Smart Grid Technol. Eur., pp. 1–7.
[11] S. Kazemi, M. Lehtonen, andM. Fotuhi–Firuzabad, “A comprehensiveapproach for reliability worth assessment of the automated fault man-agement schemes,” in Proc. 2010 IEEE Transm. Distrib. Conf. Exhib.,pp. 1–8.
[12] S. Kazemi, M. Fotuhi–Firuzabad, and R. Billinton, “Reliability assess-ment of an automated distribution system,” IET Gener., Transm., Dis-trib., vol. 1, pp. 223–233, Mar. 2007.
[13] S. Kazemi, M. Fotuhi–Firuzabad, M. Sanaye-Pasand, and M.Lehtonen, “Impacts of automatic control systems of loop restorationscheme on the distribution system reliability,” IET Gener., Transm.,Distrib., vol. 3, pp. 891–902, Oct. 2009.
[14] S. Kazemi, “Reliability evaluation of smart distribution grids,” Ph.D.dissertation, Sharif Univ. Technol., Aalto Univ. Dept. Electr. Eng., ,2011.
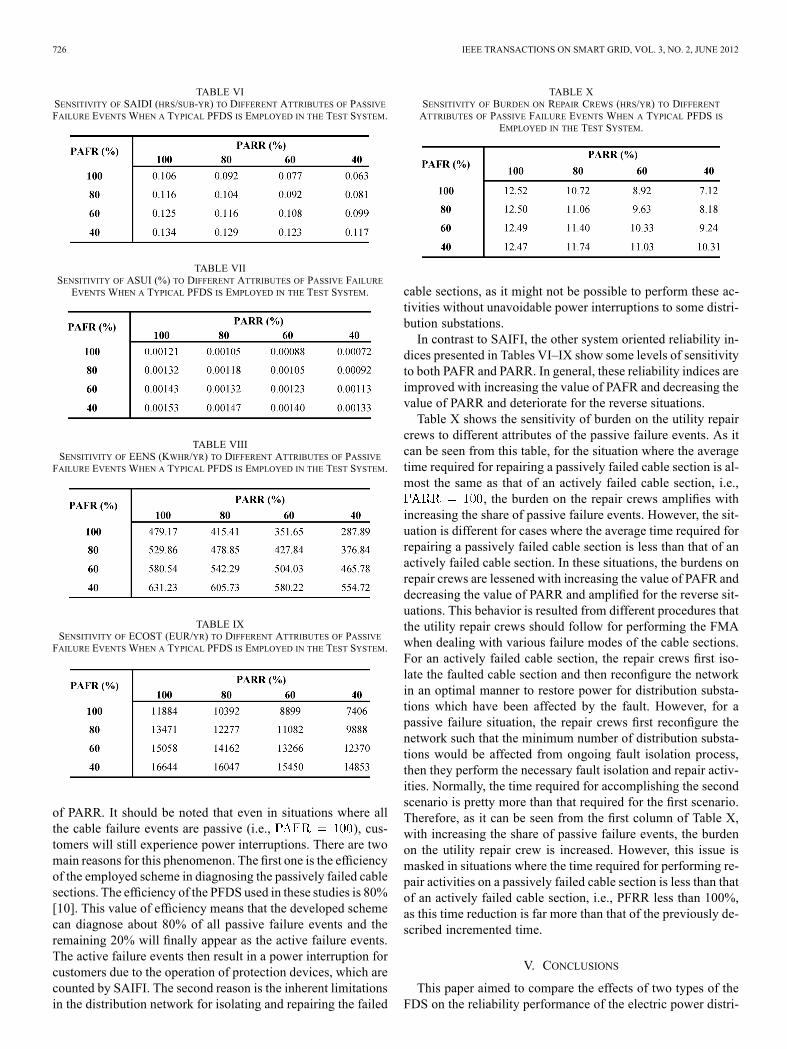
ShahramKazemi (M’09) received the M.Sc. degreein electrical engineering from Sharif University ofTechnology, Tehran, Iran in 2004 and the Ph.D. andD.Sc. degrees in electrical engineering from SharifUniversity of Technology and Aalto University,Espoo, Finland, in 2011.From 2003 to 2006, he was with Niroo Consulting
Engineers Co., Tehran, as a Senior Researcher.He then pursued his doctoral study and researchactivities at Sharif University of Technology andAalto University. His main research interest is the
reliability evaluation of smart distribution grids.
Matti Lehtonen received the M.S. and Licentiatedegrees in electrical engineering from Aalto Univer-sity (formerly Helsinki University of Technology),Espoo, Finland, in 1984 and 1989, respectively, andthe D.Sc. degree from the Tampere University ofTechnology, Tampere, Finland, in 1992.Since 1987, he has been with VTT Energy, Espoo,
and since 1999, he has been with the Department ofElectrical Engineering at Aalto University, where heis a Professor of IT applications in power systems.His main activities include earth fault problems, and
harmonic related issues and applications of information technology in distribu-tion automation and distribution energy management.
Mahmud Fotuhi-Firuzabad (SM’99) received theB.Sc. and M.Sc. degrees in electrical engineeringfrom Sharif University of Technology, Tehran, Iran,and Tehran University, Iran, in 1986 and 1989,respectively, and the M.Sc. and Ph.D. degreesin electrical engineering from the University ofSaskatchewan, Saskatoon, Canada, in 1993 and1997, respectively.He worked as a Postdoctoral Fellow in the De-
partment of Electrical Engineering, University ofSaskatchewan from January 1998 to September
2000, where he conducted research in the area of power system reliability. Heworked as an Assistant Professor in the same department from September 2000to September 2001. Presently, he is a professor and Head of the Department ofElectrical Engineering, Sharif University of Technology.Dr. Fotuhi-Firuzabad is a member of the Center of Excellence in Power
System Management and Control. He serves as an Editor of the IEEETRANSACTIONS ON SMART GRID.