Impact of Tax Reforms on Household Welfare
44
Research Series No. 64 Impact of Tax Reforms on Household Welfare John Matovu, Evarist Twimukye, Winnie Nabiddo and Madina Guloba May 2009 Economic Policy Research Centre (EPRC) 51 Pool Road Makerere University Campus, P. O. Box 7841 Kampala, Uganda Tel: 256-41-541023, Fax: 256-41-541022, Email: [email protected]
Transcript of Impact of Tax Reforms on Household Welfare

Research Series No. 64
Impact of Tax Reforms on Household Welfare
John Matovu, Evarist Twimukye, Winnie Nabiddo and Madina Guloba
May 2009
Economic Policy Research Centre (EPRC) 51 Pool Road Makerere University Campus, P. O. Box 7841 Kampala, Uganda Tel: 256-41-541023, Fax: 256-41-541022, Email: [email protected]

See the end of this document for a list of previous papers in the series

Impact of Tax Reforms on Household Welfare
John Matovu, Evarist Twimukye, Winnie Nabiddo and Madina Guloba
May 2009
i
Abstract The Uganda government has since 1987 initiated a sequence of tax reforms to address the fiscal challenges facing the country. This paper uses a Computable General Equilibrium (CGE) model to analyze the welfare effects of tax reforms on households and the impact of these changes on production and firm activities. The findings are consistent with previous studies which found that the introduction of VAT was indeed a progressive policy reform. Zero rating all food items and agricultural products mainly benefit the low income households whose consumption basket is mainly food items. In a quest for further sources of revenue by overtaxing the rich, this could generate further revenues albeit lower savings and investments by this group. Finally, over-reliance on excise duties especially on petroleum and alcoholic drinks affects the transportation sectors which are also used by the poor. In our results we find that taxation of petrol and rising excise duties indeed is a regressive policy stance.

1
Section 1: Introduction The Uganda government has since 1987 initiated a sequence of tax reforms to
address the fiscal challenges facing the country. Fiscal policy has focused on
stimulating economic growth, strengthening tax administration and raising tax
revenue. From a historical performance of 12.6 percent of GDP in 1970-71, revenue
from tax declined to a dismal 6.5 percent in 1989/90 which led to large deficits and a
budget mainly funded by external financing. However, revenue performance
improved between 1991/92 and 1996/97, to a tax/GDP ratio of 12.2 percent in
1996/97. The remarkable growth in tax revenue was a result of policy measures that
included restructuring the tax system/administration, particularly the establishment of
the Uganda Revenue Authority (URA) in 1991.
Among the main tax changes introduced since 1990 include; the replacement of
sales tax with VAT in 1996, introduction of the new income tax structure in 1997
coupled with a reduction of the personal income tax and abolishing of the tax
holidays in 1999 which were replaced with tax concessions.
The natural question to ask is the extent to which all these changes have affected
the welfare of households and the performance of firms. Studies have showed that
with the exception of some excise taxes and graduated personal tax, tax reforms
have largely been progressive (Chen et al, 2001). It was found that excise tax on
kerosene which is highly consumed by the poor was highly regressive and that the
tax burden incurred by large and medium-size regular taxable firms was significantly
reduced due to the 1997 income tax reform.
While these studies have focused on the micro incidence of taxes, the literature
does not address the general equilibrium effects of these reforms. For instance,
while at the micro level increasing the income taxes would hurt the middle income
class, the collected revenues could be used by the government to improve
infrastructure and thereby indirectly improve the overall welfare of individuals. This
paper uses a Computable General Equilibrium (CGE) model to analyze the welfare

2
effects of tax reforms on households and the impact of these changes on production
and firm activities.
Using a similar approach as Devarajan and Hossain (1995) we assess the incidence
of VAT by removing it and replacing it with other forms of taxes that were used
earlier. The findings are consistent with previous studies which found that the
introduction of VAT was indeed a progressive policy reform. Households in lower
income groups are better off now than the previous tax system prior to the reforms.
In addition, to make VAT even more regressive, we run a simulation where all food
items and agricultural products are zero rated. This policy reform would mainly
benefit the low income households whose consumption basket is mainly food items.
For Uganda’s case, the main problem is to identify further sources of revenues
without necessarily affecting the low income households. We describe alternative tax
structures that are revenue neutral and that shift the tax burden away from low-
income households; in particular we increase income taxes on high-income
households. While this policy change is progressive, it could also affect the savings
and investment of high income households and hence the overall macroeconomic
performance.
In addition, for the case of Uganda there has been an over-reliance on excise duties
especially on petroleum and alcoholic drinks. As for petroleum an argument could be
made that it’s mainly consumed by rich households. However, by over taxing petrol
this could also affect the transportation sectors which are also used by the poor. In
our results we find that taxation of petrol and rising excise duties indeed is a
regressive policy stance. This affects both the urban consumers and rural
consumers who indirectly use it through transport services.
Key policy conclusions from this paper are as follows. Uganda should continue
strengthening the VAT and further streamline it so that VAT can be captured both at
the production and consumption stage. At the moment, its only formally registered
companies which are paying VAT at the retail stage. This narrows the scope of

3
collection and provides some room to widen the tax base. Second, to stimulate
production in the agricultural sector, all agricultural activities should be fully
exempted from VAT. This would make the tax system more progressive as most of
the low income households depend on the agricultural sector. Third, excessive
excise taxes indirectly impact poor households through other intermediary sectors
like transport. Therefore, there should be a balance between excessive taxation of a
few commodities considered to be luxury goods and the quest for revenue.
The rest of the paper will be organized as follows: section II outlines the salient
features of the tax reforms with specific changes in rates; section III focuses on the
tax yields as a result of changes in tax reforms; section IV covers the literature
review; the methodological issues will be outlined in section V and lastly section VI
will have results and conclusion.
Section 2: Tax reforms with specific changes in quantity Excise Duties especially on fuel have been increasing over the years. This affects
transport services since it’s a main source of fuel for public and produces transport
and could have a negative impact on household and firms. In addition, due to the
shortages in electricity, many firms have resorted to the use of diesel for generators
and changes in rates affect their profitability. Because of this fact, the government
has recently reduced tax rates on diesel for manufactures.
The Income Tax Decree of 1974 (Kelvin Holmes, 1997) with extensive amendments
in the subsequent annual financial statutes remained the main income tax law until
the major reforms in income tax of 1997, which saw the enactment of Income Tax
Act 1997. The Income Tax Act 1997 and its subsequent amendments are the basis
of income tax to date. The components of the income tax are:

4
(a) PAYE. Its brackets was in 1992/93 reduced from five to four and the
maximum marginal rate reduced from 50 percent to 40 percent on income
exceeding shs.3.6 million.
Other reforms in the income tax was the 1993 increase in the threshold for personal
income from Shs 600,000 to Shs 840,000 and the reduction of the income tax
brackets from four to three and the top marginal rate from 40 percent to 30 percent
for income above shs.4.2 million. Then there was an introduction of the New Income
Tax Law in December 1997, which was to replace tax holidays with accelerated
depreciation allowances. This was to improve the performance of PAYE and non-
PAYE component. The new threshold for PAYE is as follows.
Table 2.1: PAYE bracket trends
Bracket from to rate
1st 0 130000 0 2nd 130001 235000 10% 3rd 235001 410000 20% 4th >410000 410000 30% Source: MFPED (2002) The above threshold was revised in 1997. An analysis of the threshold from an
income point of view shows that the rates depend on an income bracket. Majority of
the salaried Ugandans are within the 1st and third bracket, and therefore the rates
applicable to them are not as regressive as those in the 4th bracket. This perhaps
explains why PAYE is one of the taxes where government collects a lot of revenue.
(b) Corporation tax or Company tax. This is a tax on company's net profits. The rate
of company tax in Uganda is 30 percent and is normally paid twice a year,
depending on the taxpayers’ year of income. Companies file returns of income to
URA, which highlights the operations of the company specifically the income and
expenses, gross profits and deductions, and net profits. The corporation tax rate on
company’s net profits was reduced from 35 percent to 30 percent in 1997 and has
not changed since.

5
The performance of company tax has been poor since 1997 when income tax was
overhauled (Table 2). This is attributed to the number of weaknesses in the Income
Tax Act (ITA) 1997. For instance, section 39 of the ITA allows companies to
indefinitely carry forward losses, section 23 specifies a number of deductions
allowed and some companies still have certificates of incentives.
Under corporation tax, the major reform was the abolition of all tax exemptions, tax
holidays (however this change did not affect investors who had already received tax
holidays), suspension of all running investment incentives other than those
specifically re-confirmed on fresh application and privatization of state owned
enterprises, which brought all corporations into the tax net. The act repealed Section
25 of the Investment Code 1991, which provided a basis for tax holidays (Budget
Speech June 1997).
(b) VAT. This was introduced in 1997 to replace Certificate of Tax Liability (CTL)
and sales tax in order to boost non-trade related taxes that were also disappointing
in the tax collection effort. The rate was established at 17 percent but was revised in
2005/2006 to 18 percent.
(c) Withholding tax. The major reform in this tax (1997) was the imposition of
withholding tax on non-residents who earn income in form of interest, dividends,
management fees, and loyalty in Uganda. Effective July 1997, non-residents were
required to pay the withholding tax of 15 percent. The rate on supplies and
procurement is 6 percent
(c) Presumptive taxes. This is a tax that is levied on a turnover of less than or equal
to 50 million Uganda shillings. It mainly covers small businesses, because any
business with a turnover of above 50 million is considered a corporation. These
small businesses are associated with inability to keeping proper records, hence
unlike corporate taxes; these firms are taxed without adjusting for deductions of

6
expenditures and losses. This tax could have larger implications on low income
earners who are largely involved in small scale production.
Table 2.2: Presumptive tax Income Tax on MOF Schedule From To Rate(Ug.Shs) - 5,000,000.00 0 5,000,001.00 20,000,000.00 100,000.00 20,000,001.00 30,000,000.00 250,000.00 30,000,001.00 40,000,000.00 350,000.00 40,000,001.00 50,000,000.00 450,000.00 Source: URA (various issues) (d) Rental income tax. This is categorized as either limited company earnings or
individual rental earnings. With respect to limited company earnings of rent, this is
income that is considered as part of the company’s turnover. As for individual rental
incomes, it’s not considered as part of the turnover, since we are dealing with
individuals, so it’s imposed separately from actual incomes, payable after 12
months. For companies, a 20 percent deduction is made to cater for expense on
maintenance of the building and the remaining 80 percent is what is taxed. However
the other characteristics of this tax are that no deductions are made on withholding
tax and this tax applies to only immovable properties (land and buildings).
(e) Import duty which is the second largest source of government revenue in
Uganda, contributing 3 percent of GDP in 2003/04, representing 23.8 percent of total
tax revenue. Excise duty was the biggest contributor bringing in 10.5 percent of
Uganda’s total tax revenue (1.4 percent of GDP) in 2003/2004. The tariff structure in
Uganda (is basically ad valorem for most items) - comprising three tariff bands: 0,
10, and 15 percent. The zero rate applies to capital goods and some socially
important imports such as medicines, fertilizers and pesticides. Tariff reform have
involved (among others) reduction in tariff rates, simplification of the structure,
reduction of exemptions and phasing out import bans, import license requirements
and pre-shipment inspection. To compensate for the reduction in tariff, government
introduced excises of 10 percent on the imports (applied on an ad valorem basis
7
across about 400 tariff lines). For example, sugar benefited from high duties on
sugar imports (15 percent), and hence, preferential access to imported sugar as a
raw material for other production (beer and soft drinks) led to the domestic market
price of sugar in Uganda to exceed US$600 per ton (much higher than the cost of
sugar on world markets) – thus imposing a burden on the consumers.
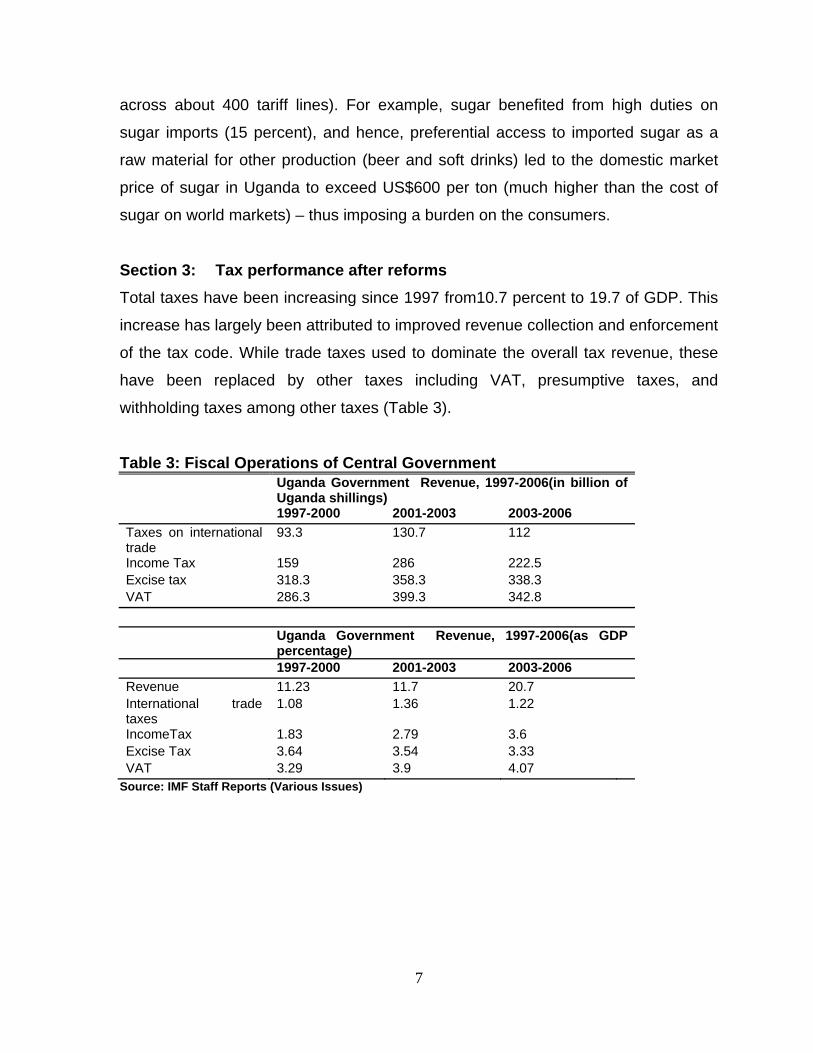
Section 3: Tax performance after reforms Total taxes have been increasing since 1997 from10.7 percent to 19.7 of GDP. This
increase has largely been attributed to improved revenue collection and enforcement
of the tax code. While trade taxes used to dominate the overall tax revenue, these
have been replaced by other taxes including VAT, presumptive taxes, and
withholding taxes among other taxes (Table 3).
Table 3: Fiscal Operations of Central Government
Uganda Government Revenue, 1997-2006(in billion of Uganda shillings)
1997-2000 2001-2003 2003-2006 Taxes on international trade
93.3 130.7 112
Income Tax 159 286 222.5 Excise tax 318.3 358.3 338.3 VAT 286.3 399.3 342.8 Uganda Government Revenue, 1997-2006(as GDP
percentage) 1997-2000 2001-2003 2003-2006 Revenue 11.23 11.7 20.7 International trade taxes
1.08 1.36 1.22
IncomeTax 1.83 2.79 3.6 Excise Tax 3.64 3.54 3.33 VAT 3.29 3.9 4.07
Source: IMF Staff Reports (Various Issues)

8
Section 4: Literature review To assess the effectiveness of a tax system, it’s always worthwhile to understand
how the tax system impacts the welfare of households and performance of firms.
Under the current tax code most basic goods and services which accounts for
disproportionately high percentage of low-income household spending are exempted
or zero-rated (e.g. basic foodstuffs). In addition to equity concerns, certain sales are
exempt or zero-rated for especially educational and health services and passenger
transport services. Generally, a number of VAT exemptions appear pro-poor.
Chen et al. (2001) showed that, with the exception of some excise taxes and
graduated personal tax, which is an income tax levied by local governments, most
tax reforms had been progressive. The excise tax on kerosene, which is heavily
consumed by the poor, was found to be highly regressive. Graduated personal tax
also turned out to hit the poor relatively hard as its threshold was about half the
lower threshold of the central government income tax on individuals. Since it was
levied on formal sector employees and hence on the better-off, Pay-As-You Earn
(PAYE) income tax was the most progressive tax.
The impact of tax reforms on regular taxable firms was such that the tax burden
incurred by large and medium-size regular taxable firms was significantly reduced
following the 1997 income tax reform (Chen et al., 2001). This was mainly due to the
generous initial allowance for investment in machinery and equipment (except
vehicles) available to all tax-paying firms under the new system. The other
contributor was the zero rated import duty for imported machinery. The corporate tax
holidays were abolished in 1997 and replaced mainly by an initial investment
allowance for machinery. As a result, the Marginal Effective Tax Rate (METR) on
machinery was significantly reduced. This indicated that, given the generous
allowances, profitable firms that invest heavily in machinery could benefit from opting
from the tax reform, reflecting the policy makers’ desire to provide incentives for
acquisition on new technologies.

9
The findings indicated that the tax reforms made excise taxes more progressive and
import duties more regressive. The latter finding was most likely due to the
introduction of duty-free treatment of imported capital goods for all firms in 1995. The
excise tax on petroleum was found to be particularly progressive. As the authors
pointed out, this finding should be treated with caution. If the indirect effects of the
petroleum taxes were taken into account, excise taxes might turn out to be more
regressive. Since taxing petroleum consumption affects transport prices and hence
final consumer prices of all types of goods, people in rural areas and thus the poor
are likely to be hurt disproportionately.
This study points to the limitations of this type of tax incidence analysis. In addition, it
is based on the formal tax structure only. If the analysis were instead based on taxes
actually paid, the above findings could change substantially. In an economy with a
large rural and informal sector like Uganda, there is good reason to believe that
numerous businesses and individuals do not pay taxes at all. For example, there is
evidence that tax exemptions and tax evasion are widespread among firms. While
tax exemptions appear to be more common among larger firms, tax evasion is
especially prevalent among smaller firms (Gauthier and Reinikka, 2001). If this were
taken into account, the resulting tax incidence could move in either direction
depending on the extent of the tax burden resting on smaller firms.
Kayizzi-Mugerwa, 2002, points out that the budget’s financing options also implied
trade-offs. Earlier, trade taxes, notably those on coffee exports, were popular, mostly
for their ease of collection. Commodity taxation has a high incidence on the poor,
however, with the countryside in effect subsidizing the cities. There were followed by
fuel taxation, which seemed more equitable, since cities are transport-intensive.
However, fuel enters directly into the cost of transporting exports to the sea as well
as the price of the ‘wage goods’ to producers in the countryside, including the
remotest regions. Intent on private sector development, such as Uganda, tax policies
have assumed a central place in the economic debate not least since the level of

10
taxation ultimately defines the business environment. Pressure groups representing
the manufacturing sector have argued that taxes are among the most important
obstacles to the expansion of industrial activities. The government has argued,
however, that at only 11.5 of GDP total taxation is much lower than in many other
African countries. The problem is that the tax base is still quite shallow.
Section 5: Incidence of Taxes 1992-2005
In examining the welfare impact of tax policy reforms, we adopt a number of strong
assumptions. For direct taxes, we assume that the factors that produce the
associated incomes pay the taxes. For indirect taxes, we assume that households
that consume the taxed items pay the associated taxes. Thus, smokers pay taxes on
tobacco, households that use paraffin for lamps pay the taxes on paraffin, etc.
Import duties are more difficult to capture from a household survey given that there
is no differentiation of consumer goods which are domestically produced and those
which are imported. We therefore assume that the prices of all goods for which
imports are a large share of the market go up by the amount of the tariff when it is
imposed. Finally, most of the analysis relies on statutory tax rates rather than any
estimates of taxes actually paid.
In the figures below, we present results showing the incidence of taxes on
Households over the period 1992-2005. The data used to analyze the effects of tax
reforms for both 1992 and 1994/95 are from the Integrated Households Survey
(1992) and the 2005 Integrated Household Survey.
We first compare two different tax regimes by presenting results for the incidence of
taxes in 1992 before major reforms took place and 1994/95 after the tax reforms. We
compare these results to the 2005 data. Two important results can be derived from
this exercise. Figure 1 clearly shows that tax reforms did not have an immediate
impact on the overall distribution of taxes paid by households. As noted from the
figures below, all taxes have concentration curves that are lower than the household

11
per-capita expenditures an indication that they are generally progressive. The
exception is graduated tax which was later abolished.1
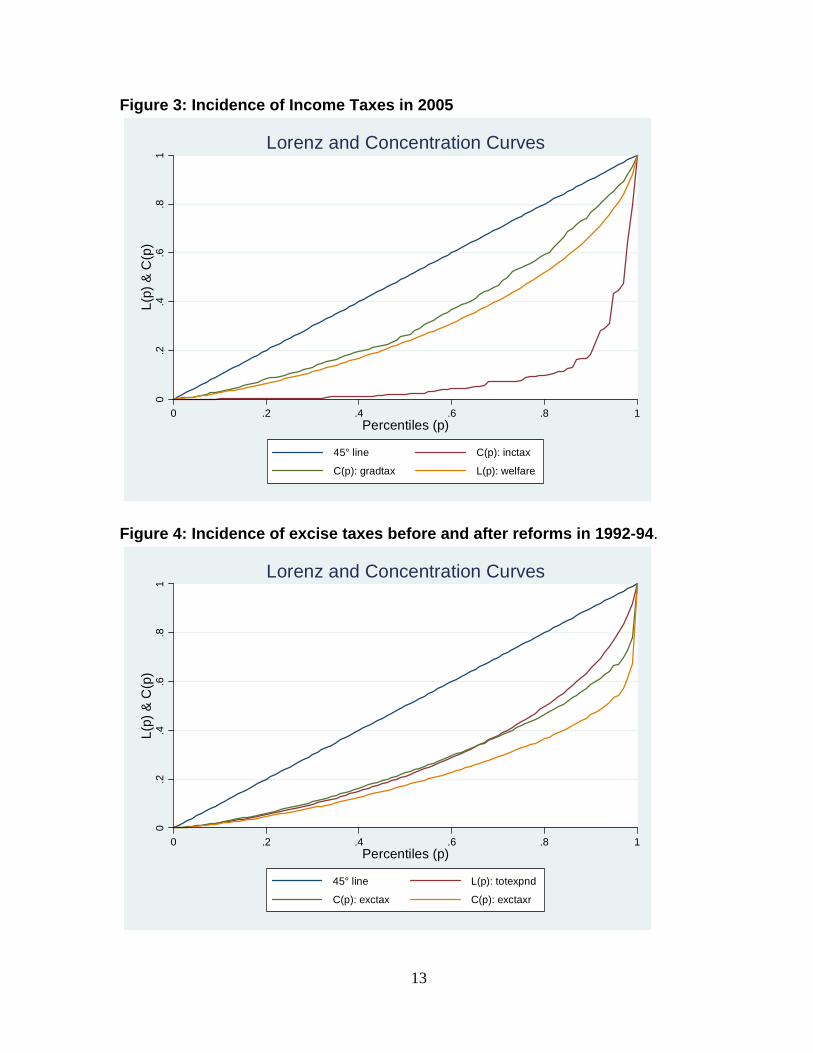
The key interest in this paper is mainly on how the tax incidence has evolved
overtime. From the Lorenz curves, its revealed that the coverage of taxes has
greatly improved compared to 1992-94. For instance, in figure 2 its very clear that
income tax during that period was only paid by a few individuals. Since then if we
compare this chart to figure 3, we find that more individuals are now being captured
in the distribution. This also applied to excise duties which in 1992 the distribution of
the Lorenz curve was mainly skewed to the rich. Compared to the 2005 distribution,
more households are being captured for this income tax category. The intuition
behind the changes in the distribution of these curves could be two fold: first its
possible that there has been a growth in incomes by households which has resulted
into being captured especially for taxes like excise which are levied on goods
consumed largely by the rich. Second, its also possible that there has been a
general improvement in tax collection effort.
1 Graduated tax is a form of a poll tax which is compulsory for all individuals above 18 years of age and not engaged in schooling. This tax is levied irrespective of whether an individual holds a job or some taxable assets. The incidence of this tax is mainly on the poor given that it is effectively collected in rural areas.

12
Figure 1: Incidence of Tax Reforms on Households 1992-94
Figure 2: Incidence of Income Taxes before and After Reforms in 1992-94
0.2
.4.6
.81
L(p)
& C
(p)
0 .2 .4 .6 .8 1Percentiles (p)
45° line L(p): totexpnd
C(p): aggtax C(p): aggtaxr
Lorenz and Concentration Curves0
.2.4
.6.8
1L(
p) &
C(p
)
0 .2 .4 .6 .8 1Percentiles (p)
45° line L(p): totexpnd
C(p): inctaxr C(p): inctax
C(p): gradt
Lorenz and Concentration Curves
13
Figure 3: Incidence of Income Taxes in 2005
Figure 4: Incidence of excise taxes before and after reforms in 1992-94.
0.2
.4.6
.81
L(p)
& C
(p)
0 .2 .4 .6 .8 1Percentiles (p)
45° line C(p): inctax
C(p): gradtax L(p): welfare
Lorenz and Concentration Curves0
.2.4
.6.8
1L(
p) &
C(p
)
0 .2 .4 .6 .8 1Percentiles (p)
45° line L(p): totexpnd
C(p): exctax C(p): exctaxr
Lorenz and Concentration Curves

14
Figure 5: Incidence of Sales and VAT taxes before and after reforms in 1992-94
Figure 6: Incidence of Excise, VAT and Import Duties in 2005
0.2
.4.6
.81
L(p)
& C
(p)
0 .2 .4 .6 .8 1Percentiles (p)
45° line L(p): totexpnd
C(p): saletax C(p): vat
Lorenz and Concentration Curves0
.2.4
.6.8
1L(
p) &
C(p
)
0 .2 .4 .6 .8 1Percentiles (p)
45° line C(p): exctot
C(p): imptot C(p): vattot
L(p): welfare
Lorenz and Concentration Curves

15
Section 6: The Uganda Social Accounting Matrix (SAM) 2007 A Social Accounting Matrix (SAM) is a table which summarizes the economic
activities of all agents in the economy. These agents typically include households,
enterprises, government, and the rest of the world (ROW). The relationships
included in the SAM include purchase of inputs (goods and services, imports, labour,
land, capital etc.); production of commodities; payment of wages, interest rent and
taxes; and savings and investment. Like other conventional SAMs, the Uganda SAM
is based on a block of production activities, involving factors of production,
households, government, stocks and the rest of the world.
The Uganda SAM is a 120 by 120 matrix. The various commodities (domestic
production) supplied are purchased and used by households for final consumption
(42 per cent of the total), but also a considerable proportion (34 per cent) is
demanded and used by producers as intermediate inputs. Only 7 percent of
domestic production is exported, while 11 per cent is used for investment and stocks
and the remaining 7 percent is used by government for final consumption.
Households derive 64 per cent of their income from factor income payments, while
the rest accrues from government, inter-household transfers, corporations and the
rest of the world. The government earns 32 percent of its income from import tariffs
– a relatively high proportion, but a characteristic typical of developing countries. It
derives 42 percent of its income from the ROW, which includes international aid and
interest. The remainder of government’s income is derived from taxes on products
(14 percent), income taxes paid by households (6 percent) and corporate taxes (5
percent).
Investment finance is sourced more or less equally from government (26 per cent),
domestic producers (27 per cent) and households (26 per cent), with enterprises
providing only 21 per cent. Imports of goods and services account for 87 percent of
total expenditure to the ROW. The rest is paid to ROW by domestic household
sectors in form of remittances; wage labour from domestic production activity;

16
domestic corporations payments of dividends; income transfers paid by government;
and net lending and external debt related payments.
The extent of household dis-aggregation is very important for policy analysis, and
involves representative household groups as opposed to individual households.
Pyatt and Thorbecke (1976) argue persuasively for a household dis-aggregation that
minimizes within-group heterogeneity. This is achieved in the Uganda SAM through
the disaggregating of households by rural and urban, and whether households are
involved in farming or non farming activities.
The Uganda SAM identifies three labour categories disaggregated by skilled,
unskilled and self employed. Land and capital are distributed accordingly to the
various household groups.
Section 7: Salient Features of the CGE Model The CGE model used in the present study is based on a standard CGE model
developed by Lofgren, Harris, and Robinson (2002). The CGE model is calibrated to
the 2002 SAM database. GAMS software is used to calibrate the model and perform
the simulations.
Productions and commodities
For all activities, producers maximize profits given their technology and the prices of
inputs and output. The production technology is a two-step nested structure. At the
bottom level, primary inputs are combined to produce value-added using a CES
(constant elasticity of substitution) function. At the top level, aggregated value added
is then combined with intermediate input within a fixed coefficient (Leontief) function
to give the output. The profit maximization gives the demand for intermediate goods,
labor and capital demand.

17
The allocation of domestic output between exports and domestic sales is determined
using the assumption that domestic producers maximize profits subject to imperfect
transformability between these two alternatives. The production possibility frontier of
the economy is defined by a constant elasticity of transformation (CET) function
between domestic supply and export.
On the demand side, a composite commodity is made up of domestic demand and
final imports and it is consumed by households, enterprises, and government. The
Armington assumption is used here to distinguish between domestically produced
goods and imports. For each good, the model assumes imperfect substitutability
(CES function) between imports and the corresponding composite domestic goods.
The parameter for CET and CES elasticity used to calibrate the functions used in the
CGE model are exogenously determined and are taken from Chung-I Li (1999).
Factor of production
There are 18 primary inputs: 16 labour types, capital and land. Wages and returns to
capital are assumed to adjust so as to clear all the factor markets. Both types of
labor are mobile across sectors while capital is assumed to be sector-specific.
Institutions
There are six institutions in the model: 32 households, 1 enterprises and
government. Households receive their income from primary factor payments. They
also receive transfers from government and the rest of the world. Households pay
income taxes and these are proportional to their incomes. Savings and total
consumption are assumed to be a fixed proportion of household’s disposable
income (income after income taxes). Consumption demand is determined by a
Linear Expenditure System (LES) function. Firms received their income from
remuneration of capital; transfers from government and the rest of the world; and net
capital transfers from households. Firms pay corporate tax to government and these
are proportional to their incomes.

18
Government revenue is composed of direct taxes collected from households and
firms, indirect taxes on domestic activities, domestic value added tax, tariff revenue
on imports, factor income to the government, and transfers from the rest of the
world. The government also saves and consumes.
Macro closure
Equilibrium in a CGE model is captured by a set of macro closures in a model. Aside
from the supply-demand balances in product and factor markets, three
macroeconomic balances are specified in the model: (i) fiscal balance, (ii) the
external trade balance, and (iii) savings-investment balance. For fiscal balance,
government savings is assumed to adjust to equate the different between
government revenue and spending. For external balance, foreign savings are fixed
with exchange rate adjustment to clear foreign exchange markets. For savings-
investment balance, the model assumes that savings are investment driven and
adjust through flexible saving rate for firms. Alternative closures, described later, are
used in a subset of the model simulations.
Section 8: Simulations and Results
First to make an assessment as to whether the current tax regime is progressive, we
undertake a simulation where we assume that VAT is removed and the budget is
mainly financed by the former sales tax and direct income taxes. In all cases, we
remove VAT while at the same time considering the following revenue tax changes.
First, we assume that the revenue losses are not compensated for by adjusting any
other forms of taxes. We also consider scenarios where the revenue loss after the
removal of VAT is compensated for by increasing direct taxes on households
uniformly. The third scenario is where the revenue loss is mainly compensated for by
households in the fourth quartile (richer households). We also assess the
progressiveness of the tax system if all food items and agricultural commodities
were zero rated.

19
8.1 Macroeconomic Effects of Tax Reforms
The analysis used to assess the progressiveness of VAT is similar to Devarajan and
Hossain who analyze sales taxes rather than a VAT. As noted in Devarajan and
Hossain, this allows us to examine the “true” price-distorting effect of the tax. In the
analysis, we are mainly interested in the macroeconomic effects, the sectoral effects
and the welfare implications on households. A policy of a 100 percent reduction in
VAT is expected to impact generally positively on the macro economy. The outturn is
as expected under both fixed and flexible tax deficits with a greater impact on the
trade balance since the increase in exports (0.1 percent) is greater than the increase
in imports (0.04 percent). The intuition is that the exports become cheaper as such
they are now more competitive in the international markets. Overall GDP increased
due to increased domestic activities as the elimination of VAT reduces both cost of
production and prices of the product for the domestic consumers. The positive net
indirect taxes are due to increases in the GDP and the higher disposable incomes
that have resulted from the VAT cuts.
For the case where the reduction of VAT is financed by richer households, the trade
balance is negatively affected (exports decreased by about 0.3 percent while the
imports decreased by about 0.2 percent). On top of the VAT, they are burdened by
indirect taxes, which make the trade balance suffer. However, the effects on other
macroeconomic variables are marginal. The reduction of VAT on food items has a
positive though small effect on the macro economy (this tax is however regressive
since all rural quartiles households are negatively affected). The intuition here is that
these rural quartile households are the ones engaged in the production of food
items, removing taxes on these items results in low tax revenues which revenues
would otherwise be used to provide social infrastructure for these groups.
Removing excise tax on manufactured goods impacts negatively on the macro
economy under both the flexible and fixed tax deficit regimes. The trade balance is
also negatively affected (exports decrease by about 0.24 percent while the imports

20
decreased by about 0.16 percent). The negative net indirect taxes may be due to a
decrease in the excise tax itself. The negative impact on the macro economy and
the trade balance may be because the removal of excise duty which is a major
source of government revenue impacts negatively the government expenditure and
economic development.
Increasing excise tax on petrol products impacts negatively on the macro economy
and the trade balance is also slightly affected. Whereas taxation of petrol (which is
considered to be consumed mainly by the rich), may be considered to be a
progressive move, its effects can also be felt in the overall transport sector thereby
affecting the whole macroeconomy.
Table: 8.1: Simulations on the Impact of Tax Reforms on the Macroeconomy
Baseline VATTAX1 VATTAX2 VATTAX3 VATTAX4 VATTAX5
Absorption 12703 0.03 0.04 0.00 0.00 0.00Private Consumption 8513 0.05 0.05 0.01 0.00 0.00Fixed Investment 2424 .. .. .. .. ..Government Consumption 1766 .. .. .. .. ..Exports 1854 0.06 0.07 -0.03 0.13 0.13Imports -2821 0.04 0.05 -0.02 0.09 0.09GDP at Market Price 11736 0.04 0.04 0.00 0.00 0.00Net Indirect Taxes 1163 0.51 0.52 0.04 0.02 0.02
INCTAX1 INCTAX2 PTRTAX1 VATTAX6 VATTAX7 EXCISE3 EXCISE4
Absorption 0.00 -0.01 0.00 0.03 0.04 -0.01 -0.01Private Consumption 0.00 -0.01 -0.01 0.05 0.05 -0.02 -0.02Fixed Investment .. .. .. .. .. .. ..Government Consumption .. .. .. .. .. .. ..Exports -0.05 -0.09 -0.02 0.06 0.07 -0.24 -0.24Imports -0.03 -0.06 -0.01 0.04 0.05 -0.16 -0.16GDP at Market Price 0.00 -0.01 0.00 0.04 0.04 -0.01 -0.01Net Indirect Taxes -0.03 -0.06 -0.04 0.51 0.52 -0.13 -0.13
21
8.2 Welfare Effects Removal of VAT across the board
With the removal of VAT, the welfare of richer households improves. These are
households who mainly consume manufactured commodities on which VAT is
levied. The rural household’s welfare generally declined. This policy stance clearly
shows that implementation of VAT was indeed good for the poor and made the tax
system more progressive. The arguments that were fronted at the time that VAT
would make the poor poorer are not supported in this analysis. This result is
consistent with the study done by Chen et.al. (200x), which suggests that
replacement of sales tax with VAT did not make the poor worse off. The welfare
measures also show a worse off scenario where the loss in revenues is mainly
compensated for by a uniform increase in direct taxes.

22
Table 8.2: Simulations on the Impact of Tax Reforms on Household Welfare
VATTAX1 VATTAX2 VATTAX3 VATTAX4 VATTAX5 INCTAX1
CRURQ1 -0.96 -1.12 0.24 -0.07 -0.08 1.09CRURQ2 -2.11 -2.42 0.57 -0.09 -0.11 2.09CRURQ3 -1.93 -2.20 1.04 -0.17 -0.19 0.78CRURQ4 -1.73 -1.65 2.16 -0.12 -0.11 -5.32CURBQ1 0.22 0.20 0.07 -0.02 -0.02 0.22CURQ2 0.65 0.61 0.22 -0.03 -0.03 0.15CURQ3 0.77 0.74 0.44 -0.06 -0.06 -0.32CURQ4 14.97 18.45 -12.37 0.08 0.33 -7.42ERURQ1 -1.50 -1.83 0.87 0.14 0.11 1.14ERURQ2 -2.52 -2.89 1.14 0.01 -0.02 0.92ERURQ3 -1.74 -2.04 1.12 -0.16 -0.18 1.20ERURQ4 -1.12 -1.27 0.66 0.04 0.03 -2.38EURBQ1 0.15 0.14 0.05 -0.01 -0.01 0.20EURQ2 0.21 0.18 0.08 -0.02 -0.02 0.31EURQ3 0.35 0.33 0.19 -0.03 -0.03 0.01EURQ4 0.50 0.95 -0.15 -0.10 -0.07 -1.25NRURQ1 -1.45 -1.78 0.70 0.05 0.03 1.18NRURQ2 -1.03 -1.26 0.53 -0.04 -0.05 1.39NRURQ3 0.24 0.09 0.47 -0.01 -0.02 1.03NRURQ4 0.17 0.02 -0.22 0.02 0.01 -0.92NURBQ1 0.22 0.15 -0.16 -0.03 -0.03 1.93NURQ2 0.18 0.15 0.07 -0.02 -0.02 0.26NURQ3 0.28 0.26 0.14 -0.02 -0.02 0.01NURQ4 0.28 0.51 0.09 -0.05 -0.04 -0.53WRURQ1 -1.12 -1.34 0.40 0.29 0.28 1.62WRURQ2 -1.98 -2.41 0.68 0.15 0.11 3.49WRURQ3 -0.85 -1.19 1.07 0.26 0.23 2.71WRURQ4 1.29 0.83 -0.59 0.11 0.08 -3.14WURBQ1 0.30 0.28 0.07 -0.01 -0.01 0.24WURQ2 0.35 0.33 0.13 -0.02 -0.02 0.17WURQ3 0.45 0.42 0.22 -0.02 -0.02 -0.05WURQ4 2.07 2.45 0.55 0.13 0.16 -1.11TOTAL 3.61 3.68 0.47 0.21 0.22 -0.31

23
Table 8.2 Cont’d:
Financing of VAT revenue losses by increasing direct taxes paid by Q4 We also consider a scenario where the losses in VAT tax revenues are mainly
financed by households in the fourth quartile. The general welfare of urban
households in Q4 declines. This is because they bear the burden of the tax.
However, over taxation of households in this income category could have more
negative effects at the macroeconomic level due to the reduction in savings and
investments. As expected, the welfare of the households in the other quartiles
INCTAX2 PTRTAX1 VATTAX6 VATTAX7 EXCISE3 EXCISE4
CRURQ1 1.65 0.04 -0.96 -1.12 0.44 0.41CRURQ2 3.33 0.06 -2.11 -2.42 0.71 0.66CRURQ3 2.29 0.07 -1.93 -2.20 0.77 0.66CRURQ4 -3.67 -0.15 -1.73 -1.65 -0.12 -0.18CURBQ1 0.31 -0.01 0.22 0.20 -0.05 -0.04CURQ2 0.34 -0.02 0.65 0.61 -0.09 -0.08CURQ3 0.02 -0.03 0.77 0.74 -0.10 -0.29CURQ4 -24.46 -0.53 14.97 18.45 -1.45 -1.70ERURQ1 2.48 0.05 -1.50 -1.83 0.05 0.10ERURQ2 2.66 0.06 -2.52 -2.89 0.18 0.22ERURQ3 2.86 0.06 -1.74 -2.04 0.03 0.06ERURQ4 -1.94 -0.04 -1.12 -1.27 -0.42 -0.36EURBQ1 0.27 -0.01 0.15 0.14 -0.03 -0.02EURQ2 0.43 -0.01 0.21 0.18 -0.03 -0.03EURQ3 0.18 -0.02 0.35 0.33 -0.08 -0.07EURQ4 -1.70 -0.03 0.50 0.95 -0.20 -0.27NRURQ1 2.34 0.06 -1.45 -1.78 0.20 0.24NRURQ2 2.34 0.04 -1.03 -1.26 0.06 0.09NRURQ3 1.69 0.01 0.24 0.09 -0.15 -0.12NRURQ4 -1.36 0.00 0.17 0.02 -0.39 -0.35NURBQ1 2.05 -0.01 0.22 0.15 -0.05 -0.04NURQ2 0.36 -0.01 0.18 0.15 -0.02 -0.02NURQ3 0.13 -0.01 0.28 0.26 -0.06 -0.05NURQ4 -0.57 -0.01 0.28 0.51 -0.07 -0.10WRURQ1 2.49 0.03 -1.12 -1.34 0.05 0.10WRURQ2 5.09 0.06 -1.98 -2.41 0.28 0.37WRURQ3 4.47 0.04 -0.85 -1.19 -0.05 0.04WRURQ4 -4.54 -0.07 1.29 0.83 -0.66 -0.52WURBQ1 0.32 -0.01 0.30 0.28 -0.04 -0.03WURQ2 0.30 -0.01 0.35 0.33 -0.04 -0.03WURQ3 0.12 -0.01 0.45 0.42 -0.07 -0.06WURQ4 -0.94 -0.07 2.07 2.45 -0.35 -0.37TOTAL -0.64 -0.45 3.61 3.68 -1.78 -1.78

24
improved because the taxation system became more progressive which impacts
positively on the poorer households.
Removal of VAT on all food items across the board In order to make the tax system more progressive, we analyzed a case where food
items are exempted from VAT. The implications of this scenario would be an overall
improvement in the welfare of households in the lower quartiles. However, in this
case the urban households benefit the most because they are the main consumers
of food products that are VAT eligible. The rural households are affected negatively
by this because the urban households who are the main consumers of these food
items produced by the rural households switch to manufactured products which
impacts negatively on the market of food products from rural areas.
Removal of all income taxes on low income households i.e. Q1, Q2 & Q3 We also experiment with the case of removing all income taxes on low income
households and mainly targeting the rich households. The argument for this policy
stance is that it’s administratively cheaper to target rich individuals, than spreading
the tax collection resources thin across so many individuals who are more difficult to
target. The welfare of Q4 households is negatively affected because they bear the
burden of the tax. For the other quartiles, their welfare improves because they will
fall outside the tax bracket. This implies that the income tax in this scenario is
progressive because it improves the welfare of the poorer members of the society.
Under the fixed fiscal balance the Q4 become worse off compared to the flexible
regime.

25
Increasing excise taxes all manufactured products
Due to lack of other sources of revenues, the government has been taxing goods
considered to be luxurious very heavily. In particular goods like beers, cigarettes and
soft drinks have attracted very high excise duties. While these commodities are not
generally consumed by the poor, over taxing them could actually harm the real
objective of raising revenues due to reduced consumption. For the simulations, the
rural households are better off as they consume less of the manufactured products
compared to the urban households.
Increasing excise tax on only petrol
We also specifically run a simulation of increasing excise taxes on petroleum
products. The objective behind this simulation is that petrol could have other indirect
effects on the poor especially given its interdependency with other sectors like
transport. This had a general negative impact on almost all households in the
country. This is because increase in excise tax on petrol directly or/and indirectly
impacts negatively all economic activities that depend on petrol such as transport
and manufacturing.
9. Conclusion and Policy Implications From a historical perspective, we note that Uganda has gone a long way to improve
its tax system. Income taxes which were largely paid by a few individuals are now
being paid more households. This is partly due to the growth in comes of
households that has been witnessed over the past ten years. However, a few
specific areas would still need improvement.
Key policy conclusions from this paper are as follows. Uganda should continue to
strengthen VAT and further streamline it so that VAT can be captured both at the
production and consumption stage. At the moment, it’s only formally registered

26
companies which are paying VAT at the retail stage. This narrows the scope of
collection and provides some room to widen the tax base. Second, to stimulate
production in the agricultural sector, all agricultural activities should be fully
exempted from VAT. This would make the tax system more progressive as most of
the low income households depend on the agricultural sector. Third, while excessive
excise taxes may not directly impact poor households, the revenue authorities
should be aware that this could reduce the consumption levels of these
commodities. Therefore there should be a balance between excessive taxation of a
few commodities considered to be luxury goods and the quest for revenue.

27
References Chen, D., Matovu, J. and Reinikka, R. (2001) ‘A Quest for Revenue and Tax Incidence’, in R. Reinikka and P. Collier (eds), Uganda’s Recovery: The Role of Firms, Farms, and Government. Washington, DC: World Bank. Collier, P. and Reinikka, R. (2001) ‘Reconstruction and Liberalisation: An Overview’, in R. Reinikka and P. Collier (eds), Uganda’s Recovery: The Role of Firms, Farms, and Government. Washington, DC: World Bank. Gauthier, B. and Reinikka, R. (2001) Shifting Tax Burdens through Exemptions and Evasion: An Empirical Investigation of Uganda. World Bank Policy Research Working Paper 2735. Washington, DC: World Bank. IMF Staff Reports (Various Issues). IMF, Uganda Statistical Appendix (various issues). Kayizzi-Mugerwa, S. (2002), ‘Fiscal Policy, Growth and Poverty Reduction in Uganda” UNU, World Institute for Development Economic Research (WIDER), Discussion Paper No. 2002/33 Kelvin Holmes, (1997), “The Uganda Income Tax Act: A Primer on Concepts and Structures, URA. MFPED (2002) Deepening the Understanding of Poverty: Second Participatory Poverty Assessment Process. Kampala: Ministry of Finance, Planning, and Economic Development. MFPED (Various Issues). URA (Various Issues).

28
Table A1. CGE model sets, parameters, and variables
Symbol Explanation Symbol Explanation Sets
Activities Commodities not in CM
Activities with a Leontief function at the top of the technology nest
Transaction service commodities
Commodities Commodities with domestic production
Commodities with domestic sales of domestic output
Factors
Commodities not in CD Institutions (domestic and rest of world)
Exported commodities Domestic institutions
Commodities not in CE Domestic non-government institutions
( )c CM C∈ ⊂ Aggregate imported commodities
Households
Parameters
Weight of commodity c in the CPI
Quantity of stock change
Weight of commodity c in the producer price index
Base-year quantity of government demand
Quantity of c as intermediate input per unit of activity a
Base-year quantity of private investment demand
Quantity of commodity c as trade input per unit of c’ produced and sold domestically
Share for domestic institution i in income of factor f
Quantity of commodity c as trade input per exported unit of c’
Share of net income of i’ to i (i’ ∈ INSDNG’; i ∈ INSDNG)
Quantity of commodity c as trade input per imported unit of c’
Tax rate for activity a
Quantity of aggregate Exogenous direct
a A∈ ( )c CMN C∈ ⊂
( )a ALEO A∈ ⊂ ( )c CT C∈ ⊂
c C∈ ( )c CX C∈ ⊂
( )c CD C∈ ⊂ f F∈
( )c CDN C∈ ⊂ i INS∈
( )c CE C∈ ⊂ ( )i INSD INS∈ ⊂
( )c CEN C∈ ⊂ ( )i INSDNG INSD∈ ⊂
( )h H INSDNG∈ ⊂
ccwts cqdst
cdwts cqg
caica cqinv
'ccicd ifshif
'ccice 'iishii
'ccicm ata
ainta itins

29
intermediate input per activity unit
tax rate for domestic institution i
Quantity of aggregate intermediate input per activity unit
0-1 parameter with 1 for institutions with potentially flexed direct tax rates
Base savings rate for domestic institution i
Import tariff rate
0-1 parameter with 1 for institutions with potentially flexed direct tax rates
Rate of sales tax
Export price (foreign currency)
Transfer from factor f to institution i
Import price (foreign currency)
aiva itins01
imps ctm
imps01 ctq
cpwe i ftrnsfr
cpwm

30
Table A1 continued. CGE model sets, parameters, and variables
Symbol Explanation Symbol Explanation Greek Symbols
Efficiency parameter in the CES activity function
tcrδ CET function share
parameter
Efficiency parameter in the CES value-added function
CES value-added function share parameter for factor f in activity a
Shift parameter for domestic commodity aggregation function
Subsistence consumption of marketed commodity c for household h
Armington function shift parameter
Yield of output c per unit of activity a
CET function shift parameter CES production function exponent
aβ Capital sectoral mobility factor CES value-added function
exponent
Marginal share of consumption spending on marketed commodity c for household h
Domestic commodity aggregation function exponent
CES activity function share parameter Armington function exponent
Share parameter for domestic commodity aggregation function
CET function exponent
qcrδ Armington function share
parameter afatη Sector share of new capital
fυ Capital depreciation rate Exogenous Variables
Consumer price index Savings rate scaling factor (= 0 for base)
Change in domestic institution tax share (= 0 for base; exogenous variable)
Quantity supplied of factor
Foreign savings (FCU) Direct tax scaling factor (= 0 for base; exogenous variable)
Government consumption adjustment factor
Wage distortion factor for factor f in activity a
Investment adjustment factor Endogenous Variables
aftAWF
Average capital rental rate in time period t
Government consumption demand for commodity
Change in domestic Quantity consumed of
aaα
vaaα
vafaδ
accα
mchγ
qcα acθ
tcα
aaρ
vaaρ
mchβ ac
cρ
aaδ
qcρ
acacδ t
cρ
CPI MPSADJ
DTINS fQFS
FSAV TINSADJ
GADJ faWFDIST
IADJ
cQG
DMPS chQH

31
institution savings rates (= 0 for base; exogenous variable)
commodity c by household h
Producer price index for domestically marketed output
Quantity of household home consumption of commodity c from activity a for household h
Government expenditures Quantity of aggregate intermediate input
Consumption spending for household
Quantity of commodity c as intermediate input to activity a
Exchange rate (LCU per unit of FCU)
Quantity of investment demand for commodity
Government savings crQM Quantity of imports of commodity c
Quantity demanded of factor f from activity a
Table A1 continued. CGE model sets, parameters, and variables
Symbol Explanation Symbol Explanation Endogenous Variables Continued
Marginal propensity to save for domestic non-government institution (exogenous variable)
Quantity of goods supplied to domestic market (composite supply)
Activity price (unit gross revenue)
Quantity of commodity demanded as trade input
Demand price for commodity produced and sold domestically
Quantity of (aggregate) value-added
Supply price for commodity produced and sold domestically
Aggregated quantity of domestic output of commodity
crPE Export price (domestic currency)
Quantity of output of commodity c from activity a
Aggregate intermediate input price for activity a fRWF Real average factor
price
ftPK Unit price of capital in time period t Total nominal
absorption
crPM Import price (domestic currency)
Direct tax rate for institution i (i ∈ INSDNG)
DPI achQHA
EG aQINTA
hEH caQINT
EXR cQINV
GSAV
faQF
iMPS cQQ
aPA cQT
cPDD aQVA
cPDS cQX
acQXAC
aPINTA
TABS
iTINS

32
Composite commodity price
Transfers from institution i’ to i (both in the set INSDNG)
Value-added price (factor income per unit of activity)
Average price of factor
Aggregate producer price for commodity
Income of factor f
Producer price of commodity c for activity a
Government revenue
Quantity (level) of activity
Income of domestic non-government institution
Quantity sold domestically of domestic output
Income to domestic institution i from factor f
crQE Quantity of exports afatKΔ
Quantity of new capital by activity a for time period t
cPQ 'iiTRII
aPVA fWF
cPX fYF
acPXAC YG
aQA iYI
cQD ifYIF

33
Table A2. CGE model equations
Production and Price Equations
c a c a aQINT ica QINTA= ⋅ (1)
a c cac C
PINTA PQ ica∈
= ⋅∑ (2)
( )vava aa
1-
va va vafa a f a f a f a
f FQVA QF
ρρα δ α
−
∈
⎛ ⎞= ⋅ ⋅ ⋅⎜ ⎟
⎝ ⎠∑ (3)
( ) ( )1
1
'
va vaa ava vaf va vaf
faf a a f a f a f a f a f a f af F
W WFDIST PVA QVA QF QFρ ρ
δ α δ α−
− − −
∈
⎛ ⎞⋅ = ⋅ ⋅ ⋅ ⋅ ⋅ ⋅ ⋅⎜ ⎟
⎝ ⎠∑ (4)
' ''
vanvan f af a
1-
van vanf a f a f f a f a
f FQF QF
ρρα δ −
∈
⎛ ⎞= ⋅ ⋅⎜ ⎟
⎝ ⎠∑ (5)
11
' ' '' '' ' '''
van vanf a f avan van
f f a f f a f a f f a f a f f a f af F
W WFDIST W WFDIST QF QF QFρ ρδ δ−
− − −
∈
⎛ ⎞⋅ = ⋅ ⋅ ⋅ ⋅ ⋅ ⋅⎜ ⎟
⎝ ⎠∑ (6)
a a aQVA iva QA= ⋅ (7)
a a aQINTA inta QA= ⋅ (8) (1 )a a a a a a aPA ta QA PVA QVA PINTA QINTA⋅ − ⋅ = ⋅ + ⋅ (9)
a c a c aQXAC QAθ= ⋅ (10)
a ac acc C
PA PXAC θ∈
= ⋅∑ (11)1
1accac
cac acc c a c a c
a AQX QXAC
ρρα δ
−−
−
∈
⎛ ⎞= ⋅ ⋅⎜ ⎟
⎝ ⎠∑ (12)
1
1
'
ac acc cac ac
ca c c a c a c a c a ca A
PXAC = QX QXAC QXACPX ρ ρδ δ−
− − −
∈
⎛ ⎞⋅ ⋅ ⋅ ⋅⎜ ⎟⎜ ⎟
⎝ ⎠∑ (13)
''
cr cr c c cc CT
PE pwe EXR PQ ice∈
= ⋅ − ⋅∑ (14)1tct t
c ct t tc cr crc cr c
r r = + (1- )QX QE QD
ρρ ρα δ δ⎛ ⎞⋅ ⋅ ⋅⎜ ⎟
⎝ ⎠∑ ∑ (15)
11t
ctcr
crcr rt
c cc
1 - QE PE = QD PDS
ρδ
δ
−⎛ ⎞⎜ ⎟⋅⎜ ⎟⎜ ⎟⎝ ⎠
∑ (16)

34
Table A3. CGE model equations (continued)
c crcr
= QD QEQX +∑ (17)
c c c c cr crr
PX QX PDS QD PE QE⋅ = ⋅ + ⋅∑ (18)
' ''
c c c c cc CT
PDD PDS PQ icd∈
= + ⋅∑ (19)
( ) ' ''
1cr cr cr c c cc CT
PM pwm tm EXR PQ icm∈
= ⋅ + ⋅ + ⋅∑ (20)
qq q cc c
1-- -q q q
c cr crc cr cr r
= + (1- )QQ QM QDρρ ρα δ δ⎛ ⎞
⋅ ⋅ ⋅⎜ ⎟⎝ ⎠∑ ∑ (21)
qc
11+
qccr c
qc crc
r
QM PDD =1 - QD PM
ρδ
δ
⎛ ⎞⎜ ⎟⋅⎜ ⎟⎜ ⎟⎝ ⎠
∑ (22)
c c crr
= QQ QD QM+∑ (23)
( )1c c c c c cr crr
PQ tq QQ PDD QD PM QM⋅ − ⋅ = ⋅ + ⋅∑ (24)
( )' ' ' ' ' '' '
c c c c c c c cc cc C
= icm QM ice QE icd QT QD∈
⋅ + ⋅ + ⋅∑ (25)
c cc C
CPI PQ cwts∈
= ⋅∑ (26)
c cc C
DPI PDS dwts∈
= ⋅∑ (27)
Institutional Incomes and Domestic Demand Equations
f af f f aa A
YF = WF WFDIST QF∈
⋅ ⋅∑ (28)
i f i f f row fYIF = shif YF trnsfr EXR⎡ ⎤⋅ − ⋅⎣ ⎦ (29)
'' '
i i f i i i gov i rowf F i INSDNG
YI = YIF TRII trnsfr CPI trnsfr EXR∈ ∈
+ + ⋅ + ⋅∑ ∑ (30)
'' ' ' 'ii i i i i iTRII = shii (1- MPS ) (1- tins ) YI⋅ ⋅ ⋅ (31)
( )1 1 hh i h h hi INSDNG
EH = shii MPS (1- tins ) YI∈
⎛ ⎞− ⋅ − ⋅ ⋅⎜ ⎟
⎝ ⎠∑ (32)
' ''
m m mc c h c ch ch h c c h
c CPQ QH = PQ EH PQγ β γ
∈
⎛ ⎞⋅ ⋅ + ⋅ − ⋅⎜ ⎟
⎝ ⎠∑ (33)
c cQINV = IADJ qinv⋅ (34)
c cQG = GADJ qg⋅ (35)

35
Table A3. CGE Model Equations (continued)
c c i govc C i INSDNG
EG PQ QG trnsfr CPI∈ ∈
= ⋅ + ⋅∑ ∑ (36)
System Constraints and Macroeconomic Closures
i i c c c cc ci INSDNG c CMNR c C
gov f gov rowf F
YG tins YI tm EXR tq PQ QQpwm QM
YF trnsfr EXR∈ ∈ ∈
∈
= ⋅ + ⋅ ⋅ + ⋅ ⋅⋅
+ + ⋅
∑ ∑ ∑
∑ (37)
c c a c h c c c ca A h H
QQ QINT QH QG QINV qdst QT∈ ∈
= + + + + +∑ ∑ (38)
f a fa A
QF QFS∈
=∑ (39)
YG EG GSAV= + (40)cr cr row f cr cr i row
r c CMNR f F r c CENR i INSDpwm QM trnsfr pwe QE trnsfr FSAV
∈ ∈ ∈ ∈
⋅ + = ⋅ + +∑ ∑ ∑ ∑ (41)
( )1 ii i c c c ci INSDNG c C c C
MPS tins YI GSAV EXR FSAV PQ QINV PQ qdst∈ ∈ ∈
⋅ − ⋅ + + ⋅ = ⋅ + ⋅∑ ∑ ∑ (42)
( )1i iMPS mps MPSADJ= ⋅ + (43)Capital Accumulation and Allocation Equations
'
f a taf t f t f a t
a f a' ta
QFAWF WF WFDIST
QF
⎡ ⎤⎛ ⎞⎢ ⎥⎜ ⎟= ⋅ ⋅⎢ ⎥⎜ ⎟⎜ ⎟⎢ ⎥⎝ ⎠⎣ ⎦
∑ ∑ (44)
,
'
1 1f a t f t f a ta af a t a
f a' t f ta
QF WF WFDISTQF AWF
η β⎛ ⎞ ⎛ ⎞⎛ ⎞⋅⎜ ⎟= ⋅ ⋅ − +⎜ ⎟⎜ ⎟⎜ ⎟ ⎜ ⎟⎜ ⎟⎜ ⎟ ⎝ ⎠⎝ ⎠⎝ ⎠∑
(45)
c t c ta a cf a t f a t
f t
PQ QINVK
PKη
⎛ ⎞⋅⎜ ⎟Δ = ⋅⎜ ⎟⎜ ⎟⎝ ⎠
∑ (46)
'
c tf t c t
c c' tc
QINVPK PQQINV
= ⋅∑ ∑ (47)
1af a t
f a t+1 f a t ff a t
KQF QF
QFυ
⎛ ⎞Δ= ⋅ + −⎜ ⎟⎜ ⎟
⎝ ⎠ (48)
1 1f a t
af t f t f
f t
KQFS QFS
QFSυ+
⎛ ⎞Δ⎜ ⎟= ⋅ + −⎜ ⎟⎜ ⎟⎝ ⎠
∑ (4

36
ECONOMIC POLICY RESEARCH CENTRE
Research Series
NUMBER
AUTHOR(S)
TITLE
DATE
63 Edward Sennoga, John M. Matovu and
Evarist Twimukye
Tax Evasion and Widening the Tax Base
in Uganda
May 2009
62 Evarist Twimukye and John Mary
Matovu
Macroeconomic and Welfare
Consequences of High Energy Prices
May 2009
61 John M. Matovu & Evarist P.
Twimukye
Increasing World Food Prices: Blessing or Curse?
May 2009
60 Edward Sennoga, John M. Matovu and
Evarist Twimukye,
Social Cash Transfers for the Poorest in
Uganda
May 2009
59 Evarist Twimukye, Winnie Nabiddo & John Mary Matovu
Aid Allocation Effects on Growth and Poverty. A CGE Framework
May 2009
58 Lawrence Bategeka, Madina Guloba & Julius Kiiza
Gender and Taxation: Analysis of Personal Income Tax (PIT)
April 2009
57 Sarah Ssewanyana
Gender and incidence of indirect taxation: Evidence from Uganda
April 2009
56 Ibrahim Kasirye & Eria Hisali The Socioeconomic impact of HIV/AIDS on Education Outcomes in Uganda: School Enrolment and the Schooling Gap in 2002/03
November 2008
55 Sarah N. Ssewanyana and John A. Okidi A microsimulation of the Uganda tax system (UGATAX) and the poor from 1999 to 2003
October 2008
54 Ibrahim Okumu Mike, Alex Nakajjo & Doreen Isoke
Socioeconomic Determinants of Primary School Dropout: The Logistic Model Analysis
February 2008
53 Akankunda Bwesigye Denis
An assessment of the causal relationship between Poverty and HIV/AIDS in Uganda
February 2008
52 Rudaheranwa N., Guloba M. & W. Nabiddo
Costs of Overcoming Market Entry Constraints to Uganda’s Export-Led Growth Strategy
August 2007
51 Ibrahim Kasirye Vulnerability and Poverty Dynamics in Uganda, 1992-1999
August 2007
50 Sebaggala Richard
Wage determination and wage Discrimination In Uganda
May 2007
49 J. Herbert Ainembabazi
Landlessness within the vicious cycle of poverty in Ugandan rural farm households: Why and how is it born?
May 2007
48 Marios Obwona & Sarah N. Ssewanyana
Development impact of higher education in Africa: The case of Uganda
January 2007
47 Charles A. Abuka, Kenneth A. Egesa, Firm Level Investment: Trends, March 2006
37
NUMBER
AUTHOR(S)
TITLE
DATE
Imelda Atai & Marios Obwona determinants and constraints 46 John Okidi, Sarah Ssewanyana,
Lawrence Bategeka & Fred Muhumuza Distributional and Poverty Impacts of Uganda’s Growth: 1992 to 2003
December 2005
45 John Okidi, Sarah Ssewanyana, Lawrence Bategeka & Fred Muhumuza
Growth Stategies and Conditions for Pro-poor Growth: Uganda;s Experience
December 2005
44 Marios Obwona, Francis Wasswa and Victoria Nabwaayo
Taxation of the tobacco industry in Uganda:The Case for excise duty on cigarettes
November 2005
43 Marios Obwona & Stephen Ndhaye
Do the HIPC debt initiatives really achieve the debt sustainability objective? Uganda’s experience
August 2005
42 Nichodemus Rudaheranwa
Trade costs relating to transport barriers on Uganda’s trade
May 2004
41 Okurut Francis Nathan Banga Margaret & Mukungu Ashie
Microfinance and poverty reduction in Uganda: Achievements and challenges
April 2004
40 Ssewanyana Sarah, Nabyonga Orem Juliet, Kasirye Ibrahim, David Lawson
Demand for health care services in Uganda implications for poverty reduction
March 2004
39 Ssewanyana N.S., Okidi A.J., Angemi D., & Barungi V.
Understanding the determinants of income inequality in Uganda
March 2004
38 John A. Okidi Trends in Ugandan household assets during the 1990s
March 2004
37 Nichodemus Rudaheranwa, Lawrence Bategeka and Margaret Banga
Beneficiaries of water service delivery in Uganda
October 2003
36 Nichodemus Rudaheranwa, Lawrence Bategeka, Margaret Banga & Ashie Mukungu
Supply Response of Selected Export Commodities in Uganda
October 2003
35 Godfrey Bahiigwa, Frank Ellis, Odd-Helge Fjeldstad & Vegard Iversen
Rural Taxation in Uganda: Implications for Growth, Income Distribution, Local Government Revenue and Poverty Reduction
January 2004
34 David Lawson, Andy McKay & John Okidi
Poverty Persistence and Transitions in Uganda: A Combined Qualitative and Quantitative Analysis
December 2003
33 Michael Atingi Ego & Rachel Kaggwa Sebudde
Measuring Efficiency of a Market in Transition: The Ugandan Foreign Exchange Market
September 2003
32 John A. Okidi & Andrew McKay Poverty Dynamics in Uganda: 1992 to 2000
May 2003
31 Rosetti Nabbumba & Godfrey Bahiigwa Agricultural Productivity Constraints in Uganda: Implications for Investment
May 2003
30 M.D. Sajjabi Capital Account Liberalization in Uganda: An assessment of the early warning indicators and policy response
July 2003

38
NUMBER
AUTHOR(S)
TITLE
DATE
29 Klaus Deininge, Gloria Kempaka, & Anja Crommelynck
Long-term welfare and investment impact of AIDS-related changes in family composition: Evidence from Uganda
December 2002
28 Klaus Deininger & John Okidi Growth and Poverty reduction in Uganda, 1992-2000: panel data evidence
March 2002
27
Marios Obwona & Adam Mugume Credit Accessibility and Investment Decisions in Uganda’s Manufacturing Sector: An empirical investigation
June 2001
26 Charles A. Abuka & Augustine Wandera
Determinants of Price Level Dynamics in Uganda: Some Stylized Facts and Empirical Evidence
June 2001
25 Godfrey B.A. Bahiigwa Household Food Security in Uganda: An Empirical Analysis
December 1999
24 Bruno R.M. Ocaya The Economic Performance of Highly Indebted African Countries
October 1999
23 Torgny Holmgren, Louis Kasekende, Michael Atingi-Ego & Daniel Ddamulira
Aid and Reform in Uganda – Country Case Study
September 1999
22 Paul Okiira Okwi Poverty in Uganda: A Multivariate Analysis
October 1999
21 Godfrey Bahiigwa The Impact of Trade and Investment Policies on the Environment: The Case of the Fisheries Industry in Uganda
September 1999
20 Peter Mijumbi Estimation of Regional Staple Food Demand Elasticities using 1993-4 Uganda National Survey Data
September 1999
19 John Alphonse Okidi The Degree of Socially Sub-optimal Individual Behaviour in Collective Resource Management
September 1999
18 John Alphonse Okidi The Potential for Community-based Management of Forest Resources in Uganda
September 1999
17 John Alphonse Okidi Regional Growth Disparities and Household Economic Performance in Uganda
September 1999
16 Gloria Kempaka Exchange Rate Movements and Their Effect on Industrial Production in Uganda
September 1999
15 Marios Obwona Foreign Direct Investment: Leader of Follower
September 1999
14 Marilyn Kamanyire External Financing and Economic Performance: The Case of Uganda
September 1999
13 Darlison Kaija Community and Economic Impact of Export Diversification: The Cut-Flower Industry in Uganda
September 1999
12 Klaus Deininger & John Okidi
Capital Market Access, Factor Demand, and Agricultural Development in Rural Areas of Developing Countries: The case of Uganda
June 1999

39
NUMBER
AUTHOR(S)
TITLE
DATE
11 Fred Kakongoro Muhumuza How Responsive is Tax Revenue to Growth in Uganda
June 1999
10
Charles A. Abuka & David M. Sajjabi
The Importance of Domestic and External Factors in the Appreciation of the Real Exchange Rate in Uganda
March 1999
9 Marios Obwona Estimating Unreported Income of the Self-Employed and Tax Evasion in Uganda: An Expenditure-Based Approach
March 1999
8 Francis Nathan Okurut, Jonathan J.A.O. Odwee & Asaf Adebua
Determinants of Regional Poverty in Uganda
February 1999
7 Adam Mugume & Marios Obwona
Public Sector Deficit and Macroeconomic Performance in Uganda
August 1998
6 Michael Atingi-Ego & Winnie Rwebeyanga
The Effectiveness of the Treasury Bill as an Instrument of Monetary Policy in Uganda
October 1998
5 Marios Obwona Savings Mobilisation and Credit Conduits: Formal and Informal Financial Sector Linkages
January 1998
4 Marios Obwona Determinants of Foreign Direct Investments and their Impact on Economic Growth in Uganda
December 1998
3 Fred Opio The Impact of Structural Adjustment Programme on Poverty and Income Distribution in Uganda
September 1997
2 Marios Obwona & John Ddumba-Ssentamu
Nature and Determinants of Domestic Savings in Uganda
August 1997
1 John Matovu & Luke Okumu
Credit Accessibility to the Rural Poor in Uganda
May 1997

Economic Policy Research Centre (EPRC) 51 Pool Road Makerere University Campus P. O. Box 7841 Kampala, Uganda
Tel: 256-41-541023 Fax: 256-41-541022 Email: [email protected]