
Analyzing the Impact of Indirect Tax Reforms on Rank Dependant Social Welfare Functions: A...
15
Groupe de Recherche en Économie et Développement International Cahier de recherche / Working Paper 06-02 Analyzing the Impact of Indirect Tax Reforms on Rank Dependant Social Welfare Functions: A Positional Dominance Approach Paul Makdissi Stéphane Mussard
Transcript of Analyzing the Impact of Indirect Tax Reforms on Rank Dependant Social Welfare Functions: A...

Groupe de Recherche en Économie et Développement International
Cahier de recherche / Working Paper 06-02
Analyzing the Impact of Indirect Tax Reforms on Rank Dependant Social Welfare Functions: A Positional Dominance Approach
Paul Makdissi
Stéphane Mussard
Analyzing the Impact of Indirect TaxReforms on Rank Dependant Social WelfareFunctions: A Positional Dominance Approach�
Paul Makdissiy
Université de SherbrookeStéphane Mussardz
Université de Perpignan
January 2006
Abstract
A new approach is developed to identify thorough marginal taxreforms for pairs of commodities and to test for the robustness oftheir impacts on Yaari�s dual social welfare functions. S-concentrationcurves are provided for every order of positional dominance and anillustration is performed using Canadian data.
Keywords: Dual Social Welfare Function, Stochastic Dominance, TaxReform.JEL Numbers: H20, I30
�This paper was funded through the Social Science and Humanities Research Councilof the Government of Canada and the Fonds Québécois de la Recherche sur la Société etla Culture of the Government of Quebec.
yDépartement d�économique and GRÉDI, Université de Sherbrooke, 2500,boulevard de l�Université, Sherbrooke, Québec, Canada, J1K 2R1; Email:[email protected]
zGRÉDI and GEREM, Département des Sciences Economiques, Université de Per-pignan, 52 Avenue Paul Alduy, 66860 Perpignan Cedex, France, E-mail: [email protected]
1
1 Introduction
The non-intersection between concentration curves is usually considered as
a necessary condition to gauge the distributive e¤ects of tax reforms (see
e.g. Lambert, 1993). The seminal works of Yitzhaki and Thirsk (1990)
and Yitzhaki and Slemrod (1991) are devoted to the construction of welfare-
improving indirect tax reforms for all social welfare functions respecting the
Pigou-Dalton transfer principle. They identify pairs of commodities with
non-intersecting concentration curves, for which the analyst can choose the
di¤erential in the e¢ ciency cost of raising public funds through the two
commodities. Alternatively, Makdissi and Wodon (2002) have introduced
the concept of consumption dominance curve to determine the impact of
marginal indirect tax reforms on poverty for any order of restricted stochas-
tic dominance. This result has been subsequently generalized in Duclos,
Makdissi and Wodon (2004), in which consumption dominance curves are
used to test for the robustness of welfare-improving indirect tax reforms in a
more general framework than the Pigou-Dalton transfer principle.
In this note, following a di¤erent path, we aim at using rank dependant
social welfare functions (see Yaari, 1987, 1988), instead of the traditional util-
itarian criterion, to evaluate the impact of marginal indirect tax reforms on
these social welfare functions. We introduce a new approach, s-concentration
curve, which is a generalization of the usual concentration curve.
The measurement of rank dependant social welfare functions and the as-
sociated ethical criteria are discussed in the next section. Section 3 exposes
a framework to analyze the impact of a marginal indirect tax reform and
introduces the concept of s-concentration curve. Section 4 presents an em-
pirical illustration and a brief section follows to conclude and suggest further
researches.
2
2 Measuring Rank Dependant Social Welfare
Consider the following rank dependant social welfare function:
W (F ) =
Z 1
0
F�1 (p) v (p) dp (A1)
where F�yE�is the distribution of equivalent income yE de�ned over [0; a],
which is a subset of non-negative real incomes and where a is the maximum
conceivable income. F�1 (p) = inf�yE : F
�yE�� p
is the left continuous
inverse income distribution, and v (p) � 0 the weight attached to an individ-ual at the pth percentile of the distribution, with p 2 [0; 1].In order to describe the normative implications underlying the functional
forms of v (�), we de�ne some positional ethical principles. The �rst principlestipulates that ordering two distributions of living standards is equivalent
to make the living standards �parade�simultaneously alongside each other,
and verifying if one parade weakly dominates the other (this exercise was
�rst suggested by Pen, 1971).
De�nition 1 A social welfare functionW (�) satis�es the Pen Parade Prin-ciple if it is increasing in F�1 (p) for any p:
It is straightforward that this principle is satis�ed as long as v (p) � 0 forall p 2 [0; 1]. The second principle is the well-known Pigou-Dalton Principleof Transfers (Pigou, 1912 and Dalton, 1920).
De�nition 2 A social welfare function W (�) satis�es the Pigou-DaltonPrinciple of Transfers if a transfer from a higher-income individual to a
lower-income individual increases social welfare.
These two �rst de�nitions are identical in both utilitarian and rank de-
pendant social welfare approaches. However, it would be appealing to impose
3
more structure on the social welfare function, permitting the decision-maker
to choose between a wide range of transfer principles (see e.g. Gajdos, 2002).
In an utilitarian framework, Kolm (1976) has introduced the Principle of
Transfer Sensitivity. Mehran (1976) and Kakwani (1980) have adapted this
rule to a Positional Principle of Transfer Sensitivity. They stipulate that
a small transfer from a higher-income person to a lower-income one, with
a given proportion of the population between them, is more valuable if it
occurs at lower income levels. In order to propose a formal de�nition of this
principle, let us �rst de�ne �p; W (�; F ) as the variation in W (F ) induced
by a small transfer � from the person at rank p + to the one at rank p,
leaving their position unchanged.
De�nition 3 A social welfare functionW (�) satis�es the Positional Prin-ciple of Transfer Sensitivity if �p; W (�; F ) � �p0; W (�; F ) for all
p0 > p:
Fishburn andWillig (1984) have suggested a generalized transfer principle
for the utilitarian approach. Analogously, Aaberge (2004) has de�ned a posi-
tional version of those generalized transfer principles based on �sp;�W (�; F ),
which is recursively deduced. Formally:
�2p;�2W (�; F ) = �p; 1W (�; F )��p+ 2; 1W (�; F ) ; (1)
where �2 = ( 1; 2),
...
�sp;�sW (�; F ) = �s�1
p;�s�1W (�; F )��s�1p+ s;�
s�1W (�; F ) ; (2)
where �s = ( 1; 2; : : : ; s).
4
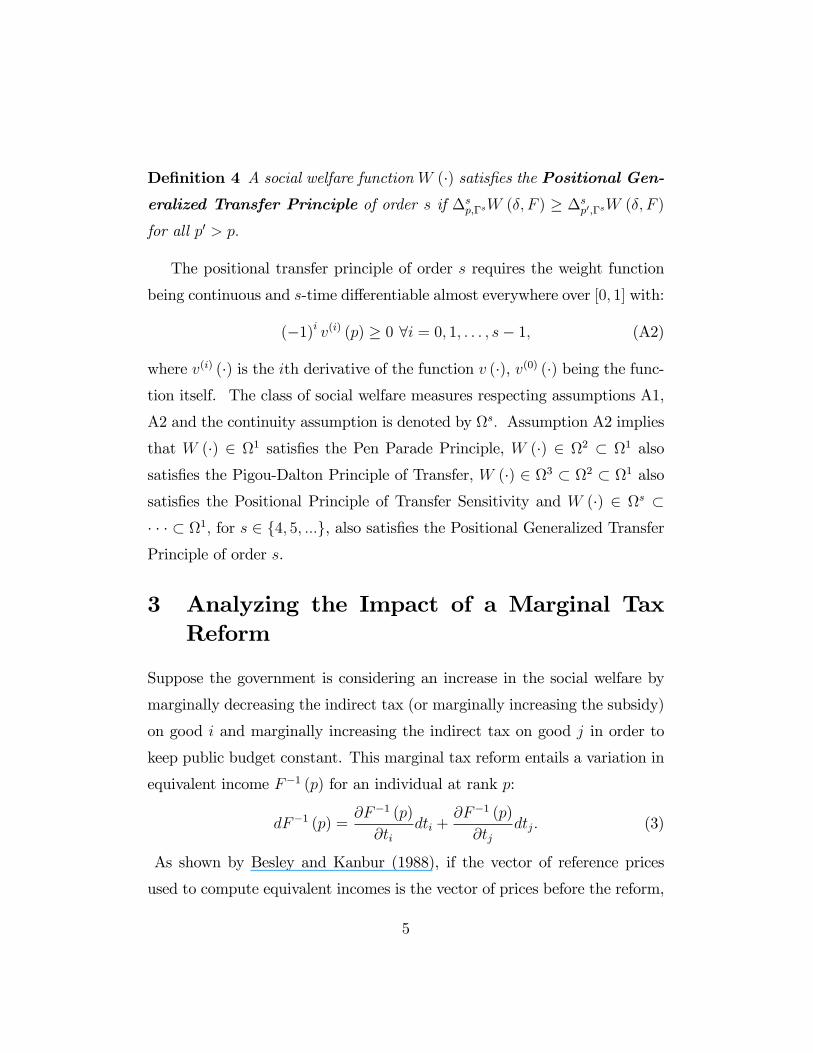
De�nition 4 A social welfare function W (�) satis�es the Positional Gen-eralized Transfer Principle of order s if �s
p;�sW (�; F ) � �sp0;�sW (�; F )
for all p0 > p:
The positional transfer principle of order s requires the weight function
being continuous and s-time di¤erentiable almost everywhere over [0; 1] with:
(�1)i v(i) (p) � 0 8i = 0; 1; : : : ; s� 1; (A2)
where v(i) (�) is the ith derivative of the function v (�), v(0) (�) being the func-tion itself. The class of social welfare measures respecting assumptions A1,
A2 and the continuity assumption is denoted by s: Assumption A2 implies
that W (�) 2 1 satis�es the Pen Parade Principle, W (�) 2 2 � 1 also
satis�es the Pigou-Dalton Principle of Transfer, W (�) 2 3 � 2 � 1 alsosatis�es the Positional Principle of Transfer Sensitivity and W (�) 2 s �� � � � 1; for s 2 f4; 5; :::g, also satis�es the Positional Generalized TransferPrinciple of order s.
3 Analyzing the Impact of a Marginal TaxReform
Suppose the government is considering an increase in the social welfare by
marginally decreasing the indirect tax (or marginally increasing the subsidy)
on good i and marginally increasing the indirect tax on good j in order to
keep public budget constant. This marginal tax reform entails a variation in
equivalent income F�1 (p) for an individual at rank p:
dF�1 (p) =@F�1 (p)
@tidti +
@F�1 (p)
@tjdtj: (3)
As shown by Besley and Kanbur (1988), if the vector of reference prices
used to compute equivalent incomes is the vector of prices before the reform,
5
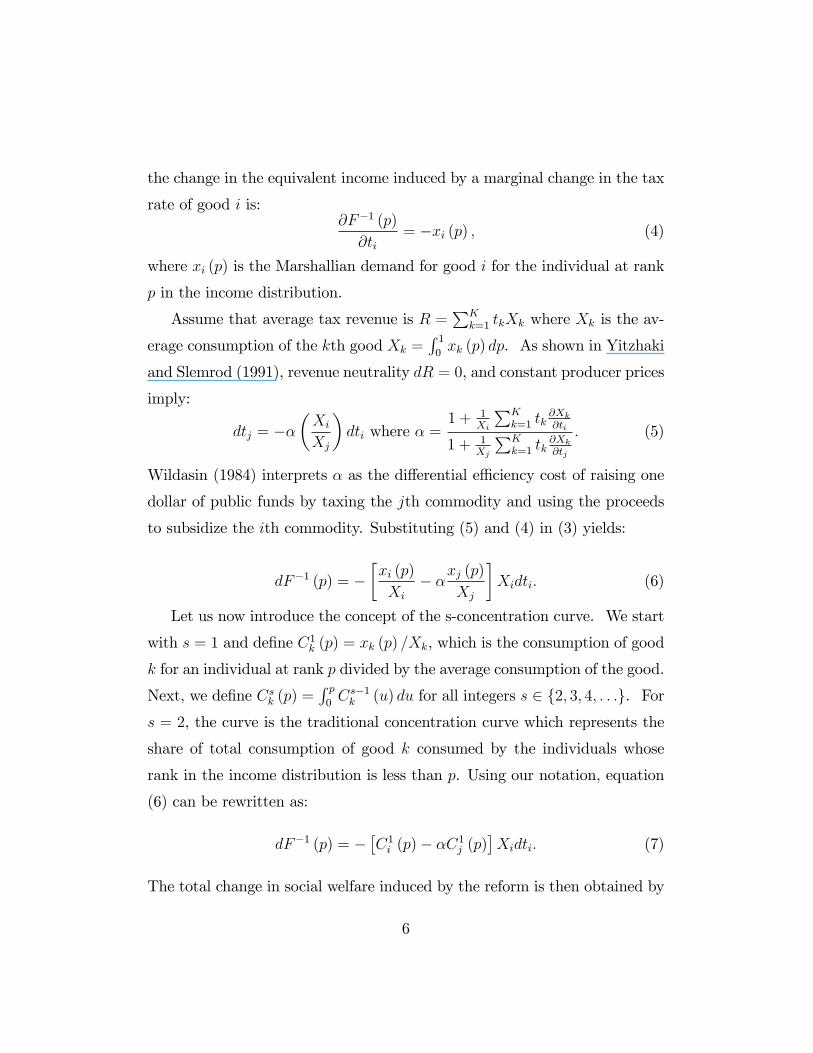
the change in the equivalent income induced by a marginal change in the tax
rate of good i is:@F�1 (p)
@ti= �xi (p) ; (4)
where xi (p) is the Marshallian demand for good i for the individual at rank
p in the income distribution.
Assume that average tax revenue is R =PK
k=1 tkXk where Xk is the av-
erage consumption of the kth good Xk =R 10xk (p) dp. As shown in Yitzhaki
and Slemrod (1991), revenue neutrality dR = 0, and constant producer prices
imply:
dtj = ���Xi
Xj
�dti where � =
1 + 1Xi
PKk=1 tk
@Xk@ti
1 + 1Xj
PKk=1 tk
@Xk@tj
: (5)
Wildasin (1984) interprets � as the di¤erential e¢ ciency cost of raising one
dollar of public funds by taxing the jth commodity and using the proceeds
to subsidize the ith commodity. Substituting (5) and (4) in (3) yields:
dF�1 (p) = ��xi (p)
Xi
� �xj (p)Xj
�Xidti: (6)
Let us now introduce the concept of the s-concentration curve. We start
with s = 1 and de�ne C1k (p) = xk (p) =Xk, which is the consumption of good
k for an individual at rank p divided by the average consumption of the good.
Next, we de�ne Csk (p) =R p0Cs�1k (u) du for all integers s 2 f2; 3; 4; : : :g. For
s = 2, the curve is the traditional concentration curve which represents the
share of total consumption of good k consumed by the individuals whose
rank in the income distribution is less than p. Using our notation, equation
(6) can be rewritten as:
dF�1 (p) = ��C1i (p)� �C1j (p)
�Xidti: (7)
The total change in social welfare induced by the reform is then obtained by
6
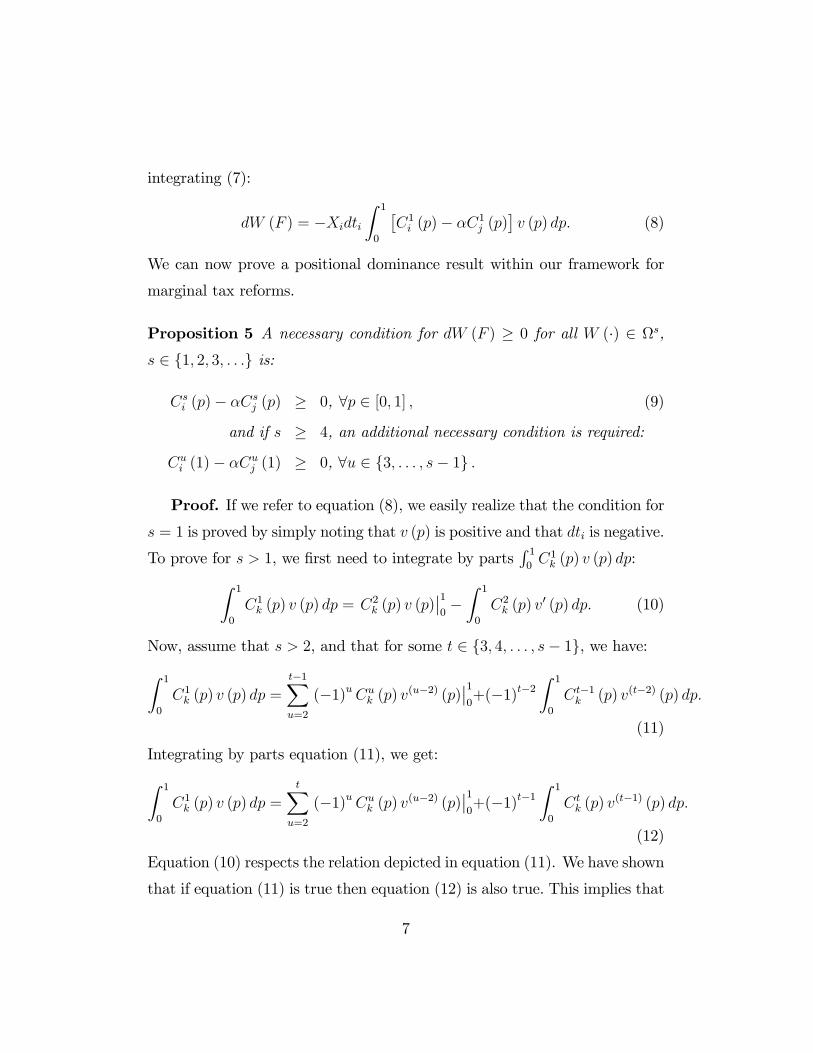
integrating (7):
dW (F ) = �Xidti
Z 1
0
�C1i (p)� �C1j (p)
�v (p) dp: (8)
We can now prove a positional dominance result within our framework for
marginal tax reforms.
Proposition 5 A necessary condition for dW (F ) � 0 for all W (�) 2 s,s 2 f1; 2; 3; : : :g is:
Csi (p)� �Csj (p) � 0, 8p 2 [0; 1] ; (9)
and if s � 4, an additional necessary condition is required:
Cui (1)� �Cuj (1) � 0, 8u 2 f3; : : : ; s� 1g :
Proof. If we refer to equation (8), we easily realize that the condition for
s = 1 is proved by simply noting that v (p) is positive and that dti is negative.
To prove for s > 1, we �rst need to integrate by partsR 10C1k (p) v (p) dp:Z 1
0
C1k (p) v (p) dp = C2k (p) v (p)��10�Z 1
0
C2k (p) v0 (p) dp: (10)
Now, assume that s > 2, and that for some t 2 f3; 4; : : : ; s� 1g, we have:Z 1
0
C1k (p) v (p) dp =t�1Xu=2
(�1)uCuk (p) v(u�2) (p)��10+(�1)t�2
Z 1
0
Ct�1k (p) v(t�2) (p) dp:
(11)
Integrating by parts equation (11), we get:Z 1
0
C1k (p) v (p) dp =
tXu=2
(�1)uCuk (p) v(u�2) (p)��10+(�1)t�1
Z 1
0
Ctk (p) v(t�1) (p) dp:
(12)
Equation (10) respects the relation depicted in equation (11). We have shown
that if equation (11) is true then equation (12) is also true. This implies that
7
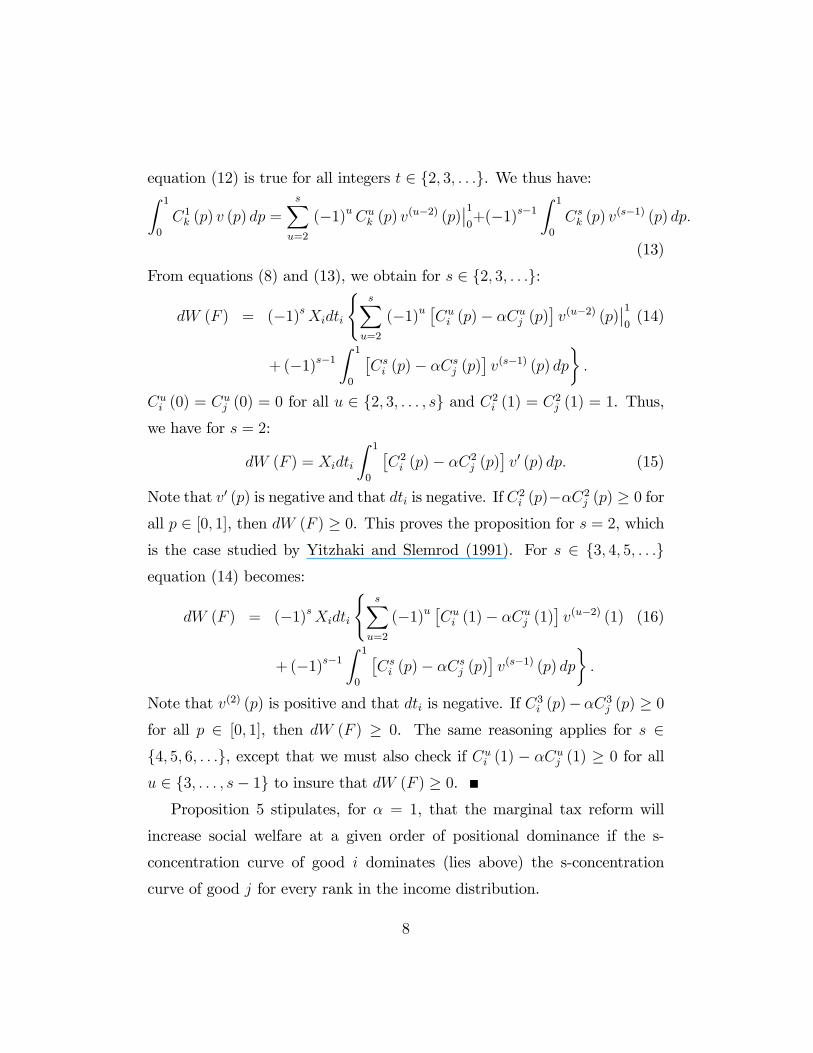
equation (12) is true for all integers t 2 f2; 3; : : :g. We thus have:Z 1
0
C1k (p) v (p) dp =sXu=2
(�1)uCuk (p) v(u�2) (p)��10+(�1)s�1
Z 1
0
Csk (p) v(s�1) (p) dp:
(13)
From equations (8) and (13), we obtain for s 2 f2; 3; : : :g:
dW (F ) = (�1)sXidti
(sXu=2
(�1)u�Cui (p)� �Cuj (p)
�v(u�2) (p)
��10(14)
+(�1)s�1Z 1
0
�Csi (p)� �Csj (p)
�v(s�1) (p) dp
�:
Cui (0) = Cuj (0) = 0 for all u 2 f2; 3; : : : ; sg and C2i (1) = C2j (1) = 1. Thus,
we have for s = 2:
dW (F ) = Xidti
Z 1
0
�C2i (p)� �C2j (p)
�v0 (p) dp: (15)
Note that v0 (p) is negative and that dti is negative. If C2i (p)��C2j (p) � 0 forall p 2 [0; 1], then dW (F ) � 0. This proves the proposition for s = 2, whichis the case studied by Yitzhaki and Slemrod (1991). For s 2 f3; 4; 5; : : :gequation (14) becomes:
dW (F ) = (�1)sXidti
(sXu=2
(�1)u�Cui (1)� �Cuj (1)
�v(u�2) (1) (16)
+(�1)s�1Z 1
0
�Csi (p)� �Csj (p)
�v(s�1) (p) dp
�:
Note that v(2) (p) is positive and that dti is negative. If C3i (p)��C3j (p) � 0for all p 2 [0; 1], then dW (F ) � 0. The same reasoning applies for s 2f4; 5; 6; : : :g, except that we must also check if Cui (1) � �Cuj (1) � 0 for allu 2 f3; : : : ; s� 1g to insure that dW (F ) � 0.Proposition 5 stipulates, for � = 1, that the marginal tax reform will
increase social welfare at a given order of positional dominance if the s-
concentration curve of good i dominates (lies above) the s-concentration
curve of good j for every rank in the income distribution.
8
While the traditional concentration curves can only be used to test for
dominance at order s = 2, this framework enables the decision-maker to test
for any order of positional dominance. For s � 4 an additional necessary con-dition is required at p = 1. If � 6= 1, we can still compare the s-concentrationcurve for good i with the s-concentration curve of good j provided the latter
is multiplied by �.
4 Empirical Illustration
We illustrate our technique on Canadian data using the Survey of House-
hold Spending (2002), which involves 14,655 households. The application is
concerned with eight types of expenditures: housing, electricity, transport,
gasoline, drugs, scholarship, tobacco, and alcoholic drinks.
The choice of � is important. As Yitzhaki and Slemrod (1991) have
pointed out, � < 1 (� > 1) indicates, as a consequence of the tax reform,
whether a diminution (a rise) of the excess burden occurs. The case for
which � = 1 is appealing since it yields neither e¢ ciency gain nor e¢ ciency
loss for the government but can be welfare-improving. In this section we
assume that � = 1. Figure 1 exposes the 2-concentration curves and exhibits
single crossing curves between housing and electricity and between gasoline
and medicaments. In these cases, welfare dominance is not possible. The
2-concentration curves enable us, for instance, to capture any tax reform on
education and health, showing that drug expenditures dominate scholarship
expenses (see Figure 1).
[Figure 1 about here]
Yitzhaki and Slemrod (1991) introduced the �di¤erence in concentration
curve�approach (DCC approach). Our methodology generalizes DCC into
9
�di¤erence in concentration curve of order s�(DCCS). For example, an in-
crease of scholarship taxes entirely �nanced by a decrease of drug taxes would
be welfare improving (see Figure 2).
[Figure 2 about here]
Another atypical tax reform would be welfare-improving by �nancing a
tax reduction on alcoholic drinks by an increasing tax on tobacco.
[Figure 3 about here]
The 3-concentration curves (see Figure 4) can exhibit some dominance
since they implicitly involve a progressive positional transfer sensitivity at
the lower part of the distribution (from a higher-income person to a lower-
income one) coupled with a regressive positional transfer sensitivity at the
upper part of the distribution (from a lower-income person to a higher-income
one).
[Figure 4 about here]
5 Conclusion
Our methodology �the s-concentration curve �allows decision-makers to test
whether the increase in social welfare induced by a marginal tax reform for
two commodities is robust over a large set of rank dependant social welfare
functions.
Instead of looking for non-intersecting concentration curves at the order
2, the positional dominance approach enables the decision-maker to choose
the order of positional dominance of interest. This method can also be used
to adapt Duclos, Makdissi and Wodon�s (2005) tests for the targeting and
allocative e¢ ciency of public transfer programs in a positionalist framework.
10
References
[1] Aaberge, R. (2004), Ranking Intersecting Lorenz Curves, CEIS Tor Ver-
gata Research Paper Series, Working Paper No. 45.
[2] Besley, T. and R. Kanbur (1988), Food Subsidies and Poverty Allevia-
tion, Economic Journal, 98, 701-719.
[3] Dalton, H. (1920), The Measurement of the Inequality of Incomes, Eco-
nomic Journal, 30, 348-361.
[4] Duclos, J.-Y., P. Makdissi and Q. Wodon (2004), Socially-Improving
Tax Reforms, mimeo.
[5] Duclos, J.-Y., P. Makdissi and Q. Wodon (2005), Poverty-Dominant
Transfer Programs: The Role of Targeting and Allocation Rules, Journal
of Development Economics, 77, 53-73.
[6] Fishburn, P.C. and R.D. Willig (1984), Transfer Principles in Income
Redistribution, Journal of Public Economics, 25, 323-328.
[7] Gajdos, T. (2002), Measuring Inequalities without Linearity in Envy:
Choquet Integrals for Symmetric Capacities, Journal of Economic The-
ory, 106, 190-200.
[8] Kakwani, N.C. (1980), On a Class of Poverty Measures, Econometrica,
48, 437-446.
[9] Kolm, S.C. (1976), Unequal Inequlities I, Journal of Economic The-
ory,12, 416-442.
[10] Lambert, P.J. (1993), The Distribution and Redistribution of Income: A
Mathematical Analysis, Manchester University Press, Manchester.
11
[11] Makdissi, P. and Q. Wodon (2002), Consumption Dominance Curves:
Testing for the Impact of Indirect Tax Reforms on Poverty, Economics
Letters, 75, 227-235.
[12] Mehran, F. (1976), Linear Measures of Income Inequality, Econometrica,
44, 805-809.
[13] Pen, J. (1971), Income Distribution: facts, theories, policies, Preaeger,
New York.
[14] Pigou, A.C. (1912), Wealth and Welfare, Macmillan, London.
[15] Wildasin, D.E. (1984), On Public Good Provision With Distortionary
Taxation, Economic Inquiry 22, 227-243.
[16] Yaari, M.E. (1987), The Dual Theory of Choice Under Risk, Economet-
rica, 55, 99-115.
[17] Yaari, M.E. (1988), A Controversial Proposal Concerning Inequality
Measurement, Journal of Economic Theory, 44, 381-397.
[18] Yitzhaki, S. and J. Slemrod (1991), Welfare Dominance: An Application
to Commodity Taxation, American Economic Review, 81, 480-496.
[19] Yitzhaki, S. and W. Thirsk (1990), Welfare Dominance and the De-
sign of Excise Taxation in the Côte d�Ivoire, Journal of Development
Economics, 33, 1-18.
12
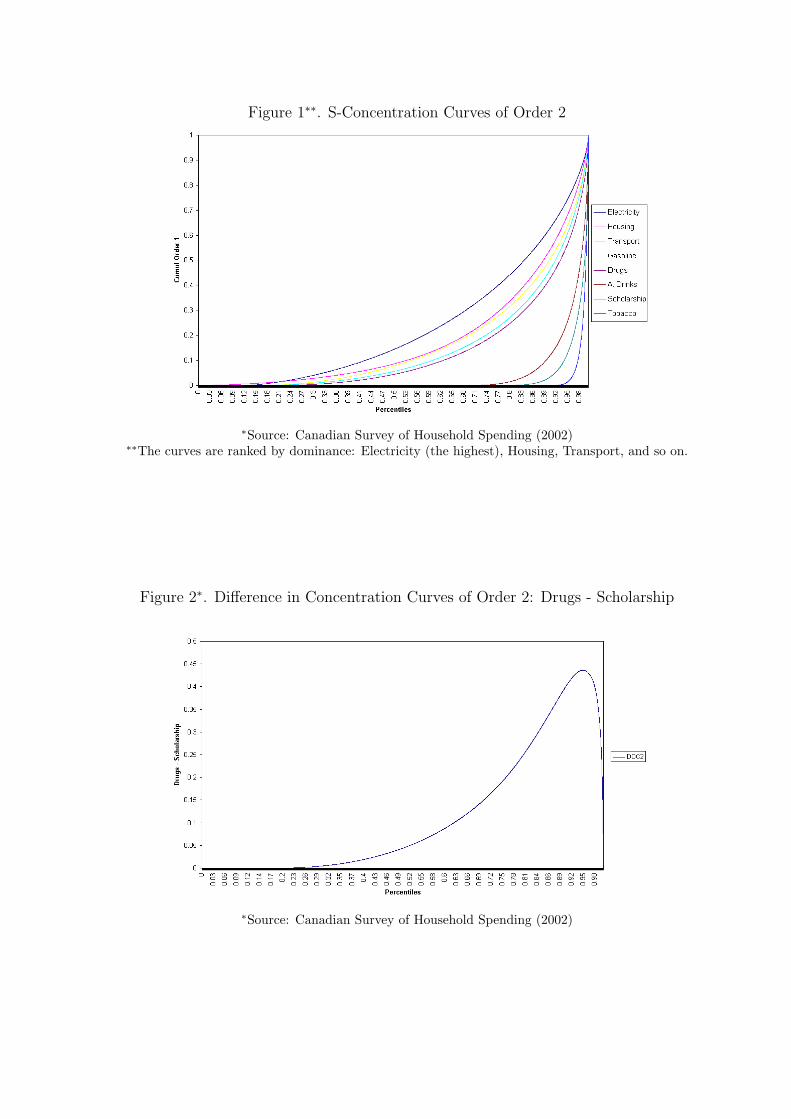
Figure 1∗∗. S-Concentration Curves of Order 2
∗Source: Canadian Survey of Household Spending (2002)∗∗The curves are ranked by dominance: Electricity (the highest), Housing, Transport, and so on.
Figure 2∗. Difference in Concentration Curves of Order 2: Drugs - Scholarship
∗Source: Canadian Survey of Household Spending (2002)
1
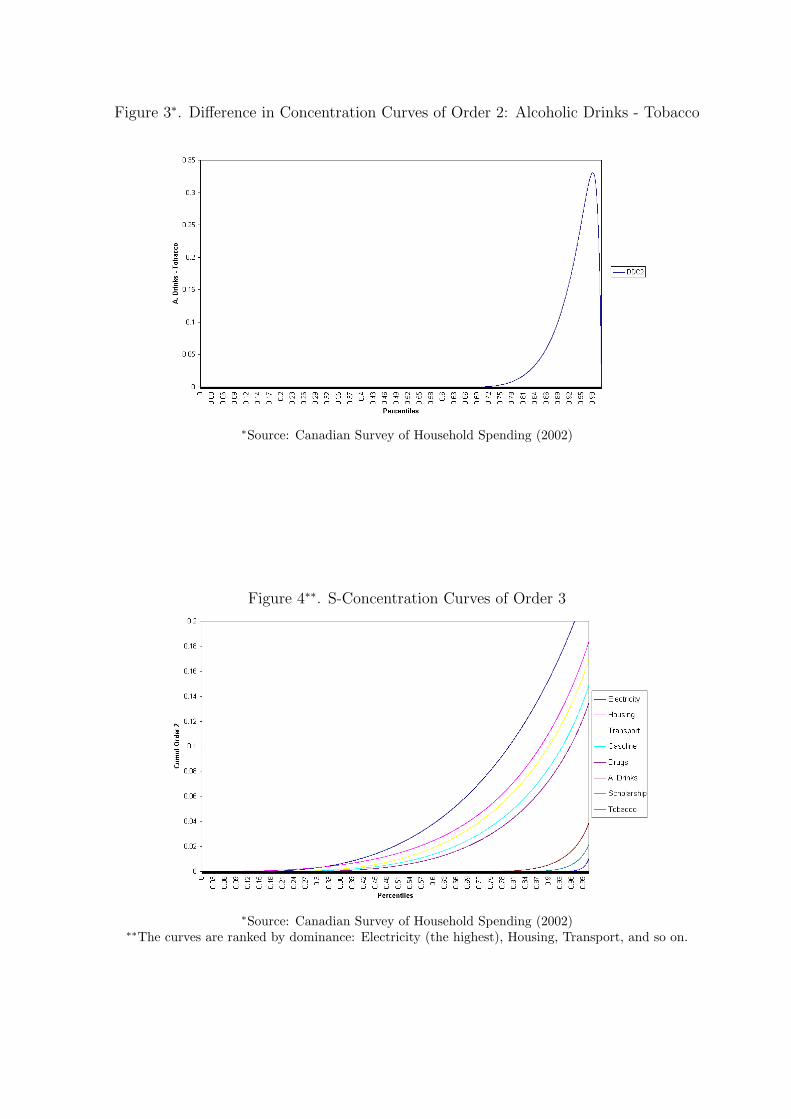
Figure 3∗. Difference in Concentration Curves of Order 2: Alcoholic Drinks - Tobacco
∗Source: Canadian Survey of Household Spending (2002)
Figure 4∗∗. S-Concentration Curves of Order 3
∗Source: Canadian Survey of Household Spending (2002)∗∗The curves are ranked by dominance: Electricity (the highest), Housing, Transport, and so on.
2