Positional cloning of the combined hyperlipidemia gene Hyplip1
16
Positional cloning of the combined hyperlipidemia gene Hyplip1 Jackie S. Bodnar 1 , Aurobindo Chatterjee 2 , Lawrence W. Castellani 1 , David A. Ross 2 , Jeffrey Ohmen 2 , James Cavalcoli 2 , Chenyan Wu 2 , Katherine M. Dains 2 , Joe Catanese 2 , Michael Chu 1 , Sonal S. Sheth 1 , Kanti Charugundla 1 , Peter Demant 3 , David B. West 2 , Pieter de Jong 2 , and Aldons J. Lusis 1 1 Molecular Biology Institute and Departments of Medicine, Human Genetics, and Microbiology, Immunology and Molecular Genetics, University of California, Los Angeles, 47-123 CHS, UCLA School of Medicine, Los Angeles, California 90095, USA 2 Department of Molecular Science, Pfizer Global Research and Development, Ann Arbor Laboratories, Pfizer Inc., Ann Arbor, Michigan 48105, USA 3 Division of Molecular Genetics, The Netherlands Cancer Institute, Amsterdam, The Netherlands Abstract Familial combined hyperlipidemia (FCHL, MIM-144250) is a common, multifactorial and heterogeneous dyslipidemia predisposing to premature coronary artery disease 1– 2 and characterized by elevated plasma triglycerides, cholesterol, or both3 – 4. We identified a mutant mouse strain, HcB-19/Dem (HcB-19), that shares features with FCHL, including hypertriglyceridemia, hypercholesterolemia, elevated plasma apolipoprotein B and increased secretion of triglyceride-rich lipoproteins 5 . The hyperlipidemia results from spontaneous mutation at a locus, Hyplip1, on distal mouse chromosome 3 in a region syntenic with a 1q21–q23 FCHL locus identified in Finnish, German, Chinese and US families 6–8 . We fine-mapped Hyplip1 to roughly 160 kb, constructed a BAC contig and sequenced overlapping BACs to identify 13 candidate genes. We found substantially decreased mRNA expression for thioredoxin interacting protein (Txnip). Sequencing of the critical region revealed a Txnip nonsense mutation in HcB-19 that is absent in its normolipidemic parental strains. Txnip encodes a cytoplasmic protein that binds and inhibits thioredoxin, a major regulator of cellular redox state. The mutant mice have decreased CO 2 production but increased ketone body synthesis, suggesting that altered redox status down-regulates the citric-acid cycle, sparing fatty acids for triglyceride and ketone body production. These results reveal a new pathway of potential clinical significance that contributes to plasma lipid metabolism. For fine-mapping, we constructed a large F2 intercross between HcB-19, a recombinant congenic strain that is 88% C3H/DiSnA (C3H) and 12% C57BL/10ScSnA (B10)9 – 10, and the evolutionarily distant strain CAST/Ei. Approximately 2,700 (HcB-19 × CAST/Ei)F2 mice were generated and genotyped for 17 Hyplip1 region microsatellite markers. Triglycerides were significantly elevated in HcB-19 (Fig. 1a) and yielded the highest lod score in our previously reported cross 5 . We therefore measured triglycerides for approximately one-third of (HcB-19 × CAST/Ei)F2 mice (Fig. 1b). Because considerable phenotypic overlap made assigning recombinant animals to a particular genotypic class difficult, we searched for additional phenotypes. © 2002 Nature Publishing Group Correspondence should be addressed to A.J.L. ([email protected]). NIH Public Access Author Manuscript Nat Genet. Author manuscript; available in PMC 2010 March 29. Published in final edited form as: Nat Genet. 2002 January ; 30(1): 110–116. doi:10.1038/ng811. NIH-PA Author Manuscript NIH-PA Author Manuscript NIH-PA Author Manuscript
-
Upload
independent -
Category
Documents
-
view
1 -
download
0
Transcript of Positional cloning of the combined hyperlipidemia gene Hyplip1
Positional cloning of the combined hyperlipidemia gene Hyplip1
Jackie S. Bodnar1, Aurobindo Chatterjee2, Lawrence W. Castellani1, David A. Ross2, JeffreyOhmen2, James Cavalcoli2, Chenyan Wu2, Katherine M. Dains2, Joe Catanese2, MichaelChu1, Sonal S. Sheth1, Kanti Charugundla1, Peter Demant3, David B. West2, Pieter deJong2, and Aldons J. Lusis1
1Molecular Biology Institute and Departments of Medicine, Human Genetics, and Microbiology,Immunology and Molecular Genetics, University of California, Los Angeles, 47-123 CHS, UCLASchool of Medicine, Los Angeles, California 90095, USA 2Department of Molecular Science, PfizerGlobal Research and Development, Ann Arbor Laboratories, Pfizer Inc., Ann Arbor, Michigan48105, USA 3Division of Molecular Genetics, The Netherlands Cancer Institute, Amsterdam, TheNetherlands
AbstractFamilial combined hyperlipidemia (FCHL, MIM-144250) is a common, multifactorial andheterogeneous dyslipidemia predisposing to premature coronary artery disease1–2 and characterizedby elevated plasma triglycerides, cholesterol, or both3–4. We identified a mutant mouse strain,HcB-19/Dem (HcB-19), that shares features with FCHL, including hypertriglyceridemia,hypercholesterolemia, elevated plasma apolipoprotein B and increased secretion of triglyceride-richlipoproteins5. The hyperlipidemia results from spontaneous mutation at a locus, Hyplip1, on distalmouse chromosome 3 in a region syntenic with a 1q21–q23 FCHL locus identified in Finnish,German, Chinese and US families6–8. We fine-mapped Hyplip1 to roughly 160 kb, constructed aBAC contig and sequenced overlapping BACs to identify 13 candidate genes. We found substantiallydecreased mRNA expression for thioredoxin interacting protein (Txnip). Sequencing of the criticalregion revealed a Txnip nonsense mutation in HcB-19 that is absent in its normolipidemic parentalstrains. Txnip encodes a cytoplasmic protein that binds and inhibits thioredoxin, a major regulatorof cellular redox state. The mutant mice have decreased CO2 production but increased ketone bodysynthesis, suggesting that altered redox status down-regulates the citric-acid cycle, sparing fatty acidsfor triglyceride and ketone body production. These results reveal a new pathway of potential clinicalsignificance that contributes to plasma lipid metabolism.
For fine-mapping, we constructed a large F2 intercross between HcB-19, a recombinantcongenic strain that is 88% C3H/DiSnA (C3H) and 12% C57BL/10ScSnA (B10)9–10, and theevolutionarily distant strain CAST/Ei. Approximately 2,700 (HcB-19 × CAST/Ei)F2 micewere generated and genotyped for 17 Hyplip1 region microsatellite markers. Triglycerideswere significantly elevated in HcB-19 (Fig. 1a) and yielded the highest lod score in ourpreviously reported cross5. We therefore measured triglycerides for approximately one-thirdof (HcB-19 × CAST/Ei)F2 mice (Fig. 1b). Because considerable phenotypic overlap madeassigning recombinant animals to a particular genotypic class difficult, we searched foradditional phenotypes.
© 2002 Nature Publishing GroupCorrespondence should be addressed to A.J.L. ([email protected]).
NIH Public AccessAuthor ManuscriptNat Genet. Author manuscript; available in PMC 2010 March 29.
Published in final edited form as:Nat Genet. 2002 January ; 30(1): 110–116. doi:10.1038/ng811.
NIH
-PA Author Manuscript
NIH
-PA Author Manuscript
NIH
-PA Author Manuscript
In our previous cross of 183 (HcB-19 × B10)F2 animals, Hyplip1 was linked to plasmatriglycerides, LDL+VLDL cholesterol, total cholesterol and free fatty acid (FFA) amounts withlod scores of 30.5, 22.4, 10.2 and 9.2, respectively, at peak marker D3Mit101 (ref. 5 and datanot shown). As FFA levels were elevated and fatty acids are esterified to produce triglyceridesor partially oxidized to form ketone bodies, we examined plasma levels of the predominantketone body, β-hydroxybutyrate (β-HB). HcB-19 mice showed hyperketonemia, with β-HBlevels increased approximately threefold (Fig. 1c). Plasma β-HB levels segregated with theHyplip1 locus in the (HcB-19 × CAST/Ei)F2 cross (Fig. 1d), yielding a peak lod score of 219at D3Mit101, whereas triglycerides reached a lod score of 90. Notably, the variability andoverlap of β-HB levels between the genotypic classes were reduced as compared withtriglycerides, making the assessment of Hyplip1 genotype for recombinant animals moredefinitive.
From approximately 2,700 (HcB-19 × CAST/Ei)F2 mice, we generated 184 animals withcrossovers between D3Mit76 and D3Mit75 (Fig. 2a). Initial analysis restricted Hyplip1between D3Mit76 and D3Mit100 (ref. 11). We backcrossed recombinant animals to HcB-19for progeny-testing to confirm the Hyplip1 genotype by analysis of backcross progeny thatinherited the same Hyplip1 haplotype. To facilitate fine-mapping, we identified additionalpolymorphic SNP and microsatellite markers between HcB-19 and CAST/Ei (Fig. 2b).
We assessed the probability that a particular haplotype carried the Hyplip1 mutation by logisticregression. We first analyzed the phenotype distribution of ketone body and triglyceride levelsof nonrecombinant animals that were homozygous, heterozygous or wildtype with respect toHyplip1 mutant alleles between D3Mit76 and D3Mit100. Using the resultant regressionequations and sex-adjusted ketone body and triglyceride levels, we determined the predictiveprobability that the original recombinant was heterozygous [P(c/h)] and the predictiveprobabilities that backcross progeny with the same haplotype were homozygous with respectto Hyplip1 mutant alleles [P(h/h)]. On the basis of four critical recombinant animals and theirbackcross progeny (Fig. 3), as well as additional recombinants and progeny (Table 1), thecritical region was narrowed to roughly 160 kb between D3Pds7 and D3Pds13. We thereforefocused on this interval for physical mapping and sequencing.
To facilitate candidate gene identification, we constructed a BAC contig between D3Mit76and D3Mit157 (Fig. 2b). We used a ‘chromosome walking’ strategy to develop a completecontig containing 128 clones and covering 3 Mb. Four BACs representing a minimum tilingpath across the critical region were subcloned and sequenced, revealing 13 genes (Fig. 2c). Ofthese, only four (Txnip, Rbm8, Pex11b, and Itga10) were entirely within the maximal criticalinterval. We evaluated candidate genes by northern analysis and sequencing to identify possibledifferences between HcB-19 and its normolipidemic parental control.
Northern blot data revealed that mRNA amounts for Txnip were reduced approximatelyeightfold in HcB-19 (Fig. 4a). No expression differences were observed for any other genesfrom the locus (data not shown). Sequencing Txnip RT–PCR products revealed a T→Atransversion in HcB-19 at position 337 in the 1,456-bp cDNA (Fig. 4b). This spontaneous pointmutation changes a tyrosine (TAT) to a stop codon (TAA) at amino acid 97 in Txnip, whichnormally consists of 395 residues. Notably, this nonsense mutation in HcB-19 was absent inthe C3H parental strain and 94 other strains of mice we examined (Fig. 4b and data not shown).In addition, by comparing over 175 kb of fully aligned, contiguous genomic sequence fromHcB-19 and C3H cosmid libraries, we observed only one coding difference, the Txnip nonsensemutation.
The gene Txnip contains eight exons spanning approximately 5 kb (Fig. 2d). The Hyplip1nonsense mutation occurs in exon 2 at codon 97 (Fig. 2d). The Txnip transcript was fairly
Bodnar et al. Page 2
Nat Genet. Author manuscript; available in PMC 2010 March 29.
NIH
-PA Author Manuscript
NIH
-PA Author Manuscript
NIH
-PA Author Manuscript

ubiquitously expressed in all tissues examined, with the highest abundance in heart, liver andkidney (Fig. 4c). The decrease in Txnip mRNA in HcB-19 presumably results from nonsense-mediated mRNA decay through RNA surveillance mechanisms for the detection anddegradation of transcripts with premature stop codons12–13.
The Hyplip1 nonsense mutation affects several aspects of lipid metabolism. In (HcB-19 ×C57BL/6J)N4 congenic mice, plasma levels of TG, β-HB, TC, LDL+VLDL-C and FFA weresignificantly increased as compared with wildtype littermates (Fig. 5a–e). In addition, in(HcB-19 × CAST/Ei)F2 animals, the Hyplip1 mutation was associated with increased plasmatotal cholesterol and LDL+VLDL cholesterol (Fig. 5f–g) as well as increased amounts of TGand β-HB (Fig. 1b,d), consistent with our previous cross5. Plasma HDL cholesterol did notsegregate with Hyplip1 (data not shown).
We previously showed that triglyceride secretion in vivo is increased roughly 70% inHyplip1 mutant mice5. Consistent with this, we found an approximately 70% increase intriglyceride content of HcB-19 livers (Fig. 5i). In addition, from isolated liver slices weobserved that incorporation of 14C-oleate into newly synthesized triglycerides was increasedapproximately 70% (Fig. 5j).
Hyplip1 mice have increased plasma FFA levels (Fig. 5e,h), which is predicted to increase thesupply of exogenous FA to the liver because uptake is concentration-dependent. Hepatic FAare oxidized primarily in mitochondria, where they undergo complete oxidation to CO2 via theTCA cycle, or partial oxidation to produce ketone bodies. As discussed, plasma β-HB wasincreased threefold in HcB-19 (Fig. 1c). Consistent with these findings, we observed a twofoldincrease in ketone body synthesis in HcB-19 liver slices (Fig. 5k). In contrast, CO2 productionwas significantly decreased (Fig. 5l), demonstrating reduced oxidation by the TCA cycle.Taken together, the data indicate that Hyplip1 results in increased FFA uptake by liver anddecreased oxidation of FA by the TCA cycle, resulting in increased availability for triglycerideand ketone body synthesis. In addition, plasma lactate was significantly increased in HcB-19mice (Fig. 5m), whereas plasma pyruvate was decreased (Fig. 5n). As the lactate: pyruvateratio reflects [NADH]:[NAD+] concentration14, these findings probably reflect an alteredredox state resulting from the Hyplip1 mutation in Txnip.
The gene TXNIP was first identified from HL-60 cells stimulated to differentiate intomonocytes/macrophages by 1,25- dihydroxyvitamin D3 treatment15. More recent workrevealed that both TXNIP and Txnip bind reduced thioredoxin (TXN) in vitro and in vivo andinhibit its reducing activity16–17. In studies with partial proteins, amino acids 134–395 of Txnipwere required for TXN binding and inhibition17. Because the Hyplip1 nonsense mutationoccurs at residue 97, the truncated protein will be missing crucial amino acids, resulting inmisregulation of thioredoxin.
Thioredoxin is a 12-kD thiol-oxidoreductase with many cellular functions, including cellactivation18, cell growth19, apoptosis20, signal transduction21 and gene expression22. BecauseTxnip inhibits thioredoxin, the Hyplip1 mutation may cause hyperlipidemia by affecting theTxn pathway, one of the major reducing systems23. Alterations in redox state could explainseveral aspects of the hyperlipidemic phenotype. For example, increased [NADH]:[NAD+]inhibits flux through the TCA cycle and results in decreased CO2 production24–25. As a result,more FA are available for the alternative oxidative pathway and for esterification.
Our results provide evidence of a new pathway with a profound influence on the regulation oflipid metabolism. Our data indicate the Hyplip1 mutation causes a decreased flux of FA throughthe TCA cycle, resulting in increased availability for ketogenesis and triglyceride synthesis.Further studies are warranted to elucidate the exact molecular mechanisms by which the
Bodnar et al. Page 3
Nat Genet. Author manuscript; available in PMC 2010 March 29.
NIH
-PA Author Manuscript
NIH
-PA Author Manuscript
NIH
-PA Author Manuscript
Hyplip1 nonsense mutation in Txnip causes combined hyperlipidemia in HcB-19, as well asthe potential role the human ortholog may have in FCHL or other metabolic disorders.
MethodsMice and mouse husbandry
The development of the recombinant congenic mutant mouse strain HcB-19/Dem wasdescribed previously5,9. Because HcB-19 animals were initially unavailable, we used (HcB-19× BALB/c)F1 mice for breeding to CAST/Ei mice. We genotyped the resultant progeny forpolymorphic markers D3Mit29, D3Mit76, D3Mit75 and D3Mit121 to exclude animals withBALB/c alleles within or near the Hyplip1 region. Animals with HcB-19 alleles wereintercrossed to produce approximately 2,000 progeny that are essentially (HcB-19 × CAST/Ei)F2 at the Hyplip1 locus. In addition, we generated approximately 700 (HcB-19 × CAST/Ei)F2 mice. These two groups of F2 animals are referred to as ‘(HcB-19 × CAST/Ei)F2’ mice.We constructed (HcB-19 × C57BL/6J)N4 congenic mice by backcrossing HcB-19 to C57BL/6J for four generations and selecting for HcB-19 alleles at markers D3Mit76 and D3Mit101 ateach generation. Heterozygous N4 mice were intercrossed to obtain progeny that we screenedto identify congenic mice homozygous with respect to the Hyplip1 nonsense mutation orwildtype. All mice were housed in groups of five or less animals per cage and maintained ona 12-h light-dark cycle at an ambient temperature of 23 °C. They were allowed ad libitumaccess to water and standard Purina Rodent Chow containing 4.5% fat (Ralston-Purina Co.).
Plasma lipid, ketone body and lactate determinationsMice were fasted for 12 h before retro-orbital bleeding and were bled under isofluoraneanesthesia 3–6 h after the beginning of the light cycle, with EDTA used as the anticoagulant.We determined plasma lipids as described previously5. We measured β-hydroxybutyrate levelsin duplicate using a kit (#310-A, Sigma). We pre-chilled blood collection tubes on ice andcentrifuged the samples within 5 min to remove erythrocytes to obtain accurate plasma lactateconcentrations, which we measured in duplicate using a kit (#735-10, Sigma). For pyruvatedeterminations, we did not use EDTA, as whole blood was immediately deproteinized and thepyruvate measured using a kit (#726-UV, Sigma). For pyruvate measurements, we pre-chilledblood collection tubes with cold perchloric acid and kept the blood-precipitate mixture on icefor at least 5 min to ensure complete protein precipitation.
Statistical analysisWe analyzed linkage data and calculated lod scores and recombination distances using the MapManager QT v.3.0 Program. As the triglyceride and ketone body levels of heterozygous miceoverlapped with both wildtype and Hyplip1 mutant homozygous groups, recombinant micewere evaluated statistically using logistic regression. We calculated predictive probabilitiesusing the logistic subroutine of the SAS program (Version 6.10, 1993, SAS Institute). Giventhe distribution of triglyceride and ketone body levels for each genotype from animals thatwere nonrecombinant between markers D3Mit76 and D3Mit100, we calculated logisticregression coefficients by using the ketone body values and the natural log of the triglyceridevalues (the natural log was used to normalize the data set.) We then used these logisticregression coefficients to calculate the probability that each parental recombinant animal washeterozygous and that each backcross progeny with the same haplotype was homozygous withrespect to Hyplip1, given the sex-adjusted triglyceride and ketone body values. The predictiveprobabilities thus represent an estimate of the probability that a particular animal isheterozygous [P(c/h)] or homozygous [P(h/h)] for the Hyplip1 mutation based on itsphenotype. The total cholesterol values were highly correlated with triglycerides in this sample(r=0.8025) and inclusion of total cholesterol levels did not significantly effect the predictive
Bodnar et al. Page 4
Nat Genet. Author manuscript; available in PMC 2010 March 29.
NIH
-PA Author Manuscript
NIH
-PA Author Manuscript
NIH
-PA Author Manuscript
probability values after triglycerides were used in the prediction, although total cholesterollevels were significantly linked to the Hyplip1 locus (P<0.00005).
Radiation hybrid mapping and genotypingWe mapped markers and genes from the Hyplip1 region using the mouse/hamster T31 radiationhybrid panel (Research Genetics). All clone lines producing a breakpoint were typed induplicate, as were any ambiguous typings. PCR and thermal cycling conditions were asrecommended by the manufacturer. All mapping data are available at The Jackson LaboratoryMouse Radiation Hybrid database. We carried out automated genotyping of DNAmicrosatellite markers using fluorescent-labeled primers (Research Genetics) and ABI 377machines according to standard protocols.
BAC contig and cosmid library constructionWe identified BACs for the Hyplip1 region by hybridizing labeled PCR products from theHyplip1 locus to filters from the RPCI-23 mouse BAC libraries (Children’s Hospital, Oakland).Briefly, high-density filters with 10× coverage were hybridized with random-primed 32P-labeled probes (1 × 10⁶ cpm ml−1 hybridization solution). Ten to twenty PCR products wereroutinely pooled per hybridization. We pre-hybridized the filters for 1 h and then hybridizedwith labeled probes overnight (16–18 h) at 65 °C. We washed the filters at 65 °C for 4–6 timesuntil all nonbound probe was essentially removed. The filters were then exposed to phosphorscreens (Molecular Dynamics) for 2–24 h and analyzed on the Storm Image Analysis System(Molecular Dynamics). We interpreted the positions of positive clones according to themanufacturer’s instructions, using transparent overlays as an orientation guide. The order ofthe markers was based on radiation hybrid mapping data and their presence or absence withineach BAC clone bin. We sized BAC clones by pulsed-field gel electrophoresis. BAC ends weresequenced for primer design, PCR-amplified, and then used for chromosome walking and gapclosure of the approximately 3-Mb contig we constructed between markers D3Mit76 andD3Mit157. For the construction of cosmid libraries, we used fresh livers from C3H and HcB-19mice to prepare high–molecular weight genomic DNA embedded in agarose plugs. GenomicDNA was partially digested by MboI before ligation to the pFOS1 vector that was treated withAatII and BamH1 (New England Biolabs). The ligated mixture was packaged using the GigpackIII xl–11 (Stratagene) according to the manufacturer’s protocol and transformed into DH10Bcompetent cells. We determined the titer of roughly 200 clones and aliquoted them into 96-well format. Row and column pools were prepared for subsequent screening. We plated severalhundred colonies from each positive well, picked 1,536 colonies into four 384-well microtiterplates and then transferred the cultures onto nylon membranes for hybridization to identifyindividual positive clones.
Sequencing and sequence data analysisWe extracted BAC DNA using a standard cesium chloride cushion26. For sequencing, a sub-library in pUC18 was first constructed from each BAC clone. Briefly, we randomly shearedBAC DNA using a sonicator and end-filled with Klenow, then size-fractionated by agarose gelelectrophoresis and collected fragments between 1.5 kb and 3.0 kb. We cloned the gel-purifiedfragments into SmaI-cut, bacterial alkaline phosphatase–treated pUC18. Ligation (RocheRapid Ligation kit) and transformation of XL-10 competent cells (Stratagene) were carried outaccording to the manufacturer’s instructions. We picked several thousand clones from eachBAC library for high-throughput sequencing. We extracted plasmid DNA using the QiagenBiorobot. Cycle sequencing was carried out using BigDye terminators (PE AppliedBiosystems), purified on Centrisep spin columns in 96-well format and analyzed on an ABI3700 capillary sequencer (PE Applied Biosystems). We purified PCR products using a kit(Qiagen) and used 30–60 ng for cycle sequencing. Raw sequence data were analyzed and
Bodnar et al. Page 5
Nat Genet. Author manuscript; available in PMC 2010 March 29.
NIH
-PA Author Manuscript
NIH
-PA Author Manuscript
NIH
-PA Author Manuscript
assembled using PHRED and PHRAP, and then vector and repeat sequences were masked andhigh-quality sequence compared to available sequence databases.
Northern-blot analysis and RT–PCRWe isolated total RNA from liver with Trizol reagent (Life Technologies) according to themanufacturer’s instructions. PolyA RNA was isolated using the Oligotex mRNA kit (Qiagen),and then 2 µg was resolved by electrophoresis in a denaturing agarose gel using theNorthernMax protocol and reagents (Ambion) and transferred to Brightstar-Plus membranes(Ambion) according to the manufacturer’s instructions. We labeled DNA with 32P-dCTP(Amersham Pharmacia Biotech) using a random-prime kit (Life Technologies). We hybridizedand washed the filters according to the NorthernMax protocol, then exposed the filtersovernight and imaged them using the Storm Image Analysis System (Molecular Dynamics).We carried out RT–PCR on total RNA using the Access RT–PCR kit (Promega).
Metabolism of 14C-oleate in liver slicesAfter an overnight fast, mice were anesthetized with pentobarbital (50 mg kg−1) and the liverremoved. We used a Staddie-Riggs microtome to obtain fresh liver slices (~0.5 mm thick) thatwere immediately weighed and incubated for 1 h under 95% O2:5% CO2 in Krebs-Henseleitbuffer containing 5.5 mM glucose and a 3% BSA/1 mM 14C-oleic acid complex27. The finalspecific activity was 250,000 dpm µmol−1. We determined 14CO2 production using hyaminehydroxide to trap the CO2 and measuring the radioactive counts in a liquid scintillationspectrometer essentially as described27. The 14C-oleic acid incorporation into ketone bodiesand secreted triglycerides was determined in the liver slice incubations under similarconditions, except the cells were continuously gassed with 95% O2:5% CO2 and no hyaminehydroxide was used. After the 40-min incubation, we removed the media for extraction of lipidsand ketone bodies. We measured the radioactivity incorporated into ketone bodies afterperchloric acid deproteinization as described27. The triglycerides were separated from medialipid extracts by thin layer chromatography, and the radioactivity in the band corresponding totriglycerides was determined as previously described28.
PrimersPrimers for SNP and microsatellite markers are available upon request.
Genbank accession numberThe accession number for the Hyplip1 cosmid sequence is AF449447. The accession numberfor the Txnip cDNA is AF173681.
AcknowledgmentsThis work was supported by grants from the National Institutes of Health and the UCLA Laubisch Fund (A.J.L.) andby a USPHS National Research award (J.B.). We thank S. Charugundla for help in the plasma lipid determinations.We appreciate the excellent technical assistance of Y. Lee, D. San Juan, L. Chen, A. Cairo, S. Tobias, K. Amburgey,D. Civello, J. Choi and Q. Zhang. We also thank O. Iakoubova, H. Sakul and R. Woychik for their expert advice. Weappreciate the aid of J. Sinsheimer for the statistical analysis of recombinant animals. We are grateful to R. Davis forhis comments on this manuscript. We also thank L. Peltonen, P. Pajukanta, H. Allayee and K. Krass for thoughtfuldiscussion and input. Production of HcB-19/Dem was supported by grants from the Dutch Cancer Foundation and theEuropean Commission (P.D.).
References1. Genest JJ Jr, et al. Familial lipoprotein disorders in patients with premature coronary artery disease.
Circulation 1992;85:2025–2033. [PubMed: 1534286]
Bodnar et al. Page 6
Nat Genet. Author manuscript; available in PMC 2010 March 29.
NIH
-PA Author Manuscript
NIH
-PA Author Manuscript
NIH
-PA Author Manuscript

2. Grundy SM, Chait A, Brunzell JD. Familial combined hyperlipidemia workshop. Arteriosclerosis1987;7:203–207.
3. Goldstein JL, Schrott HG, Hazzard WR, Bierman EL, Motulsky AG. Hyperlipidemia in coronary heartdisease. II. Genetic analysis of lipid levels in 176 families and delineation of a new inherited disorder,combined hyperlipidemia. J. Clin. Invest 1973;52:1544–1568. [PubMed: 4718953]
4. Nikkila EA, Aro A. Family study of serum lipids and lipoproteins in coronary heart-disease. Lancet1973;1:954–959. [PubMed: 4121585]
5. Castellani LW, et al. Mapping a gene for combined hyperlipidaemia in a mutant mouse strain. NatureGenet 1998;18:374–377. [PubMed: 9537422]
6. Pajukanta P, et al. Linkage of familial combined hyperlipidaemia to chromosome 1q21–q23. NatureGenet 1998;18:369–373. [PubMed: 9537421]
7. Pei W, et al. Support for linkage of familial combined hyperlipidemia to chromosome 1q21–q23 inChinese and German families. Clin. Genet 2000;57:29–34. [PubMed: 10733233]
8. Coon H, et al. Replication of linkage of familial combined hyperlipidemia to chromosome 1q withadditional heterogeneous effect of apolipoprotein A-I/C-III/ A-IV locus. The NHLBI family heartstudy. Arterioscler. Thromb. Vasc. Biol 2000;20:2275–2280. [PubMed: 11031215]
9. Demant P, Hart AA. Recombinant congenic strains–a new tool for analyzing genetic traits determinedby more than one gene. Immunogenetics 1986;24:416–422. [PubMed: 3793154]
10. Groot PC, et al. The recombinant congenic strains for analysis of multigenic traits: geneticcomposition. FASEB J 1992;6:2826–2835. [PubMed: 1634045]
11. Pajukanta P, et al. Fine mapping of Hyplip1 and the human homolog, a potential locus for FCHL.Mamm. Genome 2001;12:238–245. [PubMed: 11252174]
12. Culbertson MR. RNA surveillance. Unforeseen consequences for gene expression, inherited geneticdisorders and cancer. Trends Genet 1999;15:74–80. [PubMed: 10098411]
13. Leeds P, Peltz SW, Jacobson A, Culbertson MR. The product of the yeast UPF1 gene is required forrapid turnover of mRNAs containing a premature translational termination codon. Genes Dev1991;5:2303–2314. [PubMed: 1748286]
14. Williamson DH, Lund P, Krebs HA. The redox state of free nicotinamide-adenine dinucleotide in thecytoplasm and mitochondria of rat liver. Biochem. J 1967;103:514–527. [PubMed: 4291787]
15. Chen KS, DeLuca HF. Isolation and characterization of a novel cDNA from HL-60 cells treated with1,25-dihydroxyvitamin D-3. Biochim. Biophys. Acta 1994;1219:26–32. [PubMed: 8086474]
16. Nishiyama A, et al. Identification of thioredoxin-binding protein-2/vitamin D(3) up-regulated protein1 as a negative regulator of thioredoxin function and expression. J. Biol. Chem 1999;274:21645–21650. [PubMed: 10419473]
17. Junn E, et al. Vitamin D3 up-regulated protein 1 mediates oxidative stress via suppressing thethioredoxin function. J. Immunol 2000;164:6287–6295. [PubMed: 10843682]
18. Yodoi J, Uchiyama T. Diseases associated with HTLV-1: virus, IL-2 receptor dysregulation and redoxregulation. Immunol. Today 1992;13:405–411. [PubMed: 1418377]
19. Gasdaska JR, Berggren M, Powis G. Cell growth stimulation by the redox protein thioredoxin occursby a novel helper mechanism. Cell Growth Differ 1995;6:1643–1650. [PubMed: 9019170]
20. Ueda S, et al. Redox regulation of caspase-3(-like) protease activity: regulatory roles of thioredoxinand cytochrome c. J. Immunol 1998;161:6689–6695. [PubMed: 9862698]
21. Nakamura H, Nakamura K, Yodoi J. Redox regulation of cellular activation. Annu. Rev. Immunol1997;15:351–369. [PubMed: 9143692]
22. Hirota K, et al. AP-1 transcriptional activity is regulated by a direct association between thioredoxinand Ref-1. Proc. Natl Acad. Sci. USA 1997;94:3633–3638. [PubMed: 9108029]
23. Holmgren A. Thioredoxin and glutaredoxin systems. J. Biol. Chem 1989;264:13963–13966.[PubMed: 2668278]
24. LaNoue KF, Bryla J, Williamson JR. Feedback interactions in the control of citric acid cycle activityin rat heart mitochondria. J. Biol. Chem 1972;247:667–679. [PubMed: 4333508]
25. Kimura RE, Warshaw JB. Control of fatty acid oxidation by intramitochondrial [NADH]/[NAD+] indeveloping rat small intestine. Pediatr. Res 1988;23:262–265. [PubMed: 3353171]
Bodnar et al. Page 7
Nat Genet. Author manuscript; available in PMC 2010 March 29.
NIH
-PA Author Manuscript
NIH
-PA Author Manuscript
NIH
-PA Author Manuscript
26. Sambrook, J.; Fritsch, EF.; Maniatis, T. Molecular Cloning: A Laboratory Manual. 2nd ed. New York:Cold Spring Harbor Laboratory Press; 1989.
27. Olubadewo JO, Heimberg M. Effects of adrenergic agonists and antagonists on the metabolism of[1-14C] oleic acid by rat hepatocytes. Biochem. Pharmacol 1993;45:2441–2447. [PubMed: 8328982]
28. Castellani LW, Wilcox HC, Heimberg M. Relationships between fatty acid synthesis and lipidsecretion in the isolated perfused rat liver: effects of hyperthyroidism, glucose and oleate. Biochim.Biophys. Acta 1991;1086:197–208. [PubMed: 1932102]
29. Doolittle MH, Wong H, Davis RC, Schotz MC. Synthesis of hepatic lipase in liver and extrahepatictissues. J. Lipid Res 1987;28:1326–1334. [PubMed: 3323389]
30. Lanford, RE.; Estlack, L. A cultivation method for highly differentiated primary chimpanzeehepatocytes permissive for hepatitis C virus replication. In: Lau, JYN., editor. Methods in MolecularMedicine: Hepatitis C Protocols. New Jersey: Humana, Totowa; 1998. p. 501-515.
Bodnar et al. Page 8
Nat Genet. Author manuscript; available in PMC 2010 March 29.
NIH
-PA Author Manuscript
NIH
-PA Author Manuscript
NIH
-PA Author Manuscript

Fig. 1.Distributions of triglyceride and ketone body levels. a, Plasma levels of triglycerides in HcB-19and its C3H parental control. The average ± s.e.m. is shown for six animals in each group.Asterisk indicates P<0.0001. b, Distribution of plasma triglycerides in (HcB-19 × CAST/Ei)F2 mice grouped by genotype at D3Mit101 so that each group represents animals withtriglycerides within a certain interval (for example, the group at 30 represents animals withtriglycerides from 21–30 mg dl−1). Filled bars indicate values for animals homozygous withrespect to HcB-19 alleles (h/h), hatched bars indicate heterozygote values (c/h) and open barsdenote values for animals homozygous with respect to wildtype CAST/Ei alleles (c/c). Thegenotype and average triglyceride value ± s.e.m. (avg.) in mg dl−1 for each group are indicatedin the legend box. N=259 wildtype, 489 heterozygote and 214 homozygote animals. c, Plasmalevels of ketone body β-hydroxybutyrate in the HcB-19 mouse and its C3H parent control. Theaverage ± s.e.m. is shown for six animals in each group. Asterisk indicates P<0.0001. d,Distribution of plasma levels of ketone body β-hydroxybutyrate in (HcB-19 × CAST/Ei)F2mice grouped by genotype at D3Mit101 so that each group represents animals with plasmaketone body levels within a certain interval (for example, the group at 30 represents animalswith ketone bodies from 29–30 mg dl−1). N=259 wildtype, 489 heterozygote and 214homozygote animals. Abbreviations and designations are identical to panel b.
Bodnar et al. Page 9
Nat Genet. Author manuscript; available in PMC 2010 March 29.
NIH
-PA Author Manuscript
NIH
-PA Author Manuscript
NIH
-PA Author Manuscript

Fig. 2.Physical- and fine-mapping of the Hyplip1 locus. a, Fine-mapping of (HcB-19 × CAST/Ei)F2animals by genotyping 17 microsatellite markers. The ratios of the number of recombinants tothe total number of informative mice plus the recombination frequencies ± s.e.m. (in cM) areshown. b, The minimum tiling path of the BAC contig for the Hyplip1 locus. Solid black linesrepresent 22 individual BAC clones. The BAC clone name is listed, and the BAC size in kb(when known) is given in parenthesis. Markers, genes, and BAC end clone sequences are shownat the top, and the estimated physical distances (in kb) are given. The limiting breakpointmarkers that define the maximal location of the gene Hyplip1 are in boldface. c, Fouroverlapping BACs from the Hyplip1 locus that were subcloned and sequenced to identify 13candidate genes. Each BAC clone name is given; gray boxes depict genes. The approximatepositions of microsatellite markers and SNPs are shown. The Hyplip1 gene (Txnip) and themarkers that define the maximal location of Hyplip1 are shown in boldface. d, Genomicstructure of Hyplip1 (Txnip). Solid black lines indicate the eight exons of Txnip, and an asteriskindicates the location of the T→A nonsense mutation observed in strain HcB-19. Numberslisted below the figure indicate the DNA base positions of the exon-intron junctions.
Bodnar et al. Page 10
Nat Genet. Author manuscript; available in PMC 2010 March 29.
NIH
-PA Author Manuscript
NIH
-PA Author Manuscript
NIH
-PA Author Manuscript

Fig. 3.Recombinant animals and their HcB-19 backcross progeny that define the maximal criticalinterval containing Hyplip1. a, Recombinant R11 and 10 backcross progeny. Backcross miceare grouped according to the inheritance of a recombinant or nonrecombinant haplotype acrossthe Hyplip1 locus for the seven markers listed at the right. Filled boxes indicate HcB-19 (h)alleles and open boxes denote CAST/Ei (c) alleles. Ketone body (Ket) and triglyceride (TG)levels in mg dl−1 are given for each parental recombinant and their progeny. The predictiveprobability of heterozygosity, P(c/h), is shown for each parental recombinant, and the averagepredictive probability of homozygosity, P(h/h), is given for backcross progeny with the samehaplotype. The R11 recombinant and all six backcross progeny with the same haplotype havelower β-HB and TG levels as compared with littermates homozygous with respect to HcB-19alleles. R11 had a high probability of being heterozygous [P(c/h)=0.987] and the backcrossprogeny had a low probability of homozygosity with respect to Hyplip1 [P(h/h)=0.064],indicating that Hyplip1 is distal to D3Pds7. b, Recombinant R12 and 8 backcross progeny. Allsix backcross progeny with the parental haplotype have normal β-HB and TG levels, with alow probability of homozygosity with respect to Hyplip1 [P(h/h)=0.156]. Thus, Hyplip1 liesproximal to D3Pds13. c, Recombinant R13 and 3 backcross progeny. As shown, R13 carriesHyplip1 alleles proximal to D3Pds13. Backcross progeny carrying this crossover haveincreased amounts of β-HB and TG, indicating homozygosity for Hyplip1 with a highprobability [P(h/h)=0.959], giving further evidence that Hyplip1 is proximal to D3Pds13. d,Recombinant R14, six backcross progeny, and 90 animals obtained from intercrossingbackcross progeny with the crossover breakpoint. R14 had a high probability of beingheterozygous [P(c/h)=0.816]. Backcross progeny with the same haplotype have increasedamounts of β-HB and TG, indicating homozygosity with respect to Hyplip1 [P(h/h)=0.955].
Bodnar et al. Page 11
Nat Genet. Author manuscript; available in PMC 2010 March 29.
NIH
-PA Author Manuscript
NIH
-PA Author Manuscript
NIH
-PA Author Manuscript

When these mice are intercrossed, all resultant progeny have increased β-HB and TG levels(the average ± s.e.m. for each genotypic group is shown), providing additional evidence forplacing the distal boundary for Hyplip1 at D3Pds13.
Bodnar et al. Page 12
Nat Genet. Author manuscript; available in PMC 2010 March 29.
NIH
-PA Author Manuscript
NIH
-PA Author Manuscript
NIH
-PA Author Manuscript
Fig. 4.Expression and sequence analysis of Txnip. a, Northern blot data revealing decreased mRNAexpression for Txnip in HcB-19 as compared with the C3H parental control strain. Expressionlevels for another gene from the Hyplip1 region, Pja1l, serve as a locus and RNA loadingcontrol. b, Sequence analysis of HcB-19 and C3H mice reveals a T→A transversion mutationpresent in HcB-19 that is absent from the C3H strain from which it was derived. The sequencechromatograms from HcB-19 and C3H mice are shown, as well as the DNA sequence datafrom three HcB-19 and three C3H mice. c, Northern-blot analysis of the Txnip transcript invarious tissues reveals detectable expression in brain, spleen, lung, liver, skeletal muscle,kidney and testis, with the highest abundance occurring in heart.
Bodnar et al. Page 13
Nat Genet. Author manuscript; available in PMC 2010 March 29.
NIH
-PA Author Manuscript
NIH
-PA Author Manuscript
NIH
-PA Author Manuscript
Fig. 5.Metabolic consequences of the Hyplip1 nonsense mutation in Txnip. a, Plasma triglyceridesfor (HcB-19 × C57BL/6J)N4 congenic mice homozygous (−/−) or wildtype (+/+) for theHyplip1 nonsense mutation. N=6 animals in each group. Asterisk indicates P<0.005. b, Plasmaβ-hydroxybutyrate levels for (HcB-19 × C57BL/6J)N4 congenic mice. N=6 animals in eachgroup. Asterisk indicates P<0.0001. c–e, Plasma levels for total cholesterol (c), LDL+VLDLcholesterol (d) and free fatty acids (e) for (HcB-19 × C57BL/6J)N4 congenic mice. N=6 animalsin each group. Asterisk indicates P<0.05. f,g, Plasma levels for total cholesterol (f) and LDL+VLDL cholesterol (g) for (HcB-19 × CAST/Ei)F2 animals grouped by genotype at markerD3Mit101. N=124 wildtype (c/c), 273 heterozygote (c/h) and 113 animals homozygous (h/h)with respect to Hyplip1 mutant alleles. Asterisk indicates P<0.00005. h, Plasma free fatty acidlevels for nine HcB-19 (HcB) and nine C3H controls. Asterisk indicates P<0.01. i, Total hepatictriglyceride content (in mg per g of liver tissue) from HcB-19 and C3H livers that were perfusedto remove plasma lipids. N=4 C3H animals and 5 HcB-19 animals. Asterisk indicates P<0.01.
Bodnar et al. Page 14
Nat Genet. Author manuscript; available in PMC 2010 March 29.
NIH
-PA Author Manuscript
NIH
-PA Author Manuscript
NIH
-PA Author Manuscript
j, Dpm of 14C-oleic acid per g of liver tissue in newly-synthesized triglycerides secreted fromliver slices isolated from fasted HcB-19 and C3H mice. N=6 animals in each group. Asteriskindicates P<0.05. k, Amount of newly-synthesized ketone bodies (in dpm per g of liver tissue)from isolated liver slices. N=5 C3H and 6 HcB-19 animals. Asterisk indicates P<0.005. l,Amount of newly-synthesized CO2 (in dpm per g of liver tissue) from isolated liver slices.N=4 C3H and 5 HcB-19 animals. Asterisk indicates P<0.05. m, Plasma lactate levels (in mgdl−1) from HcB-19 and C3H mice. Asterisk indicates P<0.001. N=5 animals in each group.n, Pyruvate levels (in mg dl−1) from whole blood from HcB-19 and C3H mice. Asteriskindicates P<0.008. N=5 animals in each group.
Bodnar et al. Page 15
Nat Genet. Author manuscript; available in PMC 2010 March 29.
NIH
-PA Author Manuscript
NIH
-PA Author Manuscript
NIH
-PA Author Manuscript
NIH
-PA Author Manuscript
NIH
-PA Author Manuscript
NIH
-PA Author Manuscript
Bodnar et al. Page 16
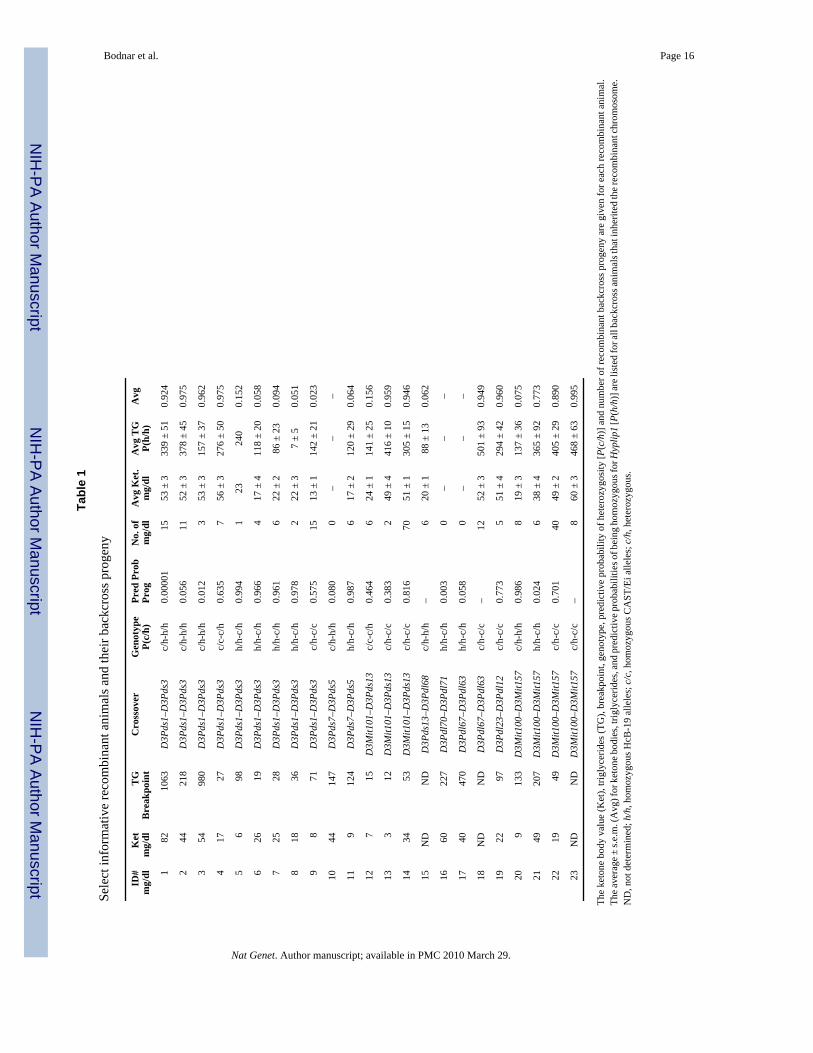
Tabl
e 1
Sele
ct in
form
ativ
e re
com
bina
nt a
nim
als a
nd th
eir b
ackc
ross
pro
geny
ID#
mg/
dlK
etm
g/dl
TG
Bre
akpo
int
Cro
ssov
erG
enot
ype
P(c/
h)Pr
ed P
rob
Prog
No.
of
mg/
dlA
vg K
et.
mg/
dlA
vg T
GP(
h/h)
Avg
182
1063
D3P
ds1–
D3P
ds3
c/h-
h/h
0.00
001
1553
± 3
339
± 51
0.92
4
244
218
D3P
ds1–
D3P
ds3
c/h-
h/h
0.05
611
52 ±
337
8 ±
450.
975
354
980
D3P
ds1–
D3P
ds3
c/h-
h/h
0.01
23
53 ±
315
7 ±
370.
962
417
27D
3Pds
1–D
3Pds
3c/
c-c/
h0.
635
756
± 3
276
± 50
0.97
5
56
98D
3Pds
1–D
3Pds
3h/
h-c/
h0.
994
123
240
0.15
2
626
19D
3Pds
1–D
3Pds
3h/
h-c/
h0.
966
417
± 4
118
± 20
0.05
8
725
28D
3Pds
1–D
3Pds
3h/
h-c/
h0.
961
622
± 2
86 ±
23
0.09
4
818
36D
3Pds
1–D
3Pds
3h/
h-c/
h0.
978
222
± 3
7 ±
50.
051
98
71D
3Pds
1–D
3Pds
3c/
h-c/
c0.
575
1513
± 1
142
± 21
0.02
3
1044
147
D3P
ds7–
D3P
ds5
c/h-
h/h
0.08
00
––
–
119
124
D3P
ds7–
D3P
ds5
h/h-
c/h
0.98
76
17 ±
212
0 ±
290.
064
127
15D
3Mit1
01–D
3Pds
13c/
c-c/
h0.
464
624
± 1
141
± 25
0.15
6
133
12D
3Mit1
01–D
3Pds
13c/
h-c/
c0.
383
249
± 4
416
± 10
0.95
9
1434
53D
3Mit1
01–D
3Pds
13c/
h-c/
c0.
816
7051
± 1
305
± 15
0.94
6
15N
DN
DD
3Pds
13–D
3Pdl
68c/
h-h/
h–
620
± 1
88 ±
13
0.06
2
1660
227
D3P
dl70
–D3P
dl71
h/h-
c/h
0.00
30
––
–
1740
470
D3P
dl67
–D3P
dl63
h/h-
c/h
0.05
80
––
–
18N
DN
DD
3Pdl
67–D
3Pdl
63c/
h-c/
c–
1252
± 3
501
± 93
0.94
9
1922
97D
3Pdl
23–D
3Pdl
12c/
h-c/
c0.
773
551
± 4
294
± 42
0.96
0
209
133
D3M
it100
–D3M
it157
c/h-
h/h
0.98
68
19 ±
313
7 ±
360.
075
2149
207
D3M
it100
–D3M
it157
h/h-
c/h
0.02
46
38 ±
436
5 ±
920.
773
2219
49D
3Mit1
00–D
3Mit1
57c/
h-c/
c0.
701
4049
± 2
405
± 29
0.89
0
23N
DN
DD
3Mit1
00–D
3Mit1
57c/
h-c/
c–
860
± 3
468
± 63
0.99
5
The
keto
ne b
ody
valu
e (K
et),
trigl
ycer
ides
(TG
), br
eakp
oint
, gen
otyp
e, p
redi
ctiv
e pr
obab
ility
of h
eter
ozyg
osity
[P(c
/h)]
and
num
ber o
f rec
ombi
nant
bac
kcro
ss p
roge
ny a
re g
iven
for e
ach
reco
mbi
nant
ani
mal
.Th
e ave
rage
± s.
e.m
. (A
vg) f
or k
eton
e bod
ies,
trigl
ycer
ides
, and
pre
dict
ive p
roba
bilit
ies o
f bei
ng h
omoz
ygou
s for
Hyp
lip1
[P(h
/h)]
are l
iste
d fo
r all
back
cros
s ani
mal
s tha
t inh
erite
d th
e rec
ombi
nant
chro
mos
ome.
ND
, not
det
erm
ined
; h/h
, hom
ozyg
ous H
cB-1
9 al
lele
s; c
/c, h
omoz
ygou
s CA
ST/E
i alle
les;
c/h
, het
eroz
ygou
s.
Nat Genet. Author manuscript; available in PMC 2010 March 29.