In vivo response to electrochemically aligned collagen bioscaffolds
Upload
un-lincolnCategory
view
0download
0
Syst Biol 49(4)628ndash651 2000
Integrating Ambiguously Aligned Regions of DNA Sequencesin Phylogenetic Analyses Without Violating Positional Homology
FRANCOIScedil LUTZONI1 PETER WAGNER2 VALERIE REEB1 AND STEFAN ZOLLER
Departments of 1Botany and 2Geology The Field Museum of Natural History 1400 S Lake Shore DriveChicago Illinois 60605-2496 USA E-mail utzonifmnhorg
AbstractmdashPhylogenetic analyses of non-protein-coding nucleotide sequences such as ribosomal RNAgenes internal transcribed spacers and introns are often impeded by regions of the alignments thatare ambiguously aligned These regions are characterized by the presence of gaps and their uncer-tain positions no matter which optimization criteria are used This problem is particularly acute inlarge-scale phylogenetic studies and when aligning highly diverged sequences Accommodating theseregions where positional homology is likely to be violated in phylogenetic analyses has been dealtwith very differently by molecular systematists and evolutionists ranging from the total exclusion ofthese regions to the inclusion of every position regardless of ambiguity in the alignment We present anew method that allows the inclusion of ambiguously aligned regions without violating homology Inthis three-step procedure rst homologous regions of the alignment containing ambiguously alignedsequences are delimited Second each ambiguously aligned region is unequivocally coded as a newcharacter replacing its respective ambiguous region Third each of the coded characters is subjectedto a specic step matrix to account for the differential number of changes (summing substitutions andindels) needed to transform one sequence to another The optimal number of steps included in the stepmatrix is the one derived from the pairwise alignment with the greatest similarity and the least num-ber of steps In addition to potentially enhancing phylogenetic resolution and support by integratingpreviously nonaccessible characters without violating positional homology this new approach can im-prove branch length estimations when using parsimony [Character coding character-state weightingcrocodile 12S mtrDNA indel-rich region insect 16S mtrDNA intron large-scale phylogenies molec-ular phylogenies multiple sequence alignment non-protein-coding DNA sequences ribosomal RNAgenes]
Among the most fundamental practices insystematic studies are the characterizationof intrinsic features of organisms charac-ter coding and the assessment of homology(Wiley 1981 Patterson 1982 1988 Roth1988 Stevens 1991) Because of the na-ture of nucleotide sequences the two rstaspects are not so much a concern formolecular systematists and evolutionistsHomology assessment however is a majorconcern (Mindell 1991 Hillis 1994 Doyleand Davis 1998) In this paper we as-sume that the nucleotide sequences com-pared are orthologous The new methoddescribed here tackles the problem of po-sitional homology when the position ofa specic nucleotide is equivocal becauseof the potential presence of nearby gapsThis problem is particularly acute whenaligning fast-evolving or highly divergednon-protein-coding portions of genomes asituation frequently encountered in large-scale phylogenetic studies As sequencesfrom more distant taxa are added to analignment covering a broad spectrum of or-ganisms these ambiguously aligned regionshave a tendency to become larger and morenumerous If these regions are included
in phylogenetic analyses fundamental as-sumptions of homology are likely to be vi-olated and phylogenetic accuracy might belowered considerably If excluded howeverresolving power and branch length estimatesmay be jeopardized
Ambiguous alignments or multiple equ-ally optimal alignments are most easily de-tected when sequences vary in length Thislength variation requires inserting gaps inthe alignment to maintain positional homol-ogy The number of gaps needed and theirexact position can be uncertain Most align-ment procedures necessitate the assignmentof a cost for a nucleotide substitution versusthe insertion of a gap (DeSalle et al 1994Wheeler 1994) Different parameters oftenresult in the inclusion of various numbersof gaps that can also vary in their positionThe inability to justify one set of parame-ters over another (Vingron and Waterman1994 Kjer 1995 Doyle and Davis 1998) leadsto alternative sequence alignments for thesame data set Problems occur when differenttopologiesare revealed by phylogenetic anal-yses of these different alignments (Wheeler1995 Wheeler et al 1995 Soltis et al 1996)Thorne et al (1991 1992) developed an
628
2000 LUTZONI ET ALmdashAMBIGUOUS ALIGNMENTS AND PHYLOGENETICS 629
objective technique to estimate alignment pa-rameters based on an evolutionary modelusing a maximum likelihood approach Intheir method the weights of evolutionaryevents such as nucleotide substitutions andindels are a function of evolutionary ratesand divergence times estimated from thetwo sequences to be aligned However thismethod has yet to be extended to the si-multaneous alignment of more than twosequences
Another source of ambiguity is the pres-ence of multiple equally optimal alignmentsfor a specic set of alignment parameters(Wheeler et al 1995) This is best visualizedas multiple equally optimal paths (Kruskal1983 Weir 1990 Wheeler 1994) when align-ing two sequences by using a method de-rived from the dynamic programming al-gorithm of Needleman and Wunsch (1970)Finally the order in which sequences areintegrated in a multiple alignment processcan affect the resulting alignments (Lake1991 Mindell 1991) In this context the ques-tion becomes which order should be chosenThis situation leads to the multiple align-ment problem described by Gatesy et al(1993) and Wheeler (1995) The consequencesof these multiple potential alignments for agiven data set can be severe because differ-ent alignments can support different topolo-gies regardless of the degree of sophisticationof the phylogenetic method used afterwardThis can lead systematists to conicting con-clusions (Cerchio and Tucker 1998) Despitethe primary importance of positional ho-mology in phylogenetic studies alignmentissues have received far less attention anddiscussion by systematists than theoreti-cal aspects of phylogenetic reconstruction(Doyle and Davis 1998)
There are several options available tophylogeneticists dealing with ambiguousregions of an alignment These differentmethods can lead to different phylogeneticresults (eg Vogler and DeSalle 1994) Acommon and often considered the most con-servative approach is the exclusion of theseregions from phylogenetic searches (egBruns et al 1992 Berbee and Taylor 1993Hibbett and Vilgalys 1993 Spatafora andBlackwell 1993 Lutzoni 1995 Spatafora1995 Berbee 1996) However the subjectiv-ity associated with this process can lead todifferent phylogenies depending on whichcombination of sites is excluded The othermain caveat of this method is the loss of
resolution (Lutzoni 1995 Wheeler et al1995) and the removal of data essential for amore accurate estimation of branch lengthsThis is because ambiguously aligned re-gions can contain a large fraction (some-times gt50) of all potentially parsimony-informative characters present in a givenalignment For example Fernandez et al(1999) used a 1-kb fragment at the 50 endof the large subunit nuclear ribosomal RNA(nrRNA) gene to unveil relationships of agroup of pyrenomycetous ascomycetes at theordinal and family level In all 16 am-biguously aligned regions covering 157 sitesand corresponding to 17 of the entirealignment were delimited They estimatedthat these ambiguous regions would pro-vide 120 parsimony-informative characterscorresponding to raquo 40 of all parsimony-informative characters that the entire data setwould provide The small subunit nrRNAgene which is on average more conservedthan the large subunit nrRNA gene is notdevoid of this problem For example Lutzoniet al (in prep) in their phylogenetic study oflichenized and nonlichenized ascomycetesfound that at the ordinal level 20 of allpotential parsimony-informative charactersresided in ambiguously aligned regions ofa specic alignment of the 1-kb fragmentthey sequenced This percentage goes up asmore distantly related taxa (such as basid-iomycetes) are included in the alignment
The exclusion or inclusion of ambigu-ously aligned regions can have a determi-nant effect on the results of phylogeneticanalyses (Giribet and Wheeler 1999) Thiswas the case for the controversial MysticetiPhyseteroidea clade for which Cerchio andTucker (1998) showed that the phylogeneticsignal supporting this hypothesis was con-tained predominantly in the ambiguouslyaligned regions of the 12S and 16S mitochon-drial ribosomal DNA (mtrDNA) The dif-ferent ways systematists working on thesedata sets treated these regions resulted inincongruences
Another problem associated with the ex-clusion of ambiguously aligned regions ishow to delimit them accurately The use of arange of gap-to-substitution cost ratios (egranging from 23 to 3001) has been pro-posed to circumscribe alignment-ambiguoussites (Waterman et al 1992 Gatesy et al1993) In such a procedure sites that arenot constant among all the alignments re-sulting from the different cost ratios are
630 SYSTEMATIC BIOLOGY VOL 49
considered ambiguously aligned and subse-quently removed from phylogenetic analy-ses The use of extreme cost ratios howeversuch as 23 and 3001 causes unambiguousregions to be unstable among alignmentssuch that parsimony-informative sites are re-moved that are clearly not violating posi-tional homology Even if this method weremore accurate in delimiting ambiguouslyaligned regions this does not alleviate theloss in resolution and branch length accu-racy associated with the exclusion of dataThe other extreme and by far the worst-casescenario is the inclusion of all sites in thephylogenetic analysis based on one of manyequally most optimal alignments and simul-taneously treating gaps as a fth characterstate One problem with this strategy is theoverweighting of adjacent gaps by treatingthem as independent indels when they arevery likely part of a single genetic change
To minimize the detrimental effect of in-serting gaps in an alignment gaps havebeen treated as missing data Although itmight be tempting to believe that replac-ing gaps by question marks in ambiguouslyaligned regions is a safe alternative evenif gaps are treated as missing data theirpositional homology remains highly ques-tionable and very likely wrong When suchambiguously aligned sites are parsimony-informative they will often have a nega-tive effect on phylogenetic accuracy Thispractice has the unfortunate potential ofgenerating highly resolved trees which iserroneously interpreted as a sign of phy-logenetic accuracy (Hillis et al 1994) andcan give a sense of overcondence in theresulting topologies As was demonstratedby Hillis and Huelsenbeck (1992) the anal-ysis of random molecular data sets canyield a single most-parsimonious (highly re-solved) tree that may also be considerablyshorter than the second-best alternative Bre-mer (1988) support values generated for thissingle most-parsimonious but meaninglesstree might even increase In our opinion theinclusion of all sites of an alignment withambiguously aligned regions in a phyloge-netic analysis should be done only if allcompeting alignments are shown to gener-ate the same topology At least the sensi-tivity of the phylogenetic analysis to the in-clusion of various alignments for a givenambiguous region should be explored (seeBaum et al 1994)
Hibbett et al (1995) pointed out two othercaveats associated with the treatment of gapsas missing data (1) the exclusion of poten-tially parsimony-informative indels as char-acters and (2) the potential for assigning im-possible states to ancestors (Platnick et al1991 Maddison 1993) Barriel (1994) devel-oped a method that combined the use ofquestion marks and the implementation of acoding scheme for regions with multiple ad-jacent gaps The method proposed by Barriel(1994) takes care of the rst problem men-tioned by Hibbett et al (1995) but not thesecond one This is because treating gaps asmissing data especially when the placementof gaps is not ambiguous and when the gapsare not treated as a fth character state canresult in the ancestors of taxa with gaps beingassigned a nucleotide unequivocally whenmore likely the ancestor had a gap at thatposition Finally several hybrid approachesconsisting of excluding some indel-rich re-gions and including others as coded withouttreating gaps as missing data or where gapsare considered as missing information havebeen implemented to maximize the integra-tion of phylogenetic signal provided by in-dels without violating criteria for positionalhomology (eg Baldwin et al 1995 Hibbettet al 1995 Kjer 1995 Kretzer et al 1996Manos 1997) All of the above methods as-sume that gap positions are correct that isunambiguous which is often not the caseTherefore ambiguously aligned sequenceswith indels of variable lengths and equivo-cal positions are still excluded from phylo-genetic analyses
Wheeler et al (1995) suggested a solutionto the problem of equally optimal alignmentsand multiple alignments resulting from dif-ferent cost parameters that can lead to differ-ent phylogenetic trees Their method termedelision consists of joining end to end alloptimal alignments obtained from all costparameters into a single grand alignmentSites that are identical among all combinedalignments will have by default the mostweight corresponding to the number of op-timal alignments that were fused Positionsthat vary among alignments are automat-ically downweighted proportionally to thedegree of interalignment variability We haveidentied four problems with the elisionapproach First all equally optimal align-ments for a high number of cost parametersand for different orders of sequence entry
2000 LUTZONI ET ALmdashAMBIGUOUS ALIGNMENTS AND PHYLOGENETICS 631
in the alignment process should be part ofthe grand alignment otherwise the result-ing topology or topologies could be biasedFinding all these optimal alignments couldbe problematic when dealing with large datasets that is with a high number of OTUs orwith highly diverged sequences Moreoverthe number of gapsubstitution cost ratiosused has a direct impact on the result Thegreater the number of cost ratios used thegreater the potential to nd a high numberof different alignments and the more down-weighted the variable sites will be Secondalthough the proportional downweightingof these ambiguously aligned sites compen-sates to some degree for the introduction ofphylogenetic noise this weighting schemeis too drastic when numerous equally opti-mal alignments are involved For most inter-alignment variable sites this procedure be-comes equivalent to the exclusion of thesesites when they might be essential for re-solving specic portions of the phylogenetictree Third for data sets with highly diver-gent sequences and relatively poor resolv-ing power this could involve the fusion ofa prohibitively high number of equally op-timal alignments Fourth as pointed out byWheeler et al (19955) this method has ldquothedisturbing property of assigning multipleputative homologies to the same datumrdquotherefore it inevitably introduces many sitesfor which positional homology is violated
On the basis of the initial work of Sankoffand Cedergren (1983) Feng and Doolittle(1987 1990) Hein (1990) and others toalign sequences and reconstruct phyloge-nies simultaneously Wheeler (1996) pro-posed a new approach for the analysis ofambiguously aligned sequences (POY) Hismethod proceeds directly from the origi-nal nucleotide sequences to phylogeny re-construction that is it does not rst insertgaps in a multiple sequence alignment Thisdirect optimization of DNA sequences of-fers a potential solution to the problem ofintegrating ambiguously aligned regions inphylogenetic analyses without violating po-sitional homology however its implementa-tion might be too time consuming especiallywhen dealing with large-scale phylogeniesMoreover with a direct optimization ap-proach according to Giribet and Wheeler(1999) ldquothere is no way to disregard gapinformation because there is no intermedi-ate step (alignment)rdquo Therefore this practice
of eliminating the use of alignments pre-vents the potential detection of (1) site-to-site variation in terms of parameters suchas transitiontransversion ratios rates of nu-cleotide substitution and base frequency bi-ases (2) regions saturated by changes thatcould mislead the search toward incorrecttopologies because of the loss of most if notall of the phylogenetic signal (3) the contri-bution of ambiguously aligned sites to the re-sulting phylogenetic tree and (4) sequencesso divergent (eg outgroup compared withingroup sequences) that an alignment stepwould quickly reveal these sequences couldnot be incorporated into a given phyloge-netic analysis
Because gaps and ambiguously aligned re-gions are a class of molecular characters thatcan be exceptionally reliable for phylogeneticanalyses (Lloyd and Calder 1991 Giribet andWheeler 1999) it is crucial to nd a viableway to integrate this type of informationin phylogenetic analyses In this paper wepresent a new method that accommodatesevery type of ambiguously aligned regionexcept the ones where saturation caused bymultiple changes has most likely resultedin the complete loss of phylogenetic sig-nal Such regions still should be excludedfrom phylogenetic analyses (Swofford et al1996) The method presented here also pro-vides a criterion to detect the ambiguouslyaligned regions most likely to be saturatedby multiple changes We have restricted thispaper to the case of nucleotide sequencesbut this method can be extended to ac-commodate ambiguous alignments of aminoacid sequences The rst part of this pa-per describes the three steps of this newprocedure (1) delimiting of homologous re-gions that contain ambiguously aligned se-quences (2) unequivocal coding of homol-ogous ambiguously aligned regions and(3) optimal weighting of changes amongcharacter states (step matrices) of unequiv-ocally coded regions Ambiguously alignedregions are delimited by sliding gaps later-ally until there is no justication to push thegap further based on nucleotide composi-tion of neighboring sites Each ambiguouslyaligned region is recoded as a single charac-ter without involving any gaps and withoutviolating positional homology Gaps are usedonly to determine the optimal number ofsteps necessary to go from one coded charac-ter state to another by reducing the alignment
632 SYSTEMATIC BIOLOGY VOL 49
task from comparing multiple sequences toonly pairwise comparisons The second partof this paper will use this new approach toreassess the insect 16S mtrDNA and cro-codile 12S mtrDNA data sets that were an-alyzed previously by the elision method(Wheeler et al 1995)
MATERIALS AND METHODS
Data Sets and Alignments
We used the same nucleotide sequences(insect 16S and crocodile 12S mtrDNA) usedby Wheeler et al (1995) The 16S data as pre-sented in that publication has two seriousproblems First the reverse complementform is shown second some of the sequencesdiffer from those reported in GenBank Tofacilitate the comparison between the twopapers and to ensure that differences inour respective analyses are strictly the resultof using different methods these two datasets were used here exactly as presentedin Wheeler et al 1999 The sequences werealigned by using the automated assemblyoption of Sequencher 30 (Gene Codes) andsubsequently optimized by eye Using thesame program the resulting alignment wasexported as a Nexus le for phylogeneticanalyses
Phylogenetic Analyses
All phylogenetic analyses were imple-mented by using the maximum parsimo-ny optimization criterion in PAUP curren 40d64(Swofford 1998) Constant sites were re-moved from all analyses For the unam-biguously aligned sites a step matrix wasconstructed from the negative natural log-arithms of the relative frequencies of eachpossible transformation (Felsenstein 1981Wheeler 1990 Maddison and Maddison1992) The frequency of each possible geneticchange was estimated with the PAUP curren op-tion that provides the current status of eachcharacter This command provides a list of allcharacter states for each site of interest fromwhich the frequency of all potential changescan be compiled These unambiguous siteswere subjected to this step matrix in all phy-logenetic analyses
All ambiguously aligned regions were ex-cluded from phylogenetic analyses How-ever the coded versionsof these regionswereadded to the end of the data matrix andeach coded character was subjected simul-
taneously to its own step matrix The cod-ing and the building of these step matri-ces are described in detail in steps 2 and 3below The branch-and-bound search algo-rithm was implemented branches were col-lapsed if maximum branch length was 0and MULPARS was in effect The supportfor the internodes of the most-parsimonioustrees was estimated by 1000 bootstrap repli-cates (Felsenstein 1985) using the branch-and-bound algorithm and the same op-tions described above The Wilcoxon signed-ranks test (Templeton 1983) as implementedin PAUP curren 40d64 was used to determinewhether some topologies were signicantlyworse than the best topology
INTEGRATION OF AMBIGUOUSLYALIGNED NUCLEOTIDE SEQUENCES IN
MAXIMUM PARSIMONY ANALYSES
Step 1 Delimitation of HomologousAmbiguously Aligned Regions
The rst step of the method presentedhere is to delimit homologous regions ofsequences for which the number of gaps in-serted or their placement (or both) is ambigu-ous The advantage of delimiting ambigu-ous regions for their exclusion and coding isthat the alignment within these regions doesnot need to be optimized These are the re-gions most sensitive to the order in which thesequences are aligned (Lake 1991 Mindell1991) or to the gap-to-substitution cost ratiosused in the alignment process (Gatesy et al1993) Theoretically the alignment procedurehas ve possible outcomes
1 regions that lack indels no matter whichparameters or entry order of sequenceswas used (Fig 1a)
2 regions that consistently include the samenumber of indels with identical placementacross all optimal alignments (Figs 1b c)
3 regions in which the presenceabsenceof indels varies when alignments derivedfrom different gap-to-substitution cost ra-tios are compared but their positionswhen present does not change among alloptimal alignments (Fig 1d)
4 regions that consistently include a spe-cic number of indels but their placementvariesamong optimal alignments (Fig 1e)and
5 regions that combine variation in the num-ber and position of indels when comparedacross all putative alignments (Fig 1f)
2000 LUTZONI ET ALmdashAMBIGUOUS ALIGNMENTS AND PHYLOGENETICS 633
FIGURE 1 Six different regions (andashf) with three hypo-thetical alignments (AndashC) for each An asterisk indicatesthe position of an indel and a dash represents a gap Seetext (Step 1) for descriptions of andashf
The rst three cases (Figs 1andashc) describedabove are unambiguous even if cases b andc include indels The rst case is not prob-lematic and can be included ldquoas isrdquo in phylo-genetic analyses The second and third cases
can be problematic even if the placement ofgaps is not ambiguous and their number isidentical for all sequences with one or moregaps in that region The problem resides inthe weighting scheme In the case presentedin Figure 1b where we have a 1 pound 3 blockof gaps the transformation T Atilde ndash can beattributed a cost of 1 or gt1 if based on thenegative natural logarithm of the probabilityof that change (Felsenstein 1981 Wheeler1990 Maddison and Maddison 1992) Theproblem is accentuated when several gapsare adjacent to one another (eg 3 pound 3Fig 1c) If each adjacent gap is consideredpart of an independent indel region this re-gion can quickly become overweighted In-dels that are likely to be part of one geneticevent that is more than one gap long and ofequal length across all taxa at a specic sitecan be coded as a new character that replacesthat region (eg Manos 1997) However theestimation of the cost for the transformationof one sequence to another for sequences thatare part of a specic indel region comparedwith the cost of this insertion or deletion re-mains problematic The weighting schemepresented here for character-state changeswithin a coded character partially solves thisproblem
The fourth example (Fig 1d) represents aspecial case in which the placement of theindel is not ambiguous but its presence orabsence is This case is likely when an ex-cessively low gap-to-substitution cost ratiois included as part of the range of cost ra-tios used to reveal different potential align-ments Such low cost ratios should be usedonly when dealing with highly divergent se-quences of highly variable lengths for whicha high frequency of gaps are expected How-ever the sequences in such cases are expectedto be so different that alignment is not possi-ble and their orthology or paralogy is ques-tionable This is an additional reason not touse a range of gapsubstitution cost ratios todelimit ambiguous regions If the presence ofgaps is extremely frequent for a given align-ment a totally different approach should beused (see region of data set of internal tran-scribed spacer region of Lutzoni 1995) Amultiple alignment method derived from themaximum likelihood approach proposed byThorne et al (1991 1992) where a cost ra-tio would be estimated for each pair of se-quences compared might solve this prob-lem The new method presented here does
634 SYSTEMATIC BIOLOGY VOL 49
FIGURE 2 Alignment generated in this study from the insect 16S mtrDNA data set as presented by Wheeleret al (1995) Note that this data set was inadvertently written in its reverse complement form by Wheeler et al(1995) and that their sequences for some taxa are different from the sequences found in GenBank To facilitate thecomparison with their paper and to ensure that differences in our respective results were strictly due to differentmethods however we used the same data set as presented in their 1995 publication Boxes delimit homologousambiguously aligned sequences iexcl gap missing data w variable site + constant site including missing dataAll sites without the symbols w or + on the line below the alignment are constant and without missing data
not address this specic case of presence orabsence of indels in a given region of thealignment
The fth and sixth cases (Figs 1e f) rep-resent typical situations where many sys-tematists will choose to exclude ambiguousregions especially when the different place-ment of gaps even when treated as missingdata suggests conicting phylogenetic rela-tionships The method we present was spe-cically designed to deal with the cases illus-trated in Figures 1c 1e and 1f but can alsobe applied to case 2 (Fig 1b)
In our proposed approach alignment isseen as the procedure for determining wherethe variation in length among sequences islocated This can usually be achieved by im-plementing commonly used alignment pro-grams such as CLUSTAL (Higgins et al1996) Sequencher and others followed bya thorough inspection by eye to correct ob-vious alignment errors and determine wherethe gaps are located
Figures 2 and 3 provide examples of delim-ited ambiguous regions from the insect 16SmtrDNA and crocodile 12S mtrDNA datasets respectively of Wheeler et al (1995) Theapproach used here was as follows
1 Inspect each region with at least one gap2 Slide the gap(s) laterally in an outward
direction from where they are located todetermine whether the nucleotide com-positions at adjacent sites and the sec-ondary structure can provide any justi-cation for alternative position(s) for thegap(s)
3 Continue this outward sliding of gaps inboth directions until the sliding of gapsby one more position cannot be justi-ed thus marking the boundaries for thatregion
4 If the nucleotide compositions at adjacentsites or if the secondary structure justi-es an alternative position for the gap(s)
2000 LUTZONI ET ALmdashAMBIGUOUS ALIGNMENTS AND PHYLOGENETICS 635
FIGURE 3 Alignment generated in this study for the crocodile 12S mtrDNA data set of Wheeler et al (1995)Boxes delimit homologous ambiguously aligned sequences iexcl gap w variable site All sites without the w symbolon the line below the alignment are constant
within the delimited region assess the po-tential effect on phylogenetic relationshipsfor these different gap positions
5 If these different alignments do not sup-port different phylogenetic relationshipsretain this region which does not need tobe excluded from the parsimony analysis
6 If the alignments do support differentphy-logenetic hypotheses replace this regionby a coded character
7 A rst approximation of the limits of theseregions can be made by using invariantanking regions as a guide (sites withoutasterisks in Figs 2 and 3)
Step 2 Unequivocal Coding of AmbiguouslyAligned Regions
Once all ambiguous regions of an align-ment have been delimited each region istreated separately (Fig 4) Because the am-biguity resides in the presenceabsence ofgaps and their placement the rst operationis to recover the original sequences for this re-gion This is done by removing all gaps fromthat region (Figs 4a b) Next the sequencesare inspected for the presence of missingdata uncertain base calling (eg presence ofIUPAC-IUB codes) and polymorphisms Allsequences with missing data at one or more
636 SYSTEMATIC BIOLOGY VOL 49
FIGURE 4 Unequivocal coding procedure for onehypothetical delimited ambiguously aligned region iexcl gap missing data (a) one delimited homologous re-gion containing ambiguously aligned sequences (b) Therst operation is to remove all gaps (c) Pairwise compar-isons of sequences for that region are then implementedIdentical sequences within that homologous region (in-cluding the complete absence of nucleotides) are giventhe same code Any sequence with at least one missingdatum is coded as ldquordquo At the end of the second stepof our approach the ambiguously aligned region is re-duced to a single coded character
sites are coded as missing data (Fig 4c) be-cause it is impossible to determine whetherthey are identical to any other sequence inthat ambiguous region Identical sequences(both in length and base composition) areattributed the same character state (Fig 4c)This principle also applies to OTUs withoutnucleotides for a given homologous but am-biguously aligned region For example inFigure 4c the two OTUs that do not havenucleotides for that region of the alignmentare both coded as character state 4 This lastcase illustrates why these delimited regionsneed to be anked by very conserved re-gions and therefore can be considered ho-mologous For sequences that include un-certain base calling or polymorphic sites allpossible coded character states can be at-tributed to these sequences This multistatecoded version of these sequences can thenbe treated as polymorphic or uncertain whenusing PAUP curren This practice however canlead to the introduction of a large number ofcharacter states for a given coded characterwhich can be problematic (see Discussion) Insuch instances coding sequences with uncer-tain base calling or polymorphisms simplyas missing data might be preferable Finallyalthough the ambiguous region is excludedfrom phylogenetic analyses it is replacedby its respective coded character which isadded to the end of the alignment This pro-cedure is repeated for each ambiguous regionthat is delimited for a given alignment andjudged worthy of coding
Two major factors affecting the result ofthis coding procedure are the width of theambiguous region and the rates at whichthese sequences are evolving For exampleidentical sequences are less likely to be foundfor an ambiguous region of 40 sites than fora region of 4 sites the same is true for afast-evolving (hypervariable) region versus aslowly evolving one The implementation ofthis coding method on a data set with a largenumber of OTUs could also be problematicbecause not enough symbols might be avail-able for all the different sequences within agiven ambiguous region The NEXUS for-mat (Maddison et al 1997) allows the useof all possible ASCII characters for this pur-pose however PAUP curren 40b2 allows a max-imum of 32 character states per characterIf the number of different sequences for agiven ambiguous region exceeds the maxi-mum number of character states per charac-ter allowed by a given program all sequencesthat are found more than once in that regioncould be coded with ASCII characters and allunique sequences could be coded as ldquordquo Aspointed out earlier the use of missing datain phylogenetic studies can be misleadingtherefore completely excluding this regionfrom phylogenetic analyses that is withoutreplacement by a coded character might bepreferable This problem could be viewed asa warning that saturation and consequentlythe loss of phylogenetic signal in that re-gion might be an issue which would giveadditional support for complete exclusion ofthe region from the phylogenetic study Thisis more likely to be the case when almostall sequences within a delimited region aredifferent Accordingly it is preferable to de-limit regions as narrowly as possible How-ever the risk of delimiting nonhomologousregions increases with the circumscriptionof narrower regions Because the validity ofthis method depends entirely on the delim-itation of ambiguous regions which doubt-less contain some homologous sequences in-cluding a few unambiguously aligned sitesfrom the anking regions to delimit slightlybroader regions might be desirable The lat-ter approach could be preferable even if itled to the complete exclusion of this regionfrom phylogenetic analyses The use of loopand stem information provided by the sec-ondary structure can be often useful in delim-iting narrow ambiguously aligned regionswithout risking delimiting nonhomologousregions
2000 LUTZONI ET ALmdashAMBIGUOUS ALIGNMENTS AND PHYLOGENETICS 637
If an ambiguous region is at the end of thealignment such as ambiguous region 5 (amb5) in Figure 2 there may be no highly con-served region between the end of the align-ment and the ambiguous region to be delim-ited Such an uncertain delimitation at theend of an alignment could be used to jus-tify the complete exclusion of that ambigu-ous region from future analyses because theportion of the sequences included in that de-limited region might not be homologous
Step 3 Optimal Weighting of AmbiguouslyAligned Regions
The weighting scheme proposed here re-ects the most likely nature of the changesfrom one sequence to another within an am-biguous region and includes a combinationof two factors similarity (Sxy) and number ofchanges (Cxy) for all pairwise comparisons ofsequences (x) and all possible alignments foreach pair of sequences (y) Sxy is equal to thenumber of sites that are identical (Ni) dividedby the total number of sites (Nt)
Sxy = Ni Nt
Cxy is equal to the total number of changes(number of nucleotide susbstitutions + num-ber of separate indels) for a given pair ofsequences A series of consecutive gaps ora single gap is counted as one indel (=one change) The optimal number of stepsis obtained by maximizing Sxy and mini-mizing Cxy The highest optimal value (Oxy)is used to select the Cxy value that willbe entered in the symmetric step matrix torepresent the optimal number of steps forthe transformation of one sequence into theother
Oxy = Sxy Cxy
First all alignments with the fewestchanges and the greatest similarity for agiven pair of sequences mustbe found In thisprocess a gap or a series of gaps will be intro-duced only if Oxy stays the same or increasesFor example in Figure 5a the optimal num-ber of steps that would be included in thestep matrix for these two sequences wouldbe 2 because the highest optimal value is2857 This example has two equally opti-mal alignments O11 and O12 Both involvethe same number of changes (Cxy = 2) In thecase where two equally optimal values are
FIGURE 5 Determination of the optimal Cxy valueto be included in a step matrix and applied to a speciccoded character representing an ambiguously alignedregion by maximizing Oxy (see text for further expla-nation) (a) In this case the optimal number of changes(Cxy = 2) would be chosen as the optimal number ofsteps and included in the step matrix to account for thetransformation between the two characters states rep-resenting these two sequences (b) Example showing acase where increasing Nt can increase Oxy
obtained but each indicates a different num-ber of fewest changes (ie different Cxy val-ues) the fewest changes (lowest Cxy value)would be integrated in the step matrixBy doing this we assert a preference forslightly underweighting than overweightinga change from one sequence to the otherThis also minimizes the possibility of vio-lating triangle inequality for any particularstep matrix (Maddison and Maddison 1992)Figure 5b shows how sliding the sequence byone site and increasing Nt by one can still in-crease Oxy
The output of this method consists of a se-ries of coded characters one for each des-ignated ambiguous region of the alignmenteach with its own step matrix (Fig 6) Thecoded characters can be added at the end ofthe data matrix The number of charactersspecied in the NEXUS le needs to be in-creased accordingly and the ambiguous re-gions need to be excluded because they arenow replaced by their coded counterpartsFinally the step matrices need to be addedin the assumptions block of the NEXUS leThe user needs to ensure that each step ma-trix is applied to its specic coded characteronly PAUP curren tests each step matrix for trian-gle inequality automatically and makes anynecessary modications
AN EXAMPLE USING THE INSECT 16S ANDCROCODILE 12S MTRDNA DATA SETS
Insect 16S mtrDNA
Wheeler et al (1995) used 10 different ra-tios of gap-to-substitution costs to align 9 se-quences from the mitochondrial genome of
638 SYSTEMATIC BIOLOGY VOL 49
FIGURE 6 Unequivocal coding and optimal character-state weighting (step matrices) according to the methodproposed here for each homologous ambiguously aligned region (a) Insect 16S mtrDNA (b)Crocodile 12S mtrDNA
insects which yielded 12 alignments Whenthey analyzed these alignments individu-ally 11 unique topologies were generatedWhen they combined these 12 alignmentsinto one concatenated alignment and re-moved (culled) all sites that differed amongthese 12 alignments their parsimony analy-sis generated 2 equally most-parsimonious
trees They reported that the strict consen-sus of these two trees was entirely un-resolved except for a single questionableApisndashCerastipsocus clade (Fig 7a) When theydownweighted rather then culled the vari-able sites among these 12 alignments pro-portionally to the amount of interalignmentvariability that is after their elision method
2000 LUTZONI ET ALmdashAMBIGUOUS ALIGNMENTS AND PHYLOGENETICS 639
FIGURE 7 Results obtained by Wheeler et al (1995) (a b) Phylogenetic trees resulting from the cull (a) andelision (b) procedures applied to the insect 16S mtrDNA data set (c d) Phylogenetic trees resulting from the cull(c) and elision (d) procedures applied to the crocodile 12S mtrDNA data set
they obtained a single most-parsimonioustree (Fig 7b)
We found ve regions in this data set thatcould not be aligned unequivocally (amb 1to amb 5 Fig 2) Amb 1 to amb 4 were easilydelimited They are anked by highly con-served (often invariable) sites and shiftingthe gaps into these anking regions could notbe justied under any optimization criterionto improve the alignment Amb 5 howeverlacks a conserved region at its 3 0 end whichmakes it impossible to determine if the se-quences in amb 5 are homologous as shownby the ldquordquo inserted at the end of the alignment(Fig 2) With this fundamental assumption indoubt we did not code amb 5 accordinglywe completely removed it from subsequentphylogenetic analyses
The unambiguously aligned portions ofthis data set as established with our methodprovided 21 parsimony-informative charac-ters Of the four ambiguously aligned re-
gions coded with our method none wasparsimony-informative (Fig 6a) if imple-mented under a model in which all changesamong coded character-states had equalcosts (ie in a step matrix in which allchanges = 1 step) However under themodel of unequal weighting of changesamong character-states implemented withour method phylogenetic signal was recov-ered from these ambiguous regions (Table 1)
When the phylogenetic search was re-stricted to unambiguous sites analogous tothe ldquocullrdquo analysis of Wheeler et al (1995)three equally most-parsimonious trees wererecovered (Figs 8a b e Table 1) Wheeleret al (1995) reported that their cull proce-dure yielded two topologies with an en-tirely unresolved strict consensusexcept for asingle questionable ApisndashCerastipsocus clade(Fig 7a) The strict consensus of the threetrees recovered with our approach was muchmore resolved and is identical to the topology
640 SYSTEMATIC BIOLOGY VOL 49
2000 LUTZONI ET ALmdashAMBIGUOUS ALIGNMENTS AND PHYLOGENETICS 641
TABLE 1 Summary of phylogenetic analyses for the insect 16S mtrDNA data set Coded amb 1ndash4 correspond toambiguous regions shown in Figure 2
No most- Consistency RescaledCharacters included Tree length parsimonious trees Topologya index consistency index
Unambiguous sites only 123 3 a b e 0846 0542
Unamb + coded amb 1 141 3 a b e 0837 0521Unamb + coded amb 2 138 4 a b d e 0841 0516
Unamb + coded amb 3 138 3 a b e 0855 0560
Unamb + coded amb 4 176 3 a b e 0875 0579
Unamb + coded amb 1ndash4 224 4 a b c e 0866 0549
aSee Figure 8
shown in Figure 8e Only one internode ismissing for this topology to be completelyresolved
When added individually the coded ver-sions of amb 1 amb 3 and amb 4 (Figs 2 6)generated the same three topologies as whenthe phylogenetic search was restricted tothe unambiguous portions of the alignment(Figs 8a b e Table 1) The addition ofamb 2 alone (Figs 2 6) resulted in oneadditional equally most-parsimonious tree(Fig 8d Table 1) This additional tree cor-responds more or less to the collapse of theinternode supporting the DrosophilandashAedesclade which was associated with the lowestbootstrap values (Fig 8) The new relation-ships revealed for these two taxa by the ad-dition of amb 2 are all very weakly supported(Fig 8d)
When all four coded ambiguous re-gions were included simultaneously in thephylogenetic search with the unambigu-ously aligned regions four equally most-parsimonious trees of 224 steps were re-vealed (Table 1) These were the same threetopologies derived from the analysis re-stricted to the unambiguously aligned por-
FIGURE 8 The ve most-parsimonious trees generated from analysis of the insect 16S mtrDNA data set with andwithout the inclusion of ambiguously aligned regions as obtained by the new method proposed here (see alsoTable 1) Only characters that provided unequivocal support in terms of gains and reversals to different phylo-genetic relationships revealed by Wheeler et al (1995) or in this study were mapped onto the topologies Arrowsdescribe the nature of the changes within these characters by showing the character states involved in each changeThe symbol on the left of the tail of each arrow refers to a specic character When this symbol is a number itrefers to a specic site in the alignment (Fig 2) If the number is preceded by ldquoardquo it refers to a coded ambiguouslyaligned region For example ldquoa4rdquo corresponds to ambiguously aligned region 4 (Figs 2 6a) Numbers in eacharrowhead indicate the number of steps (from the step matrix) associated with each specic change Bold num-bers below internodes are bootstrap percentages and numbers above internodes in parentheses are branch lengths(unequivocal changes) Tree lengths shown on this gure were calculated when only unambiguously aligned siteswere analyzed (a b e) Three equally most-parsimonious trees consistently generated whether ambiguous regionswere included or not in the six phylogenetic analyses listed in Table 1 (c) Single most-parsimonious tree generatedonly when all four coded ambiguous regions were included with unambiguously aligned sites (Table 1) (d) Singlemost-parsimonious tree obtained when only the coded amb 2 region was included with the unambiguously alignedsites (see Table 1 Fig 2)
tions of the data set (Figs 8a b e) plus oneadditional tree (Fig 8c) The latter topol-ogy was 2 steps longer (tree length = 125steps) when only the unambiguously alignedsites were used to calculate the tree length(Fig 8) The additional tree (Fig 8d) foundwhen adding amb 2 alone was only onestep longer (tree length = 124) than the threemost-parsimonious trees (Figs 8a b e)These longer trees were not statistically sig-nicantly worse than the most-parsimonioustrees when subjected to the Templeton testBecause the four coded ambiguous regionsare not parsimony-informative under anequally weighted (step matrix) scheme andbecause we believe that the inclusion of suchcharacters with our method can cause phy-logenetic artifacts (see Discussion) we con-cluded that restricting the analysis to theunambiguously aligned sites was the onlyjustiable solution
The elision procedure of Wheeler et al(1995)generated one most-parsimonious tree(Fig 7b) The internode supporting theDrosophilandashAedes clade the one separatingDorocordulia and Heptagenia from the restof the taxa and the bipartition separating
642 SYSTEMATIC BIOLOGY VOL 49
Dorocordulia Heptagenia and Schistocercafrom the rest are congruent with the strictconsensus of our three most-parsimonioustrees Both methods revealed a close re-lationship between Cicindela and BlaberusThere was one marked difference betweenthe elision result and ours The latter consis-tently showed Apis as sister to CerastipsocusThis odd relationship (according to Wheeleret al 1995) could well be an artifact result-ing from long branch attraction These twotaxa have the two longest branches (Fig 8)nested within a portion of the tree with shortinternodes
Two other factors could have contributedto the incongruent results between the elisionapproach and our method First Wheeleret al (1995) assumed that all types of nu-cleotide substitutions had the same costOur model took into consideration thatsome nucleotide substitutions were morefrequent than others and therefore wereattributed different costs which we imple-mented through a step matrix on the unam-biguous portion of the alignment Secondour method did not allow us to include re-gion amb 5 which is by far the largest am-biguously aligned region covering almostone third of the alignment (Fig 2) This re-gion is highly variable and would provide avery high fraction (probably close to 50) ofall the parsimony-informative sites from thecomplete data matrix Even if most sites inthis region are downweighted by the elisionmethod the signal it provides will probablyhave a considerable impact on the resultingtopology However this region is extremelyAT-rich (A = 52 and T = 37) and requiresthe inclusion of many gaps Therefore wefeel justied to at least question the phylo-genetic quality of the signal it provides Ifthis region were saturated by changes thatled to an accumulation of As and Ts fol-lowed by multiple changes between As andTs relatively little (if any) phylogenetic signalwould actually still be present in this regionThis raises a fundamental question Shouldsuch a region be included in a phylogeneticanalysis even if we were able to include itwithout violating positional homology
Crocodile 12S mtrDNA
The 10 different gap-to-substitution costratios used by Wheeler et al (1995) generated23 different alignments When analyzed sep-arately each of their 23 phylogenetic analy-
ses yielded a single most-parsimonious treeWhen compared however many of thesetrees were found to be identical yieldinga total of four different topologies By join-ing these 23 alignments end to end to formone concatenated alignment and then re-moving (culling) all interalignment variablesites the phylogenetic analysis of this con-catenated alignment generated four equallymostndashparsimonious trees The strict consen-sus of these four topologies (Fig 7c) showsa lack of resolution within the CaimanndashMelanosuchus clade and also for the relation-ship between the two Alligator species (ieparaphyly vs monophyly) Maximum parsi-mony analysis by Wheeler et al (1995) of theconcatenated alignment resulting from theelision of all 23 alignments (ie by down-weighting the interalignment variable sitesrather than excluding them from the analy-sis) revealed a single most-parsimonious treewith Melanosuchus sister to the Caiman cladeand Alligator as paraphyletic (Fig 7d)
Our alignment of the same data resulted inthe recognition of ve ambiguously alignedregions all of which were clearly ankedby highly conserved nucleotide sequences(Fig 3) All ve ambiguous regions were sub-jected to our method that is were codedand assigned step matrices (Fig 6b) Twoof the ve coded ambiguous regions (amb2 and amb 5) are potentially parsimony-informative if implemented under a modelin which every type of change has an equalcost Under a model of unequal weightingamong coded character-states however onlyamb 2 and amb 4 affected the phylogeneticsearches compared with a search restrictedto unambiguous sites only (Table 2)
When our maximum parsimony analy-sis was restricted to the unambiguouslyaligned portions of the data we obtained52 parsimony-informative characters thatresulted in one most-parsimonious tree(Fig 9b) As with the insect 16S data setour cull analysis (Fig 9b) provided muchmore resolution than did the cull analy-sis (Fig 7c) implemented by Wheeler et al(1995) This topology is also identical tothe most-parsimonious tree derived fromthe alignment obtained by using a gap-to-substitution cost ratio of 12 (Wheeler et al1995)
When only coded region amb 2 was addedto our phylogenetic analysis of unambigu-ous sites two equally most-parsimonioustrees were recovered (Table 2) One of these
2000 LUTZONI ET ALmdashAMBIGUOUS ALIGNMENTS AND PHYLOGENETICS 643
TABLE 2 Summary of phylogenetic analyses for the crocodile 12S mtrDNA data set Coded amb 1ndash5 correspondto ambiguous regions shown in Figure 3
No most- Consistency RescaledCharacters included Tree length parsimonious trees Topologya index consistency index
Unambiguous sites only 145 1 b 0697 0496Unamb + coded amb 1 159 1 b 0723 0518Unamb + coded amb 2 154 2 a b 0701 0497Unamb + coded amb 3 170 1 b 0741 0539Unamb + coded amb 4 158 1 c 0702 0500Unamb + coded amb 5 154 1 b 0714 0513Unamb + coded amb 1ndash5 215 1 c 0772 0563Unamb + coded amb 2 5 163 2 a b 0718 0513
aSee Figure 9
topologies is identical to the one derivedfrom the analysis of the unambiguous sitesonly (Fig 9b) The second topology shows thetwo Alligator speciesas sister species (Fig 9a)The strict consensus of these two topologieswould show a completely resolved tree ex-cept for the unresolved relationship betweenthe two Alligator species This unresolvedportion of the tree certainly represents themain weakness of the data set to resolve re-lationships between this pair of species (seedifferences among trees in terms of topolo-gies and bootstrap values in Fig 9)
When only coded region amb 4 was addedto our phylogenetic analysis of unambigu-ous sites a single most-parsimonious treewas obtained (Fig 9c) This topology isidentical to the single most-parsimonioustree that resulted from our all-inclusiveanalysis of the unambiguous sites plus allve coded ambiguous regions (Table 2)This is also the same tree recovered byWheeler et al (1995) when they analyzedindividually each alignment derived fromgap-to-substitution cost ratios of 11 2141 81 and 161 They also recovered thistopology with a cull analysis on alignmentsderived from gap-to-substitution cost ratiosof 11 81 and 161 and when their elisionanalysis was restricted to alignments derivedfrom gap-to-substitution cost ratios of 2181 and 161 Finally applying their elisionanalysis to all alignments combined alsogenerated this topology (Figs 7d 9c) For thecrocodile 12S mtrDNA data set the resultingtrees from the elision method (Fig 7d)and from our new approach if appliedto all ambiguous regions simultaneously(Fig 9c) were identical One advantageto our approach is that it also revealedthat the phylogenetic signal contained inambiguous region 4 (amb 4) is what ledto this topology (Table 2) Sequences for
Alligator sinensis Melanosuchus niger Paleo-suchus trigonatus and P palpebrosus are iden-tical in this region (Figs 3 9c) The differencesbetween these sequences and the ones for thetwo Caiman species involve only one and twosteps whereas for this same region (amb 4)on the internode between the two Alligatorspecies four steps are involved (Fig 9c) Weemphasize that the coded version of amb 4is parsimony-uninformative when subjectedto an equally weighted step matrix
This result raises an important questionShould a coded ambiguously aligned re-gion (such as amb 4) that is parsimony-uninformative when changes are equallyweighted but parsimony-informative whensubjected to an unequally weighted step ma-trix be included in phylogenetic analysesBased on empirical evidence (results notshown) the inclusion of such characters fa-vors an asymmetric topology (paraphyleticrelationships) To avoid this problem wewould be justied to exclude all coded re-gions that are parsimony-uniformative whensubjected to an equally weighted step matrixIn the case of the 12S data set the use of thiscriterion would justify the exclusion of codedregions amb 1 amb 3 and amb 4 from phylo-genetic analyses When the parsimony anal-ysis was implemented by using the unam-biguously aligned portions plus amb 2 andamb 5 only two equally most-parsimonioustrees resulted (as shown in Figs 9a b) oneof which shows the two alligators as sisterspecies
Phylogenetic analyses by Brochu (1997)of morphological as well as combined mor-phological and molecular data sets stronglysupport the monophyly of Alligator sinen-sis and A mississippiensis The subopti-mal topology shown in Figure 9c identi-cal to the tree recovered by Wheeler et al(1995) was only one step longer and was
644 SYSTEMATIC BIOLOGY VOL 49
2000 LUTZONI ET ALmdashAMBIGUOUS ALIGNMENTS AND PHYLOGENETICS 645
not statistically signicantly worse than themost-parsimonious trees (Figs 9a b) accord-ing to the Templeton test Clearly this 12Sdata set (Gatesy et al 1993 Wheeler et al1995) alone cannot resolve with any certaintythe relationships between these two Alligatorspecies
DISCUSSION
Criteria for Delimiting HomologousAmbiguously Aligned Sequences
The suggestion by Wheeler et al (1995)to use a broad range of gap-to-nucleotidesubstitution cost ratios to detect ambigu-ously aligned sites with ratios as low as12 and as high as 2561 is more likely toidentify sites as being ambiguously alignedwhen they are not At the low end of thisspectrum of cost ratios (eg 12 11 21)many gaps are included among the alignedsequences resulting in a high level of sim-ilarity At the other end of this spectrum(eg 2561 3001) resulting alignments willhave fewer gaps but the average similar-ity among aligned sequences will be muchlower The alignments resulting from thelatter cost ratios are extremely poor For theinsect 16S data set if we exclude the veregions that we identied as being ambigu-ously aligned (amb 1ndash5) only 9 of the re-maining alignment resulting from a 2561cost ratio as published by Wheeler et al(1995) would be correctly aligned accord-ing to our alignment This means that onlythe rst 10 sites of this data set (Fig 10)would not differ among all alignments andtherefore would not be downweighted orculled using the elision approach Our ap-
FIGURE 9 The three most-parsimonious trees generated from the crocodile 12S mtrDNA data set with andwithout the inclusion of ambiguously aligned regions as obtained by the new method proposed here (see alsoTable 2) Only characters that provided unequivocal support for relationships between the two Alligator species(mono- vs paraphyletic) were mapped onto the topologies Arrows describe the nature of the changes within thesecharacters by showing the character states involved in each change The symbol on the left of the tail of each arrowrefers to a specic character When this symbol is a number it refers to a specic site of the alignment (Fig 3) Ifthe number is preceded by ldquoardquo it refers to a coded ambiguously aligned region For example ldquoa4rdquo correspondsto ambiguously aligned region 4 (Figs 3 9c) Numbers in each arrowhead indicate the number of steps (from thestep matrix) associated with each specic change For example on topology (c) the change in amb 4 from characterstates 7 or 2 to 1 involved four steps Bold numbers below internodes are bootstrap percentages and numbersabove internodes in parentheses are branch lengths (unequivocal changes) Tree lengths shown on this gure werecalculated when unambiguous sites and coded ambiguous regions amb 2 and amb 5 were analyzed simultaneously(a) Tree obtained when coded amb 2 with or without amb 5 was included with the unambiguous sites (Table 2Fig 3) (b) Tree obtained when only unambiguous sites were included and when coded amb 1 amb 2 amb 3 amb5 or amb 2 and amb 5 were added to unambiguous sites (c) Single most-parsimonious tree generated when theentire data set was included that is when all ambiguously aligned regions (amb 1ndash5) were added to unambiguoussites The same topology was also generated when only amb 4 was added to the unambiguous sites (Table 2amb 4 Fig 3)
proach suggests that 100 more sites of thisalignment are unambiguously aligned Onthis basis we predict that more resolutionand higher support values will result whenphylogenetic searches are restricted to un-ambiguously aligned regions delimited byusing our approach The exclusion of ex-treme cost ratios in the elision process wouldimprove the situation However this wouldrequire a clear denition of the threshold be-yond which a cost ratio would be consid-ered extreme For example the alignment ofWheeler et al (1995) using an 81 cost ratio forthe same insect data set also included severalobvious misalignments The selection of therange of gap-to-nucleotide substitution costsis very subjective which is what Wheeleret al (1995) were trying to avoid with the eli-sion method In an attempt to solve this prob-lem Giribet and Wheeler (1999) proposed us-ing character congruence among data setsobtained with ILD metrics (Mickevich andFarris 1981) as the criterion to evaluate gapcosts in sequence alignment and phyloge-netic analyses
When maximum parsimony analysis ofthe insect 16S mtrDNA data set was re-stricted to unambiguously aligned sites iden-tied with our method versus those iden-tied using the elision approach our strictconsensus tree was much more resolved(Fig 8e vs Fig 7a) Our approach also ob-tained higher resolution for the crocodile12S mtrDNA data set under the same circum-stances Four equally most-parsimonioustrees resulted from the analysis after cullingambiguously aligned sites identied by theelision method (Fig 7c) whereas a sin-gle most-parsimonious solution (Fig 9b)
646 SYSTEMATIC BIOLOGY VOL 49
FIGURE 10 Alignment of the insect 16S mtrDNA data set presented by Wheeler et al (1995) using a gap-to-nucleotide substitution cost ratio of 2561 Ambiguously aligned regions (amb 1ndash5) identied with our method (seeFig 2) are delimited by clear boxes Shaded areas delimit regions that we identied as unambiguously aligned butthat are aligned differently because the 2561 cost ratio is used (compare with our alignment shown in Figure 2)These shaded regions would be detected as ambiguously aligned and therefore would be downweighted with theelision approach Adapted from the appendix published by Wheeler et al (1995)
resulted when the analysis was restricted tounambiguously aligned sites selected by us-ing our approach
Assuming that conservation of secondarystructure exceeds that of its nucleotides Kjer(1995) demonstrated the high potential of thesecondary structure as a guide for assign-ing homologous positions and for improv-ing alignments and phylogenetic accuracyOur experience using secondary structureto enhance alignments of nrDNA sequencesconrms Kjerrsquos conclusions However thatpractice does not solve all alignment prob-lems Ambiguously aligned sites are highlyconcentrated in loops where the secondarystructure is of no use in rening the align-ment or the sites can be located wherethe secondary structure is itself unresolvedDespite this limitation secondary structurecan be often useful in delimiting narrowerambiguously aligned regions without violat-ing homology For this reason the use of sec-ondary structure information (when avail-able) is an integral part of the rst step of
our procedure Unfortunately some degreeof subjectivity is still involved in the delimi-tation of ambiguous regions regardless of themethod used This specic aspect needs fur-ther investigation
In this article we did not use secondarystructure to help delimit the ambiguouslyaligned regions because we wanted to demo-nstrate that the method can be implementedeven if the secondary structure is unknownMoreover the 16S sequences published byWheeler et al (1995) which differ from thosein GenBank favor stem disruptions thatwould lead to an incorrect secondary struc-ture for some taxa For a fair comparison ofelision with our method however we usedthe data set as it was published by Wheeleret al in 1995
Contribution of Ambiguously AlignedSequences to Phylogenetic Resolution
Ambiguously aligned regions generallyinclude the fastest evolving sites of a given
2000 LUTZONI ET ALmdashAMBIGUOUS ALIGNMENTS AND PHYLOGENETICS 647
molecule Therefore these sites are mostlikely to provide phylogenetic signal thatcan resolve rapid radiations characterizedby consecutive short internodes that are oftenunresolved in phylogenetic studies and arealmost always associated with very low boot-strap values The integration of these rapidlyevolving ambiguously aligned regions bythe method proposed here is most likely toprovide synapomorphies along these prob-lematic short internodes We therefore ex-pect that greater resolution will be gainedwhen implementing our method especiallyin comparison with the results obtainedfrom the common and conservative prac-tice of completely excluding these regionsIn a study by Fernandez et al (1999) basedon a data set of 898 sites from the 5rsquo endof the nrRNA large subunit for 22 fun-gal taxa 16 ambiguously aligned regionswere delimited These 16 regions included157 of the 898 sites The integration ofthese regions into the phylogenetic analy-sis according to our method resulted ina single most-parsimonious tree comparedwith six equally most-parsimonious treeswhen these regions were completely ex-cluded from the analysis (see Fernandezet al 1999)
The phylogenetic analysis of the crocodile12S mtrDNA provides an example of an-other possible outcome resulting from theintegration of ambiguously aligned regionsas proposed here The exclusion of the veambiguously aligned regions resulted in asingle most-parsimonious tree whereas theinclusion of amb 2 and 5 resulted in one ad-ditional tree which showed the two alliga-tors as sister species In this case the inclu-sion of ambiguous regions by our methodresulted in the loss of resolution but thislarger pool of equally most-parsimonioustrees includes what is thought to be the cor-rect tree according to a combined morpho-logical and molecular study (Brochu 1997) Ifthe phylogenetic signal contained in ambigu-ously aligned regions is essential for phylo-genetic searches to converge on the correcttree and when maximum parsimony is con-sistent (sensu Felsenstein 1978) our methodshould increase phylogenetic accuracy be-cause of the additional characters it providesthat would otherwise be excluded or down-weighted
Should All Ambiguously Aligned Regions BeIncluded in Phylogenetic Analyses
Despite the high potential for ambiguouslyaligned regions to contribute greatly to phy-logenetic accuracy in some cases these re-gions will provide no gain or will even bedetrimental to phylogenetic accuracy For ex-ample if these regions are evolving so fastthat all sequences within a region are differ-ent the coded version of these regions willnot be parsimony-informative Yet whensubjected to an unequally weighted step ma-trix these coded regions can become infor-mative and provide a large portion of thesignal (eg the contribution of amb 4 inTable 2 and Fig 9c) However the phyloge-netic signal from these hypervariable regionsmight have been totally lost in the multi-tude of genetic changes over time Moreoverpreliminary empirical work we have done(results not shown) indicates that such char-acters are biased toward recovering asym-metric topologies The uninformativeness ofcoded ambiguously aligned regions and per-haps the saturation of genetic changes seemto best describe what is taking place withthe insect 16S mtrDNA (Figs 6a 8 Ta-ble 1) and ambiguously aligned regions 1 3and 4 of the crocodile 12S mtrDNA in thisstudy (Figs 6b 9 Table 2) For these rea-sons we strongly recommend that users ofthe method proposed here exclude from phy-logenetic analyses those coded ambiguouslyaligned regions that are uninformative whensubjected to an equally weighted step ma-trix If the homology of a given delimitedambiguously aligned region is doubtful thisregion cannot be dealt with in our approachand therefore should be excluded from allanalyses (eg amb 5 in Fig 2)
Another case for which users of themethod proposed here may consider ex-cluding a coded ambiguously aligned regionfrom phylogenetic analyses is when a pro-hibitively high number of character statesare required to code a given region PAUP curren
40b2a allows a maximum of 32 characterstates per character If the coding of an am-biguous region would require gt32 characterstates that region should be excluded fromphylogenetic analyses however this is an ar-bitrary cutoff point
This leads us to the question Should acoded ambiguous region with a high number
648 SYSTEMATIC BIOLOGY VOL 49
of character states be included in phyloge-netic analyses even if it can be accommo-dated Our experience is that it becomes verydifcult to handle ambiguously aligned re-gions that require gt15 character states Suchsituations are usually associated with large(many sites) ambiguous regions and largeregions are more likely to include sequenceswith drastic differences in length which cancause inconsistencies in their pairwise align-ment and in the determination of optimalnumber of changes In these situations tri-angle inequalities are likely to be so largethat the adjustments needed would modifythe step matrix in a way that does not trulyrepresent the relative number of steps re-quired to transform one sequence into an-other for most of the cells of that step matrixFinally coded regions with a large number ofcharacter states even if they are parsimony-informative when subjected to an equallyweighted step matrix can generate the samephylogenetic artifact (asymmetric phyloge-nies) as the uninformative coded regions thatbecome informative when subjected to anunequally weighted step matrix Simulationstudies are needed to determine when suchan artifact is more likely to happen Based onthe implementation of our proposed methodon several different data sets our rule ofthumb has been to exclude any ambigu-ously aligned regions requiring gt15 charac-ter states
Therefore in addition to integrating am-biguously aligned sequences in phylogeneticanalyses without violating positional homol-ogy this new method provides an objectivecriterion to exclude regions that are likely tojeopardize phylogenetic accuracy The exclu-sion of sites involves a certain degree of sub-jectivity and therefore is open to criticism(Gatesy et al 1993) and improvement How-ever the choice of gapnucleotide substitu-tion cost ratios needed for the elision ordirectoptimization (eg POY) of DNA sequencesalso involves subjectivity (see Giribet andWheeler 1999) Most likely the completeremoval of subjectivity in the delimitationof ambiguously aligned regions is utopian(Swofford et al 1996) However with themethod proposed here compared with directoptimization (POY) of DNA sequences theinvestigator still has access to the full rangeof analytical exibility and complexity avail-able in PAUP curren
Contribution of Ambiguously AlignedSequences to Estimations of Branch Length
Estimation of branch lengths is expectedto be improved with our method even whencompared with estimates corrected by anevolutionary model under the maximumlikelihood optimization Branch lengths arelikely to be underestimated in an uneven wayif they are derived exclusively from the un-ambiguous and often slowest-evolving re-gions of a molecule Unfortunately there isno satisfactory way to our knowledge to in-tegrate ambiguously aligned regions into aphylogenetic search by using maximum like-lihood as the optimization criterion
Contribution of Ambiguously AlignedSequences to Large-Scale Phylogenies
One of the major impediments in large-scale phylogenetic studies is the low ratiofor number of informative sites to numberof sequences A large number of very shortor zero-length internodes resulting from fewor no synapomorphies will greatly reducethe efciency of a search because of the over-whelming abundance of equally parsimo-nious suboptimal and optimal trees Anotherproblem associated with large-scale phylo-genetic studies involving a broad taxonomicsampling is the ever-increasing expansion ofambiguously aligned regions and the cre-ation of additional ambiguous regions as-sociated with the inclusion of more distanttaxa in the alignment This translates intoa net loss of unambiguously aligned infor-mative sites Our method provides accessi-bility to the phylogenetic signal residing inambiguously aligned characters which oth-erwise would be excluded or downweighted(elision) Because these characters are likelyto be rapidly evolving they can provide ad-ditional synapomorphies in regions of thetree that previously had very short or zero-length internodes The resulting reductionin the number of optimal and suboptimalequally parsimonious solutions should re-duce the time needed for search algorithmsto converge on the most-parsimonious treeor trees
Data sets with large numbers of se-quences and high intersequence divergencesare likely to generate a prohibitively highnumber of equally optimal alignments inthe elision approach Because the degree to
2000 LUTZONI ET ALmdashAMBIGUOUS ALIGNMENTS AND PHYLOGENETICS 649
which an ambiguously aligned site is down-weighted is proportional to its interalign-ment variability with elision many sitescould be downweighted to the extent thatthey would be effectively excluded from thephylogenetic analysis Therefore the contri-bution of the elision approach implementedwithin large-scale phylogenetic studies islikely to be minimal and could even bedetrimental if too broad a range of gap-to-substitution cost ratios is used (Fig 10)
Our method offers several advantagesover elision (Wheeler et al 1995) and di-rect optimization of DNA sequences (POYWheeler 1996) especially for dealing withlarge data sets The delimitation of am-biguously aligned regions imposed by ourmethod requires a thorough and careful in-spection of alignments Whereas this fa-miliarization with the data set allows oneto rene the alignment it can also lead tothe identication of specic evolutionary at-tributes (eg rate heterogeneity across sitesbase composition bias genetic change bias)that must be accounted for in a rigorous phy-logenetic analysisof large-scale data sets An-other advantage of our approach is that re-gions that are not ambiguously aligned butinclude gaps at two or more contiguous sites(eg Fig 1c) can be systematically recodedThis allows theuser to use gaps as a fth char-acter state on the remaining data set withoutworrying about the effect of overweightingstretches that contain gaps at more than onecontiguous site
Future Developments
We have implemented our method by us-ing the program INAASE (INtegration ofAmbiguously Aligned SEquences) In futuredevelopments of our method we expect touse a better pairwise alignment procedurethan the one implemented in the currentversion of our program INAASE 02c1 pro-vide a weighting scheme for the coded re-gions that would integrate probabilities ofevery possible type of change in those re-gions and extend this approach to phyloge-netic searches by using maximum likelihoodas the optimization criterion The currentver-sion of INAASE 02c1 uses a dynamic pro-gramming alignment approach (Needlemanand Wunsch 1970) to nd all the best align-ments of two sequences
Contrary to the step matrices applied tothe unambiguous portions of the alignment
the step matrices applied to the coded am-biguous regions do not provide differen-tial weights for different types of changesamong the coded character states For ex-ample a change from A to C or C to Acould have a weight of two steps based onthe frequency of this type of change derivedfrom the unambiguously aligned portion ofthe alignment Currently however everytype of change within a delimited ambigu-ously aligned region is counted as one stepin INAASE This discrepancy between thetwo weighting schemesmdashfor the unambigu-ously aligned versus ambiguously alignedregionsmdasharises from thedifculty in estimat-ing the frequency of changes in a region of thealignment that is ambiguously aligned andlikely to be subject to a very different evolu-tionary model However we do not believethat this problem is insurmountable
Currently only phylogenetic searchesusing parsimony can benet from ourapproach This means that ambiguouslyaligned regions still need to be excluded frommaximum likelihood searches To extend thismethod to phylogenetic searches that usemaximum likelihood as the optimization cri-terion is by far our greatest future challenge
PROGRAM AVAILABILITY
The program INAASE (INtegration of Am-biguously Aligned SEquences) has been de-veloped to implement the unequivocal cod-ing and optimal weighting of ambiguouslyaligned sequences described in this paperINAASE can be obtained by contacting FLThe program was written by PW in C for thepower PC (Apple) platform and modied bySZ
ACKNOWLEDGMENTS
We are particularly thankful to Karl Kjer for his thor-ough reading of the manuscript His comments and sug-gestions greatly improved this paper We thank PaulLewis for his useful comments on how to improvethe alignment algorithm implemented in our programINAASE Rob DeSalle and John Gatesy for providingdata matrices and Kathleen Pryer Chris Brochu JuttaBuschbom Andrew Miller and Rebecca Rincker for acritical reading of the manuscript This research wassup-ported by a National Science Foundation DEB-9615542grant awarded to FL
NOTE ADDED IN PROOF
W Wheeler (1999 Cladistics 15379ndash385)published a similar approach while ourmanuscript was in press
650 SYSTEMATIC BIOLOGY VOL 49
REFERENCES
BALDWIN B G M J SANDERSON J M PORTERM F WOJCIECHOWSKI C S CAMPBELL AND M JDONOGHUE 1995 The ITS region of nuclear ribosomalDNA A valuable source of evidence on angiospermphylogeny Ann Mo Bot Gard 82257ndash277
BARRIEL V 1994 Phylogenies moleculaires etinsertions-deletions de nucleotides C R AcadSci Paris 317693ndash701
BAUM D A K J SYTSMA AND P CHOCH 1994 A phy-logenetic analysis of Epilobium (Onagraceae) based onnuclear ribosomal DNA sequences Syst Bot 19363ndash388
BERBEE M L 1996 Loculoascomycete origins and evo-lution of lamentous ascomycetes morphology basedon 18S rRNA gene sequence data Mol Biol Evol13462ndash470
BERBEE M L AND J W TAYLOR 1993 Dating the evo-lutionary radiations of the true fungi Can J Bot711114ndash1127
BREMER K 1988 The limits of amino acid sequencedata in angiosperm phylogenetic reconstruction Evo-lution 42795ndash803
BROCHU C A 1997 Morphology fossils divergencetiming and the phylogenetic relationships of GavialisSyst Biol 46479ndash522
BRUNS T D R VILGALYS S M BARNS D GONZALEZD S HIBBETT D J LANE L S IMON S STICKEL TM SZARO W G WEISBURG AND M L SOGIN 1992Evolutionary relationships within the fungi analysesof nuclear small subunit rRNA sequences Mol Phy-logenet Evol 1231ndash241
CERCHIO S AND P TUCKER 1998 Inuence of align-ment on the mtDNA phylogeny of Cetacea ques-tionable support for a MysticetiPhyseteroidea cladeSyst Biol 47336ndash344
DESALLE R C WRAY AND R ABSHER 1994 Com-putational problems in molecular systematics Pages353ndash370 in Molecular ecology and evolution ap-proaches and applications (B Schierwater B StreitG P Wagner and R DeSalle eds) Birkhauser VerlagBoston
DOYLE J J AND J I DAVIS 1998 Homology in molec-ular phylogenetics a parsimony perspective Pages101ndash131 in Molecular systematics of plants 2nd edi-tion (P S Soltis D E Soltis and J J Doyle eds)Chapman and Hall New York
FELSENS TEIN J 1978 Cases in which parsimony or com-patibility methods will be positively misleading SystZool 27401ndash410
FELSENS TEIN J 1981 A likelihood approach to characterweighting and what it tells us about parsimony andcompatibility Biol J Linn Soc 16183ndash196
FELSENS TEIN J 1985 Condence intervals on phylo-genies an approach using the bootstrap Evolution39783ndash791
FENG D AND R F DOOLITTLE 1987 Progressive se-quence alignment as a prerequisite to correct phylo-genetic trees J Mol Evol 25351ndash360
FENG D AND R F DOOLITTLE 1990 Progressive align-ment and phylogenetic tree reconstruction of proteinsequences In Molecular evolution computer analysisof protein and nucleic acid sequences (R F Doolittleed) Methods Enzymol 183 375ndash387
FERNANDEZ F F LUTZONI AND S M HUHNDORF1999 Teleomorphndashanamorph connections the newpyrenomycetous genus Carpoligna and its Pleurothe-cium anamorph Mycologia 91251ndash262
GATESY J R DESALLE AND W WHEELER 1993Alignmentndashambiguous nucleotide sites and the exclu-sion of systematic data Mol Phylogenet Evol 2152ndash157
G IRIBET G AND W C WHEELER 1999 On gaps MolPhylogenet Evol 13132ndash143
HEIN J 1990 Unied approach to alignment and phy-logenies In Molecular evolution computer analysisof protein and nucleic acid sequences (R F Doolittleed) Methods Enzymol 183626ndash644
HIBBETT D S AND R VILGALYS 1993 Phylogeneticrelationships of Lentinus (Basidiomycotina) inferredfrom molecular and morphological characters SystBot 18409ndash433
HIBBETT D S Y FUKUMASA-NAKAI A TSUNEDA ANDM J DONOGHUE 1995 Phylogenetic diversity inshiitake inferred from nuclear ribosomal DNA se-quences Mycologia 87618ndash638
HIGGINS D G J D THOMPSON AND T J G IBSON1996 Using CLUSTAL for multiple sequence align-ments In Computer methods for macromolecular se-quence analysis (R F Doolittle ed) Methods Enzy-mol 266383ndash402
HILLIS D M 1994 Homology in molecular biologyPages 339ndash368 in Homology the hierarchical basis ofcomparative biology (B K Hall ed) Academic PressSan Diego
HILLIS D M AND J P HUELSENBECK 1992 Signalnoise and reliability in molecular phylogenetic anal-yses J Hered 83189ndash195
HILLIS D M J P HUELSENBECK AND C W CUNNING-HAM 1994 Application and accuracy of molecularphylogenies Science 264671ndash677
KJER K M 1995 Use of rRNA secondary structurein phylogenetic studies to identify homologous posi-tions An example of alignment and data presentationfrom the frogs Mol Phylogenet Evol 4314ndash330
KRETZER A Y LI T SZARO AND T D BRUNS 1996Internal transcribed spacer sequences from 38 recog-nized species of Suillus sensu lato phylogenetic andtaxonomic implications Mycologia 88776ndash785
KRUSKAL J B 1983 An overview of sequence com-parison Pages 1ndash45 in Time warps string edits andmacromolecules (D Sankoff and J B Kruskal eds)Addison-Wesley Reading Massachusetts
LAKE J A 1991 The order of sequence alignment canbias the selection of tree topology Mol Biol Evol8378ndash385
LLOYD D G AND V L CALDER 1991 Multi-residuegaps a class of molecular characters with exceptionalreliability for phylogenetic analyses J Evol Biol 49ndash21
LUTZONI F 1995 Phylogeny of lichen- and non-lichen-forming omphalinoid mushrooms and the utility oftesting for combinability among multiple data setsSyst Biol 46373ndash406
MADDISON D R D L SWOFFORD AND W P MADDI-SON 1997 NEXUS An extensible le format for sys-tematic information Syst Biol 46590ndash621
MADDISON W P 1993 Missing data versus missingcharacters in phylogenetic analysis Syst Biol 42576ndash581
MADDISON W P AND D R MADDISON 1992 Mac-Clade analysis of phylogeny and character evolutionvers 30 Sinauer Sunderland Massachusetts
MANOS P S 1997 Systematics of Nothofagus (Nothofa-gaceae) based on rDNA spacer sequences (ITS) tax-onomic congruence with morphology and plastid se-quences Am J Bot 841137ndash1155
2000 LUTZONI ET ALmdashAMBIGUOUS ALIGNMENTS AND PHYLOGENETICS 651
MICKEVICH M F AND J S FARRIS 1981 The implica-tions of congruence in Menidia Syst Zool 27143ndash158
MINDELL D P 1991 Aligning DNA sequences ho-mology and phylogenetic weighting Pages 73ndash89in Phylogenetic analysis of DNA sequences (M MMiyamoto and J Cracraft eds) Oxford Univ PressNew York
NEEDLEMAN S B AND C D WUNSCH 1970 A gen-eral method applicable to the search for similarities inthe amino acid sequence of two proteins J Mol Biol48443ndash453
PATTERSON C 1982 Morphological characters and ho-mology Pages 21ndash74 in Prospects in systematics (KJoysey and A Friday eds) Academic Press London
PATTERSON C 1988 Homology in classical and molec-ular biology Mol Biol Evol 5603ndash625
PLATNICK N I C E GRISWOLD AND J A CODDING-TON 1991 On missing entries in cladistic analysisCladistics 7337ndash343
ROTH V L 1988 The biological basisof homology Pages1ndash26 in Ontogeny and systematics (C J Humphriesed) Columbia Univ Press New York
SANKOFF D D AND R J CEDERGREN 1983 Simulta-neous comparison of three or more sequences relatedby a tree Pages 253ndash264 in Time warps string ed-its and macromolecules the theory and practice ofsequence comparison (D Sankoff and F B Kruskaleds) Addison-Wesley Reading Massachusetts
SOLTIS D E L A JOHNSON AND CLOONEY 1996 Dis-cordance between ITS and chloroplast topologies inthe Boykinia group (Saxifragaceae) Syst Bot 21169ndash185
SPATAFORA J W 1995 Ascomal evolution of lamen-tous ascomycetes Evidence from molecular data CanJ Bot 73(Suppl 1)S811ndashS815
SPATAFORA J W AND M BLACKWELL 1993 Molecu-lar systematics of unitunicate perithecial ascomycetesThe ClavicepitalesndashHypocreales connection Mycolo-gia 85912ndash922
STEVENS P F 1991 Character states morphologicalvariation and phylogenetic analysis A review SystBot 16553ndash583
SWOFFORD D L 1998 PAUP curren Phylogenetic analysisusing parsimony ( curren and other methods) vers 40 Sin-auer Sunderland Massachusetts
SWOFFORD D L G J OLSEN P J WADDELL AND DM HILLIS 1996 Phylogenetic inference Pages 407ndash514 inMolecular systematics 2nd edition (D M Hillis
CMoritz and BK Mable eds) Sinauer SunderlandMassachusetts
TEMPLETON A R 1983 Phylogenetic inference from re-striction endonuclease cleavage site maps with par-ticular reference to the humans and apes Evolution37221ndash244
THORNE J LH KISHINO AND J FELSENSTEIN 1991 Anevolutionary model for maximum likelihood align-ment of DNA sequences J Mol Evol 33114ndash124
THORNE J L H KISHINO AND J FELSENSTEIN1992 Inching toward reality An improved likelihoodmodel of sequence evolution J Mol Evol 343ndash16
VING RON M AND M S WATERMAN 1994 Sequencealignment and penalty choice Review of conceptscase studies and implications J Mol Biol 2351ndash12
VOGLER A P AND R DESALLE 1994 Evolution andphylogenetic information content of the ITS-1 regionin the tiger beetle Cicindela dorsalis Mol Biol Evol11393ndash405
WATERMAN M S M EGGERT AND F LANDER 1992Parametric sequence comparisons Proc Natl AcadSci USA 896090ndash6093
WEIR B 1990 Genetic data analysis Sinauer Sunder-land Massachusetts
WHEELER W C 1990 Combinatorial weights in phy-logenetic analyis a statistical parsimony procedureCladistics 6269ndash275
WHEELER W C 1994 Sources of ambiguity in nucleicacid sequence alignment Pages 323ndash352 in Molecularecology and evolution approaches and applications(B Schierwater B Streit G P Wagner and R DeSalleeds) Birkhauser Verlag Boston
WHEELER W C 1995 Sequence alignment parametersensitivity and the phylogenetic analysis of moleculardata Syst Biol 44321ndash331
WHEELER W C 1996 Optimization alignment the endof multiple sequence alignment in phylogeneticsCladistics 121ndash9
WHEELER W C J GATESY AND R DESALLE 1995 Eli-sion a method for accommodating multiple molecu-lar sequence alignments with alignment-ambiguoussites Mol Phylogenet Evol 41ndash9
WILEY E O 1981 Phylogenetics the theory and practiceof phylogenetic systematics Wiley New York
Received 11 January 1999 accepted 15 April 1999Associate Editor R Olmstead
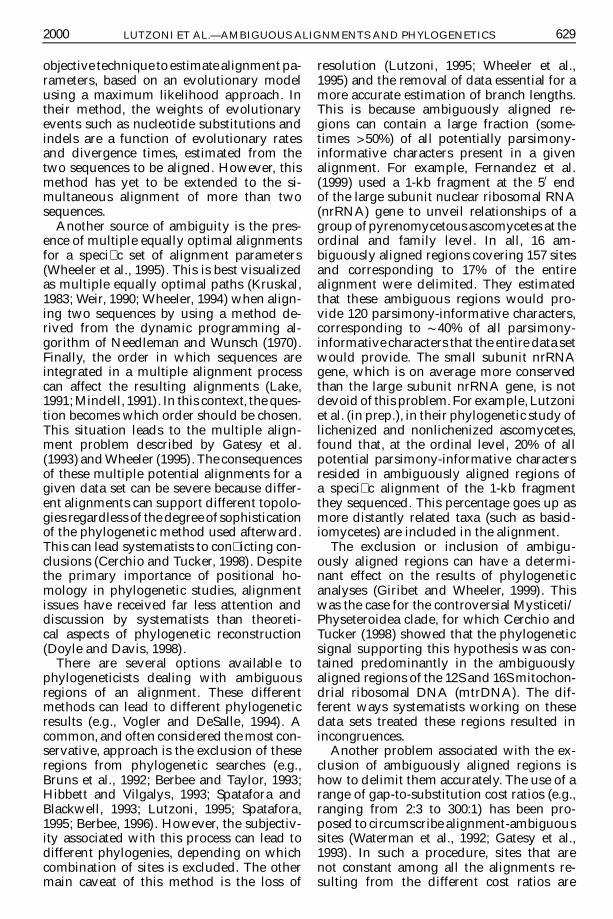
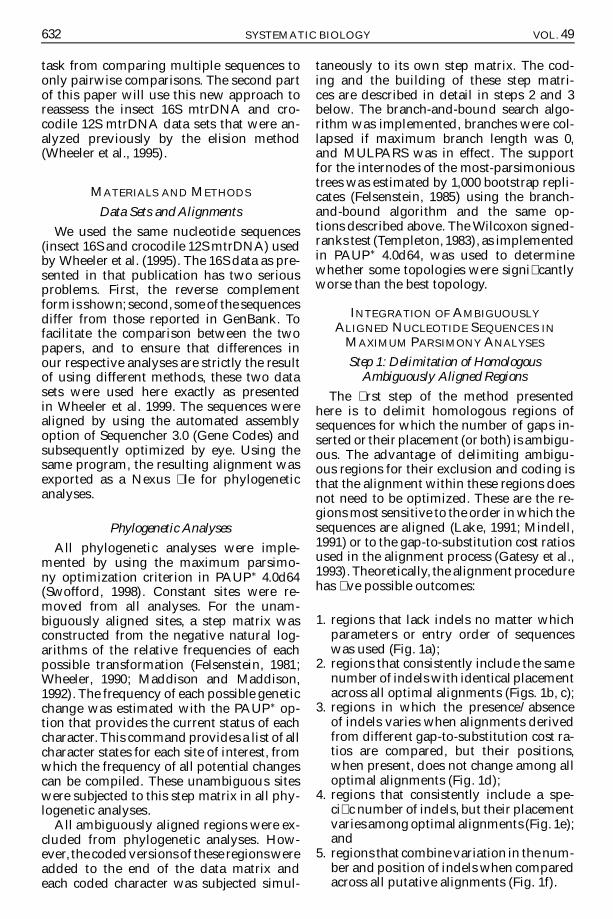
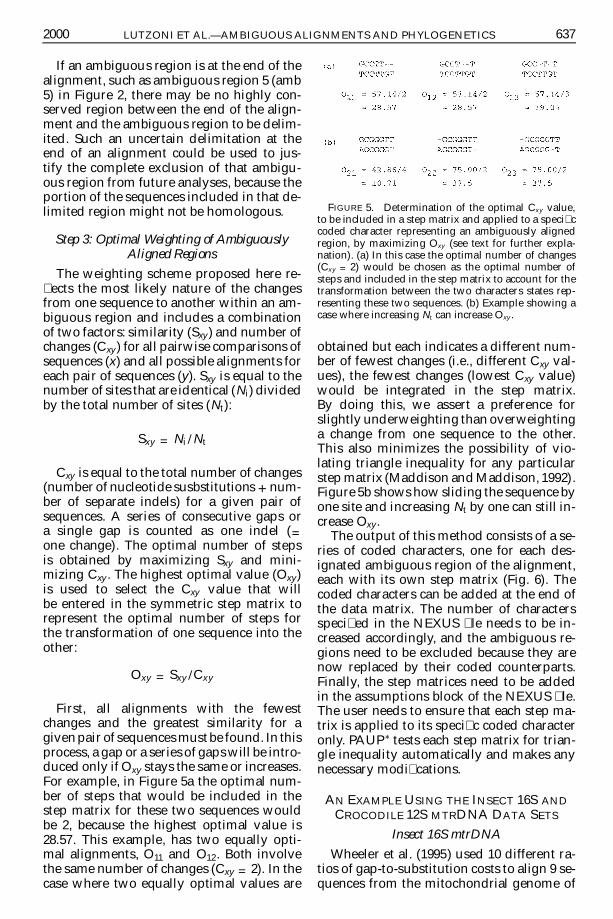
Copyright © 2022 FDOKUMEN