Cloning and Characterization of MicroRNAs from Rice
11
BioMed Central Page 1 of 11 (page number not for citation purposes) BMC Developmental Biology Open Access Research article Cloning and characterization of microRNAs from rainbow trout (Oncorhynchus mykiss): Their expression during early embryonic development Raghuveer K Ramachandra 1 , Mohamed Salem 1 , Scott Gahr 2 , Caird E Rexroad III 2 and Jianbo Yao* 1 Address: 1 Laboratory of Animal Biotechnology and Genomics, Division of Animal and Nutritional Sciences, West Virginia University, Morgantown, WV 26506, USA and 2 U.S. Department of Agriculture, Agricultural Research Service, National Center for Cool and Cold Water Aquaculture, Kearneysville, WV 25430, USA Email: Raghuveer K Ramachandra - [email protected]; Mohamed Salem - [email protected]; Scott Gahr - [email protected]; Caird E Rexroad - [email protected]; Jianbo Yao* - [email protected] * Corresponding author Abstract Background: Current literature and our previous results on expression patterns of oocyte- specific genes and transcription factors suggest a global but highly regulated maternal mRNA degradation at the time of embryonic genome activation (EGA). MicroRNAs (miRNAs) are small, non-coding regulatory RNAs (19–23 nucleotides) that regulate gene expression by guiding target mRNA cleavage or translational inhibition. These regulatory RNAs are potentially involved in the degradation of maternally inherited mRNAs during early embryogenesis. Results: To identify miRNAs that might be important for early embryogenesis in rainbow trout, we constructed a miRNA library from a pool of unfertilized eggs and early stage embryos. Sequence analysis of random clones from the library identified 14 miRNAs, 4 of which are novel to rainbow trout. Real-time PCR was used to measure the expression of all cloned miRNAs during embryonic development. Four distinct expression patterns were observed and some miRNAs showed up- regulated expression during EGA. Analysis of tissue distribution of these miRNAs showed that some are present ubiquitously, while others are differentially expressed among different tissues. We also analyzed the expression patterns of Dicer, the enzyme required for the processing of miRNAs and Stat3, a transcription factor involved in activating the transcription of miR-21. Dicer is abundantly expressed during EGA and Stat3 is up-regulated before the onset of EGA. Conclusion: This study led to the discovery of 14 rainbow trout miRNAs. Our data support the notion that Dicer processes miRNAs and Stat3 induces expression of miR-21 and possibly other miRNAs during EGA. These miRNAs in turn guide maternal mRNAs for degradation, which is required for normal embryonic development. Published: 15 April 2008 BMC Developmental Biology 2008, 8:41 doi:10.1186/1471-213X-8-41 Received: 3 February 2008 Accepted: 15 April 2008 This article is available from: http://www.biomedcentral.com/1471-213X/8/41 © 2008 Ramachandra et al; licensee BioMed Central Ltd. This is an Open Access article distributed under the terms of the Creative Commons Attribution License (http://creativecommons.org/licenses/by/2.0 ), which permits unrestricted use, distribution, and reproduction in any medium, provided the original work is properly cited.
-
Upload
independent -
Category
Documents
-
view
3 -
download
0
Transcript of Cloning and Characterization of MicroRNAs from Rice

BioMed CentralBMC Developmental Biology
ss
Open AcceResearch articleCloning and characterization of microRNAs from rainbow trout (Oncorhynchus mykiss): Their expression during early embryonic developmentRaghuveer K Ramachandra1, Mohamed Salem1, Scott Gahr2, Caird E Rexroad III2 and Jianbo Yao*1Address: 1Laboratory of Animal Biotechnology and Genomics, Division of Animal and Nutritional Sciences, West Virginia University, Morgantown, WV 26506, USA and 2U.S. Department of Agriculture, Agricultural Research Service, National Center for Cool and Cold Water Aquaculture, Kearneysville, WV 25430, USA
Email: Raghuveer K Ramachandra - [email protected]; Mohamed Salem - [email protected]; Scott Gahr - [email protected]; Caird E Rexroad - [email protected]; Jianbo Yao* - [email protected]
* Corresponding author
AbstractBackground: Current literature and our previous results on expression patterns of oocyte-specific genes and transcription factors suggest a global but highly regulated maternal mRNAdegradation at the time of embryonic genome activation (EGA). MicroRNAs (miRNAs) are small,non-coding regulatory RNAs (19–23 nucleotides) that regulate gene expression by guiding targetmRNA cleavage or translational inhibition. These regulatory RNAs are potentially involved in thedegradation of maternally inherited mRNAs during early embryogenesis.
Results: To identify miRNAs that might be important for early embryogenesis in rainbow trout,we constructed a miRNA library from a pool of unfertilized eggs and early stage embryos. Sequenceanalysis of random clones from the library identified 14 miRNAs, 4 of which are novel to rainbowtrout. Real-time PCR was used to measure the expression of all cloned miRNAs during embryonicdevelopment. Four distinct expression patterns were observed and some miRNAs showed up-regulated expression during EGA. Analysis of tissue distribution of these miRNAs showed thatsome are present ubiquitously, while others are differentially expressed among different tissues.We also analyzed the expression patterns of Dicer, the enzyme required for the processing ofmiRNAs and Stat3, a transcription factor involved in activating the transcription of miR-21. Diceris abundantly expressed during EGA and Stat3 is up-regulated before the onset of EGA.
Conclusion: This study led to the discovery of 14 rainbow trout miRNAs. Our data support thenotion that Dicer processes miRNAs and Stat3 induces expression of miR-21 and possibly othermiRNAs during EGA. These miRNAs in turn guide maternal mRNAs for degradation, which isrequired for normal embryonic development.
Published: 15 April 2008
BMC Developmental Biology 2008, 8:41 doi:10.1186/1471-213X-8-41
Received: 3 February 2008Accepted: 15 April 2008
This article is available from: http://www.biomedcentral.com/1471-213X/8/41
© 2008 Ramachandra et al; licensee BioMed Central Ltd. This is an Open Access article distributed under the terms of the Creative Commons Attribution License (http://creativecommons.org/licenses/by/2.0), which permits unrestricted use, distribution, and reproduction in any medium, provided the original work is properly cited.
Page 1 of 11(page number not for citation purposes)

BMC Developmental Biology 2008, 8:41 http://www.biomedcentral.com/1471-213X/8/41
BackgroundEmbryos are dependent on maternally stored mRNAs fortheir transcriptional needs until their own transcriptionmachinery is functional. The initiation of embryonic geneexpression, embryonic genome activation (EGA), variesgreatly with species. While it occurs by the 2-cell stage inmice, it does not take place until mid-blastula in teleosts[1] and amphibians [2]. Three reasons have been sug-gested to explain why the embryonic genome is not ableto transcribe mRNAs before EGA; namely (i) epigeneticand chromatin mediated repression, (ii) insufficient tran-scription machinery and (iii) lack of sufficient time for thechromosome to transcribe while it is undergoing rapidcell divisions [3]. In zebrafish, the maternal-zygotic tran-sition is characterized by asynchronous cell division,lengthening of cell cycles, cell motility and initiation ofzygotic transcriptional machinery [1]. After this activa-tion, the embryo becomes increasingly dependent on itsown transcription and exhausts the maternally storedmRNAs. It was recently shown that it is critical to degradematernally inherited mRNAs to achieve normal morpho-genesis which is delayed if these inherited mRNAs are notdegraded [4]. This suggests a tightly controlled regulatorymechanism in nature to degrade maternal mRNAs at thetime of EGA.
Previously, we showed that the transcripts for several tran-scription factors [5] and a novel oocyte-specific protein[6] are degraded during/around the time of EGA in rain-bow trout. Apart from the involvement of TATA bindingprotein (TBP) in regulating maternal mRNA degradation[7], little information is available on how maternal mRNAdegradation is regulated. Mechanisms by which this deg-radation is accomplished escaped scientific attention untilrecently. It was hypothesized by Schier [3] that microR-NAs (miRNAs) are involved in these degradation proc-esses.
MicroRNAs are small, 19–23 nucleotides (nt) non-codingRNAs that bind to recognition sequences on 3'-untrans-lated regions (3'-UTRs) of mRNAs and target them fordegradation in cases of high complementarity or transla-tional repression in cases of partial complementarity.Interestingly, a miRNA can bind to a specific recognitionsequence on 3'-UTR of up to 200 transcripts and eachmRNA could have recognition sequences for many miR-NAs [8]. The current miRNA model is well suited toexplain maternal mRNA degradation because miRNAsdegrade mRNAs in a specific and large scale mannerwhich is the case during EGA. Absence of all miRNAscaused by the deficiency of Dicer, an enzyme that isrequired for processing miRNAs, results in severe earlyembryonic deformities and faulty brain morphogenesis[9]. In addition, Girldez and coworkers found that miR-
430 leads to rapid deadenylation and degradation ofmaternal mRNAs [4].
To identify miRNAs that might be important for earlyembryogenesis in rainbow trout, we constructed a miRNAlibrary from a pool of unfertilized eggs and early stageembryos. We report here the identification of 14 rainbowtrout miRNAs and their expression profiles during earlyembryonic development. Our analysis showed that all 14miRNAs are present in the early stage embryos examinedwith multiple expression patterns. In addition, we presentdata to show that Dicer, the enzyme required for theprocessing of miRNAs, is abundantly expressed duringEGA, and Stat3 which activates transcription of miRNA-21, is up-regulated before the onset of EGA, supportingthe important roles of these proteins in activation/processing of miRNAs which in turn degrade maternalmRNAs during early embryonic development.
Results and DiscussionCloning and identification of rainbow trout microRNAsA schematic diagram of the method used to construct themiRNA library is depicted in Fig. 1. The library was con-structed using small RNAs isolated from a pool of oocytesand early embryos. Random clones were picked andscreened for presence of inserts by colony PCR beforesequencing. A total of 150 clones were sequenced.Sequence analysis identified 32 small RNAs that show sig-nificant similarities with published miRNAs (Sanger data-base Version 10.0 [10]). Names of the rainbow troutmiRNA were assigned based on the homologies betweenthe cloned sequence and published miRNA sequences atSanger database (Table 1) using internationally accepteduniform nomenclature [11]. After excluding redundancy,fourteen unique miRNAs were identified from rainbowtrout that are conserved across several species (Table 1).Four miRNAs were novel to rainbow trout characterizedas having high homologies with published miRNAs butdiffered by at least 1 nucleotide. Since we obtained multi-ple copies of the same sequence in the library, it isunlikely that these are sequencing errors. We annotatedthe novel miRNAs as omy-miR-100t, omy-miR-21t, omy-miR-125t and omy-miR-126t (names end with 't' fortrout, Table 1 and Fig. 2). These miRNAs only observed inthe rainbow trout (omy-miR-100t, omy-miR-21t, omy-miR-125t and omy-miR-126t) are of special interestbecause of their unique sequences and possibly uniquetargeting mechanisms. These miRNAs differ by at leastone nucleotide and this difference might have profoundimpact on target recognition and post-transcriptional reg-ulation. Omy-miR-21t has a G to A mismatch with miR-21 of cows at position 16 but this mismatch seems to becommon for all fishes (miR-21 of zebrafish, fugu andpufferfish, Fig. 2A). MiR-21 from all these three fishes is23 nucleotides long whereas in humans and mice, miR-21
Page 2 of 11(page number not for citation purposes)

BMC Developmental Biology 2008, 8:41 http://www.biomedcentral.com/1471-213X/8/41
Page 3 of 11(page number not for citation purposes)
Schematic diagram showing method used to clone rainbow trout miRNAsFigure 1Schematic diagram showing method used to clone rainbow trout miRNAs. MirCat™ (IDT DNA Technologies, Coralville IA) miRNA cloning kit was used with minor modifications.

BMC Developmental Biology 2008, 8:41 http://www.biomedcentral.com/1471-213X/8/41
is only 22 bases long. However, A to G mismatch betweentrout and other fishes at position 22 is absent betweentrout and mammals (Fig. 2A). In case of omy-miR-100t,there is a U to C single base substitution at position 17and this seems to be specific to rainbow trout (Fig 2B). Sois the case with omy-miR-125t, where the mismatch is a Cto U at positions 11 and 12 (Fig 2C). The presence of omy-miR-125b (identical to miR-125b of other species) andomy-miR-125t, specific to rainbow trout, suggests anotherlayer of complexity in post-transcriptional regulation bymiRNAs. omy-miR-126t sequence is identical to that ofchicken, mammals and fishes up to position 20, but hasan A to G mismatch at position 21 as compared to chickenmiR-126 (Fig 2D). These mismatches may not have pro-found influences on target recognition and mRNA degra-dation because they are not in the seed sequence (first 6–8nucleotides from 5' end) but they are likely fine-tune theexpression of their targets [12].
Expression patterns of miRNAs during early embryonic developmentWe analyzed the expression patterns of 14 miRNAs overthe first 6 days of rainbow trout development (Fig. 3). Theoverall pattern of all 14 miRNAs shows a minimumexpression in embryos at 2 days post fertilization (dpf).Based on miRNA abundance in embryos before and after2-dpf, the miRNAs were clustered into 4 distinct patterns.Pattern A, observed for omy-miR-23a, omy-miR-100t,omy-miR-125a, omy-miR-125b and omy-miR-125t, startswith a relatively high expression in unfertilized egg (0-dpf), declines gradually, reaching a very low level in 2-dpfembryos (P < 0.05) and remains low levels thereafter (Fig.3A). Pattern B, which includes omy-miR-26a and omy-miR-455, is similar to pattern A before 2-dpf. After 2-dpf,the expression of these miRNAs increases significantly (P< 0.05, Fig. 3B). MicroRNAs in pattern C include omy-miR-21, omy-miR-21t, omy-miR-30d, omy-miR-92a andomy-miR-200b. These miRNAs show a characteristic peakexpression at 5-dpf (P < 0.05, Fig. 3C). Pattern D miRNAsinclude omy-miR-126 and omy-miR-126*. These miR-NAs show a very significant increase in expression at 6-dpfcompared to other stages (P < 0.05, Fig. 3D).
The general trend of declined expression of miRNAs from0-dpf to 2-dpf, especially seen in patterns A and B, is sim-ilar to that of maternal transcripts. The increased expres-sion of pattern B miRNAs (between 2-dpf and 6-dpf)probably denotes the onset of EGA (Fig. 3B). The lowerexpression of all miRNAs in 2-dpf embryos may indicatethe transition point from the maternal to the embryonicgenomes. Mao et al., determined that onset of the rain-bow trout embryonic nuclear activity, genome activation,occurs at the stage 9 which is equivalent to 4-dpf for rain-bow trout embryos reared at 8.5°C [13]. In our study, theembryos were incubated at ~13°C which explains the ear-lier onset of EGA.
Significant increases of miRNA abundance at specificembryonic stages shown in patterns C (5-dpf) and D (6-dpf) suggest important roles for these miRNAs in rainbowtrout development; possibly involved in degrading resid-ual maternal mRNAs that remains after EGA or specificearly zygotic mRNAs. These results are consistent with thefindings of previous studies demonstrating the impor-tance of miRNAs in differentiation and development[4,14].
MiR-23, which exhibited pattern A (Fig. 3A), is known totarget important genes in neuronal development [15]. It ispresent in adult fish tissues, frog ovaries [16] and mam-malian neuronal cells [17]. Mir-23 is also known todown-regulate cell growth when inhibited in cell lines[18]. In rainbow trout embryos, omy-miR-23 is abun-dantly expressed in unfertilized eggs but is down regu-
Alignment of the novel rainbow trout miRNAs with highly homologous miRNAs from other species using BioEdit pro-gramFigure 2Alignment of the novel rainbow trout miRNAs with highly homologous miRNAs from other species using BioEdit program.
A
B
C
D
1 - - - | - - - - 10- - - - | - - - - 20 - - - -
1 - - - | - - - -10 - - - - | - - - - 20-
1 - - - | - - - -10 - - - - | - - - -20 - -
1 - - - | - - - -10- - - - | - - - -20- - -
Page 4 of 11(page number not for citation purposes)

BMC Developmental Biology 2008, 8:41 http://www.biomedcentral.com/1471-213X/8/41
lated after fertilization. With limited understanding of thetargets of this miRNA, the importance of this miRNA inearly embryonic development is not clear.
Transcript level of omy-miR-26, member of pattern B,increased after onset of EGA (Fig. 3B). MiR-26 is inducedunder hypoxic conditions and reduces pro-apoptotic sig-nals [19]. Expression of miR-26 gains relevance becausefish eggs undergo embryonic development in aquaticenvironments where dissolved oxygen is often in shortsupply. Mir-26 also produces caspase inhibitory effects[20] which could have long ranging consequences in earlymetabolism of stored glycoproteins in trout embryos.
Among the miRNAs of pattern C that showed a particularincrease after EGA at 5-dpf is omy-miR-21. omy-miR-21was the most abundant miRNA in our library. Similarly,miR-21 was the most abundant miRNA accounting for~40% of all cloned miRNAs in zebrafish [14]. This highabundance of miR-21 indicates an important role in fishembryonic development. The expression of miR-21increases in zebrafish embryos at 1-dpf [14]. MiR-21 is aubiquitous miRNAs being implicated as an anti-apoptoticfactor [21,22] and an oncogene [23]. Suppression of miR-21 causes down-regulation of apoptosis related proteinslike bcl2 leading to increase in apoptosis [22]. However inHeLa cells, inhibition of miR-21 causes profound increasein cell growth [18]. Rapidly dividing embryos mimicdividing cancer cells, but in our embryonic samples, miR-21 is up-regulated at a particular stage, 5-dpf, after active
large scale division begins (Fig. 3C). It is possible thatexpression of miR-21 is essential to coordinate the celldivision/cell growth in early embryos.
Similar to miR-21, miR-92 showed an increased expres-sion at 5-dpf stage (Fig 3C). This miRNA was previouslyshown to be ubiquitously expressed in adult tissues andembryonic stem cells, indicating that it controls cell func-tions common to embryonic and adult tissues [24].Expression of miR-92 is ubiquitous in early medaka andzebrafish embryos and becomes restricted to highly prolif-erative tissues late in development [25]. Polycystronicexpression of miR-17-92 is associated with some types ofcancers [26,27]. Transgenic over-expression of this clusterpromotes cell proliferation and prevents differentiation inlung epithelial progenitor cells [28]. In rainbow trout,expression of miR-92 is abundant in embryos at 5-dpf. Wesuggest that miR-92 is involved in making an embryocompetent of proliferation and it may also play a role inkeeping these early cells un-differentiated.
Expression of Stat3 and Dicer during embryonic developmentRecently, it was shown that activation of miRNA-21 is nec-essary for the survival of myeloma cells [29]. This induc-tion is mediated by signal transducer and activator oftranscription 3 (Stat3). Stat3 proteins activate transcrip-tion and become functional with tyrosine phosphoryla-tion by various cytokines [30,31]. Expression of miR-21 isindirectly but strictly dependent on Stat3 [29]. Using real
Table 1: Cloned rainbow trout miRNAs and primers used for real time PCR analysis.
MicroRNA Sequence Size Real Time Primer Sequence Conserved in other animals
omy-miR-21 UAGCUUAUCAGACUGGUGUUGGC
23 TAGCTTATCAGACTGGTGTTGGC dre, fru, tni
omy-miR-21t UAGCUUAUCAGACUGGUGUUGAC
23 TAGCTTATCAGACTGGTGTTGAC see Figure 2A
omy-miR-23a AUCACAUUGCCAGGGAUUUCCA 22 ATCACATTGCCAGGGATTTCCA dre, fru, tni, btaomy-miR-26a UUCAAGUAAUCCAGGAUAGGCU 22 TTCAAGTAATCCAGGATAGGCT dre, ssc, ptr, ggo, lla, mml, ppa, fru, tni,
btaomy-miR-30d UGUAAACAUCCCCGACUGGAAG 22 TGTAAACATCCCCGACTGGAAG bta, hsa, mmu, rno, gga dre, ptr, ggo,
mne, ppa, fru, tni, xtromy-miR-92a UAUUGCACUUGUCCCGGCCUGU 22 TATTGCACTTGTCCCGGCCTGT dre, ggo, lme, age, ppa, ppy, ptr, mml,
sla, lla, mne, fru, tni, btaomy-miR-100t AACCCGUAGAUCCGAAUUUGU 21 AACCCGTAGATCCGAATTTGT see Figure 2Bomy-miR-125a UCCCUGAGACCCUUAACCUGUG 22 TCCCTGAGACCCTTAACCTGTG dre, fru, tni, xtromy-miR-125b UCCCUGAGACCCUAACUUGUGA 22 TCCCTGAGACCCTAACTTGTGA dre, dme, hsa, rno, gga, dps, aga, dre,
ssc, ggo, ppa, ssc, age, ppy, ptr, mml, sla, lla,, mne, lca, fru, tni, bta, xtr, mdo
omy-miR-125t UCCCUGAGACUUUAACUUGUGA 22 TCCCTGAGACTTTAACTTGTGA see Figure 2Comy-miR-126t UCGUACCGUGAGUAAUAAUGCA
C23 TCGTACCGTGAGTAATAATGCAC see Figure 2D
omy-miR-126* CAUUAUUACUUUUGGUACGCG 21 CATTATTACTTTTGGTACGCG mmu, hsa, rno, gga, dre, xtromy-miR-200b UAAUACUGCCUGGUAAUGAUGA
U23 TAATACTGCCTGGTAATGATGAT gga, xtr
omy-miR-455 UAUGUGCCCUUGGACUACAUCG 22 TATGTGCCCTTGGACTACATCG dre, fru, tni, gga, xtr
Page 5 of 11(page number not for citation purposes)

BMC Developmental Biology 2008, 8:41 http://www.biomedcentral.com/1471-213X/8/41
Page 6 of 11(page number not for citation purposes)
Expression patterns of rainbow trout miRNAs (A to D), Stat3 (E) and Dicer (F) during early embryogenesis as revealed by real-time PCR analysisFigure 3Expression patterns of rainbow trout miRNAs (A to D), Stat3 (E) and Dicer (F) during early embryogenesis as revealed by real-time PCR analysis. Embryonic stages analyzed include unfertilized eggs (0-dpf), embryos at 1-dpf, 2-dpf, 3-dpf, 5-dpf and 6-dpf. Quantity of each miRNA or mRNA was normalized to Histone H2A. The means of the normalized gene expression values for each embryonic stage were calculated and expressed as relative fold changes (n = 3, mean ± SEM). Differ-ent letters indicate significant difference at P < 0.05.
day 0 day 1 day 2 day 3 day 5 day 6
0
2
4
6
8
10
12
14
stat3
a
b b
day 0 day 1 day 2 day 3 day 5 day 6
0
2
4
6
DICEER
a
b
day 0 day 1 day 2 day 3 day 5 day 6
0
20
40
60
80
100
120
140
Omy-miR-26aOmy-miR-455
a
c
day 0 day 1 day 2 day 3 day 5 day 6
0
50
100
150
200
250
Omy-miR-21Omy-miR-21tOmy-miR-30dOmy-miR-92aOmy-miR-200b
day 0 day 1 day 2 day 3 day 5 day 6
0
20
40
60
80
omy -miR-126omy -miR-126*
a
b
A. Pattern A
day 0 day 1 day 2 day 3 day 5 day 6
Rel
ativ
e m
iRN
Aex
pres
sion
0
50
100
150
200
250
300
omy-miR-23aomy-iR-100tomy-miR-125aomy-miR-125bomy-miR-125t
a
b
B. Pattern B
day 0 day 1 day 2 day 3 day 5 day 6
Rel
ativ
e m
iRN
Aex
pres
sion
0
20
40
60
80
100
120
140
- -- -
a
b
C. Pattern C
0
50
100
150
200
250
- --miR-- -- -- -
a
b
D. Pattern D
day 0 day 1 day 2 day 3 day 5 day 6
0
20
40
60
80
- -- -
E. Stat 3
Rel
ativ
e m
RN
A e
xpre
ssio
n
0
2
4
6
8
10
12
14
a
b b
F. Dicer
0
2
4
6
a
b
Rel
ativ
e m
RN
A e
xpre
ssio
n
Rel
ativ
e m
iRN
Aex
pres
sion
Rel
ativ
e m
iRN
Aex
pres
sion
day 0 day 1 day 2 day 3 day 5 day 6
0
2
4
6
8
10
12
14
stat3
a
b b
day 0 day 1 day 2 day 3 day 5 day 6
0
2
4
6
DICEER
a
b
day 0 day 1 day 2 day 3 day 5 day 6
0
20
40
60
80
100
120
140
Omy-miR-26aOmy-miR-455
a
c
day 0 day 1 day 2 day 3 day 5 day 6
0
50
100
150
200
250
Omy-miR-21Omy-miR-21tOmy-miR-30dOmy-miR-92aOmy-miR-200b
day 0 day 1 day 2 day 3 day 5 day 6
0
20
40
60
80
omy -miR-126omy -miR-126*
a
b
A. Pattern A
day 0 day 1 day 2 day 3 day 5 day 6
Rel
ativ
e m
iRN
Aex
pres
sion
0
50
100
150
200
250
300
omy-miR-23aomy-iR-100tomy-miR-125aomy-miR-125bomy-miR-125t
a
b
B. Pattern B
day 0 day 1 day 2 day 3 day 5 day 6
Rel
ativ
e m
iRN
Aex
pres
sion
0
20
40
60
80
100
120
140
- -- -
a
b
C. Pattern C
0
50
100
150
200
250
- --miR-- -- -- -
a
b
D. Pattern D
day 0 day 1 day 2 day 3 day 5 day 6
0
20
40
60
80
- -- -
E. Stat 3
Rel
ativ
e m
RN
A e
xpre
ssio
n
0
2
4
6
8
10
12
14
a
b b
F. Dicer
0
2
4
6
a
b
Rel
ativ
e m
RN
A e
xpre
ssio
n
Rel
ativ
e m
iRN
Aex
pres
sion
Rel
ativ
e m
iRN
Aex
pres
sion

BMC Developmental Biology 2008, 8:41 http://www.biomedcentral.com/1471-213X/8/41
time PCR, we measured the expression of Stat3 in rainbowtrout embryos. As shown in Fig. 3, Stat3 transcript level islow in unfertilized eggs. It increases gradually, reaching apeak in 1-dpf embryos, and declines afterwards (Fig. 3E).The abundance of Stat3 transcripts does not appear to cor-relate with the level of omy-miR-21 which shows a peakaccumulation in 5-dpf embryos. It is possible that Stat3 isinvolved in activation of other miRNAs in addition tomiR-21 and thereby regulating degradation of maternalmRNAs in early embryos.
Dicer is a RNase III enzyme with two catalytic subunits[32,33] involved in processing of all miRNAs [33,34]. IfmiRNAs are involved in maternal mRNA degradation,Dicer must be present during EGA transition. Therefore,we determined the expression of Dicer gene in early stageembryos. We found that Dicer transcripts are detectablethroughout the embryonic stages analyzed with elevatedexpression in embryos at 2-dpf (Fig. 3F). Embryonicgenome activation occurs at mid-blastula stage in fish.According to Bobe and coworkers (2000), mid-blastulastage of rainbow trout embryos (cultured at ~12°C)occurs 2-dpf [35,36]. So, maternal mRNA degradationand EGA in rainbow trout could occur around 2-dpf. Peakexpression of Dicer at 2-dpf, the time of maternal mRNAdegradation and initiation of EGA, could indicate itsinvolvement in miRNA processing during that period. Asshown in Fig. 3, many miRNAs, after onset of EGA, startto increase their expression, indicating that they are beingprocessed by Dicer around 2-dpf when Dicer transcript ishighly abundant.
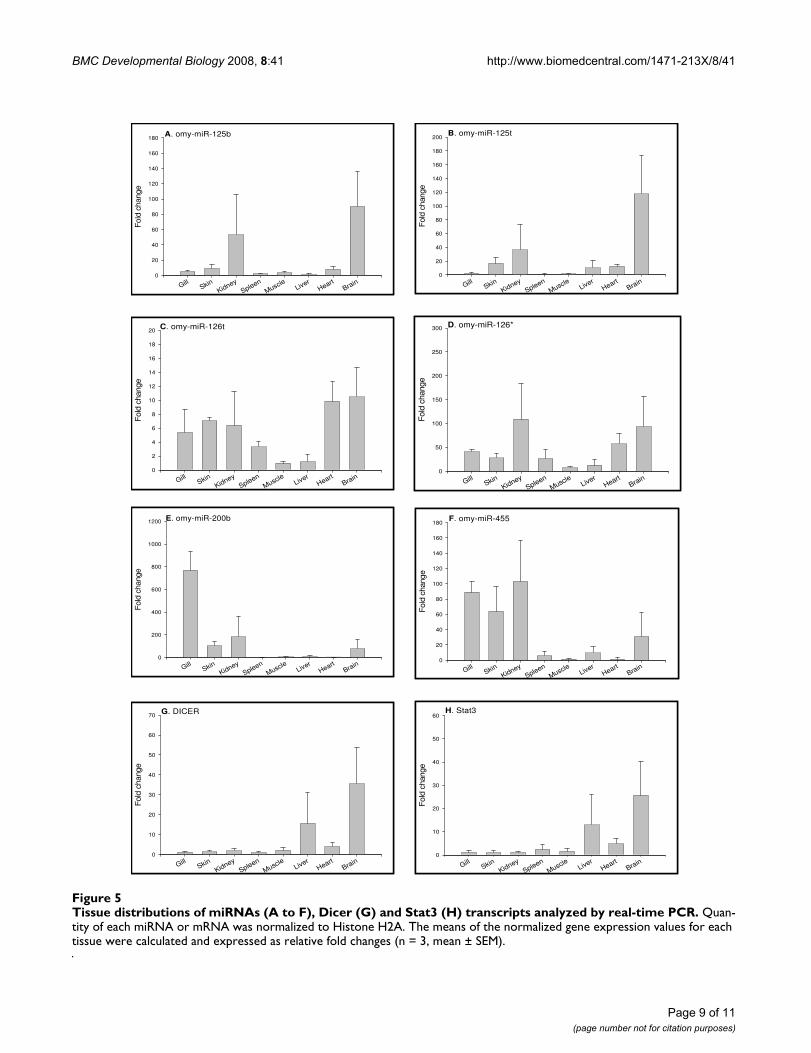
Tissue distribution profiles of miRNAs in adult fishQuantifying miRNAs in different tissues is an importantinitial step to investigate functions of miRNAs. Tissue dis-tribution of miRNAs provides essential baseline refer-ences to analyze variation of miRNA expression undervarious physiological conditions. To analyze the tissuedistribution of the newly identified rainbow trout miR-NAs, we performed real time PCR to determine the expres-sion levels of all 14 miRNAs in 8 rainbow trout tissues thatinclude gills, skin, kidney, spleen, muscle, liver, heart andbrain. Tissue distribution profiles of these miRNAs areshown in Fig 4 and Fig 5. Some miRNAs, such as omy-miR26a omy-miR30d, omy-miR92a, omy-miR126t andomy-miR126*, demonstrated ubiquitous expression in alltissues examined. The ubiquitous nature of these miRNAsexpression suggests that they might be associated withfundamental functions, such as metabolism [37]. On theother hand, we identified miRNAs with highly differentialpatterns of tissue distribution. For example, omy-miR125a shows prominent expression in brain, and miR-NAs like omy-miR21, omy-miR21t, omy-miR23a andomy-miR455 are mainly expressed in the epithelial tissues(gills and skin). Other miRNAs, such as omy-miR100t,
omy-miR125b and omy-miR125t, are highly abundant inkidney and brain. Tissue-specific expression of these miR-NAs is indicative of tissue-specific functional roles of thesemiRNAs in regulating gene expression. Fig. 5 also showsthe expression of Dicer (Fig. 5G) and Stat3 (Fig. 5H) invarious tissues. Both gene transcripts show similar tissueexpression patterns, being abundant in brain and liver.
Conservation of the tissue expression of individual miR-NAs across different species suggests their fundamentalphysiological roles. Tissue expression patterns of somemiRNAs are conserved between rainbow trout and otherspecies. For example, the ubiquitous expression of miR-26a and miR-92a and prominent brain expression of miR-125a in rainbow trout was also observed in mammals andzebrafish, and miR-23a, mainly expressed in the rainbowtrout epithelial tissues (gills and skin) is also highlyexpressed in mammalian and zebrafish epithelial tissuessuch as lung (mammals) and fins (zebrafish) [8]. On theother hand, miR126* that has restricted expression inmammals and zebrafish [8] appears to be present ubiqui-tously in rainbow trout tissues, suggesting that certainmiRNAs may have species-specific functions.
ConclusionIn this study we report the first cloning and expression ofmiRNAs from rainbow trout. Four novel miRNAs for rain-bow trout were identified, emphasizing species-specificdistribution and functions of miRNAs. Distinct patternsof expression for the cloned miRNA during early embryo-genesis were observed and some miRNAs showed charac-teristic up-regulated expression during EGA. Both Dicerand Stat3 are abundantly expressed in rainbow troutembryos around the time of EGA, indicating the impor-tance of these proteins in early embryonic development.We propose that activation of Stat3 leads to the activationof miRNA-21 and possibly other miRNAs. These miRNAsplay an important role in degrading maternally inheritedmRNAs, an essential step for normal embryonic develop-ment.
MethodsCollection of samplesAnimals were reared under standard conditions. Rainbowtrout eggs were fertilized and incubated at ~13°C in a flowthrough system in dark at the National Center for Cooland Cold Water Aquaculture (Kearneysville, WV). Unfer-tilized eggs (0 days post-fertilization) and developingembryos were collected at 1, 2, 3, 5 and 6 days post ferti-lization (dpf). Various somatic tissues including gill, skin,kidney, spleen, muscle, liver, heart and brain were alsocollected from adult fish. All samples were frozen in liq-uid nitrogen and stored at -80°C until total RNA isola-tion.
Page 7 of 11(page number not for citation purposes)

BMC Developmental Biology 2008, 8:41 http://www.biomedcentral.com/1471-213X/8/41
Page 8 of 11(page number not for citation purposes)
Tissue distributions of miRNAs (A to H) analyzed by real-time PCRFigure 4Tissue distributions of miRNAs (A to H) analyzed by real-time PCR. Quantity of each miRNA was normalized to Histone H2A. The means of the normalized gene expression values for each tissue were calculated and expressed as relative fold changes (n = 3, mean ± SEM).
A. omy-miR-21
GillSkin
KidneySpleen
MuscleLiver
HeartBrain
Fol
d ch
ange
0
20
40
60
80
100
120
140B. omy-miR-21t
GillSkin
KidneySpleen
MuscleLive
rHeart
Brain
Fol
d ch
ange
0
20
40
60
80
100
120
C. omy-miR-23a
GillSkin
KidneySpleen
MuscleLiver
HeartBrain
Fol
d ch
ange
0
5
10
15
20
25
30
35D. omy-miR-26a
GillSkin
KidneySpleen
MuscleLiver
HeartBrain
Fol
d ch
ange
0
5
10
15
20
25
E. omy-miR-30d
GillSkin
KidneySpleen
MuscleLiver
HeartBrain
Fol
d ch
ange
0
10
20
30
40F. omy-miR-92a
GillSkin
KidneySpleen
MuscleLiver
HeartBrain
Fol
d ch
ange
0
2
4
6
8
10
12
14
16
G. omy-miR-100t
GillSkin
KidneySpleen
MuscleLiver
HeartBrain
Fol
d ch
ange
0
20
40
60
80
100
120H. omy-miR-125a
GillSkin
KidneySpleen
MuscleLive
rHeart
Brain
Fol
d ch
ange
0
20x103
40x103
60x103
80x103
100x103
120x103
BMC Developmental Biology 2008, 8:41 http://www.biomedcentral.com/1471-213X/8/41
Page 9 of 11(page number not for citation purposes)
Tissue distributions of miRNAs (A to F), Dicer (G) and Stat3 (H) transcripts analyzed by real-time PCRFigure 5Tissue distributions of miRNAs (A to F), Dicer (G) and Stat3 (H) transcripts analyzed by real-time PCR. Quan-tity of each miRNA or mRNA was normalized to Histone H2A. The means of the normalized gene expression values for each tissue were calculated and expressed as relative fold changes (n = 3, mean ± SEM).
A. omy-miR-125b
GillSkin
KidneySpleen
MuscleLiver
HeartBrain
Fol
d ch
ange
0
20
40
60
80
100
120
140
160
180B. omy-miR-125t
GillSkin
KidneySpleen
MuscleLiver
HeartBrain
Fol
d ch
ange
0
20
40
60
80
100
120
140
160
180
200
C. omy-miR-126t
GillSkin
KidneySpleen
MuscleLiver
HeartBrain
Fol
d ch
ange
0
2
4
6
8
10
12
14
16
18
20
E. omy-miR-200b
GillSkin
KidneySpleen
MuscleLiver
HeartBrain
Fol
d ch
ange
0
200
400
600
800
1000
1200 F. omy-miR-455
GillSkin
KidneySpleen
MuscleLiver
HeartBrain
Fol
d ch
ange
0
20
40
60
80
100
120
140
160
180
H. Stat3
GillSkin
KidneySpleen
MuscleLiver
HeartBrain
Fol
d ch
ange
0
10
20
30
40
50
60G. DICER
GillSkin
KidneySpleen
MuscleLiver
HeartBrain
Fol
d ch
ange
0
10
20
30
40
50
60
70
D. omy-miR-126*
GillSkin
KidneySpleen
MuscleLiver
HeartBrain
Fol
d ch
ange
0
50
100
150
200
250
300

BMC Developmental Biology 2008, 8:41 http://www.biomedcentral.com/1471-213X/8/41
MicroRNA cloningTotal RNA from unfertilized eggs and early embryos (1–6dpf) was isolated using TRIzol™ reagent (Invitrogen,Carlsbad, CA) and pooled for miRNA cloning using themiRCat™ small RNA cloning kit (IDT DNA, Coralville, IA)following manufacturer's instructions with minor modifi-cations. In brief, 500 μg of pooled total RNA was size frac-tionated using 12% denaturing polyacrylamide gelelectrophoresis (PAGE) as described by [38]. Excised gelswere homogenized in water and heated for 15 minutes at70°C to solubilize small RNA and 3' linkers (5' phospho-rylated) were ligated to the small RNA fraction in theabsence of ATP. This was again size fractionated using12% PAGE and 5' linkers were ligated in the presence ofATP. This mixture was then reverse transcribed usingprimer complementary to the 3' linker sequence and PCRamplified using primers on both linkers. Amplified prod-ucts were BanI digested, concatemerized and cloned usingTOPO TA cloning kit (Invitrogen, Carlsbad, CA). Trans-formed bacterial cells were plated and grown overnight.Individual colonies were picked and screened for presenceof inserts by colony PCR. Clones with inserts weresequenced and sequence data were analyzed by BLASTsearch against the Sanger miRNA database [39]. MicroR-NAs were identified and named based on sequencehomology to published miRNAs according to the univer-sal nomenclature [11].
Quantitative real-time PCR for miRNAs, Dicer and Stat3The expression of miRNAs, Dicer and Stat3 was measuredusing quantitative real-time PCR. Total RNA from differ-ent stage embryos (n = 3 pools, 5 embryos/pool) andadult tissues (n = 3) was isolated using TRIzol™ reagent(Invitrogen) followed by DNAse treatment. One μg ofDNAse-treated RNA was converted to cDNA using miS-cript reverse transcriptase mix (Qiagen, Valencia, CA), ablend of enzymes comprising poly(A)polymerase andreverse transcriptase, and a mixture of oligo-dT (contain-ing a universal tag sequence) and random primers. ThecDNA was then used for real time PCR quantification ofmiRNAs (using a miRNA target-specific primer and themiScript Universal Primer (Qiagen) and Dicer or Stat3mRNA (using gene-specific primers).
Real-time PCR miRNA target-specific primers are showedin Table 1. Primers for rainbow trout Dicer and Stat3 weredesigned based on their corresponding cDNA sequences(AY523839 for Dicer and U60333 for Stat3) in the NCBIdatabase [40]. Primers for Dicer are: forward, AGGAG-GCAGTGCTACCCTAAA; reverse, AAGTTGAGTTCGT-CAGGCAGA. Primers for Stat3 are: forward,GCTGGACAACATCATTGACCT; reverse, GTGACT-GCCTCCCTCCTTACT). The rainbow trout Histone H2Agene (TC85036 in TIGR database) was used as endog-enous control. Primers for this gene are: forward,
TCCCCAAGAAGACTGAGAAGG; reverse, TTTGTT-GAGCTAGGTGGTTGG. All primers were designed usingPrimer3 software [41]. Quantitative real time PCR wasperformed in duplicate for each cDNA sample on a Bio-Rad iCycler iQ Real-Time PCR Detection System usingiQ™ SYBR® Green Supermix (Bio-Rad, Hercules, CA) in 25-μl reaction volumes containing 300 nM of each primerand cDNA derived from 0.05 μg of total RNA. Standardcurves for all miRNAs, Dicer, Stat3 and the endogenouscontrol were constructed using 10 fold serial dilutions ofa pooled cDNA sample. Standard curves were run on thesame plate with the samples. Threshold lines wereadjusted to intersect amplification lines in the linear por-tion of the amplification curve and cycles to threshold(Ct) were recorded. For each sample, the quantity ofmiRNA/target gene mRNA and the reference gene mRNA(Histone H2A) was determined from respective standardcurves. The quantity of miRNA/target gene mRNA wasthen divided by the quantity of the reference gene toobtain a normalized value. Mean differences in expressionlevels were reported as relative fold changes using the low-est expression value as a calibrator. This was done by des-ignating the tissue or embryonic stage with the lowestexpression value as a calibrator and dividing the means ofother samples by the mean of the calibrator (calibratormean divided by itself equals one). Specificity of amplifi-cation of each transcript was confirmed by melting curveanalysis using iCycler software (Bio-Rad, Hercules, CA).
Statistical analysisOne-way analysis of variance (ANOVA) was performed onmean gene expression levels using SigmaStat (version3.11) software (Aspire Software International, Leesburg,VA). When one-way ANOVA showed significant effects,multiple mean comparisons were made using the Holm-Sidak method. Differences between groups were reportedas significant (denoted by a different alphabet in figures)if p < 0.05.
Bioinformatics analysisSequences were analyzed for any homology to publishedmiRNAs by BLAST searching of the Sanger miRNA data-base [39]. Multiple sequence alignments were carried outusing BioEdit software (Ibis Biosciences, Carlsbad, CA).
Authors' contributionsRR was responsible for miRNA cloning and drafted themanuscript. MS generated the embryonic and tissue geneexpression data and reviewed the manuscript. SG pro-vided embryonic samples. CR participated in coordina-tion. JY was responsible for project development and isthe corresponding author. All contributing authorsreviewed and approved the final copy of this manuscript.
Page 10 of 11(page number not for citation purposes)

BMC Developmental Biology 2008, 8:41 http://www.biomedcentral.com/1471-213X/8/41
AcknowledgementsThis investigation was supported by Hatch Funds (Project No: 427) of the West Virginia Agricultural Experiment Station and USDA/ARS Cooperative Agreement No. 58-1930-5-537. It is published with the approval of the Director of the West Virginia Agriculture and Forestry Experiment Station as scientific paper No. 3009.
References1. Kane DA, Kimmel CB: The zebrafish midblastula transition.
Development 1993/10/01 edition. 1993, 119(2):447-456.2. Slevin MK, Lyons-Levy G, Weeks DL, Hartley RS: Antisense knock-
down of cyclin E does not affect the midblastula transition inXenopus laevis embryos. Cell Cycle 2005/09/01 edition. 2005,4(10):1396-1402.
3. Schier AF: The maternal-zygotic transition: death and birth ofRNAs. Science 2007, 316(5823):406-407.
4. Giraldez AJ, Mishima Y, Rihel J, Grocock RJ, Van Dongen S, Inoue K,Enright AJ, Schier AF: Zebrafish MiR-430 promotes deadenyla-tion and clearance of maternal mRNAs. Science 2006/02/18edition. 2006, 312(5770):75-79.
5. Ramachandra R, Yao J: Transcription factor profiling duringearly embryonic development in rainbow trout (oncorhyn-chus mykiss) . Biol Reprod 2006, Special issue:127.
6. Ramachandra RK, Lankford SE, Weber GM, Rexroad CE 3rd, Yao J:Identification of OORP-T, a novel oocyte-specific geneencoding a protein with a conserved oxysterol binding pro-tein domain in rainbow trout. Mol Reprod Dev 2006/10/13 edi-tion. 2007, 74(4):502-511.
7. Ferg M, Sanges R, Gehrig J, Kiss J, Bauer M, Lovas A, Szabo M, Yang L,Straehle U, Pankratz MJ, Olasz F, Stupka E, Muller F: The TATA-binding protein regulates maternal mRNA degradation anddifferential zygotic transcription in zebrafish. EMBO J 2007/08/19 edition. 2007.
8. Wienholds E, Plasterk RH: MicroRNA function in animal devel-opment. FEBS Lett 2005, 579(26):5911-5922.
9. Giraldez AJ, Cinalli RM, Glasner ME, Enright AJ, Thomson JM, Basker-ville S, Hammond SM, Bartel DP, Schier AF: MicroRNAs regulatebrain morphogenesis in zebrafish. Science 2005/03/19 edition.2005, 308(5723):833-838.
10. Griffiths-Jones S, Grocock RJ, van Dongen S, Bateman A, Enright AJ:miRBase: microRNA sequences, targets and gene nomencla-ture. Nucleic Acids Res 2005/12/31 edition. 2006, 34(Databaseissue):D140-4.
11. Ambros V, Bartel B, Bartel DP, Burge CB, Carrington JC, Chen X,Dreyfuss G, Eddy SR, Griffiths-Jones S, Marshall M, Matzke M, RuvkunG, Tuschl T: A uniform system for microRNA annotation. RNA2003/02/20 edition. 2003, 9(3):277-279.
12. Brennecke J, Stark A, Russell RB, Cohen SM: Principles of micro-RNA-target recognition. PLoS Biol 2005/02/22 edition. 2005,3(3):e85.
13. Li M, Raine JC, Leatherland JF: Expression profiles of growth-related genes during the very early development of rainbowtrout embryos reared at two incubation temperatures. GenComp Endocrinol 2007/03/30 edition. 2007, 153(1-3):302-310.
14. Chen PY, Manninga H, Slanchev K, Chien M, Russo JJ, Ju J, Sheridan R,John B, Marks DS, Gaidatzis D, Sander C, Zavolan M, Tuschl T: Thedevelopmental miRNA profiles of zebrafish as determinedby small RNA cloning. Genes Dev 2005/06/07 edition. 2005,19(11):1288-1293.
15. Kawasaki H, Taira K: Hes1 is a target of microRNA-23 duringretinoic-acid-induced neuronal differentiation of NT2 cells.Nature 2003/06/17 edition. 2003, 423(6942):838-842.
16. Lagos-Quintana M, Rauhut R, Lendeckel W, Tuschl T: Identificationof novel genes coding for small expressed RNAs. Science 2001/10/27 edition. 2001, 294(5543):853-858.
17. Smirnova L, Grafe A, Seiler A, Schumacher S, Nitsch R, Wulczyn FG:Regulation of miRNA expression during neural cell specifica-tion. Eur J Neurosci 2005/04/23 edition. 2005, 21(6):1469-1477.
18. Cheng AM, Byrom MW, Shelton J, Ford LP: Antisense inhibition ofhuman miRNAs and indications for an involvement ofmiRNA in cell growth and apoptosis. Nucleic Acids Res 2005/03/03 edition. 2005, 33(4):1290-1297.
19. Kulshreshtha R, Ferracin M, Wojcik SE, Garzon R, Alder H, Agosto-Perez FJ, Davuluri R, Liu CG, Croce CM, Negrini M, Calin GA, Ivan
M: A microRNA signature of hypoxia. Mol Cell Biol 2006/12/30edition. 2007, 27(5):1859-1867.
20. Fabbri M, Ivan M, Cimmino A, Negrini M, Calin GA: Regulatorymechanisms of microRNAs involvement in cancer. ExpertOpin Biol Ther 2007/08/02 edition. 2007, 7(7):1009-1019.
21. Chan JA, Krichevsky AM, Kosik KS: MicroRNA-21 is an antiapop-totic factor in human glioblastoma cells. Cancer Res 2005/07/19edition. 2005, 65(14):6029-6033.
22. Si ML, Zhu S, Wu H, Lu Z, Wu F, Mo YY: miR-21-mediated tumorgrowth. Oncogene 2006/10/31 edition. 2007, 26(19):2799-2803.
23. Zhu S, Si ML, Wu H, Mo YY: MicroRNA-21 targets the tumorsuppressor gene tropomyosin 1 (TPM1). J Biol Chem 2007/03/17 edition. 2007, 282(19):14328-14336.
24. Houbaviy HB, Murray MF, Sharp PA: Embryonic stem cell-specificMicroRNAs. Dev Cell 2003/08/16 edition. 2003, 5(2):351-358.
25. Ason B, Darnell DK, Wittbrodt B, Berezikov E, Kloosterman WP,Wittbrodt J, Antin PB, Plasterk RH: Differences in vertebratemicroRNA expression. Proc Natl Acad Sci U S A 2006/09/20 edi-tion. 2006, 103(39):14385-14389.
26. He L, Thomson JM, Hemann MT, Hernando-Monge E, Mu D, Good-son S, Powers S, Cordon-Cardo C, Lowe SW, Hannon GJ, HammondSM: A microRNA polycistron as a potential human oncogene.Nature 2005/06/10 edition. 2005, 435(7043):828-833.
27. Venturini L, Battmer K, Castoldi M, Schultheis B, Hochhaus A, Muck-enthaler MU, Ganser A, Eder M, Scherr M: Expression of the miR-17-92 polycistron in chronic myeloid leukemia (CML) CD34+cells. Blood 2007/02/08 edition. 2007, 109(10):4399-4405.
28. Lu Y, Thomson JM, Wang HY, Hammond SM, Hogan BL: Transgenicover-expression of the microRNA miR-17-92 cluster pro-motes proliferation and inhibits differentiation of lung epi-thelial progenitor cells. Dev Biol 2007/09/04 edition. 2007.
29. Loffler D, Brocke-Heidrich K, Pfeifer G, Stocsits C, Hackermuller J,Kretzschmar AK, Burger R, Gramatzki M, Blumert C, Bauer K, CvijicH, Ullmann AK, Stadler PF, Horn F: Interleukin-6 dependent sur-vival of multiple myeloma cells involves the Stat3-mediatedinduction of microRNA-21 through a highly conservedenhancer. Blood 2007/05/15 edition. 2007, 110(4):1330-1333.
30. Bromberg J, Chen X: STAT proteins: signal tranducers andactivators of transcription. Methods Enzymol 2001/06/13 edition.2001, 333:138-151.
31. Kretzschmar AK, Dinger MC, Henze C, Brocke-Heidrich K, Horn F:Analysis of Stat3 (signal transducer and activator of tran-scription 3) dimerization by fluorescence resonance energytransfer in living cells. Biochem J 2003/09/17 edition. 2004, 377(Pt2):289-297.
32. Bernstein E, Caudy AA, Hammond SM, Hannon GJ: Role for abidentate ribonuclease in the initiation step of RNA interfer-ence. Nature 2001/02/24 edition. 2001, 409(6818):363-366.
33. Bernstein E, Kim SY, Carmell MA, Murchison EP, Alcorn H, Li MZ,Mills AA, Elledge SJ, Anderson KV, Hannon GJ: Dicer is essentialfor mouse development. Nat Genet 2003/10/07 edition. 2003,35(3):215-217.
34. Yang WJ, Yang DD, Na S, Sandusky GE, Zhang Q, Zhao G: Dicer isrequired for embryonic angiogenesis during mouse develop-ment. J Biol Chem 2004/12/23 edition. 2005, 280(10):9330-9335.
35. Bobe J, Andre S, Fauconneau B: Embryonic muscle developmentin rainbow trout (Oncorhynchus mykiss): a scanning elec-tron microscopy and immunohistological study. J Exp Zool2000/02/23 edition. 2000, 286(4):379-389.
36. Ignat'eva GM: [The relative duration of similar periods in theearly embryogenesis of teleosts]. Ontogenez 1974/01/01 edition.1974, 5(5):427-436.
37. Liang H, Li WH: MicroRNA regulation of human protein pro-tein interaction network. RNA 2007/07/27 edition. 2007,13(9):1402-1408.
38. Sambrook J, Russell DW: Molecular cloning : a laboratory man-ual. 3rd edition. Cold Spring Harbor, N.Y. , Cold Spring Harbor Lab-oratory Press; 2001:3 v. (various pagings).
39. The Sanger miRNA database [http://microrna.sanger.ac.uk/]40. The NCBI database [http://www.ncbi.nlm.nih.gov/]41. Primer3 [http://frodo.wi.mit.edu/cgi-bin/primer3/
primer3_www.cgi]
Page 11 of 11(page number not for citation purposes)