VHF Omnidirectional Range (VOR) Experimental Positioning ...
Bryan J Flynn about 1500 words116 Edison StreetWilkes Barre, PA [email protected]
HORIZONTAL TIME-DEPENDANT POSITIONING (HTDP)
WHAT IT BRINGS TO THE TABLE
By: Bryan J Flynn

Flynn / HTDP / 2
Abstract
Plate tectonics is the scientific theory which explains the
motion of the Earth’s lithosphere. While tectonic undulation was
not something that was accounted for as recent as 100 years ago,
it has and will continue to be a reality which must be dealt with
in the future. In order to maintain precise work in our endeavor
to achieve accuracy we must understand what is happening below
the surface of the Earth in order to achieve success in our
working space. As surveyors, the need to recognize this
phenomenon was made apparent with the introduction of the GPS. As
technology has evolved we have been afforded the opportunity to
collect more precise data while analyzing and interpreting these
values. Over time is has been seen that based on plate tectonics
and given the data collected by means of GPS, that coordinates of
points can and will shift. For this reason in 1992 HDPT software
was developed and incorporated in surveying operations in order

Flynn / HTDP / 3
to determine current and future and in some cases past horizontal
velocity changes. This ability allows us to correct positional
coordinates and/or geodetic observations for the effect of
crustal deformation and transforming positional coordinates and
velocities between reference frames.
Horizontal Time-Dependant Position: What it Brings to the Table
How GPS changed everything
In the early 90’s and with the advent and advancement of
Global Navigation Satellite Systems (GNSS), the geodetic
community was on the verge of a revolutionary change that would
come to redefine not only the professional venues but also many
aspects of everyday life. Over the course of the following three
decades the information that is available to be both collected

Flynn / HTDP / 4
and processed is something far beyond that which the forefathers
of the surveying profession could have ever dreamed. As time
passes, it can only be expected that these advancements will
continue to redefine that which we know and are comfortable with
forcing us to be vigilant in our endeavor to remain educated and
relevant.
How this change affected the surveyor
So as the GNSS technology improved, we were able to collect
and process more data and at a much faster rate than in the past.
With that however, it became clear that over years of collecting
information on the same points, that the coordinate values
returned were not the same. In fact in some parts of the United
States, primarily the western coastal states saw significant
changes in the coordinates. Clearly over the course of time,
positions were moving and this was now something that could not
be overlooked. If the data collected on a handful of points is
changing, then it stands to reason that every point (based on the
theory of tectonic motion) is also moving. The natural phenomena
of tectonic deformation and tectonic motion were determined to be

Flynn / HTDP / 5
the primary causes behind this and therefore the need to
understand what was happening below the surface of the Earth
became apparent.
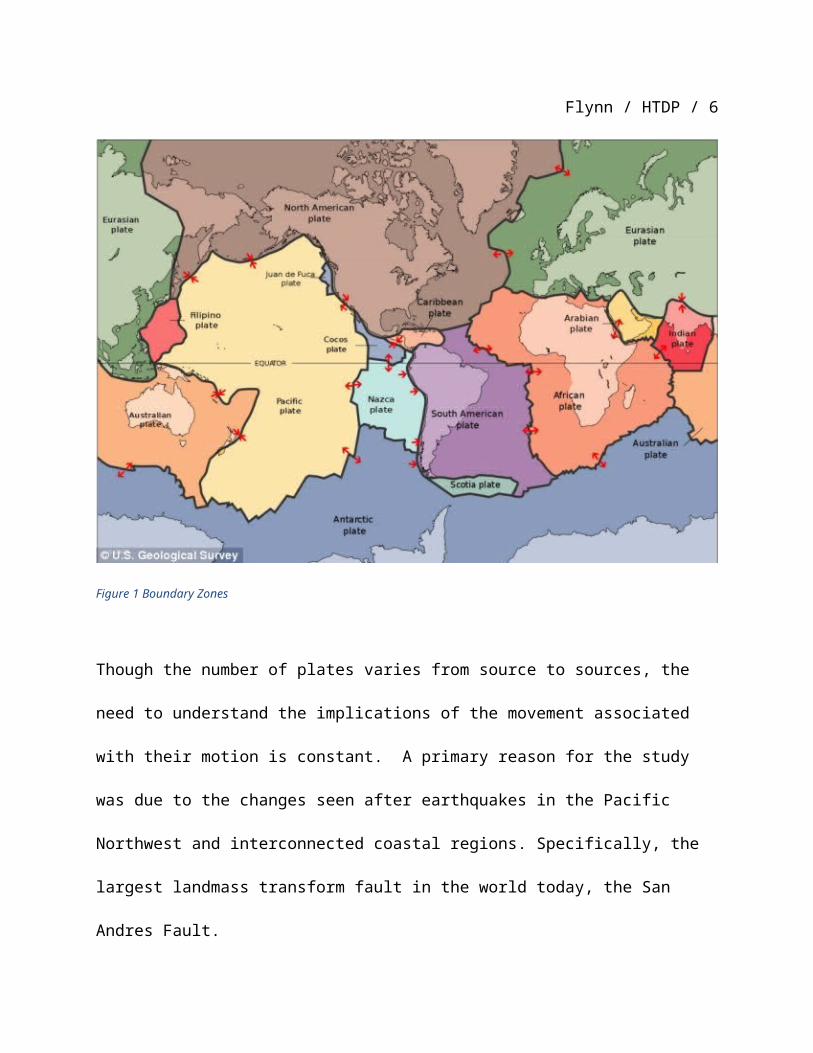
Need to understand plate tectonics
The number of plates is somewhat a matter of opinion according
to many scientists and geologists. However, according to the
Smithsonian Museum of Natural History, there are currently 8
major plates and 12 minor plates in the world and are classified
by boundary types. Divergent boundaries exist where new crust is
generated as the plates pull away from each other, while
Convergent boundaries are where crust is destroyed as one plate
dives under another. Transform boundaries occur where crust is
neither produced nor destroyed as the plates slide horizontally
past each other. Plate boundary zones are broad belts in which
boundaries are not well defined and the effects of plate
interaction are unclear.
Flynn / HTDP / 6
Figure 1 Boundary Zones
Though the number of plates varies from source to sources, the
need to understand the implications of the movement associated
with their motion is constant. A primary reason for the study
was due to the changes seen after earthquakes in the Pacific
Northwest and interconnected coastal regions. Specifically, the
largest landmass transform fault in the world today, the San
Andres Fault.

Flynn / HTDP / 7
Velocity Vectors and what they mean to us
Figure 2 Horizontal Velocity Vectors
As these faults clash together, slide alongside one another or
pull apart, the magnitude of these occurrences cause displacement
of the crust as part of the lithosphere. This natural phenomenon

Flynn / HTDP / 8
is a concern to the geodetic community for a variety of reasons,
but a major concern is the location of control. Projects, as we
all know, must have control in order for precise work to be
conducted. If the location of the ground control is
questionable, then the quality of the work associated with that
control and all subsequent information collected is also
questionable.
Capabilities of HTDP software
With the understanding of how these velocities vectors were
changing, in 1992, NOAA’s National Geodetic Survey (NGS)
introduced the Horizontal Time-Dependent Positioning (HTDP)
software. HTDP allows users to transform positional coordinates
across time and between spatial reference frames. In particular,
the current version of HTDP enables users to perform each of the
following functions: Estimate interseismic horizontal crustal
velocities, estimate the horizontal crustal displacements between
two dates, transform positional coordinates from one reference
frame to another and/or from one date to another, transform
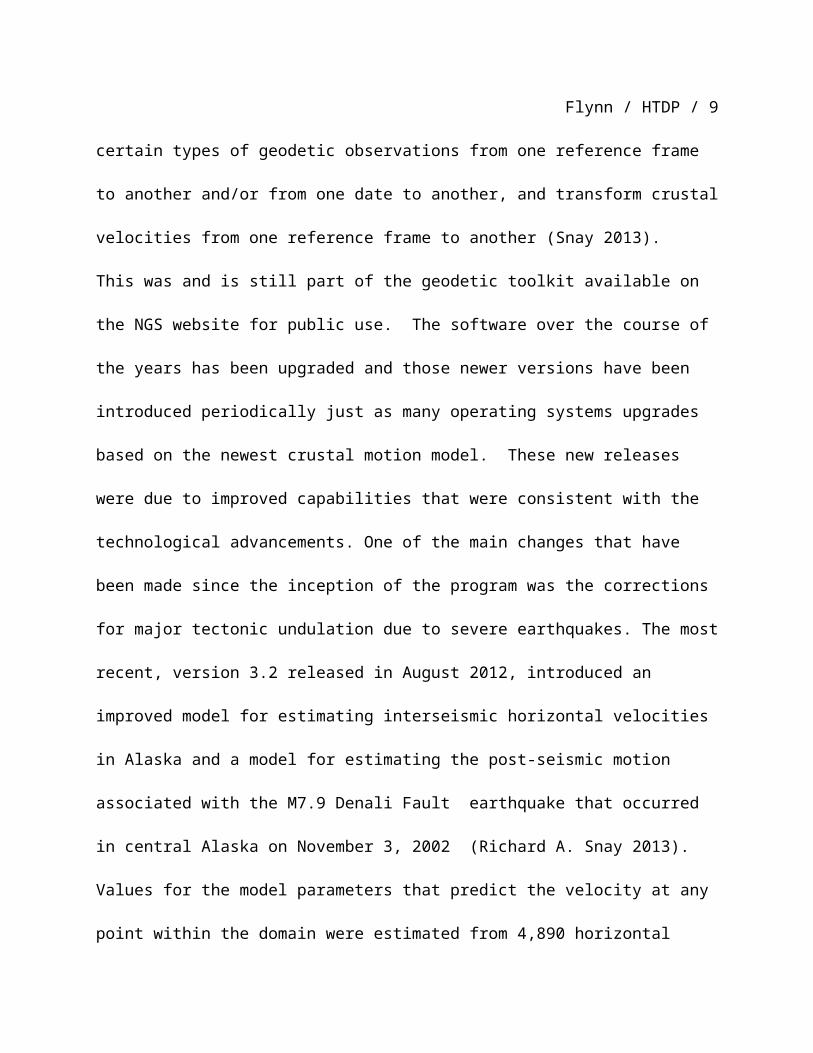
Flynn / HTDP / 9
certain types of geodetic observations from one reference frame
to another and/or from one date to another, and transform crustal
velocities from one reference frame to another (Snay 2013).
This was and is still part of the geodetic toolkit available on
the NGS website for public use. The software over the course of
the years has been upgraded and those newer versions have been
introduced periodically just as many operating systems upgrades
based on the newest crustal motion model. These new releases
were due to improved capabilities that were consistent with the
technological advancements. One of the main changes that have
been made since the inception of the program was the corrections
for major tectonic undulation due to severe earthquakes. The most
recent, version 3.2 released in August 2012, introduced an
improved model for estimating interseismic horizontal velocities
in Alaska and a model for estimating the post-seismic motion
associated with the M7.9 Denali Fault earthquake that occurred
in central Alaska on November 3, 2002 (Richard A. Snay 2013).
Values for the model parameters that predict the velocity at any
point within the domain were estimated from 4,890 horizontal

Flynn / HTDP / 10
velocity vectors _derived from repeated geodetic observations_,
170 fault slip rates, and 258 fault slip vector azimuths (Pearson
2010).
The advancements allow more data to be process not only in
CONUS but also in the Alaskan region and more accurate
information regarding horizontal velocity vectors mainly in the
western states. This along with capability to utilize the 14-
parameter transformation for converting between reference frames
makes this version of HTDP an outstanding tool for the geodetic
community (Snay 2013). HTDP supports five fundamental functions
which include: estimating horizontal velocities, estimating
horizontal displacements between two dates, updating positions
and/or observations to a specified date, transforming positions
between reference frames and/or dates, and transforming
velocities between reference frames.
According to Snay (2003) horizontal velocity is related to
the horizontal movement on the earth’s surface caused by tectonic
plate movement and periodic displacements associated with
earthquakes. This associated crustal motion can cause what is

Flynn / HTDP / 11
viewed as static points on the surface of the earth, such as ground
control points, to move at predictable rates over time. Estimating
horizontal velocities serves the purpose of prediction of a point
in a given time in the future as well as in the past. The image
below was based on the information obtained using the
displacement prediction feature of the HTDP software.

Flynn / HTDP / 12
Figure 3 Displacement Prediction

Flynn / HTDP / 13
Figure 4 Displacement over 50 years given a 50 point file

Flynn / HTDP / 14
The International Earth Rotation Service (IERS) in the 1990s
having been armed with the knowledge of how the continual motion
of the Earth’s surface developed the ITRF in which each tectonic
plate, including the North American plate, moves continuously
(Snay 1999). Thus, if a point is collected using the NAD83
reference frame, the HTDP user applications can, given the input
parameters, provide the same points’ value in the ITRF. The same
can be said for transferring point files from one reference frame
to another. For instance from a point collected using ITRF2008 to
that points same value in NAD83 or similarly from NAD83 to WGS84.
Summary
It is clear that the longer that an area is studied, or a topic
researched, the more undesirable but sometimes beneficial the
information we find. This proverbial rabbit hole seemingly has no
end. The further we look, the more sources of error we find. As
professionals it is important that we understand phenomena such
is tectonic motion and continue to be vigilant in our data
analysis. HTDP is just one of many tools available to the
geodetic professionals and is an invaluable instrument used to

Flynn / HTDP / 15
understand the implications of the tectonic motion and its
associated horizontal velocity vectors. As a benefactor and a
contributor to the geodetic community it important that we
continue to provide the most accurate information possible so as
to not only provide potential clients with top notch products,
but also to assist in the continued advancement of geodetic
tradecrafts.
REFERENCES

Flynn / HTDP / 16
Biediger, Louise Mathews and Joan. "The Impact of Horizontal Velocity on the AFO Ground Control Database." USDA. February 2, 2012. https://www.fsa.usda.gov/Internet/FSA_File/hv_paper_final.pdf (accessed November 6, 2014).
Pearson, Chris, and Richard Snay. "Coping with Tectonic Motion." Professional Surveyor Magazine, November 2010.
Richard A. Snay, Jeffrey T. Freymueller, Chris Pearson. "Crustal Motion Models Developed for Version 3.2 of the Horizontal." Geodesy, 2013: 173-190.
Snay, Chris Pearson and Richard. "Introducing HTDP3.1 to transform coordintates across time and spatial reference frames."GPS Solution, 2012: 15.
Snay, Richard. "Part 5: Horizontal Time-Dependent Positioning." Professional Surveyor Magazine, 2003.
Copyright © 2022 FDOKUMEN