EXANTE SIMULATIONS OF DIRECT AND INDIRECT EFFECTS OF WELFARE REFORMS
28
EX-ANTE SIMULATIONS OF DIRECT AND INDIRECT EFFECTS OF WELFARE REFORMS by Jose ´Cuesta* Inter-American Development Bank and Juan Ponce FLACSO, Facultad Latino Americana de Ciencias Sociales, Ecuador This paper estimates an ex-ante structural model that incorporates behavioral labor responses to analyze the distributive impacts of a long proposed reform in Ecuador: the shift from regressive consumer gas subsidies to the progressive Human Development Bonus (HDB). Even the most radical reform options may not have the expected sizeable distributive gains. This is the case even after the targeting instrument, SelBen, substantially corrects the current targeting deficiencies of the HDB. Poverty reduction is maximized (reduing poverty by about five percentage points) when the targeting instrument redirects resources to households close to the pre-reform poverty line. Most of this esti- mated impact accrues from direct effects with a minimal contribution from indirect effects. Labor- driven indirect effects are multiple and complex, tending to cancel out one another. 1. Introduction Conditional cash transfer programs (CCTs) are becoming an increasingly popular form of safety net in Latin America and elsewhere. Advocates claim that well-designed cash transfers bring together long-run investment in human capital with (gender-sensitive) short-term poverty alleviation and desirable behavioral patterns in beneficiaries (see Morley and Coady, 2003 and Das et al., 2005 for reviews). CCTs have been subject to numerous impact evaluations, which have shown unambiguous success in increasing enrolment rates, improving preventive health care and raising household consumption. 1 Note: The views expressed are those of the authors and do not necessarily reflect the position of the IADB or FLACSO. The authors are indebted to Arjun Bedi, Grecia Garrufo, James Heckman, Carola Pessino, Mansoob Murshed, Mauricio León, Rob Vos, two anonymous referees and participants in presentations held at FLACSO, the Institute of Social Studies, and the LACEA conference for valuable comments and suggestions at different stages of the research. Any remaining errors are the entirely responsibility of the authors. *Correspondence to: José Cuesta, Inter-American Development Bank, 1300 New York Avenue NW, Washington DC 20577, U.S. ([email protected]). 1 In Nicaragua, IFPRI (2002) estimates that the implementation of the Red de Protección Social (RPS) program increased secondary enrolment rates among girls by 22 percentage points, and by nine percentage points in Mexico (Schultz, 2004). Duryea and Morrison (2004) and Attanasio et al. (2006) report increases between five and nine percentage points in the probability of school attendance in Costa Rica and rural Colombia, respectively, as a result of their CCTs. In Mexico, labor among Progresa children aged 8 and 17 fell by 10 percentage points (Parker and Skoufias, 2000). Rawlings and Rubio (2003) report increases of at least 30 percentage points in the proportion of those under 3 years of age participating in growth and nutrition monitoring in Mexico and Nicaragua. Consumption of Progresa households in Mexico increased by 14 percent on average according to Hoddinot et al. (2000). In Brazil and Ecuador, Bourguignon et al. (2003) and Schady and Araujo (2006) concluded that conditionality— or the expectation of future conditionality, as in Ecuador—were critical to induce reductions in child labor and increases in school participation among beneficiaries vis-à-vis non-beneficiaries. Review of Income and Wealth Series 53, Number 4, December 2007 © 2007 The Authors Journal compilation © 2007 International Association for Research in Income and Wealth Published by Blackwell Publishing, 9600 Garsington Road, Oxford OX4 2DQ, UK and 350 Main St, Malden, MA, 02148, USA. 645
-
Upload
utteleseup -
Category
Documents
-
view
0 -
download
0
Transcript of EXANTE SIMULATIONS OF DIRECT AND INDIRECT EFFECTS OF WELFARE REFORMS

EX-ANTE SIMULATIONS OF DIRECT AND INDIRECT EFFECTS OF
WELFARE REFORMS
by Jose Cuesta*
Inter-American Development Bank
and
Juan Ponce
FLACSO, Facultad Latino Americana de Ciencias Sociales, Ecuador
This paper estimates an ex-ante structural model that incorporates behavioral labor responses toanalyze the distributive impacts of a long proposed reform in Ecuador: the shift from regressiveconsumer gas subsidies to the progressive Human Development Bonus (HDB). Even the most radicalreform options may not have the expected sizeable distributive gains. This is the case even after thetargeting instrument, SelBen, substantially corrects the current targeting deficiencies of the HDB.Poverty reduction is maximized (reduing poverty by about five percentage points) when the targetinginstrument redirects resources to households close to the pre-reform poverty line. Most of this esti-mated impact accrues from direct effects with a minimal contribution from indirect effects. Labor-driven indirect effects are multiple and complex, tending to cancel out one another.
1. Introduction
Conditional cash transfer programs (CCTs) are becoming an increasinglypopular form of safety net in Latin America and elsewhere. Advocates claim thatwell-designed cash transfers bring together long-run investment in human capitalwith (gender-sensitive) short-term poverty alleviation and desirable behavioralpatterns in beneficiaries (see Morley and Coady, 2003 and Das et al., 2005 forreviews). CCTs have been subject to numerous impact evaluations, which haveshown unambiguous success in increasing enrolment rates, improving preventivehealth care and raising household consumption.1
Note: The views expressed are those of the authors and do not necessarily reflect the position of theIADB or FLACSO. The authors are indebted to Arjun Bedi, Grecia Garrufo, James Heckman, CarolaPessino, Mansoob Murshed, Mauricio León, Rob Vos, two anonymous referees and participants inpresentations held at FLACSO, the Institute of Social Studies, and the LACEA conference for valuablecomments and suggestions at different stages of the research. Any remaining errors are the entirelyresponsibility of the authors.
*Correspondence to: José Cuesta, Inter-American Development Bank, 1300 New York AvenueNW, Washington DC 20577, U.S. ([email protected]).
1In Nicaragua, IFPRI (2002) estimates that the implementation of the Red de Protección Social(RPS) program increased secondary enrolment rates among girls by 22 percentage points, and by ninepercentage points in Mexico (Schultz, 2004). Duryea and Morrison (2004) and Attanasio et al. (2006)report increases between five and nine percentage points in the probability of school attendance in CostaRica and rural Colombia, respectively, as a result of their CCTs. In Mexico, labor among Progresachildren aged 8 and 17 fell by 10 percentage points (Parker and Skoufias, 2000). Rawlings and Rubio(2003) report increases of at least 30 percentage points in the proportion of those under 3 years of ageparticipating in growth and nutrition monitoring in Mexico and Nicaragua. Consumption of Progresahouseholds in Mexico increased by 14 percent on average according to Hoddinot et al. (2000). In Braziland Ecuador, Bourguignon et al. (2003) and Schady and Araujo (2006) concluded that conditionality—or the expectation of future conditionality, as in Ecuador—were critical to induce reductions in childlabor and increases in school participation among beneficiaries vis-à-vis non-beneficiaries.
Review of Income and WealthSeries 53, Number 4, December 2007
© 2007 The AuthorsJournal compilation © 2007 International Association for Research in Income and Wealth Publishedby Blackwell Publishing, 9600 Garsington Road, Oxford OX4 2DQ, UK and 350 Main St, Malden,MA, 02148, USA.
645

In the face of the increasing evidence of benefits associated with behavior-conditioned programs, Ecuador has long been planning a reform of its singlelargest cash transfer program, the Human Development Bonus (HDB), in tandemwith the elimination of gas subsidies. The HDB (initially known as bono solidario)was conceived as a temporary compensation to poor families in the midst of theeconomic crisis of the late 1990s. It has grown since as the largest cash transfer inthe country, delivered to mothers of schoolchildren and the elderly, in householdswith incomes below a threshold (one million sucres a month in 1999). In contrastwith CCTs programs in the region, HDB has yet to establish and exert its condi-tionalities, remaining as of today a cash transfer program. Nonetheless, there aretwo features that make this program still relevant from a CCT point of view. First,the current HDB results from the merging of two earlier programs, bono solidarioand beca escolar. While bono solidario was a traditional cash transfer, beca escolarrequired school participation by children of benefiting households. Second, Ecua-dorian policy-makers stressed from the onset the importance of school enrolmentto receive benefits from the HDB. A widely diffused marketing strategy consistingof television spots explicitly indicated the co-responsibility of parents regardingtheir children’s schooling and health status. Schady and Araujo (2006) report thatthese expectations by beneficiaries had a positive impact in the reduction of childlabor and the increase of school enrolment in Ecuador.
This paper develops an ex-ante structural behavioral model simulating thedistributive impact of such a substantial reform involving HDB and gas subsidies.This exercise adds to very few studies addressing the welfare consequences of socialprograms inducing behavioral change in developing countries before reforms takeplace. In contrast to those previous studies, labor behavioral responses of adultsrather than child labor responses are now estimated. Labor is no longer modeled ex-clusively as a discrete decision, incorporating instead an additional continuous dim-ension. Formal and informal responses are modeled separately, as well as male andfemale behavior. Different behavioral responses are allowed for each alternative re-form scenario simulated, having tested that such a flexible specification is adequate.
Simulations conclude that the distributive consequences of HDB reforms arelimited, even when resources are substantively increased and better targeted. Thisconclusion is relevant given the ongoing efforts to improve the targeting of theprogram and the successive governments’ attempts to turn the HDB into aninstrument to smooth consumption shocks to the poor. Thus, the objective of theHDB is not the reduction of poverty itself but, rather, becoming a de facto socialprotection mechanism for the poor in Ecuador. Two studies have found similarresults in Ecuador and Brazil regarding the limited impact of potential socialtransfer reforms. Cuesta et al. (2004) concluded that the failure of the labor-basedqualifying criteria for HDB to discriminate low from middle-income householdswould limit the distributive gains from a prospective HDB reform in Ecuador. InBrazil, Bourguignon et al. (2003) argue that perverse indirect effects in the form ofincreasing child labor explain a very modest distributive impact of increasingtransfers or lowering the qualifying income threshold. In contrast, this paper arguesthat even the increased capacity to identify the very poor and the moderately poorand a substantive increase in transfers may not be sufficient to render large distribu-tive gains. Labor-driven behavioral effects are multiple and complex, tending to
Review of Income and Wealth, Series 53, Number 4, December 2007
© 2007 The AuthorsJournal compilation © International Association for Research in Income and Wealth 2007
646

cancel out one another: for instance, reforms may generate simultaneously laborincentives from the elimination of a subsidy and disincentives to work fromincreases in the transfer of other subsidies. As direct effects dominate in the case ofEcuador, the reduction of poverty will be maximized to the extent that the increasedHDB transfers are geared towards households closer to the pre-reform poverty line.
The paper is structured as follows. Section 2 discusses the estimating strategyfor direct and indirect (or behavioral) distributive impacts following changes in thetransfer of incomes to the household. Section 3 describes the characteristics of keysocial programs in Ecuador and the role of the SelBen index in their targeting.Section 4 summarizes the reform scenarios being considered for HDB and gassubsidies and the sources of data for the analysis. Section 5 presents and discussesthe econometric and simulation results, while Section 6 summarizes the mainfindings of the paper.
2. Estimation of the Direct and Indirect Effects of Social Transfers
The emergence of CCTs has spurred numerous impact evaluations account-ing for their induced behavioral changes among beneficiaries. Experimental andquasi-experimental impact evaluation techniques compare the effects of a programacross beneficiaries vis-à-vis non-beneficiaries.2 New evaluations on human capitaland poverty impacts build up from the behavioral benefit incidence literature thattypically estimates the distributive (marginal and average) benefits of existingsocial programs or their scaling.3 Such evaluations4 can be divided into ex-ante andex-post behavioral studies, depending on the stage of the program cycle whenimpacts are evaluated. In the case of prospective reforms that are not already inplace, ex-ante simulations are the only feasible ones to assess distributive impacts.Those simulations are rare, however. They require an additional number ofassumptions about the way agents choose among different alternatives that are notalready established (Bourguignon and Ferreira, 2003). In contrast, ex-post evalu-ations typically observe the difference between individuals confronted to or con-cerned with the reforms and individuals who are not (Bourguignon and Spadaro,2006). Ex-ante simulations may also take different approaches. General equilib-rium models incorporating behavior—either static or dynamic—have been longcriticized for their sensitivity to modeling assumptions (see Cogneau et al., 2003for a discussion in the context of poverty reduction). Alternative partial-equilibrium behavioral micro-simulations are rarely used in the analysis of socialprograms in developing countries, although frequently in tax-benefit models in
2Experimental and quasi-experimental impact evaluation techniques differ in the way that controland treatment groups are formed: randomized before the implementation of the program in theexperimental approach, while somehow “matched” after the implementation of the program in thequasi-experimental case.
3Van de Walle (1995, 2002, 2003), Jalan and Ravallion (2003), and Lanjow and Ravallion (1999)are examples of the use of both static and panel-based benefit incidence analysis across developingcountries. Although a few studies such as Van de Walle (2002) use panel data, it is more likely thatbehavioral analyses use cross-section data. This is the case in this study for Ecuador. As cross-sectionstudies do not account for dynamic effects or medium to long run effects, the estimated effects incross-section studies should be interpreted as short-term or immediate impacts of the reform.
4Typically, impact studies—both accounting and behavioral based exercises—assume neitheradministrative nor delivery costs. They also assume identical valuations and consumption possibilitiesacross households.
Review of Income and Wealth, Series 53, Number 4, December 2007
© 2007 The AuthorsJournal compilation © International Association for Research in Income and Wealth 2007
647

developed countries—see Creedy and Duncan (2002) and Bourguignon andSpadaro (2006) for reviews. Bourguignon and Spadaro (2006) report that thesemodels are also subject to limitations, such as their specificity to the policy evalu-ated and the corresponding micro-data and the difficulties of testing the underlyingassumptions to the structural model upon which behavior is modeled.
Among the few ex-ante behavioral micro-simulations in developing countries,Bourguignon et al. (2003) and Cuesta et al. (2004) analyze social transfer reforms.Other social micro-simulations in developing countries such as Cogneau andGrimm (2004) or Cuesta (2006), among others, simulate the distributive impactof AIDS and intra-household discrimination, respectively. Bourguignon andFerreira (2003) argue that, in addition to the technical limitations mentionedabove, the rare use of behavioral micro-simulations to analyze social transfers is aconsequence of typically small-sized transfer programs and the difficulty of disen-tangling informal and formal labor related behavior.
This study adds to the behavioral modeling literature in developing countries,and remedies the shortcomings found in the only two previous studies using abehavioral ex-ante approach to study welfare program reforms. This study differsfrom Bourguignon et al. (2003) and Cuesta et al. (2004) in that behavior is struc-turally modeled and allowed for different responses to different reform alternatives(a flexibility which is formally tested, as seen below). In contrast with Bourguignonet al. (2003), labor decisions refer to all working-aged household members, notonly to child labor. The model also separates informal and formal responses aswell as male and female decisions. Both discrete and continuous dimensions oflabor (that is, participation and working hours) are included in the model.
The simplest structural modeling of labor draws from extensions to the classicconsumer demand theory that incorporates interrelations among householdmembers. Becker (1965) and Ashenfelter and Heckman (1974) are pioneeringworks in a large series of studies. Consumer demand models maximize householdutility accruing from consumption and leisure among its members. This utility issubject to budget and time restrictions and non-negative consumption and leisurelevels. The solution of this maximization problem provides the optimal labor effort(as total available time minus optimal leisure) of each household member. Theoptimal allocation depends on the level of hourly earnings from labor, othernon-labor household incomes, and the allocation mechanism operating within thehousehold. Under the common preference and income pooling hypotheses allindividual incomes end up in a common fund that the household head distributesaccording to each household member’s needs. In its simplest format, this intra-household allocation rule distributes all household incomes on a per capita basis.5
5Social scientists studying gender relations have long contested the assumption of a unitaryhousehold with common preferences and income-pooling (see Pahl, 1989; Chiappori, 1992; Jejeebhoy,1995). An increasing intra-household allocation literature has convincingly shown that the unitary ruledoes not typically hold, although it has not been equally successful in demonstrating alternativemechanisms of collective behavior within the household. Furthermore, non-unitary models are believedto have strong redistributive impacts. A recent simulation study in Chile (Cuesta, 2006) reports direimpacts on poverty incidence (up to five additional percentage points) if the allocation of resources withinhouseholds follows discriminatory rules. The lack of information in the household surveys in Ecuadorprevents simulation of such alternative allocations in this study. However, inasmuch as intra-householddiscrimination exists, distributive effects estimated by the unitary rule underestimate the true impact.
Review of Income and Wealth, Series 53, Number 4, December 2007
© 2007 The AuthorsJournal compilation © International Association for Research in Income and Wealth 2007
648

Following the standard unitary household allocation set up as an extension of theclassical Ashenfelter and Heckman (1974) model using a Stone–Geary specifica-tion, household members maximize their identical preferences subject to the totalhousehold consumption and the total household budget constraint. In addition toassumptions on common preference and income pooling, individuals are assumedto be altruistic, that is, the consumption of other members enters each member’sindividual utility (Chiappori, 1988). The resulting optimization problem of thehousehold becomes:
max ,,C L
i i i i iii
i iU C L= −( ) −( ) + ≥∏ χ μ α βα β 1(1)
s.t. X Lw C= +(2)
X Tw N= +(3)
L Ti ≤(4)
L H Ti i+ =(5)
C Li, > 0(6)
C −( ) ≥χ 0(7)
Li i−( ) ≥μ 0(8)
L Lii
∑ =(9)
C Cii
∑ =(10)
where Ui stands for each household member’s individual utility; Pi Ui, the aggre-gated household utility; C, total household consumption; Ci, the consumption ofthe i-th household member; L, total leisure time of the household; Li, the timethat each household member devotes to leisure; mi, the minimum leisure accept-able for the i-th household member; Hi, individual working hours; c, theminimum level of consumption acceptable for the household; wi, hourly laborearnings; X, total household income; T, the maximum available time (i.e. 24hours daily); and N, the non-labor household income, which in the Ecuadoriancase refers to gas subsidies, HDB and other non-labor incomes, such as self-consumption, social transfers, retirement incomes, rents and financialincomes.
Solving the Kuhn–Tucker conditions associated with the Lagrangian of theabove maximization problem provides the first order condition, which indicatesthe equilibrium relationship between individual consumption, leisure, and work
Review of Income and Wealth, Series 53, Number 4, December 2007
© 2007 The AuthorsJournal compilation © International Association for Research in Income and Wealth 2007
649
effort. The resulting equilibrium defines an optimal wage, the reservation price,wi
r, that is fundamental in determining participation in the labor market. Thereservation wage is the unitary labor income at which the individual is indiffer-ent between working or not working. In that case, C = N, and T = L, so workinghours equal 0. In other cases, participation takes place (i.e. p = 1) if the indi-vidual’s wage exceeds his or her reservation wage. Otherwise, the individualchooses not to participate (i.e. p = 0). Interestingly, the decision to participate isdetermined by individual wages, non-labor incomes (in which HDB in Ecuadoris substantive, as seen below), and factors that will shape consumption andleisure levels, such as personal and household characteristics. A generalizedexpression (that is, without imposing a priori conditions on their shape) of thesetheoretical links, equation (11), is estimated econometrically. Given the discretenature of the participation variable, pi, a discrete choice estimating techniqueis used.
As for working hours, the first order condition of the maximizationproblem and the budgetary constraints, equations (2) and (3) determineoptimal consumption (C*) and leisure levels ( Li* ). The optimal labor supply, Hi,is then obtained from H T Li i= − *. Conditional to participation, work effort islinked with unitary labor incomes, non-labor incomes and factors that affect thevaluation of leisure, as it was the case with participation. These links aremodeled in equation (12). Given the continuous nature of the working hoursvariable, Hi, an ordinary least square (OLS) technique is used to predict itsbehavior.
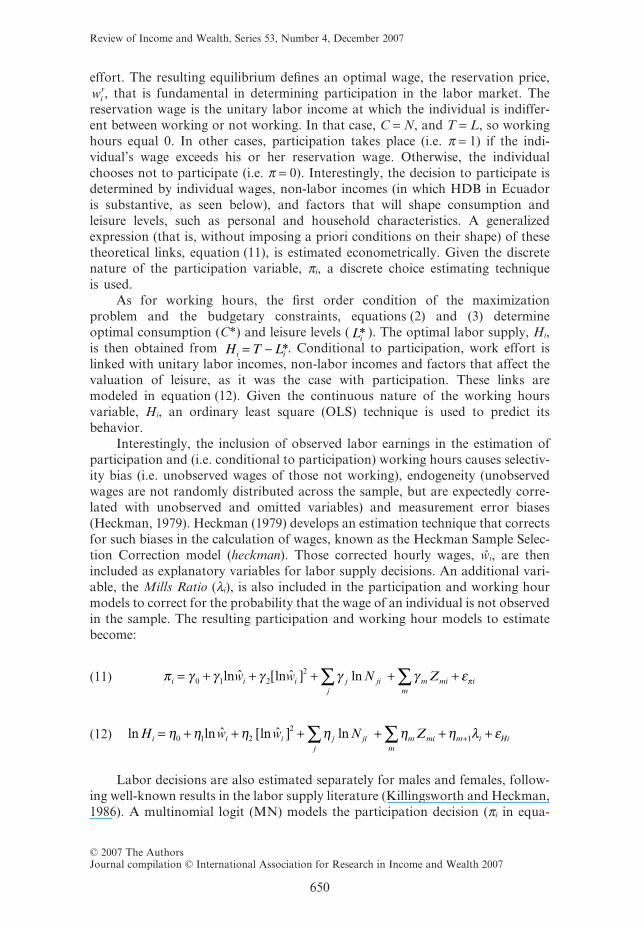
Interestingly, the inclusion of observed labor earnings in the estimation ofparticipation and (i.e. conditional to participation) working hours causes selectiv-ity bias (i.e. unobserved wages of those not working), endogeneity (unobservedwages are not randomly distributed across the sample, but are expectedly corre-lated with unobserved and omitted variables) and measurement error biases(Heckman, 1979). Heckman (1979) develops an estimation technique that correctsfor such biases in the calculation of wages, known as the Heckman Sample Selec-tion Correction model (heckman). Those corrected hourly wages, wi, are thenincluded as explanatory variables for labor supply decisions. An additional vari-able, the Mills Ratio (li), is also included in the participation and working hourmodels to correct for the probability that the wage of an individual is not observedin the sample. The resulting participation and working hour models to estimatebecome:
π γ γ γ γ γ επi i i j jij
m mim
iw w N Z= + + [ ] + + +∑ ∑0 1 22ln lnˆ ˆ ln(11)
ln ln lnH w w N Zi i i j jij
m mim
m i Hi= + + [ ] + + + +∑ ∑ +η η η η η η λ ε0 1 22
1ˆ ˆ ln(12)
Labor decisions are also estimated separately for males and females, follow-ing well-known results in the labor supply literature (Killingsworth and Heckman,1986). A multinomial logit (MN) models the participation decision (pi in equa-
Review of Income and Wealth, Series 53, Number 4, December 2007
© 2007 The AuthorsJournal compilation © International Association for Research in Income and Wealth 2007
650

tion (11)) according to three outcomes: no participation, participation in informaloccupations, and participation in formal occupations. Conditional to participa-tion (and having previously corrected for sample selection), an OLS will modelwork effort for informal and formal sectors, separately.
Among their potential determinants, participation and working hourfunctions include non-labor incomes (Nji in equations (11) and (12)). Non-labor incomes are further disaggregated in four categories: HDB for females,HDB for the elderly, gas subsidies, and the remaining non-labor incomes of thehousehold. This separation constitutes an implicit test for the uniformity oflabor effects among categories of social transfers. Previous evidence rejects suchuniformity in the Ecuadorian case. Cuesta et al. (2003) report significantly nega-tive participation elasticities of universal transfers; significantly negative partici-pation and working hour elasticities of consumption-related subsidies; andinsignificant participation and working hour elasticities of targeted transfers.These patterns are believed to reflect differences in qualifying criteria, theco-finance structure of public social services, age of beneficiaries and householdsize. Finally, the reduced-form equations include a number of exogenous vari-ables, Zm, that include personal and household characteristics as well as, for theworking hour case, informality and the Mills Ratio (or participation correctionfactor).
3. Social Transfers in Ecuador and the SelBen Targeting Mechanism
The Human Development Bonus (HDB) and gas subsidies have latelyattracted increased attention in Ecuador, a country whose social expenditure percapita remains among the lowest in Latin America (CEPAL, 2004). These twoprograms constitute the largest transfers in the country, accounting for 1 percentand 2.4 percent of GDP, respectively, in 1999. These programs are also signifi-cant contributors to household welfare, representing 1.3 percent and 3.9 percentof total household consumption per capita, respectively. Gas prices in Ecuadorhad been subsidized since the discovery of oil in the country in the early 1970s.The HDB scheme—then called bono solidario or “solidarity bonus”—was intro-duced in 1998 as a temporary monetary compensation for the liberalization ofgas prices that year. The elimination of the subsidy was short-lived, however:fixed gas prices were reintroduced in 1999 and have been maintained ever since.A 15-kg gas cylinder cost US$1.6 in 1999 while its real price was estimated atUS$5.4 (León et al., 2001). The bono solidario, far from disappearing, became acentral social protection mechanism for the poor in the recurrent periods of crisissince 1999, to the point of being widely perceived now as a permanent transfer.These bonos solidarios compensated the elderly, the disabled, and mothers inpoor households with dependants (under-18s) who were not affiliated to theEcuadorian Institute of Social Security. To qualify for benefits, households mustearn less than a million sucres per month (US$95 in 1999) from labor, or fail tohave regular labor earnings (i.e. a fixed term contract). In 2000, the unitarybenefit was increased and the program name changed to HDB. In 2003, someUS$150 million was transferred through HDB to almost 1.28 million beneficia-
Review of Income and Wealth, Series 53, Number 4, December 2007
© 2007 The AuthorsJournal compilation © International Association for Research in Income and Wealth 2007
651

ries.6 In 2004, the program was reformulated to become a CCT, merging thebono solidario with beca escolar. The latter was introduced at the end of the1990s. It transferred US$5 per month per child (up to two children per house-hold) conditional to school enrolment and assistance of at least 90 percent ofschool days. The “new” HDB was then advertised as a CCT and televisionspots were aired indicating the co-responsibility of parents towards the healthand education status of their children as a counterpart for benefit reception.However, conditionalities have been never detailed, enforced nor monitored.Although reasons for that failure to develop conditionalities are unclear, delaysin the application of the means-test instrument, the SelBen index, left the selec-tion of beneficiaries a first-come first-served exercise (Schady and Araujo, 2006).Also, the widely accepted current view of the HDB as a permanent transferwould hamper the effective use of possible conditionalities towards graduationof the HDB and updating its roster of beneficiaries.
The distribution of benefits from HDB and gas subsidies varies significantly,HDB being better targeted. Vos et al. (2003) show that the poorest 40 percent ofhouseholds capture only 22.5 percent of total gas benefits compared with some54.9 percent of HDB benefit. However, households in the intermediate region ofthe distribution of consumption capture a very similar share of benefits from eachprogram: 45.1 percent of total gas benefits accrue to the middle income groups,while 37.1 percent of total HDB benefits end up in those same households (seeTable 1, columns 1 and 3). Cuesta et al. (2004) argue that the substantial benefitsaccruing from HDB to middle income groups are the result of weak qualifyingcriteria. Only 40 percent of the active labor force self-reported monthly earnings ofover a million sucres, and only 16 percent reported having a fixed-term contract in1999.
The widely-acknowledged targeting deficiencies of the HDB have stirred up astrong demand for its reform. Those urging targeting improvements have also
6According to official figures by SIISE, the bono solidario benefited some 1,279,576 individuals inJune 1999 (SIISE, 2000). In December 2003, according to SIISE figures, there were 1,324,019 HDBbeneficiaries; by June 2004, this figure had declined to 1,090,306 after the introduction of SelBentargeting. This decrease in the number of beneficiaries is attributed to improved targeting, but also theimpossibility of computing the SelBen index among all HDB beneficiaries. Special registration com-mittees at the local (parroquia) level have been formed to amend this situation.
TABLE 1
Distribution of Benefits According to the SelBen Index
Household Consumptionper capita, Quintiles
[1]Gas, Initial
Distribution (%)
[2]Gas, “SelBen-Poor”
Distribution (%)
[3]HDB, Initial
Distribution (%)
[4]HDB “SelBen-Poor”
Distribution (%)
1 (poorest) 8.4 21.3 27.1 30.52 14.1 31.5 27.8 28.93 20.5 26.3 25.4 22.64 24.6 15.8 11.7 13.45 32.4 5.1 4.0 4.6
Total 100 100 100 100
Note: The cut-off point determining the “SelBen-poor” allocation of benefits is 51.9.Source: SIISE (2000) and authors’ estimates.
Review of Income and Wealth, Series 53, Number 4, December 2007
© 2007 The AuthorsJournal compilation © International Association for Research in Income and Wealth 2007
652

advocated an increase in resources for the HDB program resulting from theelimination of gas consumption subsidies. The household-based targeting index,SelBen, was created in 2000 partly for this purpose. SelBen is a comprehensiveindex of household living conditions weighting 27 variables reported in the latestEncuesta de Condiciones de Vida (ECV; see INEC, 1999). Variables refer to theeducation, health, and social protection conditions of the household head, spouseand other members; household demographic composition and geographic loca-tion; and households’ access to basic public services and consumer durable goods.Using principal component analysis, the correlation of each of these variables withthe first factorial component determines the individual weight of each variable inthe composite index. The resulting index is normalized into a 0 to 100 point scale,where 0 demonstrates maximum vulnerability and the highest priority for thetargeting of social benefits. A cut-off point of 51.9 in the SelBen 100-point scaleseparates two categories of households: the poor (households below the cutting-offpoint) from the non-poor (above that point) or, more importantly, householdsthat will benefit from social programs from those that will not. A second cut-offpoint at 43.3 in the 100-point scale discriminates between the poor and the verypoor. Table 2 shows the distribution of the SelBen index in terms of householdconsumption.
Table 2 shows that SelBen efficiently identifies beneficiaries among thepoorest household consumption quintiles using the living conditions ECV 1999.The bottom quintile of the SelBen index (up to a cutting-off point of 35.1)reportedly contains 91 percent of the poorest quintile of the household consump-tion per capita distribution. However, the targeting efficiency of the SelBen indexdecreases rapidly when other quintiles of the SelBen index are used. The pro-portion of beneficiaries captured by the two bottom quintiles of the SelBen indexdistribution (i.e. up to 42.3 in the scale) is 92 percent, that is, only an additional1 percent of those captured by the bottom quintile of the SelBen index.However, less than 35 percent of the beneficiaries belong to the poorest quintileof household consumption per capita. When other quintiles of the SelBen dis-tribution are used for targeting purposes, beneficiaries do not belong to thepoorest quintile of household consumption per capita, compromising targetingefficiency.
TABLE 2
Distribution of SelBen Index and Household Consumption
Household Consumptionper capita, Quintiles
SelBen Distribution, Quintiles (% of beneficiaries)
1 (poorest) 2 3 4 5
1 (poorest) 91.32 34.90 0.04 0 02 8.34 57.65 37.46 1.16 03 0.35 7.06 57.74 30.90 04 0 0.40 4.75 65.10 16.535 0 0 0 2.84 83.47
Total 100 100 100 100 100
Note: Cut-off points determining the quintiles of the SelBen index are, respectively, 35.1; 42.3;49.3; 58.4.
Source: SIISE (2000) and authors’ estimates.
Review of Income and Wealth, Series 53, Number 4, December 2007
© 2007 The AuthorsJournal compilation © International Association for Research in Income and Wealth 2007
653
This begs two questions, one regarding targeting effectiveness, the other,poverty reduction effectiveness: How much would targeting have been improvedif HDB and gas subsidies had been allocated using the SelBen index? How muchreduction of poverty should be expected to happen following such a reallocationbased on the SelBen index? If the poor cutting-off point of 51.9 in the 100-pointscale were used to identify beneficiaries, the resulting distribution of gas subsi-dies would improve considerably (see Table 1, columns 2 and 3). However, littledistributive benefit should be expected from a SelBen-based reallocation ofHDB. As the cut-off point of 51.9 falls within the next-to-top quintile of theSelBen distribution, it will only be effective in identifying beneficiaries within theupper part of the household consumption distribution. It is in that region ofthe distribution that beneficiaries of the gas subsidies abound and beneficiaries ofHDB are scarce. Interestingly, even though SelBen may potentially increase tar-geting efficiency (that is, identify beneficiaries belonging to low income groups),its use will not systematically produce large redistributive gains (that is, takethese households out of poverty or alleviate much their poverty gap). This seemsto confirm the conclusion of Coady and Skoufias (2004) that the shift fromuniversal to targeted subsidies in Mexico increased targeting efficiency withoutsizeable redistributive gains, even when poverty reduction was not their mainobjective. Similar results are also found in Brazil. Bourguignon et al. (2003)show that even though school attendance would increase significantly fromraising transfers and making them age-progressive, the impact on poverty wouldbe very limited (little more than one percentage point). The authors argue thathigh initial inequalities and adverse distributive effects from increasing childlabor are to blame.
4. Simulation Scenarios of Social Transfer Reforms
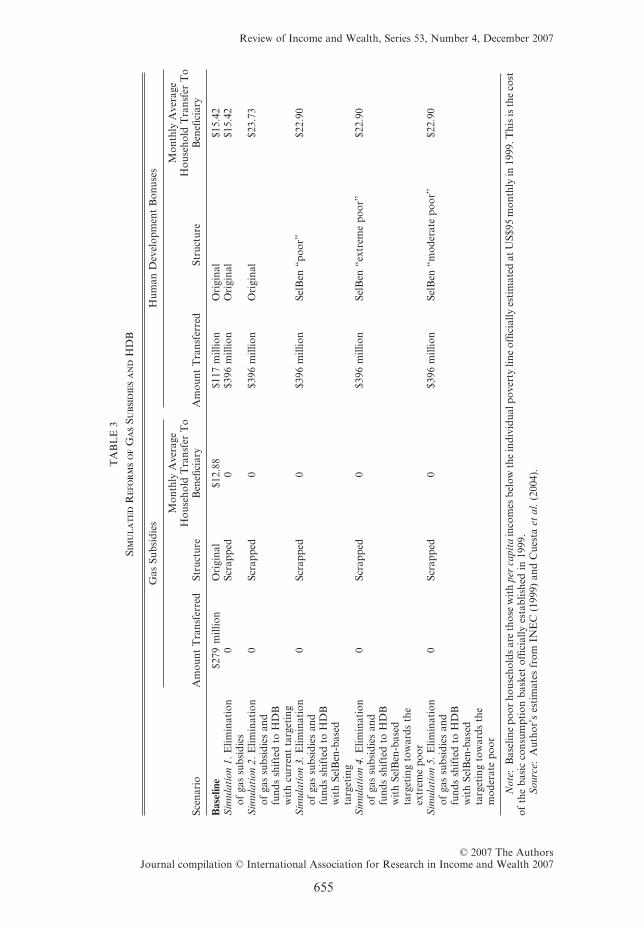
Concrete proposals for social reforms have not yet been laid out in Ecuador.Consequently, this paper considers the reform of gas subsidies and HDB usingseveral possible scenarios. Table 3 describes these scenarios: in the first, the elimi-nation of gas subsidies is not compensated; in the second, gas subsidies are shiftedto the HDB, maintaining the current qualifying criteria for beneficiaries; in thethird, gas subsidies are shifted into HDB, which in turn is reassigned to householdsclassified as poor by the SelBen index (i.e. beneficiaries do not exceed a cut-offpoint of 51.9 in the 100 point scale). The other two scenarios reassign the shiftedresources from gas subsidies to HDB targeted to the extreme and moderate poor,respectively. The first scenario is resource-saving; the other four are fiscallyneutral. Thus, the redistributive consequences of the simulated reforms are solelythe result of a better use of available resources.
A second consideration refers to a trade-off between unitary benefits and thenumber of beneficiaries from the simulated reforms. The increase of aggregatedHDB resources may not increase unitary HDB benefits if the increase in thenumber of beneficiaries from better targeting is sufficiently large. This is true in thecase of shifting gas subsidies using the SelBen index to identify beneficiaries(vis-à-vis a shifting of gas subsidies with the current targeting). The simulationsalso assume costless targeting and no substantive substitution effects among
Review of Income and Wealth, Series 53, Number 4, December 2007
© 2007 The AuthorsJournal compilation © International Association for Research in Income and Wealth 2007
654
TA
BL
E3
Sim
ul
at
edR
efo
rm
so
fG
as
Sub
sid
ies
an
dH
DB
Scen
ario
Gas
Subs
idie
sH
uman
Dev
elop
men
tB
onus
es
Am
ount
Tra
nsfe
rred
Stru
ctur
e
Mon
thly
Ave
rage
Hou
seho
ldT
rans
fer
To
Ben
efici
ary
Am
ount
Tra
nsfe
rred
Stru
ctur
e
Mon
thly
Ave
rage
Hou
seho
ldT
rans
fer
To
Ben
efici
ary
Bas
elin
e$2
79m
illio
nO
rigi
nal
$12.
88$1
17m
illio
nO
rigi
nal
$15.
42S
imul
atio
n1.
Elim
inat
ion
ofga
ssu
bsid
ies
0Sc
rapp
ed0
$396
mill
ion
Ori
gina
l$1
5.42
Sim
ulat
ion
2.E
limin
atio
nof
gas
subs
idie
san
dfu
nds
shif
ted
toH
DB
wit
hcu
rren
tta
rget
ing
0Sc
rapp
ed0
$396
mill
ion
Ori
gina
l$2
3.73
Sim
ulat
ion
3.E
limin
atio
nof
gas
subs
idie
san
dfu
nds
shif
ted
toH
DB
wit
hSe
lBen
-bas
edta
rget
ing
0Sc
rapp
ed0
$396
mill
ion
SelB
en“p
oor”
$22.
90
Sim
ulat
ion
4.E
limin
atio
nof
gas
subs
idie
san
dfu
nds
shif
ted
toH
DB
wit
hSe
lBen
-bas
edta
rget
ing
tow
ards
the
extr
eme
poor
0Sc
rapp
ed0
$396
mill
ion
SelB
en“e
xtre
me
poor
”$2
2.90
Sim
ulat
ion
5.E
limin
atio
nof
gas
subs
idie
san
dfu
nds
shif
ted
toH
DB
wit
hSe
lBen
-bas
edta
rget
ing
tow
ards
the
mod
erat
epo
or
0Sc
rapp
ed0
$396
mill
ion
SelB
en“m
oder
ate
poor
”$2
2.90
Not
e:B
asel
ine
poor
hous
ehol
dsar
eth
ose
wit
hpe
rca
pita
inco
mes
belo
wth
ein
divi
dual
pove
rty
line
offic
ially
esti
mat
edat
US$
95m
onth
lyin
1999
.Thi
sis
the
cost
ofth
eba
sic
cons
umpt
ion
bask
etof
ficia
llyes
tabl
ishe
din
1999
.S
ourc
e:A
utho
r’s
esti
mat
esfr
omIN
EC
(199
9)an
dC
uest
aet
al.(
2004
).
Review of Income and Wealth, Series 53, Number 4, December 2007
© 2007 The AuthorsJournal compilation © International Association for Research in Income and Wealth 2007
655
energy sources in the short-run. Energy substitution at the residential level may nottake place in the short-run if it implies costly investments to the users; technologi-cal or economic reasons constrain the supply of alternative sources of energy; thegovernment fails to incentive the switch to other sources. These three conditionsconcur in Ecuador.7
The simulations are constructed in six steps. First, baseline poverty indicatorsare estimated using the ECV 1999 survey (INEC, 1999) compiled by the EcuadorianInstitute of Statistics and Census (INEC, 1999). Data were collected in three-monthwaves throughout 1999 using a stratified and multi-phase survey design. Thenational sample consisted of 25,980 individuals belonging to 5,824 households. Asa Living Standard Measurement Survey type, the ECV 1999 provides informationon individual access to social programs, including HDB, as well as public educationand health services. It also reports consumption of gas, electricity and fuel, fromwhich their implicit subsidies can be estimated. The survey also provides informa-tion on living conditions, income and consumption levels among households. TheECV 1999 specifies labor participation and working hours of household membersand other demographic and geographic characteristics of households. Table 4summarizes key descriptives of Ecuadorian households.
A second step in the simulations consists of working out the direct effects ofthe reforms across the entire distribution of households, that is, also includingthose households without initial beneficiaries of the programs. The simulatedchanges in gas subsidies and HDB are incorporated into new distributions ofhousehold incomes, and poverty indicators are re-estimated. The resulting differ-ences with the baseline poverty indicators constitute the direct distributive effectsof reforms. Thirdly, labor supply responses induced by changes in gas subsidiesand HDB are estimated separately for males and females, participation andworking hour decisions, and informal and formal occupations. In the absence ofany indication of alternative intra-household behavior in Ecuador, households arealso assumed to behave according to unitary allocation rules.
Disaggregated labor supply responses are re-estimated in each scenario. Thisallows for structural changes (if any) in labor decisions following social reforms tobe taken into account. The small number of responses in the ECV concerningsecondary jobs prevented a further exploration of specific effects from primaryversus secondary jobs. In any case, the underlying assumption of the presentsupply model is that desired labor supply meets labor demand. In other words,labor market rigidities do not cause a substantial difference between desired work
7Although there are no studies specific to Ecuador, a study in Honduras found that low-incomegroups were not ready to substitute the current source of energy for cooking following an increase ofits price because the purchase of a stove operated by other sources represented a sizeable investment forthe household (see González and Cuesta, 2003). Similarly, Keener and Banerjee (2006) report that only4 percent of consumers interviewed in Ghana would substitute electricity for other energy sourcesvis-à-vis 72 percent who would reduce consumption if subsidies were eliminated. Also, there are noplans in Ecuador to increase its electrical generation capacity by the construction of new hydro- orthermo-electrical plants, and the use of solar thermal systems for water heating uses remains marginal(FEDEMA, 1999). As for economic arguments, diesel, electricity and gasoline have all observed annualincreases in their real prices of between 2.5 and 6.6 percent throughout the 1990s, while prices of gas andoil went down between 4 and 2 percent annually (Falconí, 2002). Finally, one should not overlook thedire political consequences of eliminating gas subsidies in Ecuador, even if further compensation wereto be offered.
Review of Income and Wealth, Series 53, Number 4, December 2007
© 2007 The AuthorsJournal compilation © International Association for Research in Income and Wealth 2007
656

effort and observed work effort. Large informal sectors such as that in Ecuador areconsistent with the idea of flexible occupations, where individuals can achieve thedesired number of work hours.
Fourthly, the estimated changes in participation and working hours in eachscenario are translated into monetary terms, that is, they are expressed as changesin the original labor earnings of household members. This translation is notstraightforward, as reforms may alter the original participation status of individu-als. In cases of induced participation (from no participation), each working hourprovided is valued at the average hourly labor earnings imputed in the baselinescenario. Changes in working hours among individuals who continue to partici-pate in labor activities are valued at the baseline average hourly labor earningsreported by the ECV 1999 survey.
Fifthly, new distributions of household incomes are constructed for eachscenario, after including direct changes of social incomes and indirect changes oflabor incomes.8 Finally, poverty indicators are re-estimated along the new distri-butions of household incomes. The differential between baseline indicators andindicators obtained in each scenario constitutes the overall distributive impact
8Household income based measures of poverty are chosen to estimate distributive impacts insteadof consumption measures because they avoid additional assumptions on how the monetary value of thelabor decisions is converted into consumption decisions, and how these decisions change acrossdifferent types of households. It would be very difficult to assess how the loss of gas subsidies will affectconsumption behavior and ultimately consumption-based poverty measures. Household surveys inEcuador do not report consumption or prices, just total expenditures on gas. Besides, energy consump-tion behavior may not change substantively if energy sources are not easily to substitute (that is, requirecostly installation costs, for example).
TABLE 4
Socioeconomic Characteristics of Ecuadorian Households, 1999
Male Headed Female Headed All Households
Number of households, by household head 1,907,804 480,089 2,387,893Average size of household, by household head 4.6 3.7 4.5Average schooling years of household head 7.6 6.7 7.4Total household consumption1 2,819,000 2,390,000 2,730,000Per capita consumption1 719,000 823,000 740,000Average gas consumption per household
(monthly gas cylinders)1.45 1.40 1.45
Average gas subsidies per household1 131,000 126,000 130,000Average HDB benefits per household1 89,000 128,0800 97,000Average other non-labor incomes of the
household1180,000 182,000 175,000
Total household incomes1 2,580,000 1,950,000 2,460,000Participation rate (14+) 89.2% 65.2% 76.9%Participation in informal market (14+) 56.1% 56.0% 56.1%Weekly working hours (14+) 43.0 33.8 39.2
Note: 1Consumption and incomes are expressed in monthly 1999 sucres unless otherwise indi-cated. 1999 annual average exchange rate, 10527 sucres per US$. Informality is defined according tooccupation and working conditions. Informal workers are wage-earners, non-professional self-employers and employers in workplaces with less than six employees, both in agricultural and non-agricultural activities and domestic service employees with or without salaries. Household non-laborbenefits are reported as national averages for beneficiaries and non-beneficiaries.
Source: INEC (1999).
Review of Income and Wealth, Series 53, Number 4, December 2007
© 2007 The AuthorsJournal compilation © International Association for Research in Income and Wealth 2007
657

attributed to each reform. These impacts are then broken down into relativecontributions from direct and indirect effects.
5. Simulating the Distributive Effects of Social Transfer Reforms SampleSelection Corrected Hourly Labor Earnings
Table 5 reports the regression results of hourly labor earnings—net of taxesand social security contributions—estimated by a sample selection correctionheckman model. The independence test indicates that there is in effect a selectionmechanism affecting work decisions, this effect being statistically significant at a 95percent level of confidence. Corrected hourly labor earnings depend on individualschooling years, age, gender, ethnic group and household location. This selectionfollows standard practices in the literature (see Killingsworth and Heckman, 1986;Pencavel, 1986) and specifically applied to the Ecuadorian case in Cuesta et al.(2003). Estimates show an annual return to schooling of 9.2 percent; a non-linearrelationship between age and hourly labor earnings (44 years of age being theturning point); a 53 percent hourly earnings gap to the detriment of females; andhourly earning gaps in favor of urban areas over rural areas, of nearly 6 percent inmost cities, and as high as 80 percent in Quito. Other things being equal, ethnicity
TABLE 5
Sample Selection Corrected Hourly Labor Earnings for Individuals 14+
Hourly Labor Incomes, Log Probability of Observing Labor Incomes
Coef. Std. Error Coef. Std. Error
Schooling years 0.0919 0.0034 0.0113 0.0031Age 0.0620 0.0048 0.1333 0.0042Age square -0.0007 0.0001 -0.0015 0.0001Gender (being a female) -0.7726 0.0349 -1.0408 0.0251Ethnicity (being indigenous) -0.3941 0.0630Marriage -0.0697 0.0294Residence (rural as reference)Dummy for Quito 0.5898 0.0467 0.1094 0.0454Dummy for Guayaquil 0.1644 0.0501 0.2751 0.0402Dummy for other cities 0.0579 0.0370 0.2361 0.0315Location (Highlands as reference)Dummy for Coast -0.0912 0.0302Household size -0.0321 0.0053Household universal social
transfers (¥1,000,000)-0.158 0.0380
Constant 11.6588 0.0912 -1.6950 0.0857
Rho 0.0455* 0.0218Wald c2 (8) 2,203.32**Wald independence test
(Ho: r = 0)4.33* Prob > c2 = 0.0374
Note: Number of observations: 17071 censored: 7348; non-censored: 9723. The independence ofthe two equations is accepted at a confidence interval of 95 percent. (**) indicates that a coefficient issignificantly different from 0 at a 99 percent confidence; (*) indicates that a coefficient is significantlydifferent from 0 at 95 percent; and ( ) indicates that a coefficient is not significantly different from 0 inintervals of confidence higher than 95 percent. Labor earnings are net of taxes and social securitycontributions.
Source: Authors’ estimates using ECV 1999 (INEC, 1999).
Review of Income and Wealth, Series 53, Number 4, December 2007
© 2007 The AuthorsJournal compilation © International Association for Research in Income and Wealth 2007
658

reduces hourly earnings by almost a third compared to non-indigenous rates. Allthese variables, with the exception of ethnicity, are also used to determine theselection function, that is, the individual probability of working. MacIsaac andRama (1997) show that ethnicity in Ecuador affects working conditions more thanaccess to work. In order to specify the selection function, other variables poten-tially affecting working decisions but not wages are also included: marital status,coastal location, household size and universal social transfers received by thehousehold. They are all statistically significant and have the expected signs withrespect to the probability of working.9 In particular, being married or living witha partner decreases the probability of that individual working by almost 7 percent,while the presence of an additional member of the household decreases the prob-ability by 3 percent. Also, receiving universal transfers reduces the probability ofobserving labor incomes in the household significantly (every US$10 monthlyincrease in universal benefits reduces the probability by 1.5 percent).
Labor Supply Functions
In Table 6, specification tests10 confirm that the decision to participate inlabor markets in Ecuador is appropriately described by a three-option choice: noparticipation, participation in informal occupations, and participation in formaloccupations. This is to be expected from a country such as Ecuador, with a largeinformal market. Informal labor may well be a strategy used by Ecuadorians toincrease their work effort to desired levels when this is not possible in formalmarkets. This explanation is consistent with the traditional view of informalwork as a residual of better (but typically rationed) formal jobs, although recentobservers question the usually involuntary character attributed to these activi-ties. Maloney and Núnez (2003) argue that the informal self-employed (and, tosome extent, the informal salaried) reflect voluntary optimal-decision prefer-ences, institutional constraints and formal labor productivity in Latin America.Specific to Ecuador, MacIsaac and Rama (1997) argue that several features ofthe labor market confer much greater flexibility than its cumbersome regulationinitially suggests.11 More interestingly, they argue that after controlling for edu-cation and other socioeconomic and geographical characteristics, hourly earn-ings in the public sector are not, on average, significantly different from those inthe informal sector (excluding agricultural work from the latter category). Speci-fication tests also confirm that gender-specific labor functions are preferredspecifications for describing labor supply in Ecuador. This follows the traditionalpractice in the labor supply literature, which has, since the early 1980s, custom-arily modeled labor decisions separately for males and females (Killingsworth,
9Universal transfers are by definition independent of household income levels, so there is noendogeneity between these incomes and labor decisions.
10Appendix 1 presents the estimated labor supply functions for probit participation functions withand without sample corrected wages, as well as OLS functions without gender disaggregation.
11Among such features, the authors emphasize the weak capacity of enforcing labor marketregulations, especially minimum wages; the limited unionization of the labor force (less than 10percent); the extended practice of adjusting downwards based earnings (up to 39 percent) to “com-pensate” for mandatory benefits; and the low levels of social security compliance (roughly 20percent).
Review of Income and Wealth, Series 53, Number 4, December 2007
© 2007 The AuthorsJournal compilation © International Association for Research in Income and Wealth 2007
659

TA
BL
E6
Est
ima
ted
La
bo
rSu
pply
Mo
del
sfo
rIn
div
idu
als
Ag
ed14
+
Par
tici
pati
on(M
ulti
nom
ialL
ogit
)W
orki
ngH
ours
(OL
S)
Mal
e,In
form
al(1
)
Mal
e,F
orm
al(2
)
Fem
ale,
Info
rmal
(3)
Fem
ale,
For
mal
(4)
Mal
e,In
form
al(5
)
Mal
e,F
orm
al(6
)
Fem
ale,
Info
rmal
(7)
Fem
ale,
For
mal
(8)
Pri
me
age
mal
e,he
ad2.
251
2.38
10.
092
0.20
3(0
.304
)**
(0.3
01)*
*(0
.038
)*(0
.025
)**
Pri
me
age
fem
ale,
head
0.81
40.
925
0.28
00.
260
(0.2
37)*
*(0
.230
)**
(0.0
90)*
*(0
.063
)**
Pri
me
aged
mal
e,no
head
0.61
60.
615
0.01
00.
118
(0.1
32)*
*(0
.136
)**
(0.0
37)
(0.0
30)*
*P
rim
eag
edfe
mal
e,no
head
0.15
00.
066
0.11
30.
024
(0.0
82)
(0.0
86)
(0.0
50)*
(0.0
45)
Hou
seho
ldsi
ze0.
012
-0.0
210.
002
-0.0
170.
015
0.01
5-0
.004
0.01
7(0
.025
)(0
.026
)(0
.015
)(0
.016
)(0
.006
)**
(0.0
05)*
*(0
.009
(0.0
08)*
Dum
my
for
Qui
to-1
.861
-1.1
06-1
.008
-0.2
73-0
.166
0.08
6-0
.108
0.06
2(0
.224
)**
(0.2
31)*
*(0
.152
)**
(0.1
61)
(0.0
83)*
(0.0
39)*
(0.0
88)
(0.0
66)
Dum
my
for
Gua
yaqu
il-0
.974
-0.6
880.
039
0.40
1-0
.015
-0.0
110.
209
0.27
3(0
.187
)**
(0.1
97)*
*(0
.114
)(0
.123
)**
(0.0
57)
(0.0
34)
(0.0
90)*
(0.0
74)*
*D
umm
yfo
rot
her
citi
es-0
.482
-0.0
63-0
.034
0.26
8-0
.041
-0.0
32-0
.021
-0.0
06(0
.158
)**
(0.1
68)
(0.0
94)
(0.1
08)*
(0.0
33)
(0.0
27)
(0.0
48)
(0.0
51)
Dum
my
for
Coa
st-0
.229
0.08
4-0
.991
-0.6
58-0
.102
0.00
1-0
.461
-0.3
85(0
.151
)(0
.159
)(0
.093
)**
(0.1
06)*
*(0
.035
)**
(0.0
25)
(0.0
57)*
*(0
.050
)**
Log
sam
ple
corr
ecte
dw
age
0.20
90.
972
0.05
60.
737
-0.0
65-0
.084
**-0
.047
0.15
2(0
.108
)*(0
.114
)**
(0.0
73)
(0.0
83)*
*(0
.039
)(0
.025
)(0
.047
)(0
.045
)**
Hou
seho
ldga
ssu
bsid
ies
-5.3
79-2
.071
-2.9
940.
411
-0.4
230.
245
0.26
2-0
.113
(0.7
51)*
*(0
.800
)**
(0.5
38)*
*(0
.574
)(0
.234
)(0
.150
)(0
.20)
(0.2
59)
Hou
seho
ldH
DB
,mot
hers
2.19
61.
051
1.07
3-1
.274
0.08
7-0
.112
-0.4
35-1
.142
(0.8
82)*
*(0
.943
)(0
.504
)*(0
.592
)(0
.215
)(0
.143
)(0
.325
)(0
.283
)**
Tab
le6
cont
inue
don
next
page
Review of Income and Wealth, Series 53, Number 4, December 2007
© 2007 The AuthorsJournal compilation © International Association for Research in Income and Wealth 2007
660

TA
BL
E6
(con
tinu
ed)
Par
tici
pati
on(M
ulti
nom
ialL
ogit
)W
orki
ngH
ours
(OL
S)
Mal
e,In
form
al(1
)
Mal
e,F
orm
al(2
)
Fem
ale,
Info
rmal
(3)
Fem
ale,
For
mal
(4)
Mal
e,In
form
al(5
)
Mal
e,F
orm
al(6
)
Fem
ale,
Info
rmal
(7)
Fem
ale,
For
mal
(8)
Hou
seho
ldH
DB
,eld
er-0
.208
-5.1
651.
513
0.64
4-0
.962
-1.1
92-0
.981
-0.0
71(2
.183
)(2
.469
)*(1
.565
)(1
.775
)(0
.746
)(0
.559
)*(0
.703
)(0
.821
)H
ouse
hold
othe
rtr
ansf
ers
-0.0
05-0
.009
-0.0
78-0
.043
-0.0
00-0
.010
0.01
70.
029
(0.0
78)
(0.0
82)
(0.0
37)*
(0.0
36)
(0.0
24)
(0.0
08)
(0.0
20)
(0.0
21)
Mill
sR
atio
-0.7
48-0
.724
-0.2
51-0
.055
(0.0
91)*
*(0
.072
)**
(0.0
69)*
*(0
.084
)C
onst
ant
-0.4
34-1
1.73
9**
0.44
5-9
.197
6.24
76.
368
5.67
2**
2.87
4(1
.407
)(1
.477
)(0
.888
)(1
.016
)**
(0.5
21)*
*(0
.348
)**
(0.6
06)
(0.6
10)*
*
No.
obse
rvat
ions
5,30
56,
590
2,55
04,
531
2,15
93,
032
Wal
dc2
576.
3155
1.66
F(r
,n)
10.1
9**
19.5
4**
8.75
**13
.50*
*R
20.
0978
0.05
690.
0935
0.08
920.
0718
0.08
41L
og.P
-lik
elih
ood
-4,5
56.3
0-6
,759
.16
Hau
sman
Spec
ifica
tion
Tes
tH
0:di
ffer
ence
betw
een
prob
itan
dlo
git
not
syst
emat
icH
0:di
ffer
ence
inco
effic
ient
sno
tsy
stem
atic
byge
nder
c2 (14)
=21
.73;
P>
c2=
0.08
4c2 (1
2)=
259.
32;P
>c2
=0.
0H
0is
acce
pted
,Ind
epen
denc
eof
irre
leva
ntal
tern
ativ
esac
cept
ed.
H0
reje
cted
,gen
der
spec
ifica
tion
sac
cept
ed
Not
e:St
anda
rder
rors
inpa
rent
hese
s.(*
*)in
dica
tes
that
aco
effic
ient
issi
gnifi
cant
lydi
ffer
ent
from
0at
a99
perc
ent
confi
denc
e;(*
)in
dica
tes
that
aco
effic
ient
issi
gnifi
cant
lydi
ffer
ent
from
0at
95pe
rcen
t;an
d(
)in
dica
tes
that
aco
effic
ient
isno
tsi
gnifi
cant
lydi
ffer
ent
from
0in
inte
rval
sof
confi
denc
ehi
gher
than
95pe
rcen
t.S
ourc
e:A
utho
rs’e
stim
ates
usin
gE
CV
1999
(IN
EC
,199
9).
Review of Income and Wealth, Series 53, Number 4, December 2007
© 2007 The AuthorsJournal compilation © International Association for Research in Income and Wealth 2007
661

1983). In Ecuador, MacIsaac and Rama (1997) also suggest the existence ofgender and ethnic gaps in the hourly earnings of otherwise identical workers.12
Estimated participation coefficients have the predicted signs. Age, gender andhousehold position affect the decisions to participate in both formal and informaloccupations. Higher responsibilities associated with age and household positionincrease the probability of participation, and this effect is between two and threetimes higher for males than females. Non-participating males are most likely to befound in urban areas, with insignificant differences between highlands and coastallocations.
Labor inactivity seems to be rarely affordable. Females find more formalopportunities in urban areas, except in Quito. There and in coastal locations,females appear to find less formal opportunities. As expected, corrected laborearnings per hour increase participation by type of occupation and gender. Wagecoefficients on participation are larger in formal than informal sectors, amongboth males and females. This is unsurprising given the typically more diversecomposition of labor earnings among informal workers.
Participation coefficients vary among categories of social transfers. This inter-esting result has already been documented for Ecuador (Cuesta et al., 2003), andin other studies in Latin America and elsewhere (Coady et al., 2004). In theEcuadorian context, gas subsidies typically have a negative effect on participation.This effect is two to three times higher than the positive effect from HDB. Increas-ing gas subsidies provokes a dominant income effect, which is unsurprising for asubsidy tied to household welfare levels. In contrast, a higher HDB reflects largervulnerabilities for the household, and a coping strategy consisting of increasedlabor participation. These vulnerabilities may be caused either by original low-income levels or by larger numbers of children and the elderly, as these two factorsconstitute qualifying criteria for HDB. This would also explain why household sizehas no significant effect, on its own, on participation decisions: HDB captures thesize effect. Interestingly, HDB for the elderly does not have a significant impact onindividual participation decisions, since receipt of that subsidy simultaneouslyincreases household needs, and the probability that other household membersparticipate in household production activities. Similarly, the distinctive singleeffects of universal, consumption-linked and targeted social transfers aggregatedin “other household transfers” may well cancel one another out. The estimatedcoefficient in this study supports previous evidence for Ecuador, reported inCuesta et al. (2003), of a complex distribution of contradictory impacts fromdifferent social transfer categories. As a result, distributive impacts from labor-driven decisions are expected to be small in magnitude.
As for working hours, responsibilities shaped by age, position and genderincrease the supply of working hours. Corrected unitary earnings per hour affectthe working hour decisions only of formal workers. These effects have differentsigns: negative for males, positive for females. These results fall in the wide rangeof effects from social transfers in working hours reported in the labor supply
12Such gaps amount to 33 percent and 15 percent, respectively, for the whole sample of workers.These gaps are smaller than those estimated in this study. The MacIsaac and Rama study, however,does not correct for sample correction bias. Also, its earning functions fail to control for householdsocioeconomic characteristics such as household size or other non-labor income sources.
Review of Income and Wealth, Series 53, Number 4, December 2007
© 2007 The AuthorsJournal compilation © International Association for Research in Income and Wealth 2007
662

literature. Signs and magnitudes depend on the specification used and the degreeof self-selection (Mroz, 1987), with a safe interval of working hour elasticitiesbetween -2.0 and 2.0 (Pencavel, 1986; Licona, 1997). In Ecuador, Cuesta et al.(2003) report elasticities of -0.55 for aggregate social expenditures on workinghours. Increases in household size lead systematically to increases in workinghours, also an indication that it is through this labor dimension that householdsreact to greater household needs. Coastal location reduces working hours, whichis probably explained by the devastation in the form of floods caused by theclimatic phenomenon of “El Niño” during 1997 and 1998.13 Urban location seemsto reduce the number of hours worked by males compared with rural areas, butthis effect is mixed in the case of female working hours. Furthermore, socialtransfers do not seem to have a significant effect on working hour decisions. Allcoefficients are found to be statistically insignificant, with the exceptions of HDBof mothers in female formal work and HDB of the elderly in male formal work.This could be associated with higher demands on individuals’ time in the house-hold when HDB claims increase. In contrast, gas subsidies have no impact onworking hour decisions. This evidence for Ecuador reinforces the traditionalempirical finding that labor decisions at the margin are more responsive to non-labor incomes (Heckman, 1993). In Ecuador, too, once an individual decides toparticipate and reaches a desired level of work effort, minimal working hourvariations are to be expected.
Distributive Effects of Gas Subsidies and HDB
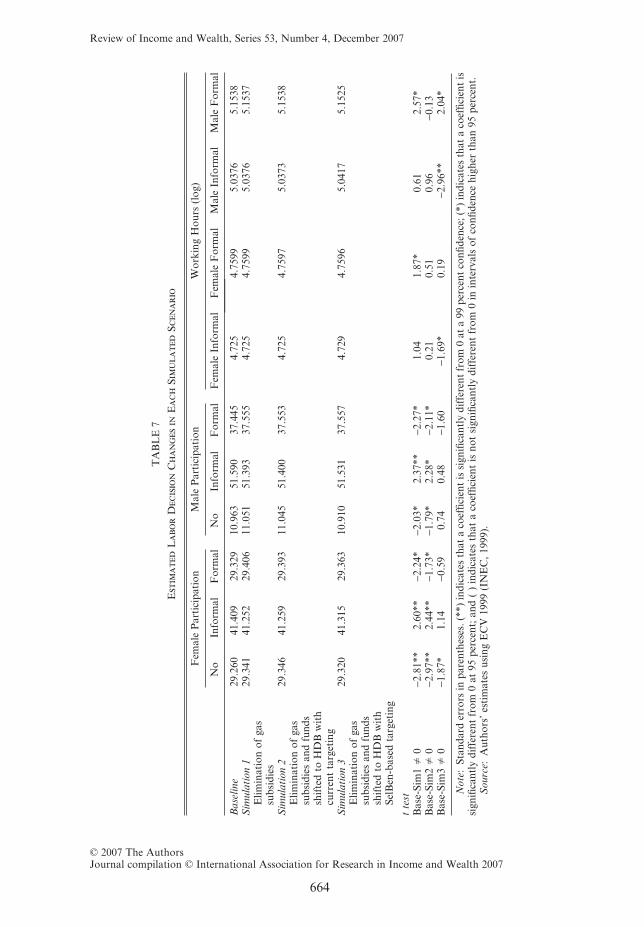
In the only previous study simulating the distributive impacts of social policyreforms in Ecuador (Cuesta et al., 2004), a main caveat was the imposition of aninvariable behavioral labor model. However, substantive changes in subsidies(even when the aggregated effects are fiscally neutral or resource-saving) and inbeneficiaries may well induce structural labor changes. Consequently, the esti-mates presented in the previous section constitute the baseline behavioral labormodel while participation and working hour functions are re-estimated specificallyfor each scenario. Table 7 reports the estimated changes in the labor decisions ofeach simulated scenario by sector and gender with respect to the baseline labormodel. Changes statistically different would justify a flexible model of adaptablebehavior to alternative scenarios. Tests for the statistical significance of thesechanges are also reported in Table 7.
Changes in labor decisions (with respect to the baseline) resulting from thesimulated reforms are mostly significant in statistical terms but inconsequential inmagnitude. Participation effects of gas subsidies and HDB reforms are larger thaneffects on working hours for the first two simulations, while the reverse is true forthe SelBen-based targeting simulation. In that simulation, occupation rather thangender determines the size and sign of indirect effects. The result is also indicativeof differences in labor coping strategies between formal and informal workers.
13Of the 105 municipalities (cantones) affected by El Niño between 1997 and 1998, around 80 werelocated along the coast. The population in the coastal provinces regarded as vulnerable to El Niño—5.6million—represented 86 percent of the total vulnerable population (around 6.5 million) (Vos et al.,2000).
Review of Income and Wealth, Series 53, Number 4, December 2007
© 2007 The AuthorsJournal compilation © International Association for Research in Income and Wealth 2007
663
TA
BL
E7
Est
ima
ted
La
bo
rD
ecis
ion
Ch
an
ges
inE
ac
hSi
mu
la
ted
Scen
ar
io
Fem
ale
Par
tici
pati
onM
ale
Par
tici
pati
onW
orki
ngH
ours
(log
)
No
Info
rmal
For
mal
No
Info
rmal
For
mal
Fem
ale
Info
rmal
Fem
ale
For
mal
Mal
eIn
form
alM
ale
For
mal
Bas
elin
e29
.260
41.4
0929
.329
10.9
6351
.590
37.4
454.
725
4.75
995.
0376
5.15
38S
imul
atio
n1
Elim
inat
ion
ofga
ssu
bsid
ies
29.3
4141
.252
29.4
0611
.051
51.3
9337
.555
4.72
54.
7599
5.03
765.
1537
Sim
ulat
ion
2E
limin
atio
nof
gas
subs
idie
san
dfu
nds
shif
ted
toH
DB
wit
hcu
rren
tta
rget
ing
29.3
4641
.259
29.3
9311
.045
51.4
0037
.553
4.72
54.
7597
5.03
735.
1538
Sim
ulat
ion
3E
limin
atio
nof
gas
subs
idie
san
dfu
nds
shif
ted
toH
DB
wit
hSe
lBen
-bas
edta
rget
ing
29.3
2041
.315
29.3
6310
.910
51.5
3137
.557
4.72
94.
7596
5.04
175.
1525
tte
stB
ase-
Sim
1�
0-2
.81*
*2.
60**
-2.2
4*-2
.03*
2.37
**-2
.27*
1.04
1.87
*0.
612.
57*
Bas
e-Si
m2
�0
-2.9
7**
2.44
**-1
.73*
-1.7
9*2.
28*
-2.1
1*0.
210.
510.
96-0
.13
Bas
e-Si
m3
�0
-1.8
7*1.
14-0
.59
0.74
0.48
-1.6
0-1
.69*
0.19
-2.9
6**
2.04
*
Not
e:St
anda
rder
rors
inpa
rent
hese
s.(*
*)in
dica
tes
that
aco
effic
ient
issi
gnifi
cant
lydi
ffer
ent
from
0at
a99
perc
ent
confi
denc
e;(*
)in
dica
tes
that
aco
effic
ient
issi
gnifi
cant
lydi
ffer
ent
from
0at
95pe
rcen
t;an
d(
)in
dica
tes
that
aco
effic
ient
isno
tsi
gnifi
cant
lydi
ffer
ent
from
0in
inte
rval
sof
confi
denc
ehi
gher
than
95pe
rcen
t.S
ourc
e:A
utho
rs’e
stim
ates
usin
gE
CV
1999
(IN
EC
,199
9).
Review of Income and Wealth, Series 53, Number 4, December 2007
© 2007 The AuthorsJournal compilation © International Association for Research in Income and Wealth 2007
664
Although this is hardly surprising, it is relevant in the context of HDB targeting.If informal workers act differently to formal workers and are more able to concealtheir incomes below qualifying criteria, then the efficiency of targeting directedtowards them may diminish. As a result, the impact on poverty of shiftingresources may well be lower than initially expected. Interestingly, SelBen-basedreforms are less likely to affect labor participation. In stark contrast, simulations1 and 2 have significant effects on participation categories: these simulated reformsraise participation in informal categories and decrease formal participation.Overall, both reforms provoke an aggregated increase in participation.
Both the differentiated adjustment of labor dimensions and the rather smallmagnitude of behavioral changes suggest relatively modest poverty impacts fol-lowing these reforms. Table 8 confirms these expectations. The elimination of gassubsidies without further compensation from HDB (Simulation 1) increases theincidence of poverty by 2.45 percent. Increases in the other two poverty dimen-sions are similar. As expected, the elimination of a relevant resource for thehousehold causes a sizeable increase in the incidence, depth and severity ofpoverty. Small indirect effects working in opposing directions also have a verymodest effect on poverty dimensions: they only compensate some 6–7 percent ofdirect effects.
In Simulation 2, the resources available after the elimination of gas subsidiesare transferred to the HDB scheme without further targeting improvements. Thestructure and number of beneficiaries are assumed to remain unchanged. As aresult, the average household benefit increases. On average, this increase amountsto US$8.6 or 53 percent of the original reported household benefit (see Table 3).Given the initial targeting deficiencies of the HDB, a substantial proportion of theadditional benefits will still accrue to households that were originally non-poor.The estimated total effect (including the effect from the elimination of gas subsi-dies) is an increase in poverty incidence by 1.71 percent. The average poverty gapand severity also increase in similar proportions (1.82 percent and 1.61 percent,respectively). However, the worsening of poverty is entirely driven by the initialelimination of gas subsidies. The marginal effect of increasing HDB benefits afterthe elimination of gas subsidies is a reduction of poverty by 0.7 percent (that is,from the increase of 2.45 percent in Simulation 1 to the estimated 1.71 percent inSimulation 2). Similarly, the marginal effect in terms of poverty gap is a reductionof 0.8 percent. Unsurprisingly, the insignificant or inconsequential indirect effectshardly counteract the direct effects on poverty in either this or the previoussimulation. In fact, this is quite a robust finding among the simulated reforms. InSimulation 2, indirect effects compensate between 0 and 3 percent of direct effectson poverty.
Simulation 3 provides a somewhat different picture. This scenario simulatesan improvement in HDB targeting and increasing resources after the eliminationof gas subsidies. Total poverty incidence hardly changes with respect to the base-line scenario, which implies that the marginal effect of a SelBen-based retargetingof HDB is a sizeable reduction of poverty incidence by some 2.51 percent. Moreinterestingly, the differential in poverty incidence between simulations 2 and 3indicates the additional poverty reduction caused by improved targeting. This gainamounts to 1.77 percent. Poverty gap and severity gains from SelBen are even
Review of Income and Wealth, Series 53, Number 4, December 2007
© 2007 The AuthorsJournal compilation © International Association for Research in Income and Wealth 2007
665

TA
BL
E8
Dis
tr
ibu
tiv
eE
ffec
ts
of
Soc
ial
Tr
an
sfer
Ref
or
ms
Bas
elin
eF
GT
(1)
=62
.59
perc
ent
FG
T(2
)=
30.1
5pe
rcen
tF
GT
(3)
=18
.53
perc
ent
Pov
erty
Indi
cato
rsaf
ter
Pol
icy
Ref
orm
s,in
Per
cent
Poi
nts
Dir
ect
Eff
ect
ofSo
cial
Tra
nsfe
rsas
Per
cent
ofT
otal
Cha
nge
Lab
or-R
elat
edIn
dire
ctE
ffec
tof
Soci
alT
rans
fers
asP
erce
ntof
Tot
alC
hang
e
FG
T1
FG
T2
FG
T3
FG
T1
FG
T2
FG
T3
FG
T1
FG
T2
FG
T3
Sim
ulat
ion
1(E
limin
atio
nof
gas
subs
idie
s)F
GT
(1)
=65
.05
FG
T(2
)=
32.7
5F
GT
(3)
=20
.86
2.45
2.60
2.33
105.
7%10
6.1%
106.
8%-5
.7%
-6.1
%-6
.8%
Sim
ulat
ion
2(E
limin
atio
nof
gas
subs
idie
san
dfu
nds
shif
ted
toH
DB
wit
hcu
rren
tta
rget
ing)
FG
T(1
)=
64.3
1F
GT
(2)
=31
.97
FG
T(3
)=
20.1
4
1.71
1.82
1.61
103.
5%10
1.1%
100.
6%-3
.5%
-1.1
%-0
.1%
Sim
ulat
ion
3(E
limin
atio
nof
gas
subs
idie
san
dfu
nds
shif
ted
toH
DB
wit
hSe
lBen
-bas
edta
rget
ing)
FG
T(1
)=
62.5
3F
GT
(2)
=28
.84
FG
T(3
)=
16.9
4
-0.0
6-1
.31
-1.5
898
.5%
97.6
%98
.9%
1.5%
2.4%
1.1%
Sim
ulat
ion
4(E
limin
atio
nof
gas
subs
idie
san
dfu
nds
shif
ted
toH
DB
wit
hSe
lBen
-bas
edta
rget
ing
tow
ards
the
extr
eme
poor
)F
GT
(0)
=63
.042
FG
T(1
)=
28.4
70F
GT
(2)
=16
.901
0.44
-1.6
8-1
.63
117.
1%98
.2%
98.9
%-1
7.1%
1.8%
1.1%
Sim
ulat
ion
5(E
limin
atio
nof
gas
subs
idie
san
dfu
nds
shif
ted
toH
DB
wit
hSe
lBen
-bas
edta
rget
ing
tow
ards
the
mod
erat
epo
or)
FG
T(0
)=
60.7
67F
GT
(1)
=26
.474
FG
T(2
)=
14.8
84
-1.8
3-3
.67
-3.6
496
.4%
99.2
%99
.6%
3.6%
0.8%
0.4%
Sou
rce:
Aut
hors
’est
imat
esus
ing
EC
V19
99(I
NE
C,1
999)
.
Review of Income and Wealth, Series 53, Number 4, December 2007
© 2007 The AuthorsJournal compilation © International Association for Research in Income and Wealth 2007
666

higher at 3.13 percent and 3.19 percent, respectively. Participation indirect effectsin this simulation are again found to be much lower than direct effects. This isunsurprising given the composition of estimated labor reactions: positive forformal males’ and females’ working hours; negative for informal workers’ workinghours; and insignificant for participation. The aggregated indirect impact resultingfrom these mixed effects is a rather small effect reinforcing the direct impact onpoverty (between 1.1 percent and 2.4 percent of the total estimated change inpoverty dimensions).
Simulation 3 shows that the poverty gains from SelBen are sizeable. Couldthese gains be even larger if a different use of SelBen were attempted? Twoadditional simulations were conducted in order to answer this question. Simula-tion 4 uses the cutting-off point of the first quintile of the SelBen index distributionto assign the increased HDB benefits to households. The other simulation, Simu-lation 5, targets the increase of HDB benefits to households whose SelBen indexlies between the very poor and the non-poor cutting-off points (i.e. between 43.3and 51.9 in the 100-point scale of SelBen). Both scenarios show that reformsmaximize the reduction of poverty when targeting effectively identifies thosehouseholds (prior to the reform) closer to the poverty line. The estimated totalpoverty reduction of the SelBen moderate poor reform (Simulation 5) decreasesthe baseline poverty incidence by 1.83 percent. In terms of efficiency gains, thereduction of poverty incidence amounts to 5.8 percent with respect to increasedHDB without further targeting improvements (Simulation 2). By contrast, themarginal gains of finessing the targeting of increased HDB to the poorest (Simu-lation 4) amount to only 1.2 percent and cannot fully compensate the overallpoverty incidence increase that the elimination of gas subsidies causes on its own.Paradoxically, improving the targeting efficiency of social transfers throughSelBen will maximize neither the reduction of poverty incidence nor other povertydimensions. The larger improvement in the poverty gap indicator in Simulation 5vis-à-vis that estimated in Simulation 4 suggests that targeting the increase of HDBbenefits to the moderate poor pushes the new recipients of the transfer above thepoverty line more easily than when benefits are targeted to the very poor.
6. Conclusions
Ex-ante behavioral simulations are especially well suited for estimating thedistributive effects of behavior-conditioning social reforms not yet implemented.This paper adds to the rare use of such ex-ante simulations of social transferreforms in developing countries. A structural model of labor behavior is con-structed separating decisions regarding formal and informal work, as well asbetween males and females. The model captures all working age householdmembers’ labor decisions and not only child labor. Simulations allow for differentresponses to different policy scenarios of the reform. As a result, the distributiveeffects of a reform can be quantified both in aggregate terms and separatedby direct and indirect impacts. This approach is applied to the repeatedlyannounced—yet not implemented—HDB reform in Ecuador, usually tied to theelimination of gas subsidies. On paper, that kind of reform should shift transfersfrom regressive to progressive (and pro-poor) social schemes. However, the effects
Review of Income and Wealth, Series 53, Number 4, December 2007
© 2007 The AuthorsJournal compilation © International Association for Research in Income and Wealth 2007
667

of such reforms have been shown to be disappointingly small without substantiveimprovements in the targeting of HDB. More interestingly, this study shows thateven with targeting improvements through a means-test instrument, the SelBenindex, the distributive impacts of gas subsidies and HDB reforms may fall short ofexpectations (even though the final objective of the HDB is not to reduce povertyitself).
Behavioral—indirect—effects may work in either the same or the oppositedirection of direct effects, their net effect being an empirical question. In fact, thereis a cumbersome pattern of labor behavioral responses to the simulated socialtransfer reforms. Reactions vary in terms of participation and working hourdecisions. They also vary by informal and formal occupation, and by gender.Despite the complexity of these disaggregated labor effects, these indirect impactsare either insignificant or, if significant, rather small in magnitude. Estimated laboreffects from the reforms could compensate up to 17 percent of their direct effects,although, typically, this compensation did not exceed 7 percent in the threepoverty dimensions. Undesired disincentive labor effects are unlikely to appeareven after radical program reforms.
Simulations show that the SelBen index can be used to dramatically improvethe quality of targeting, that is, the proportion of benefited poor households. Thisis the case when the first quintile of the distribution of the SelBen index is used todiscriminate beneficiaries from non-beneficiaries. However, reforms using SelBenmay lead to rather disappointing poverty reduction results if the increased HDB istargeted exclusively to the extreme poor. In such cases, the use of SelBen is notsufficient to overcome the total increase in poverty that the elimination of gassubsidies initially causes. Poverty reduction is only maximized when the increasedHDB is targeted to households close to the pre-reform poverty line.
Review of Income and Wealth, Series 53, Number 4, December 2007
© 2007 The AuthorsJournal compilation © International Association for Research in Income and Wealth 2007
668

AP
PE
ND
IX1
Alter
na
tiv
eE
stim
ates
of
La
bo
ur
Supply
Mo
del
sin
Ec
ua
do
r
(A1)
Par
tici
pati
onP
robi
tW
itho
utSa
mpl
eSe
lect
ion
Cor
rect
ion
(A2)
Par
tici
pati
onP
robi
tW
ith
Sam
ple
Sele
ctio
nC
orre
cted
Wag
es
(A3)
Par
tici
pati
onM
ulti
nom
ial
Log
itw
ith
Sam
ple
Sele
ctio
nC
orre
cted
Wag
es(N
oP
arti
cipa
tion
asR
efer
ence
)
(A4)
Wor
king
Hou
rsW
itho
utSa
mpl
eSe
lect
ion
Cor
rect
ion
(A5)
Wor
king
Hou
rsW
ith
Sam
ple
Sele
ctio
nC
orre
ctio
n
(A6)
Wor
king
Hou
rsW
ith
Sam
ple
Sele
ctio
nC
orre
ctio
n
Sam
ple
Join
tJo
int
Info
rmal
Lab
orF
orm
alL
abor
Join
tJo
int
Fem
ale
Mal
eP
rim
eag
em
ale,
head
1.97
31.
549
2.53
32.
560
0.13
30.
234
0.16
5(0
.102
)(0
.105
)(0
.293
)(0
.292
)(0
.017
)(0
.021
)(0
.021
)P
rim
eag
efe
mal
e,he
ad0.
775
0.69
50.
393
0.81
40.
006
0.14
50.
266
(0.1
00)
(0.1
02)
(0.2
35)
(0.2
23)
(0.0
40)
(0.0
45)
(0.0
51)
Pri
me
aged
mal
e,no
head
0.90
50.
507
0.91
90.
746
0.06
30.
105
0.07
7(0
.046
)(0
.048
)(0
.121
)(0
.126
)(0
.021
)(0
.022
)(0
.023
)P
rim
eag
edfe
mal
e,no
head
0.11
30.
069
-0.2
53-0
.027
-0.1
11-0
.015
0.06
0(0
.031
)(0
.032
)(0
.066
)(0
.070
)(0
.022
)(0
.027
)(0
.033
)H
ouse
hold
size
0.02
10.
016
0.01
1-0
.017
0.01
40.
014
0.00
80.
014
(0.0
06)
(0.0
05)
(0.0
12)
(0.0
14)
(0.0
03)
(0.0
03)
(0.0
06)
(0.0
04)
Dum
my
for
Qui
to-0
.333
-0.7
50-1
.482
-0.5
70-0
.175
-0.0
180.
009
0.01
2(0
.050
)(0
.055
)(0
.122
)(0
.126
)(0
.026
)(0
.031
)(0
.051
)(0
.036
)D
umm
yfo
rG
uaya
quil
0.09
8-0
.072
-0.2
930.
119
-0.0
260.
065
0.25
0-0
.009
(0.0
41)
(0.0
42)
(0.0
91)
(0.0
98)
(0.0
24)
(0.0
28)
(0.0
57)
(0.0
29)
Dum
my
for
othe
rci
ties
0.05
60.
011
-0.1
810.
206
-0.0
37-0
.040
-0.0
14-0
.039
(0.0
35)
(0.0
36)
(0.0
78)
(0.0
86)
(0.0
17)
(0.0
18)
(0.0
36)
(0.0
21)
Dum
my
for
Coa
st-0
.418
-0.4
75-0
.824
-0.4
93-0
.192
-0.1
87-0
.419
-0.0
46(0
.034
)(0
.036
)(0
.078
)(0
.086
)(0
.017
)(0
.019
)(0
.037
)(0
.020
)L
ogsa
mpl
eco
rrec
ted
wag
e0.
497
0.35
70.
873
0.00
70.
071
-0.0
88(0
.023
)(0
.051
)(0
.056
)(0
.018
)(0
.033
)(0
.021
)L
ogsa
mpl
ew
age
0.22
2(0
.009
)E
duca
tion
0.00
003
(0.0
03)
Hou
seho
ldga
ssu
bsid
ies
-0.1
23-1
.863
-4.0
11-0
.308
-0.0
35-0
.092
-0.0
07-0
.023
(0.0
28)
(0.1
95)
(0.4
23)
(0.4
55)
(0.0
14)
(0.1
09)
(0.1
93)
(0.1
27)
App
endi
x1
cont
inue
don
next
page
Review of Income and Wealth, Series 53, Number 4, December 2007
© 2007 The AuthorsJournal compilation © International Association for Research in Income and Wealth 2007
669

AP
PE
ND
IX1
(con
tinu
ed)
(A1)
Par
tici
pati
onP
robi
tW
itho
utSa
mpl
eSe
lect
ion
Cor
rect
ion
(A2)
Par
tici
pati
onP
robi
tW
ith
Sam
ple
Sele
ctio
nC
orre
cted
Wag
es
(A3)
Par
tici
pati
onM
ulti
nom
ial
Log
itw
ith
Sam
ple
Sele
ctio
nC
orre
cted
Wag
es(N
oP
arti
cipa
tion
asR
efer
ence
)
(A4)
Wor
king
Hou
rsW
itho
utSa
mpl
eSe
lect
ion
Cor
rect
ion
(A5)
Wor
king
Hou
rsW
ith
Sam
ple
Sele
ctio
nC
orre
ctio
n
(A6)
Wor
king
Hou
rsW
ith
Sam
ple
Sele
ctio
nC
orre
ctio
n
Hou
seho
ldH
DB
,m
othe
rs0.
651
0.86
31.
168
-0.6
850.
034
-0.4
60-0
.899
-0.0
72(0
.192
)(0
.195
)(0
.418
)(0
.473
)(0
.105
)(0
.115
)(0
.212
)(0
.119
)H
ouse
hold
HD
B,
elde
r-0
.635
0.90
22.
034
-1.2
40-0
.140
-0.7
06-0
.471
-1.0
76(0
.565
)(0
.589
)(1
.236
)(1
.437
)(0
.352
)(0
.358
)(0
.542
)(0
.464
)H
ouse
hold
othe
rtr
ansf
ers
-0.0
08-0
.014
-0.0
67-0
.044
-0.0
01-0
.000
30.
025
-0.0
08(0
.013
9)(0
.013
)(0
.032
)(0
.034
)(0
.010
)(0
.007
)(0
.015
)(0
.007
)D
umm
yfo
rin
form
al-0
.041
0.00
6-0
.078
(0.0
17)
(0.0
30)
(0.0
19)
Mill
sR
atio
-0.4
37-0
.148
-0.7
35(0
.037
)(0
.055
)(0
.057
)C
onst
ant
0.60
9-5
.487
-2.9
04-1
0.76
02.
154
5.14
84.
044
6.52
4(0
.049
)(0
.294
)(0
.631
)(0
.721
)(0
.121
)(0
.254
)(0
.441
)(0
.292
)
N.O
bser
v.17
,071
17,0
7111
,895
9,68
712
,272
5,19
17,
081
Wal
dc2
887.
521,
174.
971,
194.
49F
(r,n
)74
.81
67.4
818
.11
27.5
9R
20.
1252
0.15
650.
0887
0.23
670.
1109
0.07
250.
0911
Log
.P-l
ikel
ihoo
d-8
,075
.04
-7,7
86.7
2-1
1,43
6.99
Hau
sman
Spec
ifica
tion
Tes
tH
0:di
ffer
ence
betw
een
prob
itan
dlo
git
not
syst
emat
icH
0:di
ffer
ence
inco
effic
ient
sno
tsy
stem
atic
byge
nder
c2 (14)
=21
.73;
P>
c2=
0.08
4c2 (1
2)=
259.
32;P
>c2
=0.
0H
0is
acce
pted
,Ind
epen
denc
eof
irre
leva
ntal
tern
ativ
esac
cept
ed.
H0
reje
cted
,gen
der
spec
ifica
tion
sac
cept
ed
Sou
rce:
Aut
hors
’est
imat
esus
ing
EC
V19
99(I
NE
C,1
999)
.
Review of Income and Wealth, Series 53, Number 4, December 2007
© 2007 The AuthorsJournal compilation © International Association for Research in Income and Wealth 2007
670

References
Ashenfelter, Orley and James J. Heckman, “The Estimation of Incomes and Substitution Effects in aModel of Family Labor Supply,” Econometrica, 42(1), 73–85, 1974.
Attanasio, Orazio, Emla Fitzsimons, Ana Gomez, Diana Lopez, Costas Mehir, and Alice Mesnard,“Child Education and Work Choices in the Presence of Conditional Cash Transfer Programme inRural Colombia,” The Institute of Fiscal Studies, Working Paper 06/01, 2006.
Becker, Gary, “A Theory of Allocation of Time,” Economic Journal, 75, 493–517, 1965.Bourguignon, François and Francisco H. G. Ferreira, “Ex Ante Evaluations of Policy Reforms Using
Behavioral Models,” in François Bourguignon and L. A. Pereira Da Silva (eds), The Impact ofEconomic Policies on Poverty and Income Distribution. Evaluation Techniques and Tools, OxfordUniversity Press, New York, 123–43, 2003.
Bourguignon, François and Amadeo Spadaro, “Microsimulation as a Tool for Evaluating Redistri-bution Policies,” Journal of Economic Inequality, 4, 77–116, 2006.
Bourguignon, François, Francisco H. G. Ferreira, and Phillippe G. Leite, “Conditional Cash Trans-fers, Schooling, and Child Labor: Micro-Simulating Brazil’s Bolsa Escola Program,” The WorldBank Economic Review, 17(2), 229–54, 2003.
CEPAL (Comisión Económica Para América Latina y el Caribe), Anuario Estadístico de AméricaLatina y el Caribe 2003, CEPAL, Santiago de Chile, 2004.
Chiappori, Pierre-Andre, “Collective Labour Supply and Welfare,” Journal of Political Economy,100(3), 437–67, 1992.
———, “Rational Household Labor Supply,” Econometrica, 56(1), 63–89, 1988.Coady, David and Emmanuel Skoufias, “On the Targeting and Redistributive Efficiencies of Alterna-
tive Transfer Instruments,” The Review of Income and Wealth, 50, 11–27, March 2004.Coady, David, Margaret Grosh, and John Hoddinott, “Targeting Outcomes Redux,” World Bank
Research Observer, 19(1), 61–85, 2004.Cogneau, David and Michael Grimm, “AIDS and Income Distribution in Africa. A Micro-Simulation
Study for Côre d’Ivoire,” Developpement et Insertion Internationale DIAL, Document de TravailDT/2002/15, 2004.
Cogneau, David, Michael Grimm, and Anne-Sophie Robilliard, “Evaluating Poverty Reduction Poli-cies. The Contribution of Micro-Simulations Techniques,” in Jean-Pierre Cling, Mireille Razafin-drakoto, and François Roubaud (eds), New International Poverty Reduction Strategies, Routledge,London, 340–70, 2003.
Creedy, John and Alan Duncan, “Behavioral Micro-Simulations with Labor Supply Responses,”Journal of Economic Surveys, 16(1), 1–39, 2002.
Cuesta, José, “The Distributive Consequences of Machismo: A Simulation Analysis of Intra-Household Discrimination,” Journal of International Development, 18, 1065–80, 2006.
Cuesta, José, Mauricio León, and Juan Ponce, “Efectos Indirectos del Gasto Social Fiscal en laGeneración de Ingresos en el Ecuador,” in Rob Vos (ed.), Efectos del Gasto Social en la Generaciónde Ingresos del Ecuador, Frente Social, Quito, 71–88, 2003.
Cuesta, José, Juan Ponce, and Mauricio León, “Simulating Progressive Social Transfers: Gas Subsidiesand Solidarity Bonds in Ecuador,” Institute of Social Studies, Working Paper Series 393,2004.
Das, Jishnu, Quy-Toan Do, and Berk Özler, “Reassesing Conditonal Cash Transfer Programs,” TheWorld Bank Research Observer, 20(1), 57–80, 2005.
Duryea, Susan and Andrew Morrison, “The Effect of Conditional Cash Transfers on School Perfor-mance and Child Labor: Evidence from an Ex-post Evaluation in Costa Rica,” Inter-AmericanDevelopment Bank, Research Department Working Paper 505, 2004.
Falconí, Fender, “La Desmaterialización de la Economía,” Centro Andino de Accción Popular,Ecuador Debate No. 55, 2002.
FEDEMA (Fundación Ecuatoriana para Estudios Energéticos y de Medio Ambiente), “Ecuador.Country Study Series,” in UNEP-Risø National Laboratory, Economics of Greenhouse Gas Limi-tations, Roskilde, Copenhagen, 1–127, 1999.
González, Mary-Lisbeth and José Cuesta, “The Possible Privatization of Electricity Distribution inHonduras,” Department For International Development, Poverty and Social Impact AnalysisSeries No. 2, 2003.
Heckman, James J., “What Has Been Learned about Labor Supply in the Past Twenty Years?”American Economic Review, 83(2), 116–21, 1993.
———, “Sample Selection Bias As a Specification Error,” Econometrica, 47(1), 153–62, 1979.Hoddinot, John, Emmanuel Skoufias, and Ryan Washburn, “The Impact of Progresa on
Consumption: A Final Report,” International Food Policy Research Institute, IFPRI,Washington, 2000.
Review of Income and Wealth, Series 53, Number 4, December 2007
© 2007 The AuthorsJournal compilation © International Association for Research in Income and Wealth 2007
671

IFPRI (International Food Policy Research Institute) “Informe Final—Sistema de Evaluación de laFase Piloto de la Red de Protección Social de Nicaragua: Evaluación de Impacto,” IFPRI,Washington, 2002.
INEC (Instituto Nacional Estadísticas y Censos), Encuestas de Condiciones de Vida, 1999, República deEcuador, Quito, 1999.
Jalan, Jyotsna and Martin Ravallion, “Estimating the Benefit Incidence of an Antipoverty Program byPropensity Score Matching,” Journal of Business and Economic Statistics, 21(1), 19–30, 2003.
Jejeebhoy, Shireen J., Women’s Education, Autonomy and Reproductive Behavior: Experience fromDeveloping Countries, Clarendon Press, Oxford, 1995.
Keener, Sarah and Sudeshna G. Banerjee, “Ghana: Electricity Tariff Reform,” in Aline Coudouel, AnisDani, and Stefano Paternostro (eds), Poverty and Social Impact Analysis of Reforms. Lessons andExamples from Implementation, The World Bank, Washington, 257–92, 2006.
Killingsworth, Mark, Labour Supply, Cambridge University Press, Cambridge, 1983.Killingsworth, Mark and James. J. Heckman, “Female Labor Supply: A Survey,” in Orley Ashenfelter
and Richard Layard (eds), Handbook of Labour Economics, North-Holland, New York, 1, 103–204, 1986.
Lanjow, Peter and Martin Ravallion, “Benefit Incidence, Public Expenditure Reforms and the Timingof Program Capture,” World Bank Economic Review, 13(2), 257–74, 1999.
León, Mauricio, Rob Vos, and Wladymir Brborich, Son Eefectivos los Programas de TransferenciasMonetarias para Combatir la Pobreza?, Frente Social, Quito, 2001.
Licona, Gonzalo, “Oferta Laboral Familiar y Desempleo en México. Los Efectos de la Pobreza,” ElTrimestre Económico, 64(4), 531–68, 1997.
MacIsaac, Donna and Martin Rama, “Determinants of Hourly Earnings in Ecuador: The Role ofLabour Market Regulations,” Journal of Labor Economics, Part 2, 15(3), S136–65, July 1997.
Maloney, William and Jairo Núnez, “Measuring the Impact of Minimum Wages: Evidence from LatinAmerica,” National Bureau of Economic Research, Working Paper 9800, 2003.
Morley, Samuel and David Coady, From Social Assistance to Social Development: Targeted EducationSubsidies in Developing Countries, Center for Global Development, Washington, 2003.
Mroz, Thomas A., “The Sensitivity of an Empirical Model of Married Women’s Hours of Work toEconomic and Statistical Assumptions,” Econometrica, 55(4), 765–99, 1987.
Pahl, Jan, Money and Marriage, Macmillan, London, 1989.Parker, Susan and Emmanuel Skoufias, “Final Report: The Impact of PROGRESA on Work, Leisure
and Time Allocation,” International Food Policy Research Institute, Washington, 2000.Pencavel, John, “Labour Supply of Men: A Survey,” in Orley Ashenfelter and Richard Layard (eds),
Handbook of Labor Economics, North-Holland, New York, 1, 3–102, 1986.Rawlings, Laura and Gloria Rubio, “Evaluating the Impact of Conditional Cash Transfer Programs.
Lessons from Latin America,” World Bank, World Bank Policy Research Working Paper 3119,2003.
Schady, Norbert and Maria C. Araujo, “Cash Transfers, Conditions, School Enrollment, and ChildWork: Evidence from a Randomized Experiment in Ecuador,” World Bank, World Bank PolicyResearch Working Paper 3930, 2006.
Schultz, Paul, “School Subsidies for the Poor: Evaluating the Mexican Progresa Poverty Program,”Journal of Development Economics, 74(1), 199–250, 2004.
SIISE (Sistema Integrado de Indicadores Sociales del Ecuador), SelBen: Metodología de Construccióndel Índice de Bienestar para Potenciales Beneficiarios de Programas Sociales, Frente Social, Quito,2000.
van de Walle, Dominique, “Introduction,” in Dominique van de Walle and Kimberly Nead (eds),Public Spending and the Poor, The Johns Hopkins University Press, Baltimore, 1–6, 1995.
———, “The Static and Dynamic Incidence of Viet Nam’s Public Safety Net,” World Bank, WorldBank Policy Research Working Paper 2791, 2002.
———, “Behavioral Incidente Analysis of Public Spending and Social Programs,” in François Bour-guignon and Luiz A. Pereira Da Silva (eds), The Impact of Economic Policies on Poverty andIncome Distribution. Evaluation Techniques and Tools, Oxford University Press, New York, 69–84,2003.
Vos, Rob, Margarita Velasco, and Edgar Labastida, “Los Efectos Económicos y Sociales de El Niño,1997–1998,” in Enrico Gasparri, Carlo Tassara, and Margarita Velasco (eds), El Fenómeno de ElNiño en el Ecuador 1997–1999. Del Desastre a la Prevención, Frente Social, Quito, 2000.
Vos, Rob, Mauricio León, Juan Ponce, José Cuesta, and Wladymir Brborich, “Quién Se Beneficia delGasto Social en Ecuador?” in Rob Vos (ed.), Efectos del Gasto Social en la Generación de Ingresosdel Ecuador, Frente Social, Quito, 47–70, 2003.
Review of Income and Wealth, Series 53, Number 4, December 2007
© 2007 The AuthorsJournal compilation © International Association for Research in Income and Wealth 2007
672