Imaging the electrostatic potential of transmembrane channels: atomic probe microscopy of OmpF porin
10
Imaging the Electrostatic Potential of Transmembrane Channels: Atomic Probe Microscopy of OmpF Porin Ansgar Philippsen,* Wonpil Im, † Andreas Engel, ‡ Tilman Schirmer,* Benoit Roux, † and Daniel J. Mu ¨ ller § *Structural Biology, Biozentrum, University of Basel, CH-4056 Basel, Switzerland; † Department of Biochemistry, Weill Medical College, Cornell University, New York, New York 10021 USA; ‡ M. E. Mu ¨ ller Institute, Biozentrum, University of Basel, CH-4056 Basel, Switzerland; and § Max-Planck-Institute of Molecular Cell Biology and Genetics, D-01307 Dresden, Germany ABSTRACT The atomic force microscope (AFM) was used to image native OmpF porin and to detect the electrostatic potential generated by the protein. To this end the OmpF porin trimers from Escherichia coli was reproducibly imaged at a lateral resolution of 0.5 nm and a vertical resolution of 0.1 nm at variable electrolyte concentrations of the buffer solution. At low electrolyte concentrations the charged AFM probe not only contoured structural details of the membrane protein surface but also interacted with local electrostatic potentials. Differences measured between topographs recorded at variable ionic strength allowed mapping of the electrostatic potential of OmpF porin. The potential map acquired by AFM showed qualitative agreement with continuum electrostatic calculations based on the atomic OmpF porin embedded in a lipid bilayer at the same electrolyte concentrations. Numerical simulations of the experimental conditions showed the measurements to be reproduced quantitatively when the AFM probe was included in the calculations. This method opens a novel avenue to determine the electrostatic potential of native protein surfaces at a lateral resolution better than 1 nm and a vertical resolution of 0.1 nm. INTRODUCTION Local electrostatic properties play a central role in a variety of biological processes. A detailed characterization of the structure and function of biological systems requires an understanding of the strength and location of their electro- static interactions (Honig and Nicholls, 1995; McLaughlin, 1989; Nakamara, 1996; Sharp and Honig, 1990). Trans- membrane channels require ion selectivity to maintain the electrostatic gradient across a cell membrane. Theoretical calculations predicted (Im et al., 2000; Roux and MacKin- non, 1999) that this selectivity is likely to involve electro- static potentials established within the protein structure (Roux et al., 2000; Schirmer and Phale, 1999). However, direct measurements of the electrostatic properties of pro- teins at a sufficient spatial resolution allowing the compar- ison with theoretical calculations have not been available yet. The atomic force microscope (AFM) (Binnig et al., 1986) allows surfaces of biological samples to be imaged in liq- uids (Drake et al., 1989). As demonstrated on various native protein assemblies, the resolution of AFM topographs can be better than 1 nm enabling substructures of individual proteins to be identified (Czajkowsky et al., 1999; Engel and Mu ¨ller, 2000). Because single proteins can exhibit individual structural deviations, common structural features among similar proteins are obtained by averaging tech- niques (Mu ¨ller et al., 1998; Schabert and Engel, 1994). Standard deviation (SD) maps of averaged topographs show enhanced values at variable protein domains, allowing their identification. The conformations of such variable substruc- tures can be further unraveled by the classification of AFM topographs (Engel and Mu ¨ller, 2000; Mu ¨ller et al., 1998). The AFM probe can also be used as a sensor to probe charges of biological surfaces immersed in buffer solution (Butt et al., 1995). Here, the electrostatic double-layer (EDL) force (Israelachvili, 1991) interacting between the charged probe and charged regions of the biological sample can contribute significantly to the AFM topograph recorded (Mu ¨ ller and Engel, 1997; Rotsch and Radmacher, 1997) and can be tuned by the electrolyte concentration and the pH of the buffer solution. The DLVO theory describes the expo- nential decay of the EDL force as a function of the surface separation (Israelachvili, 1991). Whereas AFM probes have been used to measure the average surface charges from force-separation curves (Butt, 1991; Ducker et al., 1991), surface charge maps have been obtained at 40-nm lateral resolution by recording force-separation curves at each pixel of the sampled surface (Heinz and Hoh, 1999; Rotsch and Radmacher, 1997). In this work we used AFM to image transmembrane channels of native proteins and to map their electrostatic potential. To this end, high-resolution AFM topographs of OmpF porin were recorded under variable electrostatic con- ditions, and the electrostatic potential of the protein channel was decomposed by subtracting topographs recorded at different electrostatic contributions. As an example we have chosen the transmembrane channel-forming protein OmpF porin located in the outer membrane of Escherichia coli. OmpF porin exists as stable trimeric structures, and the 340-amino acids-long polypeptide of the OmpF monomer is Submitted September 14, 2001, and accepted for publication November 14, 2001. Address reprint requests to Daniel J. Mu ¨ller, PhD, Max-Planck-Institute of Molecular Cell Biology and Genetics, Pfotenhauerstr. 108, D-01307 Dresden, Germany. Tel.: 49-351-210-2586; Fax: 49-351-210-2020; E- mail: [email protected]. © 2002 by the Biophysical Society 0006-3495/02/03/1667/10 $2.00 1667 Biophysical Journal Volume 82 March 2002 1667–1676
-
Upload
independent -
Category
Documents
-
view
0 -
download
0
Transcript of Imaging the electrostatic potential of transmembrane channels: atomic probe microscopy of OmpF porin

Imaging the Electrostatic Potential of Transmembrane Channels: AtomicProbe Microscopy of OmpF Porin
Ansgar Philippsen,* Wonpil Im,† Andreas Engel,‡ Tilman Schirmer,* Benoit Roux,† and Daniel J. Muller§
*Structural Biology, Biozentrum, University of Basel, CH-4056 Basel, Switzerland; †Department of Biochemistry, Weill Medical College,Cornell University, New York, New York 10021 USA; ‡M. E. Muller Institute, Biozentrum, University of Basel, CH-4056 Basel, Switzerland;and §Max-Planck-Institute of Molecular Cell Biology and Genetics, D-01307 Dresden, Germany
ABSTRACT The atomic force microscope (AFM) was used to image native OmpF porin and to detect the electrostaticpotential generated by the protein. To this end the OmpF porin trimers from Escherichia coli was reproducibly imaged at alateral resolution of �0.5 nm and a vertical resolution of �0.1 nm at variable electrolyte concentrations of the buffer solution.At low electrolyte concentrations the charged AFM probe not only contoured structural details of the membrane proteinsurface but also interacted with local electrostatic potentials. Differences measured between topographs recorded at variableionic strength allowed mapping of the electrostatic potential of OmpF porin. The potential map acquired by AFM showedqualitative agreement with continuum electrostatic calculations based on the atomic OmpF porin embedded in a lipid bilayerat the same electrolyte concentrations. Numerical simulations of the experimental conditions showed the measurements tobe reproduced quantitatively when the AFM probe was included in the calculations. This method opens a novel avenue todetermine the electrostatic potential of native protein surfaces at a lateral resolution better than 1 nm and a vertical resolutionof �0.1 nm.
INTRODUCTION
Local electrostatic properties play a central role in a varietyof biological processes. A detailed characterization of thestructure and function of biological systems requires anunderstanding of the strength and location of their electro-static interactions (Honig and Nicholls, 1995; McLaughlin,1989; Nakamara, 1996; Sharp and Honig, 1990). Trans-membrane channels require ion selectivity to maintain theelectrostatic gradient across a cell membrane. Theoreticalcalculations predicted (Im et al., 2000; Roux and MacKin-non, 1999) that this selectivity is likely to involve electro-static potentials established within the protein structure(Roux et al., 2000; Schirmer and Phale, 1999). However,direct measurements of the electrostatic properties of pro-teins at a sufficient spatial resolution allowing the compar-ison with theoretical calculations have not been availableyet.
The atomic force microscope (AFM) (Binnig et al., 1986)allows surfaces of biological samples to be imaged in liq-uids (Drake et al., 1989). As demonstrated on various nativeprotein assemblies, the resolution of AFM topographs canbe better than 1 nm enabling substructures of individualproteins to be identified (Czajkowsky et al., 1999; Engeland Muller, 2000). Because single proteins can exhibitindividual structural deviations, common structural featuresamong similar proteins are obtained by averaging tech-
niques (Muller et al., 1998; Schabert and Engel, 1994).Standard deviation (SD) maps of averaged topographs showenhanced values at variable protein domains, allowing theiridentification. The conformations of such variable substruc-tures can be further unraveled by the classification of AFMtopographs (Engel and Muller, 2000; Muller et al., 1998).
The AFM probe can also be used as a sensor to probecharges of biological surfaces immersed in buffer solution(Butt et al., 1995). Here, the electrostatic double-layer(EDL) force (Israelachvili, 1991) interacting between thecharged probe and charged regions of the biological samplecan contribute significantly to the AFM topograph recorded(Muller and Engel, 1997; Rotsch and Radmacher, 1997) andcan be tuned by the electrolyte concentration and the pH ofthe buffer solution. The DLVO theory describes the expo-nential decay of the EDL force as a function of the surfaceseparation (Israelachvili, 1991). Whereas AFM probes havebeen used to measure the average surface charges fromforce-separation curves (Butt, 1991; Ducker et al., 1991),surface charge maps have been obtained at 40-nm lateralresolution by recording force-separation curves at eachpixel of the sampled surface (Heinz and Hoh, 1999; Rotschand Radmacher, 1997).
In this work we used AFM to image transmembranechannels of native proteins and to map their electrostaticpotential. To this end, high-resolution AFM topographs ofOmpF porin were recorded under variable electrostatic con-ditions, and the electrostatic potential of the protein channelwas decomposed by subtracting topographs recorded atdifferent electrostatic contributions. As an example we havechosen the transmembrane channel-forming protein OmpFporin located in the outer membrane of Escherichia coli.OmpF porin exists as stable trimeric structures, and the340-amino acids-long polypeptide of the OmpF monomer is
Submitted September 14, 2001, and accepted for publication November 14,2001.
Address reprint requests to Daniel J. Muller, PhD, Max-Planck-Institute ofMolecular Cell Biology and Genetics, Pfotenhauerstr. 108, D-01307Dresden, Germany. Tel.: 49-351-210-2586; Fax: 49-351-210-2020; E-mail: [email protected].
© 2002 by the Biophysical Society
0006-3495/02/03/1667/10 $2.00
1667Biophysical Journal Volume 82 March 2002 1667–1676

folded into 16 antiparallel �-strands that form a large hol-low transmembrane �-barrel structure (Cowan et al., 1992).An infolding loop forms the eyelet of each barrel constrict-ing the passage of ions and of hydrophilic solutes up to anexclusion size of �600 kDa (Nikaido and Saier, 1992;Schirmer, 1998). Translocation rate of the pore and soluteconcentration gradient across the membrane show a linearrelation. The ion selectivity of the pore, however, increaseswith decreasing electrolyte concentration (Schirmer andPhale, 1999). This selectivity is altered by modification ofthe charged amino acids of the pore lining (Saint et al.,1996a), which are thought to produce a characteristic elec-tric field at the pore constriction (Cowan et al., 1992; Weisset al., 1991). Hence, it has been suggested that the chargesof the porin constriction primarily modulate the pore selec-tivity (Klebba and Newton, 1998; Schirmer, 1998). How-ever, the electrostatic potential at the entrance of the OmpFporin channel was not explored in these calculations.
MATERIALS AND METHODS
Sample preparation
OmpF porin trimers from E. coli strain BZ1110/PMY222 (Hoenger et al.,1993) were purified and reconstituted in presence of dimyristoyl phosphati-dylcholine and lipopolysaccharides as described (Hoenger et al., 1990).The protein crystals were adsorbed to freshly cleaved mica (Muller et al.,1997), and the sample was mounted on the piezoelectric scanner of theAFM (Nanoscope III, Digital Instruments, Santa Barbara, CA) equippedwith a liquid cell. Cantilevers used had nominal force constants of 0.09 or0.02 N/m and oxide-sharpened Si3N4 probes (Olympus Ltd., Tokyo, Ja-pan). The piezoelectric scanner of the AFM (scan range of 100 � 100 �m2)was calibrated (Muller and Engel, 1997).
AFM imaging
All topographs were recorded using the constant force mode as described(Muller et al., 1999). We investigated only double-layered OmpF porinmembranes, facing both extracellular surfaces toward each other. Thus, theperiplasmic porin surface imaged by AFM was separated to the supportingmica surface by an intermediate porin layer (Schabert et al., 1995). Thesesandwiched protein layers minimized possible electrostatic influences ofthe support. It may be considered that the surface charge density of mica(�0.0025 C/m2) (Pashley, 1981) is �24 times smaller than that detected onthe periplasmic porin surface (�0.06 C/m2) (Muller and Engel, 1997).
At KCl concentrations �300 mM EDL forces (Israelachvili, 1991)contribute to repulsive interactions between Si3N4 probe and periplasmicOmpF porin surface (Muller and Engel, 1997; Muller et al., 1999). De-creasing of the electrolyte concentration resulted in an increased EDLrepulsion (Muller and Engel, 1997). In this case, submolecular resolutionwas only obtained after enhancing the applied force carefully until proteinsubstructures became visible. Because of the EDL interaction compensatedmost of the applied force, the net force interacting between AFM probe andprotein was equal to the net force when imaged at 300 mM KCl. A criterionfor the minimization of the net force was the protein structure, which wasnot deformed by the imaging process. In summary, all topographs wererecorded at applied forces slightly above (�F � 25 pN) those of the EDLrepulsion. Fine-tuning of the applied force was adjusted comparing theheight profiles acquired simultaneously in trace and retrace direction untilthe deformation of the sample (Weisenhorn et al., 1993) disappeared.
Image processing of the raw data was done as previously described (Mulleret al., 1998; Schabert and Engel, 1994).
Theoretical considerations
In the constant force mode, the AFM measured displacements represent therelative position of the probe at which the applied external force Fext isexactly counterbalanced by �Fmol�, the time-averaged microscopic molec-ular forces acting between probe and OmpF, i.e., the displacement of theprobe corresponds to the condition Fext � �Fmol�. It can be shown that�Fmol� can be expressed as the derivative of a reversible work functionG(Rtip) (Kirkwood 1934)
�Fmol� � ��G�Rip
�Ztip
in which Ztip is the direction perpendicular to the membrane plane. In fact,G(Rtip) corresponds to the free energy of the system with the probe at afixed position Rtip, relative to OmpF porin. This free energy, whichincludes contributions from the influence of the aqueous solvent and theelectric double layer from the electrolyte, as well as various nonpolarinteractions, can be written as (Roux and Simonson, 1999)
G�Rtip � Gnp�Rtip � Gelec�Rtip
Because we are mostly concerned with the dependence of the long-rangeelectrostatic contribution, Gelec, upon variations of the salt concentration,the nonpolar contribution, Gnp, which is expected to be short-range, will beignored in the following. Assuming that the solvent and electrolyte aredescribed according to macroscopic continuum electrostatics, Gelec is givenby (Madura et al., 1995; Roux and Simonson, 1999)
Gelec �1
2 �i
qi��i
in which qi is the charge of the i-th atom in the system, and �(i) is theelectrostatic potential at the position of the i-th atom in the system calcu-lated from the Poisson-Boltzmann (PB) equation (Im and Roux, 1998;Madura et al., 1995)
� ��r��r � 2�r��r � 4���r
in which (r) is the space-dependent dielectric constant, 2(r) is theDebye-Huckel ionic screening factor, and �(r) is the charge density of themolecular species being considered. All atomic details about OmpF and theAFM probe can be incorporated in the PB equation via the space-depen-dent functions (r), 2(r), and �(r).
If it is assumed that the probe interior is exactly the same as thesurrounding solution in terms of a dielectric constant and salt concentration(Approach A), the electrostatic forces are given by F � qE in which Erepresents the electrostatic field generated by OmpF. In a realistic treat-ment of the physical probe (Approach B), other contributions to the forcearising from the low dielectric constant of the probe have to be included.
Electrostatic potential calculation
The electrostatic calculations are based on the atomic structure of OmpF(2OMF) (Cowan et al., 1992). The atomic coordinates were transformedsuch that the molecular threefold axis of the central trimer coincided withthe z axis (with positive z toward the periplasmic side) and the center of themolecule was at the origin. The protein charges were set according to theCHARMM parameter set (MacKerell et al., 1998), with the net charges ofE296 and D312 set to zero according to theoretical pKa calculations(Karshikoff et al., 1994). However, the three arginines in the cluster R42,R82, and R132 were treated charged as discussed before (Schirmer and
1668 Philippsen et al.
Biophysical Journal 82(3) 1667–1676

Phale, 1999). The bulk solution and the membrane were approximated ascontinuous media (for details see below). Optimized Born radii for proteinswere used to setup the solvent-protein dielectric boundary (Nina et al.,1997). A Debye-Huckel screening factor corresponding to 300, 100, or 50mM salt concentrations was assigned to the ion-accessible region.
Approach A
Seven OmpF trimers were embedded into a membrane bilayer and ar-ranged according to the rectangular lattice (P2, a � 7.6 nm, b � 13.5 nm)of the two-dimensional OmpF crystals investigated experimentally. Thesidechains of K10, E183, and K305 at the periplasmic side are not definedin the x-ray structure (see also Fig. 2). These residues were structurallyincluded as follows: All stereochemically accessible side-chain conforma-tions were generated by systematic variation of their side-chain dihedrals.From this ensemble, the mean position of the side-chain amino group or thetwo carboxyl oxygens were determined. The three residues were truncatedto alanine, and a point charge was placed at the appropriate mean position.
The linearized PB equation was solved using UHBD (Madura et al.,1995) on a 281 � 281 � 101 grid with a 0.1-nm grid spacing. Externallygenerated dielectric constant (epsilon) grids were used: An epsilon of 4 wasassigned to grid positions within the protein (distance of the nearest proteinatom � (protein atom radius � 0.15 nm)/2). The membrane was modeledby assigning � 40 to the presumed position of the lipid head-groups(�1.4 nm � z � �0.4 nm and 1.4 nm � z � 1.9 nm) and an � 2 to themembrane core. The dielectric constant of the transmembrane pore and ofthe surrounding aqueous solution was set to 80. From the calculatedelectrostatic potential, the force at each grid point was simply calculatedfollowing F � qE in which E represents the derivative of the electrostaticpotential taken numerically.
The program used to generate the external epsilon grid was developedby A.P. and is available upon request. Data interpretation and visualization(see Figs. 2, 4, and 5) were done using DINO (http://www.dino3d.org).Molecular surfaces were calculated with MSMS (Sanner et al., 1996).
Approach B
The AFM probe was modeled as a sphere of 1-nm radius, whereas theOmpF trimer was represented with all atomic details. A single OmpFtrimer with its symmetry axis oriented along the z axis was embedded in a3.4-nm-thick ion-impermeable planar membrane. A dielectric constant of80 was assumed for the bulk solvent region including the aqueous poreregion of OmpF, whereas a dielectric constant of 2 was used for the interiorof the protein and membrane regions as well as the interior of the AFMprobe. An ion exclusion Stern layer of 0.18 nm was used to set the spatialdependence of the ionic screening factor. For each position of the probe,the electrostatic energy was first calculated by solving the PB equationwith a coarse grid (101 � 101 � 181 grid with a spacing of 0.1 nm)centered on the OmpF trimer. Periodic boundary conditions were imposedin the direction of the membrane plane. The result of the coarse calculationwas then used to set the boundary conditions on the edge of a smaller boxto perform a second calculation using a finer grid (with a spacing of 0.05nm) centered on the periplasmic side of OmpF. Finally, the electrostaticforces were calculated by taking the first derivatives of Gelec numerically.All calculations were performed using the PBEQ module in CHARMM.
RESULTS
AFM topographs recorded at differentelectrolyte concentrations
In previous studies of two-dimensional OmpF porin crystalswe have optimized the conditions to image the porin sur-
faces at subnanometer resolution by AFM (Muller et al.,1999). Topographs of the periplasmic OmpF porin surfacerecorded in 300 mM KCl, pH 7.8, 10 mM Tris-HCl revealedtrimeric domains that protruded by 0.6 0.1 nm (n � 92)from the lipid bilayer surface (Fig. 1 A). At a force of �25pN applied between AFM probe and protein (see Materialsand Methods) each trimer compromises a tripartite protru-sion and three transmembrane channels that are separatedby 1.2-nm-thick walls. The outlined circle and ellipse sur-round individual polypeptide loops between 2 and 5 aminoacids size, each loop connecting two antiparallel �-strandslining the transmembrane pore. Correlation averaging of theporin trimer enhanced common structural details amongindividual trimers (Fig. 1 B) but blurred variable areas oftheir subdomains (compare with trimers shown in raw data,Fig. 1 A). Nevertheless, the characteristic shape of theaveraged transmembrane channel appeared more pro-nounced showing an elliptical cross-section of a � 3.4 nmand b � 2.0 nm. Comparison with the SD map (Fig. 1 C)allows direct assignment of variable structural regions of thenative protein (Fig. 1 D) (Muller et al., 1998).
Fig. 1, E and H show the periplasmic surface of the sameOmpF crystal as imaged in Fig. 1 A but recorded after theelectrolyte concentration of the buffer solution (pH 7.8, 10mM Tris-HCl) has been decreased from 300 to 100 mMKCl (Fig. 1 E) and to 50 mM KCl (Fig. 1 H). Similar to thetopograph recorded under 300 mM KCl (Fig. 1 A) thetripartite protrusions surrounding the trimeric center wereclearly visible and extended by 0.6 0.1 nm from thebilayer surface. Again, correlation averaging enhanced thecommon structural details of the trimers (Fig. 1, F and I)and the SD maps (Fig. 1, G and J) allowed structural areasof enhanced variability to be assigned. As expected, thestructural variability of OmpF remained mainly unaffectedby the electrolyte concentrations (Fig. 1, C, G, and J).
Comparison of AFM topographs andatomic structure
As visible from the topographs (Fig. 1), single OmpF porinswere imaged at a sufficient resolution to visualize shortpolypeptide �-turns connecting transmembrane �-strands.To reveal the accuracy of the porin trimer recorded at 300mM KCl, we superimposed its correlation average and SDmap with the atomic porin model in three dimensions (Fig.2). The AFM topography shows excellent agreement tostructural data from x-ray crystallography (Schabert et al.,1995). Interestingly, the SD map of the porin surface (blueshaded in lower right pore) exhibited enhanced values (vari-ability) close to residue K305, which is found disordered inthe x-ray structure. The other two disordered sidechains atthe periplasmic surface (K10 and E183) were not observedin the SD map. These two residues may not have beensensed by the AFM probe, because they do not reach thetopographic surface. This agreement of structure and vari-
Microscopy of OmpF Porin 1669
Biophysical Journal 82(3) 1667–1676

ability of the porin surface determined by both structuralmethods is remarkable, considering that the informationwas obtained under different conditions (i.e., detergent ver-sus lipid membrane, three-dimensional stacking of porinsurfaces versus porin surfaces exposed to buffer solution).
Visualizing electrostatic contributions of thetransmembrane pore
To visualize local electrostatic interactions between AFMprobe and the electrostatic field of porin OmpF we calcu-lated difference maps between the averaged topographsrecorded under variable electrolyte concentrations (Fig. 1).The difference map (Fig. 3) exhibited pronounced maximalocated at the elliptical entrance of the channels. The heightdifferences of these maxima were 0.3 0.1 nm and 0.5 0.1 nm for an electrolyte difference of 200 and of 250 mMKCl, respectively. Because we can exclude structuralchanges of the rigid pore-forming structures we conclude
that the topographic differences reflect the change in elec-trostatic potential with the repulsive force on the AFMprobe increasing with decreasing electrolyte concentration.
Simulating the experiment
The electrostatic potential of OmpF and the resulting forceacting on the AFM probe were calculated from a numericalsolution of the linearized PB equation using two approaches(A and B) that differ markedly in their treatment of theAFM probe. In particular only approach B explicitly incor-porates a model of the probe into the solution of the PBequation.
Approach A
Mimicking the crystalline arrangement investigated, theelectrostatic potential of seven symmetrically arrangedOmpF trimers embedded into a lipid bilayer was calculated
FIGURE 1 Periplasmic surface of OmpF porin recorded in buffer solution (pH 7.8, 10 mM Tris-HCl) at different electrolyte concentrations. (A) AFMtopograph as revealed in 300 mK KCl. Single porin trimers forming rectangular unit cells (a � 13.5 nm, b � 8.2 nm as outlined) of the two-dimensionalcrystal were clearly visible. Circle and ellipse indicate short �-strand-connecting turns observed on individual porin monomers (comp. Fig. 2). Thetopograph was recorded at a scan frequency of 8 Hz. (B) Three-fold symmetrized correlation averaged porin trimer (n � 247) revealed from (A). (C) Thestandard deviation (SD) map of (B) had a vertical range from 0.05 to 0.23 nm. (D) To assess variable structural regions, average and SD maps weresuperimposed. (E) Topography recorded in 100 mM KCl. (F) Three-fold symmetrized correlation averaged porin trimer (n � 217) as revealed from (E).(G) SD map of (E) exhibiting a vertical range from 0.04 to 0.21 nm. (H) Topography recorded in 50 mM KCl. (I) Three-fold symmetrized correlationaveraged porin trimer (n � 309) as revealed from (H). (J) SD map of (I) exhibiting a vertical range from 0.07 to 0.23 nm. All topographs were recordedon the same OmpF crystal with identical imaging parameters except the applied force, which was enhanced to compensate for the electrostatic repulsion(see Materials and Methods). The vertical brightness range of (A), (B), (E), (F), (H), and (I) corresponds to 1.5 nm. (A), (E) and (H) were displayed inperspective view.
1670 Philippsen et al.
Biophysical Journal 82(3) 1667–1676
(Schirmer and Phale, 1999). From the resulting potential,the electrostatic force acting on a point charge was calcu-lated for each grid point. The electrostatic potential as wellas the z-component of the force are displayed in Fig. 4 for50 and 300 mM monovalent ion concentrations (100 mMion concentration giving an intermediate result is notshown). As expected, at high salt concentration the electro-static potential is effectively shielded by the electrolyte. Atlow salt concentration, the predominantly negative potentialextends asymmetrically into the periplasmic space: It isprominent at the outer rim of the transmembrane pore anddecreases toward the pore center exhibiting a small positivecontribution above the central ridge. Because theoreticalcalculations published before have mainly focused on thepotential inside the channel (Dutzler et al., 1999; Schirmerand Phale, 1999), this phenomenon was not found previ-ously. The isoforce surfaces are contoured at two values:The isosurface at �25 pN represents the approximate forceapplied during the constant force AFM mode, but cannotexplain the observed height difference of 0.5 nm. Theisosurface at �5 pN represents the value necessary for a0.5-nm height difference between the two isosurfaces.
Approach B
Here, the AFM probe was modeled explicitly as a low-dielectric sphere of 1-nm radius. The PB equation wassolved for every given position of the probe to calculate thefree energy of the system and the resulting force derivednumerically (Fig. 5). Two positions of the probe wereconsidered for illustrative purposes: the region with the
largest displacement near the center of the aqueous pore(Fig. 5 B) and a region with small displacement at the centerof the trimer (Fig. 5 A). An external applied force of �25pN was assumed. It is observed that the average micro-scopic force is counterbalanced at positions changing by�0.3 and 0.5 nm when the salt concentration is variedrespectively from 300 to 100 mM and from 300 to 50 mM.
DISCUSSION
OmpF porin facilitates the diffusion of hydrophilic solutesacross the outer membrane of E. coli. Determination of thephysical factors influencing the transporting behavior of thetransmembrane porin pore will provide information essen-tial for understanding of its function. One important aspectof porin is the experimentally observed cation selectivityincreasing reciprocally to the ion concentration of the buffersolution (Lou et al., 1996; Saint et al., 1996a,b). Here wehave taken a first step by studying the electrolyte-dependentelectrostatic potential of OmpF experimentally and corre-lated the results with calculations based on the x-ray struc-ture.
AFM clearly shows electrostatic potential of theporin pore
The AFM experiments were performed under identical ex-perimental conditions, i.e., the same AFM probe, samemembrane, identical pH, and the same force interactingbetween probe and OmpF porin (see Materials and Meth-
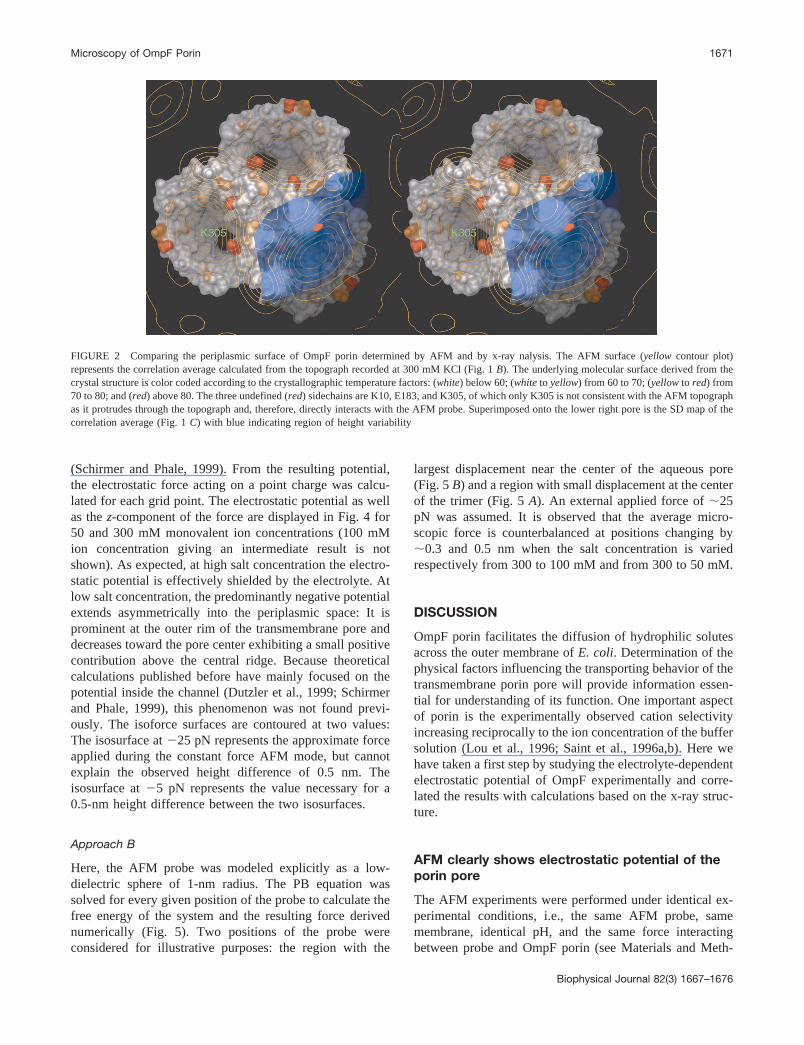
FIGURE 2 Comparing the periplasmic surface of OmpF porin determined by AFM and by x-ray nalysis. The AFM surface (yellow contour plot)represents the correlation average calculated from the topograph recorded at 300 mM KCl (Fig. 1 B). The underlying molecular surface derived from thecrystal structure is color coded according to the crystallographic temperature factors: (white) below 60; (white to yellow) from 60 to 70; (yellow to red) from70 to 80; and (red) above 80. The three undefined (red) sidechains are K10, E183, and K305, of which only K305 is not consistent with the AFM topographas it protrudes through the topograph and, therefore, directly interacts with the AFM probe. Superimposed onto the lower right pore is the SD map of thecorrelation average (Fig. 1 C) with blue indicating region of height variability
Microscopy of OmpF Porin 1671
Biophysical Journal 82(3) 1667–1676

ods). The only parameter changed during AFM imaging ofthe protein surface was the electrolyte concentration itself.As a result of this change an additional repulsive force wasobserved at the porin pore at low ionic strength. Conforma-tional changes at the periplasmic pore surface can be ex-cluded and repulsion of the negatively charged AFM probeis attributed to a negative electric potential of the pore that
is efficiently shielded at higher ionic strength of 300 mMmonovalent electrolyte.
Electrostatic pore potential
The heights of the difference maps are a direct estimate ofthe electrostatic force between porin and AFM probe. Low-
FIGURE 3 Visualizing the electrostatic potential of OmpF porin. Difference maps between topographs recorded of the periplasmic surface at 100 and300 mM KCl (A) and at 50 and 300 mM KCl (B). As becomes evident, the main differences between porin trimers recorded at different electrolyteconcentrations are located at the entrances of the transmembrane pore. The color scale shaded from white (highest difference) to red (high difference) toblack (difference �0.05 nm) corresponds to a vertical height of 0.3 nm (A) and of 0.5 nm (B). Lower panels show the superimposition of the averagedtopograph (colored brown-gold) and the electrostatic potential
1672 Philippsen et al.
Biophysical Journal 82(3) 1667–1676

ering the monovalent electrolyte concentration from 300 to100 mM resulted in a height increase of 0.3 nm at the pore,
whereas lowering the electrolyte concentration from 300 to50 mM resulted in an increase of 0.5 nm. Importantly, the
FIGURE 4 Electrostatic potential and force of the OmpF trimer calculated at different electrolyte concentrations. Series (A) explains the orientation, viewing direction,slab orientation, and scale used in series (B) and (C). Three perpendicular views are presented: a top view (B/C 1/2) from the periplasmic side onto the OmpF trimer andtwo side views, one with the trimer axis on the right hand side (B/C 3/4, indicated with a cyan line) and one viewing from the axis (B/C 5/6). The color coding is explainedin (A3). Series (B) shows the electrostatic potential at 50 mM (B 1/3/5) and at 300 mM (B 2/4/6) monovalent salt concentration. The topview (B 1/2) uses a multilayeredtransparent slab to convey information within a volume. The slabs in the sideviews (B 3–6) are given in (A2). The asymmetry of the negative potential extending into theperiplasmic space is clearly visible in (B3), with a strong contribution on the outer rim of the protein (left) and almost no contribution close to the trimer axis (perpendicularcyan line). Series (C) displays the iso-force surfaces for the z-component of the force acting on a 2.51 e unit charge, contoured at �5 pN (light magenta) and �25 pN (darkmagenta), overlayed with a 0.1 nm ruler (green). The orientation and ion concentration corresponds to series (B), (C 1/3/5) are from 50 mM and (C 2/4/6) from 300 mMion concentration. The iso-force surface corresponding to �25 pN cannot explain the measured height difference of 0.5 nm during the AFM experiment, only a lower forceiso-surface can do so, at approximately �5 pN (indicated by the two horizontal green lines).
Microscopy of OmpF Porin 1673
Biophysical Journal 82(3) 1667–1676

SD (Fig. 1) and the electrostatic (Fig. 3) maps exhibitedmaxima at different locations and, thus, are independentfrom each other. Assuming a probe radii of �2 nm, whichenables topographs at subnanometer resolution to beachieved (Engel et al., 1997), a net imaging force of 25 pNand an average surface charge density of the AFM probe of�0.032 C/m2 (Butt, 1991) we calculate an electrostatic fieldof 6.19 � 107 V/m from the AFM data (using Coulomb’slaw). At a monovalent electrolyte concentration of 100 mMKCl this field strength was reached at a pore depth of 0.5 nmbelow the periplasmic bilayer surface, whereas at 50 mM
KCl the same field strength was reached at a pore depth of0.3 nm.
Simulating the experiment
Two facts are known from the AFM experiment: the con-stant force mode operates at �25 pN and the observedheight difference between the topographs recorded at 50mM salt and 300 mM salt concentrations is 0.5 nm. In anattempt to reproduce these values theoretically, the electro-static potential and the resulting forces were calculated bytwo different approaches. These were based on similarsettings, such as using the same atomic coordinates, radii,and charges (for details, see Materials and Methods). Thetwo approaches differed markedly in their treatment of theAFM probe. Approach A did not include the probe at allduring the solution of the PB equation but only a posterioriby using a point charge of �2.51 e in the force calculation.Approach B, however, included the probe as a low-dielec-tric, ion-excluding sphere into the PB equation, solving thesystem for every given probe position. Whereas approach Aonly requires a single solution of the PB equation, theresulting force cannot correlate the experimental forces withthe measured height difference, as displayed in Fig. 4: Theisoforce surface at �25 pN is marginally different for thetwo ion concentrations, whereas the height difference of 0.5nm can only be obtained by a contour of ��5 pN. Thecalculated force is thus significantly smaller than the ap-plied external force and hence Approach A gives a qualita-tive picture of the electrostatic potential only. By modelingthe probe as a sphere of 1-nm radius, and including it intothe PB equation in terms of its dielectric constant, itsexclusion of mobile counterions, and its surface charge,Approach B can overcome this discrepancy. However, thePB equation must be solved and the electrostatic interactionenergy Gelec between probe and OmpF porin derived forevery given position of the probe (as explained in Materialsand Methods, Approach B). As presented in Fig. 5, theresults of this approach are in quantitative agreement withthe experimental measurements. In contrast, the total mi-croscopic force is smaller than 10 pN if the physical probeis not explicitly included in the calculations (the results areshown only for 50 mM salt concentration yielding thelargest force), which is exactly what was observed forApproach A. When the physical probe is not includedexplicitly, the average microscopic force is simply given byqE, in which q represents the charge of the probe and E theelectrostatic field generated by OmpF. But this expressionneglects the forces arising from the presence of the lowdielectric of the probe near OmpF (Im and Roux, 1998). Infact, it can be shown that there is a dielectric repulsion evenif the probe does not carry any charge.
The calculations demonstrate that it is essential to includethe AFM probe explicitly to reach a quantitative agreementwith the measured displacements as a function of salt con-
FIGURE 5 Results from numerical solution to the PB equation withexplicit presence of the AFM probe. Two approaches of the AFM probeperpendicular to the membrane plane are calculated: (A) along the trimeraxis and (B) near the center of the transmembrane pore (see insets forpositioning of probe). The z vlaue denotes the probe separation from thevertical OmpF center (0 Å), the force is derived from Gelec. At a distanceof �36 Å the probe touches the central protrusion of the porin trimer anddeforms the molecule (A). (B) Aproaching the pore center the probe cantravel further detecting the electric potential. The experimentally appliedforce is indicated with a strippled line. Above the OmpF pore, the averagemicroscopic force is counterbalanced at positions changing by �3 and 5 Åwhen the salt concentration is varied from 300 to 100 mM and from 300 to50 mM, respectively. As a comparison, the gray line indicates the force at50 mM salt without including the probe into the calculation. The resultswere calculated using Approach B (see Material and Methods)
1674 Philippsen et al.
Biophysical Journal 82(3) 1667–1676

centration. The agreement between the calculations and themeasured displacements is remarkable and suggests that aquantitative interpretation of electrostatic maps recorded byAFM may be possible. This opens the avenue to the directmeasurement of electrostatic fields at the molecular level.
CONCLUSION
AFM can be used to contour surface structure and to probeelectrostatic potential of a native membrane protein at aresolution � 1 nm. Experimental data and calculationsshow OmpF porin to generate an asymmetric electrostaticpotential, which increases with decreasing electrolyte con-centration. The calculations based on the numerical solutionto the PB equation show that this potential arises from thecharges lining the center of the transmembrane pore. Bothresults suggest that the previously detected ion selectivity ofOmpF finds its origin by this electrical potential producedby the protein. However, whether the observed asymmetryof the potential is of functional importance remains to beanswered. In future the combination of AFM and theoreticalcalculations may be applied to learn about the structurefunction relationship of other ion selective channels. Thecalculations demonstrate unambiguously that the amount ofelectrostatic forces is also determined by local interactionbetween AFM probe and the protein. Most interestingly, themethod introduced here is applicable to membrane proteinsas well as to water-soluble proteins and will allow detectingand localizing changes in their electrostatic potential.
We thank M. Cyrklaff and A. Hoenger for providing the OmpF porincrystals and are grateful to R. Dutzler, J. Howard, S. A. Muller, and B.Sakmann for stimulating discussions. The Swiss National and the M. E.Muller foundation supported this work.
REFERENCES
Binnig, G., C. F. Quate, and C. Gerber. 1986. Atomic force microscope.Phys. Rev. Lett. 56:930–933.
Butt, H-J. 1991. Measuring electrostatic, van der Waals, and hydrationforces in electrolyte solutions with an atomic force microscope. Biophys. J.60:1438–1444.
Butt, H-J., M. Jaschke, and W. Ducker. 1995. Measuring surface forces inaqueous solution with the atomic force microscope. Bioelect. Bioenerg.38:191–201.
Cowan, S. W., T. Schirmer, G. Rummel, M. Steiert, R. Ghosh, R. A.Pauptit, J. N. Jansonius, and J. P. Rosenbusch. 1992. Crystal structuresexplain functional properties of two E. coli porins. Nature. 358:727–733.
Czajkowsky, D. M., H. Iwamoto, T. L. Cover, and Z. Shao. 1999. Thevacuolating toxin from Helicobacter pylori forms hexameric pores inlipid bilayers at low pH. Proc. Natl. Acad. Sci. U.S.A. 96:2001–2006.
Drake, B., C. B. Prater, A. L. Weisenhorn, S. A. C. Gould, T. R. Albrecht,C. F. Quate, D. S. Cannell, H. G. Hansma, and P. K. Hansma. 1989.Imaging crystals, polymers, and processes in water with the atomic forcemicroscope. Science. 243:1586–1588.
Ducker, W. A., T. J. Senden, and R. M. Pashley. 1991. Direct measure-ments of colloidal forces using an atomic force microscope. Nature.353:239–241.
Dutzler, R., G. Rummel, S. Alberti, S. Hernandez-Alles, P. Phale, J.Rosenbusch, V. Benedi, and T. Schirmer. 1999. Crystal structure andfunctional characterization of OmpK36, the osmoporin of Klebsiellapneumoniae. Struct. Fold. Des. 7:425–434.
Engel, A., and D. J. Muller. 2000. Observing single biomolecules at workwith the atomic force microscope. Nat. Struct. Biol. 7:715–718.
Engel, A., C-A. Schoenenberger, and D. J. Muller. 1997. High-resolutionimaging of native biological sample surfaces using scanning probemicroscopy. Curr. Opin. Struct. Biol. 7:279–284.
Heinz, W. F., and J. H. Hoh. 1999. Relative surface charge densitymapping with the atomic force microscope. Biophys. J. 76:528–538.
Hoenger, A., R. Ghosh, C-A. Schoenenberger, U. Aebi, and A. Engel.1993. Direct in situ structural analysis of recombinant outer membraneproteins expressed in an OmpA-deficient mutant Escherichia coli strain.J. Struct. Biol. 111:212–221.
Hoenger, A., H. Gross, A. Engel. 1990. Localization of the lipopolysac-charides in metal-shadowed reconstituted lipid-porin membranes.J. Struct. Biol. 103:185–195.
Honig, B., and A. Nicholls. 1995. Classical electrostatics in biology andchemistry. Science. 268:1144–1149.
Im, W., and B. Roux. 1998. Continuum solvation model: electrostaticforces from numerical solutions to the Poisson-Boltzmann equation.Comp. Phys. Commun. 111:59–75.
Im, W., S. Seefeld, and B. Roux. 2000. Grand canonical Monte Carlo-Brownian dynamics algorythm for simulating ion channels. Biophys. J.79:788–801.
Israelachvili, J. 1991. Intermolecular and surface forces. Academic PressLimited, London.
Karshikoff, A., V. Spassov, S. W. Cowan, R. Ladenstein, and T. Schirmer.1994. Electrostatic properties of two porin channels from Escherichiacoli. J. Mol. Biol. 240:372–384.
Kirkwood, J. G. 1934. Theory of solution of molecules containing widelyseparated charges with application to zwiterions. J. Chem. Phys. 2:351.
Klebba, P. E., and S. M. Newton. 1998. Mechanisms of solute transportthrough outer membrane porins: burning down the house. Curr. Opin.Microbiol. 1:238–247.
Lou, K-L., N. Saint, A. Prilipov, G. Rummel, S. A. Benson, J. P. Rosen-busch, and T. Schirmer. 1996. Structural and functional characterizationof OmpF porin mutants selected for larger pore size. J. Biol. Chem.271:20669–20675.
MacKerell, A. D., D. Bashford, M. Bellot, R. L. Dunbrack, J. D. Evanseck,M. J. Field, S. Fischer, J. Gao, H. Guo, D. Joseph-McCarthy, et al. 1998.All-atom empirical potential for molecular modeling and dynamicsstudies of proteins. J. Phys. Chem. B. 102:3586–3616.
Madura, J. D., J.M. Briggs, R. C. Wade, M. E. Davies, B. A. Luty, A. Ilin,J. Antosiewicz, M. K. Gilson, B. Bagheri, L. R. Scott, et al. 1995.Electrostatics and diffusion in solution: simulations with the Universityof Houston Brownian Dynamics Program. Comp. Phys. Commun. 91:57–95.
McLaughlin, S. 1989. The electrostatic properties of membranes. Annu.Rev. Biophys. Chem. 18:113–136.
Muller, D. J., M. Amrein, and A. Engel. 1997. Adsorption of biologicalmolecules to a solid support for scanning probe microscopy. J. Struct.Biol. 119:172–188.
Muller, D. J., and A. Engel. 1997. The height of biomolecules measuredwith the atomic force microscope depends on electrostatic interactions.Biophys. J. 73:1633–1644.
Muller, D. J., D. Fotiadis, and A. Engel. 1998. Mapping flexible proteindomains at subnanometer resolution with the AFM. FEBS Lett. 430:105–111.
Muller, D. J., D. Fotiadis, S. Scheuring, S. A. Muller, and A. Engel. 1999.Electrostatically balanced subnanometer imaging of biological speci-mens by atomic force microscopy. Biophys. J. 76:1101–1111.
Nakamara, H. 1996. Roles of electrostatic interaction in proteins. Q. Rev.Biophys. 29:1–90.
Nikaido, H., and M. H. Saier. 1992. Transport proteins in bacteria: com-mon themes in their design. Science. 258:936–942.
Microscopy of OmpF Porin 1675
Biophysical Journal 82(3) 1667–1676

Nina, M., D. Beglov, and B. Roux. 1997. Atomic radii for continuumelectrostatics calculations based on molecular dynamics free energysimulations. J. Phys. Chem. B. 101:5239–5248.
Pashley, R. M. 1981. Hydration forces between mica surfaces in Li�, Na�,Na� and Cs� electrolyte solutions: a correlation of double layer andhydration forces with surface cation exchange properties. J. ColloidInterface Sci. 83:531–546.
Rotsch, C., and M. Radmacher. 1997. Mapping local electrostatic forceswith the atomic force microscope. Langmuir. 13:2825–2832.
Roux, B., S. Berneche, and W. Im. 2000. Ion channels, permeation, andelectrostatics: insight into the function of KcsA. Biochemistry. 39:13295–13306.
Roux, B., and R. MacKinnon. 1999. The cavity and pore helices in theKcsA K� channel: electrostatic stabilization of monovalent cations.Science. 285:100–102.
Roux, B., and T. Simonson. 1999. Implicit solvent models. Biophys. Chem.78:1–20.
Saint, N., K. L. Lou, C. Widmer, M. Luckey, T. Schirmer, and J. P.Rosenbusch. 1996a. Structural and functional characterization of OmpFporin mutants selected for larger pore size. J. Biol. Chem. 271:20676–20680.
Saint, N., A. Prilipov, A. Hardmeyer, K-L. Lou, T. Schirmer, and J. P.Rosenbusch. 1996b. Replacement of the sole histidinyl residue in OmpF
porin from E. coli by theronine (H21T) does not affect channel structureand function. Biochem. Biophys. Res. Commun. 223:118–122.
Sanner, M. F., A. J. Olson, and J. C. Spehner. 1996. Reduced surface: anefficient way to compute molecular surfaces. Biopolymers. 38:305–320.
Schabert, F. A., and A. Engel. 1994. Reproducible acquisition of Esche-richia coli porin surface topographs by atomic force microscopy. Bio-phys. J. 67:2394–2403.
Schabert, F. A., C. Henn, and A. Engel. 1995. Native Escherichia coliOmpF porin surfaces probed by atomic force microscopy. Science.268:92–94.
Schirmer, T. 1998. General and specific porins from bacterial outer mem-branes. J. Stuct. Biol. 121:101–109.
Schirmer, T., and P. S. Phale. 1999. Brownian dynamics simulation of ionflow through porin channels. J. Mol. Biol. 294:1159–1167.
Sharp, K. A., and B. Honig. 1990. Electrostatic interactions inmacromolecules: theory and application. Annu. Rev. Biophys. Chem.19:301–332.
Weisenhorn, A. L., M. Khorsandi, S. Kasas, V. Gotzos, and H-J. Butt.1993. Deformation and height anomaly of soft surfaces studied with anAFM. Nanotechnology. 4:106–113.
Weiss, M. S., U. Abele, J. Weckesser, W. Welte, E. Schlitz, and G. E.Schulz. 1991. Molecular architecture and electrostatic properties of abacterial porin. Science. 254:1627–1630.
1676 Philippsen et al.
Biophysical Journal 82(3) 1667–1676