Image and Fractal Information Processing for Large-Scale Chemoinformatics, Genomics Analyses and...
11
Image and Fractal Information Processing for Large-Scale Chemoinformatics, Genomics Analyses and Pattern Discovery Ilkka Havukkala, Lubica Benuskova, Shaoning Pang, Vishal Jain, Rene Kroon, and Nikola Kasabov Knowledge Engineering and Discovery Research Institute, Auckland University of Technology Auckland, New Zealand [email protected] www.kedri.info Abstract. Two promising approaches for handling large-scale biodata are presented and illustrated in several new contexts: molecular struc- ture bitmap image processing for chemoinformatics, and fractal visualiza- tion methods for genome analyses. It is suggested that two-dimensional structure databases of bioactive molecules (e.g. proteins, drugs, folded RNAs), transformed to bitmap image databases, can be analysed by a variety of image processing methods, with an example of human mi- croRNA folded 2D structures processed by Gabor filter. Another com- pact and efficient visualization method is comparison of huge amounts of genomic and proteomic data through fractal representation, with an example of analyzing oligomer frequencies in a bacterial phytoplasma genome. Bitmap visualization of bioinformatics data seems promising for complex parallel pattern discovery and large-scale genome compar- isons, as powerful modern image processing methods can be applied to the 2D images. 1 Introduction Massive amounts of information keep accumulating into many complex chemical structure databases, including protein and RNA structures, drug molecules, drug- ligand databases, and so on. Surprisingly, there is no commonly accepted standard for recording and managing chemical structure data, e.g. drug molecules, suitable for automated data mining [1]. Also genomic data are accumulating at increasing speed, with almost 2,000 microbial and eukaryotic genomes listed in the Genomes OnLine Database (GOLD), either completed or being sequenced [2]. Increasing interest is now being focused on characterizing various genomes, especially for their repetitive DNA and repeated DNA motifs, especially in the non-coding regions, important for chromatin condensation and gene regulation [3]. We present and illustrate two promising approaches to handle large-scale chemoinformatics and genomics data, based on visualization as bitmaps and applicable to standardized pattern analysis and knowledge discovery. J.C. Rajapakse, L. Wong, and R. Acharya (Eds.): PRIB 2006, LNBI 4146, pp. 163–173, 2006. c Springer-Verlag Berlin Heidelberg 2006
-
Upload
ugfhhhjkjkoll -
Category
Documents
-
view
1 -
download
0
Transcript of Image and Fractal Information Processing for Large-Scale Chemoinformatics, Genomics Analyses and...
Image and Fractal Information Processingfor Large-Scale Chemoinformatics, Genomics
Analyses and Pattern Discovery
Ilkka Havukkala, Lubica Benuskova, Shaoning Pang, Vishal Jain, Rene Kroon,and Nikola Kasabov
Knowledge Engineering and Discovery Research Institute,Auckland University of Technology Auckland,
www.kedri.info
Abstract. Two promising approaches for handling large-scale biodataare presented and illustrated in several new contexts: molecular struc-ture bitmap image processing for chemoinformatics, and fractal visualiza-tion methods for genome analyses. It is suggested that two-dimensionalstructure databases of bioactive molecules (e.g. proteins, drugs, foldedRNAs), transformed to bitmap image databases, can be analysed by avariety of image processing methods, with an example of human mi-croRNA folded 2D structures processed by Gabor filter. Another com-pact and efficient visualization method is comparison of huge amountsof genomic and proteomic data through fractal representation, with anexample of analyzing oligomer frequencies in a bacterial phytoplasmagenome. Bitmap visualization of bioinformatics data seems promisingfor complex parallel pattern discovery and large-scale genome compar-isons, as powerful modern image processing methods can be applied tothe 2D images.
1 Introduction
Massive amounts of information keep accumulating into many complex chemicalstructure databases, including protein and RNA structures, drug molecules, drug-ligand databases, and so on. Surprisingly, there is no commonly accepted standardfor recording and managing chemical structure data, e.g. drug molecules, suitablefor automated data mining [1]. Also genomic data are accumulating at increasingspeed, with almost 2,000 microbial and eukaryotic genomes listed in the GenomesOnLine Database (GOLD), either completed or being sequenced [2]. Increasinginterest is now being focused on characterizing various genomes, especially for theirrepetitive DNA and repeated DNA motifs, especially in the non-coding regions,important for chromatin condensation and gene regulation [3].
We present and illustrate two promising approaches to handle large-scalechemoinformatics and genomics data, based on visualization as bitmaps andapplicable to standardized pattern analysis and knowledge discovery.
J.C. Rajapakse, L. Wong, and R. Acharya (Eds.): PRIB 2006, LNBI 4146, pp. 163–173, 2006.c© Springer-Verlag Berlin Heidelberg 2006
164 I. Havukkala et al.
2 Protein, RNA and Other Chemoinformatics Databases
2.1 Current Analysis Methods
There are currently some 35,000 databased protein structures (X-ray and NMR)in the Protein Data Bank PDB [4], and many more structures have been esti-mated by computational comparison of amino acid sequences to secondary andtertiary structures, either by ab initio folding programs or supervised methodsinvolving sequence threading to a known protein structure. A large number ofweb servers are available on the internet to compare protein structures with eachother, see e.g. [5]. The underlying structural alignment algorithms are crucial fordrug design, e.g. ligand to protein binding simulation. However, these algorithmscurrently cannot handle simultaneous comparison and classification of large num-bers of structures, except by brute force, using very large distributed computinginfrastructures, like FightAIDS@Home on the World Community Grid, whichperforms AutoDock analysis of drug and HIV virus target matching on thousandsof PCs around the world [6]. However, currently there is no efficient solutionfor matching, clustering and classifying large numbers of molecular structuresefficiently.
Amino acid sequence similarity has been used as a proxy to compare similarprotein structures, but a minimum of 30% sequence identity and a known struc-ture is needed for modelling protein structures. For accurate drug design, up to60% sequence identity is needed to ensure proper ligand binding models. Also,in this respect the current set of protein structures do not yet cover sufficientlythe natural protein structure space [7]. In addition, protein structure is knownto be clearly more conserved than sequence similarity.
Similarly to proteins, the folding of the RNA molecules is also known to beoften more conserved than their sequence, and most recent estimates suggest thatthe number of non-coding genes with stable 2D RNA structures of transcripts isin the thousands [8], and may match the total number of protein coding genesin eukaryotic genomes.
There is thus a need for new efficient methods for comparing and clusteringof large numbers of macromolecule structures that could avoid the use of com-plicated and detailed data structures pertaining to the 3D atomic coordinates ofproteins, RNAs, and organic molecules. Such an alternative approach advocatedin this paper is to generate 2D projections of molecular structures, transformthe data into bitmap images and then analyze the bitmap images using a vari-ety of advanced methods developed in the artificial intelligence community forface recognition, fingerprint classification and so on. An example of using thisapproach for RNA structures is described below.
2.2 Bitmap Image Processing Approach to Clustering andClassification of Folded RNAs
RNA molecules commonly self-assemble, resulting in more or less stable specificconformations in which nucleotide pairs A–U and C–G are formed for a reduced

Image and Fractal Information Processing 165
free energy level. The conformations are characteristic of the different RNAs, e.g.eukaryotic ribosomal RNAs, microbial riboswitches, human microRNAs and soon. With the latest algorithms, secondary 2D structures can be computed quitefast and reliably from RNA sequence [9] Normally only the most stable struc-ture with the lowest thermodynamic energy (ΔG) is considered, but there canalso be several other more or less likely conformations, collectively known asthe Boltzmann ensemble, which can nowadays also be computed with reason-able accuracy [10]. Ideally, these alternative conformations should be taken intoaccount in comparative analysis of different RNAs.
Consensus structure comparisons for a set of RNA sequences have been previ-ously made in three basic ways: 1) multiple alignment of sequences, followed bystructure folding of the consensus, 2) Sankoff method of simultaneously aligningsequences and folds and 3), folding sequences to structures, followed by struc-tural alignment, as reviewed in [11].
The first method may not cluster together all related sequences, as RNAstructure is more conserved than its sequence. With the Sankoff method itis not easy to cluster large numbers of sequences/structures and the methodis also computationally very demanding for large-scale use. The third methodis a novel field, and demands a very good method to align structures to startwith. Several approaches have been introduced, including RNA as topologicalgraphs or trees. Representative algorithms in this field are RNAFORESTER andMARNA, reviewed in [9] and TREEMINER [12]. Their performance in analysingand clustering very large RNA sets is not yet known.
A new generic approach proposed by us [13] for large-scale analysis of RNAstructures consists of first computing the 2D structures for the set of RNA se-quences, followed by transformation of the structures into bitmap images andanalysis of the image set with a suitable image processing algorithm (Fig. 1).
2.3 Example of Human MicroRNAs Analysed by Gabor FilterMethod
MicroRNAs are short, 80-150 basepairs long RNAs that do not code for protein,but fold into hairpin structures and exert their effect on gene regulation by bind-ing to matching sequences of messenger RNAs of protein-coding genes, reviewedin [14]. They are now known from plants, mammals and many lower eukaryotesas well. In a first case study of the general bitmap image analysis approach [13],the set of 222 known human microRNAs was folded by RNAFold algorithm ofthe Vienna package [15] and transformed into bitmap images, which were thenused to extract classificatory information using Gabor filter method. Gabor fil-ter produces rotation-invariant features, which are used to calculate measures ofsimilarity to compare images. Greyscale bitmaps of 512x512 pixels were used,with low-resolution spatial frequencies and four angular directions.
Fig. 2 (top middle and right) shows two examples of Gabor filter transformedbitmap images of folded RNA (top left) at low angular resolution. From thetransformed images, feature vectors were obtained, and Manhattan distancesbetween vectors of all pairs of microRNAs calculated. The heat map of all ver-

166 I. Havukkala et al.
RNA candidate sequence set
Transform to bitmap images
Cluster by image similarity
Conserved structures
Fold sequences
Fig. 1. Bitmap image analysis approach to RNA structure classification
sus all comparisons of the 222 microRNAs (Fig. 2, bottom) shows clearly thediagonal of similar items (the microRNAs were ordered by known microRNAfamilies) or structural motifs together.
In the heatmap colour scaling blue pixels show the most similar microRNApairs, and red pixels the least similar ones. In addition, many other putativesimilarities between microRNAs that do not share sequence similarity are alsoindicated for a large number of other microRNA pairs. For more details, see[13]. These additional similarities are worth exploring further, because they maycorrelate with specific structures in the folded RNAs. Thus the bitmap imagesimilarity could help in sequence pattern discovery by providing additional in-formation for clustering RNAs with weakly similar sequences.
2.4 Further Improvement of the Approach
For improving the bitmap utilization method, other ways of visualizing the 2Dstructure could be used, e.g. by using different colours or shapes for differentbases or basepairs. Subsequently, various other image feature extraction meth-ods could be used to derive informative colour/shape/contour/curvature data forclustering and classification of the microRNA structure images. The approach isa general one, applicable to all kinds of macromolecules for which an informative2D structure representation is easily computed. This method could reveal rele-vant features not previously considered by chemists or biologists, or it could beused as a prefiltering step in very large databases of molecular structures. Thenthe challenge is to develop the image clustering methods to handle large num-
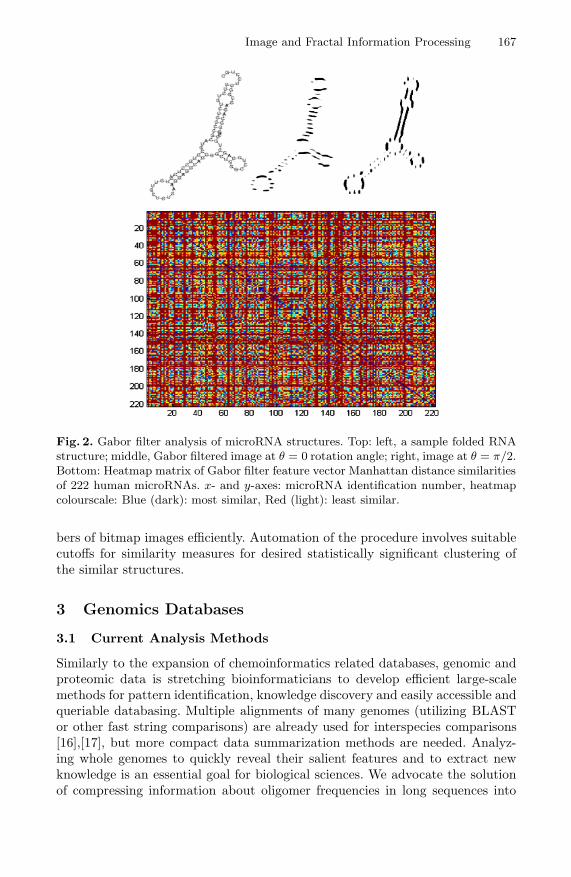
Image and Fractal Information Processing 167
Fig. 2. Gabor filter analysis of microRNA structures. Top: left, a sample folded RNAstructure; middle, Gabor filtered image at θ = 0 rotation angle; right, image at θ = π/2.Bottom: Heatmap matrix of Gabor filter feature vector Manhattan distance similaritiesof 222 human microRNAs. x- and y-axes: microRNA identification number, heatmapcolourscale: Blue (dark): most similar, Red (light): least similar.
bers of bitmap images efficiently. Automation of the procedure involves suitablecutoffs for similarity measures for desired statistically significant clustering ofthe similar structures.
3 Genomics Databases
3.1 Current Analysis Methods
Similarly to the expansion of chemoinformatics related databases, genomic andproteomic data is stretching bioinformaticians to develop efficient large-scalemethods for pattern identification, knowledge discovery and easily accessible andqueriable databasing. Multiple alignments of many genomes (utilizing BLASTor other fast string comparisons) are already used for interspecies comparisons[16],[17], but more compact data summarization methods are needed. Analyz-ing whole genomes to quickly reveal their salient features and to extract newknowledge is an essential goal for biological sciences. We advocate the solutionof compressing information about oligomer frequencies in long sequences into
168 I. Havukkala et al.
small, coloured fractal representations in 2D or 3D space. This can achieve com-pression of genome data by a million times or more.
3.2 Fractal Representation Approach for DNA Sequences
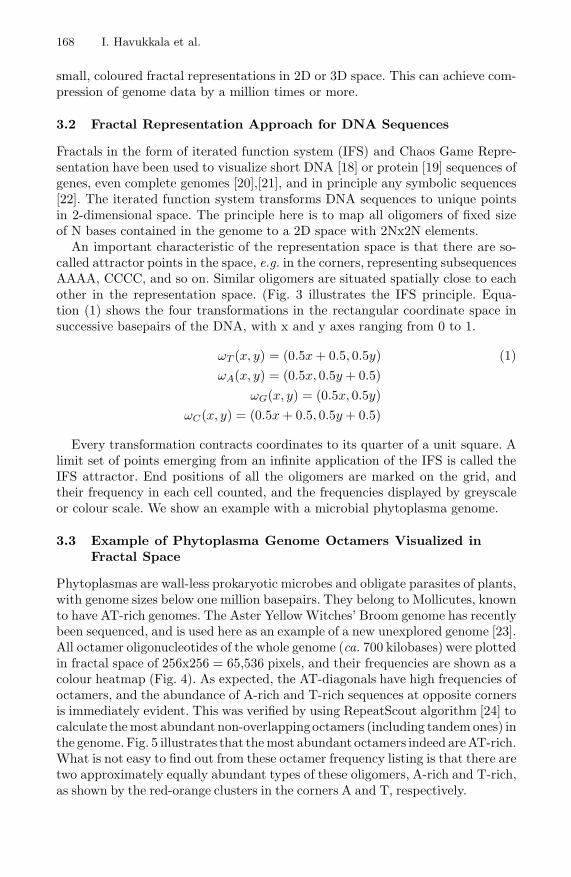
Fractals in the form of iterated function system (IFS) and Chaos Game Repre-sentation have been used to visualize short DNA [18] or protein [19] sequences ofgenes, even complete genomes [20],[21], and in principle any symbolic sequences[22]. The iterated function system transforms DNA sequences to unique pointsin 2-dimensional space. The principle here is to map all oligomers of fixed sizeof N bases contained in the genome to a 2D space with 2Nx2N elements.
An important characteristic of the representation space is that there are so-called attractor points in the space, e.g. in the corners, representing subsequencesAAAA, CCCC, and so on. Similar oligomers are situated spatially close to eachother in the representation space. (Fig. 3 illustrates the IFS principle. Equa-tion (1) shows the four transformations in the rectangular coordinate space insuccessive basepairs of the DNA, with x and y axes ranging from 0 to 1.
ωT (x, y) = (0.5x + 0.5, 0.5y) (1)ωA(x, y) = (0.5x, 0.5y + 0.5)
ωG(x, y) = (0.5x, 0.5y)ωC(x, y) = (0.5x + 0.5, 0.5y + 0.5)
Every transformation contracts coordinates to its quarter of a unit square. Alimit set of points emerging from an infinite application of the IFS is called theIFS attractor. End positions of all the oligomers are marked on the grid, andtheir frequency in each cell counted, and the frequencies displayed by greyscaleor colour scale. We show an example with a microbial phytoplasma genome.
3.3 Example of Phytoplasma Genome Octamers Visualized inFractal Space
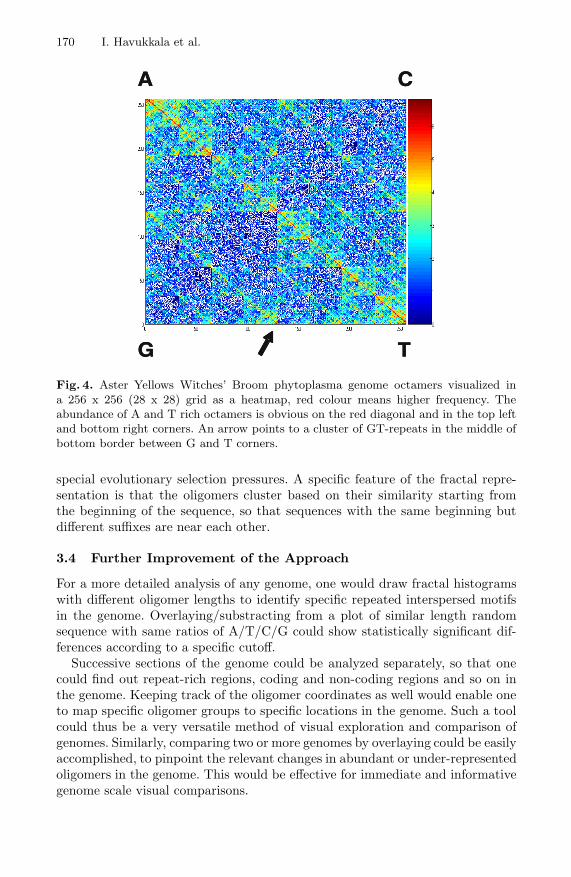
Phytoplasmas are wall-less prokaryotic microbes and obligate parasites of plants,with genome sizes below one million basepairs. They belong to Mollicutes, knownto have AT-rich genomes. The Aster Yellow Witches’ Broom genome has recentlybeen sequenced, and is used here as an example of a new unexplored genome [23].All octamer oligonucleotides of the whole genome (ca. 700 kilobases) were plottedin fractal space of 256x256 = 65,536 pixels, and their frequencies are shown as acolour heatmap (Fig. 4). As expected, the AT-diagonals have high frequencies ofoctamers, and the abundance of A-rich and T-rich sequences at opposite cornersis immediately evident. This was verified by using RepeatScout algorithm [24] tocalculate the most abundant non-overlappingoctamers (including tandem ones) inthe genome. Fig. 5 illustrates that the most abundant octamers indeed areAT-rich.What is not easy to find out from these octamer frequency listing is that there aretwo approximately equally abundant types of these oligomers, A-rich and T-rich,as shown by the red-orange clusters in the corners A and T, respectively.
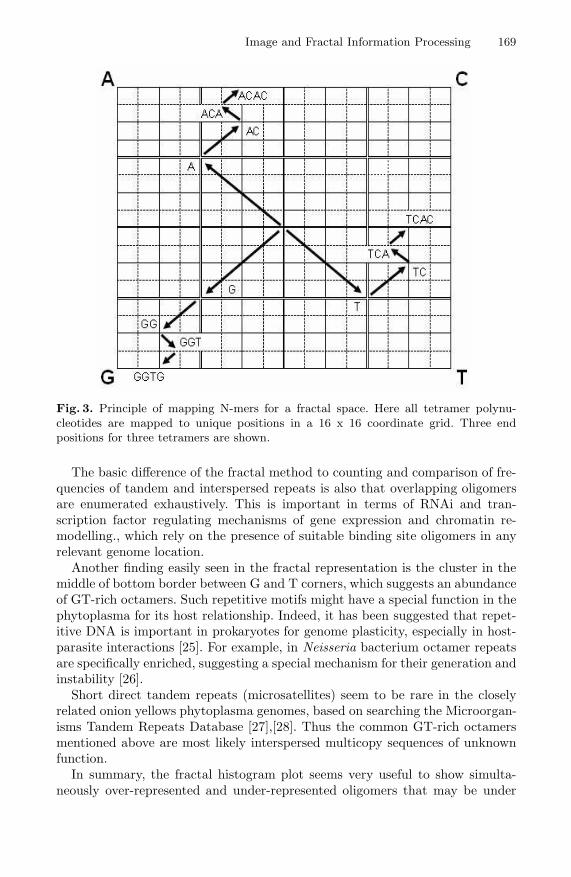
Image and Fractal Information Processing 169
Fig. 3. Principle of mapping N-mers for a fractal space. Here all tetramer polynu-cleotides are mapped to unique positions in a 16 x 16 coordinate grid. Three endpositions for three tetramers are shown.
The basic difference of the fractal method to counting and comparison of fre-quencies of tandem and interspersed repeats is also that overlapping oligomersare enumerated exhaustively. This is important in terms of RNAi and tran-scription factor regulating mechanisms of gene expression and chromatin re-modelling., which rely on the presence of suitable binding site oligomers in anyrelevant genome location.
Another finding easily seen in the fractal representation is the cluster in themiddle of bottom border between G and T corners, which suggests an abundanceof GT-rich octamers. Such repetitive motifs might have a special function in thephytoplasma for its host relationship. Indeed, it has been suggested that repet-itive DNA is important in prokaryotes for genome plasticity, especially in host-parasite interactions [25]. For example, in Neisseria bacterium octamer repeatsare specifically enriched, suggesting a special mechanism for their generation andinstability [26].
Short direct tandem repeats (microsatellites) seem to be rare in the closelyrelated onion yellows phytoplasma genomes, based on searching the Microorgan-isms Tandem Repeats Database [27],[28]. Thus the common GT-rich octamersmentioned above are most likely interspersed multicopy sequences of unknownfunction.
In summary, the fractal histogram plot seems very useful to show simulta-neously over-represented and under-represented oligomers that may be under
170 I. Havukkala et al.
G T
A C
G T
A C
Fig. 4. Aster Yellows Witches’ Broom phytoplasma genome octamers visualized ina 256 x 256 (28 x 28) grid as a heatmap, red colour means higher frequency. Theabundance of A and T rich octamers is obvious on the red diagonal and in the top leftand bottom right corners. An arrow points to a cluster of GT-repeats in the middle ofbottom border between G and T corners.
special evolutionary selection pressures. A specific feature of the fractal repre-sentation is that the oligomers cluster based on their similarity starting fromthe beginning of the sequence, so that sequences with the same beginning butdifferent suffixes are near each other.
3.4 Further Improvement of the Approach
For a more detailed analysis of any genome, one would draw fractal histogramswith different oligomer lengths to identify specific repeated interspersed motifsin the genome. Overlaying/substracting from a plot of similar length randomsequence with same ratios of A/T/C/G could show statistically significant dif-ferences according to a specific cutoff.
Successive sections of the genome could be analyzed separately, so that onecould find out repeat-rich regions, coding and non-coding regions and so on inthe genome. Keeping track of the oligomer coordinates as well would enable oneto map specific oligomer groups to specific locations in the genome. Such a toolcould thus be a very versatile method of visual exploration and comparison ofgenomes. Similarly, comparing two or more genomes by overlaying could be easilyaccomplished, to pinpoint the relevant changes in abundant or under-representedoligomers in the genome. This would be effective for immediate and informativegenome scale visual comparisons.

Image and Fractal Information Processing 171
0
500
1000
1500
2000
AAAAAAAT
TAAAAAAA
TTAAAAAA
AAAAAATA
AAAAATAA
AAAAAAAA
AAAATAAA
TTTAAAAA
AAATAAAA
AATAAAAA
ATAAAAAA
AATTAAAA
AAAAAATT
AAAAATTA
ATTAAAAA
AAAAATAT
CAAAAAAA
AAAATAAT
AAAATATT
AAATTAAA
AAAATTAA
AAAAAAAC
AAATAATT
AAATTATT
AAAAACAA
AAGAAAAA
AAAAAGAA
ATTTTTTA
AAAAGAAA
AAAAAAGA
AACAAAAA
TAATAAAA
AAAGAAAA
TAAAAATA
AAAAAAAG
AAAACAAA
ATTTAAAA
TTTTAAAA
ATTTTAAA
AAAAAACA
Aster Yellows genome octamer
Nu
mb
er o
f o
ccu
rren
ces
Fig. 5. The most abundant Aster Yellows Witches’ Broom phytoplasma genome oc-tamers obtained by RepeatScout algorithm. The abundance of A and T rich oligomersis clear.
The oligomer lengths could be variable, depending on the scale of interest, upto oligomer size 20 or so, which would map all unique single-copy sequences ina separate grid cell. The fractal spaces of the different length oligomers could beviewed successively as a moving colour video track for quick visualization of therelevant features, with several genomes shown side by side in synchrony.
When analysing longer sequences where a small trivial difference may appearin the beginning of the string, leading to a quite different location in the frac-tal space. This could be mitigated by mapping strings in the reverse directionalso. To achieve a sequence similarity based clustering like in BLAST, one wouldneed a different ordering of the similar strings in the fractal space. A specificapplication for short oligomer based microarray technology is visualization ofthe set of oligos (the ”oligome”) on an array, and comparison between arraysand the target transcriptomes/genomes for completeness of coverage of possi-ble hybridization sites. Further extension to larger alphabets to encompass alsocomplete proteomes, rather than short single protein sequences is also an in-teresting possibility. Finally, automation of the method could be accomplishedby image processing of the overlayed/subtracted images to highlight/extract theoligomer clusters of interest in the fractal space, down to the specific most com-mon oligomers differing in frequency between the genomes.
4 Discussion
We have presented two promising visualization and classification methods, bothbased on transforming a bioinformatics problem to the image analysis domain, todeal with large sets of molecular structures and oligomer motifs in large genomesand proteomes. An example on transforming folded RNA molecules to 2D struc-
172 I. Havukkala et al.
ture bitmaps was given, but the approach applies to several domains, includ-ing complex organic molecule databases and even protein secondary structurediagrams. For fractal coding of genome oligomer distribution, an example ofphytoplasma genome showed that specific types of repeats can be visualized ef-fectively. Various extensions of the fractal method seem worth pursuing for noveltypes of DNA sequence pattern clustering and classification. Finally, moving thebioinformatics domain symbolic data into bitmap representation domain makesit possible to use the wide variety of bitmap image analysis methods developedin other fields outside biology. This interdisciplinary approach should be bothinteresting and fruitful for informative visualization, data mining and knowledgediscovery in bioinformatics and chemoinformatics datasets.
Acknowledgments. Supported by the Knowledge Engineering and DiscoveryResearch Institute, Auckland University of Technology and the FRST NERFFund (AUTX0201), New Zealand.
References
1. Banville, D.L.: Mining the chemical structural information from the drug literature.Drug Discovery Today 11(1/2) (2006) 35–42
2. http://www.genomesonline.org/3. Vinogradov, A.E.: Noncoding DNA, isochores and gene expression: nucleosome
formation potential. Nucleic Acids Res. 33(2) (2005) 559–634. http://www.rcsb.org/pdb/holdings.do5. Vlahovicek, K. et al.: CX, DPX and PRIDE: WWW servers for the analysis and
comparison of protein 3D structures. Nucleic Acids Res. 1(33) (2005) W252–2546. http://fightaidsathome.scripps.edu/index.html7. Vitkup, D. et al.: Completeness in structural genomics. Nature Struct. Biol. 8
(2001) 559–5668. Washietl, S. et al.: Mapping of conserved RNA secondary structures predicts thou-
sands of functional noncoding RNAs in the human genome. Nature Biotechnol.23(11) (2005) 1383–1390
9. Washietl, S., Hofacker, I.L., Stadler, P.F.P., Tino, P.: Fast and reliable predictionof noncoding RNAs. PNAS USA 102(7) (2005) 2454–2459
10. Ding, Y., Lawrence, C.E.: A statistical sampling algorithm for RNA secondarystructure prediction. Nucleic Acids Res. 31 (2003) 7280–7301
11. Gardner, P.P., Giegerich, R.: A comprehensive comparison of comparative RNAstructure prediction approaches. BMC Bioinformatics 5(140) (2004) 1–18.
12. Zaki, M.J.: Efficiently Mining Frequent Trees in a Forest: Algorithms and Appli-cations. IEEE Trans. Knowl. Data Eng. 17(8) (2005) 1021–1035
13. Havukkala, I., Pang, S.N., Jain,V., Kasabov, N.: Classifying microRNAs by Ga-bor filter features from 2D structure bitmap images on a case study of humanmicroRNAs. J. Comput. Theor. Nanosci. 2(4) (2005) 506–513
14. Mattick, J.S., Makunin,I.V.: Small regulatory RNAs in mammals. Hum. Mol.Genet. 14(1) (2005) R121–132
15. Hofacker, I.: Vienna RNA secondary structure server. Nucleic Acids Res. 31 (2003)3429–3431

Image and Fractal Information Processing 173
16. Frazer,K.A. et al.: VISTA: computational tools for comparative genomics. NucleicAcids Res. 32(2004) W273-279
17. Brudno, M. et al.: Automated whole-genome multiple alignment of rat, mouse, andhuman. Genome Res. 14(4) (2004) 685–692
18. Jeffrey, H.J.: Chaos game representation of gene structure. Nucleic Acids Res.18(8) (1990) 2163–2170
19. Fiser, A., Tusn??ady, G.E., Simon, I.: Chaos game representation of protein struc-tures. J. Mol. Graphics 12 (1994) 302–304
20. Hao, B., Lee, H., Zhang, S.: Fractals related to long DNA sequences and completegenomes Chaos, Solitons and Fractals 11(6) (2000) 825–836
21. Almeida, J.S. et al.: Analysis of genomic sequences by Chaos Game RepresentationBioinformatics 17(5) (2001) 429–37
22. Tino, P.: Spatial representation of symbolic sequences through iterative functionsystems. IEEE Trans. Syst. Man Cybernet. 29 (1999) 386–393
23. Bai, X. et al.: Living with genome instability: the adaptation of phytoplasmasto diverse environments of their insect and plant hosts. J. Bacteriol. 188 (1999)3682–3696
24. Price, A.L., Jones, N.C., Pevzner, P.A.: De novo identification of repeat familiesin large genomes. Bioinformatics. , 21(Suppl. 1) (2005) i351–i358
25. Aras, R.A. et al.: Extensive repetitive DNA facilitates prokaryotic genome plastic-ity. Proc. Natl. Acad. Sci. USA 100(23) (1999) 13579–135784
26. Saunders, N.J. et al.: Repeat-associated phase variable genes in the completegenome sequence of Neisseria meningitidis strain MC58. Molecular Microbiology,37(1) (2000) 207–215
27. Denoeud, F., Vergnaud, G.: Identification of polymorphic tandem repeats by di-rect comparison of genome sequence from different bacterial strains: a web-basedresource. BMC Bioinformatics. 5 (2004) 4
28. http://minisatellites.u-psud.fr/