Illustration of a Common Framework for Relating Multiple Typing Methods by Application to...
10
10.1128/JCM.02536-05. 2006, 44(7):2524. DOI: J. Clin. Microbiol. de Lencastre, J. S. Almeida and M. Ramirez J. A. Carriço, C. Silva-Costa, J. Melo-Cristino, F. R. Pinto, H. Streptococcus pyogenes Application to Macrolide-Resistant Relating Multiple Typing Methods by Illustration of a Common Framework for http://jcm.asm.org/content/44/7/2524 Updated information and services can be found at: These include: SUPPLEMENTAL MATERIAL Supplemental material REFERENCES http://jcm.asm.org/content/44/7/2524#ref-list-1 at: This article cites 34 articles, 18 of which can be accessed free CONTENT ALERTS more» articles cite this article), Receive: RSS Feeds, eTOCs, free email alerts (when new http://journals.asm.org/site/misc/reprints.xhtml Information about commercial reprint orders: http://journals.asm.org/site/subscriptions/ To subscribe to to another ASM Journal go to: on July 24, 2014 by guest http://jcm.asm.org/ Downloaded from on July 24, 2014 by guest http://jcm.asm.org/ Downloaded from
-
Upload
independent -
Category
Documents
-
view
0 -
download
0
Transcript of Illustration of a Common Framework for Relating Multiple Typing Methods by Application to...

10.1128/JCM.02536-05.
2006, 44(7):2524. DOI:J. Clin. Microbiol. de Lencastre, J. S. Almeida and M. RamirezJ. A. Carriço, C. Silva-Costa, J. Melo-Cristino, F. R. Pinto, H. Streptococcus pyogenesApplication to Macrolide-Resistant Relating Multiple Typing Methods by Illustration of a Common Framework for
http://jcm.asm.org/content/44/7/2524Updated information and services can be found at:
These include:
SUPPLEMENTAL MATERIAL Supplemental material
REFERENCEShttp://jcm.asm.org/content/44/7/2524#ref-list-1at:
This article cites 34 articles, 18 of which can be accessed free
CONTENT ALERTS more»articles cite this article),
Receive: RSS Feeds, eTOCs, free email alerts (when new
http://journals.asm.org/site/misc/reprints.xhtmlInformation about commercial reprint orders: http://journals.asm.org/site/subscriptions/To subscribe to to another ASM Journal go to:
on July 24, 2014 by guesthttp://jcm
.asm.org/
Dow
nloaded from
on July 24, 2014 by guesthttp://jcm
.asm.org/
Dow
nloaded from

JOURNAL OF CLINICAL MICROBIOLOGY, July 2006, p. 2524–2532 Vol. 44, No. 70095-1137/06/$08.00�0 doi:10.1128/JCM.02536-05Copyright © 2006, American Society for Microbiology. All Rights Reserved.
Illustration of a Common Framework for Relating Multiple Typing Methodsby Application to Macrolide-Resistant Streptococcus pyogenes†
J. A. Carrico,1* C. Silva-Costa,2 J. Melo-Cristino,2 F. R. Pinto,1,2
H. de Lencastre,4,5 J. S. Almeida,1,3 and M. Ramirez2
Grupo de Biomatematica, Instituto de Tecnologia Quımica e Biologica, Universidade Nova de Lisboa, Oeiras, Portugal1;Instituto de Medicina Molecular e Instituto de Microbiologia, Faculdade de Medicina de Lisboa, Lisbon, Portugal2;
Department of Biostatistics and Applied Mathematics, University of Texas MD Anderson Cancer Center,Houston, Texas3; Laboratorio de Genetica Molecular, Instituto de Tecnologia Quımica e Biologica,
Universidade Nova de Lisboa, Oeiras, Portugal4; Laboratory of Microbiology,The Rockefeller University, New York, New York5
Received 6 December 2005/Returned for modification 14 March 2006/Accepted 10 May 2006
The studies that correlate the results obtained by different typing methodologies rely solely on qualitativecomparisons of the groups defined by each methodology. We propose a framework of measures for thequantitative assessment of correspondences between different typing methods as a first step to the globalmapping of type equivalences. A collection of 325 macrolide-resistant Streptococcus pyogenes isolates associatedwith pharyngitis cases in Portugal was used to benchmark the proposed measures. All isolates were charac-terized by macrolide resistance phenotyping, T serotyping, emm sequence typing, and pulsed-field gel electro-phoresis (PFGE), using SmaI or Cfr9I and SfiI. A subset of 41 isolates, representing each PFGE cluster, wasalso characterized by multilocus sequence typing (MLST). The application of Adjusted Rand and Wallaceindices allowed the evaluation of the strength and the directionality of the correspondences between the varioustyping methods and showed that if PFGE or MLST data are available one can confidently predict the emm type(Wallace coefficients of 0.952 for both methods). In contrast, emm typing was a poor predictor of PFGE clusteror MLST sequence type (Wallace coefficients of 0.803 and 0.655, respectively). This was confirmed by theanalysis of the larger data set available from http://spyogenes.mlst.net and underscores the necessity ofperforming PFGE or MLST to unambiguously define clones in S. pyogenes.
Typing methods are major tools for the epidemiologicalcharacterization of bacterial pathogens, allowing the determi-nation of the clonal relationships between isolates based ontheir genotypic or phenotypic characteristics. Recent techno-logical advances have resulted in a shift from classical phe-notypic typing methods, such as serotyping, biotyping, andantibiotic resistance typing, to molecular methods such as re-striction fragment length polymorphism (8), pulsed-field gelelectrophoresis (PFGE) (25), and PCR serotyping (4). Withthe availability of affordable sequencing methods, another shiftoccurred towards sequence-based typing methods such as mul-tilocus sequence typing (MLST) (18) and emm sequence typing(2). Sequence-based methods have a wide appeal since theyprovide unambiguous data and are intrinsically portable, al-lowing the creation of databases that, if publicly availablethrough the internet, enable the comparison of local data withthose of previous studies in different geographical locations.Ideally, an analysis of each typing method, in terms of discrim-inatory power, reproducibility, typeability, feasibility, and othercharacteristics as suggested by Struelens (31), should be per-formed to better determine which method is appropriate in agiven setting.
Several molecular epidemiology studies of clinically relevant
microorganisms provide a characterization of isolates based ondifferent typing methods (6, 8, 20, 23). Frequently these studiesfocus on a comparison between the assigned types of differenttyping methods, from a qualitative point of view, i.e., indicatingcorrespondences between the types of the different methods.Although this may be useful for the comparison of the geneticbackgrounds of the particular set of isolates under study, itdoes not allow for a broader view of how the results of thedifferent typing methods are related.
As more bacterial genomes are completed, novel typingmethods will appear based on the new information available.Comparisons of these new methods to those currently availableshould be complemented by a quantitative measure of howmuch information is gained from a new method in terms ofdiscriminatory power, type assignment, or even phylogeneticinformation about the isolates. It is conceivable that less-so-phisticated molecular methods can recover levels of informa-tion about the relationships between the isolates that are sim-ilar to those obtained with newer sequence-based methods.Since typing schemes analyze different phenotypic or genotypicproperties of bacteria, if some congruence between the meth-ods is found, it suggests that a phylogenetic signal is beingrecovered by both methods, allowing greater confidence aboutthe evolutionary hypothesis or clonal dispersion of the strainsunder study. These quantitative comparisons should allow theinformed choice of which typing method is more appropriate ina given clinical or microbiological research setting, also takinginto account other factors, such as the ability to identify iso-lates of interest, execution time, cost-effectiveness, or ease of
* Corresponding author. Mailing address: Rua da Quinta Grande 62780-156 Oeiras, Portugal. Phone: 351 21 446 98 55. Fax: 351 21 442 8766. E-mail: [email protected].
† Supplemental material for this article may be found at http://jcm.asm.org/.
2524
on July 24, 2014 by guesthttp://jcm
.asm.org/
Dow
nloaded from

interpretation of the results. A great diversity of typing meth-ods is used to characterize bacterial isolates, rendering thecomparison of the various studies difficult. If one could inferthe missing information from the available data provided ineach study, one could overcome this problem. In order to dothis, a method offering a quantitative assessment of the confi-dence of predicting an unknown character from another typingmethod or set of methods is needed.
Streptococcus pyogenes or group A streptococci (GAS) areknown to cause infections ranging from mild manifestations,such as pharyngitis, to severe invasive infections, such as strep-tococcal toxic shock syndrome and necrotizing fasciitis (7).These human pathogens provide a good case study for map-ping relationships between typing schemes, since multiple typ-ing methods have been used in their characterization, includ-ing T and M serotyping, antibiotic resistance typing, PFGE,restriction fragment length polymorphism (vir typing), emmsequence typing, and MLST (9, 17, 21). Although all thesemethods have proven useful for the characterization of GASisolates, phenotypic methods have declined in popularity andthe mainstream methods are now emm sequence typing,PFGE, and MLST. In the study that defined the MLST schemefor GAS, the authors compared MLST and emm sequencetyping and concluded that the majority of emm types defineclones or clonal complexes (9). This conclusion, together withthe existence of extensive data on serological M types that aredirectly comparable to emm sequence type data and a techni-cally simpler and more economic determination of emm typesas opposed to the characterization by MLST, led to the fre-quent use of emm typing as the main typing technique for GASclone definition. Notwithstanding the advantages of sequence-based methods, GAS virulence has been related to the pres-ence of phages and to horizontal transfer of large fragments ofDNA (1, 32). These observations suggest that techniques, likePFGE, that probe genomic organization could be more dis-criminative than sequence-based methods, since phage inser-tions can alter band positions in an agarose gel and, conse-quently, create more diversity within PFGE types.
In this paper we propose the use of measures of clusteringconcordance—Adjusted Rand (15, 24) and Wallace (34) coef-ficients—to compare type assignments, allowing a quantitativeapproach for exploring the concordance between typing meth-ods. The proposed methods were applied to a set of 325 mac-rolide-resistant GAS for which extensive typing informationwas available and, when possible, we generalized the conclu-sions based on this data set by using typing data available fromthe MLST database. The proposed framework also allows theevaluation of possible gains in discriminatory power obtainedby using different methods or any combination of typingschemes and the identification of which of the typing method-ologies used will be more informative in clone definition. Ul-timately, this framework may allow a mapping of type equiv-alences between typing methods.
MATERIALS AND METHODS
Strain collection. A collection of 325 macrolide-resistant S. pyogenes isolatesrecovered from throat swabs associated with a diagnosis of tonsillopharyngitis,from the period between 1998 and 2003 in Portugal, was analyzed. Results ofantimicrobial susceptibility testing, T typing, macrolide-resistant phenotypingand genotyping, and emm typing were reported previously (29). Eleven T types
were identified (1, 2, 4, 5/27/44, 6, 9, 12, 13, 25, 28, and B3264). Since twelveisolates were nontypeable by this method, the typeability of this method in ourcollection was 97%. All isolates were analyzed by PFGE using SfiI and eitherSmaI or Cfr9I endonucleases. Twelve emm sequence types were identified (1, 2,4, 6, 9, 11, 12, 22, 28, 75, 77, and 89). Forty-one strains were chosen for MLSTanalysis by selecting at least one isolate from each SmaI/Cfr9I cluster. Tensequence types (ST) were found (20, 28, 36, 38, 39, 45, 46, 52, 75, and 150) (28).
Gel analysis. A database of PFGE patterns was created in Bionumerics ver-sion 4.5 from Applied Maths (Sint-Martens-Latem, Belgium).
The gel digital photos acquired and stored in a Kodak EDAS 290 system wereimported into a Bionumerics database, as inverted 8-bit grayscale TIF images.
For each image, spectral analysis included in the software was used, to deter-mine the disk size that should be used in “rolling disk” background subtraction(Background scale) and the cutoff threshold for least-squares filtering (Wienercutoff scale). Furthermore, a median filter was used in the image to furthersmooth the densitometric curves.
After this image preprocessing, intergel and intragel normalizations of PFGEruns were done using a Lambda PFGE molecular marker (New England Biolabs,Ipswich, Ma.). All the gels had three markers in the first, middle, and last lanes.Ten lambda bands were used from 48.5 kb to 485 kb.
On all gel images, band assignment was manually curated after automatic banddetection. Bands ranging from 22.8 kb to 608 kb were considered in this study.
The settings used for comparing the strains’ PFGE patterns were 1.0% opti-mization and 1.5% band tolerance.
Diversity indices. Hunter and Gaston (16) proposed the use of Simpson’sindex of diversity (30) to measure the discriminatory ability of typing systems.This index indicates the probability of two strains sampled randomly from apopulation belonging to two different types. Grundmann et al. (13) proposed amethod for determining confidence intervals (CIs) of Simpson’s index, therebyimproving the objective assessment of the discriminatory power of typing tech-niques. The formulas of Simpson’s Index (D) and the CI are presented in thefollowing equations:
D � 1 �1
N�N � 1��j�1
S
nj�nj � 1�
�2 �4N���j
3 � ���j2�2�
CI � �D � 2��2, D � 2��2�
where N is the total number of strains in the sample population, S the totalnumber of types described, nj is the number of strains belonging to the jth type,and �j is the frequency nj/N.
Other diversity indices exist, such as the Shannon-Wiener index (27) andothers from the Hill family of indices, of which Simpson’s index is a special case(14). Notwithstanding, the ease of interpretation of Simpson’s index of diversityas a probability and the possibility of calculating a confidence interval justifies thechoice of this index in our study.
Clustering comparison coefficients: Rand, Adjusted Rand, and Wallace. Inmolecular epidemiology studies, the term cluster is frequently used to describe agroup of isolates sharing similar characteristics according to a given typingmethod. Frequently, the clusters are obtained by hierarchical methods, such asthe unweighted-pair group method with arithmetic means (UPGMA), providingfurther detail on the relationships of the isolates within clusters. In these cases,the definition of types relies on partitioning the resulting dendrogram at a givensimilarity value. In this paper, the terms partition, cluster, and type will be usedinterchangeably to identify a group of isolates sharing similar characteristicsaccording to a given typing method.
To compare two sets of results of different microbial typing methods, anobjective measure of agreement is needed. Several measures were developed forcomparing two sets of partitions (10, 15, 22, 24, 34), taking different approachesto how partitions should be compared. For their ease of interpretation, in thisstudy we use Adjusted Rand’s index and Wallace coefficient. Rand (24) andAdjusted Rand (15) are symmetric coefficients, i.e., they do not take into con-sideration which partition is considered the standard, while others, like the onesproposed by Wallace (34), do. It is also important to note in this context thatnone of the partitions tested are considered the “correct” partition in terms ofmicrobial typing.
Given two partition schemes of the same data set, P and P, all these coeffi-cients are calculated based on the fact that a pair of points (in microbial typing,a pair of points is a pair of isolates under study) from the data set will fall into
VOL. 44, 2006 QUANTITATIVE CORRESPONDENCES BETWEEN TYPING METHODS 2525
on July 24, 2014 by guesthttp://jcm
.asm.org/
Dow
nloaded from

one of the following conditions: a, the number of point pairs that are in the samecluster in P and P; b, the number of point pairs that are in the same cluster inP but not in P; c, the number of point pairs that are in the same cluster in P butnot in P; or d, the number of point pairs that are in different clusters in P and P.
The coefficients can then be defined as shown in Table 1.Rand’s index represents the proportion of agreement for both matches (a) and
mismatches (d). An acknowledged limitation of this coefficient is that, whencomparing two random partitions, the expected value of the Rand’s index doesnot take a null value (indicating nonagreement). To address this issue, Hubertand Arabie (15) assumed a hypergeometric distribution as the random model,adding a correction factor designed to take into account the presence of chanceagreement. The Hubert and Arabie’s Adjusted Rand index, here referred to
simply as Adjusted Rand, allows a better quantitative evaluation of the globalcongruence between the two partitions.
Wallace proposed two coefficients, based on Fowlkes and Mallows ’ coefficient(10). They are easy to interpret since they represent the probability that a pair ofpoints which are in the same cluster under P are also in the same cluster underP and vice versa.
Wallace’s coefficients provide an estimate of, given a typing method, how muchnew information is obtained from another typing method. A high value ofWallace’s coefficient indicates that partitions defined by a given method couldhave been predicted from the results of another method, suggesting that the useof both methodologies is redundant.
To facilitate the use of these indices in studies conducted by others, we havemade available a Bionumerics script that calculates these indices from any twosets of data generated by different typing methods. The script can be downloadedfrom http://biomath.itqb.unl.pt/ClusterComp.
Visual representation of cluster congruence. To facilitate the interpretationand representation of the comparisons between partitions, we developed a visualmethod where all the clusters and cases under comparison are represented in afigure similar to a sequence dot plot (12, 19). The strains are ordered by type andcluster size for each of the typing methods under comparison. A dot is thenplotted at the intersection of the position of each strain. Vertical and horizontallines delimit the clusters in the figure.
Examples of this visual representation are shown in Fig. 2D and in Fig. SA1 inthe supplemental material.
RESULTS
Pulsed-field gel electrophoresis. For this study, 325 iso-lates of S. pyogenes were analyzed by PFGE, using tworestriction enzymes: SfiI and either one of two isoschi-zomers—SmaI or Cfr9I. The use of Cfr9I was necessarysince the majority of the 150 isolates presenting macrolide
FIG. 1. PFGE profiles of three pairs of macrolide-resistant isolates generated after digestion with either SmaI, Cfr9I, SfiI, or ApaI. The isolatesin pair 1 were refractory to cleavage with SmaI similarly to what was previously reported in the literature for isolates presenting the M phenotype(21) and showed identical profiles upon digestion with Cfr9I, SfiI, and ApaI. The isolates in pair 2 were digested by both SmaI and Cfr9I and, asexpected, the profile of each isolate was identical with either endonuclease. The isolates in pair 2 showed different SmaI/Cfr9I and ApaI profilesbut were indistinguishable by SfiI. The isolates in pair 3 were refractory to cleavage with SmaI and presented different profiles upon digestion withCfr9I (four-band difference). These isolates presented identical SfiI profiles but exhibited different profiles with ApaI. m, lambda ladder PFGmarker (New England Biolabs, Beverly, Ma.).
TABLE 1. Clustering comparison coefficients: Rand, AdjustedRand, and Wallace
Coefficient Formula (s)a
Randa � d
a � b � c � da � d nc
a � b � c � d nc
Adjusted Rand nc �
n�n2 � 1� � �n � 1��ni2 � �n � 1��nj
2 � 2��ni2nj
2
n2�n � 1�
Wallace WI(P, P) �a
a � b
WII(P, P) �a
a � ca See the text for definitions of a, b, c, and d; n represents the number of strains
under study, ni and nj represent the numbers of strains in types i and j ofpartitions P and P, respectively.
2526 CARRICO ET AL. J. CLIN. MICROBIOL.
on July 24, 2014 by guesthttp://jcm
.asm.org/
Dow
nloaded from

resistance phenotype M were refractory to cleavage withSmaI, in agreement with previous studies (21). As expected,DNA of isolates that were digested with SmaI presentedidentical band patterns when digested with Cfr9I (Fig. 1). Inthis way the use of Cfr9I increased the typeability of PFGEto 100%, compared to 54% (175/325) estimated for the useof SmaI alone, in our collection.
In previous studies, SfiI is the endonuclease most frequentlyused to characterize M isolates by PFGE (21), although a fewstudies use ApaI (3). There was a concern that SfiI patterns didnot allow sufficient discrimination, since these patterns hadonly 3 to 10 bands, compared to SmaI/Cfr9I patterns thatpresented 8 to 17 bands (Fig. 1). This hypothesis was testedusing Simpson’s index of diversity and Adjusted Rand to de-termine the threshold that better defines types compared tothose defined by SmaI/Cfr9I.
The Adjusted Rand index was calculated for each possiblecombination of partitions given by varying the threshold cutoffsfor each UPGMA/Dice dendrogram using SfiI and SmaI/Cfr9Iendonucleases similarly to what was previously described (5).The threshold value that produced the maximum coefficientvalue was determined, and the results are displayed in Fig. 2.
The maximum value of Adjusted Rand of 0.771 was found ata threshold level of 77% similarity in the Dice/UPGMA den-drogram of SmaI/Cfr9I and at a 68% similarity in the SfiIdendrogram.
An 80% similarity value was previously shown to be usefuland concordant with proposed visual comparison criteria whendefining types by Dice/UPGMA dendrograms of SmaI profilesof Streptococcus pneumoniae (5, 11, 26, 33). At this commonlyused similarity threshold cutoff, a maximum Adjusted Randvalue of 0.765 was found, corresponding to a threshold value of68% in the SfiI dendrogram. Due to its acceptance as the cutoffvalue to define clusters in SmaI Dice/UPGMA dendrogramsand the small difference observed in the value of AdjustedRand at these two threshold levels, we opted to use the 80%cutoff for SmaI/Cfr9I and the 68% cutoff for SfiI in the re-mainder of the analysis.
At these cutoff values, 21 clusters were defined by eitherSmaI/Cfr9I or SfiI. Simpson’s index of diversity calculations forthe partitions found at these threshold levels for either endo-nuclease were of the same value of 0.81 (95% CI, 0.78–0.84),resulting in equal discriminatory power for SmaI/Cfr9I and SfiI(Table 2).
FIG. 2. Panel A. Adjusted Rand values for all possible cutoff values in each of the SmaI/Cfr9I and SfiI dendrograms (in panels B and C). PanelB. Dice/UPGMA dendrogram for SfiI band patterns of the 325 isolates. Panel C. Dice/UPGMA dendrogram for SmaI/Cfr9I band patterns of the325 isolates. Panel D. Visual representation of cluster congruence between SmaI/Cfr9I and SfiI clusters at the cutoff levels indicated in panels Band C.
VOL. 44, 2006 QUANTITATIVE CORRESPONDENCES BETWEEN TYPING METHODS 2527
on July 24, 2014 by guesthttp://jcm
.asm.org/
Dow
nloaded from

Comparing typing methods. Simpson’s index of diversityprovides a measure of the discriminatory power of the differenttyping methods as applied to our study data. Table 2 summa-rizes this coefficient for the methods used: T typing, emmtyping, a combination of both these methods, PFGE typingdefined at an 80% cutoff value on the SmaI/Cfr9I Dice/UPGMA dendrogram, macrolide resistance phenotyping,PFGE typing defined at a 68% cutoff value on the SfiI Dice/UPGMA dendrogram, and MLST data.
For comparing the congruence between type assignments ofthe different typing methods, adjusted Rand and Wallace co-efficients were calculated for the subset of 41 isolates for whichthe results of all typing methods were available. These isolatesare a diverse collection representing most of the types definedby the various methods in the entire collection of 325 isolates.The results are shown in Fig. 3A and in Tables SA1 and SA2in the supplemental material. The data indicate a strong cor-relation between the information provided by SmaI/Cfr9IPFGE, MLST, and emm typing. It is interesting to note thatthere was a robust bidirectional correspondence betweenSmaI/Cfr9I PFGE types and ST. In contrast, a strong corre-spondence was found only in the direction of emm type forboth ST and SmaI/Cfr9I PFGE types but not in the reversedirection (Fig. 3A).
To increase the robustness of the values of the AdjustedRand and Wallace coefficients for the correspondences be-tween the various typing methods utilized to characterize GAS,we excluded the MLST data and used the entire collection of325 isolates for which information regarding all other typingmethods was available. The results are shown in Tables 3 and4. The values of Rand and Wallace coefficients were consis-tently higher when considering the 325 isolates. This was onlyexpected if the smaller data set of 41 isolates already reflectedthe true correspondences between the various typing methods.
Previous publications indicated that emm types definedclones as assessed by MLST (9). Our limited data suggested amore complex relationship between emm typing and MLST(Fig. 4), resembling the comparison between emm and SmaI/Cfr9I PFGE types for our entire data set (see Fig. SA1 in thesupplemental material).
FIG. 3. (A) Representation of correspondences between the typingmethods used in the 41-strain subset, calculated by Wallace coeffi-cients. The arrows represent Wallace coefficients of �0.60.(B) Repre-sentation of correspondences between the typing methods used in the325-strain data set and on the 795 strains from www.mlst.net, calcu-lated by Wallace coefficients. The arrows represent Wallace coeffi-cients of �0.60.
TABLE 2. Number of types and Simpson’s index ofdiversity of each typing method
Typing method No. oftypes found
Simpson’s index ofdiversity (95% CI)
No. of isolatestyped
(% typeability)
T typing 12 0.72 (0.68–0.77) 316 (97)a
emm typing 12 0.77 (0.74–0.81) 325 (100)T � emm typing 33 0.81 (0.77–0.84) 325 (100)SmaI/Cfr9I 80% 21 0.81 (0.78–0.84) 325 (100)MRPb 3c 0.51 (0.50–0.53) 325 (100)SfiI 68% 21 0.81 (0.78–0.84) 325 (100)MLST 10 —d 41 (100)
a Twelve strains were nontypeable. For the purpose of calculating the Simp-son’s index of diversity, they were all considered to belong to the same group.
b MRP, macrolide resistance phenotyping.c Three macrolide resistance phenotypes were considered: M, cMLSB, and
iMLSB.d —, Simpson’s index of diversity was not calculated for the 41 isolates since it
would not be comparable to the remaining results calculated for the entire325-isolate data set.
2528 CARRICO ET AL. J. CLIN. MICROBIOL.
on July 24, 2014 by guesthttp://jcm
.asm.org/
Dow
nloaded from
To better evaluate the discriminatory power of MLST, wecalculated Simpson’s index of diversity for the 795 strains thathad unambiguous information about both ST and emm type inthe S. pyogenes MLST database (http://spyogenes.mlst.net;with a total of 847 isolates on 29 August 2005). Likewise, thesame index was calculated for emm type to provide a moreglobal view than that afforded by our data set. The results areshown in Table 5. The same could not be done for T types,since only 90 strains had T type information; 23 of those werenontypeable, and the majority of the 67 remaining strains hadambiguous information (two types). The distribution in thisdata set of emm sequence types per ST, and vice versa, as wellas the overall concordance between emm typing and MLSTamong the strains in the S. pyogenes MSLT database can befound in the supplemental material (Fig. SA2 and SA3).
The Adjusted Rand for the comparison of the clustering byMLST and emm typing is 0.77, indicating a good overall matchbetween partitions. The Wallace coefficient provides more in-formation: considering ST as the standard for comparison, thevalue of Wallace’s index is 0.952, i.e., the probability of twostrains having the same ST also sharing the same emm type is95%. However, the probability of two isolates that share thesame emm type sharing the same ST is only 66% (Wallace’sindex is 0.655) (Table 5).
The correspondences between the various typing methodsdefined by using these expanded data sets are graphically rep-resented in Fig. 3B.
DISCUSSION
The primary objective of this report was to provide a frame-work for the quantitative assessment of correspondence be-tween type assignments obtained by different microbial typingmethods. This quantification is achieved by the use of Simp-son’s index of diversity, Hubert and Arabie’s Adjusted Rand,and the Wallace coefficient and is complemented by the visu-alization of the congruence between partitions generated bydifferent typing methods.
An important application of the proposed framework is inevaluating if clusters generated by a given typing method couldhave been predicted by another methodology, allowing theevaluation of the usefulness of using several typing methods tocharacterize the same collection of isolates. This is also impor-tant in benchmarking the novel information offered by newtyping schemes and in establishing if one can infer unknown
typing information for a given isolate from other known char-acters.
While Simpson’s index was previously used in this context(16) and it allows for a measure of the discriminatory power ofa typing method, it does not evaluate the degree of equivalencebetween type assignments of two distinct typing methods. Thisgoal is achieved here by the Adjusted Rand index, which pro-vides an overall measure of the congruence between two typingmethods. On the other hand, Wallace’s coefficient is moreinformative and offers a clear interpretation since it representsthe probability that a pair of strains which are assigned to thesame type by one method are also classified in the same type bythe other method. To facilitate the use of these indices instudies conducted by others, we have made available a Bionu-merics script that calculates these indices from any two sets ofpartitions generated by different typing methods. To test thevalidity of the framework proposed, we applied it to a collec-tion of macrolide-resistant GAS characterized by T serotyping,emm sequence typing, PFGE using two different endonucle-ases, and MLST.
Although intuitively we could expect that the PFGE bandpatterns generated after SfiI digestion would be less discrimi-natory than those of SmaI/Cfr9I, since the former presentedfewer bands, this was not the case. The clusters defined byeither SmaI/Cfr9I or SfiI, at the cutoff levels showing the high-est agreement, showed the same Simpson’s index value,namely, 0.81 (95% CI, 0.78 to 0.84).
In spite of the similar discriminatory powers, SmaI/Cfr9I andSfiI assigned a significant number of isolates to different types(Adjusted Rand, 0.765). The value of the Wallace index wasalmost the same in either direction and indicated that as manyas one out of every five pairs of isolates classified in the samecluster by an endonuclease are in separate clusters using theother endonuclease. This is represented in Fig. 2D, where itcan be seen that isolates that belong to a single cluster whenusing one endonuclease were scattered into at least two otherclusters when using the other.
In view of this data, which endonuclease is more suitable fortyping macrolide-resistant S. pyogenes? A weaker correspon-dence between SfiI PFGE and the other typing methods isshown in Fig. 3A, where no line connects SfiI PFGE and Ttypes whereas multiple correspondences are associated withSmaI/Cfr9I PFGE types. When using the full data set of 325isolates this was not so pronounced, but the correspondencesestablished between SmaI/Cfr9I PFGE and the other typingmethods were consistently stronger than those observed for
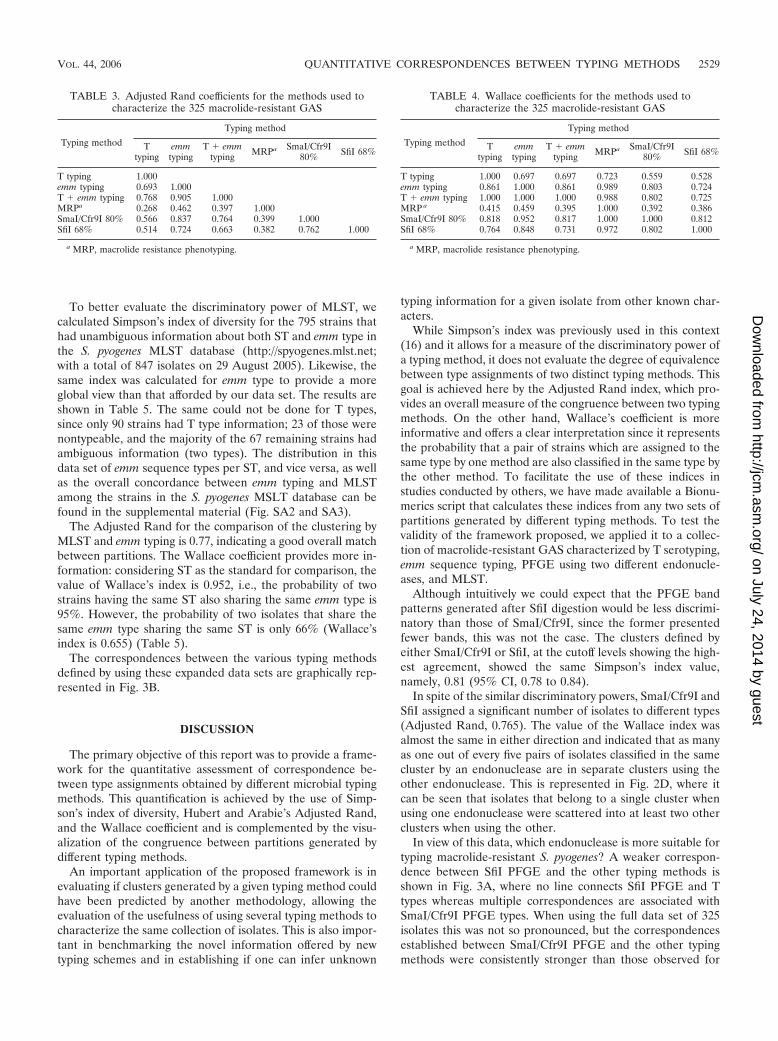
TABLE 3. Adjusted Rand coefficients for the methods used tocharacterize the 325 macrolide-resistant GAS
Typing method
Typing method
Ttyping
emmtyping
T � emmtyping MRPa SmaI/Cfr9I
80% SfiI 68%
T typing 1.000emm typing 0.693 1.000T � emm typing 0.768 0.905 1.000MRPa 0.268 0.462 0.397 1.000SmaI/Cfr9I 80% 0.566 0.837 0.764 0.399 1.000SfiI 68% 0.514 0.724 0.663 0.382 0.762 1.000
a MRP, macrolide resistance phenotyping.
TABLE 4. Wallace coefficients for the methods used tocharacterize the 325 macrolide-resistant GAS
Typing method
Typing method
Ttyping
emmtyping
T � emmtyping MRPa SmaI/Cfr9I
80% SfiI 68%
T typing 1.000 0.697 0.697 0.723 0.559 0.528emm typing 0.861 1.000 0.861 0.989 0.803 0.724T � emm typing 1.000 1.000 1.000 0.988 0.802 0.725MRP a 0.415 0.459 0.395 1.000 0.392 0.386SmaI/Cfr9I 80% 0.818 0.952 0.817 1.000 1.000 0.812SfiI 68% 0.764 0.848 0.731 0.972 0.802 1.000
a MRP, macrolide resistance phenotyping.
VOL. 44, 2006 QUANTITATIVE CORRESPONDENCES BETWEEN TYPING METHODS 2529
on July 24, 2014 by guesthttp://jcm
.asm.org/
Dow
nloaded from

SfiI PFGE (Fig. 3B). We would therefore argue that the groupsdefined by SmaI/Cfr9I, by being more concordant with othertyping methods, are more likely to accurately represent thetrue relationships between the isolates, justifying the use ofthese endonucleases in typing GAS isolates by PFGE. The useof the SmaI isoschizomer Cfr9I was essential in increasing thetypeability of macrolide-resistant GAS, since the majority ofthe isolates presenting the M phenotype were refractory tocleavage by SmaI but were susceptible to digestion withCfr9I (Fig. 1). A combination of the two endonucleases istherefore recommended for the characterization of macro-lide-resistant GAS.
If two isolates belong to the same cluster according to SmaI/Cfr9I, one can predict confidently that they will also share thesame emm sequence type (Wallace, 0.952). The reverse cor-respondence, on the other hand, cannot be made with thesame certainty since only four out of five pairs of strainssharing the same emm sequence type were also grouped intothe same SmaI/Cfr9I cluster (Wallace, 0.803). Even consid-
ering that SmaI/Cfr9I PFGE was comparable to emm se-quence typing in terms of discriminatory power (Table 2), itwas more informative given its predictive power over emmsequence typing (Fig. 3B).
T typing alone, although presenting a Simpson’s index ofdiversity similar to that with emm sequence typing, separatedthe isolates into groups that could not be mapped confidentlyin any of the other typing methods, indicating that this meth-odology is poorly congruent with any of the others (Fig. 3). Thecombination of T typing and emm sequence typing showed adiscriminatory power comparable to that of SmaI/Cfr9I (Table2), but it did not improve the mapping relative to emm typingalone as demonstrated by Adjusted Rand and Wallace coeffi-cients (Table 3 and Table 4). A drawback of using the combi-nation of these two methods was the reduced typeability of Ttyping compared with all other typing methods and the neces-sity of maintaining a set of specific sera for T typing.
When comparing the ST of the 795 isolates referenced in theMLST database, what had started to emerge with our limiteddata set of 41 isolates became clear: the majority of emm typessubdivide themselves into two or more ST (see Fig. SA3 in thesupplemental material). This is supported by a Wallace coef-ficient of 0.655 when comparing emm types using MLST as astandard. In the reverse comparison, a Wallace coefficient of0.952 implies that when two strains have the same ST we willonly misclassify them according to their emm types once out ofevery 20 pairs. These results show that clone definition byMLST is more consistent than by emm sequence typing.
FIG. 4. Relationship between MLST and emm sequence typing for the 41 strains. In this example, the figure illustrates the fact that the majorityof strains with emm type 22, the most frequent emm type in this subset, presented ST 46, and two isolates presented ST 52. However, the majorityof the strains with ST 52 have emm sequence type 28.
TABLE 5. Diversity indices and Wallace coefficients for emmtyping and MLST data available from the online MLST database
Typing method No. oftypes found
Simpson’s index ofdiversity (95% CI)
Wallace coefficient
MLST emm typing
MLST 274 0.985 (0.982–0.988) 1.000 0.952emm typing 155 0.978 (0.975–0.981) 0.655 1.000
2530 CARRICO ET AL. J. CLIN. MICROBIOL.
on July 24, 2014 by guesthttp://jcm
.asm.org/
Dow
nloaded from

The correspondences between the various typing methodsillustrated in Fig. 3B argue that performing either PFGE usingSmaI and Cfr9I endonucleases or MLST is sufficient to predictthe emm type of the isolates with less than 5% error but thatone cannot accurately predict ST or SmaI/Cfr9I PFGE typesfrom emm data.
A comprehensive comparison between SmaI/Cfr9I PFGEand MLST is outside the scope of this paper. The limited dataavailable from the smaller data set of 41 isolates for which wehad MLST information suggested that there is a strong map-ping between SmaI/Cfr9I PFGE types and MLST (Fig. 3A;also see Tables SA1 and SA2 in the supplemental material).This was also supported by the similar relationship of each ofthese methods with emm typing (Fig. 3B). In spite of the roleof bacteriophages and of the horizontal exchange of largefragments of genomic DNA in the evolution of virulent GASstrains (1, 32), these observations argued in favor of equallygood results when using SmaI/Cfr9I PFGE or MLST to char-acterize GAS. However, the choice of isolates for which MLSTwas determined reflects the SmaI/Cfr9I PFGE type assign-ment, so further studies are necessary to clarify which of thetwo typing methods would provide a more discriminatory andinformative clone definition.
Our data set represented a diverse group of GAS as docu-mented by the use of the various typing methods; for instance,21 SmaI/Cfr9I PFGE types were defined. However, it could beargued that these isolates do not accurately represent theglobal diversity of S. pyogenes since they are restricted to mac-rolide-resistant GAS recovered in Portugal during a limitedtime period. This would prevent the generalization of the re-sults presented. Although it is certainly true that there waslimited diversity in our collection, the expected clonal structureof such a geographically and temporally limited populationwould reinforce the correspondences between the differenttyping methods, increasing the values of adjusted Rand andWallace coefficients. This was not observed for all methods andWallace coefficients showed strong asymmetries depending onthe directionality, suggesting that the results did not reflect aparticular clonal composition of the studied population but aregeneral properties of the typing methods used. This was fur-ther supported by the analysis of the more extensive dataavailable from the MLST online database that strengthenedthe conclusions emerging from the study of our data set re-garding the relationship between emm typing and MLST.
When using PFGE to characterize macrolide-resistant GAS,the results were in favor of the use of SmaI, complemented byits isoschizomer Cfr9I to circumvent the resistance to cleavageof M isolates as documented previously (21), against the alter-native endonuclease SfiI. The analysis also highlighted theimportance of using PFGE and MLST, in addition to emmtyping, in the characterization of GAS due to the poor predic-tive value of the latter over the groups defined by the former.
As the data compiled in online databases (such as www.mlst.net) increases, the framework of methods presented will pro-vide further insights into the relationships between isolates,eventually enabling a generic mapping between the differenttyping methods. The congruence of results between typingmethods suggests that a phylogenetic signal is indeed beingrecovered by the typing data generated by different methods.Accordingly, the progressive identification of mapping func-
tions, such as the probability matrices for agreement of typeassignments represented in the supplemental material (Fig.SA4.1 and SA4.2), indicates that a consensus assessment of therelationships between the different types will soon be at hand.Such a tool would allow not only for comparisons of typingresults obtained by different methods but would also facilitatethe joint analyses of multiple typing methods.
ACKNOWLEDGMENTS
J. A. Carrico and F. R. Pinto were supported by grants SFRH/BD/3123/2000 and SFRH/BD/6488/2001, respectively, both from the Fun-dacao para a Ciencia e Tecnologia, Portugal.
Partial support for this work was provided by PREVIS (LSHM-CT-2003-503413 from the European Community awarded to J. S. Almeida,H. de Lencastre, and J. Melo-Cristino) and by a grant from the Fun-dacao Calouste Gulbenkian awarded to J. Melo-Cristino and M.Ramirez.
This publication made use of the Multi Locus Sequence Typingwebsite (http://www.mlst.net) at Imperial College London developedby David Aanensen and Man-Suen Chan and funded by the WellcomeTrust.
REFERENCES
1. Aziz, R. K., R. A. Edwards, W. W. Taylor, D. E. Low, A. McGeer, and M.Kotb. 2005. Mosaic prophages with horizontally acquired genes account forthe emergence and diversification of the globally disseminated M1T1 cloneof Streptococcus pyogenes. J. Bacteriol. 187:3311–3318.
2. Beall, B., R. R. Facklam, J. A. Elliott, A. R. Franklin, T. Hoenes, D. Jackson,L. Laclaire, T. Thompson, and R. Viswanathan. 1998. Streptococcal emmtypes associated with T-agglutination types and the use of conserved emmgene restriction fragment patterns for subtyping group A streptococci.J. Med. Microbiol. 47:893–898.
3. Billal, D. S., M. Hotomi, K. Yamauchi, K. Fujihara, S. Tamura, K. Kuki, R.Sugita, M. Endou, J. Mukaigawa, and N. Yamanaka. 2004. Macrolide-resis-tant genes of Streptococcus pyogenes isolated from the upper respiratory tractby polymerase chain reaction. J. Infect. Chemother. 10:115–120.
4. Brito, D. A., M. Ramirez, and H. de Lencastre. 2003. Serotyping Streptococ-cus pneumoniae by multiplex PCR. J. Clin. Microbiol. 41:2378–2384.
5. Carrico, J. A., F. R. Pinto, C. Simas, S. Nunes, N. G. Sousa, N. Frazao, H.de Lencastre, and J. S. Almeida. 2005. Assessment of band-based similaritycoefficients for automatic type and subtype classification of microbial isolatesanalyzed by pulsed-field gel electrophoresis. J. Clin. Microbiol. 43:5483–5490.
6. Coenye, T., T. Spilker, A. Martin, and J. J. LiPuma. 2002. Comparativeassessment of genotyping methods for epidemiologic study of Burkholderiacepacia genomovar III. J. Clin. Microbiol. 40:3300–3307.
7. Cunningham, M. W. 2000. Pathogenesis of group A streptococcal infections.Clin. Microbiol. Rev. 13:470–511.
8. de Lencastre, H., I. Couto, I. Santos, J. Melo-Cristino, A. Torres-Pereira,and A. Tomasz. 1994. Methicillin-resistant Staphylococcus aureus disease ina Portuguese hospital: characterization of clonal types by a combination ofDNA typing methods. Eur. J. Clin. Microbiol. Infect. Dis. 13:64–73.
9. Enright, M. C., B. G. Spratt, A. Kalia, J. H. Cross, and D. E. Bessen. 2001.Multilocus sequence typing of Streptococcus pyogenes and the relationshipsbetween emm type and clone. Infect. Immun. 69:2416–2427.
10. Fowlkes, E. B., and C. L. Mallows. 1983. A method for comparing twohierarchical clusterings. J. Am. Stat. Assoc. 78:553–569.
11. Gertz, R. E., Jr., M. C. McEllistrem, D. J. Boxrud, Z. Li, V. Sakota, T. A.Thompson, R. R. Facklam, J. M. Besser, L. H. Harrison, C. G. Whitney, andB. Beall. 2003. Clonal distribution of invasive pneumococcal isolates fromchildren and selected adults in the United States prior to 7-valent conjugatevaccine introduction. J. Clin. Microbiol. 41:4194–4216.
12. Gibbs, A. J., and G. A. McIntyre. 1970. The diagram, a method for compar-ing sequences. Its use with amino acid and nucleotide sequences. Eur. J. Bio-chem. 16:1–11.
13. Grundmann, H., S. Hori, and G. Tanner. 2001. Determining confidenceintervals when measuring genetic diversity and the discriminatory abilities oftyping methods for microorganisms. J. Clin. Microbiol. 39:4190–4192.
14. Hill, M. 1973. Diversity and evenness: a unifying notation and its conse-quences. Ecology 54:427–432.
15. Hubert, L., and P. Arabie. 1985. Comparing partitions. J. Classification2:193–218.
16. Hunter, P. R., and M. A. Gaston. 1988. Numerical index of the discrimina-tory ability of typing systems: an application of Simpson’s index of diversity.J. Clin. Microbiol. 26:2465–2466.
17. Kataja, J., P. Huovinen, A. Efstratiou, E. Perez-Trallero, and H. Seppala.
VOL. 44, 2006 QUANTITATIVE CORRESPONDENCES BETWEEN TYPING METHODS 2531
on July 24, 2014 by guesthttp://jcm
.asm.org/
Dow
nloaded from

2002. Clonal relationships among isolates of erythromycin-resistant Strepto-coccus pyogenes of different geographical origin. Eur. J. Clin. Microbiol.Infect. Dis. 21:589–595.
18. Maiden, M. C., J. A. Bygraves, E. Feil, G. Morelli, J. E. Russell, R. Urwin,Q. Zhang, J. Zhou, K. Zurth, D. A. Caugant, I. M. Feavers, M. Achtman, andB. G. Spratt. 1998. Multilocus sequence typing: a portable approach to theidentification of clones within populations of pathogenic microorganisms.Proc. Natl. Acad. Sci. USA 95:3140–3145.
19. Maizel, J. V., Jr., and R. P. Lenk. 1981. Enhanced graphic matrix analysis ofnucleic acid and protein sequences. Proc. Natl. Acad. Sci. USA 78:7665–7669.
20. Malachowa, N., A. Sabat, M. Gniadkowski, J. Krzyszton-Russjan, J. Empel,J. Miedzobrodzki, K. Kosowska-Shick, P. C. Appelbaum, and W. Hryniewicz.2005. Comparison of multiple-locus variable-number tandem-repeat analysiswith pulsed-field gel electrophoresis, spa typing, and multilocus sequence typingfor clonal characterization of Staphylococcus aureus isolates. J. Clin. Microbiol.43:3095–3100.
21. Malhotra-Kumar, S., C. Lammens, S. Chapelle, M. Wijdooghe, J. Piessens,K. Van Herck, and H. Goossens. 2005. Macrolide- and telithromycin-resis-tant Streptococcus pyogenes, Belgium, 1999–2003. Emerg. Infect. Dis. 11:939–942.
22. Milligan, G. W., and M. C. Cooper. 1986. A study of comparability ofexternal criteria for hierarchical cluster analysis. Multivariate Behav. Res.21:441–458.
23. Nemoy, L. L., M. Kotetishvili, J. Tigno, A. Keefer-Norris, A. D. Harris, E. N.Perencevich, J. A. Johnson, D. Torpey, A. Sulakvelidze, J. G. Morris, Jr., andO. C. Stine. 2005. Multilocus sequence typing versus pulsed-field gel elec-trophoresis for characterization of extended-spectrum beta-lactamase-pro-ducing Escherichia coli isolates. J. Clin. Microbiol. 43:1776–1781.
24. Rand, W. M. 1971. Objective criteria for the evaluation of clustering meth-ods. J. Am. Stat. Assoc. 66:846–850.
25. Schwartz, D. C., and C. R. Cantor. 1984. Separation of yeast chromosome-sized DNAs by pulsed field gradient gel electrophoresis. Cell 37:67–75.
26. Serrano, I., J. Melo-Cristino, J. A. Carrico, and M. Ramirez. 2005. Charac-terization of the genetic lineages responsible for pneumococcal invasivedisease in Portugal. J. Clin. Microbiol. 43:1706–1715.
27. Shannon, C. E. 1948. A mathematical theory of communication. Bell Syst.Tech. J. 27:379–423, 623–656.
28. Silva-Costa, C., M. Ramirez, and J. Melo-Cristino. 2006. Identification ofmacrolide-resistant clones of Streptococcus pyogenes in Portugal. Clin. Mi-crobiol. Infect. 12:513–518.
29. Silva-Costa, C., M. Ramirez, and J. Melo-Cristino. 2005. Rapid inversion ofthe prevalences of macrolide resistance phenotypes paralleled by a diversi-fication of T and emm types among Streptococcus pyogenes in Portugal.Antimicrob. Agents Chemother. 49:2109–2111.
30. Simpson, E. H. 1949. Measurement of species diversity. Nature 163:688.31. Struelens, M. J. 1996. Consensus guidelines for appropriate use and evalu-
ation of microbial epidemiologic typing systems. Clin. Microbiol. Infect.2:2–11.
32. Sumby, P., S. F. Porcella, A. G. Madrigal, K. D. Barbian, K. Virtaneva, S. M.Ricklefs, D. E. Sturdevant, M. R. Graham, J. Vuopio-Varkila, N. P. Hoe, andJ. M. Musser. 2005. Evolutionary origin and emergence of a highly successfulclone of serotype M1 group A Streptococcus involved multiple horizontalgene transfer events. J. Infect. Dis. 192:771–782.
33. Tenover, F. C., R. D. Arbeit, R. V. Goering, P. A. Mickelsen, B. E. Murray,D. H. Persing, and B. Swaminathan. 1995. Interpreting chromosomal DNArestriction patterns produced by pulsed-field gel electrophoresis: criteria forbacterial strain typing. J. Clin. Microbiol. 33:2233–2239.
34. Wallace, D. L. 1983. A method for comparing two hierarchical clusterings:comment. J. Am. Stat. Assoc. 78:569–576.
2532 CARRICO ET AL. J. CLIN. MICROBIOL.
on July 24, 2014 by guesthttp://jcm
.asm.org/
Dow
nloaded from