Macrolide antibiotics allosterically predispose the ribosome for translation arrest
Upload
independentCategory
view
1download
0
ENVIRONMENTAL MICROBIOLOGY
Molecular Ecology Of Macrolide–Lincosamide–StreptograminB Methylases in Waste Lagoons and Subsurface WatersAssociated with Swine Production
Satoshi Koike & Rustam I. Aminov & A. C. Yannarell &Holly D. Gans & Ivan G. Krapac &
Joanne C. Chee-Sanford & Roderick I. Mackie
Received: 10 July 2009 /Accepted: 23 October 2009 /Published online: 19 November 2009# Springer Science + Business Media, LLC 2009
Abstract RNA methylase genes are common antibioticresistance determinants for multiple drugs of the macrolide,lincosamide, and streptogramin B (MLSB) families. Weused molecular methods to investigate the diversity,distribution, and abundance of MLSB methylases in wastelagoons and groundwater wells at two swine farms with ahistory of tylosin (a macrolide antibiotic structurally relatedto erythromycin) and tetracycline usage. Phylogeneticanalysis guided primer design for quantification of MLSBresistance genes found in tylosin-producing Streptomyces(tlr(B), tlr(D)) and commensal/pathogenic bacteria (erm(A),erm(B), erm(C), erm(F), erm(G), erm(Q)). The nearabsence of tlr genes at these sites suggested a lack ofnative antibiotic-producing organisms. The gene combina-tion erm(ABCF) was found in all lagoon samples analyzed.These four genes were also detected with high frequency inwells previously found to be contaminated by lagoonleakage. A weak correlation was found between thedistribution of erm genes and previously reported patterns
of tetracycline resistance determinants, suggesting thatdissemination of these genes into the environment is notnecessarily linked. Considerations of gene origins in history(i.e., phylogeny) and gene distributions in the landscapeprovide a useful “molecular ecology” framework forstudying environmental spread of antibiotic resistance.
Introduction
The widespread use of antimicrobial agents has contributedto an increase in antibiotic resistance in pathogenic andcommensal microorganisms of humans and animals. In theUSA, antibiotics are commonly used in animal agriculturefor disease treatment, prophylaxis, and growth promotion,and these practices can select for antibiotic resistance inanimal-associated bacteria [43]. Recent studies suggest thatanimal waste can contribute antibiotic-resistant bacteriaand/or their genes to the environment [1, 2, 8, 11, 17, 19,
S. Koike, R. I. Aminov, and A. C. Yannarell contributed equally tothis work.
S. Koike :A. C. Yannarell :H. D. Gans : R. I. Mackie (*)Department of Animal Sciences,University of Illinois at Urbana-Champaign,1207 W. Gregory Dr.,Urbana, IL 61801, USAe-mail: [email protected]
R. I. AminovRowett Institute of Nutrition and Health, University of Aberdeen,Aberdeen AB21 9SB, UK
I. G. KrapacIllinois State Geological Survey,Champaign, IL 61820, USA
J. C. Chee-SanfordUSDA Agricultural Research Service,Urbana, IL 61801, USA
A. C. Yannarell : R. I. MackieInstitute for Genomic Biology,University of Illinois at Urbana-Champaign,Urbana, IL, USA
Present Address:S. KoikeResearch Faculty of Agriculture,Hokkaido University,Sapporo 060-8589, Japan
Microb Ecol (2010) 59:487–498DOI 10.1007/s00248-009-9610-0

44, 45]. Thus, animal production facilities are increasinglyviewed as potential reservoirs for antibiotic resistance[29, 38].
The antibiotic tylosin is commonly used in poultry,swine, and cattle feedlots in the USA [9]. Tylosin belongsto the macrolide family of antibiotics along with erythro-mycin, which is an important alternative therapeutic intreating infections in humans [31]. Tylosin and erythromy-cin inhibit protein synthesis in bacteria by binding to the50S ribosomal subunit, and one of the most widespreadmechanisms of macrolide resistance in clinical isolatesinvolves the methylation of a specific adenine residue(A2058) on the 23S rRNA [35, 36]. This methylationdisrupts the binding of macrolides, as well as thestructurally unrelated lincosamide and streptogramin Bantibiotics [35, 36]. The RNA methylase genes responsiblefor this are known as erm genes [36] due to their initialcharacterization in erythromycin-resistant bacteria. Howev-er, erm genes can confer resistance to a broad range ofantibiotics in the macrolide, lincosamide, and streptograminB (MLSB) families [34]. For instance, erm(B) has beenshown to confer resistance to multiple MLSB drugs [14,20]. Exposure to any of the MLSB drugs may providepositive selection pressure for erm genes [34], and tylosinuse in animal production has been shown to lead toincreased levels of erythromycin resistance in bacterialisolates [5, 24]. Administration of tylosin to animals canalso increase the incidence of bacterial resistance tounrelated antibiotics such as tetracycline [10].
Because tylosin usage in animal production has thepotential to select for erm genes that confer multidrugresistance, it is important to understand the factors thatcontribute to the dissemination and persistence of thesegenes in environments associated with animal agriculture.These include factors that relate to dispersal and persistenceof antibiotic-resistant bacteria to nearby environments,those that can increase the frequency of antibiotic resistancegenes in host populations, and those that lead to the spreadof these genes, via horizontal gene transfer (HGT), to newhost species. Molecular methods, such as quantitativepolymerase chain reaction (qPCR), can be used to detectpatterns in gene distribution without the need to cultivate oridentify host organisms. Thus, they are useful tools tocharacterize the emergent spatial and temporal patterns ofantibiotic resistance that result from: (1) gene selection, (2)population dynamics of host organisms, (3) movement ofhost organisms to new environments, (4) transmission ofmobile genetic elements, or (5) some combination of thesephenomena. An understanding of these patterns can help toidentify factors that contribute the spread of antibioticresistance, especially when these patterns can be related toenvironmental drivers or potential sources of resistancegenes in the landscape.
Our objective in this work is to characterize spatial andtemporal patterns of RNA methylase gene distributions inagriculture-associated environments. We report on a 3-year,farm-scale study investigating the distribution of eightdifferent RNA methylase genes in waste treatment lagoonsand groundwater at two swine production facilities withdifferent hydrogeology (Fig. 1). Phylogenetic analyses wereused to guide primer design for culture-independentdetection and quantification of these genes. By comparinggenes found in lagoons and wells with those of on-sitecontrol wells, we evaluate the hypothesis that hog wastelagoons can be sources of antibiotic resistance foragriculture-associated environments. In addition, we drawupon long-term observations at these facilities [8, 19, 22,23, 25, 28] to relate the patterns in erm gene distributions topreviously described patterns of chemical contamination[22, 23, 25, 28] and the occurrence of genes conferringresistance to tetracycline antibiotics [8, 21].
Figure 1 Location of monitoring wells at sites A and C. Stratigraphiccolumns indicate the locations and characteristics of sand layers.Large open arrows indicate the direction of groundwater flow, andsmall arrows show direction of stream flow. The locations ofmonitoring wells are indicated by circles. Numbers in parenthesesindicate well depths in meters. Wells A6, A8, A9, A11, and A12 areheavily impacted by lagoon leakage. Wells A1, A2, A7, and C1 arebackground control wells
488 S. Koike et al.

Methods
Strains and Plasmids
The following positive control strains and plasmids wereused for RNA methylase (erm and tlr) genes: erm(A),Tn554 in chromosome of Staphylococcus aureus RN1389[40]; erm(B), pAC1 in Streptococcus pyogenes AC1 andpJH1 in Enterococcus faecalis JH2-2 [40]; erm(C), pE194in S. aureus RN4220 [40]; erm(F), pBF4 in Bacteroidesfragilis V-479-1 [33]; erm(G), Tn7853 in chromosome ofBacteroides thetaiotaomicron [12]; erm(Q), plasmid JIR432in Clostridium perfringens [6]; tlr(B), plasmid pSD14c inStreptomyces fradiae [27]; tlr(D), on plasmid pSD57c in S.fradiae [7]. These strains were kindly provided by A. A.Salyers (Department of Microbiology, University of Illinoisat Urbana-Champaign, Urbana, USA) and S. Douthwaite(Department of Biochemistry and Molecular Biology,University of Southern Denmark, Odense M, Denmark).All strains were grown and maintained as described in theoriginal reference.
Site Description
Samples were collected from groundwater and wastelagoons at two privately operated swine confinementfacilities, referred to hereafter as sites A and C (Fig. 1).At the time of this study, the antibiotic regimens at bothsites included chlortetracycline and tylosin (personalcommunication with facilities operators; specific dosagesand the timings of administration were not revealed). Fortreatment of swine manure, both sites used unlinedlagoons that were periodically pumped for applicationto crop fields. Site A was underlain by a fine-grained siltloam (low permeability), but its hydrogeology alsoincluded two shallow, highly permeable sand layers(Fig. 1). Site C was underlain by low-permeability siltloam (Fig. 1). Thus, the two sites differed significantly interms of groundwater permeability in the vicinity ofwaste lagoons. Sixteen wells at site A and six at site Cwere previously installed in locations around the lagoons[25]. The locations of these wells (Fig. 1) were meant tocapture a range of suspected waste contamination fromlagoons, based on electromagnetic terrain conductivitysurveys [25]. On-site environmental control wells (threewells at site A and one at site C) were installed above thewaste lagoons in the hydrological flow path (Fig. 1);these wells would not receive any groundwater flowingfrom lagoons but could potentially receive antibioticresistance genes originating from other sources in thelandscape. More detailed descriptions of the operationsand hydrogeology of these sites have been describedelsewhere [8, 25, 28].
Chemical measurements taken from these wells since1996 [22, 23, 25, 28] show that the following wells (Fig. 1)are significantly impacted by lagoon leakage: A6, A8, A9,A11, and A12, while wells A13, C2, C3, and C4 showedmoderate or occasional leakage. In addition, wells A6, A8,A9, A11, and A12 have been found to frequently containtetracycline resistance genes (tet) also found in the wastelagoons [21]. This led Koike and colleagues to classifywells A6, A8, A9, A11, and A12 as “impacted” by tetgenes from the lagoon.
Microbial Community Samples and DNA Extraction
To compare the distribution of RNA methylase genes(erm and tlr) and tet genes, we use the same samples thatwere previously collected to investigate tetracyclineresistance at these facilities [21, 22]. Briefly, groundwatersamples from all wells and lagoons were collected in May2001 (both sites), April (site A) or May (site C) 2002, andMarch (site A) or February (site C) 2003. To avoid samplecross-contamination, polyethylene bailers dedicated toeach well were alcohol-sterilized and rinsed prior tosample collection, and wells were purged by removing1.5 to three well volumes of groundwater before samplecollection. Lagoon samples consisted of eight pooled 2-Lsubsamples collected from arbitrary locations around thelagoon [1]. All samples were stored in clean, sterilizedbottles, kept on ice in the field, and refrigerated (4°C) untilDNA extraction.
Sample processing and DNA extraction were describedpreviously [21]. In summary, groundwater (1 L) and lagoon(100 mL) samples were centrifuged at 17,700×g for 20 minat 4°C. The pellets were retained and washed with aphosphate-buffered saline. Total DNA was extracted fromthe pellets using a freeze–thaw method [42]. The crudeDNA was purified with polyvinylpolypyrrolidone andSepharose 2B (Sigma Chemical, St. Louis, MO, USA) asdescribed by Zhou [46] and Miller [30]. A DU 7500spectrophotometer (Beckman, Fullerton, CA, USA) wasused to measure DNA concentration, which was thenadjusted to 10 ng/μL for each sample.
Primer Design and PCR
The nucleotide sequences of all methylase genes availableat the time of primer design and conferring resistance toMLSB antibiotics were downloaded from the GenBankdatabase [4]. Sequences were aligned using the multiplesequence alignment software ClustalX ver. 1.83 [41]. Basedon phylogenetic analyses (see below), the correspondingclusters in the alignment file were inspected by eye todesign PCR primers that are specific and cover all diversitywithin the sequences belonging to the same gene cluster
MLSB Methylase Gene Ecology in Groundwater 489

(Table 1). These oligonucleotides were initially tested insilico using the blastn algorithm and nr nucleotide sequencedatabase (GenBank) to ensure a 100% match with the genesof interest and to rule out false priming (i.e., no matcheswith other genes). For each gene, laboratory validation wasperformed with the corresponding positive control plasmidand strain, and all other methylase gene-bearing strains andplasmids were used as templates for negative controls. PCRwas conducted using Amplitaq Gold DNA polymerase(Applied Biosystems, Foster City, CA, USA). The reactionmixture contained 0.5 μM of each primer, 1.5 mM MgCl2,0.2 mM of each deoxyribonucleotide triphosphate, PCRbuffer II, 1.25 U of Amplitaq Gold DNA polymerase and10 ng of template DNA in a total volume of 25 μL.Amplification of all genes began with denaturation at 94°Cfor 10 min. With the exception of erm(Q), denaturation wasfollowed by 40 cycles of 30 s at 94°C, 30 s at the annealingtemperature (Table 1), and 30 s of extension at 72°C. Afinal extension of 72°C for 10 min was used for all samples.For erm(Q), a step-down PCR was employed to eliminateprimer dimer formation: 35 cycles were performed using anannealing temperature of 68°C, followed by 15 cycles usingan annealing temperature of 60°C; because of this potentialprimer dimer difficulty, erm(Q) primers were not used forqPCR. PCR product aliquots were analyzed by electropho-
resis on 2.0% (wt/vol) agarose gel followed by stainingwith ethidium bromide.
PCR was performed on all groundwater and lagoonsamples to detect the presence of the six erm and two tlrgenes reported in Table 1. For any environmental samplethat did not show amplification of the target gene, PCR wasrepeated using serially diluted positive control plasmid (seebelow) spiked into the sample to rule out the possibility ofPCR inhibition. However, we found no evidence of PCRinhibition in any sample.
Quantitative PCR Assays
All groundwater and lagoon samples were used astemplates for quantification of erm(A), erm(B), erm(C),erm(F), and bacterial 16S rDNA genes. We did notperform qPCR on erm(G) or the tlr genes due their lowfrequency of occurrence (see “Results”), and qPCR wasnot performed for erm(Q) due to the aforementionedpotential for primer dimer formation. qPCR conditionswere identical to those described for PCR (Table 1), and16S rDNA PCR conditions followed Koike et al. [21].Positive control plasmids for qPCR standards wereprepared by cloning PCR product from positive controlstrains using the primers and conditions of Table 1.
Table 1 PCR primers targeting methylase genes
Primer Classtargeted
Sequence (5′–3′) PCR annealing temp (°C)
Amplicon size(bp)
Reference
Erm A-FW
erm(A) AGTCAGGCTAAATATAGCTATC 63 157 This study
Erm A -RV
CAAGAACAATCAATACAGAGTCTAC
Erm B-FW erm(B) GGTTGCTCTTGCACACTCAAG 65 191 This studyErm B-RV CAGTTGACGATATTCTCGATTG
Erm B-1a erm(B) GAAAARGTACTCAACCAAATAATAA 57 639 Sutcliffe et al.[40]Erm B-2 AGTAAYGGTACTTAAATYGTTTAC
Erm C-FW erm(C) AATCGTGGAATACGGGTTTGC 63 293 This studyErm C-RV CGTCAATTCCTGCATGTTTTAAGG
Erm F-FW erm(F) TCTGGGAGGTTCCATTGTCC 65 424 This studyErm F-RV TTCAGGGACAACTTCCAGC
Erm G-FW
erm(G) GTGAGGTAACTCGTAATAAGCTG 63 255 This study
Erm G-RV CCTCTGCCATTAACAGCAATG
Erm Q-FW
erm(Q) CACCAACTGATATGTGGCTAG 68, 60 154 This study
Erm Q-RV CTAGGCATGGGATGGAAGTC
Tlr B-FW tlr(B)b GTGTCCTGGAGGAGTTCGAG 63 111 This studyTlr B-RV AGCGGAAGTGTGTCCCATAC
Tlr D-FW tlr(D)b GTCAACGACGACTTCACGAC 65 186 This studyTlr D-RV ACTGGGCGTTGAAGAGATTG
aUsed in sequence analysisb Tlr(B) is also known as erm(32); tlr(D) is also known as erm(N)
490 S. Koike et al.

Briefly, PCR products were excised and purified fromagarose gel with the QIAquick gel extraction kit (QIA-GEN, Valencia, CA, USA), and then ligated into thepGEM-T EASYvector (Promega, Madison, WI, USA) andtransformed into competent Escherichia coli JM109. Afterconfirming the proper-size insert with PCR, the recombi-nant plasmids were purified with the QIAprep spinminiprep kit (QIAGEN). The concentration of eachplasmid was determined by spectroscopy, and the plasmidcopy number was calculated based on the length (basepair) and the molecular weight of DNA. Tenfold serialdilution of each plasmid was then used to create qPCRstandards. qPCR of well and lagoon samples was doneusing a GeneAmp 9600 thermal cycler in conjunction withthe GeneAmp 5700 sequence detection system (AppliedBiosystems, Foster City, CA, USA). The SYBR GREENPCR Master Mix (Applied Biosystems) was used with10 ng of template DNA for all reactions, and the plasmidstandards from tenfold serial dilution was run for each setof reactions for all genes. Duplicate reactions were run foreach sample. Data analysis was performed using theGeneAmp 5700 SDS software (Applied Biosystems). Foreach sample, the number of copies of erm was normalizedagainst the copy number of 16S rDNA.
Sequencing of Environmental erm(B)
Comparative analysis of erm(B) sequences from sites Aand C was conducted using the primer set of Sutcliffe andcolleagues [40], which amplifies 639 bp of erm(B).Samples from 2003 of wells A9, A11, and the lagoon atsite A and wells C1, C4, and the lagoon at site C wereused to construct the erm(B) clone libraries using thepGEM-T EASY system as described above. Ten clonesfrom each well/lagoon were randomly selected for sequenc-ing, which was performed by the W.M. Keck Center forComparative and Functional Genomics at the University ofIllinois. Sequences were compared with available sequen-ces of erm(B) in the GenBank database using BLAST, andphylogenetic analysis by Bayesian inference was per-formed (see below). All sequences generated in this studyhave been deposited in GenBank under accession numbers(EU168273–EU168331).
Phylogenetic and Numerical Analyses
Maximum likelihood (ML) and Bayesian inference (BI)were used to infer phylogenetic trees and estimate the cladesupport. ML analysis included the run of 100 resampledtrees using DNAML in the PHYLIP package, v.3.6 (http://evolution.genetics.washington.edu/phylip.html). For BIanalysis, posterior probabilities were calculated using aBayesian Markov chain Monte Carlo method with MrBayes
v.3.1.1 program [18, 37], using a 4 by 4 nucleotidesubstitution model with gamma-distributed site variationand a proportion of invariable sites. The priors were left atthe defaults (i.e., uninformative priors) in MrBayes. Ten or20 million generations were run, with sampling every 100generations.
Patterns in gene occurrence in wells and lagoons wereinvestigated in a multivariate framework based on theresults of PCR screening. In each sample, all erm geneswere scored as “present” or “absent,” and the resultingarrays for all sample pairs were compared using the“Jaccard” (dis-)similarity coefficient, which is commonlyused for ecological comparisons of community compositionfor species presence/absence data [26]. For any given pairof samples, the Jaccard coefficient ¼ 1� a= aþ bþ cð Þ½ �,where a is the number of erm genes found in both samplesand b and c are the number of genes found in only onesample. The resulting dissimilarity matrix was used tocluster samples using average-linkage agglomerative clus-tering. A Jaccard dissimilarity matrix was also computedfor tet genes in these samples using the data of Koike andcolleagues [21], and the erm and tet data were comparedwith the Mantel test [26]. To determine whether certaingenes had a tendency to co-occur in wells, the Jaccardcoefficient was used as a measure of association (i.e., “R-mode” sensu Legendre and Legendre [26]) for erm and tetgenes across all groundwater samples, and the resultingmatrix was clustered by average linkage. All numericalanalyses were carried out using the R environment forstatistical computing [32] with functions provided bypackages “vegan” and “labdsv.”
Results
Phylogenetic Analysis
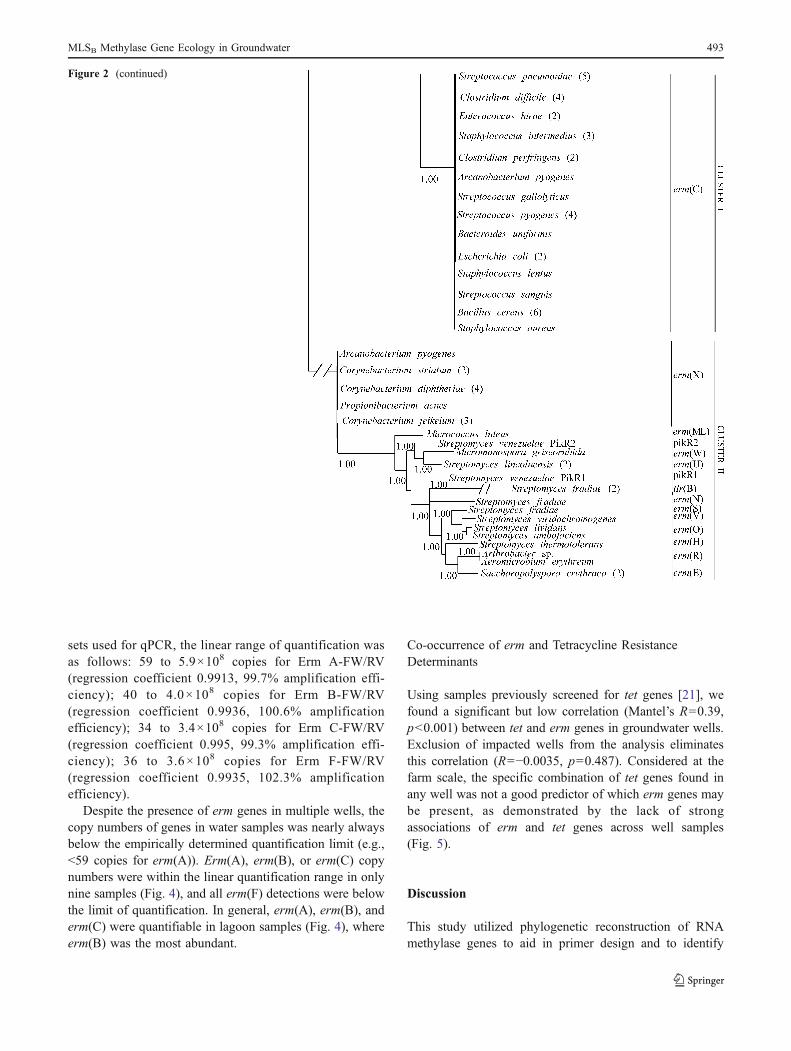
Maximum likelihood and Bayesian inference produced ermgene trees with similar topology and high clade support;only the Bayesian tree is presented here (Fig. 2). With a100% clade support (posterior probability), this analysisshows that RNA methylases are organized into two majorclusters, one of which is represented by high-G + Cbacteria, including antibiotic-producing Streptomyces, andanother by low-G + C commensal, pathogenic, andenvironmental bacteria (Fig. 2). PCR primers (Table 1)were designed to amplify six MLSB methylases found incluster 1 (erm(A), erm(B), erm(C), erm(F), erm(G), anderm(Q)) and two genes from cluster 2 (tlr(B) and tlr(D)). Inlaboratory validation tests of PCR primers (Table 1),amplicons of the expected sizes were produced withpositive controls, and product was not detected usingincongruent primer–template combinations.
MLSB Methylase Gene Ecology in Groundwater 491

Distribution of erm Genes on Swine Farms
The lagoons were always found to contain erm(A), erm(B),erm(C), and erm(F) (Table 2). Erm(Q) was found in alllagoon samples except one (site C in 2003; Table 2). Inlagoons, erm(G) was only found at site C in 2002 and siteA in 2003. The cluster 2 genes (tlr) were never found inlagoons. Erm(A), erm(B), erm(C), and erm(F) were foundin multiple site A and C wells (Table 2), and these fourgenes were significantly more likely to occur in wellspreviously reported to be impacted by lagoon leakage[21–23, 25, 28] as compared with other wells (Fisher’sexact test p values >0.001 for erm(A), erm(B), and erm(C);0.007 for erm(F)). With only two exceptions, all samplesfrom impacted wells contained erm(B) and erm(C) (Fig. 3).Neither erm(A) nor erm(F) was found outside of waste
lagoons or impacted wells (Table 2; Fig. 3). The precisecombination of genes in wells A6, A9, and A11 wasidentical in any given year (Fig. 3). At site C, where thehydrological setting limits lagoon leakage (Fig. 1), thedetection frequencies of all genes in wells were notstatistically distinguishable from those of backgroundcontrol wells.
Quantification of erm Genes
In laboratory validation tests, all primer sets detectedsingle copies of their targets with the exception of erm(Q), which had a detection limit of 100 copies (data notshown). We restricted our quantification of environmentalgenes to the empirically determined linear amplificationrange of our qPCR standards. For each of the four primer
Figure 2 Phylogenetic tree(Bayesian inference) of MSLB
resistance genes encoding meth-ylases. The posterior probabili-ties of clades are shown asinterior node labels, with valuesless than 1.00 omitted in thefigure. The scale bar showsexpected changes per site; how-ever, branch lengths of cluster 2and two S. fradiae strains arenot in scale. GenBank accessionnumbers of sequences used inthis analysis are given in paren-thesis. Tlr(B) is also known aserm(32); tlr(D) is also known aserm(N)
492 S. Koike et al.
sets used for qPCR, the linear range of quantification wasas follows: 59 to 5.9×10⁸ copies for Erm A-FW/RV(regression coefficient 0.9913, 99.7% amplification effi-ciency); 40 to 4.0×10⁸ copies for Erm B-FW/RV(regression coefficient 0.9936, 100.6% amplificationefficiency); 34 to 3.4×10⁸ copies for Erm C-FW/RV(regression coefficient 0.995, 99.3% amplification effi-ciency); 36 to 3.6×10⁸ copies for Erm F-FW/RV(regression coefficient 0.9935, 102.3% amplificationefficiency).
Despite the presence of erm genes in multiple wells, thecopy numbers of genes in water samples was nearly alwaysbelow the empirically determined quantification limit (e.g.,<59 copies for erm(A)). Erm(A), erm(B), or erm(C) copynumbers were within the linear quantification range in onlynine samples (Fig. 4), and all erm(F) detections were belowthe limit of quantification. In general, erm(A), erm(B), anderm(C) were quantifiable in lagoon samples (Fig. 4), whereerm(B) was the most abundant.
Co-occurrence of erm and Tetracycline ResistanceDeterminants
Using samples previously screened for tet genes [21], wefound a significant but low correlation (Mantel’s R=0.39,p<0.001) between tet and erm genes in groundwater wells.Exclusion of impacted wells from the analysis eliminatesthis correlation (R=−0.0035, p=0.487). Considered at thefarm scale, the specific combination of tet genes found inany well was not a good predictor of which erm genes maybe present, as demonstrated by the lack of strongassociations of erm and tet genes across well samples(Fig. 5).
Discussion
This study utilized phylogenetic reconstruction of RNAmethylase genes to aid in primer design and to identify
Figure 2 (continued)
MLSB Methylase Gene Ecology in Groundwater 493

gene targets of both evolutionary and environmentalrelevance. Based on this phylogeny, we hypothesized thatthe presence of different cluster 1 and cluster 2 methylasesmay be indicative of different sources of antibioticresistance. Cluster 1 genes like erm(B), erm(C), erm(G),and erm(F), and erm(Q) have been recovered from both soiland commensal/pathogenic bacteria, while erm(A) hasgenerally been recovered from clinically relevant strains[35, 36]. Furthermore, cluster 1 genes show a high degreeof sequence similarity within the principal gene subclusters;for example, nearly identical erm(B) sequences have beenrecovered from pathogens (e.g., Streptococcus pyogenes),commensals (e.g., Lactobacillus), and soil bacteria (e.g.,Bacillus cereus; Fig. 2). This is indicative of widespreadhorizontal gene transfer, as has been previously suggestedto occur within the GI tract ecosystem [38], where the closeassociation of these organisms forms a “genetic exchangecommunity.” The second cluster (cluster 2; Fig. 2) is deeplyseparated from the first and is composed of two subclusters,one of which contains genes found primarily in MLSBantibiotic-producing strains. Aminov and Mackie [3] haverecently observed that tetracycline and vancomycin resis-tance genes show this same phylogenetic separation ofgenes from pathogens/commensals versus those found inproducers of the respective antibiotics. The deep-branchingstructure of these gene trees (e.g., Fig. 2) suggests thatdiversification within these gene families occurred prior tomodern human antibiotic use, with little evidence of recent
transfer from antibiotic-producing bacteria to clinicallyrelevant organisms. Thus, a prevalence of cluster 2 genesis to be expected in the presence of large nativepopulations of antibiotic-producing organisms, while aprevalence of cluster 1 genes is suggestive of othersources, such as antibiotic use on site or elsewhere in thelandscape [39].
In this study, the cluster 1 methylases were predom-inant among MLSB-resistant bacteria associated withanimal waste. This is consistent with previous observa-tions [3, 11, 34]. In a similar study that included Ohioswine farms, Chen and colleagues [11] found erm(A), erm(B), and erm(F) in all swine manure (n=16) and swinelagoon (n=6) samples examined, but erm(C) was foundwith reduced frequency in both manure and lagoonsamples. The increased prevalence of erm(C) in wastelagoons in the present study suggests that there aredifferences in the autecology of erm(C)-hosting organismsin Ohio and Illinois herds. However, methodologicaldifferences between these two studies may also have beenpartly responsible. For example, different erm(C) PCRprimers and protocols were by Chen and colleagues [11],and this may have led to differential specificity, sensitiv-ity, or amplification efficiency as compared to the currentstudy. Additionally, Chen and colleagues [11] usedsample-derived, linear qPCR standards as opposed to theplasmid-based standards used here, and this may havecaused differences in qPCR calibration. Thus, proper
Table 2 Proportion of water samples testing positive for cluster 1 MLSB genes
Samplesa erm(A) erm(B) erm(C) erm(F) erm(G) erm(Q)
Site A lagoons 2001 + + + + – +
2002 + + + + – +
2003 + + + + + +
Site C lagoons 2001 + + + + – +
2002 + + + + + +
2003 + + + + – –
Site A wells Impactedb 2001 (n=5) – 0.60 0.80 0.60 – –
2002 (n=5) 1.00 1.00 1.00 - - 0.20
2003 (n=5) 0.80 1.00 0.80 0.60 - -
Nonimpacted 2001 (n=9) – – – – – –
2002 (n=11) – 0.18 0.18 – 0.09 –
2003 (n=11) – 0.18 0.27 – – –
Site C wells 2001 (n=5) – – 0.2 – – 0.2
2002 (n=6) – 0.17 0.50 – 0.17 –
2003 (n=6) – 0.50 0.67 – – –
Other numbers are [positive detections/n]
– no detection in lagoon or any wells, + detection in lagoona Number in parenthesis indicates total groundwater wells sampled; n=1 for lagoonb “Impacted” wells were previously determined to receive chemical and biological contamination from lagoon leakage
494 S. Koike et al.

caution is needed when comparing the results of anyqPCR-based environmental studies.
Of the cluster 2 genes, tlr(D) was found only once in a2003 groundwater sample (well C3), and tlr(B) was neverdetected (data not shown). This suggests that these farms
may lack significant populations of tylosin-producing S.fradiae; however, a more thorough investigation of cluster2 genes is necessary to quantify the potential influence ofnative MSLB-producing bacteria in the soil and groundwa-ter at these sites. Additionally, it must be noted that thegenes targeted in the present study represent a subset of thepossible macrolide resistance mechanisms [13].
The cluster 1 genes erm(A), erm(B), erm(C), and erm(F)were also the most commonly detected genes in ground-water wells. In particular, these genes were frequentlydetected in a spatially explicit fashion, occurring in shallowwells close to the site A lagoon (Figs. 1 and 3) and thathave been previously shown to be impacted by lagoonleakage [21–23, 25, 28]. In addition, the impacted wellsA6, A9, and A11 had the same combination of erm genes inany given year (Fig. 3). These spatial and temporalcorrelations implicate lagoon leakage as the principlesource of these four genes in groundwater wells.
On the other hand, erm(G) and erm(Q) were infrequentlydetected in wells (Table 2) and did not show any notablespatial or temporal distribution patterns (Fig. 3). A likelyexplanation for this infrequent detection outside of lagoonwater is that the anaerobic organisms that host these genes(Fig. 2) have not been able to effectively disperse to thegroundwater environment. Alternately, the sporadic appear-ance of these genes and their lack of spatial associationwith waste lagoons suggest that they may originate from anonlagoon source (or multiple sources). On three occasions,erm(C) was detected in background control wells A1, A2,and A7 (Fig. 3), which strongly points to an “upstream”source for this gene. Singer and colleagues [39] argue thatantibiotic resistance may be more properly viewed as a
Figure 5 Association of methylase genes for MSLB resistance andtetracycline resistance genes. The association statistic is Jaccard’scoefficient based on gene presence/absence across all well samples.Clustering method was agglomerative, with nodes assigned byaverage linkage. Tet(M), tet(O), tet(Q), and tet(W) encode tetracyclineresistance by ribosomal protection; tet(C), tet(H), and tet(Z) encodetetracycline resistance by efflux pump
Figure 4 Relative copy number of MSLB resistance genes encodingmethylases from selected environmental samples. Only samples withquantifiable gene copy numbers are shown. “A-lag” and “C-lag” referto waste lagoons from sites A and C, respectively, and well IDs are asindicated in Fig. 1. Error bars represent standard deviations for qPCRestimation. Asterisk, bars reaching the dashed line indicate samplesthat were PCR positive for the respective gene, but relative copiesnumbers were below the lower limit of quantification (Table 1)
Figure 3 Clustering of the genecomplement of samples basedon Jaccard’s coefficient. Clus-tering method was agglomera-tive, with nodes assigned byaverage linkage. All sampleswith at least one erm genepresent are included. Wellnumbers are identical to those inFig. 1, and numbers in paren-thesis indicate the year in whichsamples were collected. Thecombination of genes present ineach cluster is indicated at thenodes. Wells heavily impactedby lagoon leakage are indicatedwith asterisks. Lagoon samples(“lag”) are in boldface
MLSB Methylase Gene Ecology in Groundwater 495

landscape-level problem, and multiple potential sources ofantibiotic-resistant organisms and their genes should beconsidered for a full accounting of their occurrence. Ourdata suggest that there is another source of RNA methylasegenes in the landscape, or there may be a low-level“background” presence of these genes in native bacteria inthe environment. The frequent occurrence of erm(A), erm(B), erm(C), and erm(F) in impacted groundwater wells is aspatially defined signal imposed upon this background.
The most frequent and abundant gene at these sites waserm(B) (Figs. 3 and 4), which was present in lagoon waterfrom 4×10² to 104 copies per million copies of bacterial16S rDNA. This is roughly an order of magnitude lowerthan the abundance of erm(B) in Ohio swine lagoons asdetermined by Chen and colleagues [11]. As it was belowthe quantification range of our qPCR, erm(F) abundancein sites A and C lagoons was at least three orders ofmagnitude lower than that determined by Chen andcolleagues [11], whereas lagoon erm(C) was higher inthe present study, and erm(A) was comparable. As before,these differences may be methodological (primers and/orqPCR standards), or they may represent regional/ecolog-ical differences in the microbial assemblages underconsideration.
With the exception of three samples from wells A8, A9,and A11, erm gene copy numbers in all well samples werebelow the qPCR range of quantification. For erm(A), erm(B), and erm(C), this corresponds to a reduction in numbersby at least three orders of magnitude in groundwater ascompared to lagoons. A likely explanation of this reductionis due to limited dispersal of erm-hosting bacteria togroundwater. Previous investigation of tetracycline resis-tance genes (tet) at these sites [21] found an average tenfoldreduction of tet in groundwater as compared to lagoons.This may reflect differential movement or persistence oferm-harboring bacteria in groundwater as compared withtet-harboring bacteria. Alternately, as macrolide antibioticstend to have shorter half-lives in manure than tetracyclines[9], this may reflect a lower selection pressure for themaintenance of erm genes than tet genes, assuming thatmanure or lagoon water is the primary source of antibiotics atthese sites. Using liquid chromatography with tandem massspectroscopy, we were unable to detect macrolide antibioticsin any of the groundwater samples analyzed in this study,and macrolides were detected in two lagoon samples at eachsite, at concentrations of <3 mg/L (data not shown).
Resistance genes for different antibiotics have beenobserved together in the same organism and even on thesame genetic element [3, 16, 34, 38], and this raises thatpossibility that selection due to one antibiotic can coselectfor resistance genes to another [39]. For example, anincrease in tetracycline resistance gene abundance wasrecently reported in fecal bacteria of cattle fed subthera-
peutic doses of tylosin but not tetracycline [10]. In thepresent study, erm and tet genes were mildly correlatedonly if impacted wells were considered (Fig. 5). Therefore,it is unlikely that co-occurrence of these genes in the samehost organism or on the same mobile genetic element wasprincipally responsible for the patterns identified; instead,passive leakage from the lagoon, leading to a high diversityof both tet and erm genes in impacted wells, is the likelycause of this correlation. The strongest patterns of co-occurrence, which have been previously noted [21], wereamong the four ribosomal protection genes tet(M), tet(O),tet(Q), and tet(W) and also among the three efflux pumpgenes tet(C), tet(H), and tet(Z) (Fig. 5). There was atendency for erm(B) to co-occur with the efflux tet genesand for erm(C) to co-occur with tet genes as a whole(Fig. 5). Erm(A), erm(F), erm(G), and erm(Q) did not showstrong associations with any other genes. The overall lackof strong associations between erm and tet genes suggeststhat coselection is not a likely explanation for the patternsreported here. This also suggests that the distribution ofgenes in these systems reflects the individual ecologicallimitations of host species and differences in transmissibil-ity and host spectrum of resistance-conferring mobilegenetic elements. However, a more explicit focus onphysical linkages between resistance genes (e.g., accumu-lation on mobile genetic elements) should be the focus offuture environmental research regarding the spread ofantibiotic resistance.
Ecological Perspectives on Gene Distribution
The distribution of antibiotic resistance genes at these farmssuggests that a strong environmental signal (the lagoon) issuperimposed upon weaker, more ephemeral backgroundsignal. The former has a clear spatial relationship with thelagoon (Table 2; Fig. 3), while genes involved in the latterexhibit more individualistic spatial and temporal patterns.The distributions of these genes at these sites are emergentfeatures of factors that influence gene frequencies in hostpopulations, movement of resistant organisms to newenvironments, and transmission of genes via HGT to neworganisms. Previous authors [3, 38, 39] have suggested thatstudies of antibiotic resistance in the environment shouldfocus on gene distributions in much the same way thatecologists study the distributions of organisms. In thepresent work, we also considered the evolutionary historyof these gene families, and we used gene phylogeny to helpinterpret patterns of gene occurrence. For example, the lackof cluster 2 tlr genes suggests that the presence of nativetylosin-producing bacteria is not a major selective force forMLSB resistance at these sites.
Erm(B) and erm(C) were the most frequently detectedand most abundant genes in this study (Table 2; Fig. 4).
496 S. Koike et al.

Erm(B) has been frequently found in MLSB-resistantbacteria associated with animals and animal waste [3, 14,15, 20], and it was the most common and abundant ermgene found in swine manure samples in a previous study[11]. However, erm(B) has also been found in soil bacteriasuch as Bacillus (Fig. 2; [34, 35]). We obtained DNAsequences of erm(B) from lagoon, background well, andimpacted well samples from sites A and C, but all erm(B)sequences were over 99% similar by nucleotide identity(data not shown). Thus, it was not possible to identifydistinct clusters of “native” erm(B) from “swine” erm(B) aswas previously seen for tet(W) at these sites [21]. Thewidespread distribution of nearly identical erm(B) sequen-ces in a variety of species (Fig. 2) means that we cannotdefinitely conclude that erm(B) in our groundwater samplescame from a single source population.
Erm(C) has also been found in both animal-associatedand soil bacteria (Fig. 2; [34, 35]). While erm(C) tended toco-occur with erm(B) in impacted wells, it was alsoobserved more frequently in other well samples, includingbackground wells A1, A2, A7, and C1 (Fig. 4). This mayindicate the presence of alternative sources of erm(C) atthese sites, for instance, native populations of erm(C) soilor groundwater bacteria. If true, this could explain thehigher detection frequency and abundance of erm(C) in thisstudy in comparison with previous work [11]. These typesof gene ecological considerations should help inform futurestudies of antibiotic resistance in the environment and theimpact of concentrated animal feeding operations.
Acknowledgements This research was supported by fundingfrom the USDA NRI Competitive Grants Program 26.0 (awardnos. 2001-35102-10774 and 2005-35102-16424). Support was alsoprovided by the Scottish Government Rural and EnvironmentalResearch and Analysis Directorate and by Hatch funding to theAgricultural Experimental Station at the University of Illinois atUrbana-Champaign.
References
1. Aminov RI, Chee-Sanford JC, Garrigues N, Teferedegne B,Krapac IJ, White BA, Mackie RI (2002) Development, validation,and application of PCR primers for detection of tetracycline effluxgenes of gram-negative bacteria. Appl Environ Microbiol68:1786–1793
2. Aminov RI, Garrigues-Jeanjean N, Mackie RI (2001) Molecularecology of tetracycline resistance: development and validation ofprimers for detection of tetracycline resistance genes encodingribosomal protection proteins. Appl Environ Microbiol 67:22–32
3. Aminov RI, Mackie RI (2007) Evolution and ecology of antibioticresistance genes. FEMS Microbiol Lett 271:147–161
4. Benson DA, Boguski MS, Lipman DJ, Ostell J, Ouellette BFF,Rapp BA, Wheeler DL (1999) GenBank. Nucleic Acids Res27:12–17
5. Berrang ME, Ladely SR, Meinersmann RJ, Fedorka-Cray PJ(2007) Subtherapeutic tylosin phosphate in broiler feed affects
Campylobacter on carcasses during processing. Poultry Sci86:1229–1233
6. Berryman DI, Lyristis M, Rood JI (1994) Cloning and sequenceanalysis of ermQ, the predominant macrolide-lincosamide-streptogramin B resistance gene in Clostridium perfringens.Antimicrob Agents Chemother 38:1041–1046
7. Bryskier AJ, Butzler JP, Neu HC, Tulkens PM (1993) Macrolides:chemistry, pharmacology, and clinical uses. Arnette Blackwell,Paris
8. Chee-Sanford JC, Aminov RI, Krapac IJ, Garrigues-Jeanjean N,Mackie RI (2001) Occurrence and diversity of tetracyclineresistance genes in lagoons and groundwater underlying twoswine production facilities. Appl Environ Microbiol 67:1494–1502
9. Chee-Sanford JC, Mackie RI, Koike S, Krapac I, Lin Y-F,Yannarell AC, Maxwell S, Aminov RI (2009) Fate and transportof antibiotic residues and antibiotic resistance genes followingland application of manure waste. J Environ Qual 38:1086–1108
10. Chen J, Fluharty FL, St-Pierre N, Morrison M, Yu Z (2008)Technical note: occurrence in fecal microbiota of genes conferringresistance to both macrolide–lincosamide–streptogramin B andtetracyclines concomitant with feeding of beef cattle with tylosin.J Anim Sci 86:2385–2391
11. Chen J, Yu ZT, Michel FC, Wittum T, Morrison M (2007)Development and application of real-time PCR assays forquantification of erm genes conferring resistance to macrolides–lincosamides–streptogramin B in livestock manure and manuremanagement systems. Appl Environ Microbiol 73:4407–4416
12. Cooper AJ, Shoemaker NB, Salyers AA (1996) Erythromycinresistance gene from the Bacteroides conjugal transposon Tcr Ermr
7853 is nearly identical to ermG from Bacillus sphaericus.Antimicrob Agents Chemother 40:506–508
13. D'Costa VM, McGrann KM, Hughes DW, Wright GD (2006)Sampling the antibiotic resistome. Science 311:374–377
14. De Graef EM, Decostere A, De Leener E, Goossens H, Baele M,Haesebrouck F (2007) Prevalence and mechanism of resistanceagainst macrolides, lincosamides, and streptogramins amongEnterococcus faecium isolates from food-producing animals andhospital patients in Belgium. Microb Drug Resist 13:135–141
15. De Leener E, Decostere A, De Graef EM, Moyaert H,Haesebrouck F (2005) Presence and mechanism of antimicrobialresistance among enterococci from cats and dogs. Microb DrugResist 11:395–403
16. De Leener E, Martel A, Decostere A, Haesebrouck F (2004)Distribution of the erm(B) gene, tetracycline resistance genes, andTN1545-like transposons in macrolide- and lincosamide-resistantenterococci from pigs and humans. Microb Drug Resist MechanEpidemiol Dis 10:341–345
17. Heuer H, Krogerrecklenfort E, Wellington EMH, Egan S, vanElsas JD, van Overbeek L, Collard JM, Guillaume G, KaragouniAD, Nikolakopoulou TL, Smalla K (2002) Gentamicin resistancegenes in environmental bacteria: prevalence and transfer. FEMSMicrobiol Ecol 42:289–302
18. Huelsenbeck JP, Ronquist F (2001) MRBAYES: Bayesianinference of phylogenetic trees. Bioinformatics 17:754–755
19. Jindal A, Kocherginskaya S, Mehboob A, Robert M, Mackie RI,Raskin L, Zilles JL (2006) Antimicrobial use and resistance inswine waste treatment systems. Appl Environ Microbiol 72:7813–7820
20. Jost BH, Trinh HT, Songer JG, Billington SJ (2004) A secondtylosin resistance determinant, Erm B, in Arcanobacteriumpyogenes. Antimicrob Agents Chemother 48:721–727
21. Koike S, Krapac IG, Oliver HD, Yannarell AC, Chee-Sanford JC,Aminov RI, Mackie RI (2007) Monitoring and source tracking oftetracycline resistance genes in lagoons and groundwater adjacent toswine production facilities. Appl Environ Microbiol 73:4813–4823
MLSB Methylase Gene Ecology in Groundwater 497
22. Krapac I, Dey WS, Smyth CA, Roy WR (1998) Impacts of bacteria,metals, and nutrients on groundwater at two hog confinementfacilities. In: Proceedings of Animal feeding operations on ground-water: issues, impact, and solutions: a conference for the future.National Ground Water Association, St. Louis, MO, pp. 29–50
23. Krapac IG, Koike S, Meyer MT, Snow DD, Chou SFJ, Mackie RI,Roy WR, Chee-Sanford JC (2004) Long-term monitoring of theoccurrence of antibiotic resistance genes in groundwater nearswine confinement facilities. Proceedings of the 4th Internationalconference on pharmaceuticals and endocrine disrupting chem-icals in water. National Ground Water Association, Minneapolis,MN, pp. 158–172
24. Ladely SR, Harrison MA, Fedorka-Cray PJ, Berrang ME, EnglenMD, Meinersmann RJ (2007) Development of macrolide-resistantCampylobacter in broilers administered subtherapeutic or thera-peutic concentrations of tylosin. J Food Prot 70:1945–1951
25. Larson TH, Krapac IG, Dey WS, Suchomski CJ (1997) Electro-magnetic terrain conductivity surveys used to screen swineconfinement facilities for groundwater contamination. Presented atthe Proceedings of the symposium on the application of geophysicsto engineering and environmental problems, Reno, NV
26. Legendre P, Legendre L (1998) Numerical ecology, secondEnglish ed. Elsevier, Amsterdam
27. Liu MF, Kirpekar F, van Wezel GP, Douthwaite S (2000) Thetylosin resistance gene tlrB of Streptomyces fradiae encodes amethyltransferase that targets G748 in 23S rRNA. Mol Microbiol37:811–820
28. Mackie RI, Koike S, Krapac I, Chee-Sanford J, Maxwell S,Aminov RI (2006) Tetracycline residues and tetracycline resis-tance genes in groundwater impacted by swine productionfacilities. Anim Biotechnol 17:157–176
29. McEwen SA (2006) Antibiotic use in animal agriculture: whathave we learned and where are we going? Anim Biotechnol17:239–250
30. Miller DN (2001) Evaluation of gel filtration resins for theremoval of PCR-inhibitory substances from soils and sediments. JMicrobiol Methods 44:49–58
31. Portillo A, Ruiz-Larrea F, Zarazaga M, Alonso A, Martinez JL,Torres C (2000) Macrolide resistance genes in Enterococcus spp.Antimicrob Agents Chemother 44:967–971
32. R Development Core Team (2005) R: a language and environmentfor statistical computing. R Foundation for Statistical Computing,Vienna
33. Rasmussen JL, Odelson DA, Macrina FL (1986) Completenucleotide sequence and transcription of ermF, a macrolide–lincosamide–streptogramin B resistance determinant from Bacter-oides fragilis. J Bacteriol 168:523–533
34. Roberts MC (2002) Resistance to tetracycline, macrolide-lincosamide-streptogramin, trimethoprim, and sulfonamide drugclasses. Mol Biotechnol 20:261–283
35. Roberts MC (2008) Update on macrolide–lincosamide–streptogramin,ketolide, and oxazolidinone resistance genes. FEMS Microbiol Lett282:147–159
36. Roberts MC, Sutcliffe J, Courvalin P, Jensen LB, Rood J, SeppalaH (1999) Nomenclature for macrolide and macrolide–lincosamide–streptogramin B resistance determinants. Antimicrob Agents Che-mother 43:2823–2830
37. Ronquist F, Huelsenbeck JP (2003) MrBayes 3: Bayesianphylogenetic inference under mixed models. Bioinformatics19:1572–1574
38. Salyers A, Shoemaker NB (2006) Reservoirs of antibioticresistance genes. Anim Biotechnol 17:137–146
39. Singer RS, Ward MP, Maldonado G (2006) Can landscapeecology untangle the complexity of antibiotic resistance? NatRev Microbiol 4:943–952
40. Sutcliffe J, Grebe T, TaitKamradt A, Wondrack L (1996)Detection of erythromycin-resistant determinants by PCR. Anti-microb Agents Chemother 40:2562–2566
41. Thompson JD, Gibson TJ, Plewniak F, Jeanmougin F, HigginsDG (1997) The CLUSTAL_X windows interface: flexiblestrategies for multiple sequence alignment aided by qualityanalysis tools. Nucleic Acids Res 25:4876–4882
42. Tsai YL, Olson BH (1991) Rapid method for direct extraction ofDNA from soil and sediments. Appl Environ Microbiol 57:1070–1074
43. Wegener HC (2003) Antibiotics in animal feed and their role inresistance development. Curr Opin Microbiol 6:439–445
44. Witte W (2000) Ecological impact of antibiotic use in animals ondifferent complex microflora: environment. Int J AntimicrobAgents 14:321–325
45. Yu ZT, Michel FC, Hansen G, Wittum T, Morrison M (2005)Development and application of real-time PCR assays forquantification of genes encoding tetracycline resistance. ApplEnviron Microbiol 71:6926–6933
46. Zhou JZ, Bruns MA, Tiedje JM (1996) DNA recovery from soilsof diverse composition. Appl Environ Microbiol 62:316–322
498 S. Koike et al.
Copyright © 2022 FDOKUMEN