Neutralizing DNA Aptamers against Swine Influenza H3N2 Viruses
Upload
independentCategory
view
0download
0
APPLIED AND ENVIRONMENTAL MICROBIOLOGY, Aug. 2007, p. 4813–4823 Vol. 73, No. 150099-2240/07/$08.00�0 doi:10.1128/AEM.00665-07Copyright © 2007, American Society for Microbiology. All Rights Reserved.
Monitoring and Source Tracking of Tetracycline Resistance Genes inLagoons and Groundwater Adjacent to Swine Production Facilities
over a 3-Year Period�
S. Koike,1† I. G. Krapac,2 H. D. Oliver,1 A. C. Yannarell,1 J. C. Chee-Sanford,3R. I. Aminov,4 and R. I. Mackie1*
Department of Animal Sciences, University of Illinois at Urbana-Champaign,1 and USDA Agricultural Research Service,3 Urbana,Illinois 61801; Illinois State Geological Survey, Champaign, Illinois 618202; and Rowett Research Institute,
Aberdeen AB21 9SB, United Kingdom4
Received 23 March 2007/Accepted 25 May 2007
To monitor the dissemination of resistance genes into the environment, we determined the occurrence oftetracycline resistance (Tcr) genes in groundwater underlying two swine confinement operations. Monitoringwell networks (16 wells at site A and 6 wells at site C) were established around the lagoons at each facility.Groundwater (n � 124) and lagoon (n � 12) samples were collected from the two sites at six sampling timesfrom 2000 through 2003. Total DNA was extracted, and PCR was used to detect seven Tcr genes [tet(M), tet(O),tet(Q), tet(W), tet(C), tet(H), and tet(Z)]. The concentration of Tcr genes was quantified by real-time quantitativePCR. To confirm the Tcr gene source in groundwater, comparative analysis of tet(W) gene sequences wasperformed on groundwater and lagoon samples. All seven Tcr genes were continually detected in groundwaterduring the 3-year monitoring period at both sites. At site A, elevated detection frequency and concentration ofTcr genes were observed in the wells located down-gradient of the lagoon. Comparative analysis of tet(W)sequences revealed that the impacted groundwater contained gene sequences almost identical (99.8% identity)to those in the lagoon, but these genes were not found in background libraries. Novel sequence clusters andunique indigenous resistance gene pools were also found in the groundwater. Thus, antibiotic resistance genesin groundwater are affected by swine manure, but they are also part of the indigenous gene pool.
The emergence and increasing prevalence of antibiotic-re-sistant bacteria that could lead to life-threatening, untreatabledisease has been reported, especially in the medical field. Thewidespread use of antibiotics in human medicine could en-hance the selection of antibiotic resistance. This is a significantissue not only with regard to human health but also for animalhealth and food production. Antibiotics are routinely used inthe livestock industry for therapeutic (disease control), pro-phylactic (disease prevention), and subtherapeutic (growthpromotion) purposes. During the mid-1990s, the consumptionof tetracycline by farm animals in the United States was esti-mated at 3.5 � 106 kg/year (9). Antibiotics can select forresistant microorganisms in the gastrointestinal tracts of ani-mals, particularly when used at subtherapeutic levels (38), pro-viding a potential reservoir for dissemination of drug-resistantbacteria into other animals, humans, and the environment.
Although we have no direct knowledge of the ancestral tet-racycline resistance gene(s), it may have evolved from house-keeping genes (7, 22) for protecting the integrity of ribosomalprotein synthesis (ribosomal protection proteins [RPPs]) ormaintaining intracellular ionic constituent concentrations (ef-flux pump proteins). These antibiotic resistance genes were
then disseminated by interspecies transfer mediated by a vari-ety of agents, such as plasmids, transposons, and bacterio-phages (9, 29). Once resistance genes are introduced into theenvironment, they are also exposed to selective pressure, suchas antibiotics produced by indigenous antibiotic producers insoil. However, selection can occur in the environment withoutantibiotic selective pressure (2). Gilliver et al. (12) reportedthat antibiotic-resistant bacteria had been found in wild ro-dents that had never been exposed to antibiotics. Therefore,antibiotic resistance genes might be distributed and preservedin the broader environment with or without antibiotic selectivepressure.
Lagoon and pit systems are typically used for manure man-agement in confinement animal feeding operations (CAFOs)in the United States. It is of concern that farm-generatedresistant bacteria could easily migrate into soil, groundwater,and surface water via seepage from the manure lagoons andfrom the land application of manure. In the United States,groundwater constitutes about 40% of the water used for pub-lic supply and provides drinking water for more than 97% ofthe rural population (36). To assess the relationship betweenCAFOs and groundwater quality, the occurrence and extent ofcontamination from these facilities must be determined andmade available. Recent monitoring studies have shown thatseepage from animal waste lagoons has affected groundwaterquality (17, 23). Krapac et al. (18, 19) found chemical andbiological indicators of manure contamination, such as chlo-ride and fecal enterococci, at significant levels in groundwatersamples collected near CAFO lagoons and deep pits.
Recently, antibiotic resistance analysis has been employed to
* Corresponding author. Mailing address: University of Illinois, 132Animal Science Laboratory, 1207 W. Gregory Dr., Urbana, IL 61801.Phone: (217) 244-2526. Fax: (217) 333-8804. E-mail: [email protected].
† Present address: Creative Research Initiative Sousei, HokkaidoUniversity, Sapporo 001-0021, Japan.
� Published ahead of print on 1 June 2007.
4813
on May 27, 2016 by guest
http://aem.asm
.org/D
ownloaded from

identify sources of fecal pollution (13, 26, 39, 40). Althoughtraditional microbiological methods such as cultivation andphenotypic testing are commonly used, these approaches aretime-consuming and biased towards the selection of bacteriathat are easily grown in culture media. In addition, bacteriahave been shown to readily exchange genetic information inthe environment, permitting the acquisition of resistance genesor mechanisms already present in the environment and theirtransfer from one microbe to another (3, 11, 28). There is thepotential for resistance genes, selected and excreted, to betransferred into bacteria in the soil, surface water, and ground-water around the facilities; thus, a broad range of bacteria inthose environments can carry a variety of resistance genes.Traditional cultivation-based methods are not adequate to de-tect a broader range of resistant bacteria for monitoring theecology of antibiotic resistance genes in the environment. Incontrast, analysis of antibiotic resistance genes using molecular
PCR methods can provide a rapid and sensitive method fortracking the source of fecal contamination in groundwaterwithout cultivation. In our previous studies, using PCR meth-ods we confirmed the distribution of tetracycline resistance(Tcr) genes in animal gastrointestinal tracts (4, 5) and ingroundwater surrounding two confinement facilities (4, 8).However, these studies were based on a single sampling event;thus, long-term surveillance is necessary to assess the dynamicsof resistance genes in the environment.
The aim of this study was to monitor the long-term occur-rence, distribution, and quantity of Tcr genes in waste lagoonsand groundwater underlying swine confinement facilities. FourTcr genes [tet(M), tet(O), tet(Q), and tet(W)] encoding RPPsand three genes [tet(C), tet(H), and tet(Z)] encoding effluxpumps were selected, since these Tcr genes were frequentlydetected in our previous study (4, 8). PCR for detection of theTcr genes was carried out at two swine confinement facilities
FIG. 1. Locations of monitoring wells and direction of groundwater flow at sites A and C. Stratigraphic columns indicate the locations andcharacteristics of sand layers. Large open arrows indicate the direction of groundwater flow. The locations of monitoring wells are indicated bycircles; open circles at site A represent nested wells screened in the deeper sand layer. Numbers in parentheses are well depths, in meters. Theblack rectangles represent confinement buildings.
4814 KOIKE ET AL. APPL. ENVIRON. MICROBIOL.
on May 27, 2016 by guest
http://aem.asm
.org/D
ownloaded from
between 2000 and 2003. The level of Tcr genes in groundwateris an important parameter for determining the magnitude ofthe impact of CAFOs on the environment. To quantify theseven Tcr genes in groundwater, we employed a real-timequantitative PCR (qPCR) assay that allowed precise and sen-sitive quantification of the target genes (21, 30, 33). In addi-tion, comparative sequence analysis of tet(W) in lagoon andgroundwater samples was carried out to determine the sourceof Tcr genes in groundwater.
MATERIALS AND METHODS
Sampling. The operations and site hydrogeology of two commercial swineconfinement facilities, designated site A and site C, were described previously (8,23). Site A started operations in February of 1995 and is a 4,000-pig finishingoperation (Fig. 1). The facility operates with a two-stage waste handling systemin which a concrete settling basin collects most of the solids prior to the super-natant liquid passively moving into an unlined earthen lagoon. No special con-struction techniques were used to compact the soil during lagoon construction.The concrete settling basin is periodically pumped and the manure applied tocrop fields both on-site (the field east of wells A1 and A2) and off-site (thefar-northern field from well A7). Site C is a farrowing and nursery operationhousing up to 2,500 sows that began operation in 1992 (Fig. 1). The facility usesa single-stage lagoon. The waste has never been applied to the crop fieldssurrounding the lagoon. For the purpose of therapy, preventing diseases, orgrowth promotion, bacitracin, chlortetracycline, and tylosin are used at site A,while chlortetracycline, penicillin, and tylosin are employed at site C.
The site hydrogeology is significantly different at sites A and C (Fig. 1). Tworelatively shallow permeable sand layers underlie site A, whereas site C is un-derlain mainly by a silty loam material. The multiple sand layers make site Aparticularly susceptible to leachate migration from the lagoon, while at site C therelatively impermeable material and limited groundwater resources reduce thepotential for lagoon seepage migration. A groundwater monitoring networkconsisting of 16 wells was installed at site A. Twelve wells were installed in theupper sand layer, and four wells were installed in the lower sand layer (Fig. 1).Six monitoring wells were installed at depths of less than 11 m at site C.
A total of 124 groundwater and 12 lagoon samples were collected between2000 and 2003. Samples were collected at site A in April 2000, May and Sep-tember 2001, January and April 2002, and March 2003. Samples were collectedat site C in April 2000, May and August 2001, January and May 2002, andFebruary 2003. Sampling procedures were as described previously (8, 17, 23).Samples were stored in clean, sterilized bottles and kept on ice in the field.Because samples were to be used for both DNA analysis and bacterial isolation(to be detailed in a future paper), samples were stored at 4°C (to limit bacterialmortality due to freezing) prior to analysis for up to 1 week.
Sample processing and DNA extraction. Groundwater (1-liter) and lagoon(100-ml) samples were centrifuged at 17,700 � g for 20 min at 4°C. The super-natant was discarded, and the pellets were washed three times with 10 ml ofphosphate-buffered saline (120 mM NaH2PO4 [pH 8.0], 0.85% NaCl). TotalDNA was extracted from the pellets using a freeze-thaw method (35). Briefly, thepellets were resuspended in 400 �l of lysis solution (0.15 M NaCl, 0.1 M EDTA[pH 8.0]) containing 15 mg of lysozyme/ml and incubated at 37°C for 2 h, andthen 400 �l of 0.1 M NaCl–0.5 M Tris-HCl (pH 8.0)–10% sodium dodecyl sulfatewas added. Suspensions were incubated for 30 min at 37°C followed by threecycles of freezing at �80°C and thawing in a 65°C water bath. Proteinase K wasadded to a final concentration of 50 �g/ml, the mixture was incubated for 30 minat 37°C and centrifuged, and supernatant was collected. The crude DNA waspurified with polyvinylpolypyrrolidone and Sepharose 2B (Sigma Chemical Co.,St. Louis, MO), as described by Zhou et al. (41) and Miller (24), respectively.DNA concentration was measured using a DU 7500 spectrophotometer (Beck-man, Fullerton, CA) and adjusted to 10 ng/�l.
PCR detection. The class-specific primer sets used to amplify the seven Tcr
genes in this study are shown in Table 1. PCR was conducted using AmpliTaqGold DNA polymerase (Applied Biosystems, Foster City, CA). A reaction mix-ture containing 0.5 �M of each primer, 1.5 mM MgCl2, 0.2 mM each deoxyri-bonucleotide triphosphate, PCR buffer II, 1.25 U of AmpliTaq Gold DNApolymerase, and 10 ng of template DNA in a total volume of 25 �l was prepared.Typical cycle conditions were employed for the primer sets targeting tet(M),tet(O), tet(Q), tet(W), tet(C), and the 16S rRNA gene; meanwhile, a two-tem-perature step-down PCR cycle was used for the primer sets for tet(H) and tet(Z).The annealing temperatures used for amplification of different target genes areshown in Table 1. The temperature program for typical cycle conditions con-sisted of denaturation at 94°C for 10 min, followed by 40 cycles of 94°C for 30 s,annealing (Table 1) for 30 s, and extension at 72°C for 30 s and a final extensionat 72°C for 10 min. The temperature program for the two-temperature step-downPCR was as follows: 94°C for 10 min, 35 [for tet(Z)] or 40 [for tet(H)] cycles of94°C for 30 s, annealing (high temperature) (Table 1) for 30 s, and extension at72°C for 30 s followed by 15 [for tet(Z)] or 10 [for tet(H)] cycles consisting of 94°Cfor 30 s, 63°C (low temperature) for 30 s, and extension at 72°C for 30 s and afinal extension at 72°C for 10 min. PCR amplification was performed with aGeneAmp 2700 thermal cycler (Applied Biosystems). PCR product aliquotswere analyzed by electrophoresis on 2.0% (wt/vol) agarose gel and were stainedwith ethidium bromide.
To determine the detection limit for each primer set, PCR amplification wasperformed on serially diluted cloned plasmids containing the respective targetDNA fragments (see below). To check the negative effects of PCR-inhibitingsubstances in the environmental samples, two-step validation was employed.First, PCR amplification of the 16S rRNA gene (25) was performed for allsamples prior to detection of Tcr genes, and strong band intensity was confirmedon the agarose gel. Then, if the samples were negative for Tcr gene detection,cloned plasmids containing the respective target DNA fragments were diluted to
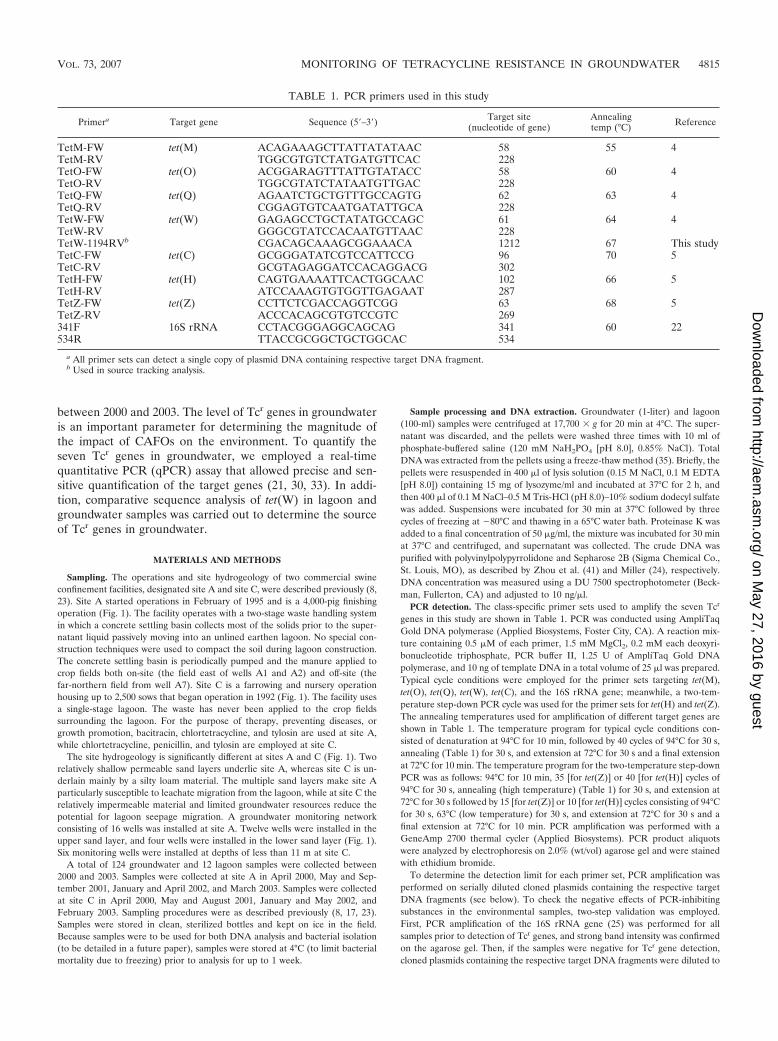
TABLE 1. PCR primers used in this study
Primera Target gene Sequence (5�–3�) Target site(nucleotide of gene)
Annealingtemp (°C) Reference
TetM-FW tet(M) ACAGAAAGCTTATTATATAAC 58 55 4TetM-RV TGGCGTGTCTATGATGTTCAC 228TetO-FW tet(O) ACGGARAGTTTATTGTATACC 58 60 4TetO-RV TGGCGTATCTATAATGTTGAC 228TetQ-FW tet(Q) AGAATCTGCTGTTTGCCAGTG 62 63 4TetQ-RV CGGAGTGTCAATGATATTGCA 228TetW-FW tet(W) GAGAGCCTGCTATATGCCAGC 61 64 4TetW-RV GGGCGTATCCACAATGTTAAC 228TetW-1194RVb CGACAGCAAAGCGGAAACA 1212 67 This studyTetC-FW tet(C) GCGGGATATCGTCCATTCCG 96 70 5TetC-RV GCGTAGAGGATCCACAGGACG 302TetH-FW tet(H) CAGTGAAAATTCACTGGCAAC 102 66 5TetH-RV ATCCAAAGTGTGGTTGAGAAT 287TetZ-FW tet(Z) CCTTCTCGACCAGGTCGG 63 68 5TetZ-RV ACCCACAGCGTGTCCGTC 269341F 16S rRNA CCTACGGGAGGCAGCAG 341 60 22534R TTACCGCGGCTGCTGGCAC 534
a All primer sets can detect a single copy of plasmid DNA containing respective target DNA fragment.b Used in source tracking analysis.
VOL. 73, 2007 MONITORING OF TETRACYCLINE RESISTANCE IN GROUNDWATER 4815
on May 27, 2016 by guest
http://aem.asm
.org/D
ownloaded from

100 (i.e., single) copies and used to spike those samples, and PCR amplificationof the target was confirmed.
Patterns of detection of all Tcr genes from all samples were analyzed usingprincipal components analysis (PCA). Genes detected in a sample were scored as1, while genes not detected were scored as 0, and these presence-absence datawere used for PCA. PCA was performed using the PRIMER 5 for Windowssoftware package (10).
Standard control for real-time qPCR assay. Plasmid DNA to be used as thestandard control in PCR was obtained by PCR cloning using the primer setsshown in Table 1. Amplified target DNA of a control strain positive for relevantgenes was separated on an agarose gel, and the products were excised from thegel. The gel fragments were purified with a QIAquick gel extraction kit(QIAGEN, Valencia, CA), ligated into the pGEM-T Easy vector (Promega,Madison, WI), and transformed into competent Escherichia coli JM109 cells byheat shock. Clones containing the correct insert were confirmed by PCR ampli-fication with the appropriate primer sets. Plasmids were purified by using aQIAprep spin miniprep kit (QIAGEN), and the plasmid concentration wasdetermined by spectroscopy. The copy number of each plasmid was calculatedusing the molecular weight of nucleic acid and the length (in base pairs) of thecloned plasmid.
Validation of DNA extraction and real-time qPCR assay. DNA extractionefficiency and the accuracy of the real-time PCR assay for Tcr genes and the 16SrRNA gene were validated by using known amounts of target to spike environ-mental samples. E. coli cells carrying cloned plasmids for various target DNAfragments were used as the inoculum for the spiking trial. Each portion oftarget-carrying E. coli cells was incubated in liquid Luria-Bertani medium over-night. To determine the plasmid copy number (i.e., copy number of the target)in each culture, plasmid DNA was extracted from the overnight-incubated cul-tures. The plasmid copy number was calculated as described above. Each target-carrying E. coli culture was serially diluted to yield a range from 103 to 108 copiesof the plasmid DNA. The dilution series of cultures containing known amountsof each target DNA fragment was spiked into 0.1 g of lagoon samples. DNA wasextracted from serially diluted E. coli cultures, nonspiked lagoon samples, andtarget-spiked lagoon samples by the freeze-thaw method and was purified withpolyvinylpolypyrrolidone and Sepharose, as described above. Purified DNA wasresuspended in 50 �l of Tris-EDTA buffer. To check the recovery of the targetfrom spiked samples, 0.5 �l of DNA was used for real-time qPCR quantification.Since the lagoon samples used in the spiking trial already contained a high copynumber of the16S rRNA gene, it was impossible to spike E. coli cells to exceedthe indigenous copy number of the 16S rRNA gene. Therefore, recovery of the16S rRNA gene was determined using the DNA extracted from serially dilutedE. coli cultures. The copy number of the 16S rRNA gene in E. coli cultures wascalculated by the microscopic count of E. coli cells in the culture multiplied by 7,which is the reported copy number of the 16S rRNA operon in E. coli (16). Thecoefficient of variation (CV) for each real-time qPCR assay was determined byrepeating the real-time qPCR quantification using the same sample. Overallvariation of quantification was evaluated by repeating the DNA extraction andthe quantification of each target.
Quantification of Tcr genes in lagoon and groundwater samples by real-timeqPCR. PCR amplifications for the quantification of Tcr genes and the 16S rRNAgene in total DNA extracted from the groundwater and lagoon samples wereperformed with a GeneAmp 9600 thermal cycler coupled with a GeneAmp 5700sequence detection system (Applied Biosystems, Foster City, CA). The SYBRGreen PCR Master Mix provided by Applied Biosystems was used with 10 ng oftemplate DNA for PCR amplification. The thermal profile for all SYBR GreenPCRs was the same as that for conventional PCR described above. The 10-folddilution series of the plasmid standard for the respective genes was run alongwith the unknown samples for the corresponding gene controls, and each samplewas duplicated in each reaction. Quantification was made using standard curvesobtained from the amplification profile of known concentrations of the plasmidstandard for the respective genes. All reactions were repeated in duplicate toconfirm the results. Wells A6, A8, A9, A11, A12, and A16 underwent a 2-yearquantitative monitoring effort for the Tcr genes, whereas wells C2, C3, C4, andC6 were monitored at site C.
The data were processed with GeneAmp 5700 SDS software (Applied Biosys-tems, Foster City, CA). To exclude the influence of unequal amplification effi-ciency among the samples, the assay values for all Tcr genes were normalized tothat of the 16S rRNA gene. The normalized assay values were analyzed using theGLM (general linear models) procedure of SAS. Comparisons between meanswere performed using Tukey’s t test at a significance level of 0.05.
Source tracking analysis of tet(W) in groundwater. In order to identify thesource of Tcr genes in groundwater, comparative sequence analysis was con-ducted using tet(W), which was selected based on its distribution in samples from
previous work. The PCR primer TetW-1194RV, specific to tet(W), was designedto obtain a 1,152-bp fragment of tet(W) in combination with the primerTetW-FW (Table 1). Since all tet(OW) mosaic genes have a tet(O) signaturesequence at the position of TetW-FW (31, 32), this primer combination allowedspecific amplification of tet(W) without cross-reaction of tet(OW) mosaic genes.Samples from wells A7, A8, and A14, the lagoon and concrete settling basin atsite A, wells C1, C2, and C4, and the lagoon at site C were used to construct thetet(W) clone libraries. All samples were collected in March 2003 at site A andFebruary 2003 at site C, and DNA was extracted as described above. PCR wasperformed with 25 pmol of each primer and an ExTaq PCR kit (Takara Bio,Otsu, Japan) by using a final reaction mixture volume of 25 �l. Purified DNA (10ng) was used as the template for PCR. The cycle conditions consisted of dena-turation at 94°C for 5 min, followed by 35 cycles consisting of 94°C for 30 s, 67°Cfor 30 s, and extension at 72°C for 1 min and a final extension at 72°C for 7 min.Because of insufficient PCR product from groundwater samples, a second PCRwas performed under the same conditions except that 1 �l of the PCR productfrom the first PCR was used as a template.
PCR products were cloned with a TOPO-TA cloning kit (Invitrogen, Carlsbad,CA), and recombinant plasmids were extracted as described above. DNA anal-ysis for 10 recombinant plasmids from each library was performed for bothstrands (primers M13F and M13R) by the University of Illinois BiotechnologyCenter. Sequences from the tet(W) libraries were compared with the tet(W)sequences available in the GenBank database using the BLAST program. Se-quences were aligned using the multiple sequence alignment softwareCLUSTALX version 1.83 (34). Maximum likelihood (ML) and Bayesian infer-ence (BI) were used to infer trees and estimate clade support. ML analysisincluded the run of 100 resampled trees using DNAML in the PHYLIP package(distributed by J. Felsenstein, Department of Genome Sciences, University ofWashington, Seattle; PHYLIP [Phylogeny Inference Package], version 3.6; http://evolution.genetics.washington.edu/phylip.html). Posterior probabilities werecalculated using a Bayesian Markov chain Monte Carlo method with MrBayesversion 3.1.1 (14, 27). Ten million generations were run, with sampling every 100generations.
Nucleotide sequence accession numbers. Nucleotide sequences from this studyhave been deposited in GenBank under the accession numbers DQ309594 toDQ309693.
RESULTS
DNA extraction efficiency and accuracy of real-time qPCRassay. A summary of the validation of DNA extraction andreal-time qPCR assay is shown in Table 2. The copy number ofthe target quantified from spiked samples showed a clear re-sponse to the increase in the amount used for spiking. Therecovery of DNA was estimated by comparison between the-oretical and recovered copy numbers of the target. Excludingthe assays for tet(O), tet(H), and the 16S rRNA gene, DNArecovery was 71.3 to 166.3% (Table 2). The recovery for tet(O)and tet(H) was lower than that for the other Tcr genes andestimated to be between 17.7 and 40.2%, whereas the recoveryof the 16S rRNA gene was higher than the theoretical numberand was up to 224.3%. The CV for real-time qPCR assays was5.0 to 25.1%, and the assay for tet(H) had a higher CV thanthat for the other targets. The CV for the overall assay, includ-ing the variation of DNA extraction and real-time qPCR assay,was 13.1 to 31.8%, and the assays for tet(H) and the 16S rRNAgene had higher CVs than the others (Table 2). The lower limitfor accurate quantification varied between the targets; the low-est was 60 copies per reaction for tet(Z), and the highest was910 copies per reaction for the 16S rRNA gene (Table 2).Because of differences in extraction efficiency and the presenceor absence of competing templates and/or inhibitory sub-stances, the lower limit for accurate quantification from envi-ronmental samples is different from the lower limit for detec-tion; thus, it may be possible to detect the presence of a Tcr
4816 KOIKE ET AL. APPL. ENVIRON. MICROBIOL.
on May 27, 2016 by guest
http://aem.asm
.org/D
ownloaded from

gene without being able to accurately determine its concentra-tion (Table 3).
PCR detection of Tcr genes from lagoon and groundwatersamples. The primer sets for the Tcr genes were able to detecta single copy of the respective target gene both from pureculture (cloned plasmids) and from plasmid-spiked environ-mental DNA extracted from groundwater samples (data notshown). Therefore, these primers were sensitive enough tomonitor the Tcr genes in groundwater. The total detectionfrequency of the Tcr genes in all samples within each samplingperiod between 2000 and 2003 is shown in Fig. 2a and c. Thetotal detection frequency (summing the number of detectionsfor all Tcr genes found in the lagoon and groundwater sam-ples) was consistent among the sampling periods over the 3years (55 to 75 detections/112 samples) at site A (Fig. 2a). Atsite C, the total detection frequency varied and was lowest (14detections/46 samples) in August 2001 and highest (34 detec-tions/46 samples) in February 2003 (Fig. 2c). There was noclear temporal pattern in total detection frequency at site Camong the sampling periods. The frequency of detecting eachof the Tcr genes in the samples throughout the study is shownin Fig. 2b and d. tet(Q) and tet(W) were detected slightly moreoften than the other tet genes at site A, while tet(H) wasdetected least often at both sites.
PCA based on the presence or absence of all seven Tcr genesfrom all well and lagoon samples (n � 135) revealed spatialvariation in Tcr gene detection (Fig. 3). Because the PCA
centroids were calculated from the average loading of sampleson the principal axes, they are analogous to the combineddetection frequencies of all Tcr genes from each sample loca-tion. All seven tet genes were detected in site A and C lagoonsamples from all six sampling dates. Five wells, A6, A8, A9,A11, and A12, were also consistently positive for all seven tetgenes, with gene detection frequencies ranging from 67 to100% of samples analyzed. These wells plotted very close tothe lagoon samples along the first principal axis (PC1), and thedetection frequency of all tet genes was negatively correlatedwith PC1 (Fig. 3). Gene detection frequencies were highlyvariable in other wells, with some, such as A3, A4, A10, andmost of the site C wells, being virtually indistinguishablefrom control wells A1, A2, A7, and C1 in terms of tet genedetections (Fig. 3). Wells A16 and C4 had slightly elevatedgene detection frequencies in comparison with this group,but they were still distinguishable overall from lagoon sam-ples. There was a tendency for genes encoding RPPs [tet(O),tet(M), tet(Q), tet(W)] to cooccur in samples and a tendencyfor efflux pump genes [tet(C), tet(H), and tet(Z)] to cooccur,and these two classes of genes were separated along PC2(Fig. 3). Efflux pump genes were found more frequently inwells A1, C1, C2, C3, and C4, and RPPs were found morefrequently in most of the wells from site A and the remain-ing two site C wells (Fig. 3).
Three-year quantitative monitoring of Tcr genes in lagoonand impacted wells. Table 3 shows the concentration of Tcr
TABLE 2. Summary of the validation of DNA extraction and real-time qPCR assays
Target Background (106)aCopy no.
Recovery (%)CV (%) Amplification
efficiencyQuantitation range
(copy no.)dTheoretical Recovered qPCRb Overallc
tet(M) 2.13 � 0.17 1.00 � 108 9.25 � 107 92.5 14.4 13.1 1.99 71–7.1 � 108
1.00 � 107 7.13 � 106 71.3
tet(O) 0.10 � 0.01 1.00 � 108 3.75 � 107 17.7 12.0 13.4 2.30 370–3.7 � 108
1.00 � 107 1.77 � 106
1.00 � 106 3.04 � 105 30.4
tet(Q) 2.71 � 0.43 1.00 � 108 8.68 � 107 86.8 5.0 16.0 2.10 240–2.4 � 108
1.00 � 107 9.17 � 106 91.7
tet(W) 1.46 � 0.21 1.00 � 108 8.50 � 107 85.0 6.8 14.4 2.06 410–4.1 � 108
1.00 � 107 1.11 � 107 110.8
tet(C) 0.41 � 0.07 1.00 � 108 1.28 � 108 128.0 13.1 17.6 1.91 220–2.2 � 108
1.00 � 107 1.50 � 107 150.51.00 � 106 1.51 � 106 150.6
tet(H) 0.25 � 0.08 1.00 � 108 2.13 � 107 21.3 25.1 31.8 1.85 470–4.7 � 108
1.00 � 107 2.99 � 106 29.91.00 � 106 4.02 � 105 40.2
tet(Z) 0.10 � 0.02 1.00 � 108 1.66 � 108 166.3 12.1 18.0 1.99 60–6.0 � 108
1.00 � 107 8.69 � 106 86.91.00 � 106 1.29 � 106 129.7
16S rDNA 370.0 � 91.7 2.47 � 106 5.54 � 106 224.3 11.0 24.7 2.13 910–9.1 � 108
2.47 � 105 2.87 � 105 116.32.47 � 104 5.13 � 104 207.7
a Indigenous target amount in the lagoon sample used in the spiking trial.b For repeat quantifications using the same sample.c For separate repeat DNA extractions and quantifications.d Quantitation range was determined using serially diluted plasmid DNA containing respective target DNA fragment.
VOL. 73, 2007 MONITORING OF TETRACYCLINE RESISTANCE IN GROUNDWATER 4817
on May 27, 2016 by guest
http://aem.asm
.org/D
ownloaded from

TA
BL
E3.
Qua
ntita
tive
mon
itori
ngof
conc
entr
atio
nsof
tetr
acyc
line
resi
stan
cege
nes
inla
goon
and
grou
ndw
ater
sam
ples
betw
een
2001
and
2003
byre
al-t
ime
qPC
Ra
Sam
ple
Sam
plin
gpe
riod
Rel
ativ
eab
unda
nce
(no.
ofco
pies
/106
copi
esof
16S
rRN
Age
ne)
tet(
M)
tet(
O)
tet(
Q)
tet(
W)
tet(
C)
tet(
H)
tet(
Z)
Site
Ala
goon
May
2001
33,1
67�
2,37
8A
,X1,
819
�23
8B
,X19
,245
�1,
914
C,X
2,93
5�
545
B,X
1,40
2�
472
B,X
�47
0�
60A
pr.2
002
4,57
3�
343
A,Y
45,4
60�
9,10
9B
,Y50
,663
�4,
034
B,Y
19,5
16�
4,75
6C
,Y7,
529
�92
2A
,X�
470
1,60
4�
172
A,X
Mar
.200
313
,807
�58
6A
B,Y
22,8
08�
2,89
5A
,Z11
,729
�1,
158
B,X
11,8
32�
1,26
9B
,XY
4,54
0�
964
BC
,X�
470
1,53
2�
164
C,X
A6
May
2001
�71
b�
370
�24
0�
410
2,82
2�
673
X�
470
�60
Apr
.200
22,
520
�42
9A
,X�
370
1,85
9�
352
A,X
467
�56
A,X
10,0
78�
1,34
9A
,XY
�47
0�
60M
ar.2
003
2,46
3�
190
A,X
�37
01,
454
�16
4A
,X�
410
19,1
21�
831
B,Y
�47
014
5�
15A
A8
May
2001
ND
�37
03,
622
�43
5A
,X1,
078
�10
4A
,X28
,081
�3,
114
B,X
ND
202
�10
3A
,XA
pr.2
002
6,44
2�
887
A,X
�37
06,
225
�34
2A
B,X
2,91
8�
217
A,X
17,4
96�
3,06
2B
,X�
470
�60
Mar
.200
31,
137
�29
7A
,X�
370
408
�15
9A
,X�
410
�22
0�
470
815
�62
A,X
A9
May
2001
692
�19
8A
,X�
370
2,41
6�
487
A,X
451
�38
A,X
56,6
42�
5,31
9B
,X�
470
�60
Apr
.200
21,
351
�30
0A
,X�
370
2,50
6�
488
A,X
1,15
6�
79A
,X11
,383
�65
1A
,Y�
470
807
�11
4A
,XM
ar.2
003
8,53
5�
827
AB
,X90
8�
97A
,X8,
602
�1,
127
AB
,X4,
470
�1,
327
A,X
14,5
54�
995
B,Y
�47
019
6�
11A
,X
A11
May
2001
1,96
1�
337
A,X
�37
05,
626
�60
9A
,X1,
240
�21
6A
,X96
,156
�3,
680
B,X
Z�
470
�60
Apr
.200
24,
051
�49
7A
,X42
1�
47A
,X4,
418
�75
4A
,X3,
294
�24
0A
,X11
,266
�2,
586
A,Y
�47
0N
DM
ar.2
003
5,28
8�
364
A,X
�37
03,
742
�64
7A
,X1,
358
�11
8A
,X10
3,13
4�
15,3
44B
,Z3,
747
�1,
282
A,X
2,84
0�
171
A
A12
May
2001
�71
�37
0�
240
437
�15
1A
,X51
5�
1A
,X�
470
�60
Apr
.200
283
0�
115
A,X
�37
072
4�
101
A,X
�41
01,
706
�23
0A
,X�
470
�60
Mar
.200
336
2�
37A
,X�
370
�24
0�
410
1,93
4�
85A
,X�
470
448
�61
A
A16
May
2001
ND
ND
ND
ND
ND
ND
ND
Apr
.200
2�
71�
370
�24
0�
410
ND
ND
175
�28
XM
ar.2
003
ND
ND
�24
0�
410
ND
ND
646
�14
X
Site
Cla
goon
May
2001
9,65
8�
167
A,X
2,23
0�
140
AD
,X12
0,99
9�
6,51
0B
,X6,
967
�67
2A
D,X
50,6
16�
5,78
3C
,X48
5�
82B
,X31
1�
16D
,XM
ay20
027,
816
�71
5A
,X10
,854
�2,
406
A,X
Y52
,684
�3,
039
B,Y
27,2
00�
2,68
2C
,Y71
,556
�12
,655
D,Y
�47
060
4�
61A
,XF
eb.2
003
9,42
6�
598
AD
,X14
,359
�3,
282
A,Y
27,2
78�
3,21
0B
,Z47
,026
�4,
046
C,Z
3,24
1�
722
D,Z
�47
03,
490
�27
9D
,X
C2
May
2001
�71
ND
ND
ND
ND
ND
ND
May
2002
ND
�37
0N
D�
410
ND
ND
ND
Feb
.200
3�
71�
370
�24
0�
410
2,65
5�
155
�47
0�
60
C3
May
2001
�71
�37
0�
240
�41
023
7�
29�
470
�60
May
2002
ND
ND
ND
ND
ND
ND
�60
Feb
.200
3�
71�
370
�24
0�
410
ND
ND
ND
C4
May
2001
ND
ND
�24
0�
410
�22
0N
D�
60M
ay20
0239
4�
64A
,X�
370
�24
0�
410
235
�16
A,X
ND
�60
Feb
.200
31,
231
�13
8A
,X�
370
1,60
8�
178
A51
5�
143
A,X
1,70
7�
106
A,X
�47
0�
60
C6
May
2001
�71
ND
�24
0�
410
ND
ND
ND
May
2002
ND
�37
0N
D�
410
ND
ND
ND
Feb
.200
3N
D�
370
ND
ND
ND
ND
ND
aT
heco
pynu
mbe
rsof
the
targ
etge
nes
wer
eno
rmal
ized
toth
eco
pynu
mbe
rof
the
16S
rRN
Age
ne.N
D,n
otde
tect
ed.S
tatis
tical
sign
ifica
nce
isin
dica
ted
asfo
llow
s:A
,B,C
,and
D,m
eans
inth
esa
me
row
with
diffe
rent
lett
ers
diffe
rsi
gnifi
cant
ly(P
�0.
01)
amon
gth
ege
nes;
X,Y
,and
Z,m
eans
with
inth
esa
mpl
ein
the
sam
eco
lum
nw
ithdi
ffere
ntle
tter
sdi
ffer
sign
ifica
ntly
(P�
0.01
)am
ong
the
peri
ods.
bB
elow
the
quan
tifica
tion
limit.
See
Tab
le2.
4818 KOIKE ET AL. APPL. ENVIRON. MICROBIOL.
on May 27, 2016 by guest
http://aem.asm
.org/D
ownloaded from

genes in lagoon and groundwater samples collected between2001 and 2003. Although concentrations fluctuated during the2-year monitoring period, greater Tcr gene concentrationswere detected in the lagoons than in groundwater (1.42 � 104
� 4.18 � 103 copies per 106 16S rDNA copies versus 5.21�103 � 3.62� 103 copies per 106 16S rDNA copies, on average).The concentrations of genes encoding RPPs [tet(M), tet(O),tet(Q), and tet(W)] were generally greater than those of theefflux pump genes [tet(C), tet(H), and tet(Z)] in lagoon samplescollected from both sites (on average, 6.5- and 1.9-fold higherat sites A and C, respectively). The Tcr gene concentrations ingroundwater at site A were significantly lower than those in thelagoon; however, a remarkably higher proportion of tet(C) inwells A6, A8, A9, and A11 than in the lagoon was confirmedduring the monitoring period at site A; the average concentra-tion of tet(C) in groundwater was 5.9-fold greater than theaverage concentration of tet(C) in the lagoon and was 8.3- to75.2-fold higher than the average concentration of the otherTcr genes in groundwater (Table 3). Overall Tcr gene concen-trations in wells A8, A9, and A11 were 1.5- to 3.9-fold higher(on average) than those in the other selected monitoring wellsat site A (Table 3). Unlike at site A, the concentrations of Tcr
genes were lower than the quantification limit in almost allsamples at site C. There was a significant difference in theconcentration of Tcr genes in nested wells A9 and A16 at siteA (Table 3; Fig. 1). Well A9, installed in the upper sand layer,contained a significant concentration of Tcr genes, whereas the
FIG. 2. Total detection frequency (a and c) and proportion (b and d) of seven tetracycline resistance genes at two swine facilities between 2000and 2003 determined by PCR. Total detection frequency was calculated by summing the number of positive detections of all seven tet genes foundin the lagoon and groundwater samples at each sampling time. The proportion of detection frequency for each tet gene was expressed as percentageof detection frequency for each gene against total detection frequency over the 3-year monitoring period. Sample number (n) was calculated asaverage sample number (16.0 for site A and 6.6 for site C) multiplied by 7 (the number of targeted tet genes).
FIG. 3. PCA biplot of tetracycline resistance gene occurrence ingroundwater wells and lagoon samples. Plotted points represent thecentroids of the data from six sampling dates for each well, and errorbars show the bivariate variance. Vectors display the loadings of tetgene presence and absence in wells on the first two principal compo-nent axes. Triangles represent wells from site A (white, backgroundwells; light gray and upward pointing, wells in shallow sand layer; darkgray and downward pointing, wells in deep sand layer), circles repre-sent wells from site C, and squares represent lagoon samples. For welllocations, see Fig. 1.
VOL. 73, 2007 MONITORING OF TETRACYCLINE RESISTANCE IN GROUNDWATER 4819
on May 27, 2016 by guest
http://aem.asm
.org/D
ownloaded from

Tcr gene concentration was lower than quantification limit inwell A16, which was in the deeper sand layer (Table 3).
Source tracking analysis of tet(W) in groundwater. A total of100 clones for tet(W) from 10 libraries (A7, A8, A9, and A14and lagoon and concrete settling basin at site A; C1, C2, andC4 and lagoon at site C; 10 clones from each library) weresequenced and subsequently subjected to phylogenetic analy-sis. For sequences from waste samples, clone names begin with“WS” followed by sample source (AP, solid waste in concretesettling basin at site A; AL, waste in lagoon at site A; CL, wastein lagoon at site C) and clone number. For the sequences fromgroundwater samples, clones are named with the prefix “GW”followed by well number and clone number.
The results of phylogenetic analysis of tet(W) are shown inFig. 4. ML and BI approaches produced similar tree topologyand clade support; therefore, the result from BI is shown inFig. 4. Among the 100 clones sequenced in this study, fivesequence groups, named IG-1 to IG-5, were found. Withineach IG group, all clones had identical nucleotide sequences.IG-1 contained two clones from site C (C4 and lagoon). In the1,152-bp sequenced region, most cultivated tet(W) sequencesdeposited in the GenBank database belonged to IG-1. Thehosts of tet(W) sequences belonging to IG-1 were as follows(with GenBank accession number in parentheses): Butyrivibriofibrisolvens (AJ222769 and AJ427421), Clostridiaceae bacte-rium K10 (AY601650), Megasphaera elsdenii (AY485125), Mit-suokella multacida (AY603069), and Mitsuokella multiacidus(AJ427422). IG-2 comprised one clone from site A (A8), fiveclones from site C (C1, C4), and tet(W) from a Bifidobacteriumsp. (AF202986). All seven clones belonging to IG-3 were re-trieved from wells A7 and A14. IG-4 consisted of five clonesfrom waste samples at site A. IG-5 contained two clones fromwell C2.
The five sequence groups (IG-1 through IG-5) could beseparated into three distinct clusters (I, II, and III), and thebranching of clusters II and III was supported by 100% prob-ability (Fig. 4). Twenty-two out of 30 clones from the waste atboth sites were found in cluster III. Six groundwater clonesfrom wells A9 and C4 also belonged to cluster III. All clonesfrom distant or background wells at site A (wells A7 and A14)formed a subcluster within cluster II, whereas 12 out of 20clones from impacted wells (wells A8 and A9) and a clone fromthe waste were found in cluster I (Fig. 4). Although clusterassignment differed between sites, a similar trend was observedat site C, i.e., all background well (C1) clones were found incluster I, and five clones from waste and six clones from wellsC2 and C4 belonged to cluster II (Fig. 4).
DISCUSSION
In our previous study, where only samples from a singlesampling event were analyzed, tet(M), tet(O), tet(Q), tet(W),tet(C), tet(H), and tet(Z) were frequently detected in ground-water collected at sites A and C (5, 10). In the present work, allseven Tcr genes were repeatedly detected at both sites over the3-year monitoring period without a clear temporal pattern indetection frequency or copy number of any specific gene (Fig.2; Table 3). The variable nature of Tcr genes in these samplesimplies that tetracycline resistance in impacted and native mi-crobial communities is a dynamic phenomenon subject to fluc-
tuations in organism and gene migration, persistence of micro-bial populations, and/or selection pressure. In our previousstudy, tetracycline, chlortetracycline, and oxytetracycline resi-dues were detected in fewer than 5% of the groundwatersamples from both sites (20, 23). Tetracycline concentrations intetracycline-positive samples were lower than 0.4 �g/liter. Thisconcentration is low compared to the concentration for in vitroscreening of resistant bacteria, where the antibiotic is used at�g/ml levels. Although low antibiotic concentrations ingroundwater would likely not select for resistant bacteria, thefrequency of resistance gene transfer might be enhanced atthese levels (29).
To avoid underestimation of target, sufficient recovery ofDNA from the samples was an important point in the environ-mental study. In this study, we demonstrated the satisfactorilyhigh efficiency of our DNA extraction approach (Table 2), andthe real-time qPCR assays we developed in this study producedconsistent results with low variability. Therefore, the combina-tion of DNA extraction method and real-time qPCR assaysemployed in this study ensured the potential for precise quan-tification of Tcr genes across a broad range of target copynumbers (Table 2). However, because E. coli was used in ourtarget-spiked validation, it is possible that extraction efficiencyfor Tcr genes in native microbial populations may vary. Therewas also gene-specific variation in extraction efficiency (Table2). The assay for tet(O) and tet(H) showed a lower recoveryrate than the other target genes; therefore, the quantity ofthese genes could have been underestimated in this study.DNA recovery of the 16S rRNA gene showed the possibilityfor slight overestimation of total bacterial number in the sam-ples. However, because 16S rRNA gene copy number was usedfor normalization, the relative abundances of all Tcr geneswere affected equally, and therefore any overestimation of 16SrRNA gene copy number would not influence comparisons ofrelative Tcr gene target abundances.
Although our DNA extraction and purification methodsshowed the ability to provide high-quality DNA with sufficientrecovery, the difference in DNA quantity and purity betweenthe samples significantly affected the cycle threshold, which isthe critical point for quantification. Therefore, experimentalvariability encountered with real-time qPCR should be mini-mized by quantifying a control gene such as a housekeepinggene (1). To compensate for differences in DNA amount andquality between different samples, we normalized the quanti-fication values for each Tcr gene in relation to 16S rRNA genecopy number in each sample.
The relative abundance (target gene/16S rRNA gene) of tetRPP genes was greater than that of tet efflux pump genes inlagoon samples (Table 3). Similar observations were obtainedfor samples from swine waste treatment systems on a differentset of farms, for which no groundwater samples are available(15). Here, however, the tet(C) abundance in groundwater was5.9-fold higher (on average) than in the lagoons (Table 3). Thisobservation suggests that differential migration or selection ofTcr genes occurred from lagoon to groundwater. The highertet(C) abundance in groundwater can be attributed to possiblegreater migration of tet(C) carriers from the lagoons togroundwater, greater gene transfer of this gene from lagoonbacteria to groundwater bacteria, and/or greater persistence ofmigrants and indigenous tet(C) carriers in groundwater. Al-
4820 KOIKE ET AL. APPL. ENVIRON. MICROBIOL.
on May 27, 2016 by guest
http://aem.asm
.org/D
ownloaded from

FIG. 4. BI dendrogram showing the phylogenetic affiliations of tet(W) sequences from lagoon and groundwater samples. For thesequences from the waste samples, clone names begin with “WS” followed by sample source (AP, manure solids in concrete settling basinat site A; AL, waste in lagoon at site A; CL, waste in lagoon at site C) and clone number. For the sequences from groundwater samples,clones are named with the prefix “GW” followed by well number and clone number. Sequences from manure samples are shown in boldface.The number at the node indicates the probability of branching obtained by 10 million generations; 1.00 corresponds to 100% support of thebranching. Bar, nucleotide substitutions per sequence position. Sequence groups IG-1 to IG-5 are boxed within the tree. Within each IGgroup, all clones had identical nucleotide sequences. The numbers in parentheses for IG groups indicate the number and source site ofsequences belonging to each group.
VOL. 73, 2007 MONITORING OF TETRACYCLINE RESISTANCE IN GROUNDWATER 4821
on May 27, 2016 by guest
http://aem.asm
.org/D
ownloaded from

though the relative abundance of tet(C) was greater in ground-water, the absolute number of 16S rRNA gene copies per ml ofsamples was estimated to be 576.6-fold higher in lagoon sam-ples (data not shown). Thus, the absolute copy number oftet(C) in the lagoon was likely higher than that in groundwater.
Tcr genes were continuously detected in the lagoons fromboth sites, and Tcr genes were detected with some frequencyfrom all groundwater wells, even those considered to be back-ground control wells due to their up-gradient location relativeto lagoons. Nevertheless, some wells were clearly more im-pacted by Tcr gene contamination than others (Fig. 3). WellsA6, A8, A9, A11, and A12 were most like the lagoons in thedetection frequency of Tcr genes, and these wells were consis-tently more likely to contain the full complement of all sevengenes (Fig. 3). These wells were all situated in the shallow sandlayer and located near the lagoon (Fig. 1). Wells located up-gradient or at a greater distance down-gradient and wells in-stalled in the lower sand layer had a lower frequency of Tcr
gene detection (Fig. 1 and 3). Previous work has shown thatshallow groundwater down-gradient of the site A lagoon issignificantly impacted by lagoon seepage, and wells A6, A8,A9, A11, and A12 contained high concentrations of chlorideand ammonia (20). In fact, PC1 (Fig. 3) was highly negativelycorrelated with the indicators of lagoon seepage contaminationmeasured by Krapac et al. (20): chloride (Pearson’s R ��0.78), ammonia (R � �0.84), and electrical conductivity (R� �0.81). Thus, there is a correlation between chemical con-tamination and biological contamination of tetracycline-resis-tant organisms and/or their Tcr genes.
The hydrogeological characteristics of aquifers can play animportant role in Tcr gene movement. The silty clay layerbetween the two sand layers at site A (Fig. 1) appeared to besomewhat resistant to Tcr gene movement, and nested wellsinstalled in the lower sand had a decreased frequency of tetgene detection (Fig. 3) and a lower copy number of tet genes(Table 3) than their shallow-sand-layer counterparts. Krapacet al. (20) indicated that tetracyclines were sorbed significantlyby the soil collected at site A, and silty material exhibited amuch higher affinity for the tetracyclines than did the sand.Therefore, contaminants in the seepage from the lagoon maybe filtered through the intervening silty loam layer, resulting inlower concentrations of antibiotics and/or Tcr genes in deeperwells. This may also explain the lower Tcr gene detection fre-quency (Fig. 3) and lower Tcr gene copy numbers (Table 3)observed at site C in comparison to site A, as the impermeableclay till at site C (Fig. 1) may retard the movement of contam-inants from the lagoon to the groundwater. Comparison ofchemical and biological contamination of groundwater at anexpanded number of farms with different hydrogeologicalcharacteristics should further illustrate this relationship.
The occurrence of Tcr genes in distant background wellslocated up-gradient of the lagoon was confirmed in this study(Fig. 3); therefore, it was essential that the source of antibioticresistance genes in groundwater be identified. In this study,tet(W) was chosen as a representative tetracycline resistancegene, since it was widely distributed in lagoons and pollutedwells as well as background control wells (Fig. 3). The mostsignificant finding of the comparative sequence analysis in thisstudy is that impacted groundwater contained the gene se-quences (clones GW-A9-1, GW-A9-6, and GW-C4-11) which
showed more than 99.8% identity (two nucleotide substitutionsin a 1,152-bp fragment) to the waste clones (Fig. 4). This resultimplies that antibiotic resistance genes can migrate betweenthese connected aquatic systems. It is unclear whether thepresence of antibiotic resistance genes is the result of themigration of antibiotic-resistant bacteria or transmission ofresistance genes by horizontal gene transfer (3, 11, 28). Severalreports indicate that E. coli can survive in anoxic groundwaterafter excretion from the animal (6, 37). In fact, Krapac et al.(17) previously demonstrated that groundwater collected atsite A and site C contained fecal coliforms and fecal strepto-cocci. These data indicate that bacterial migration has likelyoccurred to a limited extent at both sites, and it is possible thatfecal bacteria contribute to dissemination of antibiotic resis-tance genes from manure to groundwater.
With a high posterior probability, tet(W) gene sequencesfrom lagoon and polluted groundwater formed a cluster dis-tinct from the known sequence group (Fig. 4), indicating thatanimal wastes contain a novel sequence diversity of tet(W).Although sites A and C are located 265 km from each other,tet(W) sequences from waste lagoon at both sites belonged toa unique, novel tet(W) cluster (Fig. 4). Therefore, in the con-text of microevolution, swine confinement facilities may havespecific selection pressures. On the other hand, two distinctclusters of groundwater clones were observed, indicating thatlocal selection pressure might exist even in nonimpactedgroundwater. Focusing on site A, where the environmentalimpact was greater, an up-gradient clone subcluster (ground-water subcluster) was clearly isolated from the other ground-water clusters, which were comprised of clones from impactedgroundwater (clusters I and II) (Fig. 4). There may be differentselection pressures in impacted and nonimpacted groundwa-ters, and lagoon seepage might influence this. Additionally,there is evidence that site-specific differences exist within thegroundwater communities at these sites: nonimpacted wellsfrom site A tended to have a higher occurrence of RPP, whileefflux pump genes tended to be more prevalent in most of thesite C wells (Fig. 3). These observations concerning compara-tive gene diversity strongly support the presence of an indige-nous tet gene pool in groundwater, and the ecological pressuresmaintaining these pools may operate independently of lagoonseepage.
In conclusion, animal waste seeping from unlined lagoons(20) at two swine confinement facilities had an impact on thedissemination of tetracycline resistance genes in groundwaternear the facilities. Thus, these types of facilities can be reser-voirs of antibiotic resistance genes. However, the magnitudeand extent of antibiotic resistance gene migration resultingfrom lagoon seepage are likely dependent on lagoon construc-tion and local hydrogeological conditions. The migration of Tcr
genes into groundwater was confirmed by comparative se-quence analysis of tet(W). In addition, novel sequence clustersof this gene and unique indigenous resistance gene pools ingroundwater were also detected.
ACKNOWLEDGMENTS
This research was supported by funding from the USDA NRI Com-petitive Grants Program 26.0 (award no. 2001-35102-10774 and 2005-35102-16426) and partially by Hatch funding from the AgriculturalExperimental Station, University of Illinois at Urbana-Champaign.
4822 KOIKE ET AL. APPL. ENVIRON. MICROBIOL.
on May 27, 2016 by guest
http://aem.asm
.org/D
ownloaded from

REFERENCES
1. Aerts, J. L., M. I. Gonzales, and S. L. Topalian. 2004. Selection of appro-priate control genes to assess expression of tumor antigens using real-timeRT-PCR. BioTechniques 36:84–86.
2. Alonso, A., P. Sanchez, and J. L. Martınez. 2001. Environmental selection ofantibiotic resistance genes. Environ. Microbiol. 3:1–9.
3. Amabile-Cuevas, C. F., and M. E. Chicurel. 1992. Bacterial plasmids andgene flux. Cell 70:189–199.
4. Aminov, R. I., J. C. Chee-Sanford, N. Garrigues, B. Teferedegne, I. J. Kra-pac, B. A. White, and R. I. Mackie. 2002. Development, validation, andapplication of PCR primers for detection of tetracycline efflux genes ofgram-negative bacteria. Appl. Environ. Microbiol. 68:1786–1793.
5. Aminov, R. I., N. Garrigues-Jeanjean, and R. I. Mackie. 2001. Molecularecology of tetracycline resistance: development and validation of primers fordetection of tetracycline resistance genes encoding ribosomal protectionproteins. Appl. Environ. Microbiol. 67:22–32.
6. Banning, N., S. Toze, and B. J. Mee. 2002. Escherichia coli survival ingroundwater and effluent measured using a combination of propidium iodideand the green fluorescent protein. J. Appl. Microbiol. 93:69–76.
7. Baquero, F., and J. Blazquez. 1997. Evolution of antibiotic resistance. TrendsEcol. Evol. 12:482–487.
8. Chee-Sanford, J. C., R. I. Aminov, I. J. Krapac, N. Garrigues-Jeanjean, andR. I. Mackie. 2001. Occurrence and diversity of tetracycline resistance genesin lagoons and groundwater underlying two swine production facilities. Appl.Environ. Microbiol. 67:1494–1502.
9. Chopra, I., and M. Roberts. 2001. Tetracycline antibiotics: mode of action,applications, molecular biology, and epidemiology of bacterial resistance.Microbiol. Mol. Biol. Rev. 65:232–260.
10. Clarke, K. R., and R. N. Gorley. 2001. PRIMER 5 for Windows: Plymouthroutines in multivariate ecological research, 5.2.7 ed. PRIMER-E, Plymouth,United Kingdom.
11. Dzidic, S., and V. Bedekovic. 2003. Horizontal gene transfer: emerging mul-tidrug resistance in hospital bacteria. Acta Pharmacol. Sin. 24:519–526.
12. Gilliver, M. A., M. Bennett, M. Begon, S. M. Hazel, and C. A. Hart. 1999.Enterobacteria: antibiotic resistance found in wild rodents. Nature 401:233–234.
13. Hagedorn, C., S. L. Robinson, J. R. Filtz, S. M. Grubbs, T. A. Angier, andR. B. Reneau. 1999. Determining sources of fecal pollution in a rural Virginiawatershed with antibiotic resistance patterns in fecal streptococci. Appl.Environ. Microbiol. 65:5522–5531.
14. Huelsenbeck, J. P., and F. Ronquist. 2001. MRBAYES: Bayesian inferenceof phylogenetic trees. Bioinformatics 17:754–755.
15. Jindal, A., S. Kocherginskaya, A. Mehboob, M. Robert, R. I. Mackie, L.Raskin, and J. L. Zilles. 2006. Antimicrobial use and resistance in swinewaste treatment systems. Appl. Environ. Microbiol. 72:7813–7820.
16. Klappenbach, J. A., P. R. Saxman, J. R. Cole, and T. M. Schmidt. 2001.rrndb: the Ribosomal RNA Operon Copy Number Database. Nucleic AcidsRes. 29:181–184.
17. Krapac, I., W. S. Dey, C. A. Smyth, and W. R. Roy. 1998. Impacts of bacteria,metals, and nutrients on groundwater at two hog confinement facilities, p.29–50. In Proceedings of Animal Feeding Operations and Groundwater:Issues, Impact, and Solutions: a Conference for the Future. National GroundWater Association, St. Louis, MO.
18. Krapac, I. G., W. S. Dey, W. R. Roy, B. G. Jellerichs, and C. A. Smyth. 2000.Groundwater quality near livestock manure pits, p. 710–718. In Proceedingsof 8th International Symposium on Animal, Agricultural, and Food Process-ing Waters. American Society for Agricultural Engineering, Des Moines, IA.
19. Krapac, I. G., W. S. Dey, W. R. Roy, C. A. Smyth, E. Storment, S. L. Sargent,and J. D. Steele. 2002. Impacts of swine manure pits on groundwater quality.Environ. Pollut. 120:475–492.
20. Krapac, I. G., S. Koike, M. T. Meyer, D. D. Snow, S. F. J. Chou, R. I. Mackie,W. R. Roy, and J. C. Chee-Sanford. 2004. Long-term monitoring of theoccurrence of antibiotic resistance genes in groundwater near swine confine-ment facilities, p. 158–172. In Proceedings of 4th International Conferenceon Pharmaceuticals and Endocrine Disrupting Chemicals in Water. NationalGround Water Association, Minneapolis, MN.
21. Labrenz, M., I. Brettar, R. Christen, S. Flavier, J. Botel, and M. G. Hofle.2004. Development and application of a real-time PCR approach for quan-tification of uncultured bacteria in the central Baltic Sea. Appl. Environ.Microbiol. 70:4971–4979.
22. Linares, F., and K. Sundback. 2006. Uptake of dissolved free amino acids(DFAA) by microphytobenthic communities. Aquat. Microb. Ecol. 42:175–186.
23. Mackie, R. I., S. Koike, I. Krapac, J. Chee-Sanford, S. Maxwell, and R. I.Aminov. 2006. Tetracycline residues and tetracycline resistance genes ingroundwater impacted by swine production facilities. Anim. Biotechnol. 17:157–176.
24. Miller, D. N. 2001. Evaluation of gel filtration resins for the removal ofPCR-inhibitory substances from soils and sediments. J. Microbiol. Methods44:49–58.
25. Muyzer, G., E. C. De Waal, and A. G. Uitterlinden. 1993. Profiling ofcomplex microbial populations by denaturing gradient gel electrophoresisanalysis of polymerase chain reaction-amplified genes coding for 16S rRNA.Appl. Environ. Microbiol. 59:695–700.
26. Pillai, S. D., K. W. Widmer, K. G. Maciorowski, and S. C. Ricke. 1997.Antibiotic resistance profiles of Escherichia coli isolated from rural andurban environments. J. Environ. Sci. Health Part A 32:1665–1675.
27. Ronquist, F., and J. P. Huelsenbeck. 2003. MrBayes 3: Bayesian phylogeneticinference under mixed models. Bioinformatics 19:1572–1574.
28. Salyers, A. A., and C. F. Amabile-Cuevas. 1997. Why are antibiotic resistancegenes so resistant to elimination? Antimicrob. Agents Chemother. 41:2321–2325.
29. Salyers, A. A., N. B. Shoemaker, and L. Y. Li. 1995. In the driver’s seat: theBacteroides conjugative transposons and the elements they mobilize. J. Bac-teriol. 177:5727–5731.
30. Smith, M. S., R. K. Yang, C. W. Knapp, Y. F. Niu, N. Peak, M. M. Hanfelt,J. C. Galland, and D. W. Graham. 2004. Quantification of tetracyclineresistance genes in feedlot lagoons by real-time PCR. Appl. Environ. Mi-crobiol. 70:7372–7377.
31. Stanton, T. B., and S. B. Humphrey. 2003. Isolation of tetracycline-resistantMegasphaera elsdenii strains with novel mosaic gene combinations of tet(O)and tet(W) from swine. Appl. Environ. Microbiol. 69:3874–3882.
32. Stanton, T. B., J. S. McDowall, and M. A. Rasmussen. 2004. Diverse tetra-cycline resistance genotypes of Megasphaera elsdenii strains selectively cul-tured from swine feces. Appl. Environ. Microbiol. 70:3754–3757.
33. Tajima, K., R. I. Aminov, T. Nagamine, H. Matsui, M. Nakamura, and Y.Benno. 2001. Diet-dependent shifts in the bacterial population of the rumenrevealed with real-time PCR. Appl. Environ. Microbiol. 67:2766–2774.
34. Thompson, J. D., T. J. Gibson, F. Plewniak, F. Jeanmougin, and D. G.Higgins. 1997. The CLUSTAL_X windows interface: flexible strategies formultiple sequence alignment aided by quality analysis tools. Nucleic AcidsRes. 25:4876–4882.
35. Tsai, Y. L., and B. H. Olson. 1991. Rapid method for direct extraction ofDNA from soil and sediments. Appl. Environ. Microbiol. 57:1070–1074.
36. U.S. Geological Survey. 1995, posting date. Ground water studies. http://water.usgs.gov/wid/html/GW.html.
37. Wang, G. D., T. Zhao, and M. P. Doyle. 1996. Fate of enterohemorrhagicEscherichia coli O157:H7 in bovine feces. Appl. Environ. Microbiol. 62:2567–2570.
38. Wegener, H. C. 2003. Antibiotics in animal feed and their role in resistancedevelopment. Curr. Opin. Microbiol. 6:439–445.
39. Wiggins, B. A. 1996. Discriminant analysis of antibiotic resistance patterns infecal streptococci, a method to differentiate human and animal sources offecal pollution in natural waters. Appl. Environ. Microbiol. 62:3997–4002.
40. Wiggins, B. A., R. W. Andrews, R. A. Conway, C. L. Corr, E. J. Dobratz, D. P.Dougherty, J. R. Eppard, S. R. Knupp, M. C. Limjoco, J. M. Mettenburg,J. M. Rinehardt, J. Sonsino, R. L. Torrijos, and M. E. Zimmerman. 1999.Use of antibiotic resistance analysis to identify nonpoint sources of fecalpollution. Appl. Environ. Microbiol. 65:3483–3486.
41. Zhou, J. Z., M. A. Bruns, and J. M. Tiedje. 1996. DNA recovery from soilsof diverse composition. Appl. Environ. Microbiol. 62:316–322.
VOL. 73, 2007 MONITORING OF TETRACYCLINE RESISTANCE IN GROUNDWATER 4823
on May 27, 2016 by guest
http://aem.asm
.org/D
ownloaded from
Copyright © 2022 FDOKUMEN