2003 Nebraska Swine Report
68
University of Nebraska - Lincoln University of Nebraska - Lincoln DigitalCommons@University of Nebraska - Lincoln DigitalCommons@University of Nebraska - Lincoln Nebraska Swine Reports Animal Science Department January 2003 2003 Nebraska Swine Report 2003 Nebraska Swine Report Duane Reese University of Nebraska-Lincoln, [email protected] Follow this and additional works at: https://digitalcommons.unl.edu/coopext_swine Part of the Animal Sciences Commons Reese, Duane, "2003 Nebraska Swine Report" (2003). Nebraska Swine Reports. 50. https://digitalcommons.unl.edu/coopext_swine/50 This Article is brought to you for free and open access by the Animal Science Department at DigitalCommons@University of Nebraska - Lincoln. It has been accepted for inclusion in Nebraska Swine Reports by an authorized administrator of DigitalCommons@University of Nebraska - Lincoln.
-
Upload
khangminh22 -
Category
Documents
-
view
0 -
download
0
Transcript of 2003 Nebraska Swine Report

University of Nebraska - Lincoln University of Nebraska - Lincoln
DigitalCommons@University of Nebraska - Lincoln DigitalCommons@University of Nebraska - Lincoln
Nebraska Swine Reports Animal Science Department
January 2003
2003 Nebraska Swine Report 2003 Nebraska Swine Report
Duane Reese University of Nebraska-Lincoln, [email protected]
Follow this and additional works at: https://digitalcommons.unl.edu/coopext_swine
Part of the Animal Sciences Commons
Reese, Duane, "2003 Nebraska Swine Report" (2003). Nebraska Swine Reports. 50. https://digitalcommons.unl.edu/coopext_swine/50
This Article is brought to you for free and open access by the Animal Science Department at DigitalCommons@University of Nebraska - Lincoln. It has been accepted for inclusion in Nebraska Swine Reports by an authorized administrator of DigitalCommons@University of Nebraska - Lincoln.
����������� �������������������������������������
�����������������
� ���������
� ������
� ������
� �����
�������������� ��� ������ ��������������������������
� ��������������������� ������������������ ������������������ � ���
�������������� ����������� ���������������������������� ���� ������������� �!���������� �������������"#$#�%�� �&�������'���(���#��()����#�%�������%� �� ���%������������� ���������������
"�����������*�) �� ���������������'���(���� ���* �� (�+�������#
����������� ���������������������������������������������������������������������������������������������������� ��������������������������������� �����������!����������"
���������������� �������������������������������������������� ��������������������������������������������������
!������"###$�� �$� �$���%����%�#� �%������$��&
����

Table of Contents Nutrition
Gro\zth Performance. Carcass Characteristics. and Econoinics of Pigs Fed Diets Containing a Coin Genn-Corn Bran Product ................ 3 Vitanin B12 Requirement for Weanling Pigs ..................... ... .............................................................................................................. 9 . . . Vitainin B12 and Mecadox$ Suppleinentation in Weanling Pig Diets ........................ ... ...................................................................... 12
................................................................................................................. Do Crou ded Pigs Respond to Pa) lean$? ........................ ... 15 comparison of Suine Perfonnance When Fed Diets Containing Corn Root Woiln Protected Corn. Parental Line Corn.
or Conventional Corn Gro\zn during 2000 in Nebraska ..................... ... ....................................................................................... 19 ............................. Energ) and Nitrogen Utilization of Roundup Read) $ Corn (El ent nk603) and Non-Transgenic Coin in Young Pigs 23
Effect of a Lo\\ Ph~tate. Nutrient Dense Coin on Pig Perfonnance ................... .. ............................................................. ... ........... 26 ................................................................ Omega-3 FattJ Acids and S\\ ine Reproduction - A Re\ ie\z ................... ..... .... .............. 30
Effects of Glutainine on Grouth Perfonnance and Intestinal De\ elopinent of Iimnune Challenged U'eanling Pigs Fed Cheinicall~ Defined Diets ..................... ... ...................................................................................................................................................... 31
Influence of CQ stalline or Protein-Bound L) sine on Gro\zth Performance. Bod) Protein Deposition and LJ sine Utilization in Nursen Pigs ........................ ... ................................................................................................................................................. 37 . L
Influence of CQ stalline or Protein-Bound L) sine on L) sine Utilization for Grouth in Pigs .................... .... .......................... ............ 12
Housing Progress in Estimating Setback Distances for Livestock Facilities ......................................................................................... 47
................................. The Economic Potential of Methane Recovery: Pro-jected Impacts of Various Public-Policy Scenarios 52
Industry Issues Agricultural Management Advisory Groups for Pork Producers ........................................................................................... 56
Meats Case Ready and Enhanced Pork- How do Ingredients Make them Work? ......................................................................... 57 Fresh vs. Frozen Bellies for Bacon ........................................................................................................................................ 59
........................................................... Fatty Acid Composition of Fresh Pork Bellies - Implications to Bacon Production? 6 1 ....................................... Effect of Post-Cooking Holding Time on Consumer Taste Panel Ratings of Enhanced Pork Loins 63
Appendix Explanation of the Statistics Used in this Report ................................................................................................................... 66
Issued Januar~ 2003. 2.250
Nebraska Swine Report Acknowledgments for 2003
Alphaima, Inc., Ft. Lee, N J BASF Corp., Mt. Olive, N J
Cooperative Extension Division, University of Neb., Lincoln, N E Danbred NA, Inc., Dorchester, N E
Elanco Animal Health, Indianapolis, IN Fort Recovery Equipment, Inc., Fort Recovery, O H
Guilini-Ladenburg, Simi Valley, C A Heartland Pork Enterprises, Inc., Alden, IA
Hormel Foods, LLC, Austin, MN TBP Inc.. Madison. NE
Millard Processing Service. Millard. N E Monsanto Company. St. Louis, M O
National Pork Board. Des Moines. IA Nebraska Agricultural Research Division, University ofNeb. . Lincoln. N E
Nebraska Corn Board Association. Lincoln, N E Nebraska Pork Producers Association. Lincoln, N E
Nebraska SPF Accrediting Agency. Lincoln. N E Red Arrow. Inc., Manitowoc. WI
Roche Vitamins. Inc.. Parsippany, NJ SiouxPreme Packing Co.. Sioux Center, 1A
U.S. Meat Animal Research Center, Clay Center, N E Waldo Farms, Inc.. DeWitt. N E
2003 Yebraska SIL lrze Report - Page 2
Cover Photo:
Photo from U S D A Online Photography Center. Photo by K e n Haminond
I C ~ U S conzpiled by Dzlane Reese, Extension S~cline Speciulist, Departnient ofAnir7zal Science.
Editor: Marcia Oetjen Typesetting & Design: Anne Moore

Growth Performance, Carcass Characteristics, and Economics of Pigs Fed Diets Containing a
Corn Germ-Corn Bran Product Steven J. Kitt
Phillip S. Miller Duane E. Reese
Robert L. Fischer'
Summary and Implications
Dzle to an ~ncreased nzlnzber o j corn tnrllrng plants rn Nebraska, ~t rr necesrarj to evaluate the use of corn bj-prodzlctr rn s ~ t l n e d ~ e t s In there experrtnents, the ~ncluslon of a corn gem-corn bran product lnto S I I lne drets n u s e~.aluated for rts efects on gron th perfortnunce, carcarr conz- posrtlon, carcass qualrtj traltr, and econotnrc value In Experltnent I, rndlvldz~ullj houredgro~t rng-finrrhlng plgs n ere fed I ) corn-roj bean, 2) corn-roj bean nzeal-4% bleach- able ta l lon , or 3 ) corn-rojbean nzeal-8% corn gertn-bran drets Dzlr- rng the 93-daj trlul there 11 ere no dfferences for aIqerage darlj g u m (A DG, P > 0 10) or aIqerage dadj feed rntake (ADFI, P > 0 10) atnong treat- nzentr The nz~tnerrcal rtnprovenzentr of 4 DG and ADFI n hen plgs n ere fed the dret contarnrng tallo~t reszllted rn a 9% rtnprovenzent ~n feedefficrencj (ADFI/ADG, P < 0 001) Fat-0-Meter data suggested that prgr fed the dret contalnlng tallon ~t ere leaner than plgs fed the corn-rojbean nzeal dret (P < 0 07) Treatnzents znzposed ztpon grozlp-hozlaed grolvzng-fznzshzng prgs rn Euperznzent 2 Icere 1) corn- soybean nieal, 2) corn-sojlbeun nzeul- 4% bleuchable tallo~c, 3) corn-aoybeun nieal-8% corn gerni-bran, and4) corn- soybean nzeal-16% corn gernz-brun Dzirzng the 102-day trzal there were no drfferencea anzong treutnzenta for ADG (P > 0 10) Prgs fedthe dret contarnzng tullo~c had u 5 3% redzlctzon rn ADFI (P < 0 007) und 8 7% rnzprovenient zn
cotnparedto all other treattnentr Ultra- rozlnd scanr revealed no dfferencer (P > 0 10) In longrrsrnzz~r nzzlrcle area anzong treattnents and an rncreared (P < 0 02) backfat depth
for plgs fed the 4% tallo~t dret cotn- pared to other treattnents Calculated (NPPC, 1991) carcarr lean content of prgr fed the 4% tallon dlet tar
lesr than (P < 0 06) the other treat- nzentr Drerrrngpercentage~t asgreater (P < 0 05) forplgs f edd~e t r contarnrng tallo~t cotnpared to prgs fed dletr contalnlng corn gernz-bran In gen- eral, longrrrrnzus tnurcle qz lu lr~ ~t ar rnzpro~qed for prgr fed a control (corn- roj bean meal) dlet verszlr other treat- nzentr, h o ~ i eIqer, all treatment tneanr ~t ere 11 rthrn acceptable ranger for nzzmcle qualltj tralts Depending on the corn prlce (11 e ured valuer beht een S 1 75 and33 00/bzQ andnzarket prlce for nzarket hogs ( ~ t e used ~.aluer bet~t een S1O and $50/cn t llve), the ~qalue of corn gernz-corn bran In gron rng-frnrshrng dretr ranger bet~t een SO and $104 per ton
initial costs of purchasing and main- taining fat tanks can be cost prohibi- tive for some producers. Mixing supplemental fat in swine diets can be difficult with some feed processing and mixing equipment. Additionally, inain- taining fat quality can be a challenge if the swine operation does not use the fat in a timely manner. An alternative to liquid fat is dry fat. However, dry fat is rarely cost effective compared to other energy sources (e.g., corn, liquid fat, etc.) in swine diets. Because liquid fat is often physically difficult to handle for small to medium size pork produc- ers and dry fat is often cost prohibitive, it was hypothesized that corn gerin may be an economical alternative to other fat sources.
The goal of this research was to evaluate the feeding value of a corn germ-corn bran product (Table 1 ) rela- tive to corn-soybean ineal or corn- soybean meal-tallow diets.
Procedures
Background and Introduction A total of 36 barrows were used in
Corn germ is a by-product of the corn wet milling industry. Typically, oil fi-om corn germ is extracted. How- ever, when the price of competing vegetable oils is low, the price for corn oil and, therefore, corngerm decreases. The gerin contains the predominant portion of the oil in the lternel. The bran (or hull) is the outer coating ofthe corn lternel and is primarily composed of nondigestible carbohydrate. Some corn milling plants do not separate the bran from the gerin, thus, producing a by-product that is a high fat-high fiber product. Although liquid fat (animal sources) can (depending on the corn price) be economically feasible, there
a 93-day growth study. Pigs averaged 52 and 245 Ib at the initiation and termination ofthe experiment. respec- tively. Pigs were blocked by location of the room (n=3) and randomly assigned to one of three dietary treat- ments: 1) corn-soybean ineal (Con- trol); 2 ) corn-soybean meal-4% bleachable tallow (Tallow); and 3) corn- soybeanmeal-8% corn germ-corn bran (8% Germ). Pigs and feeders were weighed initially and at each feeding phase change thereafter. Four feeding phases were used and all treatments were changed at a constant time point (Phase 1, d 0 to 17; Phase 2, d 18 to 40; Phase 3, d 41 to 67; Phase 4, d 68 to
feedeffrciencj~ (ADFIIADG: P < 0 005) are some potential drawbacks. The (Cont~nued on next page)
2003 Yel~raska SIL lrze Report - Page 3
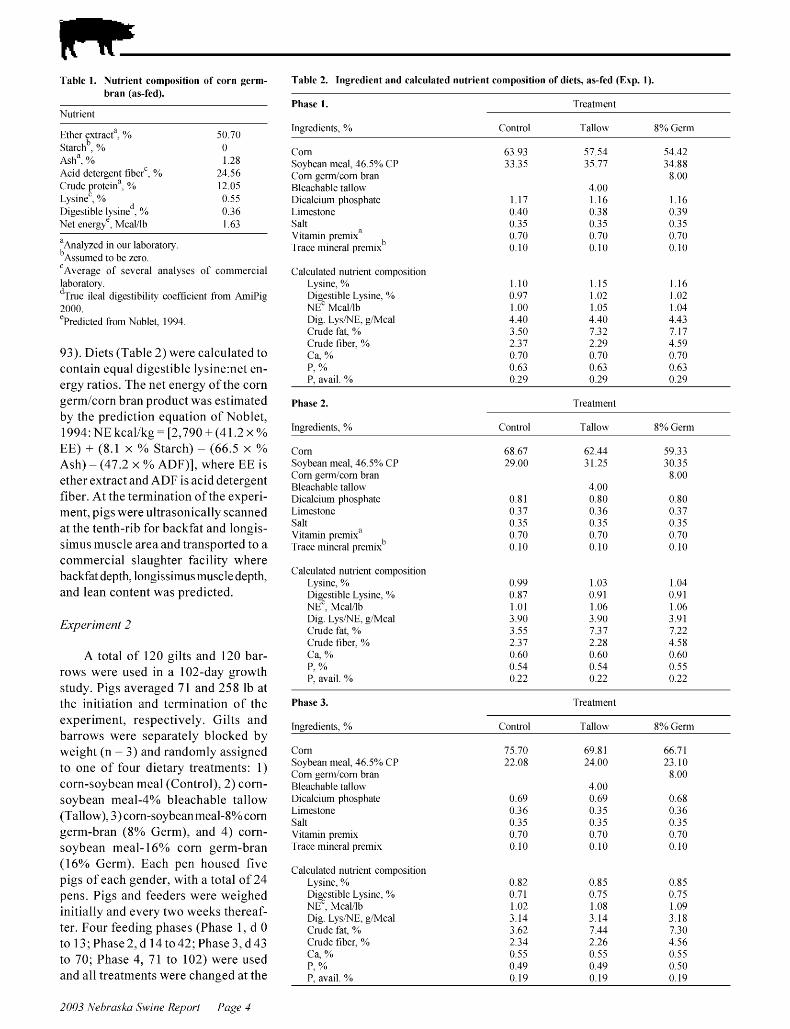
Table 1. Sntrient composition of corn germ- bran (as-fed).
Table 2. Ingredient and calculated ~lutrie~lt composition of diets, as-fed (Erp. I).
Phase 1. Treatment Nutrient
Inpred~ents. % Control Tallom 8% Germ Ether extract! % %archb % ASII! % A c ~ d detergent fiberL % Crude protein" L) slnec. % D~gestlble l)slned % Net energ)'. Mcalllb
Corn %)bean meal 16 5% CP Corn ger~ll/corn bran Bleachable tallo\\ D~calc~um phosphate L~mestone Salt V~taliiln premix" Trace ~ l l ~ ~ l e r a l prelnirb %nal)zed In our laborator)
b ~ s s u m e d to be zero 'A\erage of seleral anallses of commerc~al laborator) d~rLle Ileal d ~ g e s t ~ b ~ l ~ t ) coefficient from AmlP~g 2000 'pred~cted from Noblet. 1991
Calculated nutrient compositio~l L) sine. % Digestible Lysine, % NE' Mcalllb Dig LysNE. gMcal Crude fat. % C n ~ d e fiber. % Ca. % P. % P. mail. %
93). Diets (Table 2) were calculated to contain equal digestible 1ysine:net en- ergy ratios. The net energy of the corn gerinlcorn bran product was estimated by the prediction equation of Noblet, 1994: NE kcallkg = [2,790 + (4 1.2 x % EE) + (8.1 x % Starch) - (66.5 x % Ash) - (47.2 x % ADF)], where EE is ether extract and ADF is acid detergent fiber. At the termination ofthe experi- ment. pigs were ultrasonically scanned at the tenth-rib for backfat and longis- simus muscle area and transported to a coininercial slaughter facility where backfat depth, longissimusmuscledepth, and lean content was predicted.
Phase 2. Treatment
Inqred~ents. % Control Tallo\\ 8% Gem1
Con1 So! bean meal 16 5% CP Corn gernlconi bran Bleachable tallon Dlcalclum phosphate Linlestone 5alt V1tam111 prem~\" Trace mlneral premlrh
Calculated nutrient composition Lysine, % Digestible L)sine. % NEC, Mcalllb Dig. L)s/NE. g/Mcal C n ~ d e fat. % Crude fiber. % Ca, % P. % P. avail %
A total of 120 gilts and 120 bar- rows were used in a 102-day growth study. Pigs averaged 71 and 258 Ib at the initiation and termination of the experiment, respectively. Gilts and barrows were separately blocked by weight (n = 3) and randomly assigned to one of four dietary treatments: 1) corn-soybean meal (Control), 2) corn- soybean meal-4% bleachable tallow (Tallow), 3) coin-soybeanmeal-8% corn germ-bran (8% Germ), and 4) corn- soybean meal-16% corn germ-bran (16% Germ). Each pen housed five pigs of each gender, with a total of 24 pens. Pigs and feeders were weighed initially and every two weeks thereaf- ter. Four feeding phases (Phase 1, d 0 to 13; Phase 2, d 14 to 42; Phase 3, d43 to 70; Phase 4, 71 to 102) were used and all treatments were changed at the
Phase 3. Treatment
Ineredients. % Control Tallom 8% Germ
Corn %)bean meal 16 5% CP Corn ger~iilcorn bran Bleachable tallon Dlcalclum phosphate Linlestone 5alt V1tam111 premix
Trace mlneral premlx
Calculated nutrient composition Lysine. % 0.82 0.85 0.85 Digestible L)sine. % 0.71 0.75 0.75 NEC, Mcalllb 1.02 108 1 09 Dig. L)s/NE. g/Mcal 3.11 3.11 3.18 C n ~ d e fat. % 3.62 7 11 7 30 Crude fiber. % 2.31 2.26 1.56 Ca, % 0 55 0.55 0.55 P. % 0.19 0.19 0.50 P. avail % 0 19 0 19 0.19
2003 Yel~raska SIL lrze Report - Page I
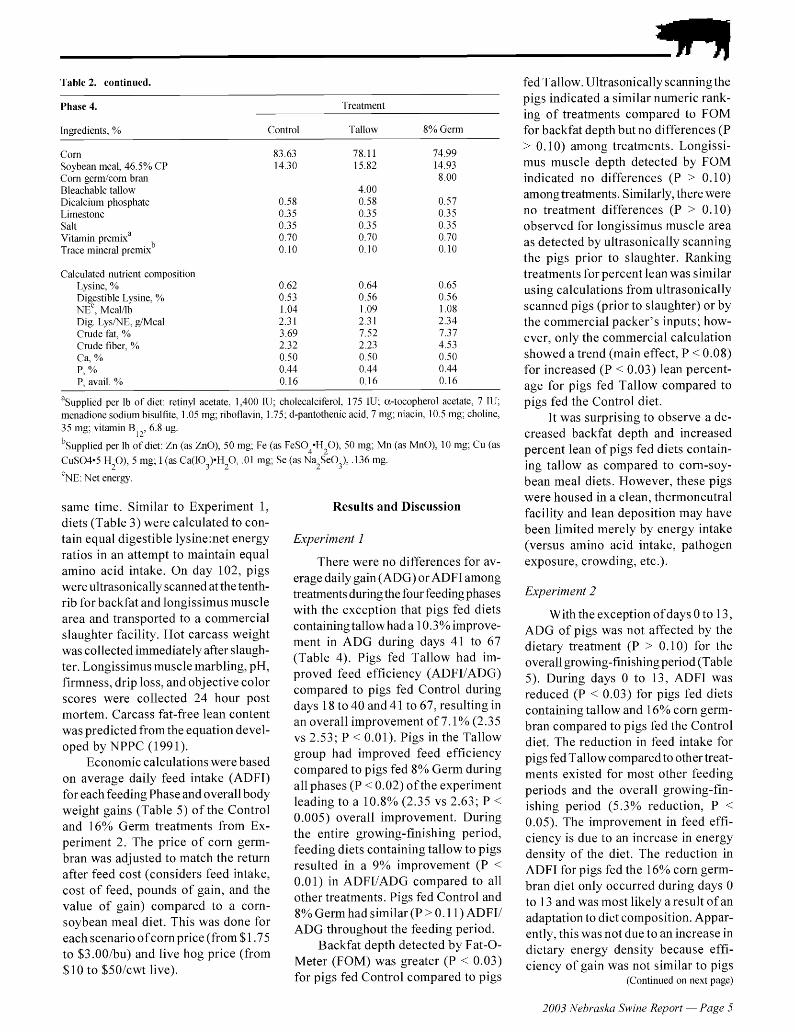
Table 2. cootioued.
Phase 1. Treatment
Ingred~ents. % Control Tallom 8% Germ
Corn %)bean meal 16 5% CP Corn grr~ldcorn bran Bleachable tallo\\ D~calc~um phosphate L~mestone Salt V~ta~iiln premlw" Trace 1n11lera1 prelllirb
Calculated nutrient compositio~l L) sine. % Digestible Lysine, % NE'. Mcalllb Dig LysNE. gMcal Crude fat. % C n ~ d e fiber. % Ca. % P. "0
P. a\ail. %
%upplied per Ib of diet: retinll acetate. 1.100 11J. cliolecalciferol. 175 11J: a-tocopherol acetate. 7 11J. menadione s o d i ~ ~ m bisulfite. 1.05 mg: ribofla! in. 1.75. d-pantothenic acid. 7 mg: niacin. 10.5 mg. clioline. 35 mg. \ita~iiin B . 6.8 ug.
12
b~upplied per lb of diet. Zn (as ZnO), 50 mg: Fe (as FeS04.H20), 50 mg: Mn (as MnO). 10 mg: Cu (as CuSO4.5 H,O). 5 mg: I (as Ca(IOq).H,O. .O1 mg: Se (as Na-SeO-), 136 mg.
3 _ L 3
'NE. Net energ)
same time. Similar to Experiment 1 , Results and Discussion diets (Table 3) were calculated to con- tain equal digestible 1ysine:net energy Experinzent 1 ratios in an attempt to maintain equal amino acid intake. On day 102. pigs were ultrasonically scanned at the tenth- rib for backfat and longissimus muscle area and transported to a commercial slaughter facility. Hot carcass weight was collected immediately after slaugh- ter. Longissiinus muscle marbling, pH, firmness, drip loss. and objective color scores were collected 24 hour post mortem. Carcass fat-free lean content was predicted from the equation devel- oped by NPPC (1 991).
Economic calculations were based on average daily feed intake (ADFI) for each feeding Phase and overall body weight gains (Table 5) of the Control and 16% Germ treatments from Ex- periment 2. The price of corn gerin- bran was adjusted to match the return after feed cost (considers feed intake, cost of feed, pounds of gain, and the value of gain) compared to a corn- soybean meal diet. This was done for each scenario ofcorn price (from $1.75 to $3.00/bu) and live hog price (ffom $10 to $50/cwt live).
There were no differences for av- erage daily gain (ADG) or ADFI ainong treatments during the four feeding phases with the exception that pigs fed diets containingtallow had a 10.3% improve- ment in ADG during days 41 to 67 (Table 4). Pigs fed Tallow had irn- proved feed efficiency (ADFIIADG) compared to pigs fed Control during days 18 to 40 and 4 1 to 67, resulting in an overall improvement of 7.1 % (2.35 vs 2.53: P < 0.01). Pigs in the Tallow group had improved feed efficiency "
compared to pigs fed 8% Germ during all phases (P < 0.02) of the experiment leading to a 10.8% (2.35 vs 2.63; P < 0.005) overall improvement. During the entire growing-finishing period, feeding diets containing tallow to pigs resulted in a 9% improvement (P < 0.01) in ADFIIADG compared to all other treatments. Pigs fed Control and 8% Germ had similar (P > 0.11) ADFII ADG throughout the feeding period.
Bacltfat depth detected by Fat-O- Meter (FOM) was greater (P < 0.03) for pigs fed Control compared to pigs
fed Tallow. Ultrasonically scanningthe pigs indicated a similar numeric rank- ing of treatments compared to FOM for backfat depth but no differences (P > 0.10) among treatments. Longissi- mus muscle depth detected by FOM indicated no differences (P > 0.10) ainong treatments. Similarly, there were no treatment differences (P > 0.10) observed for longissiinus muscle area as detected by ultrasonically scanning the pigs prior to slaughter. Ranking treatments for percent lean was similar using calculations from ultrasonically scanned pigs (prior to slaughter) or by the commercial packer's inputs: how- ever. only the commercial calculation showed a trend (main effect. P < 0.08) for increased (P < 0.03) lean percent- age for pigs fed Tallow compared to pigs fed the Control diet.
It was surprising to observe a de- creased backfat depth and increased percent lean of pigs fed diets contain- ing tallow as compared to corn-soy- bean meal diets. However, these pigs were housed in a clean, thermoneutral facility and lean deposition may have been limited merely by energy intake (versus amino acid intake, pathogen exposure, crowding. etc.).
Expermlent 2
With the exception of days 0 to 13, ADG of pigs was not affected by the dietary treatment (P > 0.10) for the overall growing-finishing period (Table 5). During days 0 to 13, ADFI was reduced (P < 0.03) for pigs fed diets containing tallow and 16% corn gerin- bran compared to pigs fed the Control diet. The reduction in feed intake for pigs fedTallow compared to other treat- ments existed for most other feeding periods and the overall growing-fin- ishing period (5.3% reduction, P < 0.05). The improvement in feed effi- ciency is due to an increase in energy density of the diet. The reduction in ADFI for pigs fed the 16% corn germ- bran diet only occurred during days 0 to 13 and was most likely aresult ofan adaptation to diet composition. Appar- ently, this was not due to an increase in dietary energy density because effi- ciency of gain was not similar to pigs
(Cont~nued on next page)
2003 Yehraska SIL lrze Report - Page .5

fed Tallow during the first 13 days and this effect was not observed during the remainder of the trial. Feed intake of pigs fed diets containing corn germ- bran was similar (P > 0.10) to pigs fed Control during the entire growing-fin- ishing period. Feed efficiency was im- proved (P < 0.02) for pigs fed the diet containing tallow by 8.7 % compared to the other treatinents during the en- tire growing-finishingperiod. Through- out the experimental period. no differences (P > 0.10) in feed effi- ciency were observed among pigs fed diets containing corn germ-bran (3.19 and 3.18: 8% and 16% corn germ- bran, respectively) and corn-soybean meal (3.09) diets.
Backfat depth was approximately one-tenth inch greater (P < 0.05) for pigs fed the diet containing tallow com- pared to pigs fed other diets with no differences (P > 0.10) among treat- ments for longissiinus inuscle area. Increased tenth-rib backfat of pigs fed the diet containing tallow contributed to nearly one percentage unit less car- cass percent lean compared (P < 0.07) to other treatments. Pigs fed corn- soybean meal diets had greater (P < 0.02) marbling than pigs fed diets containing tallow and 16% corn germ- bran, with pigs fed diets containing 8% corn germ-bran being intermedi- ate. There was a trend for increased (main effect, P < 0.08) post mortein (24 hour) longissimus inuscle pH for pigs that had consumed Control com- pared to pigs fed Tallow and 8% Germ. Although drip loss was unaffected (P > 0.10) by dietary treatinent. there was a trend (P < 0.09) for improved subjective muscle firmness score for pigs fed corn-soybean meal diets as compared to other treatinents. Longis- simus muscle color score was not affected by dietary treatinent, with the exception that Minolta a* was greater (P < 0.01) for pigs that had consumed diets containing tallow compared to other treatinents.
The treatinent means of overall body weight gain and ADFI were used to calculate the economic feeding value of the corn germ-bran product (Table 6). This analysis suggests that when corn price is $2.75/bu and live hog
Table 3. Ingredient and calculated nutrient composition of diets, as-fed (Exp. 2).
Phase 1. Treatment
Innred~ents. % Control Tallou 8% Germ 16% Gem1
Corn So! bean meal 1 6 5% CP Corn germlcorn bran Bleachable tallon D~calc~um phosphate Linlestone Salt Vitamin premix" Trace ~lli~leral prelnixb
Calculated nutrient composition L) sine. % Digestible Llsine. % NE'. Mcalllb Dig. L)s/NE. g/Mcal Crude fat. % NDF. % Ca. % P. % P. mail. %
Phase 2. Treatment
Ingred~ents % Control Tallou 8% Germ 16% Gem1
Corn Soybean meal. 16.5% CP Corn germlcorn bran Bleachable tallow Dicalcium phosphate Linlestone Salt Vitamin premix" Trace ~lli~leral prelnixb
Calculated nutrient composition L) sine. % Digestible L)sine. % NE'. Mcalllb Dig. L)s/NE. g/Mcal Crude fat. % NDF. % Ca. % P. % P. mail. %
Phase 3. Treatment
Inqred~ents % Conrol Tallou 8% Germ 16% Germ
Corn So! bean meal 1 6 5% CP Corn germlcorn bran Bleachable tallon D~calc~um phosphate L~mestone 5alt V ~ t a ~ i i ~ n premlw d
Trace m~neral p rem~rr
Calculated nutrient composltlon L? slne, % D~gestible L? slne, % NE ', Mcalllb Dig L! s N E gMcal C n ~ d e fat, % NDF % Ca, % P % P ala11 %
0 85 0 73 I l l 2 97
11 10 11 17 0 60 0 56 0 25
2003 Yel~raska SIL lrze Report - Page 6
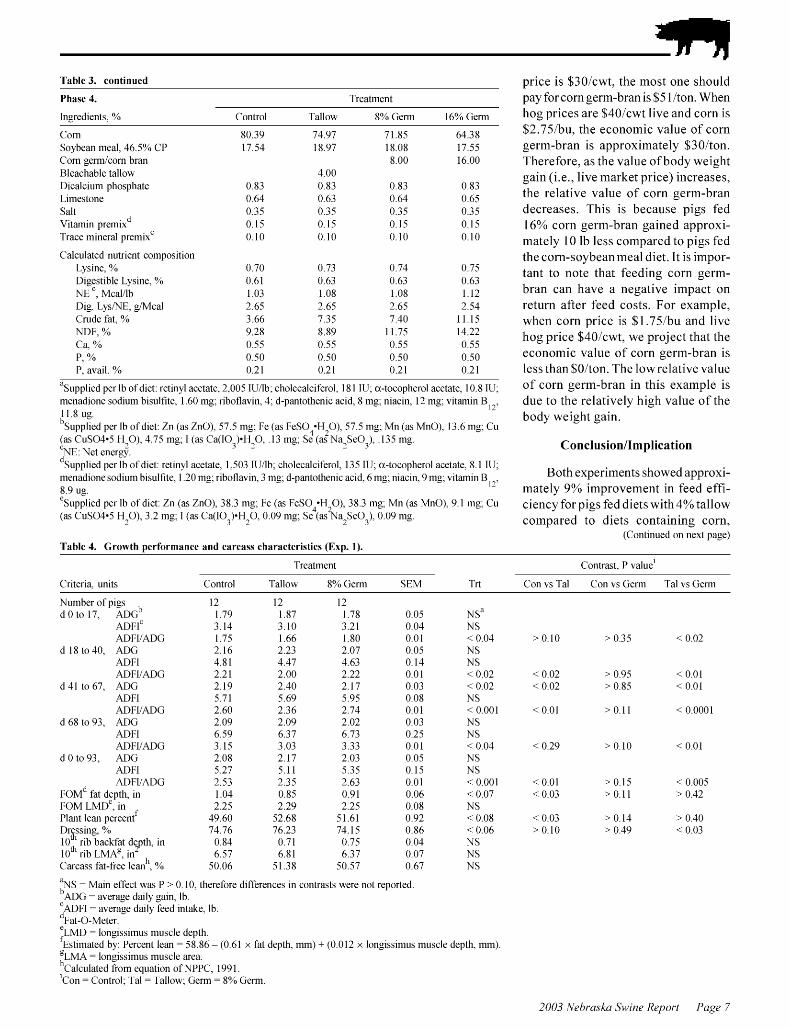
Table 3. continued
Phase 4. Treatment
Ingred~ents % Control Tallon 8% Germ 16% Germ
Con1 80 39 71 97 71 85 61 38 %)bean meal 1 6 5% CP 17 51 18 97 18 08 17 55 Corn genii/coni bran 8 00 16 00 Blea~hable tallo\\ 1 0 0 Dl~alclurn phosphate 0 83 0 83 0 83 0 83 L~mestone 0 6 1 0 63 0 6 1 0 65 5alt 0 35 0 35 0 35 0 35 V ~ t a ~ i i ~ n prem~wd 0 15 0 15 0 15 0 15 Trace m~neral prem~r' 0 10 0 10 0 10 0 10
Calculated nutnent ~omposltlon L\s~ne % 0 70 0 73 0 71 0 75 D~gestlble L\slne % 0 61 0 63 0 63 0 63 NE Mcalllb 1 03 1 08 1 08 1 12 Dig L)s/NE g/Mcal 2 65 2 65 2 65 2 51 Crude fat % 3 66 7 35 7 1 0 1 1 15 NDF % 9 28 8 89 1 1 75 1 1 22 Ca % 0 55 0 55 0 55 0 55 P % 0 50 0 50 0 50 0 50 P a\ all % 0 21 0 21 0 21 0 21
per lb of diet. retiny1 acetate, 2.005 IUIlb: cholecalciferol, 181 IU: a-tocopherol acetate, 10.8 IU: menadlone sodiu~n bisulfite, 1 60 mg: riboflavin. 1: d-pantothenic acid. 8 mg: niacin, 12 mg: vitamin B
12' 11 8 ug. b~upplied per lb of diet: Zn (as Zn0). 57.5 ~ n g : Fe (as FeS04.H-0). 57 5 mg: Mn (as MnO). 13 6 mg: Cu (as CuSO1.5 H-0). 1.75 mg: I (as Ca(I0-).H-0, .13 mg: Se ( a c ~ a - ~ e o - ) . ,135 111g
1 L L 1
'NE. Net energ?. 'supplied per lb of diet. retinyl acetate, 1.503 IUIlb: cholecalciferol, 135 IU: a-tocopherol acetate. 8.1 IU: menadlone sodiu~n bisulfite, 1.20 mg: riboflavin, 3 mg: d-pantothenic acid, 6 mg: niacin. 9 mg: vitanlin B
12' 8.9 ug. uppl plied per lb of diet: Zn (as Zn0). 38.3 mg: Fe (as FeS04.H-0), 38.3 mg: Mn (as MnO). 9.1 mg: Cu (as CuSO1.5 H-0), 3 2 mg: I (as Ca(IOq).H,O, 0 09 mg: Se (as%a-~eo-). 0 09 111g
3 - L 1
Table 4. Growth performance and carcass characteristics (Exp. 1).
price is $30/cwt. the most one should pay for corn germ-bran is $5 I /ton. When hog prices are $40/cwt live and corn is $2.75/bu. the economic value of corn germ-bran is approximately $30/ton. - Therefore. as the value of body weight gain (i.e.. live market price) increases, - the relative value of corn germ-bran decreases. This is because pigs fed 16% corn germ-bran gained approxi- mately 10 Ib less compared to pigs fed the corn-soybean meal diet. It is iinpor- tant to note that feeding corn germ- bran can have a negative impact on return after feed costs. For example, when corn price is $1.75/bu and live hog price $40/cwt, we pro-ject that the economic value of corn germ-bran is less than $O/ton. The lowrelative value of corn germ-bran in this example is due to the relatively high value of the body weight gain.
Both experiments showed approxi- mately 9% improvement in feed effi- ciency for pigs fed diets with 4% tallow compared to diets containing corn,
(Cont~nued on next page)
Treat~lle~lt Contrast, P T alue'
Cr~ter~a. ~lnlts Control Tallo\\ 8% Germ 5EM Trt Con \ s Tal Con 1s Gem1 Tal \ s Germ
Number of p ~ g s d O t o 1 7 A D G ~
A D F ~ ADFIIADG
d l 8 t o l O ADG ADFI ADFIIADG
d 1 l to67 ADG ADFI ADFIIADG
d 68 to 93 ADG ADFI ADFIIADG
d 0 to 93 ADG ADFI ADFIIADG
F O M ~ fat depth in FOM LMD' In Plant lean percenti Dresslng % loth rib backfat d ~ t h 111
1 (It1' r ~ b LMA' In- Carcass fat-free lea? %
"NS = Main effect \\as P > 0.10. therefore differences in contrasts \\ere not reported. b A D ~ = average daily gain. lb 'ADFI = merage dail) feed intake. Ib. at-0-~eter 'LMD = longissirnus rn~lscle depth. f Estimated by: Percent lean = 58 86 - (0.61 x fat depth, mm) + (0 012 x longissi~llus muscle depth. mm)
'LMA = longissim~~s muscle area. I1 Calculated fro111 equation of NPPC, 1991
'Con = Control: Tal = Tallo\\: Gem1 = 8% Gerni.
2003 Yel~raska SIL lrze Report - Page 7
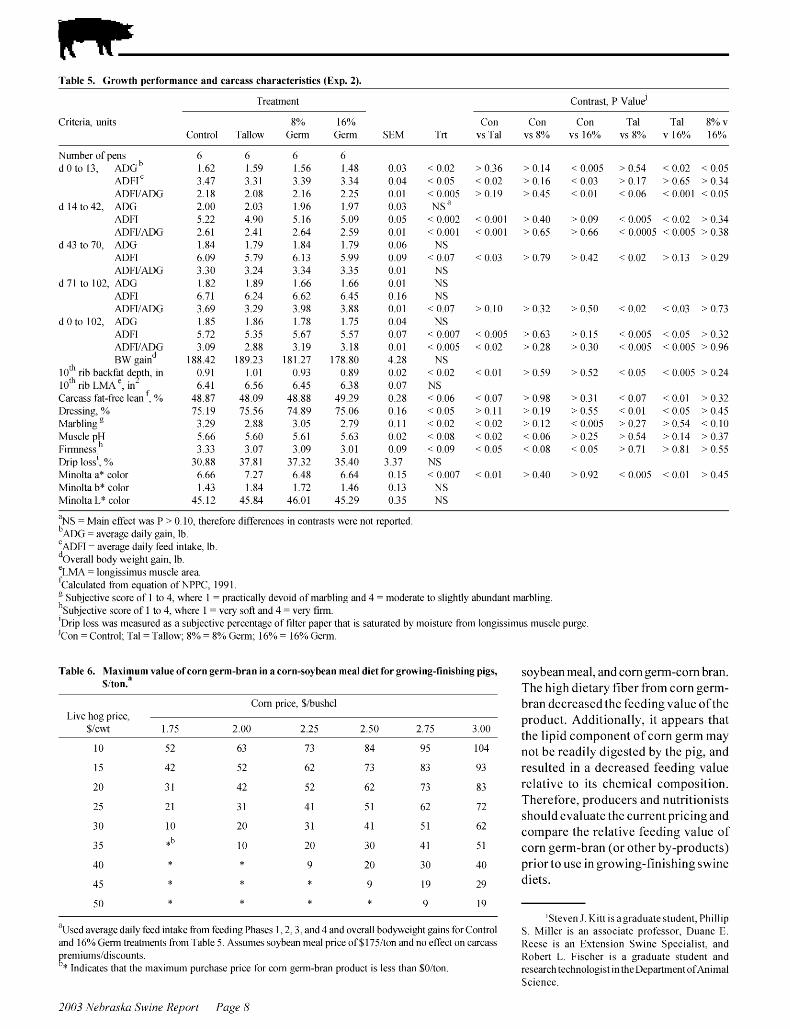
Table 5. Growth performance and carcass characteristics (Exp. 2).
Treatment Contrast. P value'
Criteria. units 8% 16% Con Con Con Tal Tal 8% \ Control Tallo\\ Germ Germ SEM Trt \ s Tal \ s 8% \ s 16% 8% 16% 16%
Number of pens 6 6 6 6 d O t 0 1 3 . ADG" 1.62 1.59 1.56 1.18 0.03 <0.02 >0,36 >0 ,11 <0,005 > 0 , j J <0,02 < o , o j
ADFI" 3.17 3.31 3.39 3.31 0.01 < 0.05 < 0.02 > 0.16 < 0.03 > 0.17 > 0.65 > 0.31 ADFIIADG 2.18 2.08 2.16 2.25 0.01 < 0.005 > 0.19 > 0.45 < 0.01 < 0.06 < 0,001 < 0.05
d l l t o 1 2 . ADG 2.00 2.03 1.96 1.97 0.03 N S " ADFl 5.22 1.90 5.16 5.09 0.05 < 0.002 < 0,001 > 0.10 > 0.09 < 0,005 < 0.02 > 0.34 ADFIIADG 2.61 2.11 2.61 2.59 0.01 < 0,001 < 0.001 > 0.65 > 0.66 < 0,0005 < 0,oOj > 0.38
d 1 3 to 70. ADG 1.81 1.79 1.81 1.79 0.06 NS ADFl 6.09 5.79 6.13 5.99 0.09 < 0.07 < 0.03 > 0.79 > 0.12 < 0.02 > 0.13 > 0.29 ADFIIADG 3.30 3.21 3.31 3.35 0.01 NS
d 71 to 102. ADG 1.82 1.89 1.66 1.66 0.01 NS ADFl 6.71 6.21 6.62 6.15 0.16 NS ADFIIADG 3.69 3.29 3.98 3.88 0.01 < 0.07 > 0.10 > 0.32 > 0.50 < 0.02 < 0.03 > 0.73
dOto102. ADG 1.85 1.86 1.78 1.75 0.01 NS ADFl 5.72 5.35 5.67 5.57 0.07 < 0.007 < 0.005 > 0.63 > 0.15 < 0,005 < 0.05 > 0.32 ADFIIADG 3.09 2.88 3.19 3.18 0.01 < 0.005 < 0.02 > 0.28 > 0.30 < 0,005 < 0,ooj > 0.96 BU' gaind 188.12 189.23 181.27 178.80 1.28 NS
10''' rib backfat depth. in 0.91 1.01 0.93 0.89 0.02 < 0.02 < 0.01 > 0.59 > 0.52 < 0.05 < 0.00j > 0.21 10"~ rib LMA '. in' 6.11 6.56 6.15 6.38 0.07 NS Carcass fat-free lean '. % 18.87 18.09 18.88 19.29 0.28 < 0.06 < 0.07 > 0.98 > 0.31 < 0.07 < 0.01 > 0.32 Dressing. % 75.19 75.56 71.89 75.06 0.16 <0.05 >0.11 >0.19 >O.j5 <0,01 < o , o j > o , l j Marbling" 3.29 2.88 3.05 2.79 0.11 <0.02 <0.02 >0.12 <0.005 >0 ,27 >0,54 <0,10 Muscle pH 5.66 5.60 5.61 5.63 0.02 < 0.08 < 0.02 < 0.06 > 0.25 > 0.54 > 0.14 > 0.37 ~ i rmness " 3.33 3.07 3.09 3.01 0.09 < 0.09 < 0.05 < 0.08 < 0.05 > 0.71 > 0.81 > 0.55 Drip loss'. % 30.88 37.81 37.32 35.10 3.37 NS Minolta a* color 6.66 7.27 6.18 6.61 0.15 < 0.007 < 0.01 > 0.10 > 0.92 < 0,005 < 0.01 > 0.45 Minolta b* color 1.13 1.81 1.72 1.16 0.13 NS Minolta L* color 15.12 15.81 16.01 15.29 0.35 NS
' h S = Main effect \\as P > 0.10. therefore differences in contrasts \\ere not reported. b ~ ~ G = alerage dail) gain. Ib. 'ADFI = merage dail) feed intake. Ib.
erall bod) \\eight gain. Ib. 'LMA = longissirnus muscle area. f Calc~llated from equation of NPPC. 1991 ' S~lbjectile score of 1 to 1. \\here 1 = practicall) deloid of marbling and 1 = moderate to sliglitl) alwndant marbling. I1 S~lbjectibe score of 1 to 1. \\liere 1 = \ e n soft and 1 = \er) tinii.
rip loss \\as measured as a sul?jecti\e percentage of fi lter paper that is sat~lrated b) moist~lre from longissim~~s muscle purge 'Con = Control. Tal = Tallo\\: 8% = 8% Genii. 16% = 16% Gerni.
Table 6 . hlaximum \slue of corn germ-bran in a corn-so? bean meal diet for growing-finishing pigs, ton.'
L n e hog prlce. $/c\\t 1 75 2 00 2 25 2 50 2 75 3 00
soybean meal. and corn germ-corn bran. The high dietary fiber from corn germ- bran decreased the feeding value ofthe product. Additionally, it appears that the lipid component of corn germ may not be readily digested by the pig. and resulted in a decreased feeding value relative to its chemical composition. Therefore, producers and nutritionists should evaluate the current pricing and compare the relative feeding value of corn germ-bran (or other by-products) prior to use in growing-finishing swine diets.
ISteven J Kitt is agraduate student, Phillip '?Used average daily feed intake fro111 feeding Phases 1,2,3, and 1 and overall body\-eight gains for Control S Miller is an associate professor. D u a ~ l e E. and 16% Germ treatments from Table 5. Assumes soybean nleal price of $175/ton and no effect on carcass Reese is an Es t ens io~ l S \ ~ i n e Specialist, and remiumsIdiscounts. Robert L Fischer is a graduate student and
'Vndicates that the ~oas imum purcl~ase price for corn gem-bran product is less than $O/too. research technologist in the Department ofAnimal Science
2003 Yel~raska SIL lrze Report - Page 8
Vitamin B 12 Requirement for Weanling Pigs Sara S. Blodgett Philip S. Miller
Robert L. Fischer
Summary and Implications
An experrtnent 11 as condzlcted to jilrther de.fine the Iqltatnln B,, reqzlrre- nzent of the 11- to 44-lh plg Plgs (rnr- tral n erght I I 20 lh) n ere fed one ofslx d ~ e t s for a total of 35 daj r I ) Negatrve control, cotnnzon nzlrrey dret n ~ t h no added Iqrtanzrn B,,, 2) IX, conztnon nzlrrerj d ~ e t 1.t rth the addrtlon of 100% the 1998 NRC-reqzla.etnent for the 11- to 22-lh prg for vrtanzln B,, (7 94 pg/lh of dlet), 3) 2X, cotntnon nzlrrey d ~ e t u l th the add~tron of 200% the 1998 NRC-requaetnent for the I 1 - to 22-lh plg for Iqrtanzrn B,, (15 87 pg/lh of dlet), 4) 4X, conznzon nzlrrey dret 1.t rth the addltlon of 400% the 1998 NRC-requrrenzent for the 11- to 22-16 plgfor Iqrtanzln B,.(31 75pg/lh ofdref), 5) SX, cotnnzon nurser) dret 1.t lth the addrtron of 800% the 1998 NRC- reqzllretnent for the 11- to 2 2 4 for Iqrtatnrn B,, (63 49 pg/lh of dref), and 6) 16X, conztnon nurser) dlet n rth the addltron of 1600% the 1998 NRC- reqzlaetnent for the I I- to 2 2 4 prg for Iqrtanzrn B,, (126 98 pg/lh of d ~ e f ) Prg n erghts and feed dlsappearancer 1.t ere nzearz~red 11 eeklj to detertnlne average darlj garn (ADG), aIqerage dull) feed lntake (ADFI), and feed efficrency JADG ADFI) Pzgs I $ ere V I S Z ~ U / / J > scored to USJeJJ uny V Z J Z ~ U ~
Jrgns of vrtunzrn B,, deficzenczes on d 14, 21, 28, and 35 Dztrzng P h a ~ e I, there I C U J no gr01vt/7 or feed rntake reJponJe to sztpplementul vztamzn B,, Dztrrng P h u ~ e 11 und the overull e~perznzental perzod there Icere no feed rntake responses Dztrrng P h u ~ e 11, there were qztudrutzc responses of ADG (P < 0 009) und feed effzczencj, reJponses (P < 0 02) to szlpplementul vztanzzn B,, Overall ( P h a ~ e I +II),
there 1.1 as a tendencj for a lrnear g r o ~ th rerponre (P < 0 1) and there 11 as a quadratrc feed efficrencj response (P < 0 02) There 11 ere no dfferencer atnong grozlps bared on 1.rsua1 arsess- nzent ofvrtanzln B,, dej'icrencler Bared on there rerultr the Iqrtanzln B, , reqzlaetnent of the 1 I- to 2 2 4 prg rr rlnzllar to that recotnnzended hj the 1998 NRC (7 94 pg/lh) H o ~ i eIqer, the 22- to 44-lh prgr rerponded to Iqrtanzrn B,, concentratrons het~teen 4 and 8 trtnes that currentlj recotnnzended hj the 1998 NRC (6 8 pg/lh of d ~ e f ) There data rzlggest that tnunj pork pro- dzlcerr are feedlng Iqrtanzln B,, at concentratronr 11 ell h e l o ~ t thore ohser~.ed to tnuxrtnrze g r o ~ th andfeed efrclencj The datafionz thrs experr- nzent rhozlld he ured In the rearsess- nzent of the Iqrtanzrn B,, reqzllretnent for 1.t eanlrng prgr
Introduction
Our group previously reported that pigs fed four times the 1998 NRC requirement for vitamin B had greater ADG during phase I1 (d 1 5 to 35 post- weaning) and a greater ADG and improved feed efficiency during the overall (d 0 to 35 post-weaning) experimental period as compared to pigs not fed supplemental vitamin BI2. In another study, we reported that pigs fed supplemental vitamin BI2 had greater ADG and improved feed effi- - ciencies duringphase I1 and the overall experimental period. Based on these findings there was interest in reassess- ing the current vitamin Bl l require- ment in weanling pigs (1 1- to 44-lb).
The objective of this study was to determine the vitamin Bllrequirement of 11- to 22-lb pigs and 22- to 44-lb pigs. Our hypothesis was that the vitamin B12 requirement of the 1 1 - to 22-lb pigs will be near that currently recommended by the 1998 NRC (7.94 pgllb of diet) and that the vitamin Bll
requirement of the 22- to 44-lb pigs will be greater than that currently sug- gested by the 1998 NRC (6.8 ingllb). -
Materials and Methods
Experinzental Design
One hundred forty-four crossbred pigs [Danbred x (Danbred x Nebraska White Line)] were allotted based on initial weight and litter oforigin, to one of six treatments using a completely randomized design. Treatments were arranged as a regression surface design. There were six replications per treatment and four pigs per pen. Pigs were weaned at 14 to 17 d of age with an average initial weight of 11.2 Ib. Average final weight was 45.8 Ib. The duration ofthe trial was 35 d and it was divided into two phases, (phase I was from d 0 to 14 and phase I1 was from d 15 to 35).
The six diets included (Table 1): 1) Negatlve control. common nursery diet with no added vitamin BI2: 2) 1X. coininon nursery diet with the addition of 100% the 1998 NRC-requirement for the 1 1 - to 22-lb pig for vitamin B I 2 (7.94 pgllb of diet). 3) 2X. common nursery diet with the addition of200% the 1998 NRC-requirement for the 1 1 - to 22-lb pig for vitamin B l l ( l 5.87 pgl Ib of diet). 4) 4 X cominon nursery diet with the addition of 400% the 1998 NRC-requirement for the 1 1 - to 22-lb pig for vitamin Bl l (3 1.75 pgllb of diet), 5 ) 8X, common nursery diet with the addition of 800% the 1998 NRC- requirement for the 11- to 22-lb for vitamin B12 (63.49 pgllb of diet), and 6) 16X, cominon nursery diet with the addition of 1600% the 1998 NRC- requirement for the 1 1- to 22-lb pig for vitamin B12 (126.98 pgllb of diet). All Phase-I diets were formulated to con- tain22% CP, 1.60% total lysine, 0.90% Ca, and 0.80% P. Phase-I1 diets were
(Continued on nest page)
2003 Yel~raska SIL lrze Report - Page 9

similar to diets used in phase I. except diets were formulated to contain 2 1 % CP, 1.40% total lysine, 0.85% Ca. and 0.74% P.
Live Aninzal Care and Measuretnents
Pigs and feeders were weighed every 7 d to determine average daily gain (ADG). average daily feed intake - (ADFI), and feed efficiency (ADGI ADFI). Two individuals visually examined the pigs on d 14.2 1.28. and 35 and evaluated the pigs on a scale of 1 to 5 (1 having extensive deficiency signs and 5 showing no signs of defi- ciency). Visual assessment was based on physical appearances. such as skin and hair coat characteristics.
Pigs were housed in pens (6.3 x 3.4 ft) that had plastic-coated wire floor- ing. one nipple waterer, and one four- hole stainless steel feeder. Pigs had ad libitum access to feed and water through- out the experiment. Heat lamps and comfort boards were provided during Phase I. The relative humidity (rang- ing between 38% and 70%) and room temperature (maintained at 78°F) were monitored continuously using tempera- ture and humidity recorders.
Results and Discussion
The response of ADG, ADFI, and ADGIADFI to dietary treatments are shown in Figures 1 a, b, and c. respec- tively. During Phase I . there were no growth or feed intake responses to - supplemental vitamin B During Phase 11, ADG responded quadratically to vitamin B,? supplementation (P <0.007) with pigs fed 8 times the NRC recom- mendation having the greatest ADG (1.34 lb). In addition, feed efficiency responded quadratically (P < 0.02) to vitamin B12 supplementation with pigs fed the 4X diet exhibiting the greatest feed efficiency (0.72 1 lbllb). For the overall experimental period, there was a tendency for a linear and qua- dratic growth response (P < 0.07 and P < 0.09, respectively) of ADG to vita- min BIZ supplementation with pigs fed the 8X diet having the greatest ADG (1 .05 lb) . Feed efficiency responded quadratically during the
a) ~ N C g l x 2 x m1x 1 8 X 0 1 6 X I
Quadratic P < 0.007 B,, conc. P < 0.06 1 . 1
SEM = 0.038 - Linear P < 0.07
Phase I Phase I 1 O\ erall
Period
Phase I Phase I1 Overall
Period
Phase I Phase I1 Overall
Period
Figure 1. The response of a) alerage dail? gain (ADG), b) merage dailj feed intake (ADFI), and c) ADGI-IDFI in ~ ~ e a n l i n g pigs to 14 Ib. SE\I = standard error of the mean. \C = Negatile control, 1 9 = loo%, 2 9 = 200%, 1 9 = JOO%, 8 9 - 800%, and 1 6 9 = 1,600% the 1998 \RC requirment recommendation for the 11- to 22-lb pig.
2003 Yel~~*aslia SIL lrze Report - Page 10
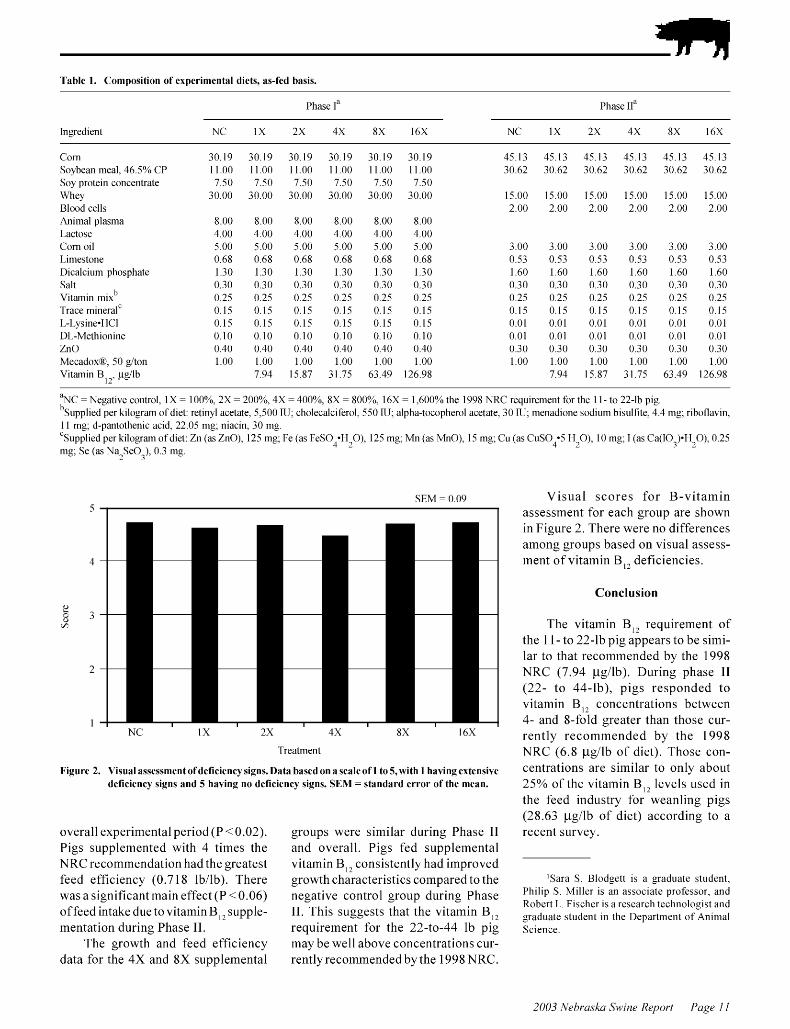
Table 1. Composition of experimental diets, as-fed basis.
Phase I" Phase 11"
lngred~ent NC 1X 2X 1X 8X I6X NC 1X 2X 1X 8X I6X
Con1 %)bean meal. 16.5% CP So) protein concentrate U'he) Blood cells Animal plasma Lactose Con1 oil Limestone Dicalcium phosphate Salt Vitamin mivb Trace mineral" L-Llsine-HCI DL-Methionine ZnO Mecadov 6. 50 _elton Vitamin BI2. pgllb
' h C = Negatib e control. 1 X = 100%. 2X = 200%. 1X = 100%. 8X = 800%. 16X = 1.600% the 1998 NRC requirement for the 1 1 - to 22-lb pig. b~LIPplied per ltilogram of diet: retiql acetate. 5.500 11J: cliolecalciferol. 550 IU: alpha-tocopherol acetate. 30 11J. menadione sodi~lm bisulfite. 1.1 mg. riboflabin. I 1 mg: d-pantothenic acid. 22.05 mg: niacin. 30 mg. ' ~ u ~ ~ l i e d per ltilogram of diet: Zn (as ZnO). 125 mg. Fe (as FeSO;H,O). 125 mg: Mn (as MnO). 15 mg. CLI (as CuS04.5 H20). 10 mg: I (as Ca(IOq).H20). 0.25 mg. Se (as Na-SeO-). 0.3 mg. - Z
5EM = 0 09 Visual scores for B-vitamin assessment for each group are shown
Treatment
Figure 2. Tlsual assessme~lt of deficienc! signs. Data based on a scale of 1 to 5,nith 1 haling extensi~e deficienc) signs and 5 haling no deficiencj signs. SE\I = standard error of the mean.
overall experimental period (P < 0.02). Pigs supplemented with 4 times the NRC recommendation had the greatest feed efficiency (0.7 18 lbllb). There was a significant main effect (P < 0.06) of feed intake due to vitaininB,: supple- mentation during Phase 11.
The growth and feed efficiency data for the 4X and 8X supplemental
groups were similar during Phase I1 and overall. Pigs fed supplemental vitamin B12 consistently had improved growth characteristics compared to the negative control group during Phase 11. This suggests that the vitamin BIZ requirement for the 22-to-44 lb pig may be well above concentrations cur- rently recommended by the 1998 NRC.
-
in Figure 2. There were no differences among groups based on visual assess- ment of vitamin BI2 deficiencies.
Conclusion
The vitamin Bl l requirement of the 1 1 - to 22-lb pig appears to be simi- lar to that recommended by the 1998 NRC (7.94 pgllb). During phase 11 (22- to 44-lb). pigs responded to vitamin B l l concentrations between 4- and 8-fold greater than those cur- rently recommended by the 1998 NRC (6.8 pgllb of diet). Those con- centrations are similar to only about 25% of the vitamin B,: levels used in the feed industry for weanling pigs (28.63 pgllb of diet) according to a recent survey.
ISara S Blodgett 1s a graduate student, Ph i l~p S M~l le r is an associate professor, and Robert L Fischer 1s a research technologist and graduate student 111 the Department of An~nlal Science
2003 \-ebra~ha Sit rne Report - Pcge 11
Vitamin B 12 and Mecadox0 Supplementation in Weanling Pig Diets
Sara S. Blodgett Phillip S. Miller
Robert L. Fischer'
Summary and Implications
An experrtnent 11 as condzlcted to arsers the rerponrrvenerr of 11 ean- lrng prgr to an antrhrotrc-llke cotn- pozlnd (Mecadox8) and vltatnln B,, Plgs (rnrtlul~t elght 1 I 3 16) 1.1 ere fed one of four dletr for a total of 35 dajs I ) Negatlve control, conznzon nurser) dret n ~ t h no added Mecadox8 or Iqrtatnrn B,,, 2) Mecadox R , conz- nzon nurreg dret n ~ t h 50 g/ton added Mecadox8, 3) B,,, conznzon nzlrrey d ~ e t ~ t l t h 36 28 ,ug/lh added Iqrtanzrn B,,, and 4) Por1tr1.e control, conztnon nzlrrey dlet urth 50 g/ton added Mecadox8 and 36 28 ,ug/lh added Iqrtatnrn B,, Plg 1.1 elghts and feed drs- appearance 11 ere nzeaszlred 11 eeklj to deternzrne average darlj garn (4 DG), average dull) feed lntake (ADFI), and feedeffficlencj (4 DG/4 DFI) Plgr 11 ere
~ . u z ~ u l l y scored to assesr any potentla1 ~~i ta tn in B,, dej'iciencles on d 14, 21, 28, and 35. No Mecadox R x vitanzin B,, interactions u,ere ohser~.ed Dzlr- ing Phase I , plgs fed Mecadox8 had greater (P < 0 02) A DG and a greater ADFl (P < 0.003) conzpared to pigr not fed Mecadox8. Durlng Phare I1 and o1.eral1, pigs fed~. l ta tn~n B,, had a greater ADG (P <0.003), A DFl (P < 0.04), and ~tnproved feed effi- ciency (P < 0.02 and P < 0.03, respec- tiveljy cotnpared to pigr not fed dletr contalnlng rz~pplenzental vitanzin B,, Dzlring Phase II, pigr fed Mecadox R had a greater ADFI (P < 0 02) conzpared to pigs not fed Mecadox8 For the overall experi- nzental perlod, pigs fed Mecadox8 had a greater (P < 0.02) ADG and ADFl (P <0.004) verrzm pigs ~ i h l c h uzre notfed Mecadox R . During Phare I1 and the o~ .era l l experitnental period, pigr fed Mecadox R had lo~t,er feed efficiencies (P < 0 02 and P < 0 04, respectl~.ely) than thore not fed dlets containing rupplenzental
Table 1. Compositio~l of experimental diets, as fed basis.
Mecadox8. There 11 ere no dflerencer atnong grozlpr for vlrzlal assesrnzent of B-~~ltatnin dej'iciencler C'itatnin B,, nzay he a partla1 alternative t o Mecadox R for 22- to 44-lh pigr. The ~~i ta tn in B,, reqzlirenzent of the 22- to 44-lhp~gtnuj~ hegreater than the current NRC reqzlaetnent recotntnendation
Introduction
B-vitamins have received little attention by swine nutritionists since the 1950s and 1960s. During the past 40 to 50 years, pigs with higher protein accretion rates have been developed, and that may increase their B-vitamin requirements. Vitamins are important for normal body growth and inainte- nance and support the bodies immune system. Vitamins are important to con- siderwhen formulating diets. especially the water-soluble vitamins. because the body cannot synthesize these vitamins and there is little storage in the body. In addition. vitamin requirements are
Phase I Phase I1
Ingred~ent, % NC" Mecadoxfi V~tamin B1 pea NC" Mecadoxfi V~tamin B1 pea
Corn 31 81 31 81 31 81 31 81 1 1 93 1 1 93 1 1 93 1 1 93 Sox bean meal 16 5% CP 12 16 12 16 12 16 12 16 28 21 28 21 28 21 28 21 Sox proteln collcelltrate 6 25 6 25 6 25 6 25 Mhex 30 00 30 00 30 00 30 00 20 00 20 00 20 00 20 00 Blood cells 2 00 2 00 2 00 2 00 An~mal plasma 8 00 8 00 8 00 8 00 Lactose 1 00 1 00 1 0 0 1 0 0 Con1 011 5 00 5 00 5 00 5 00 3 00 3 00 3 00 3 00 L~mestone 0 65 0 65 0 65 0 65 0 50 0 50 0 50 0 50 Dl~alclurn phosphate 1 28 1 28 1 28 1 28 l 50 150 150 150 5alt 0 30 0 30 0 30 0 30 0 30 0 30 0 30 0 30 V ~ t a m ~ n mlrb 0 25 0 25 0 25 0 25 0 25 0 25 0 25 0 25 Trace mlneralL 0 15 0 15 0 15 0 15 0 15 0 15 0 15 0 15 L-Llslne-HCI 0 05 0 05 0 05 0 05 0 12 0 12 0 12 0 12 DL-Meth~on~ne 0 1 1 0 1 1 0 1 1 0 1 1 0 03 0 03 0 03 0 03 Me~adow 50 _elton 1 00 1 00 1 00 1 00 V~tamln B y_e/lb
12 36 28 36 28 36 28 36 28
' h C = Ne, ffatibe control and PC = Positibe control. b~LIPplied per ltilogram of diet: retiql acetate. 5.500 111: cholecalciferol. 550 IU: alpha-tocopherol acetate. 30 111. menadione sodi~lm bisulfite. 1.1 mg. riboflabin. I 1 mg: d-pantothenic acid. 22.05 mg: niacin. 30 mg. C~upi l i edper ltilogram of diet: Zn (as ZnO). 125 me. Fe (as FeSO;H,O). 125 mg: Mn (as MnO). 15 mg. CLI (as CuS01.5 H20). 10 mg: I (as Ca(103).H,0). 0.25 mg. Se (as Na-SeO-). 0.3 mg. - Z
2003 Yel~~*aslia SIL lrze Report - Page I2

Negatn e Control Mecadox . V~tamln B Pos~tn e Control I2
I I _
SEM
SEM = 0.01 1
I BI2 P < 0.003
SEM =0.009 n
I I I I
Phase I Phase I1 Overall
Feeding Phase
b, 1 N e y a t ~ ~ e Control Mecadox . V~tani~n B Pos~tn e Control 1:
Mecadox P < 0 02 B P < 0 0 1 Mecadow C P < 0 001
Mecadow C P < 0 003 M SEM = 0.010
IdlI_u
- ~ . .. I2
SEM = 0.014
I Phase I I Phase I1
I Overall
I
Feed~ng Phase
Negatn e Control Mecadox . V~tamln B Pos~tn e Control I2
0 8 MecadoxF P < 0 02 B , - P < O 0 2 Mecadow P < 0 01 1
I I _
EFM = n nn i B , - P < 0 0 3 I
Phase I
0.7 0 1
0 - L;
0.6 >
Q
0.5
0.1 Phase I 1
Feeding Phase
Figure 1. The response of a) merage dailj gain (ADG), b) merage dailj feed intahe (ADFI), and c) ADGIADFI in aeanling pigs. SE\I = standard error of the mean.
".""., 1-
SEM = 0 003
affected by many factors. including herd health status. age. and previous nutrition. In a recent survey published by BASF of 27 companies that pro- duce swine feeds or raise pigs. the average addition ofvitamin B12to stai-ter diets (weaning to 44 Ib body weight) was 18.62 ygllb of feed. Companies representing the highest 25% of vita- min B l l concentrations reported were adding an average of 28.63 ygllb of feed and the lowest 25% were adding an average of 12.10 ygllb of feed. These findings indicate that the indus- try is adding vitamin BI2 at concentra- tions well above current 1998 NRC recommendations.
With the possibility of a ban on antibiotics. it is important to look at how the removal of antibiotics may affect the requirements of other nutri- ents. Because vitamin B l l is involved in immune function. its status could be affected by the removal of antibiotics. Therefore, vitamin BI2 may serve as a partial alternative to feeding anti- biotics for disease prevention and growth promotion.
The objective ofthis study was to investigate factors affecting the vita- min B,,requireinent of weanling pigs. specifically antibiotics (MecadoxO). Our hypothesis was that pigs fed diets containing supplemental MecadoxO or vitamin BI2 would have greater aver- age daily gain and improved feed effi- ciency compared to pigs fed anegative control diet.
Materials and Methods
SEM = 0 02 Experinzentul Design -
Ninety-six crossbred pigs [Danbred x (Danbred x Nebraska White Line)] were allotted based on initial weight and litter of origin, to one of four treat- ments using a randomized complete block design. Treatments were arranged as a 2 x 2 factorial. There were four replications per treatment and six pigs per pen. Pigs were weaned at 14 to 16 d post-farrowing with an average ini- tial weight of 11.3 lb. Average final weight was 42.4 lb. The duration ofthe trial was 35 days, which was divided
(Cont~nued on next page)
--
--
2003 \-ebra~ha Sit rne Report - Pcge 13
I
- I
-
-
-
I
into two phases (Phase I was from days 0 to 14 and Phase 11 was from days 15 to 35).
The four diets included (see Table 1 ): 1 ) Negath.e control. common nurs- ery diet with no added MecadoxO or vitamin Bll: 2) MecadooxE, common nursery diet with 50 glton added MecadoxO: 3) B,?. common nursery diet with 36.28 ygllb added vitamin BI2: and 4) Poslth.e control. common nursery diet with 50 glton added MecadoxO and 36.28 ygllb added vitamin BI2 None of the diets con- tained ZnO. All Phase-I diets were formulated to contain 22% CP. 1.5% total lysine, 0.9% Ca, and 0.78% P. Phase-I1 diets were similar to diets used in phase I . except diets were for- mulated to contain 2 1 % CP, 1.4% total lysine, 0.86% Ca, and 0.74% P.
Live Aninzal Care and Measuretnents
Pigs and feeders were weighed every 7 days to determine average daily gain (ADG), average daily feed intake - (ADFI), and feed efficiency (ADGI ADFI). Two individuals visually examined the pigs on days 14.2 1.28, and 35 and evaluated the pigs using a scale of 1 to 5 (1 having extensive deficiency signs and 5 showing no signs of deficiency). This assessment was based on physical appearance. such as skin lesions and hair coat characteris- tics.
Pigs were housed in pens (6.3 x 3.4 ft) that had plastic-coated wire flooring. one nipple waterer, and one four-hole stainless steel feeder. Pigs had ad libitum access to feed and water throughout the experiment. Heat lamps and comfort boards were pro- vided during Phase I of the trial. The relative humidity (ranging between 50% and 60%) and room temperature (maintained at 78°F) were monitored continuously using a temperature and humidity recorder.
Results and Discussion
The response of ADG, ADFI, and ADGIADFI to dietary treatments are shown in Figures 1 a, b, and c, respec- tively. No MecadoxB x vitamin BIZ
Negative control Mecados Vita~llin B, I Positive co~ltrol
Treatment
Figure 2. \ isual assessment of deficienc) signs. Data based on a scale of 1 to 5, \\ ith 1 ha\ ing extensibe deficienc) signs and 5 ha\ing no deficiencj signs. SE\I = standard error of the mean.
interactions were observed. During Phase I . pigs fed MecadoxO had a greater (P < 0.02) ADG (0.49 Ib vs. 0.43 Ib) and a 0.07 Ib greater ADFI (P < 0.003) versus pigs not fed an antibiotic. During Phase 11, pigs fed diets containing supplemental vitamin B,, had greater (P <0.003) ADG ( I . 1 1 Ib ;s. 1.23 Ib), 0. I0 Ib greater ADFI (P < 0.04). and improved (P < 0.02) feed efficiency (0.72 vs. 0.69) com- pared to pigs not fed diets containing supplemental vitamin BI2 . During Phase 11. pigs fed MecadoxO had greater (P < 0.02) ADFI (1.7 1 Ib vs. 1.60 Ib) compared to pigs not fed supplemental MecadoxO. During the overall experi- mental period. pigs fed supplemental vitamin Bl l had a greater (P <0.003) ADG (0.92 Ib vs. 0.85 Ib), greater (P < 0.03) ADFI (1.3 1 Ib vs. 1.24 Ib), and improved (P < 0.03) feed effi- ciency (0.70 vs. 0.68) versus pigs not fed supplemental vitamin BI2. Overall, pigs fed MecadoxO had a greater (P < 0.02) ADG (0.91 Ib vs. 0.86 Ib) and 0.10 lb greater ADFI (P <0.004) versus pigs not fed supplemental MecadoxB. During Phase I1 and the overall experimental period, pigs fed supplemental MecadoxO had lower feed efficiencies (P < 0.02 and P < 0.04, respectively) compared to pigs not fed diets containing supple- mental MecadoxB.
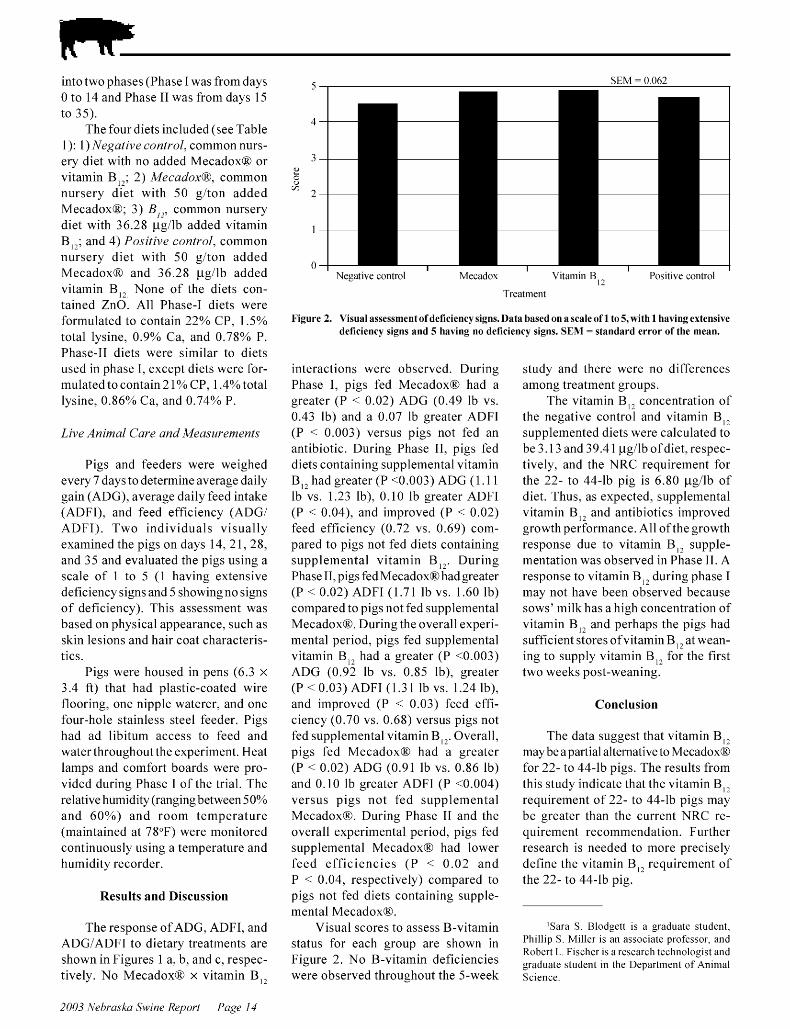
Visual scores to assess B-vitamin status for each group are shown in Figure 2. No B-vitamin deficiencies were observed throughout the 5-week
study and there were no differences among treatment groups.
The vitamin BI2 concentration of the negative control and vitamin B I 2 supplemented diets were calculated to be 3.13 and 39.4 1 ygllb ofdiet, respec- tively, and the NRC requirement for the 22- to 44-lb pig is 6.80 ygllb of diet. Thus, as expected, supplemental vitamin BI2 and antibiotics improved growth performance. All ofthe growth - response due to vitamin B l l supple- mentation was observed in Phase 11. A response to vitamin BI2 during phase I may not have been observed because sows' milk has a high concentration of vitamin Bl l and perhaps the pigs had sufficient stores ofvitainin Bl l at wean- ing to supply vitamin BI2 for the first two weeks post-weaning.
Conclusion
The data suggest that vitamin B I 2 may be apai-tial alternative to MecadoxO for 22- to 44-lb pigs. The results from this study indicate that the vitamin BIZ requirement of 22- to 44-lb pigs may be greater than the current NRC re- quirement recommendation. Further research is needed to more precisely define the vitamin B12 requirement of the 22- to 44-lb pig.
ISara S Blodgett 1s a graduate student, Phillip S M~ller 1s an associate professor, and Robert L Fischer 1s a research technologist and graduate student 111 the Department of An~nlal Science
2003 Yel~~*aslia SIL lrze Report - Page I I
@? Do Crowded Pigs Respond to Paylean . Michael C. Brumm
Phillip S. Miller Robert C. Thaler'
Summary and Implications
PajleanR rs a feed addrtlve that rnzproIqes feed effficlencj , dallj garn and carcasr nzerrt In finlshrng prgr Restrlctronr In space allocation are knoll n to redzlce dallj feed rntake and dallj galn Thzm, prgr tnuj not respond as expected to dletag add~trons of Paj leanR f f eed lntake l r reduced due to cron dlng A 2 x 2 factorla1 desrgn ~ t a s zlsed to exanzrne the potentral rnteractron of Paj leanR and space allocatron Experlnzental treattnentr 1.t ere 1) 14 or 19 prgr per pen (8 0 1.r 5 9ft9/prg), and 2) PajleanR for four 11 eeks prror to rlazlghter (0 or 9 g/T) In thls experlnzent, there 11 ere no rnteractronr bet11 een space alloca- tron and d~etar j Paj lean" addrtlonr for o~.erall dallj gum, darlj feed rntake, feedcom.erslon, carcarr 1.1 erght, carcars j leld, carcars nzerrt, carcarr fa tpee lean, or darlj fa tpee lean galn C r o ~ t ded prgr gren rlo~t er 11 rth no dfference rn feedcon~.ersron efficlencj Iqersus the uncrolt ded treattnent Prgr fed 9 g/T Paj lean" for fozlr 1.1 eekr prror to slaztghter /7ad no drference zn dally guzn or final 1vezg/7t, but dzd have an zncrease zn carcass~~reld(75 3 va 74 6%), lorn depth (2 71 tta 2 64 In), carcass percent lean (56 0 va 55 5%), and curcasa pren~zztn~ (S5 99 va S5 54/c1vf) verszla those fed 0 g T Incrdence of and aeverzt), of tar1 bztrng ~cere recorded on dajl 86 and there Icere no dzferencea u'zte to space ullo- catzon or Pajllean uu'u'ztzon These reaztlta azlggeat the response to dzetury Puj~lean addztrona za zndependent of
the response to space allocation. In addition, the lack of treatnzent efects on tail biting score on day 86 suggests neither space allocations nor d ie tay Paj~leanR addition 1t.ere the cause of the tail biting obser~.ed in this experi- nzent.
Introduction
The response to Paylean" by finishing pigs is dose dependent. At low inclusion levels (4.5 gIT), Paylean" impacts pig performance by iinprov- ing gain. feed efficiency and carcass leanness. As the amount of Paylean" in the diet is increased (4.5 to 18 g/T), there generally is an improvement in carcass leanness and further improve- ments in feed efficiency. While diets are formulated with a specific amount of Paylean" (g1T). management factors can alter the daily feed intake offinish- ing pigs. influencing the intake of Paylean". One management factor that alters feed intake is space allocation. When pigs are given less space per pig, feed intake almost always declines, with a resultant decrease in daily gain. Feed conversion efficiency may or may not be impacted by areduction in space allocation. The following experiment was conducted to investigate the inter- action of space allocation and Paylean" on pig performance and carcass char- acteristics.
Methods
The experiment was conducted at the University of Nebraska's Hasltell Ag Lab Swine Researchunit near Con- cord, Neb. Pigs were housed in a double curtain, naturally ventilated, fully slat- ted confinement facility with 16 pens and daily fresh water, under slat flush-
ing for manure removal. Each pen measured 8 ft x 14 ft and contained one two-hole wean-to-finish feeder and one wean-to-finish cup drinker.
There were four replications of each combination ofthe following ex- perimental treatments:
1) Space allocation from arrival a) 5.9 ft'lpig (I 9 pigslpen) b) 8.0 ft'lpig ( I4 pigslpen)
2) Paylean" in the diet for 4 weeks prior to slaughter a) 0 glT b) 9 glT
Crossbred barrows (Danbred USA, Seward. NE) were vaccinated for H parasuw, Mhj.opnez~nzonia, and erysi- pelas. All pigs that died during the experiment were examined for cause of death by a consulting veterinarian. Pen size was not adjusted in the event of pig removal or death. Feed disap- pearance was adjusted for dead and removed pigs prior to data analysis.
The experimental diets are listed in Table 1 . Diets were switched on the week individual pens achieved target weights. All diets contained 100gIT Tylan from arrival to 80 Ib, 40 g/T from 80 to approximately 180 Ib. and 0 g1T thereafter.
Pigs were weighed every three weelts for the first nine weelts of the experiment. Pigs were weighed biweekly or weekly thereafter as necessary to deteilnine the starting time for Paylean" treatments and to determine when to market pigs. The target slaughter weight for pigs fed P a y l e a n h a s 240 pounds and pigs were fed 0 or 9 g/T Paylean" diets for a four-week period prior to slaughter. Pigs on the uncrowded treat- ment were switched to the Paylean"
(Continued on newt page)
2003 \-ebra~ha Sit rne Report - Pcge 15
treatments on day 58 while pigs on the crowded treatment were switched on day 65 of the experiment based on projected daily gain prior to slaughter.
Individually identified pigs were slaughtered at IBP. Inc.. Madison. Neb. for determination of carcass composi- tion and premiums. All pigs within a space allocation treatment (crowded vs uncrowded) were marketed on the same day. Fat free lean (FFL) and daily FFL gain were estimated on individual pigs using the loin and muscle depth values reported by IBP for individual pigs and the equations for FFL as pub- lished in Composition and Quality Assessment Procedures (National Pork Producers Council, 2000).
Either 10 or seven predetermined pigs per pen (5.9 or 8.0 ft'lpig) were bled via venapuncture on the same day as weighing and scanning. Plasma was harvested and frozen for analysis for plasma urea by the Non-Ruminant Nutrition Laboratory in the Animal Science Department at the University of Nebraska.
On day 86. all pigs were individu- ally rated for injury due to tail biting using a 1 to 4 scale. with 1 being no injury evident and 4 being severe tail biting injury.
Results were analyzed using the ProcMixed procedure of SAS (SAS Institute. Cary, N.C.). The model included space, Paylean" addition and their interaction as fixed effects. and replication as arandom effect. The pen of pigs was the experimental unit for all statistical comparisons. Death loss and pig removal was examined by Chi-square analysis.
Results and Discussion
Table 2 presents pig deaths and removal by pen, and experimental treatment. Because pen size was not adjusted in the event of pig death or removal, space allocation increased with death or removal. Two of the crowded pens had a space allocation at slaugh- ter of 7.0 ft'lpig, two were at 6.2, and four were the original 5.9. In no instance did the space allocation of a crowded treatment pen become
Table 1. Experimental diets.
Period
0 g/T 9 g/T 65- 80 Ib 80-130 Ib 130- pa)leanh ~a) lean pa) lean
Ingredient, % Con1 67.13 72.68 So)bean meal. 16.5% CP 27.75 22.75 at^ 2.00 2.00 Dicalcium PO, 18.5% 1.20 0.85 Limestone 0.80 0.75 Salt 0.30 0.30 Vitaniin premix 0.30 0.275 Trace mineral premix 0.25 0.20 L-I) sine 0.15 0.15 T) Ian 1 0 0.125 0.05 pa) leang premix 0 0
C:alcolated composition ME. I;cal/lb 1515 1553 Crude protein. % 18.6 16.8 L) sine. % 1.10 0.97 A\ ail P. % 0.29 0.22 Total P. % 0.60 0.52 Ca. % 0.77 0.61
Laboratory Analysis h
Crude protein. % 18.8 18.2 L) sine. % 1 .OO Ca. % 0.79 0.12 P. % 0.55 0.11 Particle size. microns 985
" C M -3800 Feed Energ) Co Des Mo~nes IA bCM ard Laboratories. Kearne). Neb
Table 2. Effect of experimental treatments on pig death, remobal, and final stoching densit?.
Dens~t) ft21p~g Cause Pen pallean Da) of no lnltlal F~nal d T deatli/remo\ al Death Remol al
LJlcer Tail bitten Fail~lre to gain Injun
Streptococc~~s infection Gastric torsion
PRRSIpneumonia Tail bitten
PRRS Unhnon n PRRS/pneumonia
Tail bitten
Gastr~c torsion PRRS/pneumonia
Tail bitten
Tail bitten
2003 Yel~~*aslia SIL lrze Report - Page 16

Table 3. Effect of experimental treatments on pig performance.
space. ft2/plg Pqlean d ~ " P Values
Space x Item 5 9 8 0 0 9 SE Pax lean Space PaJlean 1
No. pens 8 8 8 8
Pig xTeight lb 1111t1al 65 0 65 i 65 3 65 2 Pa5leanh m~tiation" 183 5 176 8 179 7 180 5 1 6 0 273 0 011 0 715 ~ l n a l ~ 239 0 235 6 236 2 238 3 2 0 0 895 0 257 0 129
Coefficient of larlation for x\ithin pen \\eight, % 1111t1al 10 2 10 8 F~nal 9 0 9 0 8 2 9 8 0 6 0 073 0 981 0 073
AT erage dail! galn, lb 1 Da! 0 to7Pa>lean lllitiation 1 8 5 1 9 5 1 90 1 9 1 0 03 0 371 0 025 0 739
Pa5leanh to final 2 02 2 13 2 05 2 10 0 06 0 821 0 108 0 180 Da! 0 to final 1 89 2 00 1 93 1 96 0 02 0 971 0 010 0 196
AT erage dail! feed, lb 1 Da! 0 to-Pa) lean ~ ~ l i t ~ a t ~ o ~ l 1 72 1 80 1 7 1 1 7 8 0 08 0 266 0 161 0 718
Pa5leanh to final 6 00 6 30 6 35 5 95 0 07 0 165 0 020 0 001 Da! 0 to final 5 11 5 30 5 25 5 11 0 07 0 181 0 071 0 310
Feed gain 1 Da! 0 to-Pa) lean ~ ~ l i t ~ a t ~ o ~ l 2 55 2 1 6 2 51 2 il 0 03 0 623 0 063 0 939
Pa5leanh to final 2 99 2 97 3 10 2 85 0 07 0 675 0 697 0 001 Da! 0 to final 2 70 2 65 2 72 2 6 1 0 03 0 152 0 208 0 069
Tail bit111g score on da\ 86' I 1 1 3 1 3 1 5 0 1 0 185 0 729 0 303
2 " ~ n ~ t ~ a t e d on da) 62 for i 9 it21plg treatment and da! 58 for 8 0 it /pig treatment b ~ a 5 93 for 5 9 ft-1p1g treatment and da! 86 for 8 0 ft21pig treatment 1 = none. 1 = seT ere
Table 1. Effect of erperime~~tal treatments 011 carcass measurements.
Space, ft-/p~g Pa! leana. g / ~ a P Values
Space x Item 5 9 8 0 0 9 SE pa) lean Space Pal lean
I B P ~ measures Carcass \\t Ib 179 9 178 7 177 2 181 1 2 0 0 663 0 659 0 131 Car~ass 11eld % 7 1 8 75 1 7 1 6 75 3 0 3 0 389 0 159 0 097 Ba~l,tat ~n 0 59 0 62 0 61 0 60 0 02 0 253 0 080 0 536 Lo~n depth In 2 611 2 705 2 639 2 710 0 021 0 506 0011 0 005 Lean % 55 70 55 80 55 50 56 00 0 07 0 060 0 682 0 001 Carcass premium $ / ~ x \ t 5 72 5 82 5 5 1 5 99 0 13 0 119 0 513 0 017
NPPC Standard~zed Fat Free Lean (FFL) % FFL 51 6 51 5 51 1 51 6 0 2 0 380 0 170 0 106 FFL da~l) galn Ib 0 750 0 798 0 760 0 788 0 009 0 505 0 003 0 016
7111t1ated on da! 65 for 5 9 ftL/plg treatment and da) 58 for 8 0 ft21pl, ff treatment b~~~ Inc , Mad~son, Neb
equal to the uncrowded allocation of 8.0 ft'lpig.
Table 3 presents the main effects of space and Paylean" on pig perfor- mance. There were no interactions between space allocation and Paylean" addition to the diet for final weight, daily gain, daily feed intalte, feed con- version efficiency, or tail biting score. The interaction between space alloca- tion and Paylean" for the coefficient of
variation of within pen weight at time of sale for slaughter is due to an in- crease in within pen CV for pigs fed 9 glT Paylean" and given 5.9 ft'lpig versus 0 glT Paylean"l0.5 vs 7.5 %) and no difference in within pen CV for either Paylean" treatment at 8 ft'lpig (9.0 vs 9.0%).
Pigs given 5.9 ft'lpig grew slower from the time of arrival to the begin- ning of the Paylean" treatments.
Unlilte previous research results, there was no effect of space allocation on feed intalte prior to the initiation of the Paylean" treatments. However, crowded pigs had a reduction in feed intalte during the four week Paylean" treatment period. This resulted in a tendency for a reduction in feed intalte due to a restriction in space allocation from arrival to slaughter.
(Continued on nest page)
2003 \-ebra~ha Sit rne Report - Pcge 17

There was a tendency for crowded pigs to have a poorer feed conversion efficiency from arrival to the initiation of the Paylean" treatments. However, there was no effect of space allocation on feed efficiency during the Paylean" treatment period or overall.
There was no effect of 9 g/T Paylean" addition in the diet for four weeks prior to slaughter on final weight compared to 0 g/T Paylean" in the diet. There was no effect of Paylean" addi- tion on daily gain. either during the four-week period it was in the experimental diets or overall. The addition of 9 g/T Paylean" to the diet did result in a decrease in daily feed intake during the four-week inclusion period and a significant improvement in feed:gain for the four-week treat- ment period. This improvement was large enough to result in an overall improvement in feed:gain compared with the 0 glT treatment.
There was no effect of experimen- tal treatments on death loss or the num- ber of pigs removed for tail biting or poor performance. Tail biting scores on day 86 (Table 3) suggest no effect of experimental treatments on tail bit- ing. In general, the incidence of tail biting was not considered severe in this experiment.
Similar to the live performance data. there were minimal interactions between space allocation and Paylean" treatments for any of the IBP carcass traits reported (Table 4). There was no effect of experimental treatments on carcass weight. similar to the lack of treatinent effect on live weight at slaugh- ter . However, carcass yield was increased slightly for pigs fed 9 glT Paylean" versus 0 g/T. Crowded pigs had a slight reduction in carcass bacltfat depth when compared to uncrowded pigs. Loinmuscle depth was decreased for the crowded versus the uncrowded pigs. However, there was no effect of space allocation on carcass percentage lean, carcass preiniuin or fat free lean percentage. Because ofthe slower daily live weight gain, there was a decrease in daily FFL gain for the crowded ver- sus uncrowded pigs.
Table 5 . Effect of experimental treatments on plasma urea, mg/100 ml.
P V a l ~ ~ e s
Da) Space tt21p~g Pqlean d ~ " Clpace w
5 9 8 0 0 9 SE pallean Clpace Pa)lean
"111tlated on da) 65 for 5 9 ft21p~g treatment and da) 58 for 8 0 ft2/plg treatment
Table 6 . Experimental treatment interactions on plasma urea, d a ~ 65, mg/100 ml.
Space. ft2/p~g P V a l ~ ~ e s
5 9 8 0 Space w
pallean g/~" 9 0 9 SE pa) lean Clpace pa) lean
Plasma urea 20.3 20.7 26.1 28.0 0.8 <0.001 <0.001 0.365
"111tlated on da) 65 for 5 9 ft21p~g treatment and da) 58 for 8 0 ft2/plg treatment
Pigs fed 9 g/T Paylean" for four weeks prior to slaughter had an increase in loin muscle depth, carcass lean percentage and carcass preiniuin compared to pigs fed 0 glT Paylean". There was no effect of Paylean" treat- ment on FFL percentage, but there was an increase in daily FFL gain for the 9 glT Paylean" treatment.
On day 44, pigs given 5.9 ft'lpig had a lower plasma urea concentration compared with pigs given 8.0 ft'lpig (Table 5). The interaction between space and Paylean" treatments for plasma urea on day 65 (Table 6) is due to the day Paylean" treatments began. Pigs on the 8.0 ft'lpig treatinent had been on the .92% lysine diet associated with the Paylean" treatments for 7 days while pigs on the 5.9 ft'lpig treatinent were switched to the higher lysine diet fol- lowing sampling on day 65. The trend toward an increase in plasma urea on day 86 for the 0 g/T PayleanQreatment versus the 9 g/T Paylean" treatment suggests the dietary lysine level was in excess of the pigs needs for lean tissue deposition for the 0 g/T Paylean" treatment.
Conclusion
In this experiment, there were no interactions between space allocation and dietaiy Paylean" additions forover- all daily gain. daily feed intake. feed conversion, carcass weight. carcass yield, carcass premium, carcass fat free lean. or daily fat free lean gain. The interactions between space allocation and Paylean" treatments on days 65 and 86 were most likely due to the seven-day difference in when Paylean" treatments were applied to the 5.9 vs 8.0 ft'lpig treatments.
These results suggest the response to dietary Paylean" additions is inde- pendent of the response to space allo- cation. In addition, the lackoftreatment effects on tail biting score on day 86 suggests neither space allocations nor dietary Paylean" additionwere the cause of the tail biting observed in this experiment.
IMichael C. Brumm is professor and Extension sn-ine specialist at the Northeast Research and Extensio~l Center. Concord. Neb. Phillip S. Miller is an associate professor in the Departnlent ofA~li~l lal Science. Robert C Thaler is professor, Sn-ine Extensio~l and Nutrition, SouthDakota State University. Brookings. S.D.
2003 Yel~~*aslia SIL lrze Report - Page 18
Comparison of Swine Performance When Fed Diets Containing Corn Root Worm Protected
Corn, Parental Line Corn, or Conventional Corn Grown During 2000 in Nebraska
Robert L. Fischer Phillip S. Miller Sara S. Blodgett Steven J. Kitt'
Summary and Implications
Thls experrtnent 11 as conducted to e~.alz~ute grolt th perfortnunee and carcass qualrtj nzearzlretnentr rn gron rng-frnrshrng prgs fed dretr contarnrng erther Corn Root Wornz Protected Corn (CR W0586), the parental control corn (RX670), or h t o cotnnzercra1sozn.ces ofnon-genetrcallj nzodrfied corn (DK647 and RX740) The experrtnent used 72 barro~ts and 72 glltr ~ . t lth an average lnltral bodj 1.1 elght of 50 lb The plgs n ere allotted to a randonzlred conzplete block derlgn n ~ t h a 2 x 4 factorral arrange- nzent of treatnzents ( tuo rexer x f o u r corn hjbrrdr) The experrnzent con- trnued zlntll the average bodj 11 erght ~ . t ar 260 16, at 1.1 hrch trnze allprgr n ere rlaughtered Real-tlnze ultraroz~nd nzeaszwenzentr 1.1 ere taken on the frnal daj ofthe experrtnent Carcarr qzlulr~ nzeasz~renzentr 1.t ere tnade 24 hozlrr posttnortenz Corn hj brld drd not a$ feet average u'arlj~guzn (ADG) or uver- age duzlj~ feedzntake (ADFI), bztt there ~caa an effect of sex, 1crt/7 barro~ca havrng greater (P < 0 01) ADG and ADFI t/7an grlts Feed efficrencjl 11 aa not affected by t/7e dzfferent corn /7j1brrU'J, bztt grlts had zmproved (P < 0 01) feed effzcrencjl conzpured to barrolva u'ztrzng Frnra her 1 (0 3 7 ver- azls 0 35) and Frnrsher 2 (0 32 verszla 0 30) Real-trme zt/traaoztnd n7easztre- n7enta ~c ere armrlur unzong corns, /7olvet>er, a aey effect was detected for
backfat (BF) depth, n ~ t h grlts ha~qrng lesr (P < 0 01) BF than barro~ts (0 78 \.errus 0 98 ~ n ) There ~ . t ere no dffer- ences rn carcars nzrdlrne BF tneasure- nzentr atnong corns, bzlt there %tar a rrgnrfrcant dfference bet~t een bar- ron r and grlts, n ~ t h glltr ha~.lng lesr (P < 0 05) BF than barro~ts Hot carcass 11 erght ~ . t ar greater (P < 0 01) rn barron r than glltr (210 Iqersur 190 lb) 41~0 , the percent carcarr lean %tar greater (P < 0 01) rn grltr than barron r (51 7 verszlr 49 5%) Longrs- r~nzzls nzzlscle qualrtj rcorer 11 ere rltnrlar atnong corns and bet11 een barron r and grlts 4naljsu of longrr- rrtnzlr nzurcle cotnporrtron revealed no nzaln effect of corn (P > 0 20) or sex (P > 0 30) for proteln, fat, and n ater percentager Ho~i eIqer, Corn Root Wornz Protected Corn (73 1%) dlffered (P < 0 04)fionz parental control corn (73 6%) but not conznzerc~ul cornr (73 3 and 73 3%) rn longrrrlnzzm 11 ater content In rz~tnnzarj, there 1.t ere no dfferencer In grolt th perfortnance or carcarr tneaszlretnents In gro~ t rng- finlshrng plgs fed drets contarnrng elther Corn Root Wornz ProtectedCorn, the parental control corn, or fii o cotn- nzercral rozlrcer of non-genetlcallj n~odzfied corn T/7zts, the replacement ofnon-tranagenrc corn ~c rt/7 Corn Root Worm Protected Corn zn grolvrng- finrshrng u'rets ~crll reaztlt zn srmrlur gronth performance und(or) carcaaa n7euszlren7enta
Introduction
Transgenic crops offer producers a wide variety of agronomic benefits. Crops with microbial Bt formulations contain the Cry (crystalline protein
inclusions) insect control proteins. Fol- lowing a single acute exposure, Cry proteins bind to specific receptors in the inidgut cells of susceptible insects and form ion-selective channels in the cell membrane. The cells swell due to an influx of water which leads to cell lysis. the insect stops eating and dies. The test event, MON 863, produces a variant ofthe wild type Cry3Bb1 pro- tein, which protects against Corn Root Worm (CRW, Dlubrotica).
The objective ofthis study was to compare growth performance and car- cass quality measurements ingrowing- finishingpigs fed diets containing either Corn Root Worm Protected Corn (CRW0586). the parental control corn (RX670). or two commercial sources of non-genetically modified corn (DK647 and RX740).
Procedures
Aninzals and Treatment
A total of 144 crossbred [Danbred x (Danbred x N E White Line)] bar- rows and gilts with an average initial body weight (BW ) of 50 Ib were used. The pigs were allotted to a randomized complete block experiment with a 2 x 4 factorial arrangement of treatments. Bloclts were based on initial weight and pen location within the building. There were two sexes (barrows and gilts) and four genetic corn lines (CRW0586, RX670, DIC647, and RX740). Diets (Table 1) contained corn and soybean meal and were fortified with vitamins and minerals to meet or exceed the NRC (1998) requirements for 44- to 264-1b pigs. There were four
(Cont~nued on newt page)
2003 \-ebra~ha Sit rne Report - Pcge 19
diet phases during the experiment (Grower 1 , Grower 2. Finisher 1 , and Finisher 2). Each diet phase was 28 days. except Finisher 2 which was 20 days, this resulted in atotal experimen- tal period of 104 days.
The pigs were housed in a modi- fied-open-front building with 24 pens (pen dimensions 4.9 x 15.7 ft), and each pen contained six pigs. Pigs had ad libitum access to feed and water throughout the experimental period. Pigs remained on the experiment until the average BW of the pigs reached approximately 260 Ib (d 104). at which time all pigs were removed from the experiment.
Table 1. Ingredient and calculated composition of diets, as-fed basis.
D ~ e t a n phases"
Con1 So)bean meal (16.5% CP) Tallou Dicalcium phosphate Limestone Salt Vitaniin premix " Trace mineral premix T) losin. 10 glib L-L)sine.HCI
Calculated nutrient content Crude protein. % L) sine. % ME '. Mcalllb Calci~lrn. % Pliosphor~ls. %
Data and Satnple Collection
Pigs were weighed and feed intakes were measured biweekly to determine average daily gain (ADG), average daily feed intake (ADFI). and feed efficiency. Real-time ultrasound measurements were taken at the end of the experiment by a certified techni- cian. and tenth-rib backfat (BF) depth and longissimus muscle area (LMA)
"lie onl) difference in the fo~lr diets mithin each dietar) phase \\as the addition of the different genetic corn lines. b~LIPplied per pound of complete feed in grouer diets: retin11 acetate. 1.995 111. cliolecalciferol. 200 IU: a-tocopherol acetate. 1 1 IU: menadione sodium bisulfite. 1.6 mg: ribofla! in. 1.0 mg. d-pantothenic acid. 8.0 mg. niacin. 12.0 mg: bitamin B . 12.0 yg. ' ~ u ~ ~ l i e d per po~lnd of complete fi2d in finisher diets, retin11 acetate. 1.500 IU. cliolecalciferol. 150 IU: a-tocopherol acetate. 8.2 IU. menadione sodium bisulfite. 1.2 mg. riboflabin. 3.0 mg: d-pantothenic acid. 6.0 mg. niacin. 9.0 mg: bitamin B . 9.0 yg.
12 d~uppl ied per pound of coniplete feed 111 grouer diets Zn (as Z110). 58 mg. Fe (as FeSO;HpO).58 mg: MII (as MnO). 13.6 mg: CLI (as CuSO4-5 H-0). 5 mg: I (as Ca(l0J.H 0 ) . 0.12 mg. Se (as Na,SeO-). 0.11 mg. e~uppl ied per po~lnd of complete teed in finisher diets. Zn (as t n 0 j . 38.5 mg: Fe (as FeSO-.H d). 38.5 mg.
1 2 Mn (as MnO). 9.1 mg: CLI (as CLISO;~ H20). 3.2 mg. I (as Ca(lO;)-H,O). 0.08 mg. Se (as Na,SeO-). 0.09 - Z
me.
Table 2. Growth performance of barrons and gilts.
Item
Genet~c L ~ n e sex P-Val~le a
Pooled CRM0586 RX670 DK617 RX710 Barrons G~l t s $EM Trt $ex Trt x sex
No Pens 6 6 6 6 12 12 I~litial W t , lb 50 12 50 08 50.12 19.91 50.10 50 05 0.236 NS NS NS Final Wt.. lb 260.18 258 67 255 13 259 66 270.66 216.15 1.911 NS < 0.01 NS
Grouer 1 ADG. Ib " 1.63 1.68 1.63 1.61 1.72 1.57 0.037 NS < 0.01 N S ADFI. Ib 3.22 3.29 3.20 3.22 3.35 3.09 0.061 NS < 0.01 N S ADGIADFI 0.51 0.51 0.51 0.50 0.51 0.50 0.007 NS N S N S
Grou er 2 ADG. Ib 2.07 2.03 2.01 2.06 2.18 1.87 0.061 NS < 0.01 N S ADFI. Ib 5.01 1.87 1.81 1.83 5.27 1.50 0.150 NS < 0.01 N S ADGIADFI 0.12 0.11 0.12 0.12 0.12 0.12 0.01 1 N S N S N S
Finisher 1 ADG. Ib 2.29 2.27 2.23 2.25 2.10 2.12 0.073 N S < 0.01 N S ADFI. Ib 6.18 6.22 6.21 6.33 6.87 5.76 0.205 N S < 0.01 N S ADGIADFI 0.36 0.37 0.36 0.36 0.35 0.37 0.01 1 N S < 0.01 N S
Finisher 2 ADG. lb 2 12 2.09 2.05 2.2 1 2.21 2.03 0.079 NS < 0.01 NS ADFI. lb 6.90 6.77 6.59 6.88 7.30 6 28 0236 NS < 0.01 NS ADGIADFI 0 31 0 31 0 31 0 32 0 30 0 32 0 009 NS < 0.01 NS
Overall ADG. lb 2 07 2.07 1.98 2.07 2.12 1.90 0.016 NS < 0.01 NS ADFI. lb 5.27 5.18 5.09 5.18 5 56 1 8 1 0 135 NS < 0.01 NS ADGIADFI 0 38 0 39 0 39 0 39 0 38 0 39 0 007 NS < 0.01 NS
" ~ r t =treatment. and NS = nonsignificant effect . P > 0.10. 'ADG = alerage dail) gain. 'ADFI = aberage dail) feed intake.
2003 Yel~~*aslia SIL lrze Report - Page 20
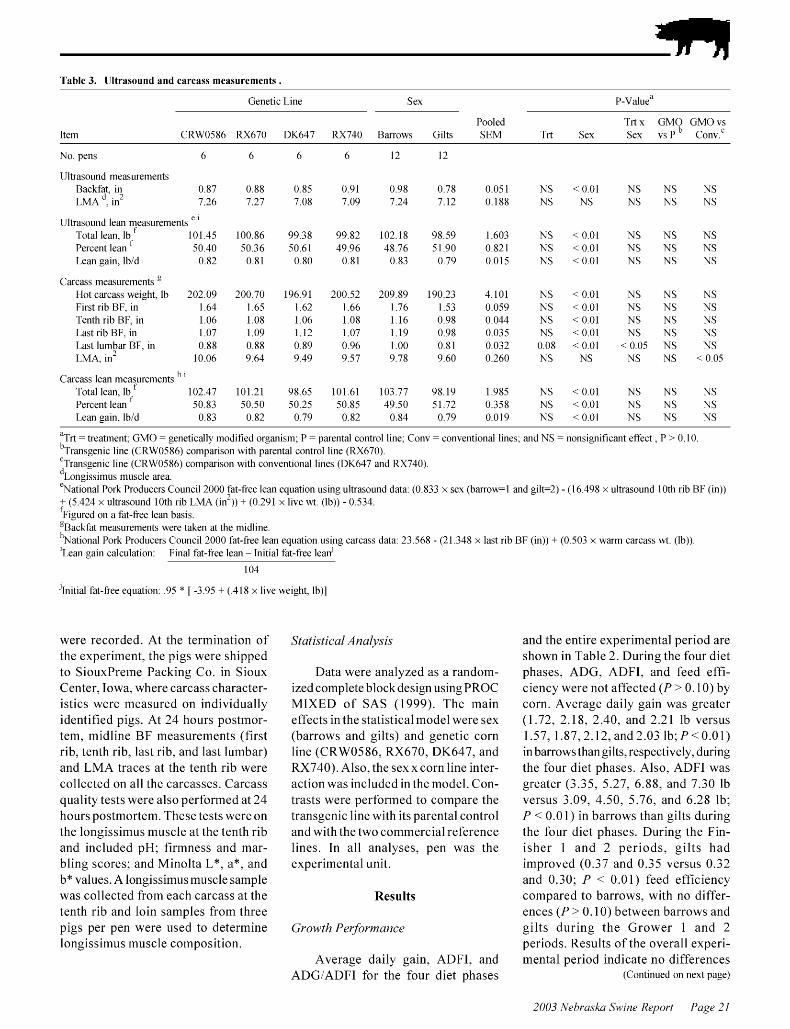
Table 3. llltrasot~nd and carcass measurements
Item
Genet~c L~ne 5ew P-value"
Pooled Trt w GMO GMO \ s CRU0586 RX670 Dk617 RX710 Barrous G~lts 5EM Trt Sex sex 1s P " con\
No. pens 6
Illtrasound measurements Bacltfat. in 0.87 LMA in2 7.26
Illtrasound lean measurements " f Total lean. Ib f
101.15 Percent lean 50.10 Lean gain. Ibld 0.82
Carcass measurements " Hot carcass \\eight. Ib 202.09 First rib BF. in 1.61 Tenth rib BF. in 1.06 Last rib BF. in 1.07 Last lumkar BF. in 0.88 LMA. in' 10.06
Carcass lean measurements " ' f Total lean. Ib f
102.17 Percent lean 50.83 Lean gain. Ibld 0.83
'?I? = treatment. GMO = geneticall) modified organism: P =parental control line: Con\ = conbentional lines. and NS =nonsignificant effect. P > 0.10. b~ransgenic line (CRUl0586) comparison \\it11 parental control line (RX670). C~ra~isgenic line (CRU70586) comparison \\it11 con\ entional lines (DK617 and RX710). d~ongissimus muscle area. '~ational Pork Prod~lcers Co~lncil 2000 fat-free lean equation using ultrasound data: (0.833 x sew (barro\\=l and gilt=2) - (16.198 x ~lltrasound 10th rib BF (in)) + (5.121 x ultraso~lnd 10th rib LMA (in')) + (0.291 x li\e \\t. (Ib)) - 0.531. f F~gured on a fat-free lean basis. '~acltfat measurements \\ere talcen at the midline. I1 National Pork Prod~lcers Co~lncil 2000 fat-free lean eq~~ation ~lsing carcass data. 23.568 - (21.318 x last rib BF (in)) + (0.503 x \\arm carcass \\t. (Ib)). ' ~ e a n gain calculation: Final fat-free lean - Initial fat-free lean'
101
'~nitial fat-free equation: .95 * [ -3.95 + (.118 x live \\.eight, lb)]
were recorded. At the termination of the experiment. the pigs were shipped to SiouxPreine Packing Co. in Sioux Center. Iowa. where carcass character- istics were measured on individually identified pigs. At 24 hours postmor- tem. midline BF measurements (first rib. tenth rib, last rib, and last lumbar) and LMA traces at the tenth rib were collected on all the carcasses. Carcass quality tests were also performed at 24 hours postmortem. These tests were on the longissiinus muscle at the tenth rib and included pH; firmness and mar- bling scores; and Minolta L*, a*, and b* values. A longissiinusinuscle sample was collected ffom each carcass at the tenth rib and loin samples ffom three pigs per pen were used to determine longissimus muscle composition.
Statistical Analj~si,r
Data were analyzed as a random- ized complete block design using PROC MIXED of SAS (1999). The main effects in the statistical model were sex (barrows and gilts) and genetic corn line (CRW0586, RX670. DK647. and RX740). Also. the sex x corn line inter- action was included in the model. Con- trasts were performed to compare the transgenic line with its parental control and with the two coininercial reference lines. In all analyses, pen was the experimental unit.
Results
Gron~/7 Performunce
Average daily gain, ADFI, and ADGIADFI for the four diet phases
and the entire experimental period are shown in Table 2. During the four diet phases, ADG, ADFI. and feed effi- ciency were not affected ( P > 0.10) by corn. Average daily gain was greater (1.72. 2.18, 2.40, and 2.21 Ib versus 1.57. 1.87.2.12.and2.03 Ib: P<0 .01) in barrows than gilts. respectively, during the four diet phases. Also. ADFI was greater (3.35, 5.27, 6.88, and 7.30 lb versus 3.09, 4.50, 5.76, and 6.28 lb; P < 0.01) in barrows than gilts during the four diet phases. During the Fin- isher 1 and 2 periods, gilts had improved (0.37 and 0.35 versus 0.32 and 0.30; P < 0.01) feed efficiency compared to barrows, with no differ- ences ( P > 0.10) between barrows and gilts during the Grower 1 and 2 periods. Results of the overall experi- mental period indicate no differences
(Cont~nued on next page)
2003 \-ebra~ha Sit rne Report - Pcge 21
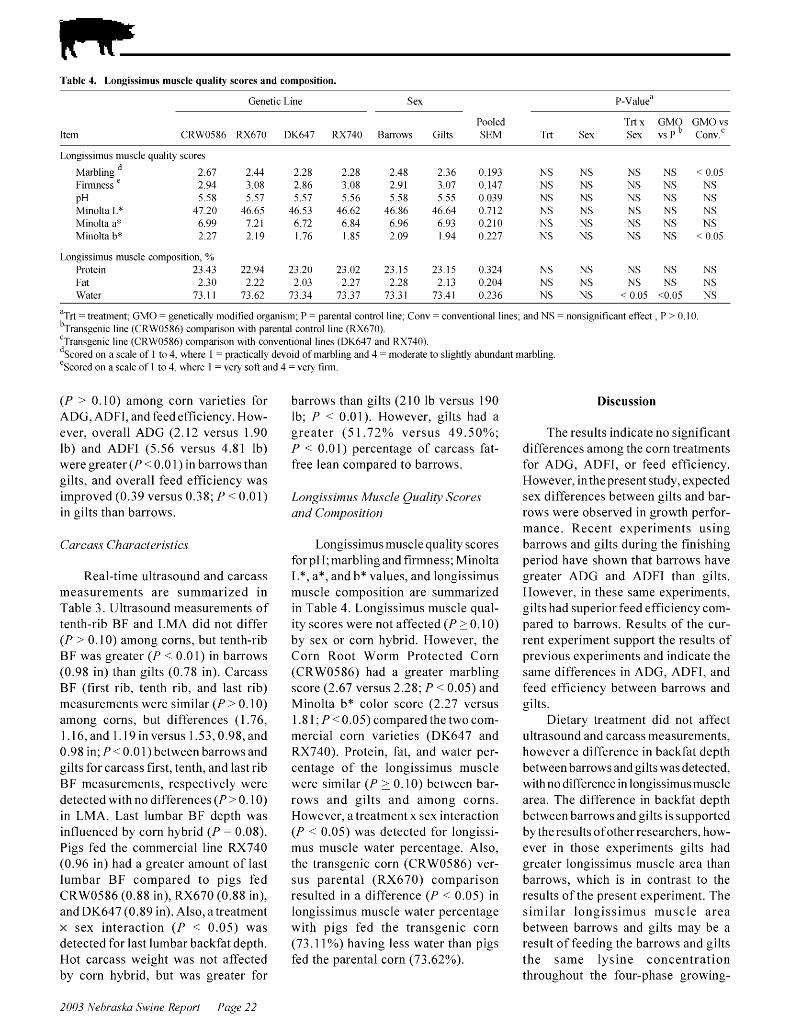
Table 4. Longissimus mt~scle qoality scores and composition.
Sex
Item CRM(O586 RX670
Longissim~~s muscle qualit) scores
Marbling d 2.67 2.14 Firmness 2.94 3.08 PH 5.58 5.57 Minolta L* 17.20 16.65 Minolta a* 6.99 7.21 Minolta b* 2.27 2 19
Pooled SEM Trt Sew
NS NS NS NS NS NS NS NS NS NS NS NS
Trt w GMO GMO \ s sex 1s P " Con\
Long~ssimus muscle compos~t~on, % Prote~n 23 1 3 22 9 1 23 20 23 02 23 15 23 15 0 321 NS NS NS NS NS Fat 2 3 0 2 2 2 2 0 3 2 2 7 2 2 8 2 1 3 0204 NS NS NS NS NS M ater 73 11 73 62 73 3 1 73 37 73 31 73 1 1 0 236 NS NS < 0 0 5 <005 NS
"Trt = treatment. GMO = geneticall> nlodified organlsln P = parental control 11ne Corn = con\entional 111les b~ralsgenlc line (CRW0586) comparison n ~ t h parental control line (RX670) C~ransge~lic 11ne (CRM 0586) colllparlson ~11th corn entional 111les (DK617 and RX740) d~cored on a scale of I to 1 , nhere 1 = pract~call> d e ~ o i d of marbling and 4 = nloderate to sl~ghtll abundant r eScored on a scale of 1 to 4 nhere 1 = \ e n soft and 1 = en firm
(P > 0.10) ainong corn varieties for barrows than gilts (2 10 Ib versus 190 ADG. ADFI. and feed efficiency. How- Ib: P < 0.0 1). However, gilts had a ever, overall ADG (2.12 versus 1.90 greater (5 1.72% versus 49.50%: Ib) and ADFI (5.56 versus 4.81 Ib) P < 0.01) percentage of carcass fat- were greater (P < 0.0 1) in barrows than free lean compared to barrows. gilts, and overall feed efficiency was - improved (0.39 versus 0.38: P < 0.0 1 ) Longissit~lzls Mzlscle Qzlalit~. Scores in gilts than barrows. and Cotnposition
Carcass Characteristics
Real-time ultrasound and carcass measurements are summarized in Table 3. Ultrasound measurements of tenth-rib BF and LMA did not differ (P > 0.10) among corns. but tenth-rib BF was greater ( P < 0.01) in barrows (0.98 in) than gilts (0.78 in). Carcass BF (first rib. tenth rib, and last rib) measurements were similar ( P > 0.10) ainong corns, but differences (1.76, 1.16,and 1.19inversus 1.53.0.98.and 0.98 in: P < 0.0 I) between barrows and gilts for carcass first, tenth. and last rib - BF measurements, respectively were detected withno differences ( P > 0.10) in LMA. Last luinbar BF depth was influenced by corn hybrid ( P = 0.08). Pigs fed the coinmercial line RX740 (0.96 in) had a greater amount of last luinbar BF compared to pigs fed CRW0586 (0.88 in), RX670 (0.88 in), and DIC647 (0.89 in). Also, a treatment x sex interaction ( P < 0.05) was detected for last lumbar bacltfat depth. Hot carcass weight was not affected by corn hybrid, but was greater for
Longissiinus inuscle quality scores for pH: marbling and firmness: Minolta L*. a*. and b* values, and longissimus muscle composition are summarized in Table 4. Longissimus muscle qual- ity scores were not affected ( P > 0.10) by sex or corn hybrid. However, the Corn Root Worm Protected Corn (CRW0586) had a greater marbling score (2.67 versus 2.28: P < 0.05) and Minolta b* color score (2.27 versus 1.8 1 : P < 0.05) compared the two com- mercial corn varieties (DK647 and RX740). Protein. fat, and water per- centage of the longissimus muscle were similar ( P > 0.10) between bar- rows and gilts and among corns. However, a treatment x sex interaction (P < 0.05) was detected for longissi- inus inuscle water percentage. Also, the transgenic corn (CRW0586) ver- sus parental (RX670) comparison resulted in a difference (P < 0.05) in longissimus inuscle water percentage with pigs fed the transgenic corn (73.1 1 %) having less water than pigs fed the parental corn (73.62%).
and NS = ~lonsign~ficant effect. P > 0 10
narbling.
Discussion
The results indicate no significant differences ainong the corn treatments for ADG. ADFI. or feed efficiency. However, in the present study, expected sex differences between gilts and bar- rows were observed in growth perfor- mance. Recent experiments using barrows and gilts during the finishing period have shown that barrows have greater ADG and ADFI than gilts. - However, in these same experiments, gilts had superior feed efficiency com- - pared to barrows. Results of the cur- rent experiment support the results of previous experiments and indicate the same differences in ADG. ADFI. and feed efficiency between barrows and gilts.
Dietary treatment did not affect ultrasound and carcass measurements, however a difference in backfat depth between barrows and gilts was detected, with no difference in longissiinus inuscle area. The difference in bacltfat depth between barrows and gilts is supported by the results of other researchers, how- ever in those experiments gilts had greater longissimus muscle area than barrows, which is in contrast to the results of the present experiment. The similar longissiinus inuscle area between barrows and gilts may be a result of feeding the barrows and gilts the same lysine concentration throughout the four-phase growing-
2003 Yel~~*aslia SIL lrze Report - Page 22
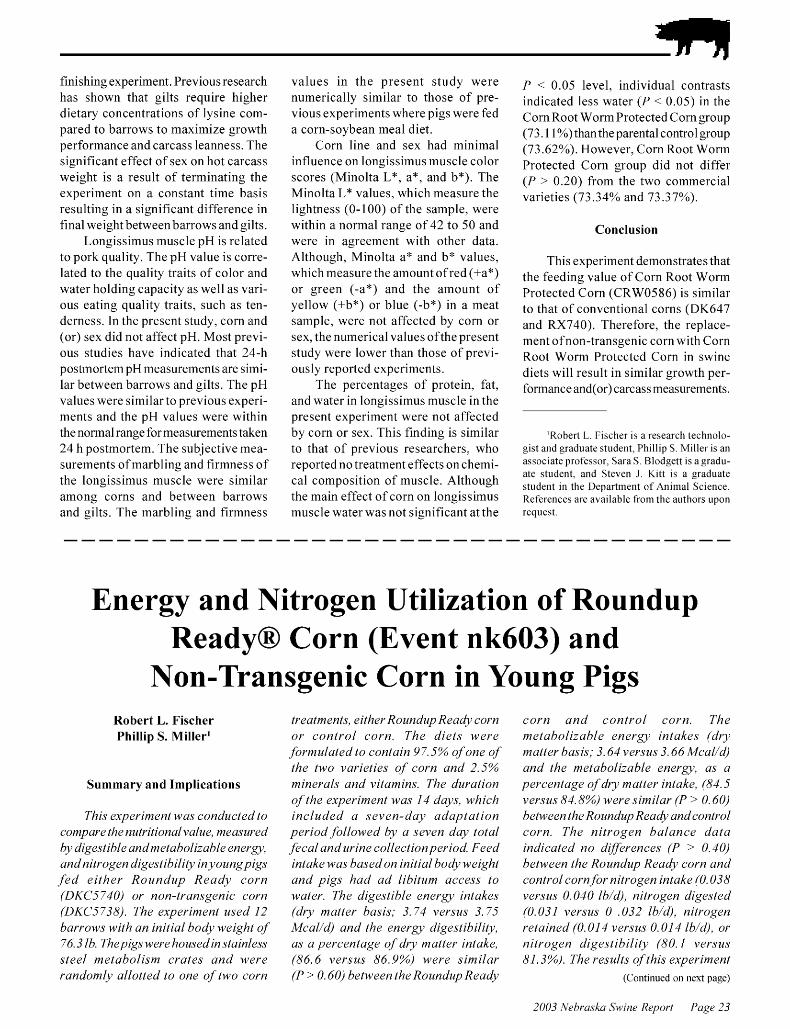
finishing experiment. Previous research has shown that gilts require higher dietary concentrations of lysine com- pared to barrows to maximize growth performance and carcass leanness. The significant effect of sex on hot carcass weight is a result of terminating the experiment on a constant time basis resulting in a significant difference in final weight between barrows and gilts.
Longissimus muscle pH is related to pork quality. The pH value is corre- lated to the quality traits of color and water holding capacity as well as vari- ous eating quality traits. such as ten- derness. In the present study. corn and (or) sex did not affect pH. Most previ- ous studies have indicated that 24-h postmortem pH measurements are simi- lar between barrows and gilts. The pH values were similar to previous experi- ments and the pH values were within the nonnal range for measurements taken 24 h postmortem. The subjective mea- surements ofinarbling and firmness of the longissimus muscle were siinilar among corns and between barrows and gilts. The marbling and firmness
values in the present study were numerically siinilar to those of pre- vious experiments where pigs were fed a corn-soybean meal diet.
Corn line and sex had minimal influence on longissimus inuscle color scores (Minolta L*. a*. and b*). The Minolta L* values, which measure the lightness (0- 100) of the sample, were within a normal range of 42 to 50 and were in agreement with other data. Although, Minolta a* and b* values, which measure the ainount ofred (+a*) or green (-a*) and the ainount of yellow (+b*) or blue (-b*) in a meat sample. were not affected by corn or sex. the numerical values ofthe present study were lower than those of previ- ously reported experiments.
The percentages of protein, fat, and water in longissimus inuscle in the present experiment were not affected by corn or sex. This finding is siinilar to that of previous researchers, who reported no treatment effects on cheini- cal composition of muscle. Although the main effect of corn on longissimus muscle water was not significant at the
P < 0.05 level, individual contrasts indicated less water ( P < 0.05) in the CornRoot WorinProtected Corngroup (73.1 1%) thanthe parental control group (73.62%). However, CornRoot Worm Protected Corn group did not differ (P > 0.20) from the two coininercial varieties (73 3 4 % and 73 37%).
Conclusion
This experiment demonstrates that the feeding value of Corn Root Worm Protected Corn (CRW0586) is siinilar to that of conventional corns (DIC647 and RX740). Therefore, the replace- ment ofnon-transgenic corn with Corn Root Worm Protected Corn in swine diets will result in siinilar growth per- foimance and(or) carcass measurements.
IRobert L Fischer is a research technolo- gist and graduate student, Ph~ll ip S M~l le r is an associate professor, Sara S Blodgett is a gradu- ate student and Stelen J K ~ t t 1s a graduate student 111 the Department of A ~ l ~ ~ l l a l Sc~ence References are aJ allable from the authors upon request
Energy and Nitrogen Utilization of Roundup Ready@ Corn (Event nk603) and
Non-Transgenic Corn in Young Pigs Robert L. Fischer Phillip S. Miller'
Summary and Implications
Thrs eyperznzent wus condztcted to conipare the nz~trztronulvalz~e, nieuszlred bjl dlge~flble andr7zetubolzzuble energq: undnrtrogen u'rgeatrbzlzt), rnj,oztngprga fed erther Rozlndztp Readjl corn (DKC5 740) or non-tranagenzc corn (DKC5738) T/7e euperznzent zlsed 12 barrolva 1c rt/7 un znztral body ~cerght of 76 3 16 Theprgs were /7oz~aedznatuznles~ ateel nietabolzar7z crutea and were ranu'onzly ullotted to one of f ie o corn
treuttnentr, elther Roundup Reudj corn or control corn The drets n ere fomz~luted to contuln 97 5% of one of the t u o varretres of corn and 2 5% nirnerals and vrtumrns The dzlrutzon of the eyperrment 11 aa 14 dajls, ~vhrch znclzlded u aeven-dajl adaptatron permd follo~ced bjl u aeven dajl totul fecal undztrzne collectronperrod Feed zntake 11 us baaedon znrtral bo4>1verg/7t and prgs /7ud ad lrbztzlr7z ucceaa to cater The dzgeatzble energjl rntukea (by nzatter buara, 3 74 verszta 3 75 Meal d) und the energql dzgestrbrlztj: us u percentage of dr~l nzatter zntake, (86 6 verszla 86 9%) Icere azmzlar (P > 0 60) befic een t/7e Rozlndzlp Ready
corn and control corn The nzetuholrruhle energj rntuker (drj nzatter harrr, 3 64verrzm 3 66 Mcal/q and the tnetabolrrahle energ), as u percentuge of dry nzatter rntake, (84 5 verszta 84 8%) were a zmzlar (P > 0 60) behveen the Rozlndztp Reudy andcontrol corn T/7e nrtrogen balance dutu znu'rcuted no dzferences (P > 0 40) be f ie een t/7e Rozindz1p Readjl corn und control corn for nztrogen rntake (0 038 verazts 0 040 Ib/u'), nztrogen u'rgeated (0 031 verszts 0 032 16 d), nrtrogen retuzned (0 014 verszla 0 014 1b d), or nrtrogen dzgeatzbrlztj~ (80 1 verazla 81 3%) The resztlts of tl7ra euperrment
(Continued on newt page)
2003 \-ebra~ha Sit rne Report - Pcge 23
rndrcute that energj and nltrogen utllrzatron 1s slnzrlur bet11 een dletr contalnlng ather the Roundup Reudj corn or non-trunsgenrc control corn 1.t hen fed to jozlng plgs Thzm, thrr trunsgenlc corn can be fed to J ozlng plgs 1.t rthozlt negatlvelj uffectrng nltrogen or energ) drgestlbllrtj
Introduction
Monsanto is developing a second generation Roundup Ready corn - containing event nk603 that has been genetically modified totolerate Roundup - (glyphosate) treatment. Researchers have demonstrated Roundup Ready corn containing event nk603 to be equivalent in composition to genetically similar, non-transgenic corn. Two previous swine finishing studies demonstrated that Roundup Ready corn containing event nk603 had similar feeding value to that of control and conventional reference varieties. In support of these findings. the current study was conducted to determine the digestible energy. metabolizable energy, and nitrogen digestibility ofRoundup Ready corn line DCK5740 in young pigs.
Procedures
Aninzuls and Treatments
Twelve crossbred [Danbred x (Danbred x Nebraska White Line)] barrows with an average initial body weight of 76.3 Ib were used in a completely randomized design. Two diets were formulated to contain 97.5% ofone oftwo varieties ofcorn (Roundup Ready corn: DCK5740 or non- transgenic control corn: DCK5738) and 2.5% minerals and vitamins (Table 1). Amino acid composition of the two corn lines is documented in Table 2. Diets were formulated such that the test grainwas the only source ofprotein and energy. Diets were fortified with vitamins and minerals to meet or exceed the NRC (1998) requirements for 45- lb pigs. Pigs were housed in stainless steel metabolism crates (4.9 x 1.6 ft) that allowed separate collection of feces and urine. The pigs were housed in an
Table 1. Ingredient and chemical composition of diets, as-fed basis.
Item ~ ~ ~ 5 7 1 0 " ~ ~ ~ 5 7 3 8 "
Ingredient. % Corn Dicalcium phosphate Limestone Salt Vitaliiin premix Trace mineral premix
Chemical composition Dr) mattere. % Crude proteine. % Gross energ)e. Mcal/l;g CalciLlmf. % ~1iosphorLls'. %
' b ~ C 5 7 1 0 - Ro~~ndup Read) corn and DKC5738 - control corn. b ~ m i n o acid composition of the tno corn ~arieties shonn in Table 2. C~upplied per p o ~ ~ n d of complete feed in grouer diets, retin11 acetate. 1.995 111. cholecalciferol. 200 IU: a-tocopherol acetate. 1 1 IU: menadione sodium bisulfite. 1.6 mg: riboflab in. 1.0 mg. d-pa~itothenic acid. 8.0 mg. niacin. 12.0 mg: bitamin B . 12.0 yg.
12 '~Llpplied per pound of complete feed In finisher diets, retiql acetate. 1.500 111. cholecalciferol. I50 IU: a-tocopherol acetate. 8.2 IU. menadione sodium bisulfite. 1.2 mg. riboflabin. 3.0 mg: d-pantothenic acid. 6.0 mg. niacin. 9.0 mg: bitamin B . 9.0 yg.
12 e~na l )zed b alues. f Calculated balues.
Table 2. .Amino acid analjsis of indi\idual ingredients, as-fed basis.
Corn
Item DKC5710 " DKC5738 "
Amino acids. % Alanine Arginine Aspartic acid C) stine Glutamic acid Gllcine Histidine Isoleucine Leucine L) sine Metliionine Plien) lalaliine Serine Threonine T)rosine Valine
' ? ~ 1 < ~ 5 7 1 0 - Rou~ldup Ready corn and DKC5738 -
environmentally controlled room and allowed ad libitum access to water through a nipple waterer.
Duta and Sunzple Collection
Pigs were fed in two equal feedings daily (at 0800 and 1700 hours) in a
control corn
mash form. The metabolism study consisted of a seven-day adjustment period to facilities and diets followed by a seven-day period of separate but total collection of feces and urine. During the seven-day adjustment period, a daily feed intake equivalent to 3.75% ofinitial body weight was achieved and
2003 Yel~~*aslia SIL lrze Report - Page 2 1

Table 3. Energy and nitrogen balancea.
Item ~ ~ ~ 5 7 1 0 " DkC5738 " SEM p - ~ a l u e
No p ~ g s
I n ~ t ~ a l x\e~glit. Ib
F~nal neight lb
Dn matter ~ntal,e/d. Ib
Apparent dr) matter d~gestlb~llt) % 88 40 88 76 0 156 N 5
Gross energ! intake, Mcalld 4 71 4 87 0 224 NS
Apparent d~gestlble energ) Intake. Mcalld 3 71 3 75 0 023 N 5
Apparent d~gestlble energ) % of DM Intake 86 69 86 98 0 555 N 5
Metabolizable enera intake. Mcalld 3 61 3 66 0 024 NS
Metabol~zal>le energ). % of DM Intake 8 1 59 84 86 0 518 N 5
Apparent d~gestlble energ) M~all lb d 1 63 l 56 0 098 N 5
Metabolizable energx , Mcalllb I 5 9 I 53 0 094 NS
N~trogen Intake Ibld 0 038 0 040 0 002 N 5
Nltrogen d~gested Ibld 0 031 0 032 0 001 N 5
N~trogen retained, lbld 0 011 0 014 0 001 NS
Nltrogen d~gestlblllt) % 80 16 81 37 1 106 N 5
Nltrogen retention % of Intake 31 92 35 92 1 153 NC,
N~trogen retent~on, % of absorbed 43 57 1 4 15 1316 NS
"he pigs nere housed in stamless steel metabolism crates and nere randoml! allotted to one of h ~ o corn treatnlents The durat~on of the e\periment n as I4 da! s x\hich ~ncluded a 7-da! adaptatloll per~od follon ed b! a 7-da! total fecal and urine collect~o~l per~od Feed intake \\as based on 111it1al BIT (3 75%) and p ~ g s had ad llbitum access to nater b ~ ~ ~ i 7 4 0 - Roundup Read! corn and DKCi738 - control corn 'NS = nons~gnificant effect, P > 0 10 d~pparel l t d~gest~ble and metabolizable energ! calculated on a 100% corn basis
maintained throughout the seven-day collection period. Fecal and urine collections started at 0800 hour on day seven and ended at 0800 hour on day 14 of the experimental period. Total feces were collected, weighed, coinposited for each pig, and stored at 0°F until subsequent analyses. Urine was collected once daily into a plastic bottle containing 25 inL of 6 N HC1. Eachinorning the urine collection from the previous day was strained through glass wool to remove particulate matter and a 10% aliquot was retained, recorded, coinposited for each pig, and stored fi-ozen at 0°F.
Statistical Anuljsis
Data were analyzed as a completely randomized design using PROC MIXED of SAS (1999). The main effect in the statistical model was genetic corn line (DCIC5740 and DCIC5738). In all analyses crate was the experimental unit.
Results and Discussion
Dry inatter percentage. crude protein percentage. and gross energy density of the two corn varieties were similar (Table 1). The digestibility of dry inatter was similar between the corn varieties 88.40 and 88.76%: P >
0.50: Table 3). Daily grossenergyintake on a dry-matter basis was siinilar between the two corn varieties. The digestible and metabolizable energy intakes (3.74 versus 3.75 Mcalld: and 3.64 versus 3.66 Mcal/d: respectively) were siinilar ( P > 0.60) between corn varieties. Expressed as a percentage of dry matter intake. digestible and metabolizable energy (86.69 versus 86.98% and 84.59 versus 84.86%: respectively) were similar ( P > 0.60) between the corn varieties. The values calculated in this experiment for dry matter digestibility, digestible energy as a percentage of dry matter intake, and metabolizable energy as a percentage of dry inatter intake are similartopreviouslypublished values.
Total nitrogen intake was siinilar (P > 0.60) between the corn varieties (Table 3). The amount of nitrogen digested (0.03 1 and 0.032 Ibld) and retained (0.014 and 0.014 Ibld) were siinilar ( P > 0.60) between the corn varieties. Also. nitrogen digestibility (80.16 and 81.37%: P > 0.40) was similar between the two corn varieties. The values for nitrogen digestibility of the corn varietiesused in this experiment are siinilar to the values published previously for corn.
In conclusion, results of energy and nitrogen balance with growing pigs demonstrate that the feeding value of Roundup Ready corn (DKC5740) is equivalent to that ofthe non-transgenic control variety (DKC5738). Therefore, Roundup Ready@ corn can be used in swine diets without negatively affecting energy and(or) nitrogen digestibility.
'Robert L Flscher I S aresearch technolog~st and graduate student and Phillip S Miller is an associate professor ~ n t h e Department ofAn1111a1 Science References a\ ailable from the authors upon request
f i R o u ~ l d u p and Roundup Read) are registered trademarks ofMonsanto Technolog) LLC
2003 \-ebra~ha Sit rne Report - Pclge 25

Effect of a Low Phytate, Nutrient Dense Corn on Pig Performance
Michael C. Brumm'
Summary and Implications
An experrtnent 11 as condzlcted to deternzrne the efects of a loll phj tate, nzltrlent dense corn barre0 onplgper- fomance, fecal phosphorzm and fecal nltrogen Experrnzentaltreatt~~entr 1.1 ere I) corn-soj bean tneal drets fortnuluted 1.1 rth pz~rchased j el lo~t corn, 2) rlnzl- lar dretr fornzulated 11 rth 500 FTU/kg phjtase, 3) d ~ e t s fortnulated 1.t rth a nzltrlent dense corn Iqarletj ha~.lng re- dzlcedphj trc acrd, ele~qated lj rrne, and hrgher energ) cotnparedtoj ello~i corn, and 4) d ~ e t s fornzulated~t ~ t h the nutrr- ent denre corn Iqarletj andphjtase at 500 FTU/kg to 130 lb B W and blended 1.1 ~ t h j el lo~t corn thereafier bared on er t~t~~uteda~~a~lablephorphorz~r There 1.t ar no dfference In darlj garn or darlj feed for prgr fed the normal j el lo~i corn dlets n rth or n lthozlt phj tare or thenutrrent dense corn11 rthoutphj tare HOII eIqer, %then phj fuse n as added to the nzltrrent denre cornj'?om arrr~.al to 130 lb and the ertrtnuted a ~ a ~ l a b l e phorphorzlr n as balanced bj blendrng nornzal j el lo~t corn and the nutrlent dense cornj'?om 130 16 to slaz~ghte~; dadj galn and darlj feed rntake n ere redzlced Phorphate In the fecer 1.t ar redzlced for all dretr cotnpared to the j el lo~t corn dret 1.1 rthoutphj tase Ho~t - eIqer, nltrogen 1.t ar rncreared In the fecer fionz prgr fed dretr contarnrng t/7e nzltrrent den5 e corn due to zts hrgher crztdeprotezn con~puredtoj~ello~c corn T/7e~e resztlts szlggeJt that 1cl7en dzet~ ure forr~zzllated on an eqztul lysrne, energy und uvurluble p/7osphorzls ba- J Z J , prgs /7uve J zn~zlarperfornzunce for dzets formz~lated~vrthj~ello~v corn, ye/- /ole corn p / z t~ phjltase and u nzttrrent den5 e corn vurret])' However, the5 e r e ~ z l l t ~ do not szlpport blendrng ofyel- lo~c corn und t/7e nzttrzent dense varz- et), bused on uvazluble p/7o~phorzt~ content Fzlrther re5 earch Z J ~varrunted
to deternzine the cause for the depres- sion in dailj. gain and daily feed re- ported for this treatnzent.
Introduction
A majority of the phosphorus in corn and soybean meal is in the form of phytic acid. a form relatively unavail- able to pigs and other nonruminant animals. There is a growing awareness of the amount of phosphorus in swine manure that comes fi-om this undigested phytate phosphorus. An increasing number of regulatory agencies regu- late land application of stored swine manure based on the total phosphorus content of the manure and the crop removal of this applied phosphorus. These factors have led to increased usage of phytase in swine diets, which increases the digestibility of phytate phosphorus and reduces the amount of phosphorus in the manure by as much as 30%. Plant breeders have also re- leased corn and soybean varieties that have a lower percentage of their total phosphorus in the phytate form. result- ing in an estimated increase in the amount ofdigestible phosphorus. Breeders are also developing cereal grain varieties with elevated lysine and energy com- pared to yellow corn. The purpose of the following experiment was to deter- mine the impact of a nutrient dense, low phytate corn variety and phytase on pig performance and fecal nutrient content when included in grower-fin- isher diets.
Methods
The experiment was conducted at the University of Nebraslta's Hasltell Ag Lab Swine Researchunit near Con- cord,Neb. DanbredUSA (Seward,Neb.) terminal crossbred barrows (192 pigs) were housed in two naturally venti- lated, partially slatted confinement fa- cilities. Each pen measured 6 x 15 ft
and had 12 pigs (7.5 ft'lpig). Each pen had one two-hole wean-to-finish feeder located on the slatted portion of the pen and one nipple drinker located immediately adjacent to the feeder.
There were two replications ofeach experimental treatment in each facil- ity, for a total of four replications per treatment. Experimental treatments were:
1) Corn-soybean meal diets for- mulated with yellow corn pur- chased at the feed mill (YC):
2) Diets similar to treatment 1 formulated with 500 FTUIkg phytase (YC+Phy):
3) Diets forinulated with anutri- ent dense. low phytate corn variety (Nutridense-LP) (LP):
4) Diets forinulated with Nutridense-LP and either 500 FTUlkgphytase or normal corn based on total dietary digest- iblephosphorus levels (LP+).
For treatment LP+, phytase was added to Nutridense-LP corn based diets for pigs from arrival to 130 Ib BW. For diets fed from 80 to 130 Ib, the increased available phosphorus estimate for the Nutridense-LP grain, when combined with phytase, meant no dicalcium phosphate was necessary to meet the estimated available phos- phorus requirement of the barrows (Table 2). The diet was forinulated for pigs from 130 lb to slaughter with a blend of Nutridense-LP corn and nor- mal yellow corn to meet the estimated available phosphorus need of finishing barrows (Table 3).
Diets were formulated according to the recoininendations of the Univer- sity of Nebraska for pigs of high lean gain potential. Lysine concentrations were forinulated to be 1.10% from ar- rival to 80 lb BW, 0.97% from 80 to 130 lb, 0.77% ffom 130 to 190 lb and 0.62% ffom 190 lb to slaughter (259
2003 Yel~~*aslia SIL lrze Report - Page 26
Table 1. Ingredient profiles used to formulate experimental diets.
Nutrient
ME. I;cal/lb 1555 1612 1536 3800 Crude protein. % 8.3 10.0 16.5 L) sine. % 0.26 0.3 1 2.91 Calci~~rn. % 0.03 0.03 0.31 Phosphorus. %
Total 0.28 0.32 0.69 A\ ailable 0.01 0.22 0.16
'hebrasl;a and S o ~ ~ t h Dakota Suine Nutrition Guide. EC95-273. Cooperatibe Extension. Unibersit) of Nebraska. Lincoln. b ~ x ~ e e d Genetics. LLC.. Decatur. IL. 'SBM = solbean meal. d ~ e e d Energ) Compan). Des Moines. IA.
Table 2. Experimental diets from arribal to 130 Ib bod) weight.
Ingredient, Iblton Yello\\ corn Nutr~dense LP con? 5o)bean meal 1 6 5% CP Dlcalclum phosphate
1 8 5 % P Calcium carbonate L-I) s~ne-HCI 5alt V~taniln premlx Trace m~neral premlr FatL Nat~lplios 600-bd
Calculated composition ME. I,cal/lb Crude proteln % L) slne. % Total P. % A\ all P. %' Total Ca. %
Anallzed composition f
Crude roteln. % Ca. %
P P %' L)s~ne % P1i)tase. F T U I I ~ ~ ~
'?YC = d~ets formulated \ \ ~ t h )ello\\ con1 to Unnerslt) of Nebraslca recommendat~ons. YC+Ph) = dlets torm~llated \ \~t l i )ello\\ corn and 500 FTUIkg ph)tase. LP = dlets for~iiulated ~11th N~ltrldense LP to Uni\ erslt! of Nebraska recommendations LP+ = d~ets formulated \\it11 Nutr~dense LP and 500 FTU/l,g ph!tase Exseed Genetics, LLC Decatur IL
'Feed Energ! Co Des Moines, IA d~~~~ Inc , Mt Olne NJ 07828 '~ncludes phi-tase alailable P credit for YC+Plq and LP+ d~ets h'ard Laboratones, Kearne! , Neb
lb). The estimated composition of the switched on the week individual pens feedstuffs used to formulate the ex- achieved their target weight. periinental diets is presented in Table Within lysine concentration, all 1 and the diets are presented in Tables diets were formulated to contain the 2 and 3. All diets contained 100 g/T same energy, lysine and calcium Tylan from arrival to 80 lb BW and 40 amounts. Natuphos 600-G (BASF Inc) g /T Tylan thereafter. Diets were was added to provide 500 FTU/kg of
phytase activity and the total available phosphorus concentration ofthe corn- soybean meal diets was credited for 0.1 % digestible phosphorus from phytase addition. There was no adjust- ment made to calcium, lysine or energy with the addition of the phytase to the experimental diets.
At arrival, pigs were ear tagged, individually weighed and assigned to experimental treatments. Weight blocks were not used in the assignment ofpigs to treatments. Pigs were vaccinated for erysipelas. M hjo and H purusz~u. All pigs that died during the experiment were examined for cause of death by a consulting veterinarian. Pen size was not adjusted when apig death occurred.
On every Wednesday during the experiment, a fecal sample was col- lected from the slatted floor portion of every pen and immediately frozen. At the completion of the experiment, the fecal samples were submitted to acoin- mercial laboratory for determination of nitrogen and phosphorus content.
The pen of pigs was the experi- mental unit for all statistical analysis. Results were analyzed using the ProcMix procedure of SAS (SAS Institute, Cary, NC). The model included building as a random effect. Experimental diets were in the model as fixed effects. Final weight was used as a covariate for analysis of carcass data.
Results and Discussion
The calcium concentration of the diets for pigs was greaterthan expected. The trace mineral premix contained 23% to 27% calcium versus no cal- cium in previous trace mineral premixes used at the research center. Thus. the total dietary calcium was elevated 0.06% for pigs from arrival to 80 lb, 0.05% for pigs from 80 to 130 lb, 0.04% for pigs from 130 to 190 lb and 0.03% for pigs from 190 lb to slaughter com- pared to the calculated analysis pre- sented in Tables 2 and 3.
There was no effect of experimen- tal treatments on death loss, with only one pig dying on the YC+Phy, LP and LP+ treatments, respectively. There was no death loss for the YC treatment.
(Cont~nued on next page)
2003 \-ebra~ha Sit rne Report - Pcge 27
The 0 to 36 day interval was cho- sen for calculation of pig performance because it represented the time period when all of the pigs on the LP+ treat- ment were fed experimental diets for- mulated with phytase. There was no effect of experimental treatments on pig weight, daily gain, daily feed in- take or feed conversion efficiency for the 0 to 36 day period (Table 4).
Pig weight on day 98 was lowest for pigs fed LP+ diet. Compared with pigs fed the LP diet. daily gain was slower for the 36 to 98 day period (P =
0.086) and overall (P = 0.104). While there was an improvement in feed con- version for LP+ versus LP diet for the 36 to 98 day period. feed intake was depressed. Overall there was no differ- ence in feed conversion. but the de- pression in daily feed remained.
There was no difference in daily gain for YC versus LP for any of the time periods reported. However, pigs fed LP diet had an increase (P = 0.094) in daily feed for the 36 to 98 day period, resulting in a poorer feed con- version compared with pigs fed YC diet. This poorer feed conversion dur- ing this period resulted in apoorer feed conversion overall for the LP versus YC fed pigs.
When formulated on a lysine ba- sis. diets containing Nutridense LP were higher in crude protein content than diets forinulated with yellow corn (Tables 2 and 3). This higher crude protein resulted in an increase in fecal nitrogen percentage for pigs fed LP versus YC. There was a decrease in fecal phosphate content for YC+Phy and LP compared with YC. Fecal phos- phate was reduced in the LP+ versus the LP fed pigs. Treatment LP+ had the lowest fecal phosphate content. This suggests that if one of the goals of diet forinulation is to reduce fecal phos- phate, diets forinulated using the nutri- ent dense, low phytate variety should be formulated on an available phos- phorus basis using both phytase and yellow corn similar to the LP+ treat- ment. Phytase additions to diets for- mulated with yellow corn (YC + Phy) was also effective in reducing fecal phosphate.
Unlike previous research results,
Table 3. Experimental diets from 130 Ib bod? weight to slaughter.
Ingredient, Iblton Yello\\ con1 1597.5 1602.8 200 Nutridense LP con? 1687.5 1182.5 So)bea~i meal. 16.5% CP 305 305 270 270 Dicalcium phosphate
18.5% P 1 1 1 0 0 Calcium carbonate 17 23 26 26 L-I) sine-HCI 3 3 3 3 Salt 6 6 6 6 Vitalnin premix 1.25 1.25 1.25 1.25 Trace mineral premix 3.25 3.25 3.25 3.25 at^ 50 17 5 Nat~lphos 600-c ;~ 1.7
C:alcolated composition ME. I;cal/lb 1571 1570 1567 1567 Crude protein. % 13.9 13.9 11.9 11.7 L) sine. % 0.77 0.77 0.77 0.77 Total P. % 0.16 0.37 0.36 0.36 A\ ail P. %' 0.19 0.19 0.21 0.19 Total Ca. % 0.55 0.55 0.55 0.55
f .Analyzed composition Crude protein. % 15.0 11.2 15.7 15.0 Ca. % 0.77 0.66 0.59 0.61 P. % 0.19 0.39 0.36 0.31 L) sine. % 0.73 0.77 0.66 0.77 Particle size. microns 88 1 927 7 1 1 713
'?C = dlets formulated \\lth )ello\\ con1 to Unnerslt) of Nebraslta recommendations YC+Ph) = dlets torm~llated \ \~t l i )ello\\ corn and 500 FTUIkg ph)tase LP = dlets for~iiulated ~11th N~ltrldense LP to IJnnerslt) of Nebraslta re~ommendatlons LP+ = dlets formulated \\ltIi N ~ ~ t r ~ d e n s e LP and YC to an a \a~lable P e q ~ ~ a l to YC dlets b ~ \ s e e d Genetlcs LLC Decatur IL 'Feed Energ) Co Des Molnes IA d ~ ~ $ ~ Inc Mt O l n e N l 07828 ' l n~ l~ ldes phltase a\allable P ~ r e d l t tor YC+Ph) dlets 'M ard Laboratories Kearlie) Neb
in this experiment pigs fed diets for- mulated with phytase (YC + Phy) had an increase in backfat, resulting in a decrease in carcass lean percentage at slaughter compared with YC fed pigs (Table 5 ) . There was no difference in backfat, loin depth. or carcass lean percentage for the YC versus LP fed pigs or LP versus LP+ fed pigs.
For the first 36 days of the experi- ment, there was no effect of experi- mental treatment on pig perforinance. Pigs fed diets formulated with either corn source performed similarly. How- ever, from day 36 to day 98, pigs fed diets containing a blend of yellow corn and the nutrient dense variety (LP+) grew slower than pigs fed diets con- taining either normal corn (YC) or the nutrient dense variety (LP).
The reason for the decrease in daily feed for the LP+ versus LP fed pigs is
unclear. especially since feed intake for LP versus YC fed pigs increased for the 36 to 98 day period. The LP+ diets contained 10% and 28.8% YC for the 130 to 190 Ib and 190 Ib to market periods. versus 74.1% and 60.2% LP corn. respectively for the same periods (Table 3). This blending of corn types should not have reduced intake to a point lower than either corn type alone.
Conclusion
When diets were formulated on a equal lysine, energy and available phos- phorus basis, pigs had similar daily gain for diets forinulated with yellow corn, yellow corn plus phytase and Nutridense LP. However, there was a depression in daily gain for pigs fed diets forinulated with Nutridense LP corn blended with yellow corn to an
2003 Yel~~*aslia SIL lrze Report - Page 28
Table 4. Effect of experimental diets on pig performance and fecal nutrient content.
Contrast P \ al~les
Item
Y C Y C LP D ~ e t a g treatments" \ s \ s \ s
YC YC+Ph) LP L P+ 5E Treatment YC+Ph) LP LP-I
No pens 1
Pig \ \e~ght Ib lnltlal 61 8 d 36 126 6 d 98 251 2
A\ erage dad) galn Ib 0 - d 3 6 1 80 d 36 - d 98 2 01 0 - d 9 8 1 93
A\ erage dad) feed Ib 0 - d 3 6 3 59 d 36 - d 98 6 08 0 - d 9 8 5 17
Feed galn 0 - d 3 6 2 00 d 36 - d 98 3 03 0 - d 9 8 2 68
Fe'al n~~tr lent 'ontent dm baslsd Nltrogen % 3 99 Phosphate % 1 3 7
%YC = d~ets foniiulated \ \ ~ t h )ello\\ 'on1 to IJnnerslt) of Nebraska recommendat~ons YC+Pli) = dlets for~iiulated \ \~t l i )ello\\ ~ o r n and 500 FTlJ/l,g ph)tase LP = dlets torm~llated \ \ ~ t h N~~t r~dense LP to Unl\erslt) ot Nebraska re~ommendatlons LP+ = dlets toniiulated \ \~t l i Nutr~dense LP and 500 FTUIkg p1i)tase to 130 Ib tollo\\ed b) d~ets for~iiulated on aballable phosphorus basls \ \~t l i a blend ot )ello\\ corn and Nutr~dense LP b ~ 5 = ~ o t s~gnlficant ( P > o 1) 'IBP In' Mad~son Neb 'U ard Laboratories Kearne) Neb merage ot \\eel,l) samples
Table 5. Effect of experime~~tal diets on carcass traits, least squares means.
Contrast P values
YC YC LP Dletan treatmentsa 1s 1s 1s
Item YC YC+Pll> LP LP+ SE Treatment YC+Ph! LP LP+
BacMat inh 0 71 0 79 0 72 0 76 0 02 0 080 0 013 NS' NS
Loin depth ulb 2 73 2 67 2 71 2 63 0 05 0 038 NS NS NS
Carcass lean %%" 55 1 51 8 55 1 51 9 0 2 <0 001 0 023 NS NS
"YC = diets formulated \\it11 ! ellom corn to Unn ersit! ofNebraska reco~ll~llendatio~ls. YC+Ph! = d~ets formulated ~11th !ellon corn and 500 FTUIkg ph!tase. LP = dlets tor~iiulated n ~ t h Nutr~dense LP to Unnerslb ot Nebraska recommendatlons LP+ = dlets tormulated n ~ t h Nutr~dense LP and 500 FTUIhg phltase to I30 Ib tollo\\ed b) d~ets for~iiulated on aballable phosphorus basls \ \~t l i a blend ot )ello\\ corn and Nutr~dense LP b~ollected at IBP Inc Madlson Neb 'N$ = Not slgn~ficant (P > 0 1)
equivalent available phosphorus basis. Based on pig performance, these re- sults do not support blending ofyellow corn and Nutridense LP corn in swine diets based on available phosphorus content, and further research is war- ranted to determine the cause for the depression in daily gain reported for this treatment.
Fecal phosphate was similar for and phytase and Nutridense LP corn pigs fed diets formulated with either and yellow corn on an available phos- yellow corn and phytase or Nutridense phorus basis LP corn, and both of these treatments were lower than phosphate from pigs fed diets formulated with yellow corn l M ~ c l ~ a e l C Brumm is a professor and
and dicalcium phosphate, ~~~~l phos- E-~tension snine s p e c ~ a l ~ s t at the Northeast Research and E-Itension Center Concord Neb
phate was lowest for pigs fed diets formulated with Nutridense LP corn
2003 \-ebra~ha Sit rne Report - Pcge 29
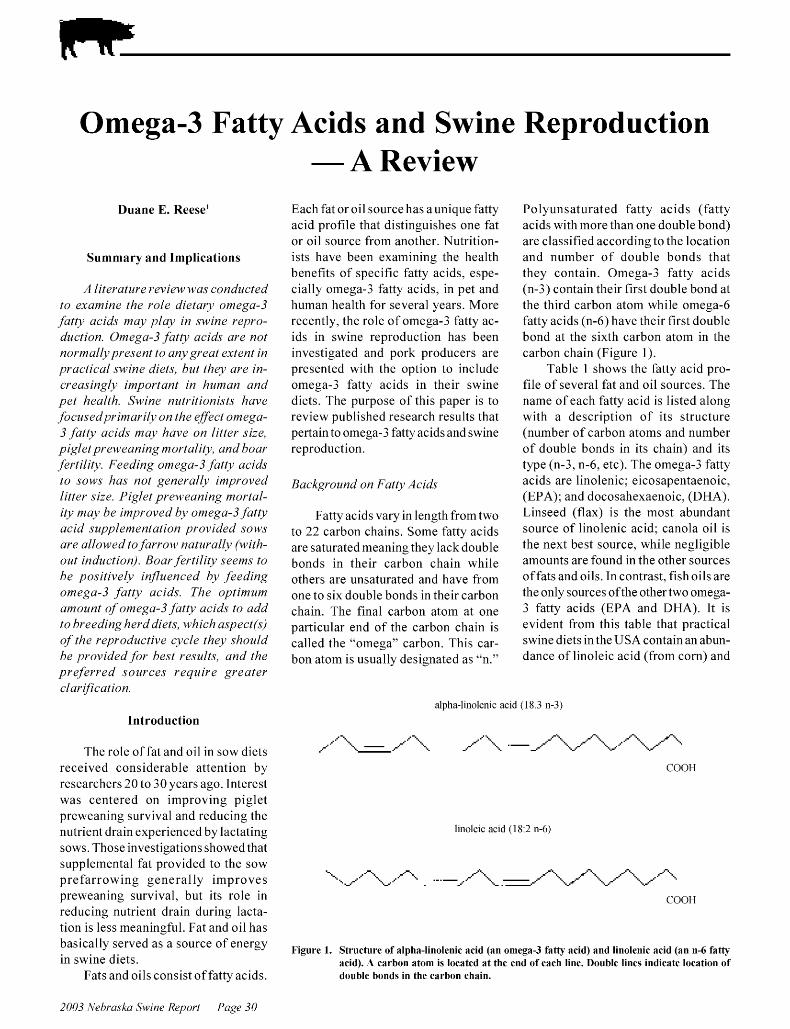
Omega3 Fatty Acids and Swine Reproduction - A Review
Duane E. Reese'
Summary and Implications
A literature re1.lel.t ~ . t ar conducted to exanzrne the role dretarj onzega-3 fattj acrdr nzaj plaj rn s ~ t lne repro- dzlctron Ot~~ega-3 fattj aclds are not nornzallj prerent to an) great extent rn practical s ~ t lne d~e t r , but thej are rn- crearlnglj rtnportant rn hunzan and pet health S1.t rne nzltrltlonlsts have focuredprrnzar~lj on the e fec t otnega- 3 fato aclds tnaj ha1.e on lltter sce , plgletpreli eanlng tnortalrtj, and boar fertllrtj Feedlng o t~~ega-3 fattj acrdr to rolls har not generallj ~tnproved litter size Prglet prelt eanrng tnortal- rtj nzaj be rnzpro~vd bj onzega-3 fato acrd rz~ppletnentatron pro~qlded s o ~ t r are a1lol.t ed to farro~t naturallj (11 rth- out ~ndzlctlon) Boar fertllro seenzs to be porrtl~.elj lnjlzlenced bj feedrng o t ~ ~ e g a - 3 fattj acrdr The optrtnunz atnount of onzega-3 fattj aclds to add to breedlng herdd~ets, n hlch aspect(r) of the reprodzlctrve cj cle thej rhould be pro~qlded for bert reszllts, and the preferred rourcer reqz~lre greater clarrficatron
Each fat or oil source has aunique fatty acid profile that distinguishes one fat or oil source from another. Nutrition- ists have been examining the health benefits of specific fatty acids. espe- cially omega-3 fatty acids. in pet and human health for several years. More recently. the role of omega-3 fatty ac- ids in swine reproduction has been investigated and pork producers are presented with the option to include omega-3 fatty acids in their swine diets. The purpose of this paper is to review published research results that pertain to omega-3 fatty acids and swine reproduction.
Background on Fatfi. Acids
Fatty acids vary in length from two to 22 carbon chains. Some fatty acids are saturated meaning they lackdouble bonds in their carbon chain while others are unsaturated and have from one to six double bonds in their carbon chain. The final carbon atom at one particular end of the carbon chain is called the "omega" carbon. This car- bon atom is usually designated as "n."
Polyunsaturated fatty acids (fatty acids with more than one double bond) are classified according to the location and number of double bonds that they contain. Omega-3 fatty acids (n-3) contain their first double bond at the third carbon atom while omega-6 fatty acids (n-6) have their first double bond at the sixth carbon atom in the carbon chain (Figure 1).
Table 1 shows the fatty acid pro- file of several fat and oil sources. The name of each fatty acid is listed along with a description of its structure (number of carbon atoms and number of double bonds in its chain) and its type (n-3. n-6. etc). The omega-3 fatty acids are linolenic: eicosapentaenoic, (EPA): and docosahexaenoic. (DHA). Linseed (flax) is the most abundant source of linolenic acid: canola oil is the next best source, while negligible amounts are found in the other sources offats and oils. In contrast. fish oils are the only sources ofthe other two oinega- 3 fatty acids (EPA and DHA). It is evident from this table that practical swine diets in the USA contain an abun- dance of linoleic acid (from corn) and
alpha-linolenic acid ( 1 8.3 n-3)
Introduction .> -. .> -. / '.
,?,. / '.., - ?,.2 '.., /.#. '.., , - # . f .s'.'.. .-k ,,w,>. ,.',., , f ,s-'...
The role of fat and oil in sow diets - 1. '.S
received considerable attention by COOH
researchers 20 to 30 years ago. Interest was centered on improving piglet preweaning survival and reducing the nutrient drain experienced by lactating I~nole~c ac~d (1 8 2 n-6)
sows. Those investigations showed that supplemental fat provided to the sow
'1.. ,,L,,2.~.'-~~,,,2, / ,,--,,. . - . - ,.s"'.., prefarrowing generally improves >.. x, --.# ./".. ',/ --? .,,-<,, J-F',~ ,,w#. r,",,,
preweaning survival, but its role in COOH reducing nutrient drain during lacta- tion is less meaningful. Fat and oil has
served as a of energy Figure 1. Strt~cture of alpha-linolenic acid (an omega-3 fattj acid) and linolenic acid (an n-6 fattj in swine diets. acid). A carbon atom is located at the end of each line. Double lines indicate location of
Fats and oils consist of fatty acids. double bonds in the carbon chain.
2003 Yel~~*aslia SIL lrze Report - Page 30
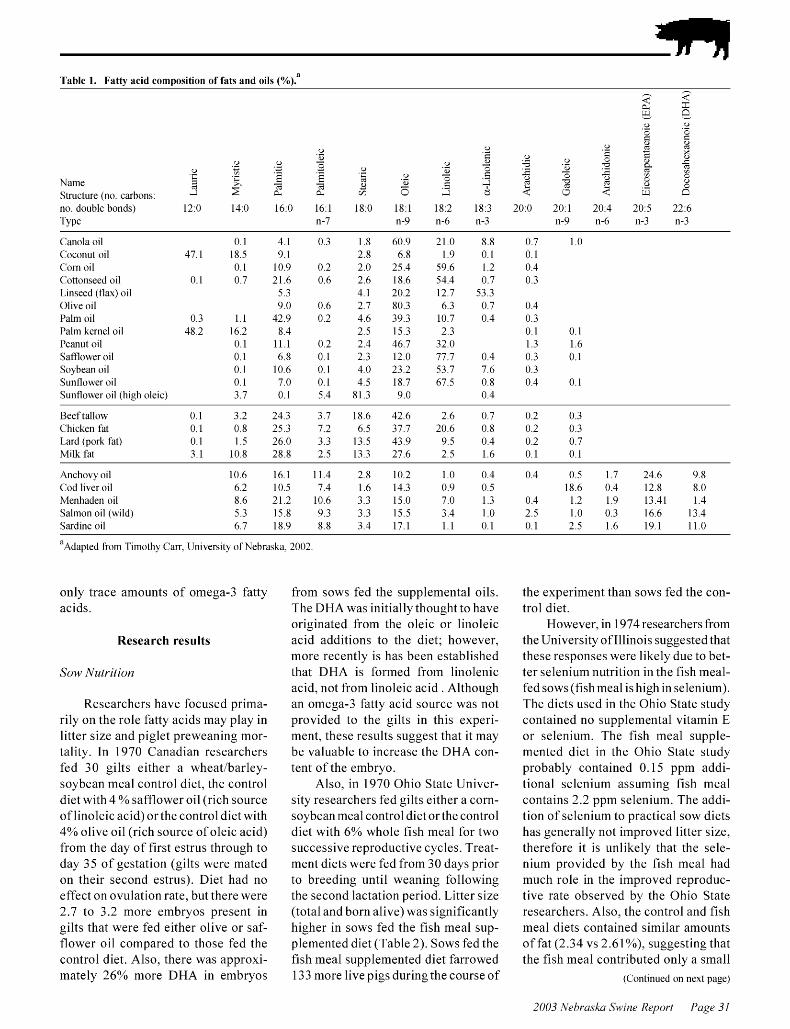
Table 1. Fattj acid composition of fats and oils (%).a
2 1 $ - C1 -
no. d o ~ ~ b l e bonds) 12:0 l1:O 16.0 16:l 18:O 18:l 18:2 18:3 20:O 20.1 20.1 20.5 22.6 T) pe n-7 n-9 n-6 n-3 n-9 n-6 n-3 n-3
Canola oil Coconut oil Con1 oil Cottonseed oil Linseed (flaw) oil Oli\e oil Palm oil Palm Iternel oil Peanut oil Safflouer oil So) bean oil S~lnflo\\er oil S~~nflo\\er oil (high
0.1 1 . 1 0.3 1.8 17.1 18.5 9.1 2.8
0.1 10.9 0.2 2.0 0.1 0.7 21.6 0.6 2.6
5.3 1 . 1 9.0 0.6 2.7
0.3 1 .1 12.9 0.2 1 .6 18.2 16.2 8 .1 2.5
0.1 1 1 . 1 0.2 2.1 0.1 6.8 0.1 2.3 0.1 10.6 0.1 1.0 0.1 7.0 0.1 1.5
oleic) 3.7 0.1 5.1 81.3
Beef tallo\\ 0.1 3.2 21.3 3.7 18.6 12.6 2.6 0.7 0.2 0.3 C1iicl;en fat 0.1 0.8 25.3 7.2 6.5 37.7 20.6 0.8 0.2 0.3 Lard (pork fat) 0.1 1.5 26.0 3.3 13.5 13.9 9.5 0.1 0.2 0.7 Mill; fat 3.1 10.8 28.8 2.5 13.3 27.6 2.5 1.6 0.1 0.1
Ancho\) o ~ l Cod Iner o ~ l Menhaden o ~ l Salmon o ~ l ( \ \~ ld) Sard~ne o ~ l
%dapted from T~moth) Carr. Unnerslt) of Nebraska 2002
only trace amounts of omega-3 fatty acids.
Research results
Researchers have focused prima- rily on the role fatty acids may play in litter size and piglet preweaning inor- tality. In 1970 Canadian researchers fed 30 gilts either a wheatlbarley- soybean ineal control diet, the control diet with 4 % safflower oil (rich source of linoleic acid) or the control diet with 4% olive oil (rich source of oleic acid) from the day of first estrus through to day 35 of gestation (gilts were mated on their second estrus). Diet had no effect on ovulation rate, but there were 2.7 to 3.2 more embryos present in gilts that were fed either olive or saf- flower oil compared to those fed the control diet. Also, there was approxi- mately 26% more DHA in embryos
from sows fed the supplemental oils. The DHA was initially thought to have originated from the oleic or linoleic acid additions to the diet: however, more recently is has been established that DHA is formed from linolenic acid. not from linoleic acid. Although an omega-3 fatty acid source was not provided to the gilts in this experi- ment, these results suggest that it may be valuable to increase the DHA con- tent of the embryo.
Also, in 1970 Ohio State Univer- sity researchers fed gilts either a corn- soybeanmeal control diet or the control diet with 6% whole fish meal for two successive reproductive cycles. Treat- ment diets were fed from 30 days prior to breeding until weaning following the second lactation period. Litter size (total and born alive) was significantly higher in sows fed the fish ineal sup- plemented diet (Table 2). Sows fed the fish ineal supplemented diet farrowed 133 more live pigs during the course of
the experiment than sows fed the con- trol diet.
However, in 1974 researchers from the University of Illinois suggested that these responses were likely due to bet- ter selenium nutrition in the fish meal- fed sows (fish ineal is high in selenium). The diets used in the Ohio State study contained no supplemental vitamin E or selenium. The fish meal supple- mented diet in the Ohio State study probably contained 0.15 ppin addi- tional selenium assuming fish ineal contains 2.2 ppin selenium. The addi- tion of selenium to practical sow diets has generally not improved litter size, therefore it is unliltely that the sele- nium provided by the fish ineal had much role in the improved reproduc- tive rate observed by the Ohio State researchers. Also, the control and fish ineal diets contained similar amounts offat (2.34 vs 2.61%), suggesting that the fish meal contributed only a small
(Continued on newt page)
2003 \-ebra~ha Sit rne Report - Pcge 31
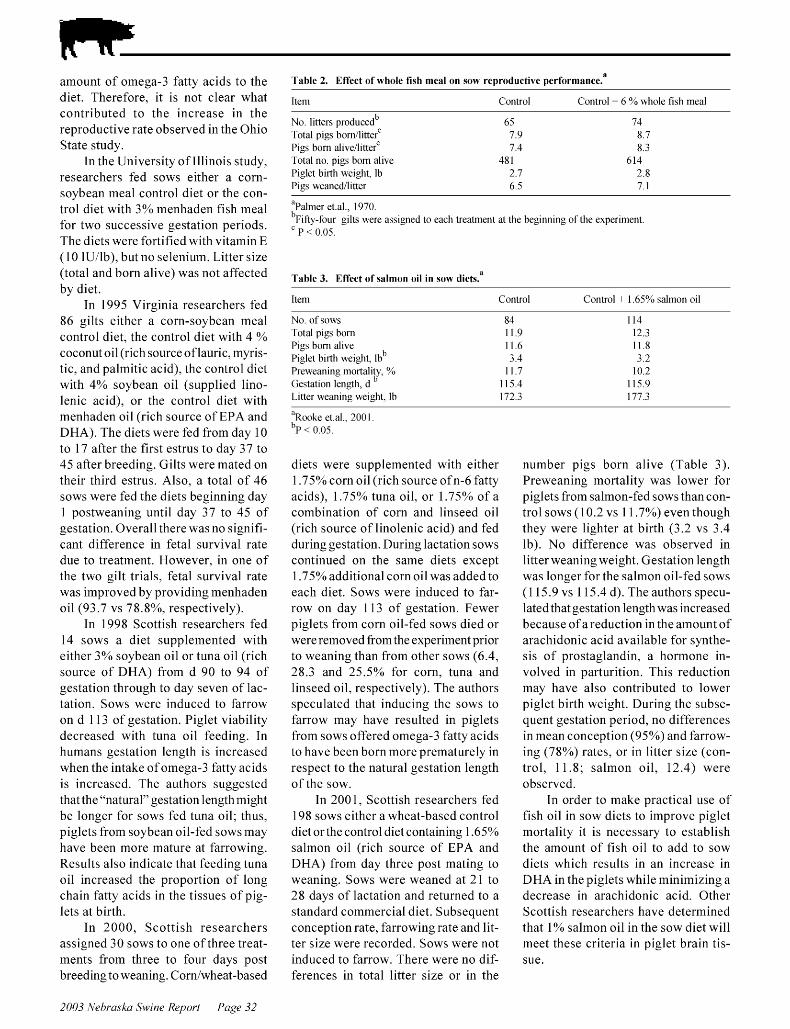
ainount of omega-3 fatty acids to the diet. Therefore, it is not clear what contributed to the increase in the reproductive rate observed in the Ohio State study.
In the University of Illinois study, researchers fed sows either a corn- soybean meal control diet or the con- trol diet with 3% menhaden fish ineal for two successive gestation periods. The diets were fortified with vitamin E (1 0 IUIlb). but no selenium. Litter size (total and born alive) was not affected by diet.
In 1995 Virginia researchers fed 86 gilts either a corn-soybean ineal control diet. the control diet with 4 % coconut oil (rich source of lauric. inyris- tic. and palmitic acid). the control diet with 4% soybean oil (supplied lino- lenic acid). or the control diet with menhaden oil (rich source of EPA and DHA). The diets were fed from day 10 to 17 after the first estrus to day 37 to 45 after breeding. Gilts were mated on their third estrus. Also. a total of 46 sows were fed the diets beginning day 1 postweaning until day 37 to 45 of gestation. Overall there was no signifi- - cant difference in fetal survival rate due to treatment. However. in one of the two gilt trials. fetal survival rate was improved by providing menhaden oil (93.7 vs 78.8%. respectively).
In 1998 Scottish researchers fed 14 sows a diet supplemented with either 3% soybean oil or tuna oil (rich source of DHA) from d 90 to 94 of gestation through to day seven of lac- - tation. Sows were induced to farrow on d 1 13 of gestation. Piglet viability decreased with tuna oil feeding. In humans gestation length is increased when the intake of omega-3 fatty acids is increased. The authors suggested that the "natural" gestation length might be longer for sows fed tuna oil; thus, piglets from soybean oil-fed sows may have been more mature at farrowing. Results also indicate that feeding tuna oil increased the proportion of long chain fatty acids in the tissues of pig- lets at birth.
In 2000, Scottish researchers assigned 30 sows to one of three treat- ments from three to four days post breeding to weaning. Cornlwheat-based
Table 2. Effect of whole fish meal on sow reproducti\e performance.a
Item Control Control + 6 % \\hole fish meal
No. litters prodLlcedb Total pigs born/litterC Pigs born ali\e/litterC Total no. pigs born ali\e Piglet birth \\eight. Ib Pigs \\eaned/litter
"almer et al 1970 b~lft)-foLlr gilts \\ere asslgned to each treatment at the beglnnlng ofthe experiment ' P < O O ~
Table 3. Effect of salmon oil in so\\ diets.'
Item Control Control + 1.65% salmon oil
No of so\\s Total p ~ g s born P~gs bom all\ e P~glet blrth \ \e~ght lbb Pre\\ean~ng mortal~t\ % Gestation lengh d b'
L~tter \\eanlng ne~ght . Ib
diets were supplemented with either 1.75% corn oil (rich source ofn-6 fatty acids). 1.75% tuna oil. or 1.75% of a combination of corn and linseed oil (rich source of linolenic acid) and fed during gestation. During lactation sows continued on the same diets except 1.75% additional corn oil was added to each diet. Sows were induced to far- row on day 1 13 of gestation. Fewer piglets from corn oil-fed sows died or were removed from the experiment prior to weaning than from other sows (6.4, 28.3 and 25.5% for corn, tuna and linseed oil, respectively). The authors speculated that inducing the sows to farrow may have resulted in piglets from sows offered omega-3 fatty acids to have been born more prematurely in respect to the natural gestation length of the sow.
In 200 1, Scottish researchers fed 198 sows either a wheat-based control diet orthe control diet containing 1.65% salmon oil (rich source of EPA and DHA) from day three post mating to weaning. Sows were weaned at 2 1 to 28 days of lactation and returned to a standard commercial diet. Subsequent conception rate, farrowing rate and lit- ter size were recorded. Sows were not induced to farrow. There were no dif- ferences in total litter size or in the
number pigs born alive (Table 3). Preweaning mortality was lower for piglets from salmon-fed sows than con- trol sows (I 0.2 vs 1 1.7%) even though they were lighter at birth (3.2 vs 3.4 Ib). No difference was observed in litter weaning weight. Gestation length was longer for the salmon oil-fed sows (1 15.9 vs 1 15.4 d). The authors specu- lated that gestation length was increased because ofareduction in the ainount of arachidonic acid available for synthe- sis of prostaglandin. a hormone in- volved in parturition. This reduction may have also contributed to lower piglet birth weight. During the subse- quent gestation period. no differences in mean conception (95%) and farrow- ing (78%) rates. or in litter size (con- trol. 11.8: salmon oil, 12.4) were observed.
In order to inalte practical use of fish oil in sow diets to improve piglet mortality it is necessary to establish the amount of fish oil to add to sow diets which results in an increase in DHA in the piglets while minimizing a decrease in arachidonic acid. Other Scottish researchers have determined that 1% salmon oil in the sow diet will meet these criteria in piglet brain tis- sue.
2003 Yel~~*aslia SIL lrze Report - Page 32

Boar Nz~trition
Pig spermatozoa contains a sig- nificant ainount of DHA. It is probable that DHA is essential for optimal fer- tility in the boar. Supplemention of boar diets with omega-3 fatty acids may improve sperm characteristics and litter size. That has been the focus of four studies.
In 1999, Norwegian researchers used 29 boars to determine the effect of a daily dose of 75 ml of cod liver oil (source of EPA and DHA) on resis- tance to cold shock and on freezability ofboar semen. Cod liver oil was supple- mented for 12 weeks. The concentra- tion of DHA increased in the semen from boars given the cod liver oil from 25.5 to 32. I%: no change in the fatty acid composition of seinen from the unsupplemented boars was observed. Despite the higher content of DHA in the semen from cod liver oil-fed boars, their seinen did notwithstand cold shock or freeze better than that from control boars.
In 200 1 British researchersrepoi-ted feeding 35 boars a diet with or without a supplement containing DHA and spe- cific antioxidants (PROSPERMTh'). Due to the large number of double bonds in long chain. polyunsaturated fatty acids, an antioxidant is necessary to prevent oxygen from attacking the double bonds and altering the biologi- cal activity of the fatty acid. Four hun- dred and seventy-eight gilts were artificially inseminated with seinen either from boars that received the dietary supplement or those that did not. Significant improvements were observed for conception rate (control, 83%: supplemented. 90%). number of pigs born alive (control, 10.2; supple- mented, 10.6), and the number of pigs born alive per 100 services (control, 846; supplemented, 954). The supple- ment increased the proportion of DHA in boar spermatozoa.
In 2001, Brit ish and Italian researchers reported feeding 14 boars a diet with or without supplemental DHA and antioxidants (PROSPERMTh') for 16 weeks. Sperm concentration increased (571 vs 695 million sperm cells per ml) when the supplement
was provided. Similar to the previous study, the supplement increased the ainount of DHA in spermatozoa.
Scottish researchers in 2001 fed 10 boars either a barleylwheat- rapeseed control diet or the control diet supplemented with 3% tuna oil. Both diets were supplemented with approximately 295 ppm a-tocopherol acetate (vitamin E) to serve as an anti- oxidant. Semen was collected at week 0.3.5. and 6 following initiation ofthe study. Tunaoil increased sperinviabil- ity and the proportion of spermatozoa with progressive motility and normal acrosome score. Also. tuna oil increased the proportion of DHA in sperm after 5 and 6 weeks of feeding.
In the studies where PROSPERMT" was provided to boars it is unclear which component ofthe product (DHA or the antioxidants) contributed to the observed improvement in seinen char- acteristics and reproductive perfor- mance. The Scottish work, where the only variable in the study was the level of tuna oil in the diet. does suggest a role for supplemental DHA in the diet of boars.
Sjwthesis of EPA and DH,4 fionz Linolenic Acid
It is interesting from a scientific and practical standpoint to knowwhether pigs can make sufficient quantities of EPA and DHA from linolenic acid. If pigs can elongate linolenic acid suffi- ciently, porkproducers could feed flax- seed or soybean oil and expect similar results to feeding fish oil. Some researchers have examined if piglet tissue levels of EPA and DHA are increased to the same extent byprovid- ing them preformed in the sow's diet vs adding linolenic acid to the diet. Vir- ginia researchers concluded that the developing fetus was not able to elon- gate soybean oil linolenic acid and it was unable to obtain the same level of EPA and DHA from soybean oil as it did from menhaden oil. A subsequent trial in Scotland concluded that offer- ing linseed oil as a source of linolenic acid to sows was ineffective at increas- ing EPA and DHA concentration in piglets. Therefore, to maximize ben-
efits that EPA and DHA may impart on litter size and piglet mortality, it seems necessary to add them preformed to the diet. In practical situations. that can be accomplished only by adding fish oil or fish products to the diet.
Onzega-3 fatty acid stability
As mentioned previously. omega- 3 fatty acids are unstable and therefore easily loose their biological activity if not protected by antioxidants such as vitamin E or ethoxyquin. In soine of research reviewed for this report, it is clear that attention was given to pro- tect the omega-3 fatty acids from oxi- dation. It is possible that soine of the variability observed in the response to omega-3 fatty acids in the published literature is due to differences in how well the omega-3 fatty acid sources were stabilized.
Conclusion
Omega-3 fatty acids appear to influence some aspects of swine repro- duction. Given the large body of infor- mation that is available on the role of omega-3 fatty acids in humans and pets, it is becoming evident that the decision to add fat or oil to sow and boar diets should be based on more than just an energy source consid- eration. However, until results from studies that involve hundreds of sows or boars fed corn and soybean meal-based diets supplemented with omega-3 fatty acids are published, it is difficult to establish the economic value of omega-3 fatty acid supple- ments for sows and boars. Additional clarification is needed for: I) the opti- mum ainount of omega-3 fatty acids to add to breeding herd diets, 2) which aspect(s) of the reproductive cycle omega-3 fatty acids should be pro- vided to enhance reproductive per- formance and piglet survival, and 3) the preferred sources of omega-3 fatty acids.
IDuane E Reese 1s extens~on sn ine special- ist In the Departnlent of A n ~ m a l Sciences References are alailable from the author b? request
2003 \-ebra~ha Sit rne Report - Pcge 33
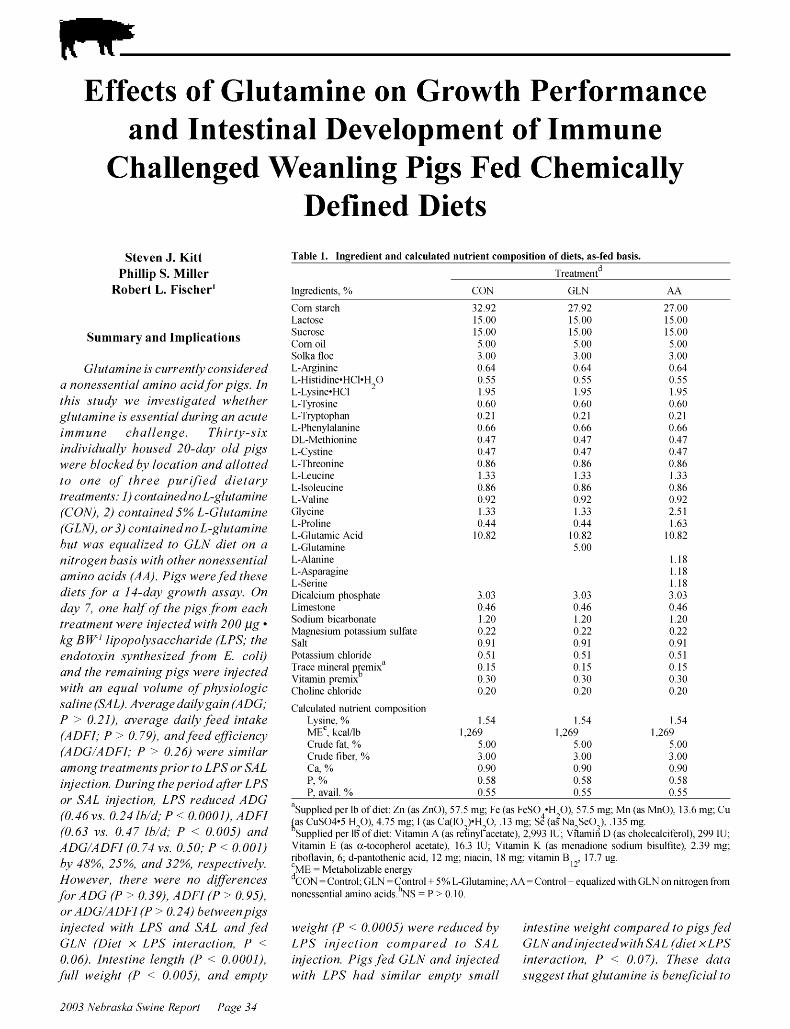
Effects of Glutamine on Growth Performance and Intestinal Development of Immune
Challenged Weanling Pigs Fed Chemically Defined Diets
Steven J. Kitt Table 1. Ingredient and calculated nutrient composition of diets, as-fed basis.
Phillip S. Miller Treat~lle~lt d
Robert L. Fischer' Ingredients, % CON GLN AA
Corn starch Lactose
Summary and Implications Sucrose Con1 011 Solha floc
Glutanzine u cz~rrenth considered L-Arglnlne
a nonessential amino acidfor pigs In : : ~ $ ~ ~ : ~ ~ l ' ~ ' 1 . ~ 2 0
this study 1t.e investigated n,hether L - T ~ ~ ~ ~ ~ ~ ~ glutatnlne rs ersentlal dzlrlng an aczlte L-Tnptopha~l
rtnnzune challenge Thlrtj -srx L-Phen'lalanlne DL-Meth~on~ne
rndl~.rdzlallj houred 20-daj old prgr L - c \ ~ ~ ~ ~ ~ ~ 1.1 ere blocked bj locatlon and allotted L-Threonlne
to one of three pzrrfred d i e t a g : : ~ ~ ~ l ~ ~ n e
treattnentr I) contalnedno L-glzltat~~me L - v ~ ~ ~ ~ ~
(CON), 2) contalned 5% L-Glutanzlne (GLN), or 3) contarnedno L-glzltanzrne bzlt ?tar equallred to GLN dret on a nrtrogen basls 1.1 rth other nonersentlul atnlno aclds (4A) Plgr n ere fed there dlets for a 14-daj groli th arraj On daj 7, one half of the plgsfi.ot71 each treattnent 11 ere ~njected 1.t rth 200 pg kg B W ' lrpopolj saccharide (LPS, the endotoxln sj nthesaed fi.ot71 E coll) and the retnarnrng plgs 11 ere rnjected 1.1 rth an eqzlal ~.olutne of phj rrologlc ralrne (SAL) Average darlj garn (ADG, P > 0 21), aIqerage darlj feed lntake (ADFI, P > 0 79), andfeed ej'jicrencj (ADG/ADFI, P > 0 26) ~ t e r e rlnzllar atnong treattnentrprror to LPS or SAL znjectzon Dztrrng the perrod after LPS or SAL rnjectzon, LPS redzlced ADG (0 46 vs 0 24 Ib/d, P < 0 0001), ADFI (0 63 va 0 47 Ib/d, P < 0 005) und ADG ADFI (0 74 va 0 50, P < 0 001) by 48%, 25%, and 32%, reapectrvelj~ Holvevel; there were no drfferencea for ADG (P > 0 39), ADFI (P > 0 95), or ADG/ADFI (P > 0 24) be f ie eenpzga znjected 1vrt/7 LPS and SAL und fed GLN (Dzet x LPS rnteractzon, P < 0 06) Intestrne length (P < 0 0001), fit11 ~vezght (P < 0 005), und e n l p ~ ,
G l ~ c i n e 1.33 1.33 2.5 1 L-Proline 0.11 0.11 1.63 L-Glutamic Acid 10.82 10.82 10.82 L-Glutamine 5.00 L-Alanine 1.18 L-Asparagine 1.18 L-Serine 1.18 Dicalcium phosphate 3.03 3.03 3.03 Limestone 0.16 0.16 0.16 Sodium bicarbonate 1 20 1.20 1.20 Magnesium potassium sulfate 0.22 0.22 0.22 Salt 0.91 0.91 0.91 Potassi~lm chloride 0.5 1 0.51 0.51 Trace ~lli~leral premixa 0.15 0.15 0.15 Vita~nin 0.30 0.30 0.30 Choline chloride 0 20 0 20 0.20
Calculated nutrient composition Lysine, % 1 54 1.54 1.51 ME'. Itcalllb 1.269 1.269 1.269 C n ~ d e fat. % 5.00 5 00 5 00 Crude fiber. % 3.00 3.00 3.00 Ca, % 0 90 0.90 0.90 P. % 0.58 0.58 0.58 P. mail. % 0.55 0.55 0.55
"Supplied per Ib of diet. Zn (as ZnO). 57.5 mg. Fe (as FeS04.H20). 57.5 mg. Mn (as MnO). 13.6 mg: CLI CuSO1.5 H-0). 4.75 mg: I (as Ca(I0-).H-0. I3 mg: Se (as Na-SeO-), I35 mg.
S~lpplled per Ilfof diet. Vita~nin A (as re?in)lLacetate). 2.993 111. vitami; D (as cholecalciferol). 299 IU: Vitamin E (as a-tocopherol acetate), 16.3 IU: Vitamin I< (as menadione sodiu~n bisulfite), 2 39 mg: ribofla! in. 6. d-pantothenic acid. 12 mg: niacin. 18 mg. I itamin B . 17.7 ug.
12 'ME = Metabolizable e n e r a d CON =Control: GLN =Control + 5% L-Gl~~ta~nine. AA = Control +equalized \I it11 GLN on nitrogen from nonessential a~n ino a c i d s . " ~ ~ = P > 0.10.
~cleight (P < 0.0005) 1c1ere redzlced by intestine weight conlpared to pigs,fed LPS injection conzpured to SAL GLNundinjected~vith SAL (diet xLPS injection. Pigs ,fed GLN and injected interuction, P < 0.07). These u'atu 1clit/7 LPS /7ud similar en7ptj1 snzull suggest thut glzttunzine is benefi'ciul to
2003 Yel~~*aslia SIL lrze Report - Page 3 1
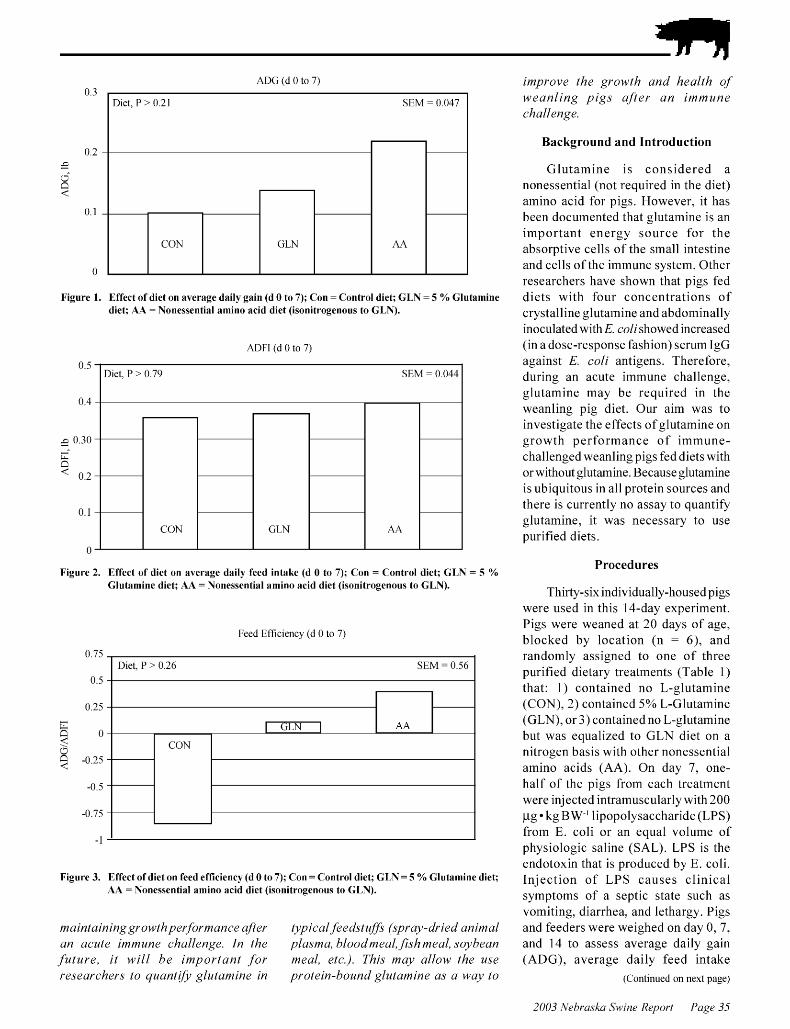
ADG (d 0 to 7) 0.3
Figure 1. Effect of diet on merage dailj gain (d 0 to 7); Con =Control diet; GLN = 5 % Glntamine diet; A A = \onessential amino acid diet (isonitrogenous to GLN).
Diet. P > 0.21 SEM = 0.017
ADFI (d 0 to 7)
0 5 Diet P > 0 79 SEM = 0 041
Fignre 2. Effect of diet on merage dail) feed intalte (d 0 to 7); Con = Control diet; GL\ = 5 % Glntamine diet; A A = \onessential amino acid diet (isonitrogenons to GL\).
AA CON
Feed Efficiency (d 0 to 7)
GLN
I Diet, P > 0 26 SEM = 0 56 I
Figure 3. Effect of diet on feed efficiencj (d 0 to 7); Con = Control diet; GL\ = 5 % Glutamine diet; ;tl = \onessential amino acid diet (isonitrogenous to GLN).
177arntuinrnggr01c~thperforrnance uffer tjprcul feedstzlffs (spruy-dried animul un ucztte rnznzztne chullenge. In t/7e plaanzu, bloodnzeul, f i h nzeul, sojlbean fzltzlre, rt ~clrll be inzportunt for n;leul, etc.) Thrs r7zaj1 allo~v t/7e ztae reaeurchers to qztantrfjl glzltanzine in protern-bound glzltamine ua u ~ v u y to
inzpro1.e the gron,th and health of u<eanling pigs after an itnnzune challenge.
Background and Introduction
Glutainine is considered a nonessential (not required in the diet) ainino acid for pigs. However. it has been documented that glutainine is an important energy source for the absorptive cells of the small intestine and cells of the iminune system. Other researchers have shown that pigs fed diets with four concentrations of crystalline glutainine and abdominally inoculated with E. coll showed increased (in a dose-response fashion) serum IgG against E C O I L antigens. Therefore, during an acute iminune challenge, glutainine may be required in the - weanling pig diet. Our aim was to investigate the effects of glutamine on growth performance of immune- challenged weanling pigs fed diets with orwithout glutainine. Because glutamine is ubiquitous in all protein sources and there is currently no assay to quantify glutamine, it was necessary to use - purified diets.
Procedures
Thirty-six individually-housed pigs were used in this 14-day experiment. Pigs were weaned at 20 days of age, blocked by location (n = 6). and randomly assigned to one of three purified dietary treatments (Table 1) that: 1 ) contained no L-glutamine (CON), 2) contained 5% L-Glutainine (GLN), or 3) contained no L-glutamine but was equalized to GLN diet on a nitrogen basis with other nonessential ainino acids (AA). On day 7 , one- half of the pigs from each treatment were injected intramuscularly with 200 yg kg BW-' lipopolysaccharide (LPS) from E. coli or an equal volume of physiologic saline (SAL). LPS is the endotoxin that is produced by E. coli. Injection of LPS causes clinical symptoms of a septic state such as vomiting, diarrhea, and lethargy. Pigs and feeders were weighed on day 0 , 7 , and 14 to assess average daily gain (ADG), average daily feed intalte
(Cont~nued on newt page)
2003 \-ebra~ha Sit rne Report - Pcge 35

Table 2. Da\ 0 to 14 combined gronth nerformance and small intestine characteristics at d a ~ 14.
CON" GLN' AA' P a~ue"
Criteria. units sALd LPS' SAL LPS SAL LPS SEM Diet LPS Diet xLPS
ADGf d 0 to 1 1 Ib 0 2 6 015 025 027 0 3 1 0 2 0 0 0 6 NC, < 0 0 5 N5 ADFI' d 0 to 11 lb 053 038 012 051 0 5 0 0 1 2 0 0 1 N 5 N 5 < 0 0 5 ADGIADFI d 0 to 1 1 -019 0 2 0 0 1 2 0 3 1 0 6 0 0 1 1 0 1 0 N 5 NC, NC, 51iiall ~n te s t~ne length m 1018 8 9 2 1011 951 1051 9 1 3 0 2 9 NC, <00001 N5 51iiall ~n te s t~ne tull \\t g 29233 22950 28167 29083 31067 25667 1631 < 0 0 9 < 0 0 0 5 < 0 0 3 51iiall Intestlne empt\ \\t g 33115 25800 32783 31100 35800 25733 1831 N 5 < 0 0005 < 0 07
"ON = Control diet. b~~~ = 5% glutallline diet. 'AA = Nonessential aliiino acid diet (isonitrogenous %AL = Saline ilijection. 'LPS = Lipopo1)saccharide injection. f ADG = alerage dail) gain.
'ADFI = alerage dail) feed intake. I1 NS=P>O.IO.
(ADFI), and feed efficiency (ADGI ADFI). On day 14, all pigs were anesthetized. the body cavity was opened, and the small intestine was removed. After samples were collected from the sinall intestine, pigs were euthanized. The sinall intestine length, full (including feed) intestine weight, and empty intestine weight were recorded.
Results and Discussion
During days 0 to 7, diet did not affect ADG (Figure 1: P > 0.21). ADFI (Figure 2: P > 0.79). or ADGIADFI (Figure 3: P > 0.26). This suggests that pigs do not possess adietaryrequireinent for glutainine in situations where the immune system is not vigorously activated.
After the LPS injection (day 8 to 14). pigs grew 48% slower (Figure 4: P < 0.0001) compared to pigs injected with SAL. Additionally. LPS reduced ADFI (Figure 5: P < 0.005) and ADGI ADFI (Figure 6: P < 0.00 1) by 25 and 32%. respectively. Pigs fed GLN and injected with LPS had similar ADG (P > 0.39), ADFI (P > 0.95), and ADGI ADFI (P > 0.24) compared to pigs fed GLN and injected with SAL (Diet x
LPS; P < 0.06). Average daily gain was decreased
(P < 0.05) by LPS versus SAL during days 0 to 14 (Table 2). However, LPS did not decrease feed efficiency (P > 0.64) of pigs when days 0 to 7 and 8 to14 were combined. Pigs fed GLN and injected with LPS had greater ADFI compared pigs fed GLN and injected
to GLN)
ADG (d 8 to 11)
Figure 4. Effect of diet and immune challenge on a\ erage dail? gain (d 8 to 14); Con= Control diet; GLN= 5 % Glutamine diet; A;i=Nonessential amino acid diet (isonitrogenous to GL\); SAL = Saline injection; LPS = Lipopol?saccharide injection.
u.u
0.5
0.1 f.
8 0.3 Q
0.2
0. I
ADFI (d 8 to 11)
I Diet P > 0.72: LPS, P < 0 005: Diet x LPS. P < 0.06 SEM = 0.055 I
Fignre 5. Effect of diet and immune challenge on merage dail? feed intahe (d 8 to 14); Con = Control diet; GL\ = 5 % Glntamine diet; -\A = \onessential amino acid diet (isonitrogenous to GLN); S-\L = Saline injection; LPS = Lipopoljsaccharide injection.
Diet. P > 0.11: LPS, P < 0.0001: Diet x LPS, P< 0.02
with SAL during days 0 to 14; whereas, Injecting pigs with LPS caused a pigs fed AA and CON and injected 12 % reduction (P < 0.0001) in small with LPS had decreased ADFI (LPS x intestine length compared to pigs Diet, P < 0.05). injected with SAL (Table 2). Pigs fed
AA SAL
2003 Yel~~*aslia SIL lrze Report - Page 36
SEM = 0.055
A A LPS
CON SAL
GLN SAL
CON LPS
GLN LPS
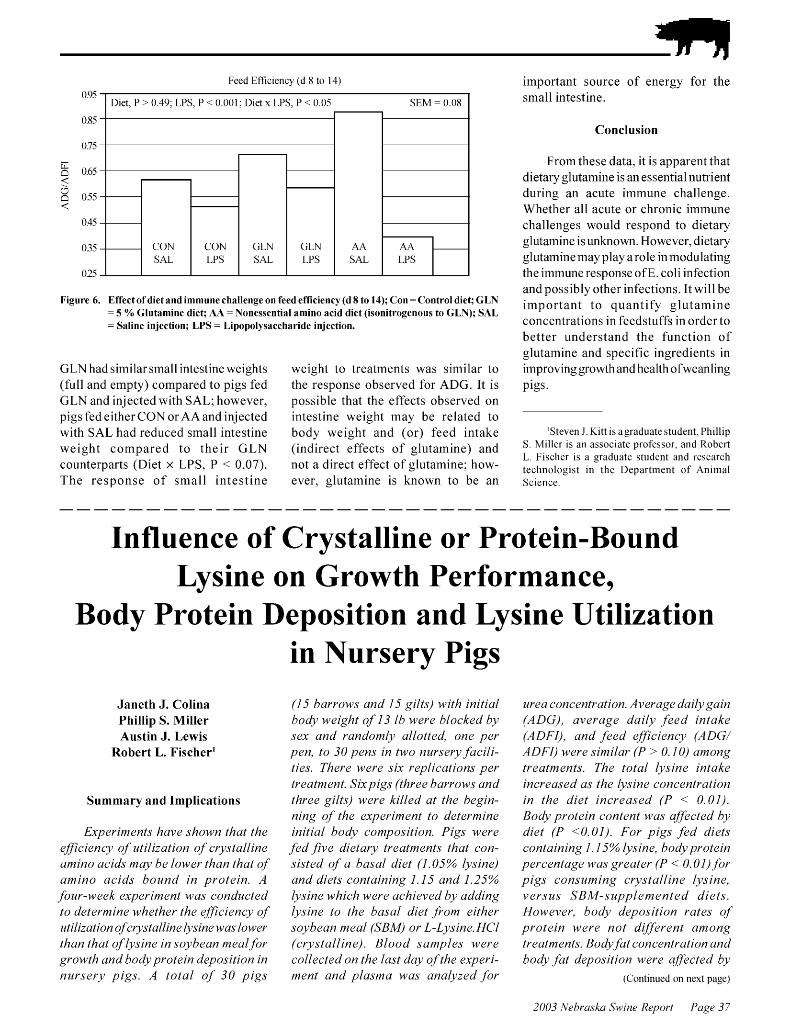
Feed Effic~enc) (d 8 to 11) ".7.>
0.85
Figure
Diet. P > 0.49: LPS. P < 0.001: Diet x LPS. P < 0 05 SEM = 0.08
- L c 0.65 Q 1
D c 0.55 Q
0.45
0.35
025
6. Effect of diet and immune challenge on feed efficiencj (d 8 to 11); Con = Control diet; GLN = 5 % Glutamine diet; ;tl = \onessential amino acid diet (isonitrogenous to GL\); S;IL = Saline injection; LPS = Lipopol>saccharide injection.
GLN had similar small intestine weights (full and empty) compared to pigs fed GLN and injected with SAL: however, pigs fed either CON or AA and injected with SAL had reduced small intestine weight compared to the i r GLN counterparts (Diet x LPS, P < 0.07). The response o f small intest ine
weight to treatments was similar to the response observed for ADG. It is possible that the effects observed on intestine weight may be related to body weight and (or) feed intake (indirect effects of glutamine) and not a direct effect of glutamine: how- ever. glutamine is known to be an
important source of energy for the small intestine.
AA SAL
CON SAL
Conclusion
AA LPS
GLN SAL
CON LPS
From these data. it is apparent that dietaryglutamine is an essential nutrient during an acute iminune challenge. Whether all acute or chronic iminune challenges would respond to dietary glutamine isunknown. However. dietary - glutainine may play arole in modulating - the iinmuneresponse of E. coli infection
GLN LPS
and possibly other infections. It will be impor tant t o quant i fy g lu tamine concentrations in feedstuffs in order to better understand the function of glutamine and specific ingredients in - improving growth and health ofweanling pigs.
'Stel en J . Kitt is agraduatestudent. Phillip S . Miller is an associate professor. and Robert L . Fisclier is a graduate student and research technologist in the Department of Animal Science.
Influence of Crystalline or Protein-Bound Lysine on Growth Performance,
Body Protein Deposition and Lysine Utilization in Nursery Pigs
Janeth J. Colina Phillip S. Miller Austin J. Lewis
Robert L. Fischer'
Summary and Implications
Experinzents have shown thut t/7e eficiencjl qf zttilizution of crj~stulline unzino acids niuy be lon~er thun thut qf umino ucids boztnd in protein. A ,foztr-~cleek experiment ~clas condzlcted to determine whether t/7e efjciency qf zttilization ofcrj~stulline Iqaine~vus lower thun that of !flqlsine in soybeun niea1,for gron~th und bodjlprotein deposition in nursery pigs. A totul of 30 pigs
(15 barrons and 15 grlts) n rth rnrtlul bodj 1.1 elght of 13 lb n ere blocked bj rex and randonzlj allotted, one per pen, to 30 pens In t1.t o nz~rrerj facllr- tler There 11 ere srx repllcatlonr per treutment Szvprgs (three barrows and three grlts) were kzlled ut t/7e begzn- nrng of the experzment to determrne znztral body conipoaztron Pzga ~c ere fed five dzetuy treatnzents thut con- arated of a busal dzet (1 05% Iysrne) und dzets conturnrng 1 15 and 1 25% Ij~szne ~vhrch ~c ere uchreved by uddzng Iysrne to the buaal dret Font erther soybean nzeal (SBM) or L-Ljlazne HCl (cr~~at~I1zne) Blood auniplea ~c ere collected on the luat dajl of the experz- nient and pIua17za ~caa unulj~red for
urea concentration. Average dailj,gain (ADG), average daily feed intake (il DFI), and feed efficiencj. (ADG/ ADFI) nzre sinzilar (P > 0.10) anzong treatments. The total 1j.sine intake increused as t/7e Ijlsine concentrution in the diet increused (P < 0.01). Body protein content ~clas qfected by diet (P <0.01). For pigs ,fed diets contuining 1.15% Iysine, body protein percentuge IVUS greuter (P < O.Ol),for pigs conszlming crj~stalline ljlsine, versus SBM-sztpplenzented diets. Hon~ever, body deposition rutes of protein 1c1ere not different unzong treatnients. Bodjl,fut concentrution und bodjl ,fut deposition lclere qfected by
(Continued on newt page)
2003 \-ebra~ha Sit rne Report - Pcge 37
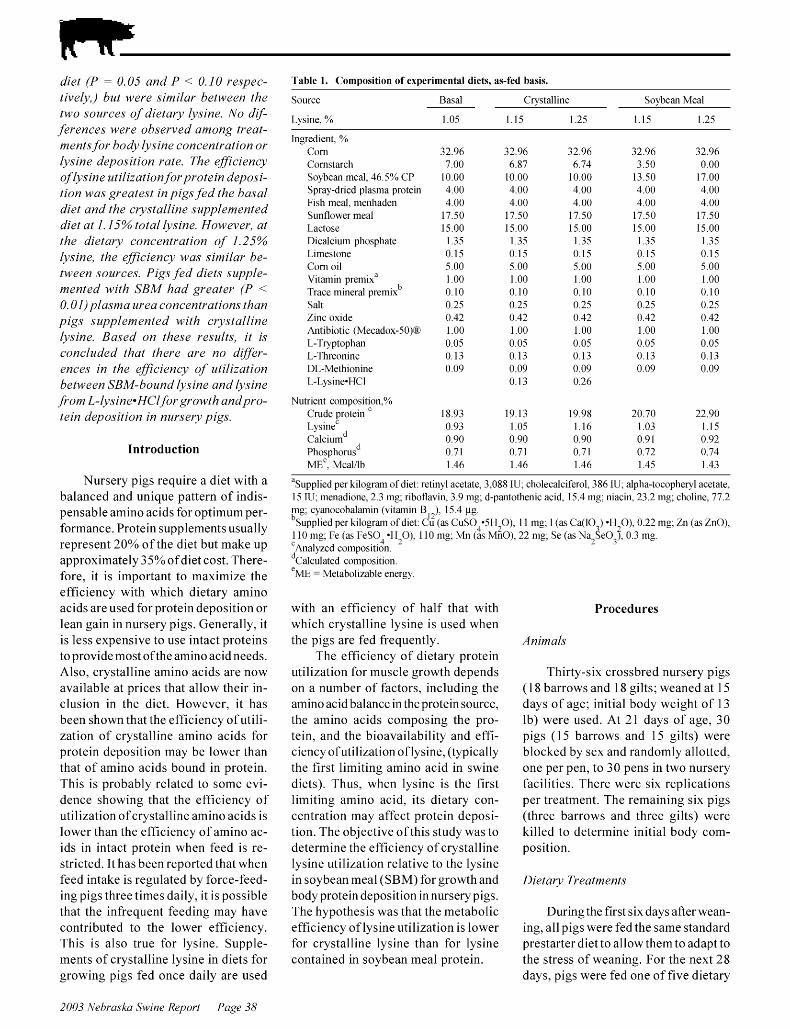
d ~ e t (P = 0 05 and P < 0 10 respec- tlvelj,) bzlt 1.1 ere srtnllar bet11 een the tn o rozwces of dretarj lj srne No d f - ferencer 11 ere obser~.ed anzong treat- nzentr for bodj lj srne concentratron or ljslne deposltron rate The efficrencj oflj rrne utrllzatlon for protern depoor- tron 1.t ar greatest rn prgr fed the baral d ~ e t and the c y rtallrne sz~pplenzented d ~ e t at I 15% total lj rlne H o ~ t ever, at the d~etarj concentratron of I 25% ljslne, the efrclencj n as slnzllar be- tn een roz~rces Prgr fed drets szlpple- nzented 11 rth SBM had greater (P < 0 01) plasnza urea concentratronr than plgs sz~pplenzented 11 rth crj rtalllne ljslne Based on there reszllts, ~t rr concluded that there are no dffer- ences rn the efficrencj of z~tllrzutron bet~t een SBM-bozlnd lj rlne and lj rlne j?om L-lj srne*HClforgro~i th andpro- teln deporrtlon In nz~rrey prgs
Introduction
Nursery pigs require a diet with a balanced and unique pattern of indis- pensable ainino acids for optimum per- formance. Protein supplementsusually represent 20% of the diet but make up approximately 35% ofdiet cost. There- fore, it is important to maximize the efficiency with which dietary ainino acids are used for protein deposition or lean gain in nursery pigs. Generally, it is less expensive to use intact proteins to provide most ofthe ainino acid needs. Also, crystalline amino acids are now available at prices that allow their in- clusion in the diet. However, it has been shown that the efficiency ofutili- zation of crystalline amino acids for protein deposition inay be lower than that of amino acids bound in protein. This is probably related to some evi- dence showing that the efficiency of utilization of crystalline ainino acids is lower than the efficiency of amino ac- ids in intact protein when feed is re- stricted. It has been reported that when feed intake is regulated by force-feed- ing pigs three times daily, it is possible that the infrequent feeding inay have contributed to the lower efficiency. This is also true for lysine. Supple- ments of crystalline lysine in diets for growing pigs fed once daily are used
Table 1. (: omposition of experimental diets, as-fed basis.
5ource Basal Cr) stallme 50) bean Meal
L) s~ne. % 1 05 1 15 1 25 1 15 I 25
Ingredient, % Corn Cornstarch Sofiean meal. 1 6 5% CP Spray-dried plasnla protein Fish meal, menhaden Sunflon-er meal Lactose Dicalcium phosphate Linlestone Corn oil Vitamin premix" Trace ~lli~leral premixh Salt Zinc oxide Antibiotic (Mecadox-50)O L-Tnptophan L-Threonine DL-Methionine L-Lysine-HC1
Nutr~ent composition,% C n ~ d e protein L! sinec Calcium d
~ h o s ~ h o r u s ~ ME'. Mcalllb
per k~logran of diet retinx 1 acetate, 3,088 IU cholecalc~lerol 386 IU. alpha-tocophen1 acetate l i IU menadlone 2 3 mg r~bofla\~n 3 9 111g d-pantothen~c a c ~ d l i 1 111g nlacin, 23 2 mg. chol~ne 77 2 mg. cx anocobalam~n (T itan1111 B ) 1 i 1 pg bSuppl~ed per kilogram of diet 6: (as CuS0,.5H20) I1 mg. I (as Ca(1OJ .H,O), 0 22 mg. Zn (as ZnO), 110 mg. Fe (as FeSO, .H,O) 110 mg. Mn (as MnO) 22 111g Se (as ~ a ~ < e 0 ~ ) 0 3 mg CAnalxzed colllposltlon - 'calculated colllposition 'ME = Metabolizable energ)
with an efficiency of half that with which crystalline lysine is used when the pigs are fed frequently.
The efficiency of dietary protein utilization for muscle growth depends on a number of factors. including the ainino acid balance in the protein source, the ainino acids composing the pro- tein, and the bioavailability and effi- ciency ofutilization of lysine. (typically the first limiting ainino acid in swine diets). Thus, when lysine is the first limiting ainino acid, its dietary con- centration may affect protein deposi- tion. The objective ofthis study was to determine the efficiency of crystalline lysine utilization relative to the lysine in soybean meal (SBM) for growth and body protein deposition in nursery pigs. The hypothesis was that the metabolic efficiency oflysine utilization is lower for crystalline lysine than for lysine contained in soybean meal protein.
Procedures
Thirty-six crossbred nursery pigs (1 8 barrows and 18 gilts: weaned at 15 days of age: initial body weight of 13 Ib) were used. At 21 days of age. 30 pigs (1 5 barrows and 15 gilts) were blocked by sex and randomly allotted, one per pen, to 30 pens in two nursery facilities. There were six replications per treatment. The remaining six pigs (three barrows and three gilts) were killed to determine initial body coin- position.
During the first six days after wean- ing, all pigs were fed the same standard prestarter diet to allow them to adapt to the stress of weaning. For the next 28 days, pigs were fed one of five dietary
2003 Yel~~*aslia SIL lrze Report - Page 38

Table 2. Performance and plasma urea concentrations of pigs fed Ijsine-limiting diets at three different concentrations.
Basal 50) bean Meal
L)s. %
Item ADG Ib ADFI. Ib ADGIADFI T L I . ~ g/d SLI g/d
f f / l00 mL PLJC'. m,
Basal 1 s D ~ e t othersC
CRYST 1s SBM (1 .15%)~
CRYST 1s 5BM (1 25%)'
%EM= Standard error of the mean. b~ignificance of main effect of diet. C~ignificance of contrasts. CRYST = cnstalline I)sine and SBM = Ilsine from so)bea~i meal d ~ ~ l = Total 1)sine intake. e~~~ = Supplemental I)sine intake. f PUC = Plasma urea concentration.
treatments. A basal diet was formu- lated based on a preliminary experi- ment that was conducted to identify the limiting range of dietary lysine con- centrations for nursery pigs. Two addi- tional diets were formulated by adding soybean meal. and the two remaining diets were supplemented with crystal- line lysine in amounts that were equal to the total lysine concentration in the soybean meal diets. All diets were formulated to meet all nutrient requirements of nursery pigs except lysine. The following three limiting amino acid concentrations (threonine, methionine. and tryptophan) were supplemented in all diets to meet the requirements for these amino acids in the basal diet and in the remaining diets. Pigs were allowed ad llbitz~nz access to the five experimental diets. Diets (Table I) used were: 1) lysine- deficient diet as basal (1.05% total lysine). 2) basal diet + 0.13% L-lysine*HCI (1.15% total lysine), 3) basal dietwith + 0.26% L-lysine*HCI (1.25% total lysine), 4) basal diet + 3.5% soybeanineal(l.15%totallysine), 5) basal diet + 7.0% soybean meal (1.25% total lysine).
Environnzental Conditions
This experiment was conducted in two nursery facilities with a total of 30 slotted-floor pens. Each pen contained a nipple waterer and a three-hole stain- less steel feeder. During the first two weeks, pigs were provided with com-
fort boards and heat lamps. A recorder was placed in the nursery facility to monitoring humidity and environmen- tal temperature.
To determine growth performance, pigs and feeders were weighed weekly. Average daily gain (ADG), average daily feed intake (ADFI), and ADGI ADFI were recorded. Total lysine in- take (TLI) and supplemental lysine intake (SLI) were calculated based on ADFI and lysine concentrations ofthe diets.
a commercial grinder with a 12.5-min die. The ground body was thoroughly mixed to ensure homogeneity and a sample of approximately 9.0 Ib was obtained. Subsequently, each sample was ground three times using a smaller grinder with successively smaller dies each time. Frequent grab samples of approximately 100 g were taken at ran- dom. mixed thoroughly to obtain a total sample of 500 g and frozen at 0°F until laboratory analyses were con- ducted. Samples were analyzed in du- plicate for dry matter (DM), ash, CP, fat. and lysine.
Blood satnples
At the end of the experiment, all pigs were bled from the jugular vein and blood samples were collected in heparinized evacuated tubes. On the day of collection. samples were centri- fuged and plasma was separated and frozen at 0°F.
The six pigs at the start and the 30 pigs fed experimental diets were killed by injecting an overdose of sodium pentobarbital. Gut contents (any re- maining digesta) were removed and the whole body of the pigs (including the gastrointestinal tract) were weighed (empty body weight; EBW) and ffozen at 0°F until further processing. The ffozen empty body was ground through
Initial EBW and chemical body composition of the pigs slaughtered at the start ofthe experiment were used to estimate the initial EBW and body chemical composition of pigs slaugh- tered at the end of the experiinent. Deposition rates ofwater. CP, fat, ash, and lysine in the whole body were estimated as the difference between the total weight of chemical compo- nents at the end and start of the experi- ment divided by the number of days of the experiment (28 days). Data were analyzed as a randomized block de- sign. Pig was considered the experi- mental unit. Linear contrasts were used to compare diets supplemented with crystalline lysine and soybean meal. The contrasts were: basal diet versus the other diets, and crystalline lysine
(Continued on newt page)
2003 \-ebra~ha Sit rne Report - Pcge 39

Table 3. Effect of diet on body chemical composition and accretion rates of pigs slaughtered at the end of the experiment.
S o ~ ~ r c e Basal C n stalline So) bean Meal P -Va l~~e
CRYST CRYST Basal ls \ s S B M \ s S B M
Lls. % 1.05 1.15 1.25 1.15 1.25 SEM" Diet " othersC ( 1 5 % (1 .25%lC
Item Initial BUrd. lb Initial €BUrd lb Final B M ~ ~ . Ib Final EBU". Ib
Bod) composition. % L) sine U'ater Protein Fat Asli
Bod) deposition. d d U'ater Protein Fat Asli
Efficient) of I)sine utilization. % f
N S N S N S
NSN
N S N S < 0.01 = 0.05 N S
NS N S < 0.10 N S
< 0.05
%EM= Standard error o t the mean b51gnltiLance ot mean e f t e ~ t of d ~ e t CS~gn~ficance of contrasts CRYST = cnstalllne I)slne and SBM = 1)slne from so)bea~i meal d ~ U =bod) nelght e € ~ U = empt) bod) uelglit 'CalLulated as (L)slne retamed In tlie bod))/(Total I)slne ~ n t a l ~ e - m a ~ n t e n a ~ i ~ e 1)slne requlrements) It IS assumed that tlie maintenance I)slne requlrements are 36 mg/l,g BU O "
versus SBM at the concentration of 1.15 and 1.25% total dietary lysine, respectively. Three linear regression equations were determined to evalu- ate the relationship of ADG. protein deposition, and lysine deposition ver- sus total lysine intake. The efficiency of utilization of lysine intake above maintenance requirements for protein deposition (PD) was calculated for individual pigs from the observed PD multiplied by the lysine content in PD divided by total lysine intake above maintenance lysine require- ments (36 mg/kgEBWo7').
Results
Gron~/7 Pe~:formunce undlysine Intuke
Growth variables are shown in Table 2. The relationship between to- tal lysine intalte and ADG (Figure 1) shows that for each additional grain1 day oflysine intalte there was a 0.08 lbl day increase in gain. Althoughpigs fed the diets supplemented with soybean meal had slightly greater ADG and ADFI than pigs fed the basal diet or diets with crystalline lysine, these dif-
ferences were not significant. Feed effi- ciency was also siinilar among treat- ments. The TLI increased as the dietary lysine concentration increased (P < 0.0 1). and was similar between lysine sources with the same dietary lysine concentration. The SLI was also af- fected by lysine concentration (P < 0.01). Pigs fed the SBM-supplemented diet at the level of 1.15% dietary lysine had a greater SLI than pigs fed the crystalline diets (P < 0.05) at the saine concentration. However. the linear contrasts indicated no differences be- tween sources at 1.25% dietary lysine.
Body Conzposition and Deposition
Body composition and deposition rates are shown in Table 3. The EBW was siinilar among dietary treatments. The percentage and deposition rates of body water and ash were similar among treatments. The body protein concen- tration was affected by diet (P < 0.01). Pigs fed the basal diet tended to have lower protein concentration than pigs fed the other diets (P < 0.10). At 1.15% total dietary lysine, pigs fed the crys- talline-supplemented diets had a greater
body protein concentration (P < 0.0 1) than pigs fed the SBM-supplemented diets. However, body protein deposi- tion rates were siinilar among treat- ments. The linear relationship between total lysine intake and PD indicated that PD increased by 5.78 glday of additional lysine intake (Figure2). Body fat content was affected by dietaiy lysine concentration (P = 0.05) but was simi- lar between the two sources of dietary lysine compared at the saine concen- tration. Deposition rate of body fat tended to decrease as dietary lysine concentration increased within sources (P < 0.10). but was similar between sources. Body lysine concentration (Table 3) and daily lysine deposition (Figure 3), were similar when compar- ing the two sources of lysine.
The efficiency of lysine utiliza- tion for protein deposition is shown in Table 3. At 1.15% total dietary lysine concentration, the efficiency of utili- zation of crystalline lysine was greater than for the SBM-supplemented diet (P = 0.08). However, at 1.25% dietary lysine, the efficiency ofutilization was similar for both sources.
Plasma urea concentration (Table
2003 Yel~~*aslia SIL lrze Report - Page 10
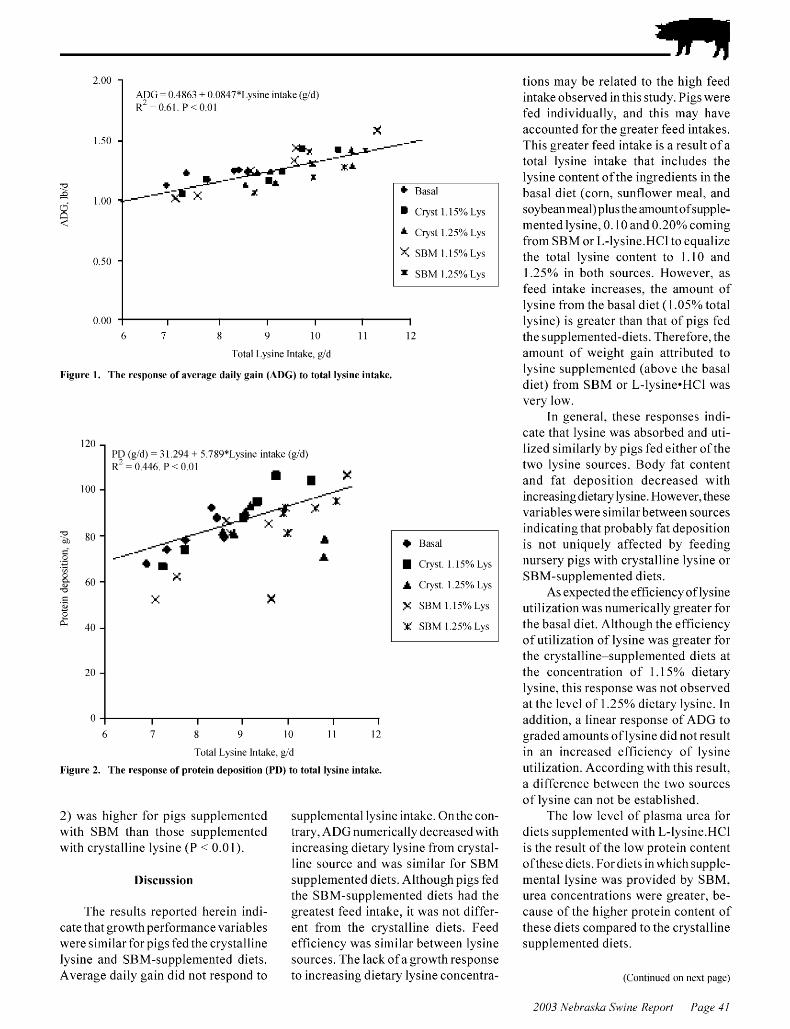
Cr!st 1 25% L>s
:< SBM I l5%L!s
= SBM 125%L!s
6 7 8 9 10 11 12
Total L) slne Intake gld
Figure 1. The response of merage dail) gain (ADG) to total ])sine intalte.
Crlst 1 15%L)s
A Crlst 1 25% L)s
S SBM 1 15% Lls
IC SBM 1 25% Lls
Total L! slne Intake. g/d
Figure 2. The response of protein deposition (PD) to total Iysine intalte.
2) was higher for pigs supplemented with SBM than those supplemented with crystalline lysine (P < 0.01).
Discussion
The results reported herein indi- cate that growthperforinance variables were similar for pigs fed the crystalline lysine and SBM-supplemented diets. Average daily gain did not respond to
supplemental lysine intalte. Onthe con- trary, ADG nuinerically decreased with increasing dietary lysine from crystal- line source and was similar for SBM supplemented diets. Although pigs fed the SBM-supplemented diets had the greatest feed intalte, it was not differ- ent from the crystalline diets. Feed efficiency was similar between lysine sources. The lack of a growth response to increasing dietary lysine concentra-
tions may be related to the high feed intake observed in this study. Pigs were fed individually, and this may have accounted for the greater feed intakes. This greater feed intake is a result of a total lysine intake that includes the lysine content ofthe ingredients in the basal diet (corn, sunflower meal, and soybeanmeal)plusthe amount ofsupple- mented lysine, 0. I0 and 0.20% coining from SBM or L-lysine.HCI to equalize the total lysine content to 1.10 and 1.25% in both sources. However. as feed intake increases. the amount of lysine from the basal diet (I .05% total lysine) is greater than that of pigs fed the supplemented-diets. Therefore. the amount of weight gain attributed to lysine supplemented (above the basal diet) from SBM or L-lysine*HCI was very low.
In general. these responses indi- cate that lysine was absorbed and uti- lized similarly by pigs fed either ofthe two lysine sources. Body fat content and fat deposition decreased with increasingdietaiy lysine. However. these variables were similar between sources indicating that probably fat deposition is not uniquely affected by feeding nursery pigs with crystalline lysine or SBM-supplemented diets.
As expected the efficiency of lysine utilization was numerically greater for the basal diet. Although the efficiency ofutilization of lysine was greater for the crystalline-supplemented diets at the concentration of 1.15% dietary lysine. this response was not observed at the level of 1.25% dietary lysine. In addition, a linear response of ADG to graded amounts of lysine did not result in an increased efficiency of lysine utilization. According with this result. a difference between the two sources of lysine can not be established.
The low level of plasma urea for diets supplemented with L-lysine.HC1 is the result of the low protein content ofthese diets. For diets in which supple- mental lysine was provided by SBM, urea concentrations were greater, be- cause of the higher protein content of these diets compared to the crystalline supplemented diets.
(Continued on nest page)
2003 \-ebra~ha Sit rne Report - Pcge 41
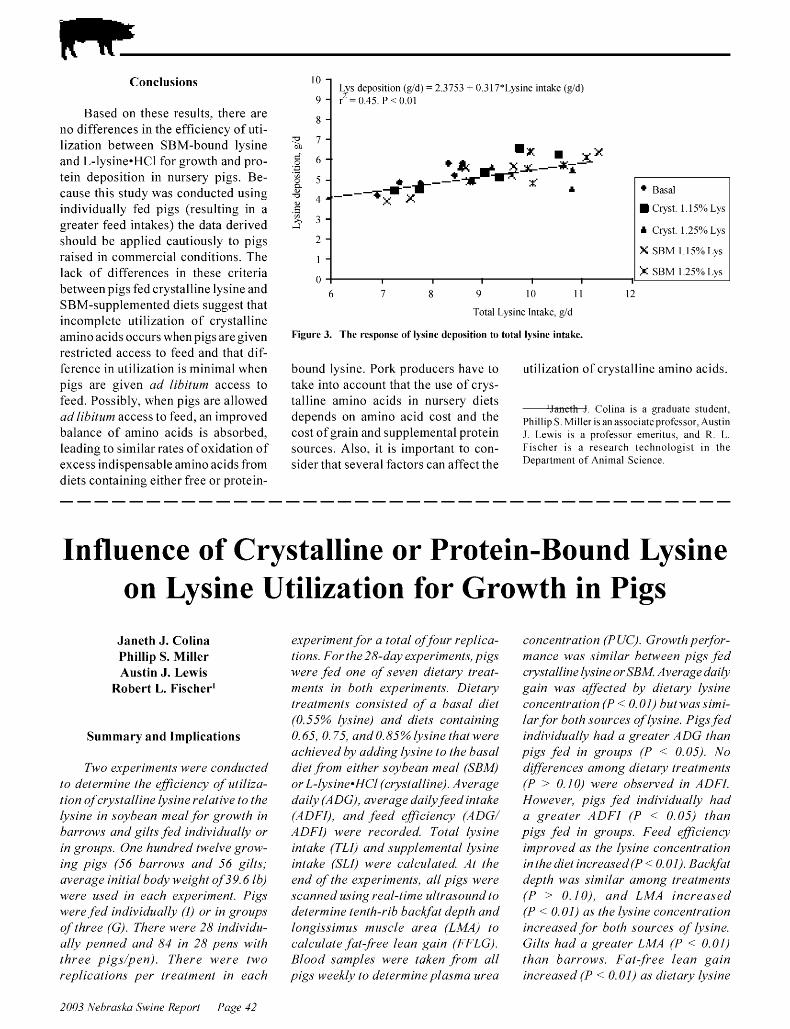
Conclusions
Based on these results. there are no differences in the efficiency of uti- lization between SBM-bound lysine and L-lysine*HCI for growth and pro- tein deposition in nursery pigs. Be- cause this study was conducted using individually fed pigs (resulting in a greater feed intakes) the data derived should be applied cautiously to pigs raised in commercial conditions. The lack of differences in these criteria between pigs fed crystalline lysine and SBM-supplemented diets suggest that incomplete utilization of crystalline amino acids occurs when pigs are given restricted access to feed and that dif- ference in utilization is minimal when pigs are given ad libitzlnz access to feed. Possibly, when pigs are allowed ad 1lbltut11 access to feed. an improved balance of amino acids is absorbed,
10 Ljs deposition (gld) = 2.3753 + 0.317*L)sine intake ( d d ) r- = 0.45. P < 0.01
+ Basal
I C r l s t 1 15% L)s
1 Crlst 1 25% L)s
X SBM 1 15% Ll s
>: SBM 1 25% Ll s
6 7 8 9 10 11 12
Total Llslne Intake. gld
Figure 3. The response of lysine deposition to total lysine intake.
bound lysine. Pork producers have to utilization of crystalline ainino acids. take into account that the use of crys- talline ainino acids in nursery diets
Inllcul I o l l n a I S a graduate student depends On amino acid cost and the Ph1111p 5 Mlller IS an assoclateprofessor A~ls t ln cost ofgrain and supplemental protein I Lenls I S a professor emerltus and R L
leading to similar rates of oxidation of sources. Also, it is important to con- Flscher 1s a research technologist ln t he
excess indispensable amino acids from sider that several factors can affect the Department of Science
diets containing either free or protein-
Influence of Crystalline or Protein-Bound Lysine on Lysine Utilization for Growth in Pigs
Janeth J. Colina Phillip S. Miller Austin J. Lewis
Robert L. Fischer'
Summary and Implications
T1t.o experiments Ii.ere condzlcted to determine the effi'ciency qf zttilira- tion qf crystalline lysine relative to t/7e Ijlsine in soybean nzea1,for gro~clth in barrows und gilts,fed individzlallj~ or in groztps. One hzlndred hvelve gro~cl- ing pigs (56 burro~cls and 56 gilts; uveruge initial body weight qf 39.6 16) 1c1ere used in euch experintent. Pigs ~clere,fed individztullj~ (I) or in groups qf three (G). There were 28 individzl- u11j~ penned und 84 in 28 pens with three pigs/pen). There were tlclo replications per treutment in each
experrtnent for a total offour replrca- tronr For the 28-daj experrnzents, plgr 1.1 ere fed one of seven d~etarj treat- nzentr rn both experrnzentr Dletag treattnents conrlrted of a basal dret (0 55% lj rrne) and dretr contarnrng 0 65, 0 75, and 0 85% 1j srne that n ere ach le~vd bj addrng ljslne to the baral d~et f ionz erther rojbean nzeal (SBM) or L-Ij~srne*HCl (crj~stallrne) Averuge u'arljl (ADG), uverage dally feed rntake (ADFI), und feed efzczencjl (ADG ADFI) were recorded Total I ~ J zne zntuke (TLI) und ~ztpplenzental lyarne zntuke (SLI) leere calczllated At the end of t/7e euperrnzents, all prgs were ~ c u n n e d ZLJ zng reul-tzme z~ltruaoz~nd to deternizne tenth-rrb buckfat depth and I O ~ ~ Z S J Z ~ ~ Z ~ J niztscle area (LMA) to culcz~late fut-pee lean gazn (FFLG) Blood ~unzples Icere tuken porn all prgs ~veeklj' to deternzrnepla~nia zlreu
concentration IPUC). Gro11,th perfor- nzance ~ t ,as sinzilar bet~t,een pigs fed cry,rtalline &sine or SBM. Average daily gain ~ t ,as aiected by dietary lysine concentration (P < 0.01) but 11.a~ sinzi- lar for both sozlrces of lj,sine. Pigs fed individz~ally had a greater ADG than pigs fed in grozlps IP < 0.05). No dijjferences atnong dietary treatnzents (P > 0.10) 1c1ere observed in ADFI. However, pigs ,fed individztullj~ had u greater ADFI (P < 0.05) than pigs ,fed in groups. Feed eficiency iniproved as the ljlsine concentrution in the diet increused (P < 0.01). Backfut depth IVUS sinzilar uniong treutnients (P > 0.10), and LMA increased (P < 0.01) us t/7e ljlsine concentrution increused,for both sozirces qf lysine. Gilts hud u greater LMA (P < 0.01) than burrows. Fut-pee leun gain increused (P < 0.01) us dietug' lysine
2003 Yel~~*aslia SIL lrze Report - Page I 2
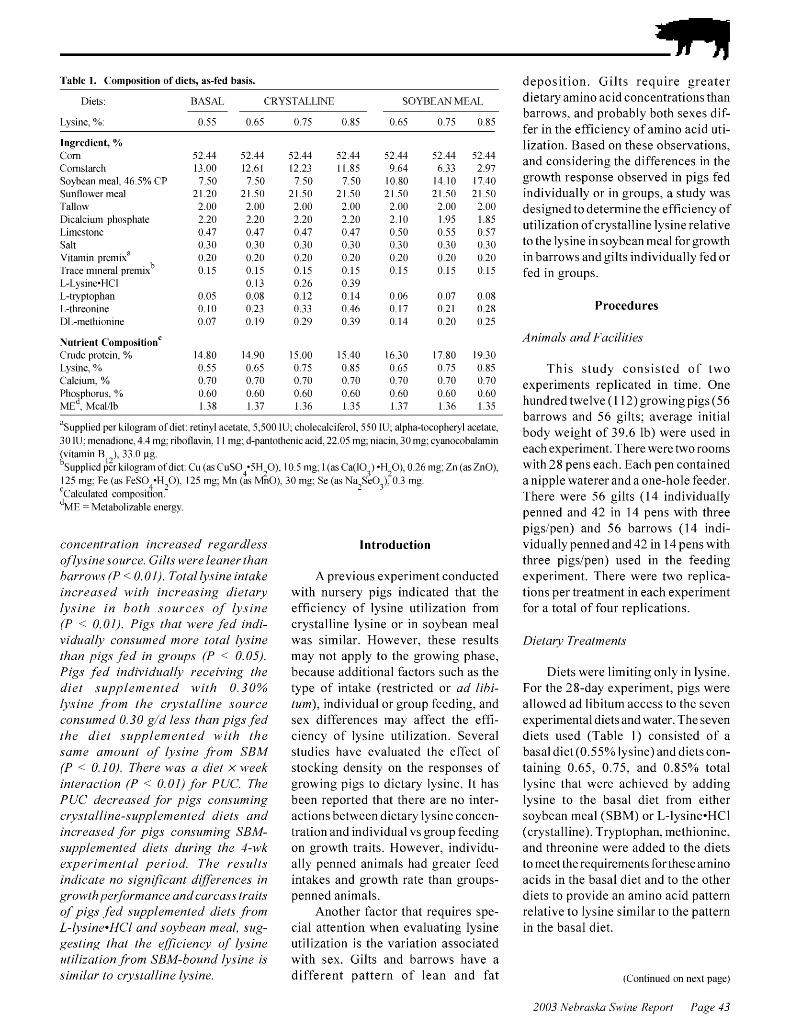
Table 1. Composition of diets, as-fed basis.
Diets. BASAL CRYSTALLINE SOYBEAN MEAL
Llsine. %. 0.55 0.65 0.75 0.85 0.65 0.75 0.85
Ingredient, % Con1 Conistarcli %)bean meal 46 5% CP 5~11iflo\\er meal Tallo\\ D~calc~um phosphate Limestone 5alt V~talii~n prem~w" Trace m~neral premlrb L-L)slne.HCI L-tr) ptophan L-tlireon~ne DL-meth~on~ne
\otrient ~ o m ~ o s i t i o n ~ Crude proteln. % L) s~ne. % Calcl~lm % Pliosplior~~s % ME^. Mcalllb
%upplied per I~ilogram of diet, retiql acetate. 5.500 IU: cliolecalciferol. 550 IIJ. alpha-tocop1ier)I acetate. 30 IU: menadione. 4.1 mg. ribofla! in. 1 1 mg: d-pa~itothenic acid. 22.05 mg. niacin. 30 mg: c)a~iocobala~iiin (vitanin B ). 33.0 pg. b~upplied liilogram ofdiet: CLI (as CLISO;SH,O). 10.5 mg: I (as Ca(l0-) .H,O). 0 2 6 mg: Zn (asZnO). 125 mg. Fe (as FeS04.H20). 125 mg: Mn (as MiiO). 30 mg. Se (as ~ a , ~ i 0 ~ ) ~ 0 . 3 mg. - 3
'calculated cornpositloll d~~ = Metabolizable energ)
concentration increased regardless of lj'sine source. Gilts Ii.ere leaner than barron,s (P < 0.01). Total lj.sine intake increased 11,ith increasing dietary lj 'sine in both soz~rces of lysine (P < 0.01). Pigs that nz re fed indi- vidz~allj. consz~tned nzore total lysine than pigs fed in grozlps (P < 0.05). Pigs fed individuallj. receiving the diet sz~ppletnented ~ t , i t h 0 .30% lj'sine f iom the cr~'sta1line source consz~nzed 0.30 g/d less than pigs fed the diet supplenzented ~ t , i t h the sanze anzount of lj.sine fionz S B M (P < 0.10). There ~ t , a s a diet x n,eek interuction (P < O.Ol),for PUC. The PUC decreused ,for pigs consz1177ing crj~stalline-szlppler7zented diets und increused ,for pigs consz1177ing SBM- szlppler7zented diets u'ztring the 4-~vk esperin7entul period. The reszllts indicate no sign!'ficant differences in gro1vt/7peyforr7zunce and curcuss traits qf pigs ,fed sztpplenzented diets ,j?om L-lysine*HCI und soybean n;leul, szlg- gesting thut the eficiency qf lysine zttiliration ,Font SBM-bozlnd lj~sine is similar to crj~stulline Iysine.
Introduction
A previous experiment conducted with nursery pigs indicated that the efficiency of lysine utilization from crystalline lysine or in soybean ineal was similar. However. these results may not apply to the growing phase, because additional factors such as the type of intake (restricted or ad libi- tunz), individual or group feeding, and sex differences may affect the effi- ciency of lysine utilization. Several studies have evaluated the effect of stocking density on the responses of growing pigs to dietary lysine. It has been reported that there are no inter- actions between dietary lysine concen- tration and individual vs group feeding on growth traits. However, individu- ally penned animals had greater feed intakes and growth rate than groups- penned animals.
Another factor that requires spe- cial attention when evaluating lysine utilization is the variation associated with sex. Gilts and barrows have a different pattern of lean and fat
deposition. Gilts require greater dietary amino acid concentrations than barrows. and probably both sexes dif- fer in the efficiency of amino acid uti- lization. Based on these observations, and considering the differences in the growth response observed in pigs fed individually or in groups, a study was designed to determine the efficiency of utilization of crystalline lysine relative to the lysine in soybean ineal for growth in barrows and gilts individually fed or fed in groups.
Procedures
Aninzals and Facilities
This study consisted of two experiments replicated in time. One hundred twelve (I 12) growing pigs (56 barrows and 56 gilts: average initial body weight of 39.6 Ib) were used in each experiment. There were two rooms with 28 pens each. Each pen contained a nipple waterer and a one-hole feeder. There were 56 gilts ( I 4 individually penned and 42 in 14 pens with three pigslpen) and 56 barrows (14 indi- vidually penned and 42 in 14 pens with three pigslpen) used in the feeding experiment. There were two replica- tions per treatment in each experiment for a total of four replications.
Diets were limiting only in lysine. For the 28-day experiment, pigs were allowed ad libitum access to the seven experimental diets and water. The seven diets used (Table 1) consisted of a basal diet (0.55% lysine) and diets con- taining 0.65. 0.75, and 0.85% total lysine that were achieved by adding lysine to the basal diet from either soybean meal (SBM) or L-lysine.HC1 (crystalline). Tryptophan, methionine, and threonine were added to the diets to meet the requirements for these amino acids in the basal diet and to the other diets to provide an amino acid pattern relative to lysine similar to the pattern in the basal diet.
(Continued on newt page)
2003 \-ebra~ha Sit rne Report - Pcge 43
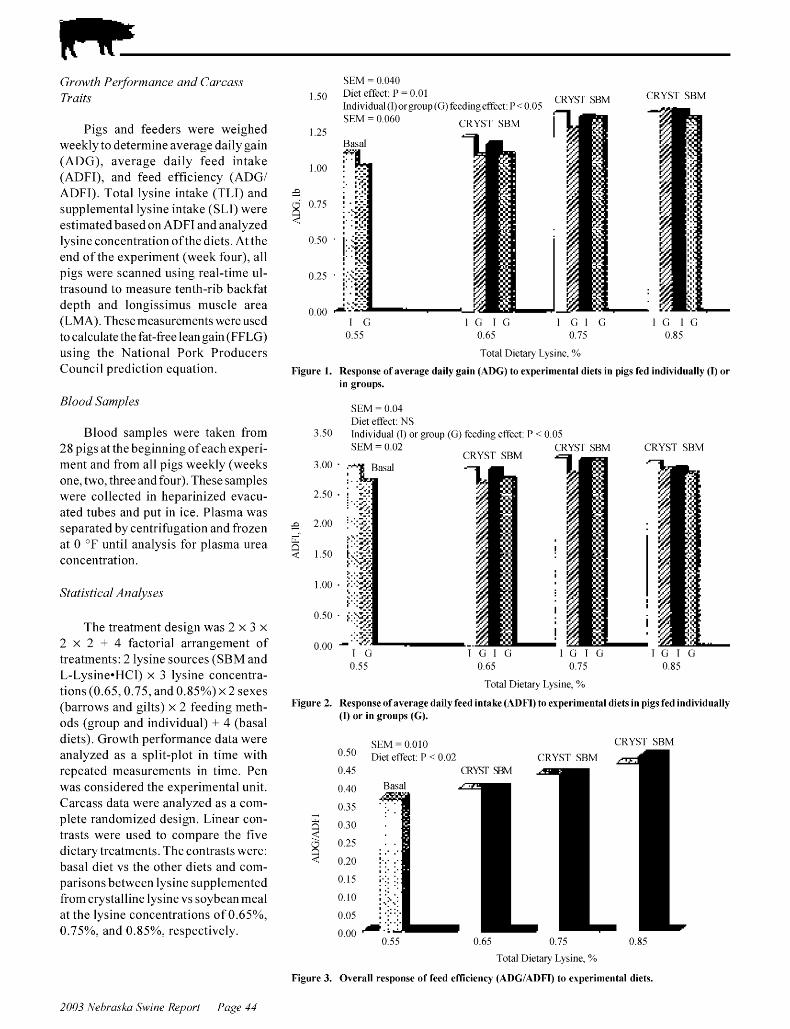
SEM = 0.040
Pigs and feeders were weighed weekly to determine average daily gain (ADG), average daily feed intake (ADFI), and feed efficiency (ADGI ADFI). Total lysine intake (TLI) and supplemental lysine intake (SLI) were estimated based on ADFI and analyzed lysine concentration ofthe diets. Atthe end of the experiment (week four). all pigs were scanned using real-time ul- trasound to measure tenth-rib backfat depth and longissiinus muscle area (LMA). These measurements were used to calculate the fat-free lean gain (FFLG) using the National Pork Producers Council prediction equation.
Blood Sutnples
Blood samples were taken from 28 pigs at the beginning ofeach experi- ment and from all pigs weekly (weeks one, two, three and four). These samples were collected in heparinized evacu- ated tubes and put in ice. Plasma was separated by centrifugation and frozen at 0 OF until analysis for plasma urea concentration.
The treatment design was 2 x 3 x 2 x 2 + 4 factorial arrangement of treatments: 2 lysine sources (SBM and L-Lysine*HCl) x 3 lysine concentra- tions (0.65.0.75. and 0.85%) x 2 sexes (barrows and gilts) x 2 feeding meth- ods (group and individual) + 4 (basal diets). Growth performance data were analyzed as a split-plot in time with repeated measurements in time. Pen was considered the experimental unit. Carcass data were analyzed as a com- plete randomized design. Linear con- trasts were used to compare the five dietary treatments. The contrasts were: basal diet vs the other diets and com- parisons between lysine supplemented ffom crystalline lysine vs soybeanmeal at the lysine concentrations of 0.65%, 0.75%, and 0.85%, respectively.
Diet effect: P = 0.01 CRYST SBM CRYST SBM
Indibidual (I)orgroup(G)feedingeffect: P<0.05 SEM = 0.060 CRYST SBM
Basal
' '-id :. ::/ . r.I! I I.-. 8 . r.: : .:*ii 8 .;Pa I' : 8 ::<
I G I G I G I G I G I G 0 65 0 75 0 85
Total Dletar) L)slne %
Figure 1. Response of merage dail) gain (ADG) to experimental diets in pigs fed indi\idoall) (I) or in groups.
SEM = 0 04 Diet effect. NS
3.50 Individual (I) or group (G) feeding effect. P < 0 05 SEM = 0 02 CRYST SBM CRYST SBM
CRYST SBM
I G I G I G I G I G I G I G 0 55 0 65 0 75 0 85
Total D~e tan Llslne. %
Figure 2. Response of merage dail) feed intake (ADFI) to experimental diets in pigs fed indi\ iduallj (I) or in groups (G).
C F ~ A = n n ~ n CRYST SBM ~ J L 2 . L "."." Diet effect. P < 0.02
0 45 CRYST SBM
" "" 0 55 0 65 0 75 0 85
Total D ~ e t a n L! sine %
Figure 3. O\erall response of feed efficient) (ADGIADFI) to experimental diets.
2003 Yel~~*aslia SIL lrze Report - Page II
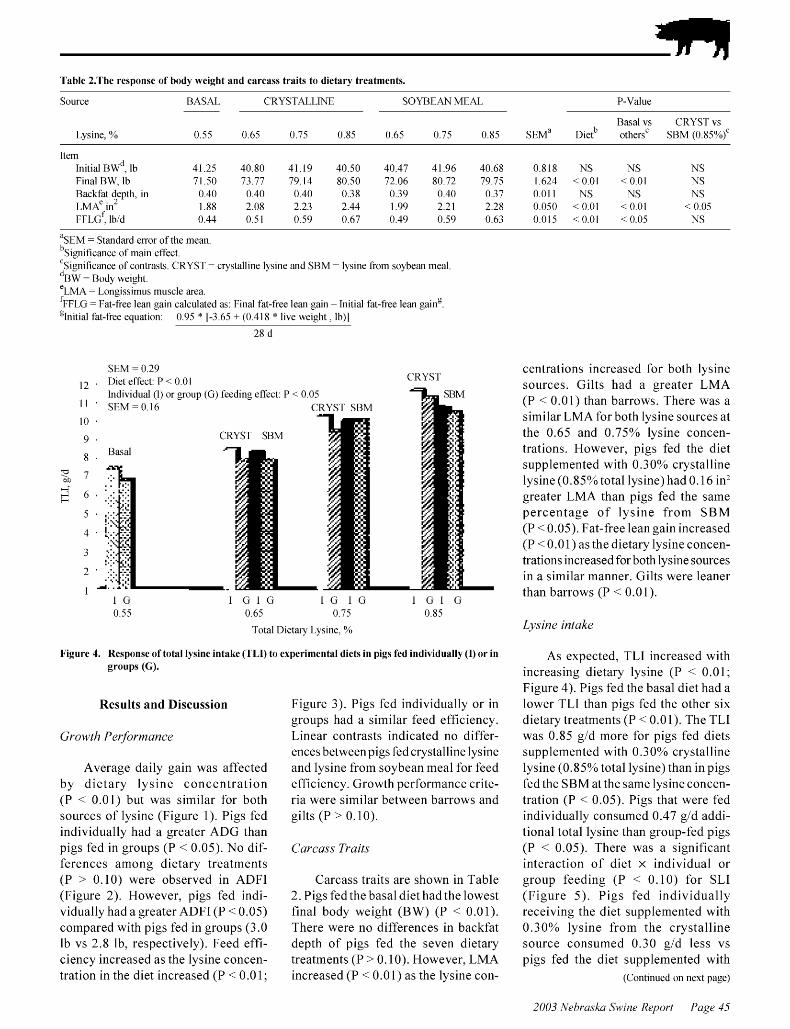
Table 2.The response of bod? \\eight and carcass traits to dietar) treatments.
5ource BA5AL CRYYTALLINE SOYBEAN MEAL P-Va l~~e
Basal 1 s CRYST \ s L l s ~ n e % 0 55 0 65 0 75 0 85 0 65 0 7 5 0 8 5 5 ~ ~ V 1 e l e t b othersC 5BM (085%)'
Item Initial B U ' ~ . lb 11.25 10.80 11.19 10.50 10.17 11.96 10.68 0.818 NS NS NS Final BU'. Ib 71.50 73.77 79.11 80.50 72.06 80.72 79.75 1.621 < 0.01 < 0.01 N S Bacltfat depth. in 0.10 0.10 0.10 0.38 0.39 0.10 0.37 0.011 NS NS NS L M A ~ in2 1.88 2.08 2.23 2.11 1.99 2.21 2.28 0.050 < 0.01 < 0.01 < 0.05 F F L G ~ . lbld 0.11 0.51 0.59 0.67 0.19 0.59 0.63 0.015 < 0.01 < 0.05 N S
%EM = Standard error of the mean. b~ignificance of main effect. 'Significance of contrasts. CRYST = cnstalline I)sine and SBM = Ilsine from solbean meal d ~ ~ , = ~ o d ) \\eiglit. e~~~ = Longissim~~s muscle area. f FFLG = Fat-free lean gain calc~llated as. Final fat-free lean gain - Initial fat-free lean gaing. 'lnitial fat-free equation. 0.95 "-3.65 + (0.118 * l i \e \ \eight. Ib)]
28 d
SEM = 0 29 I ? . D ~ e t effect P < 0 01
Individual (I) or group (G) feeding effect: P < 0.05 SEM = 0.16 CRYST SBM
Basal
I G I G I G I G I G I G I G 0 65 0 75 0 85
Total Dletar) L ) s~ne %
Figure 4. Response of total ])sine intalte (TLI) to experimental diets in pigs fed indi\iduallj (I) or in groups (G).
Results and Discussion
Average daily gain was affected by dietary lysine concentration (P < 0.01) but was similar for both sources of lysine (Figure 1). Pigs fed individually had a greater ADG than pigs fed in groups (P < 0.05). No dif- ferences among dietary treatments (P > 0.10) were observed in ADFI (Figure 2). However, pigs fed indi- vidually had a greater ADFI (P < 0.05) compared with pigs fed in groups (3.0 lb vs 2.8 lb, respectively). Feed effi- ciency increased as the lysine concen- tration in the diet increased (P < 0.0 1;
Figure 3). Pigs fed individually or in groups had a similar feed efficiency. - Linear contrasts indicated no differ- ences between pigs fed ciystalline lysine and lysine from soybean meal for feed efficiency. Growth performance crite- ria were similar between barrows and gilts (P > 0.10).
Carcass Traits
Carcass traits are shown in Table 2. Pigs fed the basal diet had the lowest final body weight (BW) (P < 0.01). There were no differences in bacltfat depth of pigs fed the seven dietary treatments (P > 0.10). However, LMA increased (P < 0.01) as the lysine con-
centrations increased for both lysine sources. Gilts had a greater LMA (P < 0.01) than barrows. There was a similar LMA for both lysine sources at the 0.65 and 0.75% lysine concen- trations. However, pigs fed the diet suppleinented with 0.30% crystalline lysine (0.85% total lysine) had 0.16 in' greater LMA than pigs fed the same - percentage of lysine from SBM (P < 0.05). Fat-fi-ee lean gain increased (P < 0.0 1) as the dietary lysine concen- trations increased for both lysine sources in a similar manner. Gilts were leaner than barrows (P < 0.0 1).
Lj.sine intake
As expected, TLI increased with increasing dietary lysine (P < 0.01: Figure 4). Pigs fed the basal diet had a lower TLI than pigs fed the other six dietary treatments (P < 0.01). The TLI was 0.85 gld more for pigs fed diets suppleinented with 0.30% crystalline lysine (0.85% total lysine) than in pigs fed the SBM at the same lysine concen- tration (P < 0.05). Pigs that were fed individually consumed 0.47 gld addi- tional total lysine than group-fed pigs (P < 0.05). There was a significant interaction of diet x individual or group feeding (P < 0.10) for SLI (Figure 5). Pigs fed individually receiving the diet suppleinented with 0.30% lysine from the crystalline source consumed 0.30 gld less vs pigs fed the diet suppleinented with
(Cont~nued on next page)
2003 \-ebra~ha Sit rne Report - Pcge 45
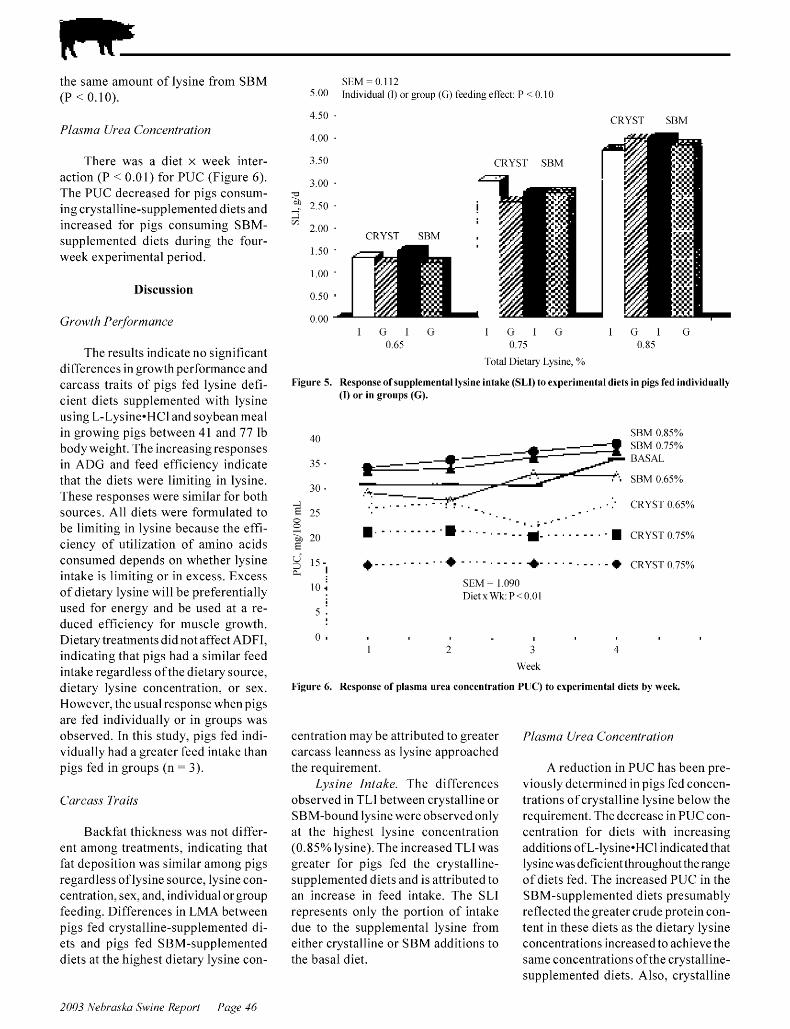
the saine amount of lysine from SBM (P < 0.10).
P/a,~nza Urea Concentration
There was a diet x week inter- action (P < 0.0 I ) for PUC (Figure 6). The PUC decreased for pigs consum- ing crystalline-supplemented diets and increased for pigs consuming SBM- supplemented diets during the four- week experimental period.
Discussion
Grou<th Perfornzance
The results indicate no significant differences in growth performance and carcass traits of pigs fed lysine defi- cient diets supplemented with lysine using L-Lysine*HCI and soybean meal in growing pigs between 41 and 77 Ib body weight. The increasingresponses in ADG and feed efficiency indicate that the diets were limiting in lysine. These responses were similar for both sources. All diets were formulated to be limiting in lysine because the effi- ciency of utilization of amino acids consumed depends on whether lysine intake is limiting or in excess. Excess of dietary lysine will be preferentially used for energy and be used at a re- duced efficiency for muscle growth. Dietary treatments did not affect ADFI, indicating that pigs had a similar feed intake regardless ofthe dietary source, dietary lysine concentration, or sex. However, the usual response when pigs are fed individually or in groups was observed. In this study. pigs fed indi- vidually had a greater feed intake than pigs fed in groups (n = 3).
Carcass Traits
Bacltfat thickness was not differ- ent ainong treatments, indicating that fat deposition was similar ainong pigs regardless of lysine source, lysine con- centration, sex, and, individual or group feeding. Differences in LMA between pigs fed crystalline-supplemented di- ets and pigs fed SBM-supplemented diets at the highest dietary lysine con-
SEM= 0 112 5.00 Individual (I) or group (G) feeding effect. P < 0 10
1.50 . CRYST SBM
I G I G I G I G I G I G 0 65 0 75 0 85
Total D~e tan L l s~ne . %
Fignre 5. Response of snpplemental Ijsine intalte (SLI) to experimental diets in pigs fed indi\iduallj (I) or in groups (G) .
SBM 0.85% 'tu
30 . - - . . . . .' CRYST 0 65% 5 25 - % .
3 15- + + CRYsT075% C I
10 4 SEM = 1.090 DietuM~k. P<0.01
3 .
Week
Figure 6 . Response of plasma urea concentration P t C') to experimental diets bj neck.
centration may be attributed to greater carcass leanness as lysine approached the requirement.
Lysine Intake. The differences observed in TLI between crystalline or SBM-bound lysine were observed only at the highest lysine concentration (0.85% lysine). The increased TLI was greater for pigs fed the crystalline- supplemented diets and is attributed to an increase in feed intalte. The SLI represents only the portion of intalte due to the supplemental lysine from either crystalline or SBM additions to the basal diet.
P/a,~nza Urea Concentration
A reduction in PUC has been pre- viously determined in pigs fed concen- trations of crystalline lysine below the requirement. The decrease in PUC con- centration for diets with increasing additions ofL-lysine.HC1 indicated that lysine was deficient throughout the range of diets fed. The increased PUC in the SBM-supplemented diets presumably reflected the greater crude protein con- tent in these diets as the dietary lysine concentrations increased to achieve the saine concentrations ofthe crystalline- supplemented diets. Also, crystalline
2003 Yel~~*aslia SIL lrze Report - Page 16
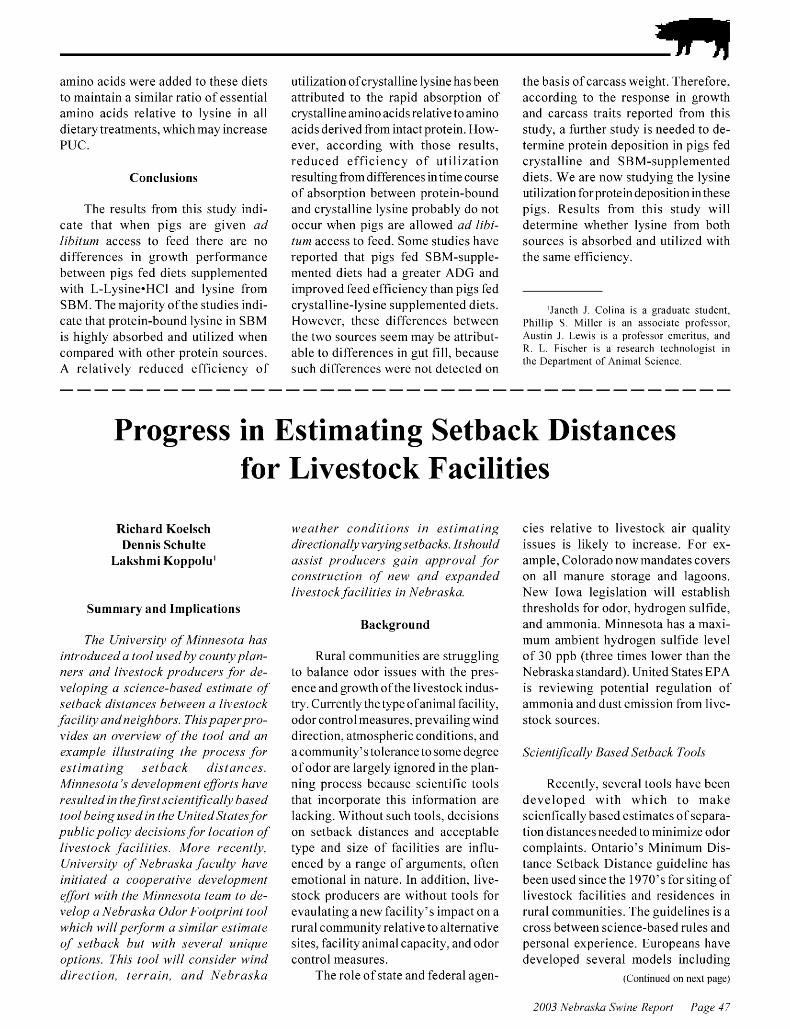
ainino acids were added to these diets to maintain a similar ratio of essential ainino acids relative to lysine in all dietary treatments, which may increase PUC.
Conclusions
The results from this study indi- cate that when pigs are given ad 1lbltut11 access to feed there are no differences in growth performance between pigs fed diets supplemented with L-Lysine*HCI and lysine from SBM. The majority ofthe studies indi- cate that protein-bound lysine in SBM is highly absorbed and utilized when compared with other protein sources. A relatively reduced efficiency of
utilization ofcrystalline lysine has been attributed to the rapid absorption of ciystalline amino acids relative to ainino acids derived from intact protein. How- ever, according with those results, reduced efficiency of utilization resulting from differences in time course of absorption between protein-bound and crystalline lysine probably do not occur when pigs are allowed ad libi- tunz access to feed. Some studies have reported that pigs fed SBM-supple- mented diets had a greater ADG and improved feed efficiency than pigs fed crystalline-lysine supplemented diets. However, these differences between the two sources seem may be attribut- able to differences in gut fill. because such differences were not detected on
the basis of carcass weight. Therefore, according to the response in growth and carcass traits reported from this study. a further study is needed to de- termine protein deposition in pigs fed crystalline and SBM-supplemented diets. We are now studying the lysine utilization forprotein deposition in these pigs. Results from this study will determine whether lysine from both sources is absorbed and utilized with the same efficiency.
'Janet11 J . Colina is a graduate student. Phillip S . Miller is an associate professor. A ~ ~ s t i n 1. Leuis is a professor emeritus. and R. L. Fischer is a research technologist in the Department of Animal Science.
Progress in Estimating Setback Distances for Livestock Facilities
Richard Koelsch Dennis Schulte
Lakshmi Koppolu'
1t.eather conditions in estitnating directional~~varj~ingsetbacks. Itshozlld assist prodzlcers gain approval for constrzlction of neli. and expanded livestock facilities in Nebraska.
Summary and Implications Background
The University of Minnesota has introdzlced a tool used bj. cozmtj. plan- ners and livestock prodzlcers for de- veloping a science-based estitnate of setback distances bet~tzen a livestock facilitj. andneighbors. Thispaperpro- vides an overview of the tool and an exatnple illustrating the process for estinzating setback distances. Minnesotu 's developnzent efforts have reszlltedin the,first scient!'ficall~~ based tool being ztsed in t/7e UnitedStates,for pziblicpolicj~ decisions,for locution qf livestock ,futilities. More recently, University qf Nebraska ,fucztlt]ll have initiated a cooperative developnient effort with the Minnesota teanz to de- velop u Nebrasku Odor Footprint tool ~clhich ~clillpeyfornz u sinzilur estinzate qf setback bztt 1clit/7 several zlniqzle options. This tool ~clill consider ~clind direction, terrain, und Nebrusku
Rural communities are struggling to balance odor issues with the pres- ence and growth ofthe livestock indus- try. Currently the type ofaniinal facility, odor control measures, prevailing wind direction. atmospheric conditions. and a community's tolerance to some degree ofodor are largely ignored in the plan- ning process because scientific tools that incorporate this information are lacking. Without such tools, decisions on setback distances and acceptable type and size of facilities are influ- enced by a range of arguments, often emotional in nature. In addition, live- stock producers are without tools for evaulating anew facility's impact on a rural community relative to alternative sites, facility animal capacity, and odor control measures.
The role of state and federal agen-
cies relative to livestock air quality issues is likely to increase. For ex- ample. Colorado now mandates covers on all manure storage and lagoons. New Iowa legislation will establish thresholds for odor, hydrogen sulfide, and ammonia. Minnesota has a maxi- mum ambient hydrogen sulfide level of 30 ppb (three times lower than the Nebraska standard). United States EPA is reviewing potential regulation of ammonia and dust emission from live- stock sources.
ScientrJicallj~ Based Setback Tools
Recently, several tools have been developed with which to make scienfically based estimates of separa- tion distances needed to minimize odor complaints. Ontario's Minimum Dis- tance Setback Distance guideline has been used since the 1970's for siting of livestock facilities and residences in rural communities. The guidelines is a cross between science-based rules and personal experience. Europeans have developed several models including
(Continued on newt page)
2003 \-ebra~ha Sit rne Report - Pcge 47

an Austrian model which determines recommended setback distances for animal housing only. Two European models, including the Austrian model, were the foundation for a Purdue model that was applied to both buildings and outdoor inanure storages. Mostrecently, OFFSET. a tool developed in Minne- sota to assess odor movement from livestock facilities. is being applied as a community odor planning tool in three Minnesota counties. Cooperative efforts between the UNL and the Uni- versity of Minnesota have the potential to improve this odor modeling tool and adaptthe OFFSET concepttoNebraska. Critical limitations for use of OFFSET in Nebraska include differences in weather conditions, lack of emissions data for anaerobic lagoons and open feedlots. and its current prediction of odor emissions without regard forwind direction. In addition. the Minnesota model does not handle odors fi-om area sources well (e.g. open feedlots. large buildings, or large inanure storages or lagoons).
Minnesota OFFSET Tool2
Recognizing the increasing num- berofnuisance-related conflicts between the livestock industry and rural neigh- bors, the Minnesota State Legislature funded an effort to develop the "Odor From Feedlots Setback Estimation Tool" (OFFSET). The University of Minne- sota Biosystems and Agricultural Engineering Department under the guidance of a stakeholder advisory committee has initiated three major activities contributing to the iinple- mentation of
OFFSET:
1. Collection of a large data base of odor emission rates from a wide range of animal housing and ina- nure storage systems. This data base is the foundation for selec- tion of an appropriate odor emis- sion factor that is used to define the magnitude of an odor source. Odor emissions factors have been published for common cattle, swine, and poultry housing types (Table 1) and manure storage options
Table 1. Odor emission number for animal housing with merage management le\el.
Odor Emission N ~ ~ m b e r (Rate)
Cattle Beefmain D~rtlconcrete lot 1
Free stall. Scrape. Free Stall. Deep pit Loose housing. scrape Tie stall. ccrane
S \ \ ~ n e Gestat~on Deep p~ t . natural or meclia~i~cal 50 PLIII PILIE. nat~~ral or meclia~i~cal 3 0
Farron lng Pull plug, natural or mechan~cal I 1
Nurser) Deep p~ t . natural or meclia~i~cal 1 2 PLIII PILIE. nat~~ral or meclia~i~cal 1 2
F ~ n ~ s l i ~ n g Deep p ~ t natural or mechan~cal 3 1 PLIII PILIE. nat~~ral or meclia~i~cal 20 Hoop bani. deep bedded scrape 1 Carg~l (open front). scrape 1 1 Loose hous~ng. scrape 1 1 Open concrete lot scrape 1 1
Poultn Bro~ler L~tter 1
Table 2. Odor emission number for liquid or solid manure storage.
Storage T)pe Odor Emission N ~ ~ m b e r (Rate)
Earthen basin. single or m~lltiple cells* 13 Steel or concrete tank. abo\ e or belo\\ gro~lnd 28 Crusted stocltuile 2
"Earthen bas~ns are des~gned for manure storage \\~tliout an) treatment Treatment lagoons ma) ha\ e less odor
Table 3. Odor control factors.
Odor Control Technolog) Odor Control Factor
Biofilter on 100% of b~lilding exhaust fans Geotextile c o ~ e r (> = 2 .1 mm)
Stra\\ or nat~~ral crust on manure 2" tli~clt 1" th~clt 6" th~clt 8" th~clt
including earthen basins, formed 3. Validation ofthis tool in repeated manure storage tanks. and crusted experiments with 20 individual fann manure stockpiles (Table 2). In sites. addition, the Minnesota model recognizes the odor control ben- efits of different technologies (Table 3) Adaption of an air dispersion com- puter model, INPUFF-2, to pre- dict downwind concentrations of odors based uponmeteorology and odor emission factors. This model has facilitated the recommenda- tion of separation distances based upon total odor emissions and an- noyance free levels (Figure 1).
This tool has two primary applica- tions in Minnesota at this time. It is being used by producers prior to the construction of anew facility or expan- sion of an existing facility to forecast potential impacts ofthe planned devel- opment on neighbors and identify appropriate setback distances. The tool also allows producers to evaluate alternative odor control practices for their ability to reduce setback require- ments and encourages a better fit for a
2003 Yel~~*aslia SIL lrze Report - Page 18
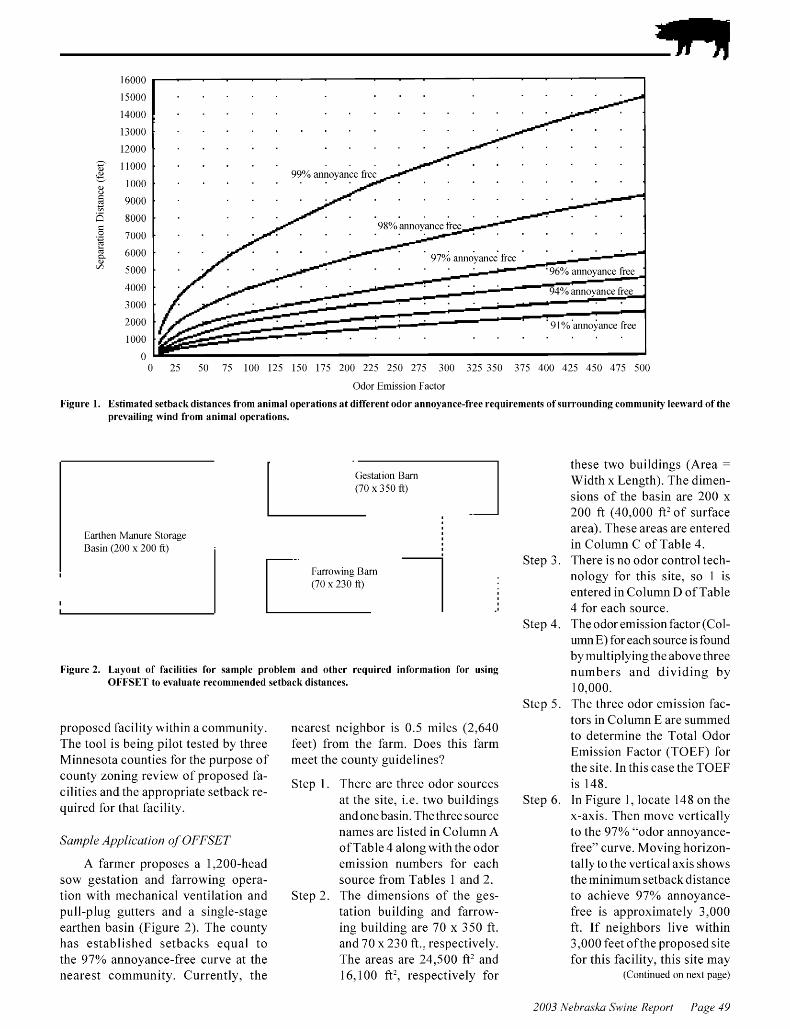
Odor Emission Factor
Figure 1. Estimated setback distances from animal operations at different odor annolance-free requirements of surrounding cornmunit! leel~ard of the prel ailing ~ ~ i n d from animal operations.
(70 x 350 ft)
Earthen Manure Storage Basin (200 w 200 ft)
I Farron-ing Barn (70 x 230 fi)
I
I
Fignre 2. Laloot of facilities for sample problem and other required information for nsing OFFSET to elalllate recommended setback distances.
proposed facility within a community. The tool is being pilot tested by three Minnesota counties for the purpose of county zoning review of proposed fa- cilities and the appropriate setback re- quired for that facility.
Sun~ple Applicution o f OFFSET
A farmer proposes a 1,200-head sow gestation and farrowing opera- tion with mechanical ventilation and pull-plug gutters and a single-stage earthen basin (Figure 2). The county has established setbacks equal to the 97% annoyance-free curve at the nearest community. Currently, the
nearest neighbor is 0.5 miles (2,640 feet) from the farm. Does this farm meet the county guidelines?
Step 1. There are three odor sources at the site, i.e. two buildings and one basin. The three source names are listed in Column A of Table 4 along with the odor emission numbers for each source ffom Tables 1 and 2.
Step 2. The dimensions of the ges- tation building and farrow- ing building are 70 x 350 ft. and 70 x230 ft., respectively. The areas are 24,500 ft' and 16,100 ft', respectively for
these two buildings (Area =
Width x Length). The diinen- sions of the basin are 200 x 200 ft (40.000 ft'of surface area). These areas are entered in Column C of Table 4.
Step 3. There is no odor control tech- nology for this site. so 1 is entered in Coluinn D ofTable 4 for each source.
Step 4. The odor emission factor (Col- umn E) for each source is found by multiplying the above three numbers and dividing by 10,000.
Step 5. The three odor emission fac- tors in Coluinn E are summed to determine the Total Odor Emission Factor (TOEF) for the site. In this case the TOEF is 148.
Step 6. In Figure 1, locate 148 on the x-axis. Then move vertically to the 97% "odor annoyance- free" curve. Moving horizon- tally to the vertical axis shows the minilnuin setback distance to achieve 97% annoyance- free is approximately 3,000 ft. If neighbors live within 3,000 feet ofthe proposed site for this facility, this site may
(Cont~nued on next page)
2003 \-ebra~ha Sit rne Report - Pcge 49

be determined to be unaccept- able and would not meet county zoning standards. Therefore, this farm does not comply with the county guidelines because the cominunitywill experience annoying odors greater than the allowable 3% per month (22 hours per month from April through October).
To comply with county regula- tions, the fariner must reduce odor emissions fi-om his animal production site or consider alternative sites. The question then becomes how much odor emission reduction is necessary to meet the 97% annoyance-fi-ee standard. The fariner contemplates the addition of a biofilter on the two buildings (odor control factor of 0.1 from Table 3) and a geotextile cover on the manure stor- age (odor control factor of 0.5 from Table 3). Table 5 indicates the changes in odor emissions with these two inodi- fications. Note that Columns A. B. and C did not change between Table 4 and Table 5.
With a new Odor Emission Total estimated, go to Figure 1 and find 30.5 on the horizontal scale. For this TOEF the 97% annoyance-free level is achieved within 1.700 feet. Only the 99% annoyance-free curve is not reached by a 0.5 mile distance to the nearest neighbor. The odor control technologies used in this example are presently available. Although not com- mon, they can be seen on demonstra- tion farms. Additional cost to the producer to implement these odor control measures should be weighed against the expenses incurred in trying to find an alternative site.
Strengths und Weuknesses qf OFFSET
The Minnesota OFFSET tool for estimating neighbor exposure to odor is a major advancement in the applica- tion of science-based tools to this is- sue. It provides a simple mechanism by which producers and county planners can make reasonable judgements as to the degree of impact a facility may have on the community. The Univer- sity of Minnesota faculty who devel- oped this tool are to be commended for
Table 4. Summar) table for calculating the total odor emission factor for a 1,200-son unit a i th no odor control practices."
Column A Column B C o l ~ ~ m n C Column D C o l ~ ~ m n E
Odor Odor Emission Area Odor Control Odor Emission Factor Source N ~ ~ m b e r (sq. ft) Factor (B x C X Dll0.000)
Gestation Barn 30 0u/ft2 24,500 1 73.7 Farrowing Barn 14 0u/ft2 16,100 1 225 Manure Storage 13 0u/ft2 40,000 1 520
Total Odor E m ~ s s ~ o n Factor (sum of Column E) 148.0 Setback D~stalice from F~gure 1 for gf% Anno)alice Free C ~ l r \ e 3,000 feet
"Text In bold IS entered b) producer and IS spec~fic to ~ n d n dual operatlons
Table 5. Summar) table for calculating the total odor emission factor for a 1,200-son unit a i th some odor control practices.*
Column A Column B C o l ~ ~ m n C Column D C o l ~ ~ m n E
Odor Odor Emission Area Odor Control Odor Emission Factor Number (sa. ft) Factor (B x C X Dll0.000)
Gestation Barn 30 0u/ft2 24,500 0.1 7.4 Farrowing Barn 14 0u/ft2 16,100 0.1 23 Manure Storage 13 0u/ft2 40,000 0.4 26.0
Total Odor E m ~ s s ~ o n Factor (sum of Column E) 35.7 Setback D~stalice from F~gure 1 for gf% Anno) ance Free C L I ~ \ e 1,700 feel
"Text In bold IS entered b) producer and IS spec~fic to ~ n d n dual operatlons
Actual Odor Footprint for 99% odor-free
Proposed interim UNL nlodel for 99% odor-free setback
M~nnesota OFFgET 99% odor-free setback
Figure 3. Predicted odor-free exposure frequencies for a li\estoclc facilit) based upon the \ebraslta Odor Footprint tool, a proposed interim tool, and the \linnesota OFFSET model.
2003 Yel~~*aslia SIL lrze Report - Page 50
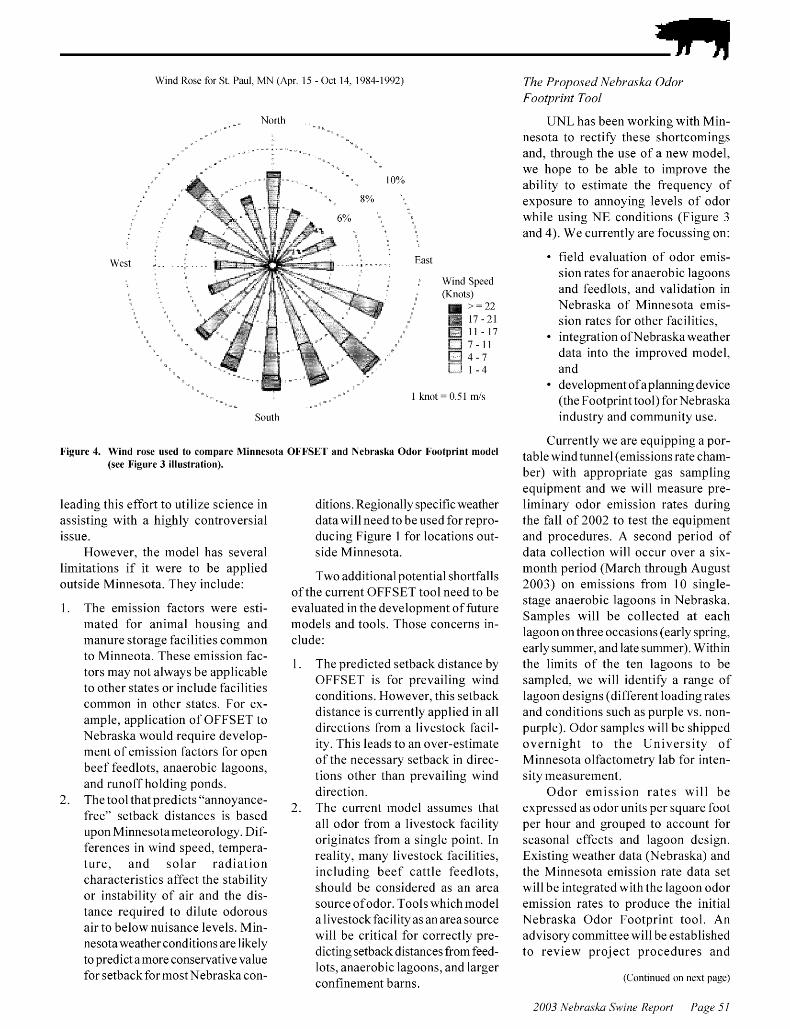
M ~ n d Rose for St Pa~ll M N (Apr 15 - Oct 11 1981-1 992)
North
West East
IT ~ n d Speed (Knots)
> = 2 2 1 7 - 2 1 11 - 1 7 7 - 1 1 1 - 7 1 - 1
South
Figure 4. \\ ind rose used to compare \linnesota OFFSET and \ebrasha Odor Footprint model (see Figure 3 illostration).
leading this effort to util assisting with a highly issue.
ize science in controversial
However, the model has several limitations if it were to be applied outside Minnesota. They include:
1. The emission factors were esti- mated for animal housing and manure storage facilities cominon -
to Minneota. These emission fac- tors may not always be applicable to other states or include facilities cominon in other states. For ex- ample. application of OFFSET to Nebraska would require develop- ment of einission factors for open beef feedlots. anaerobic lagoons, and runoff holding ponds. The tool that predicts "annoyance- free" setback distances is based upon Minnesotaineteorology. Dif- ferences in wind speed, tempera- ture, and solar radiation characteristics affect the stability or instability of air and the dis- tance required to dilute odorous air to below nuisance levels. Min- nesota weather conditions are likely to predict ainore conservative value for setback for most Nebraska con-
ditions. Regionally specific weather data will need to be used for repro- ducing Figure 1 for locations out- side Minnesota.
Two additional potential shortfalls of the current OFFSET tool need to be evaluated in the development of future models and tools. Those concerns in- clude:
The predicted setback distance by OFFSET is for prevailing wind conditions. However. this setback distance is currently applied in all directions from a livestock facil- ity. This leads to an over-estimate of the necessary setback in direc- tions other than prevailing wind direction. The current model assumes that all odor from a livestock facility originates from a single point. In reality, many livestock facilities, including beef cattle feedlots, should be considered as an area source of odor. Tools whichinodel a livestock facility as an area source will be critical for correctly pre- dicting setback distances from feed- lots, anaerobic lagoons, and larger confinement barns.
The Proposed Nebraska Odor Footprint Tool
UNL has been working with Min- nesota to rectify these shortcomings and, through the use of a new model, we hope to be able to improve the ability to estimate the frequency of exposure to annoying levels of odor while using NE conditions (Figure 3 and 4). We currently are focussing on:
field evaluation of odor emis- sion rates for anaerobic lagoons and feedlots. and validation in Nebraska of Minnesota emis- sion rates for other facilities, integration ofNebraskaweather data into the improved model, and development ofaplanning device (the Footprint tool) forNebraska industry and community use.
Currently we are equipping a por- table wind tunnel (emissions rate chain- ber) with appropriate gas sampling equipment and we will measure pre- liminary odor einission rates during the fall of 2002 to test the equipment and procedures. A second period of data collection will occur over a six- month period (March through August 2003) on emissions from 10 single- stage anaerobic lagoons in Nebraska. Samples will be collected at each lagoon on three occasions (early spring, early summer. and late summer). Within the limits of the ten lagoons to be sampled. we will identify a range of lagoon designs (different loading rates and conditions such as purple vs. non- purple). Odor samples will be shipped overnight to the University of Minnesota olfactoinetry lab for inten- sity measurement.
Odor emission rates will be expressed as odor units per square foot per hour and grouped to account for seasonal effects and lagoon design. Existing weather data (Nebraslta) and the Minnesota einission rate data set will be integrated with the lagoon odor emission rates to produce the initial Nebraska Odor Footprint tool. An advisory committee will be established to review project procedures and
(Continued on nest page)
2003 \-ebra~ha Sit rne Report - Pcge 51
results. t o provide guidance on Nebraska Odor Footprint tool devel- opment and application, and to develop consensus on issues that may be controversial. Representatives of producer associations. Farm Bureau, Nebraska Association of County Offi- cials. Nebraska Department of Envi- ronmental Quality (air quality division), and other organizations would poten- tially fulfill this role.
The Nebraska Odor Footprint tool will be refined with a user-friendly interface having specific outputs for producers and for planners. With the
It is hoped that the Nebraska Odor Footprint tool will assist producers in gaining approval for construction of new and expanded livestock facilities in Nebraska. A successfuI pro-ject will provide them with an ability to deter- mine the intensity and frequency1 infrequency of neighbor exposure to their odor footprint. based upon the size and type of housing, inanure storage and odor control technologies they plan to use. It will also allow producers to compare neighborhood impact of alternative sites for new facilities. In addition. it will give county
and the anticipated odor footprints with these options.
Weather conditions leading to higher odors in the neighborhood of a facility will be analyzed in the Odor Footprint tool. Odor episodes classi- fied based on the time of the day or season of the year will enable produc- ers to identify the situations when such episodes can potentially occur. Odor control technologies implemented only during these occurrence periods will help the producer minimize odors in the neighborhood more economically.
completion ofthis tool. an educational officials a way to understand the like- ' R ~ c h a r d Koelsch I S an assoelate pro-
program targeted at producers and lihood, magnitude and impacted area fessor and 5chLllte Is a professor I n county public policy and planning of- of odors for a proposed facility. t h e depa r tmen t s o f B ~ o l o g ~ c a l 5 ) s t e m s ficials will be delivered. All of these With this thev can then make inore Englneerlng and A n ~ m a l h e n c e Laltslim~
activities are dependent upon access to informed and better decisions on new K o ~ ~ o l U I S a research engineer I n the Depart- ment of B ~ o l o g ~ c a l $)stems Englneerlng
sufficient labor and financial resources. and expanded facilities. Finally, pro- The authors \\auld lllte to recognize that UNL and the Nebraska Pork Producers ducers and community leaders will have s~gn~ficant~nformat~onabouttlieOFF$ETmodel Association have wrovided some re- a common basis with which to evaluate for this paper \ \as adapted from I J n ~ \ e r s ~ t ) of
sources to move the Nebraska Odor alternative technology options (odor M1llnesota ') Larr) lacobson D a \ ~ d 5chm1dt k e \ l n l a n n ~ and
Footprint tool forward. housingtype* and lnanure 5 ~ 1 s a n u ood P e r m ~ s s ~ o n \ \as granted b) Larr) age type) for reducing odor emissions lacobsen
The Economic Potential of Methane Recovery: Projected Impacts of Various
Public-Policy Scenarios
Richard Stowell Christopher Henry1
Summary and Implications
Economic analyses ~clerepe~formed on unuerobic digestion of177anz~re,fj"on7 swine ,finishing operutions. The rlzuin ,factors considered 1c1ere ,futility size (1,000 head; 3,500 head; and 10,000 heud) and 177ethod qffinuncial sztpport provided (cost-share progrunz, no- interest loans, tax szlbsidies, and sub- sidized electrical sales). Installution qf a digester sj1ster7z is u significunt investr7zent that is cztn.entljl very di f i -
cult to just^. econonzicallj~ to Nebraska prodzuxrs based upon consideration of currently available inconze and expense estimates, regardless of facility sire. S~t, ine finishing opera- tions looking to invest in this technol- ogy ~cloztld benefit nzost ,Font a no- interest loan or cost-shareprograr7z - policies that relute directljl to the capi- tal cost incurred Larger operations ure n7ore likely to place a vulzte on odor control and ~vozlld experience u lon~er z1nitized effective cost than smaller operations. The efective cost n7ay still be zln~clieldj> in un indztstry 1c1it/7 tight profit 177argins, /701vet>er.
Analysis of Anaerobic Digesters in Nebraska
Methane recovery is often pro- moted as a renewable energy resource and as a means of managing inanure solids and controlling odors on live- stock farms. With or without electric- ity generation, however, methane recovery is generally not expected to be a profitable venture for most operations in Nebraska. To better understand the costs incurred and the likely impact of public policy deci- sions on the financial feasibility of anaerobic digesters, we evaluated the
2003 Yel~~*aslia SIL lrze Report - Page 52

following direct and indirect support mechanisms: grants (cost-share pro- grain), no-interest loans, tax subsidies, and subsidized electrical sales.
EPA's Ag Star software program Furnniorks 2.0 (1997) was used to evaluate the feasibility of anaerobic digesters inNebraska. Local values for farm energy costs. propane usage, etc. were obtained to more closely repre- sent Nebraska conditions. Three possible incentive programs were con- sidered that would subsidize anaerobic digestion. First. we considered the use of a no-interest loan for capital pur- chases. Second, we evaluated a cost- share program that would subsidize 20% of the capital cost of installing a digester. Third. tax credits of$O.OO 1 and $0.01 per kwh generated were consid- ered. Wind power sources currently receive a $0.01 7 per kwh federal tax credit. Finally. we considered the sale of excess generated electricity to the utility for $0.02 per kwh (approximate utility production cost) and $0.04 per kwh (twice the expected utility pro- duction cost).
In our analysis, we considered live- stock farms that would be the most likely to utilize this technology. For swine. the most likely situation would be that of finishing facilities with under-floor pits or pull-plug manure storage and removal systems. These facilities could utilize a complete-mix digester and were evaluated on that basis. Systems having very diluted manure (flushing. treatment lagoons, runoff collection ponds. etc.) or solid manure (bedded pack. separated sol- ids, etc.) do not lend themselves well to controlled anaerobic digestion and were not evaluated.
We also evaluated the relation- ship between size of operation and feasibility to determine the impact of farm scale. For this evaluation, 1,000- head; 3,500-head; and 10,000-head fin- ishing facilities were considered.
The impacts of the policylpricing scenarios on economic return were modeled for the types and sizes of operations described. The control sce- nario in each case assumed the follow- ing:
Table 1. hlodeled electricit? production and base cost of power generation for w i n e finishing operations.
Finishing capacit)
1.000 head 3.500 head 10.000 head
Cap~tal cost $125 000 $231 000 $191 000 Max a~inual e l e ~ t r ~ ~ output 82 000 1,M h 287 000 ItM 11 820 000 1,M h Excess e l e c t r ~ ~ ~ t ) 0 ItM 11 7 000 1,M h 38 000 1,M h Break-eben e l e c t r ~ ~ p r l ~ e 23c/I ,Mh 12 c/I,Mli 8 5 c /ltMli
Table 2. hlodeled return on inbestment from electric poner generation for seberal polic)/price scenarios on w i n e finishers (as a function of finishing capacit~).
Net present \ a l ~ ~ e 51mple pa) back Internal rate of return (w $1 .000) () ears) (%I
gcenarlo 1 000 3 500 10.000 1 000 3 500 10 000 1 000 3 500 10.000
No pollc) (control) -51 -61 -78 20 1 1 8 2 < 0 <O < 0 No-lnterest loan -36 -30 -6 20 1 1 8 2 < 0 <O 9 Cost-share = 20% -39 -35 -16 16 8 8 6 6 < 0 <O 1 Tax credlt
0 1 c / l tMh -51 -63 -72 20 1 1 8 2 <O < 0 <O I Oc/ltMli -19 -17 -27 20 1 1 8 2 < 0 <O 1
$ell electrlclt) 2 c ltM 11 - 5 1 -61 -73 20% 1 1 8 2 <0 <O < 0 1 c ltM 11 -51 -63 -68 20 1 1 8 2 <0 <O < 0
There IS no excess electrlclt) for t h ~ s slze operation
Table 3. Effectibe cost of methane reco\er) from swine finishing operations for odor control (no electricit! generation).
F~nlslilng capaclt)
gcenar~o 1.000 head 3 500 head I0 000 head
No pollc) (control) $57 000 $57/hd $98 000 $28/lid $188 000 $19/hd No-~nterest loan $13.000 $13/hd $72 000 $20/lid $131000 $13/hd Cost-share = 20% $15 000 $15/hd $76 000 $22/lid $112000 $l l /hd
20% down-payment made on capital investment (equity investment) Remainder financed at 8% on a 10- year loan Discount rate for farm capital = 10% Straight-line depreciation and 35% tax rate Operating and maintenance costs =
1.5%lyear Electricity purchase price (retail price paid to utility) = $O.OblltWh Excess electricity not valued (dis- tributed to neighbor or returned to utility free of charge)
types of evaluations. We believe the 1.5% annual charge for operation and maintenance to be low, especially for smaller operations, but could not find any recent data to suggest a more ap- propriate value. Using limited data from systems installed in the '70s and '80s would not accurately reflect iinprove- inents implemented since then. The other assumptions were based upon discussions with local livestock pro- ducers and utility representatives.
Results
The first five assumptions were The model outputs are presented based upongeneral values used in similar in Tables 1-3. Table 1 addresses the
(Continued on newt page)
2003 \-ebra~ha Sit rne Report - Pcge 53
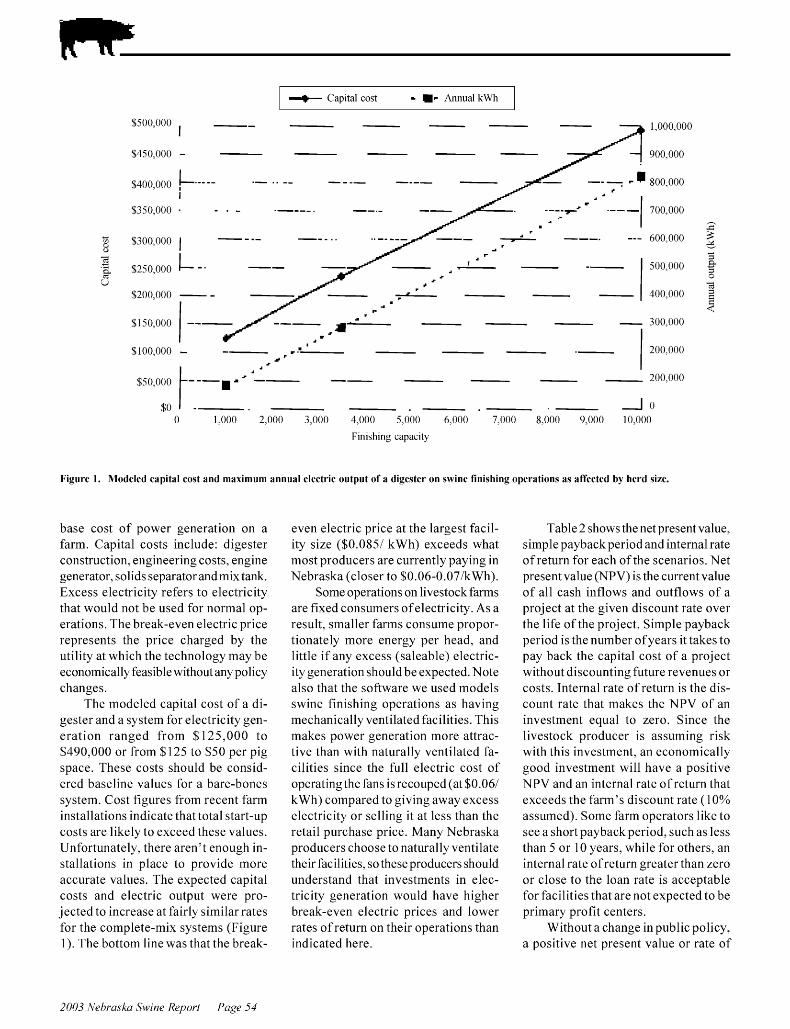
1 - Capital cost - I Annual k~l11 I
Finishing capacit)
Figure 1. \lodeled capital cost and maximum annual electric output of a digester on s ~ ~ i n e finishing operations as affected b! herd size.
base cost of power generation on a farm. Capital costs include: digester construction, engineering costs, engine generator, solids separator and mix tank. - Excess electricity refers to electricity that would not be used for normal op- erations. The break-even electric price represents the price charged by the utility at which the technology may be economically feasiblewithout any policy changes.
The modeled capital cost of a di- gester and a system for electricity gen- - eration ranged from $125,000 to $490,000 or from $125 to $50 per pig space. These costs should be consid- ered baseline values for a bare-bones system. Cost figures 'ifom recent farm installations indicate that total start-up costs are likely to exceed these values. Unfortunately, there aren't enough in- stallations in place to provide more accurate values. The expected capital costs and electric output were pro- jected to increase at fairly similar rates for the complete-mix systems (Figure 1). The bottom line was that the break-
even electric price at the largest facil- ity size ($0.0851 kwh) exceeds what most producers are currently paying in Nebraska (closer to $0.06-0.071kWh).
Some operations on livestock farms are fixed consumers ofelectricity. As a result. smaller farms consume propor- tionately more energy per head. and little if any excess (saleable) electric- ity generation should be expected. Note also that the software we used models swine finishing operations as having mechanically ventilated facilities. This makes power generation more attrac- tive than with naturally ventilated fa- cilities since the full electric cost of operatingthe fans is recouped (at $0.061 k w h ) compared to giving away excess electricity or selling it at less than the retail purchase price. Many Nebraska producers choose to naturally ventilate their facilities, so these producers should understand that investments in elec- tricity generation would have higher break-even electric prices and lower rates of return on their operations than indicated here.
Table 2 shows the net present value, simple payback period and internal rate of return for each of the scenarios. Net present value (NPV) is the current value of all cash inflows and outflows of a project at the given discount rate over the life ofthe pro-ject. Simple payback period is the number ofyears it takes to pay back the capital cost of a project without discounting future revenues or costs. Internal rate of return is the dis- count rate that makes the NPV of an investment equal to zero. Since the livestock producer is assuming risk with this investment. an econoinically good investment will have a positive - NPV and an internal rate of return that exceeds the farm's discount rate (10% assumed). Some farm operators like to see a short payback period, such as less than 5 or 10 years, while for others, an internal rate of return greater than zero or close to the loan rate is acceptable for facilities that are not expected to be primary profit centers.
Without a change in public policy, a positive net present value or rate of
2003 Yel~~*aslia SIL lrze Report - Page j l
return was not obtained for any of the farm sizes. This indicates that methane-fueled electricity generation is not projected to be a profit center on Nebraska finishing operations and confirms the previous findings that the break-even electric price is greater than that currently charged. For the 10.000-head facility. the payback period was less than 10 years, which might be viewed as acceptable by soine for long-term investments.
Forthe finishing facility sizes con- sidered. no policylprice scenarios were projected to make digestion of inanure for electricity generation profitable. The no-interest loan and 20% cost- share scenarios were the most advanta- geous scenarios for finishing operations - for each finishing capacity considered.
Table 3 shows the modeled effec- tive cost of recovering methane with a digester for the sole purpose of con- trolling odor. In this scenario. no elec- tricity was generated and the cost of electric generators was excluded. The effective cost is simply the net present value of the investment (which would be negative) made into apositive num- ber. and equals the capital cost plus the current discounted value of expected future operating costs and tax implica- tions. The benefits ofano-interest loan and a cost-share program are shown (in terms of their reduced effective cost) compared to the current situation where no subsidization is available. For fin- ishing operations. the model pro-jected a unitized effective cost ranging from $1 3 per pig space for a 10.000-head operation taking advantage of a no- interest loan to $57 per pig space for the 1.000-head finisher under current policies.
Conclusions and Implications
Clearly, installation of a digester system is a significant investment. It is
also an investment that is currently very difficult to justify econoinically toNebraska livestock producers based upon consideration of current income and expense estimates, regardless of facility size. Modest energy costs are generally advantageous, but they make - energy-related investments less attrac- tive toNebraska producers than to pro- ducers in other regions.
As the size of a livestock opera- tion increases, the fixed capital costs of a digester system can be spread over more aniinal production units, making both generation of electricity and use of a digester primarily for odor control more advantageous.
Swine finishing installations likely would benefit most from a no-interest loan or cost-share program p o l i c i e s that relate directly to the capital cost incurred.
To compare the effect of the same policy change between species, 1.000 milking cows are nearly equivalent to 3.500 finishing hogs. on an aniinal- unit basis (I pig = 0.4 AU: 1 cow = 1.4 AU). Strategies that may work for dairy operations are not feasible forthe same 'size' of swine operation, however. This can be traced to the fact that the same "size" dairy generates about 3 times the electricity for 20% higher capital costs (data for dairies not shown).
Installing a digester solely to cap- ture methane and reduce odor emis- sions involves an expense that producers need to be able to justify. Small pro- ducers will likely find the costs pro- hibitive for obtaining odor control. Larger operations are more likely to place avalue on odor control and would experience a lower unitized effective cost than smaller operations. The cost may still be considered unwieldy in an industry with tight profit margins, how- ever.
As more information becomes avail- able about the cost of odor-control
strategies. it will be interesting to see how anaerobic digestion compares with other odor-control methods. For illus- tration. a more rudimentary approach to odor control is to cover a treatment lagoon or manure storage, usually with a floating geotextile fabric. The projected capital cost of covering a manure s t o r a g e where more intense odor will be generated than for a treatment lagoon and the area to be covered is l e s s is a little over $5/pig space for finishing pigs for a 3,500- to 4,000-head facility. An additional likely advantage to using a digester is that since the inanure is treated. there would be fewer odors generated dur- ing application of the manure. Since this is a relatively infrequent activity, one must weigh this benefit against the additional costs incurred.
Low retail energy prices relative to other regions and a lack of consumer understanding ofthe value derived are major barriers to adoption of anaero- bic digestion in Nebraska. Therefore, it seems clear that. unless industry- wide changes in operating practice occur, soine sort of public policy incentive will be necessary to allow this tech- nology to penetrate the farm sector. Financial credit is not provided for the environmental and social (odor- control) benefits of this technology so, under current economic condi- tions. the technology is not eco- nomically appealing for individual producers.
'Richard Stouell is an assistant professor. Biological Slstems Engineeringa nd Animal Science and Christopher Henr) is an Eutension engineer. Biological S)stems Engineering. References alailable from the authors upon request.
T h i s report n-as developed n-ith tech~lical input from Rick Koelsch and Dennis Schulte (UNL Biological Systems Engineering), Frank Thompson (Nebraska Public P o ~ ~ e r District), and Jeff Keon-n (UNL A~l i~ l l a l Science).
2003 \-ebra~ha Sit rne Report - Pcge 55
Agricultural Management Advisory Groups for Pork Producers
Allen Prosch'
Summary and Implications
Porkprodzuxr,r face cotnplex nzan- agetnent decisions and thej. need assistance n,ith this cotnplexity. Pork prodzlcers needto increase their ali.are- ness of the value of intangible assets szlch as relationships and knon.ledge. Pork prodzuxrs tnzlst valzle, enzploj., and extract value fi.om the use o j intangible assets. Agricz~ltural nzan- agenzent advisory services assist prodzuxrs in extracting va1uefi.ot11 the use of intangible assets szlch as knon,ledge. Pork prodzlcers need to participate in advisorj. services. Pork prodzuxrs can zlse group eflorts to efectivelj. create szlch services. Advi- sory services can improve the ~t ,el l being ofprodzuxrs bj. increasing their knon,ledge of and ability to deal n,ith external inj'luencers that a f ec t their bzminesses.
Introduction
The most dramatic changes occur- ring in agriculture might best be described in terms of changes in the fundamental business proposition and the ways of doing business. A manage- rial implication is that agricultural managers will need to learn how to appreciate, employ. and extract value from the use of intangible assets.
Critical to understanding this change is the recognition that the con- cept of assets employed by an opera- tion is more comprehensive than the perspective of resources used in the past. Previously physical and human resources were the primary assets. Now the operation's resources may include intangible assets such as inarlteting systems, decision-malting processes, coordinating systems, and established patterns ofproduction. Production and inarlteting systems empowered and
continually refreshed by new knowl- edge gained from the firm's operations can be powerful sources of competi- tive advantage.
Producer Needs
In the United States. family farm- ers have traditionally made decisions by themselves with whatever informa- tion they might gather. Producers today feel the overload of data as much as any business person. The ability to assimilate all data. turn it into decision making information and acting on that information is difficult. Increasingly, the data needed is outside the normal expertise and reach of producers.
Pork producers represent a group as challenged by the need to extract value from knowledge as any segment of agriculture. Pork production has changed dramatically consolidating into fewer largerunits. Pork producers need to increase their knowledge of external influencers that affect businesses. External problems experienced with environmental and social issues do not always have tangible solutions. Pro- ducers are pinched by low margins and feel disenfranchised in their indus- try. Producers leave the industry despite having operations that are cost- effective. They exit the industry for a variety of reasons including produc- tion. economic. educational, environ- mental, and social issues. many ofwhich are intangible.
The skills that create competitive advantage and result in higher reward are changing. Producers need to have trusted resources to improve their information. They need to have greater knowledge of the value of their products. They need to have a better awareness and understanding of what changes to make in their opera- tion. Producers need to be able to create and manage intangible assets such as information and relation- ships. Producers need to capture more
knowledge out of their operations and capture more knowledge out of the transactions with both input suppliers and output buyers to improve their competitive advantage.
Producers who have a support system that can improve their ability to manage knowledge and extract value from that knowledge are likely to have increased success. Producers need help to accomplish all these activities.
Consulting Services
Pork producers who are already better able to extract value from such knowledge now have a competitive advantage. Those producers may hire consultants or have staff that can deal with these issues. The ability of an individual to obtain accurate, timely advice that is tailored to the individual unit is limited. Private consultants are challenged to provide in depth service while expanding a client base. Limited contact reduces the producer's ability to trust and rely on the advice.
In either case, whether hiring a consultant or hiring staff. the producer with highervolume can obtain agreater degree of individual attention. That individual attention given to extract- ing value from intangible assets, be that specific knowledge or a relation- ship, gives producers a new competi- tive advantage. It increases a businesses' ability to understand and to deal with complex issues.
While U.S. producers have been expected to develop these resources and abilities and implement them on their own, other countries have not- able variations. Danish agricultural producers have a producer-owned system that gives farmers advise on technical, economic, educational, information technology, and social issues.
The key issue is whether pork producers would join together to form an entity that would provide advice
2003 Yel~~*aslia SIL lrze Report - Page 56

that is focused on their individual unit's needs. To do so they would need to work together to spread the cost over sufficient production. In doing so. they would not have to become expert at extracting value from intangible assets, nor would they be required to acquire all the data to make decisions. Together they could gain many of the competi- tive advantages now being enjoyed by a limited number of producers.
Producers do need to be able to trust and rely on the advisor. The focus needs to be on their unit and the best solutions fortheir operation. Onelnethod to accomplish that would be to create a business entity that hired the specialist needed. This would tend to minimize conflict of interest. avoid time spent on marketing the consulting business and allow the specialist to concentrate on providing high quality service.
Producers identify the highest pri- ority needs and acquire persons with expertise to provide them with service. Items such as customer relations, price riskmanageinent, environmental regu- latory compliance, zoning regulations and comprehensive nutrient manage- ment planning are issues of such com- plexity and such magnitudes ofchange that producers would benefit from advice specific to their operation.
Conclusion
Reducing the diversity oftype and size of producer threatens the flexibil- ity of the pork production industry. When challenged by new or unusual circuinstances to meet societal goals production systems must meet objec- tives in environment and animal hus- bandry practices. Pork production must also provide the producers and employees with a livelihood that is satisfactory and that encourages future participation. Increasing the competi- tive advantage of a larger number of individual producers is important to the future of the industry.
IAllen Prosch is the Pork Central Coordl- nator at the Un~rers~ t ! of Nebraska L i~ lco l~ l References are a ra~ lab le b? request fro111 the author
Case Ready and Enhanced Pork - How Do Ingredients
Make Them Work?
Mike Baczwaski Roger Mandigo'
Summary and Implications
Care readj pork prodz~cts have gro~t n at a tretnendoz~s rate slnce the earlj, large rcale ~ntrodzlctronr of the nzld 1990s Estlnzates exceed 9 blllron pleces In the nearj'i~tz~re, zlpJi.ot71 500 nzlllron rn 1997 and 1 2 brlllon rn 2000 Ertrtnutes are that be01 een 70-8094 of t h e p e r h pork at the rzlpertnurkets rr noli utrllrlng t ~ t o technologres In the case-readj statur These tli o tech- nologres rnclzlde enhancetnent and nzarlnatlon Enhancenzent 1s the appllcatron of a rolutron of ~t ater, ralt and sodrunz phorphates, usz~ul l j approxltnatelj a 12% solz~t lon Marlnatlon expands the rolutron n lth jla~qor and texture profiles lnvohqrng add~tronal rngredrents The nzajor value- added nzeat procerrorr of case readj pork productr are Ji.erh-tneat pro- cesrors and retaller co-packerr and the llrt contlnz~er to groli ruprdlj Jzlrtrficatron forporkprodz~cers, tneat processors and conrzltnerr are nzanj These ad~.antages rnclude better drs- trrbutron of prodz~cts or ln-stock at retuzl and lesa oztt-of-atock on a 24 /7021r baaza, labor avazlabzlrtl)~ at t/7e retazl level, less ahrrnk, greater coat auvzngs, andnzost rniportantl~~ zncreaaed foodaufet~: conszlmer satra fuctron, con- azatencj: tenderness andjztrcrness
Introduction
There are several technologies that producers of case ready meats can uti- lize to improve product consistency and extend shelf life. Consistency is a
goal that all producers strive for regardless ofthe industiy segment. Case- ready pork allows consumers to experience more consistent fresh pork in regards to color, texture, and eating quality. Case-ready meat allows a shelf life of two to five weeks following addition of an enhancement solution and fabrication to retail cuts. This is compared to a five to 12 day shelf life seen with traditional pork cuts fabri- cated at the retail store and packaged with the conventional shrink wrapped fresh meat packaging. Extending case- ready meats shelf-life allows for improved processing at large, efficient, central fabrication plants close to the source of the pork. With case-ready concepts. only consumer products are shipped through distribution centers for filling of the needs of the local stores. Fat and bone removed have utilization and value maximized at a central location. Extended shelf life may be accomplished with modified atmospheres containing gases such as carbon dioxide, nitrogen and oxygen in different combinations. Marinated or enhanced products can be vacuum packaged to extend refrigerated prod- uct sales life. Cases-ready pork also reduces in-store meat cutting. prepara- tion, and packaging which also has a beneficial effect on food safety due to reduced handling and improved tem- perature control.
Case-Ready Benefits
Case-ready pork will reduce the amount of out-of-stoclcmerchandise in the retail case and increase availability of complete lines of products. Product management and inventory control is
(Continued on newt page)
2003 \-ebra~ha Sit rne Report - Pcge 57

much more efficient without in-store meat cutting and packaging. There are new thrusts for case-ready pork that include enhanced or marinated products.
Enhancements and Marinades
Enhancement can be defined as fresh pork that is injected with a solu- tion of water. salt. sodium phosphates and a potentially large range of natural flavors such as rosemary extract and lemonjuice. The pork isusually pumped to 8- 12% of original weight. A inari- nade typically contains the same ingredients as the enhancement solu- tion plus flavor components such as caramel colorings and top dressings with whole and/or cracked spices and other flavors. Thus, there are anuinber of non-meat ingredients that have increased the opportunity for fresh and processed pork in the retail marketplace.
Functionality of Ingredients
The functionality of the non-meat ingredient varies. Non-meat ingredi- ents contribute to product flavor and appearance. Ingredient functionality includes the role in water holding capacity, binding through salt bridges, swelling by phosphates, and impact on overall juiciness and texture proper- ties on the finished product. While increasing yields with the use of non- meat ingredients is econoinically iin- portant to the processor. optimizing their functional impact on tenderness, juiciness. texture and flavor is the most important factor.
Water
The biggest non-meat ingredient used in case-ready pork is water. Water quality, with respect to hardness and possible contaminates, influences potential benefits ofthe ingredient. Hard water reduces the ability of certain non-meat ingredients to dissolve and reduces the solubility of phosphates, salt and other large molecular weight ingredients. Without properly dissolv- ing in water, phosphates and other
ingredients will precipitate and not go into solution. If these ingredients pre- cipitate out. poor binding in meat pro- teins will occur. resulting in poorwater retention. Contaminates in water. such as iron and copper. increase oxidation. Oxidation ofcolor by lipid and protein oxidation causes a negative effect on flavor and appearance. High chlorine levels in water have an oxidative effect on finished product by increasing lipid rancidity and loss of color stability. Waterretention can be effectively con- trolled through adjusting pH. The iso- electric point (PI) of meat is the point at which the net ionic charge is equal to zero. The pl for fresh post-mortem pork generally occurs at pH 5.3. At the pl, there are no free charges and the fibers are attracted to one another, resulting in minimal space between the fibers. Altering pH with the use of an enhancement solution or a marinade allows charges to cause repulsion of the fibers and attract free water. To accomplish this alteration ofpH. alka- line phosphates are generally used. The use of phosphates increases water retention in pork during processing, distribution and final cooking or reheating.
Salt
Salt is a major non-meat coinpo- nent of any marinade or enhancement solution. Salt is needed for the solubi- lization of pork myofibrillar proteins. Through this process it binds sinall pieces to one another while allowing for subtle solubilization of proteins within the muscle. Salt can also create a negative effect by causing a rubber- like texture when excessive protein solubilization has taken place. In addi- tion, subjecting pork to too much ine- chanical action in the presence of high salt and phosphate levels can be detri- mental to desired texture. Typically, sodiuin chloride is the processor's salt of choice but in the cases where excess sodium content may cause problems, alternatives can be used. Potassium salts can be used but they tend to pro- duce bitter or metallic aftertastes. In the case where there is a masking
flavor such as with marination, these potassium salts work well.
Bulking and Water Binding Ingredients
Other non-meat ingredients that are common in case-ready meats include the broad category of hydro- colloid gums. These gums include carageenan, konjac flour. xanthan. and gellan gums. Their function is to increase water holding capacity and aid in retaining water throughout the cooking process. Gums are primarily used in pork products that are low-fat or fat-free.
Lactates and acetates are antimi- crobial agents that extend shelf life. Lactates. usually sodiuin or potassium, are ingredients that are derived from corn or beet sugar. Lactates act as a bacteriostat by interfering with bacte- rial metabolism and increasing the lag phase of growth. Specifically. lactates inhibit growth of Listeria nzono- cjtogenes, Staphjlococcus, Salmonella and Clostrid~um botulinz~tn. By doing this. lactates decrease microbial growth therefore increasing shelf life. Research has shown that with the addition of lactate, fresh sausage shelf life can be increased from 30 to 70% and roast pork shelf life can be increased 50 to 100%. The addition of lactate in pork products acts to protect against refrig- eration challenges oftransportation and retail storage and handling. In case ready porkproducts, temperature abuse comes in the form of retail refrigera- tion inconsistencies, consumer abuse after the product is purchased prior to home refrigeration and increased tem- peratures of home refrigeration units.
Sodium diacetate, a salt of acetic acid, is a biocide that reduces the ini- tial microbial load, but has the poten- tial for unwanted flavors and odors. Commonly a combination of lactate and diacetate allows for lower levels in the product while obtaining a coinbi- nation of both bactericidal and bac- teriostatic actions.
2003 Yel~~*aslia SIL lrze Report - Page 58
Reducing Agents
Reducing agents play a key role in case-ready meats. Such ingredients are sodiuin erythorbate and sodiuin ascorbate. While these ingredients are important in flavor. improving shelf life and keeping quality. the most important role of reducing agents is to reduce the tendency offresh meat color to darken and turn more brown.
Traditionally, food processors have used synthetic antioxidants developed
from fats and oils such as BHA and BHT. Since it is required to declare these ingredients on the product label. they are not often used in enhanced pork products. Instead, the use of natural antioxidants in the form ofherbs. spice extracts and fruit pastes have become widely adapted. Lemon juice is also being used to offset flavors of the antioxidant due to its ability to inaskoffflavors as well as its potential antioxidant characteristics.
The popularity of case-ready pork
products is increasing and utilizes the technologies ofenhancement solutions and the more involved marinades. Benefits include product availability, convenience, consistency. improved retail meat management and the ever present need for increased food safety.
'Mike Bacz\\asl;i is a g r a d ~ ~ a t e student. and Roger Mandigo is a professor in t he Department of Animal Science.
Fresh vs. Frozen Bellies for Bacon
Carmina Robles Roger Mandigo'
Summary and Implications
The zlre offiorenpork belller l r a conztnon practrce In the bacon tnunzl- factz~rrng rndzlstrj Frozen bellres per- nzrt the le~.ellng of sz~pplj n lth sllced bacon needs, reasonal Iqarlutrons and the rncrearlng \.alzle reco~.erjfionz the be& Freerlng pro~qrdes an excellent nzeans of rtorlng bellres for tnore e f l - clent ure at later tltnes C'oncernr that qzlalltj does not ltnprove 11 rthfieezrng andstorage and agreater underrtand- rng of the rtnpact offieezrng belller on bacon qualrtj are Iqerj rnzportant Bel- ller In thrs rtudj n ere fiozen for at lear t l j dajs prror to defiostlng and the rtart of procesrrng Rerultr szlg- gert that the zlse of fierh or fioren be / / re~ zn t/7e r7tunzlfactz~re of bacon 11 oztld lead to A zmzlar yzelds ProcesA- zng jlrelds znclztdzng percent pztnip, ~ntokehozt~e j'zeld ~lzcrng and total b u c o n j ~ z e l d ~ ~ ere very szntzlar Genetrc lzne and seY of thepzg znipacted qztan- trtjl ntea~ztres znclz~dzng theprocesszng j~zelds of bucon Longer Atorage tzmea coztld have added to qztulrtl)~ drffer- ences and concern^ S/7orf-ternif iom Atorage of bellzes ha5 r7tznzr7tul znipact on slrced bucon qztulrtl)~ and perfor- niance uttrrbzlte~
Introduction
Curing meat has been an effective process for centuries and was used long before refrigeration provided for more than a seasonal means of preser- vation. The Greekand Roman civiliza- tions were advanced in methods of meat preservation such as salting and pickling. In addition to preservation, curing and smoking adds unique fla- vors. textures. variety and convenience with new products. This study is a part of the National Pork Producers Coun- cil research effort on Lean Growth Modeling to improve the quantity and quality of pork. Through the years the emphasis of increased lean, reduced fat and leaner consumer products has been the impetus for more research of bacon. Freezing of raw bellies, a long practiced process, leads to potential concerns about loss ofquality and quan- tity of sliced bacon. Freezing provides an excellent means of storing meat for long periods oftime, but, the quality of meat could decrease. Ice crystals are formed within the food products dur- ing freezing. Damage could occur to the tissue, including changes in the water holding capacity, texture, and surface color.
During thawing, undesirable phe- nomena such as exudate loss, evapora- tion loss and deterioration of fat and protein occur. The effect of freezing
and thawing on bellies on subsequent processing of the bacon has not been reported extensively in the literature. Besides industry processing practices there are other production factors that influence bacon characteristics. Today pigs are bred and fed to be leaner. Consumers prefer leaner pork today than ever before, and thus the industry is turning to raising leaner. heavier muscled pigs to meet these demands. Lean-to-fat ratio is a major decision factor in a shopper's selection of ba- con. However. with these leaner pigs, bacon processing characteristics such as smokehouse yield and total bacon yield are often inversely related to car- cass characteristics desired by others including producers. packers and con- sumers. The goal of this work is to understand the quality and quantity of sliced bacon as impacted by certain live hog factors and processing fresh and frozen bellies.
Procedures
A total of 578 bellies were ran- domly assigned to two treatments; fresh or frozen. The project included pigs from six genetic lines: Chester White, Berltshire, Duroc, Landrace, Poland China and Yorltshire (Table 1). Gilts and barrows were included in the study. After slaughter, the belly was removed
(Continued on nest page)
2003 \-ebra~ha Sit rne Report - Pcge 59

Table 1. Least square means for loin eye area (LE;I) and backfat (BF).
overnight. Bellies were weighed to determine smokehouse yield. vacuum packaged and stored (24°F) for subse- quent commercial pressing. The pressed slabs were sliced to determine slice yield. number of slices. slice evalua- tion and camera visioned for lean and fat content.
pumping. There was no significant dif- ference between fresh and frozen bel- lies with respect to smokehouse yield (Table 2).
The type of belly had a significant effect on slicing yield. Fresh bellies had significantly better slicing yields (P <0.05). Warmer freezing tempera- ture (14°F vs. -7.6"F) causes larger ice crystals. Crystals formed between fi- bers (higher temperatures) will gener- ate pressure which will separate fibers, while crystals formed at lower tem- perature form intracellularly and result in less damage in the fresh bellies as compared to the frozen bellies. There was no difference between fresh and frozen bellies in total yield.
Effect LEA (in2) BF (in)
Berhshire Chester White Duroc Landrace Poland Chma Yorksh~re
Results and Discussion
Sex Barron s Gilts
Pumping percent in bellies previ- ously frozen [frozen bellies] was sig- nificantly higher (P <0.0 1) than in fresh bellies. Frozen bellies retained 0.73% more brine than fresh bellies (Table 2). Research has demonstrated that frozen meat has a higher drip loss than fresh meat. Frozen meat suffers greater dam- age in cellular structure, resulting in cavities and free space between meat fibers where ice crystals can form dur- ing freezing. Perhaps this loss ofwater from the cell during thawing, coupled with distortion that the cells may have suffered during frozen storage. made the cells dryer and perhaps more flex- ible. Therefore. frozen bellies may be able to hold more injection pickle after
a b ~ d Means n ~ t h i n the same colum~l nith111 a main effect\\ ith s~~llilar superscripts are not significantl) d~fferent (P>O 05) 'P 1 alues from Anal) s ~ s of Variance for each lllain effect T\ ithin a 1 ar~able LEA = L o ~ n e)e area BF = Bachfat measured on the 10''' r ~ b Genetic Line Efect
There was a significant effect of genetic line and fresh vs. frozen belly type on puinpingpercent. Poland China pigs had the highest brine retention, significantly higher (P<0.05) than Yorkshire, Duroc, Berkshire and Landrace lines. but similar to Chester White for puinped yield. Poland China
from one side of pork. cut to industry standards (NAMP #409). vacuum pack- aged and shipped refrigerated to the University of Nebraska Meat Labora- tory. They were assigned to treatments of either freshlrefrigerated (37°F) or frozen and stored for 15 days before processing. The frozen bellies were stored at least 15 days (5°F) prior to defrosting for processing. Following industry standards the raw bellies were injected and heat processed into cooked bacon slabs. Two days prior to produc- tion the frozen bellies were taken out ofthe freezer and were defrosted (37°F). On the day of production. either fresh or frozen bellies were placed in awater thawing tank. immersed in cold (40°F) air agitated water to insure complete thawing of frozen bellies and similar treatment of the fresh bellies. The bel- lies were cured by injection of apickle solution that contained water, phos- phate, salt, sugar, sodiumnitrite (cure) and sodium erythorbate. The bellies were puinped to a target of 112% of green weight, on ainultiple needle com- mercial bacon injector. Green weight and post-pump weight were recorded. The bellies were hung with combs, placed on smoltehouse trucks and al- lowed one hour for cure equilibration before thermal processing. Bacon was coolted to 128°F and chilled at 37°F
Table 2. Least square means 2 S.E. of percent pump, smokehouse >ield, slicing jield and total >ield as affected bj line, sex and treatment.
Percent Smokehouse Slici~lg Total Effect pu~npr yield (%f yield (%)' yield (%f
Line Berhshire Chester Wh~te Duroc Landrace Poland Chma Yorksh~re
Sex Barrou s Gilts
Treatment Fresh Frozen**
abcd Means \tithin the same column and uithin a main effect \\it11 similar superscripts are not significantl) different (P>0.05). *P ~ a l ~ ~ e s from Anal)sis of Variance for each main effect \tithin a bariable. **Frozen stands for bellies that \\ere frozen at - 5 ' ~ prior to processing. e~ercent pump = (\\eight of the p ~ ~ m p e d bell) 1 initial bell) \\eight) w 100. f Smol;eho~~se )ield = (\\eight of the coolted bell) 1 initial bell) \\eight) w 100. 'Slicing )ield = (\\eight of the center of the sliced bacon slab 1 \\eight bacon slab) w 100. I1 Total )ield = (\\eight of the complete sliced bacon slab. less incomplete end pieces 1 bell) \\eight) w 100.
2003 Yel~~*aslia SIL lrze Report - Page 60
and Chester White lines had higher backfat thickness and lower loin eye area and were thus fatter and lighter muscled than the other breeds (Table I), a result different from previous reports that light muscle and fat lines had lower percent pump. In this study, the lowest pumping yield was observed in the Duroc pigs which had the largest loin eye areas and low backfat content. Pigs in this study were comparatively leaner than some in previous work.
Genetic line had a highly signifi- cant effect (P<0.01) on smokehouse yields. Berkshire line had the highest yields and were different (P<0.05) than all other lines. Landrace had the lowest smokehouse yield and was significantly different that all other lines. Berkshire pigs had the highest backfat. Landrace, Yorkshire and Duroc pigs the lowest backfat. These results are in agreement with the previous studies that reported fatter bellies tended to loose less weight during the heating process. Genetic line had a significant effect on total bacon yield. Bacon slabs from Berk- shire pigs had the best total yield per- formance. followed by the Poland China and Chester White pigs. These three lines had the highest backfatthickness, again showing the relationship between fat content and total yield.
Sex Efect
Sex had no statistical influence on pumpingpercent or smokehouse yield, important measurements followed during the manufacturing process in many commercial bacon plants. Sex had a significant impact on slicingyield with barrows having a greater slicing yield than gilts (P < 0.05). Barrows had significantly higher total bacon yield than gilts (P < 0.05). Barrows were fatter thangilts (Table 1). Slicing yield increases with bacon slabs that are fatter.
lCarmina Robles is a graduate student, and Roger Mand~go . 1s a professor in the Department of A~li~l lal Sc~ence
Fatty Acid Composition of Fresh Pork Bellies - Implications to Bacon
Production? Carmina Robles
Betsy Booren Roger Mandigo'J
Summary and Implications
Conztnerc~ul bacon procerrorr open rarse concernr regardrng the nzanagenzent practlce of fioren stor- age of the bellres prror to cz~rlng and processrng for rlrced bacon Deterro- ratlon of qualltj measurer rr a con- cern andls usuallj attrrbz~tedto fieelel. rtorage A recondarj rsrue, rn the prodzlctron of bacon rnclud~ng thore procersed fionz fiozen bellres, l r the e fec t of breed and sex ofplgs There- fore, an experlnzent 11 as condzlcted to deternzrne the e fec t of a 15-daj fioren rtorage tlnze, the genetrcs, and rex of the prg on the qualrtj and fato acrd profile ofpork bellres Frozen storage of f ierh pork belller drd not pore anj rlgnrficant qualro problenzs H o ~ i eIqe/; rlgnlfrcant dfferencer rn the fattj acrd profile of fat fiotn the belller 1.1 ere obrer~vd be01 een breedr ofprgr Fat accounts for abozlt 60% of the conzporrtron of a rlrce of bacon Thur, fato acld dgerencer o f f i e rh belller due to breed efectr tnaj have a srg- nrficant znlpact on bacon fatt]l' aczd conlpoa ztron
Introduction
Consumer demand for lean meat products certainly has extended to cured and smoked sliced bacon. Consumer purchases of bacon are based on lean- ness, rather than brand name reputa- tion and price. The largest growth in demand for sliced bacon has been in the food service industry recently, where
bacon is seen as a flavor contributor for sandwiches, casseroles. salads. and other condiment uses. Consumers say that the amount, composition and con- sistency of fat are very important to their purchasing decision-making pro- cess. Sliced bacon quality problems are associated with fat separation, color of fat. color of lean, consistency and flavor.
Understanding the role of fat in bacon begins with an understanding of the variables that impact the amount and quality of the fat found in the bacon. The fatty acid composition of the fat found in the belly will poten- tially iinpact the processing character- istics of the belly, such as the slicing, cooking and eating quality of the bacon. Many factors can influence fatty acid composition including the breed and sex of the pigs as well as other management strategies.
This study is a continuing effort of the National Pork Board to character- ize lean growth in pigs and the produc- tion of pork products. Additionally, the bellies were evaluated to under- stand the iinpact of freezing of raw bellies prior to production of bacon. Frozen storage of fresh bellies is a common practice to manage the cycli- cal and seasonal supplies of pork bel- lies. Yet freezing does not usually improve the quality of meat and cer- tainly not the quality of fat and its role on the ultimate eating quality of the bacon.
Procedures
The animals in this study included barrows and gilts (n=578) from six genetic lines: Chester White, Berkshire,
(Cont~nued on nest page)
2003 \-ebra~ha Sit rne Report - Pcge 61

Table 1. Least sqnare means + S.E. of the fatty acid profile for sex, line and treatment effects.
Effect l1:O 16:O 16:l 18.0 18.1 18:2 1 8 3 20: 1
Barrou s Gilts
Berltshire Chester Mlhite Duroc Landrace Poland China Yorl;sliire
Fresh Frozen
a.b.c.d.e Means \tithin a column \tit11 different s~~perscripts are significant P<0.05
Table 2. Least square means 2 S.E. for saturated and unsaturated fat5 acid content b? sex, line and acids than barrows (P<0.05). This dif- treatment effect. ference becomes part of the variability
Unsaturated Fat8 Acids - % Saturated Fat8 Acids - % often seen during pacltaging of sliced bacon. This is well within the range
Barrom s 61 13iO 26" 37 71iO 27" that impacts slicing efficiency found in Gilts 62 5 l iO 22' 36 59iO 23' commercial slicing operations.
Berhshire Chester White Duroc Landrace Poland Chma Yorksh~re
Fresh Frozen
a b c Means n ~ t h a colum~l for an effect ~11th different superscripts are sign~ficant P<O 05
Duroc. Landrace, Poland China and Yorkshire, slaughtered at markets weights starting at 245 pounds. After slaughter. the bellies were fabricated according to industry standards. Bel- lies were randomly assigned a treat- ment of fresh (stored only under refrigeration) or frozen (stored frozen for a minimum of 15 days). Prior to processing, frozen bellies were defrosted, removed from the storage packaging, a fat sample removed from the anterior end of the belly for fatty acid analysis. The samples were frozen for subsequent inethylation and frac- tionation by gas chromatography. The fatty acid composition was determined for saturated fatty acids including inyristic (C14:0), palmitic (C 16:0), stearic and unsaturated fatty acids including palmitoleic(C: 16: 1), oleic (C 18: 1) linoleic (C 18:2), linolenic
(C 18:3). and 1 I -eciosenoatic (C20: I). These were selected as they account for over 95% of the total fatty acids typically found in pork bellies. Each fatty acid was reported as a percentage of total.
Results and Discussion
Barrens and Gilts Cotnparisons
The only difference (P<0.05) observed between sexes (Table 1) showed a minor difference for palmitic (C 16:O) acid, although this may not be ofbiological significance. Barrows had greater levels(P<0.05) of unsaturated fatty acids (Table 2) with 6 1.43% for barrows and 62.5 1% for gilts and satu- rated fatty acids 37.71% for barrows compared to 36.59% for gilts. Gilts had 1.08% more unsaturated fatty
Breed Con~parisons
Fatty acid profiles for the six dif- ferent breeds were compared. Yorlt- shire pigs had the most unsaturated fat (64.35%), Landrace and Duroc were intermediate (62.40% and 62.89%) and the Poland China, Chester White and Berltshire were lower in unsaturated fatty acids (61.46%, 60.5 1% and 60.2096, respectively). The range for unsaturated fatty acids within the 6 breeds evaluated was 4.15 percentage units (Table 2).
The breed influence illustrated in the five largest percent fatty acids reflects the breed differences for spe- cific fatty acids. For C 16:O palinitic acid there was 3.14 percentage unit variation between the Berltshire (25.09%) and the Yorkshire pigs (2 1.95%). The other saturated fatty acid. C 18:O. stearic had low variabil- ity between the breeds represented in this study with a difference of only 1.40 percentage units from the Durocs (1 1.99%) to the Yorkshire pigs (1 0.69%). Themost variation was found for fatty acids C 18: 1 and 18:2, oleic and linoleic. bothunsaturated fattyacids. The variation was 5.45 percentage units for the oleic and 6.48 percentage units
2003 Yel71*aska SIL lrze Report - Page 62

for the linoleic acid within the breeds evaluated. These results clearly show differences exist between breeds in the fatty acid profile belly fat. The inag- nitude. while statistically significant, would be hard to use for sorting and/or altered processing conditions in the commercial setting due to management problems associated with sorting or knowing the genetic background ofthe pigs. Understanding and recognizing this source o f variat ion can aid management in refining processes and adjusting the machinery used to slice bacon.
Fresh vs. Frozen Bellies
The characterization of fresh and frozen storage involved a minimal freezing time of at least 15 days before processing. There was no significant (P>0.05) difference found between the fresh and frozen bellies. As would be expected. much longer freezing tiines would likely be needed to measure loss in quality. particularly of fat as aresult of freezer storage. This was not pos- sible in this study. It can be concluded that short tiine frozen storage had no effect ofthe bacon quality in this study.
While longer storage tiines are often encountered, they would certainly be more likely undesirable. This study did demonstrate that the act offreezing the bellies posed little quality damage to the bacon nor changes in the fatty acid profiles, often a concern to pro- cessors.
'Carmina Robles and Bets) Booren are g r a d ~ ~ a t e students. and Roger Mandigo is a professor in the Department ofAnimal Science.
'Appreciation ewpressed to Tommi Jones and Jennifer Sherrill for laborator) assistance.
Effect of Post-Cooking Holding Time on Consumer Taste Panel Ratings
of Enhanced Pork Loins Christian Perversi
Kent Eskridge Chris Calkins'
Summary and Implications
Sensoy e~.aluatlon of food prod- uctr l r a ~.alz~uble tneanr of learnrng abozlt therr characterlstlcr Consunzer tarte panelr are regz~larlj used to e~.alzlute propertler of nzeat productr rzlch ar pork lornr The objectrve of thls research 11 ar to evaluate the e fec t ofpost-cookrng hold~ng trnze on the taste panel ratrngs of enhanced pork T/7e lorns zlsed rn thzs project I $ ere enhanced 1~1 th varjlzng percent- ages Jcloae to 10 %) of solzttrona contaznzng I $ uter, salt, phoap/7utea undnutztra/jzlrcea or flavors T/7e lozna came porn 10 drfferent azlpplzera and 11 ereservedzn rundor7zlj' ullottedgroztpa of seven, throztghoztt hventj', one-/7ozlr taate panel aeaarons T/7e nzeat I C U J
cooked drced and kept rn double borlera zn order to nzazntazn a atead) tenzperutzlre of appro~znzutelj> 122°F
throughout the duration of the one- hoz~r taste panel. Eight-point hedonic scales nz re usedfor juiciness, tender- ness, flavor and overall acceptability. The order in 1t.hich the panelists attended the taste panel throughout the hoz~r ~ t , a s recorded. SigniJi'cant first-degree interactions bet~t,een titne and tenderness, jzliciness, flavor and overall acceptability 1t.ere found. As expected, the ratings given 61. the panelists to the nzeat decreased as post-cooking holding tinze in the dozlble boilers increased. Etnpiri- cally, holding tinze should be nzini- nzired andsanzples shozlld be replaced ufter no Inore than 30 nzinzltes. Reszllts showed that cztn.entAn7ericun Meat Science Association JAMSA) gztidelines ,for Ineat evulztution shoztld be revised ~ /7ereby san7ples are cooked ~clhile the taste panel is condzlcted As szlch, it is in7portunt that proper ,facilities be ztsed and positive air ,flow in t/7e panel booths be nzaintained to nzininzire any carrjl- over efects,Ponz the aroma qfcooking Ineat.
Introduction
In current taste panel practices samples are cooked, cut and kept warm in double boilers until they are served to panelists, according to AMSA Research Guidelines (AMSA, 1995). People that come at the end of a taste panel session get meat that has been in the double boilers for an hour.
It is rational to speculate about the physical and chemical transformations that the meat undergoes in the time that it is kept warm in double boilers throughout the hour that taste panels last. These alterations in the products' organoleptic properties may have an impact on the panelists' ratings with respect to juiciness, tenderness, flavor and overall acceptability.
Previous research has shown lower sample temperatures have sig- nificantly deleterious effects on flavor and juiciness of the product being tested. They recommended maintain- ing 122°F sample temperature in the double boilers, but no effort was made to look at the effects of holding tiine.
(Cont~nued on newt page)
2003 \-ebra~ha Sit rne Report - Pcge 63
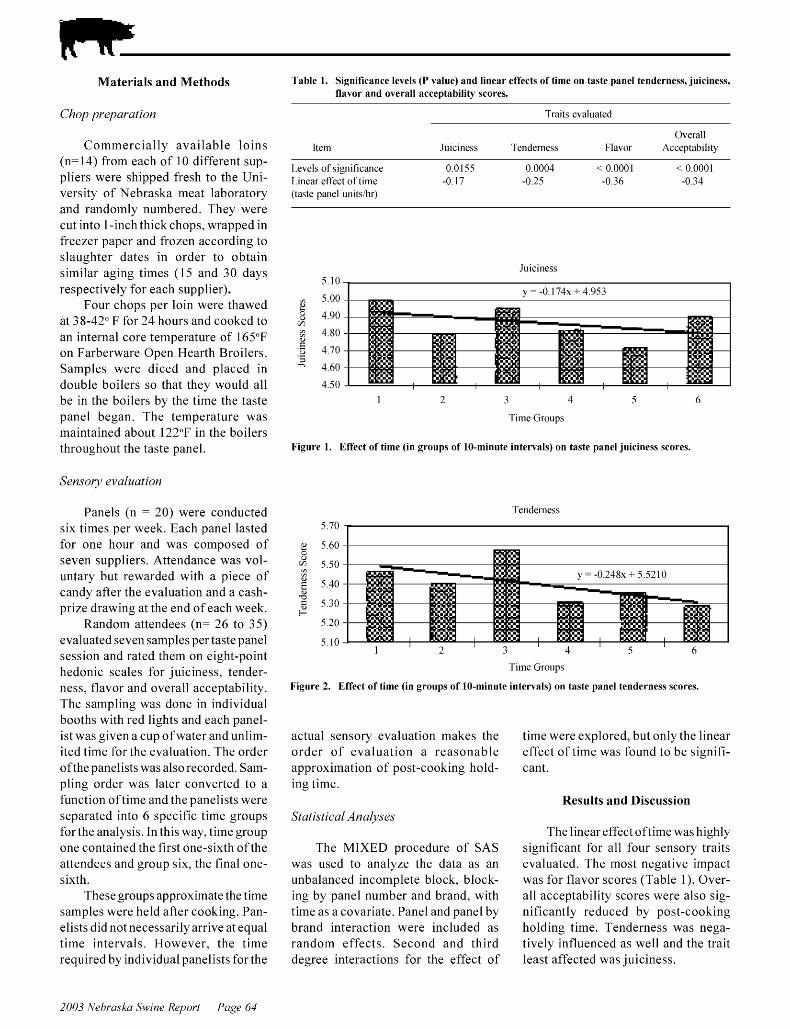
Materials and Methods Table 1. Significance lebels (P \aloe) and linear effects of time on taste panel tenderness, juiciness, fla\or and o\erall acceptabilio scores.
Chop preparation Tram eb aluated
Coininercially available loins (n= 14) from each of 10 different sup- pliers were shipped fresh to the Uni- versity of Nebraska meat laboratory and randomly numbered. They were cut into 1 -inch thick chops, wrapped in freezer paper and frozen according to slaughter dates in order to obtain similar aging tiines (15 and 30 days respectively for each supplier).
Four chops per loin were thawed at 38-42" F for 24 hours and cooked to an internal core temperature of 165°F on Farberware Open Hearth Broilers. Samples were diced and placed in double boilers so that they would all be in the boilers by the tiine the taste panel began. The temperature was maintained about 122°F in the boilers throughout the taste panel.
Sensory evalz~ation
Panels (n = 20) were conducted six tiines per week. Each panel lasted for one hour and was composed of seven suppliers. Attendance was vol- untary but rewarded with a piece of candy after the evaluation and a cash- prize drawing at the end of each week.
Random attendees (n= 26 to 35) evaluated seven samples pertaste panel session and rated them on eight-point hedonic scales for juiciness, tender- ness, flavor and overall acceptability. The sampling was done in individual booths with red lights and each panel- ist was given a cup ofwater and unlim- ited time for the evaluation. The order ofthe panelists was alsorecorded. Sam- pling order was later converted to a function oftime and the panelists were separated into 6 specific tiine groups forthe analysis. Inthis way, time group one contained the first one-sixth ofthe attendees and group six, the final one- sixth.
These groups approximate the time samples were held after cooking. Pan- elists didnot necessarily arrive at equal time intervals. However, the time required by individual panelists for the
01 erall l u ~ c ~ n e s s Tenderness Flabor Acceptab~l~t)
Lebels of signifi cance 0.0155 0.0001 < 0.0001 < 0.0001 Linear effect of time -0.17 -0.25 -0.36 -0.34 (taste panel ~~ni ts lhr)
1 2 3 4 5 6
Time Groups
Figure 1. Effect of time (in groups of 10-minute interrals) 011 taste panel juiciness scores.
. A " 1 ' 2 ' 3 ' 4 ' 5 ' 6
T ~ m e Groups
Figure 2. Effect of time (in groups of 10-minute inter~als) on taste panel tenderness scores.
actual sensory evaluation makes the order of evaluation a reasonable approximation of post-cooking hold- ing time.
tiine were explored, but only the linear effect of tiine was found to be signifi- cant.
Results and Discussion Statistical Anallaes
The MIXED procedure of SAS was used to analyze the data as an unbalanced incomplete block, block- ing by panel number and brand, with time as a covariate. Panel and panel by brand interaction were included as random effects. Second and third degree interactions for the effect of
The linear effect oftime was highly significant for all four sensory traits evaluated. The most negative impact was for flavor scores (Table 1). Over- all acceptability scores were also sig- nificantly reduced by post-cooking holding time. Tenderness was nega- tively influenced as well and the trait least affected was juiciness.
2003 Yel~~*aslia SIL lrze Report - Page 61
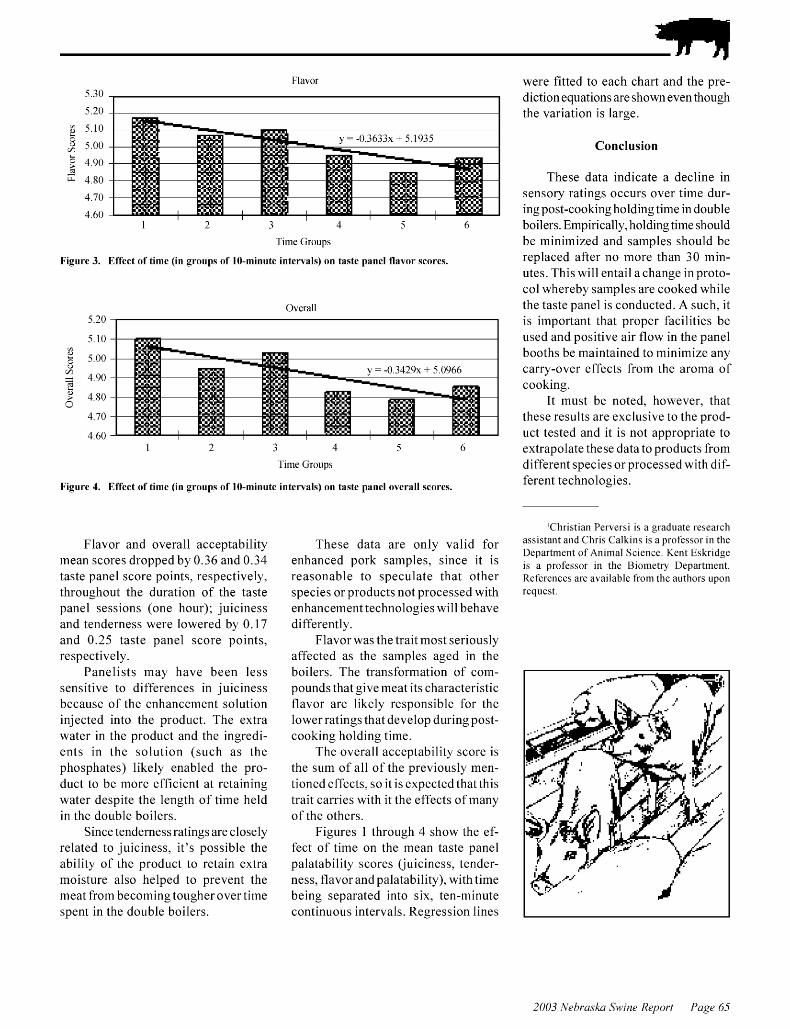
Time G~OLIPS
Fignre 3. Effect of time (in groups of 10-minnte inter\als) on taste panel fla\or scores.
Overall 5.20
1 2 3 1 5 6
T ~ m e Groups
Figure 4. Effect of time (in groups of 10-minute inter~als) on taste panel olerall scores.
Flavor and overall acceptability mean scores dropped by 0.36 and 0.34 taste panel score points. respectively, throughout the duration of the taste panel sessions (one hour): juiciness and tenderness were lowered by 0.17 and 0.25 taste panel score points, respectively.
Panelists may have been less sensitive to differences in juiciness because of the enhancement solution injected into the product. The extra water in the product and the ingredi- ents in the solution (such as the phosphates) likely enabled the pro- duct to be more efficient at retaining water despite the length of time held in the double boilers.
Since tenderness ratings are closely related to juiciness, it's possible the ability of the product to retain extra moisture also helped to prevent the meat from becoming tougher over time spent in the double boilers.
These data are only valid for enhanced pork samples. since it is reasonable to speculate that other species or products not processed with enhancement technologies will behave differently.
Flavorwas the trait most seriously affected as the samples aged in the boilers. The transformation of com- pounds that give meat its characteristic flavor are likely responsible for the lower ratings that develop duringpost- cooking holding time.
The overall acceptability score is the sum of all of the previously men- tioned effects, so it is expected that this trait carries with it the effects of many of the others.
Figures 1 through 4 show the ef- fect of time on the mean taste panel palatability scores (juiciness, tender- ness, flavor and palatability), with time being separated into six, ten-minute continuous intervals. Regression lines
were fitted to each chart and the pre- diction equations are shown even though the variation is large.
Conclusion
These data indicate a decline in sensory ratings occurs over time dur- ingpost-cooking holdingtime in double boilers. Empirically. holdingtime should be minimized and samples should be replaced after no more than 30 min- utes. This will entail a change in proto- col whereby samples are cooked while the taste panel is conducted. A such, it is important that proper facilities be used and positive air flow in the panel booths be maintained to minimize any carry-over effects fi-om the aroma of cooking.
It must be noted. however. that these results are exclusive to the prod- uct tested and it is not appropriate to extrapolate these data to products from different species or processed with dif- ferent technologies.
'Christian Perbersi is a graduate research assistant and Chris Calkins is aprofessor in the Department of Animal Science. Kent Esltridge is a professor in the Biometr) Department. References are a\ ailable from the authors upon reclLlest.
2003 \-ebra~ha Sit rne Report - Pcge 65
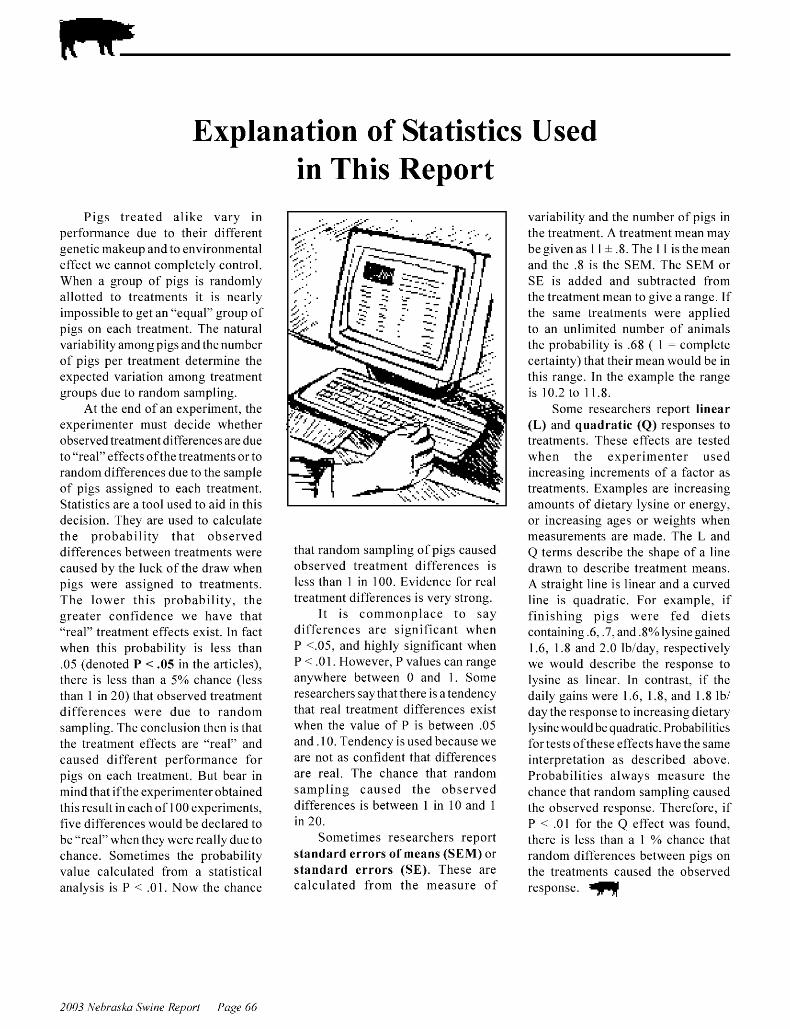
Explanation of Statistics Used in This Report
Pigs treated al ike vary in performance due to their different genetic makeup and to environmental - effect we cannot completely control. When a group of pigs is randomly allotted to treatinents it is nearly impossible to get an "equal" group of pigs on each treatment. The natural variability among pigs and the number of pigs per treatment determine the expected variation among treatment groups due to random sampling. -
At the end of an experiment. the experimenter must decide whether observed treatment differences are due to "real" effects ofthe treatments or to random differences due to the sample of pigs assigned to each treatment. Statistics are a tool used to aid in this decision. They are used to calculate the probabil i ty that observed differences between treatinents were caused by the luck of the draw when pigs were assigned to treatments. The lower th is probabil i ty. the greater confidence we have that - "real" treatinent effects exist. In fact when this probability is less than .05 (denoted P < .05 in the articles). there is less than a 5% chance (less than 1 in 20) that observed treatment differences were due to random sampling. The conclusion then is that the treatinent effects are "real" and caused different performance for pigs on each treatinent. But bear in mind that ifthe experimenterobtained this result in each of 100 experiments, five differences would be declared to be "real" when they were really due to chance. Sometimes the probability value calculated from a statistical analysis is P < .01. Now the chance
that random sampling of pigs caused observed treatinent differences is less than 1 in 100. Evidence for real treatinent differences is very strong.
I t is coinmonplace to say differences are significant when P <.05, and highly significant when P < .01. However, P values can range anywhere between 0 and 1. Some researchers say that there is a tendency that real treatinent differences exist when the value of P is between .05 and. 10. Tendency is used because we are not as confident that differences are real. The chance that random sampling caused the observed differences is between 1 in 10 and 1 in 20.
Sometimes researchers report standard errors of means (SEM) or standard errors (SE). These are calculated from the measure of
variability and the number of pigs in the treatment. A treatinent inean may be given as 1 1 * .8. The 1 1 is the inean and the .8 is the SEM. The SEM or SE is added and subtracted from the treatinent inean to give a range. If the same treatinents were applied to an unlimited number of animals the probability is .68 ( 1 = complete certainty) that their mean would be in this range. In the example the range is 10.2 to 1 1.8.
Some researchers report linear (L) and quadratic (Q) responses to treatments. These effects are tested when the exper imenter used increasing increments of a factor as treatments. Examples are increasing amounts of dietary lysine or energy, or increasing ages or weights when measurements are made. The L and Q terms describe the shape of a line drawn to describe treatment means. A straight line is linear and a curved line is quadratic. For example. if f inishing pigs were fed diets containing .6, .7. and .8% lysine gained 1.6, 1.8 and 2.0 Iblday. respectively we would describe the response to lysine as linear. In contrast, if the daily gains were 1.6. 1.8, and 1.8 Ibl day the response to increasing dietary lysine would be quadratic. Probabilities for tests ofthese effects have the same interpretation as described above. Probabilities always ineasure the chance that random sampling caused the observed response. Therefore, if P < .O1 for the Q effect was found, there is less than a 1 % chance that random differences between pigs on the treatinents caused the observed response. w
2003 Yel~~*aslia SIL lrze Report - Page 66

�;������������������������� �
�������������������� ������������������ ����� ������������� ������� ���������������� ����������������������������������������������� ����������������� ����������� ���������!� ��"���������! � ����#���� ������#���� �������������
���������� �������� ��
���������� ���������������� ���$������% ��� ��&������'����������� ��������& ������$ ������
���� ���� ����� ��������������������� ���!����
��������� ��
��������� ������������������ ������������������
�������� ��� �> � E � /� ��!�� ����-���� 3��� ��.�� (
��--����&��((���� ����.��������> /� ��!������( ������ . �( "(�
��� ���������> ��7�/� ������������� ���> ��7���-�������������� ���
������������> ����I 3 ���.��M)������������( ������
��� ((&> M#������0(�--��V? �B�((%� ������ -
. �( "(�!������((��������
����� ����������� ��� ��> J��(�( ��! ��(�&��� ������ ����� �
.������������> /� .�( "�� �������������> 4� ���!��!���������&����� -�!�������> 6������ �& �����( : ����-���3���H �� �
�� �� ((�3� ������� �� ��(& ������� �����"� �B ��(�� �����( � ����!����������������
���������� ��� ��> <���� �����������������!������������� �
!���:�� � �����-�(�&-���> � ����' &��(� ��! ((> � ��� -���� �������.�����!!������� !!�
"& ����I� ����
������ ������� ��� ��> �� �-�� ������� (������(���> *��II�:*�����������������(������ ��� (
I�������� �I�( ����������� � ���� ( ��� ��, ���� !�� �������������-�(�&-��� � �� � �� �����( �����( ����������������������� (-������&����( ������ . �( "(�
9���������������
� ���� �� �!��"���������������#$��%�$&�'�($)��)*!�+,��!
� ���������� ���� #$��%�$&�'�($) ��*!�+,��!
������� ��������������� �������
������������� ����� ������ ��!�"
������������� �������
�������������� �����
�������������
���������������� ����������������� ������������
��������������� ���������������
����������