NUTRIENT REQUIREMENTS OF SWINE - Semantic Scholar
211
NATIONAL RESEARCH COUNCIL NUTRIENT REQUIREMENTS OF SWINE Tenth Revised Edition 1998 NUTRIENT REQUIREMENTS OF DOMESTIC ANIMALS
-
Upload
khangminh22 -
Category
Documents
-
view
0 -
download
0
Transcript of NUTRIENT REQUIREMENTS OF SWINE - Semantic Scholar

NATIONAL RESEARCH COUNCIL
NUTRIENT REQUIREMENTSOF SWINE
Tenth Revised Edition1998
NUTRIENT REQUIREMENTS OF DOMESTIC ANIMALS

NutrientRequirementsof SwineTenth Revised Edition, 1998
Subcommittee on Swine NutritionCommittee on Animal NutritionBoard on AgricultureNational Research Council
NATIONAL ACADEMY PRESS ● 2101 Constitution Avenue, NW ● Washington, D.C. 20418
NOTICE: The project that is the subject of this report was approved by the Governing Board of the NationalResearch Council, whose members are drawn from the councils of the National Academy of Sciences, the NationalAcademy of Engineering, and the Institute of Medicine. The members of the committee responsible for the reportwere chosen for their special competencies and with regard for appropriate balance.
This study was supported by the Agricultural Research Service of the U.S. Department of Agriculture, underAgreement No. 59-32U4-5-6, and by the Center for Veterinary Medicine, Food and Drug Administration of theU.S. Department of Health and Human Services, under Cooperative Agreement No. FD-U-000006-10. Additionalsupport was provided by the American Feed Industry Association, and the National Pork Producers Council.
The National Academy of Sciences is a private, nonprofit, self-perpetuating society of distinguished scholarsengaged in scientific and engineering research, dedicated to the furtherance of science and technology and totheir use for the general welfare. Upon the authority of the charter granted to it by the Congress in 1863, theAcademy has a mandate that requires it to advise the federal government on scientific and technical matters. Dr.Bruce Alberts is president of the National Academy of Sciences.
The National Academy of Engineering was established in 1964, under the charter of the National Academy ofSciences, as a parallel organization of outstanding engineers. It is autonomous in its administration and in theselection of its members, sharing with the National Academy of Sciences the responsibility for advising the federalgovernment. The National Academy of Engineering also sponsors engineering programs aimed at meeting nationalneeds, encourages education and research, and recognizes the superior achievements of engineers. Dr. WilliamA. Wulf is acting president of the National Academy of Engineering.
The Institute of Medicine was established in 1970 by the National Academy of Sciences to secure the servicesof eminent members of appropriate professions in the examination of policy matters pertaining to the health ofthe public. The Institute acts under the responsibility given to the National Academy of Sciences by its congressionalcharter to be an adviser to the federal government and, upon its own initiative, to identify issues of medical care,research, and education. Dr. Kenneth I. Shine is president of the Institute of Medicine.
The National Research Council was organized by the National Academy of Sciences in 1916 to associate thebroad community of science and technology with the Academy’s purposes of furthering knowledge and advisingthe federal government. Functioning in accordance with general policies determined by the Academy, the Councilhas become the principal operating agency of both the National Academy of Sciences and the National Academyof Engineering in providing services to the government, the public, and the scientific and engineering communities.The Council is administered jointly by both Academies and the Institute of Medicine. Dr. Bruce Alberts and Dr.William A. Wulf are chairman and vice-chairman, respectively, of the National Research Council.
Library of Congress Cataloging-in-Publication Data
Nutrient requirements of swine / Subcommittee on Swine Nutrition,Committee on Animal Nutrition, Board on Agriculture, NationalResearch Council. — 10th rev. ed.
p. cm. — (Nutrient requirements of domestic animals)Includes bibliographical references and index.ISBN 0-309-05993-3 (pbk.)1. Swine—Nutrition—Requirements. 2. Swine—Feeding and feeds.
I. National Research Council (U.S.). Subcommittee on SwineNutrition. II. Series: Nutrient requirements of domestic animals(Unnumbered)
SF396.5 .N87 1988636.480852—ddc21 98-9007
CIP
International Standard Book Number 0-309-05993-3
©1998 by the National Academy of Sciences. All rights reserved.
No part of this book may be reproduced by any mechanical, photographic, or electronic process, or in the formof a phonographic recording, nor may it be stored in a retrieval system, transmitted, or otherwise copied for publicor private use without written permission from the publisher, except for the purposes of official use by theU.S. government.
Additional copies of this report are available from National Academy Press, 2101 Constitution Avenue, N.W.,Lockbox 285, Washington, D.C. 20055; (800) 624-6242 or (202) 334-3313 (in the Washington metropolitan area);Internet, http://www.nap.edu
Printed in the United States of America.
This report and the computer model are also available on the Internet, http://www.nap.edu/readingroom/enter2.cgi?0309059933.html.
SUBCOMMITTEE ON SWINE NUTRITION
GARY L. CROMWELL, Chair, University of KentuckyDAVID H. BAKER, University of IllinoisRICHARD C. EWAN, Iowa State UniversityE.T. KORNEGAY, Virginia Polytechnic Institute and State UniversityAUSTIN J. LEWIS, University of NebraskaJAMES E. PETTIGREW, Pettigrew Consulting International, Louisiana, MissouriNORMAN C. STEELE, U.S. Department of Agriculture, Agricultural Research Service,
Beltsville, MarylandPHILIP A. THACKER, University of Saskatchewan, Canada
COMMITTEE ON ANIMAL NUTRITION
DONALD C. BEITZ, Chairman, Iowa State UniversityGARY L. CROMWELL, University of Kentucky*GEORGE C. FAHEY, University of Illinois***DELBERT M. GATLIN III, Texas A&M UniversityRONALD L. HORST, U.S. Department of Agriculture, Agricultural Research Service,
Ames, Iowa***TERRY J. KLOPFENSTEIN, University of Nebraska***LAURIE M. LAWRENCE, University of Kentucky*AUSTIN J. LEWIS, University of NebraskaCARL M. PARSONS, University of IllinoisALICE N. PELL, Cornell University***GARY D. POTTER, Texas A&M UniversityJERRY L. SELL, Iowa State University**ROBERT P. WILSON, Mississippi State University**KARIN M. WITTENBERG, University of Manitoba, Canada
*July 1, 1992, through June 30, 1995**July 1, 1993, through June 30, 1996***July 1, 1994, through June 30, 1997
Staff
CHARLOTTE KIRK BAER, Program DirectorMELINDA SIMONS, Project Assistant
iii


BOARD ON AGRICULTURE
DALE E. BAUMAN, Chair, Cornell UniversityJOHN M. ANTLE, Montana State UniversitySANDRA S. BATIE, Michigan State UniversityMAY R. BERENBAUM, University of IllinoisLEONARD S. BULL, North Carolina State UniversityWILLIAM B. DELAUDER, Delaware State CollegeANTHONY S. EARL, Quarles & Brady Law Firm, Madison, WisconsinESSEX E. FINNEY, JR., U.S. Department of Agriculture (retired), Mitchellville, MarylandCORNELIA B. FLORA, Iowa State UniversityGEORGE R. HALLBERG, University of IowaRICHARD R. HARWOOD, Michigan State UniversityT. KENT KIRK, University of Wisconsin, MadisonHARLEY W. MOON, Iowa State UniversityWILLIAM L. OGREN, University of IllinoisGEORGE E. SEIDEL, JR., Colorado State UniversityJOHN W. SUTTIE, University of WisconsinJAMES J. ZUICHES, Washington State University
J. PAUL GILMAN, Executive DirectorMICHAEL J. PHILLIPS, Director
v

Preface
Swine production represents an important segment ofthe food animal industry in the United States and through-out the world. Pork is an important source of energy, pro-tein, minerals, and vitamins, and is the most widely con-sumed red meat in the world. Proper formulation of dietsis fundamental to the efficient production of swine in sys-tems that address environmental concerns, and this processdepends on a knowledge of the nutrient requirements ofswine and the nutritional characteristics of nutrientsources. This tenth edition of Nutrient Requirements ofSwine contains a reassessment of the nutrient requirementsof swine and incorporates new information that was usedto establish the requirements.
An abundance of new knowledge in swine nutrition hassurfaced since the last edition of Nutrient Requirementsof Swine was published in 1988. There is now a greaterawareness and understanding of the effects of growth rate,carcass leanness, gender, health, environmental tempera-ture, crowding, and carcass modifiers on the nutrientrequirements of growing pigs. The higher nutrient require-ments of prolific sows nursing large litters are now betterunderstood. Additionally, new information on the bioavail-ability of nutrients is now available. A better understandingof the nutrient requirements and nutrient sources allowsone to accurately formulate diets to meet the pig’s dietaryrequirements without producing overages of nutrients thatare excreted into the environment.
A major change was made in this edition in that thesubcommittee provided the biological basis used to estab-lish energy and amino acid requirements in the form ofintegrated mathematical equations (models). The modelswere developed by the subcommittee with the goal ofkeeping them simple, transparent (i.e., inner parts under-standable to the user), and firmly anchored to empiricaldata. The process of model development and validationwas an extremely laborious and time-consuming task.While these versions of the models are not perfect, thesubcommittee believes that they represent a markedimprovement over previous systems of establishingrequirements and provide the groundwork for develop-ment of improved models by future subcommittees.
vii
The model for growing-finishing pigs allows the user togenerate tables of nutrient requirements for various bodyweights of pigs, based on the pig’s lean growth rate, gender,and environmental conditions. Similarly, the energy andamino acid requirements of gestating and lactating sows areestimated by models, and the user can generate nutrientrequirement tables for sows with different body weightsand weight gains during gestation and for various levels oflactational productivity. To accomplish this, a user-friendlycomputer program containing the models is included inthis edition.
Requirements for amino acids in the models were gener-ated on a true ileal digestible basis. The amino acid require-ments are provided to the user on a true and apparentdigestible basis as well as on a total basis, using corn andsoybean meal as the major ingredients. The models alsoestimate energy requirements for gestating and lactatingsows and energy intakes of growing pigs given ad libitumaccess to feed. Equations to estimate mineral and vitaminrequirements at various body weights are also included inthe growth model.
Other new information is presented in this tenth edition.Minimizing nutrient excretion is addressed and a discussionof nonnutritive feed additives was expanded. New informa-tion on the nutrient composition of an expanded list offeed ingredients and on the bioavailability of amino acids(true and apparent ileal basis), phosphorus, and other nutri-ents is also included in this edition. Finally, the nutrientrequirement tables also provide more information than didthose in previous editions.
This three-year study was conducted by the Subcommit-tee on Swine Nutrition, which was appointed in 1994 underthe guidance of the Board on Agriculture’s Committee onAnimal Nutrition. The subcommittee began its work inNovember 1994 and the study was completed in December1997, with the release of the report in April 1998.
GARY L. CROMWELL, ChairSubcommittee on Swine Nutrition


Acknowledgments
The subcommittee would like to acknowledge the manyscientists who conducted the research studies from whichwe were able to draw information to establish nutrientrequirements. Appreciation is given to Kevin Halpin, chair-man of the Nutrition Council Swine Committee, AmericanFeed Industry Association, who assisted our subcommitteein setting goals and establishing direction for the revisedpublication, and to the many companies and individuals inthe feed industry who provided useful information to thesubcommittee. The subcommittee thanks Tim Stahly, IowaState University, and Allan Schinckel, Purdue University,for insights gained from discussions with them during theinitial stages of model development.
The subcommittee wishes to thank Charlotte Kirk Baer,Program Director, Board on Agriculture, for her untiringefforts in seeing this project to completion. Appreciation isalso given to staff members Melinda Simons and JuliemarieGoupil for their assistance with the report, and to MaryPoos for her help during the first year of planning. Finally,the work by Ron Haugen, Easy Systems, Inc., in developingthe software interface for the model is acknowledged.
The generous support of this study provided by theNational Pork Producers Council is gratefully acknowl-edged. In addition, the subcommittee appreciates the sup-port provided by the U.S. Department of Agriculture’sAgricultural Research Service, the Center for Veterinary
ix
Medicine of the Department of Health and Human Ser-vice’s Food and Drug Administration, and the AmericanFeed Industry Association.
This report has been reviewed by individuals chosenfor their diverse perspectives and technical expertise, inaccordance with procedures approved by the NationalResearch Council’s (NRC) Report Review Committee. Thepurpose of this independent review is to provide candidand critical comments that will assist the authors and theNRC in making the published report as sound as possibleand to ensure that the report meets institutional standardsfor objectivity, evidence, and responsiveness to the studycharge. The content of the review comments and draftmanuscript remain confidential to protect the integrity ofthe deliberative process. We wish to thank the followingindividuals for their participation in the review of thisreport: R. Dean Boyd, Pig Improvement Company, USA;Thomas Crenshaw, University of Wisconsin; C.F.M.deLange, University of Guelph; Darrell Knabe, TexasA&M University; Harley W. Moon, Iowa State University;Robert Myer, University of Florida; Carl Parsons, Univer-sity of Illinois; Tim Stahly, Iowa State University; MichaelTokach, Kansas State University; and Gawain Willis, PurinaMills, Inc. While the individuals listed above have providedmany constructive comments and suggestions, responsibil-ity for the final content of this report rests solely with theauthoring committee and the NRC.


Contents
PREFACE . . . . . . . . . . . . . . . . . . . . . . . . . . . . . . . . . . . . . . . . . . . . . . . . . . . . . . .vii
ACKNOWLEDGMENTS. . . . . . . . . . . . . . . . . . . . . . . . . . . . . . . . . . . . . . . . . . . ix
OVERVIEW . . . . . . . . . . . . . . . . . . . . . . . . . . . . . . . . . . . . . . . . . . . . . . . . . . . . . .1
1 ENERGY . . . . . . . . . . . . . . . . . . . . . . . . . . . . . . . . . . . . . . . . . . . . . . . . . . . . . .3Classification of Energy, 3
Gross Energy, 3Digestible Energy, 3Metabolizable Energy, 4Net Energy, 4
Heat Production, 5Temperature, 5Activity, 5
Energy Requirements, 5Maintenance, 5Growth, 6Pregnancy, 6Lactation, 7Developing Boars and Gilts, 7Sexually Active Boars, 8
Energy Sources, 8Sugars and Starch, 8Nonstarch Polysaccharides, 8Lipids, 9
Voluntary Feed Intake, 10Suckling Pigs, 10Weanling Pigs, 10Growing-Finishing Pigs, 10Sows, 11
References, 11
2 PROTEINS AND AMINO ACIDS . . . . . . . . . . . . . . . . . . . . . . . . . . . . . . . .16Essential and Nonessential Amino Acids, 16
xi
xii Contents
Amino Acids in Diets, 17Ratios Among Amino Acids (Ideal Protein), 17Bioavailability of Amino Acids, 18Amino Acid Isomers, 19
Amino Acid Deficiencies and Excesses, 19Amino Acid Requirements, 19
Starting Pigs, 19Growing-Finishing Pigs, 24Sows, 25Boars, 25
References, 26
3 MODELS FOR ESTIMATING ENERGY AND AMINO ACIDREQUIREMENTS . . . . . . . . . . . . . . . . . . . . . . . . . . . . . . . . . . . . . . . . . . . . .31
Overview of the Models, 31Growing-Finishing Pigs, 32
Requirement for Lysine, 32Requirements for Other Amino Acids, 35Expression of Amino Acid Requirements, 35
Gestating Sows, 36Composition of Weight Gain, 37Requirement for Energy, 37Requirement for Lysine, 38Requirements for Other Amino Acids, 38Expression of Amino Acid Requirements, 38
Lactating Sows, 38Requirement for Energy, 39Requirement for Lysine, 39Requirements for Other Amino Acids, 40Expression of Amino Acid Requirements, 40
Weanling Pigs, 40Mineral and Vitamin Requirements, 41Evaluation of the Models, 42
Growth Model, 42Gestation Model, 44Lactation Model, 44
References, 44
4 MINERALS . . . . . . . . . . . . . . . . . . . . . . . . . . . . . . . . . . . . . . . . . . . . . . . . . . . .47Macro Minerals, 47
Calcium and Phosphorus, 47Sodium and Chlorine, 49Magnesium, 50Potassium, 51Sulfur, 51
Micro/Trace Minerals, 51Chromium, 51Cobalt, 52Copper, 52Iodine, 53Iron, 54Manganese, 55

Contents xiii
Selenium, 55Zinc, 56
References, 57
5 VITAMINS . . . . . . . . . . . . . . . . . . . . . . . . . . . . . . . . . . . . . . . . . . . . . . . . . . .71Fat-Soluble Vitamins, 71
Vitamin A, 71Vitamin D, 73Vitamin E, 73Vitamin K, 74
Water-Soluble Vitamins, 75Biotin, 75Choline, 76Folacin, 77Niacin, 78Pantothenic Acid, 78Riboflavin, 79Thiamin, 79Vitamin B6 (The Pyridoxines), 80Vitamin B12, 80Vitamin C (Ascorbic Acid), 81
References, 82
6 WATER . . . . . . . . . . . . . . . . . . . . . . . . . . . . . . . . . . . . . . . . . . . . . . . . . . . . . .90Functions of Water, 90Water Turnover, 90Water Requirements, 91
Suckling Pigs, 91Weanling Pigs, 91Growing-Finishing Pigs, 92Gestating Sows, 93Lactating Sows, 93Boars, 93
Water Quality, 93References, 95
7 NONNUTRITIVE FEED ADDITIVES . . . . . . . . . . . . . . . . . . . . . . . . . . . .97Additives, 97
Antimicrobial Agents, 97Anthelmintics, 98Microbial Supplements, 98Oligosaccharides, 98Enzymes, 98Acidifiers, 98Flavors, 99Odor Control Agents, 99Antioxidants, 99Pellet Binders, 99Flow Agents, 99Mineral Supplements, 99Carcass Modifiers, 99
Safety Concerns, 99
xiv Contents
Regulations, 100References, 100
8 MINIMIZING NUTRIENT EXCRETION . . . . . . . . . . . . . . . . . . . . . . . . .103References, 105
9 DIET FORMULATION . . . . . . . . . . . . . . . . . . . . . . . . . . . . . . . . . . . . . . . .107Formulating a Corn–Soybean Meal Diet, 107
Formulation, 107
10 NUTRIENT REQUIREMENT TABLES . . . . . . . . . . . . . . . . . . . . . . . . .110
11 COMPOSITION OF FEED INGREDIENTS . . . . . . . . . . . . . . . . . . . . .124References, 142
APPENDIXES1 Equations Used to Model the Biological Basis for Predicting Nutrient
Requirements, 1432 Equations for Determining Lean Growth Rate of Pigs, 1483 Method to Create a Cubic Regression Equation, 1504 A User’s Guide for Model Application, 1535 Help Screens, 171
AUTHORS. . . . . . . . . . . . . . . . . . . . . . . . . . . . . . . . . . . . . . . . . . . . . . . . . . . . . .179
INDEX . . . . . . . . . . . . . . . . . . . . . . . . . . . . . . . . . . . . . . . . . . . . . . . . . . . . . . . .180
Tables and Figures
TABLES
2-1 Ideal Ratios of Amino Acids to Lysine for Maintenance, Protein Accretion, MilkSynthesis, and Body Tissue, 18
2-2 Research Findings on Amino Acid Requirements of Growing Swine Since 1985, 20
2-3 Lysine Requirements of Gestating and Lactating Sows, 25
3-1 Equations for Converting Percentages of Amino Acids from a True Ileal DigestibleBasis to an Apparent Ileal Digestible Basis, from an Apparent Ileal Digestible Basisto a True Ileal Digestible Basis, and from a True or Apparent Ileal Digestible Basisto a Total Basis in a Corn–Soybean Meal Diet, 36
3-2 Coefficients Used in the Growth Model to Predict Mineral and Vitamin Requirements(percentage or amount/kg of diet) for Pigs of Various Body Weights, 43
3-3 Evaluation of Data of the Growth Model, 43
3-4 Evaluation of Data of the Lactation Model, 44
6-1 Evaluation of Water Quality for Pigs Based on Total Dissolved Solids, 94
6-2 Water Quality Guidelines for Livestock, 95
9-1 Nutrients in Corn and Corn ` Soybean Meal (Dehulled) Compared with the Nutri-ent Requirements of a 40-kg Growing Pig of High-Medium Lean Growth Rate (325 gof carcass fat-free lean/day), 108
9-2 Fortified Swine Diet, 109
10-1 Dietary Amino Acid Requirements of Growing Pigs Allowed Feed Ad Libitum(90 percent dry matter), 111
10-2 Daily Amino Acid Requirements of Growing Pigs Allowed Feed Ad Libitum(90 percent dry matter), 112
10-3 Dietary Amino Acid Requirements of Barrows and Gilts of Different Lean GrowthRates and Allowed Feed Ad Libitum (90 percent dry matter), 113
10-4 Daily Amino Acid Requirements of Barrows and Gilts of Different Lean GrowthRates and Allowed Feed Ad Libitum (90 percent dry matter), 114
10-5 Dietary Mineral, Vitamin, and Fatty Acid Requirements of Growing Pigs AllowedFeed Ad Libitum (90 percent dry matter), 115
xv
xvi Tables and Figures
10-6 Daily Mineral, Vitamin, and Fatty Acid Requirements of Growing Pigs Allowed FeedAd Libitum (90 percent dry matter), 116
10-7 Dietary Amino Acid Requirements of Gestating Sows (90 percent dry matter), 117
10-8 Daily Amino Acid Requirements of Gestating Sows (90 percent dry matter), 118
10-9 Dietary Amino Acid Requirements of Lactating Sows (90 percent dry matter), 119
10-10 Daily Amino Acid Requirements of Lactating Sows (90 percent dry matter), 120
10-11 Dietary Mineral, Vitamin, and Fatty Acid Requirements of Gestating and LactatingSows (90 percent dry matter), 121
10-12 Daily Mineral, Vitamin, and Fatty Acid Requirements of Gestating and LactatingSows (90 percent dry matter), 122
10-13 Dietary and Daily Amino Acid, Mineral, Vitamin, and Fatty Acid Requirements ofSexually Active Boars (90 percent dry matter), 123
11-1 Chemical Composition of Some Feed Ingredients Commonly Used for Swine (dataon as-fed basis), 126
11-2 Mineral Composition of Some Feed Ingredients Commonly Used for Swine (dataon as-fed basis), 128
11-3 Vitamin Composition of Some Feed Ingredients Commonly Used for Swine (dataon as-fed basis), 130
11-4 Amino Acid Composition of Some Feed Ingredients Commonly Used for Swine(data on as-fed basis), 132
11-5 Apparent Ileal Digestibilities of Amino Acids in Some Feed Ingredients CommonlyUsed for Swine, 134
11-6 True Ileal Digestibility of Amino Acids in Some Feed Ingredients Commonly Usedfor Swine, 136
11-7 Coefficients for Estimation of Amino Acids from Crude Protein Content of FeedIngredients, 138
11-8 Mineral Concentrations in Macro Mineral Sources (data on as-fed basis), 139
11-9 Inorganic Sources and Estimated Bioavailabilities of Trace Minerals, 140
11-10 Characteristics and Energy Values of Various Sources of Fats and Oils (data on as-fed basis), 141
11-11 Chemical Composition of Some Purified Feed Ingredients Commonly Used forSwine Research (data on as-fed basis), 141
FIGURES
1-1 Digestible energy intake of growing-finishing pigs as an asymptotic function of bodyweight. Based on research conducted before 1983 and involving 8,072 observationsof 1,390 pens of pigs fed nutritionally adequate corn–soybean meal diets (NationalResearch Council, 1987), 11
2-1 Lysine requirements of starting, growing, and finishing pigs in research publishedsince 1985. Each block represents an estimated requirement (total lysine basis)plotted against the mean body weight of the pigs in the experiment (final body weightminus initial body weight divided by 2). The line represents an estimate of the lysinerequirement (total lysine basis), 19
Tables and Figures xvii
3-1 Potential whole body protein accretion rate of pigs of high-medium lean growth ratewith a carcass fat-free lean gain averaging 325 g/day from 20 to 120 kg body weight(default equation of the model). The lean growth rate of 325 g/day is converted toa mean whole-body protein accretion rate of 127.5 g/day (325/2.55 4 127.5), 32
3-2 Potential whole body protein accretion rates of pigs of medium, high-medium,and high lean growth rates with carcass fat-free lean gains averaging 300, 325,and 350 g/day from 20 to 120 kg body weight (default equation of the model), 33
3-3 Estimated daily digestible energy (DE) intakes of barrows, gilts, and a 1:1 ratio ofbarrows to gilts consuming feed on an ad libitum basis from 20 to 120 kg bodyweight (default equation of the model), 33
3-4 Relationship of whole body protein gain and digestible energy intake in pigs from5 to 150 kg body weight, 34
3-5 Relationship of daily whole body protein deposition and daily intake of true ilealdigestible lysine above maintenance. Based on data from 18 experiments and adaptedfrom a summary by Kerr (1993), 34
3-6 Daily lysine requirement (true ileal digestible basis) of pigs with a mean lean growthrate (carcass fat-free basis) of 325 g/day from 20 to 120 kg body weight as estimatedby the model using default equations, 35
3-7 Dietary lysine requirement (%, true ileal digestible basis) of pigs with a mean leangrowth rate (carcass fat-free basis) of 325 g/day from 20 to 120 kg body weight asestimated by the model using default equations, 36
3-8 Dietary lysine requirements (%) of pigs of medium, high-medium, and high leangrowth rates with carcass fat-free lean gains averaging 300, 325, and 350 g/day from20 to 120 kg body weight as estimated by the model using default equations. Therequirements are for total lysine, assuming a corn–soybean meal mixture, 37
3-9 Relation of litter growth rate to dietary apparent ileal digestible lysine intake bylactating sows, 40
3-10 Dietary lysine requirement (%) of pigs from 3 to 20 kg body weight using the defaultequation of the model (total basis, assuming a corn–soybean meal diet), 41
3-11 Estimated daily feed intake of pigs from 3 to 20 kg and from 20 to 120 kg bodyweight based on the default equations for digestible energy intake in the modeldivided by the digestible energy concentration of the diet (3,400 kcal/kg), 41
3-12 Estimated dietary calcium requirement (%) of pigs from 3 to 120 kg body weightusing the generalized exponential equation in the model, 42
3-13 Estimated dietary riboflavin requirement (mg/kg) of pigs from 3 to 120 kg bodyweight using the generalized exponential equation in the model, 42

NutrientRequirementsof SwineTenth Revised Edition, 1998

Overview
Energy, amino acids, minerals, vitamins, and water areneeded by pigs for body maintenance, growth, reproduc-tion, and lactation. Synthesis of muscle and adipose tissue,bone, hair, skin, and other body components, resulting inaccretion of water, protein, lipid, and ash, is dependentupon an adequate dietary supply of nutrients. Pigs mustbe provided these essential nutrients in adequate amountsand in forms that are palatable and efficiently utilized inorder for optimal growth, reproduction, and lactation tooccur.
Since 1944, the National Research Council has pub-lished nine editions of Nutrient Requirements of Swine.This publication has guided nutritionists and other profes-sionals in academia and the swine and feed industries indeveloping and implementing nutritional and feeding pro-grams for swine. This tenth edition continues that tradition,but the format of this edition is quite different from thatof previous ones. The text has been expanded with newsections that address contemporary issues, and the tablesare more comprehensive. A new approach using integratedmathematical equations (models) was utilized to generateestimates of energy and amino acid requirements, and acomputer program and software allow the user to createtables of nutrient requirements for swine of a specific bodyweight and level of productivity.
The first chapter deals with energy and reviews newinformation on digestible energy (DE), metabolizableenergy (ME), and net energy (NE) requirements of swine.Equations for predicting DE, ME, and NE from chemicalcomponents are presented. New information on factorsaffecting energy requirements of swine also is included inthis chapter.
In the chapter on proteins and amino acids (Chapter 2),much of the discussion relates to lysine, the first limitingamino acid in most diets for pigs, and to new informationon lysine requirements. The concept of ‘‘ideal ratios’’ ofessential amino acids to lysine for maximum lean tissue
1
synthesis in growing pigs and optimal productivity in gestat-ing and lactating sows is described. Discussion of bioavail-ability of amino acids, on a true and apparent ileal digest-ibility basis, has been expanded. A section on amino acidrequirements of boars is now included.
Chapter 3 addresses the use of mathematical models toestimate energy and amino acid requirements of swine.This chapter describes the modeling approach that wastaken by the subcommittee to generate the amino acidrequirements of growing-finishing pigs from 20 to 120 kgbody weight and for gestating and lactating sows. Thegrowth model is based on the pig’s lean growth rate andit estimates the daily true ileal digestible lysine needed tosupport maximum protein accretion at a given body weight.The dietary lysine requirement is then estimated based onthe pig’s daily feed intake, which, in turn, is based onbody weight, gender, environmental conditions, and DEconcentration of the diet. Estimates of the requirementsfor other essential amino acids are based on the ideal ratioof each to lysine for maintenance and protein accretion.The gestation model estimates the energy and amino acidrequirements of sows based on their breeding weight, tar-geted gestational weight gain, and litter size. The lactationmodel estimates requirements based on the sow’s postfar-rowing weight, lactational weight change, and daily litterweight gain, a reflection of the amount of milk production.
Chapters on minerals and vitamins were updated withresults from research studies reported since the previousedition. Chromium is recognized as an essential trace min-eral for swine. The sodium and chlorine requirements ofthe young pig and the manganese requirement of the ges-tating and lactating sow were increased, and new infor-mation on the bioavailability of minerals is presented.The vitamin E and folacin requirements of gestating andlactating sows were increased, based on new researchinformation.
2 Overview
The chapter on water was expanded. In addition to morediscussion of the water requirements of all classes of swine,this section also reviews factors that affect quality of drink-ing water. The chapter on nonnutritive feed additives wasexpanded to include antimicrobial agents and other feedadditives, including anthelmintics, microbial supplements,oligosaccharides, enzymes, acidifiers, flavors, odor controlagents, antioxidants, pellet binders, flow agents, mineralsupplements, and carcass modifiers.
A new chapter that addresses nutrient excretion wasadded to the tenth edition. This chapter discusses thepotential environmental impact of excessive excretion ofnutrients, particularly nitrogen and phosphorus, andaddresses means of reducing excretion of these potentialenvironmental pollutants by dietary manipulation.
The feed ingredient composition data have beenupdated and greatly expanded, with 23 additional ingredi-ents added to the tables, for a total of 79 feed ingredients.Net energy, neutral- and acid-detergent fiber (NDF,ADF), and beta-carotene concentrations of feedstuffs wereadded, and crude fiber was deleted. Vitamin E levels infeedstuffs were modified to include only those assayed byhigh-performance liquid chromatography. New tables thatgive estimates of apparent and true digestible coefficientsfor the amino acids in feedstuffs are now included. Othernew tables give the fatty acid composition of fat sourcesand estimates of the four most limiting amino acids infeedstuffs based on their crude protein content.
Finally, the tables of nutrient requirements have beenrevised and updated. The amino acid requirements are
based on the subcommittee’s assessment of the biologicalrelationships that govern accretion of protein and fat forgrowth, reproduction, and lactation. The estimates for allnutrients, including amino acids, are based on the bestjudgment of the subcommittee members following theirthorough review of the world’s scientific literature.
As in previous editions, the estimated nutrient require-ments in this publication are minimum standards withoutany safety allowances. Therefore, they should not be con-sidered as recommended allowances. Professional nutri-tionists may choose to increase the levels of some of themore critical nutrients to include ‘‘margins of safety’’ insome circumstances (this comment does not apply to sele-nium). Another important point is that, for minerals andvitamins, the estimated requirements include the amountsof these nutrients that are present in the natural feedstuffsand are not estimates of amounts of nutrients that shouldbe added to diets.
Knowledge of the nutritional needs of swine hasexpanded considerably since the last revision of this publi-cation. Nevertheless, there is still conflicting, incomplete,or no information for several nutrients at different stagesof the life cycle. This is particularly true for many of thevitamins and trace minerals, especially for the very youngpig and the gestating and lactating sow. More research isencouraged to expand the knowledge base in these areas.
The user of this publication is reminded that knowledgeof the principles and assumptions described in the text ofthis publication is absolutely essential for the proper useof the model and the tables of nutrient requirements.
1 Energy
Energy is produced when organic molecules undergooxidation. Energy is either released as heat or is trappedin high–energy bonds for subsequent use for the metabolicprocesses in animals.
Energy content in feedstuffs can be expressed as calories(cal), kilocalories (kcal), or megacalories (Mcal) of grossenergy (GE), digestible energy (DE), metabolizable energy(ME), or net energy (NE). Energy can also be expressedas joules (J), kilojoules (kJ), or megajoules (MJ) (1 Mcal4 4.184 MJ; 1 MJ 4 0.239 Mcal; 1 MJ 4 239 kcal). Theterms used in this publication to describe energy require-ments and energy content of feeds are similar to thosedefined and extensively discussed in Nutritional Energeticsof Domestic Animals and Glossary of Energy Terms(National Research Council, 1981). Whittemore and Mor-gan (1990), Chwalibog (1991), Ewan (1991), Noblet andHenry (1991), and Hoffmann (1994) have publishedreviews of energy utilization by swine.
Determination of the energy values of feedstuffs forswine is a difficult and tedious task. Originally, energyvalues were estimated from studies with chicks or werecalculated from Total Digestible Nutrients (TDN)(National Research Council, 1971). Since the originaldirect determinations of energy in feedstuffs for pigs byDiggs et al. (1959, 1965) and Tollett (1961), the databasehas grown. A summary of energy values of feedstuffs fromaround the world has been compiled by Ewan (1996). Still,where data are not available by direct means from pigstudies, energy concentrations can only be estimated fromchemical composition of the feedstuff. Prediction equa-tions that have been used for estimating energy concentra-tions in feeds are given in the subsequent sections. In allof these equations, the energy and nutrient concentrationsare expressed on a dry matter basis.
3
C LA SS I FI CA T IO N O F EN ER G Y
Gross Energy
Gross energy is the energy liberated when a substanceis combusted in a bomb calorimeter. The GE concentrationof a feed ingredient is dependent on the proportions ofcarbohydrate, fat, and protein present in the ingredient.Water and minerals contribute no energy; carbohydratesprovide 3.7 (glucose) to 4.2 (starch) kcal/g, protein provides5.6 kcal/g, and fat provides 9.4 kcal/g. If the compositionof a feed is known, GE can be predicted fairly accurately.The following relationship was reported by Ewan (1989)for predicting GE (kcal/kg) from ether extract (EE), crudeprotein (CP), and ash.
GE 4 4,143 ` (56 2 % EE) ` (15 2 % CP)1 (44 2 % Ash), R2 4 0.98 (1-1)
Digestible Energy
Dietary GE intake minus the GE of the excreted fecesis DE. Apparent indigestible energy is a major variable inthe evaluation of feed ingredients. Farrell (1978), Agricul-tural Research Council (1981), and Morgan and Whitte-more (1982) suggest that DE is preferable in describingthe energy requirements of swine and the energy contentof swine feeds, because DE is easily and precisely deter-mined and is, in principle, additive. In addition, DE valuesare available for most of the commonly used feeds. How-ever, in the conventional scheme of energy utilization, DEis apparent, not true, because fecal metabolic energy isnot considered.
Chemical composition of feed ingredients is a majordeterminant of DE, with positive effects of ether extractand negative effects of fiber and ash. The following equa-tions have been reported for predicting DE (kcal/kg) fromchemical composition:
4 Nutrient Requirements of Swine
DE 4 1174 ` (0.848 2 GE)` (2 2 % SCHO) 1 (16 2 % ADF),R2 4 0.87; Ewan (1989) (1-2)
DE 4 949 ` (0.789 2 GE)1 (43 2 % Ash) 1 (41 2 % NDF),R2 4 0.91; Noblet and Perez (1993) (1-3)
DE 4 4,151 1 (122 2 % Ash) ` (23 2 % CP)` (38 2 % EE) 1 (64 2 % CF),R2 4 0.89; Noblet and Perez (1993) (1-4)
in which SCHO is soluble carbohydrate calculated as 1001 (% CP ` % EE ` % Ash ` % NDF), ADF is aciddetergent fiber, NDF is neutral detergent fiber, and CFis crude fiber.
Digestibility of dietary energy increases slightly withincreased body weight (Noblet and Shi, 1993) because ofincreased degradation of undigested carbohydrate in thelarge intestine. Noblet and Shi (1993) proposed that forfinishing pigs and particularly sows fed at restricted feedintakes, DE concentrations (kcal/kg) should be correctedby one of the following relationships.
DE 4 1,391 ` (0.58 2 DE) ` (23 2 % EE)` (12.7 2 % CP), R2 4 0.96 (1-5)
or,
DE 4 1712 ` (1.14 2 DE)` (33 2 % NDF), R2 4 0.93 (1-6)
Metabolizable Energy
The DE minus the GE of gaseous and urinary lossesis metabolizable energy (ME). The loss of energy as gasproduced in the digestive tract of swine is usually between0.1 and 3.0 percent of DE (Noblet et al., 1989b; Shi andNoblet, 1993). These amounts are generally ignoredbecause they are small and not easily measured. For mostpractical swine diets used in North America, ME is 94 to97 percent of DE, with an average of 96 percent (Farrell,1979; Agricultural Research Council, 1981).
A correction is sometimes made to ME concentrationsfor nitrogen gained or lost from the body (MEn, Morganet al., 1975). ME is corrected to nitrogen equilibriumbecause the energy that is deposited as retained proteincannot be totally recovered by the animal if the aminoacids are degraded for energy. This correction to nitrogenequilibrium may be valid for mature animals but is notvalid for growing pigs that retain considerable amounts ofnitrogen. Therefore, the correction probably is not neces-sary (Farrell, 1979) or should be made to a constant positivenitrogen retention. The correction factor that is used hasbeen obtained by expressing the GE of urine per gram ofurinary nitrogen. For swine, Diggs et al. (1959) used acorrection factor of 6.77, Morgan et al. (1975) used 9.17,
and Wu and Ewan (1979) used 7.83 kcal of ME/g of nitro-gen to correct for each gram of nitrogen above or belownitrogen equilibrium. This correction is added to the deter-mined ME for pigs in negative nitrogen balance and sub-tracted when animals are in positive nitrogen balance.
If protein is of poor quality or in excess, ME decreasesbecause the amino acids not used for protein synthesis arecatabolized and used as a source of energy, and the nitrogenis excreted as urea. Therefore, as the nitrogen content ofthe urine increases, the energy losses in the urine increaseand the ME of the diet decreases.
Estimates of ME (kcal/kg) may be calculated from DE(kcal/kg) and CP using one of the following relationships.
ME 4 DE 2 (1.012 1 (0.0019 2 % CP)),R2 4 0.91; May and Bell (1971) (1-7)
ME 4 DE 2 (0.998 1 (0.002 2 % CP)),R2 4 0.54; Noblet et al. (1989c) (1-8)
ME 4 DE 2 (1.003 1 (0.0021 2 % CP)),R2 4 0.48; Noblet and Perez (1993) (1-9)
The ME of diets fed to finishing pigs or to sows fed atrestricted intakes increases because digestibility isimproved. Noblet and Shi (1993) proposed that ME con-centrations (kcal/kg) determined with growing pigs (,60kg) should be adjusted by one of the following relationshipsfor finishing pigs and sows.
ME 4 1,107 ` (0.64 2 ME) ` (22.9 2 % EE)` (6.9 2 % CP), R2 4 0.96 (1-10)
or,
ME 4 1946 ` (1.17 2 ME)` (3.15 2 % NDF), R2 4 0.94 (1-11)
Net Energy
Net energy (NE) is the difference between ME andheat increment (HI). The HI is the amount of heat releasedbecause of the energy costs of the digestive and metabolicprocesses. The energy of the HI is not used for productiveprocesses but can be used to maintain body temperaturein cold environments. Net energy, therefore, is the energythat the animal uses for maintenance (NEm) and production(NEp). The energy used for maintenance (NEm) is alsodissipated as heat, so that total heat production is the sumof HI and NEm. Evaluation of NE requires the measure-ment of energy balance or heat production. If energy isrequired to maintain body temperature or excess activity,NEp is reduced. Although difficult to measure, NE is thebest indication of the energy available to an animal formaintenance and production (Noblet et al., 1994).
For pigs fed conventional diets and kept at thermoneu-tral temperatures, the ratio of NE to ME ranged from 0.66
Energy 5
to 0.75 (Thorbek, 1975; Noblet et al., 1994). Ewan (1976),Phillips and Ewan (1977), and Pals and Ewan (1978)reported the efficiency of ME utilization for energy gainand maintenance (NE) in growing pigs to vary from 27percent for wheat middlings, to 69 percent for corn, to75 percent for soybean oil. Noblet et al. (1994) reportedefficiencies of energy utilization of 90, 82, 80, 72, and 60percent for rapeseed oil, cornstarch, sucrose, and mixturesof protein and fiber sources, respectively, for pigs rangingin weight from 45 to 150 kg. Some of the reported relation-ships between NE (kcal/kg) and chemical composition areas follows:
NE 4 328 ` (0.599 2 ME)1 (15 2 % Ash) 1 (30 2 % ADF),R2 4 0.81; Ewan (1989) (1-12)
NE 4 (0.726 2 ME) ` (13.3 2 % EE)` (3.9 2 % St) 1 (6.7 2 % CP)1 (8.7 2 % ADF)R2 4 0.97; Noblet et al. (1994) (1-13)
NE 4 2,790 ` (41.2 2 % EE) ` (8.1 2 % St)1 (66.5 2 % Ash) 1 (47.2 2 % ADF),R2 4 0.90; Noblet et al. (1994) (1-14)
in which St is starch.
H EA T P R OD UC T IO N
Measurement of total heat production includes theenergy associated with HI, the energy required for mainte-nance, and energy expended in response to changes inthe environment. The major environmental factors thatinfluence heat production are temperature and physicalactivity.
Temperature
Cold thermogenesis influences energy requirementswhen the ambient temperature (T, °C) is below the criticaltemperature (Tc, °C). The critical temperature is the pointbelow which an animal must increase heat production tomaintain body temperature. Below Tc, the pig mustincrease its rate of metabolic heat production to maintainhomeothermy (National Research Council, 1981). Factorsthat alter the rate of energy exchange between the animaland its environment will alter Tc (National Research Coun-cil, 1981). The energy cost of cold thermogenesis can bedescribed by the following equation:
MEHc (kcal ME/day) 4 ((0.3132 BW) ` 22.71) 2 (Tc 1 T) (1-15)
where MEHc is energy cost of cold thermogenesis, BW isanimal weight in kg, and Tc and T are expressed in °C
(Agricultural Research Council, 1981). Verstegen et al.(1982) estimated that during their growth period, from 25to 60 kg, pigs needed an additional 25 g of feed/day (80kcal of ME/day) to compensate for each 1°C below Tc.During the finishing period, from 60 to 100 kg, pigsrequired an additional 39 g of feed/day (125 kcal of ME/day) for each 1°C below Tc.
For each 1°C below the lower critical temperature (18to 20°C), there is an increase in heat production of approxi-mately 3.7 to 4.5 kcal of ME/kg of body weight raised tothe 0.75 power (BW0.75) (Noblet et al., 1985; Close andPoorman, 1993). The lower critical temperature is reducedby group housing, by use of bedding, and by decreasedventilation rate. For 180-kg sows in normal condition indi-vidually housed on concrete, the increase in energyrequired to maintain body temperature is about 4 percentof maintenance requirement per °C below the lower criti-cal temperature (Verstegen et al., 1987).
Between the upper and lower critical temperatures, azone of thermoneutrality exists where heat production isrelatively stable. Environmental temperatures above thecritical temperature will reduce feed intake (Ewan, 1976).The National Research Council (1987) suggested that DEintake is reduced by 1.7 percent for each 1°C that theeffective ambient temperature of the pig exceeds the uppercritical temperature. Here, effective ambient temperatureis the temperature the animal experiences.
Activity
Physical activity also influences heat production. Petleyand Bayley (1988) measured the heat production of pigsrunning on a treadmill and reported that heat productionof the exercised pigs was 20 percent greater than that ofcontrol animals. Close and Poorman (1993) calculated thatthe additional expenditure of energy by growing pigs forwalking was 1.67 kcal of ME/kg of BW for each kilometer.Noblet et al. (1993) measured the increase in heat produc-tion associated with standing by sows as 6.5 kcal of ME/kg of BW0.75 for each 100 minutes. This figure was similarto reports by Ho
¨rnicke (1970) of 7.2, by McDonald et al.
(1988) of 7.1, by Susenbeth and Menke (1991) of 6.1, andby Cronin et al. (1986) of 7.6 kcal/kg of BW0.75 for each100 minutes. Noblet et al. (1993) also determined that theenergy cost of consuming feed was 24 to 35 kcal of ME/kg of feed consumed.
E NE RG Y RE QU I RE ME N TS
Maintenance
The ME requirement for maintenance (MEm) includesthe needs of all body functions and moderate activity. These
6 Nutrient Requirements of Swine
requirements are usually expressed on a metabolic bodyweight basis, which is defined as body weight raised to the0.75 power (BW0.75). Other exponents have been suggestedas more appropriate: 0.67 (Heusner, 1982); 0.60 (Nobletet al., 1989b); 0.42 (Noblet et al., 1994). Estimates of theMEm requirement/kg of BW0.75 vary from 92 to 160 kcal/day, with most values falling between 100 and 125 kcal/day. The mean estimate for MEm is 106 kcal of ME/kg ofBW0.75/day (Whittemore, 1976; Bo
¨hme et al., 1980; Wenk
et al., 1980; Agricultural Research Council, 1981; Nobletand Le Dividich, 1982; Campbell and Dunkin, 1983; Closeand Stanier, 1984; McNutt and Ewan, 1984; Gadeken etal., 1985; Noblet et al., 1985), which is equivalent to 110kcal of DE/kg of BW0.75. However, Whittemore (1983)suggested that MEm can be more accurately described as:
MEm (kcal/day) 4 442 2 Pt0.78 (1-16)
where Pt is the whole body protein mass in kg.Robles and Ewan (1982) reported daily NE require-
ments for maintenance (NEm) as 71 kcal/kg of BW0.75; Just(1982c) reported NEm as 78 kcal/kg of BW0.75; and Nobletet al. (1994) reported this figure as 86 kcal/kg of BW0.42.
During gestation, 60 to 80 percent of the total energyrequirement is used for maintenance. The NationalResearch Council (1988) concluded from the available lit-erature that the daily requirement for maintenance of preg-nant sows was 106 kcal of ME or 110 kcal of DE/kg ofBW0.75/day. Noblet et al. (1990), on the basis of recentestimates, concluded that the daily requirement was 105kcal of ME/kg of BW0.75 for primiparous and multiparoussows. Beyer et al. (1994) reached a similar conclusion fromthe literature (103 kcal of ME/kg of BW0.75/day) for primip-arous sows but reported data to indicate an increase from93 kcal in the first parity to 104 kcal in the second parityand to 113 kcal of ME/kg of BW0.75 in the fourth parity.Whittemore and Yang (1989) reported the daily require-ment as 115 kcal of ME/kg of BW0.75 from observationsover four parities during gestation, lactation, and the inter-val from weaning to conception. Based on the literature,there seems little justification for altering the value usedfor growing pigs of 106 kcal of ME/kg of BW0.75 (or 110 kcalof DE/kg of BW0.75) for the daily maintenance requirement.Whittemore and Morgan (1990) suggested that the mainte-nance requirement was proportional to body protein mass(Pt) by the following relationship.
MEm (kcal/day) 4 600 2 Pt0.648 (1-17)
The daily maintenance energy requirement for the lac-tating sow is presumably also 106 kcal of ME/kg of BW0.75
(or 110 kcal of DE/kg of BW0.75) (National Research Coun-cil, 1988), which is the same as that for the gestating sow.But some recent reports have suggested that the require-ment of the lactating sow may be 5 to 10 percent higherthan that of the gestating sow; the higher figure probably
reflects the heat production associated with the synthesis ofmilk (Noblet and Etienne, 1986, 1987; Burlacu et al., 1986).
Noblet et al. (1989a) reported no difference in mainte-nance requirement among growing boars, barrows, andgilts (112 kcal of ME/kg of BW0.75). Kemp (1989) reportedthe maintenance requirement for mature boars as 99 kcalof ME/kg of BW0.75. McCracken et al. (1991) reportedmeasurement of maintenance requirements of matureboars of 126 kcal of ME/kg of BW0.75. Although the limiteddata available may suggest a higher maintenance require-ment for boars, the estimate suggested for growing pigsand sows is preferred (106 kcal of ME/kg of BW0.75 or 110kcal of DE/kg of BW0.75).
Growth
Estimates for the energy costs of protein retention(MEpr) range from 6.8 to 14.0 Mcal of ME/kg, with amean of 10.6 Mcal of ME/kg (Tess et al., 1984). Literatureestimates of the energy costs of fat deposition (MEf) rangefrom 9.5 to 16.3 Mcal of ME/kg, with a mean of 12.5 Mcalof ME/kg (Tess et al., 1984). Although the mean energycosts/kg of protein or fat deposited are approximately equal(Wenk et al., 1980), 1 kg of lean muscle tissue is only 20to 23 percent protein, whereas 1 kg of adipose tissue is 80to 95 percent fat. Therefore, the energy cost for muscletissue production is considerably less than that for fat tis-sue deposition.
Pregnancy
The feed and energy requirements of the pregnant sowwill vary with body weight, target body weight gain duringpregnancy, and other management and environmentalparameters. The Agricultural Research Council (1981),Cole (1982), Seerley and Ewan (1983), and Aherne andKirkwood (1985) reviewed the effects of energy intakeduring gestation on sow weight gain and reproductive per-formance. Aherne and Kirkwood (1985) and Williams etal. (1985) suggested that sows should be fed and managedso that they gain 25 kg of maternal tissues throughoutpregnancy for at least the first three or four parities. Theweight of the placenta and other products of conceptionshould be approximately 20 kg, for a total of 45 kg ofgestational weight gain of the sow (Verstegen et al., 1987;Noblet et al., 1990).
In general, an increase in the energy intake of the preg-nant sow above 6.0 Mcal of ME/day will increase maternalweight gain but will not significantly affect litter size atparturition (Elsley, 1973; Agricultural Research Council,1981). Whittemore et al. (1984) reported that gestationfeed intakes between 1.7 and 2.3 kg/day of sows maintainedfor five parities had no significant effect on the total numberof pigs born. Sows receiving the lowest level of feed did
Energy 7
have a higher overall culling rate, however. The majorityof experiments on this topic have demonstrated that pigbirth weights progressively increase when sow feed orenergy intake increases during pregnancy. However, a birthweight increase with a maternal feed intake of more than6.0 Mcal of ME/day is seldom significant (Libal and Wahl-strom, 1977; Henry and Etienne, 1978; AgriculturalResearch Council, 1981).
Increasing feed intake during early gestation does notaffect the number of pigs born (den Hartog and van Kem-pen, 1980; Toplis et al., 1983). High levels of feed intake(. 2.5 kg/day) during the first three days after matingreduced embryo survival in gilts by about 5 percent in onestudy (Aherne and Williams, 1992) and by 15 percent inanother (Dyck et al., 1980), but the reduction in survivaldoes not consistently result in reduced litter size. Elsleyet al. (1971) and Cromwell et al. (1980, 1989) demonstratedthat the pattern of feed intake during pregnancy was lessimportant in influencing sow performance than the totalamount of feed given to the sows. Increasing feed intakein late gestation may increase the average birth weight ofpigs (Hillyer and Phillips, 1980; Cromwell et al., 1982).Cromwell et al. (1989) also reported that by increasingfeed intake 1.36 kg during the last 23 days of pregnancy,pig weight increased at birth by 40 g and at 21 days of ageby 170 g. Weldon et al. (1991) reported that increasedenergy intake (5.76 to 10.5 Mcal of ME/day) of gilts fromday 75 to 105 of pregnancy reduced mammary cell numbersand suggested that milk production may be reduced.
Pregnant sows offered feed ad libitum will consumemore energy during gestation than required for mainte-nance and growth of the conceptus tissue, thus resultingin an increase in deposition of body fat and protein. Asenergy intake and weight gain during pregnancy increase,energy intake during lactation decreases and weight lossduring lactation increases (Salmon-Legagneur and Re
´rat,
1962; Baker et al., 1969; Brooks and Smith, 1980; O’Grady,1980; Cole, 1982; Williams et al., 1985; Weldon et al.,1994). Therefore, it is desirable to limit energy intake dur-ing pregnancy to control weight gain. The daily energyrequirements for pregnancy include the costs of mainte-nance, energy required for the deposition of protein andfat in the maternal tissue, and energy requirements ofthe conceptus.
Weight gain during pregnancy is a sum of maternalprotein and fat deposition and the gain of the products ofconception. Beyer et al. (1994) reported from a compara-tive slaughter experiment that the total weight gain of theuterus, uterine fluids, products of conception, and mam-mary tissue was 22.8 kg for sows fed three levels of energyduring the first, second, or fourth parity. Assuming a littersize of 10 pigs, this equates to 2.28 kg per pig. The weightgain of protein was 2.46 kg and of fat was 0.46 kg. Totalenergy gain was 19.94 Mcal. Total maternal weight gain
was dependent on the amount of energy consumed. Theyfound that there was an obligatory deposition of about 20Mcal of NE due to pregnancy, or 174 kcal of NE/day.Assuming an efficiency of utilization of ME for NE of0.486 (Noblet and Etienne, 1987), the energy requirementfor pregnancy would be 358 kcal of ME/day. Additionalenergy above the maintenance and pregnancy requirementwould be used for maternal gain, presumably with thesame efficiency as for growth.
Lactation
The long-term reproductive efficiency of the sow is bestserved by minimizing weight loss during lactation (Dour-mad et al., 1994). Such a strategy requires only minimalrestoration of weight in the next pregnancy. The dailyenergy requirements during lactation include a require-ment for maintenance (MEm) and a requirement for milkproduction. The energy requirement for milk productioncan be estimated from the growth rate of the suckling pigand the number of pigs in the li tter (Noblet andEtienne, 1989):
Milk Energy 4 (4.92 2 ADG 2 pigs)1 (90 2 pigs) (1-18)
in which milk energy is in kcal of GE/day, ADG is thegrowth rate of the suckling pig averaged over the lactationperiod (g/day), and pigs is the number of pigs in the litter.Assuming that the efficiency of conversion of dietary energyto milk energy is 0.72 (Noblet and Etienne, 1987), therelationship is as described below.
ME for Milk 4 (6.83 2 ADG 2 pigs)1 (125 2 pigs) (1-19)
If dietary energy intake is not adequate to meet thedemands of maintenance and milk production, tissue willbe mobilized to provide the necessary nutrients for milkproduction. Noblet and Etienne (1987) concluded that theefficiency of conversion of tissue energy to milk energy is0.88; this figure suggests that the major source of energyused is fat.
Developing Boars and Gilts
Developing boars and gilts should be given ad libitumaccess to diets until selected as breeding animals at about100 kg BW to allow evaluation of the potential growthrate and lean gain. After the animals are selected for thebreeding herd, energy intake should be restricted toachieve the desired weight at the time the animals areused for breeding (Wahlstrom, 1991).

8 Nutrient Requirements of Swine
Sexually Active Boars
The energy requirement of the working boar is the sumof the energy required for maintenance, mating activity,semen production, and growth. Kemp (1989) reported thatthe heat production associated with the collection of semenwhen mounting a dummy sow was 4.3 kcal of DE/kg ofBW0.75. Close and Roberts (1993) estimated the energyrequired for semen production from the average energycontent of each ejaculation (62 kcal of DE) and an estimateof the efficiency of energy utilization (0.60). The energyrequired was 103 kcal of DE per ejaculation.
E NE RG Y SO UR C ES
Sugars and Starch
Satisfactory survival and growth rates of pigs fed dietscontaining high levels of different sugars suggest that glu-cose and lactose are the sugars most effectively utilizedby pigs less than 7 days old (Kidder and Manners, 1978;Sambrook, 1979). Pigs less than 7 days old fed diets contain-ing fructose or sucrose develop severe diarrhea, weightloss, and high mortality (Becker and Terrill, 1954; Aherneet al., 1969). After pigs reach 7 to 10 days of age, they canutilize fructose and sucrose.
Starch is the main carbohydrate and energy source inmost diets fed to pigs. However, pigs less than 2 to 3 weeksold fed diets containing large amounts of starch do notgrow as well as pigs fed diets in which glucose, lactose, orsucrose is the carbohydrate source. The poor growth wasattributed to insufficient pancreatic amylase and intestinaldisaccharidases (Cunningham, 1959; Sewell and Maxwell,1966). After pigs are 2 or 3 weeks old, their digestiveenzyme systems can digest cereal starch more efficiently.Pigs can then be fed starch- or cereal-based diets (Beckerand Terrill, 1954; Cunningham, 1959; Sewell and Max-well, 1966).
Nonstarch Polysaccharides
Crude fiber determination is an imprecise analytical pro-cedure. Cellulose, hemicellulose, and lignin in crude fiberare 50 to 80 percent, 20 percent, and 10 to 50 percent,respectively, for typical feedstuffs (Van Soest andMcQueen, 1973). In view of the diverse composition offiber, methods have been developed to quantify fiber basedon solubility. Neutral detergent fiber (NDF) is an estimateof the total plant cell wall, which consists primarily ofcellulose, hemicellulose, and lignin (Goering and VanSoest, 1970). Acid detergent fiber (ADF) is an estimate ofcellulose and lignin. The difference between NDF andADF is the estimated hemicellulose content of a feed sam-ple (Goering and Van Soest, 1970).
The addition of fiber (crude fiber, NDF, ADF) to swinediets decreases the DE concentration of the diet (Kingand Taverner, 1975; DeGoey and Ewan, 1975; Kennellyet al., 1978; Kennelly and Aherne, 1980b). Increased feedintake generally results as the pig attempts to maintain DEintake (Baird et al., 1975; Agricultural Research Council,1981; Low, 1985). When dietary crude fiber exceeds 10 to15 percent of the diet, however, feed intake may bedepressed because of excessive bulk or reduced palatability(Braude, 1967). Low-energy (high-fiber) diets will supportgrowth rates equal to those of pigs fed higher-energy dietsduring periods of low environmental temperatures, butdiets of this type usually depress the growth rate duringperiods of high temperatures (Coffey et al., 1982; Stahly,1984).
Utilization of fiber by nonruminants has been shown tovary considerably, depending on the fiber source (Bell,1960; Nehring and Uhlemann, 1972; Laplace and Lebas,1981), degree of lignification (Forbes and Hamilton, 1952),level of inclusion (Farrell and Johnson, 1970; Just, 1979),and extent of processing (Saunders et al., 1969; McNab,1975). Fiber utilization is also influenced by the physicaland chemical composition of the total diet (Schneider andLucas, 1950; Myer et al., 1975), level of feeding (Cunning-ham et al., 1962), age and weight of the animal (Zivkovicand Bowland, 1970), adaptation to the fiber source (Poll-man et al., 1979), and individual variation among pigs (Keyset al., 1970; Farrell, 1973; King and Taverner, 1975). Whenthese factors are considered, it is not surprising that thedigestibility of fiber has been shown to vary between 0 and97 percent (Re
´rat, 1978) and that the literature contains
conflicting reports about the effects of fiber on the digest-ibility of nutrients. Just (1982a) reported that an increasein 1 percent of dietary crude fiber depressed digestibilityof gross energy by approximately 3.5 percent.
Fibrous components of the diet are poorly digested inthe small intestine and provide substrates for microbialfermentation in the large intestine. The principal end prod-ucts of microbial fermentation in the large intestine arevolatile fatty acids (VFA). The caloric contribution of VFAto swine has been estimated at values ranging from about5 to 28 percent of the maintenance energy requirement,depending on the level and frequency of feeding and thefiber level of the diet (Friend et al., 1964; Farrell andJohnson, 1970; Imoto and Namioka, 1978; Kim et al., 1978;Kass et al., 1980; Kennelly et al., 1981). Energy derivedfrom fermentation in the large intestine is utilized withlower efficiency than energy digested in the small intestine(52 versus 76 percent [Noblet et al., 1994]; 57 versus 74percent [Hoffmann et al., 1990]).
There is disagreement concerning the influence of fiberon protein digestibility. Several reports suggest that whenthe source of fiber does not contribute significant amountsof protein to the diet, then an increase in the level of fiber

Energy 9
does not affect protein digestibility significantly (Gouwens,1966; Friend, 1970; Eggum, 1973; Kennelly and Aherne,1980a). Other researchers have observed, however, thatan increase in the dietary level of fiber decreases proteindigestibility (Pond et al., 1962; Cole et al., 1967; Kass etal., 1980; Just et al., 1983; Frank et al., 1983; Noblet andPerez, 1993).
Lipids
The term ‘‘lipid’’ includes both fats and oils. Originally,linoleic and arachidonic acids were both identified as essen-tial fatty acids (EFA) that must be supplied in the diet(Cunnane, 1984). Now it is recognized that these fattyacids are members of N–6 series of EFA and that arachi-donic acid can be derived in vivo from linoleic acid. It isdifficult to produce overt signs of an EFA deficiency inpigs. Enser (1984) has reported normal growth in pigsfrom weaning to slaughter weight when they are fed dietscontaining only 0.1 percent linoleic acid. The AgriculturalResearch Council (1981) suggested the EFA requirementsare 3.0 percent of dietary DE for pigs up to 30 kg and 1.5percent of dietary DE from 30 to 90 kg. These are equiva-lent to about 1.2 and 0.6 percent of the diet. Christensen(1985) reported that for maximum performance and effi-ciency of feed utilization, pigs weaned at 5 weeks of ageand raised to 100 kg BW require a dietary lineoleic acidof 0.2 percent of GE, or about 0.1 percent of the diet.This level of linoleic acid is usually present in diets basedon commonly used cereal grains and protein supplements.In addition to EFA of the N–6 series, pigs probably requireEFA of the N–3 series. However, practical diets also con-tain adequate amounts of these EFA. Therefore, the mainconcern is the use of lipids as an energy source. Energyconcentrations of selected fats are presented in Chapter11 (Table 11-10).
The value of adding fat to the diets of weanling pigs isuncertain. Pettigrew and Moser (1991) summarized datainvolving 92 comparisons of fat additions for pigs from 5to 20 kg. In this weight range, addition of fat reducedgrowth rate and feed intake while it improved gain-to-feedratio. The response of growth rate was small (0.01 kg) andvariable, with similar numbers of positive (37) and negative(38) responses. Inconsistent responses to added fat maybe a result of a number of factors, including the age ofthe pig at the start of the experiment, the amount of fatadded, the type of fat, and the method by which the fatwas added. Pettigrew and Moser (1991) reported responsesfor studies in which a constant protein-to-energy ratio wasmaintained and found no response in growth rate, a reduc-tion in feed intake, and an improvement in gain-to-feedratio when fat was added.
These data suggest that there is an optimal protein-to-energy ratio for young pigs. Consequently, nutrient
requirements often are expressed as the amount per Mcalof DE (Agricultural Research Council, 1981). Such anexpression assumes that the optimal nutrient-to-energyratio for maintenance is the same as for a high level ofproduction. However, this assumption is probably not fullycorrect because the relative maintenance and gain require-ments for specific nutrients probably differ from those forenergy. Hence, the ratio will change, usually decreasingas the rate of production or body weight increases. Theconcept of a fixed optimal protein-to-energy ratio is notsupported by the results of several experiments; in these,fat added to diets containing high levels of protein andother nutrients depressed the rate and efficiency of gain(Crampton and Ness, 1954; Smith and Lucas, 1956; Peoet al., 1957; Crampton et al., 1960). Clawson et al. (1962)found little correlation between rate or efficiency of gainand the protein-to-energy ratios. Tribble et al. (1979) andLewis et al. (1980) reported that the addition of fat to thediet did not influence the lysine requirement of starterpigs fed sorghum- or corn-based diets. Cuaron et al. (1981)reported that protein-to-energy ratios within the range of53 to 71 g of protein/Mcal of DE did not significantlyinfluence the performance of starter pigs.
For growing-finishing swine (20 to 100 kg), the summaryby Pettigrew and Moser (1991) indicated consistentimprovement in growth rate, reduction in feed intake,improvement in gain-to-feed ratio, but an increase in back-fat thickness in response to addition of fat to swine diets.Chiba et al. (1991) reported that a ratio of 3.0 g of lysine(or 49 g of balanced protein) per Mcal of DE was necessaryto maximize the beneficial effects of fat addition to diets.The digestibility of the dietary fat, quantity of ME and fatconsumed, and environmental temperature in which pigsare housed influence the nutritional value of fat as anenergy source for pigs (Stahly, 1984). In general, the substi-tution of fat for carbohydrate calories in a diet for pigsmaintained in a thermoneutral environment increasesgrowth rate and decreases the ME required per unit ofbody weight gain. But for pigs housed in a warm environ-ment, voluntary ME intake increases by 0.2 to 0.6 percentfor each additional 1 percent of fat added to the diet. Thisincrease is because the heat increment of fat is less thanthat of carbohydrate (Stahly, 1984).
The age of the pig, chain length of the fatty acids inthe fat, free fatty acid concentration, and unsaturated-to-saturated (U:S) fatty acid ratio influence the apparentdigestibility of fat (Stahly, 1984). Dietary fat digestibilityis low in the weaned pig and improves as the pig grows.The apparent digestibility of short- or medium-chain fattyacids (14 carbons or less) is high (80 to 95 percent), regard-less of the dietary ratio of U:S fatty acids (Stahly, 1984).Powles et al. (1995) summarized a series of studies andreported a curvilinear increase in the digestibility of fat asthe ratio of U:S fatty acids increased from 1 to 4. They
10 Nutrient Requirements of Swine
also reported a linear decrease in digestibility as free fattyacid concentrations increased from 100 to 800 g/kg of fat.Apparent fat digestibility decreases by 1.3 to 1.5 percentfor each additional 1 percent of crude fiber in the diet(Just, 1982a,b,c).
Evidence suggests that the addition of fat to the dietsof sows during late gestation or lactation increases the milkyield, fat content of colostrum and milk, and survival ofpigs from birth to weaning, especially for lightweight pigs(Moser and Lewis, 1980; Coffey et al., 1982; Seerley, 1984;Pettigrew and Moser, 1991). Improvements in survival ofpigs from birth to weaning were dependent on the totalamount of fat the sow consumed before farrowing(. 1,000 g) and the birth-to-weaning survival of the controlgroups (, 80 percent). Fat supplementation can alsoreduce sow weight loss during lactation and decrease theinterval from weaning to mating (Moser and Lewis, 1980;Pettigrew, 1981; Cox et al., 1983; Seerley, 1984; Moser etal., 1985; Shurson et al., 1986; Pettigrew and Moser, 1991).
V OL UN T AR Y F E ED IN T AK E
The control of feed intake is influenced by a number offactors in the following groups:
● Physiological factors, including genetics, neural andhormonal mechanisms, and sensory factors, includingolfaction and taste (Baldwin, 1985; Fowler, 1985; NationalResearch Council, 1987);
● Environmental factors, including environmental tem-perature, humidity, air movement, feeder design and loca-tion, number of pigs per pen, and available space per pig(National Research Council, 1987); and
● Dietary factors, including deficiencies or excesses ofnutrients, energy density, antibiotics, flavors, feed process-ing, and availability and quantity of water (AgriculturalResearch Council, 1981; Fowler, 1985; National ResearchCouncil, 1987).
The factors that affect feed intake have been extensivelyreviewed in Predicting Feed Intake of Major Food-Produc-ing Animals (National Research Council, 1987). These val-ues are for pigs allowed ad libitum access to a balancedcorn–soybean meal diet. If the feed intake is restricted, asit sometimes is for gilts and boars used for breeding, thedaily nutrient (but not energy) intakes must be maintainedat least at the levels suggested for market pigs. To accom-plish this, the nutrient-to-energy ratio of the diet must beincreased. Voluntary energy intake formulas for variousclasses of swine are presented below.
Suckling Pigs
According to the National Research Council (1987), theDE intake of creep feed by the suckling pig can beexpressed by the following relationship:
DE intake (kcal/day) 4 1151.7` (11.2 2 day), R2 4 0.72 (1-20)
where day is age of the pig. The consumption of dry feedis not predicted until pigs are 13.5 days old.
Weanling Pigs
Based on a review of the literature, the NationalResearch Council (1987) concluded that feed intakeincreases linearly during the postweaning period exceptfor the first 24 hours after weaning, when little or no feedis consumed. Estimates of this rate of increase in feedintake range from 17 to 23 g/day for corn–soybean mealdiets containing 3,200 kcal of DE/kg of feed. These datacould be described by the following equation:
DE intake (kcal/day)4 11,531 ` (455.5 2 BW)1 (9.46 2 BW2), R2 4 0.92 (1-21)
which describes the relationship of BW to the DE intakeof the 5- to 15-kg pig.
Growing-Finishing Pigs
When growing-finishing pigs weighing 15 to 110 kg areallowed to consume feed ad libitum daily, the energy con-tent of the diet generally controls the amount consumed(Agricultural Research Council, 1981; Cole, 1984; Chibaet al., 1991). Pigs will compensate for decreases or increasesin the energy density of the diet by increasing or decreasingtheir feed intake (Owen and Ridgeman, 1967, 1968; Coleet al., 1968). Within limits, this compensation normalizesenergy intake. However, voluntary feed intake varies con-siderably from day to day and among individual pigs (Franket al., 1983). For pigs allowed ad libitum access to feed,energy intake is generally about 3 to 4 times the mainte-nance energy requirement.
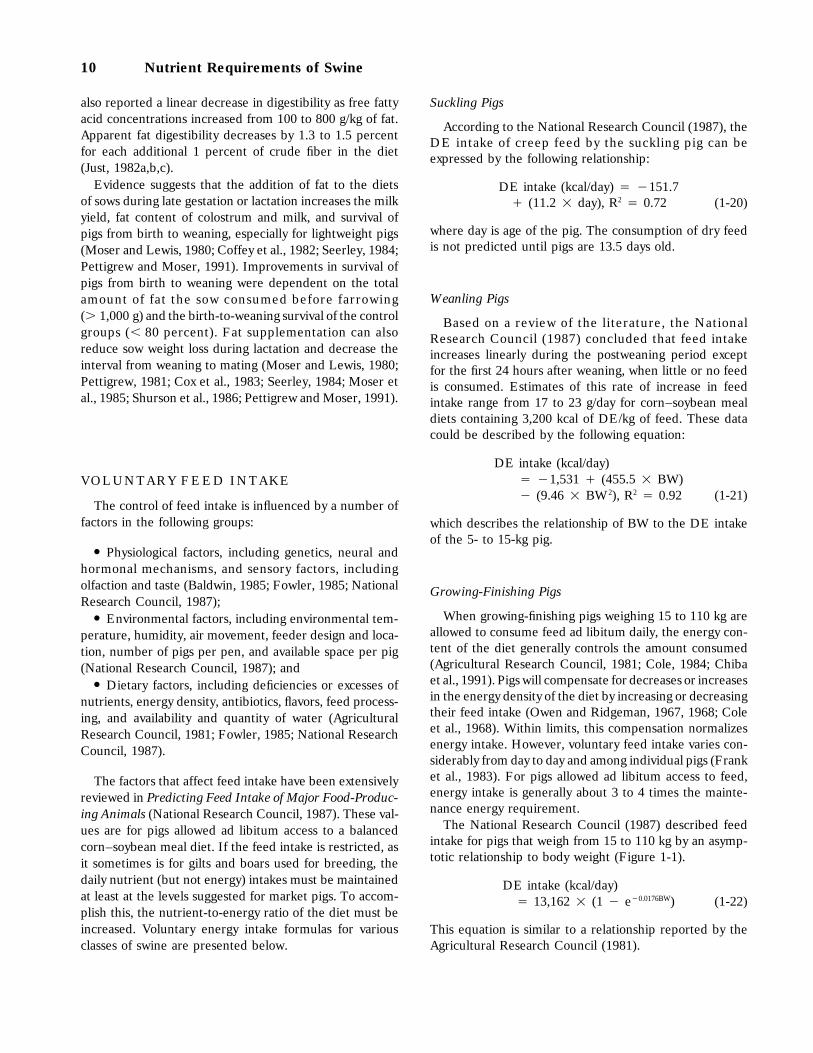
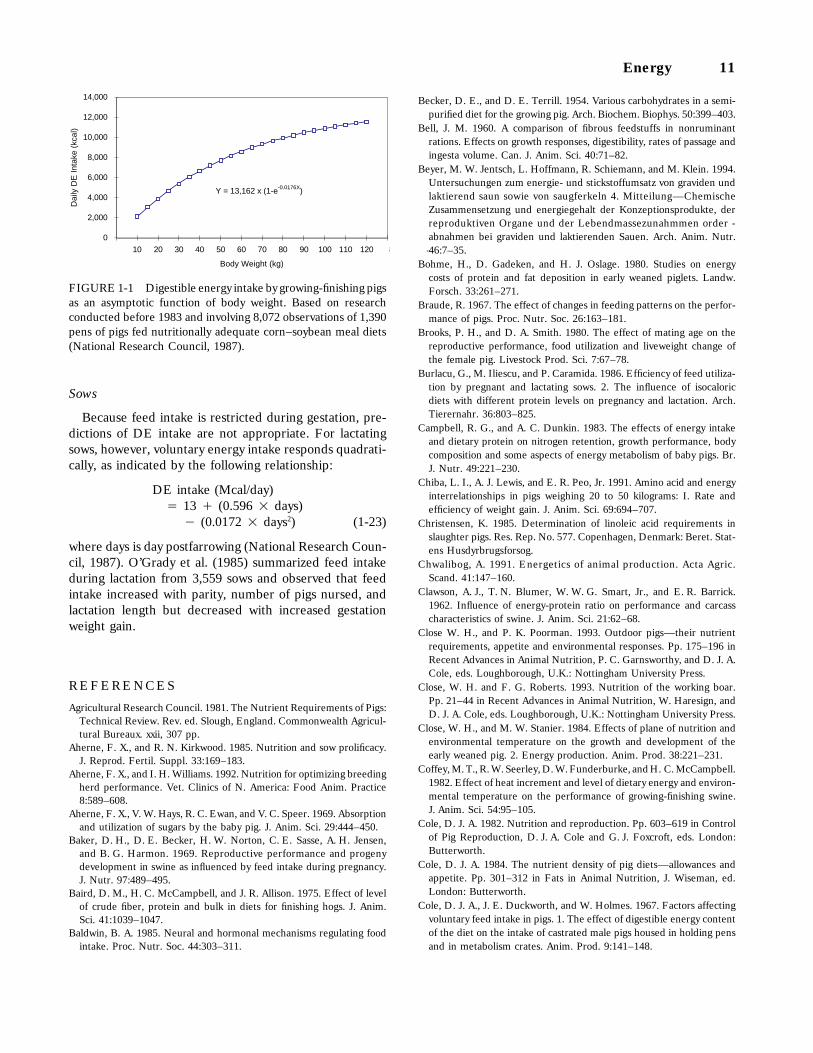
The National Research Council (1987) described feedintake for pigs that weigh from 15 to 110 kg by an asymp-totic relationship to body weight (Figure 1-1).
DE intake (kcal/day)4 13,162 2 (1 1 e10.0176BW) (1-22)
This equation is similar to a relationship reported by theAgricultural Research Council (1981).
Energy 11
0
2,000
4,000
6,000
8,000
10,000
12,000
14,000
0 10 20 30 40 50 60 70 80 90 100 110 120 13
Body Weight (kg)
Dai
ly D
E In
take
(kc
al)
Y = 13,162 x (1-e-0.0176X)
FIGURE 1-1 Digestible energy intake by growing-finishing pigsas an asymptotic function of body weight. Based on researchconducted before 1983 and involving 8,072 observations of 1,390pens of pigs fed nutritionally adequate corn–soybean meal diets(National Research Council, 1987).
Sows
Because feed intake is restricted during gestation, pre-dictions of DE intake are not appropriate. For lactatingsows, however, voluntary energy intake responds quadrati-cally, as indicated by the following relationship:
DE intake (Mcal/day)4 13 ` (0.596 2 days)
1 (0.0172 2 days2) (1-23)
where days is day postfarrowing (National Research Coun-cil, 1987). O’Grady et al. (1985) summarized feed intakeduring lactation from 3,559 sows and observed that feedintake increased with parity, number of pigs nursed, andlactation length but decreased with increased gestationweight gain.
R EF ER E NC ES
Agricultural Research Council. 1981. The Nutrient Requirements of Pigs:Technical Review. Rev. ed. Slough, England. Commonwealth Agricul-tural Bureaux. xxii, 307 pp.
Aherne, F. X., and R. N. Kirkwood. 1985. Nutrition and sow prolificacy.J. Reprod. Fertil. Suppl. 33:169–183.
Aherne, F. X., and I. H. Williams. 1992. Nutrition for optimizing breedingherd performance. Vet. Clinics of N. America: Food Anim. Practice8:589–608.
Aherne, F. X., V. W. Hays, R. C. Ewan, and V. C. Speer. 1969. Absorptionand utilization of sugars by the baby pig. J. Anim. Sci. 29:444–450.
Baker, D. H., D. E. Becker, H. W. Norton, C. E. Sasse, A. H. Jensen,and B. G. Harmon. 1969. Reproductive performance and progenydevelopment in swine as influenced by feed intake during pregnancy.J. Nutr. 97:489–495.
Baird, D. M., H. C. McCampbell, and J. R. Allison. 1975. Effect of levelof crude fiber, protein and bulk in diets for finishing hogs. J. Anim.Sci. 41:1039–1047.
Baldwin, B. A. 1985. Neural and hormonal mechanisms regulating foodintake. Proc. Nutr. Soc. 44:303–311.
Becker, D. E., and D. E. Terrill. 1954. Various carbohydrates in a semi-purified diet for the growing pig. Arch. Biochem. Biophys. 50:399–403.
Bell, J. M. 1960. A comparison of fibrous feedstuffs in nonruminantrations. Effects on growth responses, digestibility, rates of passage andingesta volume. Can. J. Anim. Sci. 40:71–82.
Beyer, M. W. Jentsch, L. Hoffmann, R. Schiemann, and M. Klein. 1994.Untersuchungen zum energie- und stickstoffumsatz von graviden undlaktierend saun sowie von saugferkeln 4. Mitteilung—ChemischeZusammensetzung und energiegehalt der Konzeptionsprodukte, derreproduktiven Organe und der Lebendmassezunahmmen order -abnahmen bei graviden und laktierenden Sauen. Arch. Anim. Nutr.46:7–35.
Bo¨hme, H., D. Gadeken, and H. J. Oslage. 1980. Studies on energycosts of protein and fat deposition in early weaned piglets. Landw.Forsch. 33:261–271.
Braude, R. 1967. The effect of changes in feeding patterns on the perfor-mance of pigs. Proc. Nutr. Soc. 26:163–181.
Brooks, P. H., and D. A. Smith. 1980. The effect of mating age on thereproductive performance, food utilization and liveweight change ofthe female pig. Livestock Prod. Sci. 7:67–78.
Burlacu, G., M. Iliescu, and P. Caramida. 1986. Efficiency of feed utiliza-tion by pregnant and lactating sows. 2. The influence of isocaloricdiets with different protein levels on pregnancy and lactation. Arch.Tierernahr. 36:803–825.
Campbell, R. G., and A. C. Dunkin. 1983. The effects of energy intakeand dietary protein on nitrogen retention, growth performance, bodycomposition and some aspects of energy metabolism of baby pigs. Br.J. Nutr. 49:221–230.
Chiba, L. I., A. J. Lewis, and E. R. Peo, Jr. 1991. Amino acid and energyinterrelationships in pigs weighing 20 to 50 kilograms: I. Rate andefficiency of weight gain. J. Anim. Sci. 69:694–707.
Christensen, K. 1985. Determination of linoleic acid requirements inslaughter pigs. Res. Rep. No. 577. Copenhagen, Denmark: Beret. Stat-ens Husdyrbrugsforsog.
Chwalibog, A. 1991. Energetics of animal production. Acta Agric.Scand. 41:147–160.
Clawson, A. J., T. N. Blumer, W. W. G. Smart, Jr., and E. R. Barrick.1962. Influence of energy-protein ratio on performance and carcasscharacteristics of swine. J. Anim. Sci. 21:62–68.
Close W. H., and P. K. Poorman. 1993. Outdoor pigs—their nutrientrequirements, appetite and environmental responses. Pp. 175–196 inRecent Advances in Animal Nutrition, P. C. Garnsworthy, and D. J. A.Cole, eds. Loughborough, U.K.: Nottingham University Press.
Close, W. H. and F. G. Roberts. 1993. Nutrition of the working boar.Pp. 21–44 in Recent Advances in Animal Nutrition, W. Haresign, andD. J. A. Cole, eds. Loughborough, U.K.: Nottingham University Press.
Close, W. H., and M. W. Stanier. 1984. Effects of plane of nutrition andenvironmental temperature on the growth and development of theearly weaned pig. 2. Energy production. Anim. Prod. 38:221–231.
Coffey, M. T., R. W. Seerley, D. W. Funderburke, and H. C. McCampbell.1982. Effect of heat increment and level of dietary energy and environ-mental temperature on the performance of growing-finishing swine.J. Anim. Sci. 54:95–105.
Cole, D. J. A. 1982. Nutrition and reproduction. Pp. 603–619 in Controlof Pig Reproduction, D. J. A. Cole and G. J. Foxcroft, eds. London:Butterworth.
Cole, D. J. A. 1984. The nutrient density of pig diets—allowances andappetite. Pp. 301–312 in Fats in Animal Nutrition, J. Wiseman, ed.London: Butterworth.
Cole, D. J. A., J. E. Duckworth, and W. Holmes. 1967. Factors affectingvoluntary feed intake in pigs. 1. The effect of digestible energy contentof the diet on the intake of castrated male pigs housed in holding pensand in metabolism crates. Anim. Prod. 9:141–148.
12 Nutrient Requirements of Swine
Cole, D. J. A., E. Duckworth, W. Holmes, and A. Cuthbertson. 1968.Factors affecting voluntary feed intake in pigs. 3. The effect of a periodof feed restriction, nutrient density of the diet and sex on intake,performance and carcass characteristics. Anim. Prod. 10:345–357.
Cox, N. M., J. H. Britt, W. D. Armstrong, and H. D. Alhusen. 1983.Effects of feeding fat and altering weaning schedule on rebreeding inprimiparous sows. J. Anim. Sci. 56:21–29.
Crampton, E. W., and O. M. Ness. 1954. A meal mixture suitable as theentire ration to be self-fed dry to pigs weaned at ten days of age.J. Anim. Sci. 13:357–364.
Crampton, E. W., R. K. Shaw, V. G. MacKay, and D. C. Schad. 1960.Comparative feeding value of common edible fats as measured by thegrowth of prematurely weaned pups, guinea pigs and swine. J. Nutr.70:81–90.
Cromwell, G. L., T. S. Stahly, and J. R. Overfield. 1980. Evaluation ofa constant vs. stepwise feeding pattern for pregnant sows. J. Anim. Sci.51(Suppl. 1):194 (Abstr.).
Cromwell, G. L., T. J. Prince, G. E. Combs, C. V. Maxwell, D. A. Knabe,and D. E. Orr. 1982. Effects of additional feed during late gestationon reproductive performance of sows: A cooperative study. J. Anim.Sci. 55(Suppl. 1):268 (Abstr.).
Cromwell, G. L., D. D. Hall, A. J. Clawson, G. E. Combs, D. A. Knabe,C. V. Maxwell, P. R. Noland, D. E. Orr, Jr., and T. J. Prince. 1989.Effects of additional feed during late gestation on reproductive perfor-mance of sows: A cooperative study. J. Anim. Sci. 67:3–14.
Cronin, G. M., F. M. F. M. Van Tartwijk, W. Van Der Hel, and M. W. A.Verstegen. 1986. The influence of degree of adaptation to tether-housing by sows in relation to behavior and energy metabolism. Anim.Prod. 42:257–268.
Cuaron, J. A., F. X. Aherne, R. A. Easter, A. H. Jensen, and T. F. Park.1981. Dietary protein–calorie ratios for young pigs. Proc. Illinois PorkIndustry Conference. Urbana: Illinois Agricultural Experiment Station.
Cunnane, S. C. 1984. Essential fatty-acid/mineral interactions with refer-ence to the pig. Pp. 167–183 in Fats in Animal Nutrition, J. Wiseman,ed. London: Butterworth.
Cunningham, H. M. 1959. Digestion of starch and some of its degradationproducts by newborn pigs. J. Anim. Sci. 18:964–975.
Cunningham, H. M., D. W. Friend, and J. W. G. Nicholson. 1962. Theeffect of age, body weight, feed intake and adaptability of pigs on thedigestibility and nutritive value of cellulose. Can. J. Anim. Sci.42:167–175.
DeGoey, L. W., and R. C. Ewan. 1975. Effect of level of intake anddiet dilution on energy metabolism in the young pig. J. Anim. Sci.40:1045–1051.
den Hartog, L. A., and G. J. M. van Kempen. 1980. Relation betweennutrition and fertility in pigs. Neth. J. Agric. Sci. 28:211–227.
Diggs, B. G., D. E. Becker, S. W. Terrill, and A. H. Jensen. 1959. Theenergy value of various feedstuffs for the young pig. J. Anim. Sci.18:1492 (Abstr.).
Diggs, B. G., D. E. Becker, A. H. Jensen, and H. W. Norton. 1965. Energyvalue of various feeds for the young pig. J. Anim. Sci. 24:555–558.
Dourmad, J.Y., M. Etienne, A. Prunier, and J. Noblet. 1994. The effectof energy and protein intake of sows on their longevity: A review.Livest. Prod. Sci. 40:87–97.
Dyck, G. W., W. M. Palmer, and S. Simaraks. 1980. Progesterone andlutenizing hormone concentration in serum of pregnant gilts on differ-ent levels of feed consumption. Can. J. Anim. Sci. 60:877–884.
Eggum, B. O. 1973. A Study of Certain Factors Influencing ProteinUtilization in Rats and Pigs. Ph.D. dissertation. National Institute ofAnimal Science, Copenhagen, Denmark.
Elsley, F. W. H. 1973. Nutrition of the female pig during pregnancyand lactation. Paper presented to Pig Commission. Vienna: EuropeanAssociation of Animal Production.
Elsley, F. W. H., E. V. J. Bathurst, A. G. Bracewell, J. M. M. Cunningham,J. B. Dent, T. L. Dodsworth, R. M. MacPherson, and N. Walker. 1971.The effect of pattern of food intake in pregnancy upon sow productivity.Anim. Prod. 13:257–270.
Enser, M. 1984. The chemistry, biochemistry and nutritional importanceof animal fats. Pp. 23–51 in Fats in Animal Nutrition, J. Wiseman, ed.London: Butterworth.
Ewan, R. C. 1976. Utilization of energy of feed ingredients by youngpigs. Proc. Distill. Feed Res. Council. Conf. 31:16–21.
Ewan, R. C. 1989. Predicting the energy utilization of diets and feedingredients by pigs. Pp. 271–274 in Energy Metabolism, EuropeanAssociation of Animal Production Bulletin No. 43, Y. van der Honingand W. H. Close, eds. Pudoc Wageningen, Netherlands.
Ewan, R. C. 1991. Energy Utilization in swine nutrition. Pp. 121–132 inSwine Nutrition, E. R. Miller, D. W. Ullrey, and A. J. Lewis, eds.Stoneham, U.K.: Butterworth-Heinemann.
Ewan, R. C. 1996. Energy Values of Feed Ingredients. 5th Revised Edition.Ames: Iowa State University. 101 pp.
Farrell, D. J. 1973. Digestibility by pigs of the major chemical componentsof diets high in plant cell-wall constituents. Anim. Prod. 16:43–47.
Farrell, D. J. 1978. Metabolizable energy in feeding systems for pigs andpoultry. Proc. Aust. Soc. Anim. Prod. 12:62–67.
Farrell, D. J. 1979. Energy systems for pigs and poultry: A review. J. Aust.Inst. Agric. Sci. 34:21–34.
Farrell, D. J., and K. A. Johnson. 1970. Utilization of cellulose by pigsand its effects on caecal function. Anim. Prod. 14:209–217.
Forbes, R. M., and T. S. Hamilton. 1952. The utilization of certaincellulosis materials by swine. J. Anim. Sci. 11:480–490.
Fowler, V. R. 1985. The importance of voluntary feed intake in pigs.Proc. Nutr. Soc. 44:347–353.
Frank, G. R., F. X. Aherne, and A. H. Jensen. 1983. A study of therelationship between performance and dietary component digestibili-ties by swine fed different levels of dietary fiber. J. Anim. Sci.57:645–654.
Friend, D. W. 1970. Comparison of some milling products of barley andrye when fed in diets to rats. Can. J. Anim. Sci. 50:345–348.
Friend, D. W., J. W. G. Nicholson, and H. M. Cunningham. 1964. Volatilefatty acid and lactic acid content of pig blood. Can. J. Anim. Sci.44:303–308.
Gadeken, D., H. J. Oslage, and H. Bo¨hme. 1985. Energy requirement
for maintenance and energy costs of protein and fat deposition inpiglets. Arch. Tierernahr. 35:481–494.
Goering, H. K., and P. J. Van Soest. 1970. Forage fiber analysis: Apparatus,reagents, procedures and some applications. Agricultural Handbook379. Washington, D.C.: U.S. Department of Agriculture. iv, 20 pp.
Gouwens, D. W. 1966. Influence of Dietary Protein and Fiber on FecalAmino Acid Excretion of Swine. M.S. thesis. University of Illinois,Urbana.
Henry, Y., and M. Etienne. 1978. Alimentation energetique du porc.J. Rech. Porc. en France 10:119–166.
Heusner, A. A. 1982. Energy metabolism and body size. 1. Is the massexponent of Kleiber’s equation a statistical artifact? Respir. Physiol.48:1–12.
Hillyer, G. M., and P. Phillips. 1980. The effect of increasing feed levelto sows and gilts in late pregnancy on subsequent litter size, litterweight and maternal body weight change. Anim. Prod. 30:469 (Abstr.).
Hoffmann, L. 1994. Vorschlag fur die einfuhrung eines fur alle nutztierar-ten nach einheitlichen parametern und prinzipien aufgebauten systemsder enmergetischen futterbewertung. 2. Mitteilung—EnergetischeFutterbewertung fu
¨r Schweine. Arch Anim. Nutr. 46:237–259.
Hoffmann, L., W. Jentsch, and R. Schiemann. 1990. Energieumsatzmes-sungen am adulten Schwein bei Vertu
¨tterung von Rationen mit Kartof-
felsta¨rke, Kartoffeln, Ru
¨ben, Presschitzeln and Grobfuttermitteln als

Energy 13
Zulagen zu einer Grundration. 1. Energienumsatz and Energieverwer-tung. Arch. Anim. Nutr. 40:191–207.
Ho¨rnicke, H. 1970. Circadian activity rhythms and the energy cost of
standing in growing pigs. Pp. 165–168 in Energy Metabolism of FarmAnimals, A. Suchurch and C. Wenk, Eds., EAAP No. 13. Juris DruckVerlag, Zurich.
Imoto, S., and S. Namioka. 1978. VFA production in the pig’s largeintestine. J. Anim. Sci. 47:467–478.
Just, A. 1979. Influence of diet composition on site of absorption andefficiency of utilization of metabolizable energy in growing pigs. Pp.27–30 in Energy Metabolism, European Association of Animal Produc-tion Bulletin No. 26, L.E. Mount, ed. Cambridge: Butterworth.
Just, A. 1982a. The influence of crude fiber from cereals on the netenergy value of diets for growth in pigs. Livest. Prod. Sci. 9:569–580.
Just, A. 1982b. The influence of ground barley straw on the net energyvalue of diets for growth in pigs. Livest. Prod. Sci. 9:717–729.
Just, A. 1982c. The net energy value of balanced diets for growing pigs.Livest. Prod. Sci. 8:541–555.
Just, A., J. A. Fernandez, and H. Jorgensen. 1983. The net energy valueof diets for growth in pigs in relation to the fermentative processes inthe digestive tract and the site of absorption of the nutrients. Livest.Prod. Sci. 10:171–186.
Kass, M. L., P. J. Van Soest, and W. G. Pond. 1980. Utilization of dietaryfiber from alfalfa by growing swine. II. Volatile fatty acid concentrationsin and disappearance from the gastrointestinal tract. J. Anim. Sci.50:192–197.
Kemp, B. 1989. Investigations on breeding boars to contribute to a func-tional feeding strategy. Ph.D. Dissertation, University of Wageningen,The Netherlands.
Kennelly, J. J., and F. X. Aherne. 1980a. The effect of fiber addition todiets formulated to contain different levels of energy and protein ongrowth and carcass quality of swine. Can. J. Anim. Sci. 60:385–393.
Kennelly, J. J., and F. X. Aherne. 1980b. The effect of fiber formulatedto contain different levels of energy and protein on digestibility coeffi-cients in swine. Can. J. Anim. Sci. 60:717–726.
Kennelly, J. J., F. X. Aherne, and A. J. Lewis. 1978. The effects of levelsof isolation, or varietal differences in high fiber hull fraction of lowglucosinolate rapeseed meals on rat or pig performance. Can. J. Anim.Sci. 58:743–752.
Kennelly, J. J., F. X. Aherne, and W. C. Sauer. 1981. Volatile fatty acidproduction in the hindgut of swine. Can. J. Anim. Sci. 61:349–361.
Keys, J. E., Jr., P. J. Van Soest, and E. P. Young. 1970. Effect of increasingcell wall content on the digestibility of hemicellulose and cellulose inswine and rats. J. Anim. Sci. 31:1172–1177.
Kidder, D. E., and M. J. Manners. 1978. Digestion of carbohydrates. Pp.96–149 in Digestion in the Pig. Bath, England: Kington Press.
Kim, K. I., D. E. Jewell, N. J. Benevenga, and R. H. Grummer. 1978.The fraction of dietary lactose available for fermentation in the cecumand colon of pigs. J. Anim. Sci. 46:1658–1665.
King, R. H., and M. R. Taverner. 1975. Prediction of the digestible energyin pig diets from analyses of fibre contents. Anim. Prod. 21:275–284.
Laplace, J. P., and F. Lebas. 1981. Nutritional value of plantex (fiber) inanimal feeding. World Rev. Nutr. Diet 37:177–228.
Lewis, A. J., E. R. Peo, Jr., B. D. Moser, and T. D. Crenshaw. 1980.Lysine requirements of pigs weighing 5 to 15 kg fed practical dietswith and without added fat. J. Anim. Sci. 51:361–366.
Libal, G. W., and R. C. Wahlstrom. 1977. Effect of level of feeding duringlactation on sow and pig performance. J. Anim. Sci. 41:1524–1525.
Low, A. G. 1985. The role of dietary fibre in digestion absorption andmetabolism. Proc. 3rd Int. Seminar on Digestive Physiology in the Pig.Report No . 580 . Copenhagen, Denmark : Bere t . S t a tens .Husdyrbugsfors.
May, R. W., and J. M. Bell. 1971. Digestible and metabolizable energyvalues of some feeds for the growing pig. Can. J. Anim. Sci. 51:271–278.
McCracken, K. J., D. S. Rao, and R. Urquhart. 1991. Feed intake, bodycomposition and energy metabolism of high genetic potential boarsfrom 30 to 340 kg. Pp. 111–114 in Energy Metabolism of Farm Animals,C. Wenk and M. Boessinger, eds. ETH, Zurich.
McDonald, T. P., D. D. Jones, J. R. Barret, J. L. Albright, G. E. Miles,J. A. Nienaaber, and G. L. Hahn. 1988. Measuring the heat incrementof activity of growing-finishing swine. Trans. Am. Soc. Agric. Eng.31:1180–1186.
McNab, J. M. 1975. Factors affecting the digestibility of nutrients. Proc.Nutr. Soc. 34:5–11.
McNutt, S. D., and R. C. Ewan. 1984. Energy utilization of weanlingpigs raised under pen conditions. J. Anim. Sci. 59:738–745.
Morgan, C. A., and C. T. Whittemore. 1982. Energy evaluation of feedsand compounded diets for pigs. A review. Anim. Feed Sci. Technol.7:387–400.
Morgan, D. J., D. J. A. Cole, and D. Lewis. 1975. Energy values in pignutrition. I. The relationship between digestible energy, metabolizableenergy and total digestible nutrient values of a range of feedstuffs.J. Agric. Sci. (Camb.) 84:7–17.
Moser, B. D., and A. J. Lewis. 1980. Adding fat to sow diets. Feed-stuffs 52:36–37.
Moser, R. L., J. E. Pettigrew, S. G. Cornelius, and H. E. Hanke. 1985.Feed and energy consumption by lactating sows as affected by supple-mental dietary fat. Minn. Swine Res. Rep. St. Paul: University ofMinnesota Press.
Myer, R. O., P. R. Cheeke, and W. H. Kennick. 1975. Utilization ofalfalfa protein concentrate by swine. J. Anim. Sci. 40:885–891.
National Research Council. 1971. Atlas of Nutritional Data on UnitedStates and Canadian Feeds. Washington, D.C.: National Academy ofSciences–National Research Council.
National Research Council. 1981. Nutritional Energetics of DomesticAnimals and Glossary of Energy Terms. Second revised ed. Washington,D.C.: National Academy Press. 54 pp.
National Research Council. 1987. Predicting Feed Intake of Food-Producing Animals. Washington, D.C.: National Academy Press. 85 pp.
National Research Council. 1988. Nutrient Requirements of Swine. NinthEdition. Washington, D.C.: National Academy Press. 93 pp.
Nehring, K., and H. Uhlemann. 1972. Feeding value of different byprod-ucts of cereal grain milling. 4. Relationship between the content ofstructural substances and digestibility. Arch. Tierernahr. 22:59–84.
Noblet, J., and J. Le Dividich. 1982. Effect of environmental temperatureand feeding level on energy balance traits of early-weaned piglets.Livest. Prod. Sci. 9:619–632.
Noblet, J., and M. Etienne. 1986. Effect of energy level in lactatingsows on yield and composition of milk and nutrient balance of piglets.J. Anim. Sci. 63:1888–1896.
Noblet, J., and M. Etienne. 1987a. Metabolic utilization of energy andmaintenance requirements in lactating sows. J. Anim. Sci. 64:774–781.
Noblet, J., and M. Etienne. 1987b. Metabolic utilization of energy andmaintenance requirements in pregnant sows. Livest. Prod. Sci.16:243–257.
Noblet, J., and M. Etienne. 1989. Estimation of sow milk nutrient output.J. Anim. Sci. 67:3352–3359.
Noblet, J., and Y. Henry. 1991. Energy evaluation systems for pig diets.Pp. 87–110 in Manipulating Pig Production III, E. S. Batterham, ed.Australasian Pig Science Association, Attwood, Australia.
Noblet, J., and J. M. Perez. 1993. Prediction of digestibility of nutrientsand energy values of pig diets from chemical analysis. J. Anim. Sci.71:3389–3398.
Noblet, J., and X. S. Shi. 1993. Comparative digestibility of energy andnutrients in growing pigs fed ad libitum and adult sows at maintenance.Livest. Prod. Sci. 34:137–152.
Noblet, J., J. Le Dividich, and T. Bikawa. 1985. Interaction betweenenergy level in the diet and environmental temperature on the utiliza-tion of energy in growing pigs. J. Anim. Sci. 61:452–459.

14 Nutrient Requirements of Swine
Noblet, J., C. Karege, and S. Dubois. 1989a. Influence of sex and genotypeon energy utilization in growing pigs. Pp. 57–60 in Energy Metabolismof Farm Animals, Y. van der Honing and W. H. Close, eds. PudocWageningen.
Noblet, J., J. Y. Dourmad, J. Le Dividich, and S. Dubois. 1989b. Effectof ambient temperature and addition of straw or alfalfa in the diet onenergy metabolism of pregnant sows. Livest. Prod. Sci. 21:309–324.
Noblet, J, H. Fortune, S. Dubois, and Y. Henry. 1989c. Nouvelles BasesD’Estimations Des Teneurs en Energie Digestible, Metabolisable etNette Des Aliments Pour Le Porc. Institut National de la RechercheAgronomique, Paris, France.
Noblet, J., J. Y. Dourmad, and M. Etienne. 1990. Energy utilization inpregnant and lactating sows: Modeling of energy requirements. J. Anim.Sci. 68:562–572.
Noblet, J., X. S. Shi, and S. Dubois. 1993. Energy cost of standing activityin sows. Livest. Prod. Sci. 34:127–136.
Noblet, J., X. S. Shi, and S. Dubois. 1994. Effect of body weight on netenergy value of feeds for growing pigs. J. Anim. Sci. 72:645–657.
Noblet, J., H. Fortune, X. S. Shi, and S. Dubois. 1994. Prediction of netenergy value of feeds for growing pigs. J. Anim. Sci. 72:344–354.
O’Grady, J. F. 1980. Energy and protein nutrition of the sow. Pp. 121–131in Recent Advances in Animal Nutrition, W. Haresign, ed. London:Butterworth.
O’Grady, J. F., P. B. Lynch, and P. A. Kearney. 1985. Voluntary feedintake by lactating sows. Livest. Prod. Sci. 12:355–366.
Owen, J. B., and W. J. Ridgeman. 1967. The effect of dietary energycontent on the voluntary intake of pigs. Anim. Prod. 9:107–113.
Owen, J. B., and W. J. Ridgeman. 1968. Further studies on the effect ofdietary energy content on the voluntary intake of pigs. Anim. Prod.10:85–91.
Pals, D. A., and R. C. Ewan. 1978. Utilization of the energy of driedwhey and wheat middlings by young swine. J. Anim. Sci. 46:402–408.
Peo, E. R., Jr., G. C. Ashton, V. C. Speer, and D. V. Catron. 1957. Proteinand fat requirements of baby pigs. J. Anim. Sci. 16:885–891.
Petley, M. P., and H. S. Bayley. 1988. Exercise and post-exercise energyexpenditure in growing pigs. Can. J. Physiol. Pharam. 66:721–730.
Pettigrew, J. E., Jr. 1981. Supplemental dietary fat for peripartal sows:A review. J. Anim. Sci. 53:107–117.
Pettigrew, J. E., Jr., and R. L. Moser. 1991. Fat in swine nutrition. Pp.133–146 in Swine Nutrition, E. R. Miller, D. E. Ullrey, and A. J. Lewis,eds. Stoneham, U.K.: Butterworth-Heinemann.
Phillips, B. C., and R. C. Ewan. 1977. Utilization of energy of milo andsoybean oil by young swine. J. Anim. Sci. 44:990–997.
Pollman, D. S., D. M. Danielson, and E. R. Peo, Jr. 1979. Value of high-fiber diets for gravid swine. J. Anim. Sci. 48:1385–1393.
Pond, W. G., R. S. Lowrey, and J. H. Maner. 1962. Effect of crude fiberlevel on ration digestibility and performance in growing-finishing swine.J. Anim. Sci. 21:692–696.
Powles, J., J. Wiseman, D.J.A. Cole, and S. Jagger. 1995. Predictionof the apparent digestible energy value of fats given to pigs. Anim.Sci. 61:149–154.
Re´rat, A. 1978. Digestion and absorption of carbohydrates and nitroge-nous matters in the hind gut of the omnivorous nonruminant animal.J. Anim. Sci. 46:1808–1837.
Robles, A., and R. C. Ewan. 1982. Utilization of energy of rice and ricebran by young pigs. J. Anim. Sci. 55:572–577.
Salmon-Legagneur, E., and A. Re´rat. 1962. Nutrition of the sow during
pregnancy. Pp. 207–237 in Nutrition of Pigs and Poultry, J. T. Morgan,and D. Lewis, eds. London: Butterworth.
Sambrook, I. E. 1979. Digestion and absorption of carbohydrate and lipidin the stomach and small intestine of the pig. In Technical BulletinNo. 3, Current Concepts of Digestion and Absorption in Pigs, A. G.Low, and I. G. Partridge, eds. Reading, U.K.: National Institute forResearch in Dairying.
Saunders, R. M., H. G. Walker, Jr., and G. O. Kohler. 1969. Aleuronecells and the digestibility of wheat mill feeds. Poult. Sci. 48:1497–1503.
Schneider, B. H., and H. L. Lucas. 1950. The magnitude of certainsources of variability in digestibility data. J. Anim. Sci. 9:504–512.
Seerley, R. W. 1984. The use of fat in sow diets. Pp. 333–352 in Fats inAnimal Nutrition, J. Wiseman, ed. London: Butterworth.
Seerley, R. W., and R. C. Ewan. 1983. An overview of energy utilizationin swine nutrition. J. Anim. Sci. 57(Suppl. 2):300–314.
Sewell, R. F., and C. V. Maxwell. 1966. Effects of various sources ofcarbohydrates in the diet of early weaned pigs. J. Anim. Sci. 25:796–799.
Shi, X. S., and J. Noblet. 1993. Digestible and metabolizable energyvalues of ten feed ingredients in growing pigs fed ad libitum and sowsfed at maintenance level: Comparative contribution of the hindgut.Anim. Feed Sci. Tech. 42:223–236.
Shurson, G. C., M. G. Hogberg, N. DeFever, S. V. Radecki, and E. R.Miller. 1986. Effects of adding fat to the sow lactation diet on lactationand breeding performance. J. Anim. Sci. 62:672–680.
Smith, H., and I. A. M. Lucas. 1956. The early weaning of pigs. 1. Theeffect upon growth of variations in the protein, fat, sucrose, antibiotic,vitamin and mineral content of diets for pigs of 8 to 25 lb. liveweightand a comparison of wet and dry feeding. J. Agric. Sci. (Camb.) 48:220.
Susenbeth, A., and K. H. Menke. 1991. Energy requirement for physicalactivity in pigs. Pp. 416–419 in Energy Metabolism of Farm Animals,C. Wenk and M. Boessinger, eds. ETH, Zurich.
Stahly, T. S. 1984. Use of fats in diets for growing pigs. Pp. 313–331 inFats in Animal Nutrition, J. Wiseman, ed. London: Butterworth.
Tess, M. H., G. E. Dickerson, J. A. Nienaber, J. T. Yen, and C. L. Farrell.1984. Energy costs of protein and fat deposition in pigs fed ad libitum.J. Anim. Sci. 58:111–122.
Thorbek, G. 1975. Studies on energy metabolism in growing pigs. II.Protein and fat gain in growing pigs fed different feed compounds.Efficiency of utilization of metabolizable energy for growth. ResearchReport No . 424 . Copenhagen, Denmark : Bere t . S t a ten s .Husdyrbrugsforsog.
Tollett, J. T. 1961. The available energy content of feedstuffs for swine.Ph.D. Dissertation. Urbana: University of Illinois. 104 pp.
Toplis, P., M. F. J. Ginesi, and A. E. Wrathhall. 1983. The influence ofhigh food levels in early pregnancy on embryo survival in multiparoussows. Anim. Prod. 37:45–48.
Tribble, L. F., S. H. Ingram, C. T. Gaskins, and C. B. Ramsey. 1979.Evaluation of added fat and lysine to sorghum-soybean meal diets forswine. J. Anim. Sci. 48:541–546.
Van Soest, P. J., and R. W. McQueen. 1973. The chemistry and estimationof fibre. Proc. Nutr. Soc. 32:123–130.
Verstegen, M. W. A., H. A. Brandsma, and G. Mateman. 1982. Feedrequirement of growing pigs at low environmental temperatures.J. Anim. Sci. 55:88–94.
Verstegen, M. W. A., J. M. F. Verhagen, and L. A. den Hartog. 1987.Energy requirements of pigs during pregnancy: A review. Livest. Prod.Sci. 16:75–89.
Wahlstrom, R. C. 1991. Feeding developing gilts and boars. Pp. 517–526in Swine Nutrition, E. R. Miller, D. E. Ullrey, and A. J. Lewis, eds.Stoneham, U.K.: Butterworth-Heinemann.
Weldon, W. C., A. J. Thulin, O. A. MacDougald, L. J. Johnston, E. R.Miller, and H. A. Tucker. 1991. Effects of increased dietary energyand protein during late gestation on mammary development in gilts.J. Anim. Sci. 69:194–200.
Weldon, W. C., A. J. Lewis, G. F. Louis, J. L. Kovar, M. A. Giesemann,and P. S. Miller. 1994. Postpartum hypophagia in primiparous sows:I. Effects of gestation feeding level on feed intake, feeding behavior,and plasma metabolite concentrations during lactation. J. Anim. Sci.72:387–394.
Wenk, C., H. P. Pfirter, and H. Bickel. 1980. Energetic aspects of feedconversion in growing pigs. Livest. Prod. Sci. 7:483–495.
Energy 15
Whittemore, C. T. 1976. A study of growth responses to nutrient inputsby modeling. Proc. Nutr. Soc. 35:383–391.
Whittemore, C. T. 1983. Development of recommended energy andprotein allowances for young pigs. Agric. Syst. 11:159–186.
Whittemore, C. T., and C. A. Morgan. 1990. Model components for thedetermination of energy and protein requirements for breeding sows:A review. Livestock Prod. Sci. 26:1–37.
Whittemore, C. T., and H. Yang. 1989. Physical and chemical compositionof the body of breeding sows with differing body subcutaneous fatdepth at parturition, differing nutrition during lactation and differinglitter size. Anim. Prod. 48:203–212.
Whittemore, C. T., A. G. Taylor, G. M. Hillyer, D. Wilson, and C.Stamataris. 1984. Influence of body fat stores on reproductive perfor-mance. Anim. Prod. 38:527 (Abstr.).
Williams, I. H., W. H. Close, and D. J. A. Cole. 1985. Strategies for sownutrition: Predicting the response of pregnant animals to protein andenergy intake. Pp. 133–147 in Recent Advances in Animal Nutrition,W. Haresign, and D. J. A. Cole, eds. London: Butterworth.
Wu, J. F., and R. C. Ewan. 1979. Utilization of energy of wheat andbarley by young swine. J. Anim. Sci. 49:1470–1477.
Zivkovic, S., and J. P. Bowland. 1970. Influence of substituting higherfiber ingredients for corn on the digestibility of diets and performanceof sows and litters. Can. J. Anim. Sci. 50:177–184.
ProteinsandAmino2 Acids
Protein generally refers to crude protein, which isdefined for mixed feedstuffs as the nitrogen content 26.25. This definition is based on the assumption that, onaverage, the nitrogen content is 16 g of nitrogen/100 g ofprotein. Proteins are composed of amino acids, and it isactually the amino acids that are the essential nutrients.Therefore, the dietary provision of amino acids in correctamounts and proportions determines the adequacy of adietary protein concentrate. Supplemental nonproteinnitrogen, such as urea, has not produced beneficialresponses in swine that were fed practical diets (Hays etal., 1957; Kornegay et al., 1965; Wehrbein et al., 1970).
E SS EN T IA L A N D N ON E SS EN T IA LA MI NO A CI DS
Although there are 20 primary amino acids that occur inproteins, not all of them are essential dietary components.Some amino acids can be synthesized by using carbonskeletons (derived primarily from glucose and other aminoacids) and amino groups derived from other amino acidspresent in excess of the requirement. Amino acids synthe-sized in this manner are termed nonessential (or dispens-able). Amino acids that cannot be synthesized, or cannotbe synthesized at a sufficient rate to permit optimal growthor reproduction, are termed essential (or indispensable).Although amino acids in both categories are needed at thephysiologic or metabolic level, normal swine diets containadequate amounts of nonessential amino acids or of aminogroups for their synthesis. This seems to be true even forlow-protein diets that are supplemented with crystallineamino acids (Brudevoid and Southern, 1994). Thus, mostof the emphasis in swine nutrition is on the essentialamino acids.
16
A few amino acids do not fit neatly into the essentialand nonessential classifications. An example is arginine,which is generally classified as an essential amino acid.Swine can synthesize arginine, and arginine synthesis fromglutamine has been detected in pig enterocytes preparedwithin 1 hour of farrowing (Wu and Knabe, 1995). How-ever, synthesis is not adequate to meet nutrient require-ments during the early stages of growth (Southern andBaker, 1983). Consequently, the diets of growing swinemust contain a source of arginine. However, during postpu-bertal growth and pregnancy, swine can synthesize arginineat a rate sufficient to meet most or all of their needs (Easteret al., 1974; Easter and Baker, 1976). Synthesis of arginineis probably insufficient to meet the demands of lactation.
Proline is not considered an essential amino acid forswine. Initial research by Ball et al. (1986) suggested thatvery young pigs (1 to 5 kg) were unable to synthesizeproline rapidly enough to meet their requirements, and,as a result, a dietary source of proline must be provided.These conclusions were reached on the basis of changesin the oxidation of an indicator amino acid. However, sub-sequent research from the same laboratory revealed nodifferences in growth rate between pigs given a diet withalmost no dietary supply of proline and pigs fed a diet withsupplemental proline (Murphy, 1992). This finding led theauthor to conclude that proline is not a dietary essentialamino acid for neonatal pigs. Furthermore, Chung andBaker (1993) fed a proline-free diet to 5-kg pigs and alsoobserved no growth response to supplemental proline.There are no reports that other classes of swine (greaterthan 5 kg) require a dietary source of proline.
Cysteine can be synthesized from methionine, and there-fore it is classified as nonessential. However, cysteine andits oxidation product cystine can satisfy approximately 50percent of the need for total sulfur amino acids (methionine` cystine) (Shelton et al., 1951; Becker et al., 1955; Mitch-ell et al., 1968; Baker et al., 1969; Roth and Kirchgessner,

Proteins and Amino Acids 17
1989; Chung and Baker, 1992a), and in this way can reducethe need for methionine. Methionine cannot be synthe-sized from cystine, and therefore it is essential. Methioninecan meet the total need for sulfur amino acids in theabsence of cystine.
Similarly, phenylalanine can meet the total requirementfor phenylalanine and tyrosine (aromatic amino acids)because it can be converted to tyrosine. Tyrosine can satisfyat least 50 percent of the total need for these two aminoacids (Robbins and Baker, 1977), but it cannot serve asthe sole source, because it cannot be converted tophenylalanine.
Glutamine is considered to be a conditionally essentialamino acid in some species (Lacey and Wilmore, 1990),because it prevents intestinal atrophy under certain condi-tions. Wu et al. (1996) recently reported that addition of1 percent glutamine to a corn–soybean meal diet preventedjejunal atrophy in pigs weaned at 21 days during the firstweek postweaning and increased feed efficiency during thesecond week postweaning.
A MI NO A CI DS I N D IE T S
Cereal grains, such as corn, sorghum, barley, or wheat,are the primary ingredients of most swine diets and usuallyprovide 30 to 60 percent of the total amino acid require-ments. But other sources of protein, such as soybean meal,must be provided to ensure adequate amounts of, and aproper balance among, the essential amino acids. Supple-ments of crystalline amino acids may also be used toincrease intakes of specific amino acids. The protein levelsnecessary to provide adequate intakes of essential aminoacids will depend on the feedstuffs used. Feedstuffs thatcontain ‘‘high quality’’ proteins (i.e., they have an aminoacid pattern relatively similar to the pig’s needs) or mixturesof feedstuffs in which the amino acid pattern in one com-plements the pattern in another will meet the essentialamino acid requirements at lower dietary protein levelsthan feedstuffs with a less desirable amino acid pattern.This is important if one of the goals is to minimize nitrogenexcretion. Another method of reducing dietary protein lev-els, and thereby reducing nitrogen excretion, is the judi-cious use of supplements of crystalline amino acids.
The amino acid requirements of growing-finishingswine, expressed in terms of dietary concentration, increaseas the energy density of the diet increases. Research data(Chiba et al., 1991a,b) indicate that at higher or lowerenergy densities than those found in standard grain–soybean meal diets, amino acid requirements (expressedas a percentage of the diet) may need to be adjusted upwardor downward, respectively.
The procedures used for amino acid analyses may causevariations in published estimates of amino acid require-ments. Determined values for tryptophan and sulfur aminoacids in dietary ingredients, in particular, vary considerably.Tryptophan analysis is difficult because of the relatively lowconcentration in most feedstuffs and because tryptophan ispartially destroyed during standard acid hydrolysis. Conse-quently, special precautions are necessary, such as hydroly-sis with barium hydroxide, sodium hydroxide, or lithiumhydroxide, or protection against oxidation in acid. Methio-nine and cystine undergo oxidation to multiple derivatives,and controlled oxidation of methionine to methionine sul-fone and of cystine to cysteic acid must be carried out withperformic acid before acid hydrolysis (Williams, 1994).
Ratios Among Amino Acids (Ideal Protein)
In determining amino acid requirements, a fundamentalconcept of this publication is that there is an optimal dietarypattern among essential amino acids that corresponds tothe needs of the animal. This optimal dietary pattern isoften called ‘‘ideal protein.’’ The basis for ideal protein hasbeen discussed by several authors, including the Agricul-tural Research Council (1981), Fuller and Wang (1990),Baker and Chung (1992), Cole and Van Lunen (1994), andBaker (1997).
The concept of an optimal pattern among amino acidshas been applied in previous editions of this publication,particularly the ninth edition (National Research Council,1988), in which the pattern was explicitly listed in a table.However, in the ninth edition the pattern was developedafter an examination of the results of experiments to deter-mine amino acid requirements. In the present edition, thepattern was developed primarily from experiments specifi-cally designed for that purpose. Three ideal proteins areused in this publication, one for maintenance, one forprotein accretion, and one for milk synthesis. These threepatterns, along with a pattern for body tissue protein, arepresented in Table 2-1.
The ratios for maintenance were calculated by takingthe mean of the maintenance requirements for each aminoacid determined at the University of Illinois (Baker et al.,1966a,b; Baker and Allee, 1970) and at the RowettResearch Institute (Fuller et al., 1989) and dividing by themaintenance requirement for lysine. The phenylalanine` tyrosine requirement determined at the University ofIllinois was not considered reliable and was not includedin the mean. Arginine is not required for maintenance.The value of 1200 was set to reflect the fact that argininesynthesis can satisfy all the maintenance needs and someof the needs for protein accretion. The maintenancerequirement for histidine has not been determined, andso the maintenance ratio was set equal to the ratio forprotein accretion.
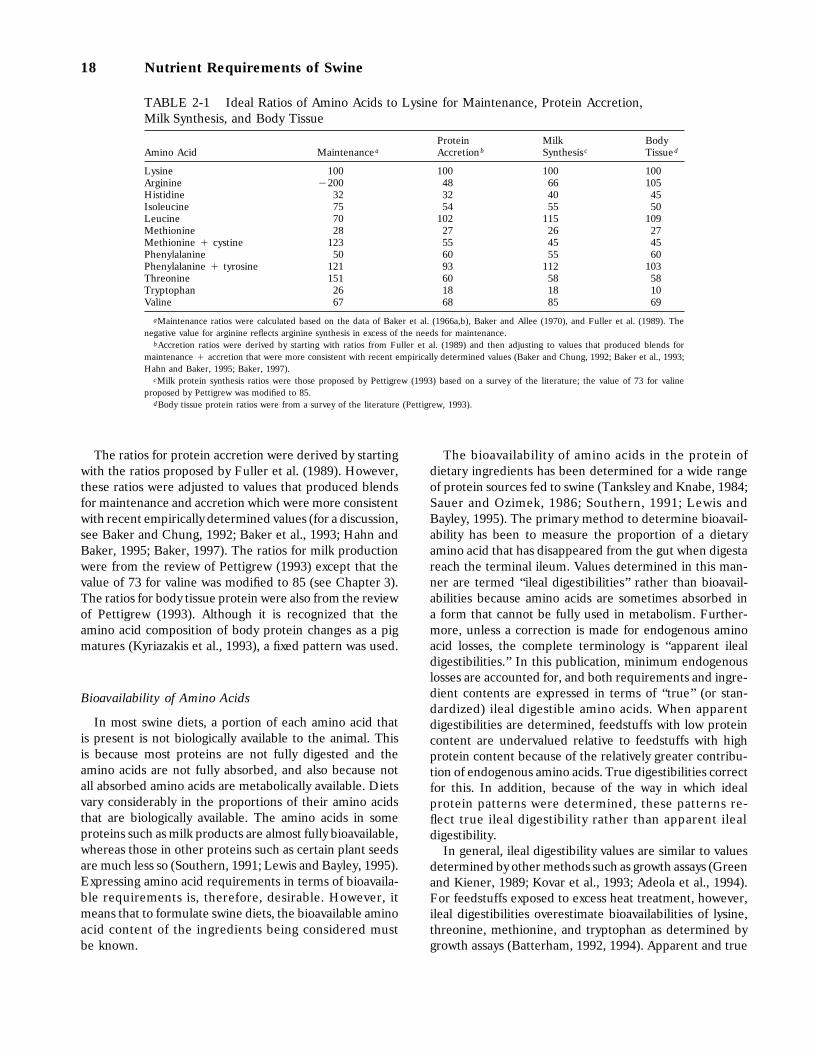
18 Nutrient Requirements of Swine
TABLE 2-1 Ideal Ratios of Amino Acids to Lysine for Maintenance, Protein Accretion,Milk Synthesis, and Body Tissue
Protein Milk BodyAmino Acid Maintenancea Accretionb Synthesis c Tissued
Lysine 100 100 100 100Arginine 1200 48 66 105Histidine 32 32 40 45Isoleucine 75 54 55 50Leucine 70 102 115 109Methionine 28 27 26 27Methionine ` cystine 123 55 45 45Phenylalanine 50 60 55 60Phenylalanine ` tyrosine 121 93 112 103Threonine 151 60 58 58Tryptophan 26 18 18 10Valine 67 68 85 69
aMaintenance ratios were calculated based on the data of Baker et al. (1966a,b), Baker and Allee (1970), and Fuller et al. (1989). Thenegative value for arginine reflects arginine synthesis in excess of the needs for maintenance.
bAccretion ratios were derived by starting with ratios from Fuller et al. (1989) and then adjusting to values that produced blends formaintenance ` accretion that were more consistent with recent empirically determined values (Baker and Chung, 1992; Baker et al., 1993;Hahn and Baker, 1995; Baker, 1997).
cMilk protein synthesis ratios were those proposed by Pettigrew (1993) based on a survey of the literature; the value of 73 for valineproposed by Pettigrew was modified to 85.
dBody tissue protein ratios were from a survey of the literature (Pettigrew, 1993).
The ratios for protein accretion were derived by startingwith the ratios proposed by Fuller et al. (1989). However,these ratios were adjusted to values that produced blendsfor maintenance and accretion which were more consistentwith recent empirically determined values (for a discussion,see Baker and Chung, 1992; Baker et al., 1993; Hahn andBaker, 1995; Baker, 1997). The ratios for milk productionwere from the review of Pettigrew (1993) except that thevalue of 73 for valine was modified to 85 (see Chapter 3).The ratios for body tissue protein were also from the reviewof Pettigrew (1993). Although it is recognized that theamino acid composition of body protein changes as a pigmatures (Kyriazakis et al., 1993), a fixed pattern was used.
Bioavailability of Amino Acids
In most swine diets, a portion of each amino acid thatis present is not biologically available to the animal. Thisis because most proteins are not fully digested and theamino acids are not fully absorbed, and also because notall absorbed amino acids are metabolically available. Dietsvary considerably in the proportions of their amino acidsthat are biologically available. The amino acids in someproteins such as milk products are almost fully bioavailable,whereas those in other proteins such as certain plant seedsare much less so (Southern, 1991; Lewis and Bayley, 1995).Expressing amino acid requirements in terms of bioavaila-ble requirements is, therefore, desirable. However, itmeans that to formulate swine diets, the bioavailable aminoacid content of the ingredients being considered mustbe known.
The bioavailability of amino acids in the protein ofdietary ingredients has been determined for a wide rangeof protein sources fed to swine (Tanksley and Knabe, 1984;Sauer and Ozimek, 1986; Southern, 1991; Lewis andBayley, 1995). The primary method to determine bioavail-ability has been to measure the proportion of a dietaryamino acid that has disappeared from the gut when digestareach the terminal ileum. Values determined in this man-ner are termed ‘‘ileal digestibilities’’ rather than bioavail-abilities because amino acids are sometimes absorbed ina form that cannot be fully used in metabolism. Further-more, unless a correction is made for endogenous aminoacid losses, the complete terminology is ‘‘apparent ilealdigestibilities.’’ In this publication, minimum endogenouslosses are accounted for, and both requirements and ingre-dient contents are expressed in terms of ‘‘true’’ (or stan-dardized) ileal digestible amino acids. When apparentdigestibilities are determined, feedstuffs with low proteincontent are undervalued relative to feedstuffs with highprotein content because of the relatively greater contribu-tion of endogenous amino acids. True digestibilities correctfor this. In addition, because of the way in which idealprotein patterns were determined, these patterns re-flect true ileal digestibility rather than apparent ilealdigestibility.
In general, ileal digestibility values are similar to valuesdetermined by other methods such as growth assays (Greenand Kiener, 1989; Kovar et al., 1993; Adeola et al., 1994).For feedstuffs exposed to excess heat treatment, however,ileal digestibilities overestimate bioavailabilities of lysine,threonine, methionine, and tryptophan as determined bygrowth assays (Batterham, 1992, 1994). Apparent and true
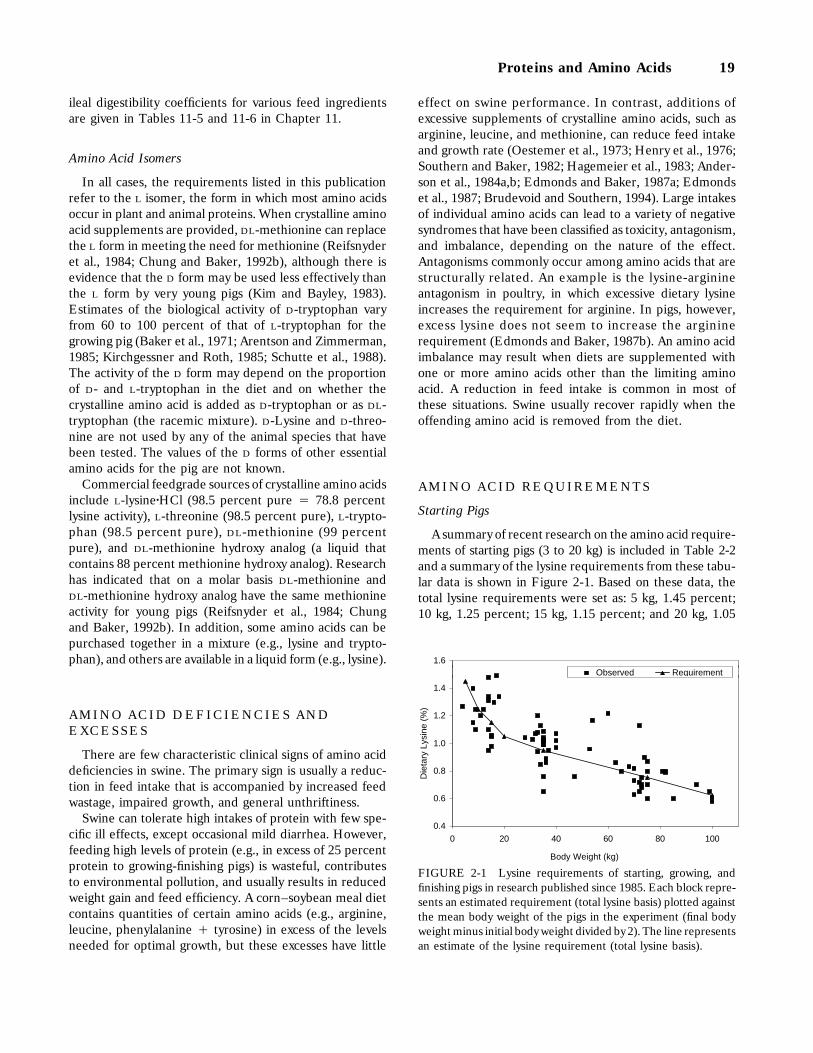
Proteins and Amino Acids 19
ileal digestibility coefficients for various feed ingredientsare given in Tables 11-5 and 11-6 in Chapter 11.
Amino Acid Isomers
In all cases, the requirements listed in this publicationrefer to the L isomer, the form in which most amino acidsoccur in plant and animal proteins. When crystalline aminoacid supplements are provided, DL-methionine can replacethe L form in meeting the need for methionine (Reifsnyderet al., 1984; Chung and Baker, 1992b), although there isevidence that the D form may be used less effectively thanthe L form by very young pigs (Kim and Bayley, 1983).Estimates of the biological activity of D-tryptophan varyfrom 60 to 100 percent of that of L-tryptophan for thegrowing pig (Baker et al., 1971; Arentson and Zimmerman,1985; Kirchgessner and Roth, 1985; Schutte et al., 1988).The activity of the D form may depend on the proportionof D- and L-tryptophan in the diet and on whether thecrystalline amino acid is added as D-tryptophan or as DL-tryptophan (the racemic mixture). D-Lysine and D-threo-nine are not used by any of the animal species that havebeen tested. The values of the D forms of other essentialamino acids for the pig are not known.
Commercial feedgrade sources of crystalline amino acidsinclude L-lysinezHCl (98.5 percent pure 4 78.8 percentlysine activity), L-threonine (98.5 percent pure), L-trypto-phan (98.5 percent pure), DL-methionine (99 percentpure), and DL-methionine hydroxy analog (a liquid thatcontains 88 percent methionine hydroxy analog). Researchhas indicated that on a molar basis DL-methionine andDL-methionine hydroxy analog have the same methionineactivity for young pigs (Reifsnyder et al., 1984; Chungand Baker, 1992b). In addition, some amino acids can bepurchased together in a mixture (e.g., lysine and trypto-phan), and others are available in a liquid form (e.g., lysine).
A MI NO A CI D D E FI CI E NC IE S AN DE XC ES S ES
There are few characteristic clinical signs of amino aciddeficiencies in swine. The primary sign is usually a reduc-tion in feed intake that is accompanied by increased feedwastage, impaired growth, and general unthriftiness.
Swine can tolerate high intakes of protein with few spe-cific ill effects, except occasional mild diarrhea. However,feeding high levels of protein (e.g., in excess of 25 percentprotein to growing-finishing pigs) is wasteful, contributesto environmental pollution, and usually results in reducedweight gain and feed efficiency. A corn–soybean meal dietcontains quantities of certain amino acids (e.g., arginine,leucine, phenylalanine ` tyrosine) in excess of the levelsneeded for optimal growth, but these excesses have little
effect on swine performance. In contrast, additions ofexcessive supplements of crystalline amino acids, such asarginine, leucine, and methionine, can reduce feed intakeand growth rate (Oestemer et al., 1973; Henry et al., 1976;Southern and Baker, 1982; Hagemeier et al., 1983; Ander-son et al., 1984a,b; Edmonds and Baker, 1987a; Edmondset al., 1987; Brudevoid and Southern, 1994). Large intakesof individual amino acids can lead to a variety of negativesyndromes that have been classified as toxicity, antagonism,and imbalance, depending on the nature of the effect.Antagonisms commonly occur among amino acids that arestructurally related. An example is the lysine-arginineantagonism in poultry, in which excessive dietary lysineincreases the requirement for arginine. In pigs, however,excess lysine does not seem to increase the argininerequirement (Edmonds and Baker, 1987b). An amino acidimbalance may result when diets are supplemented withone or more amino acids other than the limiting aminoacid. A reduction in feed intake is common in most ofthese situations. Swine usually recover rapidly when theoffending amino acid is removed from the diet.
A MI NO A CI D R E QU IR E ME NT S
Starting Pigs
A summary of recent research on the amino acid require-ments of starting pigs (3 to 20 kg) is included in Table 2-2and a summary of the lysine requirements from these tabu-lar data is shown in Figure 2-1. Based on these data, thetotal lysine requirements were set as: 5 kg, 1.45 percent;10 kg, 1.25 percent; 15 kg, 1.15 percent; and 20 kg, 1.05
0.4
0.6
0.8
1.0
1.2
1.4
1.6
0 20 40 60 80 100
Body Weight (kg)
Die
tary
Lys
ine
(%)
Observed Requirement
FIGURE 2-1 Lysine requirements of starting, growing, andfinishing pigs in research published since 1985. Each block repre-sents an estimated requirement (total lysine basis) plotted againstthe mean body weight of the pigs in the experiment (final bodyweight minus initial body weight divided by 2). The line representsan estimate of the lysine requirement (total lysine basis).
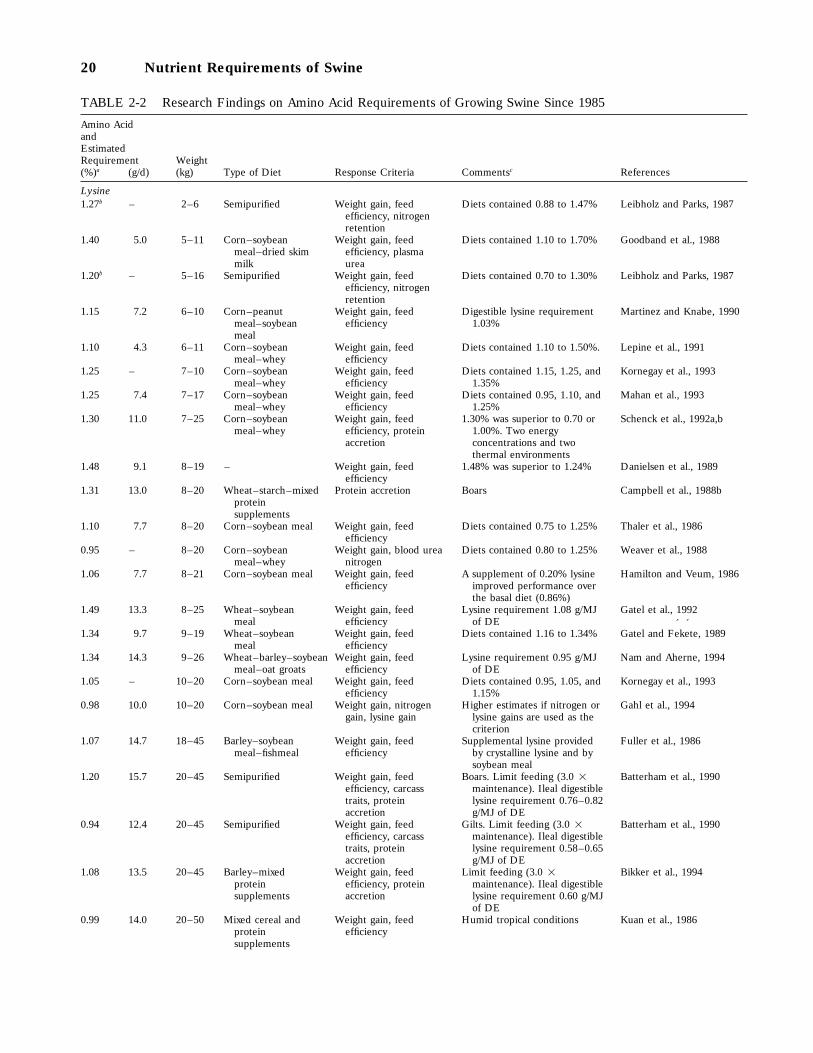
20 Nutrient Requirements of Swine
TABLE 2-2 Research Findings on Amino Acid Requirements of Growing Swine Since 1985
Amino AcidandEstimatedRequirement Weight(%)a (g/d) (kg) Type of Diet Response Criteria Commentsc References
Lysine1.27b – 2–6 Semipurified Weight gain, feed Diets contained 0.88 to 1.47% Leibholz and Parks, 1987
efficiency, nitrogenretention
1.40 5.0 5–11 Corn–soybean Weight gain, feed Diets contained 1.10 to 1.70% Goodband et al., 1988meal–dried skim efficiency, plasmamilk urea
1.20b – 5–16 Semipurified Weight gain, feed Diets contained 0.70 to 1.30% Leibholz and Parks, 1987efficiency, nitrogenretention
1.15 7.2 6–10 Corn–peanut Weight gain, feed Digestible lysine requirement Martinez and Knabe, 1990meal–soybean efficiency 1.03%meal
1.10 4.3 6–11 Corn–soybean Weight gain, feed Diets contained 1.10 to 1.50%. Lepine et al., 1991meal–whey efficiency
1.25 – 7–10 Corn–soybean Weight gain, feed Diets contained 1.15, 1.25, and Kornegay et al., 1993meal–whey efficiency 1.35%
1.25 7.4 7–17 Corn–soybean Weight gain, feed Diets contained 0.95, 1.10, and Mahan et al., 1993meal–whey efficiency 1.25%
1.30 11.0 7–25 Corn–soybean Weight gain, feed 1.30% was superior to 0.70 or Schenck et al., 1992a,bmeal–whey efficiency, protein 1.00%. Two energy
accretion concentrations and twothermal environments
1.48 9.1 8–19 – Weight gain, feed 1.48% was superior to 1.24% Danielsen et al., 1989efficiency
1.31 13.0 8–20 Wheat–starch–mixed Protein accretion Boars Campbell et al., 1988bproteinsupplements
1.10 7.7 8–20 Corn–soybean meal Weight gain, feed Diets contained 0.75 to 1.25% Thaler et al., 1986efficiency
0.95 – 8–20 Corn–soybean Weight gain, blood urea Diets contained 0.80 to 1.25% Weaver et al., 1988meal–whey nitrogen
1.06 7.7 8–21 Corn–soybean meal Weight gain, feed A supplement of 0.20% lysine Hamilton and Veum, 1986efficiency improved performance over
the basal diet (0.86%)1.49 13.3 8–25 Wheat–soybean Weight gain, feed Lysine requirement 1.08 g/MJ Gatel et al., 1992
meal efficiency of DE1.34 9.7 9–19 Wheat–soybean Weight gain, feed Diets contained 1.16 to 1.34% Gatel and Fe
´ke
´te, 1989
meal efficiency1.34 14.3 9–26 Wheat–barley–soybean Weight gain, feed Lysine requirement 0.95 g/MJ Nam and Aherne, 1994
meal–oat groats efficiency of DE1.05 – 10–20 Corn–soybean meal Weight gain, feed Diets contained 0.95, 1.05, and Kornegay et al., 1993
efficiency 1.15%0.98 10.0 10–20 Corn–soybean meal Weight gain, nitrogen Higher estimates if nitrogen or Gahl et al., 1994
gain, lysine gain lysine gains are used as thecriterion
1.07 14.7 18–45 Barley–soybean Weight gain, feed Supplemental lysine provided Fuller et al., 1986meal–fishmeal efficiency by crystalline lysine and by
soybean meal1.20 15.7 20–45 Semipurified Weight gain, feed Boars. Limit feeding (3.0 2 Batterham et al., 1990
efficiency, carcass maintenance). Ileal digestibletraits, protein lysine requirement 0.76–0.82accretion g/MJ of DE
0.94 12.4 20–45 Semipurified Weight gain, feed Gilts. Limit feeding (3.0 2 Batterham et al., 1990efficiency, carcass maintenance). Ileal digestibletraits, protein lysine requirement 0.58–0.65accretion g/MJ of DE
1.08 13.5 20–45 Barley–mixed Weight gain, feed Limit feeding (3.0 2 Bikker et al., 1994protein efficiency, protein maintenance). Ileal digestiblesupplements accretion lysine requirement 0.60 g/MJ
of DE0.99 14.0 20–50 Mixed cereal and Weight gain, feed Humid tropical conditions Kuan et al., 1986
protein efficiencysupplements
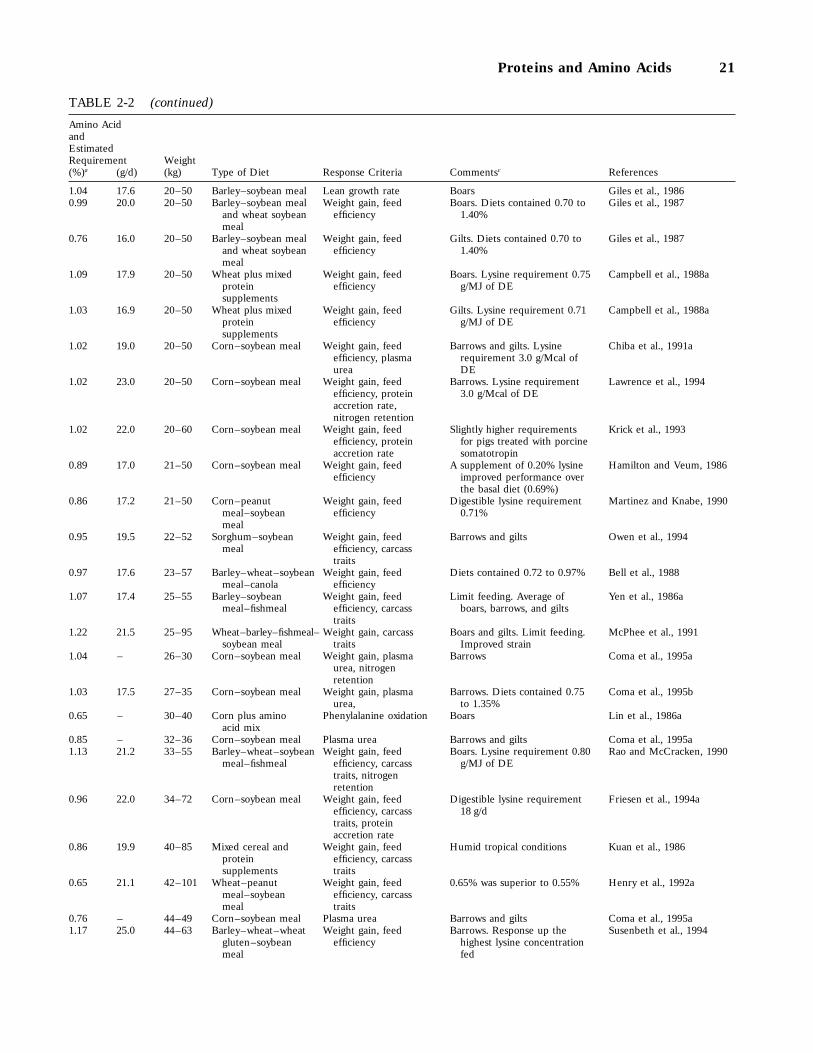
Proteins and Amino Acids 21
TABLE 2-2 (continued)
Amino AcidandEstimatedRequirement Weight(%)a (g/d) (kg) Type of Diet Response Criteria Commentsc References
1.04 17.6 20–50 Barley–soybean meal Lean growth rate Boars Giles et al., 19860.99 20.0 20–50 Barley–soybean meal Weight gain, feed Boars. Diets contained 0.70 to Giles et al., 1987
and wheat soybean efficiency 1.40%meal
0.76 16.0 20–50 Barley–soybean meal Weight gain, feed Gilts. Diets contained 0.70 to Giles et al., 1987and wheat soybean efficiency 1.40%meal
1.09 17.9 20–50 Wheat plus mixed Weight gain, feed Boars. Lysine requirement 0.75 Campbell et al., 1988aprotein efficiency g/MJ of DEsupplements
1.03 16.9 20–50 Wheat plus mixed Weight gain, feed Gilts. Lysine requirement 0.71 Campbell et al., 1988aprotein efficiency g/MJ of DEsupplements
1.02 19.0 20–50 Corn–soybean meal Weight gain, feed Barrows and gilts. Lysine Chiba et al., 1991aefficiency, plasma requirement 3.0 g/Mcal ofurea DE
1.02 23.0 20–50 Corn–soybean meal Weight gain, feed Barrows. Lysine requirement Lawrence et al., 1994efficiency, protein 3.0 g/Mcal of DEaccretion rate,nitrogen retention
1.02 22.0 20–60 Corn–soybean meal Weight gain, feed Slightly higher requirements Krick et al., 1993efficiency, protein for pigs treated with porcineaccretion rate somatotropin
0.89 17.0 21–50 Corn–soybean meal Weight gain, feed A supplement of 0.20% lysine Hamilton and Veum, 1986efficiency improved performance over
the basal diet (0.69%)0.86 17.2 21–50 Corn–peanut Weight gain, feed Digestible lysine requirement Martinez and Knabe, 1990
meal–soybean efficiency 0.71%meal
0.95 19.5 22–52 Sorghum–soybean Weight gain, feed Barrows and gilts Owen et al., 1994meal efficiency, carcass
traits0.97 17.6 23–57 Barley–wheat–soybean Weight gain, feed Diets contained 0.72 to 0.97% Bell et al., 1988
meal–canola efficiency1.07 17.4 25–55 Barley–soybean Weight gain, feed Limit feeding. Average of Yen et al., 1986a
meal–fishmeal efficiency, carcass boars, barrows, and giltstraits
1.22 21.5 25–95 Wheat–barley–fishmeal– Weight gain, carcass Boars and gilts. Limit feeding. McPhee et al., 1991soybean meal traits Improved strain
1.04 – 26–30 Corn–soybean meal Weight gain, plasma Barrows Coma et al., 1995aurea, nitrogenretention
1.03 17.5 27–35 Corn–soybean meal Weight gain, plasma Barrows. Diets contained 0.75 Coma et al., 1995burea, to 1.35%
0.65 – 30–40 Corn plus amino Phenylalanine oxidation Boars Lin et al., 1986aacid mix
0.85 – 32–36 Corn–soybean meal Plasma urea Barrows and gilts Coma et al., 1995a1.13 21.2 33–55 Barley–wheat–soybean Weight gain, feed Boars. Lysine requirement 0.80 Rao and McCracken, 1990
meal–fishmeal efficiency, carcass g/MJ of DEtraits, nitrogenretention
0.96 22.0 34–72 Corn–soybean meal Weight gain, feed Digestible lysine requirement Friesen et al., 1994aefficiency, carcass 18 g/dtraits, proteinaccretion rate
0.86 19.9 40–85 Mixed cereal and Weight gain, feed Humid tropical conditions Kuan et al., 1986protein efficiency, carcasssupplements traits
0.65 21.1 42–101 Wheat–peanut Weight gain, feed 0.65% was superior to 0.55% Henry et al., 1992ameal–soybean efficiency, carcassmeal traits
0.76 – 44–49 Corn–soybean meal Plasma urea Barrows and gilts Coma et al., 1995a1.17 25.0 44–63 Barley–wheat–wheat Weight gain, feed Barrows. Response up the Susenbeth et al., 1994
gluten–soybean efficiency highest lysine concentrationmeal fed

22 Nutrient Requirements of Swine
TABLE 2-2 (continued)
Amino AcidandEstimatedRequirement Weight(%)a (g/d) (kg) Type of Diet Response Criteria Commentsc References
0.90 26.5 44–104 Corn–soybean meal Weight gain, feed 0.90% was superior to 0.70% Friesen et al., 1994befficiency, carcass for medium and high leantraits, protein growth barrows and giltsaccretion rate
0.60 17.4 47–103 Corn–soybean meal Weight gain, feed Barrows Cromwell et al., 1993efficiency, carcasstraits
0.87 22.3 47–103 Corn–soybean meal Weight gain, feed Gilts Cromwell et al., 1993efficiency, carcasstraits
0.70 18.6 49–100 Wheat–soybean Muscle gain Limit feeding. Barrows Bourdon and Henry, 1988meal–peanut meal
0.80 20.0 49–100 Wheat–soybean Muscle gain Limit feeding. Gilts Bourdon and Henry, 1988meal–peanut meal
0.83 18.6 50–85 Barley–soybean meal Lean growth rate Boars Giles et al., 19860.82 20.9 50–90 Barley–soybean Weight gain, feed Limit feeding. Average of boars Yen et al., 1986b
meal–fishmeal efficiency, carcass barrows, and giltstraits
0.73 16.2 50–90 Wheat plus mixed Weight gain, feed Boars. Lysine requirement 0.51 Campbell et al., 1988aprotein efficiency g/MJ of DEsupplements
0.63 14.1 50–90 Wheat plus mixed Weight gain, feed Gilts. Lysine requirement 0.44 Campbell et al., 1988aprotein efficiency g/MJ of DEsupplements
0.70 19.3 50–95 Corn–soybean meal Weight gain, feed A supplement of 0.20% lysine Hamilton and Veum, 1986efficiency improved performance over
the basal diet (0.50%)0.68 23.8 50–95 Corn–soybean meal Weight gain, feed Barrows. Digestible lysine Hahn et al., 1995
efficiency, plasma requirement 0.58%urea, carcass traits
0.75 21.0 50–95 Corn–soybean meal Weight gain, feed Gilts. Digestible lysine Hahn et al., 1995efficiency, plasma requirement 0.64%urea, carcass traits
0.80 22.4 52–78 Sorghum–soybean Weight gain, feed Barrows and gilts Owen et al., 1994meal efficiency, carcass
traits1.13 27.9 55–88 Barley–wheat–soybean Weight gain, feed Boars. Lysine requirement 0.80 Rao and McCracken, 1990
meal–fishmeal efficiency, carcass g/MJ of DEtraits, nitrogenretention
0.80 26.5 59–105 Corn–soybean meal Weight gain, feed No response to levels . 0.80% Johnston et al., 1993efficiency, carcasstraits, proteinaccretion
0.60 16.7 62–108 Corn–sesame meal Weight gain, feed Diets contained 0.60 to 1.40% Goodband et al., 1989efficiency, plasmaurea, carcass traits
0.80 25.5 63–99 Corn plus mixed Weight gain, feed Lysine concentrations greater Hansen et al., 1994protein efficiency, carcass than 0.80% reduced growthsupplements traits, nitrogen performance
retention0.79 22.0 63–100 Barley–wheat–wheat Weight gain, feed Barrows Susenbeth et al., 1994
gluten–soybean efficiencymeal
0.72 – 70–74 Corn–soybean meal Plasma urea Barrows and gilts Coma et al., 1995a0.70 22.7 78–109 Sorghum–soybean Weight gain, feed Barrows and gilts Owen et al., 1994
meal efficiency, carcasstraits
0.58 22.9 90–110 Corn–soybean meal Weight gain, feed Barrows. Digestible lysine Hahn et al., 1995efficiency, plasma requirement 0.49%urea, carcass traits
0.61 20.4 90–110 Corn–soybean meal Weight gain, feed Gilts. Digestible lysine Hahn et al., 1995efficiency, plasma requirement 0.52%urea, carcass traits
0.65 22.7 93–104 Corn–soybean meal Weight gain, plasma Barrows. Diets contained 0.45 Coma et al., 1995burea to 1.05%
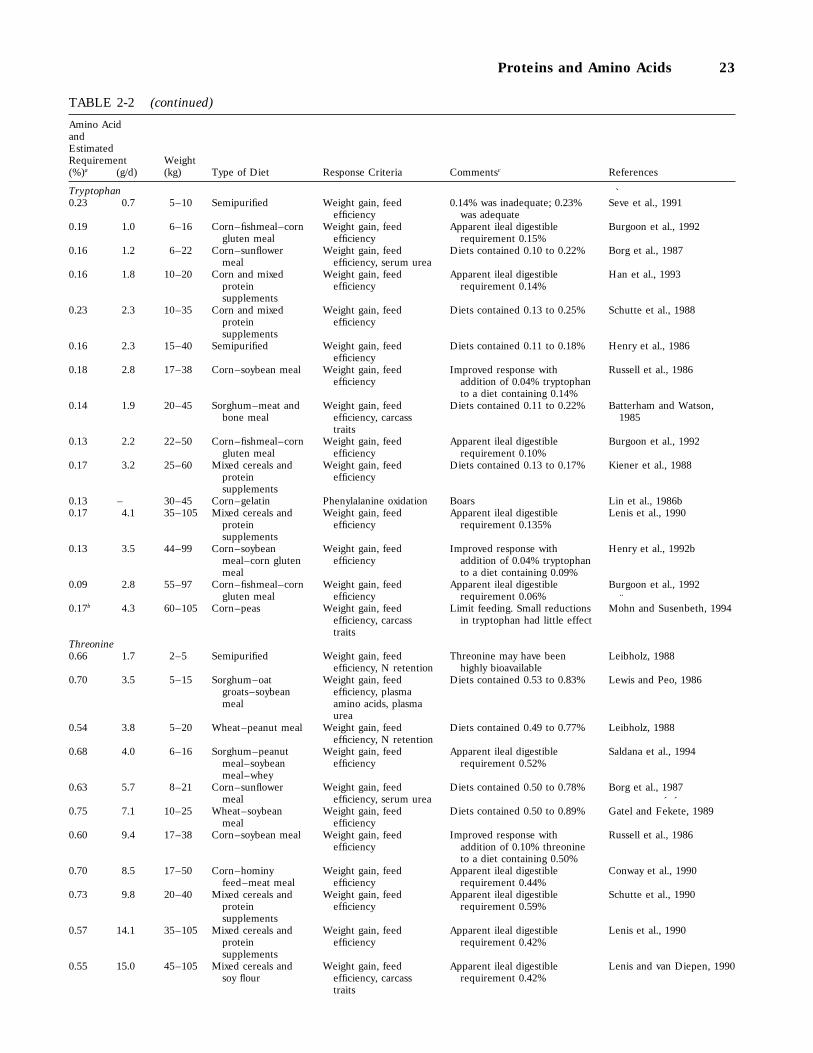
Proteins and Amino Acids 23
TABLE 2-2 (continued)
Amino AcidandEstimatedRequirement Weight(%)a (g/d) (kg) Type of Diet Response Criteria Commentsc References
Tryptophan0.23 0.7 5–10 Semipurified Weight gain, feed 0.14% was inadequate; 0.23% Se
`ve et al., 1991
efficiency was adequate0.19 1.0 6–16 Corn–fishmeal–corn Weight gain, feed Apparent ileal digestible Burgoon et al., 1992
gluten meal efficiency requirement 0.15%0.16 1.2 6–22 Corn–sunflower Weight gain, feed Diets contained 0.10 to 0.22% Borg et al., 1987
meal efficiency, serum urea0.16 1.8 10–20 Corn and mixed Weight gain, feed Apparent ileal digestible Han et al., 1993
protein efficiency requirement 0.14%supplements
0.23 2.3 10–35 Corn and mixed Weight gain, feed Diets contained 0.13 to 0.25% Schutte et al., 1988protein efficiencysupplements
0.16 2.3 15–40 Semipurified Weight gain, feed Diets contained 0.11 to 0.18% Henry et al., 1986efficiency
0.18 2.8 17–38 Corn–soybean meal Weight gain, feed Improved response with Russell et al., 1986efficiency addition of 0.04% tryptophan
to a diet containing 0.14%0.14 1.9 20–45 Sorghum–meat and Weight gain, feed Diets contained 0.11 to 0.22% Batterham and Watson,
bone meal efficiency, carcass 1985traits
0.13 2.2 22–50 Corn–fishmeal–corn Weight gain, feed Apparent ileal digestible Burgoon et al., 1992gluten meal efficiency requirement 0.10%
0.17 3.2 25–60 Mixed cereals and Weight gain, feed Diets contained 0.13 to 0.17% Kiener et al., 1988protein efficiencysupplements
0.13 – 30–45 Corn–gelatin Phenylalanine oxidation Boars Lin et al., 1986b0.17 4.1 35–105 Mixed cereals and Weight gain, feed Apparent ileal digestible Lenis et al., 1990
protein efficiency requirement 0.135%supplements
0.13 3.5 44–99 Corn–soybean Weight gain, feed Improved response with Henry et al., 1992bmeal–corn gluten efficiency addition of 0.04% tryptophanmeal to a diet containing 0.09%
0.09 2.8 55–97 Corn–fishmeal–corn Weight gain, feed Apparent ileal digestible Burgoon et al., 1992gluten meal efficiency requirement 0.06%
0.17b 4.3 60–105 Corn–peas Weight gain, feed Limit feeding. Small reductions Mo¨hn and Susenbeth, 1994
efficiency, carcass in tryptophan had little effecttraits
Threonine0.66 1.7 2–5 Semipurified Weight gain, feed Threonine may have been Leibholz, 1988
efficiency, N retention highly bioavailable0.70 3.5 5–15 Sorghum–oat Weight gain, feed Diets contained 0.53 to 0.83% Lewis and Peo, 1986
groats–soybean efficiency, plasmameal amino acids, plasma
urea0.54 3.8 5–20 Wheat–peanut meal Weight gain, feed Diets contained 0.49 to 0.77% Leibholz, 1988
efficiency, N retention0.68 4.0 6–16 Sorghum–peanut Weight gain, feed Apparent ileal digestible Saldana et al., 1994
meal–soybean efficiency requirement 0.52%meal–whey
0.63 5.7 8–21 Corn–sunflower Weight gain, feed Diets contained 0.50 to 0.78% Borg et al., 1987meal efficiency, serum urea
0.75 7.1 10–25 Wheat–soybean Weight gain, feed Diets contained 0.50 to 0.89% Gatel and Fe´ke
´te, 1989
meal efficiency0.60 9.4 17–38 Corn–soybean meal Weight gain, feed Improved response with Russell et al., 1986
efficiency addition of 0.10% threonineto a diet containing 0.50%
0.70 8.5 17–50 Corn–hominy Weight gain, feed Apparent ileal digestible Conway et al., 1990feed–meat meal efficiency requirement 0.44%
0.73 9.8 20–40 Mixed cereals and Weight gain, feed Apparent ileal digestible Schutte et al., 1990protein efficiency requirement 0.59%supplements
0.57 14.1 35–105 Mixed cereals and Weight gain, feed Apparent ileal digestible Lenis et al., 1990protein efficiency requirement 0.42%supplements
0.55 15.0 45–105 Mixed cereals and Weight gain, feed Apparent ileal digestible Lenis and van Diepen, 1990soy flour efficiency, carcass requirement 0.42%
traits
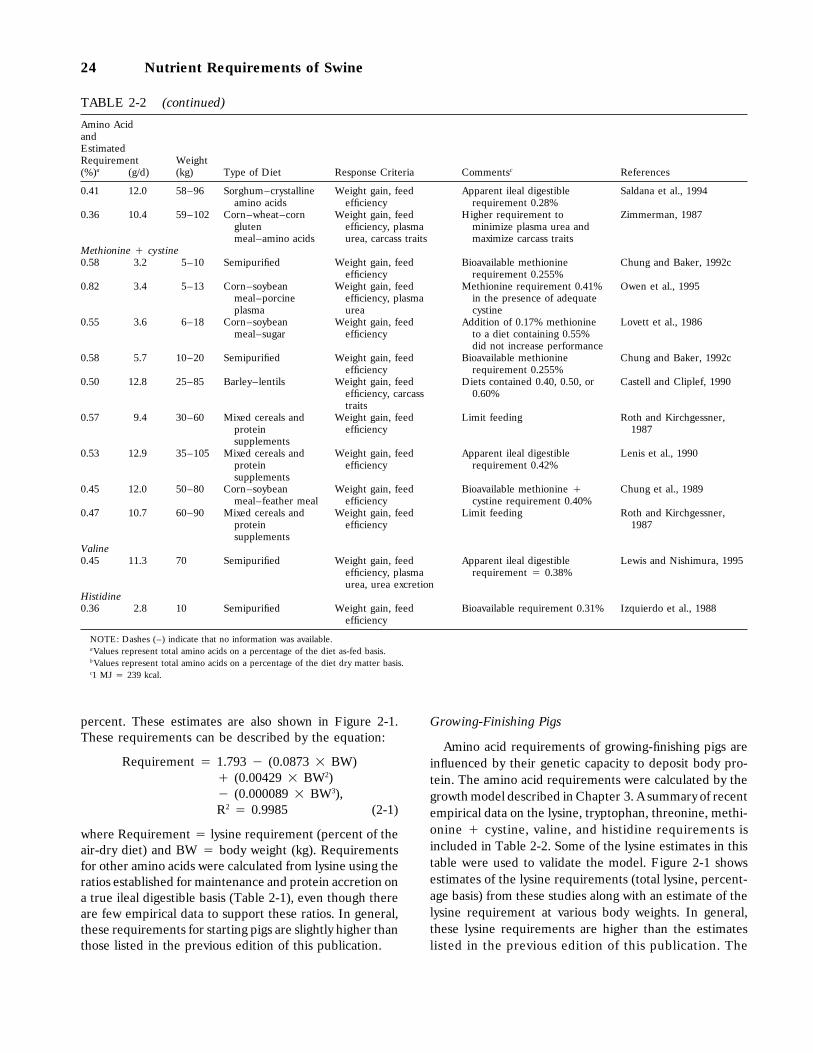
24 Nutrient Requirements of Swine
TABLE 2-2 (continued)
Amino AcidandEstimatedRequirement Weight(%)a (g/d) (kg) Type of Diet Response Criteria Commentsc References
0.41 12.0 58–96 Sorghum–crystalline Weight gain, feed Apparent ileal digestible Saldana et al., 1994amino acids efficiency requirement 0.28%
0.36 10.4 59–102 Corn–wheat–corn Weight gain, feed Higher requirement to Zimmerman, 1987gluten efficiency, plasma minimize plasma urea andmeal–amino acids urea, carcass traits maximize carcass traits
Methionine ` cystine0.58 3.2 5–10 Semipurified Weight gain, feed Bioavailable methionine Chung and Baker, 1992c
efficiency requirement 0.255%0.82 3.4 5–13 Corn–soybean Weight gain, feed Methionine requirement 0.41% Owen et al., 1995
meal–porcine efficiency, plasma in the presence of adequateplasma urea cystine
0.55 3.6 6–18 Corn–soybean Weight gain, feed Addition of 0.17% methionine Lovett et al., 1986meal–sugar efficiency to a diet containing 0.55%
did not increase performance0.58 5.7 10–20 Semipurified Weight gain, feed Bioavailable methionine Chung and Baker, 1992c
efficiency requirement 0.255%0.50 12.8 25–85 Barley–lentils Weight gain, feed Diets contained 0.40, 0.50, or Castell and Cliplef, 1990
efficiency, carcass 0.60%traits
0.57 9.4 30–60 Mixed cereals and Weight gain, feed Limit feeding Roth and Kirchgessner,protein efficiency 1987supplements
0.53 12.9 35–105 Mixed cereals and Weight gain, feed Apparent ileal digestible Lenis et al., 1990protein efficiency requirement 0.42%supplements
0.45 12.0 50–80 Corn–soybean Weight gain, feed Bioavailable methionine ` Chung et al., 1989meal–feather meal efficiency cystine requirement 0.40%
0.47 10.7 60–90 Mixed cereals and Weight gain, feed Limit feeding Roth and Kirchgessner,protein efficiency 1987supplements
Valine0.45 11.3 70 Semipurified Weight gain, feed Apparent ileal digestible Lewis and Nishimura, 1995
efficiency, plasma requirement 4 0.38%urea, urea excretion
Histidine0.36 2.8 10 Semipurified Weight gain, feed Bioavailable requirement 0.31% Izquierdo et al., 1988
efficiency
NOTE: Dashes (–) indicate that no information was available.aValues represent total amino acids on a percentage of the diet as-fed basis.bValues represent total amino acids on a percentage of the diet dry matter basis.c1 MJ 4 239 kcal.
percent. These estimates are also shown in Figure 2-1.These requirements can be described by the equation:
Requirement 4 1.793 1 (0.0873 2 BW)` (0.00429 2 BW2)1 (0.000089 2 BW3),R2 4 0.9985 (2-1)
where Requirement 4 lysine requirement (percent of theair-dry diet) and BW 4 body weight (kg). Requirementsfor other amino acids were calculated from lysine using theratios established for maintenance and protein accretion ona true ileal digestible basis (Table 2-1), even though thereare few empirical data to support these ratios. In general,these requirements for starting pigs are slightly higher thanthose listed in the previous edition of this publication.
Growing-Finishing Pigs
Amino acid requirements of growing-finishing pigs areinfluenced by their genetic capacity to deposit body pro-tein. The amino acid requirements were calculated by thegrowth model described in Chapter 3. A summary of recentempirical data on the lysine, tryptophan, threonine, methi-onine ` cystine, valine, and histidine requirements isincluded in Table 2-2. Some of the lysine estimates in thistable were used to validate the model. Figure 2-1 showsestimates of the lysine requirements (total lysine, percent-age basis) from these studies along with an estimate of thelysine requirement at various body weights. In general,these lysine requirements are higher than the estimateslisted in the previous edition of this publication. The

Proteins and Amino Acids 25
increase in the lysine requirements is attributed to severalfactors, among which are improved genetics, health, andother environmental conditions in contemporary pigs.
Sows
Amino acid requirements of gestating sows are influ-enced by their requirements for maintenance, proteindeposition in maternal proteinaceous tissues, and proteindeposition in the products of conception. Amino acidrequirements of lactating sows are affected by their needsfor maintenance and synthesis of milk protein, adjustedfor amino acids that become available from maternal bodyprotein if sows lose weight. Amino acid requirements forsows during gestation and lactation were also developedby computer modeling, as described in Chapter 3. A sum-mary of recent references on the lysine requirements ofgestating and lactating sows, some of which were used tovalidate the models, is shown in Table 2-3.
In general, the lysine requirements of pregnant sowsare slightly higher, and the lysine requirements of lactatingsows are considerably higher, than those listed in the previ-ous edition of this publication. The increased estimates forlactation are supported by the results from a number ofstudies published since the last edition (Cera et al., 1990;Coffey, 1990; Stahly et al., 1990, 1992; Monegue et al.,1993; Sauber et al., 1994; Knabe et al., 1996). These studieshave shown that lactating sows nursing large litters producemore milk (as reflected by increased weaning weights ofnursing pigs) and lose less maternal body weight when fed0.75 to 0.90% dietary lysine (45 to 55 g/day) than whenfed the lysine levels cited in the previous edition (0.60%lysine, 35 g/day).
Boars
There has been little research to determine the aminoacid requirements for reproduction in the boar (for areview, see Kemp and Den Hartog, 1989). Inadequateprotein intake during development delays sexual maturityand reduces sperm output per ejaculation, but recoveryfrom mild undernutrition (a 12 percent crude protein diet)is fairly rapid (Uzu, 1979).
Sexually active boars do not seem to have any unusualamino acid requirements. Early experiments (most of themin Eastern Europe) concerning the effects of lysine andmethionine supplements on the reproductive functions ofboars indicated that sexually active boars may have a rela-tively high requirement for sulfur amino acids and perhapslysine (Mos
ˇkutelo, 1970; Netesa and Pashkevich, 1971;
Fufaev and Pashkevich, 1972; Tomme´
and Loskutnikov,1972; Hu
¨hn et al., 1973, 1974; Poppe et al., 1974a,b,c;
Pashkevich, 1974, 1976; Zaripova and Shakirov, 1978). Pos-itive responses to methionine and lysine supplements
TABLE 2-3 Lysine Requirements of Gestating andLactating Sows a
Azain, M. J., T. Tomkins, and J. S. Sowinski. 1994. Effect of a proteinand energy enriched lactation diet in sow and litter performance:Interaction with supplemental milk replacer. J. Anim. Sci. 72(Suppl.2):65 (Abstr.).
Cera, K. R., L. G. Sterling, and D. Warrington. 1990. Effect of lysinelevel in lactating diets on sow performance over successivereproduction cycles. J. Anim. Sci. 68(Suppl. 1):365 (Abstr.).
Coffey, M. T. 1990. Effect of dietary lysine concentration duringlactation on reproductive performance of sows. J. Anim. Sci.68(Suppl. 1):368 (Abstr.).
Coma, J., D. R. Zimmerman, and D. Carrion. 1996. Lysinerequirement of the lactating sow determined by using plasma ureanitrogen as a rapid response criterion. J. Anim. Sci. 74:1056–1062.
Dourmad, J. Y., M. Etienne, and J. Noblet. 1991. Lysine and otheramino acid requirements for lactating sows. J. Anim. Sci. 69(Suppl.1):366 (Abstr.).
Dunn, J. M., and V. C. Speer. 1988. Protein requirement of pregnantgilts. J. Anim. Sci. 66(Suppl. 1):145 (Abstr.).
Dunn, J. M., and V. C. Speer. 1989. Minimum nitrogen requirementof pregnant swine. J. Anim. Sci. 68(Suppl. 1):119 (Abstr.).
Etienne, M., J. Noblet, J. Y. Dourmad, and H. Fortune. 1989. Studyof the lysine requirement of sows during lactation. Journ. Rech.Porcine Fr. 21:101–107.
Fernandes, L. C. O., J. H. Britt, and M. T. Coffey. 1990. Effect offrequency of feeding and lysine intake on production andreproduction of primiparous sows. J. Anim. Sci. 68(Suppl. 1):367(Abstr.).
Grandhi, R. R. 1986. Effect of energy and lysine levels onreproductive performance of gilts. Can. J. Anim. Sci.66:1177(Abstr.).
Grandhi, R. R. 1988. Effect of nutritional flushing, supplemental fatand supplemental lysine from puberty to breeding and during earlygestation on reproductive performance of gilts. Can. J. Anim. Sci.68:941–951.
Grandhi, R. R. 1992. Effect of feeding supplemental fat or lysineduring the postweaning period on the reproductive performance ofsows with low or high lactation body weight and fat losses. Can. J.Anim. Sci. 72:679–690.
Grandhi, R. R. 1994. Apparent absorption and retention of nutrientsduring the postweaning period in sows fed supplemental fat orlysine. Can. J. Anim. Sci. 74:123–128.
Johnston, L. J., J. E. Pettigrew, and J. W. Rust. 1993. Response ofmaternal-line sows to dietary protein concentration during lactation.J. Anim. Sci. 71:2151–2156.
Jones, D. B., and T. S. Stahly. 1995. Impact of amino acid nutritionduring lactation on subsequent reproductive function of sows. J.Anim. Sci. 73(Suppl. 1):85 (Abstr.).
Kaji, Y., Y. Hatori, S. Furuya, and T. Ishibashi. 1992a. Lysinerequirements of gilts during mid and late pregnancy and midlactating periods. Anim. Sci. Technol. 63:955–963.
Kaji, Y., Y. Hatori, S. Furuya, and T. Ishibashi. 1992b. Lysinerequirements of multiparous sows during mid and late pregnancyand mid lactating periods. Anim. Sci. Technol. 63:1175–1181.
King, R. H. 1991. Response of pregnant gilts to dietary protein asdetermined by nitrogen retention. J. Anim. Sci. 69(Suppl. 1):361(Abstr.).
King, R. H., M. S. Toner, H. Dove, C. S. Atwood, and W. G. Brown.1993. The response of first-litter sows to dietary protein level duringlactation. J. Anim. Sci. 71:2457–2463.
Knabe, D. A., J. H. Brendemuhl, L. I. Chiba, and C. R. Dove. 1996.Supplemental lysine for sows nursing large litters. J. Anim. Sci.74:1635–1640.
Laurin, J. L., R. D. Goodband, J. L. Nelssen, R. D. Richard, andD. R. Keesecker. 1991. Dietary lysine during lactation affects sowand litter performance. J. Anim. Sci. 69(Suppl. 1):109 (Abstr.).
Laurin, J. L., J. L. Nelssen, R. D. Goodband, and M. D. Tokach.1993. The interrelationships between dietary lysine and litter size onsow and litter performance. J. Anim. Sci. 71(Suppl. 1):65 (Abstr.).
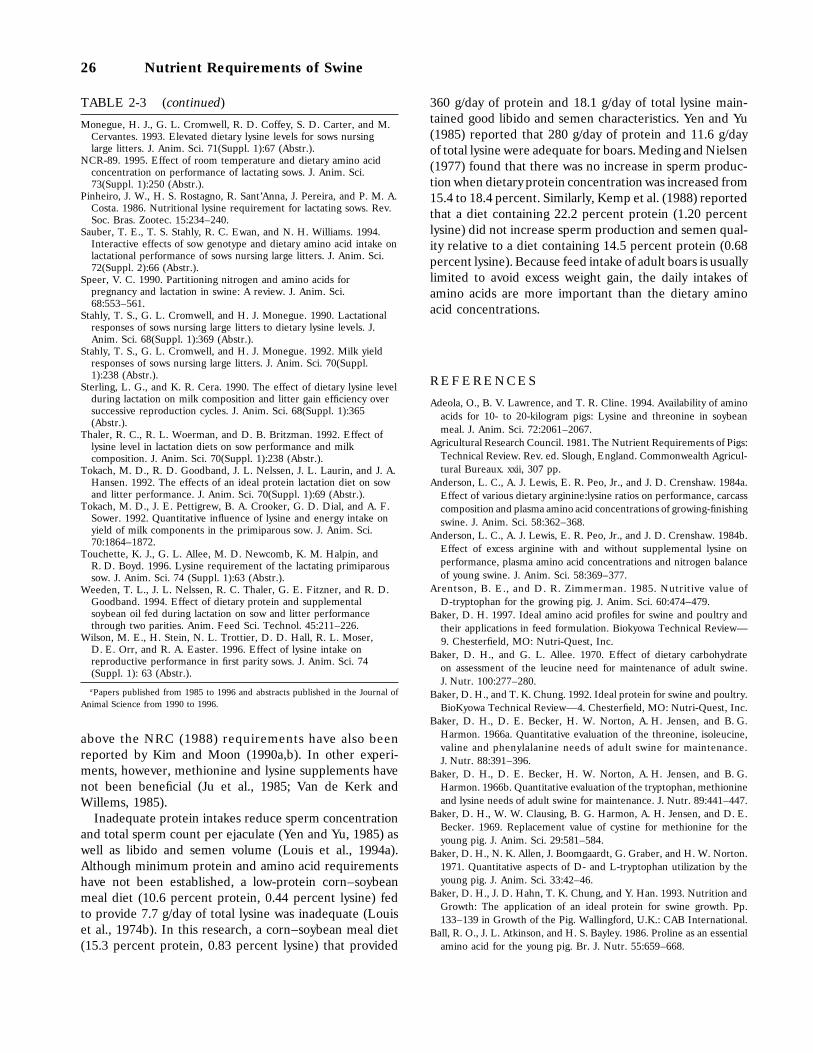
26 Nutrient Requirements of Swine
TABLE 2-3 (continued)
Monegue, H. J., G. L. Cromwell, R. D. Coffey, S. D. Carter, and M.Cervantes. 1993. Elevated dietary lysine levels for sows nursinglarge litters. J. Anim. Sci. 71(Suppl. 1):67 (Abstr.).
NCR-89. 1995. Effect of room temperature and dietary amino acidconcentration on performance of lactating sows. J. Anim. Sci.73(Suppl. 1):250 (Abstr.).
Pinheiro, J. W., H. S. Rostagno, R. Sant’Anna, J. Pereira, and P. M. A.Costa. 1986. Nutritional lysine requirement for lactating sows. Rev.Soc. Bras. Zootec. 15:234–240.
Sauber, T. E., T. S. Stahly, R. C. Ewan, and N. H. Williams. 1994.Interactive effects of sow genotype and dietary amino acid intake onlactational performance of sows nursing large litters. J. Anim. Sci.72(Suppl. 2):66 (Abstr.).
Speer, V. C. 1990. Partitioning nitrogen and amino acids forpregnancy and lactation in swine: A review. J. Anim. Sci.68:553–561.
Stahly, T. S., G. L. Cromwell, and H. J. Monegue. 1990. Lactationalresponses of sows nursing large litters to dietary lysine levels. J.Anim. Sci. 68(Suppl. 1):369 (Abstr.).
Stahly, T. S., G. L. Cromwell, and H. J. Monegue. 1992. Milk yieldresponses of sows nursing large litters. J. Anim. Sci. 70(Suppl.1):238 (Abstr.).
Sterling, L. G., and K. R. Cera. 1990. The effect of dietary lysine levelduring lactation on milk composition and litter gain efficiency oversuccessive reproduction cycles. J. Anim. Sci. 68(Suppl. 1):365(Abstr.).
Thaler, R. C., R. L. Woerman, and D. B. Britzman. 1992. Effect oflysine level in lactation diets on sow performance and milkcomposition. J. Anim. Sci. 70(Suppl. 1):238 (Abstr.).
Tokach, M. D., R. D. Goodband, J. L. Nelssen, J. L. Laurin, and J. A.Hansen. 1992. The effects of an ideal protein lactation diet on sowand litter performance. J. Anim. Sci. 70(Suppl. 1):69 (Abstr.).
Tokach, M. D., J. E. Pettigrew, B. A. Crooker, G. D. Dial, and A. F.Sower. 1992. Quantitative influence of lysine and energy intake onyield of milk components in the primiparous sow. J. Anim. Sci.70:1864–1872.
Touchette, K. J., G. L. Allee, M. D. Newcomb, K. M. Halpin, andR. D. Boyd. 1996. Lysine requirement of the lactating primiparoussow. J. Anim. Sci. 74 (Suppl. 1):63 (Abstr.).
Weeden, T. L., J. L. Nelssen, R. C. Thaler, G. E. Fitzner, and R. D.Goodband. 1994. Effect of dietary protein and supplementalsoybean oil fed during lactation on sow and litter performancethrough two parities. Anim. Feed Sci. Technol. 45:211–226.
Wilson, M. E., H. Stein, N. L. Trottier, D. D. Hall, R. L. Moser,D. E. Orr, and R. A. Easter. 1996. Effect of lysine intake onreproductive performance in first parity sows. J. Anim. Sci. 74(Suppl. 1): 63 (Abstr.).
aPapers published from 1985 to 1996 and abstracts published in the Journal ofAnimal Science from 1990 to 1996.
above the NRC (1988) requirements have also beenreported by Kim and Moon (1990a,b). In other experi-ments, however, methionine and lysine supplements havenot been beneficial (Ju et al., 1985; Van de Kerk andWillems, 1985).
Inadequate protein intakes reduce sperm concentrationand total sperm count per ejaculate (Yen and Yu, 1985) aswell as libido and semen volume (Louis et al., 1994a).Although minimum protein and amino acid requirementshave not been established, a low-protein corn–soybeanmeal diet (10.6 percent protein, 0.44 percent lysine) fedto provide 7.7 g/day of total lysine was inadequate (Louiset al., 1974b). In this research, a corn–soybean meal diet(15.3 percent protein, 0.83 percent lysine) that provided
360 g/day of protein and 18.1 g/day of total lysine main-tained good libido and semen characteristics. Yen and Yu(1985) reported that 280 g/day of protein and 11.6 g/dayof total lysine were adequate for boars. Meding and Nielsen(1977) found that there was no increase in sperm produc-tion when dietary protein concentration was increased from15.4 to 18.4 percent. Similarly, Kemp et al. (1988) reportedthat a diet containing 22.2 percent protein (1.20 percentlysine) did not increase sperm production and semen qual-ity relative to a diet containing 14.5 percent protein (0.68percent lysine). Because feed intake of adult boars is usuallylimited to avoid excess weight gain, the daily intakes ofamino acids are more important than the dietary aminoacid concentrations.
R EF ER E NC ES
Adeola, O., B. V. Lawrence, and T. R. Cline. 1994. Availability of aminoacids for 10- to 20-kilogram pigs: Lysine and threonine in soybeanmeal. J. Anim. Sci. 72:2061–2067.
Agricultural Research Council. 1981. The Nutrient Requirements of Pigs:Technical Review. Rev. ed. Slough, England. Commonwealth Agricul-tural Bureaux. xxii, 307 pp.
Anderson, L. C., A. J. Lewis, E. R. Peo, Jr., and J. D. Crenshaw. 1984a.Effect of various dietary arginine:lysine ratios on performance, carcasscomposition and plasma amino acid concentrations of growing-finishingswine. J. Anim. Sci. 58:362–368.
Anderson, L. C., A. J. Lewis, E. R. Peo, Jr., and J. D. Crenshaw. 1984b.Effect of excess arginine with and without supplemental lysine onperformance, plasma amino acid concentrations and nitrogen balanceof young swine. J. Anim. Sci. 58:369–377.
Arentson, B. E., and D. R. Zimmerman. 1985. Nutritive value ofD-tryptophan for the growing pig. J. Anim. Sci. 60:474–479.
Baker, D. H. 1997. Ideal amino acid profiles for swine and poultry andtheir applications in feed formulation. Biokyowa Technical Review—9. Chesterfield, MO: Nutri-Quest, Inc.
Baker, D. H., and G. L. Allee. 1970. Effect of dietary carbohydrateon assessment of the leucine need for maintenance of adult swine.J. Nutr. 100:277–280.
Baker, D. H., and T. K. Chung. 1992. Ideal protein for swine and poultry.BioKyowa Technical Review—4. Chesterfield, MO: Nutri-Quest, Inc.
Baker, D. H., D. E. Becker, H. W. Norton, A. H. Jensen, and B. G.Harmon. 1966a. Quantitative evaluation of the threonine, isoleucine,valine and phenylalanine needs of adult swine for maintenance.J. Nutr. 88:391–396.
Baker, D. H., D. E. Becker, H. W. Norton, A. H. Jensen, and B. G.Harmon. 1966b. Quantitative evaluation of the tryptophan, methionineand lysine needs of adult swine for maintenance. J. Nutr. 89:441–447.
Baker, D. H., W. W. Clausing, B. G. Harmon, A. H. Jensen, and D. E.Becker. 1969. Replacement value of cystine for methionine for theyoung pig. J. Anim. Sci. 29:581–584.
Baker, D. H., N. K. Allen, J. Boomgaardt, G. Graber, and H. W. Norton.1971. Quantitative aspects of D- and L-tryptophan utilization by theyoung pig. J. Anim. Sci. 33:42–46.
Baker, D. H., J. D. Hahn, T. K. Chung, and Y. Han. 1993. Nutrition andGrowth: The application of an ideal protein for swine growth. Pp.133–139 in Growth of the Pig. Wallingford, U.K.: CAB International.
Ball, R. O., J. L. Atkinson, and H. S. Bayley. 1986. Proline as an essentialamino acid for the young pig. Br. J. Nutr. 55:659–668.
Proteins and Amino Acids 27
Batterham, E. S. 1992. Availability and utilization of amino acids forgrowing pigs. Nutr. Res. Rev. 5:1–18.
Batterham, E. S. 1994. Ileal digestibilities of amino acids in feedstuffsfor pigs. Pp. 113–131 in Amino Acids in Farm Animal Nutrition.Wallingford, U.K.: CAB International.
Batterham, E. S., and C. Watson. 1985. Tryptophan content of feeds,limitations in diets and requirement for growing pigs. Anim. Feed Sci.Technol. 13:171–182.
Batterham, E. S., L. M. Andersen, D. R. Baigent, and E. White. 1990.Utilization of ileal digestible amino acids by growing pigs: Effect ofdietary lysine concentration on efficiency of lysine retention. Br. J.Nutr. 64:81–94.
Becker, D. E., A. H. Jensen, S. W. Terrill, and H. W. Norton. 1955. Themethionine-cystine need of the young pig. J. Anim. Sci. 14:1086–1094.
Bell, J. M., M. O. Keith, and C. S. Darroch. 1988. Lysine supplementationof grower and finisher pig diets based on high protein barley, wheatand soybean meal or canola meal, with observations on thyroid andzinc status. Can. J. Anim. Sci. 68:931–940.
Bikker, P., M. W. A. Verstegen, R. G. Campbell, and B. Kemp. 1994.Digestible lysine requirement of gilts with high genetic potential forlean gain, in relation to the level of energy intake. J. Anim. Sci.72:1744–1753.
Borg, B. S., G. W. Libal, and R. C. Wahlstrom. 1987. Tryphtophanand threonine requirements of young pigs and their effects on serumcalcium, phosphorus and zinc concentrations. J. Anim. Sci.64:1070–1078.
Bourdon, D., and Y. Henry. 1988. Lysine requirement of the finishingpig according to sex. Journ. Rech. Porcine Fr. 20:409–414.
Brudevoid, A. B., and L. L. Southern. 1994. Low-protein, crystallineamino acid-supplemented, sorghum-soybean meal diets for the 10- to20-kilogram pig. J. Anim. Sci. 72:638–647.
Burgoon, K. G., D. A. Knabe, and E. J. Gregg. 1992. Digestible tryptophanrequirements of starting, growing, and finishing pigs. J. Anim. Sci.70:2493–2500.
Campbell, R. G., M. R. Taverner, and D. M. Curic. 1988a. The effectsof sex and live weight on the growing pig’s response to dietary protein.Anim. Prod. 46:123–130.
Campbell, R. G., M. R. Taverner, and C. J. Rayner. 1988b. The tissueand dietary protein and amino acid requirements of pigs from 8.0 to20.0 kg live weight. Anim. Prod. 46:283–290.
Castell, A. G., and R. L. Cliplef. 1990. Methionine supplementation ofbarley diets containing lentils (Lens culinaris) or soybean meal: Liveperformance and carcass responses by gilts fed ad libitum. Can. J.Anim. Sci. 70:329–332.
Cera, K. R., L. G. Sterling, and D. Warrington. 1990. Effect of lysinelevel in lactating diets on sow performance over successive reproductioncycles. J. Anim. Sci. 68(Suppl. 1):365 (Abstr.).
Chiba, L. I., A. J. Lewis, and E. R. Peo, Jr. 1991a. Amino acid and energyinterrelationships in pigs weighing 20 to 50 kilograms: I. Rate andefficiency of weight gain. J. Anim. Sci. 69:694–707.
Chiba, L. I., A. J. Lewis, and E. R. Peo, Jr. 1991b. Amino acid and energyinterrelationships in pigs weighing 20 to 50 kilograms: II. Rate andefficiency of protein and fat deposition. J. Anim. Sci. 69:708–718.
Chung, T. K., and D. H. Baker. 1992a. Maximal portion of the youngpig’s sulfur amino acid requirement that can be furnished by cystine.J. Anim. Sci. 70:1182–1187.
Chung, T. K., and D. H. Baker. 1992b. Utilization of methionine isomersand analogs by pigs. Can. J. Anim. Sci. 72:185–188.
Chung, T. K., and D. H. Baker. 1992c. Methionine requirement of pigsbetween 5 and 20 kilograms of body weight. J. Anim. Sci. 70:1857–1863.
Chung, T. K., and D. H. Baker. 1993. A note on the dispensability ofproline for weanling pigs. Anim. Prod. 56:407–408.
Chung, T. K., O. A. Izquierdo, K. Hashimoto, and D. H. Baker. 1989.Methionine requirement of the finishing pig. J . Anim. Sci.67:2677–2683.
Coffey, M. T. 1990. Effect of dietary lysine concentration during lactationon reproductive performance of sows. J. Anim. Sci. 68(Suppl. 1):368(Abstr.).
Cole, D. J. A., and T. A. Van Lunen. 1994. Ideal amino acid patterns.Pp. 99–112 in Amino Acids in Farm Animal Nutrition. J. P. F. D’Mello,ed. Wallingford, U.K.: CAB International.
Coma, J., D. Carrion, and D. R. Zimmerman. 1995a. Use of plasmaurea nitrogen as a rapid response criterion to determine the lysinerequirement of pigs. J. Anim. Sci. 73:472–481.
Coma, J., D. R. Zimmerman, and D. Carrion. 1995b. Interactive effectsof feed intake and stage of growth on the lysine requirement of pigs.J. Anim. Sci. 73:3369–3375.
Conway, D., W. C. Sauer, L. A. den Hartog, and J. Huisman. 1990.Studies on the threonine requirements of growing pigs based on thetotal, ileal and faecal digestible contents. Livest. Prod. Sci. 25:105–120.
Cromwell, G. L., T. R. Cline, J. D. Crenshaw, T. D. Crenshaw, R. C.Ewan, C. R. Hamilton, A. J. Lewis, D. C. Mahan, E. R. Miller, J. E.Pettigrew, L. F. Tribble, and T. L. Veum. 1993. The dietary proteinand(or) lysine requirements of barrows and gilts. J. Anim. Sci.71:1510–1519.
Danielsen, V., B. O. Eggum, and H. Jørgensen. 1989. The effect ofincreased dietary levels of lysine, methionine and threonine onN-retention and growth in weaned pigs. J. Anim. Sci. 67(Suppl.1):242 (Abstr.).
Easter, R. A., and D. H. Baker. 1976. Nitrogen metabolism and reproduc-tive response of gravid swine fed an arginine-free diet during the last84 days of gestation. J. Nutr. 106:636–641.
Easter, R. A., R. S. Katz, and D. H. Baker. 1974. Arginine: A dispensableamino acid for postpubertal growth and pregnancy of swine. J. Anim.Sci. 39:1123–1128.
Edmonds, M. S., and D. H. Baker. 1987a. Amino acid excesses for youngpigs: Effects of excess methionine, tryptophan, threonine or leucine.J. Anim. Sci. 64:1664–1671.
Edmonds, M. S., and D. H. Baker. 1987b. Failure of excess dietary lysineto antagonize arginine in young pigs. J. Nutr. 117:1396–1401.
Edmonds, M. S., Gonyou, H. W., and D. H. Baker. 1987. Effect ofexcess levels of methionine, tryptophan, arginine, lysine or threonineon growth and dietary choice in the pig. J. Anim. Sci. 65:179–185.
Friesen, K. G., J. L. Nelssen, R. D. Goodband, M. D. Tokach, J. A.Unruh, D. H. Kropf, and B. J. Kerr. 1994a. Influence of dietary lysineon growth and carcass composition of high-lean-growth gilts fed from34 to 72 kilograms. J. Anim. Sci. 72:1761–1770.
Friesen, K. G., J. L. Nelssen, J. A. Unruh, R. D. Goodband, and M. D.Tokach. 1994b. Effects of the interrelationship between genotype, sex,and dietary lysine on growth performance and carcass composition infinishing pigs fed to either 104 or 127 kilograms. J. Anim. Sci.72:946–954.
Fufaev, I., and A. Pashkevich. 1972. Effect of synthetic lysine on reproduc-tive functions of boars. Svinovodstvo 36(7):32.
Fuller, M. F., and T. C. Wang. 1990. Digestible ideal protein—A measureof dietary protein value. Pig News Info. 11:353–357.
Fuller, M. F., J. Wood, A. C. Brewer, K. Pennie, and R. MacWilliam.1986. The responses of growing pigs to dietary lysine, as free lysinehydrochloride or in soya-bean meal, and the influence of food intake.Anim. Prod. 43:477–484.
Fuller, M. F., R. McWilliam, T. C. Wang, and L. R. Giles. 1989. Theoptimum dietary amino acid pattern for growing pigs. 2. Requirementsfor maintenance and for tissue protein accretion. Br. J. Nutr.62:255–267.
Gahl, M. J., T. D. Crenshaw, and N. J. Benevenga. 1994. Diminishingreturns in weight, nitrogen, and lysine gain of pigs fed six levels oflysine from three supplemental sources. J. Anim. Sci. 72:3177–3178.
Gatel, F., and J. Fe´ke
´te. 1989. Lysine and threonine balance and require-
ments for weaned piglets 10–25 kg liveweight fed cereal-based diets.Livest. Prod. Sci. 23:195–206.
28 Nutrient Requirements of Swine
Gatel, F., G. Buron, and J. Fe´ke
´te. 1992. Total amino acid requirements
of weaned piglets 8 to 25 kg live weight given diets based on wheat andsoya-bean meal fortified with free amino acids. Anim. Prod. 54:281–287.
Giles, L. R., E. S. Batterham, and E. B. Dettmann. 1986. Amino acidand energy interactions in growing pigs. 2. Effects of food intake, sexand live weight on the responses to lysine concentration in barley-based diets. Anim. Prod. 42:133–144.
Giles, L. R., E. S. Batterham, E. B. Dettmann, and R. F. Lowe. 1987.Amino acid and energy interactions in growing pigs. 3. Effects of sexand live weight and cereal on the responses to dietary lysine concentra-tion when fed ad libitum or to a restricted food scale on diets basedon wheat or barley. Anim. Prod. 45:493–502.
Goodband, R. D., R. H. Hines, J. L. Nelssen, and R. C. Thaler. 1988.The effects of dietary lysine level on performance of pigs weaned attwo weeks of age. J. Anim. Sci. 66(Suppl. 1):315 (Abstr.).
Goodband, R. D., R. H. Hines, J. L. Nelssen, D. H. Kropf, and G. R.Stoner. 1989. The effects of excess dietary lysine additions on growthperformance and carcass characteristics of finishing pigs. J. Anim. Sci.67(Suppl. 1):260 (Abstr.).
Green, S., and T. Kiener. 1989. Digestibilities of nitrogen and aminoacids in soya-bean, sunflower, meat and rapeseed meals measured withpigs and poultry. Anim. Prod. 48:157–179.
Hagemeier, D. L., G. W. Libal, and R. C. Wahlstrom. 1983. Effects ofexcess arginine on swine growth and plasma amino acid levels. J. Anim.Sci. 57:99–105.
Hahn, J. D., and D. H. Baker. 1995. Optimum ratio of lysine to threonine,tryptophan, and sulfur amino acids for finishing swine. J. Anim. Sci.73:482–489.
Hahn, J. D., R. R. Biehl, and D. H. Baker. 1995. Ideal digestible lysinelevel for early- and late-finishing swine. J. Anim. Sci. 73:773–784.
Hamilton, C. R., and T. L. Veum. 1986. Effect of biotin and(or) lysineadditions to corn-soybean meal diets on the performance and nutrientbalance of growing pigs. J. Anim. Sci. 62:155–162.
Han, Y., T. K. Chung, and D. H. Baker. 1993. Tryptophan requirement ofpigs in the weight category 10 to 20 kilograms. J. Anim. Sci. 71:139–143.
Hansen, J. A., J. L. Nelssen, R. D. Goodband, and J. L. Laurin. 1994.Interactive effects among porcine somatotropin, the beta-adrenergicagonist salbutamol, and dietary lysine on growth performance andnitrogen balance of finishing swine. J. Anim. Sci. 72:1540–1547.
Hays, V. W., G. C. Ashton, C. H. Liu, V. C. Speer, and D. V. Catron.1957. Studies on the utilization of urea by growing swine. J. Anim.Sci. 16:44–54.
Henry, Y., P. H. Due´e, and A. Re
´rat. 1976. Isoleucine requirement
of the growing pig and leucine-isoleucine interrelationship. J. Anim.Sci. 42:357–364.
Henry, Y., P. H. Due´e, A. Re
´rat, and R. Pion. 1986. Determination of
tryptophan requirement of growing pigs between 15 and 40 kg liveweight. Nutr. Rep. Int. 34:565–573.
Henry, Y., Y. Colleaux, and B. Se`ve. 1992a. Effects of dietary level of
lysine and of level and source of protein on feed intake, growth perfor-mance, and plasma amino acid pattern in the finishing pig. J. Anim.Sci. 70:188–195.
Henry, Y., B. Se`ve, Y. Colleaux, and P. Ganier, C. Saligaut, and P. Je
´go.
1992b. Interactive effects of dietary levels of tryptophan and proteinon voluntary feed intake and growth performance in pigs, in relationto plasma free amino acids and hypothalamic serotonin. J. Anim. Sci.70:1873–1887.
Hu¨hn, U., F. Kleemann, I. Ko
¨nig, and S. Poppe. 1973. Studies on the
sexual performance of male pigs fed rations of varying amino acidcomposition. 1. The influence of amino acid supply and intensity ofservice on some semen properties of young and old boars. Arch. Tier-zucht. 16:347–358.
Hu¨hn, U., S. Poppe, B. Numsen, I. Ko
¨nig, and F. Kleemann. 1974.
Investigations on the sexual productivity of male pigs fed varying levels
of amino acids in the ration. 2. Testicle condition, daily semen yieldand fertility performances of intensively used boars fed rations supple-mented with synthetic amino acids. Arch. Tierzucht. 17:259–268.
Izquierdo, O. A., K. J. Wedekind, and D. H. Baker. 1988. Histidinerequirement of the young pig. J. Anim. Sci. 66:2886–2892.
Johnston, M. E., J. L. Nelssen, R. D. Goodband, D. H. Kropf, R. H.Hines, and B. R. Schricker. 1993. The effects of porcine somatotropinand dietary lysine on growth performance and carcass characteristics offinishing swine fed to 105 or 127 kilograms. J. Anim. Sci. 71:2986–2995.
Ju, J. C., S. P. Cheng, and H. T. Yen. 1985. Effect of amino acid supple-mented diets on semen characters of boars. J. Chin. Soc. Anim. Sci.14(1–2):27–35.
Kemp, B., and L. A. Den Hartog. 1989. The influence of energy andprotein intake on the reproductive performance of the breeding boar:A review. Anim. Reprod. Sci. 20:103–115.
Kemp, B., H. J. G. Grooten, L. A. Den Hartog, P. Luiting, and M. W. A.Verstegen. 1988. The effect of a high protein intake on sperm produc-tion in boars at two semen collection frequencies. Anim. Reprod.Sci. 17:103–113.
Kiener, T., J. Lougnon, and J. C. Jugy. 1988. Contribution to the studyof the tryptophan requirement of the growing pig. Journ. Rech. PorcineFr. 20:401–407.
Kim, K. H., and S. J. Moon. 1990a. Effect of lysine levels on semenquality of boars. Korean J. Anim. Sci. 32:767–771.
Kim, K. H., and S. J. Moon. 1990b. Effect of methionine levels on semenquality of boars. Korean J. Anim. Sci. 32:800–804.
Kim, K. I., and H. S. Bayley. 1983. Amino acid oxidation by youngpigs receiving diets with varying levels of sulphur amino acids. Br. J.Nutr. 50:383–390.
Kirchgessner, V. M., and F. X. Roth. 1985. Biologische wirksamkeit vonDL-tryptophan bei mastschweinen. Z Tierphysiol. Tiererna
¨hr. Futter-
mittelkd. 54:135–141.Knabe, D. A., J. H. Brendemuhl, L. I. Chiba, and C. R. Dove. 1996.
Supplemental lysine for sows nursing large litters. J. Anim. Sci.74:1635–1640.
Kornegay, E. T., E. R. Miller, D. E. Ullrey, B. H. Vincent, and J. A.Hoefer. 1965. Influence of dietary urea on performance, antibodyproduction and hematology of growing swine. J. Anim. Sci. 24:951–954.
Kornegay, E. T., M. D. Lindemann, and V. Ravindran. 1993. Effects ofdietary lysine levels on performance and immune response of weanlingpigs housed at two floor space allowances. J. Anim. Sci. 71:552–556.
Kovar, J. L., A. J. Lewis, T. R. Radke, and P. S. Miller. 1993. Bioavailabilityof threonine in soybean meal for young pigs. J. Anim. Sci. 71:2133–2139.
Krick, B. J., R. D. Boyd, K. R. Roneker, D. H. Beermann, D. E. Bauman,D. A. Ross, and D. J. Meisinger. 1993. Porcine somatotropin affectsthe dietary lysine requirement and net lysine utilization for growingpigs. J. Nutr. 123:1913–1922.
Kuan, K. K., T. K. Mak, and D. J. Farrell. 1986. Effect of dietary energyconcentration, protein:energy and lysine:energy ratios on growth ofpigs in the humid tropics. Aust. J. Exp. Agric. 26:285–289.
Kyriazakis, I., G. C. Emmans, and R. McDaniel. 1993. Whole body aminoacid composition of the growing pig. J. Sci. Food Agric. 62:29–33.
Lacey, J.M., and D. W. Wilmore. 1990. Is glutamine a conditionallyessential amino acid? Nutr. Rev. 48:297–309.
Lawrence, B. V., O. Adeola, and T. R. Cline. 1994. Nitrogen utilizationand lean growth performance of 20- to 50-kilogram pigs fed dietsbalanced for lysine:energy ratio. J. Anim. Sci. 72:2887–2895.
Leibholz, J. 1988. Threonine supplementation of diets for pigs between7 and 56 days of age. Anim. Prod. 47:475–480.
Leibholz, J., and J. R. Parks. 1987. Lysine supplementation of diets forpigs between 7 and 56 days of age. Anim. Prod. 44:421–426.
Lenis, N. P., and J. T. M. van Diepen. 1990. Amino acid requirementsof pigs. 3. Requirement for apparent digestible threonine of pigs indifferent stages of growth. Neth. J. Agric. Sci. 38:609–622.
Proteins and Amino Acids 29
Lenis, N. P., J. T. M. van Diepen, and P. W. Goedhart. 1990. Aminoacid requirements of pigs. 1. Requirements for methionine ` cystine,threonine and tryptophan of fast-growing boars and gilts, fed ad libitum.Neth. J. Agric. Sci. 38:577–595.
Lepine, A. J., D. C. Mahan, and Y. K. Chung. 1991. Growth performanceof weanling pigs fed corn-soybean meal diets with or without driedwhey at various L-lysine•HCl levels. J. Anim. Sci.. 69:2026–2032.
Lewis, A. J., and H. S. Bayley. 1995. Amino acid bioavailability. Pp. 35–65in Bioavailability of Nutrients for Animals: Amino Acids, Minerals, andVitamins. Ammerman, C. B., D. H. Baker, and A. J. Lewis, eds. SanDiego, CA: Academic Press.
Lewis, A.J., and N. Nishimura. 1995. Valine requirement of the finishingpig. J. Anim. Sci. 73:2315–2318.
Lewis, A. J., and E. R. Peo, Jr. 1986. Threonine requirement of pigsweighing 5 to 15 kg. J. Anim. Sci. 62:1617–1623.
Lin, F. D., T. K. Smith, and H. S. Bayley. 1986a. Influence of dietarylysine concentration on the oxidation of an indicator amino acid bygrowing boars. J. Anim. Sci. 63:1179–1183.
Lin, F. D., T. K. Smith, and H. S. Bayley. 1986b. Tryptophan requirementof growing swine as determined by the oxidation of an indicator aminoacid. J. Anim. Sci. 63:467–471.
Louis, G. F., A. J. Lewis, W. C. Weldon, P. S. Miller, R. J. Kittok, andW. W. Stroup. 1994a. The effect of protein intake on boar libido, semencharacteristics, and plasma hormone concentrations. J. Anim. Sci.72:2038–2050.
Louis, G. F., A. J. Lewis, W. C. Weldon, P. M. Ermer, P. S. Miller, R. J.Kittok, and W. W. Stroup. 1994b. The effect of energy and proteinintakes on boar libido, semen characteristics, and plasma hormoneconcentrations. J. Anim. Sci. 72:2051–2060.
Lovett, T. D., M. T. Coffey, R. D. Miles, and G. E. Combs. 1986.Methionine, choline and sulfate interrelationships in the diet of wean-ling swine. J. Anim. Sci. 63:467–471.
Mahan, D. C., R. A. Easter, G. L. Cromwell, E. R. Miller, and T. L.Veum. 1993. Effect of dietary lysine levels formulated by altering theratio of corn-soybean meal with or without dried whey and L-lysine•HClin diets for weanling pigs. J. Anim. Sci. 71:1848–1852.
Martinez, G. M., and D. A. Knabe. 1990. Digestible lysine requirementof starter and grower pigs. J. Anim. Sci. 68:2748–2755.
McPhee, C. P., K. C. Williams, and L. J. Danials. 1991. The effectof selection for rapid lean growth on the dietary lysine and energyrequirements of pigs fed to scale. Livest. Prod. Sci. 27:185–198.
Meding, A. J. H., and H. E. Nielsen. 1977. Fortskellige proteinnormersindflydelse pa frugtbarheden hos orner, der anvendes til kunstig saer-doverforing. Statens Husdyrbrugsforog, Copenhagen, Denmark.
Mitchell, J. R., Jr., D. E. Baker, B. G. Harmon, H. W. Norton, andA. H. Jensen. 1968. Some amino acid needs of the young pig fed asemisynthetic diet. J. Anim. Sci. 27:1322–1326.
Mo¨hn, S., and A. Susenbeth. 1994. Tryptophan requirement of pigs
between 60 and 105 kg live weight. J. Anim. Physiol. Anim. Nutr.72:252–259.
Monegue, H. J., G. L. Cromwell, R. D. Coffey, S. D. Carter, and M.Cervantes. 1993. Elevated dietary lysine levels for sows nursing largelitters. J. Anim. Sci. 71(Suppl. 1):67 (Abstr.).
Mosˇkutelo, I. I. 1970. Different amounts of lysine for boars. Svinovodstvo
1:27–28. (Cited in Nutr. Abstr. Rev. 1970. 40:1478.)Murphy, J. M. 1992. Effects of Nutrition and Development on Proline
Metabolism in the Neonatal Piglet. M.S. Thesis. University of Guelph,Guelph, Ontario, Canada. December 1992.
Nam, D. S., and F. X. Aherne. 1994. The effects of lysine:energy ratioon the performance of weanling pigs. J. Anim. Sci. 72:1247–1256.
National Research Council. 1988. Nutrient Requirements of Swine. Ninthrevised ed. Washington, D.C.: National Academy Press. 93 pp.
Netesa, A., and A. Pashkevich. 1971. Effect of level of lysine in the dieton sperm production. Svinovodstvo 10:34. (Cited in Nutr. Abstr. Rev.1972. 42:769.)
Oestemer, G. A., L. E. Hanson, and R. J. Meade. 1973. Leucine-isoleucineinterrelationship in the young pig. J. Anim. Sci. 36:674–678.
Owen, K. Q., D. A. Knabe, K. G. Burgoon, and E. J. Gregg. 1994. Self-selection of diets and lysine requirements of growing-finishing swine.J. Anim. Sci. 72:554–564.
Owen, K. Q., J. L. Nelssen, R. D. Goodband, M. D. Tokach, L. J. Kats,and K. G. Friesen. 1995. Added dietary methionine in starter dietscontaining spray-dried blood products. J. Anim. Sci. 73:2647–2654.
Pashkevich, A. I. 1974. Changes in the reproductive function of boarsires under the effect of different conditions of lysine in rations. IzvTimiryazevsk-S-kh Akad. 4:180–187.
Pashkevich, A. I. 1976. Change in the reproductive function of stud boarswith different levels of lysine in the ration. Izv Timiryazevsk-S-khAkad. 2:168–175.
Pettigrew, J. E. 1993. Amino acid nutrition of gestating and lactatingsows. BioKyowa Technical Review—5. Chesterfield, MO: Nutri-Quest.
Poppe, S., U. Hu¨hn, F. Kleemann, and I. Ko
¨nig. 1974a. Studies on the
effect of diet on the production of sperms in young boars and boarsused for AI. 1. Effect of diet on the sperm production of boars usedfor AI. Arch. Tierernahr. 24:499–512.
Poppe, S., U. Hu¨hn, F. Kleemann, and I. Ko
¨nig. 1974b. Studies on the
effect of diet on the production of sperms in young boars and boarsused for AI. 2. Influence of nutrition upon the sperm production inyoung boars. Arch. Tierernahr. 24:551–565.
Poppe, S., U. Hu¨hn, F. Kleemann, and I. Ko
¨nig. 1974c. Studies on the
effect of diet on the production of sperms in young boars and boarsused for AI. 3. Influence of nutrition upon the sperm productionand service efficiency of boars used for artificial insemination. Arch.Tierernahr. 24:637–648.
Rao, D. S., and K. J. McCracken. 1990. Protein requirements of boarsof high genetic potential for lean growth. Anim. Prod. 51:179–187.
Reifsnyder, D. H., C. T. Young, and E. E. Jones. 1984. The use of lowprotein liquid diets to determine the methionine requirement and theefficacy of methionine hydroxy analogue for the three-week-old pig.J. Nutr. 114:1705–1715.
Robbins, K. R., and D. H. Baker. 1977. Phenylalanine requirement of theweanling pig and its relationship to tyrosine. J. Anim. Sci. 45:113–118.
Roth, F. X., and M. Kirchgessner. 1987. Biological efficiency of dietarymethionine or cystine supplementation with growing pigs: A contribu-tion to the requirement for S-containing amino acids. J. Anim. Physiol.Anim. Nutr. 58:267–280.
Roth, F. X., and M. Kirchgessner. 1989. Influence of the methionine:cys-tine relationship in the feed on the performance of growing pigs.J. Anim. Physiol. Anim. Nutr. 61:265–274.
Russell, L. E., R. A. Easter, V. Gomez-Rojas, G. L. Cromwell, and T. S.Stahly. 1986. A note on the supplementation of low-protein, maize-soya-bean meal diets with lysine, tryptophan, threonine and methioninefor growing pigs. Anim. Prod. 42:291–295.
Saldana, C. I., D. A. Knabe, K. Q. Owen, K. G. Burgoon, and E. J. Gregg.1994. Digestible threonine requirements of starter and finisher pigs.J. Anim. Sci. 72:144–150.
Sauber, T. E., T. S. Stahly, R. C. Ewan, and N. H. Williams. 1994.Interactive effects of sow genotype and dietary amino acid intake onlactational performance of sows nursing large litters. J. Anim. Sci.72(Suppl. 2):66 (Abstr.).
Sauer, W. C., and L. Ozimek. 1986. Digestibility of amino acids in swine:Results and their practical applications. A review. Livestock Prod.Sci. 15:367–388.
Schenck, B. C., T. S. Stahly, and G. L. Cromwell. 1992a. Interactiveeffects of thermal environment and dietary lysine and fat levels onrate, efficiency, and composition of growth of weanling pigs. J. Anim.Sci. 70:3791–3802.
Schenck, B. C., T. S. Stahly, and G. L. Cromwell. 1992b. Interactiveeffects of thermal environment and dietary amino acid and fat levels
30 Nutrient Requirements of Swine
on rate and efficiency of growth of pigs housed in a conventionalnursery. J. Anim. Sci. 70:3803–3811.
Schutte, J. B., E. J. Van Weerden, and F. Koch. 1988. Utilization of DL-and L-tryptophan in young pigs. Anim. Prod. 46:447–452.
Schutte, J. B., M. W. Bosch, N. P. Lenis, J. de Jong, and J. T. M. vanDiepen. 1990. Amino acid requirements of pigs. 2. Requirement forapparent digestible threonine of young pigs. Neth. J. Agric. Sci.38:597–607.
Se`ve, B., M. C. Meunier-Salau
¨n, M. Monnier, Y. Colle
´aux, and Y. Henry.
1991. Impact of dietary tryptophan and behavioral type on growthperformance and plasma amino acids of young pigs. J. Anim. Sci.69:3679–3688.
Shelton, D. C., W. M. Beeson, and E. T. Mertz. 1951. The effect ofmethionine and cystine on the growth of weanling pigs. J. Anim.Sci. 10:57–64.
Southern, L. L. 1991. Digestible Amino Acids and Digestible Amino AcidRequirements for Swine. BioKyowa Technical Review—2. Chester-field, MO: Nutri-Quest, Inc.
Southern, L. L., and D. H. Baker. 1982. Performance and concentrationof amino acids in plasma and urine of young pigs fed diets with excessesof either arginine or lysine. J. Anim. Sci. 55:857–866.
Southern, L. L., and D. H. Baker. 1983. Arginine requirement of theyoung pig. J. Anim. Sci. 57:402–412.
Stahly, T. S., G. L. Cromwell, and H. J. Monegue. 1990. Lactationalresponses of sows nursing large litters to dietary lysine levels. J. Anim.Sci. 68(Suppl. 1):369 (Abstr.).
Stahly, T. S., G. L. Cromwell, and H. J. Monegue. 1992. Milk yieldresponses of sows nursing large litters. J. Anim. Sci. 70(Suppl.1):238 (Abstr.).
Susenbeth, A., R. Schneider, and K. H. Menke. 1994. The effect ofprotein and lysine intake on growth and protein retention in pigs.J. Anim. Physiol. Anim. Nutr. 71:200–207.
Tanksley, T. D., Jr., and D. A. Knabe. 1984. Ileal digestibilities of aminoacids in pig feeds and their use in formulating diets. Pp. 75–95 inRecent Advances in Animal Nutrition, W. Haresign and D. J. A. Cole,eds. London: Butterworth.
Thaler, R. C., G. W. Libal, and R. C. Wahlstrom. 1986. Effect of lysinelevels in pig starter diets on performance to 20 kg and on subsequentperformance and carcass characteristics. J. Anim. Sci. 63:139–144.
Tomme´, M. F., and P. L. Loskutnikov. 1972. Effect of methionine level
in rations of adult breeding boars on metabolism and semen production.Dokl. Vses Ord. Lenina Akad. Skh. Nauk. 7:23–25. (Cited in Nutr.Abstr. Rev. 1973. 43:261.)
Uzu, G. 1979. Influence of protein feeding on the reproductive perfor-mance of 30 to 90 kg young boars. Ann. Zootech. 28:431–441.
Van de Kerk, P., and C. M. T. Willems. 1985. The influence of crudeprotein, lysine and methionine ` cystine on the fertility of boars. Z.Tierphysiol. Tierernaehrg. Futtermittelkde 53:43–49.
Weaver, E. M., B. S. Borg, G. W. Libal, and R. C. Wahlstrom. 1988.Effect of lysine levels in starter diets on subsequent performance andcarcass characteristics of growing-finishing pigs. J. Anim. Sci. 66(Suppl.1):314 (Abstr.).
Wehrbein, G. F., P. E. Vipperman, Jr., E. R. Peo, Jr., and P. J. Cunning-ham. 1970. Diammonium citrate and diammonium phosphate assources of dietary nitrogen for growing-finishing swine. J. Anim. Sci.31:327–332.
Williams, A. P. 1994. Recent developments in amino acid analysis. Pp.11–36 in Amino Acids in Farm Animal Nutrition. Wallingford, U.K.:CAB International.
Wu, G., and D. A. Knabe. 1995. Arginine synthesis in enterocytes ofneonatal pigs. Am. J. Physiol. 269:R621–R629.
Wu, G., S. A. Meier, and D. A. Knabe. 1996. Dietary glutamine supple-mentation prevents jejunal atrophy in weaned pigs. J. Nutr.126:2578–2584.
Yen, H. T., and I. T. Yu. 1985. Influence of digestible energy and proteinfeeding on semen characteristics of breeding boars. In: Efficient AnimalProduction for Asian Welfare. Proc. 3rd AAAP Animal Science Con-gress, Seoul, South Korea, 2:610–612.
Yen, H. T., D. J. A. Cole, and D. Lewis. 1986a. Amino acid requirementsof growing pigs. 7. The response of pigs from 25 to 55 kg live weightto dietary ideal protein. Anim. Prod. 43:141–154.
Yen, H. T., D. J. A. Cole, and D. Lewis. 1986b. Amino acid requirementsof growing pigs. 8. The response of pigs from 50 to 90 kg live weightto dietary ideal protein. Anim. Prod. 43:155–165.
Zaripova, L., and Sh. Shakirov. 1978. Fodder lysine and methionine indiets for boars. Svinovodstvo 5:14–15. (Cited in Nutr. Abstr. Rev.,Series B 48:644.)
Zimmerman, D. R. 1987. Threonine requirement of finishing pigs.J. Anim. Sci. 65(Suppl. 1):130 (Abstr.).
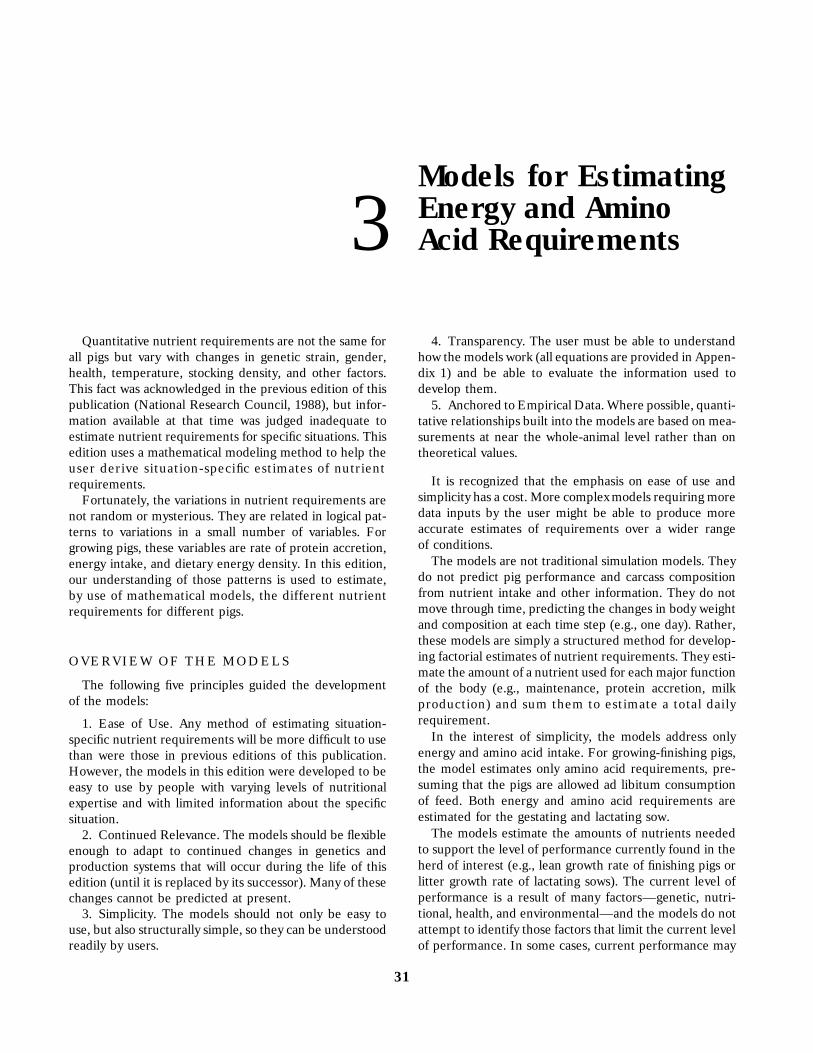
Models for EstimatingEnergy and Amino3 Acid Requirements
Quantitative nutrient requirements are not the same forall pigs but vary with changes in genetic strain, gender,health, temperature, stocking density, and other factors.This fact was acknowledged in the previous edition of thispublication (National Research Council, 1988), but infor-mation available at that time was judged inadequate toestimate nutrient requirements for specific situations. Thisedition uses a mathematical modeling method to help theuser derive situation-specific estimates of nutrientrequirements.
Fortunately, the variations in nutrient requirements arenot random or mysterious. They are related in logical pat-terns to variations in a small number of variables. Forgrowing pigs, these variables are rate of protein accretion,energy intake, and dietary energy density. In this edition,our understanding of those patterns is used to estimate,by use of mathematical models, the different nutrientrequirements for different pigs.
O VE RV I EW OF T HE MO D EL S
The following five principles guided the developmentof the models:
1. Ease of Use. Any method of estimating situation-specific nutrient requirements will be more difficult to usethan were those in previous editions of this publication.However, the models in this edition were developed to beeasy to use by people with varying levels of nutritionalexpertise and with limited information about the specificsituation.
2. Continued Relevance. The models should be flexibleenough to adapt to continued changes in genetics andproduction systems that will occur during the life of thisedition (until it is replaced by its successor). Many of thesechanges cannot be predicted at present.
3. Simplicity. The models should not only be easy touse, but also structurally simple, so they can be understoodreadily by users.
31
4. Transparency. The user must be able to understandhow the models work (all equations are provided in Appen-dix 1) and be able to evaluate the information used todevelop them.
5. Anchored to Empirical Data. Where possible, quanti-tative relationships built into the models are based on mea-surements at near the whole-animal level rather than ontheoretical values.
It is recognized that the emphasis on ease of use andsimplicity has a cost. More complex models requiring moredata inputs by the user might be able to produce moreaccurate estimates of requirements over a wider rangeof conditions.
The models are not traditional simulation models. Theydo not predict pig performance and carcass compositionfrom nutrient intake and other information. They do notmove through time, predicting the changes in body weightand composition at each time step (e.g., one day). Rather,these models are simply a structured method for develop-ing factorial estimates of nutrient requirements. They esti-mate the amount of a nutrient used for each major functionof the body (e.g., maintenance, protein accretion, milkproduction) and sum them to estimate a total dailyrequirement.
In the interest of simplicity, the models address onlyenergy and amino acid intake. For growing-finishing pigs,the model estimates only amino acid requirements, pre-suming that the pigs are allowed ad libitum consumptionof feed. Both energy and amino acid requirements areestimated for the gestating and lactating sow.
The models estimate the amounts of nutrients neededto support the level of performance currently found in theherd of interest (e.g., lean growth rate of finishing pigs orlitter growth rate of lactating sows). The current level ofperformance is a result of many factors—genetic, nutri-tional, health, and environmental—and the models do notattempt to identify those factors that limit the current levelof performance. In some cases, current performance may
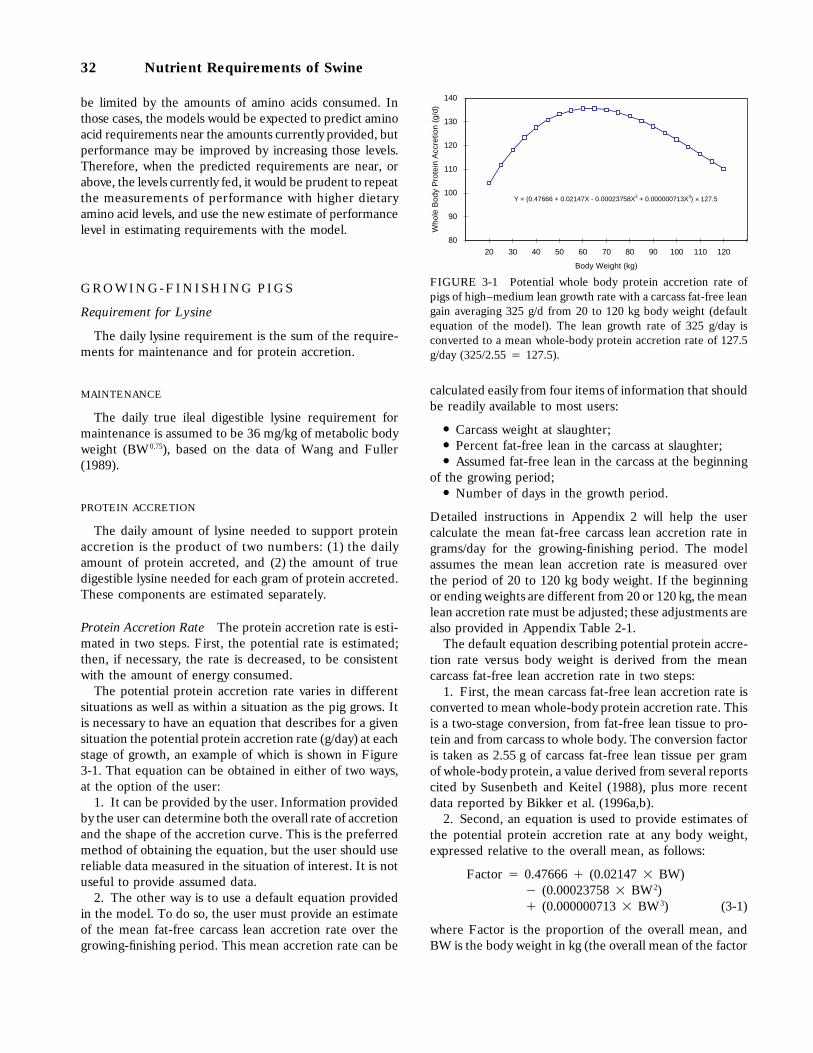
32 Nutrient Requirements of Swine
be limited by the amounts of amino acids consumed. Inthose cases, the models would be expected to predict aminoacid requirements near the amounts currently provided, butperformance may be improved by increasing those levels.Therefore, when the predicted requirements are near, orabove, the levels currently fed, it would be prudent to repeatthe measurements of performance with higher dietaryamino acid levels, and use the new estimate of performancelevel in estimating requirements with the model.
G RO WI N G- FI N IS HI N G P IG S
Requirement for Lysine
The daily lysine requirement is the sum of the require-ments for maintenance and for protein accretion.
MAINTENANCE
The daily true ileal digestible lysine requirement formaintenance is assumed to be 36 mg/kg of metabolic bodyweight (BW0.75), based on the data of Wang and Fuller(1989).
PROTEIN ACCRETION
The daily amount of lysine needed to support proteinaccretion is the product of two numbers: (1) the dailyamount of protein accreted, and (2) the amount of truedigestible lysine needed for each gram of protein accreted.These components are estimated separately.
Protein Accretion Rate The protein accretion rate is esti-mated in two steps. First, the potential rate is estimated;then, if necessary, the rate is decreased, to be consistentwith the amount of energy consumed.
The potential protein accretion rate varies in differentsituations as well as within a situation as the pig grows. Itis necessary to have an equation that describes for a givensituation the potential protein accretion rate (g/day) at eachstage of growth, an example of which is shown in Figure3-1. That equation can be obtained in either of two ways,at the option of the user:
1. It can be provided by the user. Information providedby the user can determine both the overall rate of accretionand the shape of the accretion curve. This is the preferredmethod of obtaining the equation, but the user should usereliable data measured in the situation of interest. It is notuseful to provide assumed data.
2. The other way is to use a default equation providedin the model. To do so, the user must provide an estimateof the mean fat-free carcass lean accretion rate over thegrowing-finishing period. This mean accretion rate can be
80
90
100
110
120
130
140
10 20 30 40 50 60 70 80 90 100 110 120 130
Body Weight (kg)
Who
le B
ody
Pro
tein
Acc
retio
n (g
/d)
Y = (0.47666 + 0.02147X - 0.00023758X2 + 0.000000713X3) × 127.5
FIGURE 3-1 Potential whole body protein accretion rate ofpigs of high–medium lean growth rate with a carcass fat-free leangain averaging 325 g/d from 20 to 120 kg body weight (defaultequation of the model). The lean growth rate of 325 g/day isconverted to a mean whole-body protein accretion rate of 127.5g/day (325/2.55 4 127.5).
calculated easily from four items of information that shouldbe readily available to most users:
● Carcass weight at slaughter;● Percent fat-free lean in the carcass at slaughter;● Assumed fat-free lean in the carcass at the beginning
of the growing period;● Number of days in the growth period.
Detailed instructions in Appendix 2 will help the usercalculate the mean fat-free carcass lean accretion rate ingrams/day for the growing-finishing period. The modelassumes the mean lean accretion rate is measured overthe period of 20 to 120 kg body weight. If the beginningor ending weights are different from 20 or 120 kg, the meanlean accretion rate must be adjusted; these adjustments arealso provided in Appendix Table 2-1.
The default equation describing potential protein accre-tion rate versus body weight is derived from the meancarcass fat-free lean accretion rate in two steps:
1. First, the mean carcass fat-free lean accretion rate isconverted to mean whole-body protein accretion rate. Thisis a two-stage conversion, from fat-free lean tissue to pro-tein and from carcass to whole body. The conversion factoris taken as 2.55 g of carcass fat-free lean tissue per gramof whole-body protein, a value derived from several reportscited by Susenbeth and Keitel (1988), plus more recentdata reported by Bikker et al. (1996a,b).
2. Second, an equation is used to provide estimates ofthe potential protein accretion rate at any body weight,expressed relative to the overall mean, as follows:
Factor 4 0.47666 ` (0.02147 2 BW)1 (0.00023758 2 BW2)` (0.000000713 2 BW3) (3-1)
where Factor is the proportion of the overall mean, andBW is the body weight in kg (the overall mean of the factor

Models for Energy and Amino Acid Requirements 33
is 1.0). The potential protein accretion rate at a given bodyweight is then determined by multiplying the overall meanfor protein accretion rate by the factor. Similarly, the leangain at a given body weight can also be determined bymultiplying the overall mean lean growth rate by the factor.
This equation was proposed as a compromise betweenwidely varying shapes of protein accretion curves versusbody weight. When the performance of the entire modelin estimating lysine requirements was subsequently evalu-ated, this equation proved to be satisfactory and was clearlysuperior to the others tested, at least as a component ofthis model. This is the equation shown in graphic form inFigure 3-1. This approach simply moves the regressioncurves up or down with variation in overall lean accretionrate, keeping the shape of the curves constant, as shownin Figure 3-2.
As discussed previously, the user may provide an accre-tion curve for carcass lean or whole body protein, whichis different than the model’s default curve. An aid fordeveloping different curves is shown in the Appendix(Appendix 3).
To this point, an equation describing protein accretionrate versus body weight is provided, either by the user orby the default equation within the model using the meancarcass fat-free lean accretion rate provided by the user.Then the user simply enters the weight of the pigs whoserequirements are to be estimated. The model calculatesfrom the equation the potential protein accretion rate atthe body weight indicated.
The model tests whether the energy intake is adequateto support the potential rate of protein accretion. Theamount of energy (or feed) consumed in the specific situa-tion and at the body weight of interest is determined ineither of two ways:
1. It can be provided by the user. This is the preferredmethod, but the energy (or feed) intake data should be
80
90
100
110
120
130
140
150
10 20 30 40 50 60 70 80 90 100 110 120 130
Body Weight (kg)
Who
le B
ody
Pro
tein
Acc
retio
n (g
/d)
350 g/d
325 g/d
300 g/d
CarcassFat-Free Lean Gain
FIGURE 3-2 Potential whole body protein accretion rates ofpigs of medium, high–medium, and high lean growth rates withcarcass fat-free lean gains averaging 300, 325, and 350 g/day from20 to 120 kg body weight (default equation of the model).
derived in the situation of interest. It is not useful to provideassumed or desired rates of intake.
2. A default equation describing DE intake at each bodyweight is provided in the model. It is patterned after theequation presented by National Research Council (1986),but modified to account for recent empirical data suggest-ing greater feed intake during the early growth period andslightly decreased feed intake during late finishing. Themodified equation produces estimates of total dietary lysinerequirements, on a percentage basis, that are in generalagreement with recent empirical data summarized in Table2-2 assuming a mean fat-free carcass lean growth rate of325 g/day. The equation for a combination of barrows andgilts is:
DE intake (kcal/day)4 1,250 ` (188 2 BW) 1 (1.4 2 BW2)
` (0.0044 2 BW3) (3-2)
This equation is modified for either barrows or gilts byapplying the following adjustment, which is added to theDE intake for barrows or subtracted for gilts:
Adjustment (kcal/day)4 DEI 2 (10.083 ` (0.00385 2 BW)
1 (0.0000235 2 BW2)) (3-3)
where DEI is DE intake (kcal/day) calculated from Equa-tion 3-2. Equation 3-3, a modification of a NationalResearch Council (1986) equation, results in a differenceof approximately 0.1 percentage point in the total lysinerequirement between finishing barrows and gilts (seeChapter 10, Table 10-3), as suggested by the studies ofCromwell et al. (1993) and Hahn et al. (1995). The shapeof the DE intake curves for barrows, gilts, and a 1:1 ratiofor the two genders is shown in Figure 3-3.
There are also adjustments in predicted DE intake forvariations in ambient temperature and in stocking density(space/pig), as in the system presented originally byNational Research Council (1986).
4000
5000
6000
7000
8000
9000
10000
11000
12000
13000
10 20 30 40 50 60 70 80 90 100 110 120 130
Body Weight (kg)
Dai
ly D
E In
take
(kc
al)
Barrow
Mixed
Gilt
Gender
FIGURE 3-3 Estimated daily digestible energy (DE) intakesof barrows, gilts, and a 1:1 ratio of barrows to gilts consumingfeed on an ad libitum basis from 20 to 120 kg body weight (defaultequation of the model).
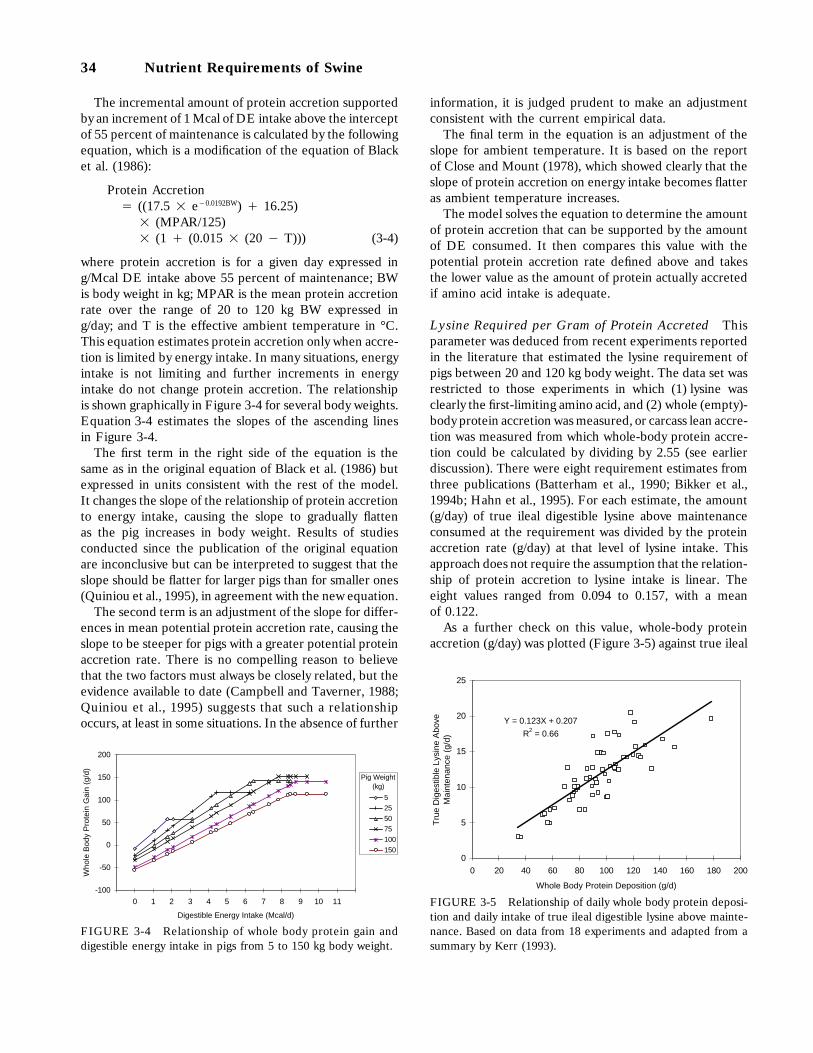
34 Nutrient Requirements of Swine
The incremental amount of protein accretion supportedby an increment of 1 Mcal of DE intake above the interceptof 55 percent of maintenance is calculated by the followingequation, which is a modification of the equation of Blacket al. (1986):
Protein Accretion4 ((17.5 2 e10.0192BW) ` 16.25)
2 (MPAR/125)2 (1 ` (0.015 2 (20 1 T))) (3-4)
where protein accretion is for a given day expressed ing/Mcal DE intake above 55 percent of maintenance; BWis body weight in kg; MPAR is the mean protein accretionrate over the range of 20 to 120 kg BW expressed ing/day; and T is the effective ambient temperature in °C.This equation estimates protein accretion only when accre-tion is limited by energy intake. In many situations, energyintake is not limiting and further increments in energyintake do not change protein accretion. The relationshipis shown graphically in Figure 3-4 for several body weights.Equation 3-4 estimates the slopes of the ascending linesin Figure 3-4.
The first term in the right side of the equation is thesame as in the original equation of Black et al. (1986) butexpressed in units consistent with the rest of the model.It changes the slope of the relationship of protein accretionto energy intake, causing the slope to gradually flattenas the pig increases in body weight. Results of studiesconducted since the publication of the original equationare inconclusive but can be interpreted to suggest that theslope should be flatter for larger pigs than for smaller ones(Quiniou et al., 1995), in agreement with the new equation.
The second term is an adjustment of the slope for differ-ences in mean potential protein accretion rate, causing theslope to be steeper for pigs with a greater potential proteinaccretion rate. There is no compelling reason to believethat the two factors must always be closely related, but theevidence available to date (Campbell and Taverner, 1988;Quiniou et al., 1995) suggests that such a relationshipoccurs, at least in some situations. In the absence of further
-100
-50
0
50
100
150
200
-1 0 1 2 3 4 5 6 7 8 9 10 11 12
Digestible Energy Intake (Mcal/d)
Who
le B
ody
Pro
tein
Gai
n (g
/d)
5
25
50
75
100
150
Pig Weight (kg)
FIGURE 3-4 Relationship of whole body protein gain anddigestible energy intake in pigs from 5 to 150 kg body weight.
information, it is judged prudent to make an adjustmentconsistent with the current empirical data.
The final term in the equation is an adjustment of theslope for ambient temperature. It is based on the reportof Close and Mount (1978), which showed clearly that theslope of protein accretion on energy intake becomes flatteras ambient temperature increases.
The model solves the equation to determine the amountof protein accretion that can be supported by the amountof DE consumed. It then compares this value with thepotential protein accretion rate defined above and takesthe lower value as the amount of protein actually accretedif amino acid intake is adequate.
Lysine Required per Gram of Protein Accreted Thisparameter was deduced from recent experiments reportedin the literature that estimated the lysine requirement ofpigs between 20 and 120 kg body weight. The data set wasrestricted to those experiments in which (1) lysine wasclearly the first-limiting amino acid, and (2) whole (empty)-body protein accretion was measured, or carcass lean accre-tion was measured from which whole-body protein accre-tion could be calculated by dividing by 2.55 (see earlierdiscussion). There were eight requirement estimates fromthree publications (Batterham et al., 1990; Bikker et al.,1994b; Hahn et al., 1995). For each estimate, the amount(g/day) of true ileal digestible lysine above maintenanceconsumed at the requirement was divided by the proteinaccretion rate (g/day) at that level of lysine intake. Thisapproach does not require the assumption that the relation-ship of protein accretion to lysine intake is linear. Theeight values ranged from 0.094 to 0.157, with a meanof 0.122.
As a further check on this value, whole-body proteinaccretion (g/day) was plotted (Figure 3-5) against true ileal
Y = 0.123X + 0.207
R2 = 0.66
0
5
10
15
20
25
0 20 40 60 80 100 120 140 160 180 200
Whole Body Protein Deposition (g/d)
Tru
e D
iges
tible
Lys
ine
Abo
veM
aint
enan
ce (
g/d)
FIGURE 3-5 Relationship of daily whole body protein deposi-tion and daily intake of true ileal digestible lysine above mainte-nance. Based on data from 18 experiments and adapted from asummary by Kerr (1993).
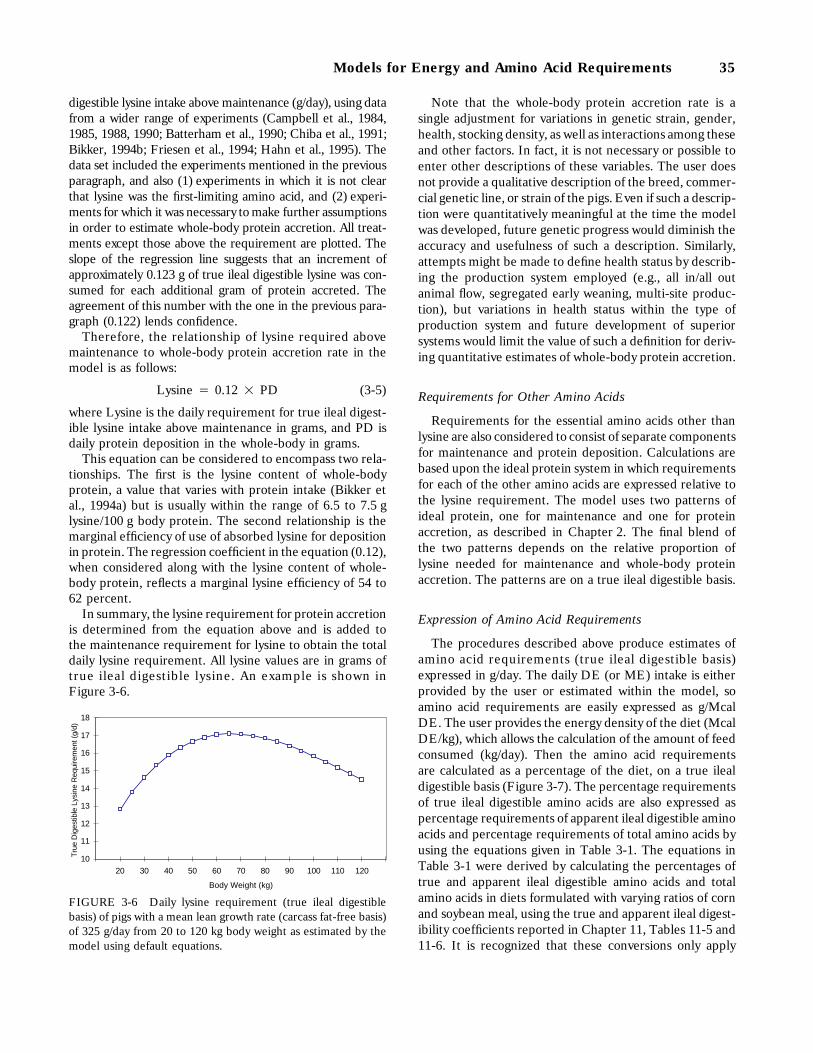
Models for Energy and Amino Acid Requirements 35
digestible lysine intake above maintenance (g/day), using datafrom a wider range of experiments (Campbell et al., 1984,1985, 1988, 1990; Batterham et al., 1990; Chiba et al., 1991;Bikker, 1994b; Friesen et al., 1994; Hahn et al., 1995). Thedata set included the experiments mentioned in the previousparagraph, and also (1) experiments in which it is not clearthat lysine was the first-limiting amino acid, and (2) experi-ments for which it was necessary to make further assumptionsin order to estimate whole-body protein accretion. All treat-ments except those above the requirement are plotted. Theslope of the regression line suggests that an increment ofapproximately 0.123 g of true ileal digestible lysine was con-sumed for each additional gram of protein accreted. Theagreement of this number with the one in the previous para-graph (0.122) lends confidence.
Therefore, the relationship of lysine required abovemaintenance to whole-body protein accretion rate in themodel is as follows:
Lysine 4 0.12 2 PD (3-5)
where Lysine is the daily requirement for true ileal digest-ible lysine intake above maintenance in grams, and PD isdaily protein deposition in the whole-body in grams.
This equation can be considered to encompass two rela-tionships. The first is the lysine content of whole-bodyprotein, a value that varies with protein intake (Bikker etal., 1994a) but is usually within the range of 6.5 to 7.5 glysine/100 g body protein. The second relationship is themarginal efficiency of use of absorbed lysine for depositionin protein. The regression coefficient in the equation (0.12),when considered along with the lysine content of whole-body protein, reflects a marginal lysine efficiency of 54 to62 percent.
In summary, the lysine requirement for protein accretionis determined from the equation above and is added tothe maintenance requirement for lysine to obtain the totaldaily lysine requirement. All lysine values are in grams oftrue ileal digestible lysine. An example is shown inFigure 3-6.
10
11
12
13
14
15
16
17
18
10 20 30 40 50 60 70 80 90 100 110 120 130
Body Weight (kg)
Tru
e D
iges
tible
Lys
ine
Req
uire
men
t (g/
d)
FIGURE 3-6 Daily lysine requirement (true ileal digestiblebasis) of pigs with a mean lean growth rate (carcass fat-free basis)of 325 g/day from 20 to 120 kg body weight as estimated by themodel using default equations.
Note that the whole-body protein accretion rate is asingle adjustment for variations in genetic strain, gender,health, stocking density, as well as interactions among theseand other factors. In fact, it is not necessary or possible toenter other descriptions of these variables. The user doesnot provide a qualitative description of the breed, commer-cial genetic line, or strain of the pigs. Even if such a descrip-tion were quantitatively meaningful at the time the modelwas developed, future genetic progress would diminish theaccuracy and usefulness of such a description. Similarly,attempts might be made to define health status by describ-ing the production system employed (e.g., all in/all outanimal flow, segregated early weaning, multi-site produc-tion), but variations in health status within the type ofproduction system and future development of superiorsystems would limit the value of such a definition for deriv-ing quantitative estimates of whole-body protein accretion.
Requirements for Other Amino Acids
Requirements for the essential amino acids other thanlysine are also considered to consist of separate componentsfor maintenance and protein deposition. Calculations arebased upon the ideal protein system in which requirementsfor each of the other amino acids are expressed relative tothe lysine requirement. The model uses two patterns ofideal protein, one for maintenance and one for proteinaccretion, as described in Chapter 2. The final blend ofthe two patterns depends on the relative proportion oflysine needed for maintenance and whole-body proteinaccretion. The patterns are on a true ileal digestible basis.
Expression of Amino Acid Requirements
The procedures described above produce estimates ofamino acid requirements (true ileal digestible basis)expressed in g/day. The daily DE (or ME) intake is eitherprovided by the user or estimated within the model, soamino acid requirements are easily expressed as g/McalDE. The user provides the energy density of the diet (McalDE/kg), which allows the calculation of the amount of feedconsumed (kg/day). Then the amino acid requirementsare calculated as a percentage of the diet, on a true ilealdigestible basis (Figure 3-7). The percentage requirementsof true ileal digestible amino acids are also expressed aspercentage requirements of apparent ileal digestible aminoacids and percentage requirements of total amino acids byusing the equations given in Table 3-1. The equations inTable 3-1 were derived by calculating the percentages oftrue and apparent ileal digestible amino acids and totalamino acids in diets formulated with varying ratios of cornand soybean meal, using the true and apparent ileal digest-ibility coefficients reported in Chapter 11, Tables 11-5 and11-6. It is recognized that these conversions only apply

36 Nutrient Requirements of Swine
0.4
0.5
0.6
0.7
0.8
0.9
1.0
1.1
10 20 30 40 50 60 70 80 90 100 110 120 13
Body Weight (kg)
Tru
e D
iges
tible
Lys
ine
Req
uire
men
t (%
)
FIGURE 3-7 Dietary lysine requirement (%, true ileal digest-ible basis) of pigs with a mean lean growth rate (carcass fat-freebasis) of 325 g/day from 20 to 120 kg body weight as estimatedby the model using default equations.
TABLE 3-1 Equations for Converting Percentages of Amino Acids from a True IlealDigestible Basis to an Apparent Ileal Digestible Basis, from an Apparent Ileal DigestibleBasis to a True Ileal Digestible Basis, and from a True or Apparent Ileal Digestible Basisto a Total Basis in a Corn–Soybean Meal Dieta
True to Apparentb Apparent to Truec
a b a b
Arginine 10.0089 0.9602 0.0092 1.0414Histidine 10.0006 0.9456 0.0006 1.0576Isoleucine 10.0097 0.9490 0.0103 1.0537Leucine 0.0157 0.9389 10.0167 1.0651Lysine 10.0210 0.9524 0.0221 1.0500Methionine 0.0021 0.9415 10.0022 1.0621Cystine 10.0002 0.9084 0.0003 1.1008Methionine ` Cystine 0.0018 0.9246 10.0020 1.0816Phenylalanine 10.0089 0.9481 0.0093 1.0548Tyrosine 10.0030 0.9463 0.0031 1.0567Phenylalanine ` Tyrosine 10.0118 0.9473 0.0124 1.0556Threonine 10.0150 0.9061 0.0165 1.1036Tryptophan 10.0074 0.9130 0.0081 1.0953Valine 10.0049 0.9230 0.0054 1.0834
True to Totald Apparent to Totale
a b a b
Arginine 0.0213 1.0571 0.0311 1.1009Histidine 0.0119 1.0884 0.0126 1.1511Isoleucine 0.0070 1.1198 0.0180 1.1800Leucine 10.0452 1.1378 10.0641 1.2119Lysine 0.0365 1.0973 0.0607 1.1522Methionine 0.0024 1.0948 0.0000 1.1628Cystine 0.0029 1.1447 0.0031 1.2603Methionine ` Cystine 0.0053 1.1205 0.0031 1.2119Phenylalanine 10.0051 1.1261 0.0054 1.1877Tyrosine 0.0031 1.1091 0.0066 1.1721Phenylalanine ` Tyrosine 10.0015 1.1186 0.0124 1.1808Threonine 0.0191 1.1373 0.0379 1.2551Tryptophan 0.0043 1.1036 0.0132 1.2088Valine 0.0052 1.1337 0.0113 1.2283
aAlthough linear relationships are indicated, the actual relationships are more complex.bFrom true to apparent ileal digestible amino acids: apparent, % 4 a ` (b 2 true, %).cFrom apparent to true ileal digestible amino acids: true, % 4 a ` (b 2 apparent, %).dFrom true ileal digestible amino acids to total amino acids: total, % 4 a ` (b 2 true, %).eFrom apparent ileal digestible amino acids to total amino acids: total, % 4 a ` (b 2 apparent, %).
to corn–soybean meal diets, which emphasize the need toformulate on a true ileal digestible basis for diets thatcontain other ingredients.
The total lysine requirements, expressed as a percent ofthe diet, generated by the model for pigs with average,medium–high, and high lean growth rates (carcass fat-freelean accretion rates of 300, 325, and 350 g/day, respec-tively) over the range of 20 to 120 kg body weight areshown in Figure 3-8.
G ES TA T IN G S O WS
Nutrient restriction is used to control weight gain insows (see discussion in Chapter 1). The model for gestating
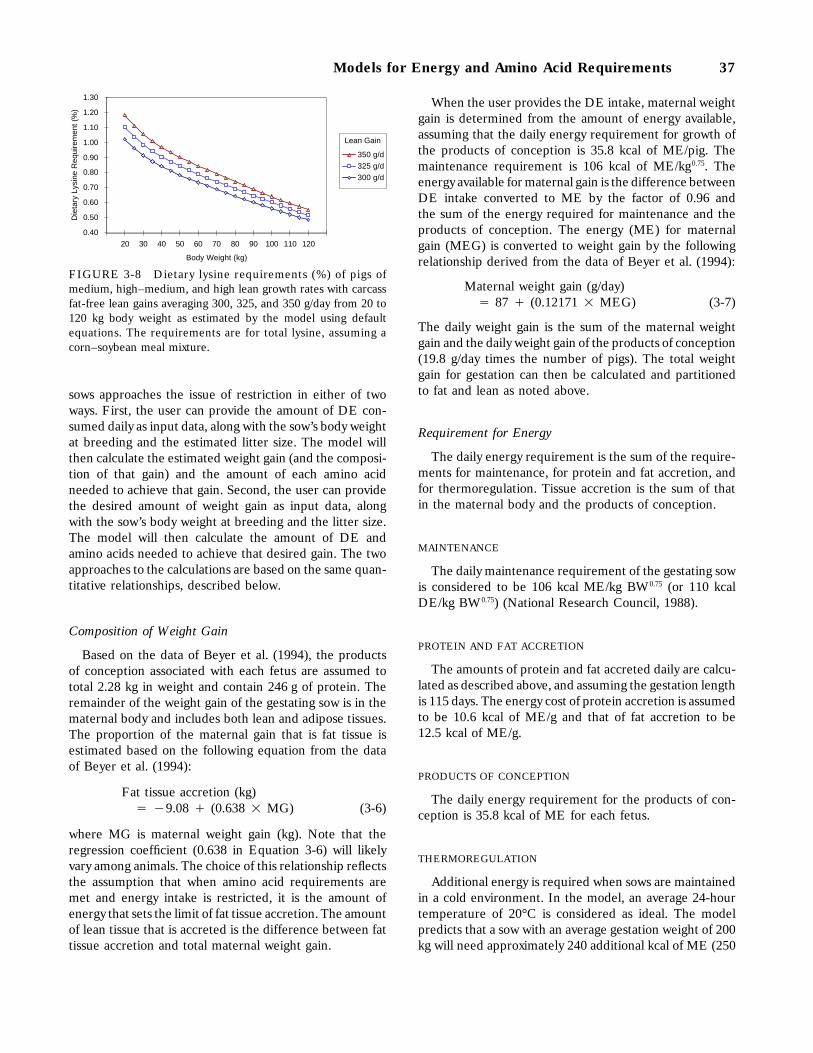
Models for Energy and Amino Acid Requirements 37
0.40
0.50
0.60
0.70
0.80
0.90
1.00
1.10
1.20
1.30
10 20 30 40 50 60 70 80 90 100 110 120 130
Body Weight (kg)
Die
tary
Lys
ine
Req
uire
men
t (%
)
350 g/d
325 g/d
300 g/d
Lean Gain
FIGURE 3-8 Dietary lysine requirements (%) of pigs ofmedium, high–medium, and high lean growth rates with carcassfat-free lean gains averaging 300, 325, and 350 g/day from 20 to120 kg body weight as estimated by the model using defaultequations. The requirements are for total lysine, assuming acorn–soybean meal mixture.
sows approaches the issue of restriction in either of twoways. First, the user can provide the amount of DE con-sumed daily as input data, along with the sow’s body weightat breeding and the estimated litter size. The model willthen calculate the estimated weight gain (and the composi-tion of that gain) and the amount of each amino acidneeded to achieve that gain. Second, the user can providethe desired amount of weight gain as input data, alongwith the sow’s body weight at breeding and the litter size.The model will then calculate the amount of DE andamino acids needed to achieve that desired gain. The twoapproaches to the calculations are based on the same quan-titative relationships, described below.
Composition of Weight Gain
Based on the data of Beyer et al. (1994), the productsof conception associated with each fetus are assumed tototal 2.28 kg in weight and contain 246 g of protein. Theremainder of the weight gain of the gestating sow is in thematernal body and includes both lean and adipose tissues.The proportion of the maternal gain that is fat tissue isestimated based on the following equation from the dataof Beyer et al. (1994):
Fat tissue accretion (kg)4 19.08 ` (0.638 2 MG) (3-6)
where MG is maternal weight gain (kg). Note that theregression coefficient (0.638 in Equation 3-6) will likelyvary among animals. The choice of this relationship reflectsthe assumption that when amino acid requirements aremet and energy intake is restricted, it is the amount ofenergy that sets the limit of fat tissue accretion. The amountof lean tissue that is accreted is the difference between fattissue accretion and total maternal weight gain.
When the user provides the DE intake, maternal weightgain is determined from the amount of energy available,assuming that the daily energy requirement for growth ofthe products of conception is 35.8 kcal of ME/pig. Themaintenance requirement is 106 kcal of ME/kg0.75. Theenergy available for maternal gain is the difference betweenDE intake converted to ME by the factor of 0.96 andthe sum of the energy required for maintenance and theproducts of conception. The energy (ME) for maternalgain (MEG) is converted to weight gain by the followingrelationship derived from the data of Beyer et al. (1994):
Maternal weight gain (g/day)4 87 ` (0.12171 2 MEG) (3-7)
The daily weight gain is the sum of the maternal weightgain and the daily weight gain of the products of conception(19.8 g/day times the number of pigs). The total weightgain for gestation can then be calculated and partitionedto fat and lean as noted above.
Requirement for Energy
The daily energy requirement is the sum of the require-ments for maintenance, for protein and fat accretion, andfor thermoregulation. Tissue accretion is the sum of thatin the maternal body and the products of conception.
MAINTENANCE
The daily maintenance requirement of the gestating sowis considered to be 106 kcal ME/kg BW0.75 (or 110 kcalDE/kg BW0.75) (National Research Council, 1988).
PROTEIN AND FAT ACCRETION
The amounts of protein and fat accreted daily are calcu-lated as described above, and assuming the gestation lengthis 115 days. The energy cost of protein accretion is assumedto be 10.6 kcal of ME/g and that of fat accretion to be12.5 kcal of ME/g.
PRODUCTS OF CONCEPTION
The daily energy requirement for the products of con-ception is 35.8 kcal of ME for each fetus.
THERMOREGULATION
Additional energy is required when sows are maintainedin a cold environment. In the model, an average 24-hourtemperature of 20°C is considered as ideal. The modelpredicts that a sow with an average gestation weight of 200kg will need approximately 240 additional kcal of ME (250
38 Nutrient Requirements of Swine
kcal of DE) per day for each 1°C below 20°C. No adjust-ment is made for temperatures above 20°C.
The total daily requirement for ME is the sum of therequirements for maintenance, for tissue accretion, for theproducts of conception, and for thermoregulation. Therequirement for DE is the requirement for ME/0.96.
Requirement for Lysine
MAINTENANCE
The daily maintenance requirement for true ileal digest-ible lysine is considered to be 36 mg/kg BW0.75, as forgrowing pigs.
PROTEIN ACCRETION
The daily nitrogen retention is calculated as the sum ofmaternal protein gain divided by 6.25, and the nitrogenaccretion in the products of conception. Regression analysisof the data of King and Brown (1993) shows the truedigestible requirement above maintenance for gestatingsows to be 0.807 g of lysine/g of nitrogen retained, assumingthe true digestibility values shown in Table 11-6 for theingredients used in the experimental diets (wheat, skimmilk powder, and soybean meal). If this parameter isexpressed as grams of true ileal digestible lysine abovemaintenance per gram of accreted protein, the value is0.129 (0.807/6.25 4 0.129). This value is similar to thecorresponding value of 0.12 used in the growth model (seeEquation 3-5). The good agreement lends confidence inboth parameters. It was suggested in an earlier review(Pettigrew, 1993), based largely on requirement estimatesof the National Research Council (1988), that threoninewas likely the first-limiting amino acid in the diets used byKing and Brown (1993). However, more recent calculationsof the Pettigrew (1993) data produced estimates that sug-gest lysine and threonine are virtually co-limiting in thesediets. Thus, it is considered appropriate to treat theresponse as though lysine were limiting.
The total daily requirement for lysine is the sum of therequirements for maintenance and for protein accretion.
Requirements for Other Amino Acids
Daily requirements for the other essential amino acidsare estimated by a method analogous to the one usedfor growing pigs. There is a set of requirement ratios formaintenance and another set for protein accretion (Chap-ter 2). The final blend of the two patterns depends on therelative proportion of lysine needed for maintenance andaccretion. The patterns are on a true ileal digestible basis.
Expression of Amino Acid Requirements
The procedures described above produce estimates ofamino acid requirements (true ileal digestible basis)expressed in g/day. The daily DE intake is either providedby the user or estimated within the model, so amino acidrequirements are easily expressed as g/Mcal DE. The userprovides the energy density of the diet (Mcal DE/kg),which allows the calculation of the amount of feed con-sumed (kg/day). Then, the amino acid requirements arecalculated as a percentage of the diet, on a true ileal digest-ible basis. The percentage requirements are also expressedon an apparent ileal digestible basis and a total basis (in acorn–soybean meal diet) by means of the equations givenin Table 3-1.
L AC TA T IN G S O WS
Estimation of nutrient requirements for lactating sowsis complicated by the sow’s propensity to contribute energyand amino acids retrieved from her own body to helpsupport her milk production. Many sows will not consumeenough feed to provide fully the enormous amount ofnutrients needed for milk production, and therefore theylose weight. The amount of body reserves used for milkproduction appears to vary widely.
Milk production potential also varies widely among sows,which causes large variations in nutrient requirements.Therefore, the user must describe the pertinent situationby providing information on the number of suckling pigsper litter and the average daily body weight gain of thesuckling pigs.
The model approaches the calculations in either of twoways. First, the user can provide the amount of energyconsumed daily as input, along with litter size and rate ofgrowth of the suckling pigs. The model will then calculatethe estimated weight gain or loss, as well as the amino acidrequirements to meet the target level of milk production.Second, the user can provide the weight gain or loss ofthe sow during lactation as input, along with data on littersize and growth rate of the suckling pigs. The model willthen calculate the amount of DE and amino acids needed.
The model is designed to calculate amino acid require-ments for observed levels of milk production. It is tenta-tively assumed, in the absence of convincing data, that thesenutrient levels will also maximize subsequent reproductiveperformance. This assumption, however, requires fur-ther testing.
The two approaches to the calculations are based on thequantitative relationships described below.
Models for Energy and Amino Acid Requirements 39
Requirement for Energy
The daily energy requirement is the sum of the require-ments for maintenance, milk production, and thermo-regulation.
MAINTENANCE
The daily maintenance requirement of the lactating sowis considered to be 106 kcal of ME/kg BW0.75 (or 110 kcalof DE/kg BW0.75), the same as for the gestating sow.
MILK PRODUCTION
The amount of energy transferred from the sow to thesuckling litter in milk is estimated by a rearrangement ofthe equation of Noblet and Etienne (1989):
Milk energy 4 (4.92 2 Litter gain)1 (90 2 Number of pigs) (3-8)
where Milk energy is expressed in kcal GE/day and Littergain is in g/day.
The amount of dietary ME required to produce thisamount of milk energy is calculated by dividing the milkenergy by 0.72, assuming that the marginal efficiency ofuse of ME for milk production is 72 percent (Noblet andEtienne, 1987).
THERMOREGULATION
Lactating sows kept in a cold or hot farrowing housewill adjust their energy intake accordingly. The model con-siders an average 24-hour temperature of 20°C as idealand it predicts that an additional 310 kcal of dietary ME(323 kcal of DE) will be consumed per day by sows forevery 1° below 20°C. Similarly, 310 fewer kcal of ME (323kcal of DE) will be consumed per day by sows for every1° above 20°C.
ENERGY FROM THE SOW’S BODY
The total energy requirement is modified by the energyassociated with changes in body weight during lactation.Regression analysis of the data of Beyer et al. (1994) pro-duced the following relationship:
Protein gain 4 1.47 ` (0.0942 2 ADG) (3-9)
where protein gain is in g/day and ADG is the sow’s averagedaily gain of body weight in grams. Note that both proteingain and ADG are often negative, reflecting weight loss inthe lactating sow. The composition of body weight gain orloss in the lactating sow may vary with several factors,including energy and amino acid intake. However, a con-stant relationship is used in the model for simplicity.
This relationship is used directly for calculation of energybalance when the user provides body weight change as aninput. Each gram of protein retrieved from the sow’s bodyis assumed to provide 5.6 kcal of GE toward meeting theenergy requirement. The amount of protein is dividedby 0.23 to estimate the amount of lean tissue mobilized(assuming lean tissue is 23 percent protein). Subtractingthe amount of lean tissue mobilized from the total amountof body weight lost gives an estimate of the amount ofadipose mobilized. This adipose tissue is considered to be90 percent fat, and it is assumed that 9.4 kcal of GE pergram of fat mobilized is available to be applied towardthe energy requirement. The total energy from mobilizedtissue is used with an efficiency of 0.88 to meet the energydemands of lactation.
The regression equation given above indicates that mar-ginal weight loss is 9.42 percent protein by weight. Furthercalculations from this number show that 9.55 percent ofthe energy in the mobilized tissues is from protein (usingthe assumptions described in the previous paragraph). Thisrelationship is used in estimating the amount of protein,fat, and body weight lost when the DE intake (providedas an input) is less than the energy demand.
Requirement for Lysine
The daily requirement for lysine is the sum of therequirements for maintenance and for milk production,with a reduction to account for the use of the sow’s bodyprotein to provide part of the lysine needed for milkproduction.
MAINTENANCE
The daily maintenance requirement for true ileal digest-ible lysine is considered to be 36 mg/kg BW0.75, as forgrowing pigs.
MILK PRODUCTION
The requirement is taken to be 22 g of apparent ilealdigestible lysine/kg of litter weight gain. This factor wasderived from a review of the literature patterned after thatof Pettigrew (1993). From several empirical estimates ofthe lysine requirement to maximize milk production, therequirement and the litter growth rate at the requirementwere recorded. The original diet formulations were used tocalculate the apparent ileal digestible lysine levels. Reportsincluded in the summary were those used by Pettigrew(1993) in his review (Boomgaardt et al., 1972; Lewis andSpeer, 1973; O’Grady and Hanrahan, 1975; Chen et al.,1978; Stahly et al., 1990; Johnston et al., 1993) and onemore recent one (Monegue et al., 1993). A total of eightrequirement estimates were included. The lysine require-
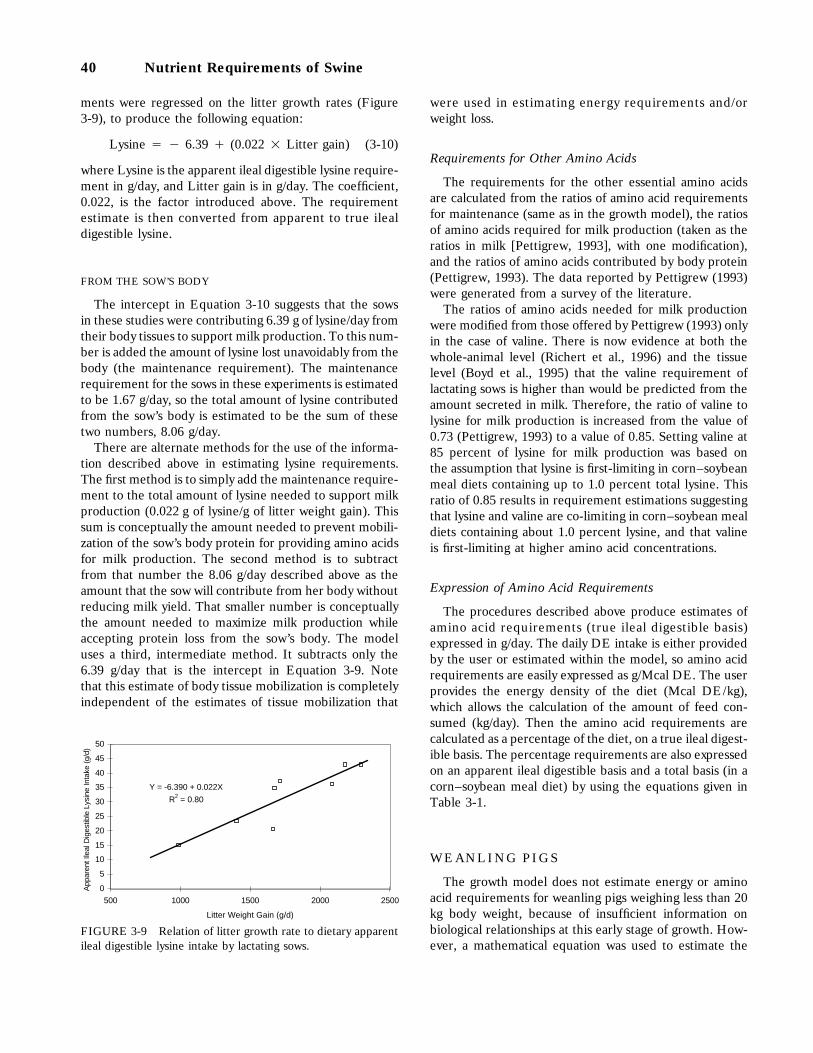
40 Nutrient Requirements of Swine
ments were regressed on the litter growth rates (Figure3-9), to produce the following equation:
Lysine 4 1 6.39 ` (0.022 2 Litter gain) (3-10)
where Lysine is the apparent ileal digestible lysine require-ment in g/day, and Litter gain is in g/day. The coefficient,0.022, is the factor introduced above. The requirementestimate is then converted from apparent to true ilealdigestible lysine.
FROM THE SOW’S BODY
The intercept in Equation 3-10 suggests that the sowsin these studies were contributing 6.39 g of lysine/day fromtheir body tissues to support milk production. To this num-ber is added the amount of lysine lost unavoidably from thebody (the maintenance requirement). The maintenancerequirement for the sows in these experiments is estimatedto be 1.67 g/day, so the total amount of lysine contributedfrom the sow’s body is estimated to be the sum of thesetwo numbers, 8.06 g/day.
There are alternate methods for the use of the informa-tion described above in estimating lysine requirements.The first method is to simply add the maintenance require-ment to the total amount of lysine needed to support milkproduction (0.022 g of lysine/g of litter weight gain). Thissum is conceptually the amount needed to prevent mobili-zation of the sow’s body protein for providing amino acidsfor milk production. The second method is to subtractfrom that number the 8.06 g/day described above as theamount that the sow will contribute from her body withoutreducing milk yield. That smaller number is conceptuallythe amount needed to maximize milk production whileaccepting protein loss from the sow’s body. The modeluses a third, intermediate method. It subtracts only the6.39 g/day that is the intercept in Equation 3-9. Notethat this estimate of body tissue mobilization is completelyindependent of the estimates of tissue mobilization that
Y = -6.390 + 0.022X
R2 = 0.80
0
5
10
15
20
25
30
35
40
45
50
500 1000 1500 2000 2500
Litter Weight Gain (g/d)
App
aren
t Ile
al D
iges
tible
Lys
ine
Inta
ke (
g/d)
FIGURE 3-9 Relation of litter growth rate to dietary apparentileal digestible lysine intake by lactating sows.
were used in estimating energy requirements and/orweight loss.
Requirements for Other Amino Acids
The requirements for the other essential amino acidsare calculated from the ratios of amino acid requirementsfor maintenance (same as in the growth model), the ratiosof amino acids required for milk production (taken as theratios in milk [Pettigrew, 1993], with one modification),and the ratios of amino acids contributed by body protein(Pettigrew, 1993). The data reported by Pettigrew (1993)were generated from a survey of the literature.
The ratios of amino acids needed for milk productionwere modified from those offered by Pettigrew (1993) onlyin the case of valine. There is now evidence at both thewhole-animal level (Richert et al., 1996) and the tissuelevel (Boyd et al., 1995) that the valine requirement oflactating sows is higher than would be predicted from theamount secreted in milk. Therefore, the ratio of valine tolysine for milk production is increased from the value of0.73 (Pettigrew, 1993) to a value of 0.85. Setting valine at85 percent of lysine for milk production was based onthe assumption that lysine is first-limiting in corn–soybeanmeal diets containing up to 1.0 percent total lysine. Thisratio of 0.85 results in requirement estimations suggestingthat lysine and valine are co-limiting in corn–soybean mealdiets containing about 1.0 percent lysine, and that valineis first-limiting at higher amino acid concentrations.
Expression of Amino Acid Requirements
The procedures described above produce estimates ofamino acid requirements (true ileal digestible basis)expressed in g/day. The daily DE intake is either providedby the user or estimated within the model, so amino acidrequirements are easily expressed as g/Mcal DE. The userprovides the energy density of the diet (Mcal DE/kg),which allows the calculation of the amount of feed con-sumed (kg/day). Then the amino acid requirements arecalculated as a percentage of the diet, on a true ileal digest-ible basis. The percentage requirements are also expressedon an apparent ileal digestible basis and a total basis (in acorn–soybean meal diet) by using the equations given inTable 3-1.
W EA NL I NG PI G S
The growth model does not estimate energy or aminoacid requirements for weanling pigs weighing less than 20kg body weight, because of insufficient information onbiological relationships at this early stage of growth. How-ever, a mathematical equation was used to estimate the
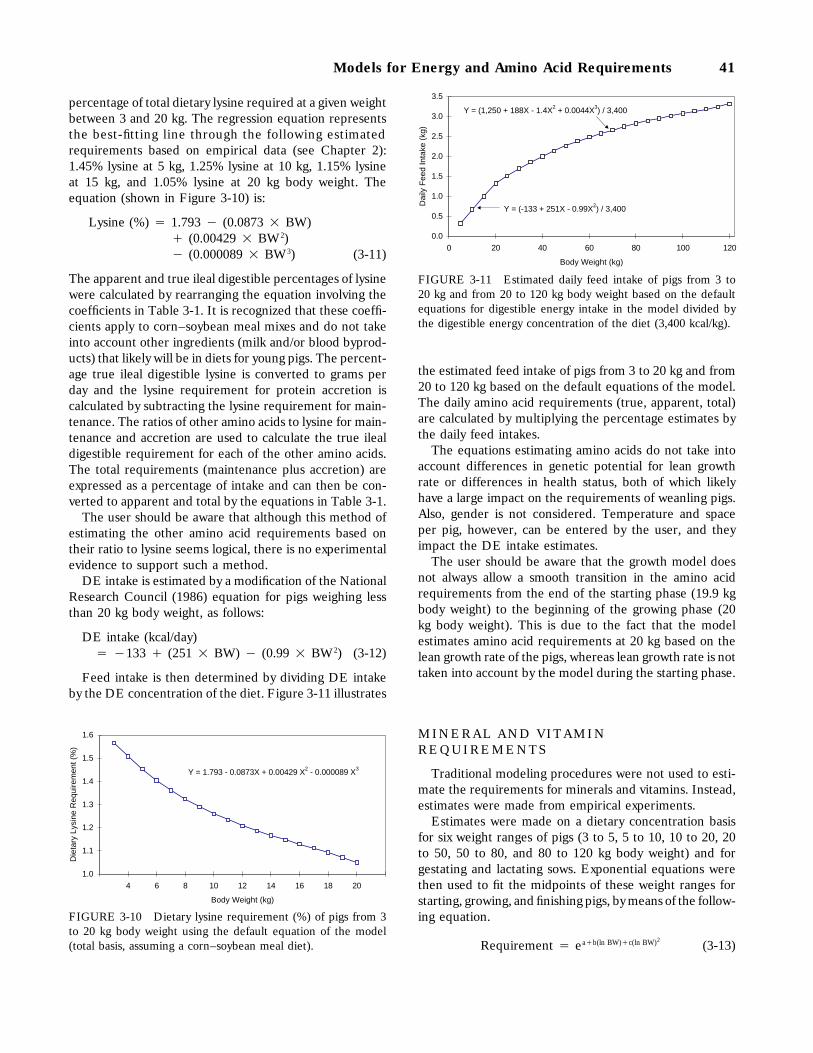
Models for Energy and Amino Acid Requirements 41
percentage of total dietary lysine required at a given weightbetween 3 and 20 kg. The regression equation representsthe best-fitting line through the following estimatedrequirements based on empirical data (see Chapter 2):1.45% lysine at 5 kg, 1.25% lysine at 10 kg, 1.15% lysineat 15 kg, and 1.05% lysine at 20 kg body weight. Theequation (shown in Figure 3-10) is:
Lysine (%) 4 1.793 1 (0.0873 2 BW)` (0.00429 2 BW2)1 (0.000089 2 BW3) (3-11)
The apparent and true ileal digestible percentages of lysinewere calculated by rearranging the equation involving thecoefficients in Table 3-1. It is recognized that these coeffi-cients apply to corn–soybean meal mixes and do not takeinto account other ingredients (milk and/or blood byprod-ucts) that likely will be in diets for young pigs. The percent-age true ileal digestible lysine is converted to grams perday and the lysine requirement for protein accretion iscalculated by subtracting the lysine requirement for main-tenance. The ratios of other amino acids to lysine for main-tenance and accretion are used to calculate the true ilealdigestible requirement for each of the other amino acids.The total requirements (maintenance plus accretion) areexpressed as a percentage of intake and can then be con-verted to apparent and total by the equations in Table 3-1.
The user should be aware that although this method ofestimating the other amino acid requirements based ontheir ratio to lysine seems logical, there is no experimentalevidence to support such a method.
DE intake is estimated by a modification of the NationalResearch Council (1986) equation for pigs weighing lessthan 20 kg body weight, as follows:
DE intake (kcal/day)4 1133 ` (251 2 BW) 1 (0.99 2 BW2) (3-12)
Feed intake is then determined by dividing DE intakeby the DE concentration of the diet. Figure 3-11 illustrates
1.0
1.1
1.2
1.3
1.4
1.5
1.6
2 4 6 8 10 12 14 16 18 20 22
Body Weight (kg)
Die
tary
Lys
ine
Req
uire
men
t (%
)
Y = 1.793 - 0.0873X + 0.00429 X2 - 0.000089 X3
FIGURE 3-10 Dietary lysine requirement (%) of pigs from 3to 20 kg body weight using the default equation of the model(total basis, assuming a corn–soybean meal diet).
0.0
0.5
1.0
1.5
2.0
2.5
3.0
3.5
0 20 40 60 80 100 120
Body Weight (kg)
Dai
ly F
eed
Inta
ke (
kg)
Y = (-133 + 251X - 0.99X2) / 3,400
Y = (1,250 + 188X - 1.4X2 + 0.0044X3) / 3,400
FIGURE 3-11 Estimated daily feed intake of pigs from 3 to20 kg and from 20 to 120 kg body weight based on the defaultequations for digestible energy intake in the model divided bythe digestible energy concentration of the diet (3,400 kcal/kg).
the estimated feed intake of pigs from 3 to 20 kg and from20 to 120 kg based on the default equations of the model.The daily amino acid requirements (true, apparent, total)are calculated by multiplying the percentage estimates bythe daily feed intakes.
The equations estimating amino acids do not take intoaccount differences in genetic potential for lean growthrate or differences in health status, both of which likelyhave a large impact on the requirements of weanling pigs.Also, gender is not considered. Temperature and spaceper pig, however, can be entered by the user, and theyimpact the DE intake estimates.
The user should be aware that the growth model doesnot always allow a smooth transition in the amino acidrequirements from the end of the starting phase (19.9 kgbody weight) to the beginning of the growing phase (20kg body weight). This is due to the fact that the modelestimates amino acid requirements at 20 kg based on thelean growth rate of the pigs, whereas lean growth rate is nottaken into account by the model during the starting phase.
M IN ER A L A ND V IT AM I NR EQ UI R EM EN T S
Traditional modeling procedures were not used to esti-mate the requirements for minerals and vitamins. Instead,estimates were made from empirical experiments.
Estimates were made on a dietary concentration basisfor six weight ranges of pigs (3 to 5, 5 to 10, 10 to 20, 20to 50, 50 to 80, and 80 to 120 kg body weight) and forgestating and lactating sows. Exponential equations werethen used to fit the midpoints of these weight ranges forstarting, growing, and finishing pigs, by means of the follow-ing equation.
Requirement 4 ea`b(ln BW)`c(ln BW)2 (3-13)
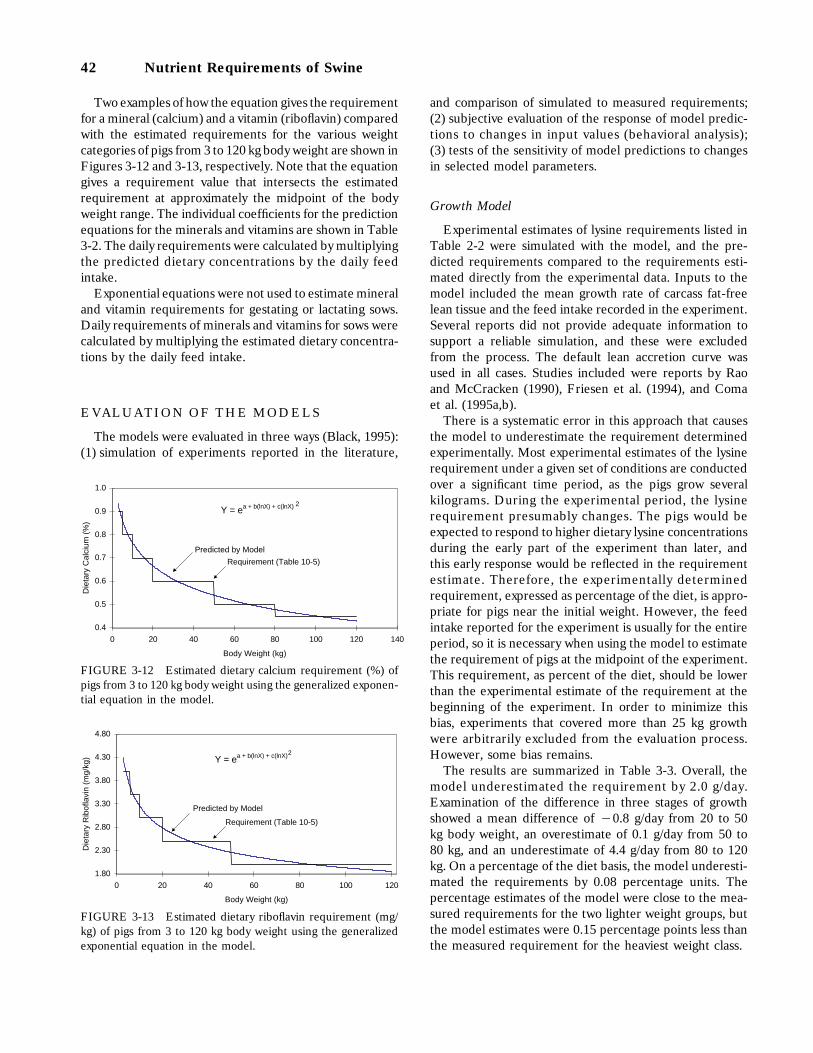
42 Nutrient Requirements of Swine
Two examples of how the equation gives the requirementfor a mineral (calcium) and a vitamin (riboflavin) comparedwith the estimated requirements for the various weightcategories of pigs from 3 to 120 kg body weight are shown inFigures 3-12 and 3-13, respectively. Note that the equationgives a requirement value that intersects the estimatedrequirement at approximately the midpoint of the bodyweight range. The individual coefficients for the predictionequations for the minerals and vitamins are shown in Table3-2. The daily requirements were calculated by multiplyingthe predicted dietary concentrations by the daily feedintake.
Exponential equations were not used to estimate mineraland vitamin requirements for gestating or lactating sows.Daily requirements of minerals and vitamins for sows werecalculated by multiplying the estimated dietary concentra-tions by the daily feed intake.
E VA LU A TI ON O F T HE M OD EL S
The models were evaluated in three ways (Black, 1995):(1) simulation of experiments reported in the literature,
0.4
0.5
0.6
0.7
0.8
0.9
1.0
0 20 40 60 80 100 120 140
Body Weight (kg)
Die
tary
Cal
cium
(%
)
Y = ea + b(lnX) + c(lnX)
Predicted by Model
Requirement (Table 10-5)
2
FIGURE 3-12 Estimated dietary calcium requirement (%) ofpigs from 3 to 120 kg body weight using the generalized exponen-tial equation in the model.
1.80
2.30
2.80
3.30
3.80
4.30
4.80
0 20 40 60 80 100 120
Body Weight (kg)
Die
tary
Rib
ofla
vin
(mg/
kg)
Predicted by Model
Requirement (Table 10-5)
Y = ea + b(lnX) + c(lnX)2
FIGURE 3-13 Estimated dietary riboflavin requirement (mg/kg) of pigs from 3 to 120 kg body weight using the generalizedexponential equation in the model.
and comparison of simulated to measured requirements;(2) subjective evaluation of the response of model predic-tions to changes in input values (behavioral analysis);(3) tests of the sensitivity of model predictions to changesin selected model parameters.
Growth Model
Experimental estimates of lysine requirements listed inTable 2-2 were simulated with the model, and the pre-dicted requirements compared to the requirements esti-mated directly from the experimental data. Inputs to themodel included the mean growth rate of carcass fat-freelean tissue and the feed intake recorded in the experiment.Several reports did not provide adequate information tosupport a reliable simulation, and these were excludedfrom the process. The default lean accretion curve wasused in all cases. Studies included were reports by Raoand McCracken (1990), Friesen et al. (1994), and Comaet al. (1995a,b).
There is a systematic error in this approach that causesthe model to underestimate the requirement determinedexperimentally. Most experimental estimates of the lysinerequirement under a given set of conditions are conductedover a significant time period, as the pigs grow severalkilograms. During the experimental period, the lysinerequirement presumably changes. The pigs would beexpected to respond to higher dietary lysine concentrationsduring the early part of the experiment than later, andthis early response would be reflected in the requirementestimate. Therefore, the experimentally determinedrequirement, expressed as percentage of the diet, is appro-priate for pigs near the initial weight. However, the feedintake reported for the experiment is usually for the entireperiod, so it is necessary when using the model to estimatethe requirement of pigs at the midpoint of the experiment.This requirement, as percent of the diet, should be lowerthan the experimental estimate of the requirement at thebeginning of the experiment. In order to minimize thisbias, experiments that covered more than 25 kg growthwere arbitrarily excluded from the evaluation process.However, some bias remains.
The results are summarized in Table 3-3. Overall, themodel underestimated the requirement by 2.0 g/day.Examination of the difference in three stages of growthshowed a mean difference of 10.8 g/day from 20 to 50kg body weight, an overestimate of 0.1 g/day from 50 to80 kg, and an underestimate of 4.4 g/day from 80 to 120kg. On a percentage of the diet basis, the model underesti-mated the requirements by 0.08 percentage units. Thepercentage estimates of the model were close to the mea-sured requirements for the two lighter weight groups, butthe model estimates were 0.15 percentage points less thanthe measured requirement for the heaviest weight class.

Models for Energy and Amino Acid Requirements 43
TABLE 3-2 Coefficients Used in the Growth Model to Predict Mineral and VitaminRequirements (percentage or amount/kg of diet) for Pigs of Various Body Weightsa
Coefficients
a b c R2
MineralsCalcium (%) 0.0658 10.1023 10.0185 0.99Phosphorus, total (%) 10.2735 10.0262 10.0244 0.99Phosphorus, available (%) 10.0557 10.4160 0.0050 0.99Sodium (%) 10.3897 10.7984 0.0815 0.97Chlorine (%) 10.3010 10.8317 0.0724 0.95Magnesium (%) — — — —Potassium (%) 11.2375 0.0736 10.0412 0.99Copper (mg) 1.8799 0.0097 10.0391 0.99Iodine (mg) — — — —Iron (mg) 4.6600 0.0642 10.0597 0.99Manganese (mg) 2.0364 10.4508 0.0317 0.91Selenium (mg) 10.6910 10.3236 0.0097 0.89Zinc (mg) 4.9230 10.1716 10.0134 0.96
VitaminsVitamin A (IU) 8.2033 10.3548 0.0262 0.92Vitamin D3 (IU) 5.6700 10.1722 0.0042 0.89Vitamin E (IU) 3.4095 10.5082 0.0628 0.83Vitamin K (menadione) (mg) — — — —Biotin (mg) — — — —Choline (g) 0.2659 10.6297 0.0664 0.98Folacin (mg) — — — —Niacin, available (mg) 3.4970 10.3884 0.0094 0.98Pantothenic acid (mg) 2.8651 10.3171 0.0250 0.99Riboflavin (mg) 1.7129 10.2314 0.0005 0.99Thiamin (mg) — — — —Vitamin B6 (mg) 1.3009 10.5088 0.0477 0.93Vitamin B12 (mg) 2.9577 0.1840 10.1092 0.96
aEstimated requirements 4 ea`b(lnBW)`c(lnBW)2, where BW is body weight. Body weights used in the derivation of the equationsrepresented the midpoints of the weight ranges of 3 to 5, 5 to 10, 10 to 20, 20 to 50, 50 to 80, and 80 to 120 kg. These equationswill give values that approximate the mineral and vitamin requirements for pigs of these weight ranges shown in Table 10-5.
TABLE 3-3 Evaluation of the Growth Modela
Carcass Total dietary lysinefat-free (grams/day) (% of diet)
Mean leanBW gain Meas Pred % Meas Pred %
Author Gender Regimen (kg) (g/day) req req Diff Meas req req Diff Meas
Coma et al. (1995a) Barrows Ad lib 31.3 292 18.3 15.4 12.9 84.2 0.97 0.81 10.16 83.5Coma et al. (1995a) Barrows Restrict 31.3 292 13.1 11.3 11.8 86.3 1.01 0.87 10.14 86.1Rao and McCracken Boars Ad lib 44.0 412 21.2 23.1 1.9 109.0 1.12 1.26 0.14 112.5
(1990)Friesen et al. (1994) Gilts Ad lib 44.5 376 21.5 21.2 10.3 98.6 1.28 1.24 10.04 96.9Friesen et al. (1994) Gilts Ad lib 63.8 376 22.2 22.3 0.1 100.5 1.03 1.06 0.03 102.9Coma et al. (1995a) Barrows Ad lib 98.3 292 21.9 17.2 14.7 78.5 0.61 0.48 10.13 78.7Coma et al. (1995a) Barrows Restrict 98.3 292 22.8 16.8 16.0 73.7 0.85 0.63 10.22 74.1Coma et al. (1995b) Gilts Ad lib 105.5 292 19.1 16.5 12.6 86.4 0.66 0.57 10.09 86.4
Overall mean 12.0 89.6 10.08 90.1Period means
20 to 50 kg BW 10.8 94.5 10.05 94.850 to 80 kg BW 0.1 100.5 0.03 102.980 to 120 kg BW 14.4 79.5 10.15 79.8
aColumn headings: Meas req 4 measured lysine requirement; Pred req 4 predicted lysine requirement from the model; Diff 4 difference in the measured and predictedrequirement; % Meas 4 predicted requirement as a percentage of the measured requirement.
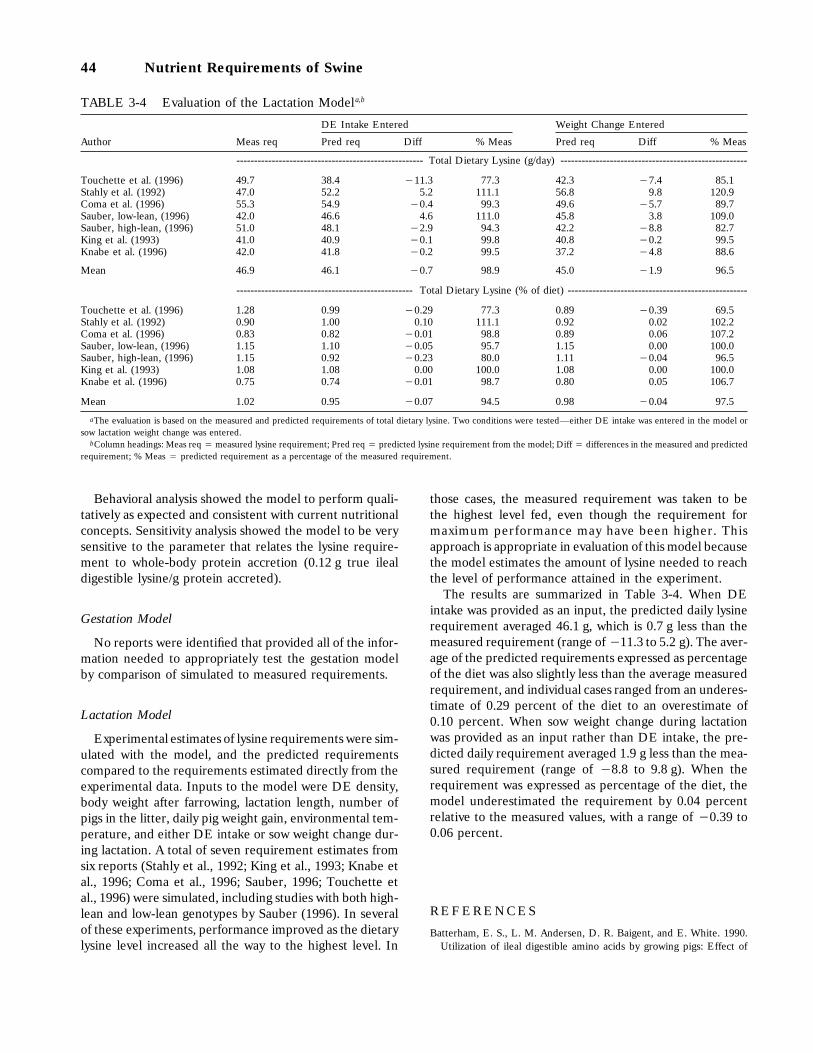
44 Nutrient Requirements of Swine
TABLE 3-4 Evaluation of the Lactation Modela,b
DE Intake Entered Weight Change Entered
Author Meas req Pred req Diff % Meas Pred req Diff % Meas
----------------------------------------------------- Total Dietary Lysine (g/day) -----------------------------------------------------
Touchette et al. (1996) 49.7 38.4 111.3 77.3 42.3 17.4 85.1Stahly et al. (1992) 47.0 52.2 5.2 111.1 56.8 9.8 120.9Coma et al. (1996) 55.3 54.9 10.4 99.3 49.6 15.7 89.7Sauber, low-lean, (1996) 42.0 46.6 4.6 111.0 45.8 3.8 109.0Sauber, high-lean, (1996) 51.0 48.1 12.9 94.3 42.2 18.8 82.7King et al. (1993) 41.0 40.9 10.1 99.8 40.8 10.2 99.5Knabe et al. (1996) 42.0 41.8 10.2 99.5 37.2 14.8 88.6
Mean 46.9 46.1 10.7 98.9 45.0 11.9 96.5
-------------------------------------------------- Total Dietary Lysine (% of diet) ---------------------------------------------------
Touchette et al. (1996) 1.28 0.99 10.29 77.3 0.89 10.39 69.5Stahly et al. (1992) 0.90 1.00 0.10 111.1 0.92 0.02 102.2Coma et al. (1996) 0.83 0.82 10.01 98.8 0.89 0.06 107.2Sauber, low-lean, (1996) 1.15 1.10 10.05 95.7 1.15 0.00 100.0Sauber, high-lean, (1996) 1.15 0.92 10.23 80.0 1.11 10.04 96.5King et al. (1993) 1.08 1.08 0.00 100.0 1.08 0.00 100.0Knabe et al. (1996) 0.75 0.74 10.01 98.7 0.80 0.05 106.7
Mean 1.02 0.95 10.07 94.5 0.98 10.04 97.5
aThe evaluation is based on the measured and predicted requirements of total dietary lysine. Two conditions were tested—either DE intake was entered in the model orsow lactation weight change was entered.
bColumn headings: Meas req 4 measured lysine requirement; Pred req 4 predicted lysine requirement from the model; Diff 4 differences in the measured and predictedrequirement; % Meas 4 predicted requirement as a percentage of the measured requirement.
Behavioral analysis showed the model to perform quali-tatively as expected and consistent with current nutritionalconcepts. Sensitivity analysis showed the model to be verysensitive to the parameter that relates the lysine require-ment to whole-body protein accretion (0.12 g true ilealdigestible lysine/g protein accreted).
Gestation Model
No reports were identified that provided all of the infor-mation needed to appropriately test the gestation modelby comparison of simulated to measured requirements.
Lactation Model
Experimental estimates of lysine requirements were sim-ulated with the model, and the predicted requirementscompared to the requirements estimated directly from theexperimental data. Inputs to the model were DE density,body weight after farrowing, lactation length, number ofpigs in the litter, daily pig weight gain, environmental tem-perature, and either DE intake or sow weight change dur-ing lactation. A total of seven requirement estimates fromsix reports (Stahly et al., 1992; King et al., 1993; Knabe etal., 1996; Coma et al., 1996; Sauber, 1996; Touchette etal., 1996) were simulated, including studies with both high-lean and low-lean genotypes by Sauber (1996). In severalof these experiments, performance improved as the dietarylysine level increased all the way to the highest level. In
those cases, the measured requirement was taken to bethe highest level fed, even though the requirement formaximum performance may have been higher. Thisapproach is appropriate in evaluation of this model becausethe model estimates the amount of lysine needed to reachthe level of performance attained in the experiment.
The results are summarized in Table 3-4. When DEintake was provided as an input, the predicted daily lysinerequirement averaged 46.1 g, which is 0.7 g less than themeasured requirement (range of 111.3 to 5.2 g). The aver-age of the predicted requirements expressed as percentageof the diet was also slightly less than the average measuredrequirement, and individual cases ranged from an underes-timate of 0.29 percent of the diet to an overestimate of0.10 percent. When sow weight change during lactationwas provided as an input rather than DE intake, the pre-dicted daily requirement averaged 1.9 g less than the mea-sured requirement (range of 18.8 to 9.8 g). When therequirement was expressed as percentage of the diet, themodel underestimated the requirement by 0.04 percentrelative to the measured values, with a range of 10.39 to0.06 percent.
R EF ER E NC ES
Batterham, E. S., L. M. Andersen, D. R. Baigent, and E. White. 1990.Utilization of ileal digestible amino acids by growing pigs: Effect of
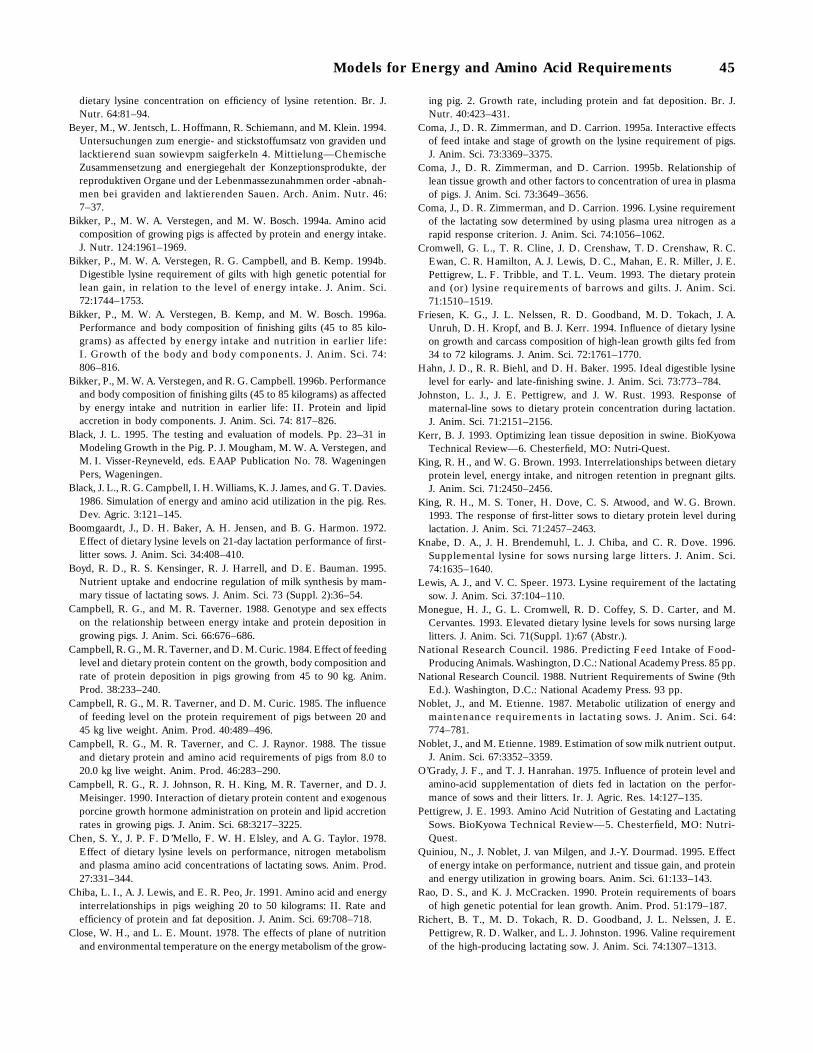
Models for Energy and Amino Acid Requirements 45
dietary lysine concentration on efficiency of lysine retention. Br. J.Nutr. 64:81–94.
Beyer, M., W. Jentsch, L. Hoffmann, R. Schiemann, and M. Klein. 1994.Untersuchungen zum energie- and stickstoffumsatz von graviden undlacktierend suan sowievpm saigferkeln 4. Mittielung—ChemischeZusammensetzung and energiegehalt der Konzeptionsprodukte, derreproduktiven Organe und der Lebenmassezunahmmen order -abnah-men bei graviden and laktierenden Sauen. Arch. Anim. Nutr. 46:7–37.
Bikker, P., M. W. A. Verstegen, and M. W. Bosch. 1994a. Amino acidcomposition of growing pigs is affected by protein and energy intake.J. Nutr. 124:1961–1969.
Bikker, P., M. W. A. Verstegen, R. G. Campbell, and B. Kemp. 1994b.Digestible lysine requirement of gilts with high genetic potential forlean gain, in relation to the level of energy intake. J. Anim. Sci.72:1744–1753.
Bikker, P., M. W. A. Verstegen, B. Kemp, and M. W. Bosch. 1996a.Performance and body composition of finishing gilts (45 to 85 kilo-grams) as affected by energy intake and nutrition in earlier life:I. Growth of the body and body components. J. Anim. Sci. 74:806–816.
Bikker, P., M. W. A. Verstegen, and R. G. Campbell. 1996b. Performanceand body composition of finishing gilts (45 to 85 kilograms) as affectedby energy intake and nutrition in earlier life: II. Protein and lipidaccretion in body components. J. Anim. Sci. 74: 817–826.
Black, J. L. 1995. The testing and evaluation of models. Pp. 23–31 inModeling Growth in the Pig. P. J. Mougham, M. W. A. Verstegen, andM. I. Visser-Reyneveld, eds. EAAP Publication No. 78. WageningenPers, Wageningen.
Black, J. L., R. G. Campbell, I. H. Williams, K. J. James, and G. T. Davies.1986. Simulation of energy and amino acid utilization in the pig. Res.Dev. Agric. 3:121–145.
Boomgaardt, J., D. H. Baker, A. H. Jensen, and B. G. Harmon. 1972.Effect of dietary lysine levels on 21-day lactation performance of first-litter sows. J. Anim. Sci. 34:408–410.
Boyd, R. D., R. S. Kensinger, R. J. Harrell, and D. E. Bauman. 1995.Nutrient uptake and endocrine regulation of milk synthesis by mam-mary tissue of lactating sows. J. Anim. Sci. 73 (Suppl. 2):36–54.
Campbell, R. G., and M. R. Taverner. 1988. Genotype and sex effectson the relationship between energy intake and protein deposition ingrowing pigs. J. Anim. Sci. 66:676–686.
Campbell, R. G., M. R. Taverner, and D. M. Curic. 1984. Effect of feedinglevel and dietary protein content on the growth, body composition andrate of protein deposition in pigs growing from 45 to 90 kg. Anim.Prod. 38:233–240.
Campbell, R. G., M. R. Taverner, and D. M. Curic. 1985. The influenceof feeding level on the protein requirement of pigs between 20 and45 kg live weight. Anim. Prod. 40:489–496.
Campbell, R. G., M. R. Taverner, and C. J. Raynor. 1988. The tissueand dietary protein and amino acid requirements of pigs from 8.0 to20.0 kg live weight. Anim. Prod. 46:283–290.
Campbell, R. G., R. J. Johnson, R. H. King, M. R. Taverner, and D. J.Meisinger. 1990. Interaction of dietary protein content and exogenousporcine growth hormone administration on protein and lipid accretionrates in growing pigs. J. Anim. Sci. 68:3217–3225.
Chen, S. Y., J. P. F. D’Mello, F. W. H. Elsley, and A. G. Taylor. 1978.Effect of dietary lysine levels on performance, nitrogen metabolismand plasma amino acid concentrations of lactating sows. Anim. Prod.27:331–344.
Chiba, L. I., A. J. Lewis, and E. R. Peo, Jr. 1991. Amino acid and energyinterrelationships in pigs weighing 20 to 50 kilograms: II. Rate andefficiency of protein and fat deposition. J. Anim. Sci. 69:708–718.
Close, W. H., and L. E. Mount. 1978. The effects of plane of nutritionand environmental temperature on the energy metabolism of the grow-
ing pig. 2. Growth rate, including protein and fat deposition. Br. J.Nutr. 40:423–431.
Coma, J., D. R. Zimmerman, and D. Carrion. 1995a. Interactive effectsof feed intake and stage of growth on the lysine requirement of pigs.J. Anim. Sci. 73:3369–3375.
Coma, J., D. R. Zimmerman, and D. Carrion. 1995b. Relationship oflean tissue growth and other factors to concentration of urea in plasmaof pigs. J. Anim. Sci. 73:3649–3656.
Coma, J., D. R. Zimmerman, and D. Carrion. 1996. Lysine requirementof the lactating sow determined by using plasma urea nitrogen as arapid response criterion. J. Anim. Sci. 74:1056–1062.
Cromwell, G. L., T. R. Cline, J. D. Crenshaw, T. D. Crenshaw, R. C.Ewan, C. R. Hamilton, A. J. Lewis, D. C., Mahan, E. R. Miller, J. E.Pettigrew, L. F. Tribble, and T. L. Veum. 1993. The dietary proteinand (or) lysine requirements of barrows and gilts. J. Anim. Sci.71:1510–1519.
Friesen, K. G., J. L. Nelssen, R. D. Goodband, M. D. Tokach, J. A.Unruh, D. H. Kropf, and B. J. Kerr. 1994. Influence of dietary lysineon growth and carcass composition of high-lean growth gilts fed from34 to 72 kilograms. J. Anim. Sci. 72:1761–1770.
Hahn, J. D., R. R. Biehl, and D. H. Baker. 1995. Ideal digestible lysinelevel for early- and late-finishing swine. J. Anim. Sci. 73:773–784.
Johnston, L. J., J. E. Pettigrew, and J. W. Rust. 1993. Response ofmaternal-line sows to dietary protein concentration during lactation.J. Anim. Sci. 71:2151–2156.
Kerr, B. J. 1993. Optimizing lean tissue deposition in swine. BioKyowaTechnical Review—6. Chesterfield, MO: Nutri-Quest.
King, R. H., and W. G. Brown. 1993. Interrelationships between dietaryprotein level, energy intake, and nitrogen retention in pregnant gilts.J. Anim. Sci. 71:2450–2456.
King, R. H., M. S. Toner, H. Dove, C. S. Atwood, and W. G. Brown.1993. The response of first-litter sows to dietary protein level duringlactation. J. Anim. Sci. 71:2457–2463.
Knabe, D. A., J. H. Brendemuhl, L. J. Chiba, and C. R. Dove. 1996.Supplemental lysine for sows nursing large litters. J. Anim. Sci.74:1635–1640.
Lewis, A. J., and V. C. Speer. 1973. Lysine requirement of the lactatingsow. J. Anim. Sci. 37:104–110.
Monegue, H. J., G. L. Cromwell, R. D. Coffey, S. D. Carter, and M.Cervantes. 1993. Elevated dietary lysine levels for sows nursing largelitters. J. Anim. Sci. 71(Suppl. 1):67 (Abstr.).
National Research Council. 1986. Predicting Feed Intake of Food-Producing Animals. Washington, D.C.: National Academy Press. 85 pp.
National Research Council. 1988. Nutrient Requirements of Swine (9thEd.). Washington, D.C.: National Academy Press. 93 pp.
Noblet, J., and M. Etienne. 1987. Metabolic utilization of energy andmaintenance requirements in lactating sows. J. Anim. Sci. 64:774–781.
Noblet, J., and M. Etienne. 1989. Estimation of sow milk nutrient output.J. Anim. Sci. 67:3352–3359.
O’Grady, J. F., and T. J. Hanrahan. 1975. Influence of protein level andamino-acid supplementation of diets fed in lactation on the perfor-mance of sows and their litters. Ir. J. Agric. Res. 14:127–135.
Pettigrew, J. E. 1993. Amino Acid Nutrition of Gestating and LactatingSows. BioKyowa Technical Review—5. Chesterfield, MO: Nutri-Quest.
Quiniou, N., J. Noblet, J. van Milgen, and J.-Y. Dourmad. 1995. Effectof energy intake on performance, nutrient and tissue gain, and proteinand energy utilization in growing boars. Anim. Sci. 61:133–143.
Rao, D. S., and K. J. McCracken. 1990. Protein requirements of boarsof high genetic potential for lean growth. Anim. Prod. 51:179–187.
Richert, B. T., M. D. Tokach, R. D. Goodband, J. L. Nelssen, J. E.Pettigrew, R. D. Walker, and L. J. Johnston. 1996. Valine requirementof the high-producing lactating sow. J. Anim. Sci. 74:1307–1313.

46 Nutrient Requirements of Swine
Sauber, T. E. 1996. Impact of Lean Growth Genotype, Dietary AminoAcid Regimen, and Level of Chronic Immune System Activation onSow Lactational Performance. Ph.D. Dissertation. Iowa State Univer-sity, Ames.
Stahly, T. S., G. L. Cromwell, and H. J. Monegue. 1990. Lactationalresponses of sows nursing large litters to dietary lysine levels. J. Anim.Sci. 68(Suppl. 1):369 (Abstr.).
Stahly, T. S., G. L. Cromwell, and H. J. Monegue. 1992. Milk yieldresponses of sows nursing large litters. J. Anim. Sci. 70 (Suppl.1):238 (Abstr.).
Susenbeth, A., and K. Keitel. 1988. Partition of whole body protein indifferent body fractions and some constants in body composition inpigs. Livestock Prod. Sci. 20:37–52.
Touchette, K. J., G. L. Allee, M. D. Newcombe, K. M. Halpin, and R. D.Boyd. 1996. Lysine requirement of the lactating primiparous sow.J. Anim. Sci. 74 (Suppl. 1):63 (Abstr.).
Wang, T. C., and M. F. Fuller. 1989. The optimum dietary amino acidpattern for growing pigs. 1. Experiments by amino acid deletion. Br.J. Nutr. 62:77–89.
4 Minerals
Pigs have a dietary requirement for certain inorganicelements. These include calcium, chlorine, copper, iodine,iron, magnesium, manganese, phosphorus, potassium, sele-nium, sodium, sulfur, and zinc. Chromium is now recog-nized as an essential mineral (National Research Council,1997), but a quantitative requirement has not been estab-lished. Cobalt also is required in the synthesis of vitaminB12. Pigs may also require other trace elements (i.e., arsenic,boron, bromine, fluorine, molybdenum, nickel, silicon, tin,and vanadium) which have been shown to have a physiolog-ical role in one or more species (Underwood, 1977; Nielsen,1984). These elements are required at such low levels,however, that their dietary essentiality has not been proven.
The functions of these inorganic elements are extremelydiverse. They range from structural functions in some tis-sues to a wide variety of regulatory functions in othertissues. Most pigs are now raised in confinement, withoutaccess to soil or forage; this rearing environment mayincrease the need for mineral supplementation. Suggestedminimum requirements for the individual elements at vari-ous stages of the life cycle are given in tables provided inChapter 10. Meeting the mineral requirements will beinfluenced by the bioavailabilities of minerals in feed ingre-dients. The subject of bioavailability of minerals wasincluded in a recent book, Bioavailability of Nutrients forAnimals, edited by Ammerman, Baker, and Lewis (1995).
Several minerals, including antimony, arsenic, cadmium,fluorine, lead, and mercury, can be toxic to swine (Carson,1986). The toxicities and tolerances of essential and othermineral elements are described in detail in Mineral Toler-ance of Domestic Animals (National Research Council,1980).
M AC RO M IN ER A LS
Calcium and Phosphorus
Calcium and phosphorus play a major role in the devel-opment and maintenance of the skeletal system and per-
47
form many other physiologic functions (Hays, 1976; Peo,1976, 1991; Kornegay, 1985). Peo (1991) indicated thatadequate calcium and phosphorus nutrition for all classesof swine is dependent upon: (1) an adequate supply of eachelement in an available form in the diet, (2) a suitable ratioof available calcium and phosphorus in the diet, and (3) thepresence of adequate vitamin D. A wide calcium-to-phosphorus ratio lowers phosphorus absorption, resultingin reduced growth and bone calcification, especially if thediet is marginal in phosphorus (Peo et al., 1969; Vippermanet al., 1974; Doige et al., 1975; van Kempen et al., 1976;Reinhart and Mahan, 1986; Hall et al., 1991; Wilde andJourquin, 1992; Eeckhout et al., 1995; Qian et al., 1996).The ratio is less critical if the diet contains excess phospho-rus (Prince et al., 1984; Hall et al., 1991). A suggested ratioof total calcium-to-total phosphorus for grain–soybeanmeal diets is between 1:1 and 1.25:1. When based onavailable phosphorus, the ratio is between 2:1 and 3:1(Jongbloed, 1987; Ketaren et al., 1989; Qian et al., 1996).A narrower calcium-to-phosphorus ratio, whether total oravailable phosphorus, probably results in more efficientutilization of phosphorus. An adequate amount of vitaminD is also necessary for proper metabolism of calcium andphosphorus, but a very high level of vitamin D can mobilizeexcessive amounts of calcium and phosphorus from bones(Hancock et al., 1986; Jongbloed, 1987).
A considerable amount of research has been conductedto determine the calcium and phosphorus requirementsof weanling pigs (Rutledge et al., 1961; Combs and Wallace,1962; Combs et al., 1962, 1966; Miller et al., 1962, 1964a,b,1965b,c,d; Menehan et al., 1963; Zimmerman et al., 1963;Blair and Benzie, 1964; Mudd et al., 1969; Coalson et al.,1972, 1974; Mahan et al., 1980; Mahan, 1982) and growing-finishing swine (Chapman et al., 1962; Libal et al., 1969;Cromwell et al., 1970, 1972b; Stockland and Blaylock,1973; Doige et al., 1975; Pond et al., 1975, 1978; Fammatreet al., 1977; Kornegay and Thomas, 1981; Thomas andKornegay, 1981; Maxson and Mahan, 1983; Combs et al.,

48 Nutrient Requirements of Swine
1991a,b). The estimated dietary requirements for calciumand phosphorus for maximum growth rate and feed effi-ciency of pigs from 3 to 120 kg are given in Chapter 10,Tables 10-5 and 10-6. The requirements for total calciumand total phosphorus are based on a fortified, corn–soybeanmeal diet and take into account the fact that some ofthe phosphorus in feedstuffs of plant origin is unavailable.Estimates of the requirements for available phosphorusfor the maximum rate and efficiency of gain are also pre-sented in Chapter 10, Tables 10-5 and 10-6. Higher dietaryconcentrations of calcium and phosphorus may be requiredif feed intake is low.
The levels of calcium and phosphorus that result inmaximum growth rate are not necessarily adequate formaximum bone mineralization. The requirements for max-imizing bone strength and bone-ash content are at least0.1 percentage unit higher than the requirements for maxi-mum rate and efficiency of gain (Cromwell et al., 1970,1972b; Mahan et al., 1980; Crenshaw et al., 1981; Kornegayand Thomas, 1981; Mahan, 1982; Maxson and Mahan,1983; Koch et al., 1984; Combs et al., 1991a,b). However,maximization of bone strength by feeding large amountsof calcium and phosphorus to growing pigs does not neces-sarily improve structural soundness (Pointillart andGueguen, 1978; Kornegay and Thomas, 1981; Calabottaet al., 1982; Kornegay et al., 1981a,b, 1983; Breman andAherne, 1984; Lepine et al., 1985; Eeckhout et al., 1995),nor has it been shown to be necessary for good health orlongevity (Arthur et al., 1983a,b; Kornegay et al., 1984).
The dietary calcium and phosphorus requirements,expressed as a percentage of the diet, may be slightly higherfor gilts than for barrows (Thomas and Kornegay, 1981;Calabotta et al., 1982). Feeding of dietary levels of calciumand phosphorus sufficient to maximize bone mineralizationin gilts during early growth and development was shownto improve reproductive longevity in one study (Nimmoet al., 1981a,b) but not in other studies (Arthur et al.,1983a,b; Kornegay et al., 1984). The calcium and phospho-rus requirements of the developing boar are greater thanthose of the barrow and gilt (Cromwell et al., 1979; Hick-man et al., 1983; Kesel et al., 1983; Hansen et al., 1987).
Pigs possessing a high lean growth rate do not seem tohave a higher dietary requirement for calcium and phos-phorus as compared with pigs having a moderate leangrowth rate, according to a study by Bertram et al. (1994).However, when the lean growth rate is increased by treat-ing pigs with porcine somatotropin, the dietary require-ment, expressed as percentage of the diet, increases dueto the reduced daily feed intake resulting from porcinesomatotropin treatment (Weeden et al., 1993a,b; Carterand Cromwell, 1998a,b). There is also strong evidence thatporcine somatotropin–treated pigs require greater dailyamounts of calcium and phosphorus to maximize growth
performance, bone mineralization, and carcass leannessthan untreated pigs (Carter and Cromwell, 1998a,b).
Kornegay et al. (1973), Harmon et al. (1974b, 1975),Monegue et al. (1980), Nimmo et al. (1981a,b), Mahanand Fetter (1982), Arthur et al. (1983a,b), Grandhi andStrain (1983), Kornegay and Kite (1983), and Maxson andMahan (1986) investigated the calcium and phosphorusrequirements of breeding swine. During pregnancy, thephysiological requirements for calcium and phosphorusincrease in proportion to the need for fetal growth andreach a maximum in late gestation. During lactation, therequirements are affected by the level of milk productionby the sow. Generally, the requirements for calcium andphosphorus are based on a feeding level of 1.8 to 2.0 kgof feed/day during gestation and 5 to 6 kg of feed/dayduring lactation. If sows are fed less than 1.8 kg of feedduring gestation, the diet should be formulated to containsufficient concentrations of calcium and phosphorus tomeet the daily requirements. The voluntary feed intakeof lactating sows may be reduced by high environmentaltemperatures. In this circumstance, assuming that milkproduction is not decreased, the lactation diet should beformulated to meet the daily needs of calcium and phos-phorus. Adequate calcium and phosphorus intakes aremore critical in first-parity sows than in mature sows(Giesemann et al., 1992a,b).
The form in which phosphorus exists in natural feedstuffsinfluences the efficiency of its utilization. In cereal grains,grain by-products, and oilseed meals, about 60 to 75 per-cent of the phosphorus is organically bound in the formof phytate (Nelson et al., 1968; Lolas et al., 1976), whichis poorly available to the pig (Taylor, 1965; Peeler, 1972;Cromwell, 1979). The biological availability of phosphorusin cereal grains is variable (Cromwell et al., 1972a, 1974),ranging from less than 15 percent in corn (Bayley andThomson, 1969; Miracle et al., 1977; Calvert et al., 1978;Hayes et al., 1979; Stober et al., 1979; Trotter and Allee,1979a,b; Huang and Allee, 1981; Ross et al., 1983) toapproximately 50 percent in wheat (Miracle et al., 1977;Hayes et al., 1979; Trotter and Allee, 1979a; Cromwellet al., 1985; Cromwell, 1992). The greater availability ofphosphorus in wheat and wheat by-products (Stober et al.,1980b; Hew et al., 1982) is attributed to the presence ofa naturally occurring phytase enzyme in wheat (McCanceand Widdowson, 1944; Mollgaard, 1946; Pointillart et al.,1984). The phosphorus in high-moisture corn or grain sor-ghum is considerably more available than that in dry grain(Trotter and Allee, 1979b; Boyd et al., 1983; Ross et al.,1983). The phosphorus in low-phytic acid corn (modifiedby the mutant lpa1 gene) is relatively high (77 percent) inits bioavailability (Cromwell et al., 1998).
The phosphorus in oilseed meals also has a low bioavail-ability (Tonroy et al., 1973; Miracle et al., 1977; Trotterand Allee, 1979a; Stober et al., 1980a; Harrold, 1981; Ross
Minerals 49
et al., 1982; Cromwell, 1992). In contrast, the phosphorusin protein sources of animal origin is largely inorganic, andmost animal protein sources (including milk and bloodbyproducts) have a high phosphorus bioavailability (Crom-well et al., 1976; Hew et al., 1982; Coffey and Cromwell,1993). The bioavailability of phosphorus in meat and bonemeal is variable. Earlier studies indicated that the bioavail-ability of phosphorus in meat and bone meal was somewhatlower (67%) than in most other animal sources (Cromwell,1992), but more recent studies showed a relatively highbioavailability (90%) (Traylor and Cromwell, 1998). Thephosphorus in dehydrated alfalfa meal is highly available(Cromwell et al., 1983). Steam pelleting has been shownto improve the bioavailability of phytate phosphorus insome studies (Bayley and Thompson, 1969; Bayley et al.,1975) but not in others (Trotter and Allee, 1979c; Corleyet al., 1980; Ross et al., 1983). Estimates of relative phos-phorus bioavailability in common feed ingredients for pigsare given in Chapter 11, Table 11-1.
Microbial phytase supplementation of high-phytate,cereal grain–oilseed meal diets can result in majorimprovements in bioavailability of phytate phosphorus(Nasi, 1990; Simmons et al., 1990; Jongbloed et al., 1992;Pallauf et al., 1992a,b; Cromwell et al., 1993b, 1995; Leiet al., 1993a). As a result, the dietary level of phosphoruscan be reduced, thereby lowering phosphorus excretionby 30 to 60 percent (see Chapter 8). The magnitude ofthe response to microbial phytase is influenced by thedietary level of available and total phosphorus (includingphytate phosphorus), the amount of supplemental phytase,the calcium-to-phosphorus ratio (or level of calcium), andthe level of vitamin D (Jongbloed et al., 1993; Lei et al.,1994; Kornegay, 1996). Microbial phytase also improvesthe bioavailability of calcium (Lei et al., 1993a; Mroz etal., 1994; Pallauf et al., 1992b; Young et al., 1993; Radcliffeet al., 1995) and zinc (Pallauf et al., 1992a, 1994a,b; Leiet al., 1993b) and has been reported to improve the digest-ibility of dietary protein (Ketaren et al., 1993; Kornegayand Qian, 1994; Mroz et al., 1994; Kemme et al., 1995;Biehl and Baker, 1996). Pelleting of diets can reduce ordestroy phytase activity because of the temperatureincreases that occur during the pelleting process. Lossof phytase activity has been reported when temperaturesexceed 60°C (Jongbloed and Kemme, 1990; Nunes, 1993);such a loss can result in reduced digestibility of phosphorusand calcium (Jongbloed and Kemme, 1990).
The phosphorus in inorganic phosphorus supplementsalso varies in bioavailability. The phosphorus in ammo-nium, calcium, and sodium phosphates is highly available(Kornegay, 1972b; Hays, 1976; Clawson and Armstrong,1981; Partridge, 1981; Tunmire et al., 1983; Cromwell etal., 1987; Cromwell, 1992). The phosphorus in steamedbone meal is less available than that in mono-dicalciumphosphate (Cromwell, 1992). The phosphorus in defluori-
nated rock phosphate is generally less available than inmonocalcium phosphate or monosodium phosphate(Cromwell, 1992; Coffey et al., 1994) but can vary depend-ing on source and processing (Kornegay and Radcliffe,1997). The phosphorus in high-fluorine rock phosphates,soft phosphate, colloidal clay, and Curac
¸ao phosphate is
poorly available (Chapman et al., 1955; Plumlee et al., 1958;Harmon et al., 1974b; Hays, 1976; Peo et al., 1982a,b).Estimates of the bioavailability of phosphorus in phospho-rus supplements are given in Chapter 11 (Table 11-8).
Little is known about the availability of calcium in naturalfeedstuffs. Because of the phytic acid content, the bioavail-ability of calcium in cereal grain–based diets, alfalfa, andvarious grasses and hays is relatively low (Soares, 1995).However, most feedstuffs contribute so little calcium tothe diet that bioavailability of the calcium is of little conse-quence. The calcium in calcitic limestone, gypsum, oyster-shell flour, aragonite, and marble dust is highly available(Pond et al., 1981; Ross et al., 1984), but the calcium indolomitic limestone is only 50 to 75 percent available (Rosset al., 1984). Particle size (up to 0.5 mm in diameter)appears to have little effect on calcium availability (Rosset al., 1984). Pig data are not available, but on the basisof poultry data, the calcium in dicalcium phosphate, trical-cium phosphate, defluorinated phosphate, calcium gluco-nate, calcium sulfate, and bone meal is highly available,generally 90 to 100 percent, when compared with the cal-cium in calcium carbonate (Baker, 1991; Soares, 1995).
Signs of calcium or phosphorus deficiency are similar tothose of vitamin D deficiency. They include depressedgrowth and poor bone mineralization, resulting in ricketsin young pigs and osteomalacia in older swine. A commonproblem of calcium- or phosphorus-deficient sows is aparalysis of the hind legs, called posterior paralysis. Theproblem occurs most frequently in sows producing highlevels of milk toward the end or just after the terminationof lactation.
Excess levels of calcium and phosphorus may reduceperformance of pigs (Hall et al., 1991; Reinhart and Mahan,1986), and the effect is greater when the calcium:phospho-rus ratio is increased. Excess calcium not only decreasesthe utilization of phosphorus but also increases the pig’srequirement for zinc in the presence of phytate (Lueckeet al., 1956; Whiting and Bezeau, 1958; Morgan et al.,1969; Oberleas, 1983). When the molar ratio of cations(zinc and calcium) was 2:1 or 3:1 with phytate, the forma-tion of an insoluble complex was much greater (Oberleasand Harland, 1996). Excess calcium also increases therequirement for vitamin K (Hall et al., 1991).
Sodium and Chlorine
Sodium and chlorine (chloride) are the principal extra-cellular cation and anion, respectively, in the body. Chlo-ride is the chief anion in gastric juice.
50 Nutrient Requirements of Swine
The dietary sodium requirement of growing-finishingpigs is no greater than 0.08 to 0.10 percent of the diet(Meyer et al., 1950; Alcantara et al., 1980; Cromwell etal., 1981a; Froseth et al., 1982a; Honeyfield and Froseth,1985; Honeyfield et al., 1985; Kornegay et al., 1991). Thedietary chlorine (chloride) requirement is less well definedbut is probably no higher than 0.08 percent for the growingpig (Froseth et al., 1982a; Honeyfield and Froseth, 1985;Honeyfield et al., 1985). A level of 0.20 to 0.25 percentadded sodium chloride will meet the dietary sodium andchlorine requirements of growing-finishing pigs fed a corn–soybean meal diet (Hagsten and Perry, 1976a,b; Hagstenet al., 1976). Mahan et al. (1996a,b) recently reported thatweanling pigs fed diets containing dried whey or driedplasma (both are relatively high in sodium) responded toadded sodium as sodium chloride or sodium phosphateand to added chloride as hydrochloric acid. Their resultsindicate that early-weaned pigs require more sodium andchlorine than previously thought. Thus, the estimateddietary sodium and chloride requirements have beenincreased to 0.25 percent of each from 3 to 5 kg, to 0.20percent of each from 5 to 10 kg, and to 0.15 percent ofeach from 10 to 20 kg body weight.
The sodium and chlorine requirements of breeding ani-mals are not well established. The results of one studysuggested that 0.3 percent dietary sodium chloride (0.12percent sodium) was not sufficient for pregnant sows(Friend and Wolynetz, 1981). In a regional study, pig birthweights and weaning weights were reduced when sodiumchloride was reduced from 0.50 to 0.25 percent duringgestation and lactation for two or more parities (Cromwellet al., 1989a). Based upon the sodium content of sow’smilk, which is 0.03 to 0.04 percent (Agricultural ResearchCouncil, 1981), the dietary sodium requirement should beabout 0.05 percentage unit greater during lactation thanduring gestation. Until more definitive information is avail-able, sodium chloride additions of 0.4 percent to gestationdiets and 0.5 percent to lactation diets are suggested.
The availability of sodium and chloride in most feedingredients is believed to be 90 to 100 percent (Miller,1980). The sodium in water, which in coastal regions canbe as high as 184 mg/L, and in defluorinated phosphate ishighly available for pigs (Kornegay et al., 1991).
A deficiency of sodium or chloride reduces the rate andefficiency of growth in pigs. In contrast, swine can toleratehigh dietary levels of sodium chloride (National ResearchCouncil, 1980), provided they have access to ample non-saline drinking water. If non-saline water is limited or ifthe level of sodium chloride in water is high, toxicity canresult. The high sodium ion concentration is responsiblefor adverse physiological reactions, apparently because ofa disturbance in water balance. The signs of sodium toxicityinclude nervousness, weakness, staggering, epileptic sei-
zures, paralysis, and death (Bohstedt and Grummer, 1954;Carson, 1986).
Sodium, potassium, and chloride are the primary dietaryions that influence the electrolyte balance and acid-basestatus of animals. Under most circumstances, dietary min-eral balance is expressed as milliequivalents (mEq) ofsodium plus potassium minus chloride ions (Na ` K 1Cl) (Mongin, 1981) and is often referred to as electrolytebalance. Patience and Wolynetz (1990) suggested that cal-cium, magnesium, sulfur, and phosphorus ions should alsobe included in the calculation of electrolyte balance. Theoptimal electrolyte balance in the diet for pigs is 250 mEqof excess cations (Na ` K 1 Cl)/kg of diet according toAustic and Calvert (1981), Golz and Crenshaw (1990), andHaydon et al. (1993); however, optimal growth has beenfound to occur over the range of 0 to 600 mEq/kg of diet(Patience et al., 1987; Kornegay et al., 1994). If a deficiencyof sodium, potassium, or chloride occurs in the diet, thenthe relationship, Na ` K 1 Cl, does not accurately predictdietary levels for optimum growth (Mongin, 1981).
Magnesium
Magnesium is a cofactor in many enzyme systems andis a constituent of bone. The magnesium requirement ofartificially reared pigs fed milk-based semipurified diets isbetween 300 and 500 mg/kg of diet (Mayo et al., 1959;Bartley et al., 1961; Miller et al., 1965a,c,d). Milk containsadequate magnesium to meet the requirement of sucklingpigs (Miller et al., 1965c,d). The magnesium requirementof weanling-growing-finishing swine is probably not higherthan that of the young pig. The magnesium in a corn–soybean meal diet (0.14 to 0.18 percent) is apparentlyadequate (Svajgr et al., 1969; Krider et al., 1975), althoughsome research suggests that the magnesium in naturalingredients is only 50 to 60 percent available to the pig(Miller, 1980; Nuoranne et al., 1980).
The magnesium requirement of breeding animals is notwell established. Harmon et al. (1976) fed semipurifieddiets containing 0.04 and 0.09 percent magnesium to sowsduring gestation, followed by 0.015 and 0.065 percent mag-nesium during lactation. They observed no difference inreproductive or lactational performance. However, in abalance study, sows fed the low level of magnesium duringlactation were in negative magnesium balance.
In order of appearance, signs of magnesium deficiencyinclude hyperirritability, muscular twitching, reluctance tostand, weak pasterns, loss of equilibrium, and tetany fol-lowed by death (Mayo et al., 1959; Miller et al., 1965c).The toxic level of magnesium is not known. The maximumtolerable level for swine is approximately 0.3 percent(National Research Council, 1980).
Minerals 51
Potassium
Potassium is the third most abundant mineral in thebody of the pig, surpassed only by calcium and phosphorus(Manners and McCrea, 1964), and is the most abundantmineral in muscle tissue (Stant et al., 1969). Potassium isinvolved in electrolyte balance and neuromuscular func-tion. It also serves as the monovalent cation to balanceanions intracellularly, as part of the sodium potassiumpump physiological mechanism.
The dietary potassium requirement of pigs from 1 to 4kg body weight is estimated to be between 0.27 and 0.39percent (Manners and McCrea, 1964); from 5 to 10 kg,0.26 to 0.33 percent (Jensen et al., 1961; Combs et al.,1985); at 16 kg, 0.23 to 0.28 percent (Meyer et al., 1950);and from 20 to 35 kg, less than 0.15 percent (Hughes andIttner, 1942; Mraz et al., 1958). No estimates are availablefor finishing or breeding pigs. The content of potassiumin most practical diets is normally adequate to meet theserequirements for all classes of swine. The potassium incorn and soybean meal is 90 to 97 percent available (Combsand Miller, 1985).
Dietary potassium is interrelated with dietary sodiumand chloride. Increasing dietary chloride from 0.03 to 0.60percent in purified diets depressed growth rate of youngpigs when the diet contained 0.1 percent potassium, but itincreased growth rate when the diet contained 1.1 percentpotassium (Golz and Crenshaw, 1990). The interactiveeffect of dietary potassium and chloride seems to be anindirect effect on the excretion and retention of additionalcations and anions, particularly ammonium and phosphate.The effects on growth are mediated via mechanisms involv-ing renal ammonium ion metabolism (Golz and Crenshaw,1991).
Potassium has been shown to spare lysine in the chick,but a similar response has not been demonstrated consis-tently in the pig (Leibholz et al., 1966; Madubuike etal., 1980; Austic and Calvert, 1981; Miller et al., 1981b;Wahlstrom and Libal, 1981; Froseth et al., 1982b,c; Millerand Froseth, 1982; Zimmerman, 1982; Mijada and Cline,1983). Madubuike and Austic (1989) suggested that thisinconsistency may be related to the lysine adequacy of thepig diet.
Signs of potassium deficiency include anorexia, roughhair coat, emaciation, inactivity, and ataxia (Jensen et al.,1961). Electrocardiograms of potassium-deficient pigsshowed reduced heart rate and increased electrocardialintervals (Cox et al., 1966). Necropsy of affected pigsrevealed no unique gross pathology.
The toxic level of potassium is not well established. Pigscan tolerate up to 10 times the potassium requirementif plenty of drinking water is provided (Farries, 1958).Intravenous infusion of potassium chloride in pigs resultedin abnormal electrocardiograms (Coulter and Swenson,1970).
Sulfur
Sulfur is an essential element. The sulfur provided bythe sulfur-containing amino acids seems adequate to meetthe pig’s needs for synthesis of sulfur-containing com-pounds, such as taurine, glutathione, lapoic acid, and chon-droitin sulfate. Additions of inorganic sulfate to low-proteindiets have not been beneficial (Miller, 1975; Baker, 1977).
M IC RO / TR AC E MI NE R AL S
Chromium
Chromium is involved in carbohydrate, lipid, protein,and nucleic acid metabolism (Nielsen, 1994). Although thespecific function of chromium is unknown, it is believedto work as a cofactor with insulin (White et al., 1993). Aglucose tolerance factor containing chromium potentiatedinsulin activity and was biologically active (Steele et al.,1977). Increased insulin sensitivity was reported for pigsfed chromium picolinate (Amoikon et al., 1995). Chro-mium added as chromium picolinate was reported byEvock-Clover et al. (1993) to lower serum insulin andglucose concentrations in growing pigs (30 to 60 kg). How-ever, in other studies serum glucose concentrations werenot influenced by feeding chromium (Page et al., 1993;Amoikon et al., 1995; Lindemann et al., 1995a). Linde-mann et al. (1995a) reported that postfeeding serum insu-lin values and insulin-to-glucose ratios were lower forfasted gestating sows fed chromium picolinate than forfasted control sows. Amoikon et al. (1995) also reportedthat when pigs were fed chromium picolinate, the fastingplasma insulin value was reduced; the clearance of glucoseafter an intravenous glucose tolerance test and insulinchallenge test was increased; and the half-life of glucosewas decreased.
Chromium, especially inorganic forms, is poorlyabsorbed from the gastrointestinal tract. The amount ofinorganic chromium absorbed ranges from 0.4 to 3 percentaccording to a review by Anderson (1987). Some organicforms are better absorbed than inorganic forms. Theabsorption by humans of chromium from chromium picoli-nate was low; 0.7 to 1.7 percent in one study (Clancy etal., 1994) and 1.5 to 5.2 percent in another (Gargas etal., 1994). Ward et al. (1995) evaluated several forms ofchromium (chloride, acetate, oxalate, nicotinate, twosources of picolinate, and nicotinate-glycine-cysteine-glu-tamate) that were fed to supply 200 ppb chromium, butfound that serum metabolites and hormone values were notaffected by any of the forms of chromium. Also, chromiumchloride (5 or 25 ppb chromium) or chromium picolinate(200 or 400 ppb chromium) did not affect serum metabo-lites in a study by Mooney and Cromwell (1997).
52 Nutrient Requirements of Swine
Recent interest has focused on the potential use of theorganic chromium complex, chromium picolinate, toincrease carcass leanness. Positive responses were reportedby Page et al. (1993), Lindemann et al. (1995b), Harperet al. (1995), Boleman et al. (1995), and Mooney and Crom-well (1995; 1997). However, others reported no responsesin carcass leanness to supplemental chromium in this form(Ward et al., 1995; Harris et al., 1995; Mooney and Crom-well, 1996). The lack of a consistent response may berelated to chromium levels of diets, form of chromium,chromium status of pig, and amino acid levels of diet (Whiteet al., 1993; Lindemann et al., 1995b). The total chromiumcontent of a corn–soybean diet can range from 750 to1,500 ppb, but most of this is probably unavailable.
Larger litters at birth have been reported for sows fedsupplemental chromium picolinate (Lindemann et al.,1995a,b). In one large trial, farrowing rate was increasedwhen first and second parity sows were fed 200 ppb chro-mium as chromium picolinate beginning on the day afterbreeding through farrowing, but total and live pigs bornwere not affected by treatments (Campbell, 1996). In asecond trial, multiparous sows were fed 200 ppb chromiumas chromium picolinate for the first 35 days after breeding;in a third trial they were fed the same amount for 28 daysprior to farrowing or for 28 days prior to farrowing throughlactation and for 35 days after breeding. The supplementa-tion had little effect on any measure of fertility or fecundity.
Additional research is required to elucidate the role ofchromium in swine. The inconsistency of biologicalresponses to chromium could be related to the bioavailabil-ity of the chromium found in traditional feed ingredients,the duration of feeding, and the chromium status of thepigs.
Trivalent and hexavalent are the two most commonforms of chromium; both are stable. Hexavalent chromiumis much more toxic than trivalent chromium, which isbelieved to be the essential trace mineral (Anderson, 1987;Mertz, 1993). Maximum tolerable dietary levels for domes-tic animals were set at 3,000 ppm chromium as the oxideand 1,000 ppm as the chloride (National Research Council,1980). A detailed discussion of tolerance concentration forchromium in animals can be found in Mineral Toleranceof Domestic Animals (National Research Council, 1980).The results of a recent in vitro study with Chinese hamsterovary cells indicate some chromosome damage after treat-ment with soluble doses of 0.05, 0.10, 0.50, and 1.0 mMof chromium picolinate (Stearns et al., 1996). Chromiumnicotinate, nicotinic acid, and trivalent chromium chloridehexahydrate did not produce chromosome damage atequivalent nontoxic doses. These results suggest the needfor further investigations of the long-term effects of supple-mental chromium. No quantitative estimate of the chro-mium requirement has been estimated for pigs. A recent
review on chromium was published by the NationalResearch Council (1997).
Cobalt
Cobalt is a component of vitamin B12 (Rickes et al.,1948). There is no evidence that pigs have an absoluterequirement for cobalt, other than for its role in vitaminB12. Cobalt can substitute for zinc in the enzyme carboxy-peptidase and for part of the zinc in the enzyme alkalinephosphatase. Hoekstra (1970) and Chung et al. (1976) haveshown that supplemental cobalt prevents lesions associatedwith a zinc deficiency.
Dietary cobalt can only be used by the intestinalmicroflora of the pig to synthesize some vitamin B12. Intesti-nal synthesis assumes greater importance if dietary vitaminB12 is limiting (Klosterman et al., 1950; Robinson, 1950;Kline et al., 1954). The use of supplemental vitamin B12
in practical diets is a routine practice.A level of 400 ppm cobalt was toxic to the young pig
and may cause anorexia, stiff-leggedness, humped back,incoordination, muscle tremors, and anemia (Huck andClawson, 1976). Cobalt concentration in the kidney andliver increased linearly and growth decreased linearly overa 4- to 5-week period as 0, 150, and 300 ppm cobalt wereadded to a basal diet containing ,2 ppm cobalt (Kornegayet al., 1995). The maximum tolerance level for weanlingpigs is ,150 ppm of diet. Selenium, vitamin E, and cysteineprovide some protection against toxicity from excessivelevels of dietary cobalt (Van Vleet et al., 1977; Southernand Baker, 1981), but growth-stimulating levels of coppermay aggravate the growth depression caused by cobalt(Kornegay et al., 1995).
Copper
The pig requires copper for the synthesis of hemoglobinand for the synthesis and activation of several oxidativeenzymes necessary for normal metabolism (Miller et al.,1979). A level of 5 to 6 ppm in the diet is adequate forthe neonatal pig (Okonkwo et al., 1979; Hill et al., 1983a).The requirement for later stages of growth is probablyno greater than 5 to 6 ppm. Definitive information onrequirements during gestation and lactation are scarce.Lillie and Frobish (1978) suggested that 60 ppm of copperfed to sows improved pig weights at birth and at weaning,but this response may have resulted from the pharmacolog-ical effect of high dietary copper. Kirchgessner et al. (1980)found that pregnant sows fed 2 ppm of copper had reducedceruloplasmin and farrowed more stillborn pigs than sowsfed 9.5 ppm of copper. In a balance study, Kirchgessneret al. (1981) estimated the copper requirement of pregnantsows at 6 ppm.
Minerals 53
Copper salts with high biological availabilities includethe sulfate, carbonate, and chloride salts (Miller, 1980;Cromwell et al., 1998). The copper in cupric sulfide andcupric oxide is poorly available to the pig (Cromwell et al.,1978, 1989b; Sazzad et al., 1993). Organic complexes ofcopper appear to have equal bioavailability to copper sul-fate in several trials (Bunch et al., 1965; Zoubek et al.,1975; Stansbury et al., 1990; Coffey et al., 1994; Apgar etal., 1995). However, in two trials reported by Coffey et al.(1994) and Zhou et al. (1994a), growth performance wasgreater in pigs fed growth-promotion levels of copper froma copper lysine complex than those fed copper sulfate.
A deficiency of copper leads to poor iron mobilization;abnormal hemopoiesis; and poor keratinization and synthe-sis of collagen, elastin, and myelin. Copper deficiency signsinclude a microcytic, hypochromic anemia; bowing of thelegs; spontaneous fractures; cardiac and vascular disorders;and depigmentation (Hart et al., 1929; Elvehjem and Hart,1932; Teague and Carpenter, 1951; Follis et al., 1955;Carter et al., 1959; Carnes et al., 1961; Hill et al., 1983a).
Copper may be toxic when dietary levels in excess of250 ppm are fed for extended periods of time (NationalResearch Council, 1980). Toxicity signs include depressedhemoglobin levels and jaundice, which are the results ofexcessive copper accumulation in the liver and other vitalorgans. Reduced dietary levels of zinc and iron or highlevels of dietary calcium accentuate copper toxicity (Suttleand Mills, 1966a,b; Hedges and Kornegay, 1973; Prince etal., 1984).
When fed at 100 to 250 ppm, copper (as copper sulfate)stimulates growth in pigs (Barber et al., 1955b; Braude,1967, 1975; Wallace, 1967; Cromwell et al., 1981b; Kor-negay et al., 1989; Cromwell, 1997). The growth responseto copper in young pigs is independent of, and in additionto, the growth response to other antibacterial agents (Stahlyet al., 1980; Roof and Mahan, 1982; Edmonds et al., 1985;Cromwell 1997). The response to high levels of coppermay be enhanced by added fat (Dove and Haydon, 1992;Dove, 1993a, 1995). The continuous feeding of high copperlevels to sows for up to six consecutive gestation–lactationcycles did not have any apparent negative effects on repro-ductive performance, in spite of rather large increases inliver and kidney copper concentrations (Cromwell et al.,1993a). In fact, birth and weaning weights were greater inpigs from sows fed high copper. Improved weight gain ofsuckling pigs was also observed by Lillie and Frobish(1978), but other studies in which copper was fed duringlate gestation and lactation (Thacker, 1991) or during lacta-tion (Roos and Easter, 1986; Dove, 1993b) showed noresponse to added copper in weight gain of suckling pigs.
The mechanisms through which beneficial effects fromcopper are observed are unknown. The growth-stimulatingaction of dietary copper has been attributed to its antimi-crobial actions (Fuller et al., 1960); however, evidence
supporting this hypothesis is lacking. A correlation betweenthe availability of copper and the growth-promoting actionof copper has been observed (Bowland et al., 1961; Crom-well et al., 1989b). Zhou et al. (1994b) reported that bothbody weight gain and serum mitogenic activity were stimu-lated in young pigs given intravenous injections of copperhistidinate every other day for 18 days. Because the gastro-intestinal tract was bypassed in this study, these resultssuggest that copper can act systemically to promote growth.Feeding 250 ppm copper stimulated lipase and phospholi-pase A activities and led to an improvement of dietary fatdigestibility in weaning pigs (Luo and Dove, 1996). Highdietary levels of copper increase fecal copper excretion,but the form of copper in pig feces is poorly bioavailableto chickens and sheep (Prince et al., 1975; Izquierdo andBaker, 1986).
Iodine
The majority of the iodine in swine is present in thethyroid gland, where it exists as a component of mono-,di-, tri-, and tetraiodothyronine (thyroxine). These hor-mones are important in the regulation of metabolic rate.Hart and Steenbock (1918), Kalkus (1920), and Welch(1928) demonstrated that hypothyroidism existed in swineraised in the northwestern United States and the GreatLakes region because of iodine-deficient feedstuffs pro-duced on low-iodine soil.
The dietary iodine requirement is not well established.The requirement is increased by goitrogens, which arepresent in certain feedstuffs, including rapeseed, linseed,lentils, peanuts, and soybeans (McCarrison, 1933; Under-wood, 1977). A level of 0.14 ppm of iodine in a corn–soybean meal diet is adequate to prevent thyroid hypertro-phy in growing pigs (Cromwell et al., 1975). A level of 0.35ppm of added iodine prevented iodine deficiency in sows(Andrews et al., 1948).
Calcium iodate, potassium iodate, and pentacalciumorthoperiodate are nutritionally available forms of iodineand are more stable in salt mixtures than are sodium iodideor potassium iodide (Kuhajek and Andelfinger, 1970). Theincorporation of iodized salt (0.007 percent iodine), at alevel of 0.2 percent of the diet, provides sufficient iodine(0.14 ppm) to meet the needs of growing pigs fedgrain–soybean meal diets.
A severe iodine deficiency causes pigs to be stunted andlethargic and to have an enlarged thyroid (Beeson et al.,1947; Braude and Cotchin, 1949; Sihombing et al., 1974).Sows fed iodine-deficient, goitrogenic diets farrow weakor dead pigs that are hairless, show symptoms of myx-edema, and have an enlarged, hemorrhagic thyroid (Hartand Steenbock, 1918; Slatter, 1955; Devilat and Skoknic,1971).
54 Nutrient Requirements of Swine
A dietary iodine level of 800 ppm depressed growth,hemoglobin level, and liver iron concentration in growingpigs (Newton and Clawson, 1974). During lactation andthe last 30 days of gestation, as much as 1,500 to 2,500 ppmof iodine was not harmful to sows (Arrington et al., 1965).
Iron
Iron is required as a component of hemoglobin in redblood cells. Iron also is found in muscle as myoglobin, inserum as transferrin, in the placenta as uteroferrin, in milkas lactoferrin, and in the liver as ferritin and hemosiderin(Zimmerman, 1980; Ducsay et al., 1984). It also plays animportant role in the body as a constituent of several meta-bolic enzymes. Pigs are born with about 50 mg of iron,most of which is present as hemoglobin (Venn et al., 1947).A high level of iron fed to sows during late gestation (Bradyet al., 1978) or parenteral administration of iron dextranto sows in gestation (Rydberg et al., 1959; Pond et al.,1961; Ducsay et al., 1984) does not substantially increaseplacental transfer of iron to fetuses.
The suckling pig must retain 7 to 16 mg of iron daily,or 21 mg of iron/kg of body weight gain to maintain ade-quate levels of hemoglobin and storage iron (Venn et al.,1947; Braude et al., 1962). Sow’s milk contains an averageof only 1 mg of iron per liter (Brady et al., 1978). Thus,pigs receiving only milk rapidly develop anemia (Hart etal., 1929; Venn et al., 1947). Feeding of high levels ofvarious iron compounds, including iron sulfate and ironchelates, to gestating and lactating sows does not increasethe iron content of milk to an extent that iron deficiencycan be prevented. These levels can, however, prevent irondeficiency in suckling pigs that have access to the sow’sfeces (Chaney and Barnhart, 1963; Veum et al., 1965;Spruill et al., 1971; Brady et al., 1978; Sansom and Gleed,1981; Gleed and Sansom, 1982).
The iron requirement of young pigs fed milk or purifiedliquid diets is 50 to 150 mg/kg of milk solids (Matrone etal., 1960; Ullrey et al., 1960; Manners and McCrea, 1964;Harmon et al., 1967; Hitchcock et al., 1974). Miller et al.(1982) suggested a requirement of 100 mg of iron/kg ofmilk solids for pigs raised in a conventional or germ-freeenvironment. The iron requirement of pigs fed a dry,casein-based diet is about 50 percent higher per unit ofdry matter than for those fed a similar diet in liquid form(Hitchcock et al., 1974).
Numerous studies have shown the effectiveness of asingle intramuscular injection of 100 to 200 mg of iron, inthe form of iron dextran, iron dextrin, or gleptoferron givenin the first 3 days of life (Barber et al., l955a; McDonaldet al., 1955; Maner et al., 1959; Rydberg et al., 1959; Ullreyet al., 1959; Zimmerman et al., 1959; Linkenheimer et al.,1960; Wahlstrom and Juhl, 1960; Kernkamp et al., 1962;Parsons, 1979; Pollmann et al., 1983). The intestinal
mucosa of the newborn pig actively absorbs iron (Furugouriand Kawabata, 1975, 1976, 1979). Oral administration ofiron from bioavailable inorganic or organic sources withinthe first few hours of life also will meet the iron needs ofthe suckling pig. However, early administration, before gutclosure to large molecules, is crucial (Harmon et al., 1974a;Thoren-Tolling, 1975). An excessive level (more than 200mg) of injectable or oral iron should be avoided becauseunbound serum iron encourages bacterial growth andresults in increased susceptibility to infection and diarrhea(Weinberg, 1978; Klasing et al., 1980; Knight et al., 1983;Kadis et al., 1984).
The postweaning dietary iron requirement is about 80ppm (Pickett et al., 1960). In later growth and maturity,this requirement diminishes as the rate of increase in bloodvolume slows. Natural feed ingredients usually supplyenough iron to meet postweaning requirements. Feed-grade defluorinated phosphate and dicalcium phosphate,which contain from 0.6 to 1.0 percent iron, also supplysubstantial amounts of iron. The iron in defluorinated phos-phate is about 65 percent as available to the pig as the ironin ferrous sulfate (Kornegay, 1972a).
Availability of iron from different sources varies greatly(Zimmerman, 1980). Ferrous sulfate, ferric chloride, ferriccitrate, ferric choline citrate, and ferric ammonium citrateare effective in preventing iron deficiency anemia (Harmonet al., 1967; Ammerman and Miller, 1972; Ullrey et al.,1973; Miller et al., 1981a). Iron compounds with low solu-bility, such as ferric oxide, are ineffective (Ammermanand Miller, 1972). The bioavailability of iron in ferrouscarbonate is lower and more variable than that of iron inferrous sulfate (Harmon et al., 1969; Ammerman et al.,1974). Iron from iron methionine was 68 to 81 percent asbioavailable as that in iron sulfate (Lewis et al., 1995).Soybean meal contains 175 to 200 ppm of iron, and thebioavailability of iron in soybean meal has been estimatedto be 38 percent, based on hemoglobin depletion–repletionassays in chicks (Biehl et al., 1997).
The hemoglobin concentration of blood is a reliableindicator of the pig’s iron status, and it is easy to determine.Hemoglobin levels of 10 g/dL of whole blood are consid-ered adequate. A hemoglobin level of 8 g/dL suggestsborderline anemia, and a level of 7 g/dL or less representsanemia (Zimmerman, 1980). The type of anemia resultingfrom iron deficiency is hypochromic-microcytic anemia.Anemic pigs show evidence of poor growth, listlessness,rough hair coats, wrinkled skin, and paleness of mucousmembranes. Fast-growing anemic pigs may die suddenlyof anoxia. A characteristic sign is labored breathing afterminimal activity or a spasmodic jerking of the diaphragmmuscles, from which the term ‘‘thumps’’ arises. Necropsyfindings include an enlarged and fatty liver; thin, wateryblood; marked dilation of the heart; and an enlarged firm
Minerals 55
spleen. Anemic pigs are more susceptible to infectiousdiseases (Osborne and Davis, 1968).
In 3- to 10-day-old pigs, the toxic oral dose of iron fromferrous sulfate is approximately 600 mg/kg of body weight(Campbell, 1961). Clinical signs of toxicity are observedwithin 1 to 3 hours after iron is fed (Nilsson, 1960; Arpiand Tollerz, 1965). Lannek et al. (1962) and Patterson etal. (1967, 1969) have found that injectable iron (100 mgas iron dextran) is toxic to pigs from vitamin E–deficientdams. A dietary level of 5,000 ppm of iron produces rachiticlesions, which may be prevented by increasing the levelof dietary phosphorus (O’Donovan et al., 1963; Furu-gouri, 1972).
Manganese
Manganese functions as a component of several enzymesinvolved in carbohydrate, lipid, and protein metabolism.Manganese is essential for the synthesis of chondroitinsulfate, a component of mucopolysaccharides in the organicmatrix of bone (Leach and Muenster, 1962).
The dietary requirements for manganese are quite low(Johnson, 1944) and not well established. The manganesestatus of the sow affects the manganese status of the neo-nates, because manganese readily crosses the placenta(Newland and Davis, 1961; Gamble et al., 1971). Leibholzet al. (1962) reported that as little as 0.4 ppm of manganeseis sufficient for young pigs. With manganese-depleteddams, however, the requirement for the neonates is 3 to6 ppm (Kayongo-Male et al., 1975). A corn–soybean mealdiet should contain ample manganese for normal growthand bone formation in growing-finishing pigs (Svajgr etal., 1969).
Long-term feeding of a diet containing only 0.5 ppm ofmanganese results in abnormal skeletal growth, increasedfat deposition, irregular or absent estrous cycles, resorbedfetuses, small, weak pigs at birth, and reduced milk produc-tion (Plumlee et al., 1956).
On the basis of manganese retention, Kirchgessner et al.(1981) estimated the manganese requirement of pregnantsows at 25 ppm. Total litter weight at birth was less forsows fed a low-manganese, basal corn–soybean meal diet(10 ppm manganese) than for sows fed the basal diet plus 84ppm manganese (Rheaume and Chavaz, 1989). Colostrumand milk from sows fed supplemental manganese containeda higher concentration of manganese, but retention of man-ganese was only numerically higher. Christianson et al.(1989, 1990) reported that birth weight of pigs was greaterwhen sows were fed 10 or 20 ppm manganese than whenthey were fed 5 ppm. Also, return to estrus was improvedby feeding 20 ppm manganese. On the basis of these recentstudies, the manganese requirements for gestation and lac-tation have been increased to 20 ppm of the diet.
Although the toxic level of manganese is not well defined,depressed feed intake and reduced growth rates have beenobserved when pigs were fed 4,000 ppm of manganese(Leibholz et al., 1962). A dietary level of 2,000 ppm ofmanganese resulted in reduced hemoglobin levels(Matrone et al., 1959), and 500 ppm of manganese reducedgrowth rate and resulted in limb stiffness in growing pigs(Grummer et al., 1950).
Selenium
Selenium is a component of the enzyme glutathioneperoxidase (Rotruck et al., 1973), which detoxifies lipidperoxides and provides protection of cellular and subcellu-lar membranes against peroxide damage. Thus, the mutualsparing effect of selenium and vitamin E stems from theirshared antiperoxidant roles. High levels of vitamin E, how-ever, do not completely eliminate the need for selenium(Ewan et al., 1969; Bengtsson et al., 1978a,b; Hakkarainenet al., 1978). Selenium has been shown to have a functionin thyroid metabolism, because iodothyronine 58-deiodi-nase has been identified as a selenoprotein (Arthur, 1994).
The dietary requirement for selenium ranges from 0.3ppm for weanling pigs to 0.15 ppm for finishing pigs andsows (Groce et al., 1971, 1973a,b; Ku et al., 1973; Mahanet al., 1973; Ullrey, 1974; Young et al., 1976; Glienke andEwan, 1977; Wilkinson et al., 1977a,b; Mahan and Moxon,1978a,b, 1984; Piatkowski et al., 1979; Meyer et al., 1981).The requirement for selenium is influenced by dietaryphosphorus level (Lowry et al., 1985b) but not dietarycalcium level (Lowry et al., 1985a). Several forms of sele-nium, including selenium-enriched yeast, sodium selenite,and sodium selenate, are effective in meeting the dietaryrequirement (Mahan and Magee, 1991; Suomi and Alavi-uhkola, 1992; Mahan and Parrett, 1996; Mahan and Kim,1996). The selenium status of the dam influences reproduc-tive performance and the selenium requirement of sucklingand weanling pigs (Van Vleet et al., 1973; Mahan et al.,1977; Piatkowski et al., 1979; Chavez, 1985; Ramisz et al.,1993). Total body retention of selenium, as well as serumand tissue levels of selenium in growing, finishing, andreproducing gilts and their suckling progeny, increased asthe dietary level of selenium increased (0.1 to 0.3 or 0.5ppm); the amount of selenium retained and stored wasusually greater at the various selenium levels when theeffects of a selenium-enriched yeast source were comparedwith those produced by sodium selenite (Mahan, 1995;Mahan and Kim, 1996; Mahan and Parrett, 1996). In repro-ducing gilts, serum glutathione peroxidase activity was notimproved beyond 0.1 ppm selenium, and the increase inactivity was similar for selenium-enriched yeast and sodiumselenite (Mahan and Kim, 1996). In growing-finishing pigs,serum selenium concentration and serum glutathione per-oxidase activity reached a plateau at a dietary level of 0.1

56 Nutrient Requirements of Swine
ppm selenium for selenium-enriched yeast and sodiumselenite, but the magnitude of the response was lower forthe yeast than for the sodium selenite, which suggests thatthe selenium-enriched yeast product was less biologicallyavailable than sodium selenite (Mahan and Parrett, 1996).About 50 percent of the selenium in the selenium-enrichedyeast product was suggested to be selenomethionine, withthe remainder in one of several seleno-amino acids or astheir analogs (Mahan, 1995).
Certain soils of the United States and Canada are lowin selenium. When diets consist exclusively of ingredientsgrown in such regions, selenium will be deficient unlesssupplemental selenium is added (Grant et al., 1961; Trappet al., 1970; Ewan, 1971; Groce et al., 1971; Sharp et al.,1972a,b; Ku et al., 1973; Mahan et al., 1973, 1974; Diehlet al., 1975; Doornenbal, 1975; Piper et al., 1975; Wilkinsonet al., 1977b; Bengtsson et al., 1978b). Environmental stressmay increase the incidence and degree of selenium defi-ciency (Michel et al., 1969; Mahan et al., 1975).
In 1974, the U.S. Food and Drug Administration (FDA)approved the addition of 0.1 ppm of selenium to all swinediets. In 1982, the FDA approved the addition of 0.3 ppmof selenium to diets for pigs up to 20 kg, because 0.1 ppmof added selenium does not always prevent deficiency signsin weanling pigs (Mahan and Moxon, 1978b; Meyer et al.,1981). The current regulation allows up to 0.3 ppm ofselenium in the diet for all pigs (Food and Drug Adminis-tration, 1987a,b). As reviewed by Ullrey (1992), concernsabout environmental pollution by selenium have led toefforts to reduce the level to 0.1 ppm, but the level of 0.3ppm has been maintained.
The primary biochemical change in selenium deficiencyis a decline in glutathione peroxidase activity (Thompsonet al., 1976; Young et al., 1976; Fontaine and Valli, 1977).Hence, the level of glutathione peroxidase in the plasmais a reliable index of the selenium status of pigs (Chavez,1979a,b; Wegger et al., 1980; Adkins and Ewan, 1984).Sudden death is a prominent feature of the selenium-deficiency syndrome (Ewan et al., 1969; Groce et al., 1971,1973a,b). The gross necropsy lesions of selenium deficiencyare identical to those of vitamin E deficiency. These includemassive hepatic necrosis (hepatosis dietetica); edema of thespiral colon, lungs, subcutaneous tissues, and submucosa ofthe stomach; bilateral paleness and dystrophy of the skele-tal muscles (white muscle disease); mottling and dystrophyof the myocardium (mulberry heart disease); impairedreproduction; reduced milk production; and impairedimmune response (Eggert et al., 1957; Orstadius et al.,1959; Lindberg and Siren, 1963, 1965; Michel et al., 1969;Trapp et al., 1970; Sharp et al., 1972a,b; Ruth and VanVleet, 1974; Ullrey, 1974; Fontaine et al., 1977a,b,c; Niel-sen et al., 1979; Sheffy and Schultz, 1979; Peplowski etal., 1980; Spallholz, 1980; Larsen and Tollersrud, 1981;Simesen et al., 1982).
When fed to growing swine as sodium selenite, sodiumselenate, selenomethionine, or seleniferous corn, seleniumdoes not produce toxicity at levels of less than 5 ppm. Insome cases, however, a level of 5 ppm (Mahan and Moxon,1984) and levels from 7.5 to 10 ppm (Wahlstrom et al.,1955; Trapp et al., 1970; Herigstad et al., 1973; Goehringet al., 1984a,b) have produced toxicity. Signs of toxicityinclude anorexia, hair loss, fatty infiltration of the liver,degenerative changes in the liver and kidney, edema, occa-sional separation of hoof and skin at the coronary band(Miller, 1938; Miller and Williams, 1940; Wahlstrom etal., 1955; Orstadius, 1960; Lindberg and Lannek, 1965;Herigstad et al., 1973), and symmetrical, focal areas ofvacuolation and neuronal necrosis (Stowe and Herdt,1992). Dietary arsenicals help to alleviate selenium toxicity(Wahlstrom et al., 1955).
Zinc
Zinc is a component of many metalloenzymes, includingDNA and RNA synthetases and transferases, many diges-tive enzymes, and is associated with the hormone, insulin.Hence, this element plays an important role in protein,carbohydrate, and lipid metabolism.
Many diet-related factors influence the dietary require-ment for zinc (Miller et al., 1979), including phytic acidor plant phytates (Oberleas et al., 1962; Oberleas, 1983),calcium (Tucker and Salmon, 1955; Hoekstra et al., 1956;Lewis et al., 1956, 1957a,b; Luecke et al., 1956,1957; Ste-venson and Earle, 1956; Bellis and Philp, 1957; Newlandet al., 1958; Whiting and Bezeau, 1958; Berry et al., 1961;Hansard and Itoh, 1968; Morgan et al., 1969; Norrdin etal., 1973; Oberleas, 1983), copper (Hoefer et al., 1960;O’Hara et al., 1960; Ritchie et al., 1963; Kirchgessner andGrassman, 1970), cadmium (Pond et al., 1966), cobalt(Hoekstra, 1970), ethylenediamine tetraacetic acid(EDTA) (Owen et al., 1973), histidine (Dahmer et al.,1972a), and protein level and source (Smith et al., 1962;Dahmer et al., 1972b).
The zinc requirement of young pigs consuming acasein–glucose diet is low (15 ppm) because such a dietdoes not contain plant phytates (Smith et al., 1962; Shanklinet al., 1968). For growing pigs fed semipurified diets thatcontain isolated soybean protein or corn–soybean mealdiets (both diets contain significant amounts of phytate)that contain the recommended level of calcium, the zincrequirement is about 50 ppm (Lewis et al., 1956, 1957a,b;Luecke et al., 1956; Stevenson and Earle, 1956; Smith etal., 1958, 1962; Miller et al., 1970). Boars have a higher zincrequirement than gilts; and gilts have a higher requirementthan barrows (Liptrap et al., 1970; Miller et al., 1970).The zinc requirement is increased when excessive levelsof calcium are fed (Lewis et al., 1956; Forbes, 1960; Hoeferet al., 1960; Pond and Jones, 1964; Pond et al., 1964;

Minerals 57
Oberleas, 1983). The zinc requirement of breeding animalsis not well established, but may be higher than for growingpigs due to fetal growth, milk synthesis, tissue repair duringuterine involution, and sperm production in boars. A levelof 33 ppm of zinc in a corn–soybean meal diet for sowsthrough five parities was adequate for optimal gestationperformance, but not for lactation (Hedges et al., 1976).Kirchgessner et al. (1981) estimated the zinc requirementof pregnant sows at 25 ppm in a balance study. A lowlevel of dietary zinc (13 ppm) during the last 4 weeks ofpregnancy prolongs the duration of farrowing (Kalinowskiand Chavez, 1984).
The classic sign of zinc deficiency in growing pigs ishyperkeratinization of the skin, a condition called paraker-atosis (Kernkamp and Ferrin, 1953; Tucker and Salmon,1955). Zinc deficiency reduces the rate and efficiency ofgrowth and levels of serum zinc, alkaline phosphatase, andalbumin (Hoekstra et al., 1956, 1967; Luecke et al., 1957;Theuer and Hoekstra, 1966; Miller et al., 1968, 1970; Pra-sad et al., 1969, 1971; Ku et al., 1970). Gilts fed zinc-deficient diets during gestation and lactation produce fewerand smaller pigs, which have reduced serum and tissuezinc levels (Pond and Jones, 1964; Hoekstra et al., 1967;Hill et al., 1983a,b,c). The zinc concentration in the milkfrom these dams is also reduced (Pond and Jones, 1964).Zinc deficiency retards testicular development of boars andthymic development of young pigs (Miller et al., 1968;Liptrap et al., 1970).
Bioavailabilities of zinc from zinc salts vary when theseare included in the diet and can be influenced by the typeof dietary ingredients used (Miller, 1991). The zinc in zincsulphate, zinc carbonate, zinc chloride, and zinc metal dustis highly available (100 percent). Bioavailability estimatesare expressed as a percentage of a recognized standardand do not refer to percentage absorbed or retained.Absorbed and retained zinc as a percentage of intake isusually much less than 50 percent of the intake. Zinc isless available from zinc oxide (50 to 80 percent) and ispoorly available from zinc sulfide (Miller, 1991). Zinc fromorganic complexes appears to have approximately equalbioavailability to the zinc in zinc sulfate (Hill et al., 1986;Swinkels et al., 1996; Hahn and Baker, 1993; Wedekindet al., 1994; Cheng and Kornegay, 1995; Cheng et al., 1995;Schell and Kornegay, 1996). Zinc from grains and plantprotein has low availability (Miller, 1991), but the availabil-ity is enhanced by microbial phytase addition to the diet(Kornegay, 1996).
Zinc toxicity in growing pigs fed a corn–soybean mealdiet supplemented with 2,000 to 4,000 ppm zinc from zinccarbonate was manifested by depression, arthritis, hemor-rhage in axillary spaces, gastritis, and death. However, adietary zinc level of 1,000 ppm was not toxic (Brink et al.,1959). Growing pigs fed 2,000 to 4,000 ppm of zinc fromzinc oxide did not show symptoms of zinc toxicity (Cox
and Hale, 1962; Hsu et al., 1975; Hill et al., 1983b). How-ever, pigs became lame and unthrifty within 2 monthswhen they were fed a diet containing 1,000 ppm of zincfrom zinc lactate (Grimmett et al., 1937). In contrast,pigs fed a diet containing 1,000 ppm of zinc from zincsulphate for 7 months showed no signs of zinc toxicity(Kulwich et al., 1953). High dietary calcium reduces theseverity of zinc toxicity (Hsu et al., 1975). A 5,000-ppmdietary level of zinc as zinc oxide through two paritiesreduced litter size and pig weight at weaning and causedosteochondrosis in sows (Hill and Miller, 1983; Hill et al.,1983a). Pigs from sows fed high levels of dietary zinc havereduced tissue levels of copper and rapidly develop anemiawhen fed a low-copper diet (Hill et al., 1983b,c). Thetoxicity of zinc depends upon the zinc source, dietary level,the duration of feeding, and the levels of other mineralsin the diet.
A report that reduced postweaning scouring andincreased weight gain resulted when the starting diet wassupplemented with 3,000 ppm of zinc from zinc oxide for14 days (Poulsen, 1989) stimulated a great deal of interestin the pharmacological use of zinc. Several recent studieshave confirmed this finding and have shown improvedweight gain even in the absence of scouring (Kavanagh,1992; Hahn and Baker, 1993; Carlson et al., 1995; LeMieuxet al., 1995; McCully et al., 1995; Smith et al., 1995a,b;Hill et al., 1996). Levels of zinc varied from 2,000 to 6,000ppm and were fed for up to 5 weeks in some studies. Arecent study (Ward et al., 1996) compared zinc oxide andzinc methionine; they reported that supplementing starterdiets with 250 ppm zinc from zinc methionine gave equalimprovements in performance to 2,000 ppm zinc fromzinc oxide. Some studies, however, have failed to observebeneficial effects of pharmacological levels of zinc (Fryeret al., 1992; Tokach et al., 1992; Schell and Kornegay,1996). A recent large regional study showed that highdietary levels of zinc (3,000 ppm, as zinc oxide) and copper(250 ppm, as copper sulfate) were both efficacious, butwere not additive in terms of growth promotion when theywere added in combination to diets for weanling pigs (Hillet al., 1996).
R EF ER E NC ES
Adkins, R. S., and R. C. Ewan. 1984. Effect of selenium on performance,serum selenium concentration and glutathione peroxidase activity inpigs. J. Anim. Sci. 58:346–350.
Agricultural Research Council. 1981. The Nutrient Requirements of Pigs:Technical Review. Rev. ed. Slough, England. Commonwealth Agricul-tural Bureaux. xxii, 307 pp.
Alcantara, P. F., L. E. Hanson, and J. D. Smith. 1980. Sodium require-ments, balance and tissue composition of growing pigs. J. Anim. Sci.50:1092–1101.
Ammerman, C. B., and S. M. Miller. 1972. Biological availability of minormineral ions: A review. J. Anim. Sci. 35:681–694.
58 Nutrient Requirements of Swine
Ammerman, C. B., J. F. Standish, C. E. Holt, R. H. Houser, S. M. Miller,and G. E. Combs. 1974. Ferrous carbonates as sources of iron forweanling pigs and rats. J. Anim. Sci. 38:52–58.
Ammerman, C. B., D. H. Baker, and A. J. Lewis, Jr. 1995. Bioavailability ofNutrients for Animals. Amino Acid, Minerals and Vitamins. AcademicPress, New York: 441 pp.
Amoikon, E. K., J. M. Fernandez, L. L. Southern, D. L. Thompson, Jr.,T. L. Ward, and B. M. Olcott. 1995. Effect of chromium tripicolinateon growth, glucose tolerance, insulin sensitivity, plasma metabolites,and growth hormone in pigs. J. Anim. Sci. 73:1123–1130.
Anderson, R. A. 1987. Chromium in animal tissues and fluids. Pp. 225–244in Trace Elements in Human and Animal Nutrition. W. Mertz, ed.Vol. 1. 5th edition. New York: Academic Press, Inc.
Andrews, F. N., C. L. Shrewsbury, C. Harper, C. M. Vestal, and L. P.Doyle. 1948. Iodine deficiency in newborn sheep and swine. J. Anim.Sci. 7:298–310.
Apgar, G. A., E. T. Kornegay, M. D. Lindemann, and D. R. Notter. 1995.Evaluation of copper sulfate and a copper lysine complex as growthpromotants for weanling swine. J. Anim. Sci. 73:2640–2646.
Arpi, T., and G. Tollerz. 1965. Iron poisoning in piglets: Autopsy findingsin spontaneous and experimental cases. Acta Vet. Scand. 6:360–373.
Arrington, L. R., R. N. Taylor, Jr., C. B. Ammerman, and R. L. Shirley.1965. Effects of excess dietary iodine upon rabbits, hamsters, rats andswine. J. Nutr. 87:394–398.
Arthur, John R. 1994. The biochemical functions of selenium: Relation-ships to thyroid metabolism and antioxidant systems. Pp. 11–20 inRowett Research Institute Annual Report for 1993, Rowett ResearchInstitute, Bucksburn, Aberdeen, UK.
Arthur, S. R., E. T. Kornegay, H. R. Thomas, H. P. Veit, D. R. Notter,and R. A. Barczewski. 1983a. Restricted energy intake and elevatedcalcium and phosphorus intake for gilts during growth. III. Character-ization of feet and limbs and soundness scores of sows during threeparities. J. Anim. Sci. 56:876–886.
Arthur, S. R., E. T. Kornegay, H. R. Thomas, H. P. Veit, D. R. Notter,K. E. Webb, Jr., and J. L. Baker. 1983b. Restricted energy intake andelevated calcium and phosphorus intake for gilts during growth. IV.Characterization of metacarpal, metatarsal, femur, humerus and turbi-nate bones of sows during three parities. J. Anim. Sci. 57:1200–1214.
Austic, R. E., and C. C. Calvert. 1981. Nutritional interrelationships ofelectrolytes and amino acids. Fed. Proc. 40:63–67.
Baker, D. H. 1977. Sulfur in Nonruminant Nutrition. West Des Moines,Iowa: National Feed Ingredient Association. 123 pp.
Baker, D. H. 1991. Bioavailability of minerals and vitamins. Pp. 341–359in Swine Nutrition, E. R. Miller, D. E. Ullrey, and A. J. Lewis, eds.Boston: Butterworth-Heinemann.
Barber, R. S., R. Braude, and K. G. Mitchell. 1955a. Studies on anemiain pigs. 1. The provision of iron by intramuscular injection. Vet.Rec. 67:348–349.
Barber, R. S., R. Braude, K. G. Mitchell, and J. Cassidy. 1955b. Highcopper mineral mixtures for fattening pigs. Chem. Ind. 601–603.
Bartley, J. C., E. F. Reber, J. W. Yusken, and H. W. Norton. 1961. Magne-sium balance study in pigs three to five weeks of age. J. Anim. Sci.20:137–141.
Bayley, H. S., and R. G. Thomson. 1969. Phosphorus requirements ofgrowing pigs and effect of steam pelleting on phosphorus availability.J. Anim. Sci. 28:484–491.
Bayley, H. S., J. Pos, and R. G. Thomson. 1975. Influence of steampelleting and dietary calcium level on the utilization of phosphorus bythe pig. J. Anim. Sci. 40:857–863.
Beeson, W. M., F. N. Andrews, H. L. Witz, and T. W. Perry. 1947. Theeffect of thyroprotein and thiouracil on the growth and fattening ofswine. J. Anim. Sci. 6:482. (Abstr.)
Bellis, D. B., and J. M. Philp. 1957. Effect of zinc, calcium and phosphoruson the skin and growth of pigs. J. Sci. Food Agric. 8:119–127.
Bengtsson, G., J. Hakkarainen, L. Jonsson, N. Lannek, and P. Lindberg.1978a. Requirement for selenium (as selenite) and vitamin E (as alpha-tocopherol) in weaned pigs. I. The effect of varying alpha-tocopherollevels in a selenium-deficient diet on the development of the VESDsyndrome. J. Anim. Sci. 47:143–152.
Bengtsson, G., J. Hakkarainen, L. Jonsson, N. Lannek, and P. Lindberg.1978b. Requirement for selenium (as selenite) and vitamin E (as alpha-tocopherol) in weaned pigs. II. The effect of varying selenium levels ina vitamin E-deficient diet on the development of the VESD syndrome.J. Anim. Sci. 46:153–160.
Berry, R. K., M. C. Bell, R. B. Crainger, and R. G. Buescher. 1961.Influence of dietary calcium and zinc on calcium-45, phosphorus 32,and zinc-65 metabolism in swine. J. Anim. Sci. 20:433–439.
Bertram, M. J., T. S. Stahly, R. C. Ewan. 1994. Impact of lean growthgenotype and dietary phosphorus regimen on rate and efficiency ofgrowth and carcass characteristics of pigs. J. Anim. Sci. 72(Suppl.2):68 (Abstr.).
Biehl, R. R., and D. H. Baker. 1996. Efficacy of supplemental 1 a-hydroxycholecalciferol and microbial phytase for young pigs fed phos-phorus- or amino acid-deficient corn-soybean meal diets. J. Anim. Sci.74:2960–2966.
Biehl, R. R., J. L. Emmert, and D. H. Baker. 1997. Iron bioavailabilityin soybean meal as affected by supplemental phytase and 1 a-hydroxy-cholecalciferol. Poultry Sci. 76:1424–1427.
Blair, R., and D. Benzie. 1964. The effect of level of dietary calciumand phosphorus on skeletal development in the young pig to 25-lbliveweight. Br. J. Nutr. 18:91–101.
Bohstedt, G., and R. H. Grummer. 1954. Salt poisoning of pigs. J. Anim.Sci. 13:933–939.
Boleman, S. L., S. J. Boleman, T. D. Bidner, L. L. Southern, T. L. Ward,J. E. Pontif, and M. M. Pike. 1995. Effect of chromium picolinate ongrowth, body composition, and tissue accretion in pigs. J. Anim. Sci.73:2033–2042.
Bonnette, E. D., E. T. Kornegay, M. D. Lindemann, and D. R. Notter.1990. Influence of two supplemental vitamin E levels and weaning ageon performance, humoral antibody production, and serum cortisollevels of pigs. J. Anim. Sci. 68:1346–1353.
Bowland, J. P., R. Braude, A. G. Chamberlain, R. F. Glascock, and K. G.Mitchell. 1961. The absorption, distribution and excretion of labeledcopper in young pigs given different quantities, as sulphate or sulphide,orally or intravenously. Br. J. Nutr. 15:59–72.
Boyd, R. D., D. Hall, and J. F. Wu. 1983. Plasma alkaline phosphataseas a criterion for determining biological availability of phosphorus forswine. J. Anim. Sci. 57:396–401.
Brady, P. S., P. K. Ku, D. E. Ullrey, and E. R. Miller. 1978. Evaluationof an amino acid-iron chelate hematinic for the baby pig. J. Anim. Sci.47:1135–1140.
Braude, R. 1967. Copper as a stimulant in pig feeding (Cuprum propecunia). World Rev. Anim. Prod. 3:69–82.
Braude, R. 1975. Copper as a performance promoter in pigs. Pp. 79–97in Proc. Copper in Farming Symp. London: Copper DevelopmentAssociation.
Braude, R., and E. Cotchin. 1949. Thiourea and methylthiouracil assupplements in rations of fattening pigs. Br. J. Nutr. 3:171–186.
Braude, R., A. G. Chamberlain, M. Kotarbinska, and K. G. Mitchell.1962. The metabolism of iron in piglets given labeled iron either orallyor by injection. Br. J. Nutr. 16:427–449.
Brennan, J. J., and F. X. Aherne. 1984. Effect of calcium and phosphoruslevels in the diet on the incidence of leg weakness in swine. Agric.Forestry Bull. Special Issue. Pp. 8–10.
Brink, M. F., D. E. Becker, S. W. Terrill, and A. H. Jensen. 1959. Zinctoxicity in the weanling pig. J. Anim. Sci. 18:836–842.
Bunch, R. J., J. T. McCall, V. C. Speer, and V. W. Hays. 1965. Coppersupplementation for weanling pigs. J. Anim. Sci. 24:995–1000.
Minerals 59
Burnell, T. W., G. L. Cromwell, and T. S. Stahly. 1988. Effects of particlesize on the availability of phosphorus in defluorinated phosphate forpigs. J. Anim. Sci. 67(Suppl. 1):140 (Abstr.).
Calabotta, D. F., E. T. Kornegay, H. R. Thomas, J. W. Knight, D. R.Notter, and H. P. Veit. 1982. Restricted energy intake and elevatedcalcium and phosphorus intake for gilts during growth. I. Feedlotperformance and foot and leg measurements and scores during growth.J. Anim. Sci. 54:565–575.
Calvert, C. C., R. J. Besecker, M. P. Plumlee, T. R. Cline, and D. M.Forsyth. 1978. Apparent digestibility of phosphorus in barley and cornfor growing swine. J. Anim. Sci. 47:420–426.
Campbell, E. A. 1961. Iron poisoning in the young pig. Aust. Vet. J.37:78–83.
Campbell, R. G. 1996. The effects of chromium picolinate on the fertilityand fecundity of sows under commercial conditions. Pp. 33–38 inSixteenth Annual Feed Ingredient Conference, Prince Agri. Products,Inc., Quincy, IL, Aug. 19–20.
Carlson, M. S., G. M. Hill, J. E. Link, G. A. McCully, D. W. Rozeboom,and R. L. Weavers. 1995. Impact of zinc oxide and copper sulfatesupplementation on the newly weaned pig. J. Anim. Sci. 73(Suppl.1):72 (Abstr.).
Carnes, W. H., C. S. Shields, C. E. Cartwright, and M. M. Winthrop. 1961.Vascular lesions in copper-deficient swine. Fed. Proc. 20:118. (Abstr.)
Carson, T. L. 1986. Toxic chemicals, plants, metals and mycotoxins. Pp.688–701 in Diseases of Swine, 6th Ed., A. D. Leman, B. Straw, R. D.Glock. W. L. Mengeling, R. H. C. Penny, and E. Scholl, eds. Ames:Iowa State University Press.
Carter, J. H., Jr., R. F. Miller, and C. C. Brooks. 1959. The effect of copperand calcium levels on the performance of growing swine. J. Anim. Sci.18:1502 (Abstr.).
Carter, S. D., and G. L. Cromwell. 1998a. Influence of porcine somato-tropin on the phosphorus requirement of finishing pigs. I. Performanceand bone characteristics. J. Anim. Sci. 76:584–595.
Carter, S. D., and G. L. Cromwell. 1998b. Influence of porcine somato-tropin on the phosphorus requirement of finishing pigs. II. Carcasscharacteristics, tissue accretion rates, and chemical composition of theham. J. Anim. Sci. 76:596–605.
Chaney, C. H., and C. E. Barnhart. 1963. Effect of iron supplementationof sow rations on the prevention of baby pig anemia. J. Nutr.81:187–192.
Chapman, H. L., Jr., J. Kastelic, C. C. Ashton, and D. V. Catron. 1955.A comparison of phosphorus from different sources for growing andfinishing swine. J. Anim. Sci. 14:1073–1085.
Chapman, H. L., Jr., J. Kastelic, G. C. Ashton, P. G. Homeyer, C. Y.Roberts, D. V. Catron, V. W. Hays, and V. C. Speer. 1962. Calciumand phosphorus requirements for growing-finishing swine. J. Anim.Sci. 21:112–118.
Chavez, E. R. 1979a. Effects of dietary selenium depletion and repletionon plasma glutathione peroxidase activity and selenium concentrationin blood and body tissue of growing pigs. Can. J. Anim. Sci. 59:761–771.
Chavez, E. R. 1979b. Effects of dietary selenium on glutathione peroxi-dase activity in piglets. Can. J. Anim. Sci. 59:67–75.
Chavez, E. R. 1985. Nutritional significance of selenium supplementationin a semi-purified diet fed during gestation and lactation to first-littergilts and their piglets. Can. J. Anim. Sci. 64:497–506.
Cheng, J., and E. T. Kornegay. 1995. Comparison of zinc sulfate and azinc complex as zinc source for young pigs fed lysine deficient andadequate diets. J. Anim. Sci. 73(Suppl. 1):172 (Abstr.).
Cheng, J., T. C. Schell, and E. T. Kornegay. 1995. Influence of dietarylysine on the utilization of zinc from zinc sulfate and a zinc lysinecomplex by young pigs. J. Anim. Sci. 73(Suppl. 1):17 (Abstr.).
Christianson, S. L., E. R. Peo, Jr., and A. J. Lewis. 1989. Effects of dietarymanganese levels on reproductive performance of sows. J. Anim. Sci.67(Suppl. 1):251 (Abstr.).
Christianson, S. L., E. R. Peo, Jr., A. J. Lewis, and M. A. Giesemann.1990. Influence of dietary manganese levels on reproduction, serumcholesterol and milk manganese concentration of sows. J. Anim. Sci.68(Suppl. 1):368 (Abstr.).
Chung, A. S., W. C. Hoekstra, and R. H. Grummer. 1976. Supplementalcobalt or nickel for zinc-deficient G.F. pigs. J. Anim. Sci. 42:1352(Abstr.).
Clancy, S. P., P. M. Clarkson, M. E. DeCheke, K. Nosaka, P. S. Freedson,J. J. Cunningham, and B. Valentine. 1994. Effects of chromium picoli-nate supplementation on body composition, strength, and urinary chro-mium loss in football players. Int. J. Sports Nutr. 4:142–153.
Clawson, A. J., and W. D. Armstrong. 1981. Ammonium polyphosphateas a source of phosphorus and nonprotein nitrogen for monogastrics.J. Anim. Sci. 52:1–7.
Coalson, J. A., C. V. Maxwell, J. C. Hillier, R. D. Washam, and E. C.Nelson. 1972. Calcium and phosphorus requirements of young pigsreared under controlled environmental conditions. J. Anim. Sci. 35:1194–1200.
Coalson, J. A., C. V. Maxwell, J. C. Hillier, and E. C. Nelson. 1974.Calcium requirement of the cesarean derived colostrum-free pig from3 through 9 weeks of age. J. Anim. Sci. 38:772–777.
Coffey, R. D., and G. L. Cromwell. 1993. Evaluation of the biologicalavailability of phosphorus in various feed ingredients for growing pigs.J. Anim. Sci. 71(Suppl. 1):66 (Abstr.).
Coffey, R. D., G. L. Cromwell, and H. J. Monegue. 1994. Efficacy of acopper-lysine complex as a growth promotant for weanling pigs.J. Anim. Sci. 72:2880–2886.
Coffey, R. D., K. W. Mooney, G. L. Cromwell, and D. K. Aaron. 1994.Biological availability of phosphorus in defluorinated phosphates withdifferent phosphorus solubilities in neutral ammonium citrate for chicksand pigs. J. Anim. Sci. 72:2653–2660.
Combs, C. E., and H. D. Wallace. 1962. Growth and digestibility studieswith young pigs fed various levels and sources of calcium. J. Anim.Sci. 21:734–737.
Combs, G. E., J. M. Vandepopuliere, H. D. Wallace, and M. Koger. 1962.Phosphorus requirement of young pigs. J. Anim. Sci. 21:3–8.
Combs, G. E., T. H. Berry, H. D. Wallace, and R. C. Crum, Jr. 1966.Levels and sources of vitamin D for pigs fed diets containing varyingquantities of calcium. J. Anim. Sci. 25:827–830.
Combs, N. R., and E. R. Miller. 1985. Determination of potassium avail-ability in K2CO3, KHCO3, corn and soybean meal for the young pig.J. Anim. Sci. 60:715–719.
Combs, N. R., E. R. Miller, and P. K. Ku. 1985. Development of anassay to determine the bioavailability of potassium in feedstuffs for theyoung pig. J. Anim. Sci. 60:709–714.
Combs, N. R., E. T. Kornegay, M. D. Lindemann, and D. R. Notter.1991a. Calcium and phosphorus requirement of swine from weaningto market: I. Development of response curves for performance. J. Anim.Sci. 69:673–681.
Combs, N. R., E. T. Kornegay, M. D. Lindemann, D. R. Notter, J. W.Wilson, and J. P. Mason. 1991b. Calcium and phosphorus requirementof swine from weaning to market: II. Development of response curvesfor bone criteria and comparison of bending and shear bone testing.J. Anim. Sci. 69:682–693.
Corley, J. R., D. H. Baker, and R. A. Easter. 1980. Biological availabilityof phosphorus in rice bran and wheat bran as affected by pelleting.J. Anim. Sci. 50:286–292.
Coulter, D. B., and M. J. Swenson. 1970. Effects of potassium intoxicationon porcine electrocardiograms. Am. J. Vet. Res. 31:2001–2011.
Cox, D. H., and O. M. Hale. 1962. Liver iron depletion without copperloss in swine for excess zinc. J. Nutr. 77:225–228.
Cox, J. L., D. E. Becker, and A. H. Jensen. 1966. Electrocardiographicevaluation of potassium deficiency in young swine. J. Anim. Sci.25:203–206.
60 Nutrient Requirements of Swine
Crenshaw, T. D., E. R. Peo, Jr., A. J. Lewis, B. D. Moser, and D. Olson.1981. Influence of age, sex and calcium and phosphorus levels onthe mechanical properties of various bones in swine. J. Anim. Sci.52:1319–1329.
Cromwell, G. L. 1979. Availability of phosphorus in feedstuffs for swine.Proc. Distill. Feed. Conf. 34:40–52.
Cromwell, G. L. 1985. Phosphorus requirements of swine. Pp. 48–65 inProc. 8th Annual International Minerals Conference. Mundelein, IL:International Minerals and Chemical Corp.
Cromwell, G. L. 1992. The biological availability of phosphorus in feed-stuffs for pigs. Pig News and Information 13:75N.
Cromwell, G. L. 1997. Copper as a nutrient for animals. Pp. 177–202 inHandbook of Copper Compounds and Applications, H. W. Richardson,Ed. New York: Marcel Dekker, Inc.
Cromwell, G. L., V. W. Hays, C. H. Chaney, and J. R. Overfield. 1970.Effects of dietary phosphorus and calcium level on performance, bonemineralization and carcass characteristics of swine. J. Anim. Sci.30:519–525.
Cromwell, G. L., V. W. Hays, and J. R. Overfield. 1972a. Effects ofphosphorus levels in corn-, milo- and wheat-based diets on performanceand bone strength of pigs. J. Anim. Sci. 35:1103(Abstr.).
Cromwell, G. L., V. W. Hays, C. W. Scherer, and J. R. Overfield. 1972b.Effects of dietary calcium and phosphorus on performance and carcass,metacarpal and turbinate characteristics of swine. J. Anim. Sci.34:746–751.
Cromwell, G. L., V. W. Hays, and J. R. Overfield. 1974. Effects of phos-phorus levels in corn, wheat and barley diets on performance and bonestrength of swine. J. Anim. Sci. 39: 180(Abstr.).
Cromwell, G. L., D. T. H. Sihombing, and V. W. Hays. 1975. Effects ofiodine level on performance and thyroid traits of growing pigs. J. Anim.Sci. 41:813–818.
Cromwell, G. L., V. W. Hays, J. R. Overfield, and J. L. Krug. 1976. Meatand bone meal as a source of phosphorus for growing swine. J. Anim.Sci. 42:1350(Abstr.).
Cromwell, G. L., V. W. Hays, and T. L. Clark. 1978. Effects of coppersulfate, copper sulfide and sodium sulfide on performance and copperstores of pigs. J. Anim. Sci. 46:692–698.
Cromwell, G. L., T. S. Stahly, and J. R. Overfield. 1979. Effect of dietaryphosphorus level on growth, carcass and bone traits of boars. J. Anim.Sci. 49(Suppl. 1):101 (Abstr.).
Cromwell, G. L., T. S. Stahly, and H. J. Monegue. 1981a. Effects ofsodium and chloride on performance of pigs J. Anim. Sci. 53(Suppl.1):237 (Abstr.).
Cromwell, G. L., T. S. Stahly, and W. D. Williams. 1981b. Efficacy ofcopper as a growth promotant and its interrelation with sulfur andantibiotics for swine. Distill. Feed Conf. Proc. Distill. Feed Res.Counc. 36:6.
Cromwell, G. L., T. S. Stahly, and H. J. Monegue. 1983. Bioavailabilityof the calcium and phosphorus in dehydrated alfalfa meal for growingpigs. J. Anim. Sci. 57(Suppl. 1):242 (Abstr.).
Cromwell, G. L., T. S. Stahly, and H. J. Monegue. 1985. Bioavailabilityof the phosphorus in wheat for the pig. J. Anim. Sci.61(Suppl.1):320 (Abstr.).
Cromwell, G. L., T. S. Stahly, and T. V. Burnell. 1987. Source and particlesize of phosphorus supplements on bioavailability of phosphorus.J. Anim. Sci. 65(Suppl. 1):134 (Abstr.).
Cromwell, G. L., D. D. Hall, G. E. Combs, O. M. Hale, D. L. Handlin,J. P. Hitchcock, D. A. Knabe, E. T. Kornegay, M. D. Lindemann, C. V.Maxwell, and T. J. Prince. 1989a. Effects of dietary salt level duringgestation and lactation on reproductive performance of sows: A cooper-ative study. J. Anim. Sci. 67:374–385.
Cromwell, G. L., H. J. Monegue, and T. S. Stahly. 1989b. Effects ofsource and level of copper on performance and liver copper stores inweanling pigs. J. Anim. Sci. 67:2996–3002.
Cromwell, G. L., H. J. Monegue, and T. S. Stahly. 1993a. Long-termeffects of feeding a high copper diet to sows during gestation andlactation. J. Anim. Sci. 71:2996–3002.
Cromwell, G. L., T. S. Stahly, R. D. Coffey, H. J. Monegue, and J. H.Randolph. 1993b. Efficacy of phytase in improving the bioavailabilityof phosphorus in soybean meal and corn-soybean meal diets for pigs.J. Anim. Sci. 71:1831–1840.
Cromwell, G. L., M. D. Lindemann, H. J. Monegue, D. D. Hall, andD. E. Orr, Jr. 1998. Tribasic copper chloride and copper sulfate ascopper sources for weanling pigs. J. Anim. Sci. 76:118–123.
Cromwell, G. L., R. D. Coffey, G. R. Parker, H. J. Monegue, and J. H.Randolph. 1995. Efficacy of a recombinant-derived phytase in improv-ing the bioavailability of phosphorus in corn-soybean meal diets forpigs. J. Anim. Sci. 73:2000–2008.
Cromwell, G. L., J. L. Pierce, T. E. Sauber, D. W. Rice, D. S. Etrl, andV. Raboy. 1998. Bioavailability of phosphorus in low-phytic acid cornfor growing pigs. J. Anim. Sci. 76(Suppl. 2): (Midwestern SectionAbstr. #115).
Dahmer, E. J., B. W. Coleman, R. H. Grummer, and W. G. Hoekstra.1972a. Alleviation of parakeratosis in zinc-deficient swine by high levelsof dietary histidine. J. Anim. Sci. 35:1181–1189.
Dahmer, E. J., R. H. Grummer, and W. G. Hoekstra. 1972b. Preventionof zinc deficiency in swine by feeding blood meal. J. Anim. Sci.35:1176–1180.
Devilat, J., and A. Skoknic. 1971. Feeding high levels of rapeseed mealto pregnant gilts. Can. J. Anim. Sci. 51:715–719.
Diehl, J. S., D. C. Mahan, and A. L. Moxon. 1975. Effects of singleintramuscular injections of selenium at various levels to young swine.J. Anim. Sci. 40:844–850.
Doige, C. E., B. D. Owen, and J. H. L. Mills. 1975. Influence of calciumand phosphorus on growth and skeletal development of growing swine.Can. J. Anim. Sci. 55:147–164.
Doornenbal, H. 1975. Tissue selenium content of the growing pig. Can.J. Anim. Sci. 55:325–330.
Dove, C. R. 1993a. The effect of adding copper and various fat sourcesto the diets of weanling swine on growth performance and serum fattyacid profiles. J. Anim. Sci. 71:2187–2192.
Dove, C. R. 1993b. The effect of copper supplementation during lactationon sow and pig performance and the subsequent nursery performanceof pigs. J. Anim. Sci. 71(Suppl. 1):173 (Abstr.).
Dove, C. R. 1995. The effect of copper level on nutrient utilization ofweanling pigs. J. Anim. Sci. 73:166–171.
Dove, C. R. and K. D. Haydon. 1992. The effect of copper and fataddition to the diets of weanling swine on growth performance andserum fatty acids. J. Anim. Sci. 70:805–810.
Ducsay, C. A., W. C. Buhi, F. W. Bazer, R. M. Roberts, and C. E. Combs.1984. Role of uteroferrin in placental iron transport: Effect of maternaliron treatment on fetal iron and uteroferrin content and neonatal hemo-globin. J. Anim. Sci. 59:1303–1308.
Edmonds, M. S., O. A. Izquierdo, and D. H. Baker. 1985. Feed additivestudies with newly weaned pigs: Efficacy of supplemental copper, anti-biotics and organic acids. J. Anim. Sci. 60:462–469.
Eeckhout, W., M. de Paepe, N. Warnants, H. Bekaert. 1995. An estimationof the minimal P requirements for growing-finishing pigs, as influencedby the Ca level of the diet. Anim. Feed Sci. Tech. 52:29–40.
Eggert, R. O., D. Patterson, W. T. Akers, and E. L. R. Stokstad. 1957.The role of vitamin E and selenium in the nutrition of the pig. J. Anim.Sci. 16:1037(Abstr.).
Elvehjem, C. A., and E. B. Hart. 1932. The necessity of copper asa supplement to iron for hemoglobin formation in the pig. J. Biol.Chem. 95:363–370.
Evock-Clover, C. M., M. M. Polansky, R. A. Anderson, and N. C. Steele.1993. Dietary chromium supplementation with or without somatotropintreatment alters serum hormones and metabolites in growing pigswithout affecting growth performance. J. Nutr. 123:1504–1512.
Minerals 61
Ewan, R.C. 1971. Effect of vitamin E and selenium on tissue compositionof young pigs. J. Anim. Sci. 32:883–887.
Ewan, R. C., M. E. Wastell, E. J. Bicknell, and V. C. Speer. 1969.Performance and deficiency symptoms of young pigs fed diets low invitamin E and selenium. J. Anim. Sci. 29:912–915.
Fammatre, C. A., D. C. Mahan, A. W. Fetter, A. P. Crifo, Jr., and J. K.Judy. 1977. Effects of dietary protein, calcium and phosphorus levelsfor growing and finishing swine. J. Anim. Sci. 44:65–71.
Farries, F. E. 1958. Kali-Briefe (Tierzucht) no. 3. 1981. P. 290 in TheNutrient Requirements of Pigs. Agricultural Research Council. Slough,England: Commonwealth Agricultural Bureaux.
Follis, R. H., J. A. Bush, G. E. Cartwright, and M. W. Wintrobe. 1955.Studies on copper metabolism. XVIII. Skeletal changes associated withcopper deficiency in swine. Bull. Johns Hopkins Hosp. 97:405.
Fontaine, M., and V. E. O. Valli. 1977. Studies on vitamin E and seleniumdeficiency in young pigs. II. The hydrogen peroxide hemolysis test andthe measure of red cell lipid peroxides as indices of vitamin E andselenium status. Can. J. Comp. Med. 41:52–56.
Fontaine, M., V. E. O. Valli, and L. G. Young. 1977a. Studies on vitaminE and selenium deficiency in young pigs. IV. Effect on coagulationsystem. Can. J. Comp. Med. 41:64–76.
Fontaine, M., V. E. O. Valli, and L. G. Young. 1977b. Studies on vitaminE and selenium deficiency in young pigs. III. Effect on kinetics oferythrocyte production and destruction. Can. J. Comp. Med. 41:57–63.
Fontaine, M., V. E. O. Valli, L. G. Young, and J. H. Lumsden. 1977c.Studies on vitamin E and selenium deficiency in young pigs. I. Hemato-logical and biochemical changes. Can. J. Comp. Med. 41:41–51.
Food and Drug Administration. 1987a. Food additives permitted in feedand drinking water of animals: Selenium. Federal Register 52:10887(Monday, April 6).
Food and Drug Administration. 1987b. Food additives permitted in feedand drinking water of animals: Selenium; Correction. Federal Register52:21001 (Thursday, June 4).
Forbes, R. M. 1960. Nutritional interactions in zinc and calcium. Fed.Proc. 19:643–647.
Friend, D. W., and M. S. Wolynetz. 1981. Self-selection of salt by giltsduring pregnancy and lactation. Can. J. Anim. Sci. 61:429–438.
Froseth, J. A., D. C. Honeyfield, and R. J. Barke. 1982a. Dietary sodiumand chloride levels for young pigs. J. Anim. Sci. 55(Suppl. 1):271(Abstr.).
Froseth, J. A., P. K. Ku, and E. R. Miller. 1982b. Addition of potassiumcarbonate to swine diets containing varying levels of lysine. J. Anim.Sci. 55(Suppl. 1):97 (Abstr.).
Froseth, J. A., E. R. Miller, P. K. Ku, and W. G. Bergen. 1982c. Effectsand interactions of dietary lysine, potassium and sodium levels foryoung pigs. J. Anim. Sci. 55(Suppl. 1):271 (Abstr.).
Fryer, A. J., P. K. Ku, E. R. Miller, and D. E. Ullrey. 1992. Effect ofelevated dietary zinc on growth performance of weanling swine.J. Anim. Sci. 70(Suppl. 1):62 (Abstr.).
Fuller, R., L. G. M. Newland, C. A. E. Briggs, R. Braude, and K. G.Mitchell. 1960. The normal intestinal flora of the pigs. IV. The effectof dietary supplements of penicillin, chlortetracyline or copper on thefaecal flora. J. Appl. Bacterial. 23:195–205.
Furugouri, K. 1972. Effect of elevated dietary levels of iron on iron storein liver, some blood constituents and phosphorus deficiency in youngswine. J. Anim. Sci. 34:573–577.
Furugouri, K., and A. Kawabata. 1975. Iron absorption in nursing piglets.J. Anim. Sci. 41:1348–1354.
Furugouri, K., and A. Kawabata. 1976. Iron absorption by neonatal pigintestine in vivo. J. Anim. Sci. 42:1460–1464.
Furugouri, K., and A. Kawabata. 1979. Iron absorptive function of neona-tal pig intestine. J. Anim. Sci. 49:715–723.
Gamble, C. T., S. L. Hansard, B. R. Moss, D. J. Davis, and E. R. Lidvall.1971. Manganese utilization and placental transfer in the gravid gilt.J. Anim. Sci. 32:84–87.
Gargas, M. L., R. I. Norton, D. J. Paustenbach, and B. L. Finley. 1991.Urinary excretion of chromium by humans following ingestion of chro-mium picolinate: Implications for biomonitoring. Drug Metab. Dis-pos. 22:522–529.
Gleed, P. T., and B. F. Sansom. 1982. Ingestion of iron in sow’s faecesby piglets reared in farrowing crates with slotted floors. Br. J. Nutr.47:113–117.
Giesemann, M. A., A. J. Lewis, M. P. Akhter, and P. S. Miller. 1992a.Effect of the reproductive cycle on bone strength of young and maturesows. J. Anim. Sci. 70(Suppl. 1):230 (Abstr.).
Giesemann, M. A., A. J. Lewis, and P. S. Miller. 1992b. Calcium andphosphorus balance of gilts and mature sows during gestation andlactation. J. Anim. Sci. 70(Suppl. 1):69 (Abstr.).
Glienke, L. R., and R. C. Ewan. 1977. Selenium deficiency in the youngpig. J. Anim. Sci. 45: 1334–1340.
Goehring, T. B., I. S. Palmer, O. E. Olson, C. W. Libal, and R. C.Wahlstrom. 1984a. Effects of seleniferous grains and inorganic sele-nium on tissue and blood composition and growth performance of ratsand swine. J. Anim. Sci. 59:725–732.
Goehring, T. B., I. S. Palmer, O. E. Olson, C. W. Libal, and R. C.Wahlstrom. 1984b. Toxic effects of selenium on growing swine fedcorn-soybean meal diets. J. Anim. Sci. 59:733–737.
Golz, D. I., and T. D. Crenshaw. 1990. Interrelationships of dietarysodium, potassium and chloride on growth in young swine. J. Anim.Sci. 68:2736–2747.
Golz, D. I., and T. D. Crenshaw. 1991. The effect of dietary potassium andchloride on cation-anion balance in swine. J. Anim. Sci. 69:2504–2515.
Grandhi, R. R., and J. H. Strain. 1983. Dietary calcium-phosphorus levelsfor growth and reproduction in gilts and sows. Can. J. Anim. Sci.63:443–454.
Grant, C. A., B. Thafvelin, and R. Christell. 1961. Retention of seleniumby pig tissues. Acta Pharmacol. Toxicol. 18:285–297.
Grimmett, R. E. R., I. G. McIntosh, E. M. Wall, and C. S. M. Hopkirk.1937. Chromium zinc poisoning of pigs. Results of experimental feedingof pure zinc lactate. New Zealand J. Agric. 54:216–223.
Groce, A. W., E. R. Miller, K. K. Keahey, D. E. Ullrey, and D. J. Ellis.1971. Selenium supplementation of practical diets for growing-finishingswine. J. Anim. Sci. 32:905–911.
Groce, A. W., E. R. Miller, D. E. Ullrey, P. K. Ku, K. K. Keahey, andD. J. Ellis. 1973a. Selenium requirements in corn-soy diets for growing-finishing swine. J. Anim. Sci. 37:948–956.
Groce, A. W., E. R. Miller, J. P. Hitchcock, D. E. Ullrey, and W. T.Magee. 1973b. Selenium balance in the pig as affected by seleniumsource and vitamin E. J. Anim. Sci. 37:942–947.
Grummer, R. H., O. G. Bentley, P. H. Phillips, and G. Bohstedt. 1950.The role of manganese in growth, reproduction and lactation of swine.J. Anim. Sci. 9:170–175.
Hagsten, I., and T. W. Perry. 1976a. Evaluation of dietary salt levels forswine. I. Effect on gain, water consumption and efficiency of feedconversion. J. Anim. Sci. 42:1187–1190.
Hagsten, I., and T. W. Perry. 1976b. Evaluation of dietary salt levelsfor swine. II. Effect on blood and excretory patterns. J. Anim. Sci.42:1191–1195.
Hagsten, I., T. R. Cline, T. W. Perry, and M. P. Plumlee. 1976. Saltsupplementation of corn-soy diets for swine. J. Anim. Sci. 42:12–15.
Hahn, J. D., and D. H. Baker. 1993. Growth and plasma zinc responses ofyoung pigs fed pharmacologic levels of zinc. J. Anim. Sci. 71:3020–3024.
Hakkarainen, J., P. Lindberg, G. Bengtsson, L. Jonsson, and N. Lannek.1978. Requirement for selenium (as selenite) and vitamin E (as alpha-tocopherol) in weaned pigs. III. The effect on the development of theVESD syndrome of varying selenium levels with a low- tocopheroldiet. J. Anim. Sci. 46:1001–1008.
Hall, D. D., G. L. Cromwell, and T. S. Stahly. 1991. Effects of dietarycalcium, phosphorus, calcium:phosphorus ratio and vitamin K on per-
62 Nutrient Requirements of Swine
formance, bone strength and blood clotting status of pigs. J. Anim.Sci. 69:646–655.
Hall, V. L., R. C. Ewan, and M. J. Wannemuehler. 1993. Effect of zincdeficiency and zinc source on performance and immune response inyoung pigs. J. Anim. Sci. 71(Suppl. 1):173 (Abstr.).
Hancock, J. E., E. R. Peo, Jr., A. J. Lewis, J. D. Crenshaw, and B. D.Moser. 1986. Vitamin D toxicity in young pigs. J. Anim. Sci. 63(Suppl.1):268 (Abstr.).
Hansard, S. L., and H. Itoh. 1968. Influence of limited dietary calciumupon zinc absorption, placental transfer and utilization by swine.J. Nutr. 95:23–30.
Hansen, B. C., A. J. Lewis, and E. R. Peo, Jr. 1987. Bone traits of growingboars, barrows and gilts fed different levels of dietary protein andavailable phosphorus. J. Anim. Sci 65(Suppl. 1):126 (Abstr.).
Harmon, B. G., D. E. Becker, and A. H. Jensen. 1967. Efficacy of ferricammonium citrate in preventing anemia in young swine. J. Anim. Sci.26:1051–1053.
Harmon, B. G., D. E. Hoge, A. H. Jensen, and D. H. Baker. 1969.Efficacy of ferrous carbonate as a hematinic for young swine. J. Anim.Sci. 29:706–710.
Harmon, B. C., S. G. Cornelius, J. Totsch, D. H. Baker, and A. H. Jensen.1974a. Oral iron dextran and iron from steel slats as hematinics forswine. J. Anim. Sci. 39:699–702.
Harmon, B. G., C. T. Liu, S. G. Cornelius, J. E. Pettigrew, D. H. Baker,and A. H. Jensen. 1974b. Efficacy of different phosphorus supplementsfor sows during gestation and lactation. J. Anim. Sci. 39:1117–1123.
Harmon, B. G., C. T. Liu, A. H. Jensen, and D. H. Baker. 1975. Phospho-rus requirements of sows during gestation and lactation. J. Anim.Sci. 40:660–664.
Harmon, B. G., C. T. Liu, A. H. Jensen, and D. H. Baker. 1976. Dietarymagnesium levels for sows during gestation and lactation. J. Anim.Sci. 42:860–865.
Harper, A. F., M. D. Lindemann, and E. T. Kornegay. 1995. Effect ofsupplemental dietary chromium on growth performance of weanlingswine. J. Anim. Sci. 73(Suppl. 1):194 (Abstr.)
Harris, J. E., S. D. Crow, and M. D. Newcomb. 1995. Effect of chromiumpicolinate on growth performance and carcass characteristics on pigsfed adequate and low protein diets. J. Anim. Sci. 73(Suppl. 1):194(Abstr.).
Harrold, R. L. 1981. Digestible energy and available phosphorus contentof sunflower seed products. J. Anim. Sci. 53(Suppl. 1):516 (Abstr.).
Hart, E. B., and H. Steenbock. 1918. Hairless pigs: The cause and remedy.Wis. Agric. Exp. Stn. Bull. 297:1–11.
Hart, E. B., C. A. Elvehjem, H. Steenbock, A. R. Kemmerer, G. Bohstedt,and J. M. Fargo. 1930. A study of the anemia of young pigs and itsprevention. J. Nutr. 2:277–294.
Haydon, K. K., J. W. West, and M. N. McCarter. 1993. Effect of dietaryelectrolyte balance on performance and blood parameters of growing-finishing swine fed in high ambient temperatures. J. Anim.Sci.68:2400–2406.
Hayes, S. H., G. L. Cromwell, T. S. Stahly, and T. H. Johnson. 1979.Availability of phosphorus in corn, wheat and barley for the chick.J. Anim. Sci. 49:992–992.
Hays, V. W. 1976. Phosphorus in Swine Nutrition. West Des Moines,Iowa: National Feed Ingredients Association.
Hedges, J. D., and E. T. Kornegay. 1973. Interrelationship of dietarycopper and iron as measured by blood parameters, tissue stores andfeedlot performance of swine. J. Anim. Sci. 37:1147–1154.
Hedges, J. D., E. T. Kornegay, and H. R. Thomas. 1976. Comparison ofdietary zinc levels for reproducing sows and the effect of dietary zincand calcium on the subsequent performance of their progeny. J. Anim.Sci. 43:453–463.
Herigstad, R. R., C. K. Whitehair, and O. E. Olson. 1973. Inorganic andorganic selenium toxicosis in young swine: Comparison of pathologic
changes with those in swine with vitamin E-selenium deficiency. Am.J. Vet. Res. 34:1227–1238.
Hew, V. F., G. L. Cromwell, and T. S. Stahly. 1982. The bioavailability ofphosphorus in some tropical feedstuffs for pigs. J. Anim. Sci. 55(Suppl.1):277 (Abstr.).
Hickman, D. S., D. C. Mahan, and J. H. Cline. 1983. Dietary calciumand phosphorus for developing boars. J. Anim. Sci. 56:431–437.
Hill, D. A., E. R. Peo, Jr., A. J. Lewis, and J. D. Crenshaw. 1986. Zinc-amino acid complexes for swine. J. Anim. Sci. 63:121–130.
Hill, G. M., and E. R. Miller. 1983. Effect of dietary zinc levels on thegrowth and development of the gilt. J. Anim. Sci. 57:106–113.
Hill, G. M., P. K. Ku, E. R. Miller, D. E. Ullrey, T. A. Losty, and B. L.O’Dell. 1983a. A copper deficiency in neonatal pigs induced by a highzinc maternal diet. J. Nutr. 113:867–872.
Hill, G. M., E. R. Miller, and H. D. Stowe. 1983b. Effect of dietary zinclevels on health and productivity of gilts and sows through two parities.J. Anim. Sci. 57:114–122.
Hill, G. M., E. R. Miller, P. A. Whetter, and D. E. Ullrey. 1983c. Concen-trations of minerals in tissues of pigs from dams fed different levelsof dietary zinc. J. Anim. Sci. 57:130–138.
Hill, G. M., G. L. Cromwell, T. D. Crenshaw, R. C. Ewan, D. A. Knabe,A. J. Lewis, D. C. Mahan, G. C. Shurson, L. L. Southern, and T. L.Veum. 1996. Impact of pharmacological intakes of zinc and (or) copperon performance of weanling pigs. J. Anim. Sci. 74(Suppl. 1):181(Abstr.).
Hitchcock, J. P., P. K. Ku, and E. R. Miller. 1974. Factors influencingiron utilization by the baby pig. Pp. 598–600 in Trace Element Metabo-lism in Animals, Volume a, W. G. Hoekstra, J. W. Suttie, H. E. Ganther,and W. Mertz, eds. Baltimore: University Park Press.
Hoefer, J. A., E. R. Miller, D. E. Ullrey, H. D. Ritchie, and R. W. Luecke.1960. Interrelationships between calcium, zinc, iron and copper inswine feeding. J. Anim. Sci. 19:249–259.
Hoekstra, W. G. 1970. The complexity of dietary factors affecting zincnutrition and metabolism in chicks and swine. Pp. 347–353 in TraceElement Metabolism in Animals, C. F. Mills, ed. Edinburgh: E. &S. Livingstone.
Hoekstra, W. G., P. K. Lewis, P. H. Phillips, and R. H. Grummer. 1956.The relationship of parakeratosis, supplemental calcium and zinc tothe zinc content of certain body components of swine. J. Anim. Sci.15:752–764.
Hoekstra, W. G., E. C. Faltin, C. W. Lin, H. F. Roberts, and R. H.Grummer. 1967. Zinc deficiency in reproducing gilts fed a diet highin calcium and its effect on tissue zinc and blood serum alkaline phos-phatase. J. Anim. Sci. 26:1348–1357.
Honeyfield, D. C., and J. A. Froseth. 1985. Effects of dietary sodium andchloride on growth, efficiency of feed utilization, plasma electrolytesand plasma basic amino acids in young pigs. J. Nutr. 115:1366–1371.
Honeyfield, D. C., J. A. Froseth, and R. J. Barke. 1985. Dietary sodiumand chloride levels for growing-finishing pigs. J. Anim. Sci. 60:691–698.
Hsu, F. S., L. Krook, W. G. Pond, and J. R. Duncan. 1975. Interactionsof dietary calcium with toxic levels of lead and zinc in pigs. J. Nutr.105:112–118.
Huang, K. C., and G. L. Allee. 1981. Bioavailability of phosphorus inselected feedstuffs for young chick and pigs. J. Anim. Sci. 53(Suppl.1):248 (Abstr.).
Huck, D. W., and A. J. Clawson. 1976. Cobalt toxicity in pigs. J. Anim.Sci. 43:253. (Abstr.)
Hughes, E. H., and N. R. Ittner. 1942. The potassium requirement ofgrowing pigs. J. Agric. Res. 64:189–192.
Izquierdo, O. A., and D. H. Baker. 1986. Bioavailability of copper in pigfeces. Can. J. Anim. Sci. 66:1145–1148.
Jensen, A. H., S. W. Terrill, and D. E. Becker. 1961. Response of theyoung pig to levels of dietary potassium. J. Anim. Sci. 20:464–467.
Minerals 63
Johnson, S. R. 1944. Studies with swine on low manganese rations ofnatural foodstuffs. J. Anim. Sci. 3:136–142.
Jongbloed, A. W. 1987. Phosphorus in the Feeding of Pigs: Effect ofDiet on the Absorption and Retention of Phosphorus by Growing Pigs.Instituut voor Veevoedingsanderzoek. Lelystad. XVI, 343 pp.
Jongbloed, A. W., and P. A. Kemme. 1990. Effect of pelleting mixedfeeds on phytase activity and the apparent absorbability of phosphorusand calcium in pigs. Anim. Feed Sci. Tech. 28:233–242.
Jongbloed, A. W., Z. Mroz, and P. A. Kemme. 1992. The effect of supple-mentary Aspergillus niger phytase in diets for pigs on concentrationand apparent digestibility of dry matter, total phosphorus, and phyticacid in different sections of the alimentary tract. J. Anim. Sci.70:1159–1168.
Jongbloed, A. W., Z. Mroz, P. A. Kemme, C. Geerse, and Y. Van DerHoning. 1993. The effect of dietary calcium levels on microbial phytaseefficacy in growing pigs. J. Anim. Sci. 71(Suppl. 1):166 (Abstr.).
Kadis, S., F. A. Udeze, J. Polanco, and D. W. Dreesen. 1984. Relationshipof iron administration to susceptibility of newborn pigs to enterotoxiccolibacillosis. Am. J. Vet. Res. 45:255–259.
Kalinowski, J., and E. R. Chavez. 1984. Effect of low dietary zinc duringlate gestation and early lactation on the sow and neonatal piglets. Can.J. Anim. Sci. 64:749–758.
Kalkus, J. W. 1920. A study of goiter and associated conditions in domesticanimals. Wash. Agric. Exp. Stn. Bull. 156:1–48.
Kavanagh, N. T. 1992. The effect of feed supplemented with zinc oxideon the performance of recently weaned pigs. P. 616 in 12th Proc.Internat. Pig Veterinary Soc. Congr.
Kayongo-Male, H., D. E. Ullrey, and E. R. Miller. 1975. The Mn require-ment of the baby pig from sows fed a low Mn diet. East Afr. Agric.For. J. 41(2):157–164.
Kernkamp, H. C. H., and E. F. Ferrin. 1953. Parakeratosis in swine.J. Am. Vet. Med. Assoc. 123:217–220.
Kernkamp, H. C. H., A. J. Clawson, and R. H. Ferneyhough. 1962.Preventing iron-deficiency anemia in baby pigs. J. Anim. Sci.21:527–532.
Kemme, P. A., A. W. Jongbloed, Z. Mroz, and M. Makinen. 1995. Appar-ent ileal digestibility of protein and amino acids from a maize-soybeanmeal diet with or without extrinsic phytate and phytase in pigs. InInternational Symposium on Nutrient Management of Food Animalsto Enhance the Environment. Abstracts, P. 6, June 4–8.
Kesel, G. A., J. W. Knight, E. T. Kornegay, J. P. Veit, and D. R. Notter.1983. Restricted energy and elevated calcium and phosphorus intake forboars during growth. 1. Feedlot performance and bone characteristics.J. Anim. Sci. 57:82–98.
Ketaren, P. P., E. S. Batterham, and D. J. Farrell. 1989. Dietary phospho-rus levels and calcium available phosphorus ratio for growing pigs. Pp.155–163 in Recent Advances in Animal Nutrition in Australia, D. J.Farrell, ed. Armidale, Australia, Dept. of Biochem., Microbiol. andNutr., Univ. of New England.
Ketaren, P. P., E. S. Batterham, E. B. Dettmann, and D. J. Farrell. 1993.Phosphorus studies in pigs. 3. Effect of phytase supplementation onthe digestibility and availability of phosphorus in soy-bean meal forgrower pigs. Br. J. Nutr. 70:289–311.
Kirchgessner, M., and E. Grassman. 1970. The dynamics of copperabsorption. Pp. 277–287 in Trace Element Metabolism in Animals,C. F. Mills, ed. Edinburgh: E. & S. Livingstone.
Kirchgessner, M., H. Mader, and E. Grassman. 1980. Zur Fruchtbarkeit-sleistung von Saven bei unterschiedlicher Cu-Versorgung. Zuchtung-skunde 52:46–53.
Kirchgessner, M., D. A. Roth-Maier, and R. Sporl. 1981. Untersuchungenzum Trachtigkeitsanabolismus der spurenelemente Kupfer, Zin, Nickelund Mangan bei Zuchtsaver. Arch. Tierernahr. 31:21–34.
Klasing, K. C., C. D. Knight, and D. M. Forsyth. 1980. Effects of ironon the anti-coli capacity of sow’s milk in vitro and in ligated intestinalsegments. J. Nutr. 110:1914–1921.
Kline, E. A., J. Kastelic, C. C. Ashton, P. G. Homeyer, L. Quinn, andD. V. Catron. 1954. The effect on the growth performance of youngpigs of adding cobalt, vitamin B12 and antibiotics to semipurified rations.J. Nutr. 53:543–555.
Klosterman, E. W., W. E. Dinusson, E. L. Lasley, and M. L. Buchanan.1950. Effect of trace minerals on growth and fattening of swine. Sci-ence 112:168–169.
Knight, D. D., K. C. Klasing, and D. M. Forsyth. 1983. E. coli growthin serum of iron dextran-supplemented pigs. J. Anim. Sci. 57:387–395.
Koch, M. E., D. C. Mahan, and J. R. Corley. 1984. An evaluation ofvarious biological characteristics in assessing low phosphorus intake inweanling swine. J. Anim. Sci. 59:1546–1556.
Koprinski, J. S., J. Leibholz, and L. Bryden. 1989. Biotin studies in pigs.Biotin availability in feedstuffs for pigs and chickens. Br. J. Nutr.62:773–780.
Kornegay, E. T. 1972a. Availability of iron contained in defluorinatedphosphate. J. Anim. Sci. 34:569–572.
Kornegay, E. T. 1972b. Supplementation of lysine, ammonium poly-phosphate and urea in diets for growing-finishing pigs. J. Anim. Sci.34:55–63.
Kornegay, E. T. 1985. Calcium and Phosphorus in Animal Nutrition. Pp.1–106 in Calcium and Phosphorus in Animal Nutrition. West DesMoines, Iowa: National Feed Ingredients Association.
Kornegay, E. T. 1996. Nutritional, Environmental and Economical Con-siderations for Using Phytase in Pig and Poultry Diets. Pp. 279–304in International Symposium on Nutrient Management of Food Animalsto Enhance the Environment, E. T. Kornegay, ed. Boca Raton, Fla.:CRC Press, Inc.
Kornegay, E. T., and B. Kite. 1983. Phosphorus in swine. VI. Utilizationof nitrogen, calcium and phosphorus and reproductive performanceof gravid gilts fed two dietary phosphorus levels for five parities. J. Anim.Sci. 57:1463–1473.
Kornegay, E. T., and H. Qian. 1994. Effectiveness of Natuphost phytaseas influenced by dietary phosphorus for improving the bioavailabilityof phytate phosphorus in a corn-soybean meal based diet fed to youngpigs. J. Anim. Sci. 72(Suppl. 1):330 (Abstr.).
Kornegay, E. T. and J. S. Radcliffe. 1997. Relative bioavailability of phos-phorus sources with different solubilities in neutral ammonium citrate(NAC) for young pigs. J. Anim. Sci. 75(Suppl. 1):188 (Abstr.).
Kornegay, E. T., and H. R. Thomas. 1981. Phosphorus in swine. II.Influence of dietary calcium and phosphorus levels and growth rateon serum minerals, soundness scores and bone development in barrows,gilts and boars. J. Anim. Sci. 52:1049–1059.
Kornegay, E. T., H. R. Thomas, and T. N. Meacham. 1973. Evaluationof dietary calcium and phosphorus for reproducing sows housed intotal confinement on concrete or in dirt lots. J. Anim. Sci. 37:493–500.
Kornegay, E. T., H. R. Thomas, and J. L. Baker. 1981a. Phosphorus inswine. IV. Influence of dietary calcium and phosphorus and proteinlevels on feedlot performance, serum minerals, bone development andsoundness scores in boars. J. Anim. Sci. 52:1070–1084.
Kornegay, E. T., H. R. Thomas, J. H. Carter, L. B. Allen, C. C. Brooks,and K. H. Hinklemann. 1981b. Phosphorus in swine. V. Interrelation-ships of various feedlot performance, serum minerals, structural sound-ness and bone parameters in barrows, boars and gilts. J. Anim. Sci.52:1085–1090.
Kornegay, E. T., H. P. Veit, J. W. Knight, D. R. Notter, H. S. Bartlett,and D. F. Calabotta. 1983. Restricted energy intake and elevated cal-cium and phosphorus intake for boars during growth. II. Foot and legmeasurements and toe and soundness scores . J . Anim. Sci.57:1182–1199.
Kornegay, E. T., B. G. Diggs, O. M. Hale, D. L. Handlin, J. P. Hitchcock,and R. A. Barczwski. 1984. Reproductive performance of sows fedelevated calcium and phosphorus levels during growth and develop-ment. A cooperative study. Report S-145 of the Committee on Nutri-
64 Nutrient Requirements of Swine
tional Systems for Swine to Increase Reproductive Efficiency. J. Anim.Sci. 59(Suppl. 1):253 (Abstr.).
Kornegay, E. T., J. B. Meldrum, G. Schurig, M. D. Lindemann, and F. C.Gwazdauskas. 1986. Lack of influence of nursery temperature on theresponse of weanling pigs to supplemental vitamins C and E. J. Anim.Sci. 63:484–491.
Kornegay, E. T., P. H. G. van Heugten, M. D. Lindemann and D. J.Blodgett. 1989. Effects of biotin and high copper levels on performanceand immune response of weanling pigs. J. Anim. Sci. 67:1471–1477.
Kornegay, E. T., M. D. Lindemann, and H. S. Bartlett. 1991. The influ-ence of sodium supplementation of two phosphorus sources on perfor-mance and bone mineralization of growing-finishing swine evaluatedat two geographical locations. Can. J. Anim. Sci. 71:537–547.
Kornegay, E. T., J. L. Evans, and V. Ravidndran. 1994. Effects of dietacidity and protein level or source of calcium on the performance,gastrointestinal content measurements, bone measurements and car-cass composition of gilt and barrow weanling pigs. J. Anim. Sci.72:2670–2680.
Kornegay, E. T., W. Zhou, J. W. G. M. Swinkels, and C. R. Risley. 1995.Characterization of cobalt–copper antagonism in the study of copper-stimulated growth in weanling pigs. J. Anim. Feed Sci. 4:21–33.
Krider, J. L., J. L. Albright, M. P. Plumlee, J. H. Conrad, C. L. Sinclair,L. Underwood, R. G. Jones, and R. B. Harrington. 1975. Magnesiumsupplementation, space and docking effects on swine performance andbehavior. J. Anim. Sci. 40:1027–1033.
Ku, P. K., D. E. Ullrey, and E. R. Miller. 1970. Zinc deficiency and tissuenucleic acid and protein concentration. Pp. 158–164 in Trace ElementMetabolism in Animals, C. F. Mills, ed. Edinburgh: E. & S. Livingstone.
Ku, P. K., W. T. Ely, A. W. Groce, and D. E. Ullrey. 1973. Naturaldietary selenium, a-tocopherol and effect on tissue selenium. J. Anim.Sci. 37:501–505.
Kuhajek, E. J., and G. F. Andelfinger. 1970. A new source of iodine forsalt blocks. J. Anim. Sci. 31:51–58.
Kulwich, R., S. L. Hansard, C. L. Comar, and G. K. Davis. 1953. Copper,molybdenum, and zinc interrelationships in rats and swine. Proc. Soc.Exp. Biol. Med. 84:487.
Lannek, N., P. Lindberg, and G. Tollerz. 1962. Lowered resistance toiron in vitamin E-deficient piglets and mice. Nature 195:1006–1007.
Larsen, H. J., and S. Tollersrud. 1981. Effect of dietary vitamin E andselenium on photohemagglutinin response of the pig lymphocytes. Res.Vet. Sci. 31:301–305.
Leach, R. M., Jr., and A. M. Muenster. 1962. Studies on the role ofmanganese in bone formation. 1. Effect upon the mucopolysaccharidecontent of chick bone. J. Nutr. 78:51–56.
Lei, X. G., P. K. Ku, E. R. Miller, and M. T. Yokoyama. 1993a. Supple-menting corn–soybean meal diets with microbial phytase linearlyimproves phytate phosphorus utilization by weanling pigs. J. Anim. Sci.71:3359–3367.
Lei, X. G., P. K. Ku, E. R. Miller, D. E. Ullrey, and M. T. Yokoyama.1993b. Supplemental microbial phytase improves bioavailability ofdietary zinc to weanling pigs. J. Nutr. 123:1117–1123.
Lei, X. G., P. K. Ku, E. R. Miller, M. T. Yokoyama, and D. E. Ullrey.1994. Calcium level affects the efficacy of supplemental microbialphytase in corn–soybean meal diets of weanling pigs. J. Anim. Sci.72:139–143.
Leibholz, J. M., V. C. Speer, and V. W. Hays. 1962. Effect of dietarymanganese on baby pig performance and tissue manganese levels.J. Anim. Sci. 21:772–776.
Leibholz, J. M., J. T. McCall, V. W. Hays, and V. C. Speer. 1966. Potass-ium, protein and basic amino acid relationships in swine. J. Anim.Sci. 25:37–43.
LeMieux, F. M., L. V. Ellison, T. L. Ward, L. L. Southern, and T. D.Bidner. 1995. Excess dietary zinc for pigs weaned at 28 days. J. Anim.Sci. 73(Suppl. 1):72 (Abstr.).
Lepine, A. J., E. T. Kornegay, D. R. Notter, H. P. Veit, and J. W. Knight.1985. Foot and leg measurements, toe lesions, soundness scores andfeedlot performance of crossbred boars as influenced by nutrition andage. Can. J. Anim. Sci. 65:459–472.
Lewis, A. J., P. S. Miller, and C. K. Wolverton. 1995. Bioavailabilityof iron in iron methionine for weanling pigs. J. Anim. Sci. 73(Suppl.1):172 (Abstr.).
Lewis, P. K., Jr., W. C. Hoekstra, R. H. Grummer, and P. H. Phillips.1956. The effects of certain nutritional factors including calcium, phos-phorus and zinc on parakeratosis. J. Anim. Sci. 15:741–751.
Lewis, P. K., Jr., R. H. Grummer, and W. G. Hoekstra. 1957a. The effectof method of feeding upon the susceptibility of the pig to parakeratosis.J. Anim. Sci. 16:927–936.
Lewis, P. K., Jr., W. G. Hoekstra, and R. H. Grummer. 1957b. Restrictedcalcium feeding versus zinc supplementation for the control of paraker-atosis in swine. J. Anim. Sci. 16:578–588.
Libal, G. W., E. R. Peo, Jr., R. P. Andrews, and P. E. Vipperman, Jr.1969. Levels of calcium and phosphorus for growing-finishing swine.J. Anim. Sci. 28:331–335.
Lillie, R. J., and L. T. Frobish. 1978. Effect of copper and iron supple-ments on performance and hematology of confined sows and theirprogeny through four reproductive cycles. J. Anim. Sci. 46:678–685.
Lindberg, P., and N. Lannek. 1965. Retention of selenium in kidneys, liverand striated muscle after prolonged feeding of therapeutic amounts ofsodium selenite to pigs. Acta Vet. Scand. 6:217–223.
Lindberg, P., and M. Siren. 1963. Selenium concentration in kidneys ofnormal pigs and pigs affected with nutritional muscular dystrophy andliver dystrophy (hepatosis dietetica). Life Sci. 2:326–330.
Lindberg, P., and M. Siren. 1965. Fluorometric selenium determinationsin the liver of normal pigs and in pigs affected with nutritional musculardystrophy and liver dystrophy. Acta Vet. Scand. 6:59–64.
Lindemann, M. D., A. F. Harper, and E. T. Kornegay. 1995a. Furtherassessment of the effects of supplementation of chromium from chro-mium picolinate on fecundity in swine. J. Anim. Sci. 73(Suppl.1):185 (Abstr.).
Lindemann, M. D., C. M. Wood, A. F. Harper, E. T. Kornegay, andR. A. Anderson. 1995b. Dietary chromium picolinate additions improvegain:feed and carcass characteristics in growing-finishing pigs andincrease litter size in reproducing sows. J. Anim. Sci. 73:457–465.
Linkenheimer, W. H., E. L. Patterson, R. A. Milstrey, J. A. Brockman,and D. E. Johnson. 1960. Preparation and biological testing of a paren-teral iron preparation. J. Anim. Sci. 19:763–768.
Liptrap, D. O., E. R. Miller, D. E. Ullrey, D. L. Whitenack, B. L.Schoepke, and R. W. Luecke. 1970. Sex influence on the zinc require-ment of developing swine. J. Anim. Sci. 30:736–741.
Lolas, G. M., N. Palamidis, and P. Markakis. 1976. The phytic acid-totalphosphorus relationship in barley, oats, soybeans and wheat. CerealChem. 53:867–871.
Lowry, K. R., D. C. Mahan, and J. R. Corley. 1985a. Effect of dietarycalcium on selenium retention in postweaning swine. J. Anim. Sci.60:1429–1437.
Lowry, K. R., D. C. Mahan, and J. R. Corley. 1985b. Effect of dietaryphosphorus on selenium retention in postweaning swine. J. Anim. Sci.60:1438–1446.
Luecke, R. W., J. A. Hoefer, W. G. Brammell, and F. Thorp, Jr. 1956.Mineral interrelationships in parakeratosis of swine. J. Anim. Sci.15:247–251.
Luecke, R. W., J. A. Hoefer, W. S. Brammell, and D. A. Schmidt. 1957.Calcium and zinc in parakeratosis of swine. J. Anim. Sci. 16:3–11.
Luo, X. G., and C. R. Dove. 1996. Effect of dietary copper and fat onnutrient utilization, digestive enzyme activities, and tissue mineral levelsin weanling pigs. J. Anim. Sci. 74:1888–1896.
Madubuike, F. N., and R. E. Austic. 1989. Lysine, potassium and chloridein young growing pigs. J. Anim. Prod. Res. 9:1–10.
Minerals 65
Madubuike, F. N., C. C. Calvert, and R. E. Austic. 1980. Lysine-cationinterrelationship in the pig. J. Anim. Sci. 51(Suppl. 1):210 (Abstr.).
Mahan, D. C. 1982. Dietary calcium and phosphorus levels for weanlingswine. J. Anim. Sci. 54:559–564.
Mahan, D. C. 1985. Effect of inorganic selenium supplementation onselenium retention in postweaning swine. J. Anim. Sci. 61:173–178.
Mahan, D. C. 1995. Selenium metabolism in animals: What role doesselenium yeast have? Pp. 257–267 in Biotechnology in the Feed Indus-try. Proc. Alltechs 11th Annual Symposium. T. P. Lyons and K. A.Jacques, eds. United Kingdom: Nottingham University Press.
Mahan, D. C., and A. W. Fetter. 1982. Dietary calcium and phosphoruslevels for reproducing sows. J. Anim. Sci. 54:285–291.
Mahan, D. C., and Y. Y. Kim. 1996. Effect of inorganic selenium attwo dietary levels on reproductive performance and tissue seleniumconcentrations in first-parity gilts and their progeny. J. Anim. Sci.74:2711–2718.
Mahan, D. C., and P. L. Magee. 1991. Efficacy of dietary sodium seleniteand calcium selenite provided in the diet at approved, marginally toxic,and toxic levels to growing swine. J. Anim. Sci. 69:4722–4725.
Mahan, D. C., and A. L. Moxon. 1978a. Effect of adding inorganicor organic selenium sources to the diets of young swine. J. Anim.Sci. 47:456–466.
Mahan, D. C., and A. L. Moxon. 1978b. Effect of increasing the levelof inorganic selenium supplementation in the postweaning diets ofswine. J. Anim. Sci. 46:384–390.
Mahan, D. C., and A. L. Moxon. 1984. Effect of inorganic seleniumsupplementation on selenosis in postweaning swine. J. Anim. Sci.58:1216–1221.
Mahan, D. C., and N. A. Parrett. 1996. Evaluating the efficacy of selenium-enriched yeast and sodium selenite on tissue selenium retention andserum glutathione peroxidase activity in grower and finisher diets.J. Anim. Sci. 74:2967–2974.
Mahan, D. C., J. E. Jones, J. H. Cline, R. F. Cross, H. S. Teague, andA. P. Crifo, Jr. 1973. Efficacy of selenium and vitamin E injections inthe prevention of white muscle disease in young swine. J. Anim. Sci.36:1104–1108.
Mahan, D. C., L. H. Penhale, J. H. Cline, A. L. Moxon, A. W. Fetter,and J. T. Yarrington. 1974. Efficacy of supplemental selenium in repro-ductive diets on sow and progeny performance. J. Anim. Sci.39:536–543.
Mahan, D. C., A. L. Moxon, and J. H. Cline. 1975. Efficacy of supplemen-tal selenium in reproductive diets on sow and progeny serum and tissueselenium values. J. Anim. Sci. 40:624–631.
Mahan, D. C., A. L. Moxon, and M. Hubbard. 1977. Efficacy of inorganicselenium supplementation to sow diets on resulting carry-over to theirprogency. J. Anim. Sci. 45:738–746.
Mahan, D. C., K. E. Ekstrom, and A. W. Fetter. 1980. Effect of dietaryprotein, calcium and phosphorus for swine from 7 to 20 kilogramsbody weight. J. Anim. Sci. 50:309–314.
Mahan, D. C., E. A. Newton, and K. R. Cera. 1996a. Effect of supplemen-tal sodium chloride, sodium phosphate, or hydrochloric acid in starterpig diets containing dried whey. J. Anim. Sci. 74:1217–1222.
Mahan, D. C., E. M. Weaver, and L. E. Russell. 1996b. Improved post-weaning pig performance responses by adding NaCl or HCl to dietscontaining animal plasma. J. Anim. Sci. 74(Suppl. 1):58 (Abstr).
Maner, J. H., W. G. Pond, and R. S. Lowrey. 1959. Effect of methodand level of iron administration on growth, hemoglobin and hematocritof suckling pigs. J. Anim. Sci. 18:1373–1377.
Manners, M. J., and M. R. McCrea. 1964. Estimates of the mineralrequirements of 2-day weaned piglets derived from data on mineralretention by sow-reared piglets. Ann. Zootechnol. 13:29–38.
Matrone, G., R. H. Hartman, and A. J. Clawson. 1959. Studies of amanganese-iron antagonism in the nutrition of rabbits and baby pigs.J. Nutr. 67:309–317.
Matrone, G., E. L. Thomason, and C. R. Bunn. 1960. Requirement andutilization of iron by the baby pig. J. Nutr. 72:459–465.
Maxson, P. F., and D. C. Mahan. 1983. Dietary calcium and phosphoruslevels for growing swine from 18 to 57 kilograms body weight. J. Anim.Sci. 56:1124–1134.
Maxson, P. F., and D. C. Mahan. 1986. Dietary calcium and phosphorusfor lactating swine at high and average production levels. J. Anim. Sci.63:1163–1172.
Mayo, R. H., M. P. Plurnlee, and W. M. Beeson. 1959. Magnesiumrequirement of the pig. J. Anim. Sci. 18:264–273.
McCance, R. A., and E. M. Widdowson. 1944. Activity of the phytase indifferent cereals and its resistance to dry heat. Nature 153:650.
McCarrison, R. 1933. The goitrogenic action of soybean and groundnut.Indian J. Med. Res. 7:189.
McCully, G. A., G. M. Hill, J. E. Link, R. L. Weavers, M. S. Carlsonand D. W. Rozeboom. 1995. Evaluation of zinc sources for the newlyweaned pig. J. Anim. Sci. 74(Suppl. 1):72 (Abstr.).
McDonald, F. F., D. Dunlop, and C. M. Bates. 1955. An effective treat-ment for anemia of piglets. Br. Vet. J. 111:403–407.
Menehan, L. A., P. A. Knapp, W. G. Pond, and J. R. Jones. 1963. Responseof early-weaned pigs to variations in dietary calcium level with andwithout lactose. J. Anim. Sci. 22:501–505.
Mertz, W. 1993. Chromium in human nutrition: A review. J. Nutr.123:626–633.
Meyer, J. H., R. H. Grummer, P. H. Phillips, and G. Bohstedt. 1950.Sodium, chlorine, and potassium requirements of growing pigs. J. Anim.Sci. 9:300–306.
Meyer, W. R., D. C. Mahan, and A. L. Moxon. 1981. Value of dietaryselenium and vitamin E for weanling swine as measured by performanceand tissue selenium and glutathione peroxidase activities. J. Anim.Sci. 52:302–311.
Michel, R. L., C. K. Whitehair, and K. K. Keahey. 1969. Dietary hepaticnecrosis associated with selenium-vitamin E deficiency in swine. J. Am.Vet. Med. Assoc. 155:50–59.
Mijada, V. S., and T. R. Cline. 1983. Lysine and potassium supplementa-tion of low protein pig starter diets. J. Anim. Sci. 57(Suppl. 1):87(Abstr.).
Miller, E. R. 1975. Utilization of inorganic sulfate by growing-finishingswine. Mich. Agric. Exp. Stn. Res. Rep. 289:100–104.
Miller, E. R. 1980. Bioavailability of minerals. P. 144 in Proc. MinnesotaNutrition Conference. St. Paul: University of Minnesota Press.
Miller, E. R. 1991. Iron, copper, zinc, manganese, and iodine in swinenutrition. Pp. 267–284 in Swine Nutrition, E. R. Miller, D. E. Ullrey,and A. J. Lewis, eds. Stoneham, MA: Butterworth-HeinemannPublishing.
Miller, E. R., and J. A. Froseth. 1982. Interaction of lysine and potassiumin swine nutrition. P. 47 in Proc. Fifth Annual International MineralsConference. Mundelein, IL: International Minerals and ChemicalCorp.
Miller, E. R., D. E. Ullrey, C. L. Zutaut, B. V. Baltzer, D. A. Schmidt,J. A. Hoefer, and R. W. Luecke. 1962. Calcium requirement of thebaby pig. J. Nutr. 77:7–16.
Miller, E. R., D. E. Ullrey, C. L. Zutaut, B. V. Baltzer, D. A. Schmidt,J. A. Hoefer, and R. W. Luecke. 1964a. Phosphorus requirement ofthe baby pig. J. Nutr. 82:34–39.
Miller, E. R., D. E. Ullrey, C. L. Zutaut, J. A. Hoefer, and R. W. Luecke.1964b. Mineral balance studies with the baby pig: Effects of dietaryphosphorus level upon calcium and phosphorus balance. J. Nutr.82:111–114.
Miller, E. R., D. E. Ullrey, C. L. Zutaut, B. V. Baltzer, D. A. Schmidt,J. A. Hoefer, and R. W. Luecke. 1965a. Magnesium requirement ofthe baby pig. J. Nutr. 85:13–20.
Miller, E. R., D. E. Ullrey, C. L. Zutaut, J. A. Hoefer, and R. W. Luecke.1965b. Comparisons of casein and soy proteins upon mineral balanceand vitamin D2 requirement of the baby pig. J. Nutr. 85:347–353.
66 Nutrient Requirements of Swine
Miller, E. R., D. E. Ullrey, C. L. Zutaut, J. A. Hoefer, and R. W. Luecke.1965c. Mineral balance studies with the baby pig: Effects of dietarymagnesium level upon calcium, phosphorus, and magnesium balance.J. Nutr. 86:209–212.
Miller, E. R., D. E. Ullrey, C. L. Zutaut, J. A. Hoefer, and R. W. Luecke.1965d. Mineral balance studies with the baby pig: Effects of dietaryvitamin D2 level upon calcium, phosphorus, and magnesium balance.J. Nutr. 85:255–258.
Miller, E. R., R. W. Luecke, D. E. Ullrey, B. V. Baltzer, B. L. Bradley,and J. A. Hoefer. 1968. Biochemical, skeletal and allometric changesdue to zinc deficiency in the baby pig. J. Nutr.95:278–286.
Miller, E. R., D. O. Liptrap, and D. E. Ullrey. 1970. Sex influence onzinc requirement of swine. Pp. 377–379 in Trace Element Metabolismin Animals, C. F. Mills, ed. Edinburgh: E. & S. Livingstone.
Miller, E. R., H. D. Stowe, P. K. Ku, and G. M. Hill. 1979. Copper andzinc in swine nutrition. P. 109 in National Feed Ingredients AssociationLiterature Review on Copper and Zinc in Animal Nutrition. West DesMoines, Iowa: National Feed Ingredients Association.
Miller, E. R., M. J. Parsons, D. E. Ullrey, and P. K. Ku. 1981a. Bioavail-ability of iron from ferric choline citrate and a ferric copper cobaltcholine citrate complex for young pigs. J. Anim. Sci. 52:783–787.
Miller, E. R., J. Skomial, P. K. Ku, and M. C. Hogberg. 1981b. Supplemen-tal potassium in low lysine diets for swine. J. Anim. Sci. 53(Suppl.1):90 (Abstr.).
Miller, E. R., G. L. Waxler, P. K. Ku, D. E. Ullrey, and C. K. Whitehair.1982. Iron requirements of baby pigs reared in germ-free or conven-tional environments on a condensed milk diet. J. Anim. Sci. 54:106–115.
Miller, W. T. 1938. Toxicity of selenium fed to swine in the form ofsodium selenite. J. Agric. Res. 56:831–842.
Miller, W. T., and K. T. Williams. 1940. Minimum lethal dose of selenium,as sodium selenite, for horses, mules, cattle and swine. J. Agric. Res.60:163–173.
Miracle, G. L., G. L. Cromwell, T. S. Stahly, and D. D. Kratzer. 1977.Availability of phosphorus in corn, wheat, and soybean meal for pigs.J. Anim. Sci. 45(Suppl. 1):101 (Abstr.).
Miser, R., and R. Blair. 1986. Reproductive performance of gilts andsows as affected by induced biotin deficiency and subsequent dietarybiotin supplementation. J. Anim. Physiol. Anim. Nutr. 55:196–208.
Mollgaard, H. 1946. On phytic acid, its importance in metabolism andits enzymic cleavage in bread supplemented with calcium. Biochem.J. 40:589–603.
Monegue, H. J., T. S. Stahly, and G. L. Cromwell. 1980. Effects of dietaryphosphorus levels on sow reproduction and lactation performance.J. Anim. Sci. 51(Suppl. 1):213 (Abstr.).
Mongin, P. 1981. Recent advances in dietary cation-anion balance: appli-cations in poultry. Proc. Nutr. Soc. 40:285–294.
Mooney, K. W., and G. L. Cromwell. 1995. Effects of dietary chromiumpicolinate supplementation on growth, carcass characteristics, andaccretion rates of carcass tissues in growing-finishing swine. J. Anim.Sci. 73:3351–3357.
Mooney, K. W., and G. L. Cromwell. 1996. Effects of chromium picolinateon performance and tissue accretion in pigs with different lean gainpotential. J. Anim. Sci. 74(Suppl. 1):65 (Abstr.)
Mooney, K. W., and G. L. Cromwell. 1997. Efficacy of chromium picoli-nate and chromium chloride as potential carcass modifiers in swine.J. Anim. Sci. 75:2661–2671.
Morgan, D. P., E. P. Young, I. P. Earle, R. J. Davey, and J. W. Stevenson.1969. Effects of dietary calcium and zinc on calcium, phosphorus andzinc retention in swine. J. Anim. Sci. 29:900–905.
Mraz, F. R., A. M. Johnson, and H. Patrick. 1958. Metabolism of cesiumand potassium in swine as indicated by cesium-134 and potassium-42.J. Nutr. 64:541–548.
Mroz, Z., A. W. Jongbloed, and P. A. Kemme. 1994. Apparent digestibilityand retention of nutrients bound to phytate complexes as influenced
by microbial phytase and feeding regimen in pigs. J. Anim. Sci.72:126–132.
Mudd, A. J., W. C. Smith, and D. G. Armstrong. 1969. The influence ofdietary concentration of calcium and phosphorus on their retention inthe body of growing pigs. J. Agric. Sci. (Camb.) 73:189–195.
Nasi, M. 1990. Microbial phytase supplementation for improving availabil-ity of plant phosphorus in the diet of the growing pig. J. Agric. Sci.Finl. 62:435–443.
National Research Council. 1980. Mineral Tolerance of Domestic Ani-mals. Washington, DC: National Academy Press. 577 pp.
National Research Council. 1995. Nutrient Requirements of LaboratoryAnimals. 4th Ed. Washington, DC: National Academy Press. 173 pp.
National Research Council. 1997. The Role of Chromium in AnimalNutrition. Washington, DC: National Academy Press. 80 pp.
Nelson, T. S., L. W. Ferrara, and N. L. Storer. 1968. Phytate phosphoruscontent of feed ingredients derived from plants. Poult. Sci.47:1372–1374.
Nesheim, M. C., R. M. Leach, Jr., T. R. Zeigler, and J. A. Serafin. 1964.Interrelationships between dietary levels of sodium, chlorine and pot-assium. J. Nutr. 84:361–366.
Newland, H. W., and G. K. Davis. 1961. Placental transfer of manganesein swine. J. Anim. Sci. 20:15–17.
Newland, H. W., D. E. Ullrey, J. A. Hoefer, and R. W. Luecke. 1958.The relationship of dietary calcium to zinc metabolism in pigs. J. Anim.Sci. 17:886–892.
Newton, G. L., and A. J. Clawson. 1974. Iodine toxicity: Physiologicaleffects of elevated dietary iodine on pigs. J. Anim. Sci. 39:879–884.
Nielsen, F. H. 1984. Ultratrace elements in nutrition. Annu. Rev.Nutr. 4:21–41.
Nielsen, F. H. 1994. Chromium. Pp. 264–268 in Modern Nutrition inHealth and Disease. 8th ed. M. E. Shils, J. A. Olson, and M. Shike,eds. Philadelphia: Lea & Febiger.
Nielsen, H. E., V. Danielsen, M. G. Simesen, G. Grissel-Nielsen, W.Hjarde, T. Leth, and A. Basse. 1979. Selenium and vitamin E deficiencyin pigs. Acta Vet. Scand. 20:276–288.
Nilsson, P. O. 1960. Acute iron poisoning with myocardial degenerationin piglets. Nord. Veterinaermed. 12:113–119.
Nimmo, R. D., E. R. Peo, Jr., J. D. Crenshaw, B. D. Moser, and A. J.Lewis. 1981a. Effects of level of dietary calcium-phosphorus duringgrowth and gestation on calcium-phosphorus balance and reproductiveperformance of first-litter sows. J. Anim. Sci. 52:1343–1349.
Nimmo, R. D., E. R. Peo, Jr., B. D. Moser, and A. J. Lewis. 1981b. Effectof level of dietary calcium-phosphorus during growth and gestationon performance, blood, and bone parameters of swine. J. Anim. Sci.52:1330–1342.
Norrdin, R. W., L. Krook, W. G. Pond, and E. F. Walker. 1973. Experi-mental zinc deficiency in weanling pigs on high- and low-calcium diets.Cornell Vet. 63:264–290.
Nunes, C. S. 1993. Evaluation of phytase resistance in swine diets todifferent pelleting temperatures. Pp. 269–271 in Enzymes in Anim.Nutr. Proc. First Symp.-Kartause Ittingen, Switzerland.
Nuoranne, P. J., R. P. Raunio, P. Saukko, and H. Karppanen. 1980.Metabolic effects of a low-magnesium diet in pigs. Br. J. Nutr.44:53–60.
Oberleas, D. 1983. The role of phytate in zinc bioavailability and homeo-stasis. Pp. 145–158 in Nutritional Bioavailability of Zinc, G. E. Inglett,ed. American Chemical Society Symposium Series No. 210. Washing-ton, DC: American Chemical Society.
Oberleas, D., and B. F. Harland. 1996. Impact of phytate on nutrientavailability. Pp. 77–84 in Phytase in Animal Nutrition and Waste Man-agement, M. B. Coelho, and E. T. Kornegay, eds. BASF Corporation,Mount Olive, NJ.
Oberleas, D. M. E. Muhrer, and B. L. O’Dell. 1962. Effects of phytic acidon zinc availability and parakeratosis in swine. J. Anim. Sci. 21:57–61.

Minerals 67
O’Connor, D. L., M. F. Picciano, M. A. Roos, and R. A. Easter. 1989.Iron and folate utilization in reproducing swine and their progeny.J. Nutr. 119:1984–1991.
O’Donovan, P. B., R. A. Pickett, M. P. Plumlee, and M. W. Beeson.1963. Iron toxicity in the young pig. J. Anim. Sci. 22:1075–1080.
O’Hara, P. J., A. P. Newman, and R. Jackson. 1960. Parakeratosis andcopper poisoning in pigs fed a copper supplement. Aust. Vet. J.36:225–229.
Okonkwo, A. C., P. K. Ku, E. R. Miller, K. K. Keahey, and D. E. Ullrey.1979. Copper requirement of baby pigs fed purified diets. J. Nutr.109:939–948.
Orstadius, K. 1960. Toxicity at a single subcutaneous dose of sodiumselenite in pigs. Nature l88:1117.
Orstadius, K., B. Wretlind, P. Lindberg. C. Nordstrom, and N. Lannek.1959. Plasma transaminase and transferase activities in pigs affectedwith muscular and liver dystrophy. Zentralbl. Veterinaermed.6:971–980.
Osborne, J. C., and J. W. Davis. 1968. Increased susceptibility to bacterialendotoxin of pigs with iron-deficiency anemia. J. Am. Vet. Med. Assoc.152:1630–1632.
Owen, A. A., E. R. Peo, Jr., P. J. Cunningham, and B. D. Moser. 1973.Effect of EDTA on utilization of dietary zinc by G-F swine. J. Anim.Sci. 37:470–478.
Page, T. G., L. L. Southern, T. L. Ward, and D. L. Thompson, Jr. 1993.Effect of chromium picolinate on growth and serum and carcass traitsof growing-finishing pigs. J. Anim. Sci. 71:656–662.
Pallauf, V. J., D. Hohler, and G. Rimbach. 1992a. Effect of microbialphytase supplementation to a maize-soya-diet on the apparent absorp-tion on Mg, Fe, Cu, Mn and Zn and parameters of Zn-status in piglets.J. Anim. Physiol. Anim. Nutr. 68:1–9.
Pallauf, V. J., D. Hohler, G. Rimbach, and H. Neusser. 1992b. Effect ofmicrobial phytase supplementation to a maize-soy-diet on the apparentabsorption of phosphorus and calcium in piglets. J. Anim. Physiol.Anim. Nutr. 67:30–40.
Pallauf, J., G. Rimbach, S. Pippig, B. Schindler, and E. Most. 1994a.Effect of phytase supplementation to a phytate-rich diet based onwheat, barley and soya on the bioavailability of dietary phosphorus,calcium, magnesium, zinc and protein in piglets. Agribiol. Res.47:39–48.
Pallauf, J., G. Rimbach, S. Pippig, B. Schindler, and E. Most. 1994b.Dietary effect of phytogenic phytase and an addition of microbialphytase to a diet based on field beans, wheat, peas and barley on theutilization of phosphorus, calcium, magnesium, zinc and protein inpiglets. Z. Ernahrungswiss 33:128–135.
Parsons, M. J. 1979. The iron requirement of the neonatal pig fromparental iron dextran. Mich. Agric. Exp. Stn. Res. Rep. 386:14.
Partridge, I. G. 1981. A comparison of defluorinated rock phosphate anddicalcium phosphate, in diets containing either skim milk powder orsoya bean meal as the main protein supplement, for early-weaned pigs.Anim. Prod. 32:67–73.
Patience, J. F., and M. S. Wolynetz. 1990. Influence of dietary undeter-mined anion on acid-base status and performance in pigs. J. Nutr.120:579–587.
Patience, J. F., R. E. Austic, and R. D. Boyd. 1987. Effect of dietaryelectrolyte balance on growth and acid-base status in swine. J. Anim.Sci. 64:457–466.
Patterson, D. S. P., W. M. Allen, D. C. Thurley, and J. T. Done. 1967.The role of tissue peroxidation in iron-induced myodegeneration ofpiglets. Biochem. J. 104:2P–3P.
Patterson, D. S. P., W. M. Allen, S. Berrett, D. Sweasy, D. C. Thurley,and J. T. Done. 1969. A biochemical study of the pathogenesis of iron-induced myodegeneration of piglets. Zentralbl. Veterinaermed.16:199–214.
Peeler, H. T. 1972. Biological availability of nutrients in feeds: Availabilityof major mineral ions. J. Anim. Sci. 35:695–712.
Peo, E. R., Jr. 1976. Calcium in Swine Nutrition. West Des Moines, IA:National Feed Ingredient Association. 65 pp.
Peo, E. R., Jr. 1991. Calcium, phosphorus, and vitamin D in swine nutri-tion. Pp. 165–182 in Swine Nutrition, E. R. Miller, D. E. Ullrey, andA. J. Lewis, eds. Stoneham, ME: Butterworth-Heinemann Publishing.
Peo, E. R., Jr., G. W. Libal, G. F. Wehrbein, P. J. Cunningham, andP. E. Vipperman, Jr. 1969. Effect of dietary increments of calcium andphosphorus on G-F swine. J. Anim. Sci. 29:141(Abstr.).
Peo, E. R., Jr., A. J. Lewis, and J. D. Crenshaw. 1982a. Effect of aluminum:fluorine ratios on the bioavailability of phosphorus from raw rock phos-phate for G-F swine. J. Anim. Sci. 55(Suppl. 1):290 (Abstr.).
Peo, E. R., Jr., A. J. Lewis, J. D. Crenshaw, and L. V. Himmelberg. 1982b.Effect of aluminum on the bioavailability of phosphorus from raw rockphosphate for G-F swine. J. Anim. Sci. 55(Suppl. 1):290 (Abstr.).
Peplowski, M. A., D. C. Mahan, F. A. Murray, A. L. Moxon, A. H. Cantor,and K. E. Ekstrom. 1980. Effect of dietary and injectable vitamin Eand selenium in weanling swine antigenically changed with sheep redblood cell. J. Anim. Sci. 51:344–351.
Piatkowski, T. L., D. C. Mahan, A. H. Cantor, A. L. Moxon, J. H. Cline,and A. P. Grifo, Jr. 1979. Selenium and vitamin E in semipurified dietsfor gravid and nongravid gilts J. Anim. Sci. 48:1357–1365.
Pickett, R. A., M. P. Plumlee, W. H. Smith, and W. M. Beeson. 1960.Oral iron requirement of the early-weaned pig. J. Anim. Sci.19:1284. (Abstr.)
Piper, R. C., J. A. Froseth, C. R. McDowell, G. H. Kroening, and I. A.Dyer. 1975. Selenium-vitamin E deficiency in swine fed peas (Pisumsativum). Am. J. Vet. Res. 36:273–281.
Plumlee, M. P., D. M. Thrasher, W. M. Beeson, F. N. Andrews, andH. E. Parker. 1956. The effects of a manganese deficiency upon thegrowth, development and reproduction of swine. J. Anim. Sci.15:352–368.
Plumlee, M. P., C. E. Jordan, M. H. Kennington, and W. M. Beeson.1958. Availability of the phosphorus from various phosphate materialsfor swine. J. Anim. Sci. 17:73–88.
Pointillart, A., and L. Gueguen. 1978. Osteochondrose et faiblesse despattes chez le porc. Ann. Biol. Anim. Bioch. Biophys. 18:201–210.
Pointillart, A., N. Fontaine, and M. Thomasset. 1984. Phytate phosphorusutilization and intestinal phosphatases in pigs fed low phosphorus:Wheat or corn diets. Nutr. Rep. Int. 29:473–483.
Pollmann, D. S., J. E. Smith, J. S. Stevenson, D. A. Schoneweis, andR. H. Hines. 1983. Comparison of gleptoferron with iron dextran foranemia prevention in young pigs. J. Anim. Sci. 56:640–644.
Pond, W. G., and J. R. Jones. 1964. Effect of level of zinc in high-calciumdiets on pigs from weaning through one reproductive cycle and onsubsequent growth of their offspring. J. Anim. Sci. 23:1057–1060.
Pond, W. G., R. S. Lowrey, J. H. Maner, and J. K. Loosli. 1961. Parenteraliron administration to sows during gestation or lactation. J. Anim.Sci. 20:747–750.
Pond, W. G., J. R. Jones, and G. H. Kroening. 1964. Effect of level ofdietary zinc and source and level of corn on performance and incidenceof parakeratosis in weanling pigs. J. Anim. Sci. 23:16–20.
Pond, W. G., P. Chapman, and E. Walker. 1966. Influence of dietaryzinc, corn oil and cadmium on certain blood components, weight gainand parakeratosis in young pigs. J. Anim. Sci. 25:122–127.
Pond, W. G., E. F. Walker, Jr., and D. Kirkland. 1975. Weight gain, feedutilization and bone and liver mineral composition of pigs fed high ornormal Ca-P diets from weaning to slaughter weight. J. Anim. Sci.41:1053–1056.
Pond, W. G., E. F. Walker, Jr., and D. Kirkland. 1978. Effect of dietaryCa and P levels from 40 to 100 kg body weight on weight gain andbone and soft tissue mineral concentrations. J. Anim. Sci. 46:686–691.
68 Nutrient Requirements of Swine
Pond, W. G., J. T. Yen, D. A. Hill, and W. E. Wheeler. 1981. DietaryCa source and level: Effects on weanling pigs. J. Anim. Sci. 53(Suppl.1):91 (Abstr.).
Poulsen, H. D. 1989. Zinc oxide for pigs during weaning. MeddelelseNo. 746. Statens Husdrybrugsforsoeq (Denmark).
Prasad, A. S., D. Oberleas, P. Wolf, J. P. Horwitz, E. R. Miller, and R. W.Luecke. 1969. Changes in trace elements and enzyme activities intissues of zinc-deficient pigs. Am. J. Clin. Nutr. 22:628–637.
Prasad, A. S., D. Oberleas, E. R. Miller, and R. W. Luecke. 1971. Bio-chemical effects of zinc deficiency: Changes in activities of zinc-depen-dent enzymes and ribonucleic acid and deoxyribonucleic acid contentof tissues. J. Lab. Clin. Med. 77:144–152.
Prince, T. J., V. W. Hays, and G. L. Cromwell. 1975. Environmentaleffects of high copper pig manure on pasture for sheep. J. Anim. Sci.41:326 (Abstr.).
Prince, T. J., V. W. Hays, and G. L. Cromwell. 1984. Interactive effectsof dietary calcium, phosphorus and copper on performance and livercopper stores of pigs. J. Anim. Sci. 58:356–361.
Qian, H., E. T. Kornegay, and D. E. Conner, Jr. 1996. Adverse effectsof wide calcium:phosphorus ratios on supplemental phytase efficacyfor weanling pigs fed two dietary phosphorus levels. J. Anim. Sci.74:1288–1297.
Radcliffe, J. S., E. T. Kornegay, and D. E. Conner, Jr. 1995. The effectof phytase on calcium release in weanling pigs fed corn–soybean mealdiets. J. Anim. Sci. 73(Suppl. 1):173 (Abstr.).
Ramisz, A., A. Balicka-Laurans, and G. Ramisz. 1993. The influence ofselenium on production, reproduction and health in pigs. AdvancesAg. Sci. 2:67.
Reinhart, G. A., and D. C. Mahan. 1986. Effect of various calcium:phosphorus ratios at low and high dietary phosphorus for starter, growerand finisher swine. J. Anim. Sci. 63:457–466.
Rheaume, J. A., and E. R. Chavaz. 1989. Trace mineral metabolism in non-gravid, gestating and lactating gilts fed two dietary levels of manganese.J. Trace Elem. Electrolytes Health Dis. 3:231–242.
Rickes, E. L., N. G. Brink, F. R. Koniuszy, T. R. Wood, and K. Folkers.1948. Vitamin B12, cobalt complex. Science 108:134.
Ritchie, H. D., R. W. Luecke, B. V. Baltzer, E. R. Miller, D. E. Ullrey,and J. A. Hoefer. 1963. Copper and zinc interrelationships in the pig.J. Nutr. 79:117–123.
Robinson, W. L. 1950. Cobalt with a soybean oil meal ration for pigs.J. Anim. Sci. 9:665. (Abstr.)
Roof, M. D., and D. C. Mahan. 1982. Effect of carbadox and variousdietary copper levels for weanling swine. J. Anim. Sci. 55:1109–1117.
Roos, M. A., and R. A. Easter. 1986. Effect on sow and piglet performanceof feeding a diet containing 250 ppm copper during lactation. J. Anim.Sci. 63(Suppl. 1):115 (Abstr.).
Ross, R. D. 1983. The Biological Availability of Calcium and Phosphorusin Selected Feedstuffs for the Pig. Ph.D. Dissertation. University ofKentucky, Lexington.
Ross, R. D., C. L. Cromwell, and T. S. Stahly. 1982. Biological availabilityof the phosphorus in regular and dehulled soybean meal for growingpigs. J. Anim. Sci. 55(Suppl. 1):93 (Abstr.).
Ross, R. D., C. L. Cromwell, and T. S. Stahly. 1983. Biological availabilityof the phosphorus in high-moisture and pelleted corn. J. Anim. Sci.57(Suppl. 1):96 (Abstr.).
Ross, R. D., G. L. Cromwell, and T. S. Stahly. 1984. Effects of sourceand particle size on the biological availability of calcium in calciumsupplements for growing pigs. J. Anim. Sci. 59:125–134.
Rotruck, J. T., A. L. Pope, H. E. Canther, A. B. Swanson, D. C. Hafeman,and W. G. Hoekstra. 1973. Selenium: Biochemical role as a componentof glutathione peroxidase. Science 179:588–590.
Ruth, C. R., and J. F. Van Vleet. 1974. Experimentally induced selenium-vitamin E deficiency in growing swine: Selective destruction of type Iskeletal muscle fibers. Am. J. Vet. Res. 35:237–244.
Rutledge, E. A., L. E. Hanson, and R. J. Meade. 1961. A study of thecalcium requirements of pigs weaned at three weeks of age. J. Anim.Sci. 20:243–245.
Rydberg, M. E., H. L. Self, T. Kowalczyk, and R. H. Grummer. 1959.The effect of prepartum intramuscular iron treatment of dams on litterhemoglobin levels. J. Anim. Sci. 18:415–419.
Sansom, B. F., and P. T. Cleed. 1981. The ingestion of sow’s faeces bysuckling piglets. Br. J. Nutr. 46:451–456.
Sazzad, H. M., R. A. Vale, and E. P. Filgueiras. 1993. Bioavailability ofcopper from inorganic sources for weaning pigs. VII World Conf. onAnim. Prod., Edmonton, Canada, 94 (Abstr. #50).
Schell, T. C., and E. T. Kornegay. 1996. Zinc concentration in tissuesand performance of weanling pigs fed pharmacological levels of zincfrom ZnO, Zn-methionine, Zn-lysine, and ZnSO4. J. Anim. Sci.74:1584–1593.
Shanklin, S. H., E. R. Miller, D. E. Ullrey, J. A. Hoefer, and R. W.Luecke. 1968. Zinc requirement of baby pigs on casein diets.J. Nutr. 96:101–108.
Sharp, B. A., L. C. Young, and A. A. van Dreummel. 1972a. Dietaryinduction of mulberry heart disease and hepatosis dietetica in pigs. 1.Nutritional aspects. Can. J. Comp. Med. 36:371–376.
Sharp, B. A., L. C. Young, and A. A. van Dreummel. 1972b. Effect ofsupplemental vitamin E and selenium in high–moisture corn diets onthe incidence of mulberry heart disease and hepatosis dietetica in pigs.Can. J. Comp. Med. 36:393–397.
Sheffy, B. E., and R. D. Schultz. 1979. Influence of vitamin E andselenium on immune response mechanisms. Fed. Proc. 38:2139–2143.
Sihombing, D. T. H., G. L. Cromwell, and V. W. Hays. 1974. Effects ofprotein source, goitrogens and iodine level on performance and thyroidstatus of pigs. J. Anim. Sci. 39:1106–1112.
Simesen, M. C., P. T. Jensen, A. Basse, C. Cissel–Nielsen, T. Leth, V.Danielsen, and H. E. Nielsen. 1982. Clinicopathologic findings in youngpigs fed different levels of selenium, vitamin E and antioxidants. ActaVet. Scand. 23:295–308.
Simons, P. C. M., H. A. J. Versteegh, A. W. Jongbloed, P. A. Kemme,P. Slump, K. D. Bos, M. G. E. Wolters, R. F. Beudeker, and G. J.Verschoor. 1990. Improvement of phosphorus availability by microbialphytase in broilers and pigs. Br. J. Nutr. 64:525–540.
Slatter, E. E. 1955. Mild iodine deficiency and losses of newborn pigs.J. Am. Vet. Med. Assoc. 127:149–152.
Smith, II, J. W., M. D. Tokach, R. D. Goodband, J. L. Nelssen, W. B.Nessmith, Jr., K. Q. Owen, and B. T. Richert. 1995a. The effect ofincreasing zinc oxide supplementation on starter pig growth perfor-mance. J. Anim. Sci. 73(Suppl. 1):72. (Abstr).
Smith, II, J. W., M. D. Tokach, R. D. Goodband, J. L. Nelssen, B. T.Richert, and S. S. Dritz. 1995b. Interaction between zinc oxide andcopper sulfate on starter pig performance. J. Anim. Sci. 73(Suppl.1):73. (Abstr).
Smith, K. 1966. Inactivation of gossypol with mineral salts. Memphis,TN: National Cottonseed Production Association.
Smith, W. H., M. P. Plumlee, and W. M. Beeson. 1958. Zinc requirementfor growing swine. Science 128:1280–1281.
Smith, W. H., M. P. Plumlee, and W. M. Beeson. 1962. Effect of sourceof protein on zinc requirement of the growing pig. J. Anim. Sci.21:399–405.
Soares, J. H. 1995. Calcium bioavailability. Pp. 95–118 in Bioavailabilityof Nutrients for Animals, C. B. Ammerman, D. H. Baker, and A. J.Lewis, eds. New York: Academic Press.
Southern, L. L., and D. H. Baker. 1981. Effect of methionine or cysteineon cobalt toxicity in the chick. Poultry Sci. 60:1303–1308.
Spallholz, J. E. 1980. Selenium: What role in immunity and immunecytoxicity. Pp. 103–117 in Proc. Second International Symposium onSelenium in Biology and Medicine, J. E. Spallholz, J. L. Martin, andH. E. Ganther, eds. Westport, CT: AVI Publishing Co.

Minerals 69
Spruill, D. C., V. W. Hays, and G. L. Cromwell. 1971. Effects of dietaryprotein and iron on reproduction and iron-related blood constituentsin swine. J. Anim. Sci. 33:376–384.
Stahly, T. S., C. L. Cromwell, and H. J. Monegue. 1980. Effects of thedietary inclusion of copper and (or) antibiotics on the performance ofweanling pigs. J. Anim. Sci. 51:1347–1351.
Stansbury, W. F., L. F. Tribble, and D. E. Orr, Jr. 1990. Effect of chelatedcopper sources on performance of nursery and growing pigs. J. Anim.Sci. 68:1318–1322.
Stant, E. C., T. C. Martin, and W. V. Kassler. 1969. Potassium contentof the porcine body and carcass at 23, 46, 68 and 91 kilograms liveweight. J. Anim. Sci. 29:547–556.
Stearns, D. M., J. J. Belbruno, and K. E. Wetterhahn. 1995. Chromium(III) picolinate produces chromosome damage in Chinese hamsterovary cells. FASEB J. 9:1643–1648.
Steele, N. C., T. G. Althen, and L. T. Frobish. 1977. Biological activityof glucose tolerance factor in swine. J. Anim. Sci. 45:1341–1345.
Stevenson, J W., and I. P. Earle. 1956. Studies on parakeratosis in swine.J. Anim. Sci. 15:1036–1045.
Stober, C. R., C. L. Cromwell, and T. S. Stahly. 1979. Availability ofphosphorus in corn and barley for the pig. J. Anim. Sci. 49(Suppl.1):97 (Abstr.).
Stober, C. R., G. L. Cromwell, and T. S. Stahly. 1980a. Biological availabil-ity of the phosphorus in cottonseed meal for growing pigs. J. Anim.Sci. 51(Suppl. 1):49 (Abstr.).
Stober, C. R., G. L. Cromwell, and T. S. Stahly. 1980b. Biological availabil-ity of the phosphorus in oats, wheat middlings, and wheat bran forpigs. J. Anim. Sci. 51(Suppl. 1):80 (Abstr.).
Stockland, W. L., and L. C. Blaylock. 1973. Influence of dietary calciumand phosphorus levels on the performance and bone characteristics ofgrowing-finishing swine. J. Anim. Sci. 37:906–912.
Stowe, H. D., and T. H. Herdt. 1992. Clinical assessment of seleniumstatus of livestock. J. Anim. Sci. 70:3928–3933.
Suomi, K., and T. Alaviuhkola. 1992. Responses to organic and inorganicselenium in the performance and blood selenium content of growingpigs. Ag. Sci. Finland 1:211.
Suttle, N. F., and C. F. Mills. 1966a. Studies of toxicity of copper to pigs.I. Effects of oral supplements of zinc and iron salts on the developmentof copper toxicosis. Br. J. Nutr. 20:135–148.
Suttle, N. F., and C. F. Mills. 1966b. Studies of toxicity of copper topigs. II. Effect of protein source and other dietary components on theresponse to high and moderate intakes of copper. Br. J. Nutr.20:149–161.
Svajgr, A. J., E. R. Peo, Jr., and P. E. Vipperman, Jr. 1969. Effects ofdietary levels of manganese and magnesium on performance of grow-ing-finishing swine raised in confinement and on pasture. J. Anim.Sci. 29:439–443.
Swinkels, J. W. G. M., E. T. Kornegay, W. Zhou, M. D. Lindemann,K. E. Webb, Jr., and M. W. A. Verstegen. 1996. Effectiveness of a zincamino acid chelate and zinc sulfate in restoring serum and soft tissuezinc concentrations when fed to zinc-depleted pigs. J. Anim. Sci.74:2420–2430.
Taylor, T. G. 1965. The availability of the calcium and phosphorus ofplant materials for animals. Proc. Nutr. Soc. 24:105–112.
Teague, H. S., and L. E. Carpenter. 1951. The demonstration of copperdeficiency in young growing pigs. J. Nutr. 43:389–399.
Thacker, P. A. 1991. Effect of high levels of copper or dichlorvos duringlate gestation and lactation on sow productivity. Can. J. Anim. Sci.71:227–248.
Theuer, R. C., and W. C. Hoekstra. 1966. Oxidation of 14C-labeled carbo-hydrate, fat and amino acid substrates by zinc-deficient rats. J. Nutr.89:448–454.
Thomas, H. R., and E. T. Kornegay. 1981. Phosphorus in swine. I. Influ-ence of dietary calcium and phosphorus levels and growth rate on
feedlot performance of barrows, gilts and boars. J. Anim. Sci.52:1041–1048.
Thompson, R. H., C. H. McMurray, and W. J. Blanchflower. 1976. Thelevels of selenium and glutathione peroxidase activity in blood of sheep,cows and pigs. Res. Vet. Sci. 20:229–231.
Thoren-Tolling, K. 1975. Studies on the absorption of iron after oraladministration in piglets. Acta Vet. Scand. Suppl. 54:1–121.
Tokach, L. M., M. D. Tokach, R. D. Goodband, J. L. Nelssen, S. C.Henry, and T. A. Marsteller. 1992. Influence of zinc oxide in starterdiets on pig performance. P. 411 in Proc. American Association ofSwine Practitioners.
Tonroy, B., M. P. Plumlee, J. H. Conrad, and T. R. Cline. 1973. Apparentdigestibility of the phosphorus in sorghum grain and soybean meal forgrowing swine. J. Anim. Sci. 36:669–673.
Trapp, A. L., K. K. Keahey, D. L. Whitenack, and C. K. Whitehair. 1970.Vitamin E-selenium deficiency in swine. Differential diagnosis andnature of field problem. J. Am. Vet. Med. Assoc. 157:289–300.
Traylor, S. L., and G. L. Cromwell. 1998. Bioavailability of phosphorusin meat and bone meal for growing pigs. J. Anim. Sci. 76(Suppl. 2)Abstract no. 119, Midwestern Section meeting of the American Societyof Animal Science, Des Moines, IA.
Trotter, M., and C. L. Allee. 1979a. Availability of phosphorus in corn,soybean meal and wheat. J. Anim. Sci. 49(Suppl. 1):255 (Abstr.).
Trotter, M., and G. L. Allee. 1979b. Availability of phosphorus in dryand high-moisture grain for pigs and chicks. J. Anim. Sci. 49(Suppl.1):98 (Abstr.).
Trotter, M., and G. L. Allee. 1979c. Effects of steam pelleting and extrud-ing sorghum grain-soybean meal diets on phosphorus availability forswine. J. Anim. Sci. 49(Suppl. 1):255 (Abstr.).
Tucker, H. F., and W. D. Salmon. 1955. Parakeratosis or zinc deficiencydisease in the pig. Proc. Soc. Exp. Biol. Med. 88:613–616.
Tunmire, D. L., D. E. Orr, Jr., and L. F. Tribble. 1983. Ammoniumpolyphosphate vs. dicalcium phosphate as a phosphorus supplementfor growing-finishing swine. J. Anim. Sci. 57:632–637.
Ullrey, D. E. 1992. Basis for regulation of selenium supplements in animaldiets. J. Anim. Sci. 70:3922–3927.
Ullrey, D. E. 1974. The selenium-deficiency problem in animal agricul-ture. Pp. 275–293 in Trace Element Metabolism in Animals, Volume 2,W. C. Hoekstra, J. W. Suttie, H. E. Ganther, and W. Mertz, eds. Balti-more: University Park Press.
Ullrey, D. E., E. R. Miller, D. R. West, D. A. Schmidt, R. W. Seerley, J. A.Hoefer, and R. W. Luecke. 1959. Oral and parenteral administration ofiron in the prevention and treatment of baby pig anemia. J. Anim.Sci. 18:256–263.
Ullrey, D. E., E. R. Miller, O. A. Thompson, l. M. Ackermann, D. A.Schmidt, J. A. Hoefer, and R. W. Luecke. 1960. The requirement ofthe baby pig for orally administered iron. J. Nutr. 70:187–192.
Ullrey, D. E., E. R. Miller, J. P. Hitchcock, P. K. Ku, R. L. Covert, J.Hegenauer, and P. Saltman. 1973. Oral ferric citrate vs. ferrous sulfatefor prevention of baby pig anemia. Mich. Agric. Exp. Stn. Res. Rep.232:34–38.
Underwood, E. J. 1971. Trace Elements in Human and Animal Nutrition,Third edition. New York: Academic Press.
Underwood, E. J. 1977. Trace Elements in Human and Animal Nutrition,Fourth edition. New York: Academic Press.
van Kempen, G. J. M., P. van der Kerk, and A. H. M. Crimbergen. 1976.The influence of the phosphorus and calcium content of feeds ongrowth, feed conversion and slaughter quality and on the chemical,mechanical and histological parameters on the bone tissue of pigs.Neth. J. Agric. Sci. 24:120–139.
van Vleet, J. F., K. B. Meyer, and H. J. Olander. 1973. Control of selenium-vitamin E deficiency in growing swine by parenteral administration ofselenium-vitamin E preparations to baby pigs or to pregnant sows andtheir baby pigs. J. Am. Vet. Med. Assoc. 163:452–456.
70 Nutrient Requirements of Swine
van Vleet, J. F., A. H. Rebar, and V. J. Ferns. 1977. Acute cobalt andisoproterenol cardiotoxicity in swine: Protection by selenium-vitaminE supplementation and potentiation by stress-susceptible phenotype.Am. J. Vet. Res. 38:991–1002.
Venn, J. A. J., R. A. McCance, and E. M. Widdowson. 1947. Iron metabo-lism in piglet anemia. J. Comp. Pathol. Ther. 57:314–325.
Veum, T. L., J. T. Gallo, W. G. Pond, L. D. Van Vleck, and J. K. Loosli.1965. Effect of ferrous fumarate in the lactation diet on sow milk iron,pig hemoglobin and weight gain. J. Anim. Sci. 24:1169–1173.
Vipperman, P. E., Jr., E. R. Peo, Jr., and P. J. Cunningham. 1974. Effectof dietary calcium and phosphorus level upon calcium, phosphorus andnitrogen balance in swine. J. Anim. Sci. 38:758–765.
Wahlstrom, R. C., and E. W. Juhl. 1960. A comparison of differentmethods of iron administration on rate of gain and hemoglobin levelof the baby pig. J. Anim. Sci. 19:183–188.
Wahlstrom, R. C., and G. W. Libal. 1981. Influence of supplementaldietary potassium on performance of growing-finishing swine. SwineDay Rep. ASR 81-11. Brookings, SD: South Dakota State University.
Wahlstrom, R. C., L. D. Kamstra, and O. E. Olson. 1955. The effectof arsanilic acid and 3-nitro-4-hydroxyphenylarsonic acid on seleniumpoisoning in the pig. J. Anim. Sci. 14:105–110.
Wallace, H. D. 1967. High Level Copper in Swine Feeding. New York:International Copper Research Association, Inc.
Ward, T. L., L. L. Southern, and R. A. Anderson. 1995. Effect of dietarychromium source on growth, carcass characteristics, and plasma metab-olite and hormone concentrations in growing-finishing swine. J. Anim.Sci. 73(Suppl. 1):189 (Abstr.).
Ward, T. L., G. L. Asche, G. F. Louis, and D. S. Pollmann. 1996. Zinc-methionine improves growth performance of starter pigs. J. Anim. Sci.74(Suppl. 1):182 (Abstr.).
Wedekind, K. J., A. J. Lewis, M. A. Giesemann, and P. S. Miller. 1994.Bioavailability of zinc from inorganic and organic sources for pigs fedcorn–soybean meal diets. J. Anim. Sci. 72:2681–2689.
Weeden, T. L., J. L. Nelssen, R. D. Goodband, J. A. Hansen, K. G. Fiesen,and B. T. Richert. 1993a. The interrelationship of porcine somatotropinadministration and dietary phosphorus on growth performance andbone properties in developing gilts. J. Anim. Sci. 71:2683–2692.
Weeden, T. L., J. L. Nelssen, R. D. Goodband, J. A. Hansen, G. E.Fitzner, K. G. Fiesen, and J. L. Laurin. 1993b. Effects of porcinesomatotropin and dietary phosphorus on growth performance and boneproperties of gilts. J. Anim. Sci. 71:2674–2682.
Wegger, I., K. Rasmussen, and P. F. Jorgensen. 1980. Glutathione peroxi-dase activity in liver and kidney as indicator of selenium status in swine.Livestock Prod. Sci. 7:175–180.
Weinberg, E. D. 1978. Iron and infection. Microbiol. Res. 42:45–66.Welch, H. 1928. Goiter in farm animals. Mont. Agric. Exp. Stn. Bull.
214:1–27.White, M., J. Pettigrew, J. Zollitsch-Stelzl, and B. Crooker. 1993. Chro-
mium in swine diets. Pp. 251–261 in Proc. 54th Minn. Nutr. Conf.and Nat. Renderers Tech. Symp.
Whiting, F., and L. M. Bezeau. 1958. The calcium, phosphorus and zincbalance in pigs as influenced by the weight of pig and the level ofcalcium, zinc and vitamin D in the ration. Can. J. Anim. Sci. 38:109–117.
Wilde, R. O. de, and J. Jourquin. 1992. Estimation of digestible phospho-rus requirements in growing-finishing pigs by carcass analysis. J. Anim.Phys. Anim. Nutr. 68:218.
Wilkinson, J. E., M. C. Bell, J. A. Bacon, and F. B. Masincupp. 1977a.Effects of supplemental selenium on swine. I. Gestation and lactation.J. Anim. Sci. 44:224–228.
Wilkinson, J. E., M. C. Bell, J. A. Bacon, and C. C. Melton. 1977b. Effectsof supplemental selenium on swine. II. Growing-finishing. J. Anim.Sci.44:229–233.
Young, L. G., J. H. Lumsden, A. Lun, J. Claxton, and D. E. Edmeades.1976. Influence of dietary levels of vitamin E and selenium on tissueand blood parameters in pigs. Can. J. Comp. Med. 40:92–97.
Young, L. G., M. Leunissen, and J. L. Atkinson. 1993. Addition of micro-bial phytase to diets of young pigs. J. Anim. Sci. 71:2147–2151.
Zhou, W., E. T. Kornegay, and M. D. Lindemann. 1994a. The role offeed intake and copper source on copper-stimulated growth in weanlingpigs. J. Anim. Sci. 72:2385–2394.
Zhou, W., E. T. Kornegay, M. D. Lindemann, J. W. G. M. Swinkels, M. K.Welten, and E. A. Wong. 1994b. Stimulation of growth by intravenousinjection of copper in weanling pigs. J. Anim. Sci. 72:2395–2043.
Zimmerman, D. R. 1980. Iron in swine nutrition. In National FeedIngredient Association Literature Review on Iron in Animal and PoultryNutrition. Des Moines, Iowa: National Feed Ingredient Association.
Zimmerman, D. R. 1982. Lysine and potassium levels in pig starter diets.J. Anim. Sci. 55(Suppl. 1):97.
Zimmerman, D. R., V. C. Speer, V. W. Hays, and D. V. Catron. 1959.Injectable iron dextran and several oral iron treatments for the preven-tion of iron deficiency anemia of baby pigs. J. Anim. Sci. 18:1409–1415.
Zimmerman, D. R., V. C. Speer, V. W. Hays, and D. V. Catron. 1963.Effect of calcium and phosphorus levels on baby pig performance.J. Anim. Sci. 22:658–661.
Zoubek, G. L., E. R. Peo, Jr., B. D. Moser, T. Stahly and P. J. Cunningham.1975. Effects of source on copper uptake by swine. J. Anim. Sci.40:880–884.
5 Vitamins
The term ‘‘vitamin’’ describes an organic compound dis-tinct from amino acids, carbohydrates, and lipids that isrequired in minute amounts for normal growth and repro-duction. Some vitamins are not required in the diet becausethey can be synthesized readily from other feed or meta-bolic constituents, or by microorganisms in the intestinaltract. Vitamins are generally classified as either fat-solubleor water-soluble. The fat-soluble vitamins include vitaminsA, D, E, and K. The water-soluble vitamins include theB-vitamins (biotin, choline, folacin, niacin, pantothenicacid, riboflavin, thiamin, B6, and B12) and vitamin C(ascorbic acid).
Vitamins are primarily required as coenzymes in nutrientmetabolism. In feedstuffs, vitamins exist primarily as pre-cursor compounds or coenzymes that may be bound orcomplexed in some manner. Hence, digestive processesare required to either release or convert vitamin precursorsor complexes to usable and absorbable forms. The require-ments for the individual vitamins at various stages of thelife cycle are shown in tables provided in Chapter 10. Tomeet the deficiencies of vitamins in practical diets, vitaminpremixes have been developed and are commonly addedto swine diets.
Dietary addition of excess levels of vitamins A and D tothe diet has been demonstrated to have toxic effects inswine. In contrast, very few toxicity signs have beenreported for the B-vitamins or for vitamins E and K(National Research Council, 1987).
Several recent studies have suggested that NationalResearch Council (1988) levels of one or more of thecommonly supplemented B-vitamins (riboflavin, niacin,pantothenic acid, and vitamin B12) are inadequate for maxi-mal performance of newly weaned pigs (Wilson et al.,1991a,b; 1992a,b; 1993) or high-lean growing pigs (Stahlyet al., 1995). Indeed, additions of these B-vitamins at levelsof two to ten times the estimated requirements have tendedto improve growth rate or feed efficiency of pigs. However,
71
it is not known what level (above those suggested by theNational Research Council in 1988) may be needed. Linde-mann et al. (1995) observed a trend toward improvedweight gain and feed intake in weanling pigs fed five timesNational Research Council (1988) levels of commonly sup-plemented vitamins (including fat-soluble vitamins), butfeed efficiency tended to be poorer with the higher levelsof vitamin fortification. In a separate study, the same grouptested a level of vitamin B12 7.5 times the 1988 standard andobserved no positive responses. In most of these previouslymentioned studies, combinations of vitamins were addedand fortification levels were such that it is not possible toestablish revised estimates of requirements for individualB-vitamins. Therefore, the B-vitamin requirements forweanling pigs have not been changed. More research cer-tainly is needed to clarify this issue.
F AT -S O LU BL E VI TA M IN S
Vitamin A
Vitamin A is essential for vision, reproduction, thegrowth and maintenance of differentiated epithelia, andmucus secretions. Except for its role in vision (Wald, 1968),the exact role of vitamin A in these functions is undefined(Goodman, 1979, 1980). Recent evidence, however, sug-gests that vitamin A may be involved in gene expression.
Vitamin A nomenclature policy (Anonymous, 1990) dic-tates that the term ‘‘vitamin A’’ be used for all b-iononederivatives, other than provitamin A carotenoids, thatexhibit the biological activity of all-trans retinol (i.e., vita-min A alcohol, or retinol). Vitamin A is present in animaltissues, eggs, and whole milk, whereas plant materials con-tain only provitamin A precursors that must be acted uponin the gut or by the liver to form retinol. Both naturalvitamin A and synthetic retinol analogs are commonly

72 Nutrient Requirements of Swine
referred to as retinoids. On the basis of rat data, 1 IU ofvitamin A equals 0.3 mg of crystalline vitamin A alcohol,0.344 mg of vitamin A acetate, or 0.55 mg of vitamin Apalmitate. Retinol equivalent (RE) is the currentlyaccepted nomenclature used to describe the vitamin activ-ity in foods and feeds. One RE is defined as 1 mg of all-trans retinol.
Pigs are less efficient than poultry or rats in convertingcarotenoid precursors to vitamin A. This conversion occursprimarily in intestinal mucosa (Fidge et al., 1969). Activecarotenoid pigments in corn–soybean meal diets (Wellen-reiter et al., 1969) and their bioactivities relative to all-trans b-carotene (100 percent) are b-zeacarotene (25 per-cent) and cryptoxanthin (57 percent), as estimated by Pet-zold et al. (1959), Duel et al. (1945), and Greenberg et al.(1950). Ullrey (1972) calculated, therefore, that the all-trans b-carotene equivalent would be only 52 percent of thechemically determined carotene value. He then calculatedthat this value for swine would be only 16 percent, basedon the fact that pigs are only 30 percent as efficient as ratsin converting b-carotene in swine diets to usable vitaminA (Braude et al., 1941). When this value is multipliedby 1,667 IU, which represents the theoretical vitamin Apotency of 1 mg of all-trans b-carotene for rats, 1 mg ofchemically determined carotene in a corn–soybean mealpig diet would have a calculated potency of 267 IU, or 80mg of vitamin A alcohol.
Chew et al. (1982) and Brief and Chew (1985) havesuggested that b-carotene plays a role in reproduction thatis independent of vitamin A. Their studies involving b-carotene injection suggest that elevation of maternalplasma vitamin A or b-carotene may improve embryonicsurvival, possibly because more uterine-specific proteinsare secreted. Dietary addition of b-carotene did not elicita response. This failure is probably due to the poor absorp-tion of intact b-carotene in the pig (Poor et al., 1987).
Swine are able to store vitamin A in the liver, whichmakes the vitamin available during periods of low intake.Requirements for vitamin A depend on the criteria evalu-ated; weight gain is less sensitive than cerebrospinal fluidpressure, liver storage, or plasma levels. For pigs duringthe first 8 weeks of life, 75 to 605 mg of retinyl acetate/kgof diet is required, depending on the response criteria used(Sheffy et al., 1954; Frape et al., 1959). With growing-finishing pigs, the requirement varies from 35 to 130mg/kg, when daily gain is used as the criterion, and from344 to 930 mg/kg, when liver storage and cerebrospinalfluid pressure are used as the criteria (Guilbert et al., 1937;Braude et al., 1941; Hentges et al., 1952a; Myers et al.,1959; Hjarde et al., 1961; Nelson et al., 1962; Ullrey et al.,1965). Presence of nitrite or nitrate in feed or water canincrease the vitamin A requirement (Koch et al., 1963;Seerley et al., 1965; Wood et al., 1967; Hutagalung etal., 1968).
The vitamin A reserves of the sow make it difficult toestablish requirements. Braude et al. (1941) reported thatmature sows fed diets without supplemental vitamin Acompleted three pregnancies normally; only in the fourthpregnancy did signs of vitamin deficiency appear. Giltsreceiving adequate vitamin A levels until 9 months of age,followed by a diet containing no vitamin A, completed tworeproductive cycles without signs of vitamin A deficiencies(Hjarde et al., 1961; Selke et al., 1967). Heaney et al. (1963)fed depleted gilts 16, 5, or 2.5 mg of retinyl palmitate/kgbody weight daily with no effects on litter size, birth weight,or survival rate. Parrish et al. (1951) suggested that 2,100IU of vitamin A/day during gestation and lactationwas adequate to maintain normal serum and liverconcentrations.
Vitamin A deficiency in swine results in reduced weightgain, incoordination, posterior paralysis, blindness,increased cerebrospinal fluid pressure, decreased plasmalevels, and reduced liver storage (Guilbert et al., 1937;Braude et al., 1941; Hentges et al., 1952a; Frape et al.,1959; Hjarde et al., 1961; Nelson et al., 1962, 1964).
Gross toxicity signs of hypervitaminosis A include aroughened hair coat, scaly skin, hyperirritability and sensi-tivity to touch, bleeding from cracks which appear in theskin about the hooves, blood in urine and feces, loss ofcontrol of the legs accompanied by inability to rise, andperiodic tremors (Anderson et al., 1966). Young pigs feddiets containing 605,000, 484,000, 363,000, or 242,000 mgof retinyl palmitate/kg of diet developed signs of vitaminA toxicity in 16, 17.5, 32, and 43 days, respectively. Nosigns of toxicity were observed when pigs were fed 121,000mg of added retinyl palmitate/kg of diet for 8 weeks (Ander-son et al., 1966). Wolke et al. (1968) observed lesions inendochondral and intramembranous bone within 5 weekswhen pigs were fed these excessive levels of vitamin A.
Vitamin A esters are more stable in feeds and premixesthan is retinol. The hydroxyl group as well as the fourdouble bonds on the retinol side chain are subject to oxida-tive losses. Thus, esterification of vitamin A alcohol does nottotally protect this vitamin from oxidative losses. Currentcommercial sources of vitamin A are generally ‘‘coated’’esters (1 IU of vitamin A 4 0.344 mg of retinyl acetate,or 0.549 mg of retinyl palmitate) that contain an addedantioxidant such as ethoxyquin or butylated hydroxytolu-ene (BHT).
Moisture in premixes and feedstuffs has a negative effecton vitamin A stability (Baker, 1995). Water causes vitaminA beadlets to soften and become more permeable to oxy-gen. Thus, both high humidity and presence of free cholinechloride (which is very hygroscopic) enhance vitamin Adestruction. Trace minerals also exacerbate vitamin Alosses in premixes exposed to moisture. For maximumretention of vitamin A activity, premixes should be as mois-ture-free as possible and have a pH above five. Low pH
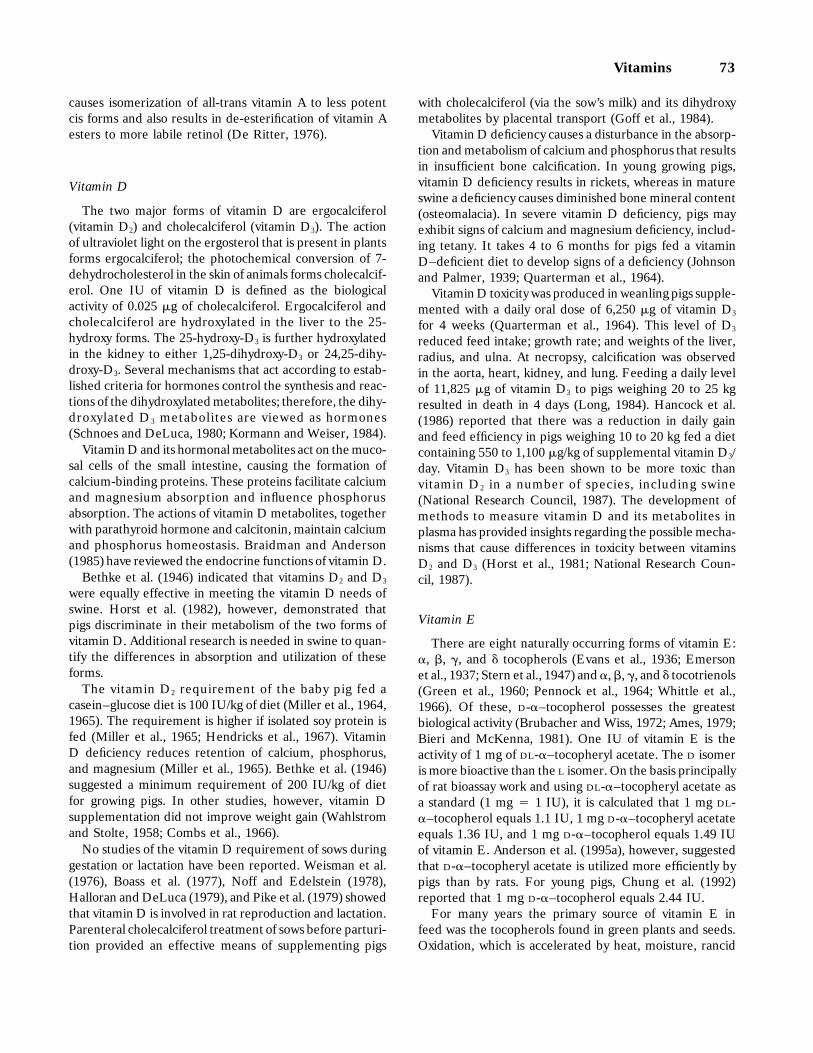
Vitamins 73
causes isomerization of all-trans vitamin A to less potentcis forms and also results in de-esterification of vitamin Aesters to more labile retinol (De Ritter, 1976).
Vitamin D
The two major forms of vitamin D are ergocalciferol(vitamin D2) and cholecalciferol (vitamin D3). The actionof ultraviolet light on the ergosterol that is present in plantsforms ergocalciferol; the photochemical conversion of 7-dehydrocholesterol in the skin of animals forms cholecalcif-erol. One IU of vitamin D is defined as the biologicalactivity of 0.025 mg of cholecalciferol. Ergocalciferol andcholecalciferol are hydroxylated in the liver to the 25-hydroxy forms. The 25-hydroxy-D3 is further hydroxylatedin the kidney to either 1,25-dihydroxy-D3 or 24,25-dihy-droxy-D3. Several mechanisms that act according to estab-lished criteria for hormones control the synthesis and reac-tions of the dihydroxylated metabolites; therefore, the dihy-droxylated D3 metabolites are viewed as hormones(Schnoes and DeLuca, 1980; Kormann and Weiser, 1984).
Vitamin D and its hormonal metabolites act on the muco-sal cells of the small intestine, causing the formation ofcalcium-binding proteins. These proteins facilitate calciumand magnesium absorption and influence phosphorusabsorption. The actions of vitamin D metabolites, togetherwith parathyroid hormone and calcitonin, maintain calciumand phosphorus homeostasis. Braidman and Anderson(1985) have reviewed the endocrine functions of vitamin D.
Bethke et al. (1946) indicated that vitamins D2 and D3
were equally effective in meeting the vitamin D needs ofswine. Horst et al. (1982), however, demonstrated thatpigs discriminate in their metabolism of the two forms ofvitamin D. Additional research is needed in swine to quan-tify the differences in absorption and utilization of theseforms.
The vitamin D2 requirement of the baby pig fed acasein–glucose diet is 100 IU/kg of diet (Miller et al., 1964,1965). The requirement is higher if isolated soy protein isfed (Miller et al., 1965; Hendricks et al., 1967). VitaminD deficiency reduces retention of calcium, phosphorus,and magnesium (Miller et al., 1965). Bethke et al. (1946)suggested a minimum requirement of 200 IU/kg of dietfor growing pigs. In other studies, however, vitamin Dsupplementation did not improve weight gain (Wahlstromand Stolte, 1958; Combs et al., 1966).
No studies of the vitamin D requirement of sows duringgestation or lactation have been reported. Weisman et al.(1976), Boass et al. (1977), Noff and Edelstein (1978),Halloran and DeLuca (1979), and Pike et al. (1979) showedthat vitamin D is involved in rat reproduction and lactation.Parenteral cholecalciferol treatment of sows before parturi-tion provided an effective means of supplementing pigs
with cholecalciferol (via the sow’s milk) and its dihydroxymetabolites by placental transport (Goff et al., 1984).
Vitamin D deficiency causes a disturbance in the absorp-tion and metabolism of calcium and phosphorus that resultsin insufficient bone calcification. In young growing pigs,vitamin D deficiency results in rickets, whereas in matureswine a deficiency causes diminished bone mineral content(osteomalacia). In severe vitamin D deficiency, pigs mayexhibit signs of calcium and magnesium deficiency, includ-ing tetany. It takes 4 to 6 months for pigs fed a vitaminD–deficient diet to develop signs of a deficiency (Johnsonand Palmer, 1939; Quarterman et al., 1964).
Vitamin D toxicity was produced in weanling pigs supple-mented with a daily oral dose of 6,250 mg of vitamin D3
for 4 weeks (Quarterman et al., 1964). This level of D3
reduced feed intake; growth rate; and weights of the liver,radius, and ulna. At necropsy, calcification was observedin the aorta, heart, kidney, and lung. Feeding a daily levelof 11,825 mg of vitamin D3 to pigs weighing 20 to 25 kgresulted in death in 4 days (Long, 1984). Hancock et al.(1986) reported that there was a reduction in daily gainand feed efficiency in pigs weighing 10 to 20 kg fed a dietcontaining 550 to 1,100 mg/kg of supplemental vitamin D3/day. Vitamin D3 has been shown to be more toxic thanvitamin D2 in a number of species, including swine(National Research Council, 1987). The development ofmethods to measure vitamin D and its metabolites inplasma has provided insights regarding the possible mecha-nisms that cause differences in toxicity between vitaminsD2 and D3 (Horst et al., 1981; National Research Coun-cil, 1987).
Vitamin E
There are eight naturally occurring forms of vitamin E:a, b, g, and d tocopherols (Evans et al., 1936; Emersonet al., 1937; Stern et al., 1947) and a, b, g, and d tocotrienols(Green et al., 1960; Pennock et al., 1964; Whittle et al.,1966). Of these, D-a–tocopherol possesses the greatestbiological activity (Brubacher and Wiss, 1972; Ames, 1979;Bieri and McKenna, 1981). One IU of vitamin E is theactivity of 1 mg of DL-a–tocopheryl acetate. The D isomeris more bioactive than the L isomer. On the basis principallyof rat bioassay work and using DL-a–tocopheryl acetate asa standard (1 mg 4 1 IU), it is calculated that 1 mg DL-a–tocopherol equals 1.1 IU, 1 mg D-a–tocopheryl acetateequals 1.36 IU, and 1 mg D-a–tocopherol equals 1.49 IUof vitamin E. Anderson et al. (1995a), however, suggestedthat D-a–tocopheryl acetate is utilized more efficiently bypigs than by rats. For young pigs, Chung et al. (1992)reported that 1 mg D-a–tocopherol equals 2.44 IU.
For many years the primary source of vitamin E infeed was the tocopherols found in green plants and seeds.Oxidation, which is accelerated by heat, moisture, rancid

74 Nutrient Requirements of Swine
fat, and trace minerals, rapidly destroys natural vitamin E.Therefore, predicting the amount of vitamin E activity infeed ingredients is difficult. Vitamin E losses of 50 to 70percent can occur in alfalfa stored at 32°C for 12 weeks;losses of 5 to 30 percent can occur during dehydration ofalfalfa (Livingston et al., 1968). Storage of high-moisturegrain or its treatment with organic acids greatly reducesits vitamin E content (Madsen et al., 1973; Lynch et al.,1975; Young et al., 1975, 1978). High levels of dietaryvitamin A have also been reported to lower vitamin Eabsorption (Hoppe et al., 1992), although Anderson et al.(1995b) observed no effects on vitamin E status whengrowing pigs were fed diets containing 15 times the vitaminA requirement.
During the 1970s, many studies on the vitamin Erequirement of swine were conducted. The AgriculturalResearch Council (1981) and Ullrey (1981) have reviewedthe studies. Many dietary factors affect the vitamin Erequirement, including levels of selenium, unsaturatedfatty acids, sulfur amino acids, retinol, copper, iron, andsynthetic antioxidants. Michel et al. (1969) preventeddeaths in pigs fed a corn–soybean diet containing 5 to 8mg of vitamin E/kg and 0.04 to 0.06 mg of selenium/kg bysupplementing the diet with 22 mg of vitamin E/kg. Studiesof corn–soybean meal diets fed to growing-finishing pigssuggest that 5 mg of vitamin E/kg and 0.04 mg of selenium/kg are inadequate for growing-finishing pigs and may resultin deficiency lesions and mortality. In the presence ofadequate selenium, however, supplements of 10 to 15 mgof vitamin E/kg of diet prevented mortality and deficiencylesions and supported normal performance (Groce et al.,1971, 1973; Sharp et al., 1972a,b; Ullrey, 1974; Wilkinsonet al., 1977b; Hitchcock et al., 1978; Mahan and Moxon,1978; Meyer et al., 1981). The amount of vitamin E neces-sary to prevent deficiency signs varies considerably becauseof variation in dietary levels of selenium (AgriculturalResearch Council, 1981; Ullrey, 1981), antioxidants (Tol-lerz, 1973; Simesen et al., 1982), and lipids (Nielsen et al.,1973; Tiege et al., 1977, 1978).
Inclusion of high levels of vitamin E in the diet mayincrease the immune response (Ellis and Vorhies, 1976;Tiege, 1977; Nockels, 1979; Peplowski et al., 1980; Wuryas-tuti et al., 1993), although Bonnette et al. (1990) found noevidence of an increased humoral or cell-mediated immuneresponse in young pigs fed high levels of vitamin E.
Vitamin E functions as an antioxidant at the cell mem-brane level, and it has a structural role in cell membranes.There are vitamin E deficiency diseases that respond tovitamin E, selenium, or antioxidants. Vitamin E deficiencyresults in a wide variety of pathological conditions. Theseinclude skeletal and cardiac muscle degeneration, degener-ative thrombotic vessel injury, gastric parakeratosis, gastriculcers, anemia, liver necrosis, yellow discoloration of fattissue, and sudden death (Obel, 1953; Davis and Gorham,
1954; Hove and Seibold, 1955; Dodd and Newling, 1960;Grant, 1961; Lannek et al., 1961; Nafstad, 1965, 1973;Nafstad and Nafstad, 1968; Reid et al., 1968; Ewan et al.,1969; Michel et al., 1969; Nafstad and Tollersrud, 1970;Trapp et al., 1970; Baustad and Nafstad, 1972; Sharp etal., 1972a,b; Sweeney and Brown, 1972; Wastell et al., 1972;Piper et al., 1975; Bengtsson et al., 1978a,b; Hakkarainen etal., 1978; Tiege and Nafstad, 1978; Simesen et al., 1982).In addition, vitamin E may be involved in the mastitis-metritis-agalactia (MMA) complex of sows (Ringarp, 1960;Ullrey et al., 1971; Whitehair et al., 1984).
Information is available on the vitamin E requirementsfor reproduction (Hanson and Hathaway, 1948; Adamstoneet al., 1949; Cline et al., 1974; Malm et al., 1976; Younget al., 1977, 1978; Wilkinson et al., 1977a; Nielsen et al.,1979; Piatkowski et al., 1979; Mahan, 1991, 1994). Placentaltransfer of tocopherol from dam to fetus is minimal, sothe offspring must rely on colostrum and milk to meet theirdaily needs. The content of vitamin E in sow colostrum andmilk is dependent on the vitamin E content of the sow’sdiet (Mahan, 1991). In most studies, diets containing 5 to7 mg/kg of vitamin E and 0.1 mg/kg of inorganic seleniumhave prevented deficiency lesions and supported normalreproductive performance. But the addition of 0.1 mg/kgof inorganic selenium and 22 mg/kg of vitamin E to dietsappears necessary to maintain tissue vitamin E levels (Piat-kowski et al., 1979). Recent research (Mahan, 1991; 1994;Wuryastuti et al., 1993), however, suggests that vitamin Elevels as high as 44 to 60 mg/kg during gestation andlactation may be necessary to maximize both litter size andimmunocompetency. As a result of these recent findings,the vitamin E requirements for gestation and lactation havebeen increased to 44 IU/kg of diet.
Vitamin E toxicity has not been demonstrated in swine.Levels as high as 550 mg/kg of diet have been fed togrowing pigs without toxic effects (Bonnette et al., 1990).
Vitamin K
Although it was the last of the four fat-soluble vitaminsto be discovered, the metabolic role of vitamin K has beenmore clearly defined than that of vitamins A, D, and E(Suttie, 1980; Kormann and Weiser, 1984). Vitamin K isessential for the synthesis of prothrombin, factor VII, factorIX, and factor X, which are necessary for the normal clottingof blood. These proteins are synthesized in the liver asinactive precursors. The action of vitamin K converts themto biologically active compounds (Suttie and Jackson, 1977;Suttie, 1980). This activation occurs by enzymatic g-carboxy-lation of specific glutamate residues. The resulting carboxy-glutamate residues are strong chelators of calcium ions,which are essential for blood coagulation. A deficiency ofvitamin K or the presence of anticoagulation compoundsreduces the number of carboxyglutamate residues, result-

Vitamins 75
ing in a loss of activity and prolonged bleeding times. Inaddition to its role in blood clotting, there is evidencethat vitamin K–dependent protein and peptides may beinvolved in calcium metabolism (Suttie, 1980; Kormannand Weiser, 1984).
Vitamin K exists in three series: the phylloquinones (K1)in plants; the menaquinones (K2), formed by microbialfermentation; and the menadiones (K3), which are syn-thetic. Menadione (2-methyl-1,4-naphthoquinone) is thesynthetic form of vitamin K, which has the same cyclicstructure as vitamins K1 and K2. All three forms of vitaminK are biologically active.
Water-soluble forms of menadione are commonly usedto supplement swine diets. The major forms are menadionesodium bisulfite (MSB) and menadione dimethylpyrimidi-nol bisulfite (MPB). Menadione sodium bisulfite complex(MSBC) is used in poultry diets, but it does not have FDAapproval for use in swine diets. The vitamin K activitydepends upon the menadione content of these products:52, 33, and 46 percent menadione in MSB, MSBC, andMPB, respectively. Menadione nicotinamide bisulfite is anew synthetic form of vitamin K that has been shownto have a bioactivity similar to that of MPB (Oduho etal., 1993).
Vitamin K deficiency increases prothrombin and clottingtimes and may result in internal hemorrhages and death(Schendel and Johnson, 1962; Brooks et al., 1973; Seerleyet al., 1976; Hall et al., 1986, 1991). Schendel and Johnson(1962) reported a requirement of 5 mg of menadionesodium phosphate/kg of body weight for 1- and 2-day-old pigs fed a purified liquid diet. Their diet containedsulfathiazole and oxytetracycline to reduce the intestinalsynthesis of vitamin K. Wire-bottomed cages were usedand carefully cleaned to minimize coprophagy. Seerley etal. (1976) reported that 1.1 mg of MPB/kg of diet counter-acted the effects of the anticoagulant pivalyl in weanlingpigs. Hall et al. (1986) suggested that 2 mg/kg of menadioneas MPB was needed to counteract the effects of pivalyl ingrowing pigs.
Bacterial synthesis of vitamin K and subsequent absorp-tion, directly or by coprophagy, reduces or eliminates theneed for supplemental vitamin K. High levels of antibioticsmay decrease the synthesis of vitamin K by the intestinalflora. Studies have not been conducted to determinewhether a supplemental source of vitamin K is beneficialfor the breeding herd.
Muhrer et al. (1970), Osweiler (1970), and Fritschen etal. (1971) reported an occurrence of hemorrhagic condi-tions in pigs under field conditions. Mycotoxin-contami-nated ingredients were suspected in these incidents, andvitamin K supplementation (2.0 mg of menadione/kg ofdiet) prevented the hemorrhagic syndrome. In some ofthese studies, the presence of anti-clotting coumarins mayhave increased the dietary requirement for vitamin K.
Excess calcium may also increase the pig’s requirementfor vitamin K (Hall et al., 1991). Liver stores of vitamin Kcan be depleted very rapidly during even very short periodsof vitamin K–deficient diet consumption (Kindberg andSuttie, 1989).
Stability of water-soluble menadione supplements inpremixes and diets is impaired by moisture, choline chlo-ride, trace elements, and alkaline conditions. Coelho (1991)suggested that MSBC and MPB can lose up to 80 percentof bioactivity if stored for 3 months in a vitamin–trace–mineral premix containing choline. Activity losses were farless when the menadione compounds were stored in thesame premix that did not contain choline. Some menadionesupplements are now coated, and this appears to improvestability in diets and premixes.
Even very large amounts of menadione compounds aretolerated well by animals. Seerley et al. (1976) fed 110 mg/kg of MPB to pigs, and Oduho et al. (1993) fed 300 mg/kg of MPB to chicks; neither observed signs of toxicity. Adietary level of 3,000 mg/kg of MPB did not depress weightgain or blood hemoglobin when fed over a 14-day periodto chicks. It appears that menadione levels of 1,000 times ananimal’s requirement are well tolerated (National ResearchCouncil, 1987; Oduho et al., 1993).
W AT ER - SO LU B LE VI T AM IN S
Biotin
Biotin is important metabolically as a cofactor for severalenzymes that function in carbon dioxide fixation. As partof pyruvate carboxylase and propionyl CoA carboxylase, itis important in gluconeogenesis and in the citric acid cycle.Acetyl CoA carboxylase is also a biotin-dependent enzymethat functions in initiating fatty acid biosynthesis. White-head et al. (1980) and Misir and Blair (1986) suggestedthat plasma biotin concentration and plasma pyruvate car-boxylase activity are methods of assessing the biotin statusof pigs. The D-isomer of biotin is the biologically activeform of the vitamin.
Biotin is present in most common feedstuffs in more-than-adequate amounts, but its bioavailability varies greatlyamong ingredients. The bioavailability of biotin in yelllowcorn and soybean meal is high for the chick, but its bioavail-ability in barley, grain sorghum, oats, and wheat is lower(Frigg, 1976; Anderson et al., 1978; Kopinski et al., 1989).Much of the biotin in feed ingredients exists as e-N-biotinylL-lysine (biocytin), which is a component of protein. Thebioavailability of biocytin (relative to crystalline D-biotin)varies widely and is dependent on the digestibility of theproteins in which it is found. A considerable portion ofthe pig’s biotin requirement is presumed to come frombacterial synthesis in the gut.
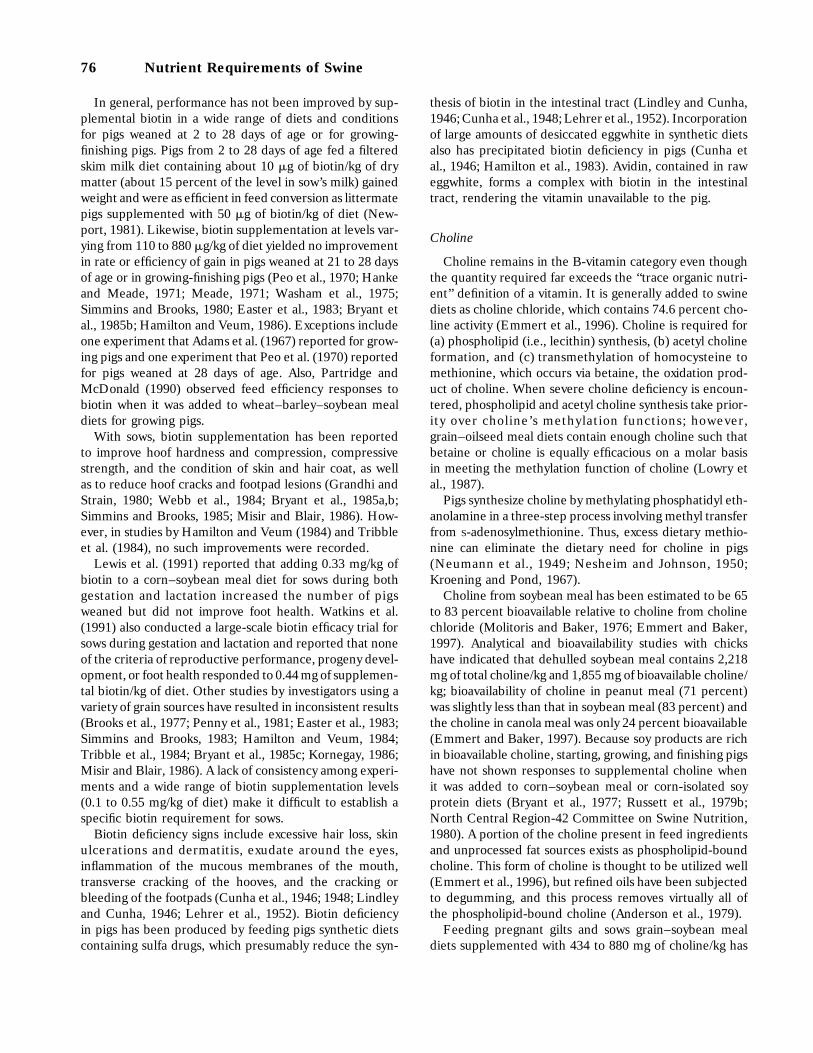
76 Nutrient Requirements of Swine
In general, performance has not been improved by sup-plemental biotin in a wide range of diets and conditionsfor pigs weaned at 2 to 28 days of age or for growing-finishing pigs. Pigs from 2 to 28 days of age fed a filteredskim milk diet containing about 10 mg of biotin/kg of drymatter (about 15 percent of the level in sow’s milk) gainedweight and were as efficient in feed conversion as littermatepigs supplemented with 50 mg of biotin/kg of diet (New-port, 1981). Likewise, biotin supplementation at levels var-ying from 110 to 880 mg/kg of diet yielded no improvementin rate or efficiency of gain in pigs weaned at 21 to 28 daysof age or in growing-finishing pigs (Peo et al., 1970; Hankeand Meade, 1971; Meade, 1971; Washam et al., 1975;Simmins and Brooks, 1980; Easter et al., 1983; Bryant etal., 1985b; Hamilton and Veum, 1986). Exceptions includeone experiment that Adams et al. (1967) reported for grow-ing pigs and one experiment that Peo et al. (1970) reportedfor pigs weaned at 28 days of age. Also, Partridge andMcDonald (1990) observed feed efficiency responses tobiotin when it was added to wheat–barley–soybean mealdiets for growing pigs.
With sows, biotin supplementation has been reportedto improve hoof hardness and compression, compressivestrength, and the condition of skin and hair coat, as wellas to reduce hoof cracks and footpad lesions (Grandhi andStrain, 1980; Webb et al., 1984; Bryant et al., 1985a,b;Simmins and Brooks, 1985; Misir and Blair, 1986). How-ever, in studies by Hamilton and Veum (1984) and Tribbleet al. (1984), no such improvements were recorded.
Lewis et al. (1991) reported that adding 0.33 mg/kg ofbiotin to a corn–soybean meal diet for sows during bothgestation and lactation increased the number of pigsweaned but did not improve foot health. Watkins et al.(1991) also conducted a large-scale biotin efficacy trial forsows during gestation and lactation and reported that noneof the criteria of reproductive performance, progeny devel-opment, or foot health responded to 0.44 mg of supplemen-tal biotin/kg of diet. Other studies by investigators using avariety of grain sources have resulted in inconsistent results(Brooks et al., 1977; Penny et al., 1981; Easter et al., 1983;Simmins and Brooks, 1983; Hamilton and Veum, 1984;Tribble et al., 1984; Bryant et al., 1985c; Kornegay, 1986;Misir and Blair, 1986). A lack of consistency among experi-ments and a wide range of biotin supplementation levels(0.1 to 0.55 mg/kg of diet) make it difficult to establish aspecific biotin requirement for sows.
Biotin deficiency signs include excessive hair loss, skinulcerations and dermatitis, exudate around the eyes,inflammation of the mucous membranes of the mouth,transverse cracking of the hooves, and the cracking orbleeding of the footpads (Cunha et al., 1946; 1948; Lindleyand Cunha, 1946; Lehrer et al., 1952). Biotin deficiencyin pigs has been produced by feeding pigs synthetic dietscontaining sulfa drugs, which presumably reduce the syn-
thesis of biotin in the intestinal tract (Lindley and Cunha,1946; Cunha et al., 1948; Lehrer et al., 1952). Incorporationof large amounts of desiccated eggwhite in synthetic dietsalso has precipitated biotin deficiency in pigs (Cunha etal., 1946; Hamilton et al., 1983). Avidin, contained in raweggwhite, forms a complex with biotin in the intestinaltract, rendering the vitamin unavailable to the pig.
Choline
Choline remains in the B-vitamin category even thoughthe quantity required far exceeds the ‘‘trace organic nutri-ent’’ definition of a vitamin. It is generally added to swinediets as choline chloride, which contains 74.6 percent cho-line activity (Emmert et al., 1996). Choline is required for(a) phospholipid (i.e., lecithin) synthesis, (b) acetyl cholineformation, and (c) transmethylation of homocysteine tomethionine, which occurs via betaine, the oxidation prod-uct of choline. When severe choline deficiency is encoun-tered, phospholipid and acetyl choline synthesis take prior-ity over choline’s methylation functions; however,grain–oilseed meal diets contain enough choline such thatbetaine or choline is equally efficacious on a molar basisin meeting the methylation function of choline (Lowry etal., 1987).
Pigs synthesize choline by methylating phosphatidyl eth-anolamine in a three-step process involving methyl transferfrom S-adenosylmethionine. Thus, excess dietary methio-nine can eliminate the dietary need for choline in pigs(Neumann et al., 1949; Nesheim and Johnson, 1950;Kroening and Pond, 1967).
Choline from soybean meal has been estimated to be 65to 83 percent bioavailable relative to choline from cholinechloride (Molitoris and Baker, 1976; Emmert and Baker,1997). Analytical and bioavailability studies with chickshave indicated that dehulled soybean meal contains 2,218mg of total choline/kg and 1,855 mg of bioavailable choline/kg; bioavailability of choline in peanut meal (71 percent)was slightly less than that in soybean meal (83 percent) andthe choline in canola meal was only 24 percent bioavailable(Emmert and Baker, 1997). Because soy products are richin bioavailable choline, starting, growing, and finishing pigshave not shown responses to supplemental choline whenit was added to corn–soybean meal or corn-isolated soyprotein diets (Bryant et al., 1977; Russett et al., 1979b;North Central Region-42 Committee on Swine Nutrition,1980). A portion of the choline present in feed ingredientsand unprocessed fat sources exists as phospholipid-boundcholine. This form of choline is thought to be utilized well(Emmert et al., 1996), but refined oils have been subjectedto degumming, and this process removes virtually all ofthe phospholipid-bound choline (Anderson et al., 1979).
Feeding pregnant gilts and sows grain–soybean mealdiets supplemented with 434 to 880 mg of choline/kg has
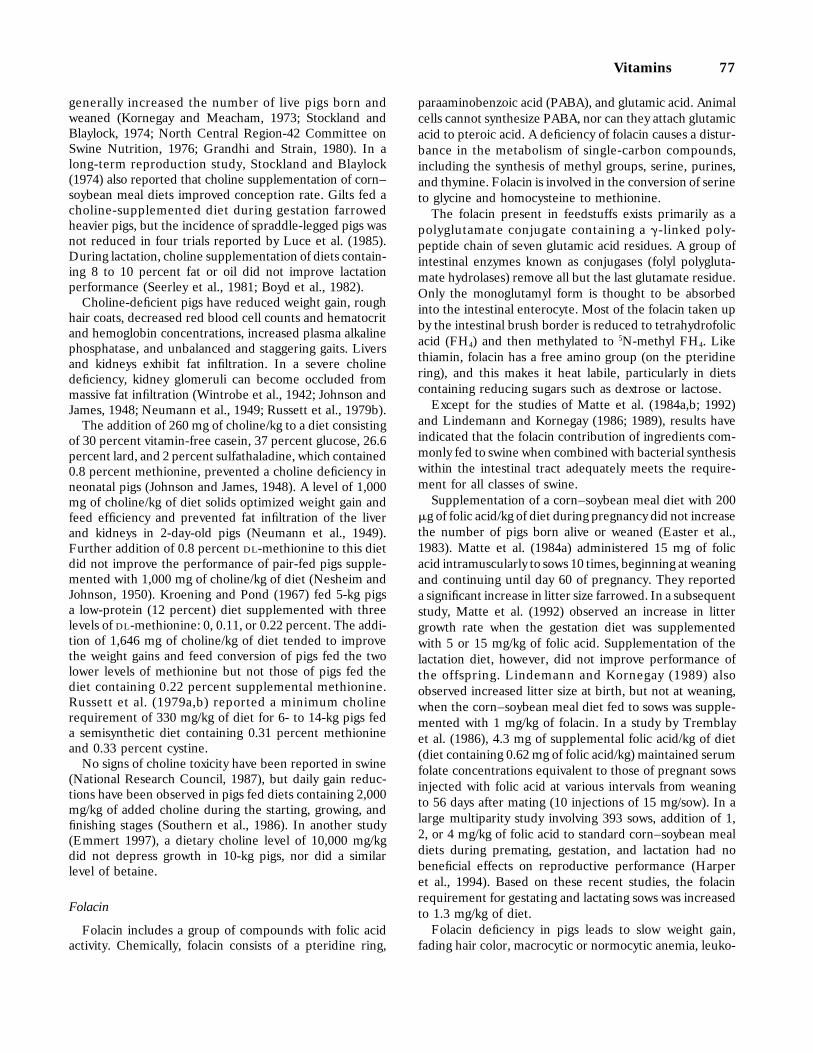
Vitamins 77
generally increased the number of live pigs born andweaned (Kornegay and Meacham, 1973; Stockland andBlaylock, 1974; North Central Region-42 Committee onSwine Nutrition, 1976; Grandhi and Strain, 1980). In along-term reproduction study, Stockland and Blaylock(1974) also reported that choline supplementation of corn–soybean meal diets improved conception rate. Gilts fed acholine-supplemented diet during gestation farrowedheavier pigs, but the incidence of spraddle-legged pigs wasnot reduced in four trials reported by Luce et al. (1985).During lactation, choline supplementation of diets contain-ing 8 to 10 percent fat or oil did not improve lactationperformance (Seerley et al., 1981; Boyd et al., 1982).
Choline-deficient pigs have reduced weight gain, roughhair coats, decreased red blood cell counts and hematocritand hemoglobin concentrations, increased plasma alkalinephosphatase, and unbalanced and staggering gaits. Liversand kidneys exhibit fat infiltration. In a severe cholinedeficiency, kidney glomeruli can become occluded frommassive fat infiltration (Wintrobe et al., 1942; Johnson andJames, 1948; Neumann et al., 1949; Russett et al., 1979b).
The addition of 260 mg of choline/kg to a diet consistingof 30 percent vitamin-free casein, 37 percent glucose, 26.6percent lard, and 2 percent sulfathaladine, which contained0.8 percent methionine, prevented a choline deficiency inneonatal pigs (Johnson and James, 1948). A level of 1,000mg of choline/kg of diet solids optimized weight gain andfeed efficiency and prevented fat infiltration of the liverand kidneys in 2-day-old pigs (Neumann et al., 1949).Further addition of 0.8 percent DL-methionine to this dietdid not improve the performance of pair-fed pigs supple-mented with 1,000 mg of choline/kg of diet (Nesheim andJohnson, 1950). Kroening and Pond (1967) fed 5-kg pigsa low-protein (12 percent) diet supplemented with threelevels of DL-methionine: 0, 0.11, or 0.22 percent. The addi-tion of 1,646 mg of choline/kg of diet tended to improvethe weight gains and feed conversion of pigs fed the twolower levels of methionine but not those of pigs fed thediet containing 0.22 percent supplemental methionine.Russett et al. (1979a,b) reported a minimum cholinerequirement of 330 mg/kg of diet for 6- to 14-kg pigs feda semisynthetic diet containing 0.31 percent methionineand 0.33 percent cystine.
No signs of choline toxicity have been reported in swine(National Research Council, 1987), but daily gain reduc-tions have been observed in pigs fed diets containing 2,000mg/kg of added choline during the starting, growing, andfinishing stages (Southern et al., 1986). In another study(Emmert 1997), a dietary choline level of 10,000 mg/kgdid not depress growth in 10-kg pigs, nor did a similarlevel of betaine.
Folacin
Folacin includes a group of compounds with folic acidactivity. Chemically, folacin consists of a pteridine ring,
paraaminobenzoic acid (PABA), and glutamic acid. Animalcells cannot synthesize PABA, nor can they attach glutamicacid to pteroic acid. A deficiency of folacin causes a distur-bance in the metabolism of single-carbon compounds,including the synthesis of methyl groups, serine, purines,and thymine. Folacin is involved in the conversion of serineto glycine and homocysteine to methionine.
The folacin present in feedstuffs exists primarily as apolyglutamate conjugate containing a g-linked poly-peptide chain of seven glutamic acid residues. A group ofintestinal enzymes known as conjugases (folyl polygluta-mate hydrolases) remove all but the last glutamate residue.Only the monoglutamyl form is thought to be absorbedinto the intestinal enterocyte. Most of the folacin taken upby the intestinal brush border is reduced to tetrahydrofolicacid (FH4) and then methylated to 5N-methyl FH4. Likethiamin, folacin has a free amino group (on the pteridinering), and this makes it heat labile, particularly in dietscontaining reducing sugars such as dextrose or lactose.
Except for the studies of Matte et al. (1984a,b; 1992)and Lindemann and Kornegay (1986; 1989), results haveindicated that the folacin contribution of ingredients com-monly fed to swine when combined with bacterial synthesiswithin the intestinal tract adequately meets the require-ment for all classes of swine.
Supplementation of a corn–soybean meal diet with 200mg of folic acid/kg of diet during pregnancy did not increasethe number of pigs born alive or weaned (Easter et al.,1983). Matte et al. (1984a) administered 15 mg of folicacid intramuscularly to sows 10 times, beginning at weaningand continuing until day 60 of pregnancy. They reporteda significant increase in litter size farrowed. In a subsequentstudy, Matte et al. (1992) observed an increase in littergrowth rate when the gestation diet was supplementedwith 5 or 15 mg/kg of folic acid. Supplementation of thelactation diet, however, did not improve performance ofthe offspring. Lindemann and Kornegay (1989) alsoobserved increased litter size at birth, but not at weaning,when the corn–soybean meal diet fed to sows was supple-mented with 1 mg/kg of folacin. In a study by Tremblayet al. (1986), 4.3 mg of supplemental folic acid/kg of diet(diet containing 0.62 mg of folic acid/kg) maintained serumfolate concentrations equivalent to those of pregnant sowsinjected with folic acid at various intervals from weaningto 56 days after mating (10 injections of 15 mg/sow). In alarge multiparity study involving 393 sows, addition of 1,2, or 4 mg/kg of folic acid to standard corn–soybean mealdiets during premating, gestation, and lactation had nobeneficial effects on reproductive performance (Harperet al., 1994). Based on these recent studies, the folacinrequirement for gestating and lactating sows was increasedto 1.3 mg/kg of diet.
Folacin deficiency in pigs leads to slow weight gain,fading hair color, macrocytic or normocytic anemia, leuko-
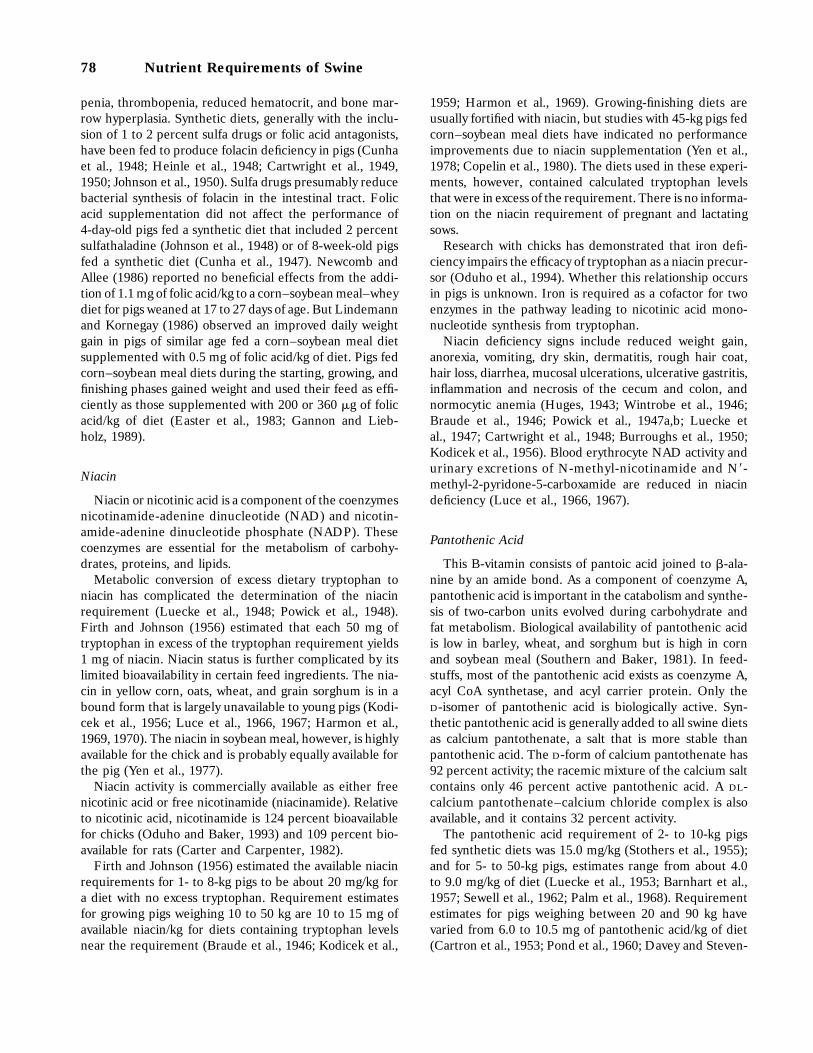
78 Nutrient Requirements of Swine
penia, thrombopenia, reduced hematocrit, and bone mar-row hyperplasia. Synthetic diets, generally with the inclu-sion of 1 to 2 percent sulfa drugs or folic acid antagonists,have been fed to produce folacin deficiency in pigs (Cunhaet al., 1948; Heinle et al., 1948; Cartwright et al., 1949,1950; Johnson et al., 1950). Sulfa drugs presumably reducebacterial synthesis of folacin in the intestinal tract. Folicacid supplementation did not affect the performance of4-day-old pigs fed a synthetic diet that included 2 percentsulfathaladine (Johnson et al., 1948) or of 8-week-old pigsfed a synthetic diet (Cunha et al., 1947). Newcomb andAllee (1986) reported no beneficial effects from the addi-tion of 1.1 mg of folic acid/kg to a corn–soybean meal–wheydiet for pigs weaned at 17 to 27 days of age. But Lindemannand Kornegay (1986) observed an improved daily weightgain in pigs of similar age fed a corn–soybean meal dietsupplemented with 0.5 mg of folic acid/kg of diet. Pigs fedcorn–soybean meal diets during the starting, growing, andfinishing phases gained weight and used their feed as effi-ciently as those supplemented with 200 or 360 mg of folicacid/kg of diet (Easter et al., 1983; Gannon and Lieb-holz, 1989).
Niacin
Niacin or nicotinic acid is a component of the coenzymesnicotinamide-adenine dinucleotide (NAD) and nicotin-amide-adenine dinucleotide phosphate (NADP). Thesecoenzymes are essential for the metabolism of carbohy-drates, proteins, and lipids.
Metabolic conversion of excess dietary tryptophan toniacin has complicated the determination of the niacinrequirement (Luecke et al., 1948; Powick et al., 1948).Firth and Johnson (1956) estimated that each 50 mg oftryptophan in excess of the tryptophan requirement yields1 mg of niacin. Niacin status is further complicated by itslimited bioavailability in certain feed ingredients. The nia-cin in yellow corn, oats, wheat, and grain sorghum is in abound form that is largely unavailable to young pigs (Kodi-cek et al., 1956; Luce et al., 1966, 1967; Harmon et al.,1969, 1970). The niacin in soybean meal, however, is highlyavailable for the chick and is probably equally available forthe pig (Yen et al., 1977).
Niacin activity is commercially available as either freenicotinic acid or free nicotinamide (niacinamide). Relativeto nicotinic acid, nicotinamide is 124 percent bioavailablefor chicks (Oduho and Baker, 1993) and 109 percent bio-available for rats (Carter and Carpenter, 1982).
Firth and Johnson (1956) estimated the available niacinrequirements for 1- to 8-kg pigs to be about 20 mg/kg fora diet with no excess tryptophan. Requirement estimatesfor growing pigs weighing 10 to 50 kg are 10 to 15 mg ofavailable niacin/kg for diets containing tryptophan levelsnear the requirement (Braude et al., 1946; Kodicek et al.,
1959; Harmon et al., 1969). Growing-finishing diets areusually fortified with niacin, but studies with 45-kg pigs fedcorn–soybean meal diets have indicated no performanceimprovements due to niacin supplementation (Yen et al.,1978; Copelin et al., 1980). The diets used in these experi-ments, however, contained calculated tryptophan levelsthat were in excess of the requirement. There is no informa-tion on the niacin requirement of pregnant and lactatingsows.
Research with chicks has demonstrated that iron defi-ciency impairs the efficacy of tryptophan as a niacin precur-sor (Oduho et al., 1994). Whether this relationship occursin pigs is unknown. Iron is required as a cofactor for twoenzymes in the pathway leading to nicotinic acid mono-nucleotide synthesis from tryptophan.
Niacin deficiency signs include reduced weight gain,anorexia, vomiting, dry skin, dermatitis, rough hair coat,hair loss, diarrhea, mucosal ulcerations, ulcerative gastritis,inflammation and necrosis of the cecum and colon, andnormocytic anemia (Huges, 1943; Wintrobe et al., 1946;Braude et al., 1946; Powick et al., 1947a,b; Luecke etal., 1947; Cartwright et al., 1948; Burroughs et al., 1950;Kodicek et al., 1956). Blood erythrocyte NAD activity andurinary excretions of N-methyl-nicotinamide and N8-methyl-2-pyridone-5-carboxamide are reduced in niacindeficiency (Luce et al., 1966, 1967).
Pantothenic Acid
This B-vitamin consists of pantoic acid joined to b-ala-nine by an amide bond. As a component of coenzyme A,pantothenic acid is important in the catabolism and synthe-sis of two-carbon units evolved during carbohydrate andfat metabolism. Biological availability of pantothenic acidis low in barley, wheat, and sorghum but is high in cornand soybean meal (Southern and Baker, 1981). In feed-stuffs, most of the pantothenic acid exists as coenzyme A,acyl CoA synthetase, and acyl carrier protein. Only theD-isomer of pantothenic acid is biologically active. Syn-thetic pantothenic acid is generally added to all swine dietsas calcium pantothenate, a salt that is more stable thanpantothenic acid. The D-form of calcium pantothenate has92 percent activity; the racemic mixture of the calcium saltcontains only 46 percent active pantothenic acid. A DL-calcium pantothenate–calcium chloride complex is alsoavailable, and it contains 32 percent activity.
The pantothenic acid requirement of 2- to 10-kg pigsfed synthetic diets was 15.0 mg/kg (Stothers et al., 1955);and for 5- to 50-kg pigs, estimates range from about 4.0to 9.0 mg/kg of diet (Luecke et al., 1953; Barnhart et al.,1957; Sewell et al., 1962; Palm et al., 1968). Requirementestimates for pigs weighing between 20 and 90 kg havevaried from 6.0 to 10.5 mg of pantothenic acid/kg of diet(Cartron et al., 1953; Pond et al., 1960; Davey and Steven-
Vitamins 79
son, 1963; Palm et al., 1968; Meade et al., 1969; Roth-Maier and Kirchgessner, 1977).
Ullrey et al. (1955), Davey and Stevenson (1963), andTeague et al. (1970) reported poor reproductive perfor-mance in three experiments when the pantothenic acidlevel was below 5.9 mg/kg of diet; Bowland and Owen(1952), however, reported normal reproductive perfor-mance at this level. Ullrey et al. (1955) and Davey andStevenson (1963) estimated the pantothenic acid require-ment for optimal reproduction at 12.0 to 12.5 mg/kg of diet.
Pantothenic acid deficiency signs include slow growth,anorexia, diarrhea, dry skin, rough hair coat, alopecia,reduced immune response, and an abnormal movementof the hind legs called goose stepping (Hughes and Ittner,1942; Wintrobe et al., 1943b; Luecke et al., 1948, 1950,1952; Wiese et al., 1951; Stothers et al., 1955; Harmon etal., 1963). Postmortem findings in pigs with pantothenicacid deficiency include edema and necrosis of the intestinalmucosa, increased connective tissue invasion of the submu-cosa, loss of nerve myelin, and degeneration of dorsal rootganglion cells (Wintrobe et al., 1943b; Follis and Win-trobe, 1946).
Riboflavin
A component of two coenzymes, flavin mononucleotide(FMN) and flavin adenine dinucleotide (FAD), riboflavinis important in the metabolism of proteins, fats, and carbo-hydrates. In feedstuffs, most of the riboflavin activity existsas FAD.
Estimates of the riboflavin requirement for pigs weigh-ing 2 to 20 kg range from 2.0 to 3.0 mg/kg of synthetic diet(Forbes and Haines, 1952; Miller et al., 1954). Riboflavinrequirement estimates range from 1.1 to 2.9 mg/kg forgrowing pigs fed synthetic diets (Hughes, 1940a; Krideret al., 1949; Mitchell et al., 1950; Terrill et al., 1955),whereas the estimates vary from 1.8 to 3.1 mg/kg of dietwhen practical diets are fed (Krider et al., 1949; Miller andEllis, 1951). Seymour et al. (1968) reported no consistentinteractions between riboflavin level and environmentaltemperature for 5- to 17-kg pigs, a finding that contradictedan earlier report by Mitchell et al. (1950). Corn–soybeanmeal diets are deficient in bioavailable riboflavin. In a studywith chicks, Chung and Baker (1990) estimated that theriboflavin in corn–soybean meal diets is 59 percent bioavail-able relative to crystalline riboflavin.
Riboflavin deficiency has led to anestrus (Esch et al.,1981) and reproductive failure in gilts (Miller et al., 1953;Frank et al., 1984). On the basis of farrowing performanceand erythrocyte glutathione reductase activity (FAD-dependent enzyme), Frank et al. (1984) estimated the avail-able riboflavin requirement for pregnancy to be about 6.5mg daily. Pettigrew et al. (1996), however, observed that60 mg of riboflavin/day produced a higher farrowing rate
than 10 mg/day when these levels were fed from breedingto day 21 of gestation. Erythrocyte glutathione reductaseactivity and farrowing performance suggest a lactationrequirement of about 16 mg of riboflavin daily (Frank etal., 1988).
Signs of riboflavin deficiency in young growing pigsinclude slow growth, cataracts, stiffness of gait, seborrhea,vomiting, and alopecia (Wintrobe et al., 1944; Miller andEllis, 1951; Lehrer and Wiese, 1952; Miller et al., 1954).In severe riboflavin deficiency, researchers have observedincreased blood neutrophil granulocytes, decreasedimmune response, discolored liver and kidney tissue, fattyliver, collapsed follicles, degenerating ova, and degenerat-ing myelin of the sciatic and brachial nerves (Wintrobe etal., 1944; Krider et al, 1949; Mitchell et al., 1950; Forbesand Haines, 1952; Lehrer and Wiese, 1952; Miller et al.,1954; Terrill et al., 1955; Harmon et al., 1963).
Thiamin
Thiamin is essential for carbohydrate and protein metab-olism. The coenzyme, thiamin pyrophosphate, is essentialfor the oxidative decarboxylation of a–keto acids. Thiaminis very heat-labile. Therefore, excess heat or autoclavingcan reduce the thiamin content of dietary components,particularly when reducing sugars are present.
Miller et al. (1955) estimated a thiamin requirement of1.5 mg/kg for pigs weighing about 2 kg initially and fed toapproximately 10 kg of body weight. Pigs weaned at 3weeks and fed to about 40 kg of body weight requiredabout 1.0 mg of thiamin/kg of diet (Van Etten et al., 1940;Ellis and Madsen, 1944). The survival time of thiamin-deficient pigs was increased by increasing fat levels to 28percent of the diet (Ellis and Madsen, 1944). This findingindicated that the requirement for thiamin was decreasedas the dietary energy from carbohydrate was replaced withhigher levels of fat. Weight gain was improved by increasingthiamin levels to 1.1 mg/kg of diet, whereas feed intakewas maximized at 0.85 mg/kg of diet for pigs weighingabout 30 kg and fed to 90 kg of body weight (Peng andHeitman, 1974). Peng and Heitman (1973) evaluated thethiamin status of growing-finishing pigs by measuring theincrease in erythrocyte transketolase activity resulting fromthiamin pyrophosphate addition to in vitro preparations.This criterion yielded thiamin requirement estimates upto four times the level required for maximum weight gain.Furthermore, the requirement measured by this criterionincreased as environmental temperature increased from20 to 35°C (Peng and Heitman, 1974). This change wasprobably related to a reduction in feed intake. There is alack of information on the thiamin requirement for preg-nancy and lactation.
Treatment of feed ingredients with sulfur dioxide inacti-vates thiamin. This process was used in early studies to
80 Nutrient Requirements of Swine
produce deficient diets for purposes of determining a pig’sthiamin requirement (Van Etten et al., 1940; Ellis andMadsen, 1944). A number of freshwater fish species con-tain an antithiamin factor known as thiaminase I (Tanphai-chitr and Wood, 1984). Feeding moderate levels of unpro-cessed freshwater fish preparations to other animals cancause a thiamin deficiency (Green et al., 1941; Krampitzand Woolley, 1944).
Thiamin-deficient pigs exhibit loss of appetite; a reduc-tion in weight gain, body temperature, and heart rate; and,occasionally, vomiting. Other effects observed in thiamindeficiency are heart hypertrophy, flabby heart, myocardialdegeneration, and sudden death because of heart failure.Animals deficient in thiamin also have elevated plasmapyruvate concentrations (Hughes, 1940b; Van Etten et al.,1940; Follis et al., 1943; Wintrobe et al., 1943a; Ellis andMadsen, 1944; Heinemann et al., 1946; Miller et al., 1955).Most of the cereal grains used in swine diets are rich inthiamin. Hence, grain–oilseed meal diets fed to all classesof swine are considered adequate in this B-vitamin, and itis not generally included as a supplement for swine diets.
Vitamin B6 (The Pyridoxines)
Vitamin B6 occurs in feedstuffs as pyridoxine, pyridoxal,pyridoxamine, and pyridoxal phosphate. Pyridoxal phos-phate is an important cofactor for many amino acid enzymesystems, including transaminases, decarboxylases, dehydra-tases, synthetases, and racemases. Vitamin B6 plays a crucialrole in central nervous system function. It is involved inthe decarboxylation of amino acid derivatives for the syn-thesis of neurotransmitters and neuroinhibitors.
Vitamin B6 in corn and soybean meal is about 40 and60 percent bioavailable for the chick, respectively (Yen etal., 1976). Presumably, it is the same in pigs, although dataare not available. Miller et al. (1957) and Ko
¨sters and
Kirchgessner (1976a,b) suggested a dietary requirementof 1.0 to 2.0 mg/kg of diet for the pig weighing initiallyabout 2 kg and fed to 10 kg of body weight. Requirementestimates for the 10- to 20-kg pig range from 1.2 to 1.8mg of vitamin B6/kg of diet (Sewall et al., 1964; Ko
¨sters
and Kirchgessner, 1976a,b).Ritchie et al. (1960) reported no treatment differences
in reproductive or lactation performance in gilts and sowsfed diets containing total pyroxidine levels of either 1.0 or10.0 mg/kg from the second month of pregnancy throughday 35 of lactation. Easter et al. (1983) reported an increasein litter size at birth and at weaning when 1.0 ppm ofpyridoxine was added to a corn–soybean meal diet fed togilts during pregnancy. In another study, the coefficientsof glutamic-oxaloacetic transaminase activity in red bloodcells of sexually mature gilts fed 0.45 and 2.1 mg of vitaminB6/day were elevated compared with those of gilts fed anexcess level of 83 mg of vitamin B6/day. Whole muscle
glutamic-oxaloacetic transaminase activity was reduced indeficient gilts; this reduction suggests that the daily require-ment for vitamin B6 may be greater than 2.1 mg (Russellet al., 1985a,b).
A deficiency of vitamin B6 will reduce appetite andgrowth rate. Advanced deficiency will result in an exudatedevelopment around the eyes, convulsions, ataxia, coma,and death. Blood samples from deficient pigs show a reduc-tion in hemoglobin, red blood cells, and lymphocyte counts.Serum iron and gamma globulin are increased. Peripheralmyelin and axis cylinder degeneration of the sensory neu-rons, microcytic hypochromic anemia, and fat infiltrationof the liver are characteristic of vitamin B6 deficiency(Hughes and Squibb, 1942; Wintrobe et al., 1942, 1943c;Follis and Wintrobe, 1946; Lehrer et al., 1951; Miller etal., 1957; Harmon et al., 1963). A tryptophan-loading test,in which the conversion of tryptophan to niacin is impaired,can determine vitamin B6 status. This impairment resultsin elevated xanthurenic acid and kynurenic acid concentra-tions in the urine (Cartwright et al., 1944). Supplementa-tion of grain–soybean meal diets with vitamin B6 is gener-ally unnecessary, because the level of bioavailable vitaminB6 in feed ingredients will meet the pig’s requirement.
Vitamin B12
Vitamin B12, or cyanocobalamin, contains the trace ele-ment cobalt in its molecule, which is a unique featureamong vitamins. Vitamin B12 as a coenzyme is involved inthe de novo synthesis of labile methyl groups derived fromformate, glycine, or serine, and their transfer to homocyste-ine to form methionine. It is also important in the methyla-tion of uracil to form thymine, which is converted to thymi-dine and used for the synthesis of DNA. Pigs require vita-min B12, but responses to dietary supplementation havebeen variable. Synthesis of vitamin B12 by microorganismsin the environment and within the intestinal tract as wellas the pig’s inclination toward coprophagy may supply suf-ficient vitamin B12 to satisfy the pig’s requirement (Baurie-del et al., 1954; Hendricks et al., 1964). Ingredients ofplant origin are devoid of vitamin B12, but animal andfermentation by-products contain the vitamin. In theseingredients, vitamin B12 exists in a methylated form (meth-ylcobalamin) or a 58-deoxyadenosyl form (adenosyl cobal-amin), and both of these compounds are generally boundto protein. Vitamin B12 supplements are produced commer-cially by microbial fermentation and are usually added tograin–soybean meal diets.
Receptor sites for vitamin B12 binding are located inthe ileum. Prior to absorption, cobalamin is bound to aglycoprotein, commonly referred to as ‘‘intrinsic factor.’’Intrinsic factor is derived from the parietal cells of gastricmucosa. Vitamin B12 is stored effectively in the body. Thustissue storage, primarily in the liver, resulting from excess
Vitamins 81
vitamin B12 ingestion can delay for many months the onsetof vitamin B12 deficiency symptoms after a vitamin B12-deficient diet is fed.
Estimated vitamin B12 requirements for 1.5- to 20-kgpigs fed synthetic milk diets and housed in wire-flooredcages range from 15 to 20 mg/kg of dietary dry matter(Anderson and Hogan, 1950b; Nesheim et al., 1950; Fred-erick and Brisson, 1961), but as high as 50 mg/kg of diet drymatter in one study (Neumann et al., 1950). Pigs weighingabout 10 to 45 kg required 8.8 to 11.0 mg of vitamin B12/kg of diet (Richardson et al., 1951; Catron et al., 1952).The animals in these experiments also were housed in wire-floored cages.
Anderson and Hogan (1950a), Frederick and Brisson(1961), and Teague and Grifo (1966) improved the repro-ductive performance of sows by adding 11 to 1,100 mg ofvitamin B12/kg of diet. Teague and Grifo (1966) comparedthe reproductive performance of sows fed an unsupple-mented all-plant diet with that of a diet supplemented with110 to 1,100 mg/kg of vitamin B12. Until the sows’ thirdand fourth parities, there was no reduction in the numberof pigs farrowed or weaned, or in their weights at birth orweaning. Because of the wide range of levels supplementedand the few experiments, it is difficult to determine thevitamin B12 requirement for reproduction and lactation,but it is estimated at 15 mg/kg of diet.
Pigs that are deficient in vitamin B12 display reducedweight gain, loss of appetite, rough skin and hair coat,irritability, hypersensitivity, and hind leg incoordination.Blood samples from deficient pigs indicate normocytic ane-mia and high neutrophil and low lymphocyte counts (Ander-son and Hogan, 1950b; Neumann and Johnson, 1950; Neu-mann et al., 1950; Cartwright et al., 1951; Richardson etal., 1951; Catron et al., 1952). A deficiency of folic acidand vitamin B12 has led to macrocytic anemia and bonemarrow hyperplasia, both of which have several similarcharacteristics to pernicious anemia in human beings (John-son et al., 1950; Cartwright et al., 1952). Signs of folacindeficiency generally accompany vitamin B12 deficiency,because vitamin B12 is required for folate metabolism. Lackof either folacin or vitamin B12 prevents the proper transferof methyl groups in the synthesis of thymidine.
Vitamin C (Ascorbic Acid)
Vitamin C (ascorbic acid) is a water-soluble antioxidantthat is involved in the oxidation of aromatic amino acids,synthesis of norepinephrine and carnitine, and in thereduction of cellular ferritin iron for transport to the bodyfluids. Ascorbic acid is also essential for hydroxylation ofproline and lysine, which are integral constituents of colla-gen. Collagen is essential for growth of cartilage and bone.Vitamin C enhances the formation of both bone matrixand tooth dentin. In vitamin C deficiency, petechial hemor-
rhages occur throughout the body. A dietary source ofvitamin C is essential for primates and guinea pigs, butfarm animals, including pigs, can synthesize this vitaminfrom D-glucose and several other related compounds(Braude et al., 1950; Dvorak, 1974; Brown and King, 1977).Strittmatter et al. (1978), Cleveland et al. (1983), andNakano et al. (1983) have investigated the role of vitaminC in the prevention or alleviation of osteochondrosis inswine. These authors postulated that osteochondrosismight be related to insufficient collagen cross-linkingbecause of reduced hydroxylation of lysine. Dietary supple-mentation with vitamin C, however, was ineffective in pre-venting this malady.
Under some conditions, pigs may not be able to synthe-size vitamin C rapidly enough to meet their requirements.Riker et al. (1967) reported that plasma ascorbic acid con-centrations were lower for pigs at an environmental tem-perature of 29°C than for pigs at 18°C. However, vitaminC supplementation of pigs housed at temperatures of either19 or 27°C did not improve rate or efficiency of weightgain (Kornegay et al., 1986). Brown et al. (1970) found asignificant correlation between energy intake and serumascorbate levels, and later reported that vitamin C supple-mentation significantly improved the rate of weight gainof 3-week-old pigs (Brown et al., 1975). There was a greaterresponse to vitamin C at a low-energy intake than at anintermediate- or a high-energy intake. The concentrationand total amount of vitamin C in the liver of 1- or 40-day-old pigs was reduced in fasted pigs compared with that insuckling pigs (Dvorak, 1974). There also are reports ofimproved weight gains in response to supplemental vitaminC in the diet when no deliberate stress had been imposedon pigs. Jewell et al. (1981) reported improved weight gainfrom vitamin C supplementation in 1-day-old weaned pigsin one trial, but no response to the supplement in a secondtrial. Using pigs weaned at 3 to 4 weeks of age, Brown etal. (1975), Yen and Pond (1981), and Mahan et al. (1994)reported that weight gains were improved by supplement-ing the diet with vitamin C. In pigs weighing 24 kg initially,Mahan et al. (1966) observed an improvement in weightgain from parenteral dosing and feed supplementation withvitamin C. In two of three trials, growing pigs (15 to 27kg) fed to about 90 kg of body weight responded to vitaminC supplementation (Cromwell et al., 1970). Others havenoted no improvement in performance from vitamin Csupplementation in suckling pigs, pigs weaned at 3 to 4weeks of age, or growing-finishing pigs (Hutagalung et al.,1969; Leibbrandt, 1977; Strittmatter et al., 1978; Mahanand Saif, 1983; Nakano et al., 1983; Yen and Pond, 1984;Yen et al., 1985; Kornegay et al., 1986). Mahan et al. (1994)observed no beneficial effects from adding ascorbate tocorn–soybean meal diets fed to growing-finishing pigs.Chiang et al. (1985) reviewed the effects of supplementalvitamin C for weanling and growing-finishing pigs.
82 Nutrient Requirements of Swine
Sandholm et al. (1979) reported a rapid cessation ofnavel bleeding in newborn pigs when 1.0 g of vitamin C/day was fed to pregnant sows beginning 5 days beforeexpected farrowing. Pigs from sows given supplementalascorbic acid were significantly heavier at 3 weeks of agethan those from control sows. A water-soluble vitamin Kadministered in the drinking water to several sows in thisherd failed to prevent the navel bleeding problem in new-born pigs. In subsequent studies, there was no improve-ment in pig survival or growth rate when sows were supple-mented with 1.0 to 10.0 g of ascorbic acid/day beginningin late pregnancy (Lynch and O’Grady, 1981; Chavez, 1983;Yen and Pond, 1983). Navel bleeding was not consideredto be a problem in these latter experiments.
Currently, the conditions in which supplemental vitaminC may be beneficial are not well defined. Therefore, novitamin C requirement estimate is given for pigs.
R EF ER E NC ES
Adams, C. R., C. E. Richardson, and T. J. Cunha. 1967. Supplementalbiotin and vitamin B6 for swine. J. Anim. Sci. 26:903. (Abstr.)
Adamstone, P. B., J. D. Krider, M. F. James, and C. A. Blomquist. 1949.Response of swine to vitamin E-deficient rations. Ann. N.Y. Acad.Sci. 52:260–268.
Agricultural Research Council. 1981. The Nutrient Requirements of Pigs.Slough, England: Commonwealth Agricultural Bureaux.
Ames, S. R. 1979. Biopotencies in rats of several forms of alpha-tocoph-erol. J. Nutr. 109:2198–2204.
Anderson, G. C., and A. C. Hogan. 1950a. Adequacy of synthetic dietsfor reproduction of swine. Proc. Soc. Exp. Biol. Med. 75:288–290.
Anderson, G. C., and A. C. Hogan. 1950b. Requirements of the pig forvitamin B12. J. Nutr. 40:243–250.
Anderson, L. E., R. O. Myer, J. H. Brendemuhl, and L. R. McCowell.1995a. Bioavailability of various vitamin E compounds for finishingswine. J. Anim. Sci. 73:490–495.
Anderson, L. E., R. O. Myer, J. H. Brendemuhl, and L. R. McCowell.1995b. The effect of excessive dietary vitamin A on performance andvitamin E status in swine fed diets varying in dietary vitamin E. J. Anim.Sci. 73:1093–1098.
Anderson, M. D., V. C. Speer, J. T. McCall, and V. W. Hays. 1966.Hypervitaminosis A in the young pig. J. Anim. Sci. 25:1123–1127.
Anderson, P. A., D. H. Baker, and S. P. Mistry. 1978. Bioassay determina-tion of the biotin content of corn, barley, sorghum and wheat. J. Anim.Sci. 47:654–659.
Anderson, P. A., D. H. Baker, P. A. Sherry, and J. E. Corbin. 1979.Choline-methionine interrelationship in feline nutrition. J. Anim.Sci. 49:522–527.
Anonymous. 1990. Nomenclature policy: Generic descriptors and trivialnames for vitamins and related compounds. J. Nutr. 120:12–20.
Baker, D. H. 1991. Vitamin bioavailability. Pp. 399–431 in Bioavailabilityof Nutrients for Animals: Amino Acids, Minerals, and Vitamins.Ammerman, C. B., D. H. Baker, and A. J. Lewis, eds. San Diego, CA:Academic Press.
Barnhart, C. E., D. V. Catron, G. C. Ashton, and L. Y. Quinn. 1957.Effects of dietary pantothenic acid levels on the weanling pig. J. Anim.Sci. 16:396–403.
Bauriedel, W. R., A. B. Hoerlein, J. C. Picken, Jr., and L. A. Underkofler.1954. Selection of diet for studies of vitamin B12 depletion using unsuck-led baby pigs. J. Agric. Food Chem. 2:468–471.
Baustad, B., and I. Nafstad. 1972. Hematologic response to vitamin Ein piglets. Br. J. Nutr. 28:183–190.
Bengtsson, G., J. Hakkarainen, L. Jonsson, J. Lannek, and P. Lindberg.1978a. Requirement for selenium (as selenite) and vitamin E (as a-tocopherol) in weaned pigs. I. The effect of varying a-tocopherol levelsin a selenium deficient diet on the development of the VESD syndrome.J. Anim. Sci. 46:143–152.
Bengtsson, G., J. Hakkarainen, L. Jonsson, J. Lannek, and P. Lindberg.1978b. Requirement for selenium (as selenite) and vitamin E (as a-tocopherol) in weaned pigs. II. The effect of varying selenium levels ina vitamin E deficient diet on the development of the VESD syndrome.J. Anim. Sci. 46:153–160.
Bethke, R. M., W. Burroughs, O. H. M. Wilder, B. H. Edgington, andW. L. Robison. 1946. The comparative efficiency of vitamin D fromirradiated yeast and cod liver oil for growing pigs, with observationson their vitamin D requirements. Ohio Agricultural Experiment StationBulletin 667:1–29. Wooster, Ohio: Ohio Agricultural ExperimentStation.
Bieri, J. G., and M. C. McKenna. 1981. Expressing dietary values for fat-soluble vitamins: Changes in concepts and terminology. Am. J. Clin.Nutr. 34:289–295.
Boass, A., S. U. Toverud, T. A. McCain, J. W. Pike, and M. R. Haussler.1977. Elevated serum levels of 1,g-25-dihydroxycholecalciferol in lac-tating rats. Nature 267:630–632.
Bonnette, E. D., E. T. Kornegay, M. D. Lindemann, and C. Hammerberg.1990. Humoral and cell-mediated immune response and performanceof weaned pigs fed four supplemental vitamin E levels and housed attwo nursery temperatures. J. Anim. Sci. 68:1337–1345.
Bowland, J. P., and B. D. Owen. 1952. Supplemental pantothenic acidin small grain rations for swine. J. Anim. Sci. I 1: 757. (Abstr.)
Boyd, R. D., B. D. Moser, E. R. Peo, Jr., A. J. Lewis, and R. K. Johnson.1982. Effect of tallow and choline chloride addition to the diet of sowson milk composition, milk yield and preweaning pig performance.J. Anim. Sci. 54: 1–7.
Braidman, I. P., and D. C. Anderson. 1985. Extra-endocrine functionsof vitamin D. Clin. Endocrinol. 23:445–460.
Braude, R., A. S. Foot, K. M. Henry, S. K. Kon, S. Y. Thompson, andT. H. Mead. 1941. Vitamin A studies with rats and pigs. Biochem. J.35:693–707.
Braude, R., S. K. Kon, and E. G. White. 1946. Observations on thenicotinic acid requirements of pigs. Biochem. J. 40:843–855.
Braude, R., S. K. Kon, and J. W. G. Porter. 1950. Studies in the vitaminC metabolism of the pig. Br. J. Nutr. 4:186–197.
Brief, S., and B. P. Chew. 1985. Effects of vitamin A and b-carotene onreproductive performance in gilts. J. Anim. Sci. 60:998–1004.
Brooks, C. C., R. M. Nakamura, and A. Y. Miyahara. 1973. Effect ofmenadione and other factors on sugar-induced heart lesions and hemor-rhagic syndrome in the pig. J. Anim. Sci. 37:1344–1350.
Brooks, P. H., D. A. Smith, and V. C. R. Irwin. 1977. Biotin supplementa-tion of diets: The incidence of foot lesions and the reproductive perfor-mance of sows. Vet. Rec. 101:46–50.
Brown, R. G., and G. J. King. 1977. Ascorbic acid synthesis in pigs. Can.J. Anim. Sci. 57:831. (Abstr.)
Brown, R. G., V. D. Sharma, and L. G. Young. 1970. Ascorbic acidmetabolism in swine. Interrelationships between the level of energyintake and serum ascorbate levels. Can. J. Anim. Sci. 50:605–609.
Brown, R. G., J. G. Buchanan-Smith, and V. D. Sharma. 1975. Ascorbicacid metabolism in swine. The effects of frequency of feeding andlevel of supplementary ascorbic acid on swine fed various energy levels.Can. J. Anim. Sci. 55:353–358.
Vitamins 83
Brubacher, G., and O. Wiss. 1972. Vitamin E active compounds, synergistsand antagonists. Pp. 255–258 in The Vitamins, Volume V, W. H. Sebrelland R. S. Harris, eds. New York: Academic Press.
Bryant, K. L., G. E. Combs, and H. D. Wallace. 1977. Supplementalcholine for young and growing-finishing swine. Florida AgriculturalExperiment Station Twenty-second Annual Swine Field Day. ResearchReport AL-1977-1. Gainesville, FL: Florida Agricultural ExperimentStation.
Bryant, K. L., E. T. Kornegay, J. W. Knight, H. P. Veit, and D. R. Notter.1985a. Supplemental biotin for swine. III. Influence of supplementationto corn- and wheat-based diets on the incidence and severity of toelesions, hair and skin characteristics and structural soundness of sowshoused in confinement during four parities. J. Anim. Sci. 60:154–162.
Bryant, K. L., E. T. Kornegay, J. W. Knight, K. E. Webb, Jr., and D. R.Notter. 1985b. Supplemental biotin for swine. I. Influence on feedlotperformance, plasma biotin and toe lesions in developing gilts. J. Anim.Sci. 60:136–144.
Bryant, K. L., E. T. Kornegay, J. W. Knight, K. E. Webb, Jr., and D. R.Notter. 1985c. Supplemental biotin for swine. II. Influence of supple-mentation to corn- and wheat-based diets on reproductive performanceand various biochemical criteria of sows during four parities. J. Anim.Sci. 60:145–153.
Burroughs, W., B. H. Edginton, W. L. Robinson, and R. M. Bethke.1950. Niacin deficiency and enteritis in growing pigs. J. Nutr. 41:51–62.
Carter, E. G. A., and Carpenter, K. J. 1982. The available niacin valuesof food for rats and their relation to analytical values. J. Nutr.112:2091–2103.
Cartwright, G. E., M. M. Wintrobe, P. Jones, M. Lauritsen, and S.Humphreys. 1944. Tryptophane derivatives in urine of pyridoxine defi-cient swine. Bull. Johns Hopkins Hosp. 75:35.
Cartwright, G. E., B. Tatting, and M. M. Wintrobe. 1948. Niacin defi-ciency anemia in swine. Arch. Biochem. 19:109–118.
Cartwright, G. E., B. Tatting, H. Ashenbrucker, and M. M. Wintrobe.1949. Experimental production of nutritional macrocytic anemia inswine. Blood 4:301–323.
Cartwright, G. E., J. G. Palmer, B. Tatting, H. Ashenbrucker, and M. M.Wintrobe. 1950. Experimental production of nutritional macrocyticanemia in swine. III. Further studies on pteroylglutamic acid deficiency.J. Lab. Clin. Med. 36:675–693.
Cartwright, G. E., B. Tatting, J. Robinson, N. M. Fellows, F. D. Gunn,and M. M. Wintrobe. 1951. Hematologic manifestations of vitamin B12
deficiency in swine. Blood 6:867–891.Cartwright, G. E., B. Tatting, D. Kurth, and M. M. Wintrobe. 1952.
Experimental production of nutritional macrocytic anemia in swine.V. Hematologic manifestations of a combined deficiency of vitamin B12
and pteroylglutamic acid. Blood 7:992–1004.Catron, D. V., D. Richardson, L. A. Underkofler, H. M. Maddock, and
W. C. Friedland. 1952. Vitamin B12 requirement of weanling pigs. II.Performance on low level of vitamin B12 and requirements for optimumgrowth. J. Nutr. 47:461–468.
Chavez, E. R. 1983. Supplemental value of ascorbic acid during lategestation on piglet survival and early growth. Can. J. Anim. Sci.63:683–687.
Chew, B. P., H. Rasmussen, M. H. Pubols, and R. L. Preston. 1982.Effects of vitamin A and b-carotene on plasma progesterone and uterineprotein secretions in gilts. Theriogenology 18:643–654.
Chiang, S. H., J. E. Pettigrew, R. L. Moser, S. G. Cornelius, K. P. Miller,and T. R. Heeg. 1985. Supplemental vitamin C in swine diets. Nutr.Rep. Int. 31:573–581.
Chung, T. K., and D. H. Baker. 1990. Riboflavin requirement of chicksfed purified amino acid and conventional corn-soybean meal diets.Poult. Sci. 69:1357–1363.
Chung, Y. K., D. C. Mahan and A. J. Lepine. 1992. Efficacy of D-a–tocopherol and DL-a–tocopheryl acetate for weanling pigs. J. Anim.Sci. 70:2485–2492.
Cleveland, E. R., G. L. Newton, B. G. Mullinix, O. M. Hale, and T. M.Frye. 1983. Foot-leg and performance traits of boars fed two levels ofascorbic acid. J. Anim. Sci. 57(Suppl. 1):387 (Abstr.).
Cline, J. H., D. C. Mahan, and A. L. Moxon. 1974. Progeny effects ofsupplemental vitamin E in sow diets. J. Anim. Sci. 39:974. (Abstr.)
Coelho, M. B. 1991. Vitamin stability. Feed Management 42 (No. 10): 24.Combs, G. E., T. H. Berry, H. D. Wallace, and R. C. Crum, Jr. 1966.
Levels and sources of vitamin D for pigs fed diets containing varyingquantities of calcium. J. Anim. Sci. 25:827-830.
Copelin, J. L., H. Monegue, and G. E. Combs. 1980. Niacin levels ingrowing-finishing swine diets. J. Anim. Sci. 51 (Suppl. 1): 190 (Abstr.).
Cromwell, G. L., V. W. Hays, and J. R. Overfield. 1970. Effect of dietaryascorbic acid on performance and plasma cholesterol levels of growingswine. J. Anim. Sci. 31:63–66.
Cunha, T. J., D. C. Lindley, and M. E. Ensminger. 1946. Biotin deficiencysyndrome in pigs fed desiccated egg white. J. Anim. Sci. 5:219–225.
Cunha, T. J., L. K. Bustad, W. E. Ham, D. R. Cordy, E. C. McCullock,I. F. Woods, G. H. Corner, and M. A. McGregor. 1947. Folic acid,para-aminobenzoic acid and anti-pernicious anemia liver extract inswine nutrition. J. Nutr. 34:173–187.
Cunha, T. J., R. W. Colby, L. K. Bustad, and J. F. Bone. 1948. The needfor and interrelationship of folic acid, anti-pernicious anemia liverextract, and biotin in the pig. J. Nutr. 36:215–229.
Davey, R. J., and J. W. Stevenson. 1963. Pantothenic acid requirementof swine for reproduction. J. Anim. Sci. 22:9–13.
Davis, C. L., and J. R. Gorham. 1954. The pathology of experimental andnatural cases of yellow fat disease in swine. Am. J. Vet. Res. 15:55–59.
De Ritter, E. 1976. Stability characteristics of vitamins in processed foods.Food Technol. 30:48–54.
Dodd, D. C., and P. E. Newling. 1960. Muscle degeneration and livernecrosis in the pig. Report of a natural outbreak. N. Z. Vet. J. 8:95–98.
Duel, H. J., Jr., E. R. Meserve, C. H. Johnston, A. Polgar, and L. Zechmeis-ter. 1945. Reinvestigation of the relative provitamin A potency of cryp-toxanthin and b-carotene. Arch. Biochem. 7:447–450.
Dvorak, M. 1974. Effects of corticotrophin, starvation and glucose onascorbic acid levels in the blood plasma and liver of piglets. Nutr.Metab. 16:215–222.
Easter, R. A., P. A. Anderson, E. J. Michel, and J. R. Corley. 1983.Response of gestating gilts and starter, grower and finisher swine tobiotin, pyridoxine, folacin and thiamine additions to a corn-soybeanmeal diet. Nutr. Rep. Int. 28:945–953.
Ellis, N. R., and L. L. Madsen. 1944. The thiamine requirements of pigsas related to the fat content of the diet. J. Nutr. 27:253–292.
Ellis, R. P., and M. M. Vorhies. 1976. Effect of supplemental dietaryvitamin E on the serologic response of swine to an Esherichia colibacterin. J. Am. Vet. Med. Assoc. 168:231–232.
Emerson, O. H., G. A. Emerson, A. Mohammad, and H. M. Evans. 1937.The chemistry of vitamin E: Tocopherols from various sources. J. Biol.Chem. 122:99–107.
Emmert, J. L. 1997. Methyl group metabolism in poultry. Proc. DegussaTech. Symp. (Indianapolis, IN), pp. 19–40.
Emmert, J. L., and D. H. Baker. 1997. A chick bioassay approach fordetermining the bioavailable choline concentration in normal and over-heated soybean meal, canola meal, and peanut meal. J. Nutr.127:745–752.
Emmert, J. L., T. A. Garrow, and D. H. Baker. 1996. Development ofan experimental diet for determining bioavailable choline concentrationand its application in studies with soybean lecithin. J. Anim. Sci.74:2738–2744.
Esch, M. W., R. A. Easter, and J. M. Bahr. 1981. Effect of riboflavindeficiency on estrous cyclicity in pigs. Biol. Reprod. 25:659–665.
Evans, H. M., O. H. Emerson, and G. A. Emerson. 1936. The isolationfrom wheat germ oil of an alcohol, a-tocopherol, having the propertiesof vitamin E. J. Biol. Chem. 113:319–332.

84 Nutrient Requirements of Swine
Ewan, R. C., M. E. Wastell, E. J. Bicknell, and V. C. Speer. 1969. Perfor-mance and deficiency symptoms of young pigs fed diets low in vitaminE and selenium. J. Anim. Sci. 29:912–915.
Fidge, N. H., F. R. Smith, and D. S. Goodman. 1969. Vitamin A andcarotenoids. The enzymatic conversion of b-carotene into retinal inhog intestinal mucosa. Biochem. J. 114:689–694.
Firth, J., and B. C. Johnson. 1956. Quantitative relationships of tryptophanand nicotinic acid in the baby pig. J. Nutr. 59:223–234.
Follis, R. H., Jr., and M. M. Wintrobe. 1945. A comparison of the effectsof pyridoxine and pantothenic acid deficiencies on the nervous tissuesof swine. J. Exp. Med. 81:539–551.
Follis, R. H., M. H. Miller, M. M. Wintrobe, and H. J. Stein. 1943.Development of myocardial necrosis and absence of nerve degenerationin thiamine deficiency in pigs. Am. J. Pathol. 19:341–357.
Forbes, R. M., and W. T. Haines. 1952. The riboflavin requirement ofthe baby pig. J. Nutr. 47:411–424.
Frank, G. R., J. M. Bahr, and R. A. Easter. 1984. Riboflavin requirementof gestating swine. J. Anim. Sci. 59:1567–1572.
Frank, G. R., J. M. Bahr, and R. A. Easter. 1988. Riboflavin requirementof lactating swine. J. Anim. Sci. 66:47–52.
Frape, D. L., V. C. Speer, V. W. Hays, and D. V. Catron. 1959. Thevitamin A requirement of the young pig. J. Nutr. 68:173–187.
Frederick, G. L., and G. J. Brisson. 1961. Some observations on therelationship between vitamin B12 and reproduction in swine. Can.J. Anim. Sci. 41:212–219.
Frigg, M. 1976. Bio-availability of biotin in cereals. Poult. Sci.55:2310–2318.
Fritschen, R. D., O. D. Grace, and E. R. Peo, Jr. 1971. Bleeding pigdisease. Nebr. Swine Rep. EC71 219:22–23.
Gannon, N. J., and J. Liebholz. 1989. The effects of folic acid supplementa-tion on the performance of growing pigs. P. 136 in Manipulating PigProduction II, J. L. Barnett and D. P. Hennessy, eds. Werribee, Victo-ria, Australia: Australasian Pig Science Assn.
Goff , J. P., R. L. Horst, and E. T. Littledike. 1984. Effect of sow vitaminD status at parturition on the vitamin D status of neonatal pigs.J. Nutr. 114:163–169.
Goodman, D. S. 1979. Vitamin A and retinoids: Recent advances. Fed.Proc. 38:2501–2503.
Goodman, D. S. 1980. Vitamin A metabolism. Fed. Proc. 39:2716–2722.Grandhi, R. R., and J. H. Strain. 1980. Effect of biotin supplementation
on reproductive performance and foot lesions in swine. Can. J. Anim.Sci. 60:961–969.
Grant, C. A. 1961. Morphological and etiological studies of dieteticmicroangiopathy in pigs (‘‘mulberry heart’’). Acta Vet. Scand. 2(Suppl.3):1 (Abstr.).
Green, J., P. Mamalis, S. Marcinkiewicz, and D. McHale. 1960. Structureof b-tocopherol. Chem. Ind. (London), Jan. 16, p. 73.
Green, R. G., W. E. Carlson, and C. A. Evans. 1941. A deficiency diseaseof foxes produced by feeding fish. J. Nutr. 21:243–256.
Greenberg, S. M., A. Chatterjee, C. E. Calbert, H. J. Duel, Jr., and L.Zechmeister. 1950. A comparison of the provitamin A activity of b-carotene and cryptoxanthin in the chick. Arch. Biochem. 25:61–65.
Groce, A. W., E. R. Miller, K. K. Keahey, D. E. Ullrey, and D. J. Ellis.1971. Selenium supplementation of practical diets for growing-finishingswine. J. Anim. Sci. 32:905–911.
Groce, A. W., E. R. Miller, D. E. Ullrey, P. K. Ku, K. K. Keahey, andD. J. Ellis. 1973. Selenium requirements in corn-soy diets for growing-finishing swine. J. Anim. Sci. 37:948–956.
Guilbert, H. R., R. F. Miller, and E. H. Hughes. 1937. The minimumvitamin A and carotene requirements of cattle, sheep, and swine.J. Nutr. 13:543–564.
Hakkarainen, J., P. Lindberg, G. Bengtsson, L. Jonsson, and N. Lannek.1978. Requirement for selenium (as selenite) and vitamin E (as a-tocopherol) in weaned pigs. III. The effect on the development of the
VESD syndrome of varying selenium levels in a low-tocopherol diet.J. Anim. Sci. 46: 1001–1008.
Hall, D. D., G. L. Cromwell, and T. S. Stahly. 1991. Effects of dietarycalcium, phosphorus, calcium:phosphorus ratio and vitamin K on per-formance, bone strength and blood clotting status of pigs. J. Anim.Sci. 69:646–655.
Hall, D. D., G. L. Cromwell, and T. S. Stahly. 1986. The vitamin Krequirement of the growing pig. J. Anim. Sci. 63 (Suppl. 1):268 (Abstr.).
Halloran, B. P., and H. F. DeLuca. 1979. Vitamin D deficiency andreproduction in rats. Science 204:73–74.
Hamilton, C. R., and T. L. Veum. 1984. Response of sows and litters toadded dietary biotin in environmentally regulated facilities. J. Anim.Sci. 59:151–157.
Hamilton, C. R., and T. L. Veum. 1986. Effect of biotin and(or) lysineadditions to corn-soybean meal diets on the performance and nutrientbalance of growing pigs. J. Anim. Sci. 62:155–162.
Hamilton, C. R., T. L. Veum, D. E. Jewell, and J. A. Siwecki. 1983. Thebiotin status of weanling pigs fed semipurified diets as evaluated byplasma and hepatic parameters. Int. J. Vitamin Nutr. Res. 53:44–50.
Hancock, J. D., E. R. Peo, Jr., A. J. Lewis, J. D. Crenshaw, and B. D.Moser. 1986. Vitamin D toxicity in young pigs. J. Anim. Sci. 63(Suppl.1):268 (Abstr.).
Hanke, H. E., and R. J. Meade. 1971. Biotin and pyridoxine additionsto diets for pigs weaned at an early age. 1970–71 Minnesota SwineResearch Report H-120. St. Paul: University of Minnesota Press.
Hanson, L. E., and I. L. Hathaway. 1948. The fertility of boars fed avitamin E deficient ration. J. Anim. Sci. 7:528 (Abstr.).
Harmon, B. G., E. R. Miller, J. A. Hoefer, D. E. Ullrey, and R. W.Luecke. 1963. Relationship of specific nutrient deficiencies to antibodyproduction in swine. II. Pantothenic acid, pyridoxine or riboflavin.J. Nutr. 79:263–268.
Harmon, B. G., D. E. Becker, A. H. Jensen, and D. H. Baker. 1969.Nicotinic acid-tryptophan relationship in the nutrition of the weanlingpig. J. Anim. Sci. 28:848–852.
Harmon, D. G., D. E. Becker, A. H. Jensen, and D. H. Baker. 1970.Nicotinic acid-tryptophan nutrition and immunologic implications inyoung swine. J. Anim. Sci. 31:339–342.
Harper, A. F., M. D. Lindemann, L. I. Chiba, G. E. Combs, D. L.Handlin, E. T. Kornegay, and L. L. Southern. 1994. An assessment ofdietary folic acid levels during gestation and lactation on reproductiveand lactational performance of sows: a cooperative study. J. Anim. Sci.72:2338–2344.
Heaney, D. P., J. A. Hoefer, D. E. Ullrey, and E. R. Miller. 1963. Effectsof marginal vitamin A intake during gestation in swine. J. Anim. Sci.22:925–928.
Heinemann, W. W., M. E. Ensminger, T. J. Cunha, and E. C. McCulloch.1946. The relation of the amount of thiamine in the ration of the hogto the thiamine and riboflavin content of the tissue. J. Nutr. 31:107–125.
Heinle, R. W., A. D. Welch, and J. A. Pritchard. 1948. Essentiality ofboth the antipernicious anemia factor of liver and pteroylglutamic acidfor hematopoiesis in swine. J. Lab. Clin. Med. 33:1647 (Abstr.).
Hendricks, D. G., E. R. Miller, D. E. Ullrey, R. D. Struthers, B. V.Baltzer, J. A. Hoefer, and R. W. Luecke. 1967. b-Carotene vs. retinylacetate for the baby pig and the effect upon ergocalciferol requirement.J. Nutr. 93:37–43.
Hendricks, H. K., H. S. Teague, D. R. Redman, and A. P. Grifo, Jr.1964. Absorption of vitamin B12 from the colon of the pig. J. Anim.Sci. 23:1036–1038.
Hentges, J. F., Jr., R. H. Grummer, P. H. Phillips, and G. Bohstedt.1952a. The minimum requirement of young pigs for a purified sourceof carotene. J. Anim. Sci. 11: 266–272.
Hitchcock, J. P., E. R. Miller, K. K. Keahey, and D. E. Ullrey. 1978.Effects of arsanilic acid and vitamin E upon utilization of natural orsupplemental selenium by swine. J. Anim. Sci. 46:425–435.

Vitamins 85
Hjarde, W., A. Neimann-Sorensen, B. Palludan, and P. H. Sorensen.1961. Investigations concerning vitamin A requirement, utilization anddeficiency symptoms in pigs. Acta Agric. Scand. 11:13–53.
Hoppe, P. P., F. J. Schoner, and M. Frigg. 1992. Effects of dietary retinolon hepatic retinol storage and on plasma and tissue a-tocopherol inpigs. Internat. J. Vit. Nutr. Res. 62:121–129.
Horst, R. L., E. T. Littledike, J. L. Riley, and J. L. Napoli. 1981. Quantita-tion of vitamin D and its metabolites and their plasma concentrationsin five species of animals. Anal. Biochem. 116:189–203.
Horst, R. L., J. L. Napoli, and E. T. Littledike. 1982. Discrimination inthe metabolism of orally dosed ergocalciferol and cholecalciferol bythe pig, rat, and chick. Biochem. J. 204:185–189.
Hove, E. L., and H. R. Seibold. 1955. Liver necrosis and altered fatcomposition in vitamin E-deficient swine. J. Nutr. 56:173–186.
Hughes, E. H. 1940a. The minimum requirement of riboflavin for thegrowing pig. J. Nutr. 20:233–238.
Hughes, E. H. 1940b. The minimum requirement of thiamine for thegrowing pig. J. Nutr. 20:239–241.
Hughes, E. H., and N. R. Ittner. 1942. The minimum requirement ofpantothenic acid for the growing pig. J. Anim. Sci. 1:116–119.
Hughes, E. H., and R. L. Squibb. 1942. Vitamin B6 (pyridoxine) in thenutrition of the pig. J. Anim. Sci. 1:320–325.
Hutagalung, R. I., C. H. Chaney, R. D. Wood, and D. G. Waddill. 1968.Effects of nitrates and nitrites in feed on utilization of carotene inswine. J. Anim. Sci. 27:79–82.
Hutagalung, R. I., G. L. Cromwell, V. W. Hays, and C. H. Chaney.1969. Effect of dietary fat, protein, cholesterol and ascorbic acid onperformance, serum and tissue cholesterol levels and serum lipid levelsof swine. J. Anim. Sci. 29:700–705.
Jewell, D. E., J. A. Siwecki, and T. L. Veum. 1981. The effect of dietaryvitamin C on performance and tissue vitamin C levels in neonatal pigs.J. Anim. Sci. 53(Suppl. 1):98 (Abstr.).
Johnson, B. C., and M. F. James. 1948. Choline deficiency in the babypig. J. Nutr. 36:339–344.
Johnson, D. W., and L. S. Palmer. 1939. Individual and breed variationsin pigs on rations devoid of vitamin D. J. Agric. Res. 58:929–940.
Johnson, B. C., M. F. James, and J. L. Krider. 1948. Raising newbornpigs to weaning age on a synthetic diet with attempts to produce apteroylglutamic acid deficiency. J. Anim. Sci. 7:486–493.
Johnson, B. C., A. L. Neuman, R. O. Nesheim, M. F. James, J. L. Krider,A. S. Dana, and J. B. Thiersch. 1950. The interrelationship of vitaminB12 and folic acid in the baby pig. J. Lab. Clin. Med. 36:537–546.
Kindberg, C. G., and J. W. Suttie. 1989. Effect of various intakes ofphylloquinone on signs of vitamin K deficiency and serum liver phyllo-quinone concentrations in the rat. J. Nutr. 119:175–180.
Koch, B. A., D. B. Parrish, and S. Sukhonthasarnpa. 1963. Effects ofdietary nitrate and nitrite on growing pigs. J. Anim. Sci. 22:840 (Abstr.).
Kodicek, E., R. Braude, S. K. Kon, and K. G. Mitchell. 1956. The effectof alkaline hydrolysis of maize on the availability of its nicotinic acidto the pig. Br. J. Nutr. 10:51–66.
Kodicek, E., R. Braude, S. K. Kon, and K. G. Mitchell. 1959. The availabil-ity to pigs of nicotinic acid in tortilla baked from maize treated withlimewater. Br. J. Nutr. 13:363–384.
Kopinski, J. S., J. Leibholz, and L. Bryden. 1989. Biotin studies in pigs.4. Biotin availability in feedstuffs for pigs and chickens. Br. J. Nutr.62:773–780.
Kormann, A. W., and H. Weiser. 1984. Protective functions of fat-solublevitamins. Pp. 201–222 in Proc. 37th Nottingham Feed Manufacturer’sConference, Nottingham, England. London: Butterworth.
Kornegay, E. T. 1986. Biotin in swine production: A review. LivestockProd. Sci. 14:65–89.
Kornegay, E. T., and T. N. Meacham. 1973. Evaluation of supplementalcholine for reproducing sows housed in total confinement on concreteor in dirt lots. J. Anim. Sci. 37:506–509.
Ko¨sters, W. W., and M. Kirchgessner. 1976a. Gewichtenwicklung undFutterverwertung Friiheutwijhnter Ferkel bei untersehiedlicher Vita-min B6-Versorgung. (Growth rate and feed efficiency of early-weanedpiglets with varying vitamin B6 supply.) Z. Tierphysiol. Tierernahr.Futtermittelkd. 37:235–246.
Ko¨sters, W. W., and M. Kirchgessner. 1976b. Zur Veranderugn des Fut-terverzeha Friiheutwohnter Ferkel bei Untersehiedlicher Vitamin Be-Versorgung. (Change in feed intake of early-weaned piglets in responseto different vitamin B6 supply.) Z. Tierphysiol. Tierernahr. Futtermit-telkd. 37:247–254.
Krampitz, L. O., and D. W. Woolley. 1944. The manner of inactivationof thiamine by fish tissue. J. Biol. Chem. 152:9–17.
Krider, J. L., S. W. Terrill, and R. F. VanPoucke. 1949. Response ofweanling pigs to various levels of riboflavin. J. Anim. Sci. 8:121–125.
Kroening, G. H., and W. G. Pond. 1967. Methionine, choline and threo-nine interrelationships for growth and lipotropic action in the baby pigand rat. J. Anim. Sci. 26:352–357.
Lannek, N., P. Lindberg, G. Nilsson, G. Nordstrom, and K. Orstadius.1961. Production of vitamin E deficiency and muscular dystrophy inpigs. Res. Vet. Sci. 2:67–72.
Lehrer, W. P., Jr., and A. C. Wiese. 1952. Riboflavin deficiency in babypigs. J. Anim. Sci. 11:244–250.
Lehrer, W. P., Jr., A. C. Wiese, P. R. Moore, and M. E. Ensminger.1951. Pyridoxine deficiency in baby pigs. J. Anim. Sci. 10: 65–72.
Lehrer, W. P., Jr., A. C. Wiese, and P. R. Moore. 1952. Biotin deficiencyin suckling pigs. J. Nutr. 47:203–212.
Leibbrandt, V. D. 1977. Influence of ascorbic acid on suckling pig perfor-mance. J. Anim. Sci. 45(Suppl. 1):98 (Abstr.).
Lewis, A. J., G. L. Cromwell, and J. E. Pettigrew. 1991. Effects of supple-mental biotin during gestation and lactation on reproductive perfor-mance of sows: A cooperative study. J. Anim. Sci. 69:207–214.
Lindemann, M. D., and E. T. Kornegay. 1986. Folic acid additions toweanling pig diets. J. Anim. Sci. 63(Suppl. 1): 35 (Abstr.).
Lindemann, M. D., and E. T. Kornegay. 1989. Folic acid supplementationto diets of gestating-lactating swine over multiple parities. J. Anim.Sci. 67:459–464.
Lindemann, M.P., G.L. Cromwell, and H.J. Monegue. 1995. Effects ofinadequate and high levels of vitamin fortification on performance ofweanling pigs. J. Anim. Sci. 73(Suppl. 1):16 (Abstr.).
Lindley, D. C., and T. J. Cunha. 1946. Nutritional significance of inositoland biotin for the pig. J. Nutr. 32:47–59.
Livingston, A. L., J. W. Nelson, and G. O. Kohler. 1968. Stability ofalpha-tocopherol during alfalfa dehydration and storage. J. Agric. FoodChem. 16:492–495.
Long, G. G. 1984. Acute toxicosis in swine associated with excessiveintake of vitamin D. J. Am. Vet. Med. Assoc. 184:164–170.
Lowry, K. R., O. A. Izquierdo, and D. H. Baker. 1987. Efficacy of betainerelative to choline as a dietary methyl donor. Poult. Sci. 66(Suppl.1):120 (Abstr.).
Luce, W. G., E. R. Peo, Jr., and D. B. Hudman. 1966. Availability ofniacin in wheat for swine. J. Nutr. 88:39–44.
Luce, W. G., E. R. Peo, Jr., and D. B. Hudman. 1967. Availability ofniacin in corn and milo for swine. J. Anim. Sci. 26:76–84.
Luce, W. G., D. S. Buchanan, C. V. Maxwell, H. E. Jordan, and R. O.Bates. 1985. Effect of supplemental choline and dichlorvos on repro-ductive performance of gilts. Nutr. Rep. Int. 32:245–251.
Luecke, R. W., W. N. McMillen, F. Thorpe, Jr., and C. Tull. 1947. Therelationship of nicotinic acid, tryptophane and protein in the nutritionof the pig. J. Nutr. 33:251–261.
Luecke, R. W., W. N. McMillen, F. Thorpe, Jr., and C. Tull. 1948.Further studies on the relationship of nicotinic acid, tryptophane andprotein in the nutrition of the pig. J. Nutr. 36:417–424.
Luecke, R. W., W. N. McMillen, and F. Thorpe, Jr. 1950. Further studiesof pantothenic acid deficiency in weanling pigs. J. Anim. Sci. 9:78–82.
86 Nutrient Requirements of Swine
Luecke, R. W., J. A. Hoefer, and F. Thorpe, Jr. 1952. The relationshipof protein to pantothenic acid and vitamin B12 in the growing pig.J. Anim. Sci. 11:238–243.
Luecke, R. W., J. A. Hoefer, and F. Thorpe, Jr. 1953. The supplementaryeffects of calcium pantothenate and aureomycin in a low-protein rationfor weanling pigs. J. Anim. Sci. 12:605–610.
Lynch, P. B., and J. F. O’Grady. 1981. Effect of vitamin C (ascorbic acid)supplementation on sows in late pregnancy on piglet mortality. IrishJ. Agric. Res. 20:217–219.
Lynch, P. B., G. E. Hall, L. D. Hill, E. E. Hatfield, and A. H. Jensen.1975. Chemically preserved high-moisture corns in diets for growing-finishing swine. J. Anim. Sci. 40:1063–1069.
Madsen, A., H. P. Mortensen, W. Hjarde, E. Leebeck, and T. Leth.1973. Vitamin E in barley treated with propionic acid with specialreference to the feeding of bacon pigs. Acta Agric. Scand. Suppl.19:169–173.
Mahan, D. C. 1991. Assessment of the influence of dietary vitamin E onsows and offspring in three parities: Reproductive performance, tissuetocopherol, and effects on progeny. J. Anim. Sci. 69:2904–2917.
Mahan, D. C. 1994. Effects of dietary vitamin E on sow reproductiveperformance over a five-parity period. J. Anim. Sci. 72:2870–2879.
Mahan, D. C., and A. L. Moxon. 1978. Effect of increasing the level ofinorganic selenium supplementation in the post-weaning diets of swine.J. Anim. Sci. 46:384–390.
Mahan, D. C., and L. J. Saif. 1983. Efficacy of vitamin C supplementationfor weanling pigs. J. Anim. Sci. 56:631–639.
Mahan, D. C., R. A. Pickett, T. W. Perry, T. M. Curtin, W. R. Featherston,and W. M. Beeson. 1966. Influence of various nutritional factors andphysical form of feed on esophagogastric ulcers in swine. J. Anim. Sci.25:1019–1023.
Mahan, D. C., A. J. Lepine, and K. Dabrowski. 1994. Efficacy of magne-sium-L-ascorbyl-2-phosphate as a vitamin C source for weanling andgrowing-finishing swine. J. Anim. Sci. 72:2354–2361.
Malm, A., W. G. Pond, E. F. Walker, Jr., M. Homan, A. Aydin, and D.Kirtland. 1976. Effect of polyunsaturated fatty acids and vitamin Elevel of the sow gestation diet on reproductive performance and onlevel of alpha-tocopherol in colostrum, milk and dam and progenyblood serum. J. Anim. Sci. 42:393–399.
Matte, J. J., C. L. Girard, and G. J. Brisson. 1984a. Folic acid and repro-ductive performance of sows. J. Anim. Sci. 59:1020–1025.
Matte, J. J., C. L. Girard, and G. J. Brisson. 1984b. Serum folates duringthe reproductive cycle of sows. J. Anim. Sci. 59:158–163.
Matte, J. J., C. L. Girard, and G. J. Brisson. 1992. The role of folic acidin the nutrition of gestating and lactating primaparous sows. LivestockProd. Sci. 32:131–148.
Meade, R. J. 1971. Biotin and pyridoxine supplementation of diets forgrowing pigs. 1970–71 Minnesota Swine Research Report H-218. St.Paul, Minn.: University of Minnesota Press.
Meade, R. J., L. E. Hanson, H. E. Hanke, K. P. Miller, J. W. Rust, R. S.Grant, and M. E. Tumbleson. 1969. B-vitamin supplementation ofconventional diets for growing swine. Minnesota Agricultural Experi-ment Station Technical Bulletin 263. St. Paul: University of Minne-sota Press.
Meyer, W. R., D. C. Mahan, and A. L. Moxon. 1981. Value of dietaryselenium and vitamin E for weanling swine as measured by performanceand tissue selenium and glutathione peroxidase activities. J. Anim.Sci. 52:302–311.
Michel, R. L., C. K. Whitehair, and K. K. Keahey. 1969. Dietary hepaticnecrosis associated with selenium-vitamin E deficiency in swine. J. Am.Vet. Med. Assoc. 155:50–59.
Miller, C. O., and N. R. Ellis. 1951. The riboflavin requirement of growingswine. J. Anim. Sci. 10: 807–812.
Miller, C. O., N. R. Ellis, J. W. Stevenson, and R. Davey. 1953. Theriboflavin requirement of swine for reproduction. J. Nutr. 51:163–170.
Miller, E. R., R. L. Johnston, J. A. Hoefer, and R. W. Luecke. 1954. Theriboflavin requirement of the baby pig. J. Nutr. 52:405–413.
Miller, E. R., D. A. Schmidt, J. A. Hoefer, and R. W. Luecke. 1955. Thethiamine requirement of the baby pig. J. Nutr. 56:423–430.
Miller, E. R., D. A. Schmidt, J. A. Hoefer, and R. W. Luecke. 1957. Thepyridoxine requirement of the baby pig. J. Nutr. 62:407–419.
Miller, E. R., D. E. Ullrey, C. L. Zutaut, B. V. Baltzer, D. A. Schmidt,B. H. Vincent, J. A. Hoefer, and R. W. Luecke. 1964. Vitamin D2
requirement of the baby pig. J. Nutr. 83:140–148.Miller, E. R., D. E. Ullrey, C. L. Zutaut, J. A. Hoefer, and R. W. Luecke.
1965. Comparisons of casein and soy proteins upon mineral balanceand vitamin D2 requirement of the baby pig. J. Nutr. 85:347–353.
Misir, R., and R. Blair. 1984. Effect of biotin supplementation of a barley-wheat diet on restoration of healthy feet, legs, and skin of biotin deficientsows. J. Res. Vet. Sci. 40:212–218.
Misir, R., and R. Blair. 1986. Reproductive performance of gilts and sowsas affected by induced biotin deficiency and subsequent dietary biotinsupplementation. J. Anim. Physiol. Anim. Nutr. 55:196–208.
Mitchell, H. H., B. C. Johnson, T. S. Hamilton, and W. T. Haines. 1950.The riboflavin requirement of the growing pig at two environmentaltemperatures. J. Nutr. 41:317–337.
Molitoris, B. A., and D. H. Baker. 1976. Assessment of the quantity ofbiologically available choline in soybean meal. J. Anim. Sci. 42:481–489.
Muhrer, M. E., R. G. Cooper, C. N. Cornell, and R. D. Thomas. 1970. Dietrelated hemorrhagic syndrome in swine. J. Anim. Sci. 31:1025 (Abstr.).
Myers, G. S., Jr., H. D. Eaton, and J. E. Rousseau, Jr. 1959. Relativevalue of carotene from alfalfa and vitamin A from a dry carrier fed tolambs and pigs. J. Anim. Sci. 18:288–297.
Nafstad, I. 1965. Studies of hematology and bone marrow morphologyin vitamin E-deficient pigs. Pathol. Vet. 2:277–287.
Nafstad, I. 1973. Some aspects of vitamin E deficiency in pigs. Acta Agric.Scand. 19:31–34.
Nafstad, I., and H. J. Nafstad. 1968. An electron microscopic study ofblood and bone marrow in vitamin E-deficient pigs. Pathol. Vet.5:520–537.
Nafstad, I., and S. Tollersrud. 1970. The vitamin E-deficiency syndromein pigs. I. Pathological changes. Acta Vet. Scand. 11:452–480.
Nakano, T., F. X. Aherne, and J. R. Thompson. 1983. Effect of dietarysupplementation of vitamin C on pig performance and the incidenceof osteochondrosis in elbow and stifle joints in young growing swine.Can. J. Anim. Sci. 63:421–428.
National Research Council. 1987. Vitamin Tolerance of Animals. Wash-ington, D.C.: National Academy Press. 96 pp.
Nelson, E. C., B. A. Dehority, H. S. Teague, V. L. Sanger, and W. D.Pounden. 1962. Effect of vitamin A on some biochemical and physiolog-ical changes in swine. J. Nutr. 76:325–332.
Nelson, E. C., B. A. Dehority, H. S. Teague, A. P. Grifo, Jr., and V. L.Sanger. 1964. Effect of vitamin A and vitamin A acid on cerebrospinalfluid pressure and blood and liver vitamin A concentration in the pig.J. Nutr. 82:263–268.
Nesheim, R. O., and B. C. Johnson. 1950. Effect of a high level ofmethionine on the dietary choline requirement of the baby pig.J. Nutr. 41:149–152.
Nesheim, R. O., J. L. Krider, and B. C. Johnson. 1950. The quantitativecrystalline B12 requirement of the baby pig. Arch. Biochem. 27:240–242.
Neumann, A. L., and B. C. Johnson. 1950. Crystalline vitamin B12 in thenutrition of the baby pig. J. Nutr. 40:403–414.
Neumann, A. L., J. L. Krider, M. R. James, and B. C. Johnson. 1949.The choline requirement of the baby pig. J. Nutr. 38:195–214.
Neumann, A. L., J. B. Thiersch, J. L. Krider, M. F. James, and B. C.Johnson. 1950. Requirement of the baby pig for vitamin B12 fed as aconcentrate. J. Anim. Sci. 9:83–89.
Newcomb, M. D., and G. L. Allee. 1986. Water-soluble vitamins forweanling pigs. J. Anim. Sci. 63 (Suppl. 1):108 (Abstr.).
Vitamins 87
Newport, M. J. 1981. A note on the effect of low levels of biotin in milksubstitutes for neonatal pigs. Anim. Prod. 33:333–335.
Nielsen, H. E., N. J. Hojgaard-Olsen, W. Hjarde, and E. Leerbeck. 1973.Vitamin E content in colostrum and sow’s milk and sow milk yield attwo levels of dietary fats. Acta Agric. Scand. Suppl. 19:35–38.
Nielsen, H. E., V. Danielsen, M. G. Simesen, C. Gissel-Nielsen, W.Hjarde, T. Leth, and A. Basse. 1979. Selenium and vitamin E deficiencyin pigs. I. Influence on growth and reproduction. Acta Vet. Scand.20:276–288.
Nockels, C. F. 1979. Protective effects of supplemental vitamin E againstinfection. Fed. Proc. 38:2134–2138.
Noff, D., and S. Edelstein. 1978. Vitamin D and its hydroxylated metabo-lites in the rat. Hormone Res. 9:292–300.
North Central Region-42 Committee on Swine Nutrition. 1976. Effectsof supplemental choline on reproductive performance of sows: A coop-erative regional study. J. Anim. Sci. 42:1211–1216.
North Central Region-42 Committee on Swine Nutrition. 1980. Effect ofsupplemental choline on performance of starting, growing and finishingpigs: A cooperative regional study. J. Anim. Sci. 50:99–102.
Obel, A. L. 1953. Studies on the morphology and etiology of so-called toxicliver dystrophy (hepatosis dietetica) in swine. Acta Pathol. Microbiol.Scand. Suppl. 94:1–87.
Oduho, G. and D. H. Baker. 1993. Quantitative efficacy of niacin sourcesfor chicks: nicotinic acid, nicotinamide, NAD and tryptophan. J. Nutr.123:2201–2206.
Oduho, G. W., T. K. Chung, and D. H. Baker. 1993. Menadione nicotin-amide bisulfite is a bioactive source of vitamin K and niacin activityfor chicks. J. Nutr. 123:737–743.
Oduho, G. W., Y. Han, and D. H. Baker. 1994. Iron deficiency reducesthe efficacy of tryptophan as a niacin precursor for chicks. J. Nutr.124:444–450.
Osweiler, G. D. 1970. Porcine hemorrhagic disease. No. AS3531 in Proc.Pork Producers Day. Ames, IA. Iowa State Univ. Press.
Palm, B. W., R. J. Meade, and A. L. Melliere. 1968. Pantothenic acidrequirement of young swine. J. Anim. Sci. 27:1596–1601.
Parrish, D. B., C. E. Aubel, J. S. Hughes, and J. D. Wheat. 1951. Relativevalue of vitamin A and carotene for supplying the vitamin A require-ments of swine during gestation and beginning lactation. J. Anim.Sci. 10:551–559.
Partridge, I. G., and M. S. McDonald. 1990. A note on the response ofgrowing pigs to supplemental biotin. Anim. Prod. 50:195–197.
Peng, C. L., and H. Heitman, Jr. 1973. Erythrocyte transketolase activityand the percentage stimulation by thiamin pyrophosphate as criteriaof thiamin status in the pig. Br. J. Nutr. 30:391–399.
Peng, C. L., and H. Heitman, Jr. 1974. The effect of ambient temperatureon the thiamin requirement of growing-finishing pigs. Br. J. Nutr.32:1–9.
Pennock, J. F., F. W. Hemming, and J. D. Kerr. 1964. A reassessment oftocopherol chemistry. Biochem. Biophys. Res. Commun. 17:542–548.
Penny, R. H. C., R. H. A. Cameron, S. Johnson, P. J. Kenyan, H. A.Smith, A. W. P. Bell, J. P. L. Cole, and J. Taylor. 1981. The influenceof biotin supplementation on sow reproductive efficiency. Vet. Rec.109:80–81.
Peo, E. R., Jr., G. F. Wehrebein, B. Moser, P. J. Cunningham, and P. E.Vipperman, Jr. 1970. Biotin supplementation of baby pig diets. J. Anim.Sci. 31:209. (Abstr.)
Peplowski, M. A., D. C. Mahan, F. A. Murray, A. L. Moxon, A. H. Cantor,and K. E. Ekstrom. 1980. Effect of dietary and injectable vitamin Eand selenium in weanling swine antigenically challenged with sheepred blood cell. J. Anim. Sci. 51:344–351.
Pettigrew, J.E., S.M. El-Kandelgy, L.J. Johnston, and G. C. Shurson.1996. Riboflavin nutrition of sows. J. Anim. Sci. 74:2226–2230.
Petzold, E. N., F. W. Quackenbush, and M. McQuistan. 1959. Zeacaro-tenes, new provitamins from corn. Arch. Biochem. Biophys.82:117–124.
Piatkowski, T. L., D. C. Mahan, A. H. Cantor, A. L. Moxon, J. H. Cline,and A. P. Grifo, Jr. 1979. Selenium and vitamin E in semipurified dietsfor gravid and non-gravid gilts. J. Anim. Sci. 48:1357–1365.
Pike, W. J., J. B. Parker, M. R. Haussler, A. Boass, and S. U. Toverud.1979. Dynamic changes in circulating 1,25-dihydroxyvitamin D duringreproduction in rats. Science 204:1427–1429.
Piper, R. C., J. A. Froseth, L. R. McDowell, G. H. Kroening, and I. A.Dyer. 1975. Selenium-vitamin E deficiency in swine fed peas (Pisumsativum). Am. J. Vet. Res. 36:273–281.
Pond, W. G., E. Kwong, and J. K. Loosli. 1960. Effect of level of dietaryfat, pantothenic acid, and protein on performance of growing-fatteningswine. J. Anim. Sci. 19:1115–1122.
Poor, C. L., S. D. Miller, G. C. Fahey, R. A. Easter, and J. W. Erdman.1987. Animal models for carotenoid utilization studies: Evaluation ofthe chick and the pig. Nutr. Rep. Intl. 36:229–234.
Powick, W. C., N. R. Ellis, and C. N. Dale. 1947a. Relationship of corndiets to nicotinic acid deficiency in growing pigs. J. Anim. Sci.6:395–400.
Powick, W. C., N. R. Ellis, L. L. Madsen, and C. N. Dale. 1947b. Nicotinicacid deficiency and nicotinic acid requirement of young pigs on apurified diet. J. Anim. Sci. 6:310–324.
Powick, W. C., N. R. Ellis, and C. N. Dale. 1948. Relationship of trypto-phane to nicotinic acid in the feeding of growing pigs. J. Anim. Sci.7:228–232.
Quarterman, J., A. C. Dalgarno, A. Adams, B. F. Fell, and R. Boyne.1964. The distribution of vitamin D between the blood and the liverin the pig, and observations on the pathology of vitamin D toxicity.Br. J. Nutr. 18:65–77.
Reid, I. M., R. H. Barnes, W. G. Pond, and L. Krook. 1968. Methionine-responsive liver damage in young pigs fed a diet low in protein andvitamin E. J. Nutr. 95:499–508.
Richardson, D., D. V. Catron, L. A. Underkofler, H. M. Maddock, andW. C. Friedland. 1951. Vitamin B12 requirement of male weanling pigs.J. Nutr. 44:371–381.
Riker, J. T., III, T. W. Perry, R. A. Pickett, and C. J. Heidenreich. 1967.Influence of controlled temperatures on growth rate and plasmaascorbic acid values in swine. J. Nutr. 92:99–103.
Ringarp, N. 1960. Clinical and experimental investigations into a post-parturient syndrome with agalactia in sows. Acta Agric. Scand. Suppl. 7.
Ritchie, H. D., E. R. Miller, D. E. Ullrey, J. A. Hoefer, and R. W. Luecke.1960. Supplementation of the swine gestation diet with pyridoxine.J. Nutr. 70:491–496.
Roth-Maier, D. A., and M. Kirchgessner. 1977. Utersuchungen zumoptimalen Pantothensaurebedarf von Mastschweinen. (Studies on theoptimal pantothenic acid requirement of market pigs.) Z. Tierphysiol.Tierernahr. Futtermittelkd. 38:121–131.
Russell, L. E., P. J. Bechtel, and R. A. Easter. 1985a. Effect of deficientand excess dietary vitamin B6 on amino transaminase and glycogenphosphorylase activity and pyridoxal phosphate content in two musclesfrom postpubertal gilts. J. Nutr. 115:1124–1135.
Russell, L. E., R. A. Easter, and P. J. Bechtel. 1985b. Evaluation ofthe erythrocyte aspartate aminotransferase activity coefficient as anindicator of the vitamin B6 status of postpubertal gilts. J. Nutr.115:1117–1123.
Russett, J. C., J. L. Krider, T. R. Cline, H. L. Thacker, and L. B. Under-wood. 1979a. Choline-methionine interactions in young swine. J. Anim.Sci. 49:708–714.
Russett, J. C., J. L. Krider, T. R. Cline, and L. B. Underwood. 1979b.Choline requirement of young swine. J. Anim. Sci. 48:1366–1373.
Sandholm, M., T. Honkanen-Buzalski, and V. Rasi. 1979. Prevention ofnavel bleeding in piglets by preparturient administration of ascorbicacid. Vet. Rec. 104:337–338.
Schendel, H. E., and B. C. Johnson. 1962. Vitamin K deficiency in thebaby pig. J. Nutr. 76: 124–130.
88 Nutrient Requirements of Swine
Schnoes, H. K., and H. F. DeLuca. 1980. Recent progress in vitamin Dmetabolism and the chemistry of vitamin D metabolites. Fed. Proc.39:2723–2729.
Seerley, R. W., R. J. Emerick, L. B. Embry, and O. E. Olsen. 1965.Effect of nitrate or nitrite administered continuously in drinking waterfor swine and sheep. J. Anim. Sci. 24:1014–1019.
Seerley, R. W., O. W. Charles, H. C. McCampbell, and S. P. Bertch.1976. Efficacy of menadione dimethylpyrimidinol bisulfite as a sourceof vitamin K in swine diets. J. Anim. Sci. 42:599–607.
Seerley, R. W., R. A. Snyder, and H. C. McCampbell. 1981. The influenceof sow dietary lipids and choline on piglet survival, milk and carcasscomposition. J. Anim. Sci. 52:542–550.
Selke, M. R., C. E. Barnhart, and C. H. Chaney. 1967. Vitamin A require-ment of the gestating and lactating sow. J. Anim. Sci. 26:759–763.
Sewell, R. F., D. G. Price, and M. C. Thomas. 1962. Pantothenic acidrequirement of the pig as influenced by dietary fat. Fed. Proc. 21:468.
Sewell, R. F., D. Nugara, R. L. Hill, and W. A. Knapp. 1964. VitaminB-6 requirement of early-weaned pigs. J. Anim. Sci. 23:694–699.
Seymour, E. W., V. C. Speer, and V. W. Hays. 1968. Effect of environmen-tal temperature on the riboflavin requirement of young pigs. J. Anim.Sci. 27:389–393.
Sharp, B. A., L. G. Young, and A. A. van Dreumel. 1972a. Dietaryinduction of mulberry heart disease and hepatosis dietetica in pigs. I.Nutritional aspects. Can. J. Comp. Med. 36:371–376.
Sharp, B. A., L. G. Young, and A. A. van Dreumel. 1972b. Effect ofsupplemental vitamin E and selenium in high-moisture corn diets onthe incidence of mulberry heart disease and hepatosis dietetica in pigs.Can. J. Comp. Med. 36:393–397.
Sheffy, B. E., N. Drouliscos, J. K. Loosli, and J. P. Willman. 1954. VitaminA requirements of baby pigs. J. Anim. Sci. 13:999. (Abstr.)
Simesen, M. G., P. T. Jensen, A. Basse, G. Gissel-Nielsen, T. Leth, V.Danielson, and H. E. Nielsen. 1982. Clinico-pathologic findings inyoung pigs fed different levels of selenium, vitamin E and antioxidant.Acta Vet. Scand. 23:295–308.
Simmins, P. H., and P. H. Brooks. 1980. The effect of dietary biotinlevel on the physical characteristics of pig hoof tissue. Anim. Prod.30:469. (Abstr.)
Simmins, P. H., and P. H. Brooks. 1983. Supplementary biotin for sows:Effect on reproductive characteristics. Vet. Rec. 112:425–429.
Simmins, P. H., and P. H. Brooks. 1985. Effect of different levels ofdietary biotin intake on the hoof horn hardness of the gilt. Anim. Prod.40:544–545 (Abstr.).
Southern, L. L., and D. H. Baker. 1981. Bioavailable pantothenic acidin cereal grains and soybean meal. J. Anim. Sci. 53:403–408.
Southern, L. L., D. R. Brown, D. D. Werner, and M. C. Fox. 1986.Excess supplemental choline for swine. J. Anim. Sci. 62:992–996.
Stahly, T.S., N.H. Williams, S.G. Swenson, and R.C. Ewan. 1995. DietaryB vitamin needs of high and moderate lean growth pigs fed from 9 to28 kg body weight. J. Anim. Sci. 73(Suppl. 1):193 (Abstr.).
Stern, M. H., C. D. Robeson, L. Weisler, and J. G. Blaxter. 1947. d-Tocopherol. I. Isolation from soybean oil and properties. J. Am. Chem.Soc. 69:869–874.
Stockland, W. L., and L. G. Blaylock. 1974. Choline requirement ofpregnant sows and gilts under restricted feeding conditions. J. Anim.Sci. 39:1113–1116.
Stothers, S. C., D. A. Schmidt, R. L. Johnston, J. A. Hoefer, and R. W.Luecke. 1955. The pantothenic acid requirement of the baby pig.J. Nutr. 57:47–54.
Strittmatter, J. E., D. J. Ellis, M. G. Hogberg, A. L. Trapp, M. J. Parsons,and E. R. Miller. 1978. Effects of vitamin C on swine growth andosteochondrosis. J. Anim. Sci. 47 (Suppl. 1): 16 (Abstr.).
Suttie, J. W. 1980. The metabolic role of vitamin K. Fed. Proc.39:2730–2735.
Suttie, J. W., and C. M. Jackson. 1977. Prothrombin structure, activationand biosynthesis. Physiol. Rev. 57:1–70.
Sweeney, P. R., and R. G. Brown. 1972. Ultrastructure changes in muscu-lar dystrophy. 1. Cardiac tissue of piglets deprived of vitamin E andselenium. Am. J. Pathol. 68:479–485.
Tanphaichitr, V., and B. Wood. 1984. Thiamin. Present Knowledge inNutrition. Washington, D.C.: The Nutrition Foundation.
Teague, H. S., and A. P. Grifo, Jr. 1966. Vitamin B12 in sow rations.Swine Research. Research Summary 13. Ohio Agricultural ResearchDevelopment Center, Wooster: Ohio State University Press.
Teague, H. S., W. M. Palmer, and A. P. Grifo, Jr. 1970. Pantothenicacid deficiency in the reproducing sow. Ohio Agricultural ResearchDevelopment Center Animal Science Mimeograph 200. Wooster: OhioState University Press.
Terrill, S. W., C. B. Ammerman, D. E. Walker, R. M. Edwards, H. W.Norton, and D. E. Becker. 1955. Riboflavin studies with pigs. J. Anim.Sci. 14:593–603.
Tiege, J., Jr. 1977. The generalized Shwartzman reaction induced by asingle injection of endotoxin in pigs fed a vitamin E-deficient commer-cial diet. Acta Vet. Scand. 18:140–142.
Tiege, J., Jr., and H. J. Nafstad. 1978. Ultrastructure of colonic epithelialcells in vitamin E- and selenium-deficient pigs. Acta Vet. Scand.19:549–560.
Tiege, J., Jr., K. Nordstoga, and J. Aurjo. 1977. Influence of diet onexperimental swine dysentery. I. Effects of vitamin E- and selenium-deficient diet supplemented with 6.8% cod liver oil. Acta Vet.Scand. 18:384–396.
Tiege, J., Jr., F. Saxegaard, and A. Froslie. 1978. Influence of diet onexperimental swine dysentery. 2. Effects of a vitamin E- and selenium-deficient diet supplemented with 3% cod liver oil, vitamin E or sele-nium. Acta Vet. Scand. 19:133–146.
Tollerz, G. 1973. Vitamin E, selenium and some related compounds andtolerance toward iron in piglets. Acta Agric. Scand. Suppl. 19:184–187.
Trapp, A. L., K. K. Keahey, D. L. Whitenack, and C. K. Whitehair. 1970.Vitamin E-selenium deficiency in swine: Differential diagnosis andnature of field problem. J. Am. Med. Assoc. 157:289–300.
Tremblay, G. F., J. J. Matte, L. Lemieux, and G. J. Brisson. 1986. Serumfolates in gestating swine after folic acid addition to diet. J. Anim. Sci.63:1173–1178.
Tribble, L. R., J. D. Hancock, and D. E. Orr, Jr. 1984. Value of supplemen-tal biotin on reproductive performance of sows in confinement. J. Anim.Sci. 59(Suppl. 1):245 (Abstr.).
Ullrey, D. E. 1972. Biological availability of fat-soluble vitamins: VitaminA and carotene. J. Anim. Sci. 35:648–657.
Ullrey, D. E. 1974. The selenium deficiency problem in animal agricul-ture. Pp. 275–293 in Trace Element Metabolism in Animals No. 2,W. G. Hoekstra, J. W. Suttie, H. E. Ganther, and W. Mertz, eds. Balti-more: University Park Press.
Ullrey, D. E. 1981. Vitamin E for swine. J. Anim. Sci. 53:1039–1056.Ullrey, D. E., D. E. Becker, S. W. Terrill, and R. A. Notzold. 1955.
Dietary levels of pantothenic acid and reproductive performance offemale swine. J. Nutr. 57:401–414.
Ullrey, D. E., E. R. Miller, R. D. Struthers, R. E. Peterson, J. A. Hoefer,and H. M. Hall. 1965. Vitamin A activity of fermentation b-carotenefor swine. J. Nutr. 85:375–385.
Ullrey, D. E., E. R. Miller, D. J. Ellis, D. E. Orr, J. P. Hitchcock, K. K.Keahey, and A. L. Trapp. 1971. Vitamin E (selenium and choline),reproduction and MMA. Pp. 48–51 in Report of Swine Research 148,Michigan State University Agricultural Experiment Station. East Lan-sing: Michigan State University Press.
Van Etten, C., N. R. Ellis, and L. L. Madsen. 1940. Studies on thethiamine requirement of young swine. J. Nutr. 20:607–624.
Wahlstrom, R. C., and D. E. Stolte. 1958. The effect of supplementalvitamin D in rations for pigs fed in the absence of direct sunlight.J. Anim. Sci. 17:699–705.
Vitamins 89
Wald, G. 1968. Molecular basis of visual excitement. Science162:230–239.
Washam, R. D., J. E. Sowers, and L. W. DeGoey. 1975. Effect of zinc-proteinate or biotin in swine starter rations. J. Anim. Sci. 40:179. (Abstr.)
Wastell, M. E., D. C. Ewan, M. W. Vorhies, and V. C. Speer. 1972. VitaminE and selenium for growing and finishing pigs. J. Anim. Sci. 34:969–973.
Watkins, K. L., L. L. Southern, and J. E. Miller. 1991. Effect of dietarybiotin supplementation on sow reproductive performance and sound-ness and pig growth and mortality. J. Anim. Sci. 69:201–206.
Webb, N. G., R. H. C. Penny, and A. M. Johnston. 1984. The effect ofa dietary supplement of biotin on pig hoof horn strength and hardness.Vet. Rec. 114:185–189.
Weisman, Y., R. Sapir, A. Harell, and S. Edelstein. 1976. Maternal perina-tal interrelationships of vitamin D metabolism in rats. Biochem. Bio-phys. Acta 428:388–395.
Wellenreiter, R. H., D. E. Ullrey, E. R. Miller, and W. T. Magee. 1969.Vitamin A activity of corn carotenes for swine. J. Nutr. 99:129–136.
Whitehair, C. K., E. R. Miller, M. Loudenslager, and M. G. Hogberg.1984. MMA in sows-A vitamin E-selenium deficiency. J. Anim. Sci. 59(Suppl. 1): 106 (Abstr.).
Whitehead, C. C., D. W. Bannister, and J. P. F. D’Mello. 1980. Bloodpyruvate carboxylase activity as a criterion of biotin status in youngpigs. Res. Vet. Sci. 29:126–128.
Whittle, K. J., P. J. Dunphy, and J. F. Pennock. 1966. The isolation andproperties of d-tocotrienol from Heuca latex. Biochem. J. 100:138–145.
Wiese, A. C., W. P. Lehrer, Jr., P. R. Moore, O. F. Pahnish, and W. V.Hartwell. 1951. Pantothenic acid deficiency in baby pigs. J. Anim.Sci. 10:80–87.
Wilkinson, J. E., M. C. Bell, J. A. Bacon, and F. B. Masincupp. 1977a.Effects of supplemental selenium on swine. I. Gestation and lactation.J. Anim. Sci. 44:224–228.
Wilkinson, J. E., M. C. Bell, J. A. Bacon, and C. C. Melton. 1977b. Effectsof supplemental selenium on swine. II. Growing-finishing. J. Anim.Sci. 44:229–233.
Wilson, M. E., J. E. Pettigrew, L. J. Johnston, J. D. Hawton, J. W. Rust,and H. Chester-Jones. 1991a. Provision of additional B-vitaminsimproves growth rate of weanling pigs. J. Anim. Sci. 69 (Suppl.1):106 (Abstr.).
Wilson, M. E., J. E. Pettigrew, R. D. Walker, H. Chester-Jones, andB. Oeltjenbruns. 1991b. Provision of additional vitamin B12 improvedgrowth rate of weanling pigs. J. Anim. Sci. 69 (Suppl. 1): 359 (Abstr.).
Wilson, M. E., J. E. Pettigrew, L. J. Johnston, and H. Chester-Jones.1992a. Effect of B-vitamin supply upon growth of weanling pigs.J. Anim. Sci. 70 (Suppl. 1):61 (Abstr.).
Wilson, M. E., J. E. Pettigrew, G. C. Shurson, L. J. Johnston, H. Chester-Jones, and J. D. Jones. 1992b. J. Anim. Sci. 70 (Suppl. 1):233 (Abstr.).
Wilson, M. E., M. D. Tokach, R. W. Walker, J. L. Nelssen, R. D. Good-hand, and J. E. Pettigrew. 1993. Influence of high levels of individualB vitamins on starter pig performance. J. Anim. Sci. 71 (Suppl. 1):56(Abstr.).
Wintrobe, M. M., M. H. Miller, R. H. Follis, Jr., H. J. Stein, C. Mushatt,and S. Humphreys. 1942. Sensory neuron degeneration in pigs. IV.
Protection afforded by calcium pantothenate and pyridoxine.J. Nutr. 24:345–366.
Wintrobe, M. M., R. Alcayaga, S. Humphreys, and R. H. Follis, Jr. 1943a.Electrocardiographic changes associated with thiamine deficiency inpigs. Bull. Johns Hopkins Hosp. 73:169.
Wintrobe, M. M., R. H. Follis, Jr., R. Alcayaga, M. Paulson, and S.Humphreys. 1943b. Pantothenic acid deficiency in swine with particularreference to the effects on growth and on the alimentary tract. Bull.Johns Hopkins Hosp. 73:313.
Wintrobe, M. M., R. H. Follis, Jr., M. H. Miller, H. J. Stein, R. Alcayaga,S. Humphreys, A. Suksta, and G. E. Cartwright. 1943c. Pyridoxinedeficiency in swine with particular reference to anemia, epileptiformconvulsions and fatty liver. Bull. Johns Hopkins Hosp. 72:1–25.
Wintrobe, M. M., W. Buschke, R. H. Follis, Jr., and S. Humphreys. 1944.Riboflavin deficiency in swine with special reference to the occurrenceof cataracts. Bull. Johns Hopkins Hosp. 75:102–110.
Wintrobe, M. M., H. J. Stein, R. H. Follis, Jr., and S. Humphreys. 1946.Nicotinic acid and the level of protein intake in the nutrition of thepig. J. Nutr. 30:395–412.
Wolke, R. E., S. W. Nielsen, and J. E. Rousseau. 1968. Bone lesions ofhypervitaminosis A in the pig. Am. J. Vet. Res. 29:1009–1024.
Wood, R. D., C. H. Chaney, D. G. Waddill, and G. W. Garrison. 1967.Effect of adding nitrate or nitrite to drinking water on the utilizationof carotene by growing swine. J. Anim. Sci. 26:510–513.
Wuryastuti, H., H. D Stowe, R. W. Bull, and E. R. Miller. 1993. Effectsof vitamin E and selenium on immune responses of peripheral blood,colostrum, and milk leukocytes of sows. J. Anim. Sci. 71:2464–2472.
Yen, J. T., and W. G. Pond. 1981. Effect of dietary vitamin C additionon performance, plasma vitamin C and hematic iron status in weanlingpigs. J. Anim. Sci. 53:1292–1296.
Yen, J. T., and W. G. Pond. 1983. Response of swine to periparturientvitamin C supplementation. J. Anim. Sci. 56:621–624.
Yen, J. T., and W. G. Pond. 1984. Responses of weanling pigs to dietarysupplementation with vitamin C or carbadox. J. Anim. Sci. 58:132–137.
Yen, J. T., A. H. Jensen, and D. H. Baker. 1976. Assessment of theconcentration of biologically available vitamin B6, in corn and soybeanmeal. J. Anim. Sci. 42:866–870.
Yen, J. T., A. H. Jensen, and D. H. Baker. 1977. Assessment of theavailability of niacin in corn, soybeans and soybean meal. J. Anim.Sci. 45:269–278.
Yen, J. T., R. Lauxen, and T. L. Veum. 1978. Effect of supplementalniacin on finishing pigs fed soybean meal supplemented diets. J. Anim.Sci. 47(Suppl. 1):325. (Abstr.).
Yen, J. T., P. K. Ku, W. G. Pond, and E. R. Miller. 1985. Response todietary supplementation of vitamins C and E in weanling pigs fed lowvitamin E-selenium diets. Nutr. Rep. Int. 31:877–885.
Young, L. G., A. Lun, J. Pos, R. P. Forshaw, and D. Edmeades. 1975.Vitamin E stability in corn and mixed feed. J. Anim. Sci. 40:495–499.
Young, L. G., R. B. Miller, D. E. Edmeades, A. Lun, G. C. Smith, andG. J. King. 1977. Selenium and vitamin E supplementation of high-moisture corn diets for swine reproduction. J. Anim. Sci. 45:1051–1060.
Young, L. G., R. B. Miller, D. E. Edmeades, A. Lun, G. C. Smith, andG. J. King. 1978. Influence of method of corn storage and vitamin Eand selenium supplementation on pig survival and reproduction.J. Anim. Sci. 47:639–647.
6 Water
Although water is an important nutrient, there has beensurprisingly little research conducted on water require-ments of swine since the publication of the previous editionof Nutrient Requirements of Swine (National ResearchCouncil, 1988). In the future, greater emphasis will needto be placed on the water requirements of swine, because insome areas of the world, water is becoming an increasinglyscarce commodity, whereas in others, excessive water usagehas led to problems with slurry disposal (Brooks, 1994).
F UN CT I ON S O F WA TE R
Water fulfills a number of physiological functions neces-sary for life (Roubicek, 1969). It is a major structural ele-ment giving form to the body through cell turgidity, andit plays a crucial role in temperature regulation. The highspecific heat of water makes it indispensable for dispersingthe surplus heat produced during various metabolic pro-cesses. About 580 calories of heat are released when 1 gof water changes from liquid to vapor (Thulin and Brumm,1991). Water is important in the movement of nutrientsto the cells of body tissues and for the removal of wasteproducts from these cells. The high dielectric constant ofwater gives it the ability to dissolve a wide variety of sub-stances and transport these throughout the body via thecirculatory system. In addition, water plays a role in virtu-ally every chemical reaction that takes place in the body.The oxidation of carbohydrates, fats, and proteins all resultin the formation of water. The subsequent metabolism ofthese compounds to yield their energy is achieved througha series of complex reactions that include hydration andhydrolysis. Finally, water is important in the lubricationof joints (i.e., synovial fluid) and in providing protectivecushioning for the nervous system (i.e., cerebral-spinalfluid).
90
The water content of a pig varies with its age. Wateraccounts for as much as 82 percent of the empty bodyweight (whole body weight less gastrointestinal tract con-tents) in a 1.5-kg neonatal pig and declines to 53 percentin a 90-kg market hog (Shields et al., 1983). This changewith age is principally because the fat content of the pigincreases with age and adipose tissue is considerably lowerin its water content than is muscle (Georgievskii, 1982).
W AT ER T UR NO V ER
Swine obtain water from three sources: (1) water thatis consumed; (2) water that is a component of feedstuffs(typically about 10 to 12 percent of air-dry feed); and (3)water that originates from the breakdown of carbohydrate,fat, and protein (metabolic water). The oxidation of 1 kgof fat, carbohydrate, or protein produces 1,190, 560, or450 g of water, respectively (National Research Council,1981). According to Yang et al. (1984), every 1 kg of air-dry feed consumed will produce between 0.38 and 0.48 kg(or L) of metabolic water.
Water is lost from the body by four routes: (1) the lungs(respiration), (2) the skin (evaporation), (3) the intestines(defecation), and (4) the kidneys (urination). Moisture iscontinually lost from the respiratory tract during the normalprocess of breathing. Incoming air is both warmed andmoistened as it passes over the lining of the respiratorytract and is expired at approximately 90 percent saturation(Roubicek, 1969). For pigs in a thermoneutral environment(20°C), respiratory water loss has been estimated to be0.29 and 0.58 L for pigs of 20 and 60 kg body weight(Holmes and Mount, 1967). The degree of loss is affectedby both temperature and relative humidity; water lossincreases with increased temperature and decreases withincreased humidity.

Water 91
Sweating and insensible water loss from the skin are notmajor sources of water loss in swine because the sweatglands are largely dormant. Within the thermoneutral zone,the rate of moisture loss has been estimated to be between12 and 16 g/m2 (Morrison et al., 1967). Increasing theenvironmental temperature from 15 to 30°C increasedwater loss from 7 to 32 g/m2 (Ingram, 1964). However,increased relative humidity had no effect on this loss (Mor-rison et al., 1967).
Significant quantities of water are lost in the feces. Theamount of manure a pig produces per day in confinementranges from 8 to 9 percent of its body weight, with awater content varying from 62 to 79 percent (Brooks andCarpenter, 1993). Water loss through the gut will vary withthe nature of the diet. In general, the greater the proportionof undigested material, the greater the water loss (Maynardet al., 1979). Water loss increases with the level of fiberintake (Cooper and Tyler, 1959) and with intake of feedsthat have laxative properties. Water loss via the feces isalso increased in the case of diarrhea (Thulin andBrumm, 1991).
Urination is the major route of water excretion in swine,although the amount of water excreted in the urine ishighly variable. The kidneys regulate the volume and com-position of body fluids by excreting more or less water,depending on water intake and excretion through othermechanisms. Water excretion is increased when pigs arefed diets that contain greater amounts of minerals andprotein. The larger the amount of protein in the diet,the greater the water loss, and thus the greater the waterrequirement (Wahlstrom et al., 1970). Similarly, increasedintake of salt results in increases in water intake and aconcomitant increase in urinary excretion (Sinclair, 1939).
W AT ER R EQ UI R EM EN T S
Many factors, including environmental ones, govern thewater requirements of swine (National Research Council,1981). The amount of water in a pig’s body at any givenage is relatively constant. Therefore, pigs must consumesufficient water on a daily basis to balance the amount ofwater lost. Any factor known to increase water excretionwill increase water requirements. The minimum require-ment for water is the amount needed to balance waterlosses, produce milk, and form new tissue during growthor pregnancy.
In determining water requirements, care must be takento distinguish between requirements and consumption.True water usage by pigs is usually overestimated becausewastage is generally not taken into account. Based on water-turnover rates measured using tritiated water, waterrequirements of pigs under confined and normal dry feed-ing conditions were estimated to be approximately 120 and
80 mL/kg of body weight for growing (30 to 40 kg) andnon-lactating adult pigs (157 kg), respectively (Yang et al.,1981). However, because of the difficulty in making thesetypes of measurements, water consumption is typicallyused to estimate water requirement.
Suckling Pigs
A common assumption is that suckling pigs do not drinkwater and can completely satisfy their water requirementsby drinking milk, because milk contains 80 percent water.However, suckling pigs, in fact, drink water within 1 or 2days of birth (Aumaitre, 1964). In addition, because milkis a high-protein, high-mineral food, its consumption cancause increased urinary excretion, which might actuallylead to a water deficit (Lloyd et al., 1978). As a conse-quence, research interest in the water requirements ofsuckling pigs has increased recently.
Fraser et al. (1988) measured water use by 51 sucklinglitters during the first 4 days after farrowing. The use variedgreatly among litters, ranging from 0 to 200 mL/day, withan average daily consumption per pig of 46 mL. This levelof intake is considerably higher than that reported in earlierwork, in which average daily water intake per pig was closerto 10 mL. Fraser et al. (1993) speculated that the increasedconsumption levels recorded recently may reflect anincreased emphasis on temperature control in farrowingrooms and that the higher temperatures currently usedmay lead to an increase in moisture loss from the pig.Their data showed almost a fourfold increase in waterconsumption when suckling pigs were housed in rooms at28°C than when housed at 20°C.
Fraser et al. (1988) suggested that providing a supple-mental water supply may help to reduce preweaning mor-tality. They speculated that undernourished pigs, especiallythose housed in warm environments, may be prone todehydration during the first few days after farrowing andthat at least some pigs have the developmental maturityto compensate by drinking water. Exposed water surfaces(e.g., bowls or cups) are superior to nipple drinkers forthis purpose (Phillips and Fraser, 1990, 1991).
After the first week of life, the principal concern regard-ing the water consumption of suckling pigs is the role itplays in stimulating creep feed consumption. Although theconsumption of creep feed by pigs is usually low duringthe first 3 weeks, subsequent feed intake is less if water isnot provided (Friend and Cunningham, 1966). Pig healthis a factor that affects water intake. Pigs with diarrheaconsumed 15 percent less water than healthy pigs (Baran-yiova and Holub, 1993).
Weanling Pigs
Gill et al. (1986) measured the water intake of weanedpigs from 3 to 6 weeks of age. Daily water intake during

92 Nutrient Requirements of Swine
the first, second, and third week after weaning averaged0.49, 0.89, and 1.46 L per pig. The relationship betweenfeed intake and water consumption was described byBrooks et al. (1984) using the following equation.
Water intake (L/day)4 0.149
` (3.053 2 Daily dry feed intake in kg) (6-1)
McLeese et al. (1992) observed two distinct patterns ofwater intake. During the first phase, lasting about 5 daysafter weaning, water intake fluctuated independently ofapparent physiological need and did not seem to be relatedto growth, feed intake, or the severity of diarrhea. In thesecond period, water intake followed a consistent patternthat paralleled growth and feed intake. The authors specu-lated that during the first few days after weaning, waterconsumption might be high so that the pigs could obtaina sense of satiety in the absence of feed intake. Brooks etal. (1984) reported a diurnal pattern to water intake forweaned pigs housed under conditions of constant light,with a higher consumption from 0830 to 1700 hours thanfrom 0700 to 0830 hours.
Nienaber and Hahn (1984) studied the effects of waterflow restriction on the performance of weanling pigs. Theirresults showed little effect on growth when flow rates werevaried between 0.1 and 1.1 L/minute. However, water usewas significantly higher with a more rapid flow rate, whichwas attributed to increased wastage of water. Similarly,water use increased when water nipples were tilted up (at45°) versus down (at 45°) in position (Carlson and Peo,1982). Weanling pigs in pens with water nipples placed inthe down position gained 6.5 percent faster, were 7 percentmore efficient in feed conversion, and used 63 percent lesswater than pigs in pens with water nipples pointing up.There was no advantage in using drip versus non-dripwaterers (Ogunbameru et al., 1991).
Growing-Finishing Pigs
For growing-finishing pigs, free access to water locatednear feed dispensers is advisable, and such access is nor-mally provided for dry feeding systems. The rate (gramsper hour) of digesta or water emptying from the stomachincreases as the water intake increases (Low et al., 1985).This process regulates the dry matter content of the gastricdigesta, particularly during the first hour after feeding.
Factors such as feed intake, ingredients contained in thediet, ambient temperature and humidity, state of health,and stress level affect water requirements. Water consump-tion generally has a positive relationship with feed intakeand body weight (Evvard, 1929). The minimum require-ment for pigs between 20 and 90 kg body weight is approxi-mately 2 kg of water for each kg of feed. The voluntarywater intake of growing pigs allowed to consume feed ad
libitum is approximately 2.5 kg of water for each kg of feedwhile pigs receiving restricted amounts of feed have beenreported to consume 3.7 kg of water per kg of feed (Cumby,1986). The difference between ad libitum and restrictedfed pigs might be due to the tendency of pigs to fill them-selves with water if their appetite is not satisfied by theirfeed allowance.
Braude et al. (1957) gave 79 pigs unrestricted dry feedup to 3 kg/pig daily and free access to water. From 10 to22 weeks of age, the water-to-feed ratio averaged 2.56:1.From 16 to 18 weeks of age, the maximum average dailyintakes of water and feed were 7.0 and 2.7 kg/pig,respectively.
Olsson and Andersson (1985), using nose-operateddrinking devices, concluded that water consumption atfeeding for growing-finishing pigs has a distinct periodicity,with a peak at the beginning and end of the feeding period.Water consumption between feeding periods peaked2 hours after the morning feeding and 1 hour after theafternoon feeding. These results support the conclusionsof Yang et al. (1984) that growing pigs have a tendency,when feed intake is restricted, to increase the total wateringested, possibly because of a desire for abdominal fill.In general, their results suggest that if feed access wasrestricted, water for abdominal fill was taken during theafternoon.
Barber et al. (1988) studied the effect of water deliveryrate and number of drinking nipples on the water useof growing pigs. A high (900 mL/minute) delivery rateincreased water use (3.8 L/day) compared with a low (300mL/minute) delivery rate (1.9 L/day). However, pig perfor-mance was not affected. Increasing the number of nipplesper pen (eight pigs per pen) from one to two had no effecton either water use or pig performance.
Mount et al. (1971) reported little difference in waterconsumption by growing pigs kept at temperatures of 7, 9,12, 20, or 22°C, although there was considerable variationamong pigs at any one temperature. However, at 30 and33°C, the intake of water increased considerably. At 30°Cand above, Close et al. (1971) observed behavioralresponses to increased temperature. Urine and feces werevoided over the whole pen area, and water was spilledfrom the water bowl presumably in an attempt to cool thepig’s body surface.
The temperature of the water itself will affect intakebecause additional energy is required to warm liquids con-sumed at temperatures below that of the body. In an Aus-tralian study, pigs were reared from 45 to 90 kg body weightin either a cool room where the temperature was main-tained at a constant 22°C or in a hot room where thetemperature alternated from 35 to 24°C every 12 hours(Vajrabukka et al., 1981). Pigs kept in the cool room drank3.3 L daily when the water was cooled to 11°C, comparedwith almost 4.0 L when the water was warmed to 30°C.
Water 93
In contrast, pigs kept in the hot room drank 10.5 L whenthe water was supplied at 11°C, but only 6.6 L when itwas supplied at 30°C.
Hagsten and Perry (1976) reported reductions in waterconsumption and daily weight gain of 20 and 38 percent,respectively, when growing pigs were fed a diet containingless than 0.20 percent total salt (NaCl) or salt equivalent.
Use of antibiotics may also affect water consumption;some researchers report an increase in consumption,whereas others have reported a decrease. It has beenhypothesized that the effect of antibiotics on water demandwill depend on the relative extent to which water loss isreduced by the control of diarrhea and water demand isincreased to enable renal clearance of the antibiotic or itsresidues (Brooks and Carpenter, 1993).
Bowland and Standish (1966) found that withholdingaccess to water for 24 hours before slaughter restrictedfeed intake and resulted in body weight loss and apparentcarcass shrinkage of 5.5 percent and 1.9 kg, respectively.
In wet feeding systems, water-to-feed ratios rangingfrom 1.5:1 to 3.0:1 seemed to have little effect on theperformance or carcass quality of growing-finishing swine(Barber et al., 1963; Holme and Robinson, 1965). However,pigs fed with wet feeding systems should be given accessto an additional source of fresh water to ensure adequatewater intake in case of sudden changes in barn temperatureor unexpected alterations in feed composition (e.g., highsalt or protein levels).
Gestating Sows
The water intake of pregnant gilts increases in proportionto dry matter intake (Friend, 1971). For unbred gilts, feedand water intake diminished during estrus (Friend, 1973;Friend and Wolynetz, 1981). Nonpregnant gilts consumed11.5 L of water daily, whereas gilts in advanced pregnancyconsumed 20 L (Bauer, 1982). These quantities are similarto the values of 13.5 L (Riley, 1978) and 10.0 L (Lightfootand Armsby, 1984). The practice of feed or water depriva-tion before or after weaning as a means of reducing theweaning-to-breeding interval in sows is not well supportedby research evidence (Knabe et al., 1986). According toMadec (1984), urinary disorders are quite common in sows,and low water intake is strongly implicated. Pregnant sowsgiven restricted levels of feed intake may show a desire tocompensate for inadequate gut fill by an enhanced waterintake. Increasing the fiber content of gestation diets islikely to increase the required ratio of water-to-feed.
Lactating Sows
Lactating sows need considerable amounts of water, notonly to replace the 8 to 16 kg of daily milk secreted butalso to void large amounts of metabolic end products in
the urine. Daily water consumption for lactating sows wasshown to vary from 12 to 40 L/day, with a mean of 18 L/day (Lightfoot, 1978). These quantities are similar to otherrecorded values for the daily water intake of lactating sowsof 20 L (Bauer, 1982), 25.1 L (Riley, 1978), and 17.7 L(Lightfoot and Armsby, 1984).
Phillips et al. (1990) observed no difference in waterconsumption between sows housed in crates with high(2 L/minute) versus low (0.6 L/minute) flow rates of nippledrinkers. Similarly, the height of the nipple drinkers abovethe floor (600 mm versus 300 mm) did not affect waterconsumption patterns.
Boars
There are few data on the water requirements of boars,but free access to water is advisable. Straub et al. (1976)observed water intakes in boars (70 to 110 kg) of up to15 L/day at 25°C compared with about 10 L/day at 15°C.
W AT ER Q UA LI T Y
Elements and substances can occur in water at levelsthat are harmful to pigs (National Research Council, 1974).Water may contain a variety of microorganisms, includingboth bacteria and viruses. Of the former, Salmonella, Lep-tospira, and Escherichia coli are the most commonlyencountered (Fraser et al., 1993). Water can also carrypathogenic protozoa as well as eggs or cysts of intestinalworms. Whether the presence of these microorganismswill be detrimental is largely dependent on the specifictypes found and their concentration. The Bureau ofNational Affairs (1973) proposed that water used for live-stock should not contain more than 5,000 coliforms/100 mL. However, this recommendation can be consideredas only a guide because some pathogens may be harmfulbelow this level, whereas other, more benign microorgan-isms can be tolerated at much higher levels. Bacterial con-tamination is usually more common in surface waters thanin underground supplies such as deep wells and artesianwater.
Total dissolved solids (TDS) is a measure of the totalinorganic matter dissolved in a sample of water. Calcium,magnesium, and sodium in the bicarbonate, chloride, orsulfate form are the most common salts found in water witha high TDS (Thulin and Brumm, 1991). Water containing.6,000 ppm TDS may cause temporary diarrhea andincreased daily water intake, although health and perfor-mance are not usually affected. Paterson et al. (1979)offered water containing 5,060 ppm TDS to gilts and sowsand reported no significant effects on reproduction. Theaddition of up to 6,000 ppm TDS to water offered toweaned pigs resulted in no effect on growth or feed effi-

94 Nutrient Requirements of Swine
ciency. However, increases in water intake were reportedalong with temporary mild diarrhea and less firm feces forpigs offered the higher TDS levels in their water (Andersonand Stothers, 1978; Paterson et al., 1979).
Total dissolved solids is an inexact measure of waterquality. As a general rule, water containing ,1,000 ppmTDS should be safe, whereas water containing .7,000ppm TDS may present a health risk for pregnant or lactat-ing sows or for stressed pigs and should not be offered toswine for consumption (National Research Council, 1974).Between 1,000 and 7,000 ppm is a gray area, with someproducers reporting economic loss at levels well below7,000 ppm, whereas others experience transient or minorinconvenience at worst. Since so many different elementscan contribute to a high TDS, further chemical analysisshould be conducted on such water to determine whetherthe soluble minerals present represent a health risk. How-ever, the values in Table 6-1 can be used as a guide.
The pH of water has little direct relevance to waterquality, because almost all samples fall within the accept-able range of 6.5 to 8.5 (Fraser et al., 1993). However,alterations in pH can have a major impact on chemicalreactions involved in the treatment of water. High waterpH impairs the efficiency of chlorination, and low waterpH may cause precipitation of some antibacterial agentsdelivered via the water system. Sulfonamides particularlypose a risk (Russell, 1985) and could lead to potentialproblems with carcass sulfa residues, because precipitatedmedication in the water lines may leach back into the waterafter medication has been terminated.
Water hardness is caused by multivalent metal cations,principally calcium and magnesium. Water is consideredsoft if hardness is ,60 ppm, hard between 120 and 180ppm, and very hard .180 ppm (Durfor and Becker, 1964).Even very hard water rarely causes problems for swine(National Research Council, 1980), although it does resultin the accumulation of scale in water delivery systems. Ifthis impairs water availability, problems can arise. In one
TABLE 6-1 Evaluation of Water Quality for PigsBased on Total Dissolved Solids
TotalDissolvedSolids(ppm) Rating Comment
,1,000 Safe No risk to pigs.1,000 to 2,999 Satisfactory Mild diarrhea in pigs not adapted
to it.3,000 to 4,999 Satisfactory May cause temporary refusal of
water.5,000 to 6,999 Reasonable Higher levels for breeding stock
should be avoided..7,000 Unfit Risky for breeding stock and pigs
exposed to heat stress.
SOURCE: Adapted from National Research Council, 1974
survey, excessively hard water from one region in Quebec,Canada was found to supply as much as 29 percent of agestating sow’s daily requirement for calcium (Filpot andOuellet, 1988).
Sulfates are the primary cause of water quality problemsin well water in many regions of North America. A recentsurvey conducted on the Canadian prairies indicated that25 percent of wells contained excessive (.1,000 ppm)quantities of sulfates (McLeese et al., 1991). Sulfates arenot well tolerated in the gut of the pig, resulting in diarrheaand reduced performance when levels are .7,000 ppm(Anderson et al., 1994). However, lower levels (2,650 ppm)have no detrimental effect on pig performance (Maenz etal., 1994). It would seem that pigs can adapt to elevatedsulfate levels within a few weeks of exposure. This explainswhy weanling pigs are most susceptible to sulfates becausethey consume little water before weaning and, as a conse-quence, are not adapted. In addition, water odor is notnecessarily an indication of poor quality water. Despite adistinct ‘‘rotten egg’’ smell, water containing 1,900 ppmsulfates did not affect pig performance (DeWit et al., 1987).
Heavy applications of nitrogenous fertilizers to land andcontamination of runoff water by animal wastes can raisenitrate concentrations in water supplies to exceedingly highlevels. Nitrites impair the oxygen-carrying capacity of theblood by reducing hemoglobin to methemoglobin. Winkset al. (1950) found that conversion of nitrate to nitrite inthe water was necessary for toxicity to occur. They reportedmortality in swine with access to well water containing 290to 490 ppm of nitrate nitrogen. However, Seerley et al.(1965) considered it unlikely that sufficient nitrite wouldbe formed and consumed in water alone to cause toxicityin swine unless the initial level of nitrate exceeds 300 ppmof nitrate nitrogen. Nitrite nitrogen levels greater than 10ppm are cause for concern (Task Force on Water QualityGuidelines, 1987). Nitrates and nitrites in water also mayimpair the use of vitamin A by the pig (Wood et al., 1967).Additional ions may be occasionally found in water samples.Safety guidelines are provided in Table 6-2.
In situations where poor quality water exists, it is essen-tial to determine its impact on animal performance. Often,producers are overly concerned about the diarrhea in situa-tions where animal performance is not impaired. However,when poor water quality reduces performance, there are anumber of things that can be done to alleviate the problem.
Chlorination disinfects and destroys disease-causingmicroorganisms. Protozoa and enteroviruses are muchmore resistant to chlorination than are bacteria (Fraser etal., 1993). The effectiveness of disinfection and the quantityof chlorine required in the water depends on the quantityof nitrites, iron, hydrogen sulfide, ammonia, and organicmatter in the water. The presence of organic matter in thewater converts the free chlorine to chloramines, which haveless disinfecting action. Sodium hypochlorite or laundry
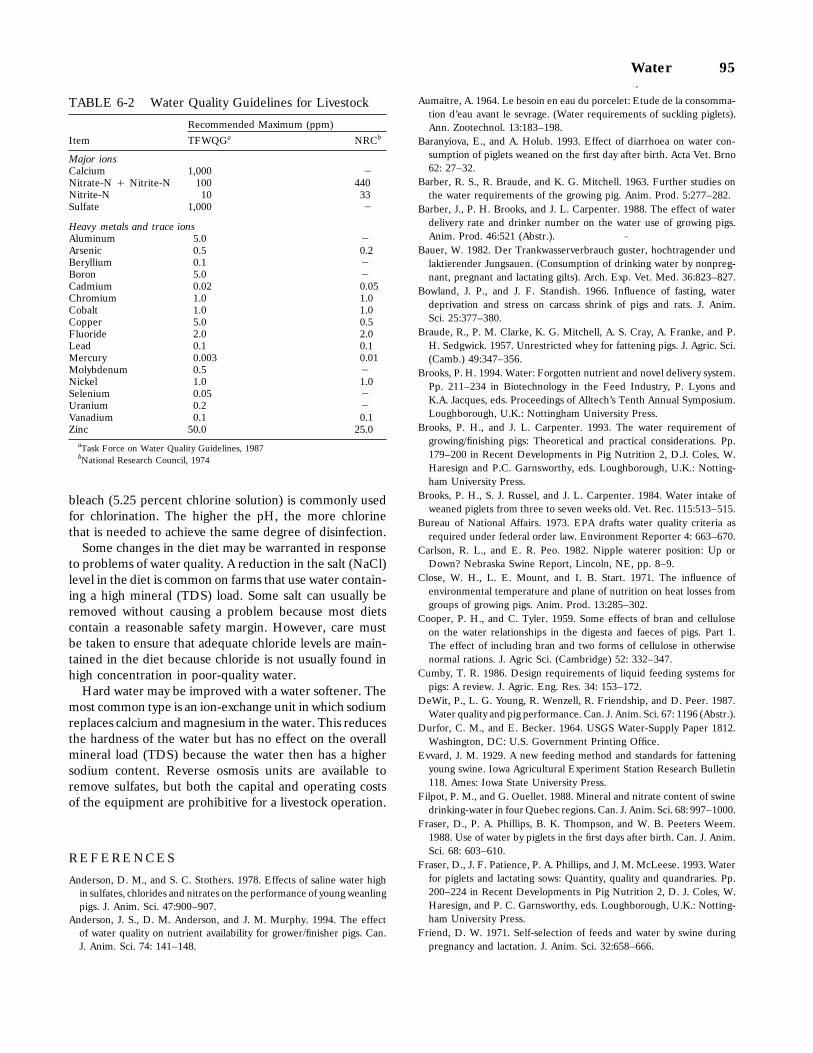
Water 95
TABLE 6-2 Water Quality Guidelines for Livestock
Recommended Maximum (ppm)Item TFWQGa NRCb
Major ionsCalcium 1,000 1Nitrate-N ` Nitrite-N 100 440Nitrite-N 10 33Sulfate 1,000 1
Heavy metals and trace ionsAluminum 5.0 1Arsenic 0.5 0.2Beryllium 0.1 1Boron 5.0 1Cadmium 0.02 0.05Chromium 1.0 1.0Cobalt 1.0 1.0Copper 5.0 0.5Fluoride 2.0 2.0Lead 0.1 0.1Mercury 0.003 0.01Molybdenum 0.5 1Nickel 1.0 1.0Selenium 0.05 1Uranium 0.2 1Vanadium 0.1 0.1Zinc 50.0 25.0
aTask Force on Water Quality Guidelines, 1987bNational Research Council, 1974
bleach (5.25 percent chlorine solution) is commonly usedfor chlorination. The higher the pH, the more chlorinethat is needed to achieve the same degree of disinfection.
Some changes in the diet may be warranted in responseto problems of water quality. A reduction in the salt (NaCl)level in the diet is common on farms that use water contain-ing a high mineral (TDS) load. Some salt can usually beremoved without causing a problem because most dietscontain a reasonable safety margin. However, care mustbe taken to ensure that adequate chloride levels are main-tained in the diet because chloride is not usually found inhigh concentration in poor-quality water.
Hard water may be improved with a water softener. Themost common type is an ion-exchange unit in which sodiumreplaces calcium and magnesium in the water. This reducesthe hardness of the water but has no effect on the overallmineral load (TDS) because the water then has a highersodium content. Reverse osmosis units are available toremove sulfates, but both the capital and operating costsof the equipment are prohibitive for a livestock operation.
R EF ER E NC ES
Anderson, D. M., and S. C. Stothers. 1978. Effects of saline water highin sulfates, chlorides and nitrates on the performance of young weanlingpigs. J. Anim. Sci. 47:900–907.
Anderson, J. S., D. M. Anderson, and J. M. Murphy. 1994. The effectof water quality on nutrient availability for grower/finisher pigs. Can.J. Anim. Sci. 74: 141–148.
Aumaitre, A. 1964. Le besoin en eau du porcelet: E´tude de la consomma-
tion d’eau avant le sevrage. (Water requirements of suckling piglets).Ann. Zootechnol. 13:183–198.
Baranyiova, E., and A. Holub. 1993. Effect of diarrhoea on water con-sumption of piglets weaned on the first day after birth. Acta Vet. Brno62: 27–32.
Barber, R. S., R. Braude, and K. G. Mitchell. 1963. Further studies onthe water requirements of the growing pig. Anim. Prod. 5:277–282.
Barber, J., P. H. Brooks, and J. L. Carpenter. 1988. The effect of waterdelivery rate and drinker number on the water use of growing pigs.Anim. Prod. 46:521 (Abstr.).
Bauer, W. 1982. Der Tra¨nkwasserverbrauch gu
¨ster, hochtragender und
laktierender Jungsauen. (Consumption of drinking water by nonpreg-nant, pregnant and lactating gilts). Arch. Exp. Vet. Med. 36:823–827.
Bowland, J. P., and J. F. Standish. 1966. Influence of fasting, waterdeprivation and stress on carcass shrink of pigs and rats. J. Anim.Sci. 25:377–380.
Braude, R., P. M. Clarke, K. G. Mitchell, A. S. Cray, A. Franke, and P.H. Sedgwick. 1957. Unrestricted whey for fattening pigs. J. Agric. Sci.(Camb.) 49:347–356.
Brooks, P. H. 1994. Water: Forgotten nutrient and novel delivery system.Pp. 211–234 in Biotechnology in the Feed Industry, P. Lyons andK.A. Jacques, eds. Proceedings of Alltech’s Tenth Annual Symposium.Loughborough, U.K.: Nottingham University Press.
Brooks, P. H., and J. L. Carpenter. 1993. The water requirement ofgrowing/finishing pigs: Theoretical and practical considerations. Pp.179–200 in Recent Developments in Pig Nutrition 2, D.J. Coles, W.Haresign and P.C. Garnsworthy, eds. Loughborough, U.K.: Notting-ham University Press.
Brooks, P. H., S. J. Russel, and J. L. Carpenter. 1984. Water intake ofweaned piglets from three to seven weeks old. Vet. Rec. 115:513–515.
Bureau of National Affairs. 1973. EPA drafts water quality criteria asrequired under federal order law. Environment Reporter 4: 663–670.
Carlson, R. L., and E. R. Peo. 1982. Nipple waterer position: Up orDown? Nebraska Swine Report, Lincoln, NE, pp. 8–9.
Close, W. H., L. E. Mount, and I. B. Start. 1971. The influence ofenvironmental temperature and plane of nutrition on heat losses fromgroups of growing pigs. Anim. Prod. 13:285–302.
Cooper, P. H., and C. Tyler. 1959. Some effects of bran and celluloseon the water relationships in the digesta and faeces of pigs. Part 1.The effect of including bran and two forms of cellulose in otherwisenormal rations. J. Agric Sci. (Cambridge) 52: 332–347.
Cumby, T. R. 1986. Design requirements of liquid feeding systems forpigs: A review. J. Agric. Eng. Res. 34: 153–172.
DeWit, P., L. G. Young, R. Wenzell, R. Friendship, and D. Peer. 1987.Water quality and pig performance. Can. J. Anim. Sci. 67: 1196 (Abstr.).
Durfor, C. M., and E. Becker. 1964. USGS Water-Supply Paper 1812.Washington, DC: U.S. Government Printing Office.
Evvard, J. M. 1929. A new feeding method and standards for fatteningyoung swine. Iowa Agricultural Experiment Station Research Bulletin118. Ames: Iowa State University Press.
Filpot, P. M., and G. Ouellet. 1988. Mineral and nitrate content of swinedrinking-water in four Quebec regions. Can. J. Anim. Sci. 68: 997–1000.
Fraser, D., P. A. Phillips, B. K. Thompson, and W. B. Peeters Weem.1988. Use of water by piglets in the first days after birth. Can. J. Anim.Sci. 68: 603–610.
Fraser, D., J. F. Patience, P. A. Phillips, and J. M. McLeese. 1993. Waterfor piglets and lactating sows: Quantity, quality and quandraries. Pp.200–224 in Recent Developments in Pig Nutrition 2, D. J. Coles, W.Haresign, and P. C. Garnsworthy, eds. Loughborough, U.K.: Notting-ham University Press.
Friend, D. W. 1971. Self-selection of feeds and water by swine duringpregnancy and lactation. J. Anim. Sci. 32:658–666.
96 Nutrient Requirements of Swine
Friend, D. W. 1973. Self-selection of feeds and water by unbred gilts.J. Anim. Sci. 37:1137–1141.
Friend, D. W., and H. M. Cunningham. 1966. The effect of water con-sumption on the growth, feed intake, and carcass composition of suck-ling piglets. Can. J. Anim. Sci. 46:203–209.
Friend, D. W., and M. S. Wolynetz. 1981. Self-selection of salt by giltsduring pregnancy and lactation. Can. J. Anim. Sci. 61:429–438.
Georgievskii, V. I. 1982. Water metabolism and the animal’s waterrequirements. Pp. 79–89 in Mineral Nutrition of Animals, V. I. Geor-gievskii, B. N. Annenkov, and V. I. Samokhin, eds. London:Butterworths.
Gill, B. P., P. H. Brooks, and J. L. Carpenter. 1986. The water intake ofweaned pigs from 3 to 6 weeks of age. Anim. Prod. 42: 470 (Abstr.).
Hagsten, I., and T. W. Perry. 1976. Evaluation of dietary salt levels forswine. 1. Effect on gain, water consumption and efficiency of feedconversion. J. Anim. Sci. 42:1187–1190.
Holme, D. W., and K. L. Robinson. 1965. A study of water allowancesfor the bacon pig. Anim. Prod. 7:377–384.
Holmes, C. W., and L. E. Mount. 1967. Heat loss from groups of growingpigs under various conditions of environmental temperature and airmovement. Anim. Prod. 9: 435–452.
Ingram, D. L. 1964. The effect of environmental temperature on heatloss and thermal insulation in the young pig. Res. Vet. Sci. 5: 357–364.
Knabe, D. A., T. J. Prince, and D. E. Orr, Jr. 1986. Effect of feed and(or) water deprivation prior to weaning on reproductive performanceof sows: A cooperative study. J. Anim. Sci. 62:1–8.
Lightfoot, A. L. 1978. Water consumption of lactating sows. Anim. Prod.26: 386 (Abstr.).
Lightfoot, A. L., and A. W. Armsby. 1984. Water consumption and slurryproduction of dry and lactating sows. Anim. Prod. 38:541. (Abstr.)
Lloyd, L. E., B. E. McDonald, and E. W. Crampton. 1978. Water andits metabolism. Pp. 22–34 in Fundamentals of Nutrition, 2nd Edition.San Francisco: W. H. Freeman and Co.
Low, A. G., R. T. Pittman, and R. J. Elliott. 1985. Gastric emptying ofbarley-soya-bean diets in the pig: Effects of feeding level, supplemen-tary maize oil, sucrose or cellulose, and water intake. Br. J. Nutr.54:437–447.
Madec, F. 1984. Urinary disorders in intensive pig herds. Pig NewsInfo. 5:89–93.
Maenz, D. D., J. F. Patience, and M. S. Wolynetz. 1994. The influenceof the mineral level in drinking water and thermal environment on theperformance and intestinal fluid flux of newly-weaned pigs. J. Anim.Sci. 72: 300–308.
Maynard, L. A., J. K. Loosli, H.F. Hintz, and R. G. Warner. 1979. AnimalNutrition. 7th ed. New York: McGraw-Hill.
McLeese, J. M., J. F. Patience, M. S. Wolynetz, and G. I. Christison.1991. Evaluation of the quality of ground water supplies used onSaskatchewan swine farms. Can. J. Anim. Sci. 71: 191–203.
McLeese, J. M., M. L. Tremblay, J. F. Patience, and G. I. Christison.1992. Water intake patterns in the weanling pig: Effect of water quality,antibiotics and probiotics. Anim. Prod. 54: 135–142.
Morrison, S. R., T. E. Bond, and H. Heitman. 1967. Skin and lungmoisture loss from swine. Trans. Amer. Soc. Agric. Eng. 10: 691–697.
Mount, L. E., C. W. Holmes, W. H. Close, S. R. Morrison, and I. B.Start. 1971. A note on the consumption of water by the growing pigat several environmental temperatures and levels of feeding. Anim.Prod. 13:561–563.
National Research Council. 1974. Nutrient and Toxic Substances in Waterfor Livestock and Poultry. Washington, DC: National Academy Press.93 pp.
National Research Council. 1980. Mineral Tolerance of Domestic Ani-mals. Washington, D.C.: National Academy Press.
National Research Council. 1981. Water-environment interactions. Pp.39–50 in Effect of Environment on Nutrient Requirements of Domes-tic Animals. Washington, DC: National Academy Press.
National Research Council. 1988. Nutrient Requirements of Swine, 9thed. Washington, DC: National Academy Press. 93 pp.
Nienaber, J. A., and G. L. Hahn. 1984. Effects of water flow restrictionand environmental factors on performance of nursery-age pigs. J. Anim.Sci. 59:1423–1429.
Ogunbameru, B. O., E. T. Kornegay, and C. M. Wood. 1991. A comparisonof drip and non-drip nipple waters used by weanling pigs. Can. J. Anim.Sci. 71: 581–583.
Olsson, O., and T. Andersson. 1985. Biometric considerations whendesigning value drinking systems for growing-finishing pigs. Acta Agric.Scand. 35: 55–66.
Paterson, D. W., R. C. Wahlstrom, G. W. Libal, and O. E. Olson. 1979.Effects of sulfate in water on swine reproduction and young pig perfor-mance. J. Anim. Sci. 49:664–667.
Phillips, P. A., and D. Fraser. 1990. Water bowl size for newborn pigs.Appl. Eng. Agric. 6: 79–81.
Phillips, P. A., and D. Fraser. 1991. Discovery of selected water dispensersby newborn pigs. Can. J. Anim. Sci. 71: 233–236.
Phillips, P. A., D. Fraser, and B. K. Thompson. 1990. The influence ofwater nipple flow rate and position and room temperature on sowwater intake and spillage. Appl. Eng. Agric. 6: 75–78.
Riley, J. E. 1978. Drinking ‘‘straws’’: A method of watering housed sowsduring pregnancy and lactation. Anim. Prod. 26:386 (Abstr.).
Russell, I. D. 1985. Some fundamentals of water medications. Poult.Digest 44: 422–423.
Seerley, R. W., R. J. Emerick, L. B. Emery, and O. E. Olson. 1965.Effect of nitrate or nitrite administered continuously in drinking waterfor swine and sheep. J. Anim. Sci. 24:1014–1019.
Shields, R. G., Jr., D. C. Mahan, and P. L. Graham. 1983. Changes inswine body composition from birth to 145 kg. J. Anim. Sci. 57:43–54.
Sinclair, R. D. 1939. The salt requirements of growing pigs. Sci. Agri.20: 109–119.
Straub, G., J. H. Weniger, E. S. Tawfik, E. S., and D. Steinhauf. 1976.The effects of high environmental temperatures on fattening perfor-mance and growth of boars. Livest. Prod. Sci. 3: 65–74.
Task Force on Water Quality Guidelines. 1987. Livestock watering. Pp.4-23–4-37 in Canadian Water Quality Guidelines. Inland Waters Direc-torate, Ottawa, Ontario.
Thulin, A. J., and M. C. Brumm. 1991. Water: The forgotten nutrient.Pp. 315–324 in Swine Nutrition, E.R. Miller, D.E. Ullrey and A.J.Lewis, eds.. Stoneham, MA: Butterworth-Heinemann.
Vajrabukka, C., C. J. Thwaites, and D. J. Farrell. 1981. Overcoming theeffects of high temperature on pig growth. Pp. 99–114 in RecentAdvances in Animal Nutrition in Australia, D. J. Farrell and P. Vohra,eds. University of New England Publishing Unit, Armidale, Australia.
Wahlstrom, R. C., A. R. Taylor, and R. W. Seerley. 1970. Effects of lysinein the drinking water of growing swine. J. Anim. Sci. 30: 368–373.
Winks, W. R., A. K. Sutherland, and R. M. Salisbury. 1950. Nitritepoisoning of pigs. Queensl. J. Agric. Sci. 7:1–14.
Wood, R. D., C. H. Chaney, D. G. Waddill, and G. W. Garrison. 1967.Effect of adding nitrate or nitrite to drinking water on the utilizationof carotene by growing swine. J. Anim. Sci. 26: 510–513.
Yang, T. S., B. Howard, and W. V. McFarlane. 1981. Effects of food ondrinking behaviour of growing pigs. Appl. Anim. Ethol. 7: 259–270.
Yang, T. S., M. A. Price, and F. X. Aherne. 1984. The effect of levelof feeding on water turnover in growing pigs. Appl. Anim. Behav.Sci. 12:103–109.
Nonnutritive7 Feed Additives
Nonnutrient feed additives are commonly included inswine diets. Of these, the antimicrobial agents are theadditives most commonly used. Antimicrobial agents, alongwith anthelmintics, are defined as ‘‘drugs’’ by the Foodand Drug Administration (FDA). Thus, their usage levels,allowable combinations, and periods of withdrawal priorto slaughter are regulated by the FDA and are publishedannually in the Feed Additive Compendium (1998). Inaddition, certain other additives are sometimes includedin swine diets. The Association of American Feed ControlOfficials (1998) has established guidelines for the use ofmany of these products in animal feeds.
A DD IT I VE S
Antimicrobial Agents
These are compounds that suppress or inhibit the growthof microorganisms. This class of compounds includes theantibiotics (naturally occurring substances produced byyeasts, molds, and other microorganisms) and the chemo-therapeutics (chemically synthesized substances). They areadded to feed at low (subtherapeutic) levels for growthpromotion, improvement of feed utilization, reduction ofmortality and morbidity, and improvement of reproductiveperformance. Antimicrobial agents also are used at moder-ate-to-high (prophylaxis) levels for the prevention of dis-ease in exposed animals, and at high (therapeutic) levelsfor the treatment of certain swine diseases. Currently, 17antimicrobial agents are approved for use in swine feed(Feed Additive Compendium, 1998). Of these, eightrequire withdrawal from the feed (on schedules rangingfrom 5 to 70 days) before animals are slaughtered, andnine do not require a withdrawal period.
The efficacy of antimicrobials in improving the rate andefficiency of growth in pigs is well documented, as reviewed
97
by Hays (1978), Zimmerman (1986), and Cromwell (1991).A summary of 1,194 experiments involving 32,555 pigsindicated that antimicrobials improved growth rate by 16.4percent in weanling pigs (7 to 25 kg body weight), by 10.6percent in growing pigs (17 to 49 kg), and by 4.2 percentin growing-finishing pigs (24 to 89 kg) (Hays, 1978; Zim-merman, 1986). Improvements in efficiency of feed utiliza-tion for these same groups were 6.9, 4.5, and 2.2 percent,respectively. Responses in pig growth to the feeding ofantimicrobials are greater under field conditions than incontrolled experiments at research stations (Cromwell,1991). A summary of 67 field trials with young pigs indi-cated that the feeding of antimicrobials reduced mortalityby one half (4.3 versus 2.0 percent), with even greaterreductions in mortality when disease levels were high (15.6versus 3.1 percent) (Maddox, 1985).
Antibacterial agents also are effective in improvingreproductive performance (Cromwell, 1991). A summaryof nine experiments (1,931 sows) indicated that farrowingrate was improved from 75.4 percent in controls to 82.1percent in treated sows, and the number of live pigs bornwas increased from 10.0 to 10.4, respectively, when antimi-crobials were included in the diet at the time of breeding.In 11 experiments (2,105 sows), inclusion of antimicrobialsin the lactation diet increased survival of pigs to weaning(84.9 versus 87.1 percent of pigs born alive) and pig wean-ing weights (4.65 versus 4.70 kg).
Although the mechanism of action of antimicrobials isnot well understood, their effects are generally groupedinto three categories: a metabolic effect, a nutritionaleffect, and a disease-control effect. The first effect impliesthat these compounds directly influence certain metabolicprocesses in the animal (e.g., increased rate of proteinsynthesis). The second effect implies that antimicrobialscause changes in the microbial population that result inincreased utilization of nutrients by the host animal. Thiseffect is supported by evidence that antimicrobials reduce
98 Nutrient Requirements of Swine
intestinal wall thickness (thus improving absorption ofnutrients), and that they reduce total gut mass (thus reduc-ing heat loss from tissues with high metabolic activity).Most of the data support the disease control effect as theprimary mode of action. This effect implies that antimicro-bials suppress microorganisms that cause nonspecific, sub-clinical disease, thereby allowing the host animal to achievea growth rate closer to its maximum potential. This sug-gested mechanism of action is supported by the greaterresponse to antimicrobials that occurs in young versus olderpigs, in a ‘‘dirty’’ versus ‘‘clean’’ environment, and in low-health versus high-health animals.
Anthelmintics
This class of drugs, also called ‘‘dewormers,’’ is includedin feed to control internal parasites (e.g., roundworms,lungworms, threadworms). One drug, ivermectin, also iseffective as a systemic for the control of external parasites(lice and mange). Of the seven anthelmintics currentlyapproved for swine, five have specified withdrawal periodsbefore slaughter (24 hours to 30 days) and two have nowithdrawal period (Feed Additive Compendium, 1998).One compound in this group, dichlorvos, has been shown toreduce the incidence of stillbirths and increase pig weaningweights (Siers et al., 1976; Young et al., 1979) and mayplay a role in the immune response (Murray, 1983).
Microbial Supplements
Microbials that are directly fed, once referred to as ‘‘pro-biotics,’’ consist of live (viable), naturally occurring micro-organisms such as Lactobacillus acidophilus, Streptococcusfaecium, and Saccharomyces cerevisiae. The suggestedaction of these supplements is that they enhance the intesti-nal microbial balance in the host animal. In some instances,these products have been reported to benefit pig perfor-mance under field conditions, generally under high-stressconditions (Pollmann, 1986; Stavric and Kornegay, 1995);however, most controlled experiments at research stationshave failed to show consistent, beneficial responses fromtheir inclusion. A review of these products was written byvan Belle et al. (1990).
Oligosaccharides
Inclusion of certain oligosaccharides (e.g., mannooligo-saccharides, fructooligosaccharides) in the diet has beenproposed to alter the ability of specific pathogens to colo-nize the intestinal tract (Monsand and Paul, 1995; New-man, 1995). The effect of oligosaccharides on performanceof pigs is not well established. Some reports have showna benefit in performance of young pigs from fructooligosac-charide inclusion (Hidaka et al., 1986; Fukuyasu and
Oshida, 1988), whereas others have not (Farnworth et al.,1991, 1992, 1995; Kornegay et al., 1992).
Enzymes
Mixtures of cellulases, hemicellulases, and proteases aresometimes added to feeds in an attempt to improve thedigestibility of complex carbohydrates and proteins. Theyare more commonly used in Europe, where diets are com-posed of a more diverse group of feedstuffs, than in NorthAmerica, where diets tend to be based on corn or grainsorghum and soybean meal. Some research has shownthese enzymes to be beneficial (Wenk, 1992). In areaswhere barley or rye is used, b-glucanase and pentosanasessometimes are included to degrade the b-glucans and pen-tosans (complex carbohydrates that interfere with digest-ibility of other nutrients) found in these cereal grains (New-man et al., 1980; Li et al., 1996), but improvements inpig performance do not necessarily occur (Thacker, 1993;Thacker and Baas, 1996). Varied responses have beenshown to the addition of amylases and proteases to dietsfor very young pigs to aid in nutrient digestibility (Lewiset al., 1955; Cunningham and Brisson, 1957a,b; Combs etal., 1960). Recent reviews contain additional informationon feed enzymes (Wenk and Boessinger, 1993; van Hartin-gsveldt et al., 1995).
An enzyme that has recently received considerable atten-tion is phytase. This enzyme cleaves the ortho-phosphategroups from phytic acid (phytate), the predominant formof phosphorus in cereal grains and oilseed meals. Phytasesupplementation markedly improves the utilization of phy-tate phosphorus by pigs (Simons et al., 1990; Jongbloed etal., 1992; Cromwell et al., 1995) and reduces the excretionof phosphorus into the environment. For additional infor-mation on phytase, see Chapters 4 and 8.
Acidifiers
Citric acid, fumaric acid, or formic acid additions tostarter diets have been shown to enhance performance inearly-weaned pigs (Kirchgessner and Roth, 1982, 1987;Falkowski and Aherne, 1984; Giesting and Easter, 1985;Burnell et al., 1988; Ravindran and Kornegay, 1993). Inor-ganic acids, such as phosphoric acid and, in some instances,hydrochloric acid, also have been found to be beneficialto young pig performance (Schoenherr, 1994; Bergstromet al., 1996; Mahan et al., 1996). The mechanism of actionis not clear, but it may be related to a reduction in pH inthe upper intestinal tract, thereby reducing the potentialfor proliferation of undesirable microorganisms in thestomach and small intestine. Organic acids also have beenused to preserve high-moisture grains and as mold inhibi-tors in feeds (Crenshaw et al., 1986).

Nonnutritive Feed Additives 99
Flavors
Synthetic flavors are added to feed to improve palatabil-ity and/or to mask off-flavors or off-odors in feed. Mostresearch indicates that pigs may select diets with addedflavors or aromatic compounds when given a choice; butwhen pigs are not given a choice, benefits from most flavorsor aromatics are negligible (Hines, 1973; Hines et al., 1975;Kornegay et al., 1979; Ogunbameru et al., 1979). A reviewof flavors was written by McLaughlin et al. (1983).
Odor Control Agents
Sarsaponin, an extract from the yucca plant (Yucca schid-igera), inhibits urease activity and is claimed to reduceodor in swine manure. In some instances, sarsaponin hasbeen found to increase performance in weanling and grow-ing-finishing pigs (Foster, 1983; Cromwell et al., 1985) andto reduce ammonia emissions (Sutton et al., 1992). Otherproducts consisting of dried, live, naturally occurringmicroorganisms are claimed to reduce manure odor whenadded to feed. In some instances, zeolites have been shownto reduce odors and nitrogen volatilization (Barrington andEl Moueddeb, 1995). Some of the oligosaccharides havebeen shown to alter hind gut microorganisms and reduceodor in swine manure (Sutton et al., 1991; Farnworth etal., 1995).
Antioxidants
These products are added to feeds to inhibit oxidationof fat or vitamins. Examples are ethoxyquin and butylatedhydroxytoluene (BHT).
Pellet Binders
Certain clays (e.g., bentonite) are added to feed priorto pelleting in order to promote cohesiveness and inhibitcrumbling of pellets. Some of the clays and zeolites alsoprotect against aflatoxicosis in pigs by binding aflatoxinsand preventing their absorption (Schell et al., 1993); how-ever, they are not approved by the FDA for this purpose.
Flow Agents
These products are the same as or similar to pellet bind-ers. Their purpose is to prevent caking and improve theflow characteristics of certain ingredients. An example ishydrated sodium calcium aluminosilicate. Although notapproved for aflatoxicosis prevention, this product is alsoeffective in binding aflatoxins (Lindemann et al., 1993).
Mineral Supplements
High levels of dietary copper (100 to 250 ppm copper,as copper sulfate) have been shown to stimulate growthrate, feed intake, and efficiency of feed utilization in pigs,especially during the post-weaning and the early growthphases (Braude, 1945, 1975; Cromwell, 1991). Also, highdietary copper for sows has been found to increase pigweaning weights (Cromwell et al., 1993). Recent studieshave also shown that high levels of zinc (3,000 ppm zinc,from zinc oxide) stimulate feed intake and growth rate inyoung pigs (Hahn and Baker, 1993; LeMieux et al., 1994;Hill et al., 1996). For further information and documenta-tion, the reader is referred to the sections on copper andzinc in Chapter 4.
Carcass Modifiers
Several b-adrenergic agonists, including clenbuterol,cimaterol, and ractopamine, increase carcass leannesswhen included in the diet (Jones et al., 1985; Moser et al.,1986; Cromwell et al., 1988; Watkins et al., 1990; Bark etal., 1992). However, these substances are not yet approvedin the United States for use in swine. Under certain condi-tions, betaine and carnitine have been found to improvecarcass leanness (Odle, 1995). Chromium also has beenshown to improve carcass leanness when added to the dietas chromium picolinate in some instances (Page et al.,1993; Lindemann et al., 1995; Mooney and Cromwell,1995), but not in others (Mooney and Cromwell, 1996;Crow and Newcomb, 1997). There is recent evidence thatpositional and geometric isomers of conjugated dienoicfatty acids (derivatives of linoleic acid [CLA]) reduce bodyfat and increase lean tissue when fed to mice, rats, andchicks (Pariza et al., 1996; Park et al., 1997), and thoughdata are limited, CLA may produce a similar effect whenfed to pigs (Pariza, 1997; Parrish et al., 1997). Certaincarcass modifiers (e.g., b-agonists) can alter nutrientrequirements (Anderson et al., 1987).
S AF ET Y CO NC E RN S
There is concern by some that the feeding of antimicro-bials to animals contributes to a reservoir of drug-resistantenteric bacteria that are capable of transferring their resis-tance to pathogenic bacteria, thereby causing a potentialpublic health hazard (Smith, 1962; Falkow, 1975; Linton,1977). The greatest concern is in regard to penicillin andthe tetracyclines, because they also are used in humanmedicine.
Although transfer of antibiotic resistant plasmids (R-plasmids) occurs in vitro, the extent to which it occursin the animal, and between animal bacteria and human

100 Nutrient Requirements of Swine
bacteria, is not well documented. Animal bacteria do notcolonize very effectively in humans unless extremely largedoses are consumed; and even then, they are transient(Smith, 1969).
In 1987, the Food and Drug Administration asked theInstitute of Medicine of the National Academy of Sciencesto conduct an independent review of the human healthconsequences and make a quantitative risk assessmentassociated with the use of penicillin and the tetracyclinesat subtherapeutic levels in animal feeds. The committeewas unable to find a substantive body of direct evidencethat established the existence of a definite health hazardin humans associated with the use of these antimicrobialsin animal feeds (Institute of Medicine, 1988). Similarly,other task forces concluded that there was no conclusiveevidence of human health being compromised by subthera-peutic antimicrobial usage in animals (National ResearchCouncil, 1980; Council for Agricultural Science and Tech-nology, 1981).
Monitoring and surveillance of bacterial resistance inanimals and in humans has continued, with no animal-to-human infection path being clearly delineated. Althoughthe incidence of antimicrobial resistance in the humanpopulation remains high, there is no evidence that thelevels or patterns have changed (Lorian, 1986). Althoughantimicrobial agents have been fed to billions of animalsfor over 45 years, there is still no convincing evidence ofany unfavorable health effects in humans that can bedirectly linked to the feeding of subtherapeutic levels ofantibiotics to animals.
R EG UL A TI ON S
Regulations and constraints on the use of feed additivesvary among countries. In addition, the approved uses ofadditives are subject to change. For official informationconcerning U.S. Food and Drug Administration approvalof feed additives and other animal drugs, the Code ofFederal Regulations, Title 21, should be consulted. Arevised edition of Title 21 is available in April of each year.Individual issues of the Federal Register update the Codeof Federal Regulations. The Federal Register and the Codeof Federal Regulations must be used together to determinethe latest version of any rule. Title 21 is published in sixparts. Part 500-599 covers animal drugs, feeds, and relatedproducts. It is available from the Superintendent of Docu-ments, U.S. Government Printing Office, Washington, DC20402. The Federal Register is available from the sameaddress and includes monthly issues of the ‘‘List of Code ofFederal Regulations Sections Affected’’ and ‘‘The FederalRegister Index.’’
Additional information on feed additives, usage levels,and legal requirements is available in the Feed Additive
Compendium, which is published yearly by the Miller Pub-lishing Company, 12400 Whitewater Drive, Minneapolis,MN 55343, and in the compendium of Medicating Ingredi-ent Brochures, Feed and Fertilizer Division, published byAgriculture Canada, Ottawa, Ontario, Canada. The Com-pendium of Medicating Ingredient Brochures is availablefrom Supply and Services Canada, Canada Communica-tions Group, Ottawa, Ontario, Canada, K1A 0S9.
R EF ER E NC ES
Anderson, D. B., E. L. Veenhuizen, W. P. Waitt, R. E. Paxton, and S.S. Young. 1987. The effect of dietary protein on nitrogen metabolism,growth performance and carcass composition of finishing pigs fed racto-pamine. Fed. Proc. 46:1021 (Abstr.).
Association of American Feed Control Officials. 1998. AAFCO OfficialPublication. Atlanta: Georgia Dept. of Agric.
Bark, L. J., T. S. Stahly, G. L. Cromwell, and J. Miyat. 1992. Influenceof genetic capacity for lean tissue growth on rate and efficiency oftissue accretion in pigs fed ractopamine. J. Anim. Sci. 70:3391–3400.
Barrington, S., and K. El Moueddeb. 1995. Zeolite to control swinemanure odours and nitrogen volatilization. Pp. 65–68 in Proc. Interna-tional Livestock Odor Conference. Ames: Iowa State University.
Bergstrom, J. R., J. L. Nelssen, and M. D. Tokach, and R. D. Goodband.1996. An evaluation of several diet acidifiers commonly used in pigstarter diets to improve growth performance. J. Anim. Sci. 74:194(Abstr.).
Braude, R. 1945. Some observations on the need for copper in the dietof fattening pigs. J. Agric. Sci. 35:163–167.
Braude, R. 1975. Copper as a performance promoter in pigs. Pp. 79–97in Farming Symp. Development Assoc., London.
Burnell, T. W., G. L. Cromwell, and T. S. Stahly. 1988. Effects of driedwhey and copper sulfate on the growth responses to organic acid indiets for weanling pigs. J. Anim. Sci. 66:1100–1108.
Combs, G. E., W. L. Alsmeyer, H. D. Wallace, and M. Koger. 1960.Enzyme supplementation of baby pig rations containing differentsources of carbohydrate and protein. J. Anim. Sci. 19:932–937.
Council for Agricultural Science and Technology. 1981. Antibiotics inAnimal Feeds. Report No. 88. Ames, IA: Council for AgriculturalScience and Technology.
Crenshaw, J. D., E. R. Peo, Jr., A. J. Lewis, and N. R. Schneider. 1986.The effects of sorbic acid in high moisture sorghum grain diets onperformance of weanling swine. J. Anim. Sci. 63:831–837.
Cromwell, G. L. 1991. Antimicrobial agents. Pp. 297–314 in Swine Nutri-tion, E. R. Miller, D. E. Ullrey, and A. J. Lewis, eds. Stoneham, MA:Butterworth-Heinemann.
Cromwell, G. L., T. S. Stahly, and H. J. Monegue. 1985. Efficacy ofsarsaponin for weanling and growing-finishing swine housed at twoanimal densities. J. Anim. Sci. 61(Suppl. 1):111 (Abstr.).
Cromwell, G. L., J. D. Kemp, T. S. Stahly, and R. H. Dalrymple. 1988.Effects of dietary level and withdrawal time on the efficacy of cimaterolas a growth repartitioning agent in finishing swine. J. Anim. Sci.66:2193–2199.
Cromwell, G. L., H. J. Monegue, and T. S. Stahly. 1993. Long-termeffects of feeding a high copper diet to sows during gestation andlactation. J. Anim. Sci. 71:2996–3002.
Cromwell, G. L., R. D. Coffey, G. R. Parker, H. J. Monegue, and J. H.Randolph. 1995. Efficacy of a recombinant-derived phytase in improv-ing the bioavailability of phosphorus in corn–soybean meal diets forpigs. J. Anim. Sci. 73:2000–2008.
Nonnutritive Feed Additives 101
Crow, S. D., and M. D. Newcomb. 1997. Effect of dietary chromiumadditions along with varying protein levels on growth performance andcarcass characteristics. J. Anim. Sci. 74:79 (Abstr.).
Cunningham, H. M., and G. J. Brisson. 1957a. The effect of amylaseson the digestibility of starch by baby pigs. J. Anim. Sci. 16:370–376.
Cunningham, H. M., and G. J. Brisson. 1957b. The effect of proteolyticenzymes on the utilization of animal and plant proteins by newbornpigs and the response to predigested protein. J. Anim. Sci. 16:568–573.
Falkow, S. 1975. Infectious Multiple Drug Resistance. London: Pion Ltd.Falkowski, J. F., and F. X. Aherne. 1984. Fumaric and citric acid as feed
additives in starter pig nutrition. J. Anim. Sci. 58:935–938.Farnworth, E. R., N. Dilawri, H. Yamazaki, H. W. Modler, and J. D.
Jones. 1991. Studies on the effect of adding Jerusalem artichoke flourto pig milk replacer. Can. J. Anim. Sci. 71:531–536.
Farnworth, E. R., H. W. Modler, J. D. Jones, N. Cave, H. Yamazaki,and A. V. Rao. 1992. Feeding Jerusalem artichoke flour rich in fructooli-gosaccharides to weanling pigs. Can. J. Anim. Sci. 72:977–980.
Farnworth, E. R., H. W. Modler, and D. A. Mackie. 1995. Adding Jerusa-lem artichoke (Helianthus tuberosus L.) to weanling pig diets and theeffect on manure composition and characteristics. Anim. Feed Sci.Tech. 55:153–160.
Feed Additive Compendium. 1998. Minneapolis, Minn.: Miller Publish-ing Co.
Foster, J. R. 1983. Effects of sarsaponin in growing-finishing swine diets.J. Anim. Sci. 57(Suppl. 1):94 (Abstr.).
Fukuyasu, T., and Oshida, T. 1988. Use of Neosugart in piglets. P. 1 inProc. 3rd Neosugart Conf., Tokyo, Japan, 1986.
Giesting, D. W., and R. A. Easter. 1985. Response of starter pigs tosupplementation of corn–soybean meal diets with organic acids. J.Anim. Sci. 60:1288–1294.
Hahn, J. D., and D. H. Baker. 1993. Growth and plasma zinc responses ofyoung pigs fed pharmacologic levels of zinc. J. Anim. Sci. 71:3020–3024.
Hays, V. W. 1978. Effectiveness of Feed Additive Usage of AntibacterialAgents in Swine and Poultry Production. Report to the Office of Tech-nology Assessment, U.S. Congress. U.S. Government Printing Office,Washington, D.C. (Edited version: Hays, V.W., 1981. The Hays Report.Rachelle Laboratories, Inc., Long Beach, CA.)
Hidaka, H., T. Eida, T. Takizawa, T. Tokunaga, and Y. Tashiro. 1986.Effects of fructooligosaccharides on intestinal flora and human health.Bifidobacteria Microflora 5:37–50.
Hill, G. M., G. L. Cromwell, T. D. Crenshaw, R. C. Ewan, K. A. Knabe,A. J. Lewis, D. C. Mahan, G. C. Shurson, L. L. Southern, and T. L.Veum, NCR-42 and S-145 Regional Swine Nutrition Committees. 1996.Impact of pharmacological intakes of zinc and(or) copper on perfor-mance of weanling pigs. J. Anim. Sci. 74(Suppl. 1):181 (Abstr.).
Hines, R. H. 1973. Feed flavors in swine starter rations. Pp. 37–42 inProc. Swine Industry Day, Kansas State Univ.
Hines, R. H., B. A. Koch, and G. L. Allee. 1975. Attractants for swinestarter feed: Aroma vs. taste. Pp. 20–23 in Proc. Swine Industry Day,Kansas State Univ.
Institute of Medicine. 1988. Human Health Risks with the SubtherapeuticUse of Penicillin or Tetracycline in Animal Feed. Institute of Medicine,National Academy of Sciences. Washington, DC: National AcademyPress.
Jones, R. W., R. A. Easter, F. K. McKeith, R. H. Dalrymple, H. M.Maddock, and P. J. Bechtel. 1985. Effect of the b-adrenergic agonistcimaterol (CL 263,780) on the growth and carcass characteristics offinishing swine. J. Anim. Sci. 61:905–913.
Jongbloed, A.W., Z. Mroz, and P. A. Kemme. 1992. The effect of supple-mentary Aspergillus niger phytase in diets for pigs on concentrationand apparent digestibility of dry matter, total phosphorus, and phyticacid in different sections of the alimentary tract. J. Anim. Sci.70:1159–1168.
Kirchgessner, M., and F. X. Roth. 1982. Fumaric acid as a feed additivein pig nutrition. Pig News and Information 3:259–263.
Kirchgessner, M., and F. X. Roth. 1987. Use of formates in the feedingof piglets. First communication: Calcium formate. Landwirtsch.Forsch. 40:141–152.
Kornegay, E. T., S. E. Tinsley, and K. L. Bryant. 1979. Evaluation ofrearing systems and feed flavors for pigs weaned at two to three weeksof age. J. Anim. Sci. 48:999–1006.
Kornegay, E. T., C. M. Wood, and L. A. Eng. 1992. Effectiveness andsafety of fructooligosaccharides for pigs. J. Anim. Sci. 70(Suppl.1):19 (Abstr.).
LeMieux, F. M., L. L. Southern, and T. D. Bidner. 1994. Effect of dietaryzinc and(or) antibiotic on growth of pigs weaned at four weeks of age.J. Anim. Sci. 72(Suppl. 2):6 (Abstr.).
Lewis, C. J., D. V. Catron, C. H. Liu, V. C. Speer, and G. C. Ashton.1955. Enzyme supplementation of baby pig diets. J. Agric. FoodChem. 3:1047–1050.
Li, S., W. C. Sauer, R. Mosenthin, and B. Kerr. 1995. Effect of b-glucanase supplementation of cereal-based diets for starter pigs on theapparent digestibilities of dry matter, crude protein, and energy. Anim.Feed Sci. Tech. 59:223–231.
Lindemann, M. D., D. J. Blodgett, E. T. Kornegay, and G. G. Schurig.1993. Potential ameliorators of aflatoxicosis in weanling/growing swine.J. Anim. Sci. 71:171–178.
Lindemann, M. D., C. M. Wood, A. F. Harper, E. T. Kornegay, and R.A. Anderson. 1995. Dietary chromium picolinate additions improvegain:feed and carcass characteristics in growing-finishing pigs andincrease litter size in reproducing sows. J. Anim. Sci. 73:457–465.
Linton, A. H. 1977. Antibiotics, animals and man—an appraisal of acontentious subject. Pp. 315–343 in Antibiotics and Antibiosis in Agri-culture, M. Woodbine, ed. Woburn, MA: Butterworths.
Lorian, V. 1986. Antibiotic sensitivity patterns of human pathogens inAmerican hospitals. J. Anim. Sci. 62(Suppl. 3):49–55.
Maddox, H. M. 1985. Unpublished data from American Cyanamid Co.,Princeton, NJ (cited by Cromwell, 1991).
Mahan, D. C., E. A. Newton, and K. R. Cera. 1996. Effect of supplementalsodium chloride, sodium phosphate, or hydrochloric acid in starter pigdiets containing dried whey. J. Anim. Sci. 74:1218–1222.
McLaughlin, C. L., C. A. Baile, L. L. Buckholtz, and S. K. Freeman.1983. Preferred flavors and performance of weanling pigs. J. Anim.Sci. 56:1287–1293.
Monsand, P. F., and F. Paul. 1995. Oligosaccharide feed additives. Pp.233–245 in Biotechnology in Animal Feeds and Animal Feeding, R.J. Wallace and A. Chesson, eds. Weinheim, Germany: VCH Verlagsge-sellschaft mbH.
Mooney, K. W., and G. L. Cromwell. 1995. Effects of dietary chromiumpicolinate supplementation on growth, carcass characteristics, andaccretion rates of carcass tissues in growing-finishing swine. J. Anim.Sci. 75:3351–3357.
Mooney, K. W., and G. L. Cromwell. 1996. Effects of chromium picolinateon performance and tissue accretion in pigs with different lean gainpotential. J. Anim. Sci. 74 (Suppl. 1): 65 (Abstr.).
Moser, R. L., R. H. Dalrymple, S. G. Cornelius, J. E. Pettigrew, and C.E. Allen. 1986. Effect of cimaterol (CL 263,780) as a repartitioningagent in the diet for finishing pigs. J. Anim. Sci. 62:21–26.
Murray, F. A. 1983. Effects of dichlorvos on lymphocyte reactivity duringpregnancy in the pig. J. Anim. Sci. 57:1270–1275.
National Research Council. 1980. Effects on Human Health of Subthera-peutic Use of Antimicrobials in Animal Feeds. Washington, DC:National Academy Press. 376 pp.
Newman, C. W., R. F. Eslick, J. W. Pepper, and A. M. El-Negoumy. 1980.Performance of pigs fed hulless and covered barleys supplemented withor without a bacterial diastase. Nutr. Rep. Internat. 22:833–837.

102 Nutrient Requirements of Swine
Newman, K. E. 1995. Mannan oligosaccharides: Immune modulator orrumen efficiency potentiator. Pp. 37–42 in Proc. 56th Minnesota Nutri-tion Conference Alltech Tech. Symposium. St. Paul: University ofMinnesota.
Odle, J. 1995. Betaine and carnitine—evaluation of performance andcarcass effects. Pp. 1–14 in Proc. Carolina Swine Nutr. Conference.Raleigh: North Carolina State Univ.
Ogunbameru, B. O., E. T. Kornegay, K. L. Bryant, K. H. Hinkelmann,and J. W. Knight. 1979. Evaluation of a fed flavour in lactation andstarter diets to stimulate feed intake of weaned pigs. Nutr. Rep.Intl. 20:455–460.
Page, T. G., L. L. Southern, T. L. Ward, and D. L. Thompson, Jr. 1993.Effect of chromium picolinate on growth and serum- and carcass traitsof growing-finishing pigs. J. Anim. Sci. 71:656–662.
Pariza, M. W. 1997. Conjugated linoleic acid, a newly recognized nutrient.Chem. Ind. 12:464–466.
Pariza, M., Y. Park, M. Cook, K. Albright, and W. Liu. 1996. Conjugatedlinoleic acid (CLA) reduces body fat. FASEB Journal 10:A560 (Abstr.).
Park, Y., K. J. Albright, W. Liu, J. M. Storkson, M. E. Cook, and M. W.Pariza. 1997. Effect of conjugated linoleic acid on body compositionin mice. Lipids. 32:853–858.
Parrish, F.C., Jr., R.L. Thiel, J. C. Sparks, and R. C. Ewan. 1998. Effectsof conjugated linoleic acid (CLA) on swine performance and bodycomposition. 1997 Swine Research Report, Iowa State University,AS-638:187–190.
Pollmann, D. S. 1986. Probiotics in pig diets. Pp. 193–205 in RecentAdvances in Animal Nutrition, W. Haresign and D. J. A. Cole, eds.London: Butterworths.
Ravindran, V., and E. T. Kornegay. 1993. Acidification of weaner pigdiets: A review. J. Anim. Sci. Food Agric. 62:313–322.
Schell, T. C., M. D. Lindemann, E. T. Kornegay, D. J. Blodgett, and J.A. Doerr. 1993. Effectiveness of different types of clay for reducingthe detrimental effects of aflatoxin-contaminated diets on performanceand serum profiles of weanling pigs. J. Anim. Sci 71:1226–1231.
Schoenherr, W. D. 1994. Phosphoric acid-based acidifiers explored forstarter diets. Feedstuffs, September 26, 1994, p. 14.
Siers, D. G., D. E. DeKay, H. J. Mersmann, L. J. Brown, and H. C.Stanton. 1976. Late gestation feeding of dichlorvos: a physiologicalcharacterization of the neonate and a growth-survival response. J. Anim.Sci. 42:381–392.
Simons, P. C. M., H. A. J. Versteegh, A. W. Jongbloed, P. A. Kemme,P. Slump, K. D. Bos, M. G. E. Wolters, R. F. Beudeker, and G. J.Verschoor. 1990. Improvement of phosphorus availability by microbialphytase in broilers and pigs. Br. J. Nutr. 64:525–540.
Smith, H. W. 1962. The effects of the use of antibiotics on the emergenceof antibiotic-resistant disease-producing organisms in animals. Pp.374–388 in Antibiotics in Agriculture. Univ. of Nottingham NinthEaster School in Agriculture Science. London: Butterworths.
Smith, H. W. 1969. Transfer of antibiotic resistance from animal andhuman strains of Escherichia coli to resistant E. coli in the alimentarytract of man. Lancet 1:1174–1176.
Stavric, S., and E. T. Kornegay. 1995. Microbial probiotics for pigs andpoultry. Pp. 205–231 in Biotechnology in Animal Feeds and Feeding,R. J. Wallace and A. Chesson, eds. Weinheim, Germany: VCHVerlagsgesellschaft.
Sutton, A. L., A. G. Mathew, A. B. Scheidt, J. A. Patterson, and D. T. Kelly.1991. Effect of carbohydrate source and organic acids on intestinalmicroflora and performance of the weanling pig. Pp. 422–427 in Proc.5th Congress on Digestive Physiology in Pigs. EEAP Pub. No. 54.Pudoc, Wageningen, Netherlands.
Sutton, A. L., S. R. Goodall, J. A. Patterson, A. G. Mathew, D. T. Kelly,and K. A. Meyerholtz. 1992. Effects of odor control compounds onurease activity in swine manure. J. Anim. Sci. 70(Suppl. 1):160 (Abstr.).
Thacker, P. A. 1993. Novel approaches to growth promotion in the pig.Pp. 295–306 in Recent Developments in Pig Nutrition, D. J. A. Cole, W.Haresign, and P. C. Garnsworthy, eds. Nottingham, U.K.: NottinghamUniversity Press.
Thacker, P.A., and F. C. Baas. 1996. Effects of gastric pH on the activityof exogenous pentosanase and the effect of pentosanase supplementa-tion of the diet on the performance of growing-finishing pigs. Anim.Feed Sci. Tech. 63:187–200.
van Belle, M., E. Teller, and M. Focant. 1990. Probiotics in animalnutrition: A review. Arch. Anim. Nutr., Berlin 40:7:543–567.
van Hartingsveldt, W., M. Hessing, J. P. van der Lugt, and W.A.C. Somers.1995. The Second European Symposium on Feed Enzymes. Zeist,Netherlands: TNO Nutrition and Food Research Institute. 302 pp.
Watkins, L. E., D. J. Jones, D. H. Mowrey, D. B. Anderson, and E.L. Veenhuizen. 1990. The effects of various levels of ractopaminehydrochloride on the performance and carcass characteristics of finish-ing swine. J. Anim. Sci. 68:3588–3595.
Wenk, C. 1992. Enzymes in the nutrition of monogastric farm animals.Pp. 205–218 in Biotechnology in the Feed Industry, T. P. Lyons, ed.Nicholasville, KY: Alltech Technical Publications.
Wenk, C., and M. Boessinger. 1993. Enzymes in Animal Nutrition. Zurich,Switzerland: Institut fu
¨r Nutztierwissenschaften, Gruppe Ernahrung.
Young, R., Jr., D. K. Hass, and L. J. Brown. 1979. Effect of late gestationfeeding of dichlorvos in non-parasitized and parasitized sows. J. Anim.Sci. 48:45–51.
Zimmerman, D. R. 1986. Role of subtherapeutic antimicrobials in pigproduction. J. Anim. Sci. 62(Suppl. 3):6.

MinimizingNutrient8 Excretion
Maximization of individual pig performance traditionallyhas been the goal of swine producers and nutritionists.Diets are generally formulated to achieve this goal withlittle or no regard for the amount of nutrients excreted.Consequently, oversupplementation of diets with nutrientsto ensure maximum pig performance results in excessiveamounts of excreted nutrients in feces and urine. Becauseof its relatively high content of nitrogen, phosphorus, po-tassium, and other nutrients, manure is an excellent fertil-izer when applied to land. During the past decade, therehas been little change in total number of hogs producedin the United States, but the number of large swine unitsand the intensity of production has sharply increased. Asa result, large amounts of manure are produced on a muchsmaller land area. Distribution and disposal has become aproblem. The application of excessive amounts of manureto land can potentially lead to surface and ground watercontamination and to the accumulation of minerals inthe soil.
Of the nutrients present in manure, nitrogen, phospho-rus, sodium, potassium, copper, and zinc cause the greatestconcern. In some areas, nitrogen is used as the basis toregulate the amount of manure that can be applied to theland. However, evidence is accumulating which suggeststhat phosphorus will be the nutrient that limits land appli-cation of manure in the more intensive swine producingareas. For example, Barker and Zublena (1995) reportedthat in North Carolina, animal manure could provide about20 percent of the nitrogen and 66 percent of the phospho-rus requirements of all non-legume agronomic crops andforages produced in that state. Three of the 100 countiessurveyed had enough manure to exceed the nitrogenrequirements of their crops, and 18 counties had enoughmanure to exceed the phosphorus requirements of crops.Soil analyses of a Sampson County (North Carolina) ber-mudagrass pasture that was fertilized with swine lagooneffluent to satisfy nitrogen requirements showed approxi-
103
mately a fourfold increase in phosphorus and zinc, a one-fold increase in potassium, and a threefold increase incopper to a depth of 91 cm during the three-year periodof application (Mueller et al., 1994). These findings maywell be representative of other regions of the United States.
The overall quality of water, both surface water andground water, can be negatively affected by applying excessnitrogen and phosphorus, and perhaps other nutrients, tosoil. Excess nitrogen application can lead to increases innitrate content of ground water and to potential runoff ofnitrate into surface water. Excess phosphorus applicationresults in excess buildup of phosphorus in the soil. Whilephosphorus is adsorbed onto soil particles and does notleach into ground water, it can erode (along with soil parti-cles) into streams, lakes, and rivers. Phosphorus is themost limiting nutrient that regulates aquatic plant growth(Pierzynski et al., 1994; Sharpley et al., 1994), so when itis added to bodies of surface water, phosphorus stimulatesgrowth of algae and other aquatic vegetation. Decomposi-tion of such vegetation can lead to a general deterioration ofwater quality, a process called ‘‘eutrophication’’ (Crenshawand Johanson, 1995). To prevent potential pollution bynitrogen and phosphorus, governments in many countrieshave passed legislation requiring nutrient managementplans for each farm, so that land application of manurecan be properly controlled (Hacker and Du, 1993).
Even in the best situation, pigs do not utilize 100 percentof nutrients consumed. A review of balance data for pigsfed commercial feedstuffs indicates the following apparentutilization values (as percent of intake): 30 to 55 for nitro-gen; 30 to 50 for calcium; 20 to 50 for phosphorus; 5 to20 for potassium; 10 to 25 for sodium; 15 to 30 for magne-sium; 5 to 30 for copper; 5 to 30 for zinc; 5 to 10 formanganese; and 5 to 30 for iron (Kornegay and Harper,1997). Therefore, the percentages of intake excreted are45 to 60 percent of nitrogen; 50 to 80 percent of calciumand phosphorus; and 70 to 95 percent of potassium,
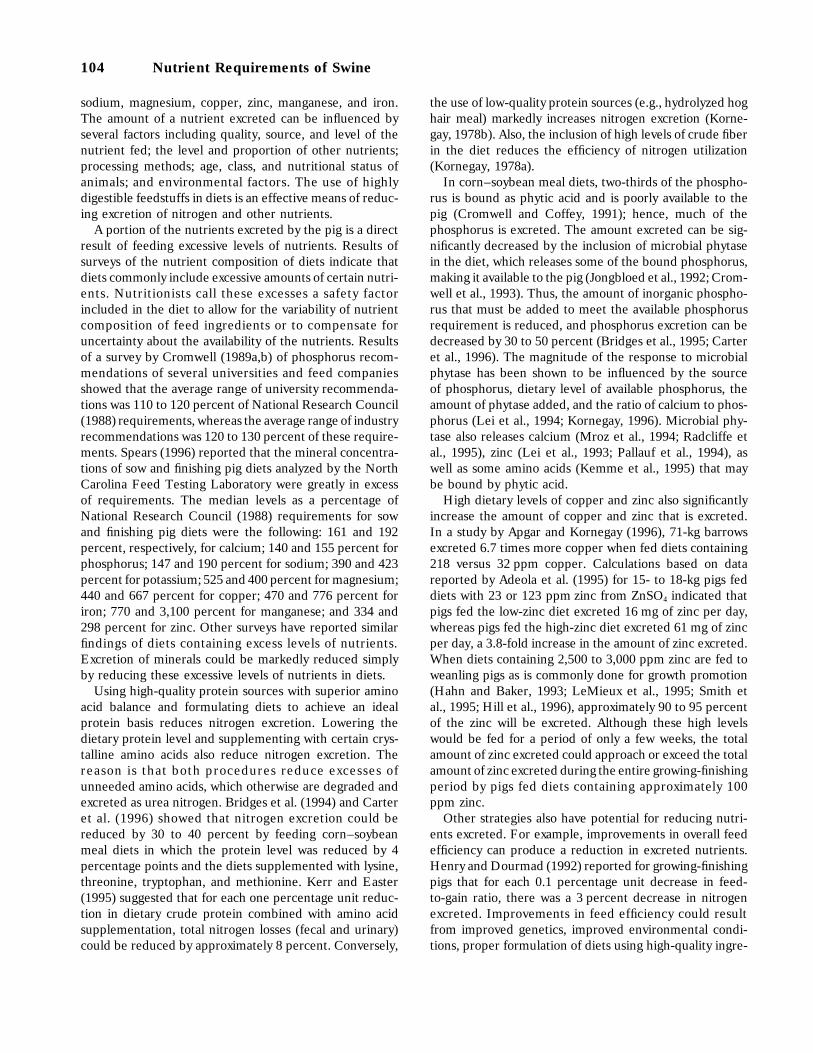
104 Nutrient Requirements of Swine
sodium, magnesium, copper, zinc, manganese, and iron.The amount of a nutrient excreted can be influenced byseveral factors including quality, source, and level of thenutrient fed; the level and proportion of other nutrients;processing methods; age, class, and nutritional status ofanimals; and environmental factors. The use of highlydigestible feedstuffs in diets is an effective means of reduc-ing excretion of nitrogen and other nutrients.
A portion of the nutrients excreted by the pig is a directresult of feeding excessive levels of nutrients. Results ofsurveys of the nutrient composition of diets indicate thatdiets commonly include excessive amounts of certain nutri-ents. Nutritionists call these excesses a safety factorincluded in the diet to allow for the variability of nutrientcomposition of feed ingredients or to compensate foruncertainty about the availability of the nutrients. Resultsof a survey by Cromwell (1989a,b) of phosphorus recom-mendations of several universities and feed companiesshowed that the average range of university recommenda-tions was 110 to 120 percent of National Research Council(1988) requirements, whereas the average range of industryrecommendations was 120 to 130 percent of these require-ments. Spears (1996) reported that the mineral concentra-tions of sow and finishing pig diets analyzed by the NorthCarolina Feed Testing Laboratory were greatly in excessof requirements. The median levels as a percentage ofNational Research Council (1988) requirements for sowand finishing pig diets were the following: 161 and 192percent, respectively, for calcium; 140 and 155 percent forphosphorus; 147 and 190 percent for sodium; 390 and 423percent for potassium; 525 and 400 percent for magnesium;440 and 667 percent for copper; 470 and 776 percent foriron; 770 and 3,100 percent for manganese; and 334 and298 percent for zinc. Other surveys have reported similarfindings of diets containing excess levels of nutrients.Excretion of minerals could be markedly reduced simplyby reducing these excessive levels of nutrients in diets.
Using high-quality protein sources with superior aminoacid balance and formulating diets to achieve an idealprotein basis reduces nitrogen excretion. Lowering thedietary protein level and supplementing with certain crys-talline amino acids also reduce nitrogen excretion. Thereason is that both procedures reduce excesses ofunneeded amino acids, which otherwise are degraded andexcreted as urea nitrogen. Bridges et al. (1994) and Carteret al. (1996) showed that nitrogen excretion could bereduced by 30 to 40 percent by feeding corn–soybeanmeal diets in which the protein level was reduced by 4percentage points and the diets supplemented with lysine,threonine, tryptophan, and methionine. Kerr and Easter(1995) suggested that for each one percentage unit reduc-tion in dietary crude protein combined with amino acidsupplementation, total nitrogen losses (fecal and urinary)could be reduced by approximately 8 percent. Conversely,
the use of low-quality protein sources (e.g., hydrolyzed hoghair meal) markedly increases nitrogen excretion (Korne-gay, 1978b). Also, the inclusion of high levels of crude fiberin the diet reduces the efficiency of nitrogen utilization(Kornegay, 1978a).
In corn–soybean meal diets, two-thirds of the phospho-rus is bound as phytic acid and is poorly available to thepig (Cromwell and Coffey, 1991); hence, much of thephosphorus is excreted. The amount excreted can be sig-nificantly decreased by the inclusion of microbial phytasein the diet, which releases some of the bound phosphorus,making it available to the pig (Jongbloed et al., 1992; Crom-well et al., 1993). Thus, the amount of inorganic phospho-rus that must be added to meet the available phosphorusrequirement is reduced, and phosphorus excretion can bedecreased by 30 to 50 percent (Bridges et al., 1995; Carteret al., 1996). The magnitude of the response to microbialphytase has been shown to be influenced by the sourceof phosphorus, dietary level of available phosphorus, theamount of phytase added, and the ratio of calcium to phos-phorus (Lei et al., 1994; Kornegay, 1996). Microbial phy-tase also releases calcium (Mroz et al., 1994; Radcliffe etal., 1995), zinc (Lei et al., 1993; Pallauf et al., 1994), aswell as some amino acids (Kemme et al., 1995) that maybe bound by phytic acid.
High dietary levels of copper and zinc also significantlyincrease the amount of copper and zinc that is excreted.In a study by Apgar and Kornegay (1996), 71-kg barrowsexcreted 6.7 times more copper when fed diets containing218 versus 32 ppm copper. Calculations based on datareported by Adeola et al. (1995) for 15- to 18-kg pigs feddiets with 23 or 123 ppm zinc from ZnSO4 indicated thatpigs fed the low-zinc diet excreted 16 mg of zinc per day,whereas pigs fed the high-zinc diet excreted 61 mg of zincper day, a 3.8-fold increase in the amount of zinc excreted.When diets containing 2,500 to 3,000 ppm zinc are fed toweanling pigs as is commonly done for growth promotion(Hahn and Baker, 1993; LeMieux et al., 1995; Smith etal., 1995; Hill et al., 1996), approximately 90 to 95 percentof the zinc will be excreted. Although these high levelswould be fed for a period of only a few weeks, the totalamount of zinc excreted could approach or exceed the totalamount of zinc excreted during the entire growing-finishingperiod by pigs fed diets containing approximately 100ppm zinc.
Other strategies also have potential for reducing nutri-ents excreted. For example, improvements in overall feedefficiency can produce a reduction in excreted nutrients.Henry and Dourmad (1992) reported for growing-finishingpigs that for each 0.1 percentage unit decrease in feed-to-gain ratio, there was a 3 percent decrease in nitrogenexcreted. Improvements in feed efficiency could resultfrom improved genetics, improved environmental condi-tions, proper formulation of diets using high-quality ingre-

Minimizing Nutrient Excretion 105
dients, use of pelleting and fine grinding of feed, and properfeeder adjustment to reduce wastage. Harper (1994) esti-mated that a 5 percent level of feed waste resulted in anadditional 327 g of nitrogen and 82 g of phosphorusexcreted per animal.
Nutrient requirements change as pigs increase in bodyweight. Thus, frequent changes in diet formulation canmeet the nutrient needs of the pig more efficiently. Fre-quent adjustments in diets can result in reduced intake ofnutrients and, thus, reduced excretion of nutrients. Phasefeeding and separate-sex feeding are ways to meet thenutrient needs of growing and finishing pigs more preciselyand reduce nitrogen excretion.
A further point is that the efficiency of animal perfor-mance follows the principle of diminishing returns inresponse to nutrient input (Heady et al., 1954; Combs etal., 1991; Gahl et al., 1995). Heady et al. (1954) reportedthat in 14 of 16 years, swine diets formulated using thediminishing return concept would have produced greaterprofits than diets formulated for maximum gain. As thecost of disposing of nitrogen and phosphorus increases,the nutrient levels fed to pigs will probably decrease. Inthe future, nutritionists may formulate diets to achieve 95to 98 percent rather than 100 percent of maximumresponse, because the benefit of adding a unit of nutrientincreases at a decreasing rate, and nutrient costs increaseat an increasing rate as the animal reaches maximumperformance.
The success of all strategies for reducing nutrientsexcreted is dependent on an accurate estimate of the nutri-ent requirements of the class of pigs in question and onthe accuracy of compositional information for, and bioavail-ability of, feed ingredients. Recommended nutrientrequirements for the different classes of pigs often varyand, in many cases, are only estimates for an ‘‘average’’animal under ‘‘average’’ environmental conditions. Theestimated nutrient requirements may be influenced by theanimal’s genetic potential, feeding methods, environmentalconditions, the ingredients used, and animal response crite-ria. With the exception of phosphorus and amino acids,nutrient requirements are generally based on total nutri-ents rather than available nutrients. The available nutrientrequirement of pigs can be accurately met, assuming theyare known, only if the compositional data of feed ingredi-ents are expressed on available nutrient composition. Usingmore precise data on compositional and nutrient availabil-ity for feed ingredients and better defined requirementswill allow nutritionists to formulate diets that more pre-cisely meet the needs of the animal at the various stagesof production.
In summary, nutrients excreted can be reduced throughproper nutrient management to improve the availability ofnutrients and reduce excessive amounts that are fed. Inthe future, diet formulation will be integrated into a total
production system with nutrient and manure managementbeing its major components. The need for more carefulnutrient management planning probably will increase inthe future, as the intensity of the industry increases andas the concerns of the public increase.
R EF ER E NC ES
Adeola, O., B. V. Lawrence, A. L. Sutton, and T. R. Cline. 1995. Phytase-induced changes in mineral utilization in zinc-supplemented diets forpigs. J. Anim. Sci. 73:3384–3391.
Apgar, G. A., and E. T. Kornegay. 1996. Mineral balance of finishingpigs fed copper sulfate or a copper lysine complex at growth stimulatinglevels. J. Anim. Sci. 74:1594–1600.
Barker, J. C., and J. P. Zublena. 1995. Livestock manure nutrient assess-ment in North Carolina. Pp. 98–106 in Proc. Seventh InternationalSymposium on Agricultural and Food Processing Wastes. Sponsoredby ASAE, Chicago, IL, June 18–20.
Bridges, T. C., L. W. Turner, G. L. Cromwell, and J. L. Pierce. 1995.Modeling the effects of diet formulation on nitrogen and phosphorusexcretion in swine waste. Applied Engineering in Agriculture11(5):731–739.
Carter, S. D., G. L. Cromwell, M. D. Lindemann, L. W. Turner, and T.C. Bridges. 1996. Reducing N and P excretion by dietary manipulationin growing and finishing pigs. J. Anim. Sci. 74(Suppl. 1):59 (Abstr.).
Combs, N. R., E. T. Kornegay, M. D. Lindemann, and D. R. Notter.1991. Calcium and phosphorus requirement of swine from weaning tomarket weight: 1. Development of response curves for performance.J. Anim. Sci. 69:673–681.
Crenshaw, T. D., and J. C. Johanson. 1995. Nutritional strategies forwaste reduction management: Minerals. Pp. 69–78 in New HorizonsIn Animal Nutrition and Health; J. B. Longenecker and J. W. Spears,eds. The Institute of Nutrition of The University of North Carolina,Chapel Hill, Nov. 7 and 8.
Cromwell, G. L. 1989a. Requirements, biological availability of calcium,phosphorus for swine evaluated. Feedstuffs 60(23):16.
Cromwell, G. L. 1989b. Requirements and biological availability of phos-phorus for swine. Pp. 75–95 in Proc. Pitman-Moore Nutr. Conf., DesMoines, IA.
Cromwell, G. L., and R. D. Coffey. 1991. Phosphorus—a key essentialnutrient, yet a possible major pollutant—its central role in animalnutrition. Pp. 133–145 in Biotechnology in the Feed Industry, T. P.Lyons, ed. Nicholasville, KY: Alltech Technical Publications.
Cromwell, G. L., T. S. Stahly, R. D. Coffey, H. J. Monegue, and J. H.Randolph. 1993. Efficacy of phytase in improving the bioavailabilityof phosphorus in soybean meal and corn–soybean meal diets for pigs.J. Anim. Sci. 71:1831–1840.
Gahl, M. J., T. D. Crenshaw, and N. J. Benevenga. 1995. Diminishingreturns in weight, nitrogen, and lysine gain of pigs fed six levels oflysine from three supplemental sources. J. Anim. Sci. 72:3177–3187.
Hacker, R. R., and Z. Du. 1993. Livestock pollution and politics. Pp. 3–21in Nitrogen flow in pig production and environmental consequences; M.W. A. Verstegen, L. A. den Hartog, G. J. M. van Kempen and C. J.H. M. Metz, eds. EAAP publ. 69, Pudoc Scientific Publishers,Wageningen.
Hahn, J. D., and D. H. Baker. 1993. Growth and plasma zinc responses ofyoung pigs fed pharmacologic levels of zinc. J. Anim. Sci. 71:3020–3024.
Harper, A. F. 1994. Feeding technologies to reduce excess nutrients inswine diets. Pp. 44–51 in Proc. Meeting the Challenge of Environmen-tal Management on Hog Farms. Second Annual Virginia Tech SwineProducers Seminar, Carson, Aug. 4.
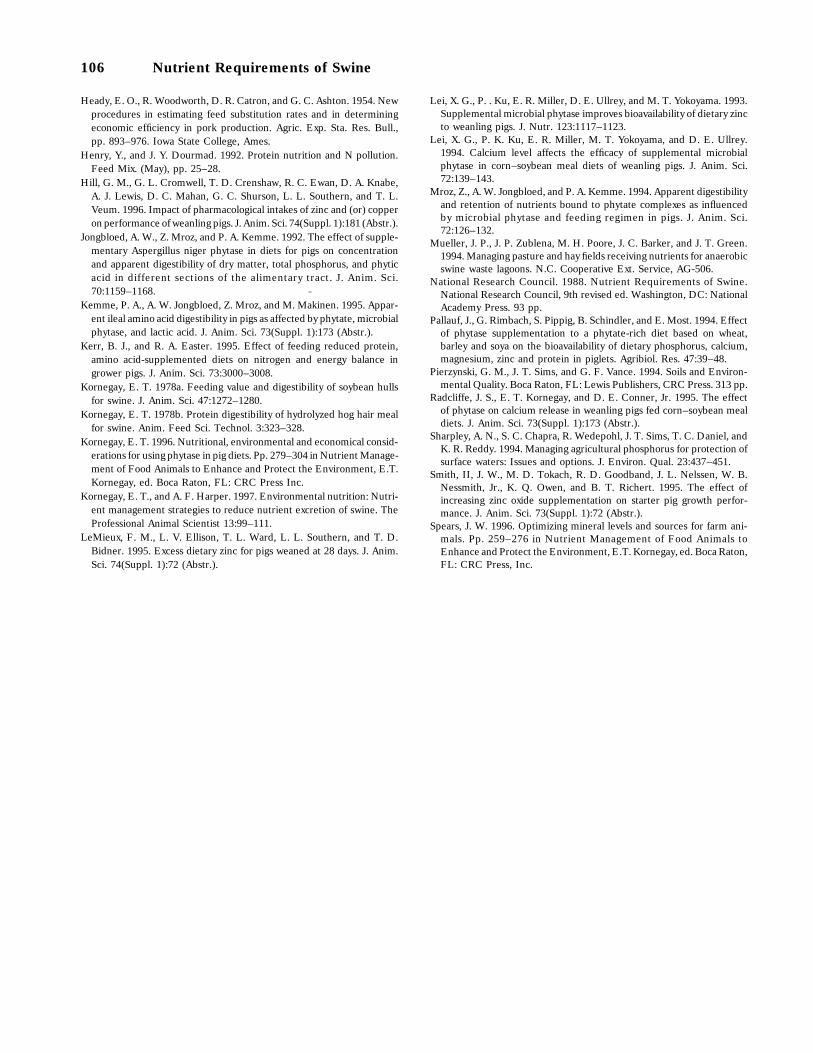
106 Nutrient Requirements of Swine
Heady, E. O., R. Woodworth, D. R. Catron, and G. C. Ashton. 1954. Newprocedures in estimating feed substitution rates and in determiningeconomic efficiency in pork production. Agric. Exp. Sta. Res. Bull.,pp. 893–976. Iowa State College, Ames.
Henry, Y., and J. Y. Dourmad. 1992. Protein nutrition and N pollution.Feed Mix. (May), pp. 25–28.
Hill, G. M., G. L. Cromwell, T. D. Crenshaw, R. C. Ewan, D. A. Knabe,A. J. Lewis, D. C. Mahan, G. C. Shurson, L. L. Southern, and T. L.Veum. 1996. Impact of pharmacological intakes of zinc and (or) copperon performance of weanling pigs. J. Anim. Sci. 74(Suppl. 1):181 (Abstr.).
Jongbloed, A. W., Z. Mroz, and P. A. Kemme. 1992. The effect of supple-mentary Aspergillus niger phytase in diets for pigs on concentrationand apparent digestibility of dry matter, total phosphorus, and phyticacid in different sections of the alimentary tract. J. Anim. Sci.70:1159–1168.
Kemme, P. A., A. W. Jongbloed, Z. Mroz, and M. Ma¨kinen. 1995. Appar-
ent ileal amino acid digestibility in pigs as affected by phytate, microbialphytase, and lactic acid. J. Anim. Sci. 73(Suppl. 1):173 (Abstr.).
Kerr, B. J., and R. A. Easter. 1995. Effect of feeding reduced protein,amino acid-supplemented diets on nitrogen and energy balance ingrower pigs. J. Anim. Sci. 73:3000–3008.
Kornegay, E. T. 1978a. Feeding value and digestibility of soybean hullsfor swine. J. Anim. Sci. 47:1272–1280.
Kornegay, E. T. 1978b. Protein digestibility of hydrolyzed hog hair mealfor swine. Anim. Feed Sci. Technol. 3:323–328.
Kornegay, E. T. 1996. Nutritional, environmental and economical consid-erations for using phytase in pig diets. Pp. 279–304 in Nutrient Manage-ment of Food Animals to Enhance and Protect the Environment, E.T.Kornegay, ed. Boca Raton, FL: CRC Press Inc.
Kornegay, E. T., and A. F. Harper. 1997. Environmental nutrition: Nutri-ent management strategies to reduce nutrient excretion of swine. TheProfessional Animal Scientist 13:99–111.
LeMieux, F. M., L. V. Ellison, T. L. Ward, L. L. Southern, and T. D.Bidner. 1995. Excess dietary zinc for pigs weaned at 28 days. J. Anim.Sci. 74(Suppl. 1):72 (Abstr.).
Lei, X. G., P. . Ku, E. R. Miller, D. E. Ullrey, and M. T. Yokoyama. 1993.Supplemental microbial phytase improves bioavailability of dietary zincto weanling pigs. J. Nutr. 123:1117–1123.
Lei, X. G., P. K. Ku, E. R. Miller, M. T. Yokoyama, and D. E. Ullrey.1994. Calcium level affects the efficacy of supplemental microbialphytase in corn–soybean meal diets of weanling pigs. J. Anim. Sci.72:139–143.
Mroz, Z., A. W. Jongbloed, and P. A. Kemme. 1994. Apparent digestibilityand retention of nutrients bound to phytate complexes as influencedby microbial phytase and feeding regimen in pigs. J. Anim. Sci.72:126–132.
Mueller, J. P., J. P. Zublena, M. H. Poore, J. C. Barker, and J. T. Green.1994. Managing pasture and hay fields receiving nutrients for anaerobicswine waste lagoons. N.C. Cooperative Ext. Service, AG-506.
National Research Council. 1988. Nutrient Requirements of Swine.National Research Council, 9th revised ed. Washington, DC: NationalAcademy Press. 93 pp.
Pallauf, J., G. Rimbach, S. Pippig, B. Schindler, and E. Most. 1994. Effectof phytase supplementation to a phytate-rich diet based on wheat,barley and soya on the bioavailability of dietary phosphorus, calcium,magnesium, zinc and protein in piglets. Agribiol. Res. 47:39–48.
Pierzynski, G. M., J. T. Sims, and G. F. Vance. 1994. Soils and Environ-mental Quality. Boca Raton, FL: Lewis Publishers, CRC Press. 313 pp.
Radcliffe, J. S., E. T. Kornegay, and D. E. Conner, Jr. 1995. The effectof phytase on calcium release in weanling pigs fed corn–soybean mealdiets. J. Anim. Sci. 73(Suppl. 1):173 (Abstr.).
Sharpley, A. N., S. C. Chapra, R. Wedepohl, J. T. Sims, T. C. Daniel, andK. R. Reddy. 1994. Managing agricultural phosphorus for protection ofsurface waters: Issues and options. J. Environ. Qual. 23:437–451.
Smith, II, J. W., M. D. Tokach, R. D. Goodband, J. L. Nelssen, W. B.Nessmith, Jr., K. Q. Owen, and B. T. Richert. 1995. The effect ofincreasing zinc oxide supplementation on starter pig growth perfor-mance. J. Anim. Sci. 73(Suppl. 1):72 (Abstr.).
Spears, J. W. 1996. Optimizing mineral levels and sources for farm ani-mals. Pp. 259–276 in Nutrient Management of Food Animals toEnhance and Protect the Environment, E.T. Kornegay, ed. Boca Raton,FL: CRC Press, Inc.
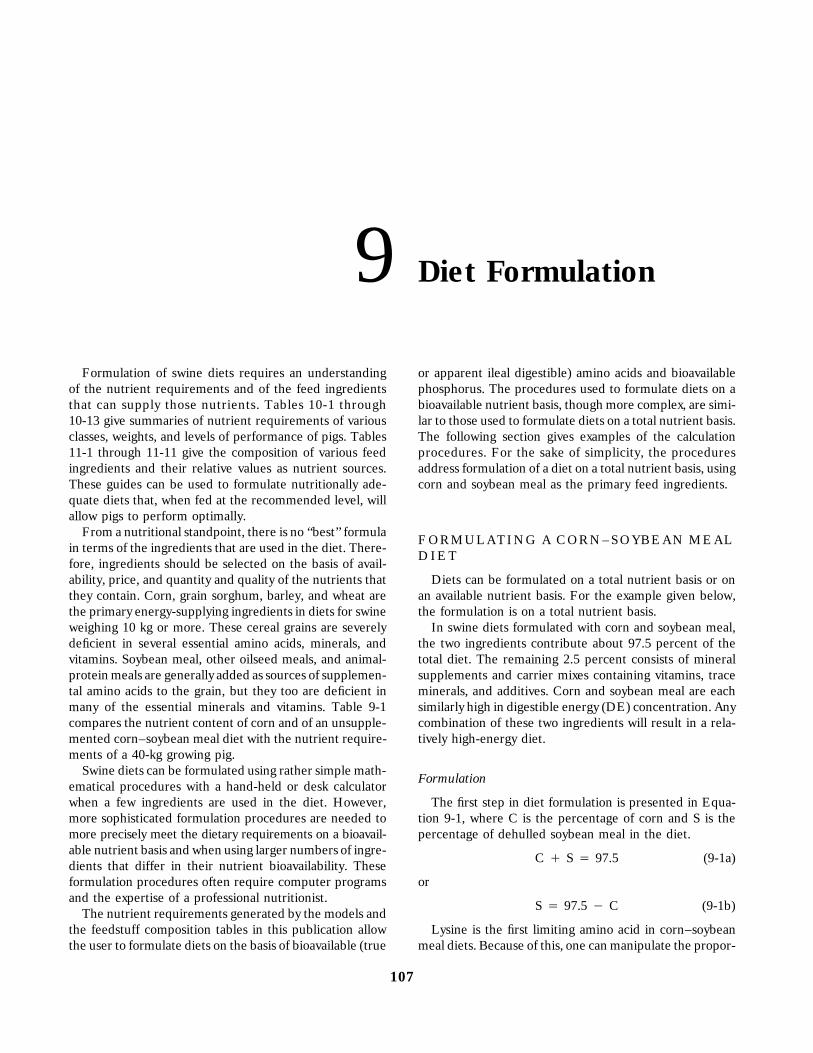
9 Diet Formulation
Formulation of swine diets requires an understandingof the nutrient requirements and of the feed ingredientsthat can supply those nutrients. Tables 10-1 through10-13 give summaries of nutrient requirements of variousclasses, weights, and levels of performance of pigs. Tables11-1 through 11-11 give the composition of various feedingredients and their relative values as nutrient sources.These guides can be used to formulate nutritionally ade-quate diets that, when fed at the recommended level, willallow pigs to perform optimally.
From a nutritional standpoint, there is no ‘‘best’’ formulain terms of the ingredients that are used in the diet. There-fore, ingredients should be selected on the basis of avail-ability, price, and quantity and quality of the nutrients thatthey contain. Corn, grain sorghum, barley, and wheat arethe primary energy-supplying ingredients in diets for swineweighing 10 kg or more. These cereal grains are severelydeficient in several essential amino acids, minerals, andvitamins. Soybean meal, other oilseed meals, and animal-protein meals are generally added as sources of supplemen-tal amino acids to the grain, but they too are deficient inmany of the essential minerals and vitamins. Table 9-1compares the nutrient content of corn and of an unsupple-mented corn–soybean meal diet with the nutrient require-ments of a 40-kg growing pig.
Swine diets can be formulated using rather simple math-ematical procedures with a hand-held or desk calculatorwhen a few ingredients are used in the diet. However,more sophisticated formulation procedures are needed tomore precisely meet the dietary requirements on a bioavail-able nutrient basis and when using larger numbers of ingre-dients that differ in their nutrient bioavailability. Theseformulation procedures often require computer programsand the expertise of a professional nutritionist.
The nutrient requirements generated by the models andthe feedstuff composition tables in this publication allowthe user to formulate diets on the basis of bioavailable (true
107
or apparent ileal digestible) amino acids and bioavailablephosphorus. The procedures used to formulate diets on abioavailable nutrient basis, though more complex, are simi-lar to those used to formulate diets on a total nutrient basis.The following section gives examples of the calculationprocedures. For the sake of simplicity, the proceduresaddress formulation of a diet on a total nutrient basis, usingcorn and soybean meal as the primary feed ingredients.
F OR MU L AT IN G A C OR N – S OY B EA N M E ALD IE T
Diets can be formulated on a total nutrient basis or onan available nutrient basis. For the example given below,the formulation is on a total nutrient basis.
In swine diets formulated with corn and soybean meal,the two ingredients contribute about 97.5 percent of thetotal diet. The remaining 2.5 percent consists of mineralsupplements and carrier mixes containing vitamins, traceminerals, and additives. Corn and soybean meal are eachsimilarly high in digestible energy (DE) concentration. Anycombination of these two ingredients will result in a rela-tively high-energy diet.
Formulation
The first step in diet formulation is presented in Equa-tion 9-1, where C is the percentage of corn and S is thepercentage of dehulled soybean meal in the diet.
C ` S 4 97.5 (9-1a)
or
S 4 97.5 1 C (9-1b)
Lysine is the first limiting amino acid in corn–soybeanmeal diets. Because of this, one can manipulate the propor-
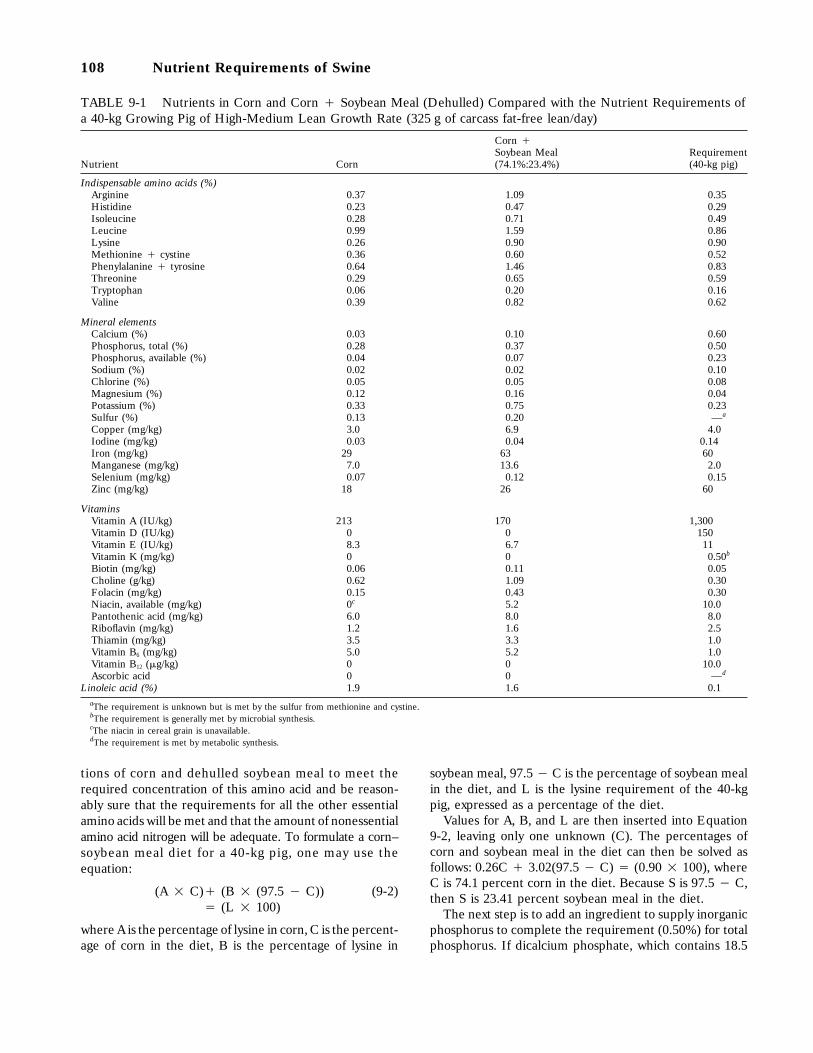
108 Nutrient Requirements of Swine
TABLE 9-1 Nutrients in Corn and Corn ` Soybean Meal (Dehulled) Compared with the Nutrient Requirements ofa 40-kg Growing Pig of High-Medium Lean Growth Rate (325 g of carcass fat-free lean/day)
Corn `Soybean Meal Requirement
Nutrient Corn (74.1%:23.4%) (40-kg pig)
Indispensable amino acids (%)Arginine 0.37 1.09 0.35Histidine 0.23 0.47 0.29Isoleucine 0.28 0.71 0.49Leucine 0.99 1.59 0.86Lysine 0.26 0.90 0.90Methionine ` cystine 0.36 0.60 0.52Phenylalanine ` tyrosine 0.64 1.46 0.83Threonine 0.29 0.65 0.59Tryptophan 0.06 0.20 0.16Valine 0.39 0.82 0.62
Mineral elementsCalcium (%) 0.03 0.10 0.60Phosphorus, total (%) 0.28 0.37 0.50Phosphorus, available (%) 0.04 0.07 0.23Sodium (%) 0.02 0.02 0.10Chlorine (%) 0.05 0.05 0.08Magnesium (%) 0.12 0.16 0.04Potassium (%) 0.33 0.75 0.23Sulfur (%) 0.13 0.20 —a
Copper (mg/kg) 3.0 6.9 4.0Iodine (mg/kg) 0.03 0.04 0.14Iron (mg/kg) 29 63 60Manganese (mg/kg) 7.0 13.6 2.0Selenium (mg/kg) 0.07 0.12 0.15Zinc (mg/kg) 18 26 60
VitaminsVitamin A (IU/kg) 213 170 1,300Vitamin D (IU/kg) 0 0 150Vitamin E (IU/kg) 8.3 6.7 11Vitamin K (mg/kg) 0 0 0.50b
Biotin (mg/kg) 0.06 0.11 0.05Choline (g/kg) 0.62 1.09 0.30Folacin (mg/kg) 0.15 0.43 0.30Niacin, available (mg/kg) 0c 5.2 10.0Pantothenic acid (mg/kg) 6.0 8.0 8.0Riboflavin (mg/kg) 1.2 1.6 2.5Thiamin (mg/kg) 3.5 3.3 1.0Vitamin B6 (mg/kg) 5.0 5.2 1.0Vitamin B12 (mg/kg) 0 0 10.0Ascorbic acid 0 0 —d
Linoleic acid (%) 1.9 1.6 0.1aThe requirement is unknown but is met by the sulfur from methionine and cystine.bThe requirement is generally met by microbial synthesis.cThe niacin in cereal grain is unavailable.dThe requirement is met by metabolic synthesis.
tions of corn and dehulled soybean meal to meet therequired concentration of this amino acid and be reason-ably sure that the requirements for all the other essentialamino acids will be met and that the amount of nonessentialamino acid nitrogen will be adequate. To formulate a corn–soybean meal diet for a 40-kg pig, one may use theequation:
(A 2 C)` (B 2 (97.5 1 C)) (9-2)4 (L 2 100)
where A is the percentage of lysine in corn, C is the percent-age of corn in the diet, B is the percentage of lysine in
soybean meal, 97.5 1 C is the percentage of soybean mealin the diet, and L is the lysine requirement of the 40-kgpig, expressed as a percentage of the diet.
Values for A, B, and L are then inserted into Equation9-2, leaving only one unknown (C). The percentages ofcorn and soybean meal in the diet can then be solved asfollows: 0.26C ` 3.02(97.5 1 C) 4 (0.90 2 100), whereC is 74.1 percent corn in the diet. Because S is 97.5 1 C,then S is 23.41 percent soybean meal in the diet.
The next step is to add an ingredient to supply inorganicphosphorus to complete the requirement (0.50%) for totalphosphorus. If dicalcium phosphate, which contains 18.5
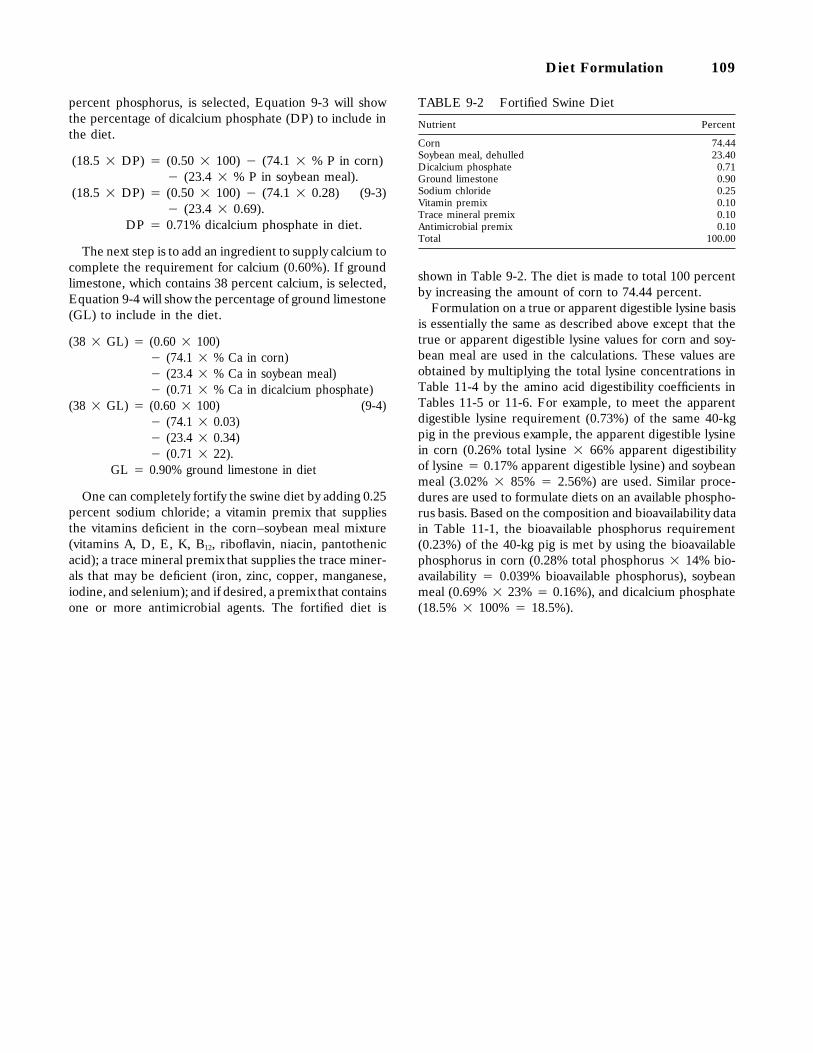
Diet Formulation 109
percent phosphorus, is selected, Equation 9-3 will showthe percentage of dicalcium phosphate (DP) to include inthe diet.
(18.5 2 DP) 4 (0.50 2 100) 1 (74.1 2 % P in corn)1 (23.4 2 % P in soybean meal).
(18.5 2 DP) 4 (0.50 2 100) 1 (74.1 2 0.28) (9-3)1 (23.4 2 0.69).
DP 4 0.71% dicalcium phosphate in diet.
The next step is to add an ingredient to supply calcium tocomplete the requirement for calcium (0.60%). If groundlimestone, which contains 38 percent calcium, is selected,Equation 9-4 will show the percentage of ground limestone(GL) to include in the diet.
(38 2 GL) 4 (0.60 2 100)1 (74.1 2 % Ca in corn)1 (23.4 2 % Ca in soybean meal)1 (0.71 2 % Ca in dicalcium phosphate)
(38 2 GL) 4 (0.60 2 100) (9-4)1 (74.1 2 0.03)1 (23.4 2 0.34)1 (0.71 2 22).
GL 4 0.90% ground limestone in diet
One can completely fortify the swine diet by adding 0.25percent sodium chloride; a vitamin premix that suppliesthe vitamins deficient in the corn–soybean meal mixture(vitamins A, D, E, K, B12, riboflavin, niacin, pantothenicacid); a trace mineral premix that supplies the trace miner-als that may be deficient (iron, zinc, copper, manganese,iodine, and selenium); and if desired, a premix that containsone or more antimicrobial agents. The fortified diet is
TABLE 9-2 Fortified Swine Diet
Nutrient Percent
Corn 74.44Soybean meal, dehulled 23.40Dicalcium phosphate 0.71Ground limestone 0.90Sodium chloride 0.25Vitamin premix 0.10Trace mineral premix 0.10Antimicrobial premix 0.10Total 100.00
shown in Table 9-2. The diet is made to total 100 percentby increasing the amount of corn to 74.44 percent.
Formulation on a true or apparent digestible lysine basisis essentially the same as described above except that thetrue or apparent digestible lysine values for corn and soy-bean meal are used in the calculations. These values areobtained by multiplying the total lysine concentrations inTable 11-4 by the amino acid digestibility coefficients inTables 11-5 or 11-6. For example, to meet the apparentdigestible lysine requirement (0.73%) of the same 40-kgpig in the previous example, the apparent digestible lysinein corn (0.26% total lysine 2 66% apparent digestibilityof lysine 4 0.17% apparent digestible lysine) and soybeanmeal (3.02% 2 85% 4 2.56%) are used. Similar proce-dures are used to formulate diets on an available phospho-rus basis. Based on the composition and bioavailability datain Table 11-1, the bioavailable phosphorus requirement(0.23%) of the 40-kg pig is met by using the bioavailablephosphorus in corn (0.28% total phosphorus 2 14% bio-availability 4 0.039% bioavailable phosphorus), soybeanmeal (0.69% 2 23% 4 0.16%), and dicalcium phosphate(18.5% 2 100% 4 18.5%).
NutrientRequirement10 Tables
Nutrient requirements for starting, growing, and finish-ing pigs, gestating and lactating sows, and sexually activeboars are provided in the tables of this chapter. Estimatesare listed for energy, amino acids, minerals, vitamins, andlinoleic acid. The amino acid requirements are expressedon a true and apparent ileal digestible basis, which appliesto all types of feed ingredients. They are also expressedon a total basis, which applies to a corn–soybean meal-based diet. For minerals and vitamins, the requirementsinclude the amounts of these nutrients that are providedby feed ingredients. Thus they are not estimates of nutrientquantities that should be added to diets.
Tables 10-1 to 10-6 give estimated requirements ofyoung weanling pigs from 3 to 20 kg, and of growing-finishing pigs from 20 to 120 kg body weight. The aminoacid requirements in Table 10-1 are generated by themodel described in Chapter 3 for pigs (equal ratio of bar-rows and gilts) of a high-medium lean growth rate (325 gof carcass fat-free gain/day) from 20 to 120 kg and housedunder ideal temperature and space conditions. Table10-3 gives separate requirements for barrows and gilts ofthree lean growth rates from 50 to 120 kg. Tables 10-2 and10-4 give estimated daily requirements of amino acids.Requirements for minerals, vitamins, and linoleic acid aregiven both on a dietary concentration (Table 10-5) anddaily intake (Table 10-6) basis.
Amino acid requirements, estimated by the sow models,for gestating sows of various breeding weights, gestationweight gains, and anticipated litter sizes and for lactatingsows of various postfarrowing weights, lactation weightchanges, and weight gains of their pigs are given in Tables10-7 through 10-10. The estimates are based on ideal tem-perature environments. Dietary concentrations and dailyintake requirements of minerals, vitamins, and linoleic acidare given in Tables 10-11 and 10-12, respectively. Table10-13 lists estimated requirements of sexually active boars.
110
The amino acid requirements in the tables are given asexamples. The models included in this publication allowthe user to generate tables of estimated amino acid require-ments for swine under various conditions (i.e., differentlean growth rates, feed intakes, energy density of diets,environmental temperature, floor space, etc.). The mineraland vitamin estimates in these tables, however, are thecommittee’s best estimates of the dietary requirements foraverage pigs under average conditions. The growth modelmay generate slightly different estimates of mineral andvitamin requirements because it uses an exponential equa-tion to estimate the requirements at various body weightsof growing pigs (3 to 120 kg), based on the coefficientsgiven in Table 3-2.
The requirements for certain minerals and/or vitaminsby pigs possessing a high lean growth rate, due to superiorgenetics or high health status, may be higher than thelevels shown in the tables, but definitive information wasnot available to estimate a higher quantitative requirement.Slightly higher levels of calcium and phosphorus thanshown in the tables are required by developing boars andreplacement gilts from 50 to 120 kg body weight, and sug-gestions are appropriately footnoted in Tables 10-5 and10-6.
The requirements listed in the following tables do notinclude any intentional surpluses. They are the committee’sbest estimates of minimum requirements. In practice, how-ever, a margin of safety is commonly added to the statedrequirements, and these levels are often referred to asnutrient ‘‘allowances.’’ Nutrient allowances are generallyestablished by professional nutritionists to account for vari-ability in nutrient composition and in nutrient bioavailabil-ity of feedstuffs, presence of inhibitors or toxins in ingredi-ents, inadequate processing or mixing of diets, partial lossof nutrients from storage, and other factors.
Because of these factors, the statement on a feed labelthat the product ‘‘meets or exceeds National Research
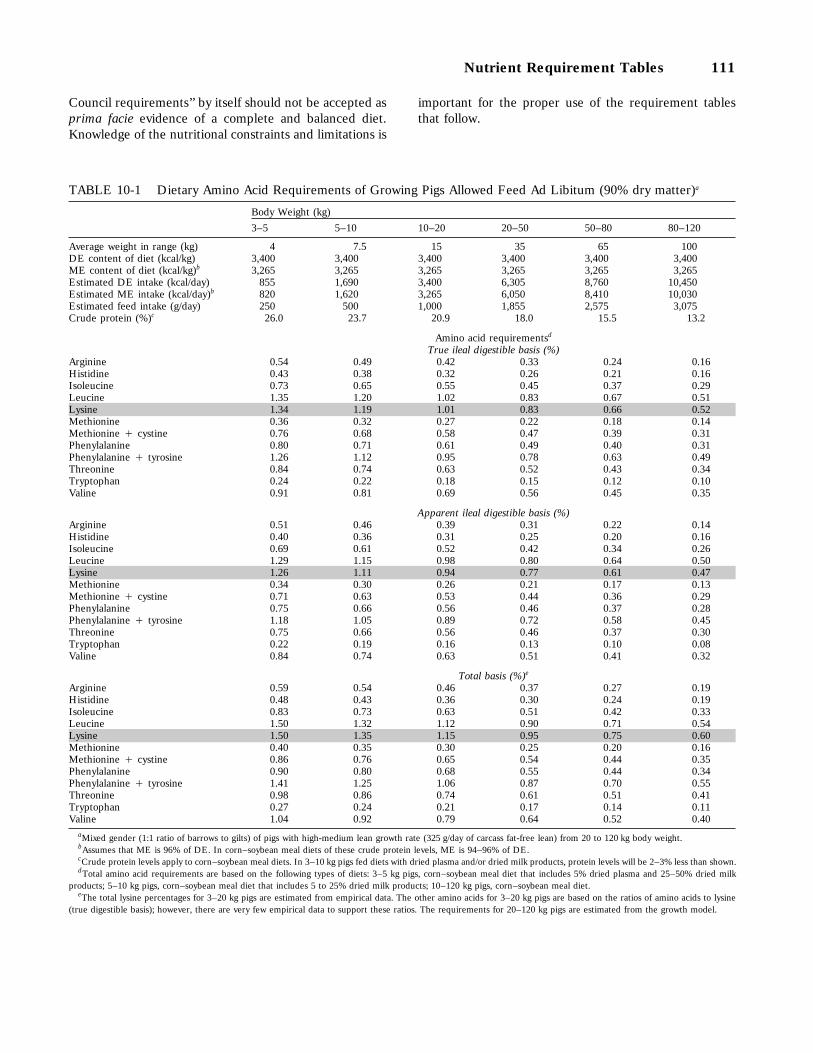
Nutrient Requirement Tables 111
Council requirements’’ by itself should not be accepted asprima facie evidence of a complete and balanced diet.Knowledge of the nutritional constraints and limitations is
TABLE 10-1 Dietary Amino Acid Requirements of Growing Pigs Allowed Feed Ad Libitum (90% dry matter)a
Body Weight (kg)3–5 5–10 10–20 20–50 50–80 80–120
Average weight in range (kg) 4 7.5 15 35 65 100DE content of diet (kcal/kg) 3,400 3,400 3,400 3,400 3,400 3,400ME content of diet (kcal/kg)b 3,265 3,265 3,265 3,265 3,265 3,265Estimated DE intake (kcal/day) 855 1,690 3,400 6,305 8,760 10,450Estimated ME intake (kcal/day)b 820 1,620 3,265 6,050 8,410 10,030Estimated feed intake (g/day) 250 500 1,000 1,855 2,575 3,075Crude protein (%)c 26.0 23.7 20.9 18.0 15.5 13.2
Amino acid requirementsd
True ileal digestible basis (%)Arginine 0.54 0.49 0.42 0.33 0.24 0.16Histidine 0.43 0.38 0.32 0.26 0.21 0.16Isoleucine 0.73 0.65 0.55 0.45 0.37 0.29Leucine 1.35 1.20 1.02 0.83 0.67 0.51Lysine 1.34 1.19 1.01 0.83 0.66 0.52Methionine 0.36 0.32 0.27 0.22 0.18 0.14Methionine ` cystine 0.76 0.68 0.58 0.47 0.39 0.31Phenylalanine 0.80 0.71 0.61 0.49 0.40 0.31Phenylalanine ` tyrosine 1.26 1.12 0.95 0.78 0.63 0.49Threonine 0.84 0.74 0.63 0.52 0.43 0.34Tryptophan 0.24 0.22 0.18 0.15 0.12 0.10Valine 0.91 0.81 0.69 0.56 0.45 0.35
Apparent ileal digestible basis (%)Arginine 0.51 0.46 0.39 0.31 0.22 0.14Histidine 0.40 0.36 0.31 0.25 0.20 0.16Isoleucine 0.69 0.61 0.52 0.42 0.34 0.26Leucine 1.29 1.15 0.98 0.80 0.64 0.50Lysine 1.26 1.11 0.94 0.77 0.61 0.47Methionine 0.34 0.30 0.26 0.21 0.17 0.13Methionine ` cystine 0.71 0.63 0.53 0.44 0.36 0.29Phenylalanine 0.75 0.66 0.56 0.46 0.37 0.28Phenylalanine ` tyrosine 1.18 1.05 0.89 0.72 0.58 0.45Threonine 0.75 0.66 0.56 0.46 0.37 0.30Tryptophan 0.22 0.19 0.16 0.13 0.10 0.08Valine 0.84 0.74 0.63 0.51 0.41 0.32
Total basis (%)e
Arginine 0.59 0.54 0.46 0.37 0.27 0.19Histidine 0.48 0.43 0.36 0.30 0.24 0.19Isoleucine 0.83 0.73 0.63 0.51 0.42 0.33Leucine 1.50 1.32 1.12 0.90 0.71 0.54Lysine 1.50 1.35 1.15 0.95 0.75 0.60Methionine 0.40 0.35 0.30 0.25 0.20 0.16Methionine ` cystine 0.86 0.76 0.65 0.54 0.44 0.35Phenylalanine 0.90 0.80 0.68 0.55 0.44 0.34Phenylalanine ` tyrosine 1.41 1.25 1.06 0.87 0.70 0.55Threonine 0.98 0.86 0.74 0.61 0.51 0.41Tryptophan 0.27 0.24 0.21 0.17 0.14 0.11Valine 1.04 0.92 0.79 0.64 0.52 0.40
aMixed gender (1:1 ratio of barrows to gilts) of pigs with high-medium lean growth rate (325 g/day of carcass fat-free lean) from 20 to 120 kg body weight.bAssumes that ME is 96% of DE. In corn–soybean meal diets of these crude protein levels, ME is 94–96% of DE.cCrude protein levels apply to corn–soybean meal diets. In 3–10 kg pigs fed diets with dried plasma and/or dried milk products, protein levels will be 2–3% less than shown.dTotal amino acid requirements are based on the following types of diets: 3–5 kg pigs, corn–soybean meal diet that includes 5% dried plasma and 25–50% dried milk
products; 5–10 kg pigs, corn–soybean meal diet that includes 5 to 25% dried milk products; 10–120 kg pigs, corn–soybean meal diet.eThe total lysine percentages for 3–20 kg pigs are estimated from empirical data. The other amino acids for 3–20 kg pigs are based on the ratios of amino acids to lysine
(true digestible basis); however, there are very few empirical data to support these ratios. The requirements for 20–120 kg pigs are estimated from the growth model.
important for the proper use of the requirement tablesthat follow.
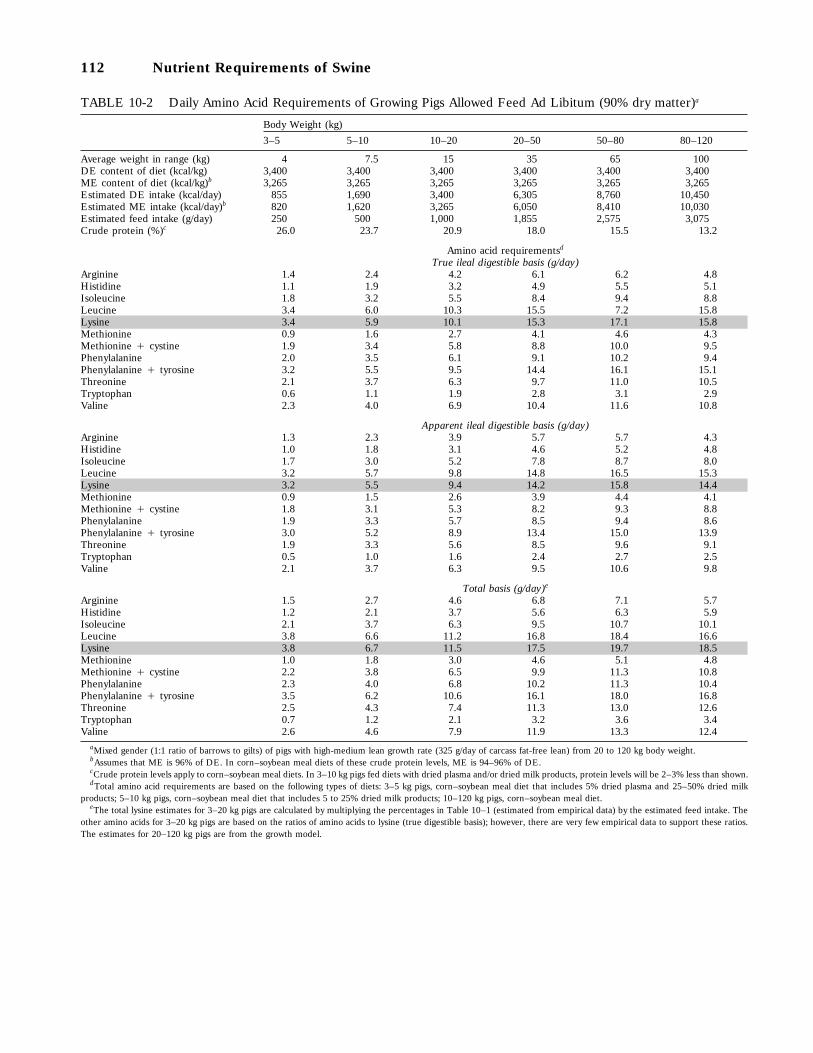
112 Nutrient Requirements of Swine
TABLE 10-2 Daily Amino Acid Requirements of Growing Pigs Allowed Feed Ad Libitum (90% dry matter)a
Body Weight (kg)3–5 5–10 10–20 20–50 50–80 80–120
Average weight in range (kg) 4 7.5 15 35 65 100DE content of diet (kcal/kg) 3,400 3,400 3,400 3,400 3,400 3,400ME content of diet (kcal/kg)b 3,265 3,265 3,265 3,265 3,265 3,265Estimated DE intake (kcal/day) 855 1,690 3,400 6,305 8,760 10,450Estimated ME intake (kcal/day)b 820 1,620 3,265 6,050 8,410 10,030Estimated feed intake (g/day) 250 500 1,000 1,855 2,575 3,075Crude protein (%)c 26.0 23.7 20.9 18.0 15.5 13.2
Amino acid requirementsd
True ileal digestible basis (g/day)Arginine 1.4 2.4 4.2 6.1 6.2 4.8Histidine 1.1 1.9 3.2 4.9 5.5 5.1Isoleucine 1.8 3.2 5.5 8.4 9.4 8.8Leucine 3.4 6.0 10.3 15.5 7.2 15.8Lysine 3.4 5.9 10.1 15.3 17.1 15.8Methionine 0.9 1.6 2.7 4.1 4.6 4.3Methionine ` cystine 1.9 3.4 5.8 8.8 10.0 9.5Phenylalanine 2.0 3.5 6.1 9.1 10.2 9.4Phenylalanine ` tyrosine 3.2 5.5 9.5 14.4 16.1 15.1Threonine 2.1 3.7 6.3 9.7 11.0 10.5Tryptophan 0.6 1.1 1.9 2.8 3.1 2.9Valine 2.3 4.0 6.9 10.4 11.6 10.8
Apparent ileal digestible basis (g/day)Arginine 1.3 2.3 3.9 5.7 5.7 4.3Histidine 1.0 1.8 3.1 4.6 5.2 4.8Isoleucine 1.7 3.0 5.2 7.8 8.7 8.0Leucine 3.2 5.7 9.8 14.8 16.5 15.3Lysine 3.2 5.5 9.4 14.2 15.8 14.4Methionine 0.9 1.5 2.6 3.9 4.4 4.1Methionine ` cystine 1.8 3.1 5.3 8.2 9.3 8.8Phenylalanine 1.9 3.3 5.7 8.5 9.4 8.6Phenylalanine ` tyrosine 3.0 5.2 8.9 13.4 15.0 13.9Threonine 1.9 3.3 5.6 8.5 9.6 9.1Tryptophan 0.5 1.0 1.6 2.4 2.7 2.5Valine 2.1 3.7 6.3 9.5 10.6 9.8
Total basis (g/day)e
Arginine 1.5 2.7 4.6 6.8 7.1 5.7Histidine 1.2 2.1 3.7 5.6 6.3 5.9Isoleucine 2.1 3.7 6.3 9.5 10.7 10.1Leucine 3.8 6.6 11.2 16.8 18.4 16.6Lysine 3.8 6.7 11.5 17.5 19.7 18.5Methionine 1.0 1.8 3.0 4.6 5.1 4.8Methionine ` cystine 2.2 3.8 6.5 9.9 11.3 10.8Phenylalanine 2.3 4.0 6.8 10.2 11.3 10.4Phenylalanine ` tyrosine 3.5 6.2 10.6 16.1 18.0 16.8Threonine 2.5 4.3 7.4 11.3 13.0 12.6Tryptophan 0.7 1.2 2.1 3.2 3.6 3.4Valine 2.6 4.6 7.9 11.9 13.3 12.4
aMixed gender (1:1 ratio of barrows to gilts) of pigs with high-medium lean growth rate (325 g/day of carcass fat-free lean) from 20 to 120 kg body weight.bAssumes that ME is 96% of DE. In corn–soybean meal diets of these crude protein levels, ME is 94–96% of DE.cCrude protein levels apply to corn–soybean meal diets. In 3–10 kg pigs fed diets with dried plasma and/or dried milk products, protein levels will be 2–3% less than shown.dTotal amino acid requirements are based on the following types of diets: 3–5 kg pigs, corn–soybean meal diet that includes 5% dried plasma and 25–50% dried milk
products; 5–10 kg pigs, corn–soybean meal diet that includes 5 to 25% dried milk products; 10–120 kg pigs, corn–soybean meal diet.eThe total lysine estimates for 3–20 kg pigs are calculated by multiplying the percentages in Table 10–1 (estimated from empirical data) by the estimated feed intake. The
other amino acids for 3–20 kg pigs are based on the ratios of amino acids to lysine (true digestible basis); however, there are very few empirical data to support these ratios.The estimates for 20–120 kg pigs are from the growth model.
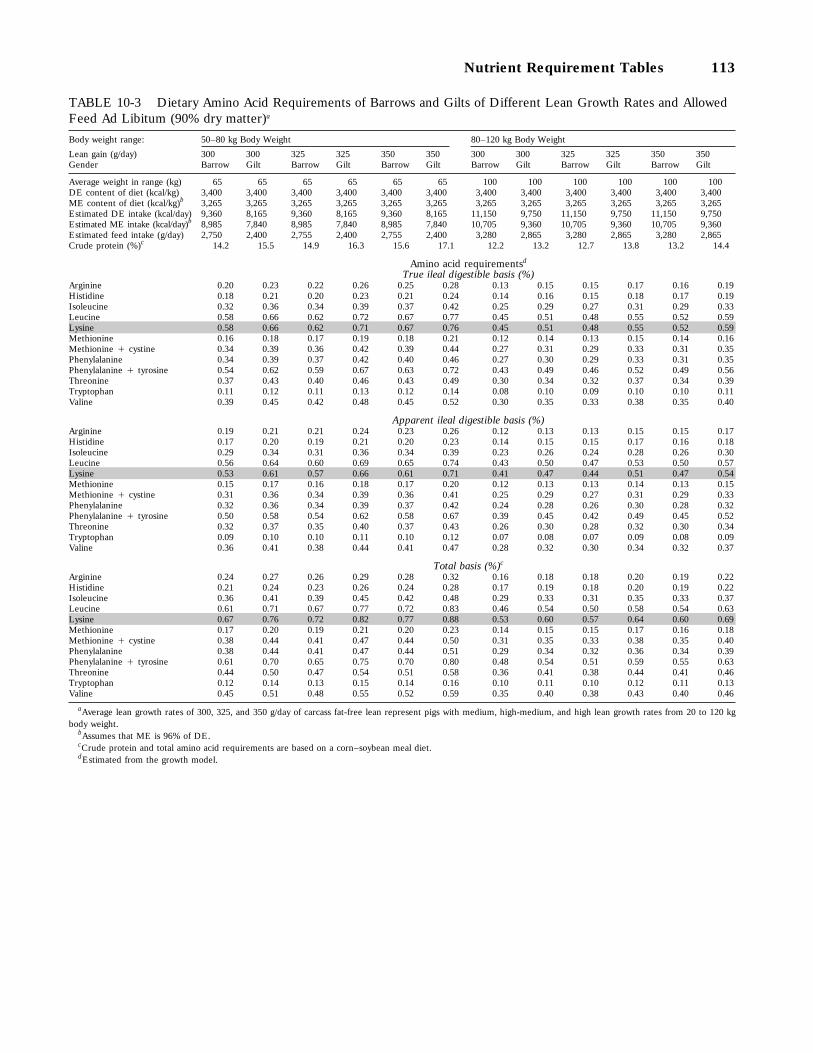
Nutrient Requirement Tables 113
TABLE 10-3 Dietary Amino Acid Requirements of Barrows and Gilts of Different Lean Growth Rates and AllowedFeed Ad Libitum (90% dry matter)a
50–80 kg Body Weight 80–120 kg Body WeightBody weight range:
Lean gain (g/day) 300 300 325 325 350 350 300 300 325 325 350 350Gender Barrow Gilt Barrow Gilt Barrow Gilt Barrow Gilt Barrow Gilt Barrow Gilt
Average weight in range (kg) 65 65 65 65 65 65 100 100 100 100 100 100DE content of diet (kcal/kg) 3,400 3,400 3,400 3,400 3,400 3,400 3,400 3,400 3,400 3,400 3,400 3,400ME content of diet (kcal/kg)b 3,265 3,265 3,265 3,265 3,265 3,265 3,265 3,265 3,265 3,265 3,265 3,265Estimated DE intake (kcal/day) 9,360 8,165 9,360 8,165 9,360 8,165 11,150 9,750 11,150 9,750 11,150 9,750Estimated ME intake (kcal/day)b 8,985 7,840 8,985 7,840 8,985 7,840 10,705 9,360 10,705 9,360 10,705 9,360Estimated feed intake (g/day) 2,750 2,400 2,755 2,400 2,755 2,400 3,280 2,865 3,280 2,865 3,280 2,865Crude protein (%)c 14.2 15.5 14.9 16.3 15.6 17.1 12.2 13.2 12.7 13.8 13.2 14.4
Amino acid requirementsd
True ileal digestible basis (%)Arginine 0.20 0.23 0.22 0.26 0.25 0.28 0.13 0.15 0.15 0.17 0.16 0.19Histidine 0.18 0.21 0.20 0.23 0.21 0.24 0.14 0.16 0.15 0.18 0.17 0.19Isoleucine 0.32 0.36 0.34 0.39 0.37 0.42 0.25 0.29 0.27 0.31 0.29 0.33Leucine 0.58 0.66 0.62 0.72 0.67 0.77 0.45 0.51 0.48 0.55 0.52 0.59Lysine 0.58 0.66 0.62 0.71 0.67 0.76 0.45 0.51 0.48 0.55 0.52 0.59Methionine 0.16 0.18 0.17 0.19 0.18 0.21 0.12 0.14 0.13 0.15 0.14 0.16Methionine ` cystine 0.34 0.39 0.36 0.42 0.39 0.44 0.27 0.31 0.29 0.33 0.31 0.35Phenylalanine 0.34 0.39 0.37 0.42 0.40 0.46 0.27 0.30 0.29 0.33 0.31 0.35Phenylalanine ` tyrosine 0.54 0.62 0.59 0.67 0.63 0.72 0.43 0.49 0.46 0.52 0.49 0.56Threonine 0.37 0.43 0.40 0.46 0.43 0.49 0.30 0.34 0.32 0.37 0.34 0.39Tryptophan 0.11 0.12 0.11 0.13 0.12 0.14 0.08 0.10 0.09 0.10 0.10 0.11Valine 0.39 0.45 0.42 0.48 0.45 0.52 0.30 0.35 0.33 0.38 0.35 0.40
Apparent ileal digestible basis (%)Arginine 0.19 0.21 0.21 0.24 0.23 0.26 0.12 0.13 0.13 0.15 0.15 0.17Histidine 0.17 0.20 0.19 0.21 0.20 0.23 0.14 0.15 0.15 0.17 0.16 0.18Isoleucine 0.29 0.34 0.31 0.36 0.34 0.39 0.23 0.26 0.24 0.28 0.26 0.30Leucine 0.56 0.64 0.60 0.69 0.65 0.74 0.43 0.50 0.47 0.53 0.50 0.57Lysine 0.53 0.61 0.57 0.66 0.61 0.71 0.41 0.47 0.44 0.51 0.47 0.54Methionine 0.15 0.17 0.16 0.18 0.17 0.20 0.12 0.13 0.13 0.14 0.13 0.15Methionine ` cystine 0.31 0.36 0.34 0.39 0.36 0.41 0.25 0.29 0.27 0.31 0.29 0.33Phenylalanine 0.32 0.36 0.34 0.39 0.37 0.42 0.24 0.28 0.26 0.30 0.28 0.32Phenylalanine ` tyrosine 0.50 0.58 0.54 0.62 0.58 0.67 0.39 0.45 0.42 0.49 0.45 0.52Threonine 0.32 0.37 0.35 0.40 0.37 0.43 0.26 0.30 0.28 0.32 0.30 0.34Tryptophan 0.09 0.10 0.10 0.11 0.10 0.12 0.07 0.08 0.07 0.09 0.08 0.09Valine 0.36 0.41 0.38 0.44 0.41 0.47 0.28 0.32 0.30 0.34 0.32 0.37
Total basis (%)c
Arginine 0.24 0.27 0.26 0.29 0.28 0.32 0.16 0.18 0.18 0.20 0.19 0.22Histidine 0.21 0.24 0.23 0.26 0.24 0.28 0.17 0.19 0.18 0.20 0.19 0.22Isoleucine 0.36 0.41 0.39 0.45 0.42 0.48 0.29 0.33 0.31 0.35 0.33 0.37Leucine 0.61 0.71 0.67 0.77 0.72 0.83 0.46 0.54 0.50 0.58 0.54 0.63Lysine 0.67 0.76 0.72 0.82 0.77 0.88 0.53 0.60 0.57 0.64 0.60 0.69Methionine 0.17 0.20 0.19 0.21 0.20 0.23 0.14 0.15 0.15 0.17 0.16 0.18Methionine ` cystine 0.38 0.44 0.41 0.47 0.44 0.50 0.31 0.35 0.33 0.38 0.35 0.40Phenylalanine 0.38 0.44 0.41 0.47 0.44 0.51 0.29 0.34 0.32 0.36 0.34 0.39Phenylalanine ` tyrosine 0.61 0.70 0.65 0.75 0.70 0.80 0.48 0.54 0.51 0.59 0.55 0.63Threonine 0.44 0.50 0.47 0.54 0.51 0.58 0.36 0.41 0.38 0.44 0.41 0.46Tryptophan 0.12 0.14 0.13 0.15 0.14 0.16 0.10 0.11 0.10 0.12 0.11 0.13Valine 0.45 0.51 0.48 0.55 0.52 0.59 0.35 0.40 0.38 0.43 0.40 0.46
aAverage lean growth rates of 300, 325, and 350 g/day of carcass fat-free lean represent pigs with medium, high-medium, and high lean growth rates from 20 to 120 kgbody weight.
bAssumes that ME is 96% of DE.cCrude protein and total amino acid requirements are based on a corn–soybean meal diet.dEstimated from the growth model.
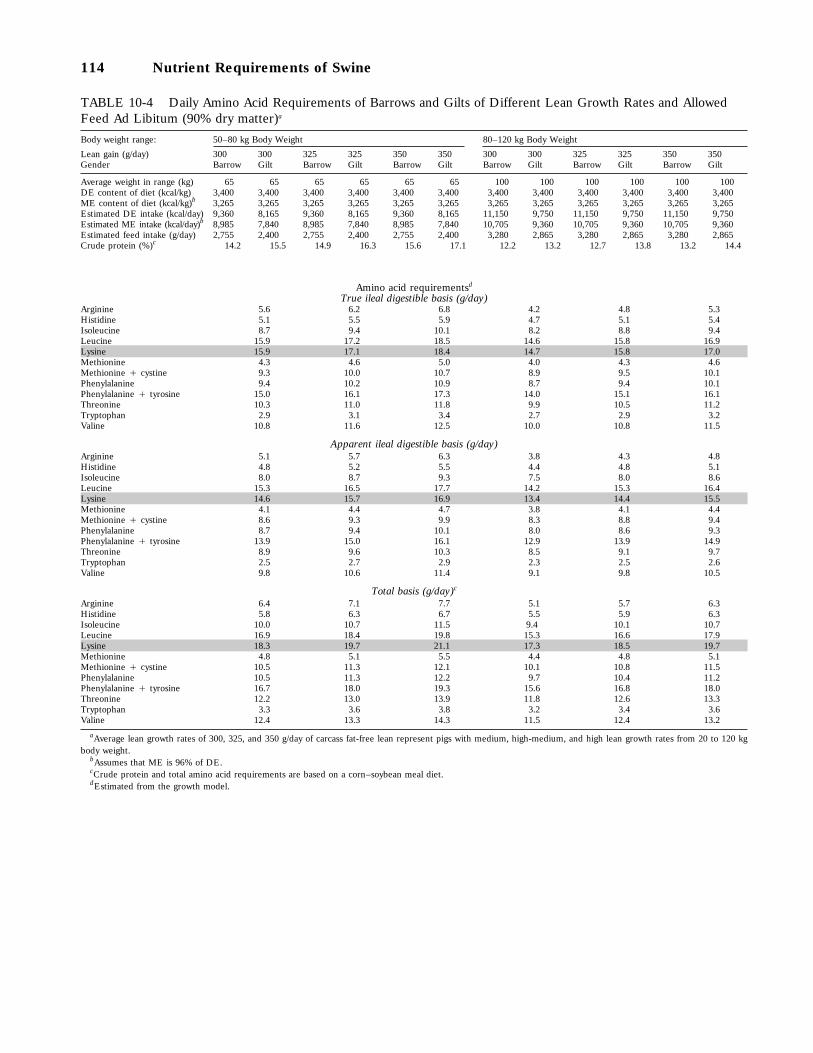
114 Nutrient Requirements of Swine
TABLE 10-4 Daily Amino Acid Requirements of Barrows and Gilts of Different Lean Growth Rates and AllowedFeed Ad Libitum (90% dry matter)a
Body weight range: 50–80 kg Body Weight 80–120 kg Body Weight
Lean gain (g/day) 300 300 325 325 350 350 300 300 325 325 350 350Gender Barrow Gilt Barrow Gilt Barrow Gilt Barrow Gilt Barrow Gilt Barrow Gilt
Average weight in range (kg) 65 65 65 65 65 65 100 100 100 100 100 100DE content of diet (kcal/kg) 3,400 3,400 3,400 3,400 3,400 3,400 3,400 3,400 3,400 3,400 3,400 3,400ME content of diet (kcal/kg)b 3,265 3,265 3,265 3,265 3,265 3,265 3,265 3,265 3,265 3,265 3,265 3,265Estimated DE intake (kcal/day) 9,360 8,165 9,360 8,165 9,360 8,165 11,150 9,750 11,150 9,750 11,150 9,750Estimated ME intake (kcal/day)b 8,985 7,840 8,985 7,840 8,985 7,840 10,705 9,360 10,705 9,360 10,705 9,360Estimated feed intake (g/day) 2,755 2,400 2,755 2,400 2,755 2,400 3,280 2,865 3,280 2,865 3,280 2,865Crude protein (%)c 14.2 15.5 14.9 16.3 15.6 17.1 12.2 13.2 12.7 13.8 13.2 14.4
Amino acid requirementsd
True ileal digestible basis (g/day)Arginine 5.6 6.2 6.8 4.2 4.8 5.3Histidine 5.1 5.5 5.9 4.7 5.1 5.4Isoleucine 8.7 9.4 10.1 8.2 8.8 9.4Leucine 15.9 17.2 18.5 14.6 15.8 16.9Lysine 15.9 17.1 18.4 14.7 15.8 17.0Methionine 4.3 4.6 5.0 4.0 4.3 4.6Methionine ` cystine 9.3 10.0 10.7 8.9 9.5 10.1Phenylalanine 9.4 10.2 10.9 8.7 9.4 10.1Phenylalanine ` tyrosine 15.0 16.1 17.3 14.0 15.1 16.1Threonine 10.3 11.0 11.8 9.9 10.5 11.2Tryptophan 2.9 3.1 3.4 2.7 2.9 3.2Valine 10.8 11.6 12.5 10.0 10.8 11.5
Apparent ileal digestible basis (g/day)Arginine 5.1 5.7 6.3 3.8 4.3 4.8Histidine 4.8 5.2 5.5 4.4 4.8 5.1Isoleucine 8.0 8.7 9.3 7.5 8.0 8.6Leucine 15.3 16.5 17.7 14.2 15.3 16.4Lysine 14.6 15.7 16.9 13.4 14.4 15.5Methionine 4.1 4.4 4.7 3.8 4.1 4.4Methionine ` cystine 8.6 9.3 9.9 8.3 8.8 9.4Phenylalanine 8.7 9.4 10.1 8.0 8.6 9.3Phenylalanine ` tyrosine 13.9 15.0 16.1 12.9 13.9 14.9Threonine 8.9 9.6 10.3 8.5 9.1 9.7Tryptophan 2.5 2.7 2.9 2.3 2.5 2.6Valine 9.8 10.6 11.4 9.1 9.8 10.5
Total basis (g/day)c
Arginine 6.4 7.1 7.7 5.1 5.7 6.3Histidine 5.8 6.3 6.7 5.5 5.9 6.3Isoleucine 10.0 10.7 11.5 9.4 10.1 10.7Leucine 16.9 18.4 19.8 15.3 16.6 17.9Lysine 18.3 19.7 21.1 17.3 18.5 19.7Methionine 4.8 5.1 5.5 4.4 4.8 5.1Methionine ` cystine 10.5 11.3 12.1 10.1 10.8 11.5Phenylalanine 10.5 11.3 12.2 9.7 10.4 11.2Phenylalanine ` tyrosine 16.7 18.0 19.3 15.6 16.8 18.0Threonine 12.2 13.0 13.9 11.8 12.6 13.3Tryptophan 3.3 3.6 3.8 3.2 3.4 3.6Valine 12.4 13.3 14.3 11.5 12.4 13.2
aAverage lean growth rates of 300, 325, and 350 g/day of carcass fat-free lean represent pigs with medium, high-medium, and high lean growth rates from 20 to 120 kgbody weight.
bAssumes that ME is 96% of DE.cCrude protein and total amino acid requirements are based on a corn–soybean meal diet.dEstimated from the growth model.

Nutrient Requirement Tables 115
TABLE 10-5 Dietary Mineral, Vitamin, and Fatty Acid Requirements of Growing Pigs Allowed Feed Ad Libitum(90% dry matter)a
Body Weight (kg)3–5 5–10 10–20 20–50 50–80 80–120
Average weight in range (kg) 4 7.5 15 35 65 100DE content of diet (kcal/kg) 3,400 3,400 3,400 3,400 3,400 3,400ME content of diet (kcal/kg)b 3,265 3,265 3,265 3,265 3,265 3,265Estimated DE intake (kcal/day) 855 1,690 3,400 6,305 8,760 10,450Estimated ME intake (kcal/day)b 820 1,620 3,265 6,050 8,410 10,030Estimated feed intake (g/day) 250 500 1,000 1,855 2,575 3,075
Requirements (% or amount/kg of diet)Mineral elements
Calcium (%)c 0.90 0.80 0.70 0.60 0.50 0.45Phosphorus, total (%)c 0.70 0.65 0.60 0.50 0.45 0.40Phosphorus, available (%)c 0.55 0.40 0.32 0.23 0.19 0.15Sodium (%) 0.25 0.20 0.15 0.10 0.10 0.10Chlorine (%) 0.25 0.20 0.15 0.08 0.08 0.08Magnesium (%) 0.04 0.04 0.04 0.04 0.04 0.04Potassium (%) 0.30 0.28 0.26 0.23 0.19 0.17Copper (mg) 6.00 6.00 5.00 4.00 3.50 3.00Iodine (mg) 0.14 0.14 0.14 0.14 0.14 0.14Iron (mg) 100 100 80 60 50 40Manganese (mg) 4.00 4.00 3.00 2.00 2.00 2.00Selenium (mg) 0.30 0.30 0.25 0.15 0.15 0.15Zinc (mg) 100 100 80 60 50 50
VitaminsVitamin A (IU)d 2,200 2,200 1,750 1,300 1,300 1,300Vitamin D3 (IU)d 220 220 200 150 150 150Vitamin E (IU)d 16 16 11 11 11 11Vitamin K (menadione) (mg) 0.50 0.50 0.50 0.50 0.50 0.50Biotin (mg) 0.08 0.05 0.05 0.05 0.05 0.05Choline (g) 0.60 0.50 0.40 0.30 0.30 0.30Folacin (mg) 0.30 0.30 0.30 0.30 0.30 0.30Niacin, available (mg)e 20.00 15.00 12.50 10.00 7.00 7.00Pantothenic acid (mg) 12.00 10.00 9.00 8.00 7.00 7.00Riboflavin (mg) 4.00 3.50 3.00 2.50 2.00 2.00Thiamin (mg) 1.50 1.00 1.00 1.00 1.00 1.00Vitamin B6 (mg) 2.00 1.50 1.50 1.00 1.00 1.00Vitamin B12 (mg) 20.00 17.50 15.00 10.00 5.00 5.00
Linoleic acid (%) 0.10 0.10 0.10 0.10 0.10 0.10aPigs of mixed gender (1:1 ratio of barrows to gilts). The requirements of certain minerals and vitamins may be slightly higher for pigs having high lean growth rates (.325
g/day of carcass fat-free lean), but no distinction is made.bAssumes that ME is 96% of DE. In corn–soybean meal diets, ME is 94–96% of DE, depending on crude protein level of the diet.cThe percentages of calcium, phosphorus, and available phosphorus should be increased by 0.05 to 0.1 percentage points for developing boars and replacement gilts from
50 to 120 kg body weight.dConversions: 1 IU vitamin A 4 0.344 mg (g retinyl acetate; 1 IU vitamin D3 4 0.025 mg cholecalciferol; 1 IU vitamin E 4 0.67 mg of D-a-tocopherol or 1 mg of DL-
a-tocopheryl acetate.eThe niacin in corn, grain sorghum, wheat, and barley is unavailable. Similarly, the niacin in by-products made from these cereal grains is poorly available unless the by-
products have undergone a fermentation or wet-milling process.

116 Nutrient Requirements of Swine
TABLE 10-6 Daily Mineral, Vitamin, and Fatty Acid Requirements of Growing Pigs Allowed Feed Ad Libitum (90%dry matter)a
Body Weight (kg)3–5 5–10 10–20 20–50 50–80 80–120
Average weight in range (kg) 4 7.5 15 35 65 100DE content of diet (kcal/kg) 3,400 3,400 3,400 3,400 3,400 3,400ME content of diet (kcal/kg)b 3,265 3,265 3,265 3,265 3,265 3,265Estimated DE intake (kcal/day) 855 1,690 3,400 6,305 8,760 10,450Estimated ME intake (kcal/day)b 820 1,620 3,265 6,050 8,410 10,030Estimated feed intake (g/day) 250 500 1,000 1,855 2,575 3,075
Requirements (amount/day)Mineral elements
Calcium (g)c 2.25 4.00 7.00 11.13 12.88 13.84Phosphorus, total (g)c 1.75 3.25 6.00 9.28 11.59 12.30Phosphorus, available (g)c 1.38 2.00 3.20 4.27 4.89 4.61Sodium (g) 0.63 1.00 1.50 1.86 2.58 3.08Chlorine (g) 0.63 1.00 1.50 1.48 2.06 2.46Magnesium (g) 0.10 0.20 0.40 0.74 1.03 1.23Potassium (g) 0.75 1.40 2.60 4.27 4.89 5.23Copper (mg) 1.50 3.00 5.00 7.42 9.01 9.23Iodine (mg) 0.04 0.07 0.14 0.26 0.36 0.43Iron (mg) 25.00 50.00 80.00 111.30 129.75 123.00Manganese (mg) 1.00 2.00 3.00 3.71 5.15 6.15Selenium (mg) 0.08 0.15 0.25 0.28 0.39 0.46Zinc (mg) 25.00 50.00 80.00 111.30 129.75 153.75
VitaminsVitamin A (IU)d 550 1,100 1,750 2,412 3,348 3,998Vitamin D3 (IU)d 55 110 200 278 386 461Vitamin E (IU)d 4 8 11 20 28 34Vitamin K (menadione) (mg) 0.13 0.25 0.50 0.93 1.29 1.54Biotin (mg) 0.02 0.03 0.05 0.09 0.13 0.15Choline (g) 0.15 0.25 0.40 0.56 0.77 0.92Folacin (mg) 0.08 0.15 0.30 0.56 0.77 0.92Niacin, available (mg)e 5.00 7.50 12.50 18.55 18.03 21.53Pantothenic acid (mg) 3.00 5.00 9.00 14.84 18.03 21.53Riboflavin (mg) 1.00 1.75 3.00 4.64 5.15 6.15Thiamin (mg) 0.38 0.50 1.00 1.86 2.58 3.08Vitamin B6 (mg) 0.50 0.75 1.50 1.86 2.58 3.08Vitamin B12 (mg) 5.00 8.75 15.00 18.55 12.88 15.38
Linoleic acid (g) 0.25 0.50 1.00 1.86 2.58 3.08aPigs of mixed gender (1:1 ratio of barrows to gilts). The daily requirements of certain minerals and vitamins may be slightly higher for pigs having high lean growth rates
(.325 g/day of carcass fat-free lean), but no distinction is made.bAssumes that ME is 96% of DE. In corn–soybean meal diets, ME is 94–96% of DE, depending on crude protein level of the diet.cThe daily amounts of calcium, phosphorus, and available phosphorus are slightly higher in developing boars and gilts from 50 to 120 kg body weight.dConversions: 1 IU vitamin A 4 0.344 mg (g retinyl acetate; 1 IU vitamin D3 4 0.025 mg cholecalciferol; 1 IU vitamin E 4 0.67 mg of D-a-tocopherol or 1 mg of DL-
a-tocopheryl acetate.eThe niacin in corn, grain sorghum, wheat, and barley is unavailable. Similarly, the niacin in by-products made from these cereal grains is poorly available unless the by-
products have undergone a fermentation or wet-milling process.

Nutrient Requirement Tables 117
TABLE 10-7 Dietary Amino Acid Requirements of Gestating Sows (90% dry matter)a
Body Weight at Breeding (kg)125 150 175 200 200 200Gestation Weight Gain (kg)b
55 45 40 35 30 35Anticipated Pigs in Litter11 12 12 12 12 14
DE content of diet (kcal/kg) 3,400 3,400 3,400 3,400 3,400 3,400ME content of diet (kcal/kg)c 3,265 3,265 3,265 3,265 3,265 3,265Estimated DE intake (kcal/day) 6,660 6,265 6,405 6,535 6,115 6,275Estimated ME intake (kcal/day)c 6,395 6,015 6,150 6,275 5,870 6,025Estimated feed intake (kg/day) 1.96 1.84 1.88 1.92 1.80 1.85Crude protein (%)d 12.9 12.8 12.4 12.0 12.1 12.4
Amino acid requirementsTrue ileal digestible basis (%)
Arginine 0.04 0.00 0.00 0.00 0.00 0.00Histidine 0.16 0.16 0.15 0.14 0.14 0.15Isoleucine 0.29 0.28 0.27 0.26 0.26 0.27Leucine 0.48 0.47 0.44 0.41 0.41 0.44Lysine 0.50 0.49 0.46 0.44 0.44 0.46Methionine 0.14 0.13 0.13 0.12 0.12 0.13Methionine ` cystine 0.33 0.33 0.32 0.31 0.32 0.33Phenylalanine 0.29 0.28 0.27 0.25 0.25 0.27Phenylalanine ` tyrosine 0.48 0.48 0.46 0.44 0.44 0.46Threonine 0.37 0.38 0.37 0.36 0.37 0.38Tryptophan 0.10 0.10 0.09 0.09 0.09 0.09Valine 0.34 0.33 0.31 0.30 0.30 0.31
Apparent ileal digestible basis (%)Arginine 0.03 0.00 0.00 0.00 0.00 0.00Histidine 0.15 0.15 0.14 0.13 0.13 0.14Isoleucine 0.26 0.26 0.25 0.24 0.24 0.25Leucine 0.47 0.46 0.43 0.40 0.40 0.43Lysine 0.45 0.45 0.42 0.40 0.40 0.42Methionine 0.13 0.13 0.12 0.11 0.12 0.12Methionine ` cystine 0.30 0.31 0.30 0.29 0.30 0.31Phenylalanine 0.27 0.26 0.24 0.23 0.23 0.24Phenylalanine ` tyrosine 0.45 0.44 0.42 0.40 0.41 0.43Threonine 0.32 0.33 0.32 0.31 0.32 0.33Tryptophan 0.08 0.08 0.08 0.07 0.07 0.08Valine 0.31 0.30 0.28 0.27 0.27 0.28
Total basis (%)d
Arginine 0.06 0.03 0.00 0.00 0.00 0.00Histidine 0.19 0.18 0.17 0.16 0.17 0.17Isoleucine 0.33 0.32 0.31 0.30 0.30 0.31Leucine 0.50 0.49 0.46 0.42 0.43 0.45Lysine 0.58 0.57 0.54 0.52 0.52 0.54Methionine 0.15 0.15 0.14 0.13 0.13 0.14Methionine ` cystine 0.37 0.38 0.37 0.36 0.36 0.37Phenylalanine 0.32 0.32 0.30 0.28 0.28 0.30Phenylalanine ` tyrosine 0.54 0.54 0.51 0.49 0.49 0.51Threonine 0.44 0.45 0.44 0.43 0.44 0.45Tryptophan 0.11 0.11 0.11 0.10 0.10 0.11Valine 0.39 0.38 0.36 0.34 0.34 0.36
aDaily intakes of DE and feed and the amino acid requirements are estimated by the gestation model.bWeight gain includes maternal tissue and products of conception.cAssumes that ME is 96% of DE.dCrude protein and total amino acid requirements are based on a corn–soybean meal diet.
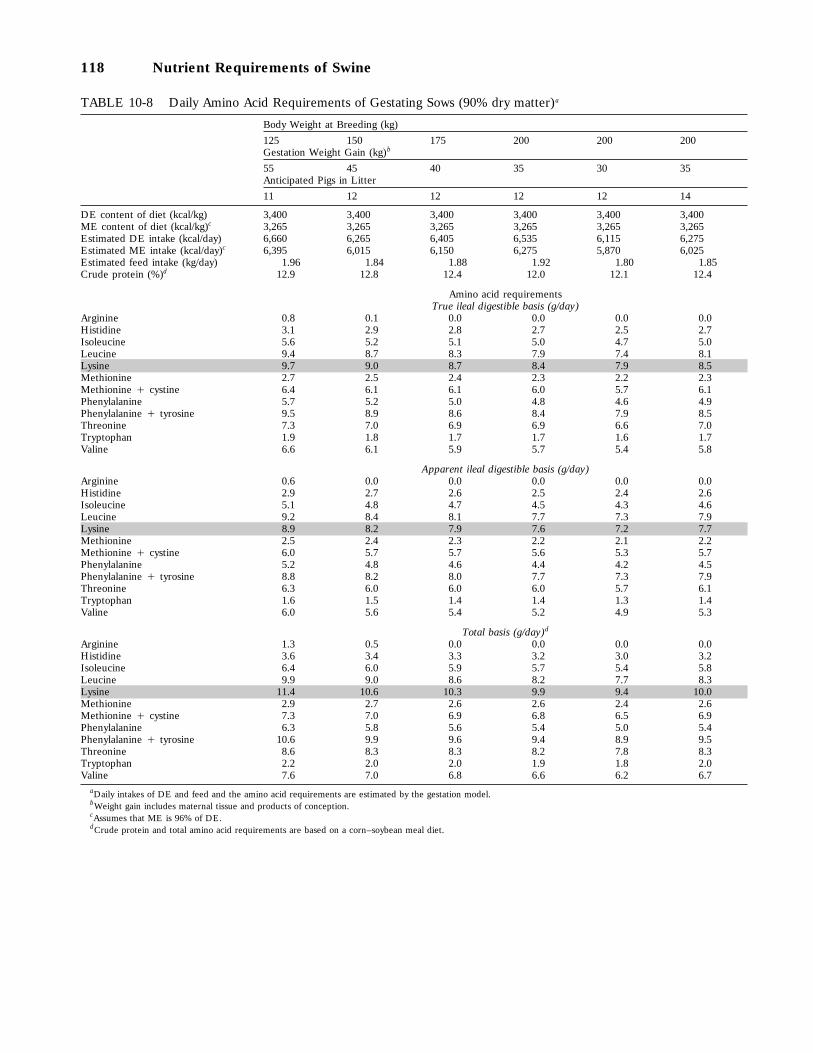
118 Nutrient Requirements of Swine
TABLE 10-8 Daily Amino Acid Requirements of Gestating Sows (90% dry matter)a
Body Weight at Breeding (kg)125 150 175 200 200 200Gestation Weight Gain (kg)b
55 45 40 35 30 35Anticipated Pigs in Litter11 12 12 12 12 14
DE content of diet (kcal/kg) 3,400 3,400 3,400 3,400 3,400 3,400ME content of diet (kcal/kg)c 3,265 3,265 3,265 3,265 3,265 3,265Estimated DE intake (kcal/day) 6,660 6,265 6,405 6,535 6,115 6,275Estimated ME intake (kcal/day)c 6,395 6,015 6,150 6,275 5,870 6,025Estimated feed intake (kg/day) 1.96 1.84 1.88 1.92 1.80 1.85Crude protein (%)d 12.9 12.8 12.4 12.0 12.1 12.4
Amino acid requirementsTrue ileal digestible basis (g/day)
Arginine 0.8 0.1 0.0 0.0 0.0 0.0Histidine 3.1 2.9 2.8 2.7 2.5 2.7Isoleucine 5.6 5.2 5.1 5.0 4.7 5.0Leucine 9.4 8.7 8.3 7.9 7.4 8.1Lysine 9.7 9.0 8.7 8.4 7.9 8.5Methionine 2.7 2.5 2.4 2.3 2.2 2.3Methionine ` cystine 6.4 6.1 6.1 6.0 5.7 6.1Phenylalanine 5.7 5.2 5.0 4.8 4.6 4.9Phenylalanine ` tyrosine 9.5 8.9 8.6 8.4 7.9 8.5Threonine 7.3 7.0 6.9 6.9 6.6 7.0Tryptophan 1.9 1.8 1.7 1.7 1.6 1.7Valine 6.6 6.1 5.9 5.7 5.4 5.8
Apparent ileal digestible basis (g/day)Arginine 0.6 0.0 0.0 0.0 0.0 0.0Histidine 2.9 2.7 2.6 2.5 2.4 2.6Isoleucine 5.1 4.8 4.7 4.5 4.3 4.6Leucine 9.2 8.4 8.1 7.7 7.3 7.9Lysine 8.9 8.2 7.9 7.6 7.2 7.7Methionine 2.5 2.4 2.3 2.2 2.1 2.2Methionine ` cystine 6.0 5.7 5.7 5.6 5.3 5.7Phenylalanine 5.2 4.8 4.6 4.4 4.2 4.5Phenylalanine ` tyrosine 8.8 8.2 8.0 7.7 7.3 7.9Threonine 6.3 6.0 6.0 6.0 5.7 6.1Tryptophan 1.6 1.5 1.4 1.4 1.3 1.4Valine 6.0 5.6 5.4 5.2 4.9 5.3
Total basis (g/day)d
Arginine 1.3 0.5 0.0 0.0 0.0 0.0Histidine 3.6 3.4 3.3 3.2 3.0 3.2Isoleucine 6.4 6.0 5.9 5.7 5.4 5.8Leucine 9.9 9.0 8.6 8.2 7.7 8.3Lysine 11.4 10.6 10.3 9.9 9.4 10.0Methionine 2.9 2.7 2.6 2.6 2.4 2.6Methionine ` cystine 7.3 7.0 6.9 6.8 6.5 6.9Phenylalanine 6.3 5.8 5.6 5.4 5.0 5.4Phenylalanine ` tyrosine 10.6 9.9 9.6 9.4 8.9 9.5Threonine 8.6 8.3 8.3 8.2 7.8 8.3Tryptophan 2.2 2.0 2.0 1.9 1.8 2.0Valine 7.6 7.0 6.8 6.6 6.2 6.7
aDaily intakes of DE and feed and the amino acid requirements are estimated by the gestation model.bWeight gain includes maternal tissue and products of conception.cAssumes that ME is 96% of DE.dCrude protein and total amino acid requirements are based on a corn–soybean meal diet.

Nutrient Requirement Tables 119
TABLE 10-9 Dietary Amino Acid Requirements of Lactating Sows (90% dry matter)a
Sow Postfarrowing Weight (kg)175 175 175 175 175 175Anticipated Lactational Weight Change (kg)b
0 0 0 110 110 110Daily Weight Gain of Pigs (g)b
150 200 250 150 200 250
DE content of diet (kcal/kg) 3,400 3,400 3,400 3,400 3,400 3,400ME content of diet (kcal/kg)c 3,265 3,265 3,265 3,265 3,265 3,265Estimated DE intake (kcal/day) 14,645 18,205 21,765 12,120 15,680 19,240Estimated ME intake (kcal/day)c 14,060 17,475 20,895 11,635 15,055 18,470Estimated feed intake (kg/day) 4.31 5.35 6.40 3.56 4.61 5.66Crude protein (%)d 16.3 17.5 18.4 17.2 18.5 19.2
Amino acid requirementsTrue ileal digestible basis (%)
Arginine 0.36 0.44 0.49 0.35 0.44 0.50Histidine 0.28 0.32 0.34 0.30 0.34 0.36Isoleucine 0.40 0.44 0.47 0.44 0.48 0.50Leucine 0.80 0.90 0.96 0.87 0.97 1.03Lysine 0.71 0.79 0.85 0.77 0.85 0.90Methionine 0.19 0.21 0.22 0.20 0.22 0.23Methionine ` cystine 0.35 0.39 0.41 0.39 0.42 0.43Phenylalanine 0.39 0.43 0.46 0.42 0.46 0.49Phenylalanine ` tyrosine 0.80 0.89 0.95 0.88 0.97 1.02Threonine 0.45 0.49 0.52 0.50 0.53 0.56Tryptophan 0.13 0.14 0.15 0.15 0.16 0.17Valine 0.60 0.67 0.72 0.66 0.73 0.77
Apparent ileal digestible basis (%)Arginine 0.34 0.41 0.46 0.33 0.41 0.47Histidine 0.27 0.30 0.32 0.29 0.32 0.34Isoleucine 0.37 0.41 0.44 0.41 0.44 0.47Leucine 0.77 0.86 0.92 0.83 0.92 0.98Lysine 0.66 0.73 0.79 0.72 0.79 0.84Methionine 0.18 0.20 0.21 0.19 0.21 0.22Methionine ` cystine 0.33 0.36 0.38 0.36 0.39 0.40Phenylalanine 0.36 0.40 0.43 0.39 0.43 0.46Phenylalanine ` tyrosine 0.75 0.83 0.89 0.82 0.90 0.96Threonine 0.40 0.43 0.46 0.44 0.47 0.49Tryptophan 0.11 0.12 0.13 0.13 0.14 0.14Valine 0.55 0.61 0.66 0.61 0.67 0.71
Total basis (%)d
Arginine 0.40 0.48 0.54 0.39 0.49 0.55Histidine 0.32 0.36 0.38 0.34 0.38 0.40Isoleucine 0.45 0.50 0.53 0.50 0.54 0.57Leucine 0.86 0.97 1.05 0.95 1.05 1.12Lysine 0.82 0.91 0.97 0.89 0.97 1.03Methionine 0.21 0.23 0.24 0.22 0.24 0.26Methionine ` cystine 0.40 0.44 0.46 0.44 0.47 0.49Phenylalanine 0.43 0.48 0.52 0.47 0.52 0.55Phenylalanine ` tyrosine 0.90 1.00 1.07 0.98 1.08 1.14Threonine 0.54 0.58 0.61 0.58 0.63 0.65Tryptophan 0.15 0.16 0.17 0.17 0.18 0.19Valine 0.68 0.76 0.82 0.76 0.83 0.88
aDaily intakes of DE and feed and the amino acid requirements are estimated by the lactation model.bAssumes 10 pigs per litter and a 21-day lactation period.cAssumes that ME is 96% of DE. In corn-soybean meal diets of these crude protein levels, ME is 95–96% of DE.dCrude protein and total amino acid requirements are based on a corn–soybean meal diet.
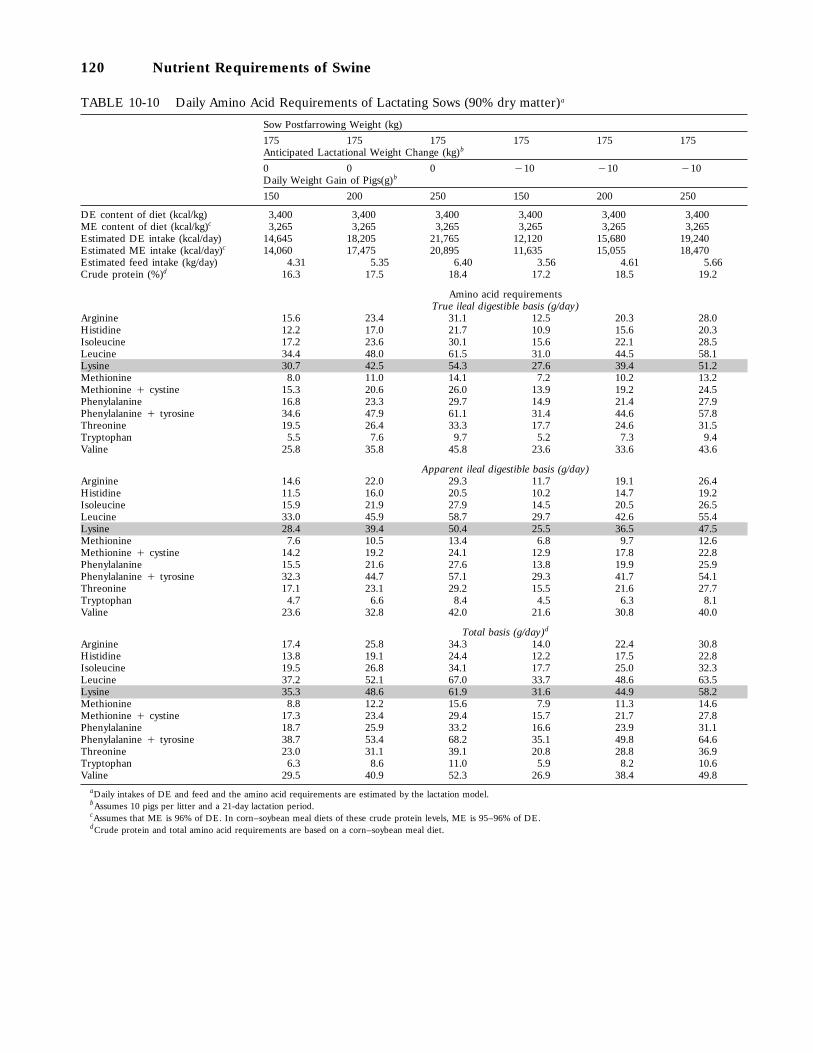
120 Nutrient Requirements of Swine
TABLE 10-10 Daily Amino Acid Requirements of Lactating Sows (90% dry matter)a
Sow Postfarrowing Weight (kg)175 175 175 175 175 175Anticipated Lactational Weight Change (kg)b
0 0 0 110 110 110Daily Weight Gain of Pigs(g)b
150 200 250 150 200 250
DE content of diet (kcal/kg) 3,400 3,400 3,400 3,400 3,400 3,400ME content of diet (kcal/kg)c 3,265 3,265 3,265 3,265 3,265 3,265Estimated DE intake (kcal/day) 14,645 18,205 21,765 12,120 15,680 19,240Estimated ME intake (kcal/day)c 14,060 17,475 20,895 11,635 15,055 18,470Estimated feed intake (kg/day) 4.31 5.35 6.40 3.56 4.61 5.66Crude protein (%)d 16.3 17.5 18.4 17.2 18.5 19.2
Amino acid requirementsTrue ileal digestible basis (g/day)
Arginine 15.6 23.4 31.1 12.5 20.3 28.0Histidine 12.2 17.0 21.7 10.9 15.6 20.3Isoleucine 17.2 23.6 30.1 15.6 22.1 28.5Leucine 34.4 48.0 61.5 31.0 44.5 58.1Lysine 30.7 42.5 54.3 27.6 39.4 51.2Methionine 8.0 11.0 14.1 7.2 10.2 13.2Methionine ` cystine 15.3 20.6 26.0 13.9 19.2 24.5Phenylalanine 16.8 23.3 29.7 14.9 21.4 27.9Phenylalanine ` tyrosine 34.6 47.9 61.1 31.4 44.6 57.8Threonine 19.5 26.4 33.3 17.7 24.6 31.5Tryptophan 5.5 7.6 9.7 5.2 7.3 9.4Valine 25.8 35.8 45.8 23.6 33.6 43.6
Apparent ileal digestible basis (g/day)Arginine 14.6 22.0 29.3 11.7 19.1 26.4Histidine 11.5 16.0 20.5 10.2 14.7 19.2Isoleucine 15.9 21.9 27.9 14.5 20.5 26.5Leucine 33.0 45.9 58.7 29.7 42.6 55.4Lysine 28.4 39.4 50.4 25.5 36.5 47.5Methionine 7.6 10.5 13.4 6.8 9.7 12.6Methionine ` cystine 14.2 19.2 24.1 12.9 17.8 22.8Phenylalanine 15.5 21.6 27.6 13.8 19.9 25.9Phenylalanine ` tyrosine 32.3 44.7 57.1 29.3 41.7 54.1Threonine 17.1 23.1 29.2 15.5 21.6 27.7Tryptophan 4.7 6.6 8.4 4.5 6.3 8.1Valine 23.6 32.8 42.0 21.6 30.8 40.0
Total basis (g/day)d
Arginine 17.4 25.8 34.3 14.0 22.4 30.8Histidine 13.8 19.1 24.4 12.2 17.5 22.8Isoleucine 19.5 26.8 34.1 17.7 25.0 32.3Leucine 37.2 52.1 67.0 33.7 48.6 63.5Lysine 35.3 48.6 61.9 31.6 44.9 58.2Methionine 8.8 12.2 15.6 7.9 11.3 14.6Methionine ` cystine 17.3 23.4 29.4 15.7 21.7 27.8Phenylalanine 18.7 25.9 33.2 16.6 23.9 31.1Phenylalanine ` tyrosine 38.7 53.4 68.2 35.1 49.8 64.6Threonine 23.0 31.1 39.1 20.8 28.8 36.9Tryptophan 6.3 8.6 11.0 5.9 8.2 10.6Valine 29.5 40.9 52.3 26.9 38.4 49.8
aDaily intakes of DE and feed and the amino acid requirements are estimated by the lactation model.bAssumes 10 pigs per litter and a 21-day lactation period.cAssumes that ME is 96% of DE. In corn–soybean meal diets of these crude protein levels, ME is 95–96% of DE.dCrude protein and total amino acid requirements are based on a corn–soybean meal diet.
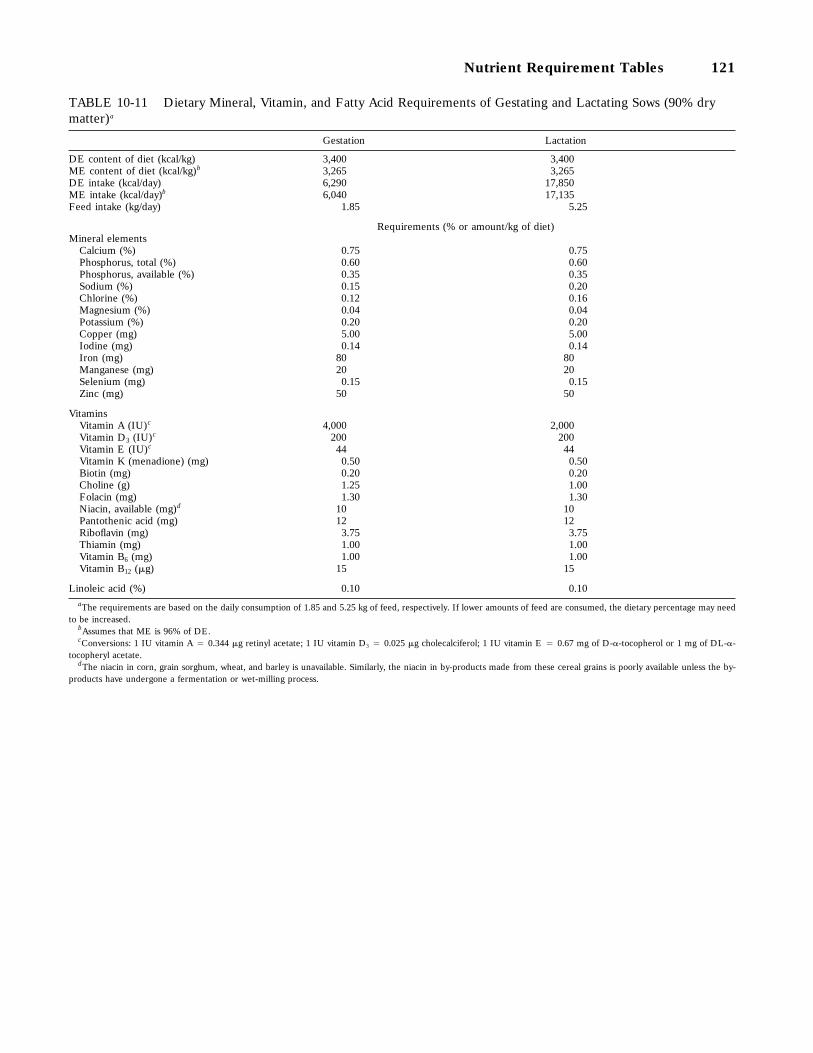
Nutrient Requirement Tables 121
TABLE 10-11 Dietary Mineral, Vitamin, and Fatty Acid Requirements of Gestating and Lactating Sows (90% drymatter)a
Gestation Lactation
DE content of diet (kcal/kg) 3,400 3,400ME content of diet (kcal/kg)b 3,265 3,265DE intake (kcal/day) 6,290 17,850ME intake (kcal/day)b 6,040 17,135Feed intake (kg/day) 1.85 5.25
Requirements (% or amount/kg of diet)Mineral elements
Calcium (%) 0.75 0.75Phosphorus, total (%) 0.60 0.60Phosphorus, available (%) 0.35 0.35Sodium (%) 0.15 0.20Chlorine (%) 0.12 0.16Magnesium (%) 0.04 0.04Potassium (%) 0.20 0.20Copper (mg) 5.00 5.00Iodine (mg) 0.14 0.14Iron (mg) 80 80Manganese (mg) 20 20Selenium (mg) 0.15 0.15Zinc (mg) 50 50
VitaminsVitamin A (IU)c 4,000 2,000Vitamin D3 (IU)c 200 200Vitamin E (IU)c 44 44Vitamin K (menadione) (mg) 0.50 0.50Biotin (mg) 0.20 0.20Choline (g) 1.25 1.00Folacin (mg) 1.30 1.30Niacin, available (mg)d 10 10Pantothenic acid (mg) 12 12Riboflavin (mg) 3.75 3.75Thiamin (mg) 1.00 1.00Vitamin B6 (mg) 1.00 1.00Vitamin B12 (mg) 15 15
Linoleic acid (%) 0.10 0.10aThe requirements are based on the daily consumption of 1.85 and 5.25 kg of feed, respectively. If lower amounts of feed are consumed, the dietary percentage may need
to be increased.bAssumes that ME is 96% of DE.cConversions: 1 IU vitamin A 4 0.344 mg retinyl acetate; 1 IU vitamin D3 4 0.025 mg cholecalciferol; 1 IU vitamin E 4 0.67 mg of D-a-tocopherol or 1 mg of DL-a-
tocopheryl acetate.dThe niacin in corn, grain sorghum, wheat, and barley is unavailable. Similarly, the niacin in by-products made from these cereal grains is poorly available unless the by-
products have undergone a fermentation or wet-milling process.
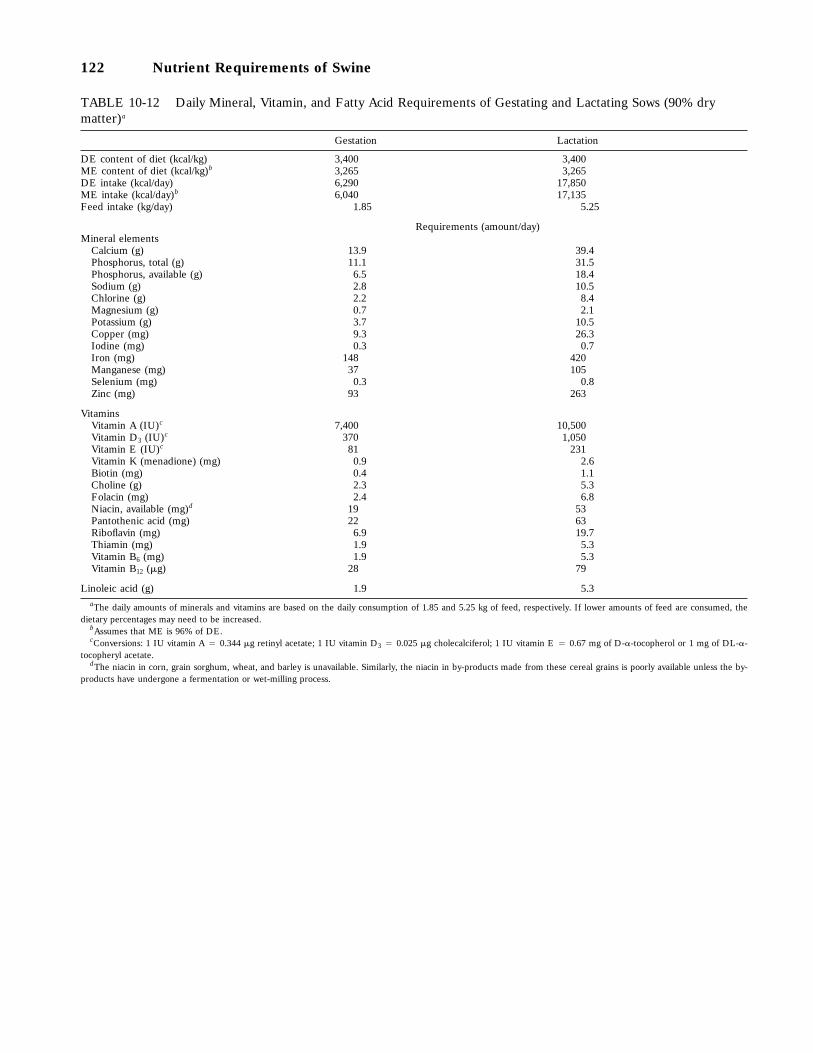
122 Nutrient Requirements of Swine
TABLE 10-12 Daily Mineral, Vitamin, and Fatty Acid Requirements of Gestating and Lactating Sows (90% drymatter)a
Gestation Lactation
DE content of diet (kcal/kg) 3,400 3,400ME content of diet (kcal/kg)b 3,265 3,265DE intake (kcal/day) 6,290 17,850ME intake (kcal/day)b 6,040 17,135Feed intake (kg/day) 1.85 5.25
Requirements (amount/day)Mineral elements
Calcium (g) 13.9 39.4Phosphorus, total (g) 11.1 31.5Phosphorus, available (g) 6.5 18.4Sodium (g) 2.8 10.5Chlorine (g) 2.2 8.4Magnesium (g) 0.7 2.1Potassium (g) 3.7 10.5Copper (mg) 9.3 26.3Iodine (mg) 0.3 0.7Iron (mg) 148 420Manganese (mg) 37 105Selenium (mg) 0.3 0.8Zinc (mg) 93 263
VitaminsVitamin A (IU)c 7,400 10,500Vitamin D3 (IU)c 370 1,050Vitamin E (IU)c 81 231Vitamin K (menadione) (mg) 0.9 2.6Biotin (mg) 0.4 1.1Choline (g) 2.3 5.3Folacin (mg) 2.4 6.8Niacin, available (mg)d 19 53Pantothenic acid (mg) 22 63Riboflavin (mg) 6.9 19.7Thiamin (mg) 1.9 5.3Vitamin B6 (mg) 1.9 5.3Vitamin B12 (mg) 28 79
Linoleic acid (g) 1.9 5.3aThe daily amounts of minerals and vitamins are based on the daily consumption of 1.85 and 5.25 kg of feed, respectively. If lower amounts of feed are consumed, the
dietary percentages may need to be increased.bAssumes that ME is 96% of DE.cConversions: 1 IU vitamin A 4 0.344 mg retinyl acetate; 1 IU vitamin D3 4 0.025 mg cholecalciferol; 1 IU vitamin E 4 0.67 mg of D-a-tocopherol or 1 mg of DL-a-
tocopheryl acetate.dThe niacin in corn, grain sorghum, wheat, and barley is unavailable. Similarly, the niacin in by-products made from these cereal grains is poorly available unless the by-
products have undergone a fermentation or wet-milling process.
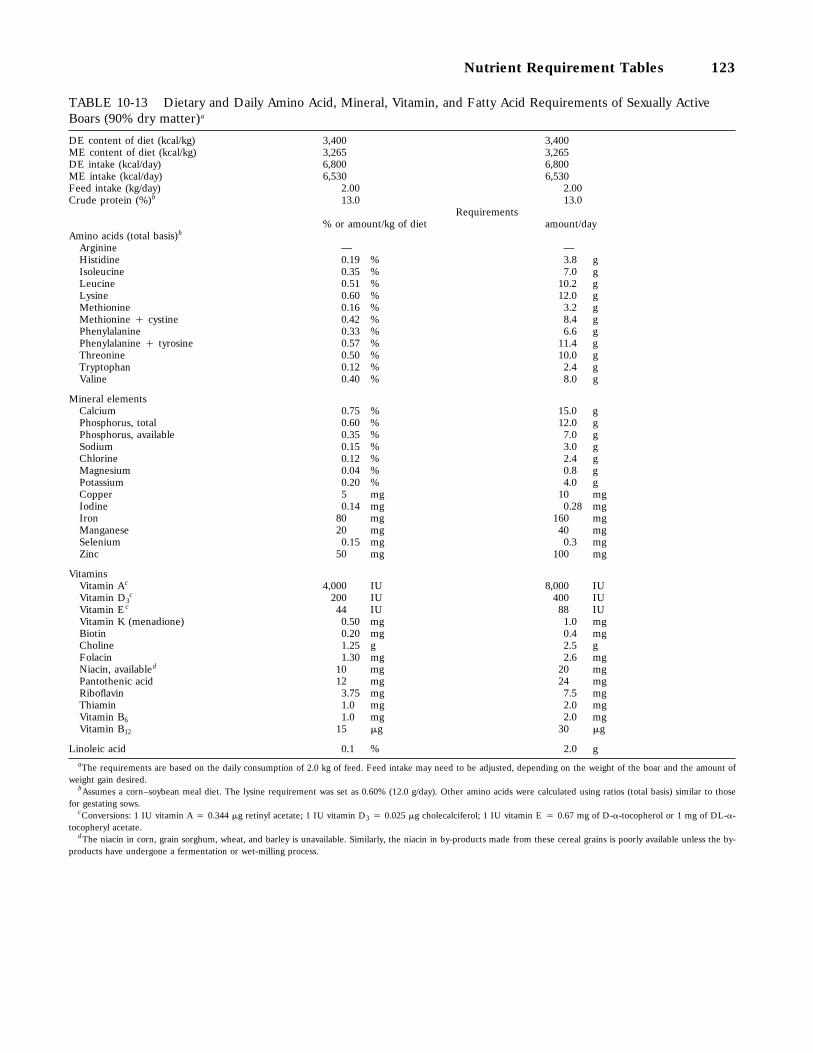
Nutrient Requirement Tables 123
TABLE 10-13 Dietary and Daily Amino Acid, Mineral, Vitamin, and Fatty Acid Requirements of Sexually ActiveBoars (90% dry matter)a
DE content of diet (kcal/kg) 3,400 3,400ME content of diet (kcal/kg) 3,265 3,265DE intake (kcal/day) 6,800 6,800ME intake (kcal/day) 6,530 6,530Feed intake (kg/day) 2.00 2.00Crude protein (%)b 13.0 13.0
Requirements% or amount/kg of diet amount/day
Amino acids (total basis)b
Arginine — —Histidine 0.19 % 3.8 gIsoleucine 0.35 % 7.0 gLeucine 0.51 % 10.2 gLysine 0.60 % 12.0 gMethionine 0.16 % 3.2 gMethionine ` cystine 0.42 % 8.4 gPhenylalanine 0.33 % 6.6 gPhenylalanine ` tyrosine 0.57 % 11.4 gThreonine 0.50 % 10.0 gTryptophan 0.12 % 2.4 gValine 0.40 % 8.0 g
Mineral elementsCalcium 0.75 % 15.0 gPhosphorus, total 0.60 % 12.0 gPhosphorus, available 0.35 % 7.0 gSodium 0.15 % 3.0 gChlorine 0.12 % 2.4 gMagnesium 0.04 % 0.8 gPotassium 0.20 % 4.0 gCopper 5 mg 10 mgIodine 0.14 mg 0.28 mgIron 80 mg 160 mgManganese 20 mg 40 mgSelenium 0.15 mg 0.3 mgZinc 50 mg 100 mg
VitaminsVitamin Ac 4,000 IU 8,000 IUVitamin D3
c 200 IU 400 IUVitamin Ec 44 IU 88 IUVitamin K (menadione) 0.50 mg 1.0 mgBiotin 0.20 mg 0.4 mgCholine 1.25 g 2.5 gFolacin 1.30 mg 2.6 mgNiacin, availabled 10 mg 20 mgPantothenic acid 12 mg 24 mgRiboflavin 3.75 mg 7.5 mgThiamin 1.0 mg 2.0 mgVitamin B6 1.0 mg 2.0 mgVitamin B12 15 mg 30 mg
Linoleic acid 0.1 % 2.0 gaThe requirements are based on the daily consumption of 2.0 kg of feed. Feed intake may need to be adjusted, depending on the weight of the boar and the amount of
weight gain desired.bAssumes a corn–soybean meal diet. The lysine requirement was set as 0.60% (12.0 g/day). Other amino acids were calculated using ratios (total basis) similar to those
for gestating sows.cConversions: 1 IU vitamin A 4 0.344 mg retinyl acetate; 1 IU vitamin D3 4 0.025 mg cholecalciferol; 1 IU vitamin E 4 0.67 mg of D-a-tocopherol or 1 mg of DL-a-
tocopheryl acetate.dThe niacin in corn, grain sorghum, wheat, and barley is unavailable. Similarly, the niacin in by-products made from these cereal grains is poorly available unless the by-
products have undergone a fermentation or wet-milling process.
Composition ofFeed11 Ingredients
When diets are formulated to meet the recommendednutrient requirements of swine, it is necessary to know thenutrient composition of and, if possible, the bioavailabilityof nutrients in each ingredient used. Individual feed ingre-dients may vary widely in composition because of variationin cultivars, growing conditions, processing and storageconditions, and nutrient status. Variations in analytical pro-cedures also affect the results that are obtained. Further-more, the amount of dry matter in the ingredients alsoaffects their nutrient concentrations. The nutrient valuesgiven in the following tables are averages, reflecting theconcentration of nutrients most likely to be present in feedsthat are commonly used in swine diets. They are intendedto be used only as a guide and users are encouraged tohave a chemical analysis of feed ingredients performedprior to widespread use.
A total of 79 feed ingredients have been included in thisedition. Additional information included in the composi-tion tables include estimates of net energy, neutral deter-gent fiber, acid detergent fiber, phosphorus bioavailability,and beta-carotene as well as estimates of apparent and trueileal amino acid digestibility. In many instances, values inthis edition are different from those previously published.These changes reflect results of analyses of feed ingredientsobtained from contemporary crop cultivars, newer process-ing techniques, and improved analytical procedures.
The subcommittee obtained much of the data includedin Tables 11-1 and 11-2 from United States–CanadianTables of Feed Composition (National Research Council,1982), International Feeds Institute Tables of Feed Compo-sition (Fonnesbeck et al., 1984), Centraal Veevoederbu-reau’s Veevoedertabel, (Centraal Veevoederbureau, 1994),L’Alimentation des Animaux Monogastriques (InstitutNational de la Recherche Agronomique, 1984), FeedstuffsIngredient Analysis Table (Dale, 1995), Nutrient Require-ments of Poultry (National Research Council, 1993), UKTables of Nutritive Value and Chemical Composition of
124
Feedstuffs (Ministry of Agriculture Fisheries and FoodStanding Committee on Tables of Feed Composition,1990), Raw Material Compendium (Novus, 1994), andRhodimet Nutrition Guide (Rho
ˆne-Poulenc, 1993b). Addi-
tional information was provided by suppliers of relativelynew ingredients (e.g., Growmark Inc., for potato proteinconcentrate; American Protein Corporation, Merricks, andDuCoa for spray dried animal plasma and animal bloodcells; Milk Specialities Company for whey permeate; Inter-national Ingredient Corporation for milk-based products)as well as individual scientists.
Energy values were obtained from a summary compiledby R. C. Ewan of Iowa State University (Ewan, 1996) andfrom Noblet and Henry (1991) and Noblet et al. (1993;1994). Phosphorus bioavailability estimates are largelybased on data from Cromwell (1992) and Jongbloed (1987).
Vitamin levels for Table 11-3 were largely obtained fromthe same sources listed for Table 11-1 and 11-2, with theexception of biotin, folic acid, b-carotene, and vitamin E,which were obtained from various publications from Hoff-man–La Roche (Roche, 1986; 1987a,b; 1992). Two publica-tions by Frigg (Frigg, 1984; Frigg and Volker, 1994) pro-vided additional values for biotin content. Vitamin E valuesof feedstuffs are dramatically lower than previous publica-tions because only (a–tocopherol values obtained by high-performance liquid chromatography were included (Cortet al., 1983).
The values for the amino acid composition of feedstuffsin Table 11-4 were largely obtained from Degussa’s bookThe Amino Acid Composition of Feedstuffs (Fickler et al.,1995), ADM BioProducts Amino Acid Database (ArcherDaniels Midland Company, 1995), Heartland Lysine’sApparent Ileal Digestibility of Crude Protein and EssentialAmino Acids in Feedstuffs for Swine—1995 (HeartlandLysine, 1995), BioKyowa’s amino acid data base (Southern,1991), Rho
ˆne-Poulenc’s Rhodimet Nutrition Guide
(Rhoˆne-Poulenc, 1993a), Eurolysine’s Ileal Digestibility of
Composition of Feed Ingredients 125
Amino Acids in Feedstuffs for Pigs (Jondreville et al., 1995),comprehensive studies of the North Central Region Com-mittee on Swine Nutrition (North Central Region Commit-tee on Swine Nutrition [NCR-42], 1992; 1993; 1995), andthe National Research Council’s Nutrient Requirements ofPoultry (National Research Council, 1993). The Fats andProteins Research Foundation supplied the subcommitteewith a survey of the protein, amino acid, calcium, andphosphorus content of animal-based protein sources(Knabe, 1995).
Knowledge of the availability of amino acids in feedingredients is important for consistent formulation of dietsthat meet the pig’s amino acid requirements. The amountsof amino acids that are available to the animal are oftenmuch lower than the quantity contained in feed. Also, largevariation exists among feedstuffs in their digestibilities ofvarious amino acids. As a consequence, it is generally con-sidered to be more accurate to formulate diets on an avail-able or digestible basis rather than total amino acid basis.Tables 11-5 and 11-6 provide estimates of apparent andtrue ileal amino acid digestibilities. The values presentedare mostly obtained from Heartland Lysine’s ApparentIleal Digestibility of Crude Protein and Essential AminoAcids in Feedstuffs for Swine—1995 (Heartland Lysine,1995), Rho
ˆne-Poulenc’s Rhodimet Nutrition Guide
(Rhoˆne-Poulenc, 1993a), BioKyowa’s Bulletin Digestible
Amino Acids and Digestible Amino Acid Requirements forSwine (Southern, 1991), and Eurolysine’s Ileal Digestibilityof Amino Acids in Feedstuffs for Pigs (Jondreville et al.,1995).
Many factors influence the amino acid composition ofgrains and protein supplements. For accurate and econom-ical feed formulation, it is desirable to know the aminoacid composition of the actual ingredient to be used in the
diet. However, it is generally not feasible to analyse allsamples of feed ingredients prior to their use. Researchhas been conducted at several laboratories using regressionanalysis to estimate the amino acid composition of the feedfrom its proximate composition. Equations for estimatingthe amino acid content of feedstuffs based on the proteincontent are presented in Table 11-7 and were obtainedfrom Degussa’s book The Amino Acid Composition of Feed-stuffs (Fickler et al., 1995). However, caution should betaken in using this procedure because for some amino acids(e.g., lysine in corn), the correlation between amino acidsand crude protein is low.
Mineral concentrations of macro mineral sources shownin Table 11-8 were obtained primarily from InternationalFeeds Institute Tables of Feed Composition (Fonnesbecket al., 1984), Nutrient Requirements of Poultry (NationalResearch Council, 1993), and Macrominerals (Axe, 1994),as well as from suppliers of mineral supplements includingConsolidated Minerals Inc. (Plant City, FL), J. R. SimplotCompany (Lathrop, CA), Mallinckrodt (IMC-Agrico, Ban-nockburn, IL), Nutra-Flo Company (Sioux City, IA), WhiteSprings Agricultural Chemicals (White Springs, FL), Occi-dental Chemical Corporation (White Springs, FL) and PCSPhosphate Company (Raleigh, NC). Trace mineral concen-trations in Table 11-9 are largely from National ResearchCouncil (1982), Fonnesbeck et al. (1984), Ammerman etal. (1995), Reese et al. (1995), Bernhardt (1996), and Nel-son (1995).
The fatty acid composition of various sources of fatsand oils presented in Table 11-10 are from Feeding Fatspublished by the Fats and Proteins Research Foundation(Pearl, 1995) and USDA Food Composition StandardRelease 11-1 (U.S. Department of Agriculture, 1997).Energy values for fats are from the summary of Ewan(1996) and the work of Powles et al. (1995).
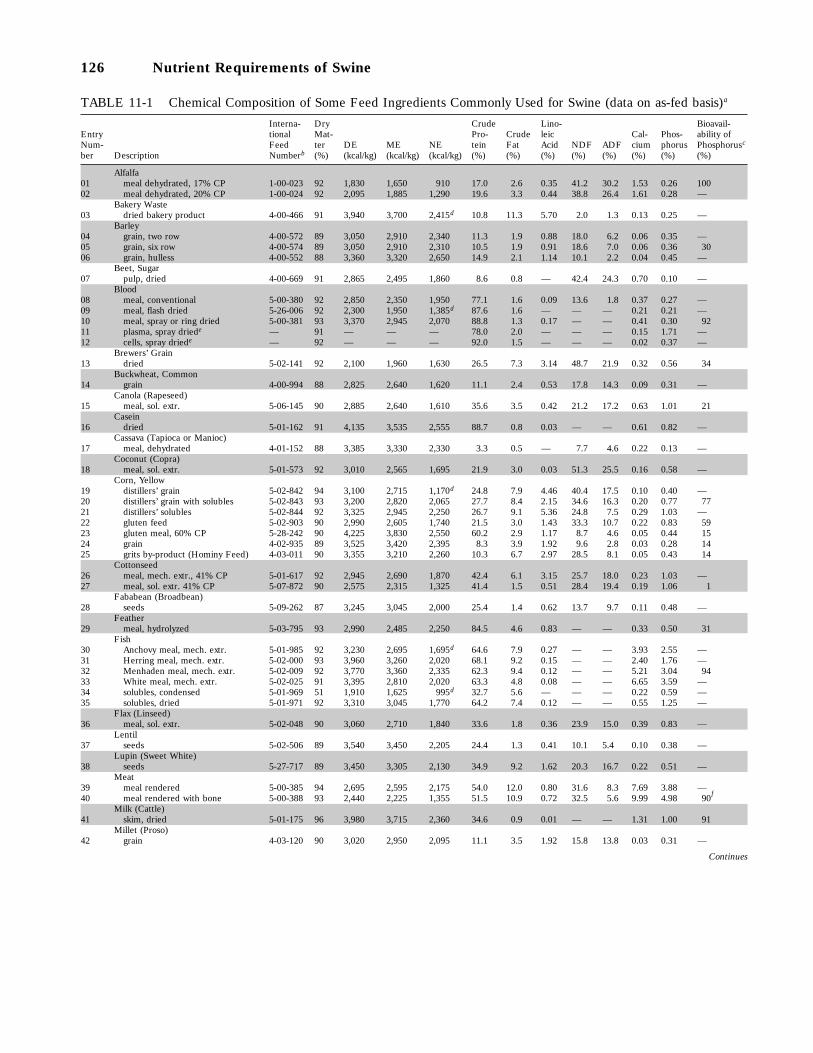
126 Nutrient Requirements of Swine
TABLE 11-1 Chemical Composition of Some Feed Ingredients Commonly Used for Swine (data on as-fed basis)a
Interna- Dry Crude Lino- Bioavail-Entry tional Mat- Pro- Crude leic Cal- Phos- ability ofNum- Feed ter DE ME NE tein Fat Acid NDF ADF cium phorus Phosphorusc
ber Description Numberb (%) (kcal/kg) (kcal/kg) (kcal/kg) (%) (%) (%) (%) (%) (%) (%) (%)
Alfalfa01 meal dehydrated, 17% CP 1-00-023 92 1,830 1,650 910 17.0 2.6 0.35 41.2 30.2 1.53 0.26 10002 meal dehydrated, 20% CP 1-00-024 92 2,095 1,885 1,290 19.6 3.3 0.44 38.8 26.4 1.61 0.28 —
Bakery Waste03 dried bakery product 4-00-466 91 3,940 3,700 2,415d 10.8 11.3 5.70 2.0 1.3 0.13 0.25 —
Barley04 grain, two row 4-00-572 89 3,050 2,910 2,340 11.3 1.9 0.88 18.0 6.2 0.06 0.35 —05 grain, six row 4-00-574 89 3,050 2,910 2,310 10.5 1.9 0.91 18.6 7.0 0.06 0.36 3006 grain, hulless 4-00-552 88 3,360 3,320 2,650 14.9 2.1 1.14 10.1 2.2 0.04 0.45 —
Beet, Sugar07 pulp, dried 4-00-669 91 2,865 2,495 1,860 8.6 0.8 — 42.4 24.3 0.70 0.10 —
Blood08 meal, conventional 5-00-380 92 2,850 2,350 1,950 77.1 1.6 0.09 13.6 1.8 0.37 0.27 —09 meal, flash dried 5-26-006 92 2,300 1,950 1,385d 87.6 1.6 — — — 0.21 0.21 —10 meal, spray or ring dried 5-00-381 93 3,370 2,945 2,070 88.8 1.3 0.17 — — 0.41 0.30 9211 plasma, spray driede — 91 — — — 78.0 2.0 — — — 0.15 1.71 —12 cells, spray driede — 92 — — — 92.0 1.5 — — — 0.02 0.37 —
Brewers’ Grain13 dried 5-02-141 92 2,100 1,960 1,630 26.5 7.3 3.14 48.7 21.9 0.32 0.56 34
Buckwheat, Common14 grain 4-00-994 88 2,825 2,640 1,620 11.1 2.4 0.53 17.8 14.3 0.09 0.31 —
Canola (Rapeseed)15 meal, sol. extr. 5-06-145 90 2,885 2,640 1,610 35.6 3.5 0.42 21.2 17.2 0.63 1.01 21
Casein16 dried 5-01-162 91 4,135 3,535 2,555 88.7 0.8 0.03 — — 0.61 0.82 —
Cassava (Tapioca or Manioc)17 meal, dehydrated 4-01-152 88 3,385 3,330 2,330 3.3 0.5 — 7.7 4.6 0.22 0.13 —
Coconut (Copra)18 meal, sol. extr. 5-01-573 92 3,010 2,565 1,695 21.9 3.0 0.03 51.3 25.5 0.16 0.58 —
Corn, Yellow19 distillers’ grain 5-02-842 94 3,100 2,715 1,170d 24.8 7.9 4.46 40.4 17.5 0.10 0.40 —20 distillers’ grain with solubles 5-02-843 93 3,200 2,820 2,065 27.7 8.4 2.15 34.6 16.3 0.20 0.77 7721 distillers’ solubles 5-02-844 92 3,325 2,945 2,250 26.7 9.1 5.36 24.8 7.5 0.29 1.03 —22 gluten feed 5-02-903 90 2,990 2,605 1,740 21.5 3.0 1.43 33.3 10.7 0.22 0.83 5923 gluten meal, 60% CP 5-28-242 90 4,225 3,830 2,550 60.2 2.9 1.17 8.7 4.6 0.05 0.44 1524 grain 4-02-935 89 3,525 3,420 2,395 8.3 3.9 1.92 9.6 2.8 0.03 0.28 1425 grits by-product (Hominy Feed) 4-03-011 90 3,355 3,210 2,260 10.3 6.7 2.97 28.5 8.1 0.05 0.43 14
Cottonseed26 meal, mech. extr., 41% CP 5-01-617 92 2,945 2,690 1,870 42.4 6.1 3.15 25.7 18.0 0.23 1.03 —27 meal, sol. extr. 41% CP 5-07-872 90 2,575 2,315 1,325 41.4 1.5 0.51 28.4 19.4 0.19 1.06 1
Fababean (Broadbean)28 seeds 5-09-262 87 3,245 3,045 2,000 25.4 1.4 0.62 13.7 9.7 0.11 0.48 —
Feather29 meal, hydrolyzed 5-03-795 93 2,990 2,485 2,250 84.5 4.6 0.83 — — 0.33 0.50 31
Fish30 Anchovy meal, mech. extr. 5-01-985 92 3,230 2,695 1,695d 64.6 7.9 0.27 — — 3.93 2.55 —31 Herring meal, mech. extr. 5-02-000 93 3,960 3,260 2,020 68.1 9.2 0.15 — — 2.40 1.76 —32 Menhaden meal, mech. extr. 5-02-009 92 3,770 3,360 2,335 62.3 9.4 0.12 — — 5.21 3.04 9433 White meal, mech. extr. 5-02-025 91 3,395 2,810 2,020 63.3 4.8 0.08 — — 6.65 3.59 —34 solubles, condensed 5-01-969 51 1,910 1,625 995d 32.7 5.6 — — — 0.22 0.59 —35 solubles, dried 5-01-971 92 3,310 3,045 1,770 64.2 7.4 0.12 — — 0.55 1.25 —
Flax (Linseed)36 meal, sol. extr. 5-02-048 90 3,060 2,710 1,840 33.6 1.8 0.36 23.9 15.0 0.39 0.83 —
Lentil37 seeds 5-02-506 89 3,540 3,450 2,205 24.4 1.3 0.41 10.1 5.4 0.10 0.38 —
Lupin (Sweet White)38 seeds 5-27-717 89 3,450 3,305 2,130 34.9 9.2 1.62 20.3 16.7 0.22 0.51 —
Meat39 meal rendered 5-00-385 94 2,695 2,595 2,175 54.0 12.0 0.80 31.6 8.3 7.69 3.88 —40 meal rendered with bone 5-00-388 93 2,440 2,225 1,355 51.5 10.9 0.72 32.5 5.6 9.99 4.98 90f
Milk (Cattle)41 skim, dried 5-01-175 96 3,980 3,715 2,360 34.6 0.9 0.01 — — 1.31 1.00 91
Millet (Proso)42 grain 4-03-120 90 3,020 2,950 2,095 11.1 3.5 1.92 15.8 13.8 0.03 0.31 —
Continues

Composition of Feed Ingredients 127
TABLE 11-1 (continued)
Interna- Dry Crude Lino- Bioavail-Entry tional Mat- Pro- Crude leic Cal- Phos- ability ofNum- Feed ter DE ME NE tein Fat Acid NDF ADF cium phorus Phosphorusc
ber Description Numberb (%) (kcal/kg) (kcal/kg) (kcal/kg) (%) (%) (%) (%) (%) (%) (%) (%)
Oat43 grain 4-03-309 89 2,770 2,710 1,760 11.5 4.7 1.62 27.0 13.5 0.07 0.31 2244 grain, naked 4-25-101 86 3,480 3,410 2,160d 17.1 6.5 2.52 9.9 3.7 0.08 0.38 —45 groat 4-03-331 90 3,690 3,465 2,310 13.9 6.2 2.40 — — 0.08 0.41 13
Pea46 seeds 5-03-600 89 3,435 3,210 2,195 22.8 1.2 0.47 12.7 7.2 0.11 0.39 —
Peanut (Groundnut)47 meal, mech. extr. 5-03-649 92 3,895 3,560 2,280 43.2 6.5 1.73 14.6 9.1 0.17 0.59 —48 meal, sol. extr. 5-03-650 92 3,415 3,245 2,170 49.1 1.2 0.30 16.2 12.2 0.22 0.65 12
Potato49 protein concentrate 5-25-392 91 4,140 3,880 2,040 73.8 1.7 — 1.8 — 0.17 0.19 —
Poultry50 by-product, meal rendered 5-03-798 93 3,090 2,860 1,945d 64.1 12.6 2.54 — — 4.46 2.41 —
Rice51 bran 4-03-928 90 3,100 2,850 2,040 13.3 13.0 4.12 23.7 13.9 0.07 1.61 25
grain, polished and broken52 (Brewers’ Rice) 4-03-932 89 3,565 3,350 2,295 7.9 1.0 0.28 12.2 3.1 0.04 0.18 —53 polishings 4-03-943 90 3,770 3,350 2,070d 13.0 13.7 3.58 — 4.0 0.09 1.18 —
Rye54 grain 4-04-047 88 3,270 3,060 2,300 11.8 1.6 0.76 12.3 4.6 0.06 0.33 —
Safflower55 meal, sol. extr. 5-04-110 92 2,840 2,170 870 23.4 1.4 0.84 55.9 38.8 0.34 0.75 —56 meal without hulls, sol. extr. 5-07-959 92 3,055 2,910 1,585 42.5 1.3 0.74 25.9 18.0 0.37 1.31 —
Sesame57 meal, mech. extr. 5-04-220 93 3,350 3,035 2,090 42.6 7.5 3.07 18.0 13.2 1.90 1.22 —
Sorghum58 grain 4-20-893 89 3,380 3,340 2,255 9.2 2.9 1.13 18.0 8.3 0.03 0.29 20
Soybean59 meal, sol. extr. 5-04-604 89 3,490 3,180 1,935 43.8 1.5 0.69 13.3 9.4 0.32 0.65 3160 meal without hulls, sol. extr. 5-04-612 90 3,685 3,380 2,020 47.5 3.0 0.60 8.9 5.4 0.34 0.69 2361 protein concentrate — 90 4,100 3,500 2,000d 64.0 3.0 — — — 0.35 0.81 —62 protein isolate 5-08-038 92 4,150 3,560 2,000 85.8 0.6 — — — 0.15 0.65 —63 seeds, heat processed 5-04-597 90 4,140 3,690 2,880 35.2 18.0 9.13 13.9 8.0 0.25 0.59 —
Sunflower64 meal, sol. extr. 5-09-340 90 2,010 1,830 1,230 26.8 1.3 0.98 42.4 30.3 0.36 0.86 365 meal without hulls, sol. extr. 5-04-739 93 2,840 2,735 1,635 42.2 2.9 1.07 27.8 18.4 0.37 1.01 —
Triticale66 grain 4-20-362 90 3,320 3,180 2,420 12.5 1.8 0.71 12.7 3.8 0.05 0.33 46
Wheat67 bran 4-05-190 89 2,420 2,275 1,400 15.7 4.0 1.80 42.1 13.0 0.16 1.20 2968 grain, hard red spring 4-05-258 88 3,400 3,250 1,925d 14.1 2.0 — — — 0.05 0.36 —69 grain, hard red winter 4-05-268 88 3,365 3,210 2,225 13.5 2.0 0.93 13.5 4.0 0.06 0.37 5070 grain, soft red winter 4-05-294 88 3,450 3,305 2,400 11.5 1.9 — — — 0.04 0.39 5071 grain, soft white winter 4-05-337 89 3,400 3,285 2,375 11.8 2.1 0.83 12.0 3.7 0.05 0.35 —72 middlings, , 9.5% fiber 4-05-205 89 3,075 3,025 1,560 15.9 4.2 1.74 35.6 10.7 0.12 0.93 4173 red dog, , 4% fiber 4-05-203 88 3,140 2,925 2,090 15.3 3.3 — 18.7 4.3 0.07 0.57 —74 shorts, , 7% fiber 4-05-201 88 2,985 2,820 2,120 16.0 4.6 1.90 28.4 8.6 0.09 0.84 —
Whey75 dried 4-01-182 96 3,335 3,190 2,215 12.1 0.9 0.01 — — 0.75 0.72 9776 low lactose, dried 4-01-186 96 3,045 2,910 2,030 17.6 1.1 0.04 — — 2.00 1.37 —77 permeate, dried — 96 3,435 3,300 2,260d 3.8 0.2 — — — 0.86 0.66 —
Yeast, Brewers’78 dried 7-05-527 93 3,325 3,025 2,075 45.9 1.7 0.04 4.0 3.0 0.16 1.44 —
Yeast, Torula79 dried 7-05-534 93 3,110 2,765 1,985 46.4 2.4 0.05 — — 0.58 1.52 —
aDash indicates that no data were available.bFirst digit is class of feed: 1, dry forages and roughages; 2, pasture, range plants, and forages fed green; 3, silages; 4, energy feeds; 5, protein supplements; 6, minerals;
7, vitamins; 8, additives; the other five digits are the International Feed Number.cEstimated bioavailability, relative to that in monosodium or monocalcium phosphate.dBased on chemical composition using Equation 1-12 in Chapter 1.eDE, ME, and NE of spray-dried plasma and spray-dried blood cells have not been determined experimentally and composition data are insufficient to accurately determine
calculated values.fSome meat and bone meals may have phosphorus bioavailabilities of 70% or less.
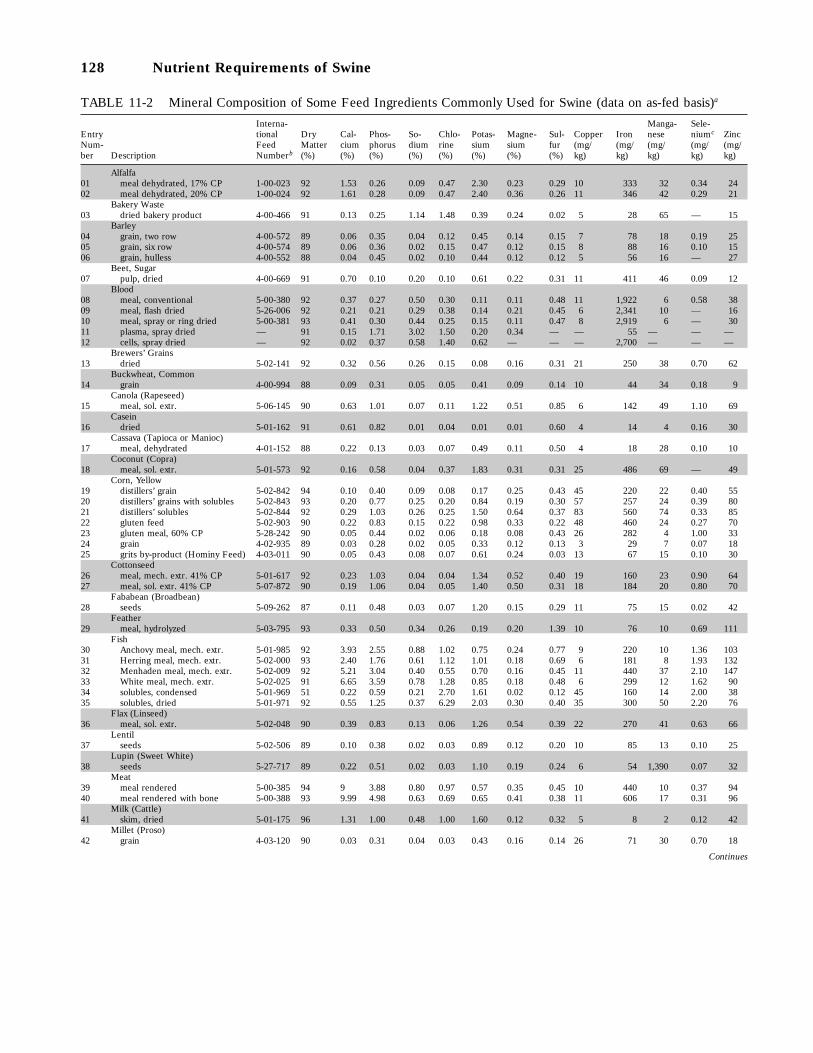
128 Nutrient Requirements of Swine
TABLE 11-2 Mineral Composition of Some Feed Ingredients Commonly Used for Swine (data on as-fed basis)a
Interna- Manga- Sele-Entry tional Dry Cal- Phos- So- Chlo- Potas- Magne- Sul- Copper Iron nese niumc ZincNum- Feed Matter cium phorus dium rine sium sium fur (mg/ (mg/ (mg/ (mg/ (mg/ber Description Numberb (%) (%) (%) (%) (%) (%) (%) (%) kg) kg) kg) kg) kg)
Alfalfa01 meal dehydrated, 17% CP 1-00-023 92 1.53 0.26 0.09 0.47 2.30 0.23 0.29 10 333 32 0.34 2402 meal dehydrated, 20% CP 1-00-024 92 1.61 0.28 0.09 0.47 2.40 0.36 0.26 11 346 42 0.29 21
Bakery Waste03 dried bakery product 4-00-466 91 0.13 0.25 1.14 1.48 0.39 0.24 0.02 5 28 65 — 15
Barley04 grain, two row 4-00-572 89 0.06 0.35 0.04 0.12 0.45 0.14 0.15 7 78 18 0.19 2505 grain, six row 4-00-574 89 0.06 0.36 0.02 0.15 0.47 0.12 0.15 8 88 16 0.10 1506 grain, hulless 4-00-552 88 0.04 0.45 0.02 0.10 0.44 0.12 0.12 5 56 16 — 27
Beet, Sugar07 pulp, dried 4-00-669 91 0.70 0.10 0.20 0.10 0.61 0.22 0.31 11 411 46 0.09 12
Blood08 meal, conventional 5-00-380 92 0.37 0.27 0.50 0.30 0.11 0.11 0.48 11 1,922 6 0.58 3809 meal, flash dried 5-26-006 92 0.21 0.21 0.29 0.38 0.14 0.21 0.45 6 2,341 10 — 1610 meal, spray or ring dried 5-00-381 93 0.41 0.30 0.44 0.25 0.15 0.11 0.47 8 2,919 6 — 3011 plasma, spray dried — 91 0.15 1.71 3.02 1.50 0.20 0.34 — — 55 — — —12 cells, spray dried — 92 0.02 0.37 0.58 1.40 0.62 — — — 2,700 — — —
Brewers’ Grains13 dried 5-02-141 92 0.32 0.56 0.26 0.15 0.08 0.16 0.31 21 250 38 0.70 62
Buckwheat, Common14 grain 4-00-994 88 0.09 0.31 0.05 0.05 0.41 0.09 0.14 10 44 34 0.18 9
Canola (Rapeseed)15 meal, sol. extr. 5-06-145 90 0.63 1.01 0.07 0.11 1.22 0.51 0.85 6 142 49 1.10 69
Casein16 dried 5-01-162 91 0.61 0.82 0.01 0.04 0.01 0.01 0.60 4 14 4 0.16 30
Cassava (Tapioca or Manioc)17 meal, dehydrated 4-01-152 88 0.22 0.13 0.03 0.07 0.49 0.11 0.50 4 18 28 0.10 10
Coconut (Copra)18 meal, sol. extr. 5-01-573 92 0.16 0.58 0.04 0.37 1.83 0.31 0.31 25 486 69 — 49
Corn, Yellow19 distillers’ grain 5-02-842 94 0.10 0.40 0.09 0.08 0.17 0.25 0.43 45 220 22 0.40 5520 distillers’ grains with solubles 5-02-843 93 0.20 0.77 0.25 0.20 0.84 0.19 0.30 57 257 24 0.39 8021 distillers’ solubles 5-02-844 92 0.29 1.03 0.26 0.25 1.50 0.64 0.37 83 560 74 0.33 8522 gluten feed 5-02-903 90 0.22 0.83 0.15 0.22 0.98 0.33 0.22 48 460 24 0.27 7023 gluten meal, 60% CP 5-28-242 90 0.05 0.44 0.02 0.06 0.18 0.08 0.43 26 282 4 1.00 3324 grain 4-02-935 89 0.03 0.28 0.02 0.05 0.33 0.12 0.13 3 29 7 0.07 1825 grits by-product (Hominy Feed) 4-03-011 90 0.05 0.43 0.08 0.07 0.61 0.24 0.03 13 67 15 0.10 30
Cottonseed26 meal, mech. extr. 41% CP 5-01-617 92 0.23 1.03 0.04 0.04 1.34 0.52 0.40 19 160 23 0.90 6427 meal, sol. extr. 41% CP 5-07-872 90 0.19 1.06 0.04 0.05 1.40 0.50 0.31 18 184 20 0.80 70
Fababean (Broadbean)28 seeds 5-09-262 87 0.11 0.48 0.03 0.07 1.20 0.15 0.29 11 75 15 0.02 42
Feather29 meal, hydrolyzed 5-03-795 93 0.33 0.50 0.34 0.26 0.19 0.20 1.39 10 76 10 0.69 111
Fish30 Anchovy meal, mech. extr. 5-01-985 92 3.93 2.55 0.88 1.02 0.75 0.24 0.77 9 220 10 1.36 10331 Herring meal, mech. extr. 5-02-000 93 2.40 1.76 0.61 1.12 1.01 0.18 0.69 6 181 8 1.93 13232 Menhaden meal, mech. extr. 5-02-009 92 5.21 3.04 0.40 0.55 0.70 0.16 0.45 11 440 37 2.10 14733 White meal, mech. extr. 5-02-025 91 6.65 3.59 0.78 1.28 0.85 0.18 0.48 6 299 12 1.62 9034 solubles, condensed 5-01-969 51 0.22 0.59 0.21 2.70 1.61 0.02 0.12 45 160 14 2.00 3835 solubles, dried 5-01-971 92 0.55 1.25 0.37 6.29 2.03 0.30 0.40 35 300 50 2.20 76
Flax (Linseed)36 meal, sol. extr. 5-02-048 90 0.39 0.83 0.13 0.06 1.26 0.54 0.39 22 270 41 0.63 66
Lentil37 seeds 5-02-506 89 0.10 0.38 0.02 0.03 0.89 0.12 0.20 10 85 13 0.10 25
Lupin (Sweet White)38 seeds 5-27-717 89 0.22 0.51 0.02 0.03 1.10 0.19 0.24 6 54 1,390 0.07 32
Meat39 meal rendered 5-00-385 94 9 3.88 0.80 0.97 0.57 0.35 0.45 10 440 10 0.37 9440 meal rendered with bone 5-00-388 93 9.99 4.98 0.63 0.69 0.65 0.41 0.38 11 606 17 0.31 96
Milk (Cattle)41 skim, dried 5-01-175 96 1.31 1.00 0.48 1.00 1.60 0.12 0.32 5 8 2 0.12 42
Millet (Proso)42 grain 4-03-120 90 0.03 0.31 0.04 0.03 0.43 0.16 0.14 26 71 30 0.70 18
Continues
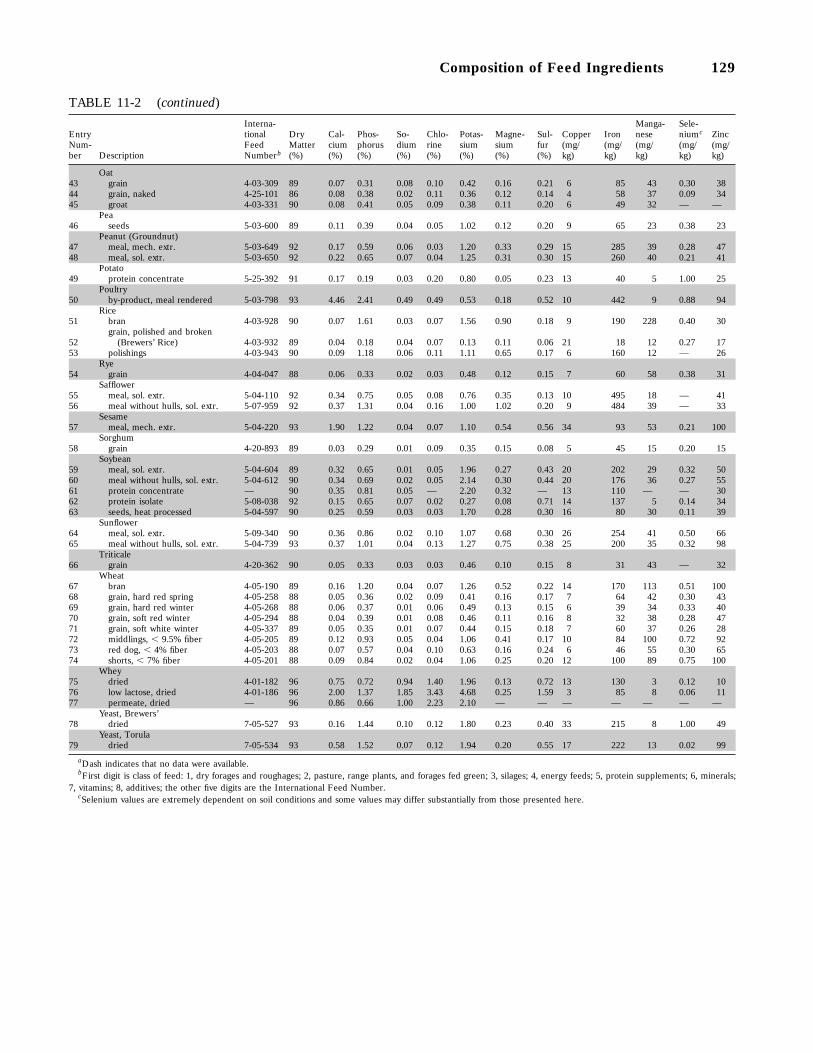
Composition of Feed Ingredients 129
TABLE 11-2 (continued)Interna- Manga- Sele-
Entry tional Dry Cal- Phos- So- Chlo- Potas- Magne- Sul- Copper Iron nese niumc ZincNum- Feed Matter cium phorus dium rine sium sium fur (mg/ (mg/ (mg/ (mg/ (mg/ber Description Numberb (%) (%) (%) (%) (%) (%) (%) (%) kg) kg) kg) kg) kg)
Oat43 grain 4-03-309 89 0.07 0.31 0.08 0.10 0.42 0.16 0.21 6 85 43 0.30 3844 grain, naked 4-25-101 86 0.08 0.38 0.02 0.11 0.36 0.12 0.14 4 58 37 0.09 3445 groat 4-03-331 90 0.08 0.41 0.05 0.09 0.38 0.11 0.20 6 49 32 — —
Pea46 seeds 5-03-600 89 0.11 0.39 0.04 0.05 1.02 0.12 0.20 9 65 23 0.38 23
Peanut (Groundnut)47 meal, mech. extr. 5-03-649 92 0.17 0.59 0.06 0.03 1.20 0.33 0.29 15 285 39 0.28 4748 meal, sol. extr. 5-03-650 92 0.22 0.65 0.07 0.04 1.25 0.31 0.30 15 260 40 0.21 41
Potato49 protein concentrate 5-25-392 91 0.17 0.19 0.03 0.20 0.80 0.05 0.23 13 40 5 1.00 25
Poultry50 by-product, meal rendered 5-03-798 93 4.46 2.41 0.49 0.49 0.53 0.18 0.52 10 442 9 0.88 94
Rice51 bran 4-03-928 90 0.07 1.61 0.03 0.07 1.56 0.90 0.18 9 190 228 0.40 30
grain, polished and broken52 (Brewers’ Rice) 4-03-932 89 0.04 0.18 0.04 0.07 0.13 0.11 0.06 21 18 12 0.27 1753 polishings 4-03-943 90 0.09 1.18 0.06 0.11 1.11 0.65 0.17 6 160 12 — 26
Rye54 grain 4-04-047 88 0.06 0.33 0.02 0.03 0.48 0.12 0.15 7 60 58 0.38 31
Safflower55 meal, sol. extr. 5-04-110 92 0.34 0.75 0.05 0.08 0.76 0.35 0.13 10 495 18 — 4156 meal without hulls, sol. extr. 5-07-959 92 0.37 1.31 0.04 0.16 1.00 1.02 0.20 9 484 39 — 33
Sesame57 meal, mech. extr. 5-04-220 93 1.90 1.22 0.04 0.07 1.10 0.54 0.56 34 93 53 0.21 100
Sorghum58 grain 4-20-893 89 0.03 0.29 0.01 0.09 0.35 0.15 0.08 5 45 15 0.20 15
Soybean59 meal, sol. extr. 5-04-604 89 0.32 0.65 0.01 0.05 1.96 0.27 0.43 20 202 29 0.32 5060 meal without hulls, sol. extr. 5-04-612 90 0.34 0.69 0.02 0.05 2.14 0.30 0.44 20 176 36 0.27 5561 protein concentrate — 90 0.35 0.81 0.05 — 2.20 0.32 — 13 110 — — 3062 protein isolate 5-08-038 92 0.15 0.65 0.07 0.02 0.27 0.08 0.71 14 137 5 0.14 3463 seeds, heat processed 5-04-597 90 0.25 0.59 0.03 0.03 1.70 0.28 0.30 16 80 30 0.11 39
Sunflower64 meal, sol. extr. 5-09-340 90 0.36 0.86 0.02 0.10 1.07 0.68 0.30 26 254 41 0.50 6665 meal without hulls, sol. extr. 5-04-739 93 0.37 1.01 0.04 0.13 1.27 0.75 0.38 25 200 35 0.32 98
Triticale66 grain 4-20-362 90 0.05 0.33 0.03 0.03 0.46 0.10 0.15 8 31 43 — 32
Wheat67 bran 4-05-190 89 0.16 1.20 0.04 0.07 1.26 0.52 0.22 14 170 113 0.51 10068 grain, hard red spring 4-05-258 88 0.05 0.36 0.02 0.09 0.41 0.16 0.17 7 64 42 0.30 4369 grain, hard red winter 4-05-268 88 0.06 0.37 0.01 0.06 0.49 0.13 0.15 6 39 34 0.33 4070 grain, soft red winter 4-05-294 88 0.04 0.39 0.01 0.08 0.46 0.11 0.16 8 32 38 0.28 4771 grain, soft white winter 4-05-337 89 0.05 0.35 0.01 0.07 0.44 0.15 0.18 7 60 37 0.26 2872 middlings, , 9.5% fiber 4-05-205 89 0.12 0.93 0.05 0.04 1.06 0.41 0.17 10 84 100 0.72 9273 red dog, , 4% fiber 4-05-203 88 0.07 0.57 0.04 0.10 0.63 0.16 0.24 6 46 55 0.30 6574 shorts, , 7% fiber 4-05-201 88 0.09 0.84 0.02 0.04 1.06 0.25 0.20 12 100 89 0.75 100
Whey75 dried 4-01-182 96 0.75 0.72 0.94 1.40 1.96 0.13 0.72 13 130 3 0.12 1076 low lactose, dried 4-01-186 96 2.00 1.37 1.85 3.43 4.68 0.25 1.59 3 85 8 0.06 1177 permeate, dried — 96 0.86 0.66 1.00 2.23 2.10 — — — — — — —
Yeast, Brewers’78 dried 7-05-527 93 0.16 1.44 0.10 0.12 1.80 0.23 0.40 33 215 8 1.00 49
Yeast, Torula79 dried 7-05-534 93 0.58 1.52 0.07 0.12 1.94 0.20 0.55 17 222 13 0.02 99
aDash indicates that no data were available.bFirst digit is class of feed: 1, dry forages and roughages; 2, pasture, range plants, and forages fed green; 3, silages; 4, energy feeds; 5, protein supplements; 6, minerals;
7, vitamins; 8, additives; the other five digits are the International Feed Number.cSelenium values are extremely dependent on soil conditions and some values may differ substantially from those presented here.

130 Nutrient Requirements of Swine
TABLE 11-3 Vitamin Composition of Some Feed Ingredients Commonly Used for Swine (data on as-fed basis)a
Panto- Vita- Vita- Vita- Beta-Interna- Cho- Fola- thenic Ribo- Thia- min min min Caro-
Entry tional Dry Biotin line cin Niacinc Acid flavin min B6 B12 Ed tenee
Num- Feed Matter (mg/ (mg/ (mg/ (mg/ (mg/ (mg/ (mg/ (mg/ (mg/ (mg/ (mg/ber Description Numberb (%) kg) kg) kg) kg) kg) kg) kg) kg) kg) kg) kg)
Alfalfa01 meal dehydrated, 17% CP 1-00-023 92 0.54 1,401 4.36 38 29.0 13.6 3.4 6.5 0 49.8 94.602 meal dehydrated, 20% CP 1-00-024 92 0.54 1,419 4.36 45 34.0 15.2 5.8 8.0 0 49.8 94.6
Bakery Waste03 dried bakery product 4-00-466 91 0.07 923 0.20 26 8.3 1.4 2.9 4.3 0 — 4.2
Barley04 grain, two row 4-00-572 89 0.14 1.034 0.31 55 8.0 1.8 4.5 5.0 0 7.4 4.105 grain, six row 4-00-574 89 0.15 1,034 0.40 48 7.0 1.6 4.0 2.9 0 7.4 4.106 grain, hulless 4-00-552 88 0.07 — 0.62 48 6.8 1.8 4.3 5.6 0 6.0 —
Beet, Sugar07 pulp, dried 4-00-669 91 — 818 — 18 1.3 0.7 0.4 1.9 0 13.2 10.6
Blood08 meal, conventional 5-00-380 92 0.03 852 0.10 31 2.0 2.4 0.4 4.4 44 1.0 —09 meal, flash dried 5-26-006 92 0.08 781 0.10 23 1.0 1.4 1.0 4.4 44 1.0 —10 meal, spray or ring dried 5-00-381 93 0.28 485 0.40 23 3.7 3.2 0.3 4.4 — 1.0 —11 plasma, spray dried — 91 — — — — — — — — — — —12 cells, spray dried — 92 — — — — — — — — — — —
Brewers’ Grains13 dried 5-02-141 92 0.24 1,723 7.10 43 8.0 1.4 0.6 0.7 0 — 0.2
Buckwheat, Common14 grain 4-00-994 88 0.06 440 0.64 19 12.0 5.5 4.0 3.0 0 — —
Canola (Rapeseed)15 meal, sol. extr. 5-06-145 90 0.98 6,700 0.83 160 9.5 5.8 5.2 7.2 0 13.4 —
Casein16 dried 5-01-167 91 0.04 205 0.51 1 2.7 1.5 0.4 0.4 — — —
Cassava (Tapioca or Manioc)17 meal, dehydrated 4-01-152 88 0.05 — — 3 0.3 0.8 1.6 0.7 0 0.2 —
Coconut (Copra)18 meal, sol. extr. 5-01-573 92 0.25 1,089 0.30 28 6.5 3.5 0.7 4.4 — 7.7 —
Corn, Yellow19 distillers’ grains 5-02-842 94 0.49 1,180 0.90 37 11.7 5.2 1.7 4.4 0 12.9 3.020 distillers’ grains with solubles 5-02-843 93 0.78 2,637 0.90 75 14.0 8.6 2.9 8.0 0 — 3.521 distillers’ solubles 5-02-844 92 1.66 4,842 1.10 116 21.0 17.0 6.9 8.8 3 — —22 gluten feed 5-02-903 90 0.14 1,518 0.28 66 17.0 2.4 2.0 13.0 0 8.5 1.023 gluten meal, 60% CP 5-28-242 90 0.15 330 0.13 55 3.5 2.2 0.3 6.9 0 6.7 —24 grain 4-02-935 89 0.06 620 0.15 24c 6.0 1.2 3.5 5.0 0 8.3 0.825 grits by-product (Hominy Feed) 4-03-011 90 0.13 1,155 0.21 47 8.2 2.1 8.1 11.0 0 6.5 9.0
Cottonseed26 meal, mech. extr. 41% CP 5-01-617 92 0.30 2,753 1.65 38 10.0 5.1 6.4 5.3 0 35.0 0.227 meal, sol. extr. 41% CP 5-07-872 90 0.30 2,933 1.65 40 12.0 5.9 7.0 5.1 0 14.0 0.2
Fababean (Broadbean)28 seeds 5-09-262 87 0.09 1,670 — 26 3.0 2.9 5.5 — 0 0.8 —
Feather29 meal, hydrolyzed 5-03-795 93 0.13 891 0.20 21 10.0 2.1 0.1 3.0 78 7.3 —
Fish30 Anchovy meal, mech. extr. 5-01-985 92 0.13 4,408 0.37 100 15.0 7.1 0.3 4.0 280 5.0 —31 Herring meal, mech. extr. 5-02-000 93 0.13 5,306 0.37 93 17.0 9.9 0.4 4.8 403 15.0 —32 Menhaden meal, mech. extr. 5-02-009 92 0.13 3,056 0.37 55 9.0 4.9 0.5 4.0 143 5.0 —33 White meal, mech. extr. 5-02-025 91 0.13 3,099 0.37 59 9.9 9.1 1.7 5.9 90 5.0 —34 solubles, condensed 5-01-969 51 0.18 3,519 0.02 169 35.0 14.6 5.5 12.2 347 — —35 solubles, dried 5-01-971 92 0.26 5,507 0.60 271 55.0 15.6 7.4 23.8 401 — —
Flax (Linseed)36 meal, sol. extr. 5-02-048 90 0.41 1,512 1.30 33 14.7 2.9 7.5 6.0 0 2.0 0.2
Lentil37 seeds 5-02-506 89 0.13 — 0.70 22 14.9 2.4 3.9 5.5 0 0.0 1.0
Lupin (Sweet White)38 seeds 5-27-717 89 0.05 — — — — — — — — 7.5 —
Meat39 meal rendered 5-00-385 94 0.08 2,077 0.50 57 5.0 4.7 0.6 2.4 80 1.2 —40 meal rendered with bone 5-00-388 93 0.08 1,996 0.41 49 4.1 4.7 0.4 4.6 90 1.6 —
Milk (Cattle)41 skim, dried 5-01-175 96 0.25 1,393 0.47 12 36.4 19.1 3.7 4.1 36 4.1 —
Millet (Proso)42 grain 4-03-120 90 0.16 440 0.23 23 11.0 3.8 7.3 5.8 0 — —
Continues
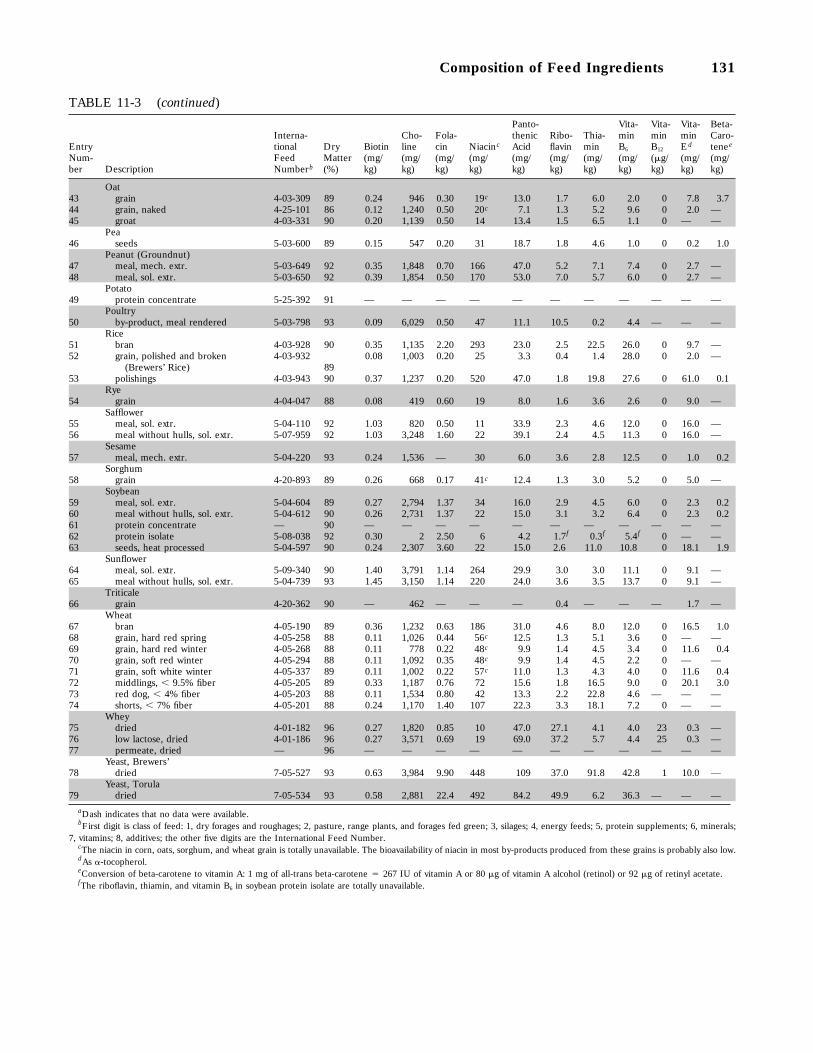
Composition of Feed Ingredients 131
TABLE 11-3 (continued)
Panto- Vita- Vita- Vita- Beta-Interna- Cho- Fola- thenic Ribo- Thia- min min min Caro-
Entry tional Dry Biotin line cin Niacinc Acid flavin min B6 B12 Ed tenee
Num- Feed Matter (mg/ (mg/ (mg/ (mg/ (mg/ (mg/ (mg/ (mg/ (mg/ (mg/ (mg/ber Description Numberb (%) kg) kg) kg) kg) kg) kg) kg) kg) kg) kg) kg)
Oat43 grain 4-03-309 89 0.24 946 0.30 19c 13.0 1.7 6.0 2.0 0 7.8 3.744 grain, naked 4-25-101 86 0.12 1,240 0.50 20c 7.1 1.3 5.2 9.6 0 2.0 —45 groat 4-03-331 90 0.20 1,139 0.50 14 13.4 1.5 6.5 1.1 0 — —
Pea46 seeds 5-03-600 89 0.15 547 0.20 31 18.7 1.8 4.6 1.0 0 0.2 1.0
Peanut (Groundnut)47 meal, mech. extr. 5-03-649 92 0.35 1,848 0.70 166 47.0 5.2 7.1 7.4 0 2.7 —48 meal, sol. extr. 5-03-650 92 0.39 1,854 0.50 170 53.0 7.0 5.7 6.0 0 2.7 —
Potato49 protein concentrate 5-25-392 91 — — — — — — — — — — —
Poultry50 by-product, meal rendered 5-03-798 93 0.09 6,029 0.50 47 11.1 10.5 0.2 4.4 — — —
Rice51 bran 4-03-928 90 0.35 1,135 2.20 293 23.0 2.5 22.5 26.0 0 9.7 —52 grain, polished and broken 4-03-932 0.08 1,003 0.20 25 3.3 0.4 1.4 28.0 0 2.0 —
(Brewers’ Rice) 8953 polishings 4-03-943 90 0.37 1,237 0.20 520 47.0 1.8 19.8 27.6 0 61.0 0.1
Rye54 grain 4-04-047 88 0.08 419 0.60 19 8.0 1.6 3.6 2.6 0 9.0 —
Safflower55 meal, sol. extr. 5-04-110 92 1.03 820 0.50 11 33.9 2.3 4.6 12.0 0 16.0 —56 meal without hulls, sol. extr. 5-07-959 92 1.03 3,248 1.60 22 39.1 2.4 4.5 11.3 0 16.0 —
Sesame57 meal, mech. extr. 5-04-220 93 0.24 1,536 — 30 6.0 3.6 2.8 12.5 0 1.0 0.2
Sorghum58 grain 4-20-893 89 0.26 668 0.17 41c 12.4 1.3 3.0 5.2 0 5.0 —
Soybean59 meal, sol. extr. 5-04-604 89 0.27 2,794 1.37 34 16.0 2.9 4.5 6.0 0 2.3 0.260 meal without hulls, sol. extr. 5-04-612 90 0.26 2,731 1.37 22 15.0 3.1 3.2 6.4 0 2.3 0.261 protein concentrate — 90 — — — — — — — — — — —62 protein isolate 5-08-038 92 0.30 2 2.50 6 4.2 1.7f 0.3f 5.4f 0 — —63 seeds, heat processed 5-04-597 90 0.24 2,307 3.60 22 15.0 2.6 11.0 10.8 0 18.1 1.9
Sunflower64 meal, sol. extr. 5-09-340 90 1.40 3,791 1.14 264 29.9 3.0 3.0 11.1 0 9.1 —65 meal without hulls, sol. extr. 5-04-739 93 1.45 3,150 1.14 220 24.0 3.6 3.5 13.7 0 9.1 —
Triticale66 grain 4-20-362 90 — 462 — — — 0.4 — — — 1.7 —
Wheat67 bran 4-05-190 89 0.36 1,232 0.63 186 31.0 4.6 8.0 12.0 0 16.5 1.068 grain, hard red spring 4-05-258 88 0.11 1,026 0.44 56c 12.5 1.3 5.1 3.6 0 — —69 grain, hard red winter 4-05-268 88 0.11 778 0.22 48c 9.9 1.4 4.5 3.4 0 11.6 0.470 grain, soft red winter 4-05-294 88 0.11 1,092 0.35 48c 9.9 1.4 4.5 2.2 0 — —71 grain, soft white winter 4-05-337 89 0.11 1,002 0.22 57c 11.0 1.3 4.3 4.0 0 11.6 0.472 middlings, , 9.5% fiber 4-05-205 89 0.33 1,187 0.76 72 15.6 1.8 16.5 9.0 0 20.1 3.073 red dog, , 4% fiber 4-05-203 88 0.11 1,534 0.80 42 13.3 2.2 22.8 4.6 — — —74 shorts, , 7% fiber 4-05-201 88 0.24 1,170 1.40 107 22.3 3.3 18.1 7.2 0 — —
Whey75 dried 4-01-182 96 0.27 1,820 0.85 10 47.0 27.1 4.1 4.0 23 0.3 —76 low lactose, dried 4-01-186 96 0.27 3,571 0.69 19 69.0 37.2 5.7 4.4 25 0.3 —77 permeate, dried — 96 — — — — — — — — — — —
Yeast, Brewers’78 dried 7-05-527 93 0.63 3,984 9.90 448 109 37.0 91.8 42.8 1 10.0 —
Yeast, Torula79 dried 7-05-534 93 0.58 2,881 22.4 492 84.2 49.9 6.2 36.3 — — —
aDash indicates that no data were available.bFirst digit is class of feed: 1, dry forages and roughages; 2, pasture, range plants, and forages fed green; 3, silages; 4, energy feeds; 5, protein supplements; 6, minerals;
7, vitamins; 8, additives; the other five digits are the International Feed Number.cThe niacin in corn, oats, sorghum, and wheat grain is totally unavailable. The bioavailability of niacin in most by-products produced from these grains is probably also low.dAs a-tocopherol.eConversion of beta-carotene to vitamin A: 1 mg of all-trans beta-carotene 4 267 IU of vitamin A or 80 mg of vitamin A alcohol (retinol) or 92 mg of retinyl acetate.fThe riboflavin, thiamin, and vitamin B6 in soybean protein isolate are totally unavailable.

132 Nutrient Requirements of Swine
TABLE 11-4 Amino Acid Composition of Some Feed Ingredients Commonly Used for Swine (data on as-fed basis)a
Interna- Dry Crude His- Iso- Ly- Me- Phenyl- Tryp-Entry tional Mat- Pro- Agri- ti- leu- Leu- sine thi- Cys- ala- Tyro- Thre- to-Num- Feed ter tein nine dine cine cine (%) onine tine nine sine onine phan Valineber Description Numberb (%) (%) (%) (%) (%) (%) (%) (%) (%) (%) (%) (%) (%)
Alfalfa01 meal dehydrated, 17% CP 1-00-023 92 17.0 0.71 0.37 0.68 1.21 0.74 0.25 0.18 0.84 0.55 0.70 0.24 0.8602 meal dehydrated, 20% CP 1-00-024 92 19.6 0.91 0.38 0.89 1.40 0.90 0.34 0.26 0.93 0.60 0.82 0.35 1.05
Bakery Waste03 dried bakery product 4-00-466 91 10.8 0.46 0.24 0.38 0.80 0.27 0.18 0.23 0.50 0.36 0.33 0.10 0.46
Barley04 grain, two row 4-00-572 89 11.3 0.54 0.25 0.39 0.77 0.41 0.20 0.28 0.55 0.29 0.35 0.11 0.5205 grain, six row 4-00-574 89 10.5 0.48 0.22 0.37 0.68 0.36 0.17 0.20 0.49 0.32 0.34 0.13 0.4906 grain, hulless 4-00-552 88 14.9 0.56 0.23 0.41 0.77 0.44 0.16 0.24 0.61 0.40 0.40 0.13 0.55
Beet, Sugar07 pulp, dried 4-00-669 91 8.6 0.32 0.23 0.31 0.53 0.52 0.07 0.06 0.30 0.40 0.38 0.10 0.45
Blood08 meal, conventional 5-00-380 92 77.1 3.34 5.06 0.91 10.99 7.04 0.99 1.09 5.34 2.29 4.05 1.08 7.0509 meal, flash dried 5-26-006 92 87.6 3.37 4.57 0.88 11.48 7.56 0.95 1.20 6.41 2.32 4.07 1.06 8.0310 meal, spray or ring dried 5-00-381 93 88.8 3.69 5.30 1.03 10.81 7.45 0.99 1.04 5.81 2.71 3.78 1.48 7.0311 plasma, spray dried — 92 78.0 4.55 2.55 2.71 7.61 6.84 0.75 2.63 4.42 3.53 4.72 1.36 4.9412 cells, spray dried — 92 92.0 3.77 6.99 0.49 12.70 8.51 0.81 0.61 6.69 2.14 3.38 1.37 8.50
Brewers’ Grains13 dried 5-02-141 92 26.5 1.53 0.53 1.02 2.08 1.08 0.45 0.49 1.22 0.88 0.95 0.26 1.26
Buckwheat, Common14 grain 4-00-994 88 11.1 0.92 0.25 0.40 0.64 0.57 0.19 0.23 0.45 0.31 0.41 0.17 0.56
Canola (Rapeseed)15 meal, sol. extr. 5-06-145 90 35.6 2.21 0.96 1.43 2.58 2.08 0.74 0.91 1.43 1.13 1.59 0.45 1.82
Casein16 dried 5-01-162 91 88.7 3.26 2.82 4.66 8.79 7.35 2.70 0.41 4.79 4.77 3.98 1.14 6.10
Cassava (Tapioca or Manioc)17 meal 4-01-152 88 3.3 0.18 0.08 0.11 0.19 0.12 0.04 0.05 0.15 0.04 0.11 0.04 0.14
Coconut (Copra)18 meal, sol. extr. 5-01-573 92 21.9 2.38 0.39 0.75 1.36 0.58 0.35 0.29 0.84 0.58 0.67 0.19 1.07
Corn, Yellow19 distillers’ grain 5-02-842 94 24.8 0.90 0.63 0.95 2.63 0.74 0.43 0.28 0.99 0.82 0.62 0.20 1.2420 distillers’ grain with solubles 5-02-843 93 27.7 1.13 0.69 1.03 2.57 0.62 0.50 0.52 1.34 0.83 0.94 0.25 1.3021 distillers’ solubles, 5-02-844 92 26.7 0.90 0.66 1.21 2.25 0.82 0.51 0.46 1.38 0.80 1.03 0.23 1.5022 gluten feed 5-02-903 90 21.5 1.04 0.67 0.66 1.96 0.63 0.35 0.46 0.76 0.58 0.74 0.07 1.0123 gluten meal, 60% CP 5-28-242 90 60.2 1.93 1.28 2.48 10.19 1.02 1.43 1.09 3.84 3.25 2.08 0.31 2.7924 grain 4-02-935 89 8.3 0.37 0.23 0.28 0.99 0.26 0.17 0.19 0.39 0.25 0.29 0.06 0.3925 grits by-product (Hominy Feed) 4-03-011 90 10.3 0.56 0.28 0.36 0.98 0.38 0.18 0.18 0.43 0.40 0.40 0.10 0.52
Cottonseed26 meal, mech. extr. 41% CP 5-01-617 92 42.4 4.26 1.11 1.29 2.45 1.65 0.67 0.69 1.97 1.23 1.34 0.54 1.7627 meal, sol. extr. 41% CP 5-07-872 90 41.4 4.55 1.17 1.30 2.47 1.72 0.67 0.70 2.20 1.22 1.36 0.48 1.78
Fababean (Broadbean)28 seeds 5-09-262 87 25.4 2.28 0.67 1.03 1.89 1.62 0.20 0.32 1.03 0.87 0.89 0.22 1.14
Feather29 meal, hydrolyzed 5-03-795 93 84.5 5.62 0.93 3.86 6.79 2.08 0.61 4.13 4.01 2.41 3.82 0.54 5.88
Fish30 Anchovy meal, mech. extr. 5-01-985 92 64.6 3.68 1.56 3.06 5.00 5.11 1.95 0.61 2.66 2.15 2.82 0.76 3.5131 Herring meal, mech. extr. 5-02-000 93 68.1 4.01 1.52 2.91 5.20 5.46 2.04 0.66 2.75 2.18 3.02 0.74 3.4632 Menhaden meal, mech. extr. 5-02-009 92 62.9 3.66 1.78 2.57 4.54 4.81 1.77 0.57 2.51 2.04 2.64 0.66 3.0333 White meal, mech. extr. 5-02-025 91 63.3 4.04 1.34 2.61 4.39 4.51 1.76 0.68 2.32 2.03 2.60 0.66 3.0634 solubles, condensed 5-01-969 51 32.7 1.61 1.56 1.06 1.86 1.73 0.50 0.30 0.93 0.40 0.86 0.31 1.1635 solubles, dried 5-01-971 92 64.2 2.67 1.23 1.56 2.68 2.84 0.98 0.49 1.22 0.62 1.40 0.34 1.94
Flax (Linseed)36 meal sol. extr. 5-02-048 90 33.6 2.97 0.68 1.56 2.06 1.24 0.59 0.59 1.57 1.03 1.26 0.52 1.74
Lentil37 seeds 5-02-506 89 24.4 2.05 0.78 1.00 1.84 1.71 0.18 0.27 1.29 0.70 0.84 0.21 1.27
Lupin (Sweet White)38 seeds 5-27-717 89 34.9 3.38 0.77 1.40 2.43 1.54 0.27 0.51 1.22 1.35 1.20 0.26 1.29
Meat39 meal rendered 5-00-385 94 54.0 3.60 1.14 1.60 3.84 3.07 0.80 0.60 2.17 1.40 1.97 0.35 2.6640 meal rendered with bone 5-00-388 93 51.5 3.45 0.91 1.34 2.98 2.51 0.68 0.50 1.62 1.07 1.59 0.28 2.04
Milk (Cattle)41 skim, dried 5-01-175 96 34.6 1.24 1.05 1.87 3.67 2.86 0.92 0.30 1.78 1.87 1.62 0.51 2.33
Continues
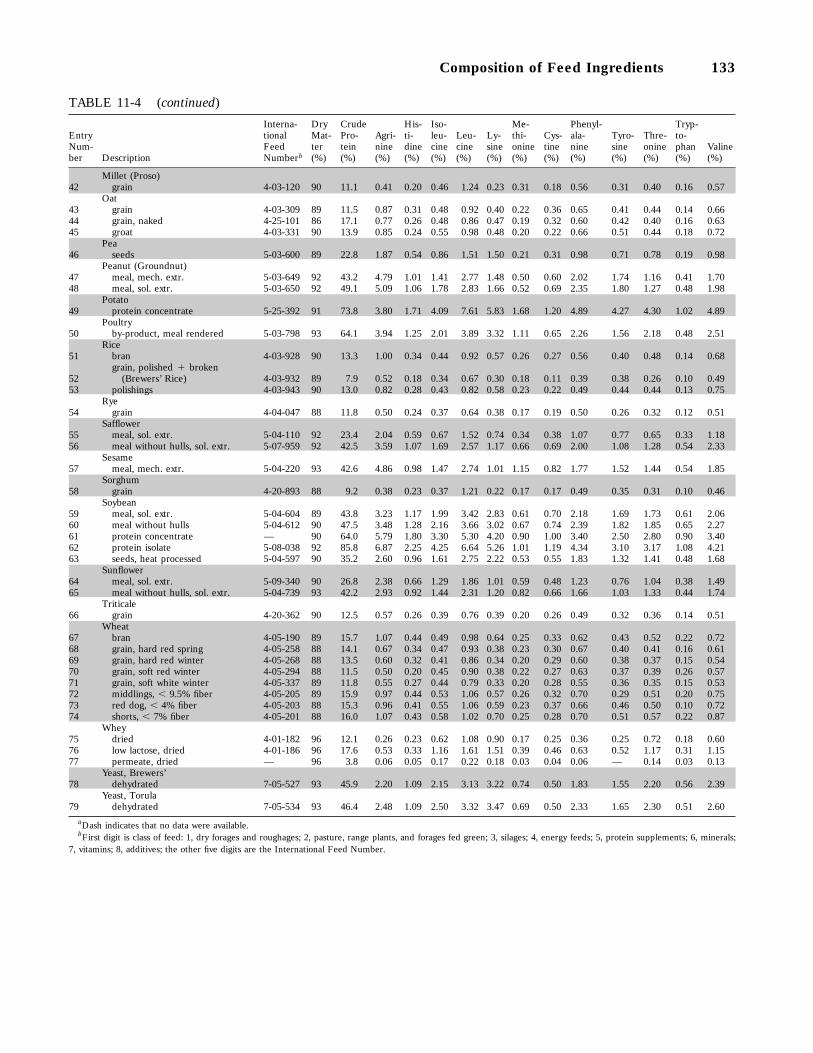
Composition of Feed Ingredients 133
TABLE 11-4 (continued)
Interna- Dry Crude His- Iso- Me- Phenyl- Tryp-Entry tional Mat- Pro- Agri- ti- leu- Leu- Ly- thi- Cys- ala- Tyro- Thre- to-Num- Feed ter tein nine dine cine cine sine onine tine nine sine onine phan Valineber Description Numberb (%) (%) (%) (%) (%) (%) (%) (%) (%) (%) (%) (%) (%) (%)
Millet (Proso)42 grain 4-03-120 90 11.1 0.41 0.20 0.46 1.24 0.23 0.31 0.18 0.56 0.31 0.40 0.16 0.57
Oat43 grain 4-03-309 89 11.5 0.87 0.31 0.48 0.92 0.40 0.22 0.36 0.65 0.41 0.44 0.14 0.6644 grain, naked 4-25-101 86 17.1 0.77 0.26 0.48 0.86 0.47 0.19 0.32 0.60 0.42 0.40 0.16 0.6345 groat 4-03-331 90 13.9 0.85 0.24 0.55 0.98 0.48 0.20 0.22 0.66 0.51 0.44 0.18 0.72
Pea46 seeds 5-03-600 89 22.8 1.87 0.54 0.86 1.51 1.50 0.21 0.31 0.98 0.71 0.78 0.19 0.98
Peanut (Groundnut)47 meal, mech. extr. 5-03-649 92 43.2 4.79 1.01 1.41 2.77 1.48 0.50 0.60 2.02 1.74 1.16 0.41 1.7048 meal, sol. extr. 5-03-650 92 49.1 5.09 1.06 1.78 2.83 1.66 0.52 0.69 2.35 1.80 1.27 0.48 1.98
Potato49 protein concentrate 5-25-392 91 73.8 3.80 1.71 4.09 7.61 5.83 1.68 1.20 4.89 4.27 4.30 1.02 4.89
Poultry50 by-product, meal rendered 5-03-798 93 64.1 3.94 1.25 2.01 3.89 3.32 1.11 0.65 2.26 1.56 2.18 0.48 2.51
Rice51 bran 4-03-928 90 13.3 1.00 0.34 0.44 0.92 0.57 0.26 0.27 0.56 0.40 0.48 0.14 0.68
grain, polished ` broken52 (Brewers’ Rice) 4-03-932 89 7.9 0.52 0.18 0.34 0.67 0.30 0.18 0.11 0.39 0.38 0.26 0.10 0.4953 polishings 4-03-943 90 13.0 0.82 0.28 0.43 0.82 0.58 0.23 0.22 0.49 0.44 0.44 0.13 0.75
Rye54 grain 4-04-047 88 11.8 0.50 0.24 0.37 0.64 0.38 0.17 0.19 0.50 0.26 0.32 0.12 0.51
Safflower55 meal, sol. extr. 5-04-110 92 23.4 2.04 0.59 0.67 1.52 0.74 0.34 0.38 1.07 0.77 0.65 0.33 1.1856 meal without hulls, sol. extr. 5-07-959 92 42.5 3.59 1.07 1.69 2.57 1.17 0.66 0.69 2.00 1.08 1.28 0.54 2.33
Sesame57 meal, mech. extr. 5-04-220 93 42.6 4.86 0.98 1.47 2.74 1.01 1.15 0.82 1.77 1.52 1.44 0.54 1.85
Sorghum58 grain 4-20-893 88 9.2 0.38 0.23 0.37 1.21 0.22 0.17 0.17 0.49 0.35 0.31 0.10 0.46
Soybean59 meal, sol. extr. 5-04-604 89 43.8 3.23 1.17 1.99 3.42 2.83 0.61 0.70 2.18 1.69 1.73 0.61 2.0660 meal without hulls 5-04-612 90 47.5 3.48 1.28 2.16 3.66 3.02 0.67 0.74 2.39 1.82 1.85 0.65 2.2761 protein concentrate — 90 64.0 5.79 1.80 3.30 5.30 4.20 0.90 1.00 3.40 2.50 2.80 0.90 3.4062 protein isolate 5-08-038 92 85.8 6.87 2.25 4.25 6.64 5.26 1.01 1.19 4.34 3.10 3.17 1.08 4.2163 seeds, heat processed 5-04-597 90 35.2 2.60 0.96 1.61 2.75 2.22 0.53 0.55 1.83 1.32 1.41 0.48 1.68
Sunflower64 meal, sol. extr. 5-09-340 90 26.8 2.38 0.66 1.29 1.86 1.01 0.59 0.48 1.23 0.76 1.04 0.38 1.4965 meal without hulls, sol. extr. 5-04-739 93 42.2 2.93 0.92 1.44 2.31 1.20 0.82 0.66 1.66 1.03 1.33 0.44 1.74
Triticale66 grain 4-20-362 90 12.5 0.57 0.26 0.39 0.76 0.39 0.20 0.26 0.49 0.32 0.36 0.14 0.51
Wheat67 bran 4-05-190 89 15.7 1.07 0.44 0.49 0.98 0.64 0.25 0.33 0.62 0.43 0.52 0.22 0.7268 grain, hard red spring 4-05-258 88 14.1 0.67 0.34 0.47 0.93 0.38 0.23 0.30 0.67 0.40 0.41 0.16 0.6169 grain, hard red winter 4-05-268 88 13.5 0.60 0.32 0.41 0.86 0.34 0.20 0.29 0.60 0.38 0.37 0.15 0.5470 grain, soft red winter 4-05-294 88 11.5 0.50 0.20 0.45 0.90 0.38 0.22 0.27 0.63 0.37 0.39 0.26 0.5771 grain, soft white winter 4-05-337 89 11.8 0.55 0.27 0.44 0.79 0.33 0.20 0.28 0.55 0.36 0.35 0.15 0.5372 middlings, , 9.5% fiber 4-05-205 89 15.9 0.97 0.44 0.53 1.06 0.57 0.26 0.32 0.70 0.29 0.51 0.20 0.7573 red dog, , 4% fiber 4-05-203 88 15.3 0.96 0.41 0.55 1.06 0.59 0.23 0.37 0.66 0.46 0.50 0.10 0.7274 shorts, , 7% fiber 4-05-201 88 16.0 1.07 0.43 0.58 1.02 0.70 0.25 0.28 0.70 0.51 0.57 0.22 0.87
Whey75 dried 4-01-182 96 12.1 0.26 0.23 0.62 1.08 0.90 0.17 0.25 0.36 0.25 0.72 0.18 0.6076 low lactose, dried 4-01-186 96 17.6 0.53 0.33 1.16 1.61 1.51 0.39 0.46 0.63 0.52 1.17 0.31 1.1577 permeate, dried — 96 3.8 0.06 0.05 0.17 0.22 0.18 0.03 0.04 0.06 — 0.14 0.03 0.13
Yeast, Brewers’78 dehydrated 7-05-527 93 45.9 2.20 1.09 2.15 3.13 3.22 0.74 0.50 1.83 1.55 2.20 0.56 2.39
Yeast, Torula79 dehydrated 7-05-534 93 46.4 2.48 1.09 2.50 3.32 3.47 0.69 0.50 2.33 1.65 2.30 0.51 2.60
aDash indicates that no data were available.bFirst digit is class of feed: 1, dry forages and roughages; 2, pasture, range plants, and forages fed green; 3, silages; 4, energy feeds; 5, protein supplements; 6, minerals;
7, vitamins; 8, additives; the other five digits are the International Feed Number.
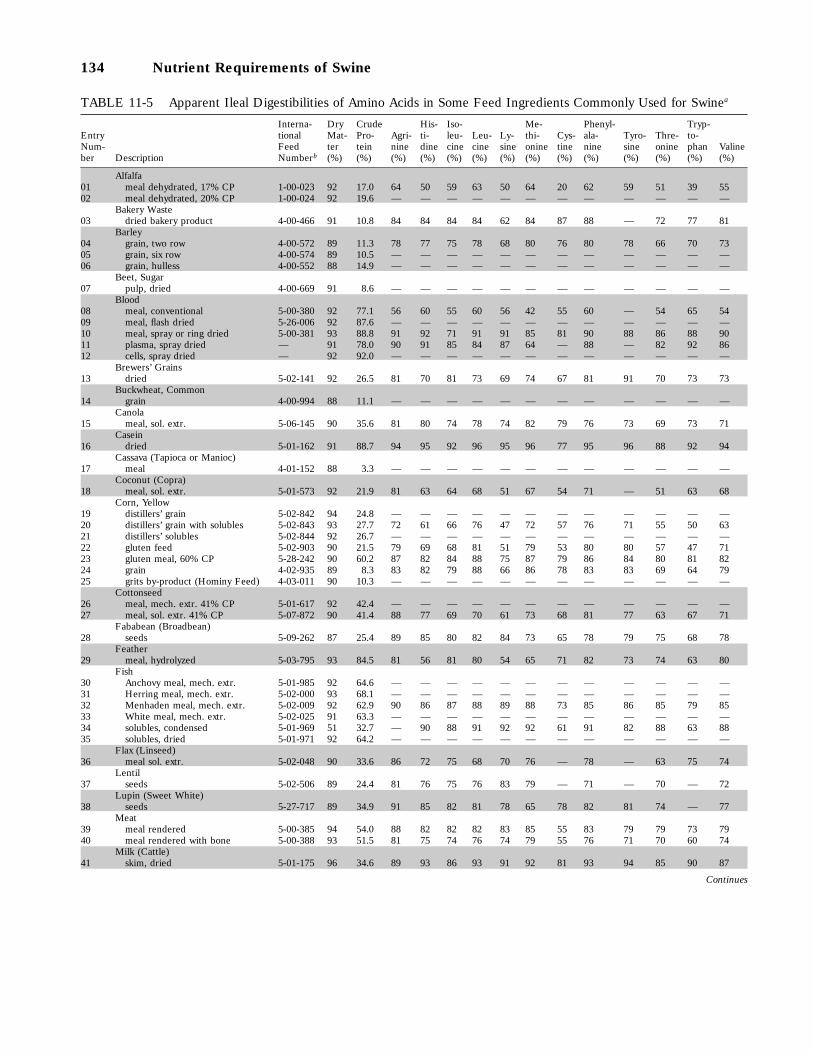
134 Nutrient Requirements of Swine
TABLE 11-5 Apparent Ileal Digestibilities of Amino Acids in Some Feed Ingredients Commonly Used for Swinea
Interna- Dry Crude His- Iso- Me- Phenyl- Tryp-Entry tional Mat- Pro- Agri- ti- leu- Leu- Ly- thi- Cys- ala- Tyro- Thre- to-Num- Feed ter tein nine dine cine cine sine onine tine nine sine onine phan Valineber Description Numberb (%) (%) (%) (%) (%) (%) (%) (%) (%) (%) (%) (%) (%) (%)
Alfalfa01 meal dehydrated, 17% CP 1-00-023 92 17.0 64 50 59 63 50 64 20 62 59 51 39 5502 meal dehydrated, 20% CP 1-00-024 92 19.6 — — — — — — — — — — — —
Bakery Waste03 dried bakery product 4-00-466 91 10.8 84 84 84 84 62 84 87 88 — 72 77 81
Barley04 grain, two row 4-00-572 89 11.3 78 77 75 78 68 80 76 80 78 66 70 7305 grain, six row 4-00-574 89 10.5 — — — — — — — — — — — —06 grain, hulless 4-00-552 88 14.9 — — — — — — — — — — — —
Beet, Sugar07 pulp, dried 4-00-669 91 8.6 — — — — — — — — — — — —
Blood08 meal, conventional 5-00-380 92 77.1 56 60 55 60 56 42 55 60 — 54 65 5409 meal, flash dried 5-26-006 92 87.6 — — — — — — — — — — — —10 meal, spray or ring dried 5-00-381 93 88.8 91 92 71 91 91 85 81 90 88 86 88 9011 plasma, spray dried — 91 78.0 90 91 85 84 87 64 — 88 — 82 92 8612 cells, spray dried — 92 92.0 — — — — — — — — — — — —
Brewers’ Grains13 dried 5-02-141 92 26.5 81 70 81 73 69 74 67 81 91 70 73 73
Buckwheat, Common14 grain 4-00-994 88 11.1 — — — — — — — — — — — —
Canola15 meal, sol. extr. 5-06-145 90 35.6 81 80 74 78 74 82 79 76 73 69 73 71
Casein16 dried 5-01-162 91 88.7 94 95 92 96 95 96 77 95 96 88 92 94
Cassava (Tapioca or Manioc)17 meal 4-01-152 88 3.3 — — — — — — — — — — — —
Coconut (Copra)18 meal, sol. extr. 5-01-573 92 21.9 81 63 64 68 51 67 54 71 — 51 63 68
Corn, Yellow19 distillers’ grain 5-02-842 94 24.8 — — — — — — — — — — — —20 distillers’ grain with solubles 5-02-843 93 27.7 72 61 66 76 47 72 57 76 71 55 50 6321 distillers’ solubles 5-02-844 92 26.7 — — — — — — — — — — — —22 gluten feed 5-02-903 90 21.5 79 69 68 81 51 79 53 80 80 57 47 7123 gluten meal, 60% CP 5-28-242 90 60.2 87 82 84 88 75 87 79 86 84 80 81 8224 grain 4-02-935 89 8.3 83 82 79 88 66 86 78 83 83 69 64 7925 grits by-product (Hominy Feed) 4-03-011 90 10.3 — — — — — — — — — — — —
Cottonseed26 meal, mech. extr. 41% CP 5-01-617 92 42.4 — — — — — — — — — — — —27 meal, sol. extr. 41% CP 5-07-872 90 41.4 88 77 69 70 61 73 68 81 77 63 67 71
Fababean (Broadbean)28 seeds 5-09-262 87 25.4 89 85 80 82 84 73 65 78 79 75 68 78
Feather29 meal, hydrolyzed 5-03-795 93 84.5 81 56 81 80 54 65 71 82 73 74 63 80
Fish30 Anchovy meal, mech. extr. 5-01-985 92 64.6 — — — — — — — — — — — —31 Herring meal, mech. extr. 5-02-000 93 68.1 — — — — — — — — — — — —32 Menhaden meal, mech. extr. 5-02-009 92 62.9 90 86 87 88 89 88 73 85 86 85 79 8533 White meal, mech. extr. 5-02-025 91 63.3 — — — — — — — — — — — —34 solubles, condensed 5-01-969 51 32.7 — 90 88 91 92 92 61 91 82 88 63 8835 solubles, dried 5-01-971 92 64.2 — — — — — — — — — — — —
Flax (Linseed)36 meal sol. extr. 5-02-048 90 33.6 86 72 75 68 70 76 — 78 — 63 75 74
Lentil37 seeds 5-02-506 89 24.4 81 76 75 76 83 79 — 71 — 70 — 72
Lupin (Sweet White)38 seeds 5-27-717 89 34.9 91 85 82 81 78 65 78 82 81 74 — 77
Meat39 meal rendered 5-00-385 94 54.0 88 82 82 82 83 85 55 83 79 79 73 7940 meal rendered with bone 5-00-388 93 51.5 81 75 74 76 74 79 55 76 71 70 60 74
Milk (Cattle)41 skim, dried 5-01-175 96 34.6 89 93 86 93 91 92 81 93 94 85 90 87
Continues

Composition of Feed Ingredients 135
TABLE 11-5 (continued)
Interna- Dry Crude His- Iso- Me- Phenyl- Tryp-Entry tional Mat- Pro- Agri- ti- leu- Leu- Ly- thi- Cys- ala- Tyro- Thre- to-Num- Feed ter tein nine dine cine cine sine onine tine nine sine onine phan Valineber Description Numberb (%) (%) (%) (%) (%) (%) (%) (%) (%) (%) (%) (%) (%) (%)
Millet (Proso)42 grain 4-03-120 90 11.1 82 85 83 87 74 72 82 85 — 75 84 81
Oat43 grain 4-03-309 89 10.8 85 81 74 78 70 79 69 81 76 59 72 7344 grain, naked 4-25-101 86 17.1 — — — — — — — — — — — —45 groat 4-03-331 90 13.9 86 83 83 83 79 85 80 86 82 76 80 82
Pea46 seeds 5-03-600 89 22.8 87 83 79 80 84 78 68 81 83 73 70 76
Peanut (Groundnut)47 meal, mech. extr. 5-03-649 92 43.2 — — — — — — — — — — — —48 meal, sol. extr. 5-03-650 92 49.1 93 81 83 85 78 85 77 89 91 74 73 82
Potato49 protein concentrate 5-25-392 91 73.8 83 84 80 83 79 83 56 82 78 78 59 78
Poultry50 by-product, meal rendered 5-03-798 93 64.1 85 76 77 78 78 74 70 80 71 72 74 74
Rice51 bran 4-03-928 91 13.3 85 78 64 65 72 74 66 68 77 61 64 66
grain, polished ` broken52 (Brewers’ Rice) 4-03-932 89 7.9 — — — — — — — — — — — —53 polishings 4-03-943 90 13.0 82 80 62 65 68 71 61 64 68 61 61 63
Rye54 grain 4-04-047 88 11.8 73 71 68 71 64 76 74 76 65 59 67 67
Safflower55 meal, sol. extr. 5-04-110 92 23.4 — — — — — — — — — — — —56 meal without hulls, sol. extr. 5-07-959 92 42.5 — — — — — — — — — — — —
Sesame57 meal, mech. extr. 5-04-220 93 42.6 94 76 85 85 76 90 86 89 87 78 85 84
Sorghum58 grain 4-20-893 88 9.2 78 73 80 86 62 81 79 81 83 68 75 78
Soybean59 meal, sol. extr. 5-04-604 89 43.8 91 86 84 84 85 86 77 85 86 78 80 8160 meal without hulls 5-04-612 90 47.5 90 86 84 84 85 86 79 84 85 78 81 8161 protein concentrate — 90 64.0 97 95 93 93 93 91 90 94 93 90 89 9162 protein isolate 5-08-038 92 85.8 91 88 90 92 88 — — 88 89 85 — 8663 seeds, heat processed 5-04-597 90 35.2 89 82 78 80 81 78 76 82 85 77 75 76
Sunflower64 meal, sol. extr. 5-09-340 90 26.8 90 79 79 79 75 88 75 82 83 74 79 7765 meal without hulls, sol. extr. 5-04-739 93 42.2 89 79 78 77 74 87 74 80 77 71 76 75
Triticale66 grain 4-20-362 90 12.5 85 84 80 82 76 85 83 84 81 69 74 79
Wheat67 bran 4-05-190 89 15.7 83 76 69 71 69 76 70 76 75 60 65 7068 grain, hard red spring 4-05-258 88 14.1 — — — — — — — — — — — —69 grain, hard red winter 4-05-268 88 13.5 — — — — — — — — — — — —70 grain, soft red winter 4-05-294 88 11.5 83 84 84 85 73 85 84 87 84 72 81 8071 grain, soft white winter 4-05-337 89 11.8 — — — — — — — — — — — —72 middlings, , 9.5 % fiber 4-05-205 89 15.9 88 76 77 78 75 82 82 83 83 69 77 7673 red dog, , 4% fiber 4-05-203 88 15.3 — — — — — — — — — — — —74 shorts, , 7% fiber 4-05-201 88 16.0 86 82 77 80 73 81 66 82 78 72 77 76
Whey75 dried 4-01-182 96 12.1 86 91 85 89 82 84 86 80 71 79 78 8176 low lactose, dried 4-01-186 96 17.6 83 92 90 94 85 92 92 92 92 87 92 8977 permeate, dried — 96 3.8 — — — — — — — — — — — —
Yeast, Brewers’78 dehydrated 7-05-527 93 45.9 79 77 74 73 76 72 38 72 61 63 60 70
Yeast, Torula79 dehydrated 7-05-534 93 46.4 — — — — — — — — — — — —
aDash indicates that no data were available.bFirst digit is class of feed: 1, dry forages and roughages; 2, pasture, range plants, and forages fed green; 3, silages; 4, energy feeds; 5, protein supplement; 6, minerals; 7,
vitamins; 8, additives; the other five digits are the International Feed Number.Source: Southern (1991), Rho
ˆne-Poulenc (1993a), Jondreville et al. (1995), and Heartland Lysine (1995).
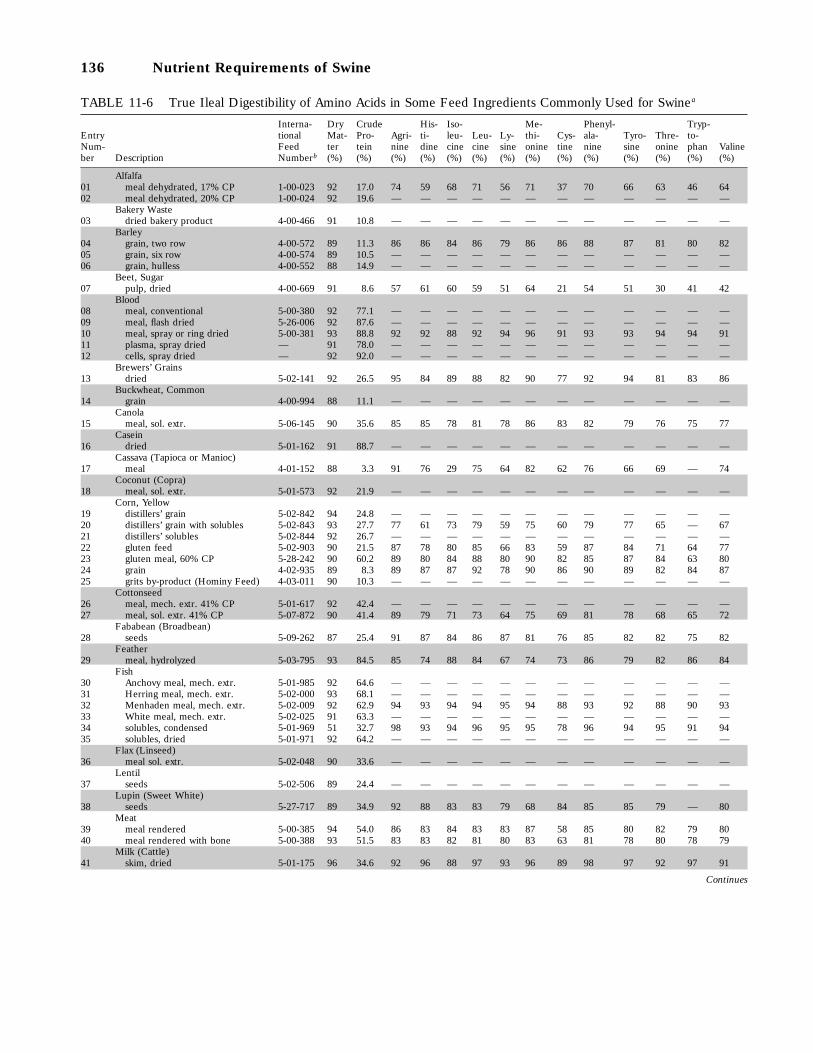
136 Nutrient Requirements of Swine
TABLE 11-6 True Ileal Digestibility of Amino Acids in Some Feed Ingredients Commonly Used for Swinea
Interna- Dry Crude His- Iso- Me- Phenyl- Tryp-Entry tional Mat- Pro- Agri- ti- leu- Leu- Ly- thi- Cys- ala- Tyro- Thre- to-Num- Feed ter tein nine dine cine cine sine onine tine nine sine onine phan Valineber Description Numberb (%) (%) (%) (%) (%) (%) (%) (%) (%) (%) (%) (%) (%) (%)
Alfalfa01 meal dehydrated, 17% CP 1-00-023 92 17.0 74 59 68 71 56 71 37 70 66 63 46 6402 meal dehydrated, 20% CP 1-00-024 92 19.6 — — — — — — — — — — — —
Bakery Waste03 dried bakery product 4-00-466 91 10.8 — — — — — — — — — — — —
Barley04 grain, two row 4-00-572 89 11.3 86 86 84 86 79 86 86 88 87 81 80 8205 grain, six row 4-00-574 89 10.5 — — — — — — — — — — — —06 grain, hulless 4-00-552 88 14.9 — — — — — — — — — — — —
Beet, Sugar07 pulp, dried 4-00-669 91 8.6 57 61 60 59 51 64 21 54 51 30 41 42
Blood08 meal, conventional 5-00-380 92 77.1 — — — — — — — — — — — —09 meal, flash dried 5-26-006 92 87.6 — — — — — — — — — — — —10 meal, spray or ring dried 5-00-381 93 88.8 92 92 88 92 94 96 91 93 93 94 94 9111 plasma, spray dried — 91 78.0 — — — — — — — — — — — —12 cells, spray dried — 92 92.0 — — — — — — — — — — — —
Brewers’ Grains13 dried 5-02-141 92 26.5 95 84 89 88 82 90 77 92 94 81 83 86
Buckwheat, Common14 grain 4-00-994 88 11.1 — — — — — — — — — — — —
Canola15 meal, sol. extr. 5-06-145 90 35.6 85 85 78 81 78 86 83 82 79 76 75 77
Casein16 dried 5-01-162 91 88.7 — — — — — — — — — — — —
Cassava (Tapioca or Manioc)17 meal 4-01-152 88 3.3 91 76 29 75 64 82 62 76 66 69 — 74
Coconut (Copra)18 meal, sol. extr. 5-01-573 92 21.9 — — — — — — — — — — — —
Corn, Yellow19 distillers’ grain 5-02-842 94 24.8 — — — — — — — — — — — —20 distillers’ grain with solubles 5-02-843 93 27.7 77 61 73 79 59 75 60 79 77 65 — 6721 distillers’ solubles 5-02-844 92 26.7 — — — — — — — — — — — —22 gluten feed 5-02-903 90 21.5 87 78 80 85 66 83 59 87 84 71 64 7723 gluten meal, 60% CP 5-28-242 90 60.2 89 80 84 88 80 90 82 85 87 84 63 8024 grain 4-02-935 89 8.3 89 87 87 92 78 90 86 90 89 82 84 8725 grits by-product (Hominy Feed) 4-03-011 90 10.3 — — — — — — — — — — — —
Cottonseed26 meal, mech. extr. 41% CP 5-01-617 92 42.4 — — — — — — — — — — — —27 meal, sol. extr. 41% CP 5-07-872 90 41.4 89 79 71 73 64 75 69 81 78 68 65 72
Fababean (Broadbean)28 seeds 5-09-262 87 25.4 91 87 84 86 87 81 76 85 82 82 75 82
Feather29 meal, hydrolyzed 5-03-795 93 84.5 85 74 88 84 67 74 73 86 79 82 86 84
Fish30 Anchovy meal, mech. extr. 5-01-985 92 64.6 — — — — — — — — — — — —31 Herring meal, mech. extr. 5-02-000 93 68.1 — — — — — — — — — — — —32 Menhaden meal, mech. extr. 5-02-009 92 62.9 94 93 94 94 95 94 88 93 92 88 90 9333 White meal, mech. extr. 5-02-025 91 63.3 — — — — — — — — — — — —34 solubles, condensed 5-01-969 51 32.7 98 93 94 96 95 95 78 96 94 95 91 9435 solubles, dried 5-01-971 92 64.2 — — — — — — — — — — — —
Flax (Linseed)36 meal sol. extr. 5-02-048 90 33.6 — — — — — — — — — — — —
Lentil37 seeds 5-02-506 89 24.4 — — — — — — — — — — — —
Lupin (Sweet White)38 seeds 5-27-717 89 34.9 92 88 83 83 79 68 84 85 85 79 — 80
Meat39 meal rendered 5-00-385 94 54.0 86 83 84 83 83 87 58 85 80 82 79 8040 meal rendered with bone 5-00-388 93 51.5 83 83 82 81 80 83 63 81 78 80 78 79
Milk (Cattle)41 skim, dried 5-01-175 96 34.6 92 96 88 97 93 96 89 98 97 92 97 91
Continues

Composition of Feed Ingredients 137
TABLE 11-6 (continued)
Interna- Dry Crude His- Iso- Me- Phenyl- Tryp-Entry tional Mat- Pro- Agri- ti- leu- Leu- Ly- thi- Cys- ala- Tyro- Thre- to-Num- Feed ter tein nine dine cine cine sine onine tine nine sine onine phan Valineber Description Numberb (%) (%) (%) (%) (%) (%) (%) (%) (%) (%) (%) (%) (%) (%)
Millet (Proso)42 grain 4-03-120 90 11.1 — — — — — — — — — — — —
Oat43 grain 4-03-309 89 10.8 89 85 80 83 76 84 75 86 82 71 78 7944 grain, naked 4-25-101 86 17.1 — — — — — — — — — — — —45 groat 4-03-331 90 13.9 86 82 83 83 79 86 85 84 84 80 82 81
Pea46 seeds 5-03-600 89 22.8 90 89 85 86 88 84 79 87 87 83 81 83
Peanut (Groundnut)47 meal, mech. extr. 5-03-649 92 43.2 — — — — — — — — — — — —48 meal, sol. extr. 5-03-650 92 49.1 97 91 92 93 88 89 86 94 95 90 — 91
Potato49 protein concentrate 5-25-392 91 73.8 88 86 82 85 81 86 64 85 80 83 66 81
Poultry50 by-product, meal rendered 5-03-798 93 64.1 85 78 81 80 80 77 72 81 76 77 — 74
Rice51 bran 4-03-928 91 13.3 89 87 69 70 78 77 68 73 81 71 — 6952 grain, polished ` broken 4-03-932 89 7.9 — — — — — — — — — — — —
(Brewers’ Rice)53 polishings 4-03-943 90 13.0 85 82 67 69 72 75 65 68 73 67 67 67
Rye54 grain 4-04-047 88 11.8 79 78 77 79 73 81 83 82 76 73 75 75
Safflower55 meal, sol. extr. 5-04-110 92 23.4 — — — — — — — — — — — —56 meal, without hulls, sol. extr. 5-07-959 92 42.5 — — — — — — — — — — — —
Sesame57 meal, mech. extr. 5-04-220 93 42.6 96 93 91 92 85 92 92 93 91 90 — 89
Sorghum58 grain 4-20-893 88 9.2 87 81 87 90 81 89 83 88 87 84 83 87
Soybean59 meal, sol. extr. 5-04-604 89 43.8 93 90 88 88 89 91 84 88 90 85 87 8660 meal without hulls 5-04-612 90 47.5 94 91 89 89 90 91 87 89 90 87 90 8861 protein concentrate — 90 64.0 99 97 95 95 95 94 94 97 96 94 93 9462 protein isolate 5-08-038 92 85.8 — — — — — — — — — — — —63 seeds, heat processed 5-04-597 90 35.2 93 88 84 86 86 85 80 88 87 83 82 83
Sunflower64 meal, sol. extr. 5-09-340 90 26.8 93 83 84 85 81 91 81 87 88 82 84 8265 meal without hulls, sol. extr. 5-04-739 93 42.2 93 85 84 85 83 90 81 86 88 84 — 82
Triticale66 grain 4-20-362 90 12.5 88 84 84 86 81 89 87 85 83 76 88 84
Wheat67 bran 4-05-190 89 15.7 87 82 76 78 71 79 77 81 80 70 74 7568 grain, hard red spring 4-05-258 88 14.1 — — — — — — — — — — — —69 grain, hard red winter 4-05-268 88 13.5 — — — — — — — — — — — —70 grain, soft red winter 4-05-294 88 11.5 88 89 89 89 81 90 90 91 89 84 90 8671 grain, soft white winter 4-05-337 89 11.8 — — — — — — — — — — — —72 middlings, , 9.5% fiber 4-05-205 89 15.9 95 94 92 93 89 93 91 95 92 88 91 9073 red dog, , 4% fiber 4-05-203 88 15.3 — — — — — — — — — — — —74 shorts, , 7% fiber 4-05-201 88 16.0 89 84 81 84 77 85 80 86 83 78 83 81
Whey75 dried 4-01-182 96 12.1 48 89 83 87 87 81 85 83 77 79 79 7776 low lactose, dried 4-01-186 96 17.6 88 95 92 96 87 95 96 96 95 89 95 9277 permeate, dried — 96 3.8 — — — — — — — — — — — —
Yeast, Brewers’78 dehydrated 7-05-527 93 45.9 78 77 72 73 74 71 48 67 64 66 54 66
Yeast, Torula79 dehydrated 7-05-534 93 46.4 — — — — — — — — — — — —
aDash indicates that no data were available.bFirst digit is class of feed: 1, dry forages and roughages; 2, pasture, range plants, and forages fed green; 3, silages; 4, energy feeds; 5, protein supplements; 6, minerals;
7, vitamins; 8, additives; the other five digits are the International Feed Number.Source: Southern (1991), Rho
ˆne-Poulenc (1993a), and Jondreville et al. (1995).
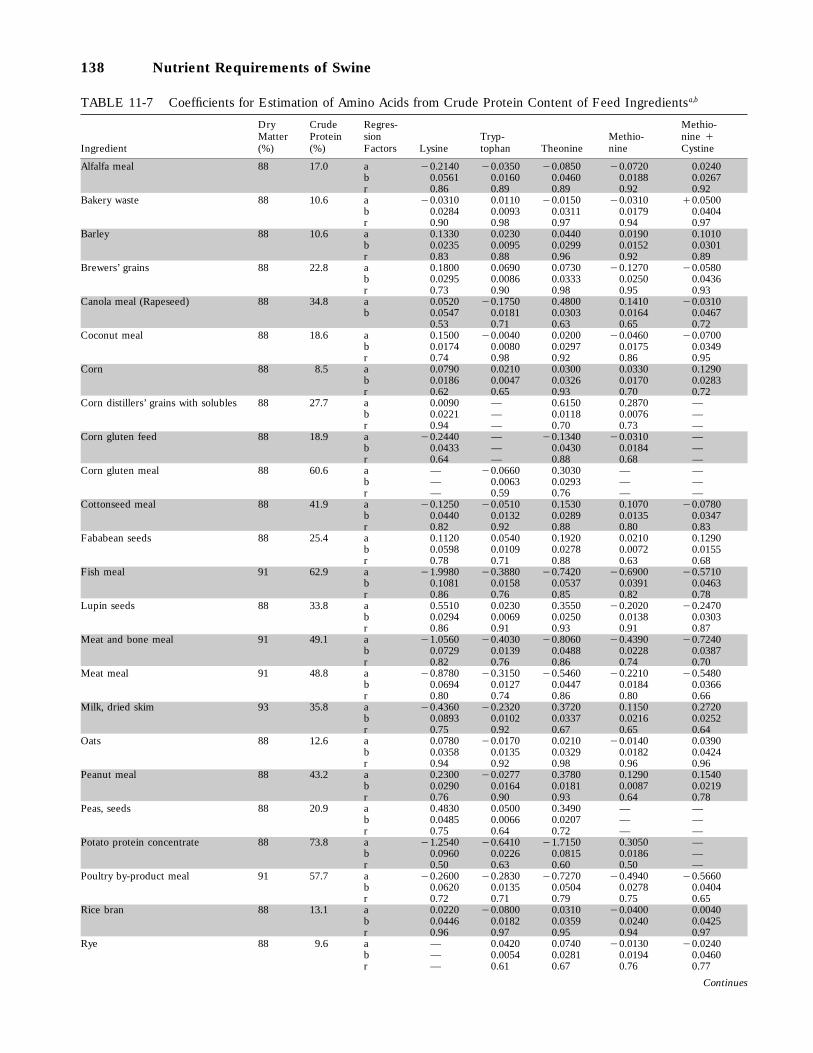
138 Nutrient Requirements of Swine
TABLE 11-7 Coefficients for Estimation of Amino Acids from Crude Protein Content of Feed Ingredientsa,b
Dry Crude Regres- Methio-Matter Protein sion Tryp- Methio- nine `
Ingredient (%) (%) Factors Lysine tophan Theonine nine Cystine
Alfalfa meal 88 17.0 a 10.2140 10.0350 10.0850 10.0720 0.0240b 0.0561 0.0160 0.0460 0.0188 0.0267r 0.86 0.89 0.89 0.92 0.92
Bakery waste 88 10.6 a 10.0310 0.0110 10.0150 10.0310 `0.0500b 0.0284 0.0093 0.0311 0.0179 0.0404r 0.90 0.98 0.97 0.94 0.97
Barley 88 10.6 a 0.1330 0.0230 0.0440 0.0190 0.1010b 0.0235 0.0095 0.0299 0.0152 0.0301r 0.83 0.88 0.96 0.92 0.89
Brewers’ grains 88 22.8 a 0.1800 0.0690 0.0730 10.1270 10.0580b 0.0295 0.0086 0.0333 0.0250 0.0436r 0.73 0.90 0.98 0.95 0.93
Canola meal (Rapeseed) 88 34.8 a 0.0520 10.1750 0.4800 0.1410 10.0310b 0.0547 0.0181 0.0303 0.0164 0.0467
0.53 0.71 0.63 0.65 0.72Coconut meal 88 18.6 a 0.1500 10.0040 0.0200 10.0460 10.0700
b 0.0174 0.0080 0.0297 0.0175 0.0349r 0.74 0.98 0.92 0.86 0.95
Corn 88 8.5 a 0.0790 0.0210 0.0300 0.0330 0.1290b 0.0186 0.0047 0.0326 0.0170 0.0283r 0.62 0.65 0.93 0.70 0.72
Corn distillers’ grains with solubles 88 27.7 a 0.0090 — 0.6150 0.2870 —b 0.0221 — 0.0118 0.0076 —r 0.94 — 0.70 0.73 —
Corn gluten feed 88 18.9 a 10.2440 — 10.1340 10.0310 —b 0.0433 — 0.0430 0.0184 —r 0.64 — 0.88 0.68 —
Corn gluten meal 88 60.6 a — 10.0660 0.3030 — —b — 0.0063 0.0293 — —r — 0.59 0.76 — —
Cottonseed meal 88 41.9 a 10.1250 10.0510 0.1530 0.1070 10.0780b 0.0440 0.0132 0.0289 0.0135 0.0347r 0.82 0.92 0.88 0.80 0.83
Fababean seeds 88 25.4 a 0.1120 0.0540 0.1920 0.0210 0.1290b 0.0598 0.0109 0.0278 0.0072 0.0155r 0.78 0.71 0.88 0.63 0.68
Fish meal 91 62.9 a 11.9980 10.3880 10.7420 10.6900 10.5710b 0.1081 0.0158 0.0537 0.0391 0.0463r 0.86 0.76 0.85 0.82 0.78
Lupin seeds 88 33.8 a 0.5510 0.0230 0.3550 10.2020 10.2470b 0.0294 0.0069 0.0250 0.0138 0.0303r 0.86 0.91 0.93 0.91 0.87
Meat and bone meal 91 49.1 a 11.0560 10.4030 10.8060 10.4390 10.7240b 0.0729 0.0139 0.0488 0.0228 0.0387r 0.82 0.76 0.86 0.74 0.70
Meat meal 91 48.8 a 10.8780 10.3150 10.5460 10.2210 10.5480b 0.0694 0.0127 0.0447 0.0184 0.0366r 0.80 0.74 0.86 0.80 0.66
Milk, dried skim 93 35.8 a 10.4360 10.2320 0.3720 0.1150 0.2720b 0.0893 0.0102 0.0337 0.0216 0.0252r 0.75 0.92 0.67 0.65 0.64
Oats 88 12.6 a 0.0780 10.0170 0.0210 10.0140 0.0390b 0.0358 0.0135 0.0329 0.0182 0.0424r 0.94 0.92 0.98 0.96 0.96
Peanut meal 88 43.2 a 0.2300 10.0277 0.3780 0.1290 0.1540b 0.0290 0.0164 0.0181 0.0087 0.0219r 0.76 0.90 0.93 0.64 0.78
Peas, seeds 88 20.9 a 0.4830 0.0500 0.3490 — —b 0.0485 0.0066 0.0207 — —r 0.75 0.64 0.72 — —
Potato protein concentrate 88 73.8 a 11.2540 10.6410 11.7150 0.3050 —b 0.0960 0.0226 0.0815 0.0186 —r 0.50 0.63 0.60 0.50 —
Poultry by-product meal 91 57.7 a 10.2600 10.2830 10.7270 10.4940 10.5660b 0.0620 0.0135 0.0504 0.0278 0.0404r 0.72 0.71 0.79 0.75 0.65
Rice bran 88 13.1 a 0.0220 10.0800 0.0310 10.0400 0.0040b 0.0446 0.0182 0.0359 0.0240 0.0425r 0.96 0.97 0.95 0.94 0.97
Rye 88 9.6 a — 0.0420 0.0740 10.0130 10.0240b — 0.0054 0.0281 0.0194 0.0460r — 0.61 0.67 0.76 0.77
Continues

Composition of Feed Ingredients 139
TABLE 11-7 (continued)
Dry Crude Regres- Methio-Matter Protein sion Tryp- Methio- nine `
Ingredient (%) (%) Factors Lysine tophan Theonine nine Cystine
Sesame meal 88 41.1 a 0.1540 10.1680 0.1760 10.0080 0.0250b 0.0210 0.0181 0.0308 0.0282 0.0473r 0.81 0.94 0.94 0.88 0.91
Sorghum grain 88 9.2 a 0.0910 0.0170 0.0320 0.0390 0.0980b 0.0138 0.0090 0.0302 0.0140 0.0261r 0.76 0.94 0.98 0.86 0.87
Soybean meal 88 45.6 a 10.0810 0.0580 0.0810 0.0170 0.1470b 0.0644 0.0118 0.0381 0.0141 0.0263r 0.78 0.59 0.81 0.65 0.57
Sunflower meal 88 33.5 a 0.1720 10.0490 0.0360 10.0570 10.0160b 0.0304 0.0134 0.0361 0.0247 0.0411r 0.86 0.92 0.95 0.93 0.94
Triticale 88 11.6 a 0.2050 0.0260 0.1390 0.0550 0.1310b 0.0183 0.0081 0.0214 0.0131 0.0309r 0.61 0.83 0.71 0.780 0.75
Wheat 88 13.3 a 10.0270 0.0310 0.0080 0.0030 0.0750b 0.0306 0.0091 0.0284 0.0157 0.0322r 0.77 0.85 0.94 0.92 0.93
Wheat bran 88 15.7 a 0.0400 0.0650 0.0470 0.0030 0.1620b 0.0381 0.0099 0.0299 0.0155 0.0264r 0.80 0.50 0.89 0.82 0.80
Wheat middlings 88 15.9 a 0.3230 — 0.1300 0.0690 10.0250b 0.0158 — 0.0240 0.0123 0.0387r 0.41 — 0.96 0.73 0.88
aTo estimate amino acid content, use the equation y 4 a ` bx, where y is the percentage of the amino acid in the sample, x is the percentage of crude protein in thesample, a is the intercept, and b is the regression coefficient. The r-value is the correlation between the two variables. Note that the percentages of crude protein and drymatter may not agree with previous tables because they were obtained from different data sets.
bDash indicates that no coefficients were available.Source: Fickler et al. (1995).
TABLE 11-8 Mineral Concentrations in Macro Mineral Sources (data on as-fed basis)
Inter- Phosphorusnational Cal- Phos- Bioavail- Chlo- Potas- Magne- Mang-
Entry Feed ciuma phorus abilityb Sodium rine sium sium Sulfur Iron aneseNumber Description No. (%) (%) (%) (%) (%) (%) (%) (%) (%) (%)
01 Bone meal, steamed 6-00-400 29.80 12.50 80 to 90 0.04 — 0.20 0.30 2.40 — 0.0302 Calcium carbonate 6-01-069 38.50 0.02 0.08 0.02 0.08 1.61 0.08 0.06 0.0203 Calcium phosphate (dicalcium) 6-01-080 20 to 24 18.50 95 to 100 0.18 0.47 0.15 0.80 0.80 0.79 0.1404 Calcium phosphate (monocalcium) 6-26-334 17.00 21.10 100 0.20 — 0.16 0.90 0.80 0.75 0.0105 Calcium sulfate, dihydrate 6-01-090 21.85 — — — — 0.48 16.19 — —06 Limestone, groundc 6-02-632 35.84 0.01 0.06 0.02 0.11 2.06 0.04 0.35 0.0207 Magnesium carbonate 6-02-754 0.02 — — — — 30.20 — — 0.0108 Magnesium oxide 6-02-756 1.69 — — — 0.02 55.00 0.10 1.06 —09 Magnesium sulfate, heptahydrate 6-02-758 0.02 — — 0.01 — 9.60 13.04 — —10 Phosphate, defluorinated 6-01-780 32.00 18.00 85 to 95 3.27 — 0.10 0.29 0.13 0.84d 0.0511 Phosphate, monoammonium 6-09-338 0.35 24.20 100 0.20 — 0.16 0.75 1.50 0.41 0.0112 Phosphate, rock curac
¸ao, ground 6-05-586 35.09 14.23 40 to 60 0.20 — — 0.80 — 0.35 —
13 Phosphate, rock, soft 6-03-947 16.09 9.05 30 to 50 0.10 — — 0.38 — 1.92 0.1014 Potassium chloride 6-03-755 0.05 — 1.00 46.93 51.37 0.23 0.32 0.06 0.00115 Potassium and magnesium sulfate 6-06-177 0.06 — 0.76 1.25 18.45 11.58 21.97 0.01 0.00216 Potassium sulfate 6-08-098 0.15 — 0.09 1.50 43.04 0.60 17.64 0.07 0.00117 Sodium carbonate 6-12-316 — — 43.30 — — — — — —18 Sodium bicarbonate 6-04-272 0.01 — 27.00 — 0.01 — — — —19 Sodium chloride 6-04-152 0.30 — 39.50 59.00 — 0.005 0.20 0.01 —20 Sodium phosphate, dibasic 6-04-286 — 21.15 100 31.04 — — — — — —21 Sodium phosphate, monobasic 6-04-288 0.09 24.94 100 18.65 0.02 0.01 0.01 — — —22 Sodium sulfate, decahydrate 6-04-291 — — 13.80 — — — 9.70 — —
NOTE: The mineral supplements used as feed supplements are not chemically pure compounds, and the composition may vary substantially among sources. The supplier’sanalysis should be used if it is available. For example, feed-grade dicalcium phosphate contains some monocalcium phosphate and feed-grade monocalcium phosphate containssome dicalcium phosphate. Dashes indicate that no data were available.
aEstimates suggest 90 to 100% bioavailability of calcium in most sources of monocalcium phosphate, dicalcium phosphate, tricalcium phosphate, defluorinated phosphate,calcium carbonate, calcium sulfate, and calcitic limestone. The calcium in high-magnesium limestone or dolomitic limestone is less bioavailable (50 to 80%).
bBioavailability estimates are generally expressed as a percentage of monosodium phosphate or monocalcium phosphate.cMost calcitic limestones will contain 38% or more calcium and less magnesium than shown.dIron in defluorinated phosphate is about 65% as available as the iron in ferrous sulfate.

140 Nutrient Requirements of Swine
Table 11-9 Inorganic Sources and Estimated Bioavailabilities of Trace Mineralsa
Mineral RelativeChemical Content Bioavailability
Mineral Element and Sourceb Formula (%) (%)
CopperCupric sulfate (pentahydrate) CuSO4•5H2O 25.2 100Cupric chloride, tribasic Cu2(OH)3Cl 58.0 100Cupric oxide CuO 75.0 0 to 10Cupric carbonate (monohydrate) CuCO3•Cu(OH)2•H2O 50 to 55 60 to 100Cupric sulfate (anhydrous) CuSO4 39.9 100
IronFerrous sulfate (monohydrate) FeSO4•H2O 30.0 100Ferrous sulfate (heptahydrate) FeSO4•7H2O 20.0 100Ferrous carbonate FeCO3 38.0 15 to 80Ferric oxide Fe2O3 69.9 0Ferric chloride (hexahydrate) FeCl3•6H2O 20.7 40 to 100Ferrous oxide FeO 77.8 —c
IodineEthylenediamine dihydroiodide (EDDI) C2H8N22HI 79.5 100Calcium iodate Ca(IO3)2 63.5 100Potassium iodide KI 68.8 100Potassium iodate KIO3 59.3 —c
Cupric iodide CuI 66.6 100
ManganeseManganous sulfate (monohydrate) MnSO4•H2O 29.5 100Manganous oxide MnO 60.0 70Manganous dioxide MnO2 63.1 35 to 95Manganous carbonate MnCO3 46.4 30 to 100Manganous chloride (tetrahydrate) MnCl2•4H2O 27.5 100
SeleniumSodium selenite Na2SeO3 45.0 100Sodium selenate (decahydrate) Na2SeO4•10H2O 21.4 100
ZincZinc sulfate (monohydrate) ZnSO4•H2O 35.5 100Zinc oxide ZnO 72.0 50 to 80Zinc sulfate (heptahydrate) ZnSO4•7H2O 22.3 100Zinc carbonate Zn•CO3 56.0 100Zinc chloride ZnCl2 48.0 100aThe mineral source listed first under each mineral element was generally the standard with which the other sources were compared to
establish relative bioavailability.bLess commonly used sources in italic.c—indicates no data available.

Composition of Feed Ingredients 141
Table 11-10 Characteristics and Energy Values of Various Sources of Fats and Oils (data on as-fed basis)a,b
Inter- Selected Fatty Acids (% of Total Fatty Acids) Energy Content (kcal/kg)nationalFeed Total Total U:Sd Iodine Total Total
Type of Lipid Numberc #C10 C12:0 C14:0 C16:0 C16:1 C18:0 C18:1 C18:2 C18:3 $20 sat. unsat. ratio value SN-6 SN-3 DEd MEe NEf
Animal FatsBeef Tallow 4-08-127 0.0 0.9 2.7 24.9 4.2 18.9 36.0 3.1 0.6 0.3 52.1 47.9 0.92 44 3.1 0.6 8,000 7,680 4,925Choice White Grease — 0.2 0.2 1.9 21.5 5.7 14.9 41.1 11.6 0.4 1.8 40.8 59.2 1.45 60 11.6 0.4 8,290 7,955 5,095Lard 4-04-790 0.1 0.2 1.3 23.8 2.7 13.5 41.2 10.2 1.0 1.0 41.1 58.9 1.44 64 10.2 1.0 8,285 7,950 5,100Poultry Fat 4-09-319 0.0 0.1 0.9 21.6 5.7 6.0 37.3 19.5 1.0 1.2 31.2 68.8 2.20 78 19.5 1.0 8,520 8,180 5,230Restaurant Grease — — — 1.9 16.2 2.5 10.5 47.5 17.5 1.9 1.0 29.9 70.1 2.34 75 17.5 1.9 8,550 8,205 5,245
Fish OilsAnchovy — — — 7.4 17.4 10.5 4.0 11.6 1.2 0.8 30.3 34.6 65.4 1.89 — 1.3 31.2 8,445 8,105 5,185Herring 7-08-048 — 0.2 7.1 11.7 9.6 0.8 11.9 1.1 0.8 45.6 22.8 77.2 3.39 — 1.4 17.8 8,680 8,330 5,320Menhaden 7-08-049 — — 8.0 15.1 10.5 3.8 14.5 2.1 1.5 29.5 33.3 66.7 2.00 — 1.5 25.1 8,475 8,135 5,200
Vegetable OilsCanola (Rapeseed) 4-06-144 0.0 0.0 0.0 4.0 0.2 1.8 56.1 20.3 9.3 3.6 7.4 92.6 12.46 118 20.3 9.3 8,760 8,410 5,365Coconut 4-09-320 14.1 44.6 16.8 8.2 0.0 2.8 5.8 1.8 0.0 — 91.9 8.1 0.09 10 1.8 0.0 8,405g 8,070 5,160Corn 4-07-882 0.0 0.0 0.0 10.9 0.0 1.8 24.2 59.0 0.7 — 13.3 86.7 6.53 125 58.0 0.7 8,755 8,405 5,360Cottonseed 4-20-836 0.0 0.0 0.8 22.7 0.8 2.3 17.0 51.5 0.2 0.1 27.1 72.9 2.69 105 51.5 0.2 8,605 8,260 5,275Olive — 0.0 0.0 0.0 11.0 0.8 2.2 72.5 7.9 0.6 0.3 14.1 85.9 6.08 86 7.9 0.6 8,750 8,400 5,360Palm — 0.0 0.1 1.0 43.5 0.3 4.3 36.6 9.1 0.2 0.1 51.6 48.4 0.94 50 9.1 0.2 8,010 7,690 4,935Peanut 4-03-658 0.0 0.0 0.1 9.5 0.1 2.2 44.8 32.0 — 6.4 17.8 82.2 4.63 92 32.0 0.0 8,735 8,385 5,350Safflower 4-20-526 0.0 0.0 0.1 6.2 0.4 2.3 11.7 74.1 0.4 — 9.5 90.5 9.52 140 74.1 0.4 8,760 8,410 5,365Sesame — 0.0 0.0 0.0 8.9 0.2 4.8 39.3 41.3 0.3 0.2 14.8 85.2 5.73 110 41.3 0.3 8,750 8,400 5,360Soybean 4-07-983 0.0 0.0 0.1 10.3 0.2 3.8 22.8 51.0 6.8 0.2 15.1 84.9 5.64 130 51.0 6.8 8,750 8,400 5,360Sunflower 4-20-833 0.0 0.0 0.0 5.4 0.2 3.5 45.3 39.8 0.2 — 10.6 89.4 8.47 133 39.8 0.2 8,760 8,410 5,365
aDash indicates that no data were available.bThe fatty acid data were obtained from Pearl (1995) of the Fats and Protein Research Foundation and USDA Food Composition Standard Release 11 (1997). Values for
fatty acid content do not always total 100% but represent means as obtained from various fat analysis conducted by gas-liquid chromatography.cFirst digit is class of feed: 1, dry forages and roughages; 2, pasture, range plants, and forages fed green; 3, silages; 4, energy feeds; 5, protein supplements; 6, minerals;
7, vitamins; 8, additives; the other five digits are the International Feed Number.dCalculated by the following relationship (Powles et al. 1995): DE(kcal/kg) 4 (36.898 1 (0.005 2 FFA) 1 (7.330 2 e10.9062U:S))/4.184 where FFA is the free fatty acid
content in g/kg and U:S is the ratio of unsaturated to saturated fatty acids. In calculating the DE, the free fatty acid concentrations of all fats were assumed to be 50 g/kg(or 5%).
eCalculated as 96% of DE.fCalculated by Equation 1-12 in Chapter 1.gCoconut oil was considered outside the range of the data used to develop the relationship in footnote d. The DE concentration of coconut oil was calculated from the
digestibility (89.42% of GE) reported by Cera et. al (1989) for pigs from 2 to 4 weeks after weaning at 3 weeks of age.
TABLE 11-11 Chemical Composition of Some Purified Feed Ingredients Commonly Used for Swine Research (dataon as-fed basis)a
Interna- Dry Crude Lino-Entry tional Mat- DE ME NE Pro- Crude leic Cal- Phos-Num- Feed ter (kcal/ (kcal/ (kcal/ tein Fat Acid cium phorusber Description Numberb (%) kg) kg) kg) (%) (%) (%) (%) (%) Lysinec
01 Casein 5-01-162 91 4,135 3,535 2,555 88.7 0.80 0.03 0.63 1.01 7.3502 Corn starch 4-02-889 99 4,000 3,985 2,505 0.3 0.22 — 0.00 0.03 —03 Glucose monohydrate 4-02-125 90 3,360 3,260 1,940 0.3 — — — — —04 Lactose 4-07-881 96 3,525 3,435 2,370d 0.3 — — — — —05 Gelatin 5-14-503 90 2,800 2,140 1,570d 88.6 0.50 — 0.49 — 3.6206 Sucrose 4-04-701 99 3,795 3,635 2,730 0.0 0.00 — 0.04 0.01 —
aDash indicates that no data were available.bFirst digit is class of feed: 1, dry forages and roughages; 2, pasture, range plants, and forages fed green; 3, silages; 4, energy feeds; 5, protein supplements; 6, minerals;
7, vitamins; 8, additives; the other five digits are the International Feed Number.cAmino acid composition of casein is shown in Table 11-4. Other amino acids in gelatin: arginine, 6.60%; histidine, 0.66%; isoleucine, 1.42%; leucine, 2.91%; methionine,
0.76%; cystine, 0.12%; phenylalanine, 1.74%; tyrosine, 0.43%; threonine, 1.82%; tryptophan, 0.05%; and valine, 2.26%.dCalculated by Equation 1-12 in Chapter 1.
142 Nutrient Requirements of Swine
R EF ER E NC ES
Ammerman, C. B., D. H. Baker, and A. J. Lewis. 1995. Bioavailability ofNutrients for Animals. Amino Acids, Minerals and Vitamins. AcademicPress, NY. 441 pp.
Archer Daniels Midland Company. 1995. ADM Bioproducts Amino AcidDatabase. Archer Daniels Midland Company, Decatur, IL.
Axe, D. E. 1994. Macrominerals. IMC-Agric Feed Ingredients, Bannock-burn, IL. 50 pp.
Bernhardt, M. D. 1996. What you need to know about feed grade minerals.Pp. 61–70 in 16th Annual Feed Ingredient Conference. Prince Agric.Products Inc., Quincy, Illinois.
Centraal Veevoederbureau. 1994. Veevoedertabel. CVB Lelystad, TheNetherlands.
Cera, K. R., D. C. Mahan, and G. A. Reinhart. 1989. Apparent fatdigestibilities and performance responses of postweaning swine feddiets supplemented with coconut oil, corn oil or tallow. J. Anim. Sci.67:2040–2047.
Cort, W. M., T. S. Vicente, E. H. Waysek, and B. D. Williams. 1983.Vitamin E content of feedstuffs determined by high-performance liquidchromatographic fluorescence. J. Agric. Food Chem: 31: 1330–1333.
Cromwell, G. L. 1992. The biological availability of phosphorus in feed-stuffs for pigs. Pig News Inform. 13: 75N–78N.
Dale, N. 1995. Feedstuffs Ingredient Analysis Table—1995. Miller Pub-lishing Co., Minnetonka, MN.
Ewan, R. C. 1996. Energy Values of Feed Ingredients. 5th RevisedEdition. Iowa State University, Ames, IA. 101 pp.
Fickler, J., J. Fontaine, and W. Heimbeck. 1995. The Amino Acid Compo-sition of Feedstuffs, Degussa Corporation, Ridgefield Park, NJ.
Fonnesbeck, P. V., H. Lloyd, R. Obray, and S. Romesburg. 1984. IFITables of Feed Composition. International Feedstuffs Institute, UtahAgric. Exper. Stat., Utah State University, Logan, UT. 607 pp.
Frigg, M. 1984. Available biotin content of various feed ingredients. Poult.Sci. 63: 750–753.
Frigg, M., and L. Volker. 1994. Biotin inclusion helps optimize animalperformance. Feedstuffs (January 3) 12–13.
Heartland Lysine. 1995. Apparent Ileal Digestibility of Crude Proteinand Essential Amino Acids in Feedstuffs for Swine-1995. HeartlandLysine, Chicago. IL.
Institut National de la Recherche Agronomique. 1984. L’alimentationdes animaux monogastriques: Porcs, Lapins, Volailles. Institut Nationalde la Recherche Agronomique, Paris, France.
Jondreville, C., J. Van den Broecke, F. Gatel, and S. Van Cauwenberghe.1995. Ileal Digestibility of Amino Acids in Feedstuffs for Pigs. Eurolys-ine and ITCF Technical Institute for Cereals and Forages, Paris,France. 55 pp.
Jongbloed, A. W. 1987. Phosphorus in the Feeding of Pigs: Effect ofDiet on the Absorption and Retention of Phosphorus by Growing Pigs.Instituut voor Veevoedingsonderzoek, Lelystad, The Netherlands.343 pp.
Knabe, D. A. 1995. Survey of the content and digestibility of protein andamino acids in animal protein coproducts. Pp. 15–37 in North CarolinaSwine Nutrition Conference. Raleigh: North Carolina State University.
Ministry of Agriculture Fisheries and Food Standing Committee onTables of Feed Composition. 1990. UK Tables of Nutritive Value and
Chemical Composition of Feedstuffs. Rowett Research Services LTD,Bucksburn, Aberdeen. 420 pp.
National Research Council. 1982. United States–Canadian Tables of FeedComposition: Nutritional Data for United States and Canadian Feeds.3rd ed. Washington, DC: National Academy Press. 772 pp.
National Research Council. 1993. Nutrient Requirements of Poultry. 9thed. Washington, DC: National Academy Press. 155 pp.
Nelson, J. 1995. Trace mineral sources, quality, and biological availability.AFIA Feed Ingredient Institute, American Feed Industry Assoc., June24–25th, Chicago, IL.
Noblet, J., and Y. Henry. 1991. Energy evaluation systems for pig diets.Pp. 87–110 in E. S. Batterham, ed. Manipulating Pig Production III.Proc. 3rd Biennial Conference of the Australasian Pig Science Associa-tion, Albury, Australia.
Noblet, J., H. Fortune, C. Dupire, and S. Dubois. 1993. Digestible,metabolizable and net energy values of 13 feedstuffs for growing pigs:effect of energy system. Anim. Feed Sci. Technol. 42: 131–149.
Noblet, J., H. Fortune, X. S. Shi, and S. Dubois. 1994. Prediction of netenergy value of feeds for growing pigs. J. Anim. Sci. 72: 344–354.
North Central Region Committee on Swine Nutrition (NCR-42). 1992.Variability among sources and laboratories in chemical analysis of cornand soybean meal. J. Anim. Sci. 70(Suppl. 1):70 (Abstr.).
North Central Region Committee on Swine Nutrition (NCR-42). 1993.Variability among sources and laboratories in selenium analysis of cornand soybean meal. J. Anim. Sci. 71(Suppl. 1):67 (Abstr.).
North Central Region Committee on Swine Nutrition (NCR-42). 1995.Variability among sources and laboratories in analyses of corn andwheat middlings. J. Anim. Sci. 73(Suppl. 1):79 (Abstr.).
Novus. 1994. Raw Material Compendium: A Compilation of WorldwideData Sources. Novus International Inc., Brussels, Belgium. 541 pp.
Pearl, G. G. 1995. Feeding Fats. Fats and Proteins Research FoundationPublication No. 269. Bloomington, IL: Fats and Proteins ResearchFoundation. 23 pp.
Powles, J., J. Wiseman, D. J. A. Cole, and S. Jagger. 1995. Prediction ofthe apparent digestible energy value of fats given to pigs. Anim. Sci.61: 149–154.
Rhoˆne-Poulenc. 1993a. Rhodimet Nutrition Guide: Feed Ingredients
Formulation in Digestible Amino Acids, 2nd Edition. Rhoˆne-Poulenc
Animal Nutrition, Antony Cedex, France. 55 pp.Rho
ˆne-Poulenc. 1993b. Rhodimet Nutrition Guide, 6th Edition. Rho
ˆne-
Poulenc Animal Nutrition, Antony Cedex, France. 39 pp.Roche. 1986. Biotin News No 5: Update on total and available biotin in
feed ingredients. Roche Animal Nutrition and Health, Basel, Switzer-land. 10 pp.
Roche. 1987a. Beta-Carotene News: Beta-Carotene in Feedstuffs. RocheAnimal Nutrition and Health, Basel, Switzerland. 18 pp.
Roche. 1987b. Vitamin E News: Alpha-Tocopherol in Feedstuffs. RocheAnimal Nutrition and Health, Basel, Switzerland. 42 pp.
Roche. 1992. Folic Acid Content of Feedstuffs. Roche Animal Nutritionand Health, Basel, Switzerland. 9 pp.
Southern, L. L. 1991. Digestible amino acids and digestible amino acidrequirements for swine. BioKyowa Technical Review No. 2. 16 pp.
U.S. Department of Agriculture, Agricultural Research Service. 1997.USDA Nutrient Database for Standard Reference, Release 11-1. Nutri-ent Data Laboratory Homepage, http://www.nal.usda.gov/fnic/foodcomp.
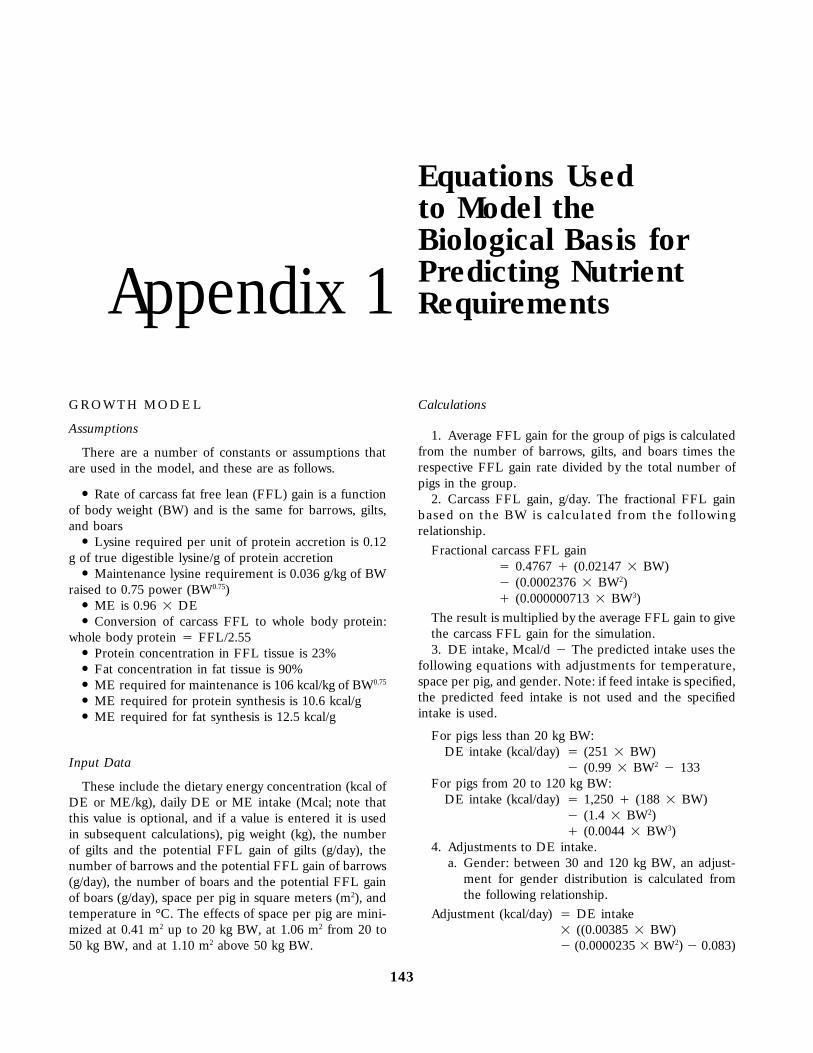
Equations Usedto Model theBiological Basis forPredicting NutrientAppendix 1 Requirements
G RO WT H MO DE L
Assumptions
There are a number of constants or assumptions thatare used in the model, and these are as follows.
● Rate of carcass fat free lean (FFL) gain is a functionof body weight (BW) and is the same for barrows, gilts,and boars
● Lysine required per unit of protein accretion is 0.12g of true digestible lysine/g of protein accretion
● Maintenance lysine requirement is 0.036 g/kg of BWraised to 0.75 power (BW0.75)
● ME is 0.96 2 DE● Conversion of carcass FFL to whole body protein:
whole body protein 4 FFL/2.55● Protein concentration in FFL tissue is 23%● Fat concentration in fat tissue is 90%● ME required for maintenance is 106 kcal/kg of BW0.75
● ME required for protein synthesis is 10.6 kcal/g● ME required for fat synthesis is 12.5 kcal/g
Input Data
These include the dietary energy concentration (kcal ofDE or ME/kg), daily DE or ME intake (Mcal; note thatthis value is optional, and if a value is entered it is usedin subsequent calculations), pig weight (kg), the numberof gilts and the potential FFL gain of gilts (g/day), thenumber of barrows and the potential FFL gain of barrows(g/day), the number of boars and the potential FFL gainof boars (g/day), space per pig in square meters (m2), andtemperature in °C. The effects of space per pig are mini-mized at 0.41 m2 up to 20 kg BW, at 1.06 m2 from 20 to50 kg BW, and at 1.10 m2 above 50 kg BW.
143
Calculations
1. Average FFL gain for the group of pigs is calculatedfrom the number of barrows, gilts, and boars times therespective FFL gain rate divided by the total number ofpigs in the group.
2. Carcass FFL gain, g/day. The fractional FFL gainbased on the BW is calculated from the followingrelationship.
Fractional carcass FFL gain4 0.4767 ` (0.02147 2 BW)1 (0.0002376 2 BW2)` (0.000000713 2 BW3)
The result is multiplied by the average FFL gain to givethe carcass FFL gain for the simulation.3. DE intake, Mcal/d 1 The predicted intake uses the
following equations with adjustments for temperature,space per pig, and gender. Note: if feed intake is specified,the predicted feed intake is not used and the specifiedintake is used.
For pigs less than 20 kg BW:DE intake (kcal/day) 4 (251 2 BW)
1 (0.99 2 BW2 1 133For pigs from 20 to 120 kg BW:
DE intake (kcal/day) 4 1,250 ` (188 2 BW)1 (1.4 2 BW2)` (0.0044 2 BW3)
4. Adjustments to DE intake.a. Gender: between 30 and 120 kg BW, an adjust-
ment for gender distribution is calculated fromthe following relationship.
Adjustment (kcal/day) 4 DE intake2 ((0.00385 2 BW)1 (0.0000235 2 BW2) 1 0.083)
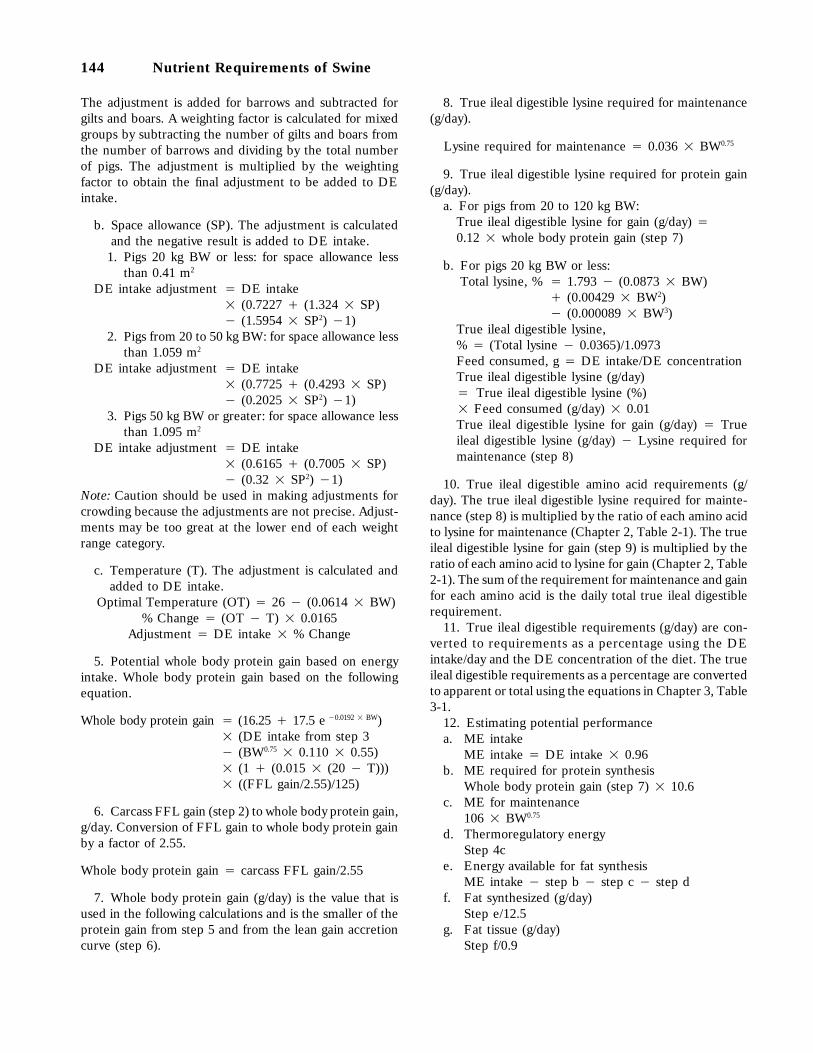
144 Nutrient Requirements of Swine
The adjustment is added for barrows and subtracted forgilts and boars. A weighting factor is calculated for mixedgroups by subtracting the number of gilts and boars fromthe number of barrows and dividing by the total numberof pigs. The adjustment is multiplied by the weightingfactor to obtain the final adjustment to be added to DEintake.
b. Space allowance (SP). The adjustment is calculatedand the negative result is added to DE intake.
1. Pigs 20 kg BW or less: for space allowance lessthan 0.41 m2
DE intake adjustment 4 DE intake2 (0.7227 ` (1.324 2 SP)1 (1.5954 2 SP2) 11)
2. Pigs from 20 to 50 kg BW: for space allowance lessthan 1.059 m2
DE intake adjustment 4 DE intake2 (0.7725 ` (0.4293 2 SP)1 (0.2025 2 SP2) 11)
3. Pigs 50 kg BW or greater: for space allowance lessthan 1.095 m2
DE intake adjustment 4 DE intake2 (0.6165 ` (0.7005 2 SP)1 (0.32 2 SP2) 11)
Note: Caution should be used in making adjustments forcrowding because the adjustments are not precise. Adjust-ments may be too great at the lower end of each weightrange category.
c. Temperature (T). The adjustment is calculated andadded to DE intake.
Optimal Temperature (OT) 4 26 1 (0.0614 2 BW)% Change 4 (OT 1 T) 2 0.0165
Adjustment 4 DE intake 2 % Change
5. Potential whole body protein gain based on energyintake. Whole body protein gain based on the followingequation.
Whole body protein gain 4 (16.25 ` 17.5 e 10.0192 2 BW)2 (DE intake from step 31 (BW0.75 2 0.110 2 0.55)2 (1 ` (0.015 2 (20 1 T)))2 ((FFL gain/2.55)/125)
6. Carcass FFL gain (step 2) to whole body protein gain,g/day. Conversion of FFL gain to whole body protein gainby a factor of 2.55.
Whole body protein gain 4 carcass FFL gain/2.55
7. Whole body protein gain (g/day) is the value that isused in the following calculations and is the smaller of theprotein gain from step 5 and from the lean gain accretioncurve (step 6).
8. True ileal digestible lysine required for maintenance(g/day).
Lysine required for maintenance 4 0.036 2 BW0.75
9. True ileal digestible lysine required for protein gain(g/day).
a. For pigs from 20 to 120 kg BW:True ileal digestible lysine for gain (g/day) 40.12 2 whole body protein gain (step 7)
b. For pigs 20 kg BW or less:Total lysine, % 4 1.793 1 (0.0873 2 BW)
` (0.00429 2 BW2)1 (0.000089 2 BW3)
True ileal digestible lysine,% 4 (Total lysine 1 0.0365)/1.0973Feed consumed, g 4 DE intake/DE concentrationTrue ileal digestible lysine (g/day)4 True ileal digestible lysine (%)2 Feed consumed (g/day) 2 0.01True ileal digestible lysine for gain (g/day) 4 Trueileal digestible lysine (g/day) 1 Lysine required formaintenance (step 8)
10. True ileal digestible amino acid requirements (g/day). The true ileal digestible lysine required for mainte-nance (step 8) is multiplied by the ratio of each amino acidto lysine for maintenance (Chapter 2, Table 2-1). The trueileal digestible lysine for gain (step 9) is multiplied by theratio of each amino acid to lysine for gain (Chapter 2, Table2-1). The sum of the requirement for maintenance and gainfor each amino acid is the daily total true ileal digestiblerequirement.
11. True ileal digestible requirements (g/day) are con-verted to requirements as a percentage using the DEintake/day and the DE concentration of the diet. The trueileal digestible requirements as a percentage are convertedto apparent or total using the equations in Chapter 3, Table3-1.
12. Estimating potential performancea. ME intake
ME intake 4 DE intake 2 0.96b. ME required for protein synthesis
Whole body protein gain (step 7) 2 10.6c. ME for maintenance
106 2 BW0.75
d. Thermoregulatory energyStep 4c
e. Energy available for fat synthesisME intake 1 step b 1 step c 1 step d
f. Fat synthesized (g/day)Step e/12.5
g. Fat tissue (g/day)Step f/0.9

Appendix 1: Model Equations for Predicting Requirements 145
h. Protein tissue (g/day)Whole body protein gain/0.23
i. Daily BW gain (g/day)(step g ` step h)/0.94
j. Feed-to-gain ratioDaily feed intake/Daily BW gain
k. Crude protein (corn–soybean meal diet)Crude protein (%) 4 5.22 ` (15.51 2 True digest-ible lysine, %)
G ES TA T IO N M O DE L
Assumptions
A number of constants or assumptions have been madeand are as follows.
● Gestation length is 115 days● Gestation weight gain in the products of conception
is 2.28 kg/pig (19.8 g/day for each pig)● Protein gain in the products of conception is 245 g/
pig (2.13 g/day for each pig)● Nitrogen gain in the products of conception is 39.2
g/pig (0.34 g/day for each pig)● Body weight (BW) is the weight at breeding plus one-
half of the total gestation weight gain● Metabolic body weight is BW0.75
● ME required for maintenance is 106 kcal/kg of BW0.75
● ME required for protein synthesis is 10.6 kcal/g● ME required for fat synthesis is 12.5 kcal/g● ME required for daily gain of the products of concep-
tion is 35.8 kcal/pig● Lean tissue contains 23% protein● Fat tissue contains 90% fat● True ileal digestible lysine requirement for mainte-
nance is 0.036 g/kg of BW0.75
Input Data
These include the DE or ME concentration (kcal/kg),daily DE or ME intake (optional) (kcal/day), sow weightat breeding (kg), the expected number of pigs born, thedesired weight gain during gestation (kg) and tempera-ture (°C).
Note: Daily energy intake is an optional input. If dailyenergy intake is not provided, the energy required for thedesired weight gain is calculated. If a value is entered fordaily energy intake, weight gain is calculated using theinput energy intake and then the amino acid requirementsare calculated to support that level of performance.
Calculations
1. Maternal weight gaina. If DE or ME intake is not input, then:
Maternal weight gain 4 Gestation weight gain 1(2.28 2 No. of pigs)Maternal fat gain 4 (Maternal weight gain 2 0.638)1 9.08Maternal lean tissue gain 4 Maternal weight gain 1Maternal fat gain
b. If daily DE or ME intake is input then:ME in the products of conception 4 No. of pigs 235.8 kcal/pigMaintenance ME requirement 4 106 2 BW0.75
ME for maternal weight gain 4 ME intake 1 MEin the products of conception 1 maintenance MEMaternal weight gain 4 87 ` (ME for maternalweight gain 1 0.12171)Daily gestation weight gain 4 (Maternal weight gain)` (No. of pigs 2 19.8 g)Gestation weight gain 4 Daily gestation weight gain2 115
Because the maintenance requirement is dependent ongestation weight gain, these relationships are solved byiteration. Gestation weight gain is then partitioned intoprotein and fat gain by the same relationships as are usedwhen daily DE intake is not provided.
2. Average daily nitrogen retention is the sum of mater-nal nitrogen retention and nitrogen in the products ofconception.
a. Maternal nitrogen retentionN retention (g/day) 4 ((Maternal lean tissue)/115)
2 0.23 2 0.16b. Nitrogen in the products of conception
N retention (g/day) 4 No. of pigs 2 0.34 g/day
3. True ileal digestible lysine requirement for gain iscalculated from N retention.
True ileal digestible lysine (g/day) 4 (Total N retention2 0.807)
4. True ileal digestible lysine requirement formaintenance.
True ileal digestible lysine (g/day) 4 0.036 2 BW0.75
5. Total true ileal digestible lysine requirement is thesum of the requirement for gain and maintenance.
6. True ileal digestible amino acid requirement (g/day).The true ileal digestible lysine required for maintenance(step 4) is multiplied by the ratio of each amino acid tolysine for maintenance (see Chapter 2, Table 2-1). Thetrue ileal digestible lysine required for gain (step 3) ismultiplied by the ratio of each amino acid to lysine forprotein accretion (Chapter 2, Table 2-1). The total require-
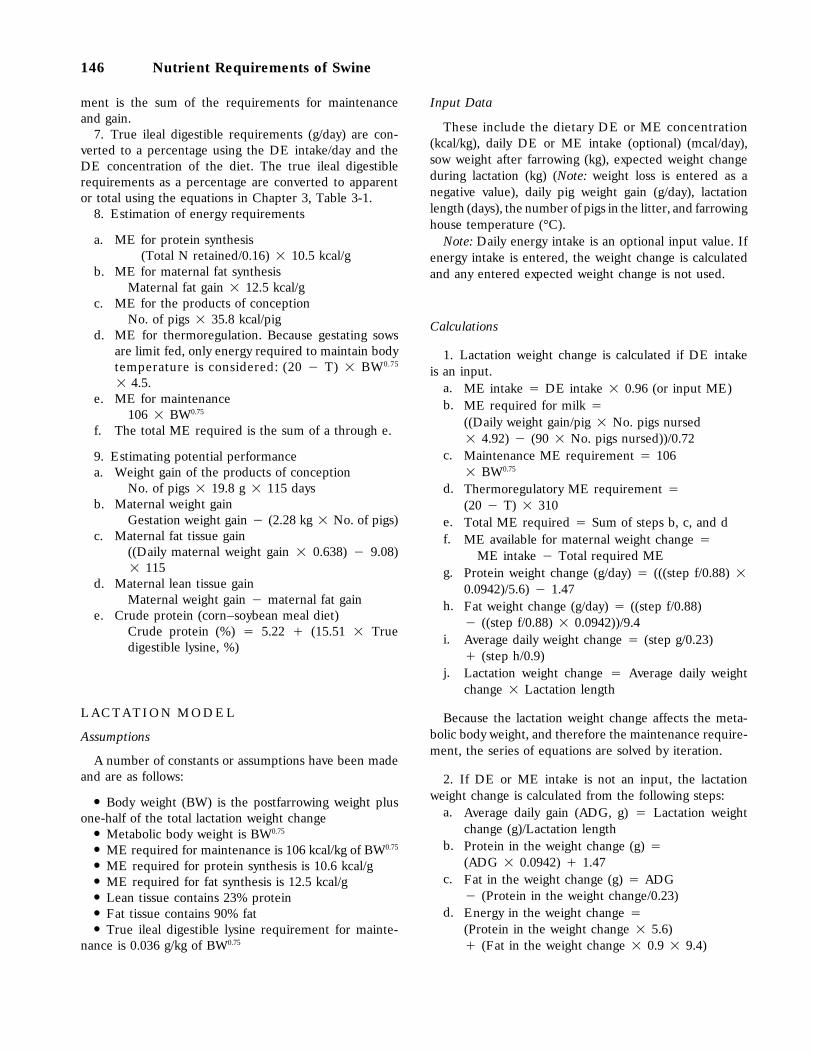
146 Nutrient Requirements of Swine
ment is the sum of the requirements for maintenanceand gain.
7. True ileal digestible requirements (g/day) are con-verted to a percentage using the DE intake/day and theDE concentration of the diet. The true ileal digestiblerequirements as a percentage are converted to apparentor total using the equations in Chapter 3, Table 3-1.
8. Estimation of energy requirements
a. ME for protein synthesis(Total N retained/0.16) 2 10.5 kcal/g
b. ME for maternal fat synthesisMaternal fat gain 2 12.5 kcal/g
c. ME for the products of conceptionNo. of pigs 2 35.8 kcal/pig
d. ME for thermoregulation. Because gestating sowsare limit fed, only energy required to maintain bodytemperature is considered: (20 1 T) 2 BW0.75
2 4.5.e. ME for maintenance
106 2 BW0.75
f. The total ME required is the sum of a through e.
9. Estimating potential performancea. Weight gain of the products of conception
No. of pigs 2 19.8 g 2 115 daysb. Maternal weight gain
Gestation weight gain 1 (2.28 kg 2 No. of pigs)c. Maternal fat tissue gain
((Daily maternal weight gain 2 0.638) 1 9.08)2 115
d. Maternal lean tissue gainMaternal weight gain 1 maternal fat gain
e. Crude protein (corn–soybean meal diet)Crude protein (%) 4 5.22 ` (15.51 2 Truedigestible lysine, %)
L AC TA T IO N M O DE L
Assumptions
A number of constants or assumptions have been madeand are as follows:
● Body weight (BW) is the postfarrowing weight plusone-half of the total lactation weight change
● Metabolic body weight is BW0.75
● ME required for maintenance is 106 kcal/kg of BW0.75
● ME required for protein synthesis is 10.6 kcal/g● ME required for fat synthesis is 12.5 kcal/g● Lean tissue contains 23% protein● Fat tissue contains 90% fat● True ileal digestible lysine requirement for mainte-
nance is 0.036 g/kg of BW0.75
Input Data
These include the dietary DE or ME concentration(kcal/kg), daily DE or ME intake (optional) (mcal/day),sow weight after farrowing (kg), expected weight changeduring lactation (kg) (Note: weight loss is entered as anegative value), daily pig weight gain (g/day), lactationlength (days), the number of pigs in the litter, and farrowinghouse temperature (°C).
Note: Daily energy intake is an optional input value. Ifenergy intake is entered, the weight change is calculatedand any entered expected weight change is not used.
Calculations
1. Lactation weight change is calculated if DE intakeis an input.
a. ME intake 4 DE intake 2 0.96 (or input ME)b. ME required for milk 4
((Daily weight gain/pig 2 No. pigs nursed2 4.92) 1 (90 2 No. pigs nursed))/0.72
c. Maintenance ME requirement 4 1062 BW0.75
d. Thermoregulatory ME requirement 4(20 1 T) 2 310
e. Total ME required 4 Sum of steps b, c, and df. ME available for maternal weight change 4
ME intake 1 Total required MEg. Protein weight change (g/day) 4 (((step f/0.88) 2
0.0942)/5.6) 1 1.47h. Fat weight change (g/day) 4 ((step f/0.88)
1 ((step f/0.88) 2 0.0942))/9.4i. Average daily weight change 4 (step g/0.23)
` (step h/0.9)j. Lactation weight change 4 Average daily weight
change 2 Lactation length
Because the lactation weight change affects the meta-bolic body weight, and therefore the maintenance require-ment, the series of equations are solved by iteration.
2. If DE or ME intake is not an input, the lactationweight change is calculated from the following steps:
a. Average daily gain (ADG, g) 4 Lactation weightchange (g)/Lactation length
b. Protein in the weight change (g) 4(ADG 2 0.0942) ` 1.47
c. Fat in the weight change (g) 4 ADG1 (Protein in the weight change/0.23)
d. Energy in the weight change 4(Protein in the weight change 2 5.6)` (Fat in the weight change 2 0.9 2 9.4)

Appendix 1: Model Equations for Predicting Requirements 147
3. Lysine requireda. Apparent digestible lysine for milk production (g) 4
(Daily pig weight gain 2 Pigs in litter2 0.022) 1 6.39
b. Apparent digestible lysine for milk production (g/day) is converted to a percentage using
DE intake and DE concentrationc. Percentage apparent digestible lysine is converted
to percentage true digestible lysineTrue digestible lysine, % 4 1.0500132 apparent digestible lysine, % ` 0.022052
d. Percentage true digestible lysine is converted to g/day using DE intake and DE concentration
e. Lysine for maintenance 4 0.036 2 BW0.75
f. Lysine from tissue 4 Change in protein 2 0.065g. Total true ileal digestible lysine requirement 4 Sum
of steps d, e, and f
4. True digestible amino acid requirements (g/day). Thetrue ileal digestible lysine required for maintenance (step3e) is multiplied by the ratio of each amino acid to lysinefor maintenance (see Chapter 2, Table 2-1). The true ilealdigestible lysine required for milk production (step 3d) ismultiplied by the ratio of each amino acid to lysine in milkprotein (Chapter 2, Table 2-1). The lysine from tissue ismultiplied by the ratio of each amino acid to lysine in tissue(Chapter 2, Table 2-1). The total requirement is the sumof the requirements for maintenance, milk production, andtissue change.
5. True ileal digestible requirements (g/day) are con-verted to a percentage using the DE intake/day and the
DE concentration of the diet. The true ileal digestiblerequirements as a percentage are converted to apparentor total using the equations in Chapter 3, Table 3-1.
6. Estimation of energy partitioninga. ME for milk production 4
((Daily pig weight gain 2 No. of pigs nursed2 4.92) 1 (90 2 No. of pigs nursed))/0.72
b. Maintenance ME requirement 4 106 2 BW0.75
c. ME in body weight change 4 Daily ME change2 0.88
d. Temperature adjustment: 20°C is considered theoptimal temperature. Above the optimal tempera-ture, ME intake is reduced 310 kcal/°C. Below theoptimal temperature, ME intake is increased 310kcal/°C
e. Total ME required 4 Sum of steps a, b, c, and df. DE intake 4 ME required/0.96
7. Estimating potential performancea. Maternal lean tissue change
(Daily protein weight change (from step 1g or 2b)/0.23 2 Lactation length
b. Maternal fat tissue change(Daily weight change 2 Lactation length)1 Maternal lean tissue change
c. Estimated milk production (kg/day)(ME for milk production [step 6a] 20.72)/1208
d. Crude protein (corn–soybean meal diet)Crude protein (%) 4 5.22 ` (15.51 2 Truedigestible lysine, %)
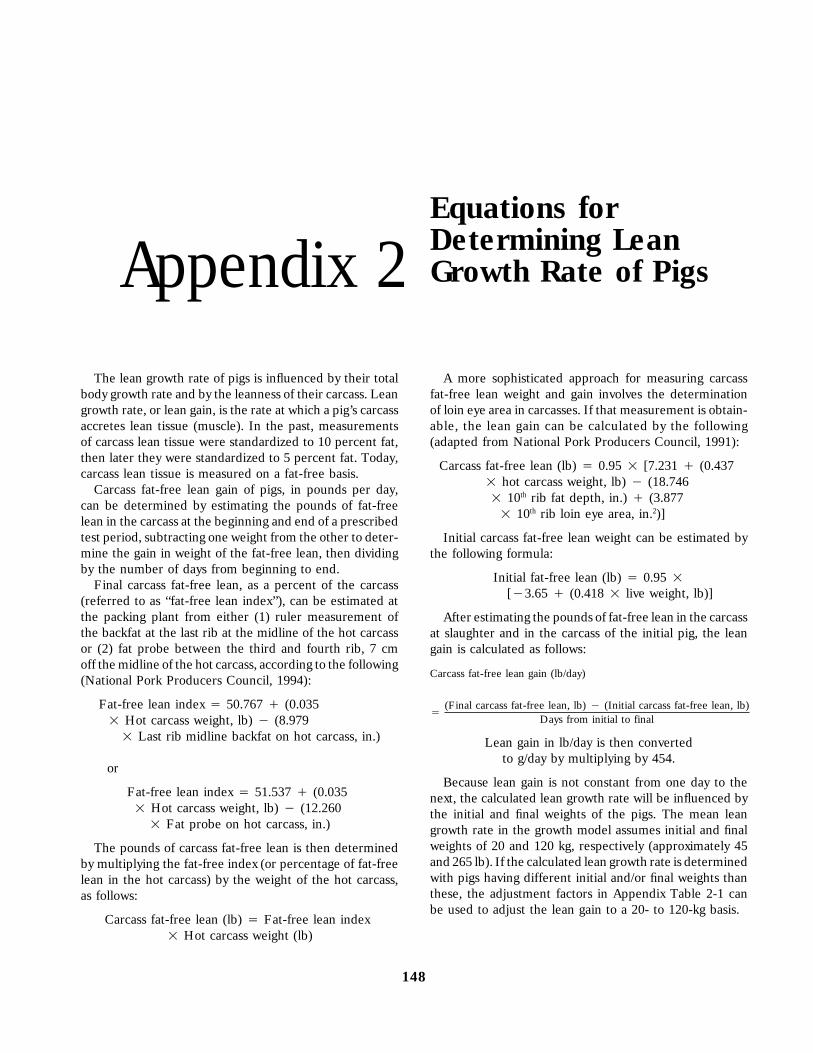
Equations forDetermining LeanGrowth Rate of PigsAppendix 2
The lean growth rate of pigs is influenced by their totalbody growth rate and by the leanness of their carcass. Leangrowth rate, or lean gain, is the rate at which a pig’s carcassaccretes lean tissue (muscle). In the past, measurementsof carcass lean tissue were standardized to 10 percent fat,then later they were standardized to 5 percent fat. Today,carcass lean tissue is measured on a fat-free basis.
Carcass fat-free lean gain of pigs, in pounds per day,can be determined by estimating the pounds of fat-freelean in the carcass at the beginning and end of a prescribedtest period, subtracting one weight from the other to deter-mine the gain in weight of the fat-free lean, then dividingby the number of days from beginning to end.
Final carcass fat-free lean, as a percent of the carcass(referred to as ‘‘fat-free lean index’’), can be estimated atthe packing plant from either (1) ruler measurement ofthe backfat at the last rib at the midline of the hot carcassor (2) fat probe between the third and fourth rib, 7 cmoff the midline of the hot carcass, according to the following(National Pork Producers Council, 1994):
Fat-free lean index 4 50.767 ` (0.0352 Hot carcass weight, lb) 1 (8.979
2 Last rib midline backfat on hot carcass, in.)
or
Fat-free lean index 4 51.537 ` (0.0352 Hot carcass weight, lb) 1 (12.260
2 Fat probe on hot carcass, in.)
The pounds of carcass fat-free lean is then determinedby multiplying the fat-free index (or percentage of fat-freelean in the hot carcass) by the weight of the hot carcass,as follows:
Carcass fat-free lean (lb) 4 Fat-free lean index2 Hot carcass weight (lb)
148
A more sophisticated approach for measuring carcassfat-free lean weight and gain involves the determinationof loin eye area in carcasses. If that measurement is obtain-able, the lean gain can be calculated by the following(adapted from National Pork Producers Council, 1991):
Carcass fat-free lean (lb) 4 0.95 2 [7.231 ` (0.4372 hot carcass weight, lb) 1 (18.7462 10th rib fat depth, in.) ` (3.877
2 10th rib loin eye area, in.2)]
Initial carcass fat-free lean weight can be estimated bythe following formula:
Initial fat-free lean (lb) 4 0.95 2[13.65 ` (0.418 2 live weight, lb)]
After estimating the pounds of fat-free lean in the carcassat slaughter and in the carcass of the initial pig, the leangain is calculated as follows:
Carcass fat-free lean gain (lb/day)
4(Final carcass fat-free lean, lb) 1 (Initial carcass fat-free lean, lb)
Days from initial to final
Lean gain in lb/day is then convertedto g/day by multiplying by 454.
Because lean gain is not constant from one day to thenext, the calculated lean growth rate will be influenced bythe initial and final weights of the pigs. The mean leangrowth rate in the growth model assumes initial and finalweights of 20 and 120 kg, respectively (approximately 45and 265 lb). If the calculated lean growth rate is determinedwith pigs having different initial and/or final weights thanthese, the adjustment factors in Appendix Table 2-1 canbe used to adjust the lean gain to a 20- to 120-kg basis.

Appendix 2: Determining Lean Growth Rate 149
Appendix Table 2-1 Factors for use when the lean growth rate is measured over a period other than 20 to 120 kg.
Initial Wt (kg)20 25 30 35 40 45 50 55 60 65 70 75 80 85 90 95 100
FinalWt (kg)40 1.07 1.04 1.02 1.0045 1.05 1.02 1.00 0.99 0.9750 1.03 1.01 0.99 0.97 0.96 0.9555 1.02 1.00 0.98 0.96 0.95 0.94 0.9460 1.01 0.99 0.97 0.96 0.95 0.94 0.93 0.9365 1.00 0.98 0.96 0.95 0.94 0.94 0.93 0.93 0.9370 0.99 0.97 0.96 0.95 0.94 0.93 0.93 0.93 0.93 0.9375 0.98 0.97 0.96 0.95 0.94 0.93 0.93 0.93 0.93 0.93 0.9380 0.98 0.97 0.96 0.95 0.94 0.94 0.93 0.93 0.93 0.93 0.94 0.9485 0.98 0.97 0.96 0.95 0.94 0.94 0.94 0.94 0.94 0.94 0.94 0.95 0.9690 0.98 0.97 0.96 0.95 0.94 0.94 0.94 0.94 0.94 0.95 0.95 0.96 0.96 0.9795 0.98 0.97 0.96 0.95 0.95 0.95 0.95 0.95 0.95 0.95 0.96 0.97 0.97 0.98 0.99100 0.98 0.97 0.96 0.96 0.95 0.95 0.95 0.95 0.96 0.96 0.97 0.97 0.98 0.99 1.00 1.01105 0.98 0.98 0.97 0.96 0.96 0.96 0.96 0.96 0.97 0.97 0.98 0.98 0.99 1.00 1.01 1.03 1.04110 0.99 0.98 0.97 0.97 0.97 0.97 0.97 0.97 0.97 0.98 0.99 1.00 1.00 1.01 1.03 1.04 1.05115 0.99 0.99 0.98 0.98 0.97 0.97 0.98 0.98 0.98 0.99 1.00 1.01 1.02 1.03 1.04 1.05 1.07120 1.00 0.99 0.99 0.98 0.98 0.98 0.99 0.99 0.99 1.00 1.01 1.02 1.03 1.04 1.05 1.07 1.08
Instructions: Find the cell in the table that corresponds to the initial and final weights over which the mean lean growth rate in the situation of interest is measured. Multiplythe measured mean lean growth rate by the factor in that cell.Note: These factors are correct only for the default lean accretion curve.
R EF ER E NC ES
National Pork Producers Council. 1991. Procedures to Evaluate MarketHogs. Third ed. National Pork Producers Council, Des Moines, IA.
National Pork Producers Council. 1994. Fat-Free Lean Index. NationalPork Producers Council, Des Moines, IA.
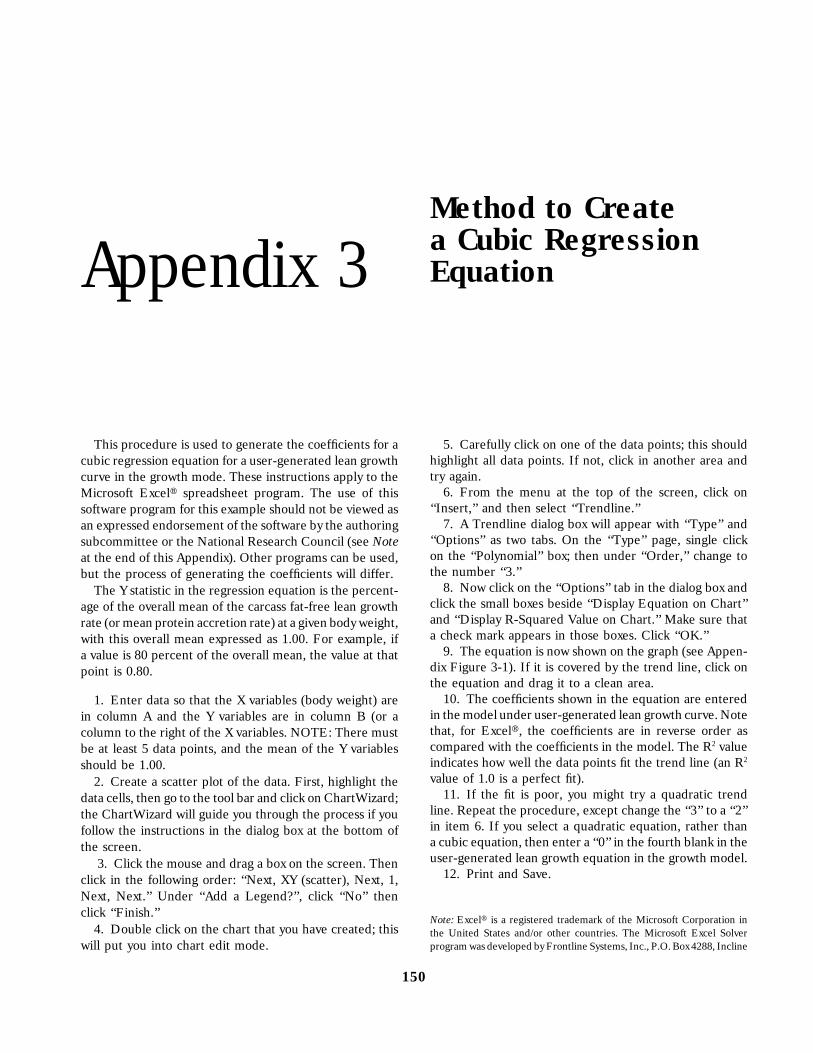
Method to Createa Cubic RegressionEquationAppendix 3
This procedure is used to generate the coefficients for acubic regression equation for a user-generated lean growthcurve in the growth mode. These instructions apply to theMicrosoft Excelt spreadsheet program. The use of thissoftware program for this example should not be viewed asan expressed endorsement of the software by the authoringsubcommittee or the National Research Council (see Noteat the end of this Appendix). Other programs can be used,but the process of generating the coefficients will differ.
The Y statistic in the regression equation is the percent-age of the overall mean of the carcass fat-free lean growthrate (or mean protein accretion rate) at a given body weight,with this overall mean expressed as 1.00. For example, ifa value is 80 percent of the overall mean, the value at thatpoint is 0.80.
1. Enter data so that the X variables (body weight) arein column A and the Y variables are in column B (or acolumn to the right of the X variables. NOTE: There mustbe at least 5 data points, and the mean of the Y variablesshould be 1.00.
2. Create a scatter plot of the data. First, highlight thedata cells, then go to the tool bar and click on ChartWizard;the ChartWizard will guide you through the process if youfollow the instructions in the dialog box at the bottom ofthe screen.
3. Click the mouse and drag a box on the screen. Thenclick in the following order: ‘‘Next, XY (scatter), Next, 1,Next, Next.’’ Under ‘‘Add a Legend?’’, click ‘‘No’’ thenclick ‘‘Finish.’’
4. Double click on the chart that you have created; thiswill put you into chart edit mode.
150
5. Carefully click on one of the data points; this shouldhighlight all data points. If not, click in another area andtry again.
6. From the menu at the top of the screen, click on‘‘Insert,’’ and then select ‘‘Trendline.’’
7. A Trendline dialog box will appear with ‘‘Type’’ and‘‘Options’’ as two tabs. On the ‘‘Type’’ page, single clickon the ‘‘Polynomial’’ box; then under ‘‘Order,’’ change tothe number ‘‘3.’’
8. Now click on the ‘‘Options’’ tab in the dialog box andclick the small boxes beside ‘‘Display Equation on Chart’’and ‘‘Display R-Squared Value on Chart.’’ Make sure thata check mark appears in those boxes. Click ‘‘OK.’’
9. The equation is now shown on the graph (see Appen-dix Figure 3-1). If it is covered by the trend line, click onthe equation and drag it to a clean area.
10. The coefficients shown in the equation are enteredin the model under user-generated lean growth curve. Notethat, for Excelt, the coefficients are in reverse order ascompared with the coefficients in the model. The R2 valueindicates how well the data points fit the trend line (an R2
value of 1.0 is a perfect fit).11. If the fit is poor, you might try a quadratic trend
line. Repeat the procedure, except change the ‘‘3’’ to a ‘‘2’’in item 6. If you select a quadratic equation, rather thana cubic equation, then enter a ‘‘0’’ in the fourth blank in theuser-generated lean growth equation in the growth model.
12. Print and Save.
Note: Excelt is a registered trademark of the Microsoft Corporation inthe United States and/or other countries. The Microsoft Excel Solverprogram was developed by Frontline Systems, Inc., P.O. Box 4288, Incline
Appendix 3: Creating a Cubic Regression Equation 151
Appendix Figure 3-1. Graph of a cubic regression equation.
Village, NV 89450-4288. Portions of the Microsoft Excel Solver programcode are copyright 1990, 1991, 1992, and 1995 by Frontline Systems,Inc. Portions are copyright 1989 by Optimal Methods, Inc. The MicrosoftExcel Solver program uses Generalized Reduced Gradient (GRG2) non-linear optimization code developed by Leon Lasdon, University of Texasat Austin, and Allan Waren, Cleveland State University. Linear and integerproblems use the simplex method with bounds on the variables and the
branch bound method, implemented by John Watson and Dan Fylstra,Frontline Systems, Inc. The Microsoft Excel Analysis Toolpak was devel-oped by GreyMatter International, Inc., 173 Otis Street, P.O. Box 388,Cambridge, MA 02141. The Microsoft Excelt Spreadsheet Solution Tem-plates were developed by Village Software, 186 Lincoln Street, Boston,MA 02111.

Appendix 4
NUTRIENTREQUIREMENTSOF SWINETenth Revised Edition, 1998
A USER’S GUIDE FOR MODEL APPLICATION
Subcommittee on Swine NutritionCommittee on Animal NutritionBoard on AgricultureNational Research Council
SUBCOMMITTEE ON SWINE NUTRITION
GARY L. CROMWELL, Chair, University of KentuckyDAVID H. BAKER, University of IllinoisRICHARD C. EWAN, Iowa State UniversityE. T. KORNEGAY, Virginia Polytechnic Institute and State UniversityAUSTIN J. LEWIS, University of NebraskaJAMES E. PETTIGREW, Pettigrew Consulting International, Louisiana, MissouriNORMAN C. STEELE, U.S. Department of Agriculture, Agricultural Research Service,
Beltsville, MarylandPHILIP A. THACKER, University of Saskatchewan, Canada
STAFF
CHARLOTTE KIRK BAER, Program DirectorMELINDA SIMONS, Project Assistant
SOFTWARE INTERFACE DEVELOPMENT
RONALD HAUGEN, Easy Systems, Inc., Welcome, Minnesota
154
Table of Contents
Chapter 1. Introduction. . . . . . . . . . . . . . . . . . . . . . . . . . . . . . . . . . . . . . . . . . . . . . . . 156Tutorials, 156Computer Model Programs, 156Feed Composition Tables, 157Hardware and Software Requirements and Program Installation, 157Getting Started, 158
Chapter 2. Using the NRC Model Programs . . . . . . . . . . . . . . . . . . . . . . . . . . . . . . . . 159About the Screen, 160Task Field, 160Report Field, 161Folder Field, 161
Chapter 3. Tutorial Lesson 1. . . . . . . . . . . . . . . . . . . . . . . . . . . . . . . . . . . . . . . . . . . . 163General Description of the Growth Model, 163Grow-Finish Case Study, 164
Chapter 4. Tutorial Lesson 2. . . . . . . . . . . . . . . . . . . . . . . . . . . . . . . . . . . . . . . . . . . . 166General Description of the Gestation Model, 166Gestating Sow Case Study, 166
Chapter 5. Tutorial Lesson 3. . . . . . . . . . . . . . . . . . . . . . . . . . . . . . . . . . . . . . . . . . . . 167General Description of the Lactation Model, 167Lactating Sow Case Study, 167
155
1 Introduction
A compact disk (CD-ROM) containing three models isprovided as a companion to the National Research Coun-cil’s (NRC’s) Nutrient Requirements of Swine, TenthRevised Edition, 1998. This User’s Guide provides informa-tion with specific examples demonstrating the use of eachof the three programs contained on the NRC computerdisk. Three model program options for predicting nutrientrequirements include programs that address (1) the grow-ing pig, including the starting, growing, and finishing stagesof growth from 3 to 120 kg body weight, (2) gestating sows,and (3) lactating sows.
These models allow the user to apply the modeling prin-ciples, interrelationships, and equations summarized inChapter 3 of the report. A basic understanding of swinenutrition is required to properly use the programs, andknowledge of the underlying biological concepts presentedin this report is essential for appropriate use of the com-puter models.
The computer model programs predict energy andamino acid requirements on a daily basis and on a dietconcentration basis by estimating the amount of energyand amino acids needed for specific physiologic functions,such as maintenance, body protein accretion, and milkprotein synthesis. Equations are given to predict mineraland vitamin requirements at various stages of growth.Numerous factors including body weight, lean growthpotential, gender, environmental temperature, space perpig, number of pigs per litter born and weaned, weaningage, litter growth rate, and other factors enter into theequations for predicting nutrient requirements. Each pro-gram uses different prediction equations and the inputsrequired for each program vary according to the variousphysiologic and metabolic functions being described (i.e.,growth, gestation, lactation).
The software was developed for accuracy and ease ofuse. The programs were developed in database format asthe foundation for a Windows-based, menu-driven pro-gram. Program ‘‘help’’ screens provide guidelines forchoosing inputs and in interpreting and applying outputs.
156
T UT OR I AL S
The purpose of this user’s guide is to demonstrate howto apply the NRC computer model programs to predictnutrient requirements of swine. Tutorials familiarize theuser with program mechanics and options. In addition,they provide a quick overview of the program applicationsfor each of the three models. Examples are provided thatallow the user to input data, obtain predicted nutrientrequirements, and evaluate the results. The user is stronglyurged to read the comprehensive material provided in thisreport and is referred to the following chapters for detailedinformation on biological bases for equations and assump-tions used in the software:
● Energy, Chapter 1● Proteins and Amino Acids, Chapter 2● Models for Estimating Energy and Amino Acid
Requirements, Chapter 3● Minerals, Chapter 4● Vitamins, Chapter 5● Diet Formulation, Chapter 9● Nutrient Requirement Tables, Chapter 10● Composition of Feed Ingredients, Chapter 11
C OM PU T ER MO D EL PR O GR AM S
Growth
This model allows the user to compute the daily lysinerequirement on a true ileal digestible basis for maintenanceand whole-body protein accretion. The program uses alean tissue accretion curve, based on carcass fat-free leantissue, to predict the lean tissue accretion rate at a givenbody weight. The carcass lean tissue accretion is then con-verted to whole body protein accretion by assuming thereare 2.55 grams of carcass fat-free lean tissue per gram ofwhole-body protein. The amount of true ileal digestible

Appendix 4: User’s Guide 157
lysine needed to support that amount of whole body proteinaccretion is then calculated, based on the assumption that0.12 gram of lysine is needed for every gram of whole bodyprotein. This amount of lysine needed for protein synthesisplus the amount needed for maintenance are summed.The requirements for the other amino acids are based onthe ideal protein system; that is, their ratio to lysine formaintenance and protein accretion. Equations are used toestimate digestible energy intake based on body weight,gender, environmental temperature, and space per pig.Feed intake is then determined from the estimate of digest-ible energy intake. Mineral and vitamin requirements areestimated for different body weights by equations.
Gestation
This model predicts the amount of dietary energy andamino acids needed by sows of different breeding weightsto attain a targeted weight gain during pregnancy. Theformula for prediction assumes that total tissue accretionis the sum of that in the maternal body plus the productsof conception. The model predicts energy requirementfor a given gestation weight gain, or predicts weight gainresulting from a given energy intake. Adjustments in energyintake are made for cold environments.
Lactation
This model predicts the amount of dietary energy andamino acids needed by sows based on their postfarrowingweight, the weight loss or gain during lactation, and theweight gain of the litter, a reflection of the sow’s level ofmilk production. Amino acid requirements are based onthe amino acid patterns in tissue protein gain or loss, milkprotein, and maintenance. The model predicts energyrequirements based on the sow’s lactational weight change,or predicts lactation weight change resulting from a givenenergy intake.
F EE D C O MP OS I TI ON T AB LE S
These tables are provided to allow the user to view andprint the composition of 79 different feed ingredients thatare commonly used in swine feeding. The tables are alsopresented in Chapter 11.
Adobe Acrobat Reader is required to view and print thetables. Instructions for installing Adobe Acrobat Readerare provided in the section ‘‘Getting Started’’ in this chapter(Chapter 1) of the User’s Guide.
After Adobe Acrobat Reader has been installed, thetables can be viewed by pressing ‘‘Tables’’ at the top ofthe screen (or if you are already in one of the modelprograms, by pressing ‘‘Feed Tables’’ at the bottom of the
screen). The first screen to appear provides titles of eachof the 11 tables. To access a particular table, click on itstitle and the table containing feed composition data willappear. To move around within individual tables, use thecursor (designated on the screen as a small hand, whichpoints to certain locations as the mouse is moved to differ-ent areas on the table).
Various tool tips located on the tool bar at the top ofthe screen allow the user to move from page to page, todisplay entire tables on the screen, and to conduct otherprocedures. For instance, to zoom in on a certain area ofthe table, select the tool designated as a magnifying glasswith a ‘‘`’’ in its center. Move the magnifying glass to thedesired section of the screen and click. The portion of thescreen being viewed will become magnified. By continuingto click, the image will continue to be enlarged. Portionsof the table can also be magnified by selecting with themouse while holding the mouse button down and outliningthe area desired. When the mouse button is released, thearea becomes enlarged. To return to the full view, clickon the button that shows a full page on the tool bar.
Three buttons located on the left side of the tool barprovide the following useful options: the first button dis-plays only the page, the second button from the left pro-vides a list of tables in the margin of the screen, and thethird button from the left provides a full-page view ofseveral tables in the margin.
To exit the tables and return to the main menu, select‘‘File’’ at the top of the screen and then ‘‘Exit.’’ An alternateway to exit is to hold down the ‘‘Alternate’’ key on thekeyboard and press F4.
Risk of use: Because of the many variables involvedand judgments that must be made inchoosing inputs and interpreting out-puts, the NRC makes no claim for theaccuracy of this software and the useris solely responsible for risk of use.
H AR DW A RE AN D SO FT W AR ER EQ UI R EM EN T S A ND P RO GR A MI NS TA L LA TI O N
This software is designed to operate in a Windows envi-ronment on microcomputers that run Windows 3.1 orhigher versions (Windows 95 or NT). The NRC modelrequires the following hardware:
1. an IBM compatible computer with 80386sx proces-sor (or higher) with mouse;
2. 8 Megabytes random access memory (RAM) (16Megabytes recommended);
3. 16 Megabytes hard drive disk space; and
158 Nutrient Requirements of Swine
4. a compact disk (CD-ROM) drive (internal or exter-nal) or floppy-disk drive.
The NRC model requires the following software:
1. Windows version 3.1 or higher, Windows for Work-groups 3.11 (Windows 95 or NT recommended),
2. NRC model CD or floppy disks.
To install this software from the CD:
1. Insert CD into drive. Setup will begin automaticallyif you are using Windows 95. If not, locate the ‘‘setup’’folder (directory) named ‘‘Disk 1.’’
2. If you are using Windows 3.1, you will need to locatethe ‘‘setup’’ folder (directory) named ‘‘Disk 1’’ on the CDto initiate the setup.
To copy the program from the CD to floppy disks:
1. General instructions: Insert the CD. Locate the 13disk folders (directories) on the CD. Copy all files in eachfolder to individual disks inserted into your floppy drive.You will need 13 individual floppy disks. You may also copythe contents of the CD to a directory on your hard driveand subsequently copy the 13 folders onto individual disksinserted in your floppy drive.
2. Using Windows 95: Use Explorer to locate your CDdrive. Click on folder named ‘‘Disk 1.’’ On the right-handside you will see all files contained in this folder. Press‘‘Alt-A’’ to select all files in this folder. Next, make sureyour mouse is located over the selected files and RIGHTCLICK your mouse. Select ‘‘Copy’’ and move to the diskdrive A: and PASTE onto the floppy disk located in driveA. Label this as ‘‘Disk #1.’’ Repeat for each of the 13 disks,labeling each with the appropriate disk number.
3. Using Windows 3.1: Use File Manager to copy asdescribed above.
To install this software from floppy disks:
1. Enter Windows.2. Select Program Manager.3. Select File.4. Select Run.5. Insert NRC ‘‘Disk 1’’ into floppy drive.6. Type ‘‘A: ⁄SETUP’’ on the command line.7. Press Enter.8. Insert disks as prompted.
G ET TI N G S TA R TE D
1. After you have installed the NRC model, an icon willbe added to your workspace, if you are using Windows3.1. If you are using Windows 3.1, double click on thaticon to open the model software. If you are using Windows95, select ‘‘Programs’’ and then select ‘‘NRC’’ to begin.
2. An introductory screen will appear. After reading thestatement of use, click ‘‘OK’’
3. When the main menu screen appears, choose one ofthe program options on the screen (Gestation, Lactation,Growth) to select the desired program. Note: preferencesfor the use of either digestible energy (DE) or metaboliz-able energy (ME) for inputs should be selected as well aspreference for the use of ‘‘tool tips’’ (use of these tips isrecommended). Preferences on this main menu screenshould be selected before beginning the model programs.
4. To view and print the feed composition tables, AdobeAcrobat Reader is required. To activate this software fromthe CD (or if the software currently exists on your com-puter) click on the utilities button located on the menubar of the NRC model. You will be presented with theoption of installing or providing the location of AdobeAcrobat Reader. Select the installation option to activateAcrobat Reader. Once this software is installed, clickon the ‘‘tables’’ button on the main menu bar to viewand print the feed composition tables. You can alsoaccess and download Adobe Acrobat Reader softwareonto your computer by going to the Internet address:www.adobe.com
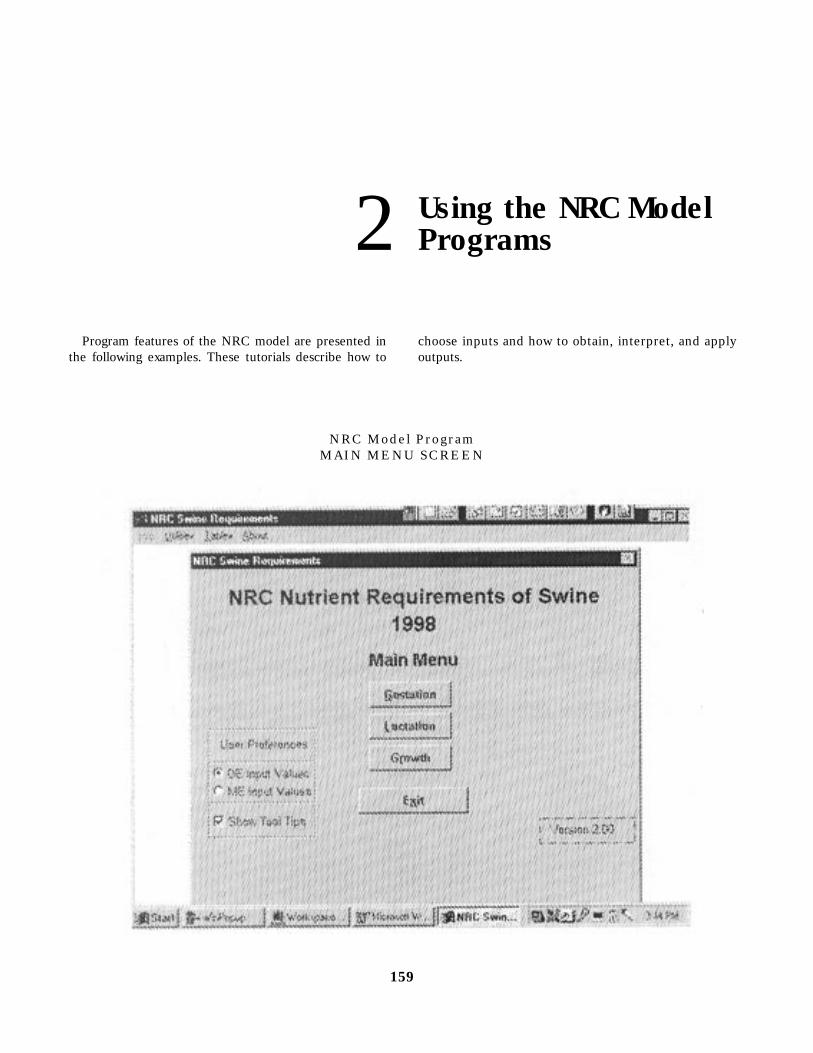
Using the NRC Model2 Programs
Program features of the NRC model are presented inthe following examples. These tutorials describe how to
N RC Mo d e l Pr o gr amM AI N M E NU SC R EE N
159
choose inputs and how to obtain, interpret, and applyoutputs.
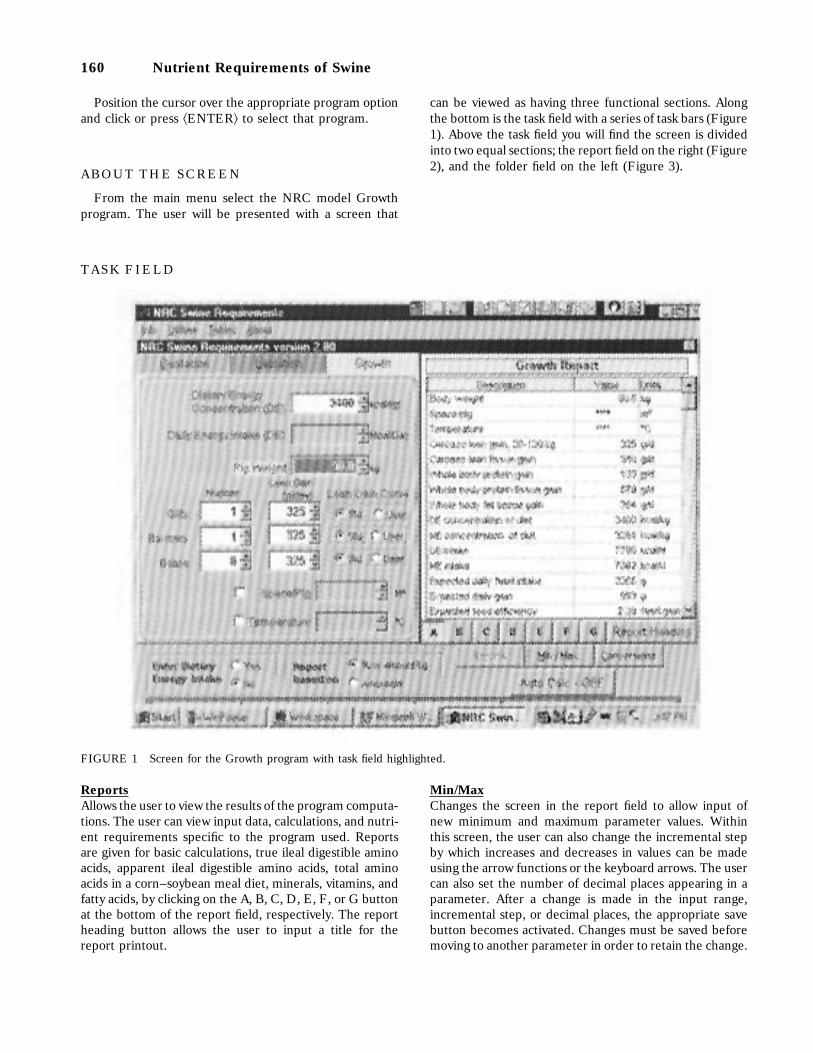
160 Nutrient Requirements of Swine
Position the cursor over the appropriate program optionand click or press ^ENTER& to select that program.
A BO UT T HE SC R EE N
From the main menu select the NRC model Growthprogram. The user will be presented with a screen that
T AS K F I EL D
FIGURE 1 Screen for the Growth program with task field highlighted.
ReportsAllows the user to view the results of the program computa-tions. The user can view input data, calculations, and nutri-ent requirements specific to the program used. Reportsare given for basic calculations, true ileal digestible aminoacids, apparent ileal digestible amino acids, total aminoacids in a corn–soybean meal diet, minerals, vitamins, andfatty acids, by clicking on the A, B, C, D, E, F, or G buttonat the bottom of the report field, respectively. The reportheading button allows the user to input a title for thereport printout.
can be viewed as having three functional sections. Alongthe bottom is the task field with a series of task bars (Figure1). Above the task field you will find the screen is dividedinto two equal sections; the report field on the right (Figure2), and the folder field on the left (Figure 3).
Min/MaxChanges the screen in the report field to allow input ofnew minimum and maximum parameter values. Withinthis screen, the user can also change the incremental stepby which increases and decreases in values can be madeusing the arrow functions or the keyboard arrows. The usercan also set the number of decimal places appearing in aparameter. After a change is made in the input range,incremental step, or decimal places, the appropriate savebutton becomes activated. Changes must be saved beforemoving to another parameter in order to retain the change.

Appendix 4: User’s Guide 161
ConversionsChanges the screen in the report field to display the U.S.standard equivalents to the units displayed in the folderfield.
Enter Dietary Energy IntakeAllows the user to calculate the nutrient requirementsbased on an actual energy intake or on the model’s defaultenergy intake.
Report Based OnAllows the user to view the nutrient requirements on anamount-per-day basis or on a diet-concentration basis.
Auto Calc—OffAllows the user to determine whether to have the programrecalculate requirements after each input, or only aftermanually activating recalculation function. (Recommendsetting to the ‘‘off’’ position when using slower machines.)
ResetReturns all parameters to their original default values.
Feed TablesAllows the user to access the feed composition tables.
HelpAllows the user to access help screens.
PreviewAllows the user to preview the report results of the modelbeing used. This option provides a view of results that occurfrom changing inputs. The report includes informationprovided by the user to generate the report and the calcu-lated requirements on both a percentage basis and anamount-per-day basis.
PrintSends the current version of the report associated with themodel program being used to the printer selected in theWindows control panel.
ExitAllows the user to exit the computer model and return tothe main menu.
R EP OR T FI EL D
This field contains three separate functional screens.The user may toggle between the three screens by clickingon either the Report, Min/Max, or Conversions buttons.
Report ScreenThe report screen allows the user to choose the view ofone of seven different reports by clicking on the appro-priate button.
A Basic calculations and input data
B Amino acids on a true ileal digestible basis
C Amino acids on an apparent ileal digestible basis
D Amino acids on a total basis (applies to corn–soybeanmeal diet)
E Minerals
F Vitamins
G Fatty acids
Report Heading
Report Heading allows the user to define the title of thereport.
Parameter Setting ScreenThe parameter setting screen allows the user to changevalues for parameter inputs. This screen is accessed byclicking the Min/Max button.
Conversions ScreenProvides the user with standard U.S. equivalents to metricunits shown in the folder field. This screen is accessed byclicking the Conversions button.
F OL DE R FI EL D
Within the folder field, the user can move between thegestation, lactation, and growth folders by clicking on theappropriate folder tab at the top.

162 Nutrient Requirements of Swine
FIGURE 2 Screen for the Growth program with report field highlighted.
FIGURE 3 Screen for the Growth program with folder field highlighted.
3 Tutorial Lesson 1
G EN ER A L D ES C RI PT I ON OF T HEG RO WT H MO DE L
All programs, including the Growth program, can beinitiated by selecting the appropriate NRC model buttonon the opening screen. However, before selecting theappropriate model button, DE or ME should be selectedas your preference of input values. Once in the desiredmodel program, using your mouse or tab key, you canbegin entering inputs (Figure 1). To move from one inputcell to another, press the ‘‘Enter’’ or ‘‘Tab’’ keys.
Inputs
To change values for inputs, highlight the appropriatecell by sweeping over the cell with the cursor or by triple-clicking on the cell, input the desired value, and hit enter.When the cursor is over the cell, a minimum and maximumvalue for input will appear. Values outside this range willnot be accepted. Small incremental changes may be accom-plished by one of two methods. After highlighting the cellincremental increases or decreases in the value can bemade using the up or down arrows on the keyboard. Alter-natively, these changes can be made by clicking on the upor down arrows to the right of the value in the appropriatecell. After you have attained the desired value, hit enterto move the cursor to the next input cell.
Three other methods exist for moving between inputcells. Any cell may be reached directly using the mousecursor. You can move from one cell to the next usingthe tab key to move forwards, or use shift`tab to movebackwards. Alternatively, the same task can be achievedusing the left arrow key on the keyboard to move backwardsand the right arrow key to move forwards.
It is very important to remember to hit the Re-Calc taskbar every time that an input is made. Otherwise, the reportwill not be correct. If the Re-Calc bar is a red color, thismeans that an input change has occurred and that theequations must be recalculated.
163
Optional Inputs
The first entry is to indicate the caloric density of thediet, in kcal of DE per kg of diet assuming that DE wasselected as the preferred input on the opening screen.Insert this value in the upper box. The default value is3400 kcal/kg, which is the typical value for a corn–soybeanmeal diet.
The user should then indicate the weight of the pig. Themodel was developed for pigs weighing from 3 to 120 kg,and any weights outside this range may not have validestimates of requirements.
Options exist for determining requirements of gilts, bar-rows, boars, or any combination of the three genders. Thisis attained by inserting the number of each sex in theappropriate box beside gilts, barrows, and boars.
The model uses a standard default lean growth curvefor gilts, barrows, and boars, and this is done by pressingthe radio button beside ‘‘std.’’ Ordinarily, this is the leangrowth curve that will be used. However, if the user prefersto use a different shape curve, that can be done also bypressing the button beside user. A new screen appearswhere you can enter the intercept and the coefficients ofa cubic equation that best describes your alternative curve.A quadratic equation can also be used by using a zero asthe fourth coefficient. Quadratic or cubic equations canbe derived by using a spreadsheet program (See Appendix3). Any new equations can be saved by pressing the appro-priate buttons on this screen. Press ‘‘Return’’ to return tothe main screen.
To incorporate the effect of stocking density (space perpig) or environmental temperature, click on the appro-priate box. When successfully incorporated, a check markwill appear in the box. To remove the effects of space perpig or environmental temperature, click again on the boxto remove the check mark.
The estimated requirements can be calculated with theoption of either including the dietary energy intake or byexcluding it and allowing the model to determine a default

164 Nutrient Requirements of Swine
energy intake at a particular body weight. To change thisfrom the default, click on the ‘‘Yes’’ option. Similarly, theprogram offers the option of having the reports given on adietary-concentration basis or on an amount-per-day basis.The default setting is for a dietary-concentration basis. Toobtain requirements on a daily basis, click on amount/day.At any time the user can return to the default settings byclicking on the ‘‘Reset’’ task bar.
Options exist allowing the user to view the general outputor the requirements for amino acids on a true or apparentdigestible basis or on a total basis, minerals, vitamins, andfatty acids by clicking on boxes A through G at the bottomof the report screen.
Conversion Factors
In addition to these features, the standard English equiv-alent conversions of the metric values can be viewed byclicking on the ‘‘Conversions’’ task bar in the task field. Toreturn to the report screen click on the ‘‘Report’’ bar.
Maximum and Minimum Values
To view the minimum and maximum values that can beinput, click on the ‘‘Min/Max’’ bar in the task field. Toview the range for any parameter, click on the parametercell of interest. The range of acceptable values can bechanged. To change the value for any given parameter,click on either the minimum or maximum bar in the boxlabeled ‘‘input ranges’’ and input the new value. Save thenew values before exiting the program. Within this screen,there also exists the option to increase or decrease thedegree of incremental changes when using the arrows but-ton option. The number of figures following the decimalpoint for any parameter can also be changed within thisscreen.
G RO W- F IN IS H CA SE S TU DY
Begin the tutorial by selecting DE input values and thenselecting the NRC Growth program. Both of these optionsare located on the main menu screen. At the Growth modelworking screen, enter information by placing the cursor inthe appropriate cell. First, if the Re-Calc task bar says thatit is on, turn it off. Otherwise, the program will recalculatebetween each entry and it will take several seconds foreach recalculation. When you click on each input cell,the descriptor becomes highlighted; type information inhighlighted cells. It may be necessary to sweep across thevalue with your mouse before entering the new number;or you can use the up and down arrows for minor changes.All entries are in metric units; conversions and conversionfactors are available by clicking on the Conversion option,
which displays information and converted equivalents inEnglish units.
Dietary energy concentration Enter the dietarydigestible energy (DE) concentration of the diet in kcal ofDE per kg of diet. This is on an ‘‘as fed’’ basis and assumes90% dry matter in the diet. In this example, the dietaryenergy concentration is 3,400 kcal of DE/kg. For practicalresults, this value cannot be below 2,000 or above 5,000kcal/kg. The default value for this entry is 3,400.
Daily energy intake In this example, we will not enterDE intake, but let the model calculate it from the defaultequation. Press the radio button beside ‘‘no’’ in the lowerleft task bar.
Pig weight Enter the average weight of the pigs forwhich requirements will be determined. For this example,the average weight is 70 kg, so enter 70.
Distribution of sex In this example, we will determinethe requirement for a mix of barrows and gilt, assuming a1:1 ratio. Enter a ‘‘1’’ in the space following gilts, a ‘‘1’’ inthe space following barrows, and a ‘‘0’’ in the space follow-ing boars. If you enter 10 gilts and 10 barrows, you willget the same answer.
Lean gain The average lean growth rate of the pigs isnow entered. Lean gain is defined as the carcass fat-freelean tissue gain averaged over the range of 20 to 120 kgbody weight. This value is estimated from the final leancontent of the carcass minus an initial lean content of thecarcass divided by the number of days from start to finish.In this example, we will assume that the lean gain is 330grams per day for gilts and 320 grams for day for barrows.Enter these two values beside gilts and barrows, respec-tively. It does not matter what value is entered besideboars, because we are not including any boars in this deter-mination (i.e., the number of boars is 0).
Lean growth curve We will use the default growthcurve for both genders, so press the radio button besideStd for barrows and for gilts.
Space/Pig We will enter the space allocation, so clickon the box to the left of space/pig. Let’s assume that thereis 0.9 square meters per pig. Enter 0.9 in the box followingspace/pig. Note: Caution should be used in making adjust-ments for crowding because the adjustments are not pre-cise. Adjustments may be too great at the lower end ofeach weight range category.
Temperature We will enter 22 degrees C as an averagetemperature for these pigs. Check the box to the left of

Appendix 4: User’s Guide 165
temperature and enter 22 in the box to the right of tempera-ture. Click on the box marked Conversions, and you willnotice that the space in more familiar units is 9.68 squarefeet and the temperature is 71 degrees Fahrenheit. Clickon the box called ‘‘Reports’’ to return the main screen.
Go to the box marked ‘‘Report based on’’ and click theradio button next to ‘‘%’’ or ‘‘amount/kg.’’
You are now ready to look at the report. But, remember,it will not be correct until you first hit the Re-Calc taskbar, which is red in color. Press it and after a few seconds,the task bar will say ‘‘Auto Calc Off.’’
Press box ‘‘A’’ under the report. You will now see muchof the data that you have already entered. In addition, youwill see the carcass daily lean growth rate and the wholebody daily protein accretion rate of the pigs at the particularweight that you have chosen. The estimated whole bodygain of protein tissue and fat tissue is also displayed. Youwill also see the DE and ME concentrations of the diet,the daily DE and ME intakes under the conditions thatyou have specified, the daily feed intake, and the expecteddaily gain and feed conversion efficiency (feed/gain) of thepigs at this particular body weight. The approximate crudeprotein level in the diet is also given. You will have to usethe scroll bar on the right side of the screen to see thecrude protein level of the diet.
Click on ‘‘B’’ and the amino acid requirements, on a trueileal digestible basis, are listed. Click on C for the apparentileal digestible amino acid requirements, and click on Dfor the total amino acid requirements assuming that a corn-soybean meal diet is fed. Note that the total lysine require-ment is 0.75% of the diet. Click on E, F, and G for themineral, vitamin, and linoleic acid requirements,respectively.
Now click once again on D. Again, what you see are theamino acid requirements of a group of barrows and gilts(1:1 ratio) at 70 kg body weight with lean growth rates asyou previously specified. Now go to the box marked‘‘Report based on’’ and click on the radio button to theleft of ‘‘amount/day.’’ Note that the report screen nowshows that the daily lysine requirement is 19.7 grams/day.Now go back and click on % or amount/kg.
Let’s make some further changes to see what effect theyhave on the lysine requirement. Change the temperature,space/pig, lean growth rate of the pigs, number of pigs andyou will see the resulting changes in the predicted lysinerequirement. Click on the ‘‘Yes’’ button in the box marked‘‘Enter Dietary Energy Intake’’ and reenter another dailyenergy intake. Note the change in the lysine requirement,as well as all of the other requirements when they areexpressed on a concentration basis. This is because thefeed intake changes; thus the concentration of nutrientsmust change to give an equivalent daily amount of thatnutrient.Note that when you make a change in energy concentra-tion, space per pig, or temperature, a warning sign willappear. The warning indicates that with low energy diets,pigs may not be able to eat sufficient feed to meet theirpredicted energy requirement and that with crowding orhigh temperatures, lean gain may be reduced.Note that every time you make a change in any of thevariables, the Re-Calc task bar below the report will be inbright red, and you must click on this bar in order for themodel to make recalculations.The recalculation box can be turned on or off. When turnedon, recalculation occurs every time you make a change inyour input, but it takes more time that way. When turnedoff, time-consuming recalculations are avoided wheneveryou change an input, but you must remember to click onthe box to recalculate.Press the ‘‘Print’’ task bar and the report will be printed.If you want to assign a title to the report before printingit, press the ‘‘Report Heading’’ button and entire thedesired title. The printed report for the conditions thatyou have entered is shown at the end of this exercise. Ifyou want to view the report before it is printed, press thepreview bar.Anytime that you need help, hit the ‘‘Help’’ task bar anda help screen will appear. The index will first appear andyou can click on the area that you need help and thatarea will appear. Or, you can scroll through the entirehelp screen.If you want to exit the program, press ‘‘exit.’’ If you wantto access one of the other models, click on the appropriatetab at the top left of the screen.

4 Tutorial Lesson 2
G EN ER A L D ES C RI PT I ON OF T HEG ES TA T IO N M O DE L
The Gestation model is quite similar to the Growthmodel in terms of data entry and output of reports. Theuser is referred to the general description of the Growthmodel, discussed in the previous chapter for details.
G ES TA T IN G S O W C AS E ST UD Y
Begin the tutorial by selecting the Gestation tab if you arealready in one of the other programs or select Gestationfrom the main menu screen. Enter information by placingthe cursor in the appropriate cell. First, if the Auto Calcis on, click on the task bar to turn it off. Otherwise, theprogram will recalculate between each entry and it willtake several seconds for each recalculation. When you clickon each input cell, the descriptor becomes highlighted;type information in highlighted cells. It may be necessaryto sweep across the value with your mouse or triple-clickon the cell before entering the new number; or you canuse the up and down arrows for minor changes. All entriesare in metric units; conversions and conversion factors areavailable by clicking on the Conversion option, which dis-plays information and converted equivalents in English units.
Enter the energy concentration of your diet. Let’s assumethat you are feeding a diet with 3,200 kcal of DE per kg,which is slightly lower in energy than a corn–soy diet.Enter 3200.
Daily energy intake will be calculated by the model. Ifthere is a value in this box, then go the lower part of thescreen and find Enter Dietary Energy Intake and clickon the ‘‘no’’ box. The energy intake entry box will nowbe blank.
Let’s assume that the sow weighs approximately 180 kg atbreeding and we want it to gain 45 kg of weight duringpregnancy. Enter 180 and 45 in the appropriate boxes.
166
Assume that the sow will farrow 13 pigs, so make thatentry. In this instance, we will assume that there is notemperature effect, so the small check box beside tempera-ture should be blank. If there is already a value in thetemperature box, click on the check mark beside it andthe temperature box will go blank.Press the red ‘‘Re-Calc’’ button to make the calculations.Press the ‘‘A’’ box, and you will see the data that youentered. You will also see estimates of how the weight gainwill be distributed, that is, 29.64 kg for the pigs and theplacental tissues and 15.36 kg for maternal tissues. Of thematernal tissue, 14.64 kg is protein or lean tissue, and only0.72 kg is fat tissue. The model predicts that the sow willconsume 8809 kcal of DE per day, which is equivalent to2.13 kg of feed per day.Click on boxes B, C, and D for estimates of the aminoacid requirements of this sow, on a true digestible basis,apparent digestible basis, and total basis, respectively. Notethat the model predicts that the sow requires 0.52% totallysine in the diet. Press boxes E, F, and G to see themineral, vitamin, and linoleic acid requirements.Go to the ‘‘Report Based On’’ task bar and press ‘‘Amount/day.’’ Now look at the reports after pressing B, C, D, etc.and you will see estimated requirements expressed on adaily basis.What would happen if this sow were fed either more orless feed during gestation? Go to the task bar marked‘‘Daily Dietary Energy Intake’’ and press ‘‘Yes.’’ You cannow enter DE intake in Mcal. Remember that there are1000 kcal in 1 Mcal. Enter a different value, press the ‘‘Re-Calc’’ bar and observe the changes in pregnancy weightgain and nutrient requirements that result from thischange.To print the report, press ‘‘Print.’’ If you want to assign atitle to the report before printing it, press the ‘‘ReportHeading’’ button and entire the desired title. An exampleof a printed report based on the original entries is shownin the attached gestation table.
5 Tutorial Lesson 3
G EN ER A L D ES C RI PT I ON OF T HEL AC TA T IO N M O DE L
The Lactation model is quite similar to the Growthmodel in terms of data entry and output of reports. Theuser is referred to the general description of the Growthmodel, discussed in Chapter 3 of this User’s Guide fordetails.
L AC TA T IN G S O W C AS E ST UD Y
Begin the tutorial by selecting the ‘‘Lactation’’ tab if youare already in one of the other programs or select ‘‘Lacta-tion’’ from the main menu screen. Enter information byplacing the cursor in the appropriate cell. First, if the AutoCalc is on, click on the task bar to turn it off. Otherwise,the program will recalculate between each entry and it willtake several seconds for each recalculation. When you clickon each input cell, the descriptor becomes highlighted;type information in highlighted cells. It may be necessaryto sweep across the value with your mouse or triple-clickon the cell before entering the new number; or you canuse the up and down arrows for minor changes. All entriesare in metric units; conversions and conversion factors areavailable by clicking on the Conversion option, which dis-plays information and converted equivalents in English units.
Enter the energy concentration of your diet. Let’s assumethat you are feeding a diet with 3,400 kcal of DE per kg;enter 3400.
Daily energy intake will be calculated by the model. Ifthere is a value in this box, then go to the lower part ofthe screen and find Enter Dietary Energy Intake and clickon the ‘‘no’’ box. The energy intake entry box will nowbe blank.
Let’s assume that the sow weighs approximately 175 kgafter farrowing and that we expect it to lose approximately5 kg of weight during a 21-day lactation period. The sow
167
will be nursing 10 pigs, and the average daily gain per pigwill be 200 grams. Enter these values in the appropriateboxes. Let’s assume that there will be no temperature effectso the small box beside temperature should not be checked.If there is already a value in the temperature box, click onthe check mark beside it and the temperature box willgo blank.Press the red ‘‘Re-Calc’’ button to make the calculations.Press the ‘‘A’’ box and you will see the data that you entered.You will also see that the sow will probably lose about 1.9kg of lean tissue and 3.1 kg of fat tissue during the 21-daylactation, and it will be expected to produce about 7.4 kgof milk per day. The model predicts that the sow willconsume about 16,942 kcal of DE per day, which is equalto 4.98 kg of feed.Click on boxes B, C, and D for estimates of the aminoacid requirements of this sow, on an true digestible basis,apparent digestible basis, and total basis, respectively. Notethat the model predicts that the sow requires 0.94% totallysine in the diet. Press boxes E, F, and G to see themineral, vitamin, and linoleic acid requirements.Go to the ‘‘Report Based On’’ task bar and press ‘‘Amount/day.’’ Now look at the reports after pressing B, C, D, etc.and you will see estimated requirements expressed on adaily basis.What would happen if this sow were fed more feed duringlactation? Go to the task bar marked ‘‘Daily Dietary EnergyIntake’’ and press ‘‘Yes.’’ You can now enter DE intake inMcal. Remember that there are 1000 kcal in 1 Mcal. Enter18.5 Mcal, press the ‘‘Re-Calc’’ bar, and notice theincreased feed intake. The sow now will gain about 1.1 kgof weight during lactation and the percentages of aminoacids are less (the lysine requirement is now 0.90%)because feed intake is higher.To print the report, press ‘‘Print.’’ If you want to assign atitle to the report before printing it, press the ‘‘ReportHeading’’ button and entire the desired title. An exampleof a printed report based on the original entries is shownin the following lactation table.

168 Nutrient Requirements of Swine
TABLE 1 Growth Model Report Printout.

Appendix 4: User’s Guide 169
TABLE 2 Gestation Model Report Printout.

170 Nutrient Requirements of Swine
TABLE 3 Lactation Model Report Printout.
Appendix 5 Help Screens
G RO WT H MO DE L HE LP S CR EE N
Index
Tabs for Gestation, Lactation, and GrowthInputs and DecimalsScrollingDietary Energy ConcentrationDaily Energy IntakePig WeightNumber of Gilts, Barrows, and BoarsLean GainLean Gain CurveSpace/PigTemperatureReport Based OnReportsReport Buttons A, B, C, D, E, F, G, and Report HeadingMin/MaxConversionsAuto Calc Off and Auto Calc OnResetFeed TablesHelpPreViewPrintExit
G RO WT H MO DE L
Tabs for Gestation, Lactation, and GrowthClick on these tabs to go between models.
Inputs and DecimalsInputs can be made in two ways, as follows:
One way is to highlight the input box by clickingthe box with the mouse and sweeping across thevalue in the box with the mouse button held
171
down or by triple-clicking on the input box.Insert the new value from the keyboard, thenpress ‘‘Enter’’ on the keyboard. The next cellwill then be highlighted and a new value can beentered. After all desired values are entered,click on the red ‘‘Re-Calc’’ button.
Another way is to click on the up and down arrowsinside the input box. If you want to change theincrements, press the ‘‘Min/Max’’ button (seeMin/Max section for further instructions).
Decimals can be changed in the input boxes andon the outputs in the visual and printed reports.Input boxes—highlight the box by clicking on it,
then click on the ‘‘Min/Max’’ button (see Min/Max section for further details).
Outputs—click on the output value and a screenwill appear allowing you to change the numberof decimal points.
ScrollingTo scroll the report screens, use the scroll slide on theright of the report or click on the variable name anduse the up and down arrows on the keyboard.
Dietary Energy ConcentrationEnter the digestible energy (DE) or metabolizableenergy (ME) concentration of the diet. DE or MEwould have been selected on the opening screen. Ifyou want to change from DE to ME (or from ME toDE), press ‘‘Exit,’’ select ‘‘DE’’ or ‘‘ME,’’ then returnto the desired model.
Daily Energy IntakeFunctions only when the radio button in the box atthe lower left corner marked ‘‘Enter Dietary EnergyIntake’’ is on ‘‘Yes.’’ When the button is on ‘‘No,’’ thisbox will be blank. If the ‘‘Yes’’ button is on, then enterthe daily DE or ME intake.

172 Nutrient Requirements of Swine
Pig WeightEnter pig weight in kg. If pig weight is below 20 kg,the number of pigs in each gender group and the leangain data will disappear.
Number of Gilts, Barrows, and BoarsEnter the number of each gender. If you want require-ments for barrows only, place a ‘‘1’’ in the box beside‘‘Barrows’’ and a ‘‘0’’ in the other boxes. If you wantrequirements for an average of barrows and gilts, placea ‘‘1’’ in the box beside ‘‘Barrows’’ and a ‘‘1’’ in thebox beside ‘‘Gilts’’ and a ‘‘0’’ in the box beside ‘‘Boars.’’Note that these entries do not apply to pigs less than20 kg body weight.
Lean GainPlace the mean carcass fat-free lean gain in the appro-priate box beside each gender. The lean gain is theaverage over the live weight range of 20 to 120 kg. Itis determined by taking the fat-free lean in the carcassat slaughter, subtracting the estimated fat-free lean inthe carcass at the start, and dividing the difference bythe number of days from start to finish (see Appen-dix 2).
Lean Gain CurveSelect the desired radio button. The standard buttonmarked ‘‘Std’’ uses the model’s default lean growthcurve, and this is ordinarily the one to use. However,if you have information on your herd indicating thatthe lean growth pattern is different from the one usedin the model, your curve can be entered as a quadraticor cubic equation. You will need to use a spreadsheetprogram, such as illustrated in Appendix 3, to generatethe coefficients for a quadratic or cubic equation. Toenter different equations, click on ‘‘User.’’ A screenwill appear and you can enter the coefficients. If youwant to use a quadratic equation, enter a ‘‘0’’ as thefourth coefficient. The new equations can be namedand saved for future use. Up to 99 equations can besaved. Click on the ‘‘Return’’ button to return to themain program.
Space/PigClick on the button if you want to enter the stockingdensity of the pigs, and enter the space per pig insquare meters (1 square meter 4 10.76 square ft).The model will then reduce energy intake if pigs arecrowded. The adjustments in feed intake are not veryprecise, so use with caution. If you do not check thebutton, adjustments are not made for crowding.
TemperatureClick on the button if you want to enter the averageambient temperature (in centigrade) over a 24-hourperiod. The model will adjust energy intake upwards
when pigs are at temperatures below their comfort(thermoneutral) zone and will adjust it downwardwhen they are at temperatures above their comfortzone. The ideal temperature is approximately 26°Cfor 10 kg pigs, 25°C for 20 kg pigs, 23°C for 50 kgpigs, and 20°C for 100 kg pigs. Each 1° deviationfrom the ideal temperature results in an approximateadjustment in daily DE intake of 18, 75, 125, and 175kcal of DE for pigs weighing 5, 20, 50, and 100 kgbody weight, respectively. If you do not check the‘‘Temperature’’ button, adjustments in energy intakewill not be made.
Report Based OnClick on ‘‘% or amount/kg’’ if you want the report togive requirements on a dietary concentration basis (%of diet, mg/kg of diet, etc.). Click on ‘‘Amount/d’’ ifyou want the report to give requirements on a dailybasis (g/d, mg/d, etc.).
ReportsClick on this button to give a screen report of the dataas entered and the nutrient requirements.
Report Buttons A, B, C, D, E, F, G, and Report HeadingClick on button ‘‘A’’ for a report of the data as entered.
Body weight—gives body weight as entered.Space/pig—gives space/pig as entered. If space/pig was not entered, it will show ‘‘**** .’’
Temperature—gives temperature as entered. If tem-perature was not entered, it will show ‘‘**** .’’
Carcass lean gain, 20-120 kg—gives the carcass fat-free lean accretion rate as entered.
Carcass lean tissue gain—gives the carcass fat-freelean tissue accretion rate at the particular weightthat you have chosen, based on the lean growthcurve.
Whole body protein gain—gives the estimated wholebody protein accretion rate at the particular weightthat you have chosen, assuming that 2.55 grams ofcarcass fat-free lean is equivalent to 1 gram of wholebody protein.
Whole body protein tissue gain—gives the whole bodylean tissue accretion rate at the particular weightthat you have chosen. Assumes that whole bodylean tissue is 23% protein.
Whole body fat tissue gain—gives the whole body fattissue accretion rate at the particular weight thatyou have chosen. Assumes that whole body fat tissueis 90% fat.
DE concentration of diet—gives the DE concentra-tion of the diet as entered.
ME concentration of diet—gives the ME concentra-tion of the diet assuming that ME is 96% of DE.
Appendix 5: Help Screens 173
DE intake—gives the DE intake based on the defaultcurves in the model. If you entered DE intake, thenit gives DE intake as entered.
ME intake—gives the ME intake assuming that MEis 96% of DE.
Expected daily feed intake—gives the daily feed intakebased on the DE intake divided by the DE concen-tration of the diet.
Expected daily gain—gives the expected daily gain ofthe pigs. This is determined by adding the dailyaccretion of total body protein tissue and total bodyfat tissue in the body and dividing by 0.94 (whichassumes that 6% of the body weight is gut fill).Protein tissue is dry protein tissue divided by 0.23(assumes that protein is 77% water) and fat tissueis dry fat tissue divided by 0.90 (assumes that fattissue is 10% water).
Expected feed efficiency—gives the expected feed/gain by dividing daily feed intake by daily gain.
Crude protein (corn–soy diet)—gives the crude pro-tein in a mixture of corn and soybean meal thatmeets the lysine requirement. It is based on thefollowing relationship: crude protein (%) 4 5.22` (15.51 2 true digestible lysine, %)
Click on button ‘‘B’’ for the true ileal digestible amino acidrequirements.
Click on button ‘‘C’’ for the apparent ileal digestible aminoacid requirements.
Click on button ‘‘D’’ for the total amino acid requirements,assuming that the diet consists of a mixture of corn andsoybean meal.
Click on button ‘‘E’’ for the mineral requirements.Click on button ‘‘F’’ for the vitamin requirements.Cl ick on button ‘ ‘G’ ’ for the essent ia l fat ty ac id
requirements.Click on ‘‘Report Heading’’ to make a heading for your
report.
Min/MaxClick on this button to give parameter settings for the
input boxes.Click on one of the input boxes.
The screen now shows the name of the input.Set the minimum and maximum values for that
input by pressing the up or down arrows, orby entering the values from the keyboard. Clickon ‘‘Save’’ to save those values.
Set the increment for that input by choosing num-bers in the two boxes marked ‘‘ by thepower of .’’ Insert different numbers andyou will see how the increment changes. Clickon ‘‘Save’’ to save the new increments.
Set the desired number of decimal points for theinput. Click on ‘‘Save’’ to save the decimalsetting.
Click on any other input boxes to make desiredsettings.
When finished, click on the ‘‘Report’’ button.
ConversionsClick on this button to give conversions from metric
to standard U.S. equivalents.Click on one of the input boxes.
The conversions are shown.When finished, click on the ‘‘Report’’ box.
Auto Calc Off and Auto Calc OnClick on this button to toggle between off and on.
When the ‘‘Auto Calc’’ button is off, this buttonwill change to ‘‘Re Calc Grow-Finish Values’’after any changes are made in inputs. The red‘‘Re Calc’’ button must be pressed to give thenew requirement values in the report.
When the ‘‘Auto Calc’’ button is on, the recalcula-tions will occur automatically after any input ischanged. However, this can be time consumingwhen several changes are made or when theup and down arrows are used to incrementbetween values.
ResetClick on this button to reset the model to the defaultvalues that you found when the program was opened.
Feed TablesClick on this button to access the feed compositiontables.
HelpClick on this button to display the help screen.
PreViewClick on this button to preview the printed report.
PrintClick on this button to print the report. If you wantto make a heading for your report, press ‘‘ReportHeading’’ and type a heading. The report will give thesame information that is shown in the screen report.The upper portion shows your inputs and the calcula-tions of various outputs and the lower portion givesthe requirements on a diet concentration and dailybasis. If the outputs are not appropriate for the particu-lar pig weight chosen or if temperature or space/pigwas not an input, the output will display ‘‘**** .’’
ExitClick to exit the program.
G ES TA T IO N M O DE L H E LP SC R EE N
Index
Tabs for Gestation, Lactation, and GrowthInputs and Decimals
174 Nutrient Requirements of Swine
ScrollingDietary Energy ConcentrationDaily Energy IntakeSow Weight at BreedingGestation Weight GainNumber Pigs BornTemperatureReport Based OnReportsReport Buttons A, B, C, D, E, F, G, and Report HeadingMin/MaxConversionsAuto Calc Off and Auto Calc OnResetFeed TableHelpPreViewPrintExit
G ES TA T IO N M O DE L
Tabs for Gestation, Lactation, and GrowthClick on these tabs to go between models.
Inputs and DecimalsInputs can be made in two ways, as follows:
One way is to highlight the input box by clickingthe box with the mouse and sweeping acrossthe value in the box with the mouse buttonheld down or by triple-clicking on the inputbox. Insert the new value from the keyboard,then press ‘‘Enter’’ on the keyboard. The nextcell will then be highlighted and a new valuecan be entered. After all desired values areentered, click on the red ‘‘Re-Calc’’ button.
Another way is to click on the up and down arrowsinside the input box. If you want to change theincrements, press the ‘‘Min/Max’’ button (seeMin/Max section for further instructions).
Decimals can be changed in the input boxes and onthe outputs in the visual and printed reports.
Input boxes—highlight the box by clicking on it, thenclick on the ‘‘Min/Max’’ button (see Min/Max sec-tion for further details).
Outputs—click on the output value and a screen willappear allowing you to change the number of deci-mal points.
ScrollingTo scroll the report screens, use the scroll slide on theright of the report or click on the variable name anduse the up and down arrows on the keyboard.
Dietary Energy ConcentrationEnter the digestible energy (DE) or metabolizableenergy (ME) concentration of the diet. DE or MEwould have been selected on the opening screen. Ifyou want to change from DE to ME (or from ME toDE), press ‘‘Exit,’’ select ‘‘DE’’ or ‘‘ME,’’ then returnto the desired model.
Daily Energy IntakeFunctions only when the radio button in the box atthe lower left corner marked ‘‘Enter Dietary EnergyIntake’’ is on ‘‘Yes.’’ When the button is on ‘‘No,’’ thisbox will be blank. If the ‘‘Yes’’ button is on, then enterthe daily DE or ME intake.
Sow Weight at BreedingEnter the breeding weight of the sow in kg.
Gestation Weight GainEnter the desired weight gain of the sow during gesta-tion. The weight gain includes both the sow body andthe products of conception. Note that an entry cannotbe made in this box if DE or ME intake is an input.When that is the case, gestation weight gain will becalculated by the model.
Litter Size, Total PigsEnter the anticipated size of the litter, total pigs.
TemperatureClick on the button if you want to enter the averageambient temperature (in centigrade) over a 24-hourperiod. The model will adjust energy intake or gesta-tion weight gain when the temperature is below 20°C.Approximately 230 kcal of ME per day is requiredfor each 1° below 20°C. No adjustment is made fortemperatures above 20°C. If you do not check the‘‘Temperature’’ button, an adjustment will not bemade.
Report Based OnClick on ‘‘% or amount/kg’’ if you want the report togive requirements on a dietary concentration basis (%of diet, mg/kg of diet, etc.). Click on ‘‘Amount/d’’ ifyou want the report to give requirements on a dailybasis (g/d, mg/d, etc.).
ReportsClick on this button to give a screen report of the dataas entered and the nutrient requirements.
Report Buttons A, B, C, D, E, F, G, and Report HeadingClick on button ‘‘A’’ for a report of the data as entered.
Sow weight at breeding—gives the breedingweight as entered.
Expected gestation weight gain—gives the gesta-tion weight gain as entered; or gives it as calcu-lated, if DE intake was entered.
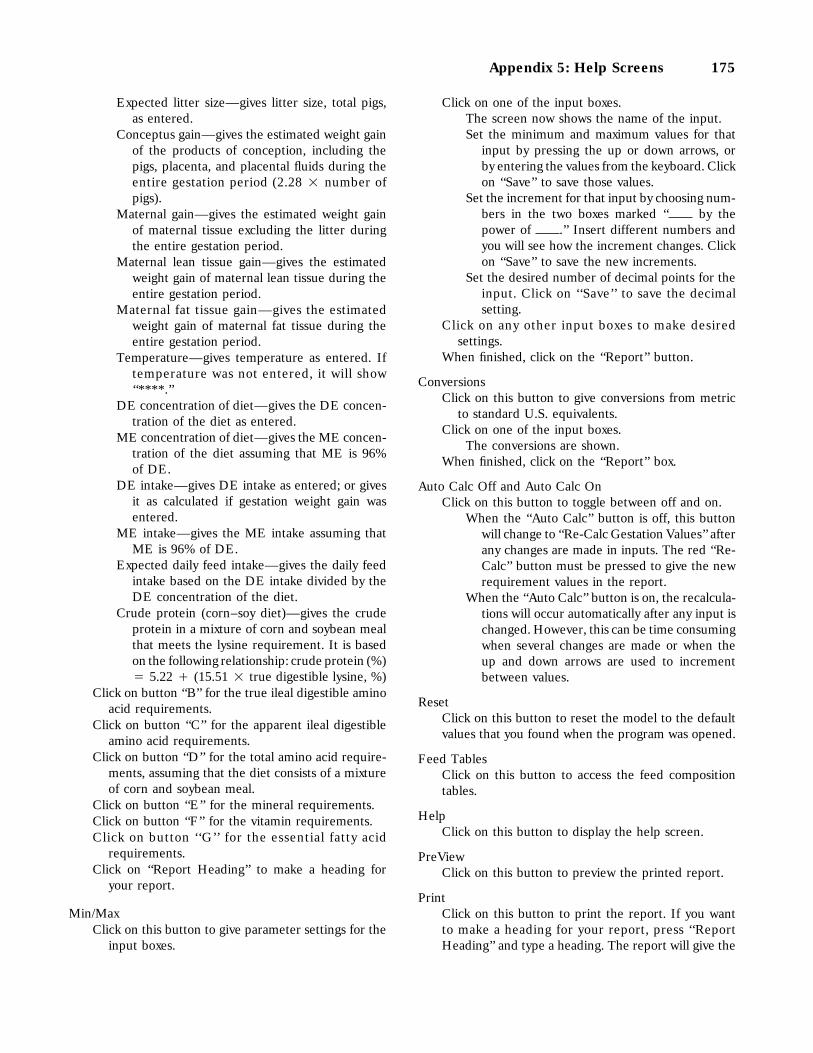
Appendix 5: Help Screens 175
Expected litter size—gives litter size, total pigs,as entered.
Conceptus gain—gives the estimated weight gainof the products of conception, including thepigs, placenta, and placental fluids during theentire gestation period (2.28 2 number ofpigs).
Maternal gain—gives the estimated weight gainof maternal tissue excluding the litter duringthe entire gestation period.
Maternal lean tissue gain—gives the estimatedweight gain of maternal lean tissue during theentire gestation period.
Maternal fat tissue gain—gives the estimatedweight gain of maternal fat tissue during theentire gestation period.
Temperature—gives temperature as entered. Iftemperature was not entered, it will show‘‘**** .’’
DE concentration of diet—gives the DE concen-tration of the diet as entered.
ME concentration of diet—gives the ME concen-tration of the diet assuming that ME is 96%of DE.
DE intake—gives DE intake as entered; or givesit as calculated if gestation weight gain wasentered.
ME intake—gives the ME intake assuming thatME is 96% of DE.
Expected daily feed intake—gives the daily feedintake based on the DE intake divided by theDE concentration of the diet.
Crude protein (corn–soy diet)—gives the crudeprotein in a mixture of corn and soybean mealthat meets the lysine requirement. It is basedon the following relationship: crude protein (%)4 5.22 ` (15.51 2 true digestible lysine, %)
Click on button ‘‘B’’ for the true ileal digestible aminoacid requirements.
Click on button ‘‘C’’ for the apparent ileal digestibleamino acid requirements.
Click on button ‘‘D’’ for the total amino acid require-ments, assuming that the diet consists of a mixtureof corn and soybean meal.
Click on button ‘‘E’’ for the mineral requirements.Click on button ‘‘F’’ for the vitamin requirements.Click on button ‘‘G’’ for the essential fatty acid
requirements.Click on ‘‘Report Heading’’ to make a heading for
your report.
Min/MaxClick on this button to give parameter settings for the
input boxes.
Click on one of the input boxes.The screen now shows the name of the input.Set the minimum and maximum values for that
input by pressing the up or down arrows, orby entering the values from the keyboard. Clickon ‘‘Save’’ to save those values.
Set the increment for that input by choosing num-bers in the two boxes marked ‘‘ by thepower of .’’ Insert different numbers andyou will see how the increment changes. Clickon ‘‘Save’’ to save the new increments.
Set the desired number of decimal points for theinput. Click on ‘‘Save’’ to save the decimalsetting.
Click on any other input boxes to make desiredsettings.
When finished, click on the ‘‘Report’’ button.
ConversionsClick on this button to give conversions from metric
to standard U.S. equivalents.Click on one of the input boxes.
The conversions are shown.When finished, click on the ‘‘Report’’ box.
Auto Calc Off and Auto Calc OnClick on this button to toggle between off and on.
When the ‘‘Auto Calc’’ button is off, this buttonwill change to ‘‘Re-Calc Gestation Values’’ afterany changes are made in inputs. The red ‘‘Re-Calc’’ button must be pressed to give the newrequirement values in the report.
When the ‘‘Auto Calc’’ button is on, the recalcula-tions will occur automatically after any input ischanged. However, this can be time consumingwhen several changes are made or when theup and down arrows are used to incrementbetween values.
ResetClick on this button to reset the model to the defaultvalues that you found when the program was opened.
Feed TablesClick on this button to access the feed compositiontables.
HelpClick on this button to display the help screen.
PreViewClick on this button to preview the printed report.
PrintClick on this button to print the report. If you wantto make a heading for your report, press ‘‘ReportHeading’’ and type a heading. The report will give the
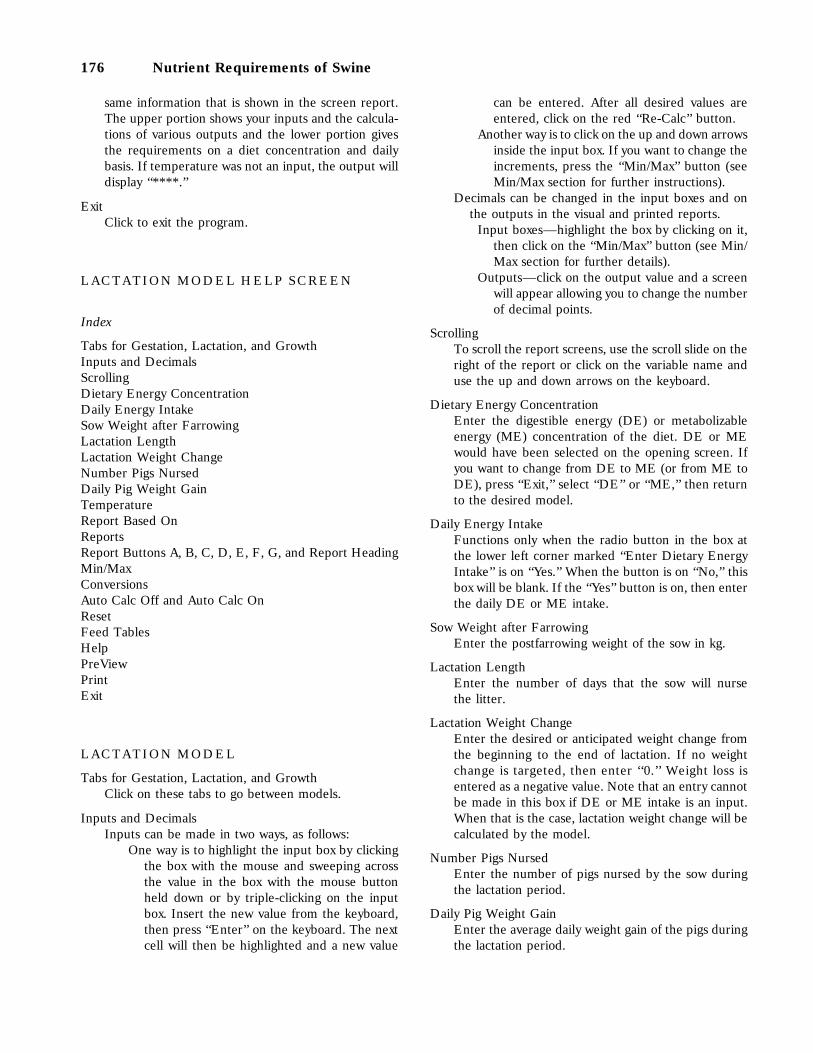
176 Nutrient Requirements of Swine
same information that is shown in the screen report.The upper portion shows your inputs and the calcula-tions of various outputs and the lower portion givesthe requirements on a diet concentration and dailybasis. If temperature was not an input, the output willdisplay ‘‘**** .’’
ExitClick to exit the program.
L AC TA T IO N M O DE L H E LP SC R EE N
Index
Tabs for Gestation, Lactation, and GrowthInputs and DecimalsScrollingDietary Energy ConcentrationDaily Energy IntakeSow Weight after FarrowingLactation LengthLactation Weight ChangeNumber Pigs NursedDaily Pig Weight GainTemperatureReport Based OnReportsReport Buttons A, B, C, D, E, F, G, and Report HeadingMin/MaxConversionsAuto Calc Off and Auto Calc OnResetFeed TablesHelpPreViewPrintExit
L AC TA T IO N M O DE L
Tabs for Gestation, Lactation, and GrowthClick on these tabs to go between models.
Inputs and DecimalsInputs can be made in two ways, as follows:
One way is to highlight the input box by clickingthe box with the mouse and sweeping acrossthe value in the box with the mouse buttonheld down or by triple-clicking on the inputbox. Insert the new value from the keyboard,then press ‘‘Enter’’ on the keyboard. The nextcell will then be highlighted and a new value
can be entered. After all desired values areentered, click on the red ‘‘Re-Calc’’ button.
Another way is to click on the up and down arrowsinside the input box. If you want to change theincrements, press the ‘‘Min/Max’’ button (seeMin/Max section for further instructions).
Decimals can be changed in the input boxes and onthe outputs in the visual and printed reports.
Input boxes—highlight the box by clicking on it,then click on the ‘‘Min/Max’’ button (see Min/Max section for further details).
Outputs—click on the output value and a screenwill appear allowing you to change the numberof decimal points.
ScrollingTo scroll the report screens, use the scroll slide on theright of the report or click on the variable name anduse the up and down arrows on the keyboard.
Dietary Energy ConcentrationEnter the digestible energy (DE) or metabolizableenergy (ME) concentration of the diet. DE or MEwould have been selected on the opening screen. Ifyou want to change from DE to ME (or from ME toDE), press ‘‘Exit,’’ select ‘‘DE’’ or ‘‘ME,’’ then returnto the desired model.
Daily Energy IntakeFunctions only when the radio button in the box atthe lower left corner marked ‘‘Enter Dietary EnergyIntake’’ is on ‘‘Yes.’’ When the button is on ‘‘No,’’ thisbox will be blank. If the ‘‘Yes’’ button is on, then enterthe daily DE or ME intake.
Sow Weight after FarrowingEnter the postfarrowing weight of the sow in kg.
Lactation LengthEnter the number of days that the sow will nursethe litter.
Lactation Weight ChangeEnter the desired or anticipated weight change fromthe beginning to the end of lactation. If no weightchange is targeted, then enter ‘‘0.’’ Weight loss isentered as a negative value. Note that an entry cannotbe made in this box if DE or ME intake is an input.When that is the case, lactation weight change will becalculated by the model.
Number Pigs NursedEnter the number of pigs nursed by the sow duringthe lactation period.
Daily Pig Weight GainEnter the average daily weight gain of the pigs duringthe lactation period.
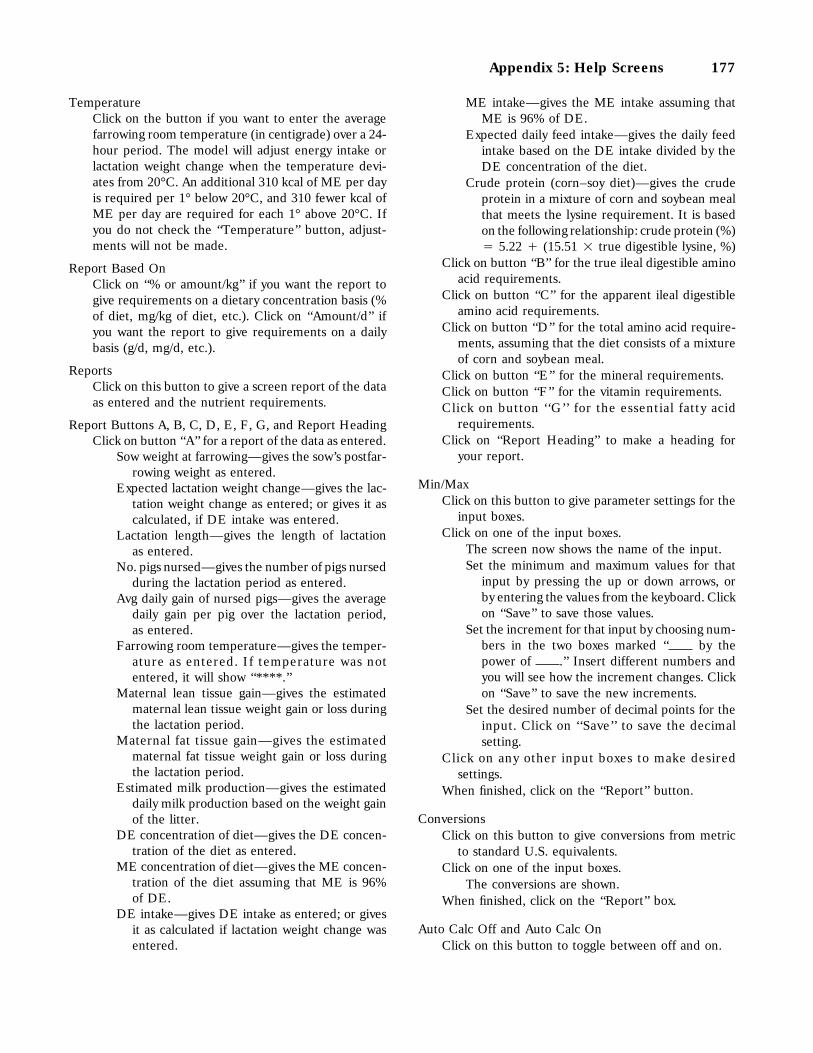
Appendix 5: Help Screens 177
TemperatureClick on the button if you want to enter the averagefarrowing room temperature (in centigrade) over a 24-hour period. The model will adjust energy intake orlactation weight change when the temperature devi-ates from 20°C. An additional 310 kcal of ME per dayis required per 1° below 20°C, and 310 fewer kcal ofME per day are required for each 1° above 20°C. Ifyou do not check the ‘‘Temperature’’ button, adjust-ments will not be made.
Report Based OnClick on ‘‘% or amount/kg’’ if you want the report togive requirements on a dietary concentration basis (%of diet, mg/kg of diet, etc.). Click on ‘‘Amount/d’’ ifyou want the report to give requirements on a dailybasis (g/d, mg/d, etc.).
ReportsClick on this button to give a screen report of the dataas entered and the nutrient requirements.
Report Buttons A, B, C, D, E, F, G, and Report HeadingClick on button ‘‘A’’ for a report of the data as entered.
Sow weight at farrowing—gives the sow’s postfar-rowing weight as entered.
Expected lactation weight change—gives the lac-tation weight change as entered; or gives it ascalculated, if DE intake was entered.
Lactation length—gives the length of lactationas entered.
No. pigs nursed—gives the number of pigs nursedduring the lactation period as entered.
Avg daily gain of nursed pigs—gives the averagedaily gain per pig over the lactation period,as entered.
Farrowing room temperature—gives the temper-ature as entered. If temperature was notentered, it will show ‘‘**** .’’
Maternal lean tissue gain—gives the estimatedmaternal lean tissue weight gain or loss duringthe lactation period.
Maternal fat tissue gain—gives the estimatedmaternal fat tissue weight gain or loss duringthe lactation period.
Estimated milk production—gives the estimateddaily milk production based on the weight gainof the litter.
DE concentration of diet—gives the DE concen-tration of the diet as entered.
ME concentration of diet—gives the ME concen-tration of the diet assuming that ME is 96%of DE.
DE intake—gives DE intake as entered; or givesit as calculated if lactation weight change wasentered.
ME intake—gives the ME intake assuming thatME is 96% of DE.
Expected daily feed intake—gives the daily feedintake based on the DE intake divided by theDE concentration of the diet.
Crude protein (corn–soy diet)—gives the crudeprotein in a mixture of corn and soybean mealthat meets the lysine requirement. It is basedon the following relationship: crude protein (%)4 5.22 ` (15.51 2 true digestible lysine, %)
Click on button ‘‘B’’ for the true ileal digestible aminoacid requirements.
Click on button ‘‘C’’ for the apparent ileal digestibleamino acid requirements.
Click on button ‘‘D’’ for the total amino acid require-ments, assuming that the diet consists of a mixtureof corn and soybean meal.
Click on button ‘‘E’’ for the mineral requirements.Click on button ‘‘F’’ for the vitamin requirements.Click on button ‘‘G’’ for the essential fatty acid
requirements.Click on ‘‘Report Heading’’ to make a heading for
your report.
Min/MaxClick on this button to give parameter settings for the
input boxes.Click on one of the input boxes.
The screen now shows the name of the input.Set the minimum and maximum values for that
input by pressing the up or down arrows, orby entering the values from the keyboard. Clickon ‘‘Save’’ to save those values.
Set the increment for that input by choosing num-bers in the two boxes marked ‘‘ by thepower of .’’ Insert different numbers andyou will see how the increment changes. Clickon ‘‘Save’’ to save the new increments.
Set the desired number of decimal points for theinput. Click on ‘‘Save’’ to save the decimalsetting.
Click on any other input boxes to make desiredsettings.
When finished, click on the ‘‘Report’’ button.
ConversionsClick on this button to give conversions from metric
to standard U.S. equivalents.Click on one of the input boxes.
The conversions are shown.When finished, click on the ‘‘Report’’ box.
Auto Calc Off and Auto Calc OnClick on this button to toggle between off and on.
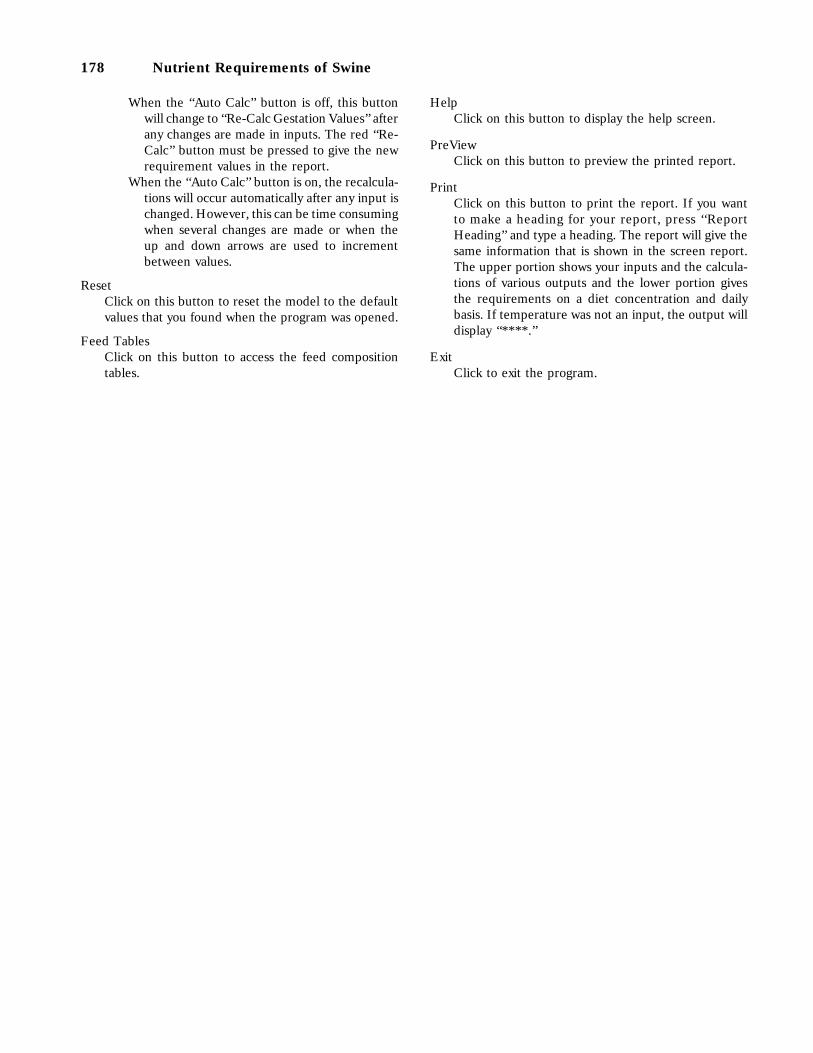
178 Nutrient Requirements of Swine
When the ‘‘Auto Calc’’ button is off, this buttonwill change to ‘‘Re-Calc Gestation Values’’ afterany changes are made in inputs. The red ‘‘Re-Calc’’ button must be pressed to give the newrequirement values in the report.
When the ‘‘Auto Calc’’ button is on, the recalcula-tions will occur automatically after any input ischanged. However, this can be time consumingwhen several changes are made or when theup and down arrows are used to incrementbetween values.
ResetClick on this button to reset the model to the defaultvalues that you found when the program was opened.
Feed TablesClick on this button to access the feed compositiontables.
HelpClick on this button to display the help screen.
PreViewClick on this button to preview the printed report.
PrintClick on this button to print the report. If you wantto make a heading for your report, press ‘‘ReportHeading’’ and type a heading. The report will give thesame information that is shown in the screen report.The upper portion shows your inputs and the calcula-tions of various outputs and the lower portion givesthe requirements on a diet concentration and dailybasis. If temperature was not an input, the output willdisplay ‘‘**** .’’
ExitClick to exit the program.

Authors
Gary L. Cromwell (Chair) is a professor of animal scienceat the University of Kentucky at Lexington. He receivedhis Ph.D. from Purdue University. His research interestsinclude mineral and amino acid nutrition of swine, andefficacy and safety of feed additives.
David H. Baker serves as professor of animal nutritionat the University of Illinois at Urbana–Champaign. Hereceived his Ph.D. in nutrition with a microbiology andbiochemistry minor from the University of Illinois. Hisresearch areas include amino acid nutrition and metabolism.
Richard C. Ewan is a professor of animal science at IowaState University. He received his Ph.D. from the Universityof Wisconsin. Research interests include swine growth,genetic background and selenium status in swine, andnutrient bioavailability in swine.
E. T. Kornegay is a professor of animal science at VirginiaPolytechnic Institute and State University. He receivedhis Ph.D. from Michigan State University. Major areas ofresearch include environmental nutrition, sow and pigletmanagement and nutrition, mineral availability of inorganicand organic sources, and evaluation of feedstuffs for swine.
179
Austin J. Lewis is a professor of animal nutrition at theUniversity of Nebraska. He received his Ph.D. from theUniversity of Nottingham, in the United Kingdom. Hisresearch interests include nutritional requirements ofswine, especially proteins and amino acids.
James E. Pettigrew, a professor of animal science at theUniversity of Minnesota until 1997, recently began his ownconsulting business, Pettigrew Consulting International.He received his Ph.D. from the University of Illinois.Research interests include swine growth and production,modeling, reproduction, and lactation.
Norman C. Steele is research leader for the USDA/ARSGrowth Biology Laboratory in Beltsville, Maryland. Hereceived his Ph.D. in Dairy Science from the Universityof Maryland. Research interests include maternal-fetalnutrient interactions, the effect of dietary energy on proteinutilization, and management factors affecting efficacy ofmetabolism modifiers.
Philip A. Thacker is currently professor of animal scienceat the University of Saskatchewan, Canada. He receivedhis Ph.D. from the University of Alberta. Research interestsinclude swine growth, nontraditional feed sources for usein swine production, and nutrient metabolism in swine.

Index
A
Acid-base status, 50Acid detergent fiber, 8
composition of feed ingredients, 124Acidifiers, 98Activity, 5Additives, feed
acidifiers in, 98anthelmintic, 98antimicrobial, 97–98antioxidants, 99carcass modifiers, 99enzyme, 98flavor, 99flow agents, 99microbial supplements, 98mineral supplements, 99odor control agents, 99oligosaccharide, 98pellet binders, 99regulations, 100safety concerns, 99–100
Aflatoxin, 99Alfalfa
calcium bioavailability, 49phosphorus content, 49
Amino acidsantagonisms, 19bioavailability, 18–19composition of feed ingredients, 124–125deficiencies and excesses, 19dietary requirements, 17, 19–25essential/nonessential, 16–17excretory losses of nutrient and, 104feed analysis, 17gestation requirements, 38
181
growing-finishing pigs, requirements of, 35ileal digestibilities, 18–19, 35–36isomers, 19lactation requirements, 38–40model for predicting requirements, 31–32nutrient requirement tables, 110ratios, 17–18synthesis, 16weanling pig requirements, 40–41See also specific acid
Anemia, iron-deficiency, 54–55Anthelmintic additives, 98Antibiotics, 97, 99–100
water intake and, 93Antimicrobial additives
growth effects, 97–98physiological function, 97safety concerns, 99–100
Antioxidants, 74, 99Arachidonic acid, 9Arginine, 16, 17
deficiencies and excesses, 19Ascorbic acid. See Vitamin CAvidin, 76
B
B vitamins, 71. See also specific B vitaminBarley, pantothenic acid in, 78Barrows, nutrient requirements of, 110Bioavailability
amino acids, 18–19biotin, 75calcium, 49choline, 76copper, 53iron, 54
182 Nutrient Requirements of Swine
phosphorus, 48–49vitamin A, 72vitamin B12, 80–81vitamin C, 81
Biotinbioavailability, 75deficiency, 76requirements, 76
Birth weights, 7copper effects, 53manganese effects, 55vitamin A requirements, 72vitamin B12 effects, 81
Boarsamino acid requirements, 25–26energy requirements, 7–8maintenance requirement, 6mineral requirements, 48water requirements, 93zinc requirement, 56See also Breeding boars
Body protein mass, maintenance requirements, 6Body temperature
energy metabolism, 5See also Thermoregulation
Body weight, metabolic, 6Bone growth
calcium-phosphorus deficiency, 49manganese requirements, 55mineral requirements, 47, 48, 50vitamin D requirements, 73
Breeding boarsamino acid requirements, 25–26chlorine requirements, 50energy requirements, 7–8magnesium requirements, 50mineral requirements, 48nutrient requirement tables, 110semen quality, 25–26sodium requirements, 50zinc requirement, 57
C
Calcitonin, 73Calcium, 47
bioavailability, 49deficiencies/excesses, 49excretion, 103, 104phosphorous ratio, 47, 49requirements, 47–48, 49vitamin D interaction, 73
Carbohydrates, gross energy, 3b-Carotene, 2, 72
Carotenoids, 71, 72Cereal grains
calcium bioavailability, 49phosphorus content, 48See also specific grain
Chemical compositionfeed intake and, 10net energy and, 5predicting digestible energy from, 3–4
Chloride-potassium interaction, 51Chlorine, 47
deficiencies and excesses, 50requirements, 49–50
Cholecalciferol, 73Choline
bioavailability, 76deficiency, 77forms of, 76function, 76–77requirement, 77toxicity, 77
Chromium, 47absorption, 51metabolic function, 51, 52picolinate, 51, 52tolerance, 52
Cobalt, 47, 52Copper, 47, 99
bioavailability, 53deficiencies and excesses, 53excretion, 103–104growth effects, 52, 53requirements, 52
Cornniacin availability, 78pantothenic acid availability, 78phosphorus content, 48riboflavin availability, 79vitamin B6 availability, 80
Corn–soybean meal diet, 105–109Crude fiber, 8Cyanocobalamin. See Vitamin B12
Cysteine, 16–17methionine and, 16–17
Cystinerequirements, 24
D
Defecationwater loss, 91See also Excretion
Deficienciesamino acid, 19
Index 183
arginine, 19biotin, 76calcium, 49chlorine, 50choline, 77copper, 53folacin, 77–78iodine, 53iron, 54–55magnesium, 50niacin, 78pantothenic acid, 79phosphorus, 49potassium, 51riboflavin, 79selenium, 56sodium, 50thiamin, 80vitamin A, 72vitamin B6, 80vitamin B12, 81vitamin D, 73vitamin E, 74vitamin K, 75
Diarrhea, 19Dichlorvos, 98Diet formulation
amino acids in, 17density, 16–17manure management and, 105nutrient composition, 124procedures, 105–109
Digestibilityamino acid bioavailability, 18–19apparent ileal, 18–19, 32–40enzyme additives for, 98fat, 9–10fiber and, 8true ileal, 18–19, 32–40
Digestible energy (DE)calculations, 3–4fiber content of feed and, 8growing-finishing pigs, requirements of, 33–34true/apparent, 3
E
Electrolyte balance, 50, 51Energy
classification, 3–5digestible (DE), 3–4gross, 3heat production, 5metabolizable (ME), 4
net (NE), 4–5nutrient requirement tables, 110optimal protein-to-energy ratio, 9terminology, 3
Energy requirementsboars and gilts, 7–8gestation, 6–7, 36–38growing-finishing pigs, 33–34growth, 6lactation, 6, 7, 38–39maintenance, 5–6model for estimating, 31–32reproduction, 8weanling pigs, 40–41
Energy sourceslipids, 9–10nonstarch polysaccharides, 8–9starch, 8sugars, 8
Environmental temperature, 5diet and, 8water intake and, 92–93water loss and, 91
Ergocalciferol, 73Essential fatty acid requirements, 9Excretion
minimizing nutrient loss, 104–105nutrient losses, 103–104pollution concerns, 103
F
Fatdigestibility, 9–10energy costs of protein retention, 6gestation requirements, 37gross energy, 3lipids, 9–10nutrient composition of feed, 125
Fatty acids, 2digestibility, 9–10essential, 9volatile, 8
Feed intakedeterminants of, 10developmental requirements, 10–11environmental conditions and, 5, 10litter size and birth weight, 6–7water intake and, 92, 93weanling pig, 41
Feedstuffsadditives. See Additives, feedamino acid bioavailability, 18–19amino acid requirements, 17

184 Nutrient Requirements of Swine
calcium-phosphorus content, 47–49energy classification, 3–5expression of energy content, 3fiber content, 8nutrient composition, 124–125vitamin A stability, 72–73vitamin E availability, 73–74vitamin K stability, 75
Fiberdigestibility and, 8–9measuring feed content, 8
Flavoring agents, 99Flow agents, 99Folacin
deficiency, 77–78, 81function, 77requirement, 77
Fructose, 8
G
Gestationamino acid requirements, 25, 38biotin effects, 76calcium-phosphorus requirements, 48chlorine requirements, 50copper requirements, 52, 53dietary fat during, 10energy requirements, 6–7, 36–38feed intake, 6–7, 11folacin effects, 77iodine intake, 54iron levels, 54magnesium requirements, 50maintenance requirements, 37, 38manganese requirements, 55nutrient requirement modeling, 44nutrient requirement tables, 110riboflavin requirement, 79selenium effects, 55sodium requirements, 50thermoregulation in, 37–38vitamin A requirements, 72vitamin B6 requirement, 80vitamin C effects, 81vitamin D requirements, 73vitamin E requirements, 74water requirements, 93weight gain, 6, 7, 36–37zinc requirement, 57See also Birth weights; Litter size
Giltsenergy requirements, 7–8mineral requirements, 48
nutrient requirement tables, 110zinc requirement, 56
Glucose, 8chromium and, 51
Glutamine, 17Glutathione peroxidase, 56Gross energy (GE), 3Growing-finishing pigs
amino acid requirements, 17, 24–25, 32–36biotin effects, 76calcium-phosphorus requirements, 47–49chlorine requirements, 50energy requirements, 33–34feed intake, 10magnesium requirements, 50niacin requirements, 78nutrient requirement tables, 110selenium requirement, 55sodium requirements, 50thiamin requirements, 79vitamin A requirements, 72water requirements, 92–93
Growthantimicrobial effects, 97–98biotin effects, 76boars and gilts, 7calcium requirements, 47–49cobalt and, 52, 53copper effects, 52, 53energy requirements, 6energy sources for, 8–10folacin effects, 77–78iron requirements, 54lipid requirements, 9manganese requirements, 55nutrient requirement variables, 31phosphorus requirements, 47–49potassium requirements, 51riboflavin requirement, 79thiamin requirement, 79vitamin A requirements, 72water requirements, 92zinc requirement, 56, 57
H
Heat increment (HI), 4Heat production, 5Histidine, 17
requirements, 24Hypervitaminosis
vitamin A, 72vitamin D, 73
Index 185
I
Ideal protein, 17Ileal digestibilities, 18–19
amino acid requirements, 35–36composition of feed ingredients, 124lysine, 34–35true/apparent, 18–19, 124
Infectious organisms in water, 93–95Intake. See Feed intakeIodine, 47, 53–54Iron, 47
bioavailability, 54deficiencies, 54–55excretion, 103–104function, 54hemoglobin levels, 54niacin availability and, 78requirements, 54toxicity, 55
Ivermectin, 98
L
Lactationamino acid ratios, 17amino acid requirements, 25, 38, 39–40antimicrobial effects, 97biotin effects, 76calcium-phosphorus requirements, 48chlorine requirements, 50choline effects, 77copper effects, 53dietary fat during, 10energy requirements, 6, 7, 38–39feed intake, 11folacin effects, 77iodine intake, 54iron levels, 54magnesium requirements, 50manganese requirements, 55nutrient requirements, 38, 44, 110riboflavin requirements, 79sodium requirements, 50vitamin B6 requirements, 80vitamin B12 requirements, 81vitamin D requirements, 73vitamin E requirements, 74water requirements, 93zinc requirements, 57
Lactose, 8Leucine, 19Linoleic acid, 9
requirements, 110Lipids, 9–10. See also Fat
Litter size, 6–7choline effects, 76–77chromium and, 52folacin effects, 77vitamin A requirements, 72vitamin B12 effects, 81
Lysinedeficiencies and excesses, 19gestation requirements, 38growing-finishing pig requirements, 32–35growth model, 42–44isomers, 19lactation requirements, 39–40requirements, 19–26weanling pig requirements, 40–41
M
Magnesium, 47deficiencies and excesses, 50excretion, 103–104requirements, 50
Maintenanceamino acid ratios, 17body protein mass and, 6energy metabolism, 4–5in gestation, 6–7, 37growing-finishing pigs, 32in lactation, 6, 7, 39metabolizable energy requirements, 5–6net energy requirements, 5–6
Manganese, 55excretion, 103–104
Manurehealth concerns in distribution of, 103nutrient content, 103odor control agents, 99total production management, 105
Mastitis-metritis-agalactia complex, 74Meat and bone as feed, 49Menadiones, 75Menaquinones, 75Metabolic body weight, 6Metabolizable energy (ME), 4
gestation requirements, 37–38for maintenance, 5–6
Methionine, 17choline and, 77cysteine and, 16–17isomers, 19requirements, 24, 25–26
Microbial supplements, 98Milk composition
fat content, 10

186 Nutrient Requirements of Swine
iron, 54vitamin E, 74
Milk productionenergy requirement, 7lysine requirement, 39–40protein requirement, 17, 18See also Lactation
Mineralscomposition of feed ingredients, 125feed additives, 99function, 47predictive modeling, 41–42requirements, 47, 110toxicity, 47See also specific mineral
Modelevaluation of, 42–44gestating sow, 36–38growing-finishing, 32–36lactating sow, 38–41principles for development, 31
Modeling, mathematical, 1. See also Appendixesamino acid requirements, 31–35energy requirements, 32–34
Muscle growth, 6
N
Net energy (NE), 4–5composition of feed ingredients, 124maintenance requirements, 6
Neutral detergent fiber, 8composition of feed ingredients, 124
Niacin, 78Nicotinamide, 78Nicotinate, 51, 52Nicotinic acid, 78Nitrates/nitrites, in water, 94Nitrogen
excretion, 17, 103, 104metabolizable energy, 4minimizing excretory losses, 104–105pollution prevention, 103urea supplements, 16
Nutrient requirementsbarrows, 113–114boars, 123gestating sows, 117–118, 121–122gilts, 113–114growing pigs, 112–113, 115–116lactating sows, 119–122
O
Oats, niacin availability, 78
Oils, 9, 125Oilseed meal, phosphorus content, 48–49Oligosaccharide additives, 98Osteochondrosis, 81Osteomalacia, 49
P
Pantothenic acid, 78–79Parakeratosis, 57Paralysis, posterior, 49Parasite control, 98Pellet binders, 99Phenylalanine, 17
and tyrosine, 17–19Phosphorus, 47
bioavailability, 48–49calcium ratio, 47, 49composition of feed ingredients, 124deficiencies/excesses, 49excretion, 103, 104inorganic, 49in manure, 103minimizing excretory losses, 104–105phytate, 49pollution prevention, 103requirements, 47–49sources, 48–49
Phylloquinones, 75Phytase, 48–49, 98, 104Phytic acid, 49, 56, 98Pigs. See Barrows; Boars; Breeding boars; Gilts;
Growing-finishing pigs; Sows; Starting pigs;Suckling pigs; Weanling pigs
Polysaccharides, nonstarchenergy sources, 8–9
Postweaning pigscouring, 57zinc requirement, 57
Potassium, 47deficiencies and excesses, 51dietary function, 51excretion, 103–104mineral interactions, 51requirements, 50, 51
Predicting nutrient requirementsamino acids, 31–32digestible energy, 3–4minerals, 41–42vitamins, 41–42
Pregnancy. See GestationProline, 16Protein
accretion, 17, 18
Index 187
body tissue, 18definition, 16digestibility, 8–9energy ratio, 9excretory losses of nutrient and, 104gestation requirements, 37, 38gross energy, 3in growing-finishing pigs, 32–35ideal, 17retention, energy costs of, 6sources, 17, 49See also Amino acids
Pyridoxal, 80Pyridoxal phosphate, 80Pyridoxamine, 80Pyridoxine, 80Pyridoxines. See Vitamin B6
R
Regulations, 100Reproduction
antimicrobial effects, 97choline effects, 76–77pantothenic acid requirements, 79vitamin B12 requirements, 81
Resistance to antimicrobials, 99–100Respiration, water loss in, 90Retinoids, 71–72Retinol, 71–72Retinyl palmitate, 72Riboflavin, 79Rickets, 49, 73
S
Salt, 50water intake and, 93, 95
Sarsaponin, 99Selenium, 47, 55–56Sexual behavior. See Breeding boars; ReproductionSodium, 47
deficiencies and excesses, 50excretion, 103–104potassium interaction, 51requirements, 49–50
Somatotropin, 48Sorghum
niacin availability, 78pantothenic acid availability, 78
Sowsamino acid requirements, 25See also Gestation; Lactation
Soybean meal
corn-soybean meal diet, 105–109iron availability, 54niacin availability, 78pantothenic acid availability, 78riboflavin availability, 79vitamin B6 availability, 80
Starch, 8Starting pigs
amino acid requirements, 19–24nutrient requirement tables, 110
Suckling pigscreep feed consumption, 10, 91feed intake, 10iron requirements, 54magnesium requirements, 50selenium requirement, 55vitamin C requirements, 81water requirements, 91–92
Sucrose, 8Sugars, 8Sulfa drugs, 78Sulfates, in water, 94Sulfur, 47, 51Sulfur amino acids, 16–17, 51
boar requirements, 25cysteine-methionine, 16–17
Sweating, 91Swine. See Pigs
T
Temperature effectsenergy metabolism, 5feed intake, 8, 10moisture loss, 90–91protein accretion, 34vitamin E stability, 74water consumption, 92–93
Thermoregulationin gestation, 37–38in lactation, 39
Thiamin, 79–80Thiaminase, 80Threonine
gestation requirements, 38isomers, 19requirements, 24
Thyroid disorders, 53Thyroxine, 53Tocopherols, 73–74Tocotrienols, 73Total dissolved solids, 93–95Toxicity
chromium, 52
188 Nutrient Requirements of Swine
cobalt, 52copper, 53iron, 55magnesium, 50manganese, 55minerals, 47potassium, 51selenium, 56sodium, 50vitamin A, 71, 72vitamin D, 71, 73vitamin E, 74zinc, 57
Trace minerals, 47See also specific mineral, 47
Tryptophan, 17isomers, 19niacin requirements and, 78requirements, 24
Tyrosine, 17
U
Urea, 16Urination
energy losses, 4water loss, 91See also Excretion
V
Valinelactation requirements, 40requirements, 24
Vitamin Abioavailability, 72deficiencies, 72in feeds, 72–73function, 71requirements, 72retinol equivalents, 71–72toxicity, 72vitamin E interaction, 74
Vitamin B6, 80Vitamin B12, 52
bioavailability, 80–81deficiency, 81function, 80requirements, 71, 81sources, 80
Vitamin Cbioavailability, 81function, 81requirements, 82
Vitamin Din calcium-phosphorus metabolism, 47deficiency, 73forms of, 73function, 73metabolism, 73requirements, 73toxicity, 73
Vitamin E, 55composition of feed ingredients, 124deficiency, 74forms of, 73–74function, 74requirements, 74toxicity, 74
Vitamin Kdeficiency, 74–75forms of, 75function, 74–75requirements, 75stability in feeds, 75toxicity, 75
Vitaminscomposition of feed ingredients, 124fat-soluble, 71function, 71nutrient requirement tables, 110predictive modeling of requirements, 41–42toxicity, 71water-soluble, 71See also specific vitamin
Volatile fatty acids, 8
W
Waterchlorination, 94–95functions of, 90hardness, 94–95nitrate concentration, 94pH, 94physiological function, 90quality, 93–95requirements, 91–93research needs, 90respiration loss, 90sulfates in, 94temperature, 92–93total dissolved solids, 93–94turnover, 90–91
Weanling pigsamino acid requirements, 40–41calcium-phosphorus requirements, 47–49energy requirements, 40–41

Index 189
feed intake, 10magnesium requirements, 50nutrient requirement tables, 110selenium requirement, 55survival, sow’s fat intake and, 10water requirements, 91–92
Weight gainin gestating sow, 6, 7, 36–37vitamin C effects, 81
Wheatniacin availability, 78pantothenic acid availability, 78phosphorus content, 48
ZZeolite, 99Zinc, 47, 56–57, 99
excretion, 103–104
Recent Publications of the Board on Agriculture
Policy and ResourcesForested Landscapes in Perspective: Prospects and Opportunities for Sustainable Management of America’s Nonfederal Forests 264 pp.,
ISBN 0-309-05641-1Precision Agriculture in the 21st Century: Geospatial and Information Technologies in Crop Management (1997), 149 pp., ISBN
0-309-05893-7Wood in Our Future: The Role of Life-Cycle Analysis, (1997), 147 pp., ISBN 0-309-5745-0Colleges of Agriculture at the Land Grant Universities: Public Service and Public Policy, (1996), 120 pp., ISBN 0-309-05433-8Ecologically Based Pest Management: New Solutions for a New Century (1996), 152 pp., ISBN 0-309-05330-7Colleges of Agriculture at the Land Grant Universities: A Profile (1995), 146 pp., ISBN 0-309-05295-5Investing in the National Research Initiative: An Update of the Competitive Grants Program in the U.S. Department of Agriculture
(1994), 66 pp., ISBN 0-309-05235-1Rangeland Health: New Methods to Classify, Inventory, and Monitor Rangelands (1994), 180 pp., ISBN 0-309-04879-6Soil and Water Quality: An Agenda for Agriculture (1993), 516 pp., ISBN 0-309-04933-4Managing Global Genetic Resources: Agricultural Crop Issues and Policies (1993), 450 pp., ISBN 0-309-04430-8Pesticides in the Diets of Infants and Children (1993), 408 pp., ISBN 0-309-04875-3Managing Global Genetic Resources: Livestock (1993), 294 pp., ISBN 0-309-04394-8Sustainable Agriculture and the Environment in the Humid Tropics (1993), 720 pp., ISBN 0-309-04749-8Agriculture and the Undergraduate: Proceedings (1992), 296 pp., ISBN 0-309-04682-3Water Transfers in the West: Efficiency, Equity, and the Environment (1992), 320 pp., ISBN 0-309-04528-2Managing Global Genetic Resources: Forest Trees (1991), 244 pp., ISBN 0-309-04034-5Managing Global Genetic Resources: The U.S. National Plant Germplasm System (1991), 198 pp., ISBN 0-309-04390-5Sustainable Agriculture Research and Education in the Field: A Proceedings (1991), 448 pp., ISBN 0-309-04578-9Toward Sustainability: A Plan for Collaborative Research on Agriculture and Natural Resource Management (1991), 164 pp., ISBN
0-309-04540-1Investing in Research: A Proposal to Strengthen the Agricultural, Food, and Environmental System (1989), 156 pp., ISBN 0-309-04127-9Alternative Agriculture (1989), 464 pp., ISBN 0-309-03985-1Understanding Agriculture: New Directions for Education (1988), 80 pp., ISBN 0-309-03936-3Designing Foods: Animal Product Options in the Marketplace (1988), 394 pp., ISBN 0-309-03798-0; ISBN 0-309-03795-6 (pbk)Agricultural Biotechnology: Strategies for National Competitiveness (1987), 224 pp., ISBN 0-309-03745-XRegulating Pesticides in Food: The Delaney Paradox (1987), 288 pp., ISBN 0-309-03746-8Pesticide Resistance: Strategies and Tactics for Management (1986), 480 pp., ISBN 0-309-03627-5Pesticides and Groundwater Quality: Issues and Problems in Four States (1986), 136 pp., ISBN 0-309-03676-3Soil Conservation: Assessing the National Resources Inventory, Volume 1 (1986), 134 pp., ISBN 0-309-03649-9; Volume 2 (1986), 314 pp.,
ISBN 0-309-03675-5New Directions for Biosciences Research in Agriculture: High-Reward Opportunities (1985), 122 pp., ISBN 0-309-03542-2Genetic Engineering of Plants: Agricultural Research Opportunities and Policy Concerns (1984), 96 pp., ISBN 0-309-03434-5
Nutrient Requirements of Domestic Animals Series and Related TitlesThe Role of Chromium in Animal Nutrition (1997), 80 pp., 0-309-06354-XNutrient Requirements of Beef Cattle, Seventh Revised Edition (1996), 241 pp., ISBN 0-309-05426-5; disk includedBuilding a North American Feed Information System (1995), 70 pp.Nutrient Requirements of Laboratory Animals, Fourth Rev. Ed. (1995)., 176 pp., ISBN 0-309-05126-6Metabolic Modifiers: Effects on the Nutrient Requirements of Food-Producing Animals (1994), 81 pp., ISBN 04997-0Nutrient Requirements of Poultry, Ninth Revised Edition (1994), ISBN 0-309-04892-3Nutrient Requirements of Fish (1993), 108 pp., ISBN 0-309-04891-5Nutrient Requirements of Horses, Fifth Revised Edition (1989), 128 pp., ISBN 0-309-03989-4; diskette includedNutrient Requirements of Dairy Cattle, Sixth Revised Edition, Update 1989 (1989), 168 pp., ISBN 0-309-03826-X; diskette includedVitamin Tolerance of Animals (1987), 105 pp., ISBN 0-309-03728-XPredicting Feed Intake of Food-Producing Animals (1986), 95 pp., ISBN 0-309-03695-XNutrient Requirements of Cats, Revised Edition (1986), 87 pp., ISBN 0-309-03682-8Nutrient Requirements of Dogs, Revised Edition (1985), 79 pp., ISBN 0-309-03496-5Nutrient Requirements of Sheep, Sixth Revised Edition (1985), 106 pp., ISBN 0-309-03596-1
Further information, additional titles (prior to 1984), and prices are available from the National Academy Press, 2101 Constitution Avenue,NW, Washington, DC 20418, 202-334-3313 (information only); 800-624-6242 (orders only); 202-334-2451 (fax).