Construct measurement in information systems research: an illustration in strategic systems
18
CONCEPTS, THEORY, AND TECHNIQUES Construct Measurement in Information Systems Research: An Illustration in Strategic Systems Vijay Sethi Departmenl of Managemenr Science and Syslcms. Smre University of New York at Buffalo, Buffalo, NY 14260 William R. King KaR Graduate School of Business, University of Pinsburgh, Pinsburgh. PA 15260 ABSTRACT Thrs study seeks to tughlight construct measurement issues in dormatiori systems (IS) research It describes the normative process of COnstNCi measurement and identifies the dlfficult problems involved in measurement and some ways in wtuch these difficulties may be overcome. An illustrative construct-operationalization study in the area of strategic systems outlines how the normative guidelines may be applied to IS. Some specific recommendations for IS mclude developing a prelunuury model of the construct even if there is little previous measurement research, devoting greater attention to predictive validity because a lack of theories in IS precludes the enammation of nomological validity. vcnfying the assumptions underlying the computation of an overall index. arid examining the meas- urement properties of he index. Subject has: InfomaUon Managemen4 Management Informorion Sysfcms and Stnafegy and Po@, INTRODUCTION Issues related to research methodology increasingly occupy a central role in the field of information system (IS). It is becoming clear that greater attention to methodological issues is essential for the evolvement of the field into a discipline. Many efforts have been made to define and distinguish IS from other disci- plines [18] [28] [31] [58] [63]. However, the field is still criticized for a lack of theories [61], the absence of a paradigm [21] [88], and for being an eclectic collection of diverse fields [40]. Recently, in a comprehensive review of IS litera- ture from 1981 through 1985, Cooper [15] noted that the field has made more progress in identifying research questions than in answering them. Further, hs is true largely because methodological problems such as poor implementation of empirical studies, poor choice of methodology, and lack of a theoretical foundation continue to plague the field of IS. Tlus criticism is particularly distressing because eight years ago Keen [42] made similar observations and called for the creation of a cumulative tradition of research in which researchers build on each others' and their own previous work and share definitions, concepts, and methodologies. Many recent studies have directed attention to ways of improving the quality of IS research. In a review of the relative strengths and weaknesses of thirteen different methodologies that have been applied to IS. Jenkins [37] emphasized the importance of selecting an appropriate research methodology. In the same vein, other researchers sought to describe and evaluate specific methodologies such as action research [2], case studies [6], and qualitative methods [27]. The time frame over which data are collected through these methodologies also merits greater consideration and, according to Vitalari [86], IS research should make greater use of longitudinal designs. Research would also benefit if the nature of data that are 455
-
Upload
independent -
Category
Documents
-
view
1 -
download
0
Transcript of Construct measurement in information systems research: an illustration in strategic systems
CONCEPTS, THEORY, AND TECHNIQUES
Construct Measurement in Information Systems Research: An Illustration in Strategic Systems Vijay Sethi Departmenl of Managemenr Science and Syslcms. Smre University of New York at Buffalo, Buffalo, NY 14260
William R. King KaR Graduate School of Business, University of Pinsburgh, Pinsburgh. PA 15260
ABSTRACT Thrs study seeks to tughlight construct measurement issues in dormatiori systems (IS) research
It describes the normative process of COnstNCi measurement and identifies the dlfficult problems involved in measurement and some ways in wtuch these difficulties may be overcome. An illustrative construct-operationalization study in the area of strategic systems outlines how the normative guidelines may be applied to IS. Some specific recommendations for IS mclude developing a prelunuury model of the construct even if there is little previous measurement research, devoting greater attention to predictive validity because a lack of theories in IS precludes the enammation of nomological validity. vcnfying the assumptions underlying the computation of an overall index. arid examining the meas- urement properties of h e index.
Subject h a s : InfomaUon Managemen4 Management Informorion Sysfcms and Stnafegy and Po@,
INTRODUCTION
Issues related to research methodology increasingly occupy a central role in the field of information system (IS). It is becoming clear that greater attention to methodological issues is essential for the evolvement of the field into a discipline.
Many efforts have been made to define and distinguish IS from other disci- plines [18] [28] [31] [58] [63]. However, the field is still criticized for a lack of theories [61], the absence of a paradigm [21] [88], and for being an eclectic collection of diverse fields [40]. Recently, in a comprehensive review of IS litera- ture from 1981 through 1985, Cooper [15] noted that the field has made more progress in identifying research questions than in answering them. Further, h s is true largely because methodological problems such as poor implementation of empirical studies, poor choice of methodology, and lack of a theoretical foundation continue to plague the field of IS. Tlus criticism is particularly distressing because eight years ago Keen [42] made similar observations and called for the creation of a cumulative tradition of research in which researchers build on each others' and their own previous work and share definitions, concepts, and methodologies.
Many recent studies have directed attention to ways of improving the quality of IS research. In a review of the relative strengths and weaknesses of thirteen different methodologies that have been applied to IS. Jenkins [37] emphasized the importance of selecting an appropriate research methodology. In the same vein, other researchers sought to describe and evaluate specific methodologies such as action research [2], case studies [6], and qualitative methods [27]. The time frame over which data are collected through these methodologies also merits greater consideration and, according to Vitalari [86], IS research should make greater use of longitudinal designs. Research would also benefit if the nature of data that are
455
456 Decision Sciences [Vol. 22
collected is both qualitative and quantitative, as shown by Kaplan and Duchon [39]. Other proposals include a more rigorous examination of construct validity [30] and internal validity [36].
This study seeks to highlight and illustrate the important and difficult issues related to construct measurement in IS research. Construct measurement is the assignment of numerals to a concept (a word that expresses an abstraction formed by a generalization from particulars) that has been deliberately and consciously invented or adopted for a special scientific purpose [43]. Measures must be reliable; that is, they must not vary unreasonably because of irrelevant factors (such as the way questions are asked), respondent fatigue, and the like. In addition, measures must be valid; that is, they must truly measure the variables they are intended to measure. The development of measures which have been tested for reliability and validity is a critical requirement for the advancement of knowledge in the social sciences [72]. This realization is prompting research in different social science disciplines (such as marketing and strategic management [67] [85]) to closely examine the quality of their measures. This study intends to do the same in IS.
This study fvst undertakes a critical evaluation of construct identification and operationalization efforts in some previous IS studies. It then describes the norma- tive process of construct measurement and identifies the difficult problems involved in measurement and some ways in which these difficulties may be over- come. An illustrative construct-operationalization study is described to demonstrate some ways of rigorously examining the domain of the construct, the validity of measures (especially a largely ignored aspect-predictive validity), the assump- tions underlying the process of combining several indicators to compute a summary score or index. and the measurement properties of the index.
The objective is to focus attention on the need and to increase concern for measurement research in IS, and to bring greater rigor to construct-operationaliza- tion efforts, especially in the area of strategic systems or systems for competitive advantage [46]. It is believed that the normative construct measurement procedure that is described and illustrated here would be very helpful for future research. It should further enable researchers and practitioners to reevaluate past results from a methodological perspective. The resulting identification of reliable and valid research findings would serve to improve the basis, and ultimately the effective- ness, of decision making.
This study would also benefit research related to the use of IS for Competitive advantage, a very important area where measurement is vastly underdeveloped. This deficiency has been noted by many studies including Parsons [65]. who pointed out a lack of commonly accepted guidelines or measurement frameworks; Treacy [83], who outlined the critical importance of clearly defining theoretical concepts and operationalizing them in reliable and valid ways; and Wiseman [91], who included measurement in his agenda of issues which need to be addressed in this area. Addressing this deficiency offers a real opportunity for IS to begin developing a cumulative tradition.
A REVIEW OF CONSTRUCT MEASUREMENT IN INFORMATION SYSTEMS RESEARCH
A number of reviews have noted that the usefulness of results in many IS areas has been undermined by a lack of well-defined constructs and measures.
19911 Sethi and King 457
For instance, Ives and Olson [33] reviewed research in the area of user in- volvement in systems development and concluded that because of weak construct measures, the benefits of involvement have not been convincingly demonstrated. Huber [30] similarly pointed out that in cognitive-style IS research, results were inconclusive because of neglect in assessing psychometric properties such as reli- ability and validity. Likewise, the usefulness of IS implementation research has been compromised by a lack of core constructs, making it difficult to build a cumulative body of knowledge [25] [54]. Measurement issues have also been inadequately addressed in the areas of information requirements determination [ 151 and information presentation formats [36].
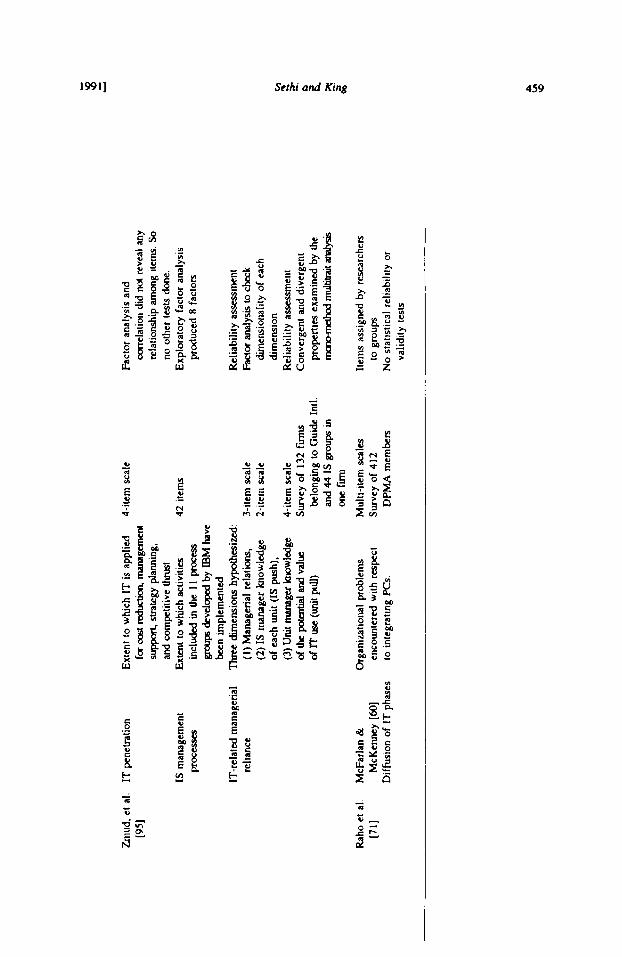
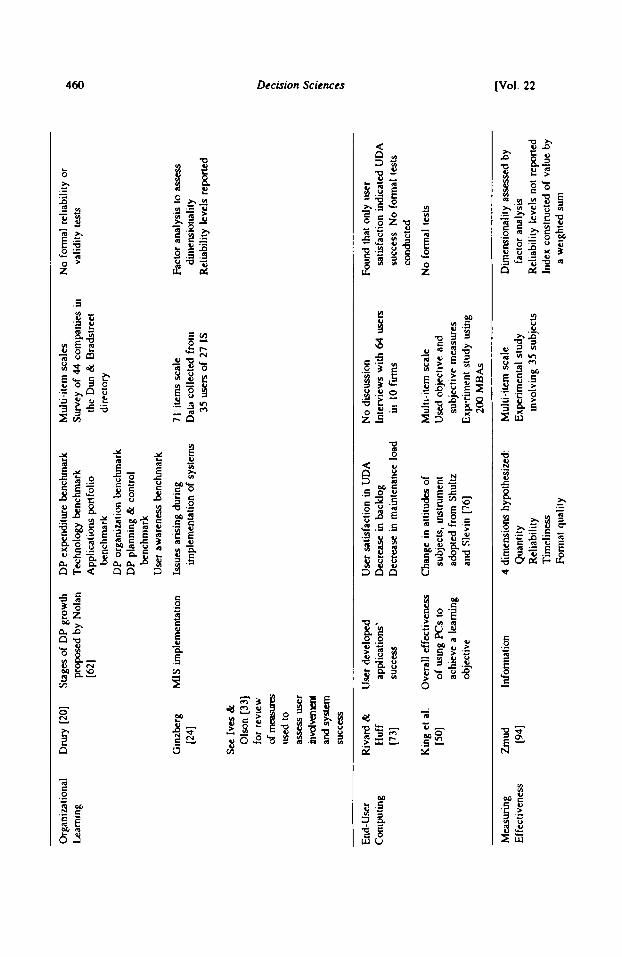
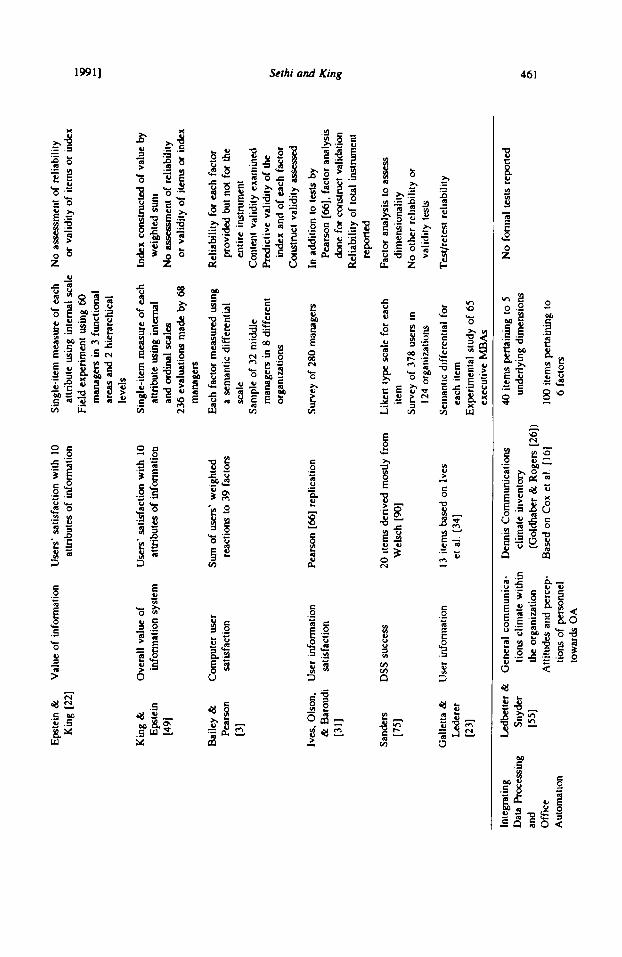
Table 1 presents additional evidence of this problem. It shows the results of a critical examination of past construct operationalization efforts undertaken by some major empirical studies in areas corresponding to the top ten IS issues iden- tified by Brancheau and Wetherbe [9]. The data in Table 1 show that, except for the construct ”user mformation satisfaction,” there has been a lack of cumulative effort in developing construct measures in IS. Further, studies sometimes do not formulate operational d e f ~ t i o n s and often do not carry out formal tests to assess a construct’s properties, especially predictive validity. Also, while constructing an index by summing related items is a common approach, few studies examine or jusafy the appropriateness of doing so even though it requires the use of simple p e - dures [47]. This raises doubts regarding the validity of using linear models [89].
On the other hand, it is encouraging to see some use of multiple-item scales rather than single-item measures, which have numerous limitations. Recent studies seem to be paying greater attention to construct measurement, as evident from Raghunathan and King [70] and Zmud. Boynton, and Jacobs [95].
THE CONSTRUCT MEASUREMENT PROCESS
Construct measurement in social science is a difficult process that requires an iterative approach. It is a learning process which is lengthy, costly, and feasible only when costs can be spread over several studies [36].
There are three different ways of obtaining the measures of a construct [82]: ( 1) fundamental measurement, where numbers are assigned according to natural laws to represent the construct (e.g., the measurement of volume or length); (2) derived measurement, in which a construct is measured by relating it through laws to other constructs (e.g., density is measured by a ratio of mass to volume); and (3) measurement by fiat, where a construct is measured by arbitrary definition. Measurement by fiat is undertaken when there exists a common-sense concept that on a-priori grounds seems to be important but for which there are no direct meas- ures. Most constructs in the social and behavioral sciences and in IS involve measurement by fiat.
In measurement by fiat, one or more observable construct properties are se- lected and their simple/weighted sum is taken as a measure of the construct. The difficulty with this process is that construct measures may be defined in a multitude of different ways. To develop measures that have desirable reliability and validity properties, Churchill [ 131 recommended an eight-step procedure.
Step I. Specify Domain ofthe Construct. The first step in operationalizing a construct is to delineate its domain constitutively and operationally [43]. A consti- tutive definition is one which defines a construct with other constructs (e.g.,

Tabl
e 1:
Rev
iew
of s
tudies in
volving c
onst
ruct
ope
ratio
naliz
atio
n.
Aut
hors
and
co
nslru
cts
Ope
ratio
nal D
efin
ition
D
escr
iptio
n of Measures
Form
al M
easu
rem
ent
Area
R
efer
ence
s O
pera
tiona
lized
of
lhe
con
slru
ct
and
Met
hodo
lopy
T
esb
Car
ried
Out
Stra
tegi
c R
aghu
nath
an
IS s
trate
gic
plan
ning
B
ased
on
Anl
hony
[I]
M
ultip
le-it
em L
ikcr
f sca
les
Rel
iabi
lity
anal
ysis
Pl
anni
ng
& K
ing
Kin
g &
Rod
rigue
z [5
I]
Surv
ey o
f 14
0 co
mpa
rues
C
onte
nt v
alid
ity
1701
us
ing
mat
ched
-pai
r In
dex
by s
umm
ing
IS s
yste
ms
plan
ning
K
ing
& S
riniv
asan
[52
] qu
estio
nnai
res
Deg
ree
of p
lan
Perf
orm
ance
User s
atis
fact
ion [MI
Kin
g &
Srin
ivas
an [
52]
impl
emen
tatio
n
Sulli
van
Infu
sion
of
IT
Exte
nt to
whi
ch IT
has
N
o di
scus
sion
N
o di
scus
sion
“1
pene
trate
d th
e fu
m in
term
s of
its im
porta
nce,
impa
ct o
r si
gnifi
canc
e.
dccenfnlizcd, d
mm
inac
ad, a
scat
tere
d th
roug
hout
the fm
Sw
ey of
37 U.S. co
mpa
nies
Diff
usio
n of
IT
Exte
nt to
whi
ch IT
has
bee
n
-. Com
petit
ive
Vit
ale
et a
l Sa
tlsfa
ctio
n w
ilh th
e -
Smgl
e-ite
m s
cale
N
o fo
rmal
rel
iabi
lity or
Adv
anta
ge
[871
process
of id
entif
ylng
Su
rvey
of
24 IS
man
ager
s va
lidity
test
s st
rate
gic uses o
f IT
K
now
ledg
e ab
out I
S
-
4-ite
m s
cale
N
o fo
rmal
test
s as
sets
and
In
dex
by s
umm
mg
oppo
rtun
ities
-
5-ite
m sc
ale
No
form
al te
sts
Inde
x by
sum
ming
En
vuon
men
tal
t urb
ulen
ce
mu
d. e
t al.
IT p
enet
ratio
n W
l
IS m
anag
emen
t PI=-
IT-r
elat
ed m
anag
eria
l re
lianc
e
Rah
o et
al
McF
arla
n &
[7
11
McK
enne
y [60]
Diff
usio
n of
IT
phas
es
Exte
nt to
whi
ch IT
is a
pplie
d f
a ccst
radu
aion.
man
agan
ent
and
com
petit
ive t
hrus
t Ex
tent
to w
hich
act
iviti
es
supp
ort.
s-te
!gY
plan
ning
,
included in
the
I I p
coce
ss
grw
ps d
evel
oped
by I
BM h
ave
been
impl
emen
ted
Thre
e di
men
sion
s hy
poth
esiz
ed:
(I) M
anag
eria
l rel
atio
ns,
(2) I
S m
anag
er k
now
ledg
e of
eac
h un
it (I
S pu
sh),
(3) u
nit m
anag
u lo
low
ledg
e of lk
polle
ntia
l and v
alue
of
ITU
SC
(rm
ilplll
)
Org
anita
tiona
l problems
enco
unte
red
with
res
pect
to
inte
grat
mg
PCs
4-ite
m s
cale
42 i
tem
s
3-ite
m s
cale
2-
item
sca
le
4-ite
m s
cale
Su
rvey
of 1
32 fu
ms
belo
ngin
g to
Gui
de l
ntl
and4
4IS
grou
psin
one fm
M
ulti-
item
scales
Surv
ey o
f 41
2 D
PMA
mem
bers
Fact
or a
naly
sis
and
corr
elat
ion
did
not
reve
al a
ny
rela
tions
hip
amon
g ite
ms. So
no o
ther
test
s do
ne.
prod
uced
8 f
acto
rs
Expl
orat
ory
fact
or a
naly
sis
Rel
iabi
lity
asse
ssm
ent
Mor
anal
ysis
to c
heck
di
men
sion
ality
of
each
di
men
sion
R
elia
bilit
y as
sess
men
t C
onve
rgen
t an
d di
verg
ent
prop
ertie
s ex
amin
ed b
y th
e m
aKu
nd
dm
uk
uta
rt+
s
ltein
s as
sign
ed b
y re
sear
cher
s
No
stat
istic
al r
elia
bilit
y or
to
groups
valid
ity te
sts
x B
Org
aniz
atio
nal
Dru
ry [
20]
Stag
es of
DP
grow
th
DP
expe
nditu
re b
ench
mar
k M
ulti-
item
sca
les
No fo
rmal
rel
iabi
lity
or
Lear
ning
pr
opos
ed b
y N
olan
(6
21
Gin
zber
g MIS
impl
emen
tatio
n ~
41
see Iv
es &
O
lson
[33
] fo
r re
view
of
rnca
sum
us
ed t
o as
sess
use
r in
vdva
nar
and
syst
em
SU
CC
rn
Tech
nolo
gy b
ench
mar
k Su
rvey
of
44 c
ompa
nies
in
valid
ity tests
App
licat
ions
por
tfolio
th
e D
un &
Bra
dstre
et
benc
hmar
k di
rect
ory
DP
orga
rurn
tion
benc
hmar
k D
P pl
anni
ng &
con
trol
Use
r aw
aren
ess
benc
hmar
k
Issu
es a
risin
g du
ring
benc
hmar
k
71 it
ems
scal
e D
ata
colle
cted
fro
m
35 u
scrs
of
27 I
S im
plem
enta
tion
of s
yste
ms
Fact
or a
naly
sis
to a
sses
s
Rel
iabi
lity
leve
ls re
port
ed
hens
iona
lity
P 8:
r)
0 a
End-
Use
r kv
ard
&
Use
r dev
elop
ed
Use
r sat
isfa
ctio
n in
UD
A
No
ku
ssio
n
Foun
d th
at o
nly
user
C
ompu
ting
Huf
f ap
plic
atio
ns *
satis
fact
ion
indi
cate
d U
DA
cond
ucte
d
No fo
rmal
test
s
Dec
reas
e in
bac
klog
In
terv
iew
s w
ith 64 wrs
(731
su
cces
s D
ecre
ax in
mai
nten
ance
load
in
10
fum
s E
UC
C~S
S No
form
al te
sts
Kin
g et
al.
Ove
rall
effe
ctiv
enes
s C
hang
e in
atti
tude
s of
Mul
ti-ite
m s
cale
15
01
of us
ing Pc
s to
su
bjec
ts. m
stnu
nent
Used o
bjec
tive
and
ache
ve a
lea
rnin
g ad
opte
d fr
om S
hultz
su
bjec
tive
mea
sure
s ob
ject
ive
and
SIev
in [
76]
Expr
rimen
t st
udy
usin
g 20
0 M
BA
S
- < D
imen
sion
ality
ass
esse
d by
0
Rel
iabi
lity
invo
lvin
g 35
sub
ject
s R
elia
bilit
y le
vels
not
rep
orte
d h)
Mea
surin
g Zm
ud
Info
rmat
ion
4 di
men
sion
s hy
poth
esiz
ed:
Mul
ti-ite
m s
cale
Ef
fcct
i ven
ess
[941
Q
uant
ity
Expe
rimen
tal s
tudy
fa
ctor
ana
lysi
s - h)
Tim
elin
ess
Form
at q
ualit
y a
wei
ghte
d su
m
Inde
x co
nstru
cted
of
valu
e by
Epst
ein
&
Val
ue o
f in
form
atio
n K
ing
1221
King &
O
vera
ll va
lue
of
Epst
ein
info
rmat
ion
syst
em
[491
Bai
ley
&
Com
pute
r us
er
PeaM
n sa
tisfa
ctio
n [3
1
Ives
, Ols
on.
Use
r do
rmat
ion
& B
arou
di
satis
fact
ion
[311
Sand
ers
DSS
suc
cess
L7
51
Gal
letta
&
Use
r do
rmat
ion
Lcde
rer
~3
1
Users' s
atis
fact
ion
with
10
attri
bute
s of
dor
mat
ion
Uun' sa
tisfa
ctio
n w
ith 1
0 at
tribu
tes
of i
nfor
mat
ion
Sum
of u
sers
' w
eigh
ted
reac
tions
to 3
9 fa
ctor
s
Pear
son
[66]
rep
licat
ion
20 it
ems
deriv
ed m
ostly
fro
m
Wel
sch
[90]
13 it
ems
base
d on
lve
s et
al.
(341
Inte
grat
ing
Ledb
ette
r &
Gen
eral
com
mun
ica-
D
enni
s C
omm
unic
atio
ns
Dat
a Pr
uces
sing
Sn
yder
tio
ns c
limat
e w
ithin
cl
imat
e in
vent
ory
Sing
le-it
em m
easu
re o
f ea
ch
No
asse
ssm
ent
of re
liabi
lity
attri
bute
win
g in
tern
al s
cale
or v
alid
ity o
f ite
ms or i
ndcx
I
Fiel
d ex
perim
ent u
sing
60
man
ager
s in
3 f
unct
iona
l ar
cs an
d 2
hier
arch
ical
le
vels
Sing
le-it
em m
easu
re o
f ea
ch
attri
bute
usi
ng i
ntan
al
and
ordi
nal s
cala
236
eval
uatio
ns m
a& b
y 68
man
ager
s
Each
fact
or m
easu
red
win
g a
sem
antic
diff
eren
tial
scal
e
man
ager
s in
8 d
iffer
ent
orga
niza
tions
Sam
ple
of 32
mid
dle
Surv
ey o
f 280
man
ager
s
Like
rt ty
pe s
cale
for
each
ite
m
Surv
ey o
f 37
8 users
in
124
orga
niza
tions
each
item
exec
utiv
e M
BA
s
Sern
antic
diff
eren
tial f
or
Expe
rimen
tal s
tudy
of
65
Indc
x co
nstru
cted
of
valu
e by
No a
sses
smen
t of
relia
bilit
y w
eigh
ted
sum
or v
alid
ity o
f it
em or
ind
ex
Rel
iabi
lity
for e
ach
fact
or
prov
ided
but
no(
for
the
entir
e in
stru
men
t C
onte
nt v
alid
ity e
xam
ined
Pr
edic
tive
valid
ly o
f the
inde
x an
d of
eac
h fa
ctor
C
onst
ruct
val
idity
assessad
In a
dditi
on t
o ta
ts b
y Pe
arso
n [M
I. fac
tor
anal
ysis
do
ne f
or c
onst
ruct
val
idat
ion
Rel
iabi
lity
of t
otal
inst
rum
ent
repo
rted
Fact
or a
naly
sis
to a
sses
s
No
othe
r re
liabi
lity or
Tes
tlre
tat
relia
bilit
y
dim
ensi
onal
ity
valid
ity t
sts
40 it
ems
perta
inin
g to
5
No
form
al te
sts
repo
rted
unde
rlyin
g di
men
sion
s an
d 15
51
the
orga
niza
tion
(Gol
dhab
et &
Rog
ers
[26]
) O
ffic
e A
ttitu
des
and
perc
ep-
Bas
ed o
n C
ox e
t al
[IG
J 10
0 ite
ms pertaining t
o A
utom
atio
n tio
ns o
f p
e~
~e
l
6 fa
ctor
s to
war
ds O
A
5 e Y 3 P
462 Decision Sciences [Vol. 22
"weight" may be defined as the ''heaviness" of objects). An operational d e f ~ t i o n assigns meaning to a construct by specifying the activities or operations that are necessary to measure it. While critical for scientific research, an operational defi- nition expresses only limited meaning [43] because an abstract concept can be operationalized and measured in an almost infinite variety of ways [93]. Thus, there is also the need for a constitutive definition whose generality and abstractness preserve a construct's meaning.
Step 2. Generare a Sample of Items. The second step in construct measurement is to review the past literature and derive the dimensions of the construct as well as a set of items for each dimension. In general, a construct should be measured with multiple items. The use of single items has many limitations: an individual item has only a low degree of relationship with a particular construct [8] [13] [64] [84]; it has considerable specificity or a type of individuality which is not correlated with any general construct [MI; it can categorize an entity into only a relatively small number of groups; and it is often unreliable.
Step 3. Collect Data The third step in construct measurement is to collect data using one of the following methods: laboratory experiments, field experiments, field studies, or survey research [43]. Methods should be selected based on their strengths and weaknesses, described by Jenkins [37] along 24 dimensions.
Survey research using questionnaires is a widely used method for collecting data. It is critical for studies using this method to follow guidelines regarding questionnaire construction and administration [19] [79] so that the data collected are relevant and appropriate.
Step 4. Purify the Measure. This step empirically examines the extent to whch there is an absence of measurement error in the items, or their reliablility [43] [a]. There are a number of ways of assessing reliability, such as correlating alternative forms of the measure against each other, split-half correlations, and test-retest. The most important [13] is internal consistency which requires calculating the alpha coefficient (the square root of the estimated correlation of the measure with error- less true scores). However, the alpha coefficient provides an unbiased estimate only if the scale is unidimensional.
The dimensionality of the construct may be examined by using factor analysis, either exploratory or confiiatory. Exploratory factor analysis is used to ascertain the underlying dimensions of data [U]. However, it may sometimes result in dimensions which are not interpretable [45]. This effect is partly due to "garbage items" which do not have a common core [13] and should be eliminated. Also, there are no unambiguous criteria to determine the number of underlying factors. Thus, only those conclusions should be accepted that are supported by several independent criteria [45], such as by a principal component factor analysis and by a maximum likelihood analysis [38].
Confiiatory factor analysis is used to test hypotheses regarding the number of dimensions. It is meaningful only when there are specific expectations regarding which variable is likely to load on which factor 1451.
Steps 5 and 6. Collect New Data and Assess Reliability with New Data. To rule out the possibility that the findings in previous steps are due to chance, additional data must be collected. New data should be subjected to the same analysis as above and the results compared. Alternative methods of assessing reliability, such as test-retest, may be additionally employed at this stage.
19911 Sethi and King 463
Step 7. Assess Validiry. The preceding steps would produce an internally consistent or internally homogenous set of items, which is a necessary, but not a sufficient, condition for construct validity [a]. Construct validity refers to the extent to which a measurement instrument actually appraises the theoretical con- structs it purports to assess [12].
A measure that correlates highly with other measures designed to measure the same thing provides evidence for convergent validity. In addition, measures should also possess discriminant validity. This is indicated by low correlations between the measure of interest and other measures not measuring the same concept. A useful way of assessing convergent and discriminant validity is through the multi- trait-multimethod matrix proposed by Campbell and Fiske [lo].
Another aspect of validity requires that the measure should behave as expected in relation to other constructs. Predictive validity examines the relationship of the measure to a single antecedent or consequent [13] [85] . This contrasts with nomological validity which attempts to confum predictions from a formal theoreti- cal network containing the concept of interest [17]. Since nomological validity involves developing a complex system of constructs and proposing specific hypotheses [53], Venkatraman and Grant [85] argued that it may not be a key requirement in fields which lack well-developed theories.
Step 8. Develop Norm. The last step in construct measurement consists of aggregating the measures to compute an overall score and then developing bench- marks for it. Constructing a summary score is popular perhaps because it is suitable for both unidimensional or multidimensional traits [8] [ 131.
The overall index may be computed in different ways, including the use of a linear model [3] [34] [48]. However, the linear method should not be used indis- criminately [43]. It is appropriate to aggregate items into an overall index only if items can compensate for each other. Also, it is necessary to examine whether the index should be based on all or only a subset of items.
After an index has been computed, it is critical to examine its measurement properties (such as validity) even though the items comprising the index have already satisfied such criteria. Further, because an index based on raw scores is not particularly informative, the raw score should be compared with the mean (or another statistic of the total distribution) to develop "norms."
Many of these issues are illustrated in IS by efforts to develop a measure of the construct ‘her information satisfaction." Bailey and Pearson [3] developed an overall index by normalizing a linear sum of 39 items. Norms were delineated by outlining score intervals and their interpretations. This index was refined by Ives, Olson, and Baroudi [34] into a short form of 13 items. However, after years of acceptance and use, as well as further validation of the index's psychometric properties [5 ] , recent evidence indicates that it may be improper to construct an overall index by aggregating individual items [23]. This shows the hazards of failing to explicitly examine the assumptions underlying index construction; all past studies virtually ignored assessing whether items are compensatory and whether they should all be aggregated.
While construct operationalization requires the execution of all eight steps, it may not be possible to do so in a single study. Churchill [13] recommended executing the process at least through the fourth step because such studies can be accomplished with one-time, cross-sectional data.
464 Decision Sciences [Vol. 22
DEVELOPING MEASURES FOR THE CONSTRUCT- COMPETITIVE ADVANTAGE FROM AN INFORMATION
TECHNOLOGY APPLICATION
This study sought to develop measures for assessing the extent to which information technology (IT) provides competitive advantage (CA'). It defmed and operationalized the construct "competitive advantage from an information technol- ogy application" (CAITA).
Domain of the Construct: The domain of the construct should be delineated through a constitutive and an operational definition. Past literature on the use of IT for CA is useful for formulating only operational definitions of CAITA (e.g., the extent to which an application enables a f m to earn above average returns [as]). A constitutive CAITA definition was therefore formulated. The following broad delinition was adopted: CAITA refers to benefits accruing to a firm, in terms of changes in its competitive position, that are caused by an IT application. The domain of CAITA was made more specific by defining an IT application as the support of business activities through the use of hardware and software that collect, transmit, process, and disseminate information.
Generating a Sample of Items: CAITA dimensions were based on the sys- tems-resource view, previously found useful in the IS field for operationalizing the construct "user information satisfaction." In this view, effectiveness is determined by the attainment of a nonnative estate rather than the accomplishment of specific performance objectives. Thus, it advocates the assessment of "means" rather than "ends. "
A ten-dimensional CAITA model was hypothesized where each dimension referred to a different source of CA that may be exploited by an IT application. These dimensions were Efficiency, User Functionality, Threat, Preemptiveness, Synergy, Observability, User Relatedness, Riskiness, Magnitude, and Uniqueness. For each dimension, multiple items were proposed as measures of the degree to which an IT application utilizes these sources. Each dimension and its measures were derived from previous theoretical and empirical studies in ths area. For instance, the Efficiency dimension was based on Bakos and Treacy [4) and its operational indicators were derived from the value chain model [69]. Similarly, User Functionality was a generalization of the concept of differentiation [68] and its measures were based on the customer resource life cycle [32].
Data Collection: A pilot-tested questionnaire asked top-level information sys- tems managers to describe an IT application that was developed with the intention of making a significant contribution to their fm's competitive position. The sam- ple consisted of 568 fms listed in the Corporate 1o00, a directory of the loo0 largest manufacturing and service companies in the United States, and 25 1 member companies of the Strategic Data Planning Institute. The effective response rate was 24 percent (185 usable responses) as a result of a first mailing and reminders three weeks later.
To investigate whether the two samples of 568 and 25 I companies belonged to the same general population, they were compared along a number of application characteristics (e.g.. duration of use, competitors' response time, source of idea, impetus for development, primary users, and underlying technology) and company features (e.g.. revenue, number of employees, sophistication in business planning, sophistication in managing information resources, and IS participation in business
1W1] Scthi and King 465
planning). Results showed that they did not differ along any characteristic. They were thus pooled for subsequent analysis. The combined data set of 185 responses was first examined for nonresponse bias.
Respondents and nonrespondents were compared with regard to company revenue and number of employees, the only items for which data were available for both the groups. None of the differences were significant, thus providing evi- dence for an absence of nonresponse bias.
Purification of the Measure: The ten-dimensional model of CAITA was a preliminary framework expected to contain redundant items and perhaps dimen- sions. This mandated use of exploratory factor analysis.
To eliminate “garbage items,’’ data were screened prior to factor analysis. Items that were uncorrelated or negatively correlated with a single-item overall CA measure were considered poor measures of the construct and thus dropped from further analyses. A factor analysis was carried out on the remaining 56 of the total 74 items.
A principal component analysis yielded 17 factors. A varimax rotation of the principal component loadings was evaluated on two criteria: significance of item loadings and simplicity of factor structure. Using these criteria, items with loadings of less than .35 on all factors [13] or with loadings greater than .35 on two or more factors [45] were dropped. This process of evaluating the factor analysis results, dropping items, and performing the analysis on the remaining items was repeated until a stable solution was found. This was the sixth factor analysis which grouped the 39 items remaining at that stage into 13 factors.
These results were compared with those obtained using maximum likelihood factor analysis (varimax rotated) for 13, 12, and 11 factors. The 13-factor solution was almost identical across the two methods, and thus seemed to be the best indicator of the number of dimensions underlying CAITA. However, factors 12 and 13 were comprised of only one item each and together accounted for only 5 percent of the total sample variance. Thus, these two factors were dropped. The 1 1 dimensions were found to correspond in general to the theoretically derived CAITA model and were labeled Primary Activity Efficiency, Support Activity Efficiency, Resource Management User Functionality, Resource Acquisition User Functional- ity, Threat, Preemptiveness, Synergy, Observability, Technical Sophistication, User Education, and Riskmess. The results that differed significantly from expectations are described below.
It was found that the Efficiency dimension of CAITA is not unidimensional, as envisioned, but comprises two dimensions: Primary Activity Efficiency and Support Activity Efficiency. T h s supports Porter and Millar [69] who categorized value-chain activities into primary and secondary activities. User Functionality was also found to consist of two components: Resource Management User Functional- ity and Resource Acquisition User Functionality. This is perhaps because activities comprising Resource Management are relatively unstructured and difficult, unlike Resource Acquisition activities. Some evidence for h s conclusion is provided by the fact that while few IT applications help users in activities comprising Resource Management [35], system to support Resource Acquisition activities are becoming commonplace [29] [77] [78]. User Relatedness also unexpectedly comprises two dimensions: Technical Sophstication and User Education. These two dimensions were considered distinct because the former primarily measures long-term benefits
466 Decuion Sciences Pol. 22
while the latter is a measure of the application's short-term implementation success, a distinction also emphasized by Runge [74]. Finally, data analysis failed to reveal the existence of two hypothesized dimensions: Magnitude and Uniqueness. It was believed that Magnitude is related to Riskiness because applications that are large, costly, or take a long time to develop (i.e., high Magnitude) have considerable associated risks [81]. Similarly, Uniqueness was believed to be subsumed under Preemptiveness because preemptive applications are also new and unique.
The alpha coefficient was then calculated for each of the 11 CAITA dimen- sions. For all but two dimensions, it was much greater than the threshold level of S O recommended for exploratory construct measurement [a].
Validity Assessment: In order to assess convergent validity, correlations were examined between each dimension and three overall indicators of an application's impact: single-item CA measure, sales growth rate, and profits. As expected, all correlations were positive and, generally, significant.
Predictive validity was assessed by examining the relationships between each dimension and a number of other constructs: competitors' response time; focus of applications (personnel internal to the company or customers); company size; com- pany's sophistication in business planning; level at which data processing execu- tives report; and data processing department's sophistication and importance. These constructs were chosen because many previous studies had emphasized their rela- tionship with CA. For instance, the salience of competitors' response time was underscored by Clemons and Kimbrough [14] and MacMillan, McCaffery, and Wijk [57], focus of applications by Benjamin, Rockart, Scott Morton, and Wyman [7] and Wiseman and MacMillan [92], and company's sophistication in business planning by Lederer and Mendelow [56] and Vitale, Ives, and Beath [87].
All results were generally consistent with expectations; that is, the relationship between these constructs and the CAITA dimensions was compatible with the observation of previous studies. For instance, all dimensions except Observability were positively correlated with competitors' response time (time taken by competi- tors to respond in an attempt to bring the situation back to normal [29]). This was expected because higher Observability implies greater visibility to competitors and thus shorter response time [57]. On the other hand, the higher the scores on other dimensions, the more novel, unique, and significant the application, and thus longer the response time of competitors [41] [59].
Development of a n Overal l Index: Theoretical justifications were sought for the compensatory nature of dimensions and for basing the index on all the dimen- sions. However, it was recognized that arguments could nevertheless be advanced regarding the irrelevance of some of the dimensions, specifically Primary Activity Efficiency and Support Activity Efficiency, for some types of IT applications, such as those intended to enhance differentiation. These arguments implied that the index should not be based on all the dimensions. It was decided to address these issues empirically, and an exploratory analysis examined the universal relevance of the two efficiency dimensions and whether the dimensions could compensate for each other. Cluster analysis was selected as the appropriate statistical test . It was hypothesized that the presence of clusters which differ on the efficiency dimensions but not on overall CA would indicate that the efficiency dimensions were not relevant for some types of applications. It was also postulated that the presence of two or more clusters which did not differ on overall CA but had
1991) Sethi and King 467
dissimilar profiles along the eleven dimensions would provide evidence that the dimensions are compensatory.
A variety of clustering methods was used to produce different clusters. Three clusters produced by the method of complete linkage were found to be the most interpretable solution. The results showed that Support Activity Efficiency was the only dimension on which there are no differences between clusters. This suggested that it is equally emphasized by all applications. It was also found that the fm two clusters did not differ on overall CA but had dissimilar profiles along the eleven dimensions.
An overall index of CAITA was thus computed and a linear model was employed. The index, a sum of dimension scores, was examined on a number of key measurement criteria.
The convergent validity of the index was assessed by examining its relation- ship with the single-item overall CA measure. The correlation between these two was high and sigruficant.
The predictive validity of the index was assessed by examining its relationship with a number of organizational factors: company size, company’s sophistication in business planning, and data processing department’s sophistication and impor- tance. The index was found to behave as expected, and it also closely emulated the single-item overall CA measure.
DISCUSSION AND CONCLUSION
The operationalization of CAITA followed the normative construct-measure- ment procedure except that new data were not collected and n o m could not be developed. This was partly because it is difficult to implement the entire procedure in a single study [ 131 and partly because of the lack of previous measurement research. Also, nomological validity could not be examined because of inade- quately developed theories in this area. Nevertheless, the application of the norma- tive construct-measurement guidelines in IS proved very beneficial, as described below.
It was found that it is useful to define a preliminary model of the dimensions underlying the construct even when there is lack of previous measurement research because it enhances the ability to understand the empirical results. This observation is important given that most IS areas lack previous, rigorously defined construct measures. Also, data screening can greatly enhance the interpretability of the results of exploratory factor analysis. Further, a comparison of the results of different factor analysis methods is a useful technique for verifying the stability and accuracy of the solution.
It was also found that assessing a construct’s predictive validity is critical for understanding its scope, meaning, and importance; the relationship of CAITA with different constructs showed how an IT application interacts with the environment and the organization to provide CA. It is imperative that IS research devote greater attention to predictive validity because it is the first step in developing a theory of the cmstmct. Also, assessment of predictive validity is of added sigruficance because the lack of theories preclude the examination of nomological validity in IS.
This study also shows that it is possible to verify the assumptions underlying the computation of an overall index statistically. These assumptions include the extent to which all items are relevant and compensatory. Also, it is important to
468 Decision Sciences Pol. 22
examine the measurement properties of the index, such as convergent and predic- tive validity, and not just its constituent items.
This study represents a first step in the area of strategic systems to move beyond anecdotes and taxonomy development to empirical testing and validation. Its substantive results would thuefore be very useful for future studies. For in- stance, the CAITA model developed here could serve as the basis for completing the normative construct measurement procedure by testing the model on new data and developing norms. Nevertheless, even as such, the CAITA index would pro- vide practitioners with a much-needed quantification of the benefits from IT; they have repeatedly noted that There is no measure we can construct that can isolate the contribution of information [to business] and not be also attributable to some other factors" [29, p. 1 141. Other results, such as the underlying dimensions of two popular models, the value chain and the customer resource cycle, would further help to validate and enhance the prescriptive and descriptive value of models in this area.
In conclusion, it is hoped that this study would bring greater attention and rigor to IS measurement research. This is critical because of the central role of measurement in the social sciences; according to Campbell and Hart, while theory has predominated measurement in the true sciences (such as physics and chemis- try), in the social sciences "there has been a continual interaction between fact collecting and theory development, and that, if anything, fact collecting has pre- ceded the theoretical achievement, rather than follow ed.... To expect social science to be able to build theory effectively without such factual and methodological underpinning [absence of well-described and measured recurrent phenomena] is to misread the social history of science " [ l l , p. 161. Also, measurement issues have often come to the forefront in IS as a result of a retrospective look at contradictory past research results. This study additionally represents an attempt to preempt such a situation in the field of strategic systems. [Received: July 17, 1989. Accepted: May 14, 1990.1
REFERENCES
Anthony, R. N. Phnning and control sysretiis: A frotirework for analysis. Graduate School of Business Administration. Harvard University, Boston. MA, 1965. Antill. L. Selection of a research method. In Mumford. E., Hirshheim, K.. Fitzgerald, G.. Wood- Harper, T. (Eds.), Research titerhods in infortiidion systetirs. North-Holland: Elsevier Science
Bailey. J. E.. & Pearson, S. W. Development of a tool for measuring and analyzing computer user satisfaction. hianagemenr Scicirce, 29(5), 1983. Bakos. Y. J . . & Tracy, M. E. lnformation technology and corporate strategy. A research per- spective. MIS Quurterly, 1986, IO(2). 107-1 19. Baroudi, J. 1.. & Orlikowsky, W. J. A short-form masure of user information satisfaction: A psychometric evaluation and notes on use. JournaI of Managcttrenr Inforitration Systenrs. 1988. 4(4), 44-59. Benbasat, 1.. Goldstein. D. K., & Mead, M. The casc research strategy in studies of information systems. MIS Quarterly, 1987, l l ( 3 ) . 47-85. Benjamin, R.. Rockart, 1. F., Scott Morton, M. S.. & Wyman, J. lnformation technology: A strategic opportunity. Sloan Management Rrview. 1984. 2s. 3-9. Blalock. H. M., Jr. Mcusuremcnr in the social scienccc. Chicago, I L Aldine Publishmg Company, 1974. Brancheau, J. C.. & Wetherbe, J . C. Key issues in information systems management MIS Quarterly. 1987. 11(1). 23-45.
Publishers, 1985, 203-218.
19911 Sethi and King 469
[lo] CMlpbell. D. T.. & Fiskc, D. W. Convugen! and dixriminan t vddation by h e multibait-multimehd matrix. Psychological Bullerin, 1959. 56, 81-105.
[ 1 I ] Campbell. D. T., & Hart. C. W. A multiple-index program for the study of race tensions in urban areas. Unpubkhed manuscript cited in M. L. Ray, The critical nwd for a marketing measurement trsdition: A proposal. In J. P. Peter & M. L. Ray (Eds.). Measurenicnt readingsfor marketing research. Chicago, IL: American Marketing Association. 1984.
[ 121 Cumines, E. G., & Zeller, R. A. Reliability ond validity. Beverly Hills, CA: Sage Publications, 1979.
[I31 Churchill, G. A.. Jr. A paradigm for developing better measures of marketing consS1NcIs. Journal of Marketing Research. 1979, 16, 64-73.
[ 141 Clunonc. E. K.. & Kimbrough. S. 0. Information systems. telcxommunications and their effects on industrial organizations. Proceedings of the Sevenrh Annual lnternarional Conference on Information Systems. Baltimore, MD: Association of Computing Mactunery. 1986. 99- 108.
[IS] Cooper. R. B. Review of management dormation systems research. A management support emphasis. Information Processing and Managetticnl. 1988. 24( I), 73- 102.
[I61 Cox, J. F., Zmud, R. W., & Clark. S. J. Auditing an MRP system. Acadettiy of Mariago~renr JOUrMl. 1981. 24(2). 386-402.
[I71 Cronbach, L. J., & MeeN. P. E. Construct validity in psychological lesls. Psychological Bullerin. 1955, 52, 281-302.
[I81 Dickson, G. W., Benbasat, I . , & King. W. R. The management dormation systems area. Problems, challenges and opportunities. P roceedings of the First Inrrrnational Conference on Information Systems. Baltimore, MD: Association of Computing Machnery. 1980. 1-7
[ 191 Dillman, D. A. Mail and telephone surveys: The roral design method. New York: John Wiley, 1978.
[20] Drury. D. H. An empirical assessment of the stages of DP growth. MIS Quarterly, 1983. 7(2),
[21] Ein-Dor. P. An epistemiological approach to the theory of knowledge Proceedings of the De- cision Science Insrirurc Annual Meeting. Atlanta. GA. Decision Sciences Institute. 1986.
[22] Epstein, B. I., & King. W. R. An experunental study of the value of Information. OMEGA. 1982.
[23) Galletta. D. F., & Lederer, A. L. Some cautions on the measurement of user information satis- faction. Decision Sciences. 1989, 20(3). 4 19-436.
[24] Ginzberg, M. J . Key recurrent issues in the MIS unplementation process. MIS Quarterly, 1981, 5(2). 47-59.
[25] Ginzhrg, M. J.. & Shultz. R. L. The practical side of implementation research. Inrer/aces. 1987.
(261 Goldhaber, G. M., & Rogers, D. P. Audiring organiznrional cotnttiunicartons sysrems: Thc lCA communications audit. Dubuque, 1A: Kendall/Hunt. 1979.
[27] Goldstein, D. Use of qualitative methods in MIS research. Proceedings of rhc Seventh Inrcrna- rional Conference on Inforutorion Sysrcttrs. Baltimore. MD: Association of Computing Machinery,
[28] G o q . G. A,. & Scott Morton, M. S A framework for management information systems. Sloati
(29) Harris, C. L. Information power: How companies are using new technologies to gam a competitive edge. Business Week, October 14, 1985. 108-1 14.
[30] Huber, G. P. Cognitive style as a basis for MIS and DSS design. Much ado about nothing? hf0MgetJWnr Science. 1983, 29(5). 567-582.
[31] Ives. B.. Hamilton. S , & Davis, G. B. A framework for research in computer-based management dormation systems. Managemrnr Science. 1980, 26(9), 910-934
[32] Ives. B.. & Learmonlh, G. P. The information system as a competitive weapon. Communications o f the ACM, 1984, 27(12), 1193-1201.
[33] Ives, B., & Olson. M. H. User involvement and MIS success' A review of research. Managettienr Science, 1984, 30(5), 586-603.
[34] Ives, B., Olson. M. H., & Baroudi. J . J The measurement of user information satisfaction. Conrimmicarions of the ACM. 1983. 26(10).
[35] Ives, B , & Vitale. M. R. After the sale: Leveraging maintenance with information technology MIS Quarrerly. 1988. 12( 1). 7-22
(361 Jarvenpaa. S. L.. Dickion. G. W.. & DeSanctis, G. Methodological issues in experunental IS research: Experiences and recommendations. MIS Quarterly, 1985, 9(2). 141-156.
59-70
l0(3), 249-258.
17(3), 1-5.
1986. 338-339.
MaMgcttttnr &View, 1971. 13( I ) . 55-70
470 Decision Sciences (vol. 22
Jenkins, M. A. Research methodologies and MIS research. In E. Mumford. R. Hinchheim, G. Fitzgerald & T. Wood-Harpu (Eds.), Research methods in infortnation systett~s. North-Holland: Elsevier Science P u b l i s h B.V.. 1985, 103-1 18. Johnson. R. A., & Wichenr, D. W. Applied multivrrriate statistical analysis. Englewood Cliffs, NJ: Rentice-Hall, Inc., 1988. Kaplan, B., & Duchon, D. Combining qualitative and quantitative methods in information systems research: A case study. MIS Quarterly, 1988. /2(4), 570-586. Kauber, P. G. Whrrt's wrong with a science of MIS? Proceedings of the Decision Science Instirute A n n u l Meeting. Atlanta, GA: Decision Sciences Institute, 1986. 569-571. Keen. P. 0. W. MIS research: Reference disciplines and cumulative tradition. Proceedings of the First International Cot$erence on Inforniation Systettts. Baltimore, MD: Assxiation of Computing Machcry. 1980.9-18. Keen. P. G. W. Competing in time: Using telecotnmunications for co~trpetitive advantage. Cam- bridge, MA: Ballinger, 1988. Kerlinger. F. N. Foundations ofkhavioral research. New York: Holt. Reinhart, and Winston. 1964. Kim, 1.. & Mueller. C. W. Introducrioti to factor analysis. Beverly Hills, CA: Sage Publications, 1978a. Kim, J., & Mueller. C. W. Facror analysis: Sraristical tttcthodc and practical issues. &vuly Hills, CA: Sage Publications, 1978b. King, W. R. Information as a strategic resource. (Working Paper No. 504), Unpublished manu- script. Katl Graduate School of Business. University of Pittsburgh. 1982. King, W. R. O n measurement. valuewise independence and linear models. OMEGA, 1983. / 1 (3 ) , 227. King, W. R. Evaluating an information systems planning process. (Working Paper), Unpublished manuscript. University of Pittsburgh, 1984. King, W. R., & Epstein, B. J. Assessing the value of information. Managetrrettr Datarnatics,
King, W. R.. Raghunathan, T. S.. & Teng. 1. Personal computers m business education: An experimental study. OMEGA. 1986, /4(4), 317-323. King, W. R., & Rodriguez, 1. I. Evaluating management information systems. MIS Quarterly,
King, W. R.. & Srinivasan, A. Decision support systems: Planning, development, and implemen- tation. Applications of Management Science. 1983, 3. 87-107. Kopelman. R. E., Greenhaus, 1. H., & COMOIIY, T. F. A model of work, family, and interrole
1976. 5(4), 171-180.
1978. 2(3). 43-51.
conflict: A construct validation study. Organimrional Behavior and Hurttan Performance, 1983, 32, 198-215.
[54] Kwon. T. H., & Zmud, R. W. Unifying the fragmented models of information systems imple- mentation. In R.J. Boland & R. Hirschheim (Eds.), Critical issues in inforatation systettrs re- search. New York: John Wiley, 1987.
[55] Lcdbetter. W. N., Snyder. C. A,. & Cox, J . F Asscssing the organizational climate for OA implementation. Infonttation and Management. 1985. 8, 155- 170.
[56] Lederer, A. L.. & Mendelow, A. L. Paradoxes of dormation systems planrung. Proceedings of rhe Seventh International Conference 011 Infonitarioti Sysrems. Baltimore. MD. Association of Computing Machinery, 1986, 255-264.
[57] MacMillan. 1. C., McCnffery, M. L.. & Wijk, G. V. Competitors response to easily imitated new p~odUCts- tkp~Othg commercial bankmg product introductions. strategic hfaMgtttttnt Journal.
[58] Mason. R 0.. & Mitroff. 1. I . A program for research on management information systems. hfanagemcnr Science. 1973, /9(5), 475-485.
[59] McFarlan. W. F. Information technology changes the way you compete. Harvard Business
[60] McFarlan. F. W. & MCKCMCY, J. L. The information archipelago-Gaps and bridges. Harwrd Business Review, 1982, 60(5), 109-1 19.
[61] Naumann, 1. D. The role of frameworks in MIS research. Proceedings of the Decrsion Science Institute Annual Meeting. Atlanta, GA: Decision Science Institute. 1986. 569-57 1.
(621 Nolan, R. L. Managing the crisis in data processing. Harvard Business Review, 1979. 57(2),
[63] Nolan. R. L., & Wetherbe. J. C. Towards a comprehensive framework for MIS research. MIS Quarterly. 1980. 4(2). 1-20.
1985. 6, 75-86.
Review, 1984, 62(3), 98-103.
115-126.
IWI] Sethi and King 47 1
(641 Nunnally, 1. C. Psychonietric theory. New York: M c G n w Hill Book Co., 1967. [65] pusonS. G. L. Information technology: A new competitive weapon. Sloan hfamgemcnl Review,
[a] Pearson, S . W. Meacurement o/ computer user sarirfoction. Unpublished Ph.D. dissertation. MZOM State University, Tempe, AZ. 1977.
[67] Peter. J. P., & Ray, M. L. (Eds.). Meacurement readings for marketing research, Clucago, IL: American Marketing Association. 1984.
[68] Porter, M. Compctifiw odvontage. New York Free Rcss, 1985. [69] Porter. M.. & Millar. V. E. How dormat ion gives you competitive advantage. Harvard Business
Review, 1985, 149-160. [70] Raghunathan. T. S., & King, W. R. The impact of information systems planning on the organi-
zation. OMEGA, 1988. 16(2), 85-93. [71] Raho, L. E.. Eklohlav. J. A.. & Fiedler. K. D. Assimilating new technology into the organization:
An assessment of McFarlan and McKenney’s model. MIS Quarterly, 1987. 11(1), 47-57. (721 Ray, M. L. The critical necd for a markl ing measurement tradition: A proposal. In J.P. P e t u
& M. L. Ray (Eds.). Meawrement readings for markring research. &cago, IL: American Marketing Association, 1984. 1-15,
[73] Rivard, S.. & Huff, S. L. User developed applications: Evaluation of success from the DP perspective. MIS Quarterly. 1984, 8( I), 39-50.
[74] Runge. D. A. Using teleconiniuriications for competitive advanfage. Unpublished doctoral dis- sertation, Oxford University. 1985.
(751 Sanders, G. L. MISflXS success measure. Sysrenis, Objeciives. Solurions. 1984. 4. 29-34. [76] Schultz. R L , & Slevin, D B. (Eds.) I/nplertioiting operatiom researc~~tranagerrren~ scioice.
New York: Americaii Elsevier, 1975. (771 A shoving match UI rhe travel agency. Business Week, June 22, 1987. 116-1 18. [78] The strategic use of iiiformation: Seizing the competitive edge. lnfonriatiori Week. May 26, 1986,
26-62. [79] Sudman, S., & Bradburn, N. M. Asking questions: A practical guide to quesriorinaire design
San Francisco, CA: J a y - B a s s Publishers, 1982. [80] Sullivan, C. H., Jr. Systems planning in the dormat ion age. Sloan Managernenr Review, 1985,
26(2). 3-13. [Sl] Synott. W. R. The information weapon. New York: Wiley, 1987. [82] Torgerson. W. S. Theory and nreihodr ofscaling. New York: Wiley. 1967. [83] T r a c y , M. E. Towards a curiiulative tradition of research on inforinorion technology as strategic
business factor Center for Information Systems Rescarch. Sloan School of Management. MIT.
(841 Venkatraman. N . Strategic orwitatiori of busirress enterprise: The construct aid its rrieacurerrient Ph.D. dissertation. University of Pittsburgh. 1986.
[85] Venkatrarnan, N.. & Grant. 1. H Coisiruct measurement in organizational strategy research. A critique and proposal Acadeiriy of Matmgement Review, 1986, I l ( I), 71-87.
[86] Vitalari, N. P. The nred for longitudinal designs in the study of computing environments. In E. Mumford. R Hirschheim. G. Fiizgenld & T. Wood-Harper (Eds.), Research niethodr iri infor- marion systenis. North-Holland: Elsevier Science Publishers B.V.. 1985, 243-266.
[87] Vitale. M. R.. Ives. B., & Beah. C. Identifying strategic dormat ion systems: Fmdmg a process or building an organization. Proceedings of the Seventh Infernational Conference on Information Systems. Baltimore, MD: Association of Computing Machinery, 1986.
[88] Wand, Y. On paradigms in the IS discipline: The problem of the problem. Proceedings ofthe Decision Scierice Institure Antiual Meeiing. Atlanla, GA: Decision Sciences Institute, 1986.
[89] Watson. S . R . & Freeling. A. N. S. Aswssing attribute weights. OMEGA, lq6), 582-583. [90] Welsch, G . M A multidunensional measure of perceived decision support system implementation
success DSS Trarlsoc.iions. Atlanta. GA, 1981. [91) Wiseman, C. Srrareg) atid corupurers. lrtjorrmtiori sysreriis as corirperirive weaporls. Homewood.
IL: Dow Jones Irwin. 1985. [92] Wiseman C , & MacMillan, I. Creating competitive weapons from information sys tem. Journal
of Business Straregy. 1984. 42-49. [93] Zeller, R. A.. & Cannines, E. G. Measurernent in the social sciences. New York: Cambridge
University Press. 1980. [a] Zmud, R. An empirical investigation of the dimensionality of the concept of dormat ion . Decision
Sciences, 1978, 9. 187-195.
1983, 21(1), 3-14.
1986. 1-21.

472 Decision Sciences [Vol. 22
Zmud R. W., Boynton. A. C.. & Jacobs. G. W. An examination of managerial strategies for incrusing information technology penetration in organizations. Proceedings ofthe Eighth Inter- n ta f io~ l Conference on In/ormarion Sysrew. Baltimore, MD: Association of Computing Machimry, 1987, 24-44.
Vijay Sethi is an assistant professor in the Department of Management Science and Systems at the State University of New York at Buffalo. He earned his Ph.D. in information systems from the Joseph M. Katz Graduate School of Business at the University of Pittsburgh. Dr. Sethi's articles have a p r e d in MIS Quarterly. Decision Sciences. INFOR Interfaces, D a t a h e . and Information Man- agement Review. His research interests are strategic planning for information systems and technology, end-user computing, and measurement issues.
William R. King is University Professor in the Katz Graduate School of Business at the University of Pittsburgh. He has served as president of the Institute of Management Sciences (TIMS). senior editor of the MIS Quarlerly and general chairman of the htemational Conference on Information Systems (lCIS). He is the a u h of more than a dozen books and more than 150 papers that have appeared in the leading joumsls in management sciences and information systems.