Sinkhole monitoring and early warning: An experimental and successful GB-InSAR application
Upload
independentCategory
view
2download
0
ORIGINAL ARTICLE
Identification of sinkhole development mechanism basedon a combined geophysical study in Nahal Hever South area(Dead Sea coast of Israel)
Michael Ezersky Æ Anatoly Legchenko ÆChristian Camerlynck Æ Abdallah Al-Zoubi
Received: 23 April 2008 / Accepted: 30 September 2008 / Published online: 25 October 2008
� Springer-Verlag 2008
Abstract Seismic refraction, magnetic resonance sound-
ing (MRS), and the transient electromagnetic (TEM)
method were applied to investigate the geological and
hydrogeological conditions in the Nahal Hever South
sinkhole development area at the Dead Sea (DS) coast of
Israel. Microgravity and MRS results reliably reveal large
karst cavity in the central part of investigated area. The map
of the seismic velocity shows that sinkholes in Nahal Hever
can be divided into two major groups: sinkholes close to the
salt edge and sinkholes over compact salt formations
between a few tens to a hundred meters from the major
cavern. The present study shows that the formation of
sinkholes of the first group is caused by soil collapsing into
the cavern. In the area occupied by sinkholes of the second
group, karst was not detected either by MRS or by seismic
diffraction methods. TEM results reveal shallow clay layer
saturated with DS brine underlain sinkholes of this group. It
allows suggestion that the water drainage and intensive
water circulation during rain events wash out fine rock
particles from the unsaturated zone into the pre-existing
cavern, initiating the formation of sinkholes of the second
group. Karst development takes place at a very low bulk
resistivity (\1 X m) of the DS aquifer, attesting to the fact
that pores are filled with a highly saline solution. Refilling
of the karstic cavities with collapsing and flushed soil slows
down sinkhole development in the area. The sinkhole for-
mation cycle at the site is estimated at 10 years. Sinkhole
development throughout the studied area is triggered by a
drop in the level of the DS, which reduces the head of the
confined aquifer and the strength of the overlain sediments.
Keywords Dead Sea � MRS � TEM � Pseudo-sinkholes �Seismic refraction � Sinkholes
Introduction
The study area is relatively highly populated and located
within the Dead Sea (DS) basin, a single geological and
geographical unit shared by Jordan, Israel, and the Pales-
tinian Authority. Since the 1990s thousands of sinkholes
have developed in alluvial fans and other unconsolidated
sediments along the coastlines of the DS. The most
alarming cases were sinkholes that occurred recently
somewhat 40 m east of the main route, highway #90, in the
Mineral Beach area and in land used by farmers (agricul-
tural land) on the Jordanian side.
There are two principal competitive geological models
explaining sinkhole development. These models provide
alternate interpretations of the cause of void formation at
depths of tens of meters within the sediments or salt layer.
The piping model (Arkin and Gilat 2000); explains the
gravel holes forming in the frontal areas of young alluvial
M. Ezersky (&)
Geophysical Institute of Israel, 6, Haba’al Shem-Tov Str.,
PO Box 182, 71100 Lod, Israel
e-mail: [email protected]
A. Legchenko
Institut de Recherche pour le Developpement (IRD-LTHE),
BP53, 38041 Grenoble Cedex 9, France
e-mail: [email protected]
C. Camerlynck
Universite Pierre et Marie Curie-Paris 6, UMR 7619 Sisyphe,
4, Place Jussieu, 75252 Paris Cedex 05, France
e-mail: [email protected]
A. Al-Zoubi
Al-Balqa Applied University,
Salt 19117, Jordan
e-mail: [email protected]
123
Environ Geol (2009) 58:1123–1141
DOI 10.1007/s00254-008-1591-7
fans. They are typically funnel-shaped with a surface
diameter ranging from 1 to 30 m. The funnel pipe diameter
is proportionally smaller and may not exceed several
meters. The pipe depth may not exceed 15 m. Pre-existing
unique flow lines (which can be recognized in the con-
glomerate beds by iron and limonite staining deposited by
the flow water) form the focus for developing sinkholes.
Fine material is washed out along the flow path in places
where the flow changes from laminated to turbulent. Fines
are washed out, and a hollow is formed. The process
continues in an upward direction forming a pipe. As the
pipe approaches the surface, sudden collapse occurs
forming a funnel-shaped hole.
Other one is the salt dissolution model (Yechieli et al.
2002). The chemical mechanism (salt dissolution) model
requires the concurrence of three factors: (1) lithological (a
salt layer close to the surface), (2) hydrological (unsatu-
rated groundwater flowing in contact with the salt layer),
and (3) tectonic (fractures or faults allowing the unsatu-
rated water to flow in contact with the salt layer).
The latter model is widely accepted as the main mech-
anism of sinkhole formation. None of the models, however,
fully explains the sinkhole formation mechanism. Flushing
of the silt suspension into the DS is likely to pollute the
seawater. This has not been confirmed by observation in
Israel, but similar phenomena have been noted by Taq-
ieddin et al. (1999) along the Jordanian coast. The energy
of the flowing water is presumably insufficient for the
transport of such considerable soil mass (Yechieli et al.
2002; Frumkin and Raz 2001). The chemical salt dissolu-
tion from below is also problematic, because (1) no fresh or
under-saturated saline water was found in most boreholes
drilled at the sinkhole sites, and (2) the salt dissolution
model does not provide information about the internal
deformational erosion processes (caused, for example, by
sagging) discussed in the recent genetic sinkhole classifi-
cations (Gutierres et al. 2008).
Sinkhole formation involves two types of processes: (1)
dissolution and (2) deformation-internal erosion (Gutierres
et al. 2008). Dissolution alternate the shape of interfaces,
forms the cavities, whereas deformation causes fractures,
faults, etc. Suffusion increases the porosity and so on.
Thus, processes involved in sinkhole formation cause
changes in the properties and structure of the subsurface
material. Some of these changes can be detected by geo-
physical methods such as gravimetry, seismics, electrical
resistivity, etc. It was shown (Ezersky et al. 2006) that the
geophysical methods applied are very sensitive to the
anomalies that correspond to changes produced by disso-
lution and subsidence processes features. Subsidence, for
instance, of the salt top, was detected by the high-resolu-
tion reflection method in the Nahal Hever South (NHS)
site. Cave was detected using seismic diffraction imaging.
Prominent bowl-shaped resistivity anomalies of 300–
1,000 X m were detected at the Ein Gedi site above large
dissolution cavities (Ezersky 2008).
Within the framework of the NATO project related to
the sinkhole occurrence, a field study applying hydrogeo-
logical and geophysical methods has been conducted with
the aim of developing an integrated approach for assess-
ment of the natural hazards caused by the development of
sinkholes in the DS region of Israel and Jordan (Ezersky
et al. 2005). According to the main working hypothesis,
sinkhole formation is related to pre-existing karst cavity/
cavities developed within the salt. Sinkholes are formed by
cover collapse and suffusion into the karst. The formation
of karstic cavities is connected with the hydraulic con-
ductivity (permeability) of aquifers and the salinity of the
solution filling the pores.
The main objectives of the investigation include the
following: (1) salt layer mapping, (2) determination of the
resistivity structure of the subsurface associated with the
salinity of the groundwater (Yechieli et al. 2001), and (3)
characterization of the hydrogeology (the groundwater
level, water content, and hydraulic conductivity). The main
techniques used to study the hydrogeology of the sinkhole
development sites were the transient electromagnetic
(TEM) method in mapping mode [also referred to as the
time domain electromagnetic (TDEM) method] in combi-
nation with magnetic resonance sounding (MRS). The
seismic refraction method was used for mapping of the
subsurface salt layer.
Investigated area
The DS is the terminal lake of the Jordan River system,
located 420 m below sea level in an extremely arid envi-
ronment with an annual precipitation of 50–100 mm. Since
the early 1960s, large amounts of fresh water have been
diverted from Lake Kinneret and the Jordan River, result-
ing in a rapid drop in the DS level at rates of about 0.5 m/
year since the 1960s till 1980s and 0.8 m/year in the 1980s.
The drop in the DS level is accompanied by lowering of
groundwater level in the DS coastal area. Sinkhole devel-
opment sites are distributed along the DS shoreline
(Fig. 1a).
The hydrogeological hypothesis suggests that the low-
ering of the DS is accompanied by a corresponding
lowering of the groundwater level owing to a good
hydraulic connection between the DS and the western
aquifer system of the DS shore. The drop in the DS level
permits the intervention of low salinity groundwater into
coastal area (Yechieli and Gavrieli 2000). This water
causes dissolution of salt layers, up to 20 m thick, which
exist in the shore area at a depth of 25–50 m below the
1124 Environ Geol (2009) 58:1123–1141
123

surface. For a long period of time, these salt layers were
surrounded by very saline groundwater similar in compo-
sition to the DS water, whose total dissolved solids
[TDS] = 340 g/l. DS water also has very high (up to
224 g/l) chloride concentration, which constitutes 98% of
the anions (Cl-) with little sulphate and carbonate. It has to
be noted that chloride concentration is therefore the main
parameter used for characterization of the DS shore
groundwater (Yechieli 2000). Migration of the aforemen-
tioned fresh or unsaturated (in relation to Cl-) groundwater
into the coastal area has lead to their contact with the salt
layer and initiated the salt dissolution process (Frumkin
and Raz 2001; Yechieli et al. 2002).
The question is how the water comes into contact with
salt, which is supposed to be enveloped in clay. The
groundwater is characterized by very high salinity, similar
to DS water. Based on electrical resistivity (Fig. 1b),
hydrogeologists have identified several conventional inter-
faces separating zones of different salinity. These are brine,
zone III (with electrical resistivity q\ 1 X m) east of area,
toward the DS, and fresh (or brackish) water, zone I
(q[ 3 X m), west of the area. The intermediate zone II is
identified as diluted brine (with a resistivity of 1 X m \q\ 3 X m) (Kafri et al. 1997). The hypothetical model of
sinkhole formation suggests that these interfaces migrate
with the drop in the DS level. Zones designated as I–III in
1970 occupy positions I0–III0 in 2003. Consequently, the salt
edge comes into contact with unsaturated water with respect
to Cl. The studied NHS area is located in the central part of
the northern DS basin in Israel (Fig. 1a).
Geology
The stratigraphy of the NHS test site is composed of alluvial
fan sediments to a depth of 18 m, a 5-m-thick marl layer,
and an 11-m-thick salt layer. A clay and gravel formation
underlies the salt layer. The section visible at the scarp of
the sinkholes consists of sand and gravels with clay inter-
calations. Iron oxide mineralization is also visible (Arkin
and Gilat 2000). Three boreholes (HS-1, HS-2, and HS-3)
were drilled in the area.1 The stratigraphy of the HS-2 and
HS-3 boreholes is presented in Fig. 2a. Boreholes HS1 and
HS2 (drilled practically in the same location) detected the
salt layer at the depth interval of 24–35 m. In borehole HS-
3, 40 m away, a cavity filled with a dense mud was detected
at a depth of 24–28 m, which is assumed to be dissolution
cavity at the depth of the dissolved salt unit that appeared in
the HS-2 borehole. It should be noted that the surface at the
HS-3 borehole does not collapse till 2008. The water table
in the area was measured at a depth of 17.2 m in borehole
HS-1 in 1999 and at 18.5 m in borehole HS-3 2 years later.
The salinity of the groundwater is 76 g/l at the water table
Fig. 1 a Distribution of the sinkhole development sites along the Dead Sea shoreline in Israel and Jordan; b presumed hydrogeological model of
sinkhole formation in the western shore of the Dead Sea, with water resistivity zonation
1 Yechieli, GSI report no. GSI/08/2002 (in Hebrew).
Environ Geol (2009) 58:1123–1141 1125
123

and quickly increases with depth. At the salt depth, the
water contains 188–200 g/l Cl (i.e., *83–88% of saturated
degree). Eighteen sinkholes have formed in the southern
and central part of the area until 2005, and recently three
sinkhole swarms have developed rapidly in the northern
part of the NHS area (Fig. 2b).
Chronological summary of the occurrence of sinkholes
in Nahal Hever
Based on the time of their occurrence, four groups of
sinkholes can be identified: before 1999, 1999–2002,
2003–2005, and recent ones (Fig. 2b). It seems that the first
southern sinkholes (nos. 1–7) are aligned along short lines
(200–250 m long) with close azimuths of 300�. Sinkholes
of second group (nos. 9–12) are concentrated at the center
of area. Sinkholes of third group (nos. 14–17) are dissi-
pated at the southern part of the area. Sinkhole 5 is shown
in Fig. 2c. Later (1999–2002), subsidence number 3 and
sinkholes 9–12 were formed in the central part of the area
following the alignment of sinkholes 1–4 (Fig. 2b, d). After
2002, sinkholes 14–17 developed in the southern and
eastern part of the area. In December 2005, observations
revealed that in the southern part of the area the develop-
ment of sinkholes 14 and 15 was slowing down. Vast
vegetation developed at the bottom of sinkhole 15
(Fig. 2e). Other sinkholes at the center of the area contin-
ued to grow, and new sinkholes in the northern parts began
to collapse (Fig. 2f).
Features of the Nahal Hever South area revealed
by previous geophysical studies
In March 1999, when seven small sinkholes (1–2 m in
diameter and 0.5–1.0 m deep) existed at the area, a micro-
gravity study (Rybakov et al. 2001) revealed there a large
negative residual gravity anomaly with a size of approxi-
mately 50 9 80 m2 and an amplitude of -0.15 mGal. This
Fig. 2 a Geological section based on boreholes HS-2 and HS-3 situated 40 m apart and align in the north direction; b sinkhole distribution
throughout the Nahal Hever South area according to the time of their occurrence; c–g images of sinkholes (see text for explanations)
1126 Environ Geol (2009) 58:1123–1141
123

anomaly was interpreted as a subsurface dissolution caverns
within the salt layer, covered from above by a thin salt plate
shaped like a peak-cap (Fig. 3b). We will consider further
development of the anomaly in the ‘‘Pre-existing cavities’’
section.
Methods
Seismic refraction method
Seismic refraction allowed us to recognize and delineate a
salt layer. However, identification of the salt layer with the
seismic refraction method poses two important problems.
The first is the determination of the correct velocity crite-
rion, the second the generation of a proper geological
model (Ezersky 2006). A salt velocity criterion of Vpmin =
2,900 m/s (within the DS graben area) is accepted as the
statistically substantiated lower limit of compressional
wave velocity (Vp) for the central and southern parts of the
DS’s western shore. The geological model adopted for
geophysical mapping is illustrated in Fig. 3a.
This model is based on previously available seismic
refraction and geological data of the DS area (Ezersky
2006). The high velocity unit comes in contact with the
relatively low velocity unit at depths of approximately 20–
50 m. There are lateral velocity variations along the
refractor. Unconsolidated sediments (alluvium) overlay
this unit. Mapping of the salt–alluvium boundary is the
main objective of this study. Salt edge coming in contact
with sediments has been found to be shaped either like a
‘‘peak-cap’’ (Fig. 3b) or like a ‘‘wall’’ (Fig. 3c). Peak
thickness found at boreholes EG-7 and EG-13 varies within
a range of 2–4 m.
We interpreted seismic refraction data using the general
reciprocal method (GRM). The GRM is suitable for map-
ping subsurface layer-boundaries, because it is based on the
principle of refraction migration, permitting determination
of the detailed geometry of the refractor and providing
information about lateral velocity variations (Palmer 1986).
We applied the GRM to map the salt–alluvium boundary.
Data acquisition was carried out with the 48-channel
StrataView seismic recorder of Geometrics (Canada). We
used a 48-geophone spreads with 2.5, 5, and 10 m sepa-
rations between geophones. The DIGIPULSE source was
applied at five points on every refraction line, according to
the GRM technique: at both ends of the spread (zero-off-
sets), within the spread (split), and at a certain distance
from each end (offsets). The shot offset distance was
approximately half of the spread length. Geophones of
Fig. 3 a Hypothetical geological model of the salt unit; b, c verified models of the salt edge ‘‘peak-cap’’ and ‘‘wall’’ type, respectively; 1 salt, 2clay, 3 sandy sediments
Environ Geol (2009) 58:1123–1141 1127
123
10 Hz (vertical) and 8 Hz (horizontal) were used as seis-
mic sensors. The data processing was carried out using the
REFRINT software (Shtivelman 1995), which implements
two methods of interpretation: the GRM and the slope
intercept method (SIM).
Because the studied area is characterized by a smooth
topography, the accuracy of the depth of the interface was
determined by the dip of the refractor top. Where the
maximum angle of the refractor dip is less than 20�, the
GRM provides estimates of refractor velocities within 5%
accuracy (Palmer 1986). Accuracy is lower when interfaces
are sharp. The accuracy of the location of a vertical
boundary between various refractor blocks (edge of the salt
layer) generally depends on velocity contrast, the depth to
the refractor, and the separation between geophones. For
our model, accuracy did not exceed two to three separa-
tions between geophones. Determination of the depth of the
horizontal interface (salt layer top) is less exact and
depends on the velocity contrast between layers and the
accuracy in the determination of the velocity of each layer
located above the refractor.
According to our experience, the difference between
refractor depth based on seismic measurements and the salt
top depth found in boreholes accuracy is higher than 10%.
To increase the reliability of the survey, we performed
seismic measurements along five of the 15 intersecting
pairs of lines that have been studied in the NHS area
between 2005 and 2007.
Magnetic resonance sounding
MRS is a method sensitive specifically to groundwater
(Legchenko et al. 2004). To perform the MRS measure-
ments, the protons of hydrogen in the groundwater
molecules are energized by a pulse of alternating current
generated in the surface loop of the device. The magnetic
resonance signal is returned by the protons after the exci-
tation current is turned off. One sounding consists of
measuring the MRS signal for different values of current in
the loop. Two main parameters are derived from MRS
measurements (Lachassagne et al. 2005): (1) the MRS
water content (w), which is closely related to the amplitude
of the MRS signal; (2) the MRS relaxation time T1.
Assuming a horizontal stratification, the inversion of
sounding data provides an estimate of the water content
w(z), and the relaxation time T1(z) as a function of depth (z)
(Legchenko and Shushakov 1998). The combination of the
MRS water content and relaxation time enables estimation
of the soil’s hydraulic conductivity (permeability) as
KMRS ¼ CpwT21 ;, with Cp being an empirical constant.
Hydraulic conductivity is a scale-dependent parameter.
Taking into account that MRS results are averaged over a
large area defined by the loop size, pumping tests, which
also provide results averaged over a large volume, are used
for calibration. These MRS parameters can be linked to the
following hydrogeological parameters (Lachassagne et al.
2005): porosity (u, dimensionless); Darcy’s permeability
[L2] [or hydraulic conductivity K (L/T)]; transmissivity T
[L2/T], which is equal to the coefficient of hydraulic con-
ductivity of an aquifer multiplied by its thickness measured
perpendicularly to the direction of the flow, most fre-
quently along the Z axis (L is distance and T is the time).
MRS is an efficient tool for characterizing aquifers as
well as for locating water-filled voids in the subsurface
(Vouillamoz et al. 2003). The relaxation time T1 is the most
reliable parameter for identifying water in voids. The MRS
signal generated by water-filling cavities is characterized
by a long relaxation time (T1 ? 1,000 ms); the signal
returned by water in a porous medium has a shorter
relaxation time (T1 \ 400 ms).
In practice, a karst aquifer is generally composed of karst
conduits and caverns (T1 ? 1,000 ms) and of porous
medium (T1 \ 400 ms). The MRS signal measured from
such an aquifer depends on the ratio between bulk water in
the karst conduits and water in the rock. A high value of the
apparent relaxation time T1ap ([500 ms) can be considered
as a karst signature. Inversion of MRS data for T1 values can
be used to detect karst conduits within the porous water-
saturated rock also when the apparent T1ap \ 500 ms.
All MRS measurements were carried out using the
NUMISplus MRS system developed by IRIS Instruments
(France). In the DS area, interpretation of MRS data
requires knowledge of the electrical conductivity of the
subsurface, and therefore, each MRS measurement was
accompanied by Transient EM measurements.
Transient electromagnetic method
TEM [also referred to as the time domain electromagnetic
method] is sensitive specifically to bulk resistivity (con-
ductivity) of the studied medium, especially in the range of
low resistivity (Kaufman 1978). This method is used
extensively in Israel for the localization of the fresh water–
saline water interface in coastal areas (Kafri et al. 1997;
Yechieli 2000; Yechieli et al. 2001). Generally, resistivity
of the subsurface depends on some parameters, most
important of which are salinity of the fluid in the pores and
porosity. Kafri et al. (1997) have shown that a bulk resis-
tivity of 1 X m or less is typical of the concentrated brine
in the DS region, reflecting sediments that contain DS brine
or slightly diluted brine. The TEM method usually identi-
fies the sharp interface unambiguously. Consistent with the
hydrogeological model presented in Fig. 1b, 1 X m resis-
tivity isolines form the top of the DS brine layer. In
addressing the DS sinkhole problem, it is important to
know the location of this interface and its configuration
1128 Environ Geol (2009) 58:1123–1141
123
relative to the salt edge to estimate the possibility of salt
dissolution (Yechieli et al. 2001). Therefore, the 1 X m
surface is an important reference to define the structure and
geometry of the upper surface (top) of sediments saturated
with the DS brine.
Quantitative interpretation of the results is based on the
modified Archie’s Law (Archie 1942), which establishes
that in partially saturated soil with ionic pore water con-
ductivity, bulk electrical resistivity depends on porosity,
pore volume occupied by the fluid, and the resistivity of the
fluid filling the pore space. In case of partially saturated
medium, bulk resistivity is expressed as
qx ¼ aqwS�n/�m ð1Þ
where qw is the resistivity of the solution filling the pores,
/ is the porosity, S = Vel/VR is a fraction of the total pore
volume filled with the same solution (referred to also as
degree of soil pore filling), Vel is the volume of the solution
in the pores, VR is the total pore volume per unit volume of
soil, and n is an empirical parameter termed the saturation
exponent (usually with a value of approximately 2).
Parameters a and m appear to depend on the cross-
section geometry of the pores along the flow path. The
value of parameter a varies mostly within range of 0.6–1.4.
Parameter m varies within the range of 1.37–1.95. In case
of complete pore space saturation, parameter S = 1 and
Eq. 1 becomes the conventional Archie’s Law:
qx ¼ aqw/�m ð2Þ
The TEM method can be used for vertical sounding or
profiling. A procedure commonly applied for ground
exploration with transient techniques involves laying a
square loop in the vicinity of the area to be examined and
performing soundings or profilings (McNeill 1980b). In our
study, coincident loop configuration was used (Barsukov
et al. 2006) when the same loop serves both as transmitter
(Tx) and receiver (Rx). Because sinkhole development
seems to be related to dimensional variations in water
salinity and to the geometry of the 1 X m interfaces, ideally
3D measurements should be performed, but the necessary
technology is still under development, and both fieldwork
and data processing are very costly. In our case, dimensional
multisoundings (quasi-3D) served as a substitute for
3D measurements, and results must be interpreted with
some caution. Evaluation of the commercially available
equipment worldwide has shown that the TEM FAST
48HPC is a highly efficient system packaged in a light
portable unit that uses a single Rx/Tx loop. The system
supports the coincident loop configuration that accelerates
data acquisition in the field. The specifications of the TEM
FAST 48 HPC system can be found in the TEM FAST
manual (AEMR 2005a). The principles of the method are
described by Barsukov et al. (2006).
The TEM measurements were interpreted using two
commercially available 1D inversion software packages.
TEM-RESEARCHER is designed for modeling and
inversion of large TEM sounding data sets (AEMR 2005b).
For more accurate estimations of the selected inversion
results, we used the IX1D software from Interpex (2006).
Results
Mapping of compact salt by seismic measurement
The salt location map based on seismic compressional
wave velocities is shown in Fig. 4. A map based on five
refraction lines shows the velocity distribution throughout
the central part of the area in the year 2000 (solid thick
line). A map based on 15 seismic refraction lines (50–100
m apart), added in 2005–2007, has extended the previously
mapped area and enabled comparison of the salt distribu-
tion in 2000 and 2007. The low-velocity zone (Vp \2,750 m/s) associated with either a no salt or a dissolved
salt area has a complicated distribution. Borehole HS-3
crosses a dense mud 5 m thick at a depth of 24–29 m
(Fig. 2a), located within this low velocity zone. As a result,
we can identify an area with a velocity of less than
2,750 m/s with no salt (Ezersky 2006). Borehole HS-2,
drilled in a zone with a velocity of more than 2,900 m/s,
crosses a salt layer 11 m thick at a depth interval of 24–
35 m. We can therefore identify the compact salt unit with
a velocity greater than 2,900 m/s. The seismic velocity
map in Fig. 4 shows that sinkholes in the southern part of
the area (nos. 6, 7, 14, 15, 16, and 17) are located within
the high-velocity area (2,900–3,520 m/s), which differs
substantially from the northern part of the area (sinkhole
nos. 4, 9, 10, 12, and above), as well as from other sites
surveyed along the DS coast, where sinkholes are typically
arranged to the west of the salt edge in zones interpreted as
salt dissolution areas (Ezersky 2006; Ezersky et al. 2007).
A portion of the sinkholes discovered in 2000 (1, 2, 3, 13)
was located close to the salt edge, along both sides of it.
Magnetic resonance sounding results
The MRS study, aimed at characterizing the aquifer in the
sinkhole development area, was performed at the NHS site
in 2005 (Legchenko et al. 2008a). A total of 14 MRS
soundings were carried out with a loop of 100 9 100 m2.
The location of the MRS stations is shown in Fig. 5. In
NHS, MRS revealed two different zones: (1) in the central
and northern part there is an aquifer, which has karstic
features, and 2) a low permeability material at a depth of
30–35 m in the southern part.
Environ Geol (2009) 58:1123–1141 1129
123

The long relaxation times (T1 [ 1,000 ms) are the
unambiguous signature of bulk water in the subsurface
(Vouillamoz et al. 2003). Depending on the rocks, the bulk
water may be interpreted as a karst aquifer or as water-
saturated gravel. Considering the geology, the aquifer
detected by MRS6 and MRS9 stations was interpreted as a
karst aquifer with water-filled cavities (Legchenko et al.
2008b). The MRS indicates that the karstic caves are
located at the depth of 25–35 m, corresponding to the
position of the salt layer revealed by borehole HS-2 and
seismic investigation results. The map of maximum T1
value distributions (Fig. 6 a) delineates the karst zone. 3D
targets (like karst cavities) cannot be accurately resolved
using a 1D survey and interpretation design. Consequently,
the white dashed line in Fig. 6 delineates approximate limit
of karstified salt. In the northern part of the investigated
area, the limit of the karst zone was not defined. In the
southern part, compact clay-type material with low water
content and a short T1 was detected at MRS2, MRS11,
MRS12, and MRS15 stations. Thus, the MRS data reliably
confirm the absence of an aquifer in the southern part of the
area to a depth of 30–35 m, and no cavities were detected
in that sector.
In 2007, MRS measurements conducted in the same
positions as in 2005 enabled the estimation of changes in
hydrogeological parameter values. These changes are
shown in Fig. 7 as maps of variations of hydraulic con-
ductivity (Fig. 7a) and T1 relaxation time (Fig. 7b).
For calibration of MRS transmissivity and hydraulic
conductivity, three boreholes (AR-3, EG-6, and EG-8) with
pumping tests carried out by the Geological Survey of
Israel (GSI)2 in Ein Gedi-Arugot area have been used. In
these boreholes, the pumping tests reveal the transmissivity
Fig. 4 Map of the salt edge
based on seismic refraction lines
acquired in 2000–2007: areas
with a velocity higher than
2,900 m/s are identified as
compact salt, whereas areas
with a velocity lower than
2,750 m/s are interpreted as
loose water-saturated sediments
2 Volman et al. (2003), Stage B, Report GSI/42/2003 (in Hebrew).
1130 Environ Geol (2009) 58:1123–1141
123

of 0.96E-2, 1.8E-2, and 1.9E-2 m2/s, respectively. The
average value yields 1.58E-2 m2/s. MRS station is located
at about 300 m from these boreholes. After boreholes, the
empirical constant is set at Cp = 7.5E-8 and the MRS
transmissivity is estimated as 1.6 ± 0.8E-2 m2/s. Three
boreholes (HS-1, HS-2, and HS-3) were drilled by GSI in
Nahal Hever. Very low yield was observed during the
pumping tests and consequently the transmissivity was not
measured. Two MRS stations around these boreholes
reveal the transmissivity of 3.5E-5 and 4.5E-4 m2/s. Hence,
MRS results in the studied areas are qualitatively in
agreement with the borehole data.
Figure 7 shows that the relaxation time at the MRS6
station decreased from 1,050 ms in 2005 to 300 ms in
Fig. 5 Location of the MRS
stations, boreholes, and known
sinkholes in 2005
Fig. 6 Maps of maximum T1 relaxation time (a) and transmissivity (b), and the approximate limit of karstified salt (white dashed line)
Environ Geol (2009) 58:1123–1141 1131
123

2007, and hydraulic conductivity value decreased by a
factor of 6 in the same period. This is unambiguous evi-
dence that the karst cavities were filled by collapsed
sediments after the sinkhole formation. Figure 7 shows
also that the values of hydraulic conductivity (K) in the
central part of the area (interpreted as the DS aquifer)
decreased during the same 2 years by a factor of 5–10,
whereas at the margins of the sinkhole formation area,
these parameters remained at a low level, close to the
sensitivity of the equipment.
The top of the aquifer derived from MRS data inversion
is presented in Fig. 8. MRS stations MRS12 and MRS15
reveal an absence of aquifers. For this raison, the top of the
aquifer does not appear on the maps at southern MRS
stations.
The conventional 2D map in Fig. 8a shows the topog-
raphy of the top of the water table. Above the main cavern
(MRS6 station), the water top is deeper (coinciding with
the top of the aquifer). The same map in 3D presentation
shows this more conspicuously in Fig. 8b. Based on these
Fig. 7 Changes in hydraulic conductivity (K) map (a) and T1 relaxation time map (b) between October 2005 and March 2007
Fig. 8 The top of the MRS detected water in 2D (a) and 3D (b) in Nahal Hever South
1132 Environ Geol (2009) 58:1123–1141
123
maps, we can conclude that the water above the karst
cavities is drained from the unsaturated zone into the
cavern.
TEM FAST results
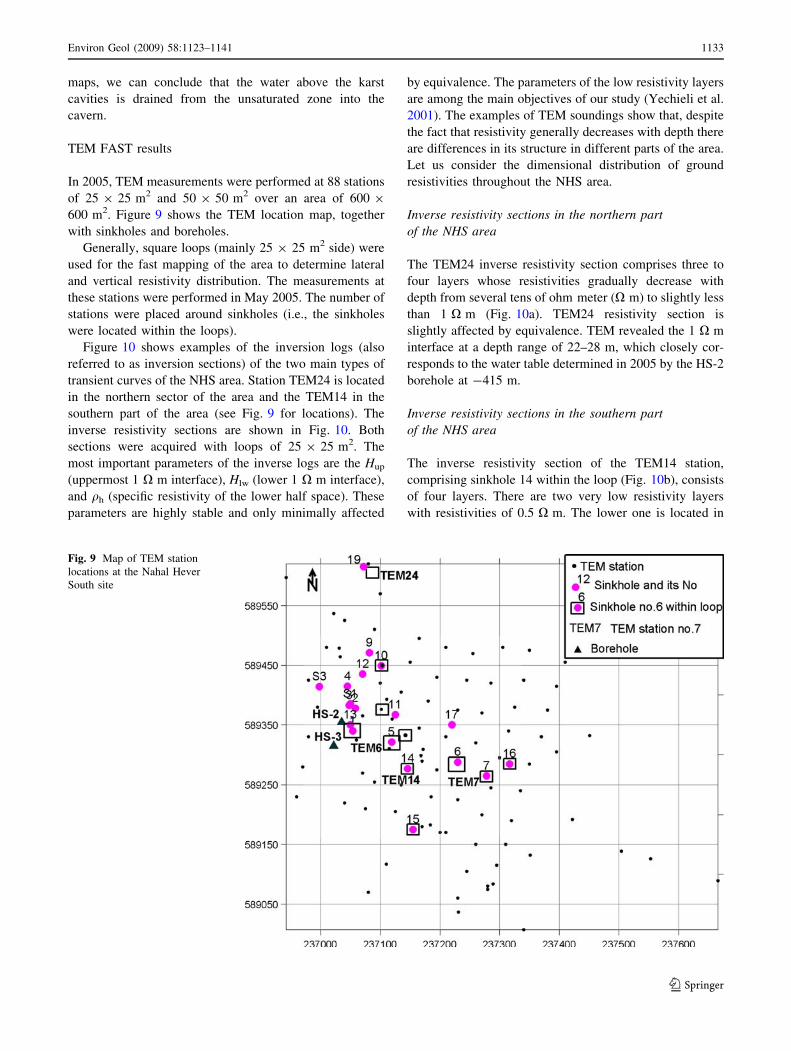
In 2005, TEM measurements were performed at 88 stations
of 25 9 25 m2 and 50 9 50 m2 over an area of 600 9
600 m2. Figure 9 shows the TEM location map, together
with sinkholes and boreholes.
Generally, square loops (mainly 25 9 25 m2 side) were
used for the fast mapping of the area to determine lateral
and vertical resistivity distribution. The measurements at
these stations were performed in May 2005. The number of
stations were placed around sinkholes (i.e., the sinkholes
were located within the loops).
Figure 10 shows examples of the inversion logs (also
referred to as inversion sections) of the two main types of
transient curves of the NHS area. Station TEM24 is located
in the northern sector of the area and the TEM14 in the
southern part of the area (see Fig. 9 for locations). The
inverse resistivity sections are shown in Fig. 10. Both
sections were acquired with loops of 25 9 25 m2. The
most important parameters of the inverse logs are the Hup
(uppermost 1 X m interface), Hlw (lower 1 X m interface),
and qh (specific resistivity of the lower half space). These
parameters are highly stable and only minimally affected
by equivalence. The parameters of the low resistivity layers
are among the main objectives of our study (Yechieli et al.
2001). The examples of TEM soundings show that, despite
the fact that resistivity generally decreases with depth there
are differences in its structure in different parts of the area.
Let us consider the dimensional distribution of ground
resistivities throughout the NHS area.
Inverse resistivity sections in the northern part
of the NHS area
The TEM24 inverse resistivity section comprises three to
four layers whose resistivities gradually decrease with
depth from several tens of ohm meter (X m) to slightly less
than 1 X m (Fig. 10a). TEM24 resistivity section is
slightly affected by equivalence. TEM revealed the 1 X m
interface at a depth range of 22–28 m, which closely cor-
responds to the water table determined in 2005 by the HS-2
borehole at -415 m.
Inverse resistivity sections in the southern part
of the NHS area
The inverse resistivity section of the TEM14 station,
comprising sinkhole 14 within the loop (Fig. 10b), consists
of four layers. There are two very low resistivity layers
with resistivities of 0.5 X m. The lower one is located in
Fig. 9 Map of TEM station
locations at the Nahal Hever
South site
Environ Geol (2009) 58:1123–1141 1133
123
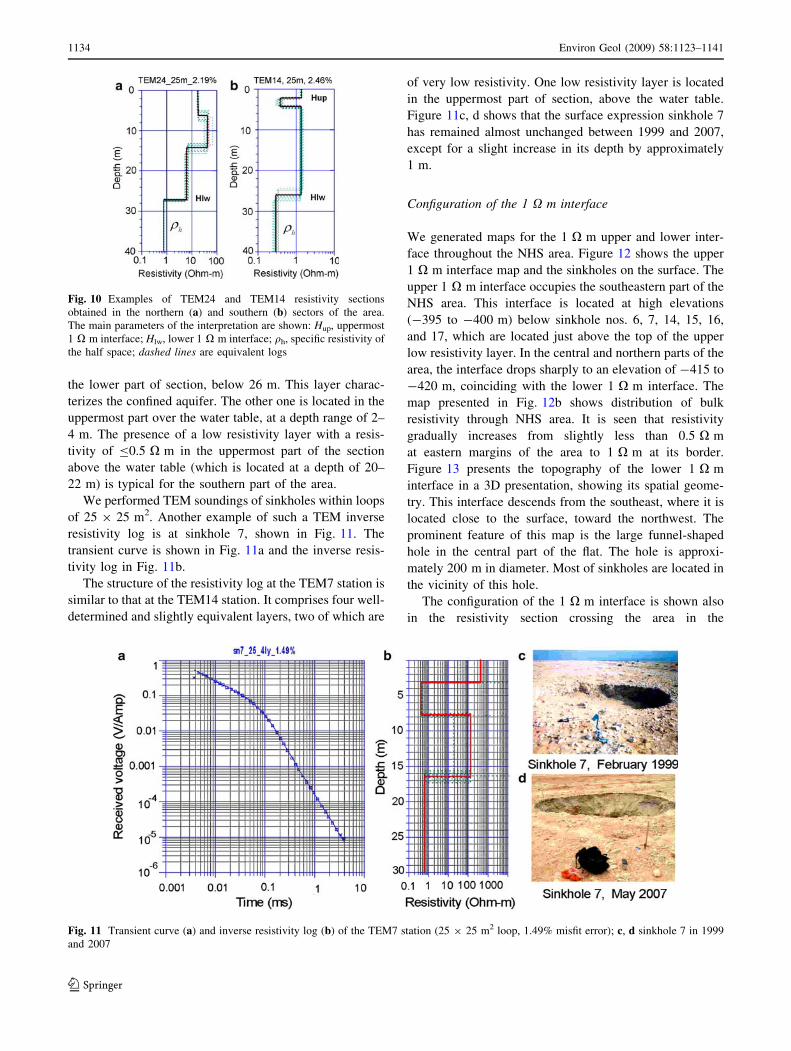
the lower part of section, below 26 m. This layer charac-
terizes the confined aquifer. The other one is located in the
uppermost part over the water table, at a depth range of 2–
4 m. The presence of a low resistivity layer with a resis-
tivity of B0.5 X m in the uppermost part of the section
above the water table (which is located at a depth of 20–
22 m) is typical for the southern part of the area.
We performed TEM soundings of sinkholes within loops
of 25 9 25 m2. Another example of such a TEM inverse
resistivity log is at sinkhole 7, shown in Fig. 11. The
transient curve is shown in Fig. 11a and the inverse resis-
tivity log in Fig. 11b.
The structure of the resistivity log at the TEM7 station is
similar to that at the TEM14 station. It comprises four well-
determined and slightly equivalent layers, two of which are
of very low resistivity. One low resistivity layer is located
in the uppermost part of section, above the water table.
Figure 11c, d shows that the surface expression sinkhole 7
has remained almost unchanged between 1999 and 2007,
except for a slight increase in its depth by approximately
1 m.
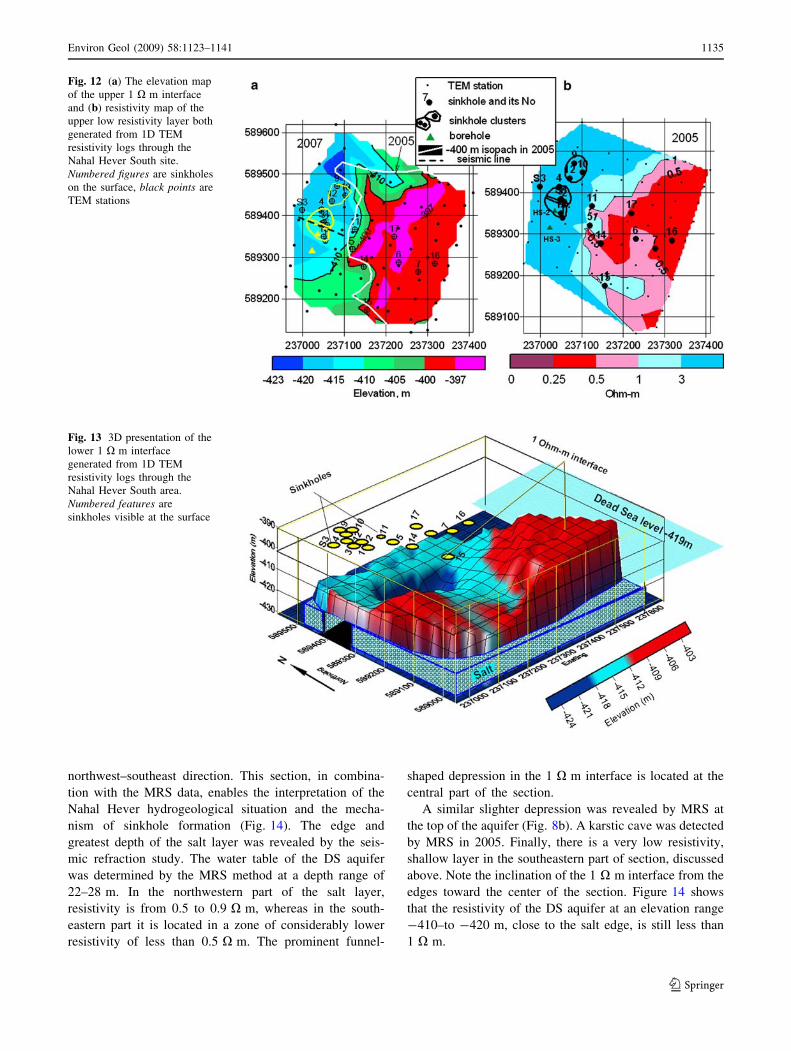
Configuration of the 1 X m interface
We generated maps for the 1 X m upper and lower inter-
face throughout the NHS area. Figure 12 shows the upper
1 X m interface map and the sinkholes on the surface. The
upper 1 X m interface occupies the southeastern part of the
NHS area. This interface is located at high elevations
(-395 to -400 m) below sinkhole nos. 6, 7, 14, 15, 16,
and 17, which are located just above the top of the upper
low resistivity layer. In the central and northern parts of the
area, the interface drops sharply to an elevation of -415 to
-420 m, coinciding with the lower 1 X m interface. The
map presented in Fig. 12b shows distribution of bulk
resistivity through NHS area. It is seen that resistivity
gradually increases from slightly less than 0.5 X m
at eastern margins of the area to 1 X m at its border.
Figure 13 presents the topography of the lower 1 X m
interface in a 3D presentation, showing its spatial geome-
try. This interface descends from the southeast, where it is
located close to the surface, toward the northwest. The
prominent feature of this map is the large funnel-shaped
hole in the central part of the flat. The hole is approxi-
mately 200 m in diameter. Most of sinkholes are located in
the vicinity of this hole.
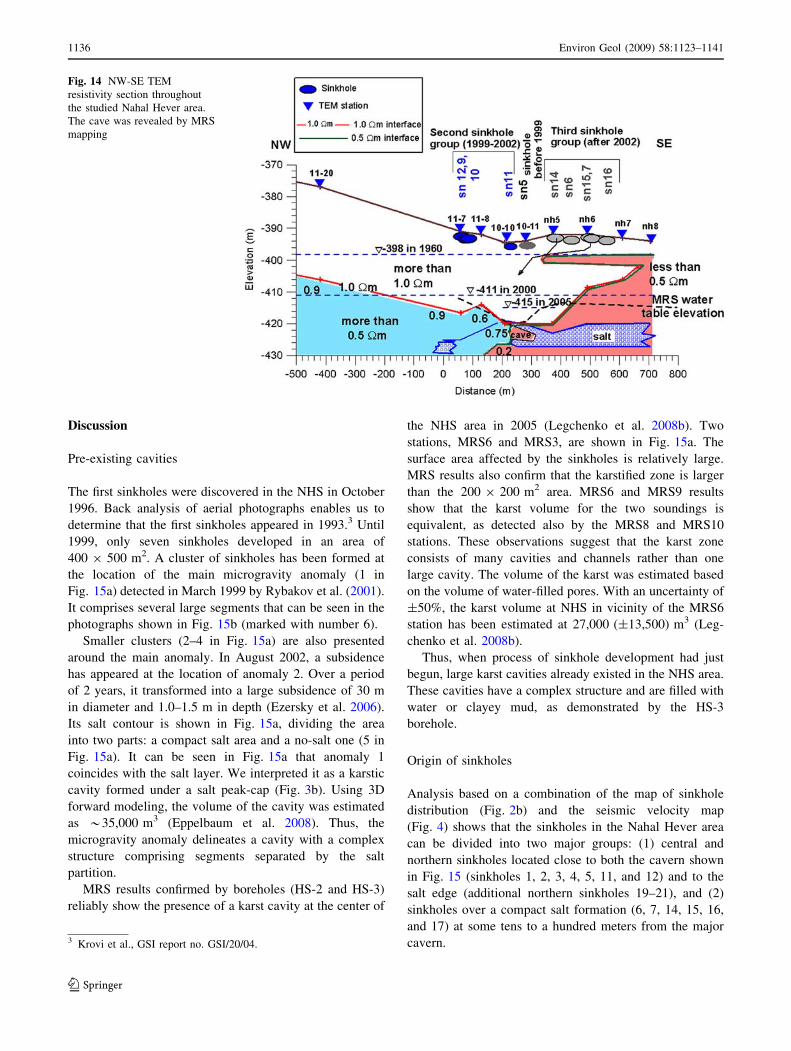
The configuration of the 1 X m interface is shown also
in the resistivity section crossing the area in the
Fig. 10 Examples of TEM24 and TEM14 resistivity sections
obtained in the northern (a) and southern (b) sectors of the area.
The main parameters of the interpretation are shown: Hup, uppermost
1 X m interface; Hlw, lower 1 X m interface; qh, specific resistivity of
the half space; dashed lines are equivalent logs
Fig. 11 Transient curve (a) and inverse resistivity log (b) of the TEM7 station (25 9 25 m2 loop, 1.49% misfit error); c, d sinkhole 7 in 1999
and 2007
1134 Environ Geol (2009) 58:1123–1141
123
northwest–southeast direction. This section, in combina-
tion with the MRS data, enables the interpretation of the
Nahal Hever hydrogeological situation and the mecha-
nism of sinkhole formation (Fig. 14). The edge and
greatest depth of the salt layer was revealed by the seis-
mic refraction study. The water table of the DS aquifer
was determined by the MRS method at a depth range of
22–28 m. In the northwestern part of the salt layer,
resistivity is from 0.5 to 0.9 X m, whereas in the south-
eastern part it is located in a zone of considerably lower
resistivity of less than 0.5 X m. The prominent funnel-
shaped depression in the 1 X m interface is located at the
central part of the section.
A similar slighter depression was revealed by MRS at
the top of the aquifer (Fig. 8b). A karstic cave was detected
by MRS in 2005. Finally, there is a very low resistivity,
shallow layer in the southeastern part of section, discussed
above. Note the inclination of the 1 X m interface from the
edges toward the center of the section. Figure 14 shows
that the resistivity of the DS aquifer at an elevation range
-410–to -420 m, close to the salt edge, is still less than
1 X m.
Fig. 12 (a) The elevation map
of the upper 1 X m interface
and (b) resistivity map of the
upper low resistivity layer both
generated from 1D TEM
resistivity logs through the
Nahal Hever South site.
Numbered figures are sinkholes
on the surface, black points are
TEM stations
Fig. 13 3D presentation of the
lower 1 X m interface
generated from 1D TEM
resistivity logs through the
Nahal Hever South area.
Numbered features are
sinkholes visible at the surface
Environ Geol (2009) 58:1123–1141 1135
123
Discussion
Pre-existing cavities
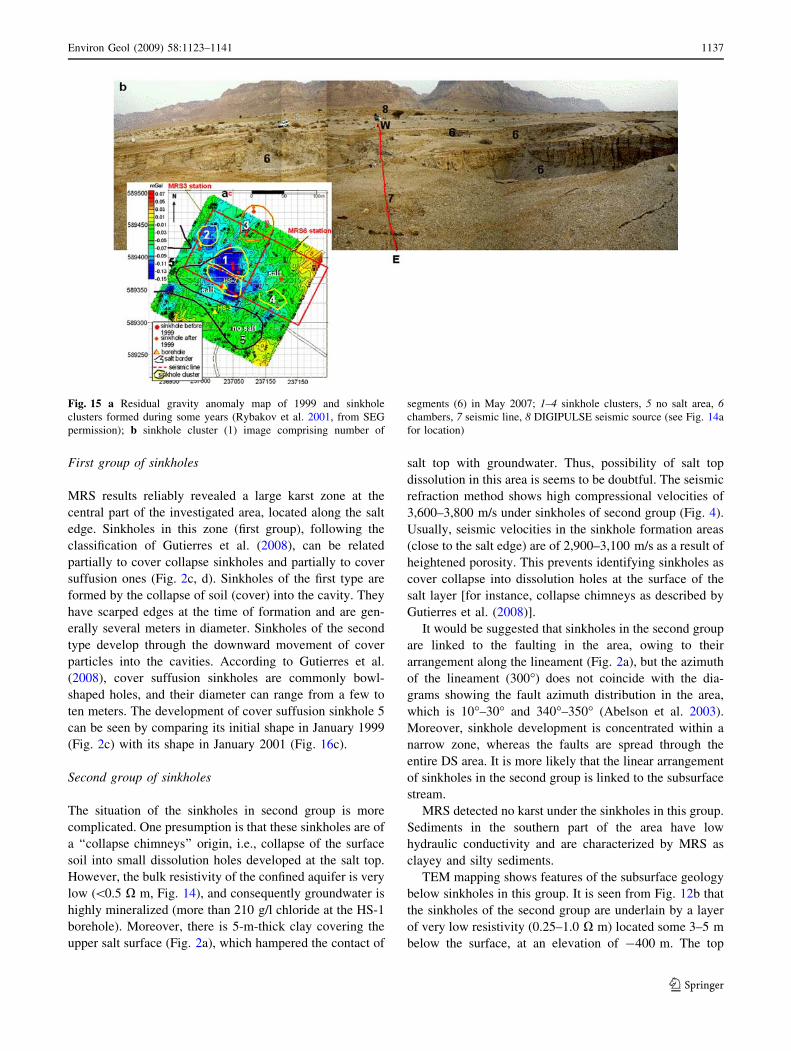
The first sinkholes were discovered in the NHS in October
1996. Back analysis of aerial photographs enables us to
determine that the first sinkholes appeared in 1993.3 Until
1999, only seven sinkholes developed in an area of
400 9 500 m2. A cluster of sinkholes has been formed at
the location of the main microgravity anomaly (1 in
Fig. 15a) detected in March 1999 by Rybakov et al. (2001).
It comprises several large segments that can be seen in the
photographs shown in Fig. 15b (marked with number 6).
Smaller clusters (2–4 in Fig. 15a) are also presented
around the main anomaly. In August 2002, a subsidence
has appeared at the location of anomaly 2. Over a period
of 2 years, it transformed into a large subsidence of 30 m
in diameter and 1.0–1.5 m in depth (Ezersky et al. 2006).
Its salt contour is shown in Fig. 15a, dividing the area
into two parts: a compact salt area and a no-salt one (5 in
Fig. 15a). It can be seen in Fig. 15a that anomaly 1
coincides with the salt layer. We interpreted it as a karstic
cavity formed under a salt peak-cap (Fig. 3b). Using 3D
forward modeling, the volume of the cavity was estimated
as *35,000 m3 (Eppelbaum et al. 2008). Thus, the
microgravity anomaly delineates a cavity with a complex
structure comprising segments separated by the salt
partition.
MRS results confirmed by boreholes (HS-2 and HS-3)
reliably show the presence of a karst cavity at the center of
the NHS area in 2005 (Legchenko et al. 2008b). Two
stations, MRS6 and MRS3, are shown in Fig. 15a. The
surface area affected by the sinkholes is relatively large.
MRS results also confirm that the karstified zone is larger
than the 200 9 200 m2 area. MRS6 and MRS9 results
show that the karst volume for the two soundings is
equivalent, as detected also by the MRS8 and MRS10
stations. These observations suggest that the karst zone
consists of many cavities and channels rather than one
large cavity. The volume of the karst was estimated based
on the volume of water-filled pores. With an uncertainty of
±50%, the karst volume at NHS in vicinity of the MRS6
station has been estimated at 27,000 (±13,500) m3 (Leg-
chenko et al. 2008b).
Thus, when process of sinkhole development had just
begun, large karst cavities already existed in the NHS area.
These cavities have a complex structure and are filled with
water or clayey mud, as demonstrated by the HS-3
borehole.
Origin of sinkholes
Analysis based on a combination of the map of sinkhole
distribution (Fig. 2b) and the seismic velocity map
(Fig. 4) shows that the sinkholes in the Nahal Hever area
can be divided into two major groups: (1) central and
northern sinkholes located close to both the cavern shown
in Fig. 15 (sinkholes 1, 2, 3, 4, 5, 11, and 12) and to the
salt edge (additional northern sinkholes 19–21), and (2)
sinkholes over a compact salt formation (6, 7, 14, 15, 16,
and 17) at some tens to a hundred meters from the major
cavern.
Fig. 14 NW-SE TEM
resistivity section throughout
the studied Nahal Hever area.
The cave was revealed by MRS
mapping
3 Krovi et al., GSI report no. GSI/20/04.
1136 Environ Geol (2009) 58:1123–1141
123
First group of sinkholes
MRS results reliably revealed a large karst zone at the
central part of the investigated area, located along the salt
edge. Sinkholes in this zone (first group), following the
classification of Gutierres et al. (2008), can be related
partially to cover collapse sinkholes and partially to cover
suffusion ones (Fig. 2c, d). Sinkholes of the first type are
formed by the collapse of soil (cover) into the cavity. They
have scarped edges at the time of formation and are gen-
erally several meters in diameter. Sinkholes of the second
type develop through the downward movement of cover
particles into the cavities. According to Gutierres et al.
(2008), cover suffusion sinkholes are commonly bowl-
shaped holes, and their diameter can range from a few to
ten meters. The development of cover suffusion sinkhole 5
can be seen by comparing its initial shape in January 1999
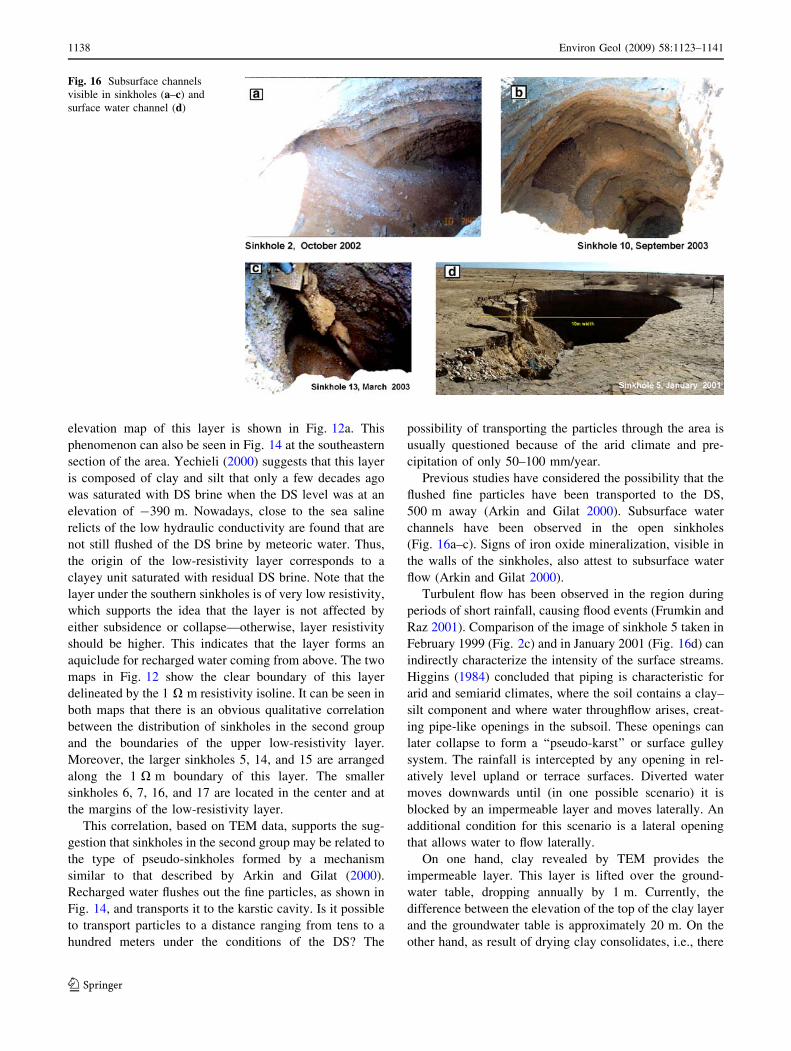
(Fig. 2c) with its shape in January 2001 (Fig. 16c).
Second group of sinkholes
The situation of the sinkholes in second group is more
complicated. One presumption is that these sinkholes are of
a ‘‘collapse chimneys’’ origin, i.e., collapse of the surface
soil into small dissolution holes developed at the salt top.
However, the bulk resistivity of the confined aquifer is very
low (\0.5 X m, Fig. 14), and consequently groundwater is
highly mineralized (more than 210 g/l chloride at the HS-1
borehole). Moreover, there is 5-m-thick clay covering the
upper salt surface (Fig. 2a), which hampered the contact of
salt top with groundwater. Thus, possibility of salt top
dissolution in this area is seems to be doubtful. The seismic
refraction method shows high compressional velocities of
3,600–3,800 m/s under sinkholes of second group (Fig. 4).
Usually, seismic velocities in the sinkhole formation areas
(close to the salt edge) are of 2,900–3,100 m/s as a result of
heightened porosity. This prevents identifying sinkholes as
cover collapse into dissolution holes at the surface of the
salt layer [for instance, collapse chimneys as described by
Gutierres et al. (2008)].
It would be suggested that sinkholes in the second group
are linked to the faulting in the area, owing to their
arrangement along the lineament (Fig. 2a), but the azimuth
of the lineament (300�) does not coincide with the dia-
grams showing the fault azimuth distribution in the area,
which is 10�–30� and 340�–350� (Abelson et al. 2003).
Moreover, sinkhole development is concentrated within a
narrow zone, whereas the faults are spread through the
entire DS area. It is more likely that the linear arrangement
of sinkholes in the second group is linked to the subsurface
stream.
MRS detected no karst under the sinkholes in this group.
Sediments in the southern part of the area have low
hydraulic conductivity and are characterized by MRS as
clayey and silty sediments.
TEM mapping shows features of the subsurface geology
below sinkholes in this group. It is seen from Fig. 12b that
the sinkholes of the second group are underlain by a layer
of very low resistivity (0.25–1.0 X m) located some 3–5 m
below the surface, at an elevation of -400 m. The top
Fig. 15 a Residual gravity anomaly map of 1999 and sinkhole
clusters formed during some years (Rybakov et al. 2001, from SEG
permission); b sinkhole cluster (1) image comprising number of
segments (6) in May 2007; 1–4 sinkhole clusters, 5 no salt area, 6chambers, 7 seismic line, 8 DIGIPULSE seismic source (see Fig. 14a
for location)
Environ Geol (2009) 58:1123–1141 1137
123
elevation map of this layer is shown in Fig. 12a. This
phenomenon can also be seen in Fig. 14 at the southeastern
section of the area. Yechieli (2000) suggests that this layer
is composed of clay and silt that only a few decades ago
was saturated with DS brine when the DS level was at an
elevation of -390 m. Nowadays, close to the sea saline
relicts of the low hydraulic conductivity are found that are
not still flushed of the DS brine by meteoric water. Thus,
the origin of the low-resistivity layer corresponds to a
clayey unit saturated with residual DS brine. Note that the
layer under the southern sinkholes is of very low resistivity,
which supports the idea that the layer is not affected by
either subsidence or collapse—otherwise, layer resistivity
should be higher. This indicates that the layer forms an
aquiclude for recharged water coming from above. The two
maps in Fig. 12 show the clear boundary of this layer
delineated by the 1 X m resistivity isoline. It can be seen in
both maps that there is an obvious qualitative correlation
between the distribution of sinkholes in the second group
and the boundaries of the upper low-resistivity layer.
Moreover, the larger sinkholes 5, 14, and 15 are arranged
along the 1 X m boundary of this layer. The smaller
sinkholes 6, 7, 16, and 17 are located in the center and at
the margins of the low-resistivity layer.
This correlation, based on TEM data, supports the sug-
gestion that sinkholes in the second group may be related to
the type of pseudo-sinkholes formed by a mechanism
similar to that described by Arkin and Gilat (2000).
Recharged water flushes out the fine particles, as shown in
Fig. 14, and transports it to the karstic cavity. Is it possible
to transport particles to a distance ranging from tens to a
hundred meters under the conditions of the DS? The
possibility of transporting the particles through the area is
usually questioned because of the arid climate and pre-
cipitation of only 50–100 mm/year.
Previous studies have considered the possibility that the
flushed fine particles have been transported to the DS,
500 m away (Arkin and Gilat 2000). Subsurface water
channels have been observed in the open sinkholes
(Fig. 16a–c). Signs of iron oxide mineralization, visible in
the walls of the sinkholes, also attest to subsurface water
flow (Arkin and Gilat 2000).
Turbulent flow has been observed in the region during
periods of short rainfall, causing flood events (Frumkin and
Raz 2001). Comparison of the image of sinkhole 5 taken in
February 1999 (Fig. 2c) and in January 2001 (Fig. 16d) can
indirectly characterize the intensity of the surface streams.
Higgins (1984) concluded that piping is characteristic for
arid and semiarid climates, where the soil contains a clay–
silt component and where water throughflow arises, creat-
ing pipe-like openings in the subsoil. These openings can
later collapse to form a ‘‘pseudo-karst’’ or surface gulley
system. The rainfall is intercepted by any opening in rel-
atively level upland or terrace surfaces. Diverted water
moves downwards until (in one possible scenario) it is
blocked by an impermeable layer and moves laterally. An
additional condition for this scenario is a lateral opening
that allows water to flow laterally.
On one hand, clay revealed by TEM provides the
impermeable layer. This layer is lifted over the ground-
water table, dropping annually by 1 m. Currently, the
difference between the elevation of the top of the clay layer
and the groundwater table is approximately 20 m. On the
other hand, as result of drying clay consolidates, i.e., there
Fig. 16 Subsurface channels
visible in sinkholes (a–c) and
surface water channel (d)
1138 Environ Geol (2009) 58:1123–1141
123

is a decrease in volume. This phenomenon, based on a
decrease in the effective pressure (Terzagi 1925), is dis-
cussed by Baer et al. (2002) with respect to the subsidence
of the DS shores. Heterogeneity of the subsurface mani-
fested in interbedded clay–silt–sand layers causes
heterogeneous deformations and consequently a lateral
opening. It was probably such a lateral opening (fracture)
that was revealed by GPR in subsided alluvium in the NHS
(Ezersky et al. 2006). The seismic diffraction method,
based on dissipation of the seismic energy, has shown
strong heterogeneity of the shallow subsurface in the NHS
area (Pelman et al. 2007).
We have considered alternative origins for sinkholes in
the second group: collapse chimneys or flushing. Our
suggestions need to be checked by numerical hydrogeo-
logical modeling and by TEM 3D forward modeling.
The two groups of sinkholes differ in their arrangement
(Fig. 2b), aspect, and long-term development.
We studied ten sites distributed along entire western DS
coastal area, from north to south, using the seismic
refraction method (Ezersky et al. 2007). We established
that at all sites the sinkholes developed along the western
salt edge by cover collapse into the salt karst. (Formation
of the second group of sinkholes, located within a range of
tens to hundreds of meter from the salt edge, is not typical
for the studied sites of the western DS coast and it is evi-
dently characterized by features of geological structure of
subsurface, as discussed above.) Nevertheless, water cir-
culation plays an important role in the process of sinkhole
formation. The MRS map in Fig. 8 shows that water in the
phreatic zone is drained into the main cavern. Similar
results are produced by the TEM map of the upper and
lower 1 X m interfaces (Figs. 12a, 13). The funnel-shaped
deep depression in the central part of the lower interface
(Fig. 13) clearly connects the phreatic and the confined DS
aquifers. The hole in the 1 X m interface seems to serve as
the channel for recharged water, for subsurface material
collapsing into the karst, and for flushed-out fine particles
refilling the dissolution caverns.
Long-term sinkhole development
Two MRS measurements, performed in 2005 and 2007,
showed reliably that the karst cavern (MRS 6 station; see
Fig. 15a for location) was refilled with fine soil material.
The maps shown in Fig. 7a, b indicate that I, hydraulic
conductivity, and relaxation time have decreased drasti-
cally during the period associated with a decrease in
porosity. The MRS 3 station (comprising cluster 1 in
Fig. 15a) produced T1 = 900 ms in 2005 and T1 =
300 ms in 2007. Thus, in the last 2 years, porosity under
two stations decreased as result of refilling of the existing
cavities. When the cavern was refilled by sediments, water
circulation in the vicinity of the main cavern slowed
down.
All sinkholes of the NHS area of 400 9 500 m2 con-
tinued developing until the cavern was refilled with
collapsing and flushing soil, causing the sinkholes in both
groups to slow down their development. This observation
suggests that the flushed out sinkholes are closely linked to
the pre-existing karst caverns. If flushed particles were
transported to the DS (Arkin and Gilat 2000), a drop in the
DS level would accelerate sinkhole development, but this is
not the case. The development of sinkholes has slowed
after the cavern was refilled with sediments.
As mentioned before, MRS has shown that in time the
karst volume is refilled with sediments as a result of surface
collapse and cover suffusion into the karst cavities. This
sharply reduces the hydraulic conductivity of the sediments
and slows down sinkhole development at the site. These
conclusions are supported by GSI data acquired in the past
10 years.4 GSI has been monitoring sinkhole appearance
systematically, and results obtained for the Nahal Hever
area confirm our ground observations: since 2004, the
number of new sinkholes has been diminishing in the area
of 400 9 500 m2 under investigation (Fig. 17). At the
same time, sinkhole formation has accelerated north of this
area.
General discussion
Based on these geophysical observations, we can now
advance a feasible scenario for the development of sink-
holes in the NHS area:
• A karstic dissolution cave of complex geometry
develops near the western salt edge over a long period
of time. The cavity comprises communicating cham-
bers with salt partitions.
• The ceiling of cavern shaped like peak cap (Fig. 3b) is
supported by the head of the confined aquifer, allowing
it to reach a considerable span. There is a 5-m-thick
clay layer bridging the cave and strengthening the
ceiling.
• A drop in the DS level decreases the head, increasing
support for the overlaying sediments. Drying of
the sediments decreases their strength and causes the
collapse of the cover into existing karst cavities in the
salt formation (the first group of sinkholes). Part of
sinkholes in this group is formed by cover suffusion.
The process extends over a period of time because of
the bridge effect.
• Open pits and karst caverns intensify the local water
circulation, causing washing out of fine soil materials,
4 Abelson et al., GSI report no. TR-GSI/07/2007 (in Hebrew).
Environ Geol (2009) 58:1123–1141 1139
123

which then triggers the development of sinkholes at a
distance of tens to the first hundred meters from the
main cavern (the second group of sinkholes).
• When the main cavity is filled by soil, water circulation
slows down and development of the sinkholes (in both
groups) slows down. A complete cycle of sinkhole
development takes place over approximately 10 years,
with the active phase lasting 5–6 years (Fig. 17).
Conclusion
Seismic refraction, MRS, and the TEM method were
applied to investigate the geological and hydrogeological
conditions in the sinkhole-affected NHS area along the DS
coast of Israel. Our geophysical results suggest that the
development of sinkholes in the NHS area is triggered by
the lowering of the DS level and caused by pre-existing
karst cavities in the salt formation.
Two groups of sinkholes have been identified: (1)
sinkholes over the large karst cavern, formed by the simple
collapse of the rock into the cavern; (2) sinkholes in the
vicinity of the large cavern (tens to one hundred meters
away), caused by flushing out of fine particles from the
ground into the cavity.
Our proposed scenario for the development of the
sinkholes assumes the existence of karst caverns before the
sinkhole formation. These caverns initiate the development
of the sinkholes, and when they fill up with sediments,
development of the sinkholes slows down.
Acknowledgments Our study was sponsored by the NATO
‘‘Security through Science’’ Program (project SfP no. 981128). We
are also grateful to the Israel Ministry of Infrastructure for supporting
the study. The authors wish to thank Dr. U. Frieslander for his con-
tribution to the project. We are grateful to the GII staff for the
efficient organization of the fieldwork. We wish to thank Drs. Y.
Yechieli and M. Abelson, who are in charge of the sinkhole problem
at the Geological Survey of Israel, for providing geological materials
about the investigated areas. We wish to thank Dr. P. Milanovich and
Prof. A. Frumkin for their help in interpreting the data. We are
grateful for the help of Dr. K. Chalikakis (IRD) in the carrying out the
fieldwork. We are grateful to Mr. Y. Goldman and Mr. E. Raz for
assistance in data collection. Finally, the original manuscript was
substantially improved owing to the constructive criticism and edition
of the anonymous reviewer.
References
Abelson M, Baer G, Stivelman V, Wachs D, Raz E, Crouvi O, Kurzon
I, Yechieli Y (2003) Collapse sinkholes and radar interferometry
reveal neo-tectonics concealed within the Dead Sea basin.
Geophys Res Lett 30(10):1545. doi:10.1029/2003GL017103
AEMR (2005a) TEM-FAST 48 manual. AEMR, Netherlands. http://
www.AEMR.net
AEMR (2005b) TEM-RESEARCHER manual, v. 7. AEMR, Nether-
lands. http://www.AEMR.net
Archie GE (1942) Electrical resistivity as an aid in determining some
reservoir characteristics. Trans AMIE 146:54–62
Arkin Y, Gilat A (2000) Dead Sea sinkholes—an ever-developing
hazard. Environ Geol 39(7):711–722
Baer G, Schattner U, Wachs D, Sandwell D, Wdowinsky S, Frydman
S (2002) The lowest place on Earth is subsiding—an InSAR
(interferometric synthetic aperture radar) perspective. Geol Soc
Am Bull 114(1):12–23
Barsukov P, Fainberg E, Khabensky E (2006) Shallow investigations
by TEM-FAST technique: Methodology and examples. In:
Spichak V (ed) Electromagnetic sounding of the Earth’s interior.
Methods in geochemistry and geophysics, vol 40. Elsevier,
Amsterdam, pp 55–77
Eppelbaum LV, Ezersky MG, Al-Zoubi AS (2008) Estimation of the
dissolution karst volume based on 3D microgravity modeling in
the Dead Sea sinkhole hazards problem. In: EGU General
Assembly 2008, Vienna, 13–18 April 2008, abstract EGU2008-
A-10717
Ezersky M (2006) The geophysical properties of the Dead Sea Salt
applied to sinkhole problem. J Appl Geophys 58(1):45–58
Ezersky M (2008) Geoelectric structure of the Ein Gedi sinkhole
occurrence site at the Dead Sea shore in Israel. J Appl Geophys
64:56–69. doi:10.1016/j/jappgeo.12.003
Ezersky M, Al-Zoubi A, Camerlynck C, Keydar S, Legchenko A,
Rybakov M (2005) Sinkhole hazards assessment in the Dead Sea
area—two geophysical aspects of the problem. In: EAEG-ES
11th meeting, Palermo, Italy, P078
Ezersky M, Bruner I, Keydar S, Trachtman P, Rybakov M (2006)
Integrated study of the sinkhole development site using
geophysical methods at the Dead Sea western shore. Near Surf
Geophys 4(5):335–343
Ezersky M, Legchenko A, Camerlynck C, Al-Zoubi A (2007) The salt
formation edge as a major indicator of the sinkhole hazard in the
Dead Sea western coast. In: 13th EAGE near surface meeting
and exhibition 2007, Istanbul, Turkey, 3–5 September 2007, P67
Fig. 17 Long-term sinkhole development through NHS area (based
on GIS database and our observations in the area)
1140 Environ Geol (2009) 58:1123–1141
123

Frumkin A, Raz E (2001) Collapse and subsidence associated with
salt karstification along the Dead Sea. Carbon Evapor 16(2):117–
130
Gutierres F, Guerrero J, Lucha P (2008) A genetic classification of
sinkholes illustrated from evaporate paleokarst exposures in
Spain. Environ Geol 53:995–1006
Higgins C (1984) Piping and sapping. In: LaFleur R (ed) Ground-
water as a geomorphic agent. Allen & Unwin, Winchester, pp
19–58
Interpex (2006) IX1D v. 3 inversion software. http://www.interpex.
com/SoftwareIndex.htm
Kafri U, Goldman M, Lang B (1997) Detection of subsurface brines,
freshwater bodies and the interface configuration in-between by
the time domain electromagnetic method in the Dead Sea Rift,
Israel. Environ Geol 31:42–49
Kaufman A (1978) Resolving capabilities of the inductive methods of
electroprospecting. Geophysics 43:1392–1398
Lachassagne P, Baltassat J-M, Legchenko A, de Gramont HM (2005)
The links between MRS parameters and the hydrogeological
parameters. Near Surf Geophys 3(4):259–265
Legchenko AV, Shushakov OA (1998) Inversion of surface NMR
data. Geophysics 63:75–84
Legchenko A, Baltassat J-M, Bobachev A, Martin C, Robin H,
Vouillamoz J-M (2004) Magnetic resonance sounding applied to
aquifer characterization. Ground Water 42(3):363–373
Legchenko A, Ezersky M, Camerlynck C, Al-Zoubi A (2007) MRS
study of the evolution of aquifer in sinkhole hazardous area
(Dead Sea coast). In: 13th EAGE near surface meeting and
exhibition, Istanbul, Turkey, 3–5 September 2007, B29
Legchenko A, Ezersky M, Girard J-F, Baltassat J-M, Boucher M,
Camerlynck C, Al-Zoubi A (2008a). Interpretation of MRS
measurements in rocks with high electrical conductivity. doi:
10.1016/j.jappgeo.2008.04.002
Legchenko A, Ezersky M, Camerlink C, Al-Zoubi A, Chalikakis K,
Girard J-F (2008b) Locating water-filled karst caverns and
estimating their volume using magnetic resonance soundings.
Geophysics 73(5). doi:10.1190/1.2958007
McNeill JD (1980) Applications of transient electromagnetic tech-
niques. Technical note TN-7. Gionics Limited, Canada
Palmer D (1986) Refraction seismic. The lateral resolution of
structure and seismic velocity. Geophysical Press, London
Pelman D, Ezersky M, Keydar S (2007) 2D diffraction as a method
for a cavity detection applied for the Dead Sea sinkhole problem.
In: Annual GSI meeting, Ein Boqeq, Israel. EAEG 69th
conference and exhibition, London, 11–14 June 2007, E-012
Rybakov M, Goldshmidt V, Fleischer L, Rotstein Y (2001) Cave
detection and 4-D monitoring: a microgravity case history near
the Dead Sea. Lead Edge 20(8):896–900
Shtivelman V (1995) Kinematical inversion of first arrivals of
refracted wave—a combined approach. Geophysics 61:509–519
Taqieddin SA, Abderahman NS, Atallah M (1999) Sinkhole hazards
along the eastern Dead Sea shoreline area, Jordan: a geological
and geotechnical consideration. Environ Geol 39(11):1237–1253
Terzagi K (1925) Principles of soil mechanics. IV—settlements and
consolidation of clay. Eng News Rec 95:874–878
Vouillamoz J-M, Legchenko A, Albouy Y, Bakalowicz M, Baltassat
J-M, Al-Fares W (2003) Localization of saturated karst aquifer
with magnetic resonance sounding and resistivity imagery.
Ground Water 41:578–587
Yechieli Y (2000) Fresh-saline ground water interface in the western
Dead Sea area. Ground Water 38(4):615–623
Yechieli Y, Gavrieli I (2000) Geohydrological process in the Dead
Sea area. Geol Surv Isr Curr Res 12:1–5
Yechieli Y, Kafri U, Goldman M, Voss CI (2001) Factors controlling
the configuration of the fresh-saline water interface in the Dead
Sea coastal aquifers: synthesis of TDEM surveys and numerical
groundwater modeling. Hydrol J 9:367–377
Yechieli Y, Wachs D, Shtivelman V, Abelson M, Onn C, Raz E,
Baer G (2002) Formation of sinkholes along the shore of the
Dead Sea—summary of the first stage of investigation. Geol
Surv Isr Curr Res 13:1–6
Environ Geol (2009) 58:1123–1141 1141
123
Copyright © 2022 FDOKUMEN