Assessing sinkhole activity in the Ebro Valley mantled evaporite karst using advanced DInSAR
15
Assessing sinkhole activity in the Ebro Valley mantled evaporite karst using advanced DInSAR Jorge Pedro Galve a, ⁎, Carmen Castañeda b , Francisco Gutiérrez a , Gerardo Herrera c a Departamento de Ciencias de la Tierra, Universidad de Zaragoza, C/Pedro Cerbuna 12, 50009 Zaragoza, Spain b Estación Experimental de Aula Dei, EEAD-CSIC, P.O. Box 13034, 50080 Zaragoza, Spain c Geo Geohazards InSAR laboratory (InSARlab), Geological Survey of Spain (IGME), C/. Alenza 1, 13 28003 Madrid, Spain abstract article info Article history: Received 17 December 2013 Received in revised form 15 July 2014 Accepted 23 July 2014 Available online 11 August 2014 Keywords: Karst subsidence SBAS SPN ERS ENVISAT ALOS Sinkholes in karst areas may cause subsidence damage in transportation infrastructures, demolition of buildings and even the loss of human lives when they occur in a catastrophic way. Differential Interferometry (DInSAR) is a promising technology for detecting and characterizing sinkholes, as well as for reducing the associated risk when combined with other sources of data such as a sinkhole inventory. In this work, the usefulness of InSAR techniques and data for sinkhole risk management has been analyzed through the comparison of three DInSAR-derived velocity maps with a comprehensive sinkhole inventory in the Ebro Valley, NE Spain. The DInSAR maps have contributed to improve the sinkhole inventory in different ways: (1) detection of non- inventoried sinkholes; (2) revision of sinkhole areas previously classified as inactive as active; and (3) refinement of underestimated sinkhole boundaries. The obtained results suggest that DInSAR products are suitable for analyzing active dissolution-induced subsidence. The application of these techniques may help in recognizing and better characterizing previously unknown karst subsidence problems and in preventing personal and property losses. However, the analysis reveals that the available DInSAR maps combined overlook about 70% of the previously mapped active sinkholes mainly due to decorrelation. © 2014 Elsevier B.V. All rights reserved. 1. Introduction Subsidence sinkholes are closed depressions commonly generated by subsurface dissolution of soluble rocks and the downward displace- ment of the overlying materials and the ground surface (Waltham et al., 2005). Three main subsidence mechanisms may operate indepen- dently or jointly: sagging, collapse, and suffusion (Gutiérrez et al., 2008a; Cooper and Gutiérrez, 2013). The settlement of the land surface associated with sinkholes, regardless of the subsidence mechanism, may cause severe damage in any human structure borne by the undermined sediments. For the latest reviews on sinkhole related damage, see the introduction section in Guerrero et al. (2008), Table 1 in Gutiérrez et al. (2009) and supplementary material in Galve et al. (2012). Collapse sinkholes related to the failure of cavity roofs may occur catastrophically and cause personal losses. These rapid sinkholes may directly engulf buildings or people (e.g. De Bruyn and Bell, 2001) and lead to fatal accidents when they form in transportation routes. Previous investigations document slow ground subsidence (creep) preceding sudden collapse, suggesting that the occurrence of these highly dangerous phenomena might be anticipated through the detec- tion of precursory displacements (e.g. Ferretti et al., 2004; Nof et al., 2013). The avoidance of the existing sinkholes and the areas more prone to new sinkhole occurrences is usually the most cost-effective mitigation option (Cooper and Calow, 1998; Gutiérrez, 2010). This preventive strategy is commonly based on the production of cartographic sinkhole inventories and susceptibility and hazard models derived from them (e.g. Galve et al., 2009a, 2011). However, sinkhole mapping is frequently a difficult task due to factors like the obliteration of the geomorphic expression of the depressions by anthropogenic and natural processes. Moreover, there is frequently a high uncertainty regarding the activity of the existing subsidence sinkholes. It is desirable to discriminate which are the active sinkholes and obtain information on their kine- matics: (1) deformation regime (continuous, episodic or a combination of both); (2) subsidence rate; and (3) spatial variability of the defor- mation pattern, including the precise limits of the area affected by ground motion. The assessment of the activity of sinkholes is usually based on qualitative data, like the freshness vs. degradation state of the depressions, the presence of recent surface deformation features or damaged structures. The application of traditional geodetic methods over large areas is not practical due to the dispersed and localized nature of the karst subsidence process. Geomorphology 229 (2015) 30–44 ⁎ Corresponding author. Tel.: +34 653 606226; fax: +34 976 761106. E-mail addresses: [email protected] (J.P. Galve), [email protected] (C. Castañeda), [email protected] (F. Gutiérrez), [email protected] (G. Herrera). http://dx.doi.org/10.1016/j.geomorph.2014.07.035 0169-555X/© 2014 Elsevier B.V. All rights reserved. Contents lists available at ScienceDirect Geomorphology journal homepage: www.elsevier.com/locate/geomorph
-
Upload
independent -
Category
Documents
-
view
0 -
download
0
Transcript of Assessing sinkhole activity in the Ebro Valley mantled evaporite karst using advanced DInSAR
Geomorphology 229 (2015) 30–44
Contents lists available at ScienceDirect
Geomorphology
j ourna l homepage: www.e lsev ie r .com/ locate /geomorph
Assessing sinkhole activity in the Ebro Valley mantled evaporite karstusing advanced DInSAR
Jorge Pedro Galve a,⁎, Carmen Castañeda b, Francisco Gutiérrez a, Gerardo Herrera c
a Departamento de Ciencias de la Tierra, Universidad de Zaragoza, C/Pedro Cerbuna 12, 50009 Zaragoza, Spainb Estación Experimental de Aula Dei, EEAD-CSIC, P.O. Box 13034, 50080 Zaragoza, Spainc Geo Geohazards InSAR laboratory (InSARlab), Geological Survey of Spain (IGME), C/. Alenza 1, 13 28003 Madrid, Spain
⁎ Corresponding author. Tel.: +34 653 606226; fax: +E-mail addresses: [email protected] (J.P. Galve), ccasta
(C. Castañeda), [email protected] (F. Gutiérrez), g.herrera
http://dx.doi.org/10.1016/j.geomorph.2014.07.0350169-555X/© 2014 Elsevier B.V. All rights reserved.
a b s t r a c t
a r t i c l e i n f oArticle history:Received 17 December 2013Received in revised form 15 July 2014Accepted 23 July 2014Available online 11 August 2014
Keywords:Karst subsidenceSBASSPNERSENVISATALOS
Sinkholes in karst areas may cause subsidence damage in transportation infrastructures, demolition of buildingsand even the loss of human liveswhen they occur in a catastrophicway. Differential Interferometry (DInSAR) is apromising technology for detecting and characterizing sinkholes, aswell as for reducing the associated riskwhencombined with other sources of data such as a sinkhole inventory. In this work, the usefulness of InSARtechniques and data for sinkhole risk management has been analyzed through the comparison of threeDInSAR-derived velocity maps with a comprehensive sinkhole inventory in the Ebro Valley, NE Spain. TheDInSAR maps have contributed to improve the sinkhole inventory in different ways: (1) detection of non-inventoried sinkholes; (2) revision of sinkhole areas previously classified as inactive as active; and (3) refinementof underestimated sinkhole boundaries. The obtained results suggest that DInSAR products are suitable foranalyzing active dissolution-induced subsidence. The application of these techniques may help in recognizingand better characterizing previously unknown karst subsidence problems and in preventing personal andproperty losses. However, the analysis reveals that the available DInSAR maps combined overlook about 70% ofthe previously mapped active sinkholes mainly due to decorrelation.
© 2014 Elsevier B.V. All rights reserved.
1. Introduction
Subsidence sinkholes are closed depressions commonly generatedby subsurface dissolution of soluble rocks and the downward displace-ment of the overlying materials and the ground surface (Walthamet al., 2005). Threemain subsidencemechanismsmay operate indepen-dently or jointly: sagging, collapse, and suffusion (Gutiérrez et al.,2008a; Cooper and Gutiérrez, 2013). The settlement of the land surfaceassociated with sinkholes, regardless of the subsidence mechanism,may cause severe damage in any human structure borne by theundermined sediments. For the latest reviews on sinkhole relateddamage, see the introduction section in Guerrero et al. (2008), Table 1in Gutiérrez et al. (2009) and supplementary material in Galve et al.(2012). Collapse sinkholes related to the failure of cavity roofs mayoccur catastrophically and cause personal losses. These rapid sinkholesmay directly engulf buildings or people (e.g. De Bruyn and Bell, 2001)and lead to fatal accidents when they form in transportation routes.Previous investigations document slow ground subsidence (creep)
34 976 [email protected]@igme.es (G. Herrera).
preceding sudden collapse, suggesting that the occurrence of thesehighly dangerous phenomena might be anticipated through the detec-tion of precursory displacements (e.g. Ferretti et al., 2004; Nof et al.,2013).
The avoidance of the existing sinkholes and the areas more prone tonew sinkhole occurrences is usually the most cost-effective mitigationoption (Cooper and Calow, 1998; Gutiérrez, 2010). This preventivestrategy is commonly based on the production of cartographic sinkholeinventories and susceptibility and hazard models derived from them(e.g. Galve et al., 2009a, 2011). However, sinkholemapping is frequentlya difficult task due to factors like the obliteration of the geomorphicexpression of the depressions by anthropogenic and natural processes.Moreover, there is frequently a high uncertainty regarding the activityof the existing subsidence sinkholes. It is desirable to discriminatewhich are the active sinkholes and obtain information on their kine-matics: (1) deformation regime (continuous, episodic or a combinationof both); (2) subsidence rate; and (3) spatial variability of the defor-mation pattern, including the precise limits of the area affected byground motion. The assessment of the activity of sinkholes is usuallybased on qualitative data, like the freshness vs. degradation state ofthe depressions, the presence of recent surface deformation featuresor damaged structures. The application of traditional geodetic methodsover large areas is not practical due to the dispersed and localizednature of the karst subsidence process.
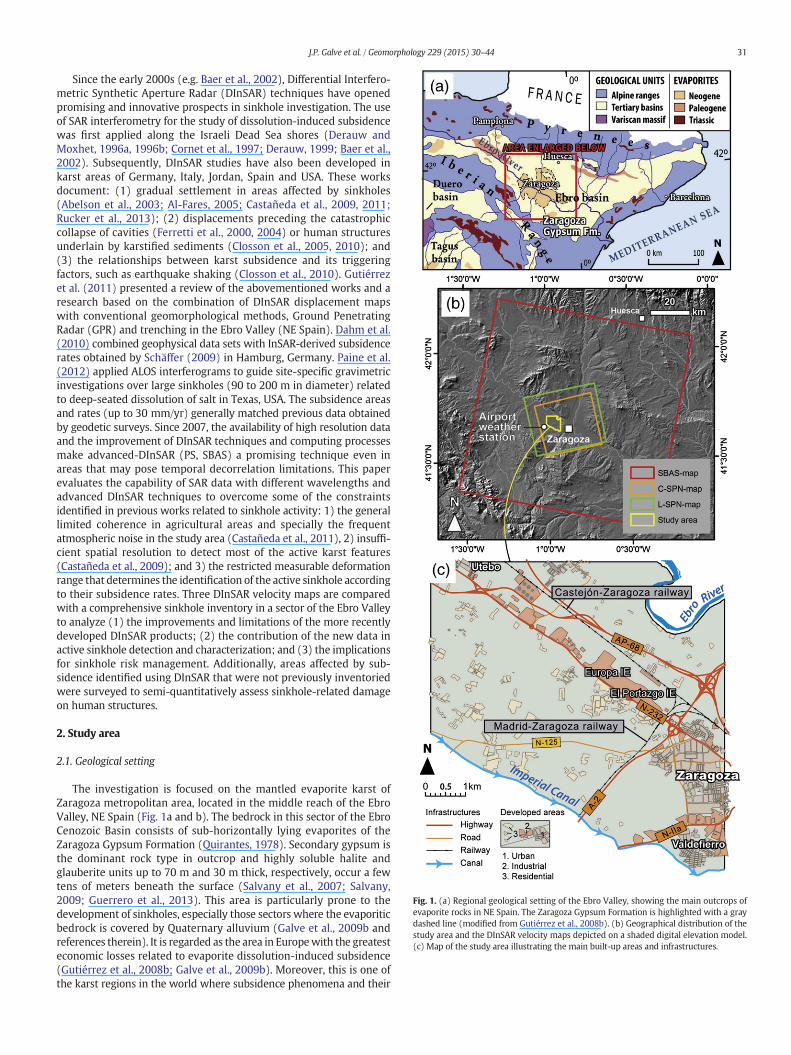
Fig. 1. (a) Regional geological setting of the Ebro Valley, showing the main outcrops ofevaporite rocks in NE Spain. The Zaragoza Gypsum Formation is highlighted with a graydashed line (modified from Gutiérrez et al., 2008b). (b) Geographical distribution of thestudy area and the DInSAR velocity maps depicted on a shaded digital elevation model.(c) Map of the study area illustrating the main built-up areas and infrastructures.
31J.P. Galve et al. / Geomorphology 229 (2015) 30–44
Since the early 2000s (e.g. Baer et al., 2002), Differential Interfero-metric Synthetic Aperture Radar (DInSAR) techniques have openedpromising and innovative prospects in sinkhole investigation. The useof SAR interferometry for the study of dissolution-induced subsidencewas first applied along the Israeli Dead Sea shores (Derauw andMoxhet, 1996a, 1996b; Cornet et al., 1997; Derauw, 1999; Baer et al.,2002). Subsequently, DInSAR studies have also been developed inkarst areas of Germany, Italy, Jordan, Spain and USA. These worksdocument: (1) gradual settlement in areas affected by sinkholes(Abelson et al., 2003; Al-Fares, 2005; Castañeda et al., 2009, 2011;Rucker et al., 2013); (2) displacements preceding the catastrophiccollapse of cavities (Ferretti et al., 2000, 2004) or human structuresunderlain by karstified sediments (Closson et al., 2005, 2010); and(3) the relationships between karst subsidence and its triggeringfactors, such as earthquake shaking (Closson et al., 2010). Gutiérrezet al. (2011) presented a review of the abovementioned works and aresearch based on the combination of DInSAR displacement mapswith conventional geomorphological methods, Ground PenetratingRadar (GPR) and trenching in the Ebro Valley (NE Spain). Dahm et al.(2010) combined geophysical data sets with InSAR-derived subsidencerates obtained by Schäffer (2009) in Hamburg, Germany. Paine et al.(2012) applied ALOS interferograms to guide site-specific gravimetricinvestigations over large sinkholes (90 to 200 m in diameter) relatedto deep-seated dissolution of salt in Texas, USA. The subsidence areasand rates (up to 30 mm/yr) generally matched previous data obtainedby geodetic surveys. Since 2007, the availability of high resolution dataand the improvement of DInSAR techniques and computing processesmake advanced-DInSAR (PS, SBAS) a promising technique even inareas that may pose temporal decorrelation limitations. This paperevaluates the capability of SAR data with different wavelengths andadvanced DInSAR techniques to overcome some of the constraintsidentified in previous works related to sinkhole activity: 1) the generallimited coherence in agricultural areas and specially the frequentatmospheric noise in the study area (Castañeda et al., 2011), 2) insuffi-cient spatial resolution to detect most of the active karst features(Castañeda et al., 2009); and 3) the restricted measurable deformationrange that determines the identification of the active sinkhole accordingto their subsidence rates. Three DInSAR velocity maps are comparedwith a comprehensive sinkhole inventory in a sector of the Ebro Valleyto analyze (1) the improvements and limitations of the more recentlydeveloped DInSAR products; (2) the contribution of the new data inactive sinkhole detection and characterization; and (3) the implicationsfor sinkhole risk management. Additionally, areas affected by sub-sidence identified using DInSAR that were not previously inventoriedwere surveyed to semi-quantitatively assess sinkhole-related damageon human structures.
2. Study area
2.1. Geological setting
The investigation is focused on the mantled evaporite karst ofZaragoza metropolitan area, located in the middle reach of the EbroValley, NE Spain (Fig. 1a and b). The bedrock in this sector of the EbroCenozoic Basin consists of sub-horizontally lying evaporites of theZaragoza Gypsum Formation (Quirantes, 1978). Secondary gypsum isthe dominant rock type in outcrop and highly soluble halite andglauberite units up to 70 m and 30 m thick, respectively, occur a fewtens of meters beneath the surface (Salvany et al., 2007; Salvany,2009; Guerrero et al., 2013). This area is particularly prone to thedevelopment of sinkholes, especially those sectors where the evaporiticbedrock is covered by Quaternary alluvium (Galve et al., 2009b andreferences therein). It is regarded as the area in Europewith the greatesteconomic losses related to evaporite dissolution-induced subsidence(Gutiérrez et al., 2008b; Galve et al., 2009b). Moreover, this is one ofthe karst regions in the world where subsidence phenomena and their
32 J.P. Galve et al. / Geomorphology 229 (2015) 30–44
environmental implications have been more profusely investigated(Galve et al., 2009b, 2012; Gutiérrez et al., 2011; Acero et al., 2013;Carbonel et al., 2013; Guerrero et al., 2013; Pueyo-Anchuela et al.,2013; Rodríguez-Tribaldos et al., 2013). Regarding the application ofradar interferometry, the Zaragoza city area has been used in pre-liminary studies as a test site to explore the suitability of the DInSARtechnique for the detection and monitoring of dissolution-inducedsubsidence (Castañeda, 2009).
The climate in the studied sector of the Ebro Valley is semiarid,with an average annual precipitation of 315 mm at Zaragoza Airportmeteorological station. Rainfall distribution throughout the year isvery irregular, with peaks in spring and autumn. Irrigation, whichtypically extends from March to September, constitutes around 90% ofthe recharge in the valley floor alluvium (Durán et al., 2005), enhancingthe probability of occurrence of collapse sinkholes in some sectors(Benito and Gutierrez, 1988; Gutiérrez et al., 2007; Galve et al., 2009c,2011, 2012).
The study area, covering 40.8 km2, is located upstream of Zaragozacity and coincides with the zone previously investigated by Galve et al.(2009b) from a geomorphological perspective. Sinkhole damage onroadways, buildings and other human structures is very common inthis area. This is mainly related to the activity of pre-existing sinkholesfilled by anthropogenic deposits and subsequently developed (e.g.Gutiérrez et al., 2009). Numerous buildings have been demolished andmost of the main transportation structures require continuous remedi-ation works or even relocation in sections affected by subsidence.
2.2. Sinkhole inventory
The detailed sinkhole inventory and geomorphological map used inthis work were produced by Galve et al. (2009b). This inventory iscontinuously updated incorporating new sinkhole occurrences and ad-ditional information obtained from site investigations applyingmultipletechniques (e.g. trenching, geophysics, boreholes; Gutiérrez et al., 2011;Carbonel et al., 2013; Rodríguez-Tribaldos et al., 2013). In order to assesssinkhole activity, subsidence rate measurements have been gatheredfrom available data sources. These datawere obtained through differentprocedures covering variable time spans: topographic leveling profilesdone by Soriano and Simón (2002); direct measurements of the cumu-lative offsetmeasured in scarps andman-made structures of known age(Simón et al., 2008; Galve et al., 2009b); dating techniques using geo-chronological methods (radiocarbon and optically stimulated lumines-cence) and historical information (Gutiérrez et al., 2009, 2011;Carbonel et al., 2013). Note that some measured subsidence ratescorrespond to minimum values that may be significantly lower thanthe actual ones (e.g. vertical displacement measured in the marginalsector of sinkholes). Moreover, estimated subsidence rates may not bedirectly comparable because they may cover markedly different timespans. For instance, the long-term subsidence rates derived fromtrenches go back to late Holocene periods, whereas topographicalprofiles go back to the past decades.
The inventoried sinkholes have been classified into three mainmor-phological and genetic types (Galve et al., 2009b): large depressions,large collapse sinkholes and small collapse sinkholes (Fig. 2):
• Large depressions correspond to broad and vaguely-edged basins upto 1138 m long and 3.6 m deep, typically with an elongated geometryshowing a structurally-controlled preferred orientation (Fig. 2a).Castañeda et al. (2009), using InSAR data, detected progressive sub-sidence at rates of the order of several mm/yr in two sinkholes ofthe latter type.
• Large collapse sinkholes reach 114m in diameter and 6.75m in depthand have an average diameter of 43 m (Fig. 2b). Several decades ago,most of these depressions used to host permanent ponds. Nowadaysthey are mostly filled by man-made ground. Galve et al. (2009b)found surface evidence of active subsidence in 58% of these sinkholes.
Subsidence rates of the order of cm/yr reported in some of these largecollapses (cf. Simón et al., 2008 and Galve et al., 2009b) stronglysuggest active deep-seated dissolution of salts (i.e. halite, glauberite).
• Small collapse sinkholes (Fig. 2c) are circular depressions up to 10 macross with scarped or overhanging edges that usually occur in acatastrophic way. To our knowledge, the deepest sudden collapsereported in the area reached 15.5 m in depth. InSAR data have signif-icant limitations for detection of ground displacement associatedwiththis type of sinkholes due to their reduced size and extremely fastsubsidence (m/s). However, as mentioned above, previous workspoint out that collapse precursory displacements may be detected(Ferretti et al., 2004; Nof et al., 2013).
2.3. Damage surveys
Several detailed damage surveys were conducted in built-up areasaffected by active subsidence identified in the DInSAR maps. The aimof these surveys was to identify and semi-quantitatively assesssinkhole-related damage on buildings. There is no direct relationshipbetween the detected subsidence and damage in buildings, becausethe latter are conditioned by multiple factors including the age andtype of the structures, their foundation, the characteristics of the groundor the relative distribution between the sinkholes and the buildings (e.g.Mulas et al., 2003; Tomás et al., 2005; Herrera et al., 2009). However,these damage surveys help in the interpretation of the subsidenceobserved in the DInSAR displacement maps. The distribution and geo-metry of the deformation features depicted in the damagemaps provideinformation on the spatial pattern of the subsidence (concavity of arcu-ate scarps and cracks orientation of the scarps, lowest point of sags).This evidence and the geomorphological and historical informationhelp to elucidatewhether the detected subsidence is related to an activesinkhole.
3. DInSAR processing
Differential Synthetic Aperture Radar Interferometry (DInSAR) is amicrowave remote sensing technique that enables measuring surfacedisplacement with sub-centimeter accuracy by subtracting the topo-graphic phase from SAR interferograms (e.g. Massonnet and Feigl,1998) by assuming that the scattering characteristics of the ground sur-face (ground nature and geometry) remain undisturbed (Rosen et al.,2000). Advanced Time-Series DInSAR techniques use two main ap-proaches to measure ground displacement: the persistent scatterer ap-proach (Ferretti et al., 2001) and the coherence approach (Berardinoet al., 2002; Hooper et al., 2007). These techniques generally use aminimum number of SAR images to produce: (1) spatially dense mapswith the average displacement rate of each persistent scatterer (PS)or coherent pixel along the line-of-sight (LOS) of the satellite; and(2) displacement time series of individual points or pixels for whichthe phase information is preserved. These data allow the identificationof non-linear terrain motion on individual points or PS. The minimumnumber of required SAR images depends upon the wavelength of theSAR sensor, the time span of the analyzed period, the temporal lapseamong SAR data acquisitions and the ground deformation rate.
3.1. SAR data
Three DInSAR displacement ratemaps were analyzed (Fig. 1b). Theywere produced with archived data from three orbital SAR missions(Table 1); two sets of C-band data and one set of L-band data. The oldestset corresponds to 27 ERS-1 and ERS-2 SAR images acquired at10:25 a.m. (mean local solar time) on descending orbits (track 237,frame 2766) from 5 July 1995 to 21 December 2000. The second setincludes 29 ENVISAT ASAR images acquired at 10.00 p.m. on ascendingorbits (track 58, frame 829) from 2 May 2003 to 17 September 2010.The third dataset comprises 13 ALOS PALSAR images acquired at
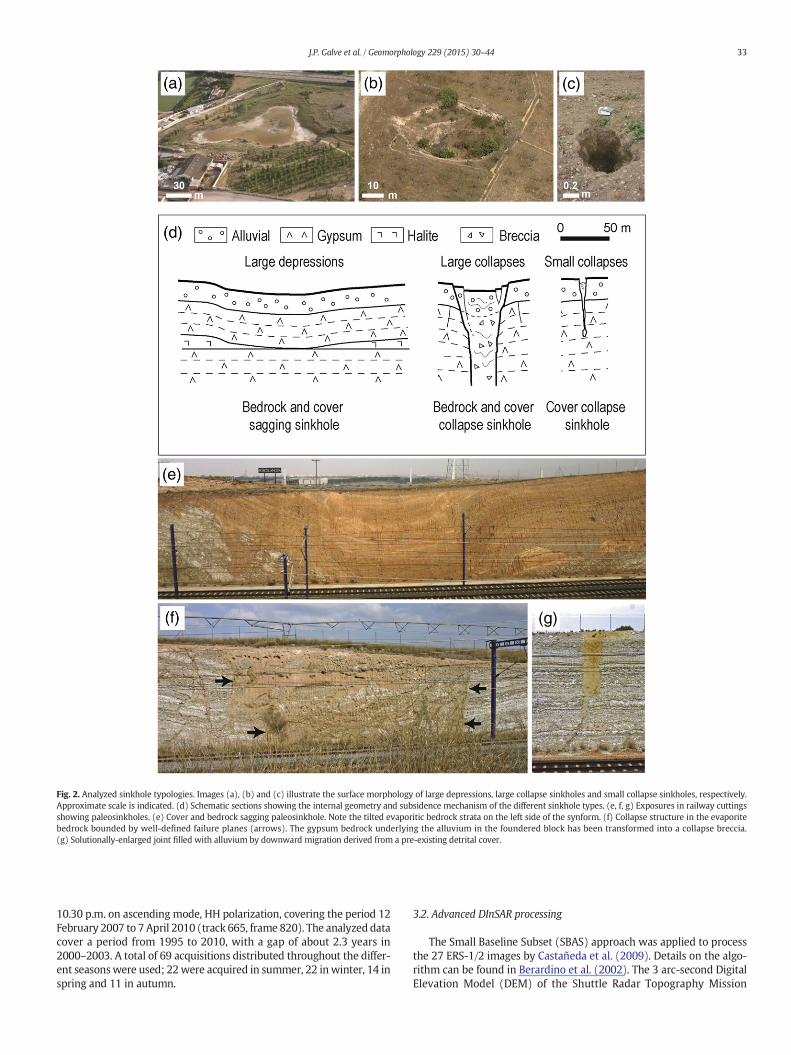
Fig. 2. Analyzed sinkhole typologies. Images (a), (b) and (c) illustrate the surface morphology of large depressions, large collapse sinkholes and small collapse sinkholes, respectively.Approximate scale is indicated. (d) Schematic sections showing the internal geometry and subsidence mechanism of the different sinkhole types. (e, f, g) Exposures in railway cuttingsshowing paleosinkholes. (e) Cover and bedrock sagging paleosinkhole. Note the tilted evaporitic bedrock strata on the left side of the synform. (f) Collapse structure in the evaporitebedrock bounded by well-defined failure planes (arrows). The gypsum bedrock underlying the alluvium in the foundered block has been transformed into a collapse breccia.(g) Solutionally-enlarged joint filled with alluvium by downward migration derived from a pre-existing detrital cover.
33J.P. Galve et al. / Geomorphology 229 (2015) 30–44
10.30 p.m. on ascending mode, HH polarization, covering the period 12February 2007 to 7 April 2010 (track 665, frame 820). The analyzed datacover a period from 1995 to 2010, with a gap of about 2.3 years in2000–2003. A total of 69 acquisitions distributed throughout the differ-ent seasonswere used; 22were acquired in summer, 22 inwinter, 14 inspring and 11 in autumn.
3.2. Advanced DInSAR processing
The Small Baseline Subset (SBAS) approach was applied to processthe 27 ERS-1/2 images by Castañeda et al. (2009). Details on the algo-rithm can be found in Berardino et al. (2002). The 3 arc-second DigitalElevation Model (DEM) of the Shuttle Radar Topography Mission
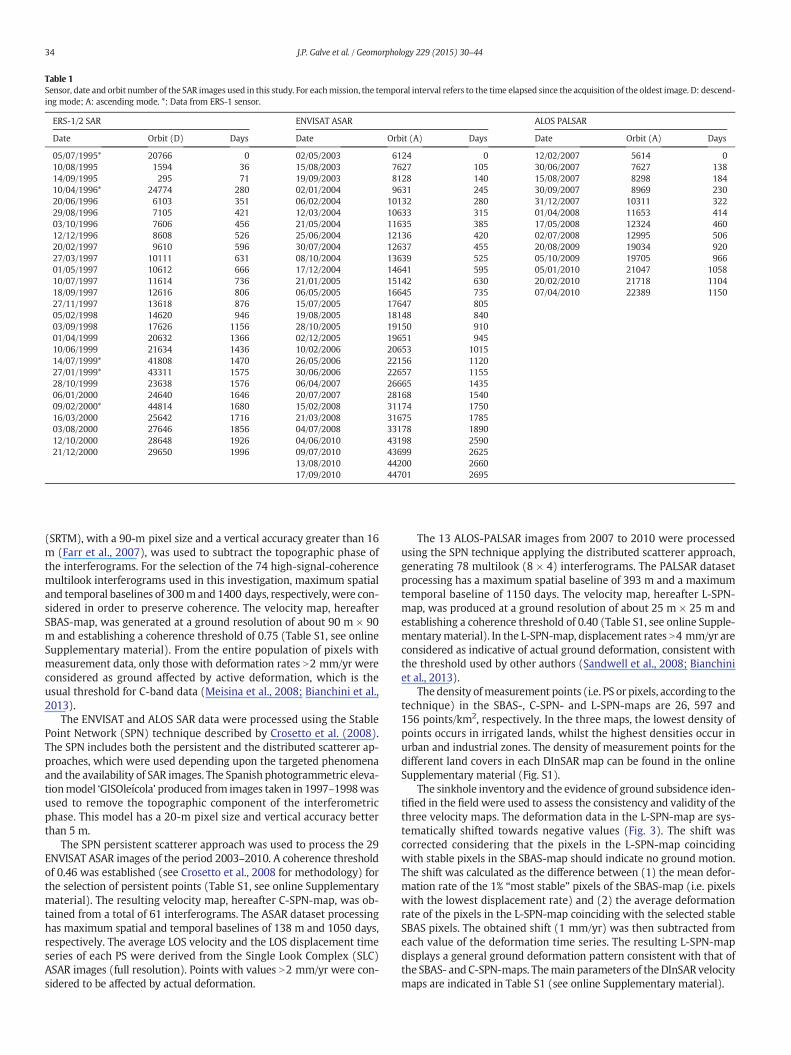
Table 1Sensor, date and orbit number of the SAR images used in this study. For eachmission, the temporal interval refers to the time elapsed since the acquisition of the oldest image. D: descend-ing mode; A: ascending mode. *: Data from ERS-1 sensor.
ERS-1/2 SAR ENVISAT ASAR ALOS PALSAR
Date Orbit (D) Days Date Orbit (A) Days Date Orbit (A) Days
05/07/1995* 20766 0 02/05/2003 6124 0 12/02/2007 5614 010/08/1995 1594 36 15/08/2003 7627 105 30/06/2007 7627 13814/09/1995 295 71 19/09/2003 8128 140 15/08/2007 8298 18410/04/1996* 24774 280 02/01/2004 9631 245 30/09/2007 8969 23020/06/1996 6103 351 06/02/2004 10132 280 31/12/2007 10311 32229/08/1996 7105 421 12/03/2004 10633 315 01/04/2008 11653 41403/10/1996 7606 456 21/05/2004 11635 385 17/05/2008 12324 46012/12/1996 8608 526 25/06/2004 12136 420 02/07/2008 12995 50620/02/1997 9610 596 30/07/2004 12637 455 20/08/2009 19034 92027/03/1997 10111 631 08/10/2004 13639 525 05/10/2009 19705 96601/05/1997 10612 666 17/12/2004 14641 595 05/01/2010 21047 105810/07/1997 11614 736 21/01/2005 15142 630 20/02/2010 21718 110418/09/1997 12616 806 06/05/2005 16645 735 07/04/2010 22389 115027/11/1997 13618 876 15/07/2005 17647 80505/02/1998 14620 946 19/08/2005 18148 84003/09/1998 17626 1156 28/10/2005 19150 91001/04/1999 20632 1366 02/12/2005 19651 94510/06/1999 21634 1436 10/02/2006 20653 101514/07/1999* 41808 1470 26/05/2006 22156 112027/01/1999* 43311 1575 30/06/2006 22657 115528/10/1999 23638 1576 06/04/2007 26665 143506/01/2000 24640 1646 20/07/2007 28168 154009/02/2000* 44814 1680 15/02/2008 31174 175016/03/2000 25642 1716 21/03/2008 31675 178503/08/2000 27646 1856 04/07/2008 33178 189012/10/2000 28648 1926 04/06/2010 43198 259021/12/2000 29650 1996 09/07/2010 43699 2625
13/08/2010 44200 266017/09/2010 44701 2695
34 J.P. Galve et al. / Geomorphology 229 (2015) 30–44
(SRTM), with a 90-m pixel size and a vertical accuracy greater than 16m (Farr et al., 2007), was used to subtract the topographic phase ofthe interferograms. For the selection of the 74 high-signal-coherencemultilook interferograms used in this investigation, maximum spatialand temporal baselines of 300mand 1400 days, respectively, were con-sidered in order to preserve coherence. The velocity map, hereafterSBAS-map, was generated at a ground resolution of about 90 m × 90m and establishing a coherence threshold of 0.75 (Table S1, see onlineSupplementary material). From the entire population of pixels withmeasurement data, only those with deformation rates N2 mm/yr wereconsidered as ground affected by active deformation, which is theusual threshold for C-band data (Meisina et al., 2008; Bianchini et al.,2013).
The ENVISAT and ALOS SAR data were processed using the StablePoint Network (SPN) technique described by Crosetto et al. (2008).The SPN includes both the persistent and the distributed scatterer ap-proaches, which were used depending upon the targeted phenomenaand the availability of SAR images. The Spanish photogrammetric eleva-tionmodel ‘GISOleícola’ produced from images taken in 1997–1998wasused to remove the topographic component of the interferometricphase. This model has a 20-m pixel size and vertical accuracy betterthan 5 m.
The SPN persistent scatterer approach was used to process the 29ENVISAT ASAR images of the period 2003–2010. A coherence thresholdof 0.46 was established (see Crosetto et al., 2008 for methodology) forthe selection of persistent points (Table S1, see online Supplementarymaterial). The resulting velocity map, hereafter C-SPN-map, was ob-tained from a total of 61 interferograms. The ASAR dataset processinghas maximum spatial and temporal baselines of 138 m and 1050 days,respectively. The average LOS velocity and the LOS displacement timeseries of each PS were derived from the Single Look Complex (SLC)ASAR images (full resolution). Points with values N2 mm/yr were con-sidered to be affected by actual deformation.
The 13 ALOS-PALSAR images from 2007 to 2010 were processedusing the SPN technique applying the distributed scatterer approach,generating 78 multilook (8 × 4) interferograms. The PALSAR datasetprocessing has a maximum spatial baseline of 393 m and a maximumtemporal baseline of 1150 days. The velocity map, hereafter L-SPN-map, was produced at a ground resolution of about 25 m × 25 m andestablishing a coherence threshold of 0.40 (Table S1, see online Supple-mentarymaterial). In the L-SPN-map, displacement rates N4 mm/yr areconsidered as indicative of actual ground deformation, consistent withthe threshold used by other authors (Sandwell et al., 2008; Bianchiniet al., 2013).
The density ofmeasurement points (i.e. PS or pixels, according to thetechnique) in the SBAS-, C-SPN- and L-SPN-maps are 26, 597 and156 points/km2, respectively. In the three maps, the lowest density ofpoints occurs in irrigated lands, whilst the highest densities occur inurban and industrial zones. The density of measurement points for thedifferent land covers in each DInSAR map can be found in the onlineSupplementary material (Fig. S1).
The sinkhole inventory and the evidence of ground subsidence iden-tified in the field were used to assess the consistency and validity of thethree velocity maps. The deformation data in the L-SPN-map are sys-tematically shifted towards negative values (Fig. 3). The shift wascorrected considering that the pixels in the L-SPN-map coincidingwith stable pixels in the SBAS-map should indicate no ground motion.The shift was calculated as the difference between (1) the mean defor-mation rate of the 1% “most stable” pixels of the SBAS-map (i.e. pixelswith the lowest displacement rate) and (2) the average deformationrate of the pixels in the L-SPN-map coinciding with the selected stableSBAS pixels. The obtained shift (1 mm/yr) was then subtracted fromeach value of the deformation time series. The resulting L-SPN-mapdisplays a general ground deformation pattern consistent with that ofthe SBAS- and C-SPN-maps. Themain parameters of theDInSAR velocitymaps are indicated in Table S1 (see online Supplementary material).
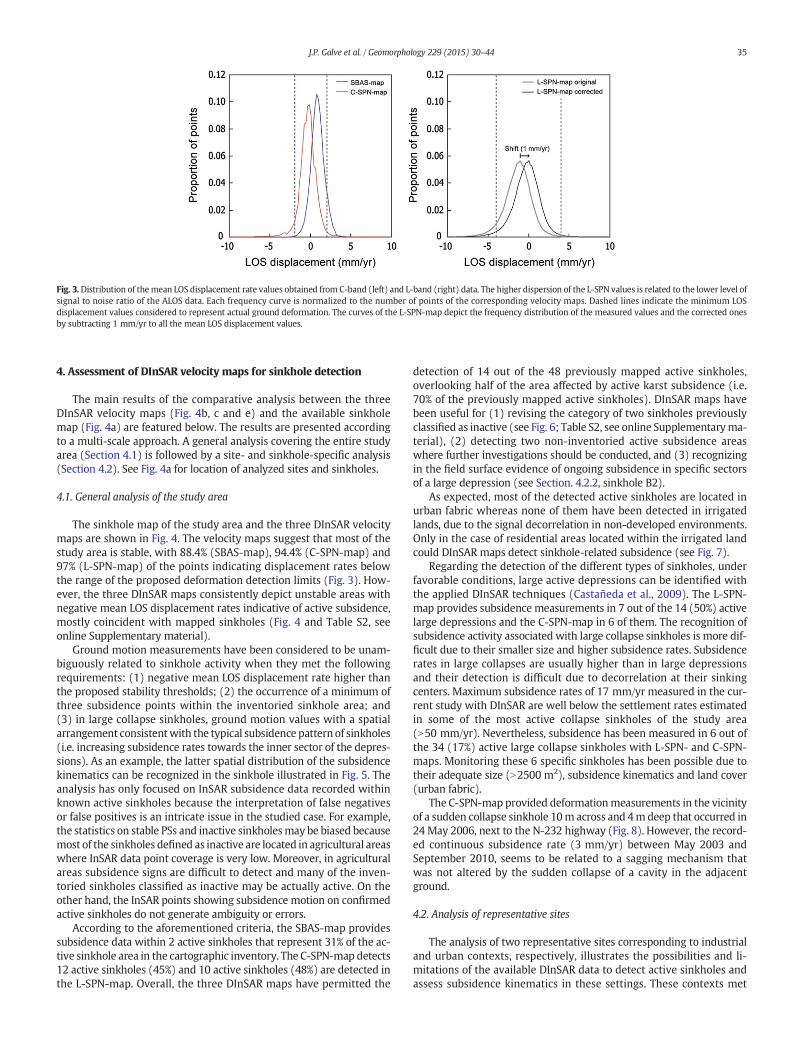
Fig. 3.Distribution of themean LOS displacement rate values obtained from C-band (left) and L-band (right) data. The higher dispersion of the L-SPN values is related to the lower level ofsignal to noise ratio of the ALOS data. Each frequency curve is normalized to the number of points of the corresponding velocity maps. Dashed lines indicate the minimum LOSdisplacement values considered to represent actual ground deformation. The curves of the L-SPN-map depict the frequency distribution of the measured values and the corrected onesby subtracting 1 mm/yr to all the mean LOS displacement values.
35J.P. Galve et al. / Geomorphology 229 (2015) 30–44
4. Assessment of DInSAR velocity maps for sinkhole detection
The main results of the comparative analysis between the threeDInSAR velocity maps (Fig. 4b, c and e) and the available sinkholemap (Fig. 4a) are featured below. The results are presented accordingto a multi-scale approach. A general analysis covering the entire studyarea (Section 4.1) is followed by a site- and sinkhole-specific analysis(Section 4.2). See Fig. 4a for location of analyzed sites and sinkholes.
4.1. General analysis of the study area
The sinkhole map of the study area and the three DInSAR velocitymaps are shown in Fig. 4. The velocity maps suggest that most of thestudy area is stable, with 88.4% (SBAS-map), 94.4% (C-SPN-map) and97% (L-SPN-map) of the points indicating displacement rates belowthe range of the proposed deformation detection limits (Fig. 3). How-ever, the three DInSAR maps consistently depict unstable areas withnegative mean LOS displacement rates indicative of active subsidence,mostly coincident with mapped sinkholes (Fig. 4 and Table S2, seeonline Supplementary material).
Ground motion measurements have been considered to be unam-biguously related to sinkhole activity when they met the followingrequirements: (1) negative mean LOS displacement rate higher thanthe proposed stability thresholds; (2) the occurrence of a minimum ofthree subsidence points within the inventoried sinkhole area; and(3) in large collapse sinkholes, ground motion values with a spatialarrangement consistentwith the typical subsidence pattern of sinkholes(i.e. increasing subsidence rates towards the inner sector of the depres-sions). As an example, the latter spatial distribution of the subsidencekinematics can be recognized in the sinkhole illustrated in Fig. 5. Theanalysis has only focused on InSAR subsidence data recorded withinknown active sinkholes because the interpretation of false negativesor false positives is an intricate issue in the studied case. For example,the statistics on stable PSs and inactive sinkholesmay be biased becausemost of the sinkholes defined as inactive are located in agricultural areaswhere InSAR data point coverage is very low. Moreover, in agriculturalareas subsidence signs are difficult to detect and many of the inven-toried sinkholes classified as inactive may be actually active. On theother hand, the InSAR points showing subsidence motion on confirmedactive sinkholes do not generate ambiguity or errors.
According to the aforementioned criteria, the SBAS-map providessubsidence data within 2 active sinkholes that represent 31% of the ac-tive sinkhole area in the cartographic inventory. The C-SPN-map detects12 active sinkholes (45%) and 10 active sinkholes (48%) are detected inthe L-SPN-map. Overall, the three DInSAR maps have permitted the
detection of 14 out of the 48 previously mapped active sinkholes,overlooking half of the area affected by active karst subsidence (i.e.70% of the previously mapped active sinkholes). DInSAR maps havebeen useful for (1) revising the category of two sinkholes previouslyclassified as inactive (see Fig. 6; Table S2, see online Supplementaryma-terial), (2) detecting two non-inventoried active subsidence areaswhere further investigations should be conducted, and (3) recognizingin the field surface evidence of ongoing subsidence in specific sectorsof a large depression (see Section. 4.2.2, sinkhole B2).
As expected, most of the detected active sinkholes are located inurban fabric whereas none of them have been detected in irrigatedlands, due to the signal decorrelation in non-developed environments.Only in the case of residential areas located within the irrigated landcould DInSAR maps detect sinkhole-related subsidence (see Fig. 7).
Regarding the detection of the different types of sinkholes, underfavorable conditions, large active depressions can be identified withthe applied DInSAR techniques (Castañeda et al., 2009). The L-SPN-map provides subsidence measurements in 7 out of the 14 (50%) activelarge depressions and the C-SPN-map in 6 of them. The recognition ofsubsidence activity associated with large collapse sinkholes is more dif-ficult due to their smaller size and higher subsidence rates. Subsidencerates in large collapses are usually higher than in large depressionsand their detection is difficult due to decorrelation at their sinkingcenters. Maximum subsidence rates of 17 mm/yr measured in the cur-rent study with DInSAR are well below the settlement rates estimatedin some of the most active collapse sinkholes of the study area(N50 mm/yr). Nevertheless, subsidence has been measured in 6 out ofthe 34 (17%) active large collapse sinkholes with L-SPN- and C-SPN-maps. Monitoring these 6 specific sinkholes has been possible due totheir adequate size (N2500 m2), subsidence kinematics and land cover(urban fabric).
The C-SPN-map provided deformationmeasurements in the vicinityof a sudden collapse sinkhole 10m across and 4m deep that occurred in24 May 2006, next to the N-232 highway (Fig. 8). However, the record-ed continuous subsidence rate (3 mm/yr) between May 2003 andSeptember 2010, seems to be related to a sagging mechanism thatwas not altered by the sudden collapse of a cavity in the adjacentground.
4.2. Analysis of representative sites
The analysis of two representative sites corresponding to industrialand urban contexts, respectively, illustrates the possibilities and li-mitations of the available DInSAR data to detect active sinkholes andassess subsidence kinematics in these settings. These contexts met
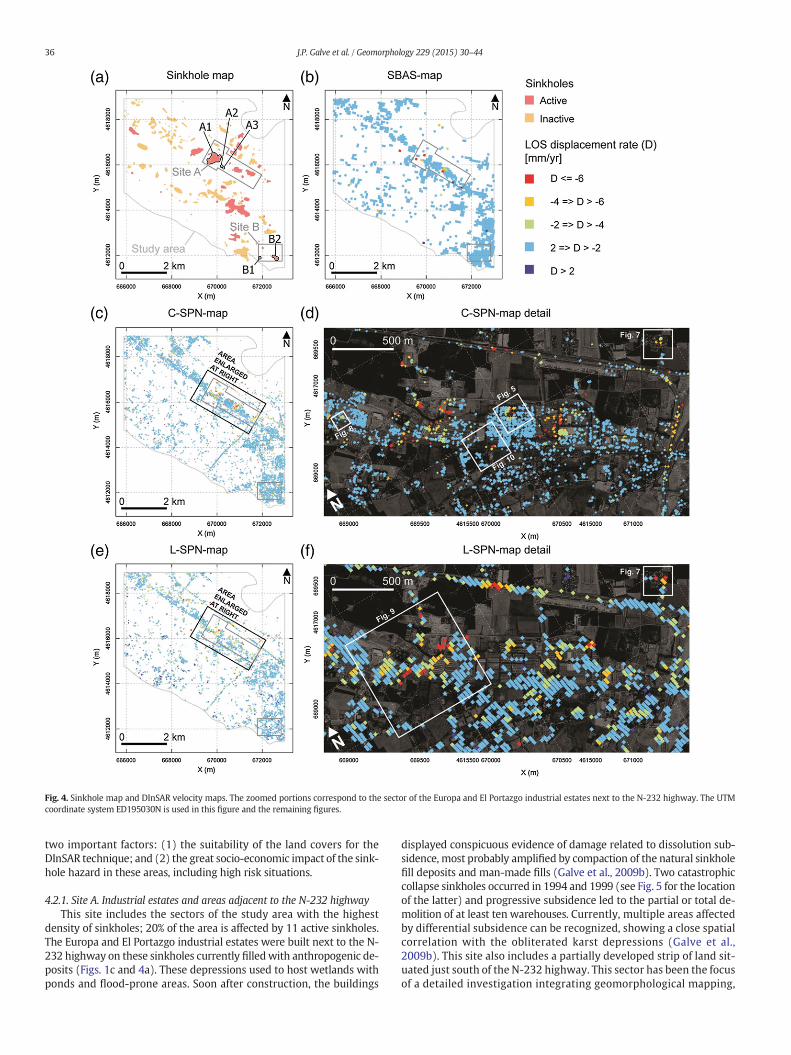
Fig. 4. Sinkhole map and DInSAR velocity maps. The zoomed portions correspond to the sector of the Europa and El Portazgo industrial estates next to the N-232 highway. The UTMcoordinate system ED195030N is used in this figure and the remaining figures.
36 J.P. Galve et al. / Geomorphology 229 (2015) 30–44
two important factors: (1) the suitability of the land covers for theDInSAR technique; and (2) the great socio-economic impact of the sink-hole hazard in these areas, including high risk situations.
4.2.1. Site A. Industrial estates and areas adjacent to the N-232 highwayThis site includes the sectors of the study area with the highest
density of sinkholes; 20% of the area is affected by 11 active sinkholes.The Europa and El Portazgo industrial estates were built next to the N-232 highway on these sinkholes currently filledwith anthropogenic de-posits (Figs. 1c and 4a). These depressions used to host wetlands withponds and flood-prone areas. Soon after construction, the buildings
displayed conspicuous evidence of damage related to dissolution sub-sidence, most probably amplified by compaction of the natural sinkholefill deposits and man-made fills (Galve et al., 2009b). Two catastrophiccollapse sinkholes occurred in 1994 and 1999 (see Fig. 5 for the locationof the latter) and progressive subsidence led to the partial or total de-molition of at least ten warehouses. Currently, multiple areas affectedby differential subsidence can be recognized, showing a close spatialcorrelation with the obliterated karst depressions (Galve et al.,2009b). This site also includes a partially developed strip of land sit-uated just south of the N-232 highway. This sector has been the focusof a detailed investigation integrating geomorphological mapping,
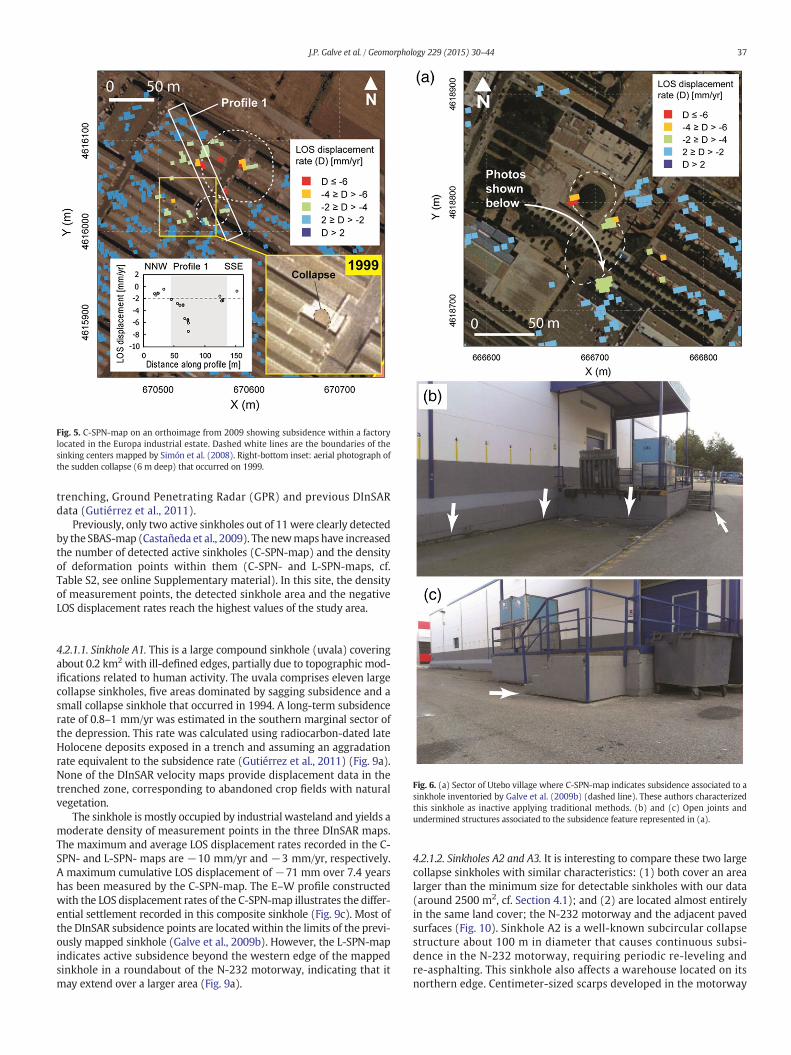
Fig. 5. C-SPN-map on an orthoimage from 2009 showing subsidence within a factorylocated in the Europa industrial estate. Dashed white lines are the boundaries of thesinking centers mapped by Simón et al. (2008). Right-bottom inset: aerial photograph ofthe sudden collapse (6 m deep) that occurred on 1999.
37J.P. Galve et al. / Geomorphology 229 (2015) 30–44
trenching, Ground Penetrating Radar (GPR) and previous DInSARdata (Gutiérrez et al., 2011).
Previously, only two active sinkholes out of 11were clearly detectedby the SBAS-map (Castañeda et al., 2009). The newmaps have increasedthe number of detected active sinkholes (C-SPN-map) and the densityof deformation points within them (C-SPN- and L-SPN-maps, cf.Table S2, see online Supplementary material). In this site, the densityof measurement points, the detected sinkhole area and the negativeLOS displacement rates reach the highest values of the study area.
Fig. 6. (a) Sector of Utebo village where C-SPN-map indicates subsidence associated to asinkhole inventoried by Galve et al. (2009b) (dashed line). These authors characterizedthis sinkhole as inactive applying traditional methods. (b) and (c) Open joints andundermined structures associated to the subsidence feature represented in (a).
4.2.1.1. Sinkhole A1. This is a large compound sinkhole (uvala) coveringabout 0.2 km2 with ill-defined edges, partially due to topographic mod-ifications related to human activity. The uvala comprises eleven largecollapse sinkholes, five areas dominated by sagging subsidence and asmall collapse sinkhole that occurred in 1994. A long-term subsidencerate of 0.8–1 mm/yr was estimated in the southern marginal sector ofthe depression. This rate was calculated using radiocarbon-dated lateHolocene deposits exposed in a trench and assuming an aggradationrate equivalent to the subsidence rate (Gutiérrez et al., 2011) (Fig. 9a).None of the DInSAR velocity maps provide displacement data in thetrenched zone, corresponding to abandoned crop fields with naturalvegetation.
The sinkhole is mostly occupied by industrial wasteland and yields amoderate density of measurement points in the three DInSAR maps.The maximum and average LOS displacement rates recorded in the C-SPN- and L-SPN- maps are −10 mm/yr and −3 mm/yr, respectively.A maximum cumulative LOS displacement of −71 mm over 7.4 yearshas been measured by the C-SPN-map. The E–W profile constructedwith the LOS displacement rates of the C-SPN-map illustrates the differ-ential settlement recorded in this composite sinkhole (Fig. 9c). Most ofthe DInSAR subsidence points are located within the limits of the previ-ously mapped sinkhole (Galve et al., 2009b). However, the L-SPN-mapindicates active subsidence beyond the western edge of the mappedsinkhole in a roundabout of the N-232 motorway, indicating that itmay extend over a larger area (Fig. 9a).
4.2.1.2. Sinkholes A2 and A3. It is interesting to compare these two largecollapse sinkholes with similar characteristics: (1) both cover an arealarger than the minimum size for detectable sinkholes with our data(around 2500 m2, cf. Section 4.1); and (2) are located almost entirelyin the same land cover; the N-232 motorway and the adjacent pavedsurfaces (Fig. 10). Sinkhole A2 is a well-known subcircular collapsestructure about 100 m in diameter that causes continuous subsi-dence in the N-232 motorway, requiring periodic re-leveling andre-asphalting. This sinkhole also affects a warehouse located on itsnorthern edge. Centimeter-sized scarps developed in the motorway
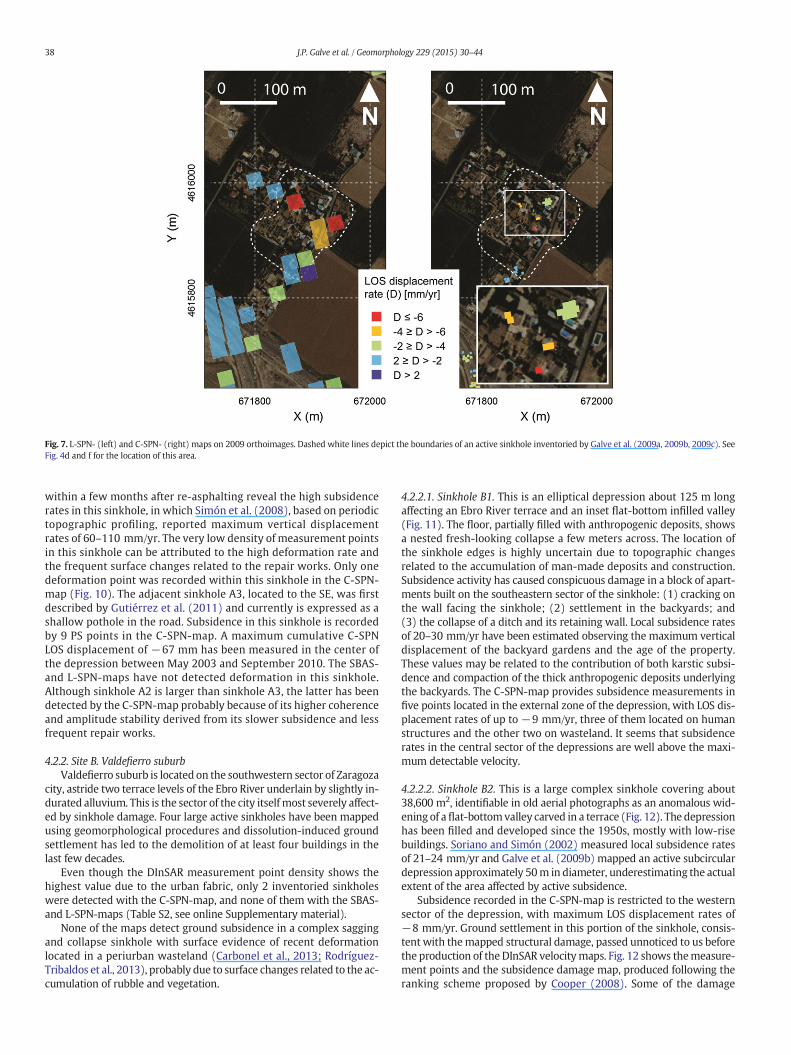
Fig. 7. L-SPN- (left) and C-SPN- (right) maps on 2009 orthoimages. Dashed white lines depict the boundaries of an active sinkhole inventoried by Galve et al. (2009a, 2009b, 2009c). SeeFig. 4d and f for the location of this area.
38 J.P. Galve et al. / Geomorphology 229 (2015) 30–44
within a few months after re-asphalting reveal the high subsidencerates in this sinkhole, in which Simón et al. (2008), based on periodictopographic profiling, reported maximum vertical displacementrates of 60–110 mm/yr. The very low density of measurement pointsin this sinkhole can be attributed to the high deformation rate andthe frequent surface changes related to the repair works. Only onedeformation point was recorded within this sinkhole in the C-SPN-map (Fig. 10). The adjacent sinkhole A3, located to the SE, was firstdescribed by Gutiérrez et al. (2011) and currently is expressed as ashallow pothole in the road. Subsidence in this sinkhole is recordedby 9 PS points in the C-SPN-map. A maximum cumulative C-SPNLOS displacement of −67 mm has been measured in the center ofthe depression between May 2003 and September 2010. The SBAS-and L-SPN-maps have not detected deformation in this sinkhole.Although sinkhole A2 is larger than sinkhole A3, the latter has beendetected by the C-SPN-map probably because of its higher coherenceand amplitude stability derived from its slower subsidence and lessfrequent repair works.
4.2.2. Site B. Valdefierro suburbValdefierro suburb is located on the southwestern sector of Zaragoza
city, astride two terrace levels of the Ebro River underlain by slightly in-durated alluvium. This is the sector of the city itself most severely affect-ed by sinkhole damage. Four large active sinkholes have been mappedusing geomorphological procedures and dissolution-induced groundsettlement has led to the demolition of at least four buildings in thelast few decades.
Even though the DInSAR measurement point density shows thehighest value due to the urban fabric, only 2 inventoried sinkholeswere detected with the C-SPN-map, and none of them with the SBAS-and L-SPN-maps (Table S2, see online Supplementary material).
None of the maps detect ground subsidence in a complex saggingand collapse sinkhole with surface evidence of recent deformationlocated in a periurban wasteland (Carbonel et al., 2013; Rodríguez-Tribaldos et al., 2013), probably due to surface changes related to the ac-cumulation of rubble and vegetation.
4.2.2.1. Sinkhole B1. This is an elliptical depression about 125 m longaffecting an Ebro River terrace and an inset flat-bottom infilled valley(Fig. 11). The floor, partially filled with anthropogenic deposits, showsa nested fresh-looking collapse a few meters across. The location ofthe sinkhole edges is highly uncertain due to topographic changesrelated to the accumulation of man-made deposits and construction.Subsidence activity has caused conspicuous damage in a block of apart-ments built on the southeastern sector of the sinkhole: (1) cracking onthe wall facing the sinkhole; (2) settlement in the backyards; and(3) the collapse of a ditch and its retaining wall. Local subsidence ratesof 20–30 mm/yr have been estimated observing the maximum verticaldisplacement of the backyard gardens and the age of the property.These values may be related to the contribution of both karstic subsi-dence and compaction of the thick anthropogenic deposits underlyingthe backyards. The C-SPN-map provides subsidence measurements infive points located in the external zone of the depression, with LOS dis-placement rates of up to −9 mm/yr, three of them located on humanstructures and the other two on wasteland. It seems that subsidencerates in the central sector of the depressions are well above the maxi-mum detectable velocity.
4.2.2.2. Sinkhole B2. This is a large complex sinkhole covering about38,600 m2, identifiable in old aerial photographs as an anomalous wid-ening of aflat-bottomvalley carved in a terrace (Fig. 12). The depressionhas been filled and developed since the 1950s, mostly with low-risebuildings. Soriano and Simón (2002) measured local subsidence ratesof 21–24 mm/yr and Galve et al. (2009b) mapped an active subcirculardepression approximately 50m in diameter, underestimating the actualextent of the area affected by active subsidence.
Subsidence recorded in the C-SPN-map is restricted to the westernsector of the depression, with maximum LOS displacement rates of−8 mm/yr. Ground settlement in this portion of the sinkhole, consis-tent with themapped structural damage, passed unnoticed to us beforethe production of the DInSAR velocitymaps. Fig. 12 shows themeasure-ment points and the subsidence damage map, produced following theranking scheme proposed by Cooper (2008). Some of the damage
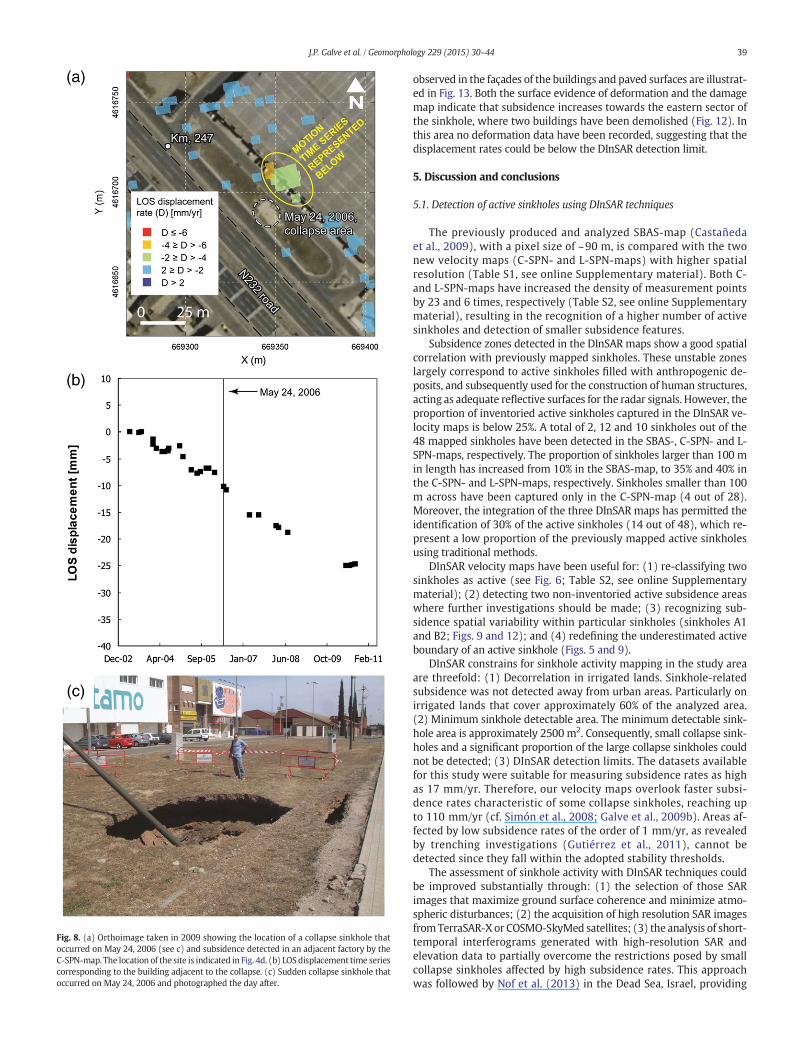
Fig. 8. (a) Orthoimage taken in 2009 showing the location of a collapse sinkhole thatoccurred on May 24, 2006 (see c) and subsidence detected in an adjacent factory by theC-SPN-map. The location of the site is indicated in Fig. 4d. (b) LOSdisplacement time seriescorresponding to the building adjacent to the collapse. (c) Sudden collapse sinkhole thatoccurred on May 24, 2006 and photographed the day after.
39J.P. Galve et al. / Geomorphology 229 (2015) 30–44
observed in the façades of the buildings and paved surfaces are illustrat-ed in Fig. 13. Both the surface evidence of deformation and the damagemap indicate that subsidence increases towards the eastern sector ofthe sinkhole, where two buildings have been demolished (Fig. 12). Inthis area no deformation data have been recorded, suggesting that thedisplacement rates could be below the DInSAR detection limit.
5. Discussion and conclusions
5.1. Detection of active sinkholes using DInSAR techniques
The previously produced and analyzed SBAS-map (Castañedaet al., 2009), with a pixel size of ~90 m, is compared with the twonew velocity maps (C-SPN- and L-SPN-maps) with higher spatialresolution (Table S1, see online Supplementary material). Both C-and L-SPN-maps have increased the density of measurement pointsby 23 and 6 times, respectively (Table S2, see online Supplementarymaterial), resulting in the recognition of a higher number of activesinkholes and detection of smaller subsidence features.
Subsidence zones detected in the DInSAR maps show a good spatialcorrelation with previously mapped sinkholes. These unstable zoneslargely correspond to active sinkholes filled with anthropogenic de-posits, and subsequently used for the construction of human structures,acting as adequate reflective surfaces for the radar signals. However, theproportion of inventoried active sinkholes captured in the DInSAR ve-locity maps is below 25%. A total of 2, 12 and 10 sinkholes out of the48 mapped sinkholes have been detected in the SBAS-, C-SPN- and L-SPN-maps, respectively. The proportion of sinkholes larger than 100 min length has increased from 10% in the SBAS-map, to 35% and 40% inthe C-SPN- and L-SPN-maps, respectively. Sinkholes smaller than 100m across have been captured only in the C-SPN-map (4 out of 28).Moreover, the integration of the three DInSAR maps has permitted theidentification of 30% of the active sinkholes (14 out of 48), which re-present a low proportion of the previously mapped active sinkholesusing traditional methods.
DInSAR velocity maps have been useful for: (1) re-classifying twosinkholes as active (see Fig. 6; Table S2, see online Supplementarymaterial); (2) detecting two non-inventoried active subsidence areaswhere further investigations should be made; (3) recognizing sub-sidence spatial variability within particular sinkholes (sinkholes A1and B2; Figs. 9 and 12); and (4) redefining the underestimated activeboundary of an active sinkhole (Figs. 5 and 9).
DInSAR constrains for sinkhole activity mapping in the study areaare threefold: (1) Decorrelation in irrigated lands. Sinkhole-relatedsubsidence was not detected away from urban areas. Particularly onirrigated lands that cover approximately 60% of the analyzed area.(2) Minimum sinkhole detectable area. The minimum detectable sink-hole area is approximately 2500 m2. Consequently, small collapse sink-holes and a significant proportion of the large collapse sinkholes couldnot be detected; (3) DInSAR detection limits. The datasets availablefor this study were suitable for measuring subsidence rates as highas 17 mm/yr. Therefore, our velocity maps overlook faster subsi-dence rates characteristic of some collapse sinkholes, reaching upto 110 mm/yr (cf. Simón et al., 2008; Galve et al., 2009b). Areas af-fected by low subsidence rates of the order of 1 mm/yr, as revealedby trenching investigations (Gutiérrez et al., 2011), cannot bedetected since they fall within the adopted stability thresholds.
The assessment of sinkhole activity with DInSAR techniques couldbe improved substantially through: (1) the selection of those SARimages that maximize ground surface coherence and minimize atmo-spheric disturbances; (2) the acquisition of high resolution SAR imagesfromTerraSAR-X or COSMO-SkyMed satellites; (3) the analysis of short-temporal interferograms generated with high-resolution SAR andelevation data to partially overcome the restrictions posed by smallcollapse sinkholes affected by high subsidence rates. This approachwas followed by Nof et al. (2013) in the Dead Sea, Israel, providing
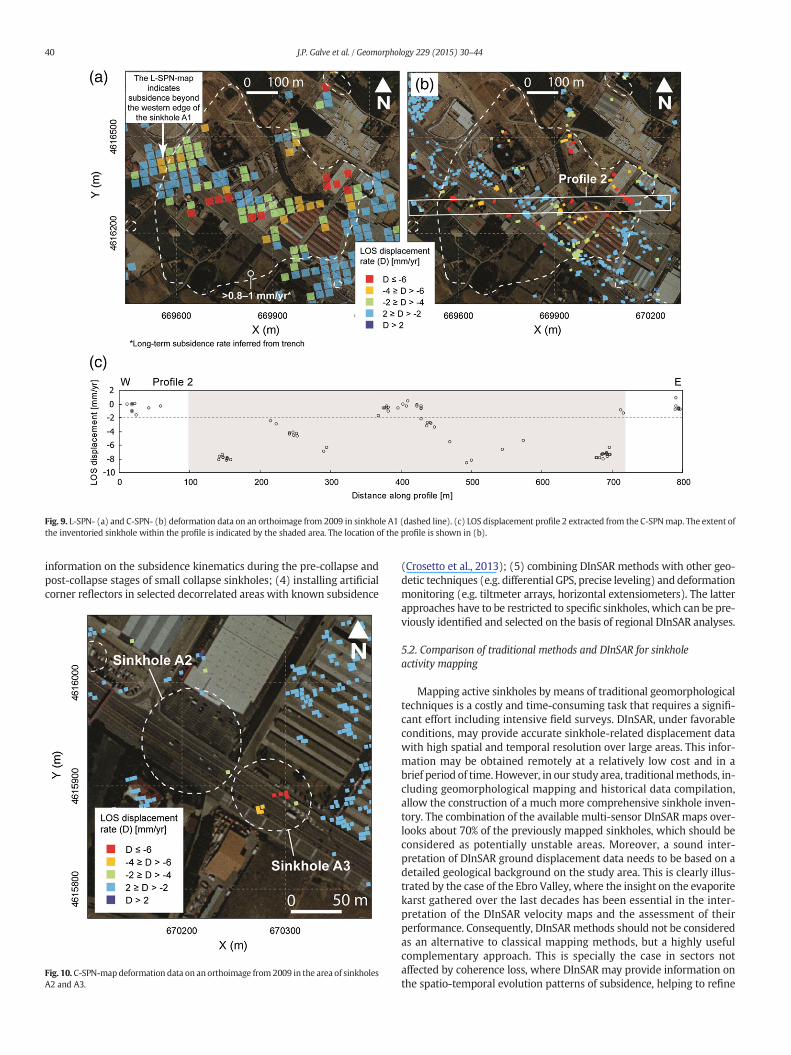
Fig. 9. L-SPN- (a) and C-SPN- (b) deformation data on an orthoimage from 2009 in sinkhole A1 (dashed line). (c) LOS displacement profile 2 extracted from the C-SPNmap. The extent ofthe inventoried sinkhole within the profile is indicated by the shaded area. The location of the profile is shown in (b).
40 J.P. Galve et al. / Geomorphology 229 (2015) 30–44
information on the subsidence kinematics during the pre-collapse andpost-collapse stages of small collapse sinkholes; (4) installing artificialcorner reflectors in selected decorrelated areas with known subsidence
Fig. 10. C-SPN-mapdeformation data on an orthoimage from 2009 in the area of sinkholesA2 and A3.
(Crosetto et al., 2013); (5) combining DInSAR methods with other geo-detic techniques (e.g. differential GPS, precise leveling) and deformationmonitoring (e.g. tiltmeter arrays, horizontal extensiometers). The latterapproaches have to be restricted to specific sinkholes, which can be pre-viously identified and selected on the basis of regional DInSAR analyses.
5.2. Comparison of traditional methods and DInSAR for sinkholeactivity mapping
Mapping active sinkholes by means of traditional geomorphologicaltechniques is a costly and time-consuming task that requires a signifi-cant effort including intensive field surveys. DInSAR, under favorableconditions, may provide accurate sinkhole-related displacement datawith high spatial and temporal resolution over large areas. This infor-mation may be obtained remotely at a relatively low cost and in abrief period of time. However, in our study area, traditionalmethods, in-cluding geomorphological mapping and historical data compilation,allow the construction of a much more comprehensive sinkhole inven-tory. The combination of the available multi-sensor DInSAR maps over-looks about 70% of the previously mapped sinkholes, which should beconsidered as potentially unstable areas. Moreover, a sound inter-pretation of DInSAR ground displacement data needs to be based on adetailed geological background on the study area. This is clearly illus-trated by the case of the Ebro Valley, where the insight on the evaporitekarst gathered over the last decades has been essential in the inter-pretation of the DInSAR velocity maps and the assessment of theirperformance. Consequently, DInSARmethods should not be consideredas an alternative to classical mapping methods, but a highly usefulcomplementary approach. This is specially the case in sectors notaffected by coherence loss, where DInSAR may provide information onthe spatio-temporal evolution patterns of subsidence, helping to refine
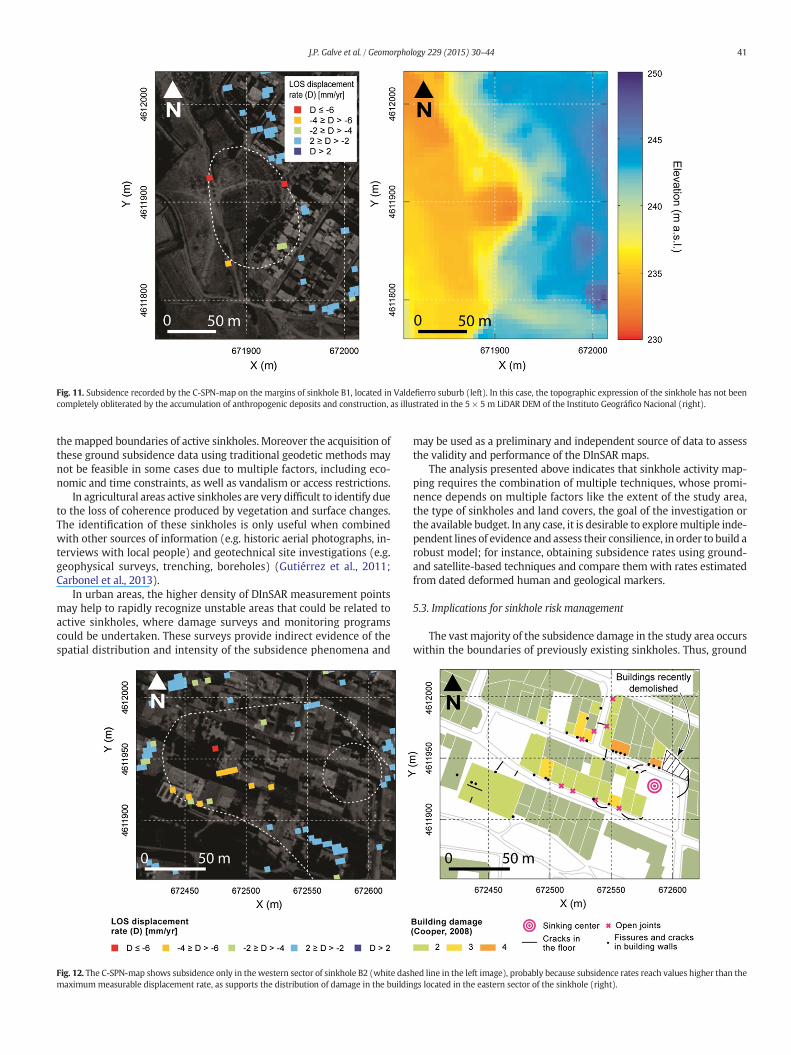
Fig. 11. Subsidence recorded by the C-SPN-map on the margins of sinkhole B1, located in Valdefierro suburb (left). In this case, the topographic expression of the sinkhole has not beencompletely obliterated by the accumulation of anthropogenic deposits and construction, as illustrated in the 5 × 5 m LiDAR DEM of the Instituto Geográfico Nacional (right).
41J.P. Galve et al. / Geomorphology 229 (2015) 30–44
themapped boundaries of active sinkholes. Moreover the acquisition ofthese ground subsidence data using traditional geodetic methods maynot be feasible in some cases due to multiple factors, including eco-nomic and time constraints, as well as vandalism or access restrictions.
In agricultural areas active sinkholes are very difficult to identify dueto the loss of coherence produced by vegetation and surface changes.The identification of these sinkholes is only useful when combinedwith other sources of information (e.g. historic aerial photographs, in-terviews with local people) and geotechnical site investigations (e.g.geophysical surveys, trenching, boreholes) (Gutiérrez et al., 2011;Carbonel et al., 2013).
In urban areas, the higher density of DInSAR measurement pointsmay help to rapidly recognize unstable areas that could be related toactive sinkholes, where damage surveys and monitoring programscould be undertaken. These surveys provide indirect evidence of thespatial distribution and intensity of the subsidence phenomena and
Fig. 12. The C-SPN-map shows subsidence only in thewestern sector of sinkhole B2 (white dasmaximummeasurable displacement rate, as supports the distribution of damage in the buildin
may be used as a preliminary and independent source of data to assessthe validity and performance of the DInSAR maps.
The analysis presented above indicates that sinkhole activity map-ping requires the combination of multiple techniques, whose promi-nence depends on multiple factors like the extent of the study area,the type of sinkholes and land covers, the goal of the investigation orthe available budget. In any case, it is desirable to exploremultiple inde-pendent lines of evidence and assess their consilience, in order to build arobust model; for instance, obtaining subsidence rates using ground-and satellite-based techniques and compare them with rates estimatedfrom dated deformed human and geological markers.
5.3. Implications for sinkhole risk management
The vast majority of the subsidence damage in the study area occurswithin the boundaries of previously existing sinkholes. Thus, ground
hed line in the left image), probably because subsidence rates reach values higher than thegs located in the eastern sector of the sinkhole (right).
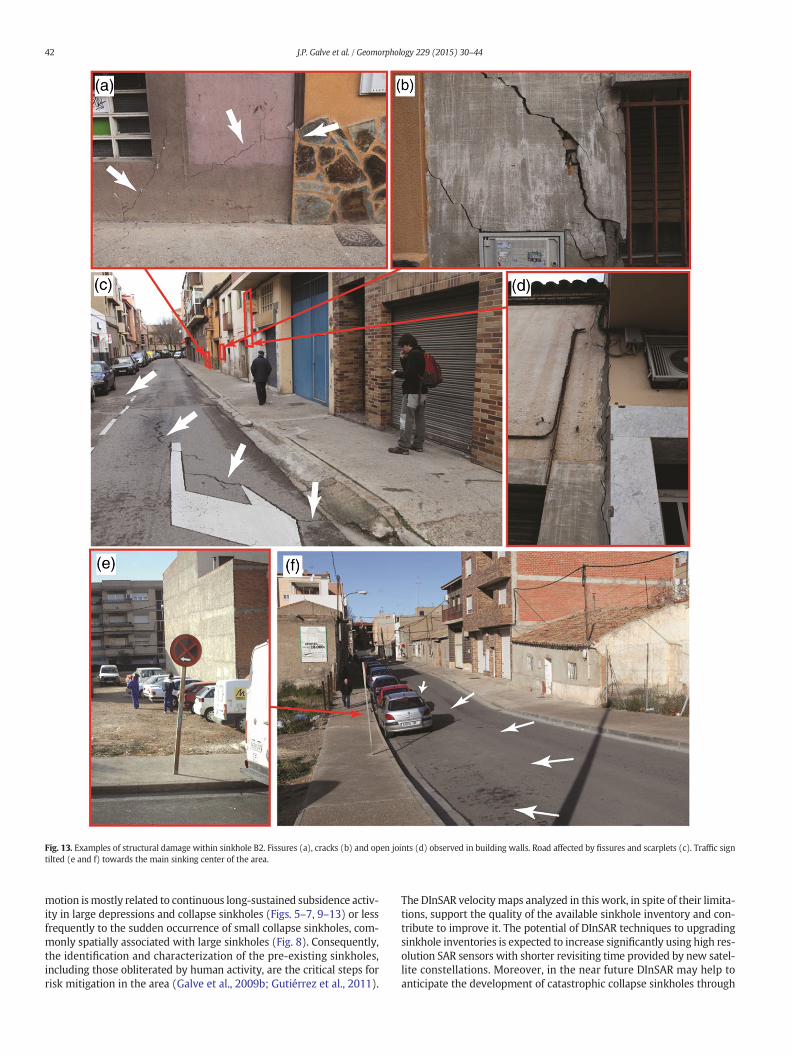
Fig. 13. Examples of structural damage within sinkhole B2. Fissures (a), cracks (b) and open joints (d) observed in building walls. Road affected by fissures and scarplets (c). Traffic signtilted (e and f) towards the main sinking center of the area.
42 J.P. Galve et al. / Geomorphology 229 (2015) 30–44
motion ismostly related to continuous long-sustained subsidence activ-ity in large depressions and collapse sinkholes (Figs. 5–7, 9–13) or lessfrequently to the sudden occurrence of small collapse sinkholes, com-monly spatially associated with large sinkholes (Fig. 8). Consequently,the identification and characterization of the pre-existing sinkholes,including those obliterated by human activity, are the critical steps forrisk mitigation in the area (Galve et al., 2009b; Gutiérrez et al., 2011).
The DInSAR velocity maps analyzed in this work, in spite of their limita-tions, support the quality of the available sinkhole inventory and con-tribute to improve it. The potential of DInSAR techniques to upgradingsinkhole inventories is expected to increase significantly using high res-olution SAR sensors with shorter revisiting time provided by new satel-lite constellations. Moreover, in the near future DInSAR may help toanticipate the development of catastrophic collapse sinkholes through
43J.P. Galve et al. / Geomorphology 229 (2015) 30–44
the detection of precursory deformation, which might constitute thebasis for an early warning system (Ferretti et al., 2004; Nof et al., 2013).
The results obtained in the Ebro Valley evaporite karst strongly sug-gest that InSAR could be an adequate and cost-effective technology toexplore evaporite dissolution subsidence in other regions of the world,particularly urban areas that offer higher coherence. For instance,some large cities in Europe like Hamburg (Dahm et al., 2010), Paris(Thierry et al., 2009) and Madrid (Gutiérrez et al., 2008b) suffer fromsubsidence damage related to evaporite karstification. Particularly se-vere damage has been reported in smaller cities underlain by cavernousevaporites like Ripon and Darlington, UK (Cooper, 1995), Calatayud,Spain (Gutiérrez and Cooper, 2002), Barzai and Pasvalys, Lithuania(Paukstys et al., 1999) and Dzerzhinsk, Russia (Koutepov et al., 2008).It may be also interesting to explore the suitability of this techniquein mantled carbonate karst areas, where slow subsidence related tosuffusion processes and possibly sagging preceding collapse might beresolved with high-resolution InSAR measurements. In this regard,many cities all over the world could be analyzed such as Guilin andother metropolises in southeastern China (Lei et al., 2002), the metro-politan area of Moscow, Russia (Tolmachev and Leonenko, 2011) orthe urban areas in the West-Central Florida, USA (Aurit et al., 2013)just to give some examples. The application of these methods mayhelp to recognize previously unknown karst subsidence problems andprevent personal and property losses.
Acknowledgments
We wish to thank Prof. Adrian Harvey, Prof. Jo De Waele and fiveanonymous reviewers for their helpful comments. This researchhas been funded by the Spanish national projects CGL2010-16775,AGL2012-40100 and CGL2013-40867-P (Ministerio de Ciencia eInnovación and FEDER), the Regional projects 2012/GA-LC-021 and2012/GA LC 036 (DGA-La Caixa) and the European Interreg IV BSUDOE project DO-SMS-SOE1/P2/F157. Jorge Pedro Galve has beencontracted under the DGA-La Caixa project and the contract of CarmenCastañeda is JAEDoc-054 co-fundedbyMulti-regionalOP ESFAdaptabilityand Employment 2007–2013. SPN maps (derived from ENVISAT andALOS data) were produced by Altamira Information S.L. (Spain). The2009 orthoimages and the 5 × 5 m LiDAR DEM are products of theNational Geographic Institute of Spain (Instituto Geográfico Nacional)available in: http://centrodedescargas.cnig.es/CentroDescargas/index.jsp.
Appendix A. Supplementary data
Supplementary data to this article can be found online at http://dx.doi.org/10.1016/j.geomorph.2014.07.035.
References
Abelson, M., Yechieli, Y., Crouvi, O., Baer, G.,Wachs, D., Bein, A., Shtivelman, V., 2003.Collapse-sinkholes and radar interferometry reveal neotectonics concealed withinthe Dead Sea basin. Geophys. Res. Lett. 30, 2–5.
Acero, P.,Gutierrez, F.,Galve, J.P.,Auqué, L.F.,Carbonel, D.,Gimeno, M.J.,Gómez, J.B.,Asta, M.P.,Yechieli, Y., 2013. Hydrogeochemical characterization of an evaporite karst area af-fected by sinkholes (Ebro Valley, NE Spain). Geol. Acta 11, 389–407.
Al-Fares, R., 2005. The Utility of Synthetic Aperture Radar (SAR) interferometry in moni-toring sinkhole subsidence: subsidence of the Devil's Throat Sinkhole Area (Nevada,USA). In: Beck, B.F. (Ed.), Proceedings of the 10th Multidisciplinary Conference onSinkholes and the Engineering and Environmental Impacts of Karst. Geo InstituteASCE, pp. 541–547 (San Antonio, Texas, US).
Aurit, M.D., Peterson, R.O., Blanford, J.I., 2013. A GIS analysis of the relationship betweensinkholes, dry-well complaints and groundwater pumping for frost–freeze protectionof winter strawberry production in Florida. PLoS ONE 8, e53832.
Baer, G.,Schattner, U.,Wachs, D.,Sandwell, D.,Wdowinski, S.,Frydman, S., 2002. The lowestplace on earth is subsiding — an InSAR (interferometric synthetic aperture radar)perspective. Geol. Soc. Am. Bull. 114, 12–23.
Benito, G.,Gutierrez, M., 1988. Karst in gypsum and its environmental impact on the Mid-dle Ebro Basin (Spain). Environ. Geol. Water Sci. 12, 107–111.
Berardino, P., Fornaro, G., Lanari, R.,Sansosti, E., 2002. A new algorithm for surface defor-mation monitoring based on small baseline differential SAR interferograms. IEEETrans. Geosci. Remote Sens. 40, 2375–2383.
Bianchini, S.,Herrera, G.,Mateos, R.M.,Notti, D.,García, I.,Mora, O.,Moretti, S., 2013. Land-slide activity maps generation by means of persistent scatterer interferometry. Re-mote Sens. 5, 6198–6222.
Carbonel, D., Rodríguez, V.,Gutiérrez, F.,McCalpin, J.P., Linares, R., Roqué, C., Zarroca, M.,Guerrero, J., Sasowsky, I., 2013. Evaluation of trenching, Ground Penetrating Radar(GPR) and Electrical Resistivity Tomography (ERT) for sinkhole characterization.Earth Surf. Process. Landf. 39, 214–227.
Castañeda, C., 2009. Basic Terrain-Motion of Spain: Zaragoza. In: Caper, R., Marsh, S.(Eds.), The Terrafirma Atlas. A Compendium of Results Produced by the EuropeanSpace Agency GMES Service Element Project Terrafirma 2003–2009. Fugro NPA Ltd2009, p. 40 (ESRIN Contract 19366/05/I-EC).
Castañeda, C., Gutiérrez, F., Manunta, M., Galve, J.P., 2009. DInSAR measurements ofground deformation by sinkholes, mining subsidence, and landslides, Ebro River,Spain. Earth Surf. Process. Landf. 34, 1562–1574.
Castañeda, C., Pourthié, N., Souyris, J.-C., 2011. Dedicated SAR interferometric analysis todetect subtle deformation in evaporite areas around Zaragoza, NE Spain. Int. J. Re-mote Sens. 32, 1861–1884.
Closson, D.,Karaki, N.A.,Klinger, Y.,Hussein, M.J., 2005. Subsidence and sinkhole hazard as-sessment in the Southern Dead Sea Area, Jordan. Pure Appl. Geophys. 162, 221–248.
Closson, D.,Karaki, N.A.,Milisavljevic, N.,Hallot, F., Acheroy, M., 2010. Salt-dissolution-induced subsidence in the Dead Sea area detected by applying interferometric tech-niques to ALOS Palsar Synthetic Aperture Radar images. Geodin. Acta 23, 65–78.
Cooper, A.H., 1995. Subsidence hazards due to the dissolution of Permian gypsum inEngland: investigation and remediation. In: Beck, B.F. (Ed.), Karst Geohazards.Engineering and Environmental Problems in Karst Terrane, Proceedings of theFifth Multidisciplinary Conference on Sinkholes and the Environmental Impactsof Karst. Balkema, Gatlinburg, Tennessee, pp. 23–29.
Cooper, A.H., 2008. The classification, recording, databasing and use of information aboutbuilding damage caused by subsidence and landslides. Q. J. Eng. Geol. Hydrogeol. 41,409–424.
Cooper, A.H.,Calow, R.C., 1998. Avoiding Gypsum Geohazards: Guidance for Planning andConstruction. British Geological Survey, Nottingham, UK, (57 pp.).
Cooper, A.H.,Gutiérrez, F., 2013. Dealing with gypsum karst problems: hazards, environ-mental issues and planning. In: Shroder, J., Frumkin, A. (Eds.), Treatise ongeomorphologyKarst Geomorphology. vol. 6. Academic Press, San Diego, CA, pp.451–462.
Cornet, Y.,Doulliez, J.-Y.,Moxhet, J.,Closson, D.,Kourgli, A.,Ozer, P.,Ozer, A.,Derauw, D., 1997.Use of ERS tandem data to produce digital elevation models by interferometry andstudy land movements by differential interferometry in Calabria and Jordan. ERS Sym-posium on Space at the Service of our Environment N°3, Florence, Italy (14/03/1997).
Crosetto, M.,Biescas, E.,Duro, J.,Closa, J.,Arnaud, A., 2008. Generation of advanced ERS andEnvisat interferometric SAR products using the Stable Point Network technique.Photogramm. Eng. Remote. Sens. 74, 443.
Crosetto, M.,Gili, J.A.,Monserrat, O.,Cuevas-González, M.,Corominas, J.,Serral, D., 2013. In-terferometric SAR monitoring of the Vallcebre landslide (Spain) using corner reflec-tors. Nat. Hazards Earth Syst. Sci. 13, 923–933.
Dahm, T.,Kühn, D.,Ohrnberger, M.,Kröger, J.,Wiederhold, H.,Reuther, C.-D.,Dehghani, A.,Scherbaum, F., 2010. Combining geophysical data sets to study the dynamics of shal-low evaporites in urban environments: application to Hamburg, Germany. Geophys.J. Int. 181, 154–172.
De Bruyn, I.A.,Bell, F.G., 2001. The occurrence of sinkholes and subsidence depressions inthe farWest Rand and Gauteng province, South Africa, and their engineering implica-tions. Environ. Eng. Geosci. 7, 281–295.
Derauw, D., 1999. Synthetic Aperture Radar Phasimetry: Theory and Applications(Phasimétrie par Radar à Synthèse d'Ouverture: théorie et applications). (PhDThesis) University of Liege, Belgium, (118 pp., in French).
Derauw, D.,Moxhet, J., 1996a. Preliminary results of Tandem SAR interferometry and dif-ferential interferometry over the Dead Sea area. Fringe'96, ESAWorkshop on Applica-tions of ERS SAR InterferometryRemote Sensing Laboratories, University of Zurich,Switzerland, (September 30th–October 2nd).
Derauw, D.,Moxhet, J., 1996b. Multiple image SAR interferometry. Fringe'96, ESA Work-shop on Applications of ERS SAR InterferometryRemote Sensing Laboratories, Univer-sity of Zurich, Switzerland, (September 30th–October 2nd, Digital).
Durán, J.J.,Garrido, E.,García, M., 2005. Trabajos técnicos para la aplicación de la DirectivaMarco del Agua en materia de Aguas Subterráneas. Caracterización Adicional Aluvialdel Ebro-Zaragoza, (112 pp.).
Farr, T.G., Rosen, P.A., Caro, E., Crippen, R., Duren, R., Hensley, S., Kobrick, M., Paller, M.,Rodriguez, E., Roth, L., Seal, D., Shaffer, S., Shimada, J., Umland, J.,Werner, M.,Oskin,M.,Burbank, D.,Alsdorf, D., 2007. The shuttle radar topographymission. Rev. Geophys.45 (2), 1–33.
Ferretti, A.,Ferrucci, F.,Prati, C.,Rocca, F., 2000. SAR analysis of building collapse by meansof the permanent scatterers technique. Geoscience and Remote Sensing Symposium,2000. Proceedings. IGARSS 2000. IEEE 2000 International, pp. 3219–3221.
Ferretti, A., Prati, C., Rocca, F., 2001. Permanent scatterers in SAR interferometry. IEEETrans. Geosci. Remote Sens. 39, 8–20.
Ferretti, A., Basilico, M.,Novali, F., Prati, C., 2004. Possibile utilizzo di dati radar satellitariper individuazione e monitoraggio di fenomeni di sinkholes. In: Nisio, S. (Ed.), Statodell'arte sullo studio dei fenomeni di sinkholes e ruolo delle amministrazioni statalie locali nel governo del territorio. APAT, Roma, pp. 415–425.
Galve, J.P.,Gutiérrez, F.,Remondo, J.,Bonachea, J.,Lucha, P.,Cendrero, A., 2009a. Evaluatingand comparing methods of sinkhole susceptibility mapping in the Ebro Valley evap-orite karst (NE Spain). Geomorphology 111, 160–172.
Galve, J.P., Gutiérrez, F., Lucha, P., Bonachea, J., Remondo, J., Cendrero, A., Gutiérrez, M.,Gimeno, M.J., Pardo, G., Sánchez, J.A., 2009b. Sinkholes in the salt-bearing evaporitekarst of the Ebro River valley upstream of Zaragoza city (NE Spain). Geomorphology108, 145–158.

44 J.P. Galve et al. / Geomorphology 229 (2015) 30–44
Galve, J.P.,Gutiérrez, F.,Lucha, P.,Guerrero, J.,Bonachea, J.,Remondo, J.,Cendrero, A., 2009c.Probabilistic sinkhole modelling for hazard assessment. Earth Surf. Process. Landf. 34,437–452.
Galve, J.P.,Remondo, J.,Gutiérrez, F., 2011. Improving sinkhole hazard models incorporat-ing magnitude–frequency relationships and nearest neighbor analysis. Geomorphol-ogy 134, 157–170.
Galve, J.P.,Gutiérrez, F.,Guerrero, J.,Alonso, J.,Diego, I., 2012. Optimizing the application ofgeosynthetics to roads in sinkhole-prone areas on the basis of hazard models andcost–benefit analyses. Geotext. Geomembr. 34, 80–92.
Guerrero, J.,Gutiérrez, F.,Bonachea, J.,Lucha, P., 2008. A sinkhole susceptibility zonation basedon paleokarst analysis along a stretch of the Madrid–Barcelona high-speed railway builtover gypsum- and salt-bearing evaporites (NE Spain). Eng. Geol. 102, 62–73.
Guerrero, J.,Gutiérrez, F.,Galve, J.P., 2013. Large depressions, thickened terraces, and grav-itational deformation in the Ebro River valley (Zaragoza area, NE Spain): evidence ofglauberite and halite interstratal karstification. Geomorphology 196, 162–176.
Gutiérrez, F., 2010. Hazards associated with karst. In: Alcantara, I., Goudie, A.S. (Eds.),Geomorphological Hazards and Disaster Prevention. Cambridge University Press,Cambridge, UK, pp. 161–175.
Gutiérrez, F.,Cooper, A.H., 2002. Evaporite dissolution subsidence in the historical city ofCalatayud, Spain: damage appraisal and prevention. Nat. Hazards 25, 259–288.
Gutiérrez, F., Galve, J.P., Guerrero, J., Lucha, P., Cendrero, A., Remondo, J., Bonachea, J.,Gutiérrez, M., Sánchez, J.A.,Gutierrez, F.,Gutierrez, M.,Sanchez, J.A., 2007. The origin,typology, spatial distribution and detrimental effects of the sinkholes developed inthe alluvial evaporite karst of the Ebro River valley downstream of Zaragoza city(NE Spain). Earth Surf. Process. Landf. 32, 912–928.
Gutiérrez, F.,Guerrero, J.,Lucha, P.,Gutierrez, F., 2008a. A genetic classification of sinkholesillustrated from evaporite paleokarst exposures in Spain. Environ. Geol. 53, 993–1006.
Gutiérrez, F.,Calaforra, J.M.,Cardona, F.,Ortí, F.,Durán, J.J.,Garay, P., 2008b. Geological andenvironmental implications of the evaporite karst in Spain. Environ. Geol. 53,951–965.
Gutiérrez, F.,Galve, J.P., Lucha, P., Bonachea, J., Jordá, L., Jordá, R., 2009. Investigation of alarge collapse sinkhole affecting a multi-storey building by means of geophysicsand the trenching technique (Zaragoza city, NE Spain). Environ. Geol. 58, 1107–1122.
Gutiérrez, F.,Galve, J.P., Lucha, P.,Castañeda, C.,Bonachea, J.,Guerrero, J., 2011. Integratinggeomorphological mapping, trenching, InSAR and GPR for the identification and char-acterization of sinkholes: a review and application in the mantled evaporite karst ofthe Ebro Valley (NE Spain). Geomorphology 134, 144–156.
Herrera, G., Tomás, R., Lopez-Sanchez, J.M.,Delgado, J., Vicente, F.,Mulas, J., Cooksley, G.,Sanchez, M., Duro, J., Arnaud, A., Blanco, P., Duque, S., Mallorqui, J.J., De la Vega-Panizo, R.,Monserrat, O., 2009. Validation and comparison of advanced differential in-terferometry techniques: Murcia metropolitan area case study. ISPRS J. Photogramm.Remote Sens. 64, 501–512.
Hooper, A.,Segall, P.,Zebker, H., 2007. Persistent scatterer interferometric synthetic aper-ture radar for crustal deformation analysis, with application to Volcán Alcedo,Galápagos. J. Geophys. Res. 112, B07407.
Koutepov, V.M.,Mironov, O.K., Tolmachev, V.V., 2008. Assessment of suffusion-relatedhazards in karst areas using GIS technology; advances and challenges of GIS andDBMS applications in karst. Environ. Geol. 54, 957–962.
Lei, M., Jiang, X.,Yu, L., 2002. New advances in karst collapse research in China. Environ.Geol. 42, 462–468.
Massonnet, D.,Feigl, K.L., 1998. Radar interferometry and its application to changes in theEarth's surface. Rev. Geophys. 36, 441–500.
Meisina, C., Zucca, F.,Notti, D., Colombo, A., Cucchi, A., Savio, G.,Giannico, C., Bianchi, M.,2008. Geological interpretation of PSInSAR data at regional scale. Sensors 8,7469–7492.
Mulas, J., Aragón, R.,Martínez, M., Lambán, J., García-Arostegui, J., Fernández-Grillo, A.,Hornero, J., Rodríguez, J.,Rodríguez, J., 2003. Geotechnical and hydrological analysisof land subsidence in Murcia (Spain). Proc. of the 1st International Conf. on Ground-water in Geotechnical Engineering. RMZ-M&G, Bled, Slovenia, pp. 249–252.
Nof, R.N.,Baer, G., Ziv, A., Raz, E., Atzori, S., Salvi, S., 2013. Sinkhole precursors along theDead Sea, Israel, revealed by SAR interferometry. Geology 41, 1019–1022.
Paine, J.G.,Buckley, S.M.,Collins, E.W.,Wilson, C.R.,Box, X., 2012. Assessing collapse risk inevaporite sinkhole-prone areas using microgravimetry and radar interferometry. J.Environ. Eng. Geophys. 17, 75–87.
Paukstys, B.,Cooper, A.H.,Arustiene, J., 1999. Planning for gypsum geohazards in Lithuaniaand England. Eng. Geol. 52, 93–103.
Pueyo-Anchuela, O.,Pocoví-Juan, A.,Casas-Sainz, A.M.,Ansón-López, D.,Gil-Garbi, H., 2013.Actual extension of sinkholes: considerations about geophysical, geomorphological,and field inspection techniques in urban planning projects in the Ebro basin (NESpain). Geomorphology 189, 135–149.
Quirantes, J., 1978. Estudio sedimentológico y estratigráfico del Terciario continental delos Monegros. In: Zaragoza (Ed.), Institución Fernando El Católico (CSIC), DiputaciónProvincial de Zaragoza (207 pp.).
Rodríguez-Tribaldos, V.,Gutiérrez, F.,Green, A.,Carbonel, D.,Horstmeyer, H.,Schmelzbach,C., 2013. Characterising saging and collapse sinkholes in a mantled karst by means ofGround Penetrating Radar (GPR). Environ. Eng. Geosci. 20, 109–132.
Rosen, P.A.,Hensley, S.,Joughin, I.A.N.R.,Li, F.U.K.K.,Madsen, S.N.,Member, S.,Rodríguez, E.,Goldstein, R.M., 2000. Synthetic Aperture Radar Interferometry, (88 pp.).
Rucker, M., Panda, B.,Meyers, R., Lommler, J., 2013. Using InSAR to detect subsidence atbrine wells, sinkhole sites, and mines. Carbonates Evaporites 28, 141–147.
Salvany, J.M., 2009. Geología del yacimiento glauberítico de Montes de Torrero (Zaragoza),(77 pp.).
Salvany, J.M.,García-Veigas, J.,Ortí, F., 2007. Glauberite–halite association of the ZaragozaGypsum Formation (Lower Miocene, Ebro Basin, NE Spain). Sedimentology 54,443–467.
Sandwell, D.,Myer, D.,Mellors, R.,Shimada, M.,Brooks, B.,Foster, J., 2008. Accuracy and res-olution of ALOS interferometry: vector deformation maps of the Father's day intru-sion at Kilauea. IEEE Trans. Geosci. Remote Sens. 46 (11), 3524–3534.
Schäffer, U., 2009. Basic Terrain-Motion of Germany: Hamburg. In: Capes, R., Marsh, S.(Eds.), The Terrafirma Atlas, A Compendium of Results Produced by the EuropeanSpace Agency GMES Service Element Project Terrafirma 2003–2009. Fugro NPA Ltd2009 (ESRIN Contract 19366/05/I-EC, 23 pp.).
Simón, J.L., Soriano, M.A.,Arlegui, L.E.,Gracia, F.J., Liesa, C.L., Pocoví, A., 2008. Space–timedistribution of ancient and active alluvial karst subsidence: examples from centralEbro Basin, Spain. Environ. Geol. 53, 1057–1065.
Soriano, M.A.,Simón, J.L., 2002. Subsidence rates and urban damages in alluvial dolines ofthe Central Ebro basin (NE Spain). Environ. Geol. 42, 476–484.
Thierry, P., Prunier-Leparmentier, A.-M., Lembezat, C.,Vanoudheusden, E., Vernoux, J.-F.,2009. 3D geological modelling at urban scale and mapping of ground movement sus-ceptibility from gypsumdissolution: the Paris example (France). Eng. Geol. 105, 51–64.
Tolmachev, V.,Leonenko, M., 2011. Experience in collapse risk assessment of building oncovered karst landscapes in Russia. In: Van Beynen, P. (Ed.), Karst Management.Springer, Dordrecht, New York, pp. 75–102.
Tomás, R.,Márquez, Y., Lopez-Sanchez, J.M.,Delgado, J.,Blanco, P.,Mallorquí, J.J.,Martínez,M.,Herrera, G.,Mulas, J., 2005. Mapping ground subsidence induced by aquifer over-exploitation using advanced differential SAR interferometry: Vega Media of theSegura River (SE Spain) case study. Remote Sens. Environ. 98, 269–283.
Waltham, T.,Bell, F.G.,Culshaw, M.G., 2005. Sinkholes and Subsidence: Karst and Cavern-ous Rocks in Engineering and Construction. Springer & Praxis Publishing, Chichester,UK, (416 pp.).