Evaporite Karst in the Greater Permian Evaporite Basin (GPEB ...
350
Evaporite Karst in the Greater Permian Evaporite Basin (GPEB) of Texas, New Mexico, Oklahoma, Kansas, and Colorado Kenneth S. Johnson, Lewis Land, and David D. Decker; Editors 2021 The University of Oklahoma Norman, Oklahoma Oklahoma Geological Survey Nicholas W. Hayman, Director Circular 113 ISSN 0078-4397
-
Upload
khangminh22 -
Category
Documents
-
view
0 -
download
0
Transcript of Evaporite Karst in the Greater Permian Evaporite Basin (GPEB ...

Evaporite Karst in the Greater Permian Evaporite Basin (GPEB)of Texas, New Mexico, Oklahoma, Kansas, and Colorado
Kenneth S. Johnson, Lewis Land, and David D. Decker; Editors
2021
The University of OklahomaNorman, Oklahoma
Oklahoma Geological SurveyNicholas W. Hayman, Director
Circular 113ISSN 0078-4397

PREFACE
Evaporite rocks, mainly gypsum (or anhydrite) and salt (halite), are the most soluble of common rocks. Their dis-solution produces caves, sinkholes, disappearing streams, collapse structures, breccia pipes, and other karst featuresthat are also commonly associated with carbonate rocks (limestones and dolomites). Evaporites underlie a vast regionof southwestern United States that is herein named the Greater Permian Evaporite Basin (GPEB), and both natural andhuman-induced evaporite karst (EK) features are present in much of the region. Eight major evaporite sequences arepresent in Permian rocks in the GPEB, including: 1) Wellington/Hutchinson, 2) Lower Cimarron/Lower Clear Fork,3) Upper Cimarron/Upper Clear Fork, 4) San Andres/Flowerpot/Blaine/Yelton, 5) Artesia, 6) Castile, 7) Salado, and8) Rustler Formations or Groups. These evaporites and theGPEBoccupy an area of about 650,000 km2 in parts of!vestates, including Texas, New Mexico, Oklahoma, Kansas, and Colorado.
EK results from both natural processes and human activities. Natural EK occurs when precipitation or groundwatercirculates through, and dissolves, part or all of an evaporite deposit. Human activities that can produce EK include(1) construction upon, or directing water into or above, outcropping or shallow evaporites and (2) drilling boreholes,opening mines, or other excavations into subsurface evaporites, mainly salt deposits, followed by unsaturated watercoming in contact with, and dissolving, the evaporite. The principal difference between karst in evaporite rocks and incarbonates is that EK features can form rapidly, in a matter of days, weeks, or years, whereas carbonate-karst featurestypically take years, decades, or centuries to form. Rapid development of EK can lead to engineering or environmentalproblems, including damage to, and/or collapse of, homes, buildings, civil projects (such as dams, bridges, and high-ways), and farmlands, and it can also result in injury or loss of life.
Being released in 2021, this publication is part of the celebration of the “International Year of Caves and Karst”(IYCK), which acknowledges the importance of karst in those parts of the world where carbonate and evaporite rocksare being dissolved at or near the Earth’s surface. The IYCK is organized by the International Union of Speleology,the worldwide organization of cave and karst explorers, scientists, managers, and educators: the IYCK is beingco-sponsored by about 150 national and international partner organizations.
This symposium volume results from a half-day theme session on EK in the GPEB that was held on September 24,2019, as part of the annual meeting of the Geological Society of America (GSA) in Phoenix, Arizona. The sessionwasorganized by us, and was co-sponsored by three divisions of GSA: the Karst Division, Hydrogeology Division, andEnvironmental and Engineering Geology Division. We thank GSA and the three Divisions for their support in spon-soring the theme session. A total of 14 talks and posters presented at the GSAmeeting are included in this volume, andwe invited another 9 papers to be prepared especially for this volume. The 23 papers are grouped into Introductory andGeneral Papers, and then into a series of geographic areas, based upon states.
The current volume is a companion to an earlier GSA-symposium volume published by the Oklahoma GeologicalSurvey as: Johnson, K.S., and Neal, J.T., eds., 2003, Evaporite karst and engineering/environmental problems in theUnited States: Oklahoma Geological Survey, Circular 109, 353 p. http://ogs.ou.edu/docs/circulars/C109.pdf
KENNETH S. JOHNSONRetired GeologistOklahoma Geological Survey1321 Greenbriar Dr.Norman, OK 73072Phone: 405/329-4150E-mail: [email protected]
LEWIS LANDNational Cave and Karst Research Institute400-1 Cascades Ave.Carlsbad, NM 88220Phone: 575/932-9912Email: [email protected]
DAVID D. DECKERSouthwest Geophysical Consulting, LLC5117 Fairfax Dr. NWAlbuquerque, NM 87114Phone: 505/585-2550E-mail: [email protected]
iii

CONTENTS
Preface
INTRODUCTORY AND GENERAL PAPERS
1 Overview of Evaporite Karst in the Greater Permian Evaporite Basin (GPEB) ofTexas, New Mexico, Oklahoma, Kansas, and Colorado, USAKenneth S. Johnson
39 Evaporite Karst in the Greater Permian Evaporite Basin of Texas, New Mexico,Oklahoma, Kansas, and Colorado as Delineated by USGS Karst MappingDavid J. Weary and Daniel H. Doctor
51 Identi!cation of Gypsum, Anhydrite, and Salt on Geophysical Logs in the GreaterPermian Evaporite BasinKenneth S. Johnson
WEST TEXAS AND SOUTHEASTERN NEW MEXICO
63 Evaporite Karst as a Transportation and Infrastructure Geohazard in the LowerPecos Region, Southeastern New Mexico and West TexasLewis Land
79 Geophysical Characterization of Playa Lakes in the GypsumKarst of SoutheasternNew Mexico, USADavid D. Decker, Lewis Land, and Barbara Luke
93 Determining Annual to Decadal Subsidence Areas andRates Using Airborne Lidar,GPS Surveys, and Topographic Maps at the Wink Sinkholes, West TexasJeffrey G. Paine, Lucie Costard, John Andrews, Aaron Averett, Kutalmis Saylam, andJohn Hupp
105 Sinkholes in Wink, Texas Observed by Satellite Radar ImageryJin Woo Kim and Zhong Lu
111 Assessing Collapse Risk in Evaporite Sinkhole-Prone Areas Using CommonlyAvailable Oil Field Data in the Area of the Wink Sinks, Winkler County, TexasRobert C. Trentham and Miles A. Henderson
125 Evaporite Dissolution and the Waste Isolation Pilot Plant (WIPP) in the NorthernDelaware Basin, Southeastern New MexicoDennis W. Powers and Robert M. Holt
151 Speleogenetic Evolution of Castile Karst Manifestations of the Delaware Basin,West Texas and Southeastern New MexicoKevin W. Stafford and Jessica Shields
iv

165 Physical and Chemical Controls on Suffosion Development in Gypsic Soil,West TexasJonah Morris, Kevin Stafford, and Kenneth Farrish
177 Geophysical Delineation of Megaporosity and Fluid Migration Pathways forGeohazard Characterization within the Delaware Basin, Culberson County, TexasJonathan Woodard, Wesley Brown, and Kevin Stafford
189 Speleogenetic Model of Evaporite-Karst Occurrences of the Gypsum Plain UsingKarst Mapping and LiDAR Analyses in Culberson County, Texas, USAJon T. Ehrhart and Kevin W. Stafford
201 A Novel Approach to Delineating Lithologic Variability of a Karsted LandscapeUsing CIR Imagery and GIS Analyses, Eddy County, New MexicoJessica Shields and Kevin W. Stafford
213 Evaporite Karst in the Permian Rustler, Salado, and Castile Formations at RedBluff Dam on the Pecos River, Loving and Reeves Counties, TexasKenneth S. Johnson, Richard A. Shoemaker, John Charlton, and Cris Parker
233 Design and Implementation of aGrout Program in anEvaporite-Karst Foundation,Red Bluff Dam, Loving and Reeves Counties, TexasJohn Charlton, Jenn Ostrowsky, Richard A. Shoemaker, and Kenneth S. Johnson
OKLAHOMA AND TEXAS PANHANDLE
247 Permian Blaine and San Andres Formations of Western Oklahoma and Palo DuroBasin of Texas: Their Correlation and Evaporite KarstKenneth S. Johnson
279 Delhi Sinkhole and Watonga Sinkhole Caused by Gypsum Karst in the PermianBlaine Formation of Western OklahomaKenneth S. Johnson
KANSAS AND COLORADO
285 This Time it’s Natural: Sinkhole Under Interstate 135 inMcPherson County, KansasNeil M. Croxton
295 Karst Feature Predictability Models Within Barber County, KansasG.M. Kelner, K.L. Gauvey, and J.B. Sumrall
305 Gypsum Karst in South-Central KansasKaitlyn L. Gauvey and Jonathan B. Sumrall
319 Salt Dissolution and the Wallace Sinkhole in the Sharon Springs–Wallace area,Wallace County, Western KansasKenneth S. Johnson
337 Dissolution of the Permian Flowerpot Salt Beneath the Great Plains Reservoirs,Queens State Wildlife Area, in Kiowa, Prowers, and Bent Counties, SoutheastColoradoKenneth S. Johnson
v

ABSTRACT.—One�of�the�major�evaporite�regions�in�the�world�is�herein�named�the�Greater�Permian�Evaporite�Basin� (GPEB).�This� evaporite� region� extends� far�beyond� the� traditional�Permian�Basin�of�west�Texas�and�southeast�New�Mexico,�and�embraces�about�650,000�km2�in�parts�of�Texas,�New�Mexico,�Oklahoma,�Kan-sas,�and�Colorado.�The�eight�main�Permian�evaporite�sequences,�each�containing�salt� (halite)� and� gypsum� and/or� anhydrite,� have� a� combined� thickness� generally�ranging� from� 500� to� 1500�m� in� various� parts� of� the�GPEB,� and� the� evaporites�extend� from�west�Texas� to� northern�Kansas� and� northeast�Colorado.�The�GPEB�embraces� several� structural� and/or� sedimentary� basins,� including� the� Delaware,�Midland,�Palo�Duro,�Hardeman–Hollis,�Dalhart,�Anadarko,�Denver�(south),�Hugo-ton,� and�Salina�Basins,� each� of�which� contains� one� or�more� thick� sequences� of�Permian� evaporites.� Gypsum� and/or� anhydrite� deposits� are� more� widespread�than�salt�deposits� in� the�GPEB:�anhydrite� is� the�common�form�of�calcium�sulfate�at�depths�below�about�15�to�30�m,�whereas�gypsum�is�almost�always� the�calcium�sulfate�at�shallower�depths�and� in�outcrops.
Evaporites� are� the� most� soluble� of� the� common� rocks.� Salt� (halite,� NaCl)�and� gypsum� (CaSO4•2H2O)� can� be� dissolved� naturally,� or� by� human� activities,�to� form� the�same�kinds�of�karst� features�present� in� limestone�and�dolomite,�such�as� caves,� sinkholes,�breccia�pipes,�disappearing� streams,� springs,� and� even� cata-strophic�collapses�(sinks�or�sinkholes).�Anhydrite�(CaSO4),�in�contact�with�water,�transforms�to�gypsum�and�then�is�susceptible�to�dissolution.�Water�in�contact�with�salt� or� gypsum�will� dissolve� some� of� the� rock,� if� the�water� is� unsaturated�with�respect� to�NaCl�or�CaSO4,� respectively,�and�will�continue� to�dissolve� the� rock� if�it� is�contacted�by�BEEJUJPOBM�unsaturated�water.�Evaporite�karst� is�present� in�most�parts�of� the�GPEB.
Salt�sequences�underlie�about�380,000�km2�of�the�GPEB,�and�salt�karst�occurs�naturally�where� the�deep-seated� salt�beds� rise� to� shallow�depths�of�about�150� to�300�m.�Each�of�the�eight�evaporite�sequences�in�the�GPEB�has�areas�where�natural�salt�dissolution�occurs�at� least�somewhere� in� the� region.�Two�major�examples�of�natural�salt�karst�are� (1)� large�subsidence� troughs� in� the�Delaware�Basin� that�are�now�!lled�with�Cenozoic�sediments�and� (2)�extensive�dissolution�of�San�Andres�and� Flowerpot/Blaine/Yelton� salts� in� the� Texas� Panhandle,� western� Oklahoma�and�Kansas,�and�southeast�Colorado.�Salt�karst�can�also�occur�when�human�activity,�such�as�solution�mining�or�some�petroleum-related�activities,�enables�unsaturated�water�to�intentionally,�or�accidentally,�dissolve�the�salt�and�create�a�water-!lled�cav-ity�large�enough�to�allow�failure�of�its�roof,�and�eventual�collapse�that�can�reach�the�land� surface� as� a� huge� sinkhole.�Examples� of� human-induced� salt� karst� because�PG� solution�mining� are� the� Cargill,� Denver� City,� Borger,� JWS,� and� Loco� Hills�Sinks.�Salt-karst� sinks� related� to�petroleum�or�water� supply� activities� include� the�Wink,�McCamey,� Jal,� Panning,� Berscheit,� Hilton,� Witt,� and� Crawford� Sinks;�other� fea-tures�related�to�petroleum�activities�are�the�Hutchinson�gas�explosion,�the�Freedom�gas�blowout,�and�Pecos�County�subsidence.
Johnson, Kenneth S., 2021, Overview of Evaporite Karst in the Greater Permian Evaporite Basin (GPEB) of Texas,New Mexico, Oklahoma, Kansas, and Colorado, USA, in Johnson, K. S.; Land, Lewis; and Decker, D. D. (eds.),Evaporite Karst in the Greater Permian Evaporite Basin (GPEB) of Texas, New Mexico, Oklahoma, Kansas, andColorado: Oklahoma Geological Survey, Circular 113, p. 1–37.
OLlahoma�Geological�Survey�Circular�113,�2021
Overview�of�Evaporite�Karst�in�the�Greater�Permian�Evaporite�Basin�(GPEB)of�Texas,�New�Mexico,�Oklahoma,�Kansas,�and�Colorado,�USA
Kenneth�S.�JohnsonRetired�Geologist,�Oklahoma�Geological�Survey,
Norman,�Oklahoma
1

THE�GREATER�PERMIAN�EVAPORITE�BASIN�(GPEB)
The� traditional� Permian� Basin� of� west� Texas� and�southeast�New�Mexico� is�a�complex�system�of�basins,�platforms,�and�shelf�areas�that�contain�sedimentary�rocks�and� sediments� of� Cambrian� through� Quaternary� age�and�covers� an� area�of�nearly�200,000�km2� (Figure�1).�Permian-age�rocks�in�the�Permian�Basin�are�mostly�dom-inated�by�evaporites—mainly�salt�(halite)�and�gypsum�or�anhydrite.�However,�these�evaporites�are�not�restricted�to�what�is�regarded�as�the�traditional�Permian�Basin�area:�they�extend�a�great�distance�to�the�north,�and�lesser�dis-tances� to� the� east� and�west.� This� vast� region,� herein�named�the�GPEB,�embraces�about�650,000�km2� in�parts�of�Texas,�New�Mexico,�Oklahoma,�Kansas,� and�Colo-rado,�where�Permian�gypsum/anhydrite�beds�can�be�con-tinuously� traced� (Figure� 2):� Permian� salt� sequences�underlie�about�380,000�km2�of�this�region.�The�thickness�of�these�Permian�evaporites�in�the�GPEB�generally�ranges�from�about�500�to�1500�m,�and�this�is�one�of�the�thickest�and�most� extensive� accumulations�of� evaporites� in� the�world.� Typically,� the� evaporites� are� interbedded� with�redbed�clastics�and�thinner�carbonates;�however,�redbeds�and/or� carbonates� locally�make� up� a� large,� or� even� a�greater,�portion�of�the�evaporite�sequence.
The�GPEB�has�been�an�area�of�major�petroleum�explo-ration� and�production� since� the� early�1900s.�With� the�development�of�hydraulic�fracturing,�horizontal�drilling,�and�advancements� in�well�completion� technology�over�the�past�two�decades,�exploration�and�petroleum�produc-tion�in�many�parts�of�the�GPEB�have�increased�sharply.�In�addition� to�potential�environmental�and�engineering�problems�related� to� living� in,�or�construction�on,�areas
of evaporite karst, virtually all exploration boreholesdrilled for petroleum or other purposes in the regionentail drilling through one or several Permian-age evap-orite units. This may result either in encountering natural
Figure 1. Map of the traditional Permian Basin of westTexas and southeast New Mexico showing major struc-tural and tectonic features, including basins, platforms,and shelf areas.
2 ,FOOFUI�4��+PIOTPO
Gypsum�deposits�underlie�the�entire�650,000�km2�of�the�GPEB,�and�natural�gyp-sum�karst�is�common�and�widespread�in�areas�of�gypsum�outcrops�on�the�east�and�west�sides�of�the�region.�Gypsum�caves�and�sinkholes�are�abundant�in�the�Delaware�Basin� of�west� Texas� and� southeast�New�Mexico,� and� include� the� Parks�Ranch�Cave�which,�with� a� total� length� of� 6596�m,� is� the� second� longest� gypsum� cave�in� the�western� hemisphere.�And� on� the� east�"ank� of� the�GPEB,� the� other�major�gypsum-karst�area�in�the�GPEB,�major�caves�in�Oklahoma�include��(1)�D.C.�Jester�Cave,�which,�with�a� total� length�of�10,065�m,� is� the� longest�gypsum�cave� in� the�western� hemisphere;� (2)� Alabaster� Cavern,� developed� as� a�major� tourist� cave;�and�(3)�Selman�Cave,�which�is�now�an�outdoor�living�laboratory�and�!eld�station�dedicated�to�research�and�teaching.�Natural�gypsum�karst�has�caused�the�abandon-ment�of�proposed�and�actual�damsites�in�Oklahoma,�Texas,�and�New�Mexico.�Gyp-sum�karst�can,�however,�be�an�advantage:� the� freshwater�Blaine�aquifer�provides�irrigation�water�in�southwest�Oklahoma�and�north-central�Texas.�Although�gypsum�karst�can�also�be�accelerated�by�human�activities,� the�only�examples� in�the�GPEB�are�� (1)� reservoirs� that� are� now� losing�water� through� gypsum-karst� features� and�(2) reservoirs� that�had�been�proposed�or�built� (and�are�now�abandoned)� in�areasof�gypsum�karst.

evaporite-karst features that complicate drilling opera-tions, or the boreholes may create man-made karst prob-lems where inadvertent dissolution of evaporites andformation of water-!lled cavities can result in subsi-dence, collapse, or sinkholes at the land surface.
The GPEB is somewhat similar to the earlier conceptof the “Permian salt basin,” as used by Bachman andJohnson (1973, p. 2) when they referred to the regionthat “includes a series of discontinuous sedimentary ba-sins in which halite and associated salts accumulatedduring Permian time.”The difference is that their “Perm-ian salt basin” embraces just the area underlain by salt,whereas the GPEB includes the 650,000 km2 underlainby salt and intimately associated gypsum/anhydrite.
Boundaries of the GPEB on the east and west are ero-sional limits,where the evaporite units crop out, and on the
south, it is the Marathon–Ouachita Fold Belt. The northlimit of the basin is where theWellington evaporites gradeinto clastics in north-central Kansas, and where the BlaineFormation is less than 6 m thick in northwest Kansas andthe Denver Basin of northeast Colorado. A number ofPermian evaporites (mainly salt) are present farther northin the Denver Basin, and beyond, but they are not tracedcontinuously into evaporites at the north end of theGPEB.
Within the GPEB are a number of major structuraland/or sedimentary basins, including (from the south)the Delaware, Midland, Palo Duro, Hardeman–Hollis,Dalhart, Anadarko, Denver (south), Hugoton, and SalinaBasins (Figure 2). Each of these basins has been the sitefor the accumulation of thick sequences of Permianrocks, and evaporites make up a signi!cant (or major)part of the Permian in each area. Figure 3 shows the
Figure�2.�Map�showing:�(1)�approximate�limits�of�Permian�salt�and�gypsum/anhydrite�in�the�Greater�Permian�Evap-orite� Basin� (GPEB);� (2)� outlines� of�major� structural/sedimentary� basins� (dotted� red� lines)� in� GPEB;� and� (3)stratigraphic�columns�1–12�SFE�OVNCFST�BOE�OBNFT�that�are�shown�in�Figure�3.
Overview of Evaporite Karst in the Greater Permian Evaporite Basin (GPEB) 3

Figure 3. Stratigraphic nomenclature of Permian strata in GPEB showing rock units containing signi!cant amounts of salt and/or gypsum/anhydrite.Location of columns 1–12 is shown in Figure 2.
4,FOOFUI�4��+PIOTPO

Figure�3�DPOUJOVFE.�Stratigraphic�nomenclature�of�Permian�strata�in�GPEB�showing�rock�units�containing�signi!cant�amounts�of�salt�and/or�gypsum/anhydrite.�Location�of�columns�1–12�is�shown�in�Figure�2�
Overview
ofEvaporite
Karst
inthe
Greater
Perm
ianEvaporite
Basin
(GPEB)
5
Permian stratigraphic units in each of the 12 basins orshelf areas identi!ed in the GPEB as shown in Figure 2,and indicates those units that contain signi!cant amountsof evaporites (salt and/or gypsum/anhydrite). This two-part chart (Figure 3) is modi!ed slightly from four chartspublished by the American Association of PetroleumGeologists in 1983–1988 as “Correlation of Strati-graphic Units of North America (COSUNA) Project.”The four COSUNA charts are “Texas–Oklahoma Tec-tonic Region,” “Mid-Continent Region,” “Southwest/Southwest Mid-Continent Region,” and “Central andSouthern Rockies Region.”Note that, in Figure 3, wherethe type of evaporite in a rock unit is mostly salt or gyp-sum/anhydrite, it does not mean that the evaporite(s)is/are necessarily the major rock type: the unit may bemostly limestone, sandstone, or shale, but if evaporitesare a signi!cant part of the rock unit, then I want toshow which of the evaporites is more abundant. Notealso, in Figure 3, that some workers place the Glori-eta/San Angelo/Duncan Sandstone in the LeonardianSeries, along with part or all of the Nippewalla Group.
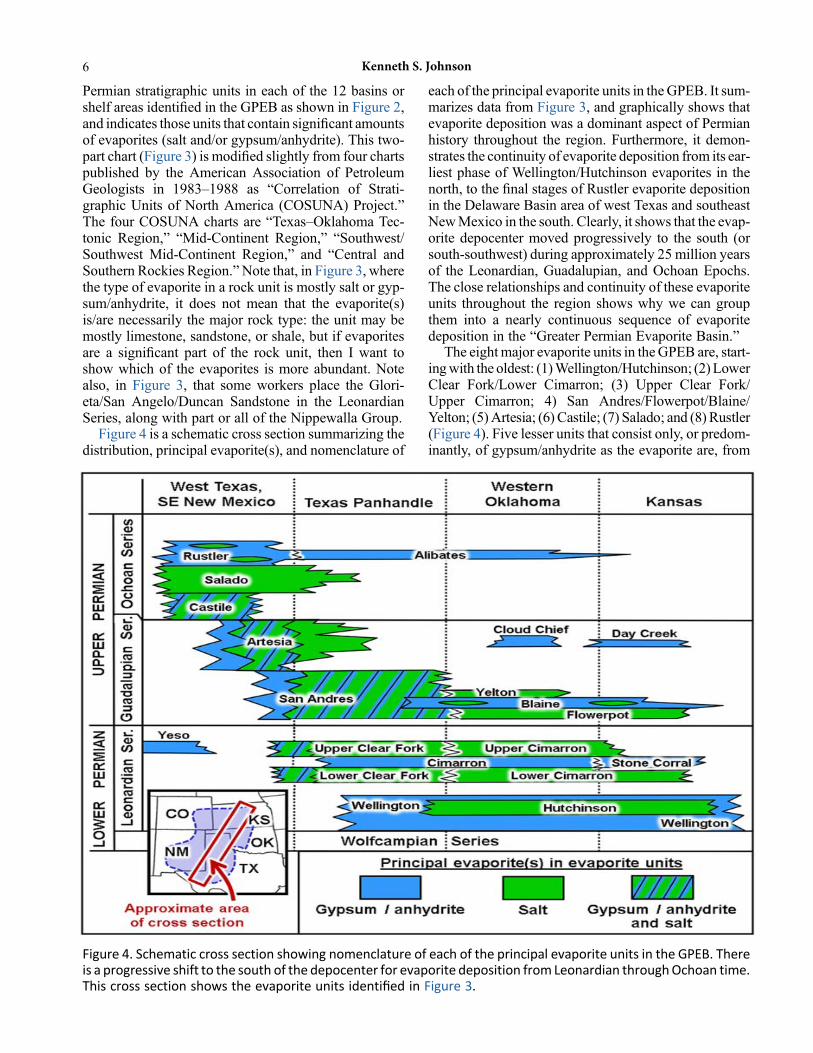
Figure 4 is a schematic cross section summarizing thedistribution, principal evaporite(s), and nomenclature of
each of the principal evaporite units in the GPEB. It sum-marizes data from Figure 3, and graphically shows thatevaporite deposition was a dominant aspect of Permianhistory throughout the region. Furthermore, it demon-strates the continuity of evaporite deposition from its ear-liest phase of Wellington/Hutchinson evaporites in thenorth, to the !nal stages of Rustler evaporite depositionin the Delaware Basin area of west Texas and southeastNewMexico in the south. Clearly, it shows that the evap-orite depocenter moved progressively to the south (orsouth-southwest) during approximately 25 million yearsof the Leonardian, Guadalupian, and Ochoan Epochs.The close relationships and continuity of these evaporiteunits throughout the region shows why we can groupthem into a nearly continuous sequence of evaporitedeposition in the “Greater Permian Evaporite Basin.”
The eight major evaporite units in theGPEB are, start-ingwith the oldest: (1)Wellington/Hutchinson; (2) LowerClear Fork/Lower Cimarron; (3) Upper Clear Fork/Upper Cimarron; 4) San Andres/Flowerpot/Blaine/Yelton; (5) Artesia; (6) Castile; (7) Salado; and (8) Rustler(Figure 4). Five lesser units that consist only, or predom-inantly, of gypsum/anhydrite as the evaporite are, from
Figure 4. Schematic cross section showing nomenclature of each of the principal evaporite units in the GPEB. Thereis a progressive shift to the south of the depocenter for evaporite deposition from Leonardian throughOchoan time.This cross section shows the evaporite units identi!ed in Figure 3.
6 ,FOOFUI�4��+PIOTPO

the oldest: (1) Cimarron/Stone Coral; (2) Yeso; (3) CloudChief; (4) Day Creek; and (5) Alibates. Gypsum/anhy-drite beds in these !ve lesser units typically are 3 to30 m thick.
Maps of seven major Permian salt units in the GPEB(Figure 5) show the approximate distribution of these saltunits, and also indicate areaswhere natural dissolution ofeach of the salt units is occurring, or has occurred in thepast. Although the Rustler Formation is one of the eightmajor evaporite units in theGPEB, it has relativelyminoramounts of salt that have escaped dissolution (Powersand Holt, 2000) and it is not here considered a majorsalt-bearing unit. Numerous reports have been done onindividual salt deposits in the various parts of theGPEB, and the reader is referred to the!ve State Geolog-ical Surveys as prime sources of this information.Comprehensive overviews covering all the salt unitsthroughout the entire region are provided by Pierceand Rich (1962), Lefond (1969), Johnson and Gonzales(1978), and Ege (1985). The oldest salt unit, the Hutch-inson Salt (Figure 5A), is in the far north of the GPEB,and, in general, younger salt units are in progressivelymore southerly positions.
Permian gypsum and/or anhydrite deposits are morewidespread than the salt in the GPEB (Figure 2), andgypsum crops out in many parts of the region. Anhydrite(CaSO4) is the common form of sulfate rock in the mod-erate-to-deep subsurface (at depths of more than about15 to 30 m below land surface), whereas gypsum(CaSO4•2H2O), which results from hydration of anhy-drite, is almost always the sulfate rock at shallow depths,and certainly in most outcrops. In this report, I will com-monly use the term gypsum to refer to either gypsum oranhydrite when referring to sulfate rock in outcrops orshallow subsurface. There are many reports on individ-ual gypsum units in various parts of theGPEB, and againthe reader is referred to the !ve State Geological Surveysas prime sources of this information. Comprehensive bib-liographies or discussions of principal gypsums through-out the region are provided by Withington and Jaster(1960), Withington (1962), Smith and others (1973),and Johnson and others (1989).
NATURAL EVAPORITE KARST IN THE GPEB
Evaporites, including salt (halite, NaCl) and gypsum(CaSO4•2H2O), are the most soluble of the commonrocks. They are dissolved readily to form the sametype of karst features normally found in limestone anddolomite, such as caves, sinkholes, breccia pipes, disap-pearing streams, springs, and (occasionally) dramatic orcatastrophic subsidence features. The process for disso-lution of evaporites was discussed by Johnson (1981,2005b) with reference to salt dissolution, but the princi-ples also apply to gypsum dissolution: groundwater incontact with salt or gypsum will dissolve some of the
rock, providing that the water is not already saturatedwith NaCl or CaSO4, respectively. For extensive disso-lution to occur, the resulting brinemust be removed fromthe evaporite rock, or else the brine becomes saturatedand the dissolution process stops. The basic require-ments for evaporite dissolution to occur are (1) a depositof salt or gypsum against which, or throughwhich, watercan "ow; (2) a supply of water unsaturated with NaCl orCaSO4, respectively; (3) an outlet whereby the resultingbrine can escape; and (4) energy, such as a hydrostatichead or density gradient, to cause water to "ow throughthe system. Examples of natural evaporite karst are pres-ent in most parts of the GPEB, and the following discus-sion will highlight only some of them. Once again, thereader is referred to the !ve State Geological Surveysas prime sources of information about areas and exam-ples of evaporite karst in their state.
Natural Salt Karst
Salt deposits underlie most parts of the GPEB(Figures 2, 5), and natural dissolution is, or has been,going on along some part of the periphery of all sevenof the major salt units (Figure 5). Whereas dissolutionfronts are widespread in most of these salt units, theLower and Upper Cimarron salts (Figure 5B and 5C)are being dissolved at relatively shallow depths onlyin small portions of northwestOklahoma (the dissolutionfront of the Lower Cimarron salt may also extend intosouthwest Kansas). Dissolution has been going on inthe Texas Panhandle (Figure 5D) at least sinceMiocene–Pliocene time (Gustavson and Finley, 1985), and it’slikely that it has persisted in some areas even longerthan that, perhaps even as early as Late Cretaceoustime. Figure 6A shows the areas or sites of natural saltkarst in the GPEB. Evidence that natural dissolution ofsalt is still going on is clearly shown by virtue of themany salt plains and salt springs that are present in theArkansas, Red, Brazos, and Pecos River drainage areas.
Examples of Natural Salt Karst
Delaware Basin Subsidence Troughs. One of theareas of signi!cant paleodissolution of salt is in the Del-aware Basin, which contains a great thickness of Castileand Salado salts (Figures 5, 6A, 7, 8). An excellentsummary of the geologic setting, the evaporites, andkarst features in the Delaware Basin is provided byHill (1996), and further discussion of a variety of karstfeatures in southeast New Mexico is given by Hill(2003). Salt beds in the Castile Formation have been dis-solved on the west side of the Delaware Basin, and thosein the Salado Formation are dissolved on the west andeast sides of the basin: most of the dissolution occurredduring the Cenozoic Era and was accompanied by sub-sidence of overlying strata and in!lling of the subsidence
Overview of Evaporite Karst in the Greater Permian Evaporite Basin (GPEB) 7

Figure 5. Maps showing approximate distribution and dissolution limits of seven major Permian salt units in the GPEB of southwestern United States.Based primarily on Pierce and Rich (1962), Johnson and Gonzales (1978), and Ege (1985).
8KFOOFUI�4��+PIOTPO

troughs with more than 450 m of Cenozoic !ll (Maleyand Huf!ngton, 1953; Lambert, 1983; Bachman,1984) (Figures 7, 8). The stratigraphic positions of thedissolved Castile salt beds on the west side of the basinare now marked by zones of brecciated anhydrite thatresult from collapse and lowering of overlying units(Anderson and others, 1972, 1978; Anderson, 1981).
Red Bluff Dam. Red Bluff Reservoir, located adja-cent to the small community of Red Bluff on the PecosRiver in Loving andReeves Counties, Texas (Figure 6A),has experienced a loss of water through collapse featuresand karst zones in the outcropping Rustler Formationthat underlies the dam foundation. Rocks in the Rustlerare largely broken up and chaotic, mainly because of nat-ural dissolution of salt and gypsum in the Rustler andthe underlying Salado and Castile Formations (Johnsonand others, 2021). The Rustler consists mainly of inter-bedded dolomite, gypsum, and shale, and originally italso contained some salt interbeds. Dissolution of thesalt and gypsumhas caused extensive collapse structuresand breccia pipes, and as water "ows in and around thebrecciated rock it further dissolves the gypsum and dolo-mite to produce additional karst features beneath thedam. The dam was completed in 1936, and soon after-ward extensive seepage was noted at several placesalong the toe and downstream slope of the dam. Initialprograms for grouting the dam’s foundation were carriedout in 1973 and 1978, and details of the latest groutingprogram are discussed by Charlton and others (2021).
Figure�6.�Sites�of�natural�or�human-induced�salt�karst�in�the�GPEB�discussed�in�this�report.�(A)�Natural�salt�karstand�(B)�Human-induced�salt�karst.
Figure 7. Map of Delaware Basin showing dissolution/collapse features that resulted in subsidence basinswith Cenozoic !ll. Modi!ed fromMaley and Huf!ngton(1953) and Baumgardner and others (1981). Cross sec-tion A—B is shown in Figure 8.
Overview of Evaporite Karst in the Greater Permian Evaporite Basin (GPEB) 9

Figure 8. Cross section through Delaware Basin showing sediment-!lled subsidence troughs resulting from thenatural dissolution of salt and collapse of overlying strata (modi!ed from Martinez and others, 1998). Wink Sinksare shown at east end of cross section. Location of cross section is shown in Figure 7.
Figure 9. Views of Bottomless Lakes State Park. (A) Oblique aerial view of sinkholes; Google Earth, dated October 4,2014. (B) View ofMirror Lakes, looking to south; gypsumbeds dip sharply (20°) to southwest, because of dissolutionof underlying salt and gypsum. (C) View of Mirror Lakes, looking to northwest; photo courtesy Anthony H. Cooper.(D) View of red-stained gypsum (white on fresh surfaces) and redbeds of Artesia Group in wall of sinkhole.
10 ,FOOFUI�4��+PIOTPO

Waste Isolation Pilot Plant (WIPP) Site Area. TheWIPP has been intensively investigated for the possibil-ity of salt karst that could adversely impact the safe, long-term storage of radioactive waste from US defenseprograms (investigations summarized in Powers andHolt, 2021). Since 1999, transuranic wastes have beenplaced in mined-out cavities in salt beds of the SaladoFormation at a depth of about 650 m at the WIPP site,about 40 km east of Carlsbad, in Eddy County, NewMexico (Figure 6A). Although salt karst is known inthe vicinity of the WIPP site, it has not been identi!edwithin the boundaries of the project area, except for evi-dence of minor salt dissolution in the middle part of theoverlying Rustler Formation. Surface evidence of evap-orite karst is present in Nash Draw, to the west of theWIPP site, and !ve “dome” or breccia-pipe structureslocated about 17 to 32 km northwest of WIPP—severalof which result from the deep-seated dissolution of saltbeds. Although the WIPP site has yielded only minorevidence of natural salt dissolution, it is included inthis report because of the intensive evaporite-karstresearch that has been conducted in the surroundingareas and is documented by Powers and Holt (2021).
Bottomless Lakes. Major karst features along thelower Pecos River Valley are present in the BottomlessLakes State Park (BLSP) area, about 18 km ESE of Ros-well, inChavesCounty,NewMexico (McLemore, 1999;Land, 2003;Rawling andMcCraw, 2010) (Figures 6A, 9).Natural ground-water movement and dissolution ofsalt and gypsum in the underlying San Andres artesianaquifer and the lower part of the Artesia Group havecaused the collapse of the outcropping upper ArtesiaGroup (Seven Rivers Formation in BLSP) gypsumand redbeds, thus forming a series of cenotes, or sinkholelakes (the “Bottomless Lakes”). Water in all the lakescomes entirely from groundwater seepage, and evidenceof salt and gypsum dissolution is found in the brackishand saline quality of water in four of the lakes (Land2003): total dissolved solids range from about 6000 to38,000 ppm, and average about 21,000 (all !gures arein ppm); chlorides range from about 2150 to 15,600,and average about 8600; and sulfates range from about2100 to 8900, and average about 4800.
Sinkholes at BLSP are adjacent to the Pecos River"oodplain, and the river is now located about 2 km tothe west. Artesia Group strata normally dip about 1°to the east in the area, but at BLSP they dip sharply tothe southwest at 20–40° (Land, 2003) because of disso-lution of underlying salt and gypsum beds (Figure 9B).Most of the sinkholes and lakes are 50 to 100 m in diam-eter (Figure 9A), but Lea Lake (not shown in Figure 9A),formed by the coalescence of several sinkholes, meas-ures about 250 m by 400 m. The steep-to-vertical wallsof the sinkholes are generally 30 to 60 m high, and the
depth of water in the lakes ranges from about 5 to27 m. Although these sinkholes have been present sinceprehistoric times, the continued mass wasting and col-lapse of the cenote walls shows that dissolution is stillgoing on in the area (Land, 2003).
Palo Duro Basin Salt Dissolution. Natural dissolu-tion of salts in the San Andres Formation is widespreadin the Texas Panhandle (Figures 6A, 10, 11), and hasbeen going on since at least Miocene–Pliocene times(Gustavson, 1986). The Bureau of Economic Geology,at The University of Texas at Austin, has conductedextensive studies of salt deposits and salt karst in theTexas Panhandle: pertinent references and a brief sum-mary of these studies are given by Johnson (2021a).
Figure 10. Map showing zones of salt dissolution in thelower and upper San Andres Formation and equivalentstrata in the Palo Duro, Dalhart, and Anadarko Basins.Based on work by Presley (1981) in the Palo Duro Basin,and by Jordan and Vosburg (1963) and Johnson (1976)in the Dalhart and Anadarko Basins. Cross section B—B’is shown in Figure 11.
Overview of Evaporite Karst in the Greater Permian Evaporite Basin (GPEB) 11

Net salt thicknesses of up to 120 m in the lower San An-dres, and up to 90m in the upper San Andres, are presentin the deep Palo Duro Basin: these salt beds are partiallyor totally dissolved where they rise to depths of 150 to300 m below the current land surface. At these relativelyshallow depths, dissolution and removal of the salt hascaused overlying strata to be fractured, disrupted, andchaotically dropped, resulting in sinkholes, complexfolds, faults, breccias, and breccia pipes. A cross sectionin the east part of the Palo Duro Basin (Figure 11) showsthat the upper San Andres salts are dissolved at a depthof about 150 m in Well #43, and the remaining lowerSan Andres salts are also dissolved where they wouldbe at a depth of about 150 m in Well #9.
Anadarko Basin Salt Dissolution. Examples of nat-ural dissolution of Permian salts in the Anadarko Basinof Oklahoma are given by Ward (1961) and Johnson(1976, 2003a, 2013, 2017, 2021a) (Figures 6A, 12). Saltsin the Blaine Formation and associated strata (the Beck-ham evaporites) are up to 250 m thick along the axis ofthe Anadarko Basin in eastern Beckham County, andthey tend to be dissolved on the !anks of the basin wherethey rise to depths of less than 150 to 300 m (Figure 12).Outcropping strata in this part of the Anadarko Basinnormally dip at angles of less than one degree (less
than 10 m/km) toward the axis of the basin, but dissolu-tion of these salts has resulted in a number of collapsestructures at the land surface. Where salt has been dis-solved (primarily the Yelton salt), overlying stratahave subsided, settled, or collapsed into undergroundwater-"lled cavities, producing outcrops of collapseblocks that dip erratically at angles of 5 to 30°, as wellas breccia pipes in which blocks of Cretaceous limestoneand sandstone have been dropped some 50 m, or more,and are juxtaposed against various Permian formations(Suneson, 2012; Johnson, 2013, 2017, 2021a).
Western Kansas. In Kansas, Merriam and Mann(1957) describe a large number of natural sinkholesand depressions that result from dissolution of salts inthe Blaine and/or Flowerpot Formations, and in theHutchinson Salt Member of the Wellington Formation.Sinks such as the Mead, Jones Ranch, Big Basin,and Little Basin Sinks in southwest Kansas areundoubtedly related to dissolution of Blaine and/orFlowerpot salts (note: these sinks are bold and under-lined here because they are shown in Figure 6A). Evi-dence of ongoing dissolution is the Wallace Sinkhole,which formed in July 2013 about 14 km north of thetown of Wallace, in Wallace County (Figure 6A). Thesink reached about 60m across and 27m deep, as a result
Figure 11. Regional stratigraphic cross section B—B’ showing transition of part of the San Andres Formation to theBlaine Formation in the Palo Duro Basin (modi!ed from Presley, 1981). Salt beds of the San Andres in the Palo DuroBasin are all dissolved where they approach the eastern outcrops in north-central Texas. Location of cross section isshown in Figure 10.
12 ,FOOFUI�4��+PIOTPO

of dissolution of the Flowerpot and Blaine salts (John-son, 2021b). A nearby petroleum test, drilled about3 km south of the sink, encountered 12 m of middleBlaine Formation salt at a depth of 704 m (2310 feet),and 67 m of Flowerpot salt at a depth of 727 m (2385feet): these are the shallowest salts in the area. It is likelythat natural dissolution of the Blaine and Flowerpot saltscreated a water-!lled cavity that migrated upward and!nally breached the surface as the Wallace Sinkhole in2013.
Also in Wallace County, western Kansas, the SmokyBasin Cave-in formed just 8 km east of Sharon Springsin 1926 (Merriam and Mann, 1957; Johnson, 2021b)(Figure 6A). In little more than 1 month, the sink wasabout 75 by 105 m wide, and, in its center, the sinkwas !lled with about 50 m of water. Although the early
common view was that the Smoky Basin Cave-in re-sulted from dissolution of carbonate rocks (the Creta-ceous Niobrara Chalk) (Merriam and Mann, 1957), thesink undoubtedly formed because of natural dissolutionof the Blaine and Flowerpot salts, in the same manner asthe Wallace Sinkhole was formed (Johnson, 2021b).Several other sinkholes in the Sharon Springs–Wallacearea that formed at earlier or unknown times are Sinks1, 2, and 3, in Bradshaw Draw, and Old Maid’s Pool(Johnson, 2021b).
Hutchinson Salt Dissolution. The Hutchinson Saltshows a prime example of salt dissolution along partof its eastern margin in central Kansas (Figures 5A,6A, 13). The Hutchinson Salt is typically 60 to 120 mthick in the area, where it has not been affected by
Figure 13. Map and cross section showing natural dissolution of Hutchinson Salt across Rice and McPherson Coun-ties, Kansas. Equus beds were deposited in subsidence basins formed by salt dissolution. Map from Johnson andGonzales (1978); cross section modi!ed from Anderson and others (1995b).
Figure 12. Cross section showing the dissolution of Permian salt units in eastern Beckham and western WashitaCounties, Oklahoma (from Johnson, 2013). The Flowerpot salt, Blaine Formation, and Yelton salt are collectivelyreferred to as the Beckham evaporites by Jordan and Vosburg (1963).
Overview of Evaporite Karst in the Greater Permian Evaporite Basin (GPEB) 13
dissolution, but within an easterly distance of only 10 to15 km,most of the salt has been dissolved alongmuch ofits east margin. The salt has been removed in this areabecause unsaturated groundwater has circulated downto, and around, the salt beds, and dissolved them fromTertiary time through to the present (Walters, 1978;Wat-ney and Paul, 1980; Watney and others, 1988; Andersonand others, 1995a, 1995b). Cavernous conditions in thedissolution zone have created a “lost circulation zone,”wherein boreholes drilled through the zone cannot recir-culate drilling "uids that are lost into the cavities. Gogel(1981) discusses the emission of brines derived from dis-solution of the Hutchinson Salt in central Kansas, andprovides a number of cross sections showing the salt dis-solution front (Gogel, 1981, Plate 2). Dissolution of thissalt has caused overlying strata to subside, and a series ofsubsidence basins were !lled by Tertiary through Recentsediments deposited over the dissolution zone (Figure 13).The presence of bones and teeth of Quaternary horses inthese unconsolidated layers of silt, sand, and gravel ledto them being referred to as the “Equus beds,” whichlocally reach a thickness of about 85 m (Walters, 1978).This dissolution front, accompanied by subsidence andsubsequent in!lling, is similar to the salt dissolution andCenozoic !ll in the Delaware Basin (see above).
A recent example of Hutchinson Salt dissolution andresultant subsidence is reported in this volume by Crox-ton (2021) at a site about 7 km SE of Lindsborg, in north-ern McPherson County, Kansas. Bedrock beneath thenorthbound lanes of Interstate 135 here has subsidedabout 1.5 m since 1967, when the interstate was con-structed, and the subsidence is centered near a pier ofan overpass bridge carrying a county road named Shaw-nee Road; the subsidence feature is referred to as theShawnee Road Sink (Figure 6A). This has caused anoticeable depression in northbound lanes, and eventu-ally, they will need to be built up to preserve visibilityand prevent ponding during heavy rains. Because thebridge itself is being affected (it shows noticeabledips), and because clearance beneath the bridge couldbe compromised by bringing the interstate back up tograde, it was decided to remove the bridge and closethe county road at the site. Croxton (2021) reports thatthe Hutchinson Salt is about 45 to 60 m below theland surface here, and that natural dissolution of thesalt has resulted in numerous shallow depressions andsinkholes in McPherson County and adjacent areas.
Baca County Salt Dissolution. Natural salt dissolu-tion occurs in Baca County, southeast Colorado, wheredissolution of salt in the middle of the Blaine Formationis af!rmed at several places along a pro!le that is about50 km long (Figures 6A, 14). Askew (2013) shows thatthis middle Blaine salt unit, typically 18 to 22 m thick inmost of his 2000 km2 study area, abruptly thins to about
3 m (all salt is probably gone, and only clastics remain)in a number of elongated “zones” that are 2 to 8 kmwideand 5 to 20 km long. These zones, where the salt hasbeen removed, are elongated with a north-northeast ori-entation, which is consistent with a series of deep-seated, en-echelon-type faults mapped in Ordovicianrocks beneath the area. Strata above the salt, includingoverlying Permian and Triassic (Dockum Formation)units, remain a constant thickness over all parts of thestudy area (including over the patches of thin salt),thus indicating that local dissolution of the salt occurredafter Dockum deposition. Askew (2013) postulates thatrecurrent movement along the deep-seated faults duringthe Laramide Orogeny (Late Cretaceous through EarlyEocene), and later tectonic activity, might have allowedmigration of freshwater from the overlying CretaceousDakota Sandstone and Tertiary Ogallala Formationdown to the middle Blaine salt, and bring about itspartial dissolution along these preferred fault/fracturezones.
Great Plains Reservoirs. Natural dissolution of theFlowerpot salt beneath the Great Plains Reservoirs areahas resulted in ten large, natural depressions beingformed in prehistoric times: these contiguous depres-sions are now being used to store water in four major res-ervoirs in Kiowa County, Colorado (Johnson, 2021c)(Figure 6A). The Flowerpot salt is generally 60 to75 m thick in the northeast part of the study area, butit thins sharply and is mostly dissolved to the southwestacross a major salt dissolution front. Some residualmasses of salt up to 54 m thick are present in the south-west, showing that dissolution is not complete. Individ-ual natural depressions range from 1.6 to 13.0 km2, andare probably some of the largest salt dissolution/collapsefeatures in southeast Colorado. The timing of salt disso-lution here is unknown, but, because the large depres-sions are still present in the current landscape, it hasprobably persisted until at least the late Pleistocene orHolocene Epochs.
Las Animas Arch Salt Dissolution. Another exam-ple of natural salt dissolution in Colorado is reported byBerry (2018). Using a 3D seismic survey and petroleum-test geophysical logs, he examined dissolution phenom-ena over the Las Animas Arch in parts of Cheyenne andKiowa Counties (Figure 6A). The Flowerpot salt,referred to by Berry as the “lower Blaine halite,” is about55 to 60 m thick in the east half of his study area, but istotally dissolved in the west half. The middle Blaine salt,referred to by Berry as the “upper Blaine halite,” is dis-solved at most places in his study area, but is about 12 mthick where not dissolved. Berry (2018) concluded thatdissolution of the middle Blaine salt occurred mainlybefore Taloga deposition (Late Permian), and dissolution
14 ,FOOFUI�4��+PIOTPO

of the deeper Flowerpot salt occurred in post-Talogatime, but before deposition of the Dakota Formation(Late Cretaceous).
Natural Gypsum Karst
Although gypsum is more widespread than salt in theGPEB, the areas of gypsum karst are not as widespread:gypsum is much less soluble than salt, and natural gyp-sum karst typically is limited to areas where gypsumcrops out, or is less than about 30 m below the land sur-face. One or more formations containing gypsum (oranhydrite) are present in the subsurface beneath all partsof the GPEB (Figure 3); however, outcrops of gypsumare chie"y along the western and eastern sides of theGPEB (Figure 15). In these areas, typical gypsum-karstfeatures abound (Figure 16): gypsum karst on the west-ern side is described by Sares and Wells (1987), Belski(1992), Hill (1996), Forbes and Nance (1997), Staffordand others (2008a, 2008b, 2017), Stafford and Nance(2009, 2018), Stafford (2013), and Land (2021); gypsumkarst on the eastern side is described by McGregor and
others (1963), Reddell and Russell (1963), Myers andothers (1969), Bozeman (1987, 2003), Johnson (1989,1990, 1996, 2003a, 2003b, 2018, 2021d), Bozemanand Bozeman (2002), Johnson and Wilkerson (2013),and Johnson and others (2013). Individual gypsumbeds typically are 3 to 10 m thick in most GPEB forma-tions, but are up to 30 m thick in the Cloud Chief Forma-tion of the Anadarko Basin and 20 to 200 m thick in theCastile Formation of the Delaware Basin (Johnson andothers, 1989).Quinlan and others (1987) report that thereare more than 500 gypsum caves in the United States,and that most of them are in the Permian Basin.
Examples of Natural Gypsum Karst
Delaware Basin. The Delaware Basin of west Texasand southeast New Mexico contains one of the greatestaccumulations of evaporites in the United States (John-son and others, 1989). Evaporites (gypsum/anhydriteand salt) of the Castile, Salado, and Rustler Formationstypically are 500 to 1500 m thick within the DelawareBasin and are more than 450 m thick where these
Figure 14. Cross section showing the natural dissolution of salt in middle part of Blaine Formation in eastern BacaCounty, Colorado (modi!ed from Askew, 2013). Depth to the top of salt ranges from about 365 m in north (A) toabout 200m in the south (B).Mostwell logs here are gamma-ray logs; however, two resistivity log curves have been"ipped, or reversed (“Reversed Resistivity”), horizontally to mimic the de"ections of the gamma-ray logs.
Overview of Evaporite Karst in the Greater Permian Evaporite Basin (GPEB) 15
deposits extend to the north and east. Outcrops of thesethree formations constitute the most extensive examplesof gypsum karst and subsidence in the nation. Thearea referred to as the Gypsum Plain comprises about2600 km2 of outcropping gypsum of the Castile andSalado Formations (Kirkland and Evans, 1980), andadditional gypsum outcrops are present just to theeast, in the Rustler Hills and into Reeves County, Texas.
Outcrops of gypsum in the Delaware Basin containabundant sinkholes, caves, closed depressions, collapsesinks, and underground drainage (Figure 16C); excellentsummaries are provided by Hill (1996), Stafford andothers (2008a, 2008b), Stafford and Nance (2009,2018), Land and others (2018b), and Land (2021).Four principal areas of gypsum karst in the DelawareBasin are the Gypsum Plain, Nash Draw, Burton Flat,and the Pecos River Valley (Hill, 1996). All four areascontain sinkholes ranging from a few meters to 100 macross; there are active collapse features in all four areas,and generally they extend down to shallow, underground
caverns less than 100m deep. One sinkhole, formed dur-ing a storm in 1918, collapsed suddenly to form a gapinghole about 25 m across and 20 m deep (Hill, 1996).
Caves are prominent and abundant on the GypsumPlain and Burton Flat (Sares and Wells, 1987; Belski,1992; Stafford and others, 2017; Stafford and Nance,2018). The Parks Ranch Cave, with a total length of6596 m, is the second longest gypsum cave system inthe western hemisphere (after the D.C. Jester Cave,described below) (Stafford and others, 2008a). The ParksRanch Cave is developed in the Castile Formation inChosa Draw, Eddy County, New Mexico. A specializedstudy of karst geohazards in the Rustler Formation wasconducted along the route of US Highway 285 in thearea from Loving, New Mexico, south to the Texas stateline (Land andothers, 2018b). Surfacemapping andnear-surface electrical resistivity (ER) surveys along US 285indicate that most sinkholes in the Rustler are less thanabout 3 m below the surface (Land and others, 2018a).
Pecos River Valley. Along the west "ank of theGPEB, in eastern NewMexico, gypsum crops out exten-sively along parts of the Pecos River Valley (Figures 9,15). Various gypsum and carbonate units are present inthe Permian Artesia Group and San Andres Formation,and they contain a large number of sinkholes, caves,and subsidence features in the Vaughn–Roswell area(Fischer and Hackman, 1964; Kelley, 1971; Forbesand Nance, 1997). Several of the caves in this area aremore than 3.2 km long, and the deepest has a verticalextent of more than 120 m (Forbes and Nance, 1997).Gypsum beds of the upper Artesia Group crop out exten-sively in the walls of the large sinkholes or cenotesformed by dissolution of salt and gypsum at BottomlessLakes State Park (described above).
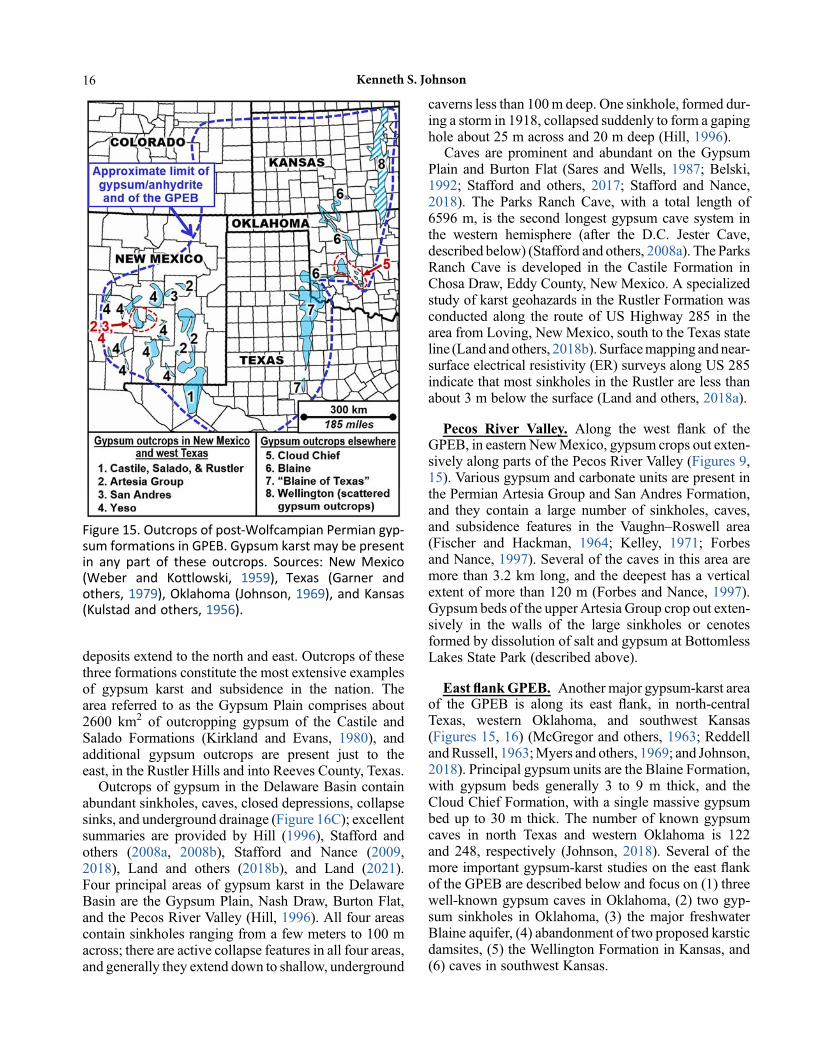
East !ankGPEB. Another major gypsum-karst areaof the GPEB is along its east "ank, in north-centralTexas, western Oklahoma, and southwest Kansas(Figures 15, 16) (McGregor and others, 1963; ReddellandRussell, 1963;Myers and others, 1969; and Johnson,2018). Principal gypsum units are the Blaine Formation,with gypsum beds generally 3 to 9 m thick, and theCloud Chief Formation, with a single massive gypsumbed up to 30 m thick. The number of known gypsumcaves in north Texas and western Oklahoma is 122and 248, respectively (Johnson, 2018). Several of themore important gypsum-karst studies on the east "ankof the GPEB are described below and focus on (1) threewell-known gypsum caves in Oklahoma, (2) two gyp-sum sinkholes in Oklahoma, (3) the major freshwaterBlaine aquifer, (4) abandonment of two proposed karsticdamsites, (5) the Wellington Formation in Kansas, and(6) caves in southwest Kansas.
Figure 15. Outcrops of post-Wolfcampian Permian gyp-sum formations in GPEB. Gypsum karst may be presentin any part of these outcrops. Sources: New Mexico(Weber and Kottlowski, 1959), Texas (Garner andothers, 1979), Oklahoma (Johnson, 1969), and Kansas(Kulstad and others, 1956).
16 ,FOOFUI�4��+PIOTPO

Three gypsum caves in Oklahoma. There are 248known gypsum caves in western Oklahoma (Johnson,2018). One well-known cave, the D.C. Jester Cave(Figure 16B), located in Greer County, southwesternOklahoma, has a main passage that is 2413 m long,but, along with the side passages, the total length is10,065 m (Bozeman, 1987); it is, therefore, the longestreported gypsum cave system in thewestern hemisphere.The cave, developed in the Blaine Formation, has passa-geways that typically are 1 to 5 m in diameter, andlocally are up to 20 m wide (Bozeman, 1987; Johnson,1989b, 1990, 2003a, 2018, 2021a). The second well-known cave, Alabaster Caverns in Woodward County,northwestern Oklahoma, is now developed as a touristcave. It has a main passage about 700 m long in the
Blaine Formation; it has a maximum width of 18 mand a maximum height of 15 m (Myers and others,1969; Johnson, 2011, 2018, 2021a). And the thirdwell-known cave is Selman Cave, developed in theBlaine Formation gypsums inWoodward County, north-western Oklahoma (Bozeman, 2002; Johnson, 2018).Selman Cave is unique among caves in the region, inas-much as it has been established as an outdoor living lab-oratory and !eld station run by the University of CentralOklahoma (UCO). The UCO Selman Living Laboratoryis being used for classes and research on a host of disci-plines. Selman Cave has a total length of 4794 m, and isthe third longest gypsum cave system reported in thewestern hemisphere (after D.C. Jester Cave and ParksRanch Cave).
Figure 16. Examples of gypsum karst, sinkholes, and caves in theGPEB. (A) Karst in Cloud Chief Gypsum inOklahoma,with dissolution most pronounced along joints and bedding planes. (B) Entrance to Jester Cave in Blaine Formation,Greer County, Oklahoma. (C) Interior of Gazelle Cave in thick gypsum of Castile Formation, Culberson County, Texas(photo courtesy of Kevin Stafford). (D) Large gypsum sinkhole in Blaine Formation, Greer County, Oklahoma.(E) Dissolution channel in Blaine Formation, Oklahoma, which is now !lled with Quaternary sediment depositedfrom through-"owing water.
Overview of Evaporite Karst in the Greater Permian Evaporite Basin (GPEB) 17

Delhi�Sinkhole�and�Watonga�Sinkhole.�Two� sink-holes�formed�as�a�result�of�natural�gypsum�karst�in�the�Blaine� Formation� in� western� Oklahoma� (Johnson�2021d).�The�Delhi�Sinkhole�developed�in�2011�in�Beck-ham�County,�southwest�Oklahoma;�at�!rst�it�was�12�m�wide�and�12�m�deep,�but�eventually,�it�reached�a�diame-ter�of�18�m.�The�Watonga�Sinkhole�formed�in�1957�in�Blaine�County,�northwest�Oklahoma:�it�reached�a�diam-eter�of�14�m�and�a�depth�of�5.2�m.�Both�sinks�formed�in�open�!elds�where�about�15�to�30�m�of�Quaternary�terrace�deposits�and�dune�sands�overlie�the�bedrock,�and�there�was�no�damage�to�infrastructure.�The�depth�to�the�shal-lowest�gypsum�at�both�sites�is�about�20�to�30�m.
Blaine�aquifer.� A�major�freshwater�aquifer�is�devel-oped�in�the�Blaine�Formation�of�southwestern�Oklahoma�and� north-central� Texas� (Steele� and� Barclay,� 1965;�Johnson,�1990,�2003a,�2019;�Runkle�and�others,�1997;�Hopkins� and�Muller,� 2011).�Water� is� produced� from�the� karstic� and� cavernous� gypsum� and� dolomite� beds�of� the�Blaine� aquifer� in�Harmon,� Jackson,� and�Greer�Counties,�Oklahoma,�and�mainly�in�Childress�and�Col-lingsworth�Counties�in�north-central�Texas.�The�aquifer�is�50� to�65�m� thick�and�consists�of�nine� thick�gypsum�beds� (each� 3� to� 8�m� thick),� interbedded�with� thinner�dolomite�beds�(0.1� to�1.5�m� thick)�and�shale�beds�(0.3�to�8.0�m�thick).�Because�of�the�high�total�dissolved�solids�in�the�water�(average�about�3100�mg/L),�it�is�unaccept-able�as�drinking�water,�but�is�extensively�used�for�irriga-tion.�A�recharge�demonstration�project�was�carried�out�to�show�that�the�aquifer�can�be�recharged�with�surface�run-off�that�is�channeled�by�gravity�"ow�down�wells�or�sink-holes� into� cavities� in� the� karst� aquifer� (Osborn� and�Eckenstein,�1997).
Abandonment�of�proposed�and�actual�damsites.�Problems� associated�with� constructing� dams� on� areas�of� gypsum� karst� were� described� by� Johnson� (2008).�Two�proposed�damsites� in� the�GPEB�had� to�be� aban-doned� because� of� gypsum� karst:� the� original� Upper�Mangum� and�Cedar�Ridge�Damsites.�Also,�McMillan�Dam,� which� was� built� on� an� area� of� gypsum� karst,�was�abandoned�after�nearly�100�yr�of�use.
The�original�Upper�Mangum�Damsite,�about�14�km�west�of�Mangum�on�Salt�Fork�of�Red�River� in�Greer�County,�Oklahoma,�was�proposed�for�siting�on�gypsum�beds� in� the�Blaine�Formation.�At� this� site,� the�Blaine�Formation�is�about�60�m�thick�and�consists�of�nine�major�gypsum� beds,� each� 3� to� 9�m� thick,� interbedded�with�shales� and� dolomites� (Johnson,� 2003b).� Favorable�topography�made� the�Upper�Mangum�site�seem�attrac-tive�since�1937,�but�extensive�gypsum�karst�at�the�pro-posed� damsite� and� in� the� reservoir� area� (Figure� 16D)�always� required� additional� study.� The� !nal� study� of�the� Upper� Mangum� site� found� many� open� cavities,
clay-!lled cavities, and other karst features in and nearthe proposed abutments, and water losses during pres-sure tests ranged from 60 to 250 L/min in most tests,and were 1600 to 5300 L/min in one borehole (Johnson,2003b). A !nal assessment in 1999 reaf!rmed theunsatisfactory, karstic conditions, and recommendedabandonment of the site in favor of another location,about 11 km farther downstream in the Flowerpot Shale,where gypsum karst would not be a problem (Johnson,2003b, 2003c).
Cedar Ridge Damwas originally proposed at a site onthe Clear Fork Brazos River, about 27 kmSWof Throck-morton, in southwest Throckmorton County, Texas(Johnson and Wilkerson, 2013). However, initial coringof the damsite encountered unsuspected gypsum beds inthe Permian Jager Bend/Valera Formation. The gypsum-bearing sequence here is 30 to 45m thick, and consists ofeight gypsum beds, mostly 1 to 3 m thick, interbeddedwith shale and limestone units 1 to 10 m thick. Gypsumbeds comprise 25 to 30% of the gypsum sequence. Gyp-sum was not known to crop out in the area, and previousstudies of the area made no mention of gypsum in theJager Bend/Valera Formation. So, it was surprising tocore karstic gypsum at the damsite, and to know thatthis gypsumwould also be in the reservoir-impoundmentarea: these conditions could allow water to escape thereservoir by passing under or around the dam. In addi-tion, a blowout of natural gas occurred in a boreholeat a depth of 20 m below the proposed damsite (it isan area of oil and gas production). After re-evaluationof the area, a new damsite was proposed on the sameriver, about 8 km to the southwest, where the gypsumbeds would be about 23 m below the newly proposedsite and are expected to be too deep to be karstic orpose any problems (Johnson and Wilkerson, 2013).
Lake McMillan was created in 1893 by damming thePecos River at a site about 22 km NNW of Carlsbad,New Mexico (Land, 2021). Unfortunately, McMillanDam and the reservoir-impoundment area were locatedon gypsumbeds of the Permian SevenRivers Formation.As a result, lake water immediately started leakingthrough gypsum-karst features and reappeared in thePecos River about 6 km farther downstream. Leakagefrom the lake was considerable at various times,although water-borne sediment did cover and plugsome of the karst features. Sediment on the lake bottomdecreased the storage capacity of the reservoir, but theidea of dredging this sediment was abandoned becausethat would re-expose karst features under the lake(Land, 2021). Storage capacity of the original reservoirwas reduced to less than 50% by the 1940s. A new dam,Brantley Dam, was constructed in 1987 about 6 kmdownstream from McMillan Dam, which was thenbreached to allow its water to "ow into Brantley Lake.Based on recommendations by Cox (1967), Brantley
18 ,FOOFUI�4��+PIOTPO

Dam and its reservoir are located mostly over the less-soluble dolomitic part of the Seven Rivers Formation.
Wellington Formation in Kansas. In Kansas, Kul-stad and others (1956) describe widespread subsidenceand surface slump structures in the outcrop area of theWellington Formation, which, they say, “shows thatsome material, probably gypsum, has been removedby subsurface solution.” Although gypsum outcropsare rare in theWellington Formation, 30 to 45m of anhy-drite interbeds are present in the subsurface just west ofthe outcrops, showing that theWellington should containgypsum at and just below the surface in its outcrop area.This is supported by locally abundant gypsum outcropsin Saline and Dickenson Counties (Kulstad and others,1956, plate 3), and the assumption that gypsum is proba-bly also present just below the surface elsewhere in theWellington Formation outcrop area. Young and Beard(1993) brie"y state that the only caves known to themin the Wellington Formation are “one cave in DickinsonCounty and a now-!lled cave in Sedgwick County:” noother data are given.
Gypsum caves in southwest Kansas. In an over-view of gypsum caves in the Blaine Formation ofComanche and Barber Counties, southwest Kansas,Young and Beard (1993) reported that there are morethan 235 known caves in Comanche County, and morethan 205 inBarber County: these caves range from small,6-m-deep shelter caves to an 860-m-long cave system.Typical gypsum caves in Kansas are only 30 to 90 mlong, and have two or more entrances, including oneor more sinkhole entrances: although most of the pas-sages are crawlways, some passages have rooms 12 mhigh. Young and Beard (1993) describe the D.E.S.Cave, which is 611m long, and provide general informa-tion on the breakdown of caves, slumping of caves, andnatural bridges in the area. Subsequent studies of gyp-sum karst in the Blaine Formation in Barber Countyhave been carried out by Gauvey and Sumrall (2021)andKelner and others (2021). Their studies describe typ-ical gypsum-karst features, such as caves, sinkholes,springs, and losing streams. They are looking at pro-cesses that lead to local karst development, and theirstudies are the !rst stage of a karst study intending todevelop predictive karst models that will help land-owners reduce the risk of collapses that can cause struc-tural damage and/or aquifer contamination.
HUMAN-INDUCED EVAPORITEKARST IN THE GPEB
Evaporite karst can result from human activities. Im-pounding water in contact with, or above, an evaporitedeposit can cause unsaturated water to come in contact
with�salt�or�gypsum,�resulting� in�some�dissolution�and�possible�settlement�or�collapse.�Generally�of�greater�con-cern�is�the�drilling�of�boreholes�into�or�through�subsur-face�salt�deposits:� this�may�allow�unsaturated�water� to�"ow� through� or� against� a� salt� deposit,� and� allow� the�development� of� small� or� large� dissolution� cavities.�Although� a� water-!lled� cavity�may� be� formed� either�intentionally�(solution�mining�or�development�of�a�stor-age� cavity� in� salt)� or� unintentionally� (fugitive� water�escaping� from� a� borehole� and� dissolving� the� salt),� if�the�cavity�is�large�enough�and�shallow�enough�it�is�pos-sible� that�successive�roof�failures�above� the�cavity�can�cause�land�subsidence�or�catastrophic�collapse.
Human-Induced�Salt�Karst
Human�activities� that�are�most� likely� to� induce�karst�in�salt�deposits�are��(1)�solution�mining�of�salt�that�inten-tionally�creates�cavities�in�the�salt;�or�(2)�petroleum�or�other� activities� that� involve� drilling� boreholes� into� or�through�subsurface�salt�deposits,�and�then�inadvertently�allowing�unsaturated�water� to� enter� the�borehole,�dis-solve�the�salt,�and�create�a�water-!lled�cavity.�In�either�case,� if�uncontrolled�dissolution�of� the�salt�occurs,� the�cavity�may� increase� in�width� to� the� point�where� the�roof�can�no� longer�be�supported.�Collapse�of� the�roof,�followed� by� a� series� of� successive� roof� failures,� can�then� cause� the�water-!lled� cavity� to�migrate� upward.�If� the� original� cavity� is� large� enough� and� shallow�enough,� the� successive� roof� failures� can� reach� the�land� surface,� resulting� either� in� land� subsidence�or� in�sudden,�catastrophic�collapse� (a� sinkhole).� In�general,�most� sinkholes� resulting� from� salt� dissolution� are�about� 50� to� 100�m� in� diameter�when� they�!rst� form,�but� some� can� enlarge� considerably� as� time� passes.�Reports�describing�general�subsidence�and/or�collapse�of� salt� cavities� caused� by� human� activities� are� given�by�Walters� (1978),� Ege� (1979),� Dunrud� and� Nevins�(1981),�Coates�and�others� (1985),� Johnson�and�others�(2003),�Johnson� (2005a,�b),�and�Cooper� (2020a).�The�location�of�human-induced�salt�karst�in�the�GPEB�dis-cussed�in�this�report�is�shown�in�Figure�6B.
It� is�also�possible� for�sinkholes�and�subsidence� fea-tures� to� form� above� dry� (room-and-pillar)� salt�mines,�if�a�large�amount�of�water�enters�the�mine�and�dissolves�the� salt:� three� examples� are� the� Jefferson� and�Weeks�Island� salt� dome�mines� in� Louisiana,� and� the� Retsof�salt� mine� in� New� York� (Martinez� and� others,� 1998;�Johnson,�2005a,�b).�However,�the�only�three�room-and-pillar�operations�in�salt�or�potash�in�the�GPEB�have�had�no�such�problems:�two�of�them,�salt�mining�at�Hutchinson,�Kansas,�and�potash�mining�near�Carlsbad,�New�Mexico,�are�only�mentioned�here,�but�excavation�of�salt�for�storage�of� transuranic� radioactive�waste�at� the�WIPP,�also�near�Carlsbad,�is�described�elsewhere�in�this�paper.
Overview of Evaporite Karst in the Greater Permian Evaporite Basin (GPEB) 19

Impacts from Solution Mining
Solution�mining� involves� dissolving� and� extracting�soluble�minerals,�such�as�salt�or�potash,�or�creating�an�underground�cavity�in�salt�for�storage�of�liquids�or�gases,�such�as�oil,�propane,�or�natural�gas.�Solution�mining�in-volves� the�following:�(1)�drilling�a�borehole� into�a�salt�formation;�(2)�introducing�unsaturated�water�into�the�sol-uble�rock�in�the�subsurface;�(3)�dissolving�the�minerals�and� forming� a� brine;� (4)� recovering� the� brine;� and�(5)�either�extracting� the�mineral�from� the�brine�(salt�or�potash�production),�or� storing�another� liquid�or�gas� in�the�water-!lled�cavity.�Solution�mining� therefore� typi-cally� entails� creation� of� one� or� several� large,� under-ground,� brine-!lled� cavities� (Marsden� and� Lucas,�1973).�When�used�for�the�underground�storage�of�liquids�and�gases,�the�liquids�and�gases�are�injected�into�the�stor-age�cavity�to�displace�the�brine,�and�they�can�be�recov-ered�later�by�reinjecting�the�brine.
Solution-mining�cavities�created�in�bedded�salts�typi-cally�are�10�to�100�m�in�diameter,�and�their�height�is�usu-ally�controlled�by�the�thickness�of�the�salt.�Cavities�may�become� larger� or� shallower� than� planned� as� a� result�of�� (1)� uncontrolled� dissolution;� (2)� unanticipated�geologic� conditions;� or� (3)� engineering/construction�problems.�This� has� resulted� in� subsidence� of� the� land�surface,� or�even� of� collapse� structures� (sinkholes)� at� a�number� of� solution� mines.� Dunrud� and� Nevins�(1981)� reported� ten� areas� of� solution� mining� and�collapse� existed� at� that� time�within� the�United� States�alone,� and� additional� sites�are�known�from�many�other�parts�of�the�world.�Most�of� the� unanticipated� solution-mining� collapses� result� from� cavities� formed� 60� to�more� than�100�yr�ago,�before�modern-day� engineering�safeguards� were� developed:�proper,�modern�design�has�virtually�eliminated�this�problem�in�new�facilities.
Cargill�Sink.� The�Cargill�Sink,�located�in�the�south-east�part�of� the� town�of�Hutchinson,� in�Reno�County,�Kansas,�is�one�example�of�solution�mining�and�resultant�sinkhole� development� in� the� GPEB� (Walters,� 1978;�Dyni,�1986;�Johnson,�2005a,�b) (Figures�6B,�17).�The�collapse�occurred� in�1974,�on� the�property�of�Cargill,�Inc.,�and� the�crater�stabilized�with�a�diameter�of�about�90�m�and�a�maximum�depth�of�about�15�m.�The�volume�of�the�crater�was�calculated�to�be�about�70,000�m3.�Salt�has�been�solution-mined�on�these�properties�since�1888�(Walters,� 1978).� The� Hutchinson� Salt� here� is� about�105�m�thick�and�occurs�at�a�depth�of�about�130�m�below�the�ground�surface�(Figure�17).�Locations�of�many�of�the�earlier�brine�wells�are�not�known,�and�early�day�dissolu-tion� methods� were� often� uncontrolled;� therefore,� the�location�and�extent�of�many�of�the�solution�cavities�on�this�property�are�not�well�known.�The� sink�developed�within�an�active�brine�!eld�that�included�both�operating�and�abandoned�wells.�Embraced�within�the�sinkhole�was
a brine well that was drilled in 1908 and was !nallyplugged and abandoned in 1929.
Post-subsidence drilling at the Cargill Sink showedthat a northeast-trending cavern had developed in theHutchinson Salt beneath the sink (Walters, 1978). Elon-gation of the cavern parallels a line of brine-producingwells that were hydraulically connected. The span ofthe cavern roof is more than 400m in its long dimension,and less than 90 m in its short dimension. The roof spanapparently exceeded the capacity of overlying shales tosupport the overburden. Failure of the roof caused thecollapse of successive overlying rock units until theuppermost rock layer !nally collapsed into the water-!lled void. At this point, water-saturated Quaternarysands dropped into the cavity, creating the surface sink(Figure 17). The sand "owed down and now !lls a sub-surface chimney that is about 30 m in diameter andlocated below the center of the sinkhole.
The report byDyni (1986) also describes several othersinkholes that formed around brine !eld wells drilledinto the Hutchinson Salt in the Hutchinson area. Theseinclude one sink that formed in 1952, and two sinksthat formed in 1978. The 1952 sink (referred to as theBarton Sinkhole), located about 350 mNNWof the Car-gill Sink, was about 75 m in diameter and 10 m deep;the sink was adjacent to the salt plant and was !lledin. The top of the Hutchinson Salt at this site is 129 mbelow the surface in borehole V-5, drilled just outsidethe dissolution cavity. The two sinks formed in 1978(referred to as the Carey Sinkholes) are about 2.25 kmENE of the Cargill Sink, in the east part of Hutchinson:these sinks are water !lled, and are about 45 and 60 macross (based on Google Earth photography, June 2019).
Denver City Sink. In 2009, a sinkhole opened upabout 2 km ENE of Denver City, in Yoakum County,Texas (Figure 6B): the sink is about 65 m wide and15 m deep. Scant data are published on this sink (Land,2013), but correspondence by the New Mexico OilConservation Division (no date) provides the followinginformation. In 1984, Salty Brine Inc. acquired, fromVul-can Chemicals, a brine-producing well (Well no. 3) thatbegan production in 1974. Brine was produced in thewell by dissolving the Salado salt, which here is about640 to 853mbelow the surface: the cavernwas developedat a depth of about 655m. In 1997,Well no. 3 suffered thecollapse of its casing at a depth of about 213 m: the wellwas then “plugged up to 300’ [91.4 m] subsurface at thattime,” and then in the year 2000 it was “plugged from adepth of 295’ [89.9 m] to surface with all three casingstrings remaining in the ground.” When the sink formedin 2009, the casing ofWell no. 3was clearly visible, nearlyat the center of the sinkhole, making it most likely that theroof of the deep-seated cavern atWell no. 3 collapsed, ulti-mately leading to the formation of the surface sinkhole.
20 ,FOOFUI�4��+PIOTPO

A response by the Railroad Commission of Texas(RRC), appended to the New Mexico Oil ConservationDivision (no date) data, stated: “Although [RRC] staffdo not dispute that the operation of Well no. 3 ultimatelyled to the development of the sinkhole, unfortunately—the information necessary to diagnose exactly what thoseoperations were, and how they ultimately led to sinkholedevelopment, does not exist because those operationsoccurred so long ago.” RRC staff believed it was mostplausible that the cavern that developed during Vulcan’soperationwasmuch larger than typical Salado salt cavernsin Texas. However, de!nitive data are lacking, because allof Vulcan’s operations occurred prior to RRC assumingprimacy over Class III brine mining in Texas.
Borger Sinks. Phillips Petroleum drilled !ve brine-producing wells from 1959 to 1961 near the town ofBorger, in Hutchinson County, Texas (Figure 6B);they were drilled into the Flowerpot salt at a depth of
about 200 m, and then interconnected by hydraulic frac-turing to create a single cavity (Johnson and others,2003). Brine was produced from the wells until 1964when surface subsidence near the brine wells indicatedthat the cavern was unstable. At that time, when produc-tion ceased, the brine-!lled cavern was about 380m longand about 120 m wide. The !rst sinkhole, with a diame-ter of about 45 m, developed above the cavern in 1969;the second sinkhole, with a diameter of about 60 m,formed over the cavern in 1978. The !rst sinkhole con-tained about 20 million liters of brine, with a chloridecontent of 26,000 to 31,000 mg/L, whereas the secondsinkhole was !lled and leveled (Johnson and others,2003).
A second cavern, developed by Phillips in the Flow-erpot salt about 150 to 200 m from the collapsed cavern,was operated from 1964 to 1966. This second cavern,which had a roof span of about one-half of the !rst cav-erns and about one-third the volume, had no history of
Figure�17.�Cargill�Sink,�developed� in�Hutchinson�Salt�at�Hutchinson,�Kansas.�On�left�is�cross�section�through�sink(modi!ed� from�Walters,�1978);�cavity� shape� is�hypothetical,�and� investigative�boreholes�were�drilled�after� thesink�was� formed.�On� right� is� an� air� photo� of� the� sink,� formed� in� 1974� as� a� result� of� solution�mining� of� salt(photograph� courtesy� of� Deming� Studio):� formation� of� this� 90-m�diameter� sinkhole� left� the�Missouri� Paci!c�Railroad�tracks�suspended�6�m�in�the�air.
Overview of Evaporite Karst in the Greater Permian Evaporite Basin (GPEB) 21
surface� subsidence� of� collapse.� In� comparing� the� two�caverns� (same� depth,� same� salt� unit),� it� is� likely� that�the�large�volume,�excessive�roof�span,�and�shallow�depth�all�contributed�to�the�collapse�of�the�!rst�cavern�and�for-mation�of�the�Borger�Sinks�(Johnson�and�others,�2003).
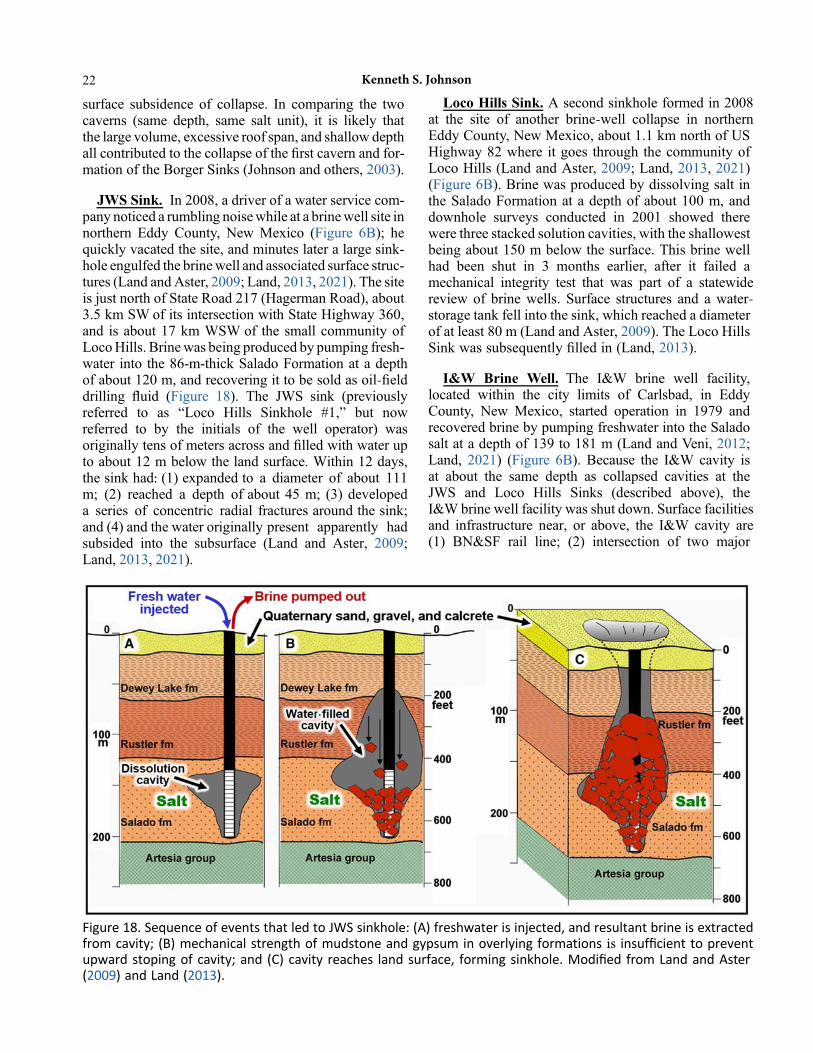
JWS�Sink.� In�2008,�a�driver�of�a�water�service�com-pany�noticed�a�rumbling�noise�while�at�a�brine�well�site�in�northern� Eddy�County,�New�Mexico� (Figure� 6B);� he�quickly�vacated�the�site,�and�minutes�later�a�large�sink-hole�engulfed�the�brine�well�and�associated�surface�struc-tures�(Land�and�Aster,�2009;�Land,�2013,�2021).�The�site�is�just�north�of�State�Road�217�(Hagerman�Road),�about�3.5�km�SW�of�its�intersection�with�State�Highway�360,�and� is�about�17�km�WSW�of� the� small�community�of�Loco�Hills.�Brine�was�being�produced�by�pumping�fresh-water� into� the�86-m-thick�Salado�Formation�at�a�depth�of�about�120�m,�and�recovering�it�to�be�sold�as�oil�!eld�drilling� "uid� (Figure� 18).� The� JWS� sink� (previously�referred� to� as� “Loco� Hills� Sinkhole� #1,”� but� now�referred� to� by� the� initials� of� the� well� operator)� was�originally�tens�of�meters�across�and�!lled�with�water�up�to�about�12�m�below� the�land�surface.�Within�12�days,�the�sink�had��(1)�expanded�to� a� diameter� of� about� 111�m;� (2)� reached� a� depth� of�about�45�m;� (3)�developed�a� series� of� concentric� radial� fractures�around�the�sink;�and�(4)�and�the�water�originally�present� apparently� had�subsided� into� the� subsurface� (Land� and� Aster,� 2009;�Land,�2013,�2021).
Loco�Hills�Sink.�A�second�sinkhole�formed� in�2008�at� the� site� of� another� brine�well� collapse� in� northern�Eddy�County,�New�Mexico,�about�1.1�km�north�of�US�Highway�82�where� it�goes� through� the�community�of�Loco�Hills� (Land�and�Aster,�2009;�Land,�2013,�2021)(Figure�6B).�Brine�was�produced�by�dissolving�salt� in�the�Salado�Formation�at�a�depth�of� about�100�m,�and�downhole� surveys� conducted� in� 2001� showed� there�were�three�stacked�solution�cavities,�with�the�shallowest�being�about�150�m�below� the�surface.�This�brine�well�had� been� shut� in� 3� months� earlier,� after� it� failed� a�mechanical� integrity� test� that�was� part� of� a� statewide�review� of� brine�wells.�Surface� structures� and� a�water��storage�tank�fell�into�the�sink,�which�reached�a�diameter�of�at�least�80�m�(Land�and�Aster,�2009).�The�Loco�Hills�Sink�was�subsequently�!lled�in�(Land,�2013).
I&W� Brine� Well.� The� I&W� brine� well� facility,�located� within� the� city� limits� of� Carlsbad,� in� Eddy�County,� New�Mexico,� started� operation� in� 1979� and�recovered�brine�by�pumping�freshwater�into�the�Salado�salt�at�a�depth�of�139� to�181�m�(Land�and�Veni,�2012;�Land,� 2021) (Figure� 6B).�Because� the� I&W� cavity� is�at� about� the� same� depth� as� collapsed� cavities� at� the�JWS� and� Loco� Hills� Sinks� (described� above),� the�I&W�brine�well�facility�was�shut�down.�Surface�facilities�and� infrastructure� near,� or� above,� the� I&W� cavity� are�(1) BN&SF� rail� line;� (2)� intersection� of� two� major
Figure�18.�Sequence�of�events�that�led�to�JWS�sinkhole:�(A)�freshwater�is�injected,�and�resultant�brine�is�extracted�from�cavity;�(B)�mechanical�strength�of�mudstone�and�gypsum� in�overlying�formations� JT� insuf!cient�to�prevent�upward�stoping�of�cavity;�and� (C)�cavity�reaches� land�surface,� forming�sinkhole.�Modi!ed� from�Land�and�Aster�(2009)�and�Land�(2013).
22 ,FOOFUI�4��+PIOTPO

highways,�known� as� the� “South�Y;”� (3)�The�Carlsbad�Irrigation� District� South� Canal;� and� 4)� several� busi-nesses,� such� as� a� feed� store,� a� truck� stop,� a� mobile�home�park,�and�a�church.�A�sinkhole�developed�at�this�site�would�cause�great�damage� to�private�property�and�infrastructure,�and�possibly�cause�fatalities.�Geotechni-cal� studies� of� the� site� indicate� that� “upward� stoping�and�roof�fall�are�occurring�at�a�rate�of�about�30�cm�per�year,� and � in� the� absence� of� any� remediation,�failure� will� occur� in� 10� to� 25� years”� (Land,� 2021).�Remediation� at� this� site� consists� of� 26� wells� drilled�around� the�perimeter�of�the�cavity�in�2018�for�injection�of� sand� and� grout,� and� this� remediation� process� is�projected�to�be�completed�by�Fall,�2020�(Land,�2021).
Impacts�from�Petroleum�and�Water�Supply�ActivitiesPetroleum-industry�activities�that�may�lead�to�adverse�
impacts�from�salt�karst� include� the�drilling�of�explora-tion,�production,�or�salt�water�disposal�(SWD)�boreholes�into,� or� through,� subsurface� salt� units� (Johnson� and�others,�2003;�Johnson,�2005a,�b).�Unintentional�dissolu-tion�of�the�salt�can�create�a�cavity�that�is�as�large�and�shal-low�as�those�created�by�solution-mining�activities.�And�if�the� cavity� becomes� too� large� for� the� roof� to� be� self-supporting,�successive�roof�failures�may�cause�the�col-lapse� to�migrate� upward� and� perhaps� reach� the� land�surface.�Most� collapses� related� to� petroleum� activity�involve�boreholes�drilled�long�ago,�before�the�develop-ment�of�proper�engineering�safeguards�pertaining�to�dril-ling�mud�design�(use�of�salt-based�drilling�"uids),�casing�placement�(sealing�salt�beds�from�circulating�"uids),�and�salt-tolerant� cements� (to� prevent� the� breakdown� of�cement�in�the�borehole).�Wells�drilled�through�salt�depos-its�in�search�of�freshwater�that�is�beneath�the�salt�can�also�produce�unintentional�collapse�features.
With�the�increase�in�rotary�drilling�during�the�1920s,�1930s,�and�1940s,�boreholes�drilled�by�petroleum�com-panies�typically�used�water-based�drilling�muds�that�cir-culated�against�the�walls�of�the�holes.�In�most�areas,�these�muds� were� probably� unsaturated� with� respect� to� salt�(NaCl).� Under� these� conditions,� it� was� common� for�salt�units� in�a�borehole� to�be�at� least�slightly�enlarged,�or�perhaps�even�greatly�enlarged.�In�areas�underlain�by�shallow�salt�deposits,�companies�now�use�a�drilling�"uid�that� is�saturated�with� respect� to�salt,�and� that�also�pro-vides� desirable� drilling-mud� characteristics.� And� to�ensure�that�salt�units�encountered�in�a�borehole�are�prop-erly�sealed�off,�longer�strings�of�surface�casing�and�inter-mediate� protective� casing� are� commonly� used� (with�improved� cements),� and� the� annulus� (the� interval�between� the� casing� and� surrounding� rock)� typically� is�!lled�with�cement�all�the�way�to�the�surface�upon�com-pletion�of�the�drilling.
Sources�of�unsaturated�waters�that�can�reach�salt�units�in�poorly�cemented�or�poorly�cased�old�wells,�or�in�wells
with�corroded�tubing�or�casing,�include��(1)�fresh�ground-water� that�can�seep�down� from�shallower�aquifers;� (2)�unsaturated� formation� brine� that� enters� the� borehole�from� above� or� below� the� salt;� (3)� unsaturated� brine�that�is�coproduced�with�the�oil�and/or�gas;�and�(4)�unsat-urated�brine�pumped�down�an�injection�well,�either�for�brine� disposal� or� for� enhancing� petroleum� production�(secondary� recovery).�With� all� the� early� drilling� and�petroleum� production� throughout� the�GPEB� region,� it�is� not� surprising� that� there� are� places� where� salt� has�been� dissolved� inadvertently� BOE� IBT� createE� solution�cavities�that� collapsed—and� there� is� a� possibility� that�similar�sinks�may�develop�in�the�future.
Wink�Sinks.� Several�large�sinkholes�and�subsidence�features�formed�in�the�Hendrick�oil�!eld�near�the�town�of�Wink,�in�Winkler�County,�Texas�(Figures�6B,�8,�19).�The�!rst� sinkhole�was�described� in�detail�by�Baumgardner�and�others�(1982)�and�Johnson�(1986,�1989a).�Descrip-tions�of�the�!rst�and�second�sinkhole,�and�nearby�subsi-dence�features,�were�then�made�by�Johnson�and�others�(2003)�and�Johnson�(2005a,�b).�Later�work�involving�In-SAR,�LIDAR,� gravimetry,� and/or�GPS�monitoring� of�ongoing� deformation� of� subsidence� features� at�Wink�has�been�carried�out�by�Paine�and�others�(2009,�2021),�Kim�and�Lu�(2018,�2021),�Kim�and�others�(2019),�Shi�and�others�(2019),�and�Trentham�and�Henderson�(2021).
The�Hendrick�oil�!eld,�which�embraces�the�collapse�and�subsidence�features�near�Wink,� is�one�of� the�giant�oil�!elds�of�Texas,�with�more� than�1400�wells�drilled�since� the�discovery�of� the�!eld� in�1926.�Wink�Sink�#1�formed� about� 3� km� NNE� of� the� town� of� Wink� in�1980:� within� 2� days,� the� sinkhole� was� about� 110�m�wide�and�33�m�deep,�and� its�volume�was�estimated�at�about� 160,000� m3� (Johnson� and� others,� 2003).� One�abandoned� oil�well� (the�Hendrick�well� 10–A),� drilled�in� 1928,�was� incorporated�within� the� sink� itself.� The�sink�resulted�from�an�underground�cavity�in�the�Salado�salt�migrating�upward�by�successive�roof�failures,� thus�producing� a� collapsed� chimney� !lled�with� brecciated�rock� (Baumgardner� and� others,� 1982;� Johnson,� 1986,�1989a,�2005a,�b;�Johnson�and�others,�2003) (Figure�20).�Eventually,�the�collapsed�chimney�reached�the�land�sur-face�and�created�Wink�Sink�#1�(Figure�21A).�In�this�area,�the�Salado�salt�is�about�260�m�thick�and�is�about�400�to�660�m�beneath�Wink�Sink�#1.
Dissolution�and�collapse�associated�with�Wink�Sink�#1�apparently�resulted�from,�or�at�least�was�accelerated�by,� the�Hendrick� 10–A�well,�which�may� have� been� a�pathway�for�unsaturated�water� to�come�in�contact�with�the�Salado�salt�(Johnson,�1986,�1989a,�2005a,�b;�Johnson�and�others,�2003).�Reasons�for�assuming�this�are�(1)�the�well�was�probably�drilled�with�freshwater�drilling�"uid�that� enlarged� the� borehole� in� the� salt� sequence;� (2)�because� of� probable� borehole� enlargement� during
Overview of Evaporite Karst in the Greater Permian Evaporite Basin (GPEB) 23
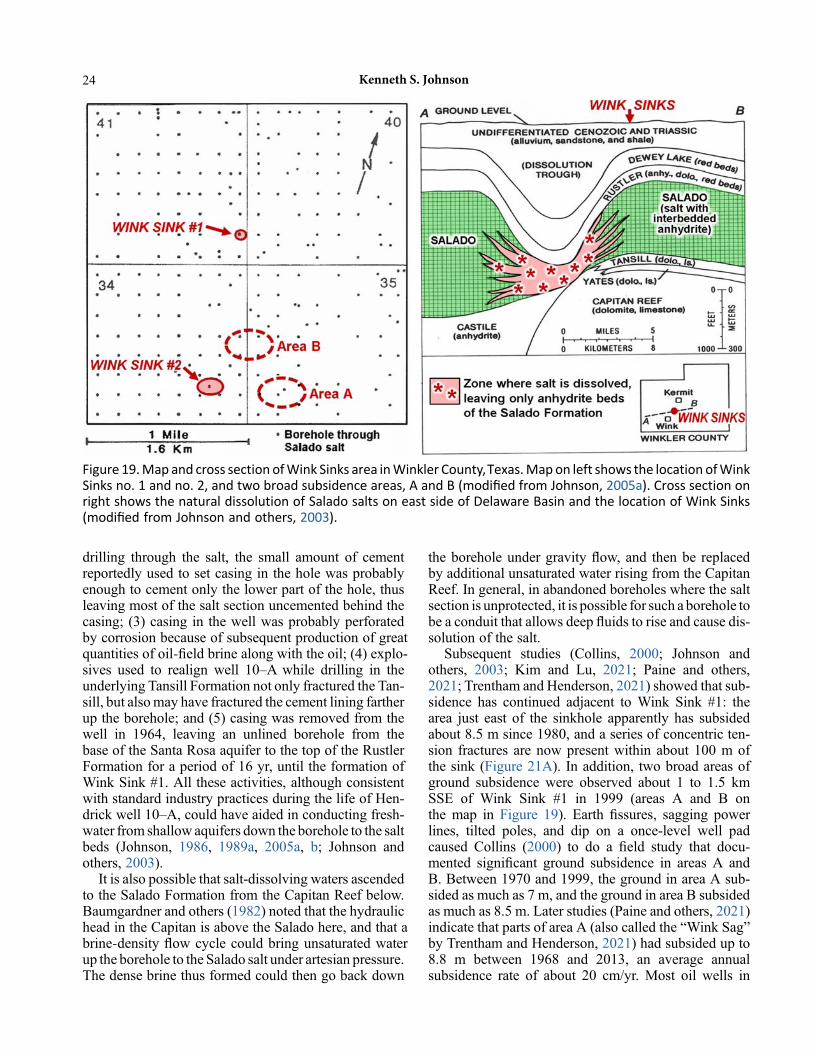
drilling� through� the� salt,� the� small� amount� of� cement�reportedly�used� to�set�casing� in� the�hole�was�probably�enough�to�cement�only�the�lower�part�of�the�hole,�thus�leaving�most�of�the�salt�section�uncemented�behind�the�casing;� (3)�casing� in� the�well�was�probably�perforated�by�corrosion�because�of�subsequent�production�of�great�quantities�of�oil�!eld�brine�along�with�the�oil;�(4)�explo-sives� used� to� realign�well� 10–A�while� drilling� in� the�underlying�Tansill�Formation�not�only�fractured�the�Tan-sill,�but�also�may�have�fractured�the�cement�lining�farther�up� the�borehole;�and�(5)�casing�was�removed�from� the�well� in� 1964,� leaving� an� unlined� borehole� from� the�base�of�the�Santa�Rosa�aquifer�to�the�top�of�the�Rustler�Formation�for�a�period�of�16�yr,�until� the�formation�of�Wink�Sink�#1.�All� these�activities,�although�consistent�with�standard�industry�practices�during�the�life�of�Hen-drick�well�10–A,�could�have�aided�in�conducting�fresh-water�from�shallow�aquifers�down�the�borehole�to�the�salt�beds� (Johnson,� 1986,� 1989a,� 2005a,� b;� Johnson� and�others,�2003).
It�is�also�possible�that�salt-dissolving�waters�ascended�to� the�Salado�Formation�from� the�Capitan�Reef�below.�Baumgardner�and�others�(1982)�noted�that�the�hydraulic�head�in�the�Capitan�is�above�the�Salado�here,�and�that�a�brine�density�"ow�cycle�could�bring�unsaturated�water�up�the�borehole�to�the�Salado�salt�under�artesian�pressure.�The�dense�brine�thus�formed�could�then�go�back�down
the borehole under gravity "ow, and then be replacedby additional unsaturated water rising from the CapitanReef. In general, in abandoned boreholes where the saltsection is unprotected, it is possible for such a borehole tobe a conduit that allows deep "uids to rise and cause dis-solution of the salt.
Subsequent studies (Collins, 2000; Johnson andothers, 2003; Kim and Lu, 2021; Paine and others,2021; Trentham and Henderson, 2021) showed that sub-sidence has continued adjacent to Wink Sink #1: thearea just east of the sinkhole apparently has subsidedabout 8.5 m since 1980, and a series of concentric ten-sion fractures are now present within about 100 m ofthe sink (Figure 21A). In addition, two broad areas ofground subsidence were observed about 1 to 1.5 kmSSE of Wink Sink #1 in 1999 (areas A and B onthe map in Figure 19). Earth !ssures, sagging powerlines, tilted poles, and dip on a once-level well padcaused Collins (2000) to do a !eld study that docu-mented signi!cant ground subsidence in areas A andB. Between 1970 and 1999, the ground in area A sub-sided as much as 7 m, and the ground in area B subsidedas much as 8.5 m. Later studies (Paine and others, 2021)indicate that parts of area A (also called the “Wink Sag”by Trentham and Henderson, 2021) had subsided up to8.8 m between 1968 and 2013, an average annualsubsidence rate of about 20 cm/yr. Most oil wells in
Figure 19.Map and cross section ofWink Sinks area inWinkler County,Texas.Map on left shows the location ofWinkSinks no. 1 and no. 2, and two broad subsidence areas, A and B (modi!ed from Johnson, 2005a). Cross section onright shows the natural dissolution of Salado salts on east side of Delaware Basin and the location of Wink Sinks(modi!ed from Johnson and others, 2003).
24 ,FOOFUI�4��+PIOTPO

areas A and B were drilled in the late 1920s, and drillingand completion methods were probably similar to thoseused in drilling Hendrick well 10–A. It is likely that sub-sidence in areas A and B results from subsurface disso-lution of the Salado salt, and may be partly related topetroleum activity (Collins, 2000; Johnson and others,2003). If deep-seated cavities do exist under areas A
and/or B, it (or they) has (have) not yet breached the sur-face as sinkholes.
Wink Sink #2 formed in 2002 at a site 1.5 km south ofWink Sink #1 and about 400 m nsouth and west of areasA and B (Johnson and others, 2003) (Figure 19, map;Figure 21B). By the end of the !rst day, Wink Sink #2was about 140 m long and 100 m wide and water level
Figure 20. Schematic cross section through the Hendrick well 10–A, showing possible relationship of this oil well tothe development ofWink Sink no. 1. (A) Geologic setting. (B) Freshwater may have circulated down the borehole todissolve the salt and create a cavity. (C) By successive roof failures, the cavity migrated upward toward the landsurface. (D) Collapse reaches the land surface and creates Wink Sink no. 1. Modi!ed from Johnson (1989a).
Figure 21. Aerial views of Wink Sinks just northeast of Wink in Winkler County, Texas. (A) Wink Sink no. 1: diameternow about 115 m across, and note concentric tension fractures extending about 100 m out from the sink. (B) WinkSink no. 2: initially about 140 m wide, but, as seen here, this sink is now about 250 m wide and the walls are about30 m high (photo B, courtesy of Ryan Short, RedWingAerials.com).
Overview of Evaporite Karst in the Greater Permian Evaporite Basin (GPEB) 25
in�the�sink�was�about�30�m�below�land�surface.�The�sink�grew�larger�by�undercutting�its�vertical�walls�and�slough-ing�unconsolidated�material� into� the�water-!lled� hole.�The� volume� of� the� sinkhole�was� estimated� earlier� at�1.33�million�m3�(Johnson�and�others,�2003),�and�its�cur-rent�width�is�estimated�to�be�about�250�m�(Figure�21B).�Wink� Sink� #2� embraced� a� former� water�supply� well�(Gulf�WS–8)� that�was�drilled� in�1960� into� the�Capitan�Reef,�at�a� total�depth�of�1092�m� (Johnson�and�others,�2003):� the� top� and�base�of� the�Salado� salt�here� are� at�depths�of�412�and�686�m,�respectively,�so�the�formation�is�274�m�thick.�It�is�possible�that�the�Gulf�WS–8�well�may�have�been�a�pathway�for�unsaturated�water� to�come� in�contact�with� Salado� salts,� and� that� created� a� solution�cavity� that�migrated� upward� and� caused� the� collapse�of�the�land�surface�as�Wink�Sink�#2�(Johnson�and�others,�2003).
McCamey� Sink.� The� McCamey� Sink� formed� in�1977�about�15�km�east�of�McCamey,�in�Upton�County,�Texas,�at�the�site�of�a�SWD�well:�the�RR�Kennedy�Pro-duction�Well�No.�17,�in�the�Rodman–Noel�!eld�(Johnson�and�others,�2003) (Figure�6B).�The�well�was�permitted�in�1967� to� inject�salt�water�co-produced�with�oil� into� the�Permian�Grayburg�Formation� at� a�depth�of� about�550�to�610�m.�At� this�site,�about�189�m�of�Salado�salt�was�penetrated�at�a�depth�interval�of�259�to�448�m.�It�is�likely�that�injected�(unsaturated)�salt�water�was�not�con!ned�to�the�Grayburg�Formation,�and�that�some�of�the�brine�came�in�contact�with,�and�dissolved,�some�of�the�Salado�salt.�Uncontrolled� dissolution� of� salt� in� the� borehole�may�have� led� to� the� formation� of� a� large� cavity,� and,�with�the� failure�of� its� roof,� the� cavity� could�have�migrated�upward�and�eventually�reached� the�surface� to�form�the�sinkhole�(Johnson�and�others,�2003).�Initially,�the�sink-hole�was�about�21�m�across�and�21�m�deep,�and�later�re-ports�indicate�the�sinkhole�enlarged�to�about�90�m�across,�and�up�to�30�m�deep�(Johnson�and�others,�2003).
Pecos� County� Subsidence.� Several� sites� in� Pecos�County,� Texas,� have� experienced� subsidence� of� the�land� surface� that�probably� is� related� to� the� subsurface�dissolution� of� the� Salado� salt� (Kim� and� Lu,� 2018)(Figure� 6B).�The� sites� include� (1)� three� separate� sites�that� are� 7–11� km� southwest� of� the� town� of� Imperial�and�(2)�Santa�Rosa�Spring,�located�about�13�km�south-west�of�Grandforth,�or�about�25�km�west�of� Imperial.�At�all�four�of�these�sites,�the�land�surface�has�subsided�at� rates� of� 0.7–8.9� cm/yr,� based� on� InSAR� data� from�late�2014�to�April�2017,�but�there�has�been�no�collapse�or� sinkhole� formation.�The� three� subsidence� sites� just�southwest�of�Imperial�embrace,�or�are�near,�abandoned�or� active� petroleum� boreholes,� and� are� underlain� by�the�Salado�salt�at�depths�of�300�to�500�m.�The�maximum�rate�of�land�subsidence�at�these�sites,�including�Boehmer
Lake (which did not exist prior to 2003), is from 1.5 to3.9 cm/yr (Kim and Lu, 2018). Kim and Lu (2018,p. 6–7) state: “Through unplugged abandoned wells,corroded pipes, or cracks in the casing, freshwater "owsdown and/or artesian water rises to the Salado Forma-tion, accelerating the dissolution of the evaporite, creat-ing voids in the beds, and causing rapid subsidence onthe surface.”
Although there has been drilling of oil wells in thevicinity of Santa Rosa Spring, it is believed that herethe Salado salt, at a depth of 300 to 450 m, is probablybeing dissolved naturally by groundwater (Kim and Lu,2018). The subsiding area is about 1.4 by 1.0 km, and themaximum subsidence shown by InSAR data are about8.9 cm/yr. Studies in Pecos County show that the highestsalinity of groundwater in the region is at Santa RosaSpring (7224 mg/L), and that the salinity of water inSanta Rosa Spring increased by 4894 mg/L from the1940s to 1987 (Kim and Lu, 2018).
Jal Sink. In 1998, a sinkhole formed at a site about15 kmNNWof Jal, in southern Lea County, NewMexico(Powers, 2003; Johnson and others, 2003) (Figure 6B).The Jal Sink (also known as the Whitten Ranch Sink-hole) formed close to the Skelly No. 2 Jal Water Systemwell (Jal WS-2) that was drilled into the Capitan Reef in1967 to provide a source of freshwater. The well wasdrilled to a depth of 1372 m, was cased from the surfaceto a depth of 1186 m, and the hole was left open (no cas-ing) from 1186 m to total depth. Salt was encountered inboth the Rustler and Salado Formations in the well, andPowers (2003) estimates the uppermost Rustler salt wasat a depth of about 518 m, and the Salado salt was pene-trated from 610 to 1006 m deep.
In 1979, casing in the well collapsed at 501m, and thewell was plugged and abandoned. After plugging por-tions of the well, Powers (2003) estimated that about91 m of the upper Salado salt and all of the Rustler saltsremained open (unplugged) behind the casing. The vari-ous plugs may have done nothing to prevent freshwaterin the Capitan aquifer from circulating up through theproduction casing and collapsed casing into the Rustlersalt, and possibly the Salado salt. Jal Sink eventuallyreached about 50 m in diameter, about 18 m deep, andhas been dry (no water in the surface depression); theedge of the sinkhole is about 20 m from Jal WS-2.Although a natural origin cannot be ruled out for thedevelopment of the Jal Sink, it is likely that the nearbyJal WS-2 well allowed freshwater to circulate into thesalt beds, and the collapsing chimney worked its wayup to the land surface (Powers, 2003).
Panning Sink. Panning Sink formed in 1959 by sub-sidence and collapse around a SWDwell on the Panninglease in Barton County, Kansas (Fader, 1975; Walters,
26 ,FOOFUI�4��+PIOTPO

1978;�Anderson�and�others,�1995a;�Johnson,�2005a,�b)(Figures�6B,�22).�The�sink�is�about�7�km�ESE�of�Ellin-wood,�and�1.5�km�south�of�US�Highway�56.�The�well�was� originally� an� oil-producing�well,� and�was� drilled�through�91�m�of�Hutchinson�Salt�starting�at�a�depth�of�298�m.�When�originally�drilled�in�1938,�freshwater�dril-ling�"uids�dissolved� the� salt� to� an� excessive�diameter�(1.4�m),� and� only� about� half� of� this�washed-out� zone�was� then�cemented�behind� the�casing� (Walters,�1978).�From�1949�to�1958,�the�well�was�converted�to�the�dis-posal�of�salt�water�that�was�co-produced�with�petroleum�from� other� oil� wells� in� the� area.� A� large� quantity� of�unsat-urated� oil�!eld� brine� (containing� about� 28,000�ppm�NaCl)�was�then�pumped�into�the�well�and,�because�of� corrosion� in� the� casing,� the� brine� inadvertently�encountered,� and� further� dissolved,� the� salt.� A� large�cavern�was� formed,�and�with� successive� roof� falls,� the�water-!lled� void� migrated� upward� causing� surface�subsidence,� tilting�of� an�oil�!eld�derrick,� and� eventual�collapse� (Figure� 22).� Initially,� the� sinkhole� had� a�diameter�of�90�m�and�was�at�least�18�m�deep;�later�data�(Google� Earth,� June� 2015)� shows� that� the� sink� has�reached�dimensions�of�150�m
by� 180� m,� and� still� later� data� (Google� Earth,� June�2019)� show�water� !lling� a� depression� (the� sink,� plus�adjacent� land�that�slopes�down�toward�the�sink)�that� is�about�230�m�by�255�m.
Berscheit�and�Hilton�Sinks.� Two�sites�of�Hutchin-son�Salt�dissolution�and�subsidence�are�present�in�west-ern�Rice�County,�Kansas� (Fader,�1975;�Walters�1978)(Figure� 6B).�Here� the�Hutchinson� Salt� is� about� 90�m�thick�and�the�top�of�the�salt�is�about�290�m�below�land�surface.�These�two�subsidence�features�are�the�Berscheit�and�Hilton�Sinks:�Berscheit�Sink�is�9�km�east�of�Ellin-wood� and� 600� m� south� of� US� Highway� 56;� Hilton�Sink� is� 2� km� SW�of� the� small� community� of�Chase.�Both�sinks�enveloped�SWD�wells�that�were�drilled�spe-ci!cally� to�dispose�of�oil�!eld�brines� into� the�Arbuckle�Group,�and�the�general�geology�and�history�are�similar�to� that�of� the�Panning�Sink� (above),�once� the�Panning�well�was�converted�to�SWD�(Figure�22).�The�principal�difference�is�that�the�land�surface�at�both�the�Berscheit�and�Hilton�Sinks�did�not�collapse,�but�instead�underwent�slow�subsidence.�The�Berscheit�well�was�drilled�in�1936,�and�was�abandoned�in�1972.�By�1975,�the�pond�!lling�the�depression�was�157�m�by�114�m,�and�the�subsidence�was�estimated�to�be�about�5�m�(Walters,�1978);�later�data�(Google� Earth,� June� 2015)� indicated� that� the� pond�(assumed� to� be� the� sink/depression� area)� is� about�150�m�across.�On�the�Hilton�lease,�two�wells�were�drilled�60�m�apart:�one�well�was�drilled�in�1948�and�plugged�in�1951,�and�the�other�well�was�drilled�in�1951�and�plugged�in�1965.�Subsidence�was�!rst�noted�at�this�site�starting�in�1964,�and�Fader�(1975)�estimated�that�by�1968�the�land�surface�had�subsided�6�m.�Aerial�photos�(Google�Earth,�June�2015)�show�that�the�pond�in�the�sink/depression�is�160�m�by�190�m.
Witt� and� Crawford� Sinks.� Slow� subsidence� is�occurring�at�two�sites�along�Interstate�70�in�the�Gorham�oil�!eld,�in�Russell�County,�Kansas,�because�of�dissolu-tion�of�the�Hutchinson�Salt�(Fader,�1975;�Walters,�1978,�1991;� Croxton,� 2002,� 2003;� Johnson,� 2005a,� b)(Figure� 6B).� Oil� wells� drilled� in� the� !eld� from� the�1920s� through� the�1940s�penetrated�75�m�of� salt� at� a�depth� of� 390�m.�Many� of� the�wells� are� now� plugged�and� abandoned,� but� the� corroded� casing� was� left� in�some�of�the�boreholes�at�depths�above,�within,�and�below�the�salt�unit;�this�probably�has�allowed�unsaturated�water�to�"ow�down�some�of�the�abandoned�boreholes�and�dis-solve�large�volumes�of�salt.�Subsidence�was�not�evident�prior�to�highway�construction�in�1966,�but�by�1971,�two�sites�of�pronounced�subsidence�were�obvious.�The�Witt�Sink�and�the�Crawford�Sink�are�located�adjacent�to�the�east-bound� lanes� (south� side)� of� I-70:� they� are� about�800�m� apart,� and� about� 4.5� and� 5.3� km,� respectively,�ESE�of�the�town�of�Gorham.
Figure 22. Cross-section through the Panning salt waterdisposal (SWD)well showing the result of unplanned dis-solution of the Hutchinson Salt and development of thePanning Sink in Kansas (modi!ed from Walters, 1978).
Overview of Evaporite Karst in the Greater Permian Evaporite Basin (GPEB) 27

Early�subsidence�at�the�sinks�occurred�at�rates�of�about�10� to�15�cm/yr,�and�by�1971� the�east-bound� lanes�had�dropped�so�much� that� they�had� to�be�regraded:�paving�was� raised� about�1.5�m�at�both� sinks,� at� a�cost�of�US$220,000� (Croxton,� 2002,� 2003).�By� 1984,� the� lanes�at� the�Witt�Sink�had�again�subsided�nearly�2.5�m,�and�a�line-of-sight�problem�arose�because�cars�down�in�the�sink�could�not�be�seen�by�oncoming� traf!c.�Witt�Sink�was� again� regraded� and� repaved� in�1986,� at� a� cost�of�nearly�US� $500,000.�A� borehole�was� drilled� adjacent�to� the� abandoned�oil�well�believed� to�be� the� cause�of�the�Witt�Sink,�and�cement�was�injected�to�plug�the�old�well�at�the�base�of�the�salt.�This�appeared�to�stop�the�set-tling�for�about�6�months,�but�then�subsidence�resumed�at�a� rate� of� 12� to� 15� cm/yr.�Plans� call� for� continuing� to�regrade� 1–70,� as� needed,� because� a�more� economical�solution�to�the�subsidence�problem�has�not�been�found�(Croxton,�2002,�2003).
Hutchinson�Gas�Explosion.� This� is�an�example�of�natural�salt�karst�affecting�a�petroleum-related�problem.�A�series�of�natural�gas�explosions�and�geysers�occurred�within�the�city�of�Hutchinson,�Kansas,�in�2001,�resulting�in� the�death�of� two�people� (Watney� and�others,�2003)(Figure� 6B).� The� loss� of� an� estimated� 4,049,000� m3
(143�million� ft3)� of� gas�was� reported� from� an� under-ground,� high-pressure,� natural�gas�storage� facility,� the�Yaggy� facility,� about�11�km�northwest�of�Hutchinson.�Gas�explosions�began�2!�days�after�a�major�gas�leak�in�a�natural�gas�storage�well�at�the�facility�where�the�gas�is�stored� in�dissolution�caverns� formed� in� the�Hutchinson�Salt.�The�gas�presumably�traveled�underground�through�a�series�of�shallow�fracture�systems�that�had�been�partly�produced�by�dissolution�of� the�deeper,�upper� salt�beds�of� the�Hutchinson�Salt� that�underly� the�entire�area:� the�top�of�the�salt�rises�from�a�depth�of�about�180�m�at�the�Yaggy�facility�to�depths�of�about�120�to�140�m�beneath�the�city�of�Hutchinson�(Watney,�2003,�see�his�Figure�6).�Dissolution� of� the� uppermost� salt� beds� formed� an�elongated� northwest-trending� trough� that� extends�beneath� the� gas-storage� facility� and�Hutchinson.� This�northwest� trend� of� fracturing� and� dissolution� probably�re"ects� the� location� of� a� deep-seated� tectonic� fracture�system.�Therefore,� it� appears� that� the� tectonic� fracture�system� aided� in� the� development� of� fractures� in� the�Hutchinson�Salt�and�overlying�strata,�and�these�fractures�apparently�acted�as�conduits�for�unsaturated�groundwater�to� reach�and�partly�dissolve� the�uppermost�Hutchinson�Salt� beds.� This� led� to� development� of� the� elongated�northwest-trending�fracture�system�that�conducted�natu-ral�gas�from�the�storage�facility�to�the�city�of�Hutchinson.
Freedom�Gas�Blowout.� This�is�another�example�of�natural� salt� karst� helping� to� bring� about� a� petroleum-related�problem.�In�1980,�natural�gas�erupted�at�a�number
of� places� in� the�"ood� plain� of�Cimarron�River,� about�6�km�WNW�of�the�town�of�Freedom,�along�the�Woods–Woodward� County� line� in� northwest� Oklahoma�(Figure� 6B).� This� event� was� described� by� Preston�(1980a,� 1980b)� and� summarized� by� Johnson� (2003a).�Alluvium� in� the� Cimarron� River� "oodplain� overlies�the�Flowerpot�Shale,�which,�in�the�shallow�subsurface,�contains�salt�beds�of�the�Flowerpot�salt.�The�top�of�the�karstic�Flowerpot�salt�here�is�about�60�m�below�the�sur-face,�and� the� top�of� the�Cimarron�salts� is�about�150�m�deep:�however,�just�3�km�to�the�west�(beneath�Big�Salt�Plain)� the� top�of� the�salt� is�actively�being�dissolved�at�a�depth�of�only�10�m�(Johnson,�1981).�At�!rst,�venting�of�the�gas�created�a�crater�6�m�wide,�from�which�viscous�mud�was�ejected�to�a�height�of�more�than�15�m�(Preston,�1980b),�and�other�craters�in�the�area�were�up�to�9�m�wide�and� 3.7� m� deep.� More� than� 50� separate� vents� were�mapped� in� an� area� about� 1.5� km� by� 2.5� km.� Preston�(1980a,� 1980b)� estimated� that� the� total� gas� emitted�from� the� larger�vents�alone�was�about�566,000�m3/day�(20�million� ft3/day),� and� that�much�more�was� emitted�from� smaller� vents� and� by� general� effusion� of� gas�through�the�sandy�soils.
Nearby�gas-producing�wells�were�checked� to� see� if�there�was� a�mechanical� failure� that� produced� the� gas,�but� all� of� them�were� intact.�Analyses� of� the� escaping�gas�showed�that�it�was�probably�coming�from�the�Mis-sissippian�Chester/Oswego� interval,�at�depths�of�about�1700�m� in� the� area.�Although� origin� of� the� gas�was�not� proven,� the� Oklahoma� Corporation� Commission�(OCC)� concluded� that� it� probably� came� from� a� well�about� 16� km� southwest� of� the� blowout.� The� suspect�well�was�drilled�to�a�depth�of�2449�m,�and,�following�a�drillstem� test,� high-pressure� natural� gas� in� the� well�caused�a�blowout�just�4�days�prior�to�the�gas�eruptions�near�Freedom.�The�Oklahoma�Corporation�Committee�of!cials�concluded�(Vanderwater,�1980)�“that�the�same�pressure�that�caused�the�blowout�at�the�: : :well�fractured�the� underground� rock.�That� let� natural� gas� below� the�well’s�casing�[set�at�305�m]�enter�caverns�which�honey-comb�the�area,�building�up�pressure�there�and�eventually�erupting� through�weak� surface� points� like� cracks� and�under� ponds� [in� the� Cimarron� River� "oodplain].”� If�that� analysis� is� correct,� then� gas� escaping� from� the�well�may�have�done�the�following:�(1)�entered�the�intra-stratal�karst� system� in� the�Cimarron� and/or�Flowerpot�salt;�(2)�migrated�laterally�up-dip�for�16�km�to�the�north-east� through� natural,� salt�dissolution� cavities;� and� (3)�then� (within�4�days)� reached� the� land� surface� through�the�fractured�Flowerpot�Shale�which�overlies�the�karstic�salts.�So,�it�appears�that�natural�salt�karst�in�the�area�al-lowed�fugitive,�high-pressure�natural�gas�to�travel�a�long�distance�(16�km)�in�a�short�time,�thus�creating�a�poten-tially� hazardous� condition� at� a� site� far� removed� from�the�site�of�the�initial�well�blowout�(Johnson,�2003a).
28 ,FOOFUI�4��+PIOTPO

Human-Induced�Gypsum�Karst
Gypsum�karst�and�subsidence�can�be�accelerated�by�human� activity,� including� the� same� activities� that�may�cause�problems�in�carbonate�terranes,�such�as��(1)�build-ing�structures�that�induce�differential�compaction�of�soils�above�an�irregular�gypsum�bedrock�surface;�(2)�building�structures�directly�upon�gypsum�collapse� features;� and�(3)� impounding�water�above,�or�directing�water� into,�a�gypsum� unit�where� soil� piping� can� divert�water� (and�soil)� into� underground� gypsum� cavities� (Johnson,�2005b;� Cooper,� 2020b).� These� human� activities� can�cause� land�subsidence,�or�can�cause�new�or�concealed�sinkholes�and�cave�systems� to�open�up;� this�can� result�in�settling�or�catastrophic�collapse�of�the�ground.
Human� activities�have� caused�problems� in�gypsum-karst�areas�in�various�parts�of�the�United�States,�especially�in� the�Black�Hills�area�of�South�Dakota�and�Wyoming�(Rahn�and�Davis,�1996;�Davis�and�Rahn,�1997;�Epstein,�2003),�and�in�the�failure�of�the�Quail�Creek�Dike�near�St.�George�in�southwest�Utah�(Gourley,�1992;�Payton,�1992;�Payton�and�Hansen,�2003).�However,�such�examples�are�rare�in�the�GPEB.�The�main�examples�I�am�aware�of�in�the�GPEB�are�where�dams�have�been�proposed� in�areas�of�gypsum�karst.�Red�Bluff�Dam� (described� above�under�“Natural� Salt� Karst”)� is� now� losing� water� through�gypsum-karst�features�that�are�largely�collapsed�because�of�dissolution�of�underlying�salt�and�gypsum�beds.�Other�dams�originally�proposed� in�areas�of�gypsum�karst,�but�that�were� abandoned� as� a� result� of� detailed� evaluation�and�alternate�sites�were�recommended,�include�the�origi-nal�Upper�Mangum,�Cedar�Ridge,�and�McMillan�Dam-sites�(described�above�under�“Natural�Gypsum�Karst”).
CONCLUSIONS
The�newly�identi!ed�GPEB�is�one�of�the�major�accu-mulations� of� evaporites� in� the�world,� covering� about�650,000�km2�in�parts�of�Texas,�New�Mexico,�Oklahoma,�Kansas,�and�Colorado.�Eight�major�Permian�evaporite�sequences� that� contain� salt� (halite)� and� gypsum/anhy-drite�have�a�combined�thickness�of�500�to�1500�m�in�var-ious�parts�of�the�GPEB.�These�evaporites�extend�across�a�series�of�structural�and�sedimentary�basins�in�the�region,�with� the�evaporite�depocenter�shifting�progressively� to�the�south�(or�southwest)�during�about�25�million�years�of� the�Leonardian,�Guadalupian,� and�Ochoan�Epochs.�The� earliest� evaporites� are� the�Wellington/Hutchinson�evaporites,�centered�in�Kansas�on�the�north,�and�the�!nal�stage�of�evaporite�deposition�was�the�Rustler�Formation�in� west� Texas� and� southeast� New� Mexico.� Whereas�Permian� gypsum/anhydrite� units� extend� throughout�the�full�650,000�km2�of�the�GPEB,�the�salt-bearing�units�are�restricted�to�about�380,000�km2�of�the�region.
Evaporite�karst�is�widespread�in�the�GPEB,�and�results�from� both� natural� processes� and� human� activities.
Typical� karst� features� here� include� caves,� sinkholes,�breccia�pipes,�disappearing� streams,� springs,�and�even�catastrophic� collapses.�Each�of� the� eight� evaporite� se-quences�in�the�GPEB�has�areas�of�natural�karst�features�somewhere�in�the�region.
Natural� salt� karst� has� resulted� in�major� subsidence�troughs� in� the�Delaware�Basin� that�are�now�!lled�with�Cenozoic� sediments,� as� well� as� smaller-scale� subsi-dence/collapse� features� in�all�!ve� states�of� the�GPEB.�Salt�karst�is�also�generated�by�human�activities:�solution�mining�of�underground� salt�deposits�can� inadvertently�create�a�large�cavity�in�the�salt,�and�if�the�cavity�becomes�too�large�it�can�result�in�failure�of�its�roof�that�can�then�reach� the� land� surface� as� a� huge� sinkhole;� petroleum�or�water�supply�wells�can�also�accidentally�create�large�cavities�in�salt�deposits�that�result�in�failure�of�the�roof�and� upward� stoping� of� the� cavity� until� it� reaches� the�land�surface�as�a�giant�sinkhole.
Natural�gypsum�karst� is� common�on�both� the�west�and�east�sides�of�the�GPEB.�Gypsum�caves�and�sinkholes�are�common� in� the�Delaware�Basin�of�west�Texas�and�New�Mexico,�as�well�as�on� the�east�side�of� the�GPEB�in�north-central�Texas,�western�Oklahoma,� and� south-west�Kansas.�A�number�of�the�longest�and�most�signi!-cant� gypsum� caves� are� present� on� both� sides� of� the�region,� and� solution� cavities� in� gypsum� have� created�signi!cant�aquifers�in�some�areas.�Natural�gypsum�karst�has� caused� loss� of� water� around� or� beneath� some�existing� dams,� and� has� also� caused� the� abandonment�of�several�proposed�or�functioning�dams.
It� is�hoped� that� this� report�on�evaporite�karst� in� the�GPEB�provides� an�overview�of� the� scope� and� signi!-cance�of�actual�and�potential�evaporite-karst�problems�in� the�region,�and�also�provides�an� impetus� for� further�research�on�various�aspects�of�evaporite�studies.
Appreciation�is�expressed�to�Dr.�Lewis�Land,�geolo-gist�with�the�National�Cave�and�Karst�Research�Institute,�for�his� review�and�constructive�comments�on�an�early�draft�of�this�report.
REFERENCES
Anderson,� N.L.,� Knapp,� R.W.,� Steeples,� D.W.,� andMiller, R.D., 1995a, Plastic deformation and dissolu-tion of the Hutchinson Salt Member in Kansas: KansasGeological Survey, Bulletin 237, p. 66-70. http://www.kgs.ku.edu/Publications/Bulletins/237/Anderson3/hutchinson2.pdf
Anderson, N.L., Watney, W.L, Macfarlane, P.A., andKnapp, R.W., 1995b, Seismic signature of the Hutch-inson Salt and associated dissolution features: KansasGeological Survey, Bulletin 237, p. 57-63. http://www.kgs.ku.edu/Publications/Bulletins/237/Anderson2/hutchinson.pdf
Overview of Evaporite Karst in the Greater Permian Evaporite Basin (GPEB) 29

Anderson, R.Y., 1981, Deep-seated salt dissolution in theDelaware Basin, Texas and NewMexico: NewMexicoGeological Society, Special Publication No. 10, p. 133–145. https://wipp.energy.gov/library/cca/CCA_1996_References/Chapter%202/CREL4992.PDF
Anderson, R.Y., Dean, W.E., Jr., Kirkland, D.W., andSnider, H.I., 1972, Permian Castile varved evaporitesequence, west Texas and New Mexico: GeologicalSociety of America, Bulletin, Vol. 83, No. 1, p. 59-86.
Anderson, R.Y., Kietzke, K.K., and Rhodes, D.J., 1978,Development of dissolution breccias, northern Dela-ware Basin, New Mexico and Texas, in Austin,G.S., compiler, Geology and mineral deposits ofOchoan rocks in Delaware Basin and adjacent areas:NewMexicoBureau ofMines andMineral Resources,Circular 159, p. 47-52. https://geoinfo.nmt.edu/publications/monographs/circulars/downloads/159/Circular-159.pdf
Askew, R.L., 2013, Distribution of the Permian BlaineFormation salt in the subsurface of the HugotonEmbayment area of Baca County, southeast Colorado:Rocky Mountain Association of Geologists, TheMountain Geologist, Vol. 50, No. 2, p. 65-75.
Bachman, G.O., 1984, Regional geology of Ochoanevaporites, northern part of Delaware Basin: NewMexico Bureau of Mines andMineral Resources, Cir-cular 184, 23 p. https://geoinfo.nmt.edu/publications/monographs/circulars/downloads/184/Circular-184.pdf
Bachman, G.O., and Johnson, R.B., 1973, Stability ofsalt in the Permian salt basin of Kansas, Oklahoma,Texas, and New Mexico: U.S. Geological Survey,Open-!le Report 73-14, 62 p. https://pubs.usgs.gov/of/1973/0014/report.pdf
Baumgardner, R.W., Jr., Hoadley, A.D., and Gustavson,T.C., 1981, Salt dissolution and formation of theWinkSink, Winkler County, Texas, in Gustavson, T.C., andothers, Geology and geohydrology of the Palo DuroBasin, Texas Panhandle: The University of Texas atAustin, Bureau of EconomicGeology,Geological Cir-cular 81–83, p. 152-155.
Baumgardner, R.W., Jr., Hoadley,A.D., Goldstein,A.G.,1982, Formation of the Wink Sink, a salt dissolutionand collapse feature, Winkler County, Texas: TheUniversity of Texas at Austin, Bureau of EconomicGeology, Report of Investigations No. 114, 38 p.
Belski, D.S., ed., 1992, GYPKAP report, no. 2, 1988–1991: National Speleological Society, SouthwestRegion, 56 p.
Berry, H.D., 2018, Dissolution of Permian salt, LasAnimas Arch, Colorado: Unpublished M.S. thesis,University of Louisiana at Lafayette, 96 p.
Bozeman, J., 2003, Exploration of western Oklahomagypsum caves, in Johnson, K.S., and Neal, J.T.,
eds., Evaporite karst and engineering/environmentalproblems in the United States: Oklahoma GeologicalSurvey, Circular 109, p. 57-64. http://ogs.ou.edu/docs/circulars/C109.pdf
Bozeman, J., andBozeman, S., 2002, Speleology of gyp-sum caves in Oklahoma: Carbonates and Evaporites,Vol. 17, No. 2, p. 107-113.
Bozeman, S., ed., 1987, The D.C. Jester Cave system:Central Oklahoma Grotto, Oklahoma Underground,Vol. 14, 56 p.
Bozeman, S., ed., 2002, The Selman Cave System,Woodward County, Oklahoma: Central OklahomaGrotto, Oklahoma City, Oklahoma Underground,Vol. 20, 44 p.
Charlton, J, Boehm,R., and Johnson, K.S., 2021, Designand implementation of a grout program in anevaporite-karst foundation, Red Bluff Dam, Orla,Texas: in Johnson, K.S., Land, L., and Decker,D.D., eds., Evaporite karst in the Greater PermianEvaporite Basin (GPEB) of Texas, New Mexico,Oklahoma, Kansas, and Colorado: OklahomaGeological Survey, Circular 113.
Coates, G.K, Lee, C.A., McClain, W.C., and Senseny,P.E., 1985, Closure and collapse of man-made cavitiesin salt, in Schreiber, B.C., andHarner, H.L., eds., Sixthinternational symposium on salt: The Salt Institute,Alexandria, Virginia, Vol. 2, p. 139-157.
Collins, E.W., 2000, Reconnaissance investigation ofactive subsidence and recent formation of earth !s-sures near the 1980 Wink Sink in the Hendrick oil!eld, Winkler County, Texas: Geological Society ofAmerica, Abstracts with Programs, Vol. 32, No. 3,p. A-6.
Cooper, 2020a, Geologic hazards from salt mining, brineextraction and natural salt dissolution in the UK, inGiles, D.P., and Grif!ths, J.S., eds., Geologic hazardsin the UK: their occurrence, monitoring andmitigation—EngineeringGroupWorking Party Report:Geological Society, London, EngineeringGeologySpe-cial Publications 20, Chapter 14, p. 369-387.
Cooper, 2020b, Geohazards caused by gypsum andanhydrite in the UK: including dissolution, subsi-dence, sinkholes and heave, in Giles, D.P., andGrif!ths, J.S., eds., Geologic hazards in the UK: theiroccurrence, monitoring and mitigation—EngineeringGroup Working Party Report: Geological Society,London, Engineering Geology Special Publications20, Chapter 16, p. 403-423.
Cox, E.R., 1967, Geology and hydrology between LakeMcMillan and Carlsbad Springs, Eddy Co., NewMexico: U.S. Geological Survey,Water-Supply Paper1828, 48 p. https://pubs.er.usgs.gov/search?q=water-supply+paper+1828
30 ,FOOFUI�4��+PIOTPO

Croxton, N.M., 2002, Subsidence of I–70 in RussellCounty,Kansas, related to salt dissolution—Ahistory:The Professional Geologist, Vol. 39, No. 8, p. 2-7.
Croxton, N.M., 2003, Subsidence on Interstate 70 inRussell County, Kansas, related to salt dissolution—A history, in Johnson, K.S., and Neal, J.T., eds., Evap-orite karst and engineering/environmental problems inthe United States: Oklahoma Geological Survey, Cir-cular 109, p. 149-155. http://ogs.ou.edu/docs/circulars/C109.pdf
Croxton, N.M, 2021, Sinkhole under Interstate 135 inMcPherson County, Kansas, in Johnson, K.S., Land,L., and Decker, D.D., eds., Evaporite karst in theGreater Permian Evaporite Basin (GPEB) of Texas,New Mexico, Oklahoma, Kansas, and Colorado:Oklahoma Geological Survey, Circular 113.
Davis, A.D., and Rahn, P.H., 1997, Karstic gypsumproblems at wastewater stabilization sites in the BlackHills of South Dakota: Carbonates and Evaporites,Vol. 12, p. 73-80.
Dunrud, C.R., and Nevins, B.B., 1981, Solution miningand subsidence in evaporite rocks in the United States:U.S. Geological Survey,Miscellaneous InvestigationsSeries, I–1298, 2 plates, scale 1:5,000,000. https://pubs.er.usgs.gov/publication/i1298
Dyni, R.C., 1986, Subsidence investigations over salt-solution mines, Hutchinson, KS: U.S. Bureau ofMines, Information Circular 9083, 23 p. https://ia800300.us.archive.org/30/items/subsidenceinvest00dyni/subsidenceinvest00dyni.pdf
Ege, J.R., 1979, Subsurface subsidence and collapse inrelation to extraction of salt and other soluble evapor-ites: U.S. Geological Survey, Open-File Report 79–1666, 34 p. https://pubs.usgs.gov/of/1979/1666/report.pdf
Ege, J.R., 1985, Maps showing distribution, thicknessand depth of salt deposits of the United States: U.S.Geological Survey, Open-File Report 85–28, 11 p. 4plates. https://pubs.er.usgs.gov/publication/ofr8528
Epstein, J.B., 2003, Gypsum karst in the Black Hills,South Dakota–Wyoming: geomorphic development,hazards, and hydrology, in Johnson, K.S., and Neal,J.T., eds., Evaporite karst and engineering/environ-mental problems in the United States: OklahomaGeological Survey, Circular 109, p. 241-254. http://ogs.ou.edu/docs/circulars/C109.pdf
Fader, S.W., 1975, Land subsidence caused by dissolu-tion of salt near four oil and gas wells in central Kan-sas: U.S. Geological Survey, Water-ResourcesInvestigations 27-75, 28 p. https://pubs.usgs.gov/wri/1975/0027/report.pdf
Fischer, W.A., and Hackman, R.J., 1964, Geologic mapand sections of the Torrance Station 4 NE quadrangle,
LincolnCounty,NewMexico:U.S.Geological Survey,Miscellaneous Geological Investigations Map 1-400.https://pubs.usgs.gov/imap/0400/report.pdf andhttps://ngmdb.usgs.gov/Prodesc/proddesc_1283.htm
Forbes, J., and Nance, R., 1997, Stratigraphy, sedimen-tology, and structural geology of gypsum caves insoutheast New Mexico: Carbonates and Evaporites,Vol. 12, p. 64-72.
Garner, L.E., St. Clair, A.E., and Evans, T.J., 1979, Min-eral resources of Texas map: The University of Texasat Austin, Bureau of Economic Geology, Energy andMineral Resource Maps, ER0002, scale 1:1,000,000.
Gauvey, K., and Sumrall, J.B., 2021, Gypsum karst insouth-central Kansas, in Johnson, K.S., Land, L.,and Decker, D.D., eds., Evaporite karst in the GreaterPermian Evaporite Basin (GPEB) of Texas, NewMex-ico, Oklahoma, Kansas, and Colorado: OklahomaGeological Survey, Circular 113.
Gogel, T., 1981, Discharge of saltwater from Permianrocks to major stream-aquifer systems in central Kan-sas: Kansas Geological Survey, Chemical QualitySeries 9, 60 p. http://www.kgs.ku.edu/Publications/Bulletins/CQS9/index.html
Gourley, C., 1992, Geological aspects of theQuail CreekDike failure, in Harty, K.M., ed., Engineering andenvironmental geology of southwestern Utah: UtahGeological Association, Publication 21, p. 17-38.
Gustavson, T.C., 1986, Geomorphic development of theCanadian River Valley, Texas Panhandle: an exampleof regional salt dissolution and subsidence:GeologicalSociety of America, Bulletin, Vol. 97, p. 459-472.
Gustavson, T.C., and Finley, R.J., 1985, Late Cenozoicgeomorphic evolution of the Texas Panhandle andnortheast New Mexico—Case studies of structuralcontrols on regional drainage development: The Uni-versity of Texas at Austin, Bureau of Economic Geol-ogy, Report of Investigations No. 148, 42 p.
Hill, C.A., 1996, Geology of the Delaware basin –Guadalupe, Apache, and Glass Mountains, southeast-ern New Mexico and west Texas: SEPM PermianBasin Section, Publication 96-39, 480 p.
Hill, C.A., 2003, Intrastratal karst at the Waste IsolationPilot Plant site, southeastern NewMexico, in Johnson,K.S., and Neal, J.T., eds., Evaporite karst and engi-neering/environmental problems in the United States:Oklahoma Geological Survey, Circular 109, p. 197-209. http://ogs.ou.edu/docs/circulars/C109.pdf
Hopkins, J., and Muller, C., 2011, Water quality in theBlaine aquifer: Texas Water Development Board,Report 376, 40 p. http://www.twdb.texas.gov/publications/reports/numbered_reports/doc/R376_Blaine.pdf
Johnson, K.S., 1969, Mineral map of Oklahoma (exclu-sive of oil and gas !elds): Oklahoma Geological
Overview of Evaporite Karst in the Greater Permian Evaporite Basin (GPEB) 31

Survey, Map GM–15, scale 1:750,000. http://ogs.ou.edu/docs/geologicmaps/GM15.pdf
Johnson, K.S., 1976, Evaluation of Permian salt depositsin the Texas Panhandle and western Oklahoma forunderground storage of radioactive wastes: unpub-lished report submitted to UnionCarbide Corporation,Oak RidgeNational Laboratories, Of!ce ofWaste Iso-lation,Y/OWI/Sub–4494/1, 73 p.Also available from:Oklahoma Geological Survey, Open-File Report 19–2018. http://www.ou.edu/content/dam/ogs/documents/data/OF19-2018.pdf
Johnson, K.S., 1981, Dissolution of salt on the east "ankof the PermianBasin in the southwesternU.S.A.: Jour-nal of Hydrology, Vol. 54, p. 75-93. https://www.researchgate.net/publication/245098253
Johnson, K.S., 1986, Salt dissolution and collapse atthe Wink Sink in west Texas: unpublished reportsubmitted to Of!ce of Nuclear Waste Isolation,Battelle Memorial Institute, BMI/ONWI–598, 83 p.Also available from: Oklahoma Geological Survey,Open-File Report 19–2018. http://www.ou.edu/content/dam/ogs/documents/data/OF19-2018.pdf
Johnson, K.S., 1989a, Development of the Wink Sink inwest Texas, U.S.A., due to salt dissolution and col-lapse: Environmental Geology and Water Sciences,Vol. 14, No. 2, p. 81-92. https://www.researchgate.net/publication/226582541
Johnson, K.S., 1989b, Geology of Jester Cave: NSSNews, National Speleological Society, Huntsville,AL, Vol. 47, No. 1, p. 11-17. https://www.researchgate.net/publication/307970029
Johnson, K.S., 1990, Hydrogeology and karst of theBlaine gypsum–dolomite aquifer, southwestern Okla-homa: Oklahoma Geological Survey, Special Publica-tion 90–5, 31 p. http://ogs.ou.edu/docs/specialpublications/SP90-5.pdf
Johnson, K.S., 1996, Gypsum karst in the United States,in Klimchouk, A., and others, eds., Gypsum karstof the world: International Journal of Speleology,Vol. 25, Nos. 3–4, p. 183-193. https://scholarcommons.usf.edu/ijs/vol25/iss3/13/
Johnson, K.S., 2003a, Evaporite karst in the PermianBlaine Formation and associated strata of westernOklahoma, in Johnson, K.S., and Neal, J.T., eds.,Evaporite karst and engineering/environmental prob-lems in the United States: Oklahoma GeologicalSurvey, Circular 109, p. 41–55. http://ogs.ou.edu/docs/circulars/C109.pdf
Johnson, K.S., 2003b, Gypsum karst and abandonmentof the Upper Mangum Damsite in southwestern Okla-homa, in Johnson, K.S., and Neal, J.T., eds., Evaporitekarst and engineering/environmental problems in the
United States: Oklahoma Geological Survey, Circular109, p. 85-94. http://ogs.ou.edu/docs/circulars/C109.pdf
Johnson, K.S., 2003c, Gypsum karst as a major factor inthe design of the proposed Lower Mangum Dam insouthwestern Oklahoma, in Johnson, K.S., andNeal, J.T., eds., Evaporite karst and engineering/envi-ronmental problems in the United States: OklahomaGeological Survey, Circular 109, p. 95-111. http://ogs.ou.edu/docs/circulars/C109.pdf
Johnson, K.S., 2005a, Salt dissolution and subsidence orcollapse caused by human activities, in Ehlen, J.,Haneberg, W.C., and Larson, R.A., eds., Humans asgeologic agents: Geological Society of America, Re-views in Engineering Geology, Vol. XVI, p. 101-110.https://www.researchgate.net/publication/273125732
Johnson, K.S., 2005b, Subsidence hazards due to evap-orite dissolution in the United States: EnvironmentalGeology, Vol. 48, No. 3, p. 395-409. https://www.researchgate.net/publication/227194203
Johnson, K.S., 2008, Gypsum-karst problems in con-structing dams in the USA: Environmental Geology,Vol. 53, No. 5, p. 945-950. https://www.researchgate.net/publication/226513928
Johnson, K.S., 2011, Alabaster Caverns State Park:Oklahoma City Geological Society, Shale Shaker,Vol. 62, No. 2, p. 108-112. https://www.researchgate.net/publication/306373810
Johnson, K.S., 2013, Salt karst and collapse structures inthe Anadarko Basin of Oklahoma and Texas, in Land,L., Doctor, D.H., and Stephenson, J.B., eds., Sink-holes and the engineering and environmental impactsof karst–Proceedings of the thirteenth multidisciplin-ary conference, Carlsbad, NM, May 6 through 10,2013: National Cave and Karst Research Institute,Carlsbad, NM, p. 103-112. http://scholarcommons.usf.edu/cgi/viewcontent.cgi?article=1118&context=sinkhole_2013
Johnson, K.S., 2017, Evaporite karst and collapse brec-cia in Permian strata, Canton Lake Dam, BlaineCounty, Oklahoma: Oklahoma Geological Survey,Oklahoma Geology Notes, Vol. 76, No. 3, p. 5-18.http://ogs.ou.edu/docs/geologynotes/GN-V76N3.pdf
Johnson, K.S., 2018, Gypsum caves of north Texas andwestern Oklahoma, in Stafford, K.W., and Veni, G.,eds., Hypogene karst of Texas: Texas SpeleologicalSurvey, Monograph 3, p. 111-122. https://www.texasspeleologicalsurvey.org/PDF/Hypogene_Karst_of_Texas.pdf
Johnson, K.S., 2019, Blaine aquifer in the Hollis Basinof southwest Oklahoma: structure-contour map andstratigraphic/hydrologic data: Oklahoma GeologicalSurvey, Geologic Map GM–45, scale 1:125,000.
32 ,FOOFUI�4��+PIOTPO

http://ou.edu/content/dam/ogs/documents/GMs/GM-45%20map.pdf
Johnson, K.S., 2021a, Permian Blaine and San AndresFormations of western Oklahoma and Palo DuroBasin of Texas: their correlation and evaporite karst,in Johnson, K.S., Land, L., and Decker, D.D., eds.,Evaporite karst in the Greater Permian EvaporiteBasin (GPEB) of Texas, New Mexico, Oklahoma,Kansas, and Colorado: Oklahoma GeologicalSurvey, Circular 113.
Johnson, K.S., 2021b, Salt dissolution and the WallaceSinkhole in the Sharon Springs–Wallace area,WallaceCounty, Kansas, in Johnson, K.S., Land, L., andDecker, D.D., eds., Evaporite karst in the GreaterPermianEvaporite Basin (GPEB) of Texas, NewMex-ico, Oklahoma, Kansas, and Colorado: OklahomaGeological Survey, Circular 113.
Johnson, K.S., 2021c, Dissolution of Permian Flowerpotsalt beneath the Great Plains Reservoirs, Queens StateWildlife Area, in Kiowa, Prowers, and Bent Counties,southeast Colorado, in Johnson, K.S., Land, L., andDecker, D.D., eds., Evaporite karst in the GreaterPermianEvaporite Basin (GPEB) of Texas, NewMex-ico, Oklahoma, Kansas, and Colorado: OklahomaGeological Survey, Circular 113.
Johnson, K.S., 2021d, Delhi Sinkhole and WatongaSinkhole due to gypsum karst in the Permian BlaineFormation of western Oklahoma, in Johnson, K.S.,Land, L., and Decker, D.D., eds., Evaporite karst inthe Greater Permian Evaporite Basin (GPEB) ofTexas, New Mexico, Oklahoma, Kansas, and Colo-rado: Oklahoma Geological Survey, Circular 113.
Johnson, K.S., and Gonzales, S., 1978, Salt deposits inthe United States and regional characteristics impor-tant for storage of radioactive waste: prepared forUnion Carbide Corp., Nuclear Division, Oak RidgeNational Laboratory, Of!ce of Waste Isolation,Y/OWI/SUB-7414/1, 188 p. Also available from:Oklahoma Geological Survey, Open-File Report 18–2018. http://www.ou.edu/content/dam/ogs/documents/data/OF18-2018.pdf
Johnson, K.S., andWilkerson, J.M., 2013, Gypsum karstcauses relocation of proposed Cedar Ridge Dam,Throckmorton County, Texas in Land, L., Doctor,D.H., and Stephenson, J.B., eds., Sinkholes and theengineering and environmental impacts of karst–Proceedings of the thirteenth multidisciplinary confer-ence, Carlsbad, NM,May 6 through 10, 2013: NationalCave and Karst Research Institute, Carlsbad, NM,p. 133-139. https://scholarcommons.usf.edu/cgi/viewcontent.cgi?article=1121&context=sinkhole_2013
Johnson, K.S., Gonzales, S., and Dean,W.E., 1989, Dis-tribution and geologic characteristics of anhydritedeposits in the United States, in Dean, W.E., and
Johnson, K.S., eds., Anhydrite deposits of the UnitedStates and characteristics of anhydrite important forstorage of radioactive wastes: U.S. GeologicalSurvey, Bulletin 1794, p. 9-90. https://pubs.usgs.gov/bul/1794/report.pdf
Johnson, K.S., Collins, E.W., and Seni, S.J., 2003, Sink-holes and land subsidence owing to salt dissolutionnear Wink, west Texas, and other sites in westernTexas and New Mexico, in Johnson, K.S., and Neal,J.T., eds., Evaporite karst and engineering/environ-mental problems in the United States: OklahomaGeo-logical Survey, Circular 109, p. 183-195. http://ogs.ou.edu/docs/circulars/C109.pdf
Johnson, K.S., Bangsund, W.J., and Hines, N.A., 2013,Gypsum karst and potential risk in siting wind turbinesin Blaine County, Oklahoma, in Land, L., Doctor,D.H., and Stephenson, J.B., eds., Sinkholes and theengineering and environmental impacts of karst–Proceedings of the thirteenth multidisciplinary confer-ence, Carlsbad,NM,May 6 through 10, 2013:NationalCave and Karst Research Institute, Carlsbad, NM,p. 151-159. http://scholarcommons.usf.edu/cgi/viewcontent.cgi?article=1123&context=sinkhole_2013
Johnson, K.S., Shoemaker, R.A., Charlton, J., andParker, C., 2021, Evaporite karst in the Permian Rus-tler, Salado, and Castile Formations at Red Bluff Damon the Pecos River, Loving and Reeves Counties,Texas, in Johnson, K.S., Land, L., and Decker,D.D., eds., Evaporite karst in the Greater PermianEvaporite Basin (GPEB) of Texas, New Mexico,Oklahoma, Kansas, and Colorado: OklahomaGeological Survey, Circular 113.
Jordan, L., and Vosburg, D.L., 1963, Permian salt andassociated evaporites in the Anadarko Basin of thewestern Oklahoma–Texas Panhandle region: Okla-homa Geological Survey, Bulletin 102, 76 p. http://ogs.ou.edu/docs/bulletins/B102.pdf
Kelley, V.C., 1971, Geology of the Pecos country, south-eastern New Mexico: New Mexico Bureau of Minesand Mineral Resources, Memoir 24, 78 p. https://geoinfo.nmt.edu/publications/monographs/memoirs/downloads/24/Memoir-24.pdf
Kelner, G.M., Gauvey, K, and Sumrall, J.B., 2021, Akarst feature predictability model within BarberCounty, Kansas, in Johnson, K.S., Land, L., andDecker, D.D., eds., Evaporite karst in the GreaterPermian Evaporite Basin (GPEB) of Texas, NewMexico, Oklahoma, Kansas, and Colorado:Oklahoma Geological Survey, Circular 113.
Kim, J-W., and Lu, Z., 2018, Association between local-ized geohazards in west Texas and human activities,recognized by Sentinel-1A/B satellite radar imagery:Scienti!c Reports 8, 4727. https://doi.org/10.1038/s41598-018-23143-6
Overview of Evaporite Karst in the Greater Permian Evaporite Basin (GPEB) 33

Kim, J-W., and Lu, Z., 2021, Sinkholes in Wink, Texas,observed by satellite radar imagery, in Johnson, K.S.,Land, L., andDecker, D.D., eds., Evaporite karst in theGreater Permian Evaporite Basin (GPEB) of Texas,New Mexico, Oklahoma, Kansas, and Colorado:Oklahoma Geological Survey, Circular 113.
Kim, J-W., Lu, Z., and Kaufmann, J., 2019, Evolution ofsinkholes over Wink, Texas, observed by high-resolution optical and SAR imagery: Remote Sensingof Environment, No. 222, p. 119-132. https://www.smu.edu/-/media/Site/Dedman/Academics/Departments/EarthSciences/PDF/Lu/176_Kim_TSX_Sinkhole_Wink_RSE_2019.pdf?la=en
Kirkland, D.W., and Evans, R., 1980, Origin of castileson Gypsum Plain of Texas and NewMexico, in Dick-erson, P.W., and Hoffer, J.M., eds., Trans-Pecosregion, southeastern New Mexico and west Texas:New Mexico Geological Society, 31st Field Confer-ence, p. 173-178. https://nmgs.nmt.edu/publications/guidebooks/downloads/31/31_p0173_p0178.pdf
Kulstad, R.O., Fairchild, P., and McGregor, D., 1956,Gypsum in Kansas: Kansas Geological Survey, Bulle-tin 113, 110 p. http://www.kgs.ku.edu/Publications/Bulletins/133/index.html
Lambert, S.J., 1983, Dissolution of evaporites in andaround the Delaware Basin, southeastern New Mex-ico: Sandia National Labs, Albuquerque, New Mex-ico, SAND86–0461, 96 p. https://www.wipp.energy.gov/library/CRA/2009_CRA/references/Others/Lambert_1983_Dissolution_of_Evaporites_in_Delaware_Basin_SAND82_0461.pdf
Land, L., 2003, Evaporite karst and regional ground-water circulation in the lower Pecos River Valley ofsoutheastern New Mexico, in Johnson, K.S., andNeal, J.T., eds., Evaporite karst and engineering/envi-ronmental problems in the United States: OklahomaGeological Survey, Circular 109, p. 227-232. http://ogs.ou.edu/docs/circulars/C109.pdf
Land, L., 2013, Evaporite karst in the Permian Basinregion of west Texas and southeastern New Mexico:the human impact, in Land, L., Doctor, D.H., andStephenson, J.B., eds., Sinkholes and the engineeringand environmental impacts of karst–Proceedings ofthe thirteenth multidisciplinary conference, Carlsbad,NM, May 6 through 10, 2013: National Cave andKarst Research Institute, Carlsbad, NM, p. 113-121.http://scholarcommons.usf.edu/cgi/viewcontent.cgi?article=1119&context=sinkhole_2013
Land, L, 2021, Evaporite karst as a transportation andinfrastructure geohazard in the lower Pecos Region,southeasternNewMexico andwest Texas, in Johnson,K.S., Land, L., andDecker, D.D., eds., Evaporite karstin the Greater Permian Evaporite Basin (GPEB) of
Texas, New Mexico, Oklahoma, Kansas, and Colo-rado: Oklahoma Geological Survey, Circular 113.
Land, L., and Aster, R., 2009, Seismic recordings of ananthropogenic sinkhole collapse, in Proceedings ofthe Symposium on the Application of Geophysicsto Engineering and Environmental Problems: Envi-ronmental and Engineering Geophysical Society,2009 Annual Meeting, Fort Worth, Texas, p. 511-519. http://www.nckri.org/research/applied_science/Sinkhole_Collapse.pdf
Land, L., Cikoski, C.K., and Veni, G., 2018a, Sinkholesas transportation and infrastructure geohazards inmixed evaporite-siliciclastic bedrock, southeasternNew Mexico, in Sasowsky, I.D., Byle, M.J., Land,L., eds., Proceedings of the Fifteenth Multidisciplin-ary Conference on Sinkholes and the Engineeringand Environmental Impact of Karst, Shepherdstown,WV. National Cave and Karst Research Institute Sym-posium 7. Carlsbad (NM): National Cave and KarstResearch Institute. p. 367-377.
Land, L., Cikoski, C., McCraw, D., and Veni, G., 2018b,Karst geohazards and geophysical surveys: US 285,Eddy County, New Mexico: National Cave andKarst Research Institute, Report of Investigations 7,89 p. http://www.nckri.org/about_nckri/investigations/NCKRI_RI-7%20screen%20quality.pdf
Land, L., and Veni, G., 2012, Electrical resistivity sur-veys of anthropogenic karst phenomena, southeasternNew Mexico: New Mexico Geology, Vol. 34, No. 4,p. 117-125. https://geoinfo.nmt.edu/publications/periodicals/nmg/34/n4/nmg_v34_n4_p117.pdf
Lefond, S.J., 1969, Handbook of world salt resources:Plenum Press, New York, 384 p.
Maley, V.L., and Huf!ngton, R.M., 1953, Cenozoic !lland evaporite solution in the Delaware Basin, Texasand New Mexico: Geological Society of America,Bulletin, Vol. 64, p. 539-546.
Marsden, R.W, and Lucas, J.R., 1973, Specializedunderground extraction systems, in Cummins, A.B.,and Given, I.A., eds., SME mining engineering hand-book: Society of Mining Engineers of American Insti-tute of Mining, Metallurgical, and PetroleumEngineers, Vol. 2, sec. 21, p. 1-118.
Martinez, J.D., Johnson, K.S., and Neal, J.T., 1998,Sinkholes in evaporite rocks: American Scientist,Vol. 86, No. 1 (January–February), p. 38-51. https://www.researchgate.net/publication/250968543
McGregor, D.R., Pendery, E.C., and McGregor, D.L.,1963, Solution caves in gypsum, north central Texas:Journal of Geology, Vol. 71, p. 108-115.
McLemore, V.T., 1999, Bottomless Lakes: NewMexicoGeology, Vol. 21, No. 2, p. 51-55. https://geoinfo.nmt
34 ,FOOFUI�4��+PIOTPO

.edu/publications/periodicals/nmg/21/n2/nmg_v21_n2_p51.pdf
Merriam, D.F., and Mann, C.J., 1957, Sinkholes andrelated geologic features in Kansas: Kansas Academyof Science, Transactions, Vol. 60, No. 3, p. 207-243.https://digital.lib.usf.edu/SFS0054165/00001
Myers, A.J., Gibson, A.M., Glass, B.P., and Patrick,C.R., 1969,Guide toAlabaster Cavern andWoodwardCounty, Oklahoma: Oklahoma Geological Survey,Guidebook 15, 38 p. http://ogs.ou.edu/docs/guidebooks/GB15.pdf
New Mexico Oil Conservation Division, no date, Gen-eral correspondence, Brine Well Work Group. http://ocdimage.emnrd.state.nm.us/Imaging/FileStore/santafeadmin/ao/73512/pcjc0906359521_1_ao.pdf
Osborn, N.I., and Eckenstein, E., 1997, Blaine gypsumgroundwater recharge demonstration project datareport: Oklahoma Water Resources Board, TechnicalReport 97–4, 308 p. https://www.owrb.ok.gov/studies/reports/reports_pdf/tr97_4_blaine_gypsum.pdf
Paine, J.G., Buckley, S., Collins, E.W.,Wilson, C.R., andKress,W., 2009, Assessing sinkhole potential at Winkand Daisetta, Texas, using gravimetry and radar inter-ferometry in Proceedings, 22nd Symposium on theApplication of Geophysics to Engineering and Envi-ronmental Problems, Fort Worth, Texas, March 29–April 2, p. 480–488. https://pdfs.semanticscholar.org/e0bd/01cdae36f445dc27f4e4e95e6cf6ac6e9ac1.pdf?_ga=2.11563440.58905847.1566680052-1121615753.1564344073
Paine, J.G., Costard, L., Andrews, J., Averett, A.,Saylam, K., and Hupp, J., 2021, Determiningannual to decadal subsidence areas and rates usingairborne Lidar, GPS surveys, and topographic mapsat the Wink Sinkholes, west Texas, in Johnson,K.S., Land, L., and Decker, D.D., eds., Evaporitekarst in the Greater Permian Evaporite Basin(GPEB) of Texas, New Mexico, Oklahoma, Kan-sas, and Colorado: Oklahoma Geological Survey,Circular 113.
Powers, D.W., and Holt, R.M., 2021, Evaporite dissolu-tion and the Waste Isolation Pilot Plant (WIPP) in thenorthern Delaware Basin, southeastern New Mexico,in Johnson, K.S., Land, L., and Decker, D.D., eds.,Evaporite karst in the Greater Permian EvaporiteBasin (GPEB) of Texas, New Mexico, Oklahoma,Kansas, and Colorado: Oklahoma GeologicalSurvey, Circular 113.
Payton, C.C., 1992, Geotechnical investigation andfoundation design for the reconstruction of QuailCreekDike, inHarty,K.M., ed., Engineering and envi-ronmental geology of southwestern Utah: UtahGeological Association, Publication 21, p. 39-51.
Payton, C.C., and Hansen, M.N., 2003, Gypsum karst insouthwesternUtah: failure and reconstruction ofQuailCreek Dike, in Johnson, K.S., and Neal, J.T., eds.,Evaporite karst and engineering/environmental prob-lems in the United States: Oklahoma GeologicalSurvey, Circular 109, p. 293-303. http://ogs.ou.edu/docs/circulars/C109.pdf
Pierce,W.G., and Rich, E.I., 1962, Summary of rock saltdeposits in the United States as possible storage sitesfor radioactive waste materials: U.S. Geological Sur-vey, Bulletin 1148, 91 p., 6 plates. https://pubs.er.usgs.gov/publication/b1148
Powers, D.W., 2003, Jal sinkhole in southeastern NewMexico: evaporite dissolution, drill holes, and thepotential for sinkhole development, in Johnson,K.S., and Neal, J.T., eds., Evaporite karst and engi-neering/environmental problems in the United States:Oklahoma Geological Survey, Circular 109, p. 219-226. http://ogs.ou.edu/docs/circulars/C109.pdf
Powers,D.W., andHolt, R.M., 2000, The salt thatwasn’tthere: mud"at facies equivalents to halite of the Perm-ian Rustler Formation, southeastern New Mexico:Journal Sedimentary Research, Vol. 70, No. 1,p. 29-36. https://www.researchgate.net/publication/240778734
Presley, M.W., 1981, Middle and Upper Permian salt-bearing strata of the Texas Panhandle: lithologic andfacies cross sections: The University of Texas at Aus-tin, Bureau of Economic Geology, Cross SectionsCS0003, 10 p. 7 cross sections.
Preston, D.A., 1980a, Bursting natural-gas bubble,Woods County, Oklahoma: Oklahoma GeologyNotes, Vol. 40, No. 1, p. 1-2. http://ogs.ou.edu/docs/geologynotes/GN-V40N1.pdf
Preston, D.A., 1980b, Gas eruptions taper off: Geotimes,Vol. 25, No. 10, p. 18-20.
Quinlan, J.F., Smith, R.A., Johnson, K.S., 1987, Gyp-sum karst and salt karst of the United States of Amer-ica, in Atti symposio internationale sul carsismo nelleevaporiti (Proceedings, international symposium onkarst in evaporites), Palermo, Italy, October 27–30,1985: Le Grotte d’Italia, Series 4, Vol. 13, p. 73-92.
Rahn, P.H., and Davis, A.D., 1996, Gypsum foundationproblems in the Black Hills area, South Dakota: Envi-ronmental and Engineering Geoscience, Vol. II, No. 2,p. 213-223.
Rawling, and McCraw, 2010, Geologic map of theBottomless Lakes quadrangle, Chaves County, NewMexico: New Mexico Bureau of Mines and MineralResources, Open-!le Geologic Map 126, scale1:24,000. https://geoinfo.nmt.edu/publications/maps/geologic/ofgm/downloads/126/BottomlessLakes_v2p-00.pdf
Overview of Evaporite Karst in the Greater Permian Evaporite Basin (GPEB) 35

Reddell, J.R., and Russell, W.H., 1963, The caves ofnorthwest Texas: Texas Speleological Survey, Vol.1, No. 8, 56 p. https://www.texasspeleologicalsurvey.org/PDF/TSS_Volume1/TSS%201(8)%20compressed.pdf
Runkle, D.L., Bergman, D.L., and Fabian, R.S., 1997,Hydrologic data for the Blaine aquifer and associatedunits in southwestern Oklahoma and northwesternTexas: U.S. Geological Survey, Open-File Report97–50, 213 p. https://pubs.usgs.gov/of/1997/0050/report.pdf
Sares, S.W., Wells, S.G., 1987, Geomorphic and hydro-geologic development of the GypsumPlain karst, Del-aware Basin, New Mexico, in Powers, D.W., andJames, W.C., eds., Geology of the western DelawareBasin, West Texas and Southeastern New Mexico:El Paso Geological Society, Guidebook 18, p. 98-117.
Shi, Y., Tang, Y., Lu, Z., Kim, J-W., and Peng, J., 2019,Subsidence of sinkholes inWink, Texas, from 2007 to2011 detected by time-series InSAR analysis: Geo-matics, Natural Hazards and Risk, Vol. 10, No. 1,p.1125-1138. https://www.researchgate.net/publication/331174035
Smith, G.I., Jones, C.L., Cubertson, W.C, Ericksen,G.E., and Dyni, J.R., 1973, Evaporites and brines,in Brobst, D.A., and Pratt, W.D., eds., United Statesmineral resources: U.S. Geological Survey, Profes-sional Paper 820, p. 197-216. https://pubs.usgs.gov/pp/0820/report.pdf
Stafford, K.W., 2013, Evaporite karst and hydrogeologyof the Castile Formation: Culberson County, Texas,and Eddy County, New Mexico, in Land, L., Doctor,D.H., and Stephenson, J.B., eds., Sinkholes and theengineering and environmental impacts of karst–Proceedings of the thirteenthmultidisciplinary confer-ence, Carlsbad, NM, May 6 through 10, 2013:National Cave and Karst Research Institute, Carlsbad,NM, p. 123-131. https://pdfs.semanticscholar.org/fa26/e653bc2c3ae95007f83dde9a1d4eab38211d.pdf
Stafford, K.W., andNance, R., 2009, TheGypsumPlain ofsoutheasternNewMexico and farwest Texas: inPalmer,A., and Palmer, M., eds., Caves and karst of the USA:Huntsville, Alabama, National Speleological Society,p. 267-272.
Stafford, K.W., and Nance, R.G., 2018, Evaporite karstof west Texas: Delaware Basin, in Stafford, K.W., andVeni, G., eds., Hypogene karst of Texas: Texas Spele-ological Survey, Monograph 3, p. 36-50. https://www.texasspeleologicalsurvey.org/PDF/Hypogene_Karst_of_Texas.pdf
Stafford, K.W., Nance, R., Rosales-Lagarde, L., andBoston, P.J., 2008a, Epigene and hypogene gypsumkarst manifestations of the Castile Formation: Eddy
County, New Mexico and Culberson County, Texas:International Journal of Speleology, Vol. 37, No. 2,p. 83-98. https://www.researchgate.net/publication/26500041
Stafford, K.W., Rosales-Lagarde, L., and Boston, P.J.,2008b, Castile evaporite karst potential map of theGyp-sum Plain, Eddy County, New Mexico and CulbersonCounty, Texas: A GIS methodological comparison:Journal of Cave and Karst Studies, Vol. 70, No. 1,p. 35-46. https://scholarworks.sfasu.edu/cgi/viewcontent.cgi?article=1013&context=geology
Stafford, K.W., Brown, W.A., Ehrhart, J.T., Majzoub,A.F., andWoodard, J.D., 2017, Evaporite karst geoha-zards in the Delaware Basin, Texas: review of tradi-tional karst studies coupled with geophysical andremote sensing characterization: International Journalof Speleology, Vol. 46, No. 2, p. 169-180. https://doi.org/10.5038/1827-806X.46.2.2089
Steele C.E., and Barclay, J.E., 1965, Ground-water re-sources of Harmon County and adjacent parts of Greerand Jackson Counties, Oklahoma: Oklahoma WaterResources Board, Bulletin 29, 96 p.
Suneson, N.H., 2012, Custer County oysters: OklahomaCity Geological Society, Shale Shaker, Vol. 62, No. 6,p. 422-429. http://www.ogs.ou.edu/pdf/ShaleShakerOYSTERS2012.pdf
Trentham, R.C., and Henderson, M.A., 2021, Assessingcollapse risk in evaporite sinkhole-prone areas usingcommonly available oil !eld data in the area of theWink Sinks, Winkler County, Texas, in Johnson,K.S., Land, L., andDecker, D.D., eds., Evaporite karstin the Greater Permian Evaporite Basin (GPEB) ofTexas, New Mexico, Oklahoma, Kansas, and Colo-rado: Oklahoma Geological Survey, Circular 113.
Vanderwater, B., 1980, Re-entry slated in suspect well:The Daily Oklahoman [newspaper], August 27, p. 23.
Walters, R.F., 1978, Land subsidence in central Kansasrelated to salt dissolution: Kansas Geological Survey,Bulletin 214, 82 p. http://www.kgs.ku.edu/Publications/Bulletins/214/index.html
Walters, R.F., 1991, Gorham oil !eld, Russell County,Kansas: Kansas Geological Survey Bulletin 228,111 p. http://www.kgs.ku.edu/Publications/Bulletins/228/Bull228.pdf
Ward, P.E., 1961, Geology and ground-water features ofsalt springs, seeps, and plains in the Arkansas and RedRiver basins of western Oklahoma and adjacent partsof Kansas and Texas: U.S. Geological Survey, Open-File Report 63–132, 94 p. https://pubs.er.usgs.gov/publication/ofr63132
Watney,W.L., and Paul, S.E., 1980, Maps and cross sec-tions of the Lower Permian Hutchinson Salt Member
36 ,FOOFUI�4��+PIOTPO

in Kansas: Kansas Geological Survey, Open-FileReport 80–7, 11 p., 9 maps, 3 cross sections.
Watney, W.L., Berg, J.A., and Paul, S.E., 1988, Originand distribution of the Hutchinson Salt Member(lower Leonardian) in Kansas, in Morgan, W.A.,and Babcock, J.A., eds, Permian rocks of the Mid-Continent: Society of Economic Paleontologists andMineralogists,Midcontinent Section, Special Publica-tion 1, p. 113-135.
Watney, W.L., Nissen, S.E., Bhattacharya, S., andYoung, D., 2003, Evaluation of the role of evaporitekarst in the Hutchinson, Kansas, gas explosions,January 17 and 18, 2001, in Johnson, K.S., andNeal, J.T., eds., Evaporite karst and engineering/envi-ronmental problems in the United States: OklahomaGeological Survey, Circular 109, p. 119-147. http://ogs.ou.edu/docs/circulars/C109.pdf
Weber, R.H., andKottlowski, F.E., 1959,Gypsum resour-ces of NewMexico: NewMexicoBureau ofMines andMineral Resources, Bulletin 68, 68 p. https://geoinfo.nmt.edu/publications/monographs/bulletins/68/
Withington, C.F., 1962, Gypsum and anhydrite in theUnited States, exclusive of Alaska and Hawaii: U.S.Geological Survey, Mineral Investigations ResourceMap MR–33.
Withington, C.F., and Jaster, M.C., 1960, Selected anno-tated bibliography of gypsum and anhydrite in theUnited States and Puerto Rico: U.S. Geological Sur-vey, Bulletin 1105, 126 p. https://pubs.usgs.gov/bul/1105/report.pdf
Young, J., and Beard, J., 1993, Caves in Kansas: KansasGeological Survey, Educational Series 9, 48 p.
Overview of Evaporite Karst in the Greater Permian Evaporite Basin (GPEB) 37


ABSTRACT.—The Greater Permian Evaporite Basin (GPEB) (Johnson, 2021) isa composite of the Anadarko, Dalhart, Delaware, Denver, Estancia, Las Vegas,Midland, Palo Duro, Raton, Salina, Tatum, Tucumcari, and Val Verde sedimentarybasins and the Hugoton Embayment; it underlies an area of about 278,000 mi2
(720,000 km2) in Texas, New Mexico, Oklahoma, Kansas, and Colorado.Evaporite-rich formations within the basin typically occur at depths of 30 to
1300 ft (10 to 400 m). This area is important for the exploration and developmentof energy and other natural resources. Knowledge of the extent of both surface andsubsurface evaporite rocks is critical to mitigating collapse hazards for manyhuman activities including siting of hydrocarbon exploration and distributionequipment, the location of wind turbine tower sites, pipelines, and transportationcorridors. Evaporite mineral-bearing rocks with potential for karst development inthe Permian Basin include the Blaine, Briggs, Castile, Gatuna, Malone, Quarter-master, Rustler, Salado, and San Angelo Formations, the Dewey Lake Redbeds,and the Clear Fork and Whitehorse Groups in Texas; the Castile, Grayburg, Queen,Salado, Seven Rivers, Yates, Tansill, and Yeso Formations, and the Artesia, Chinle,and San Rafael Groups in NewMexico; the Blaine, Cloud Chief, Marlow, and RushSprings Formations, Dog Creek and Flowerpot Shales, and the El Reno and White-horse Groups in Oklahoma; the Lykins, Morrison, and Ralston Creek Formationsin Colorado; and the Big Basin Formation, and Nippewalla and Sumner Groups inKansas.
The U.S. Geological Survey (USGS) produced a report and digital database onthe nationwide extent of rocks at the earth’s surface with the potential for the devel-opment of karst features as USGS Open-File Report 2014-1156 (Weary and Doctor,2014). The delineation of rock units with potential evaporites is based on analysisand compilation of State geologic map data at various resolutions. The databasecontains information on lithostratigraphic unit names, gross lithology, age, wet ver-sus dry climate setting, and ecoregions. This report also includes a rough delinea-tion of areas potentially underlain by evaporite rocks and the main evaporite basins.
INTRODUCTION
The Greater Permian Evaporite Basin (GPEB) com-prises one of the largest volumes of evaporite rocks inthe contiguous United States (Figure 1). The basin, acomposite of the Anadarko, Dalhart, Delaware, Denver,Estancia, Las Vegas, Midland, Palo Duro, Raton,Salina, Tatum, Tucumcari, and Val Verde sedimentarybasins and the Hugoton Embayment underlies an areaof about 278,000 mi2 (721,000 km2) in Texas, NewMexico, Oklahoma, Kansas, and Colorado (Figure 2).
Evaporite-rich formations within the basin typicallyoccur at depths of 30 to 1300 ft (10 to 400 m) andcrop out locally, in up-dip basin margin areas.
Karst features in the GPEB, both at the surface and inthe subsurface, affect human activities including housingdevelopment, transportation and energy transmissioncorridors, pipelines, energy resource extraction, andmineral commodity mining (Figure 3).
This region is one of themost productive in theUnitedStates for both hydrocarbon extraction and wind energygeneration. Widespread subsurface drainage of meteoric
Weary, D. J.; andDoctor, D. H., 2021, Evaporite Karst in the Greater Permian Evaporite Basin of Texas, NewMexico,Oklahoma, Kansas, and Colorado as Delineated by USGS Karst Mapping, in Johnson, K. S.; Land, Lewis; andDecker, D. D. (eds.), Evaporite Karst in the Greater Permian Evaporite Basin (GPEB) of Texas, New Mexico,Oklahoma, Kansas, and Colorado: Oklahoma Geological Survey, Circular 113, p. 39-49.
0LMBIPNB�Geological�Survey�Circular�113,�2021
Evaporite�Karst�in�the�Greater�Permian�Evaporite�Basin�of�Texas,�New�Mexico,�Oklahoma,�Kansas,�and�Colorado�as�Delineated�by�USGS�Karst�Mapping
David�J.�Weary�and�Daniel�H.�DoctorFlorence�Bascom�Geoscience�Center,�U.S.�Geological�Survey,�Reston,�Virginia
39
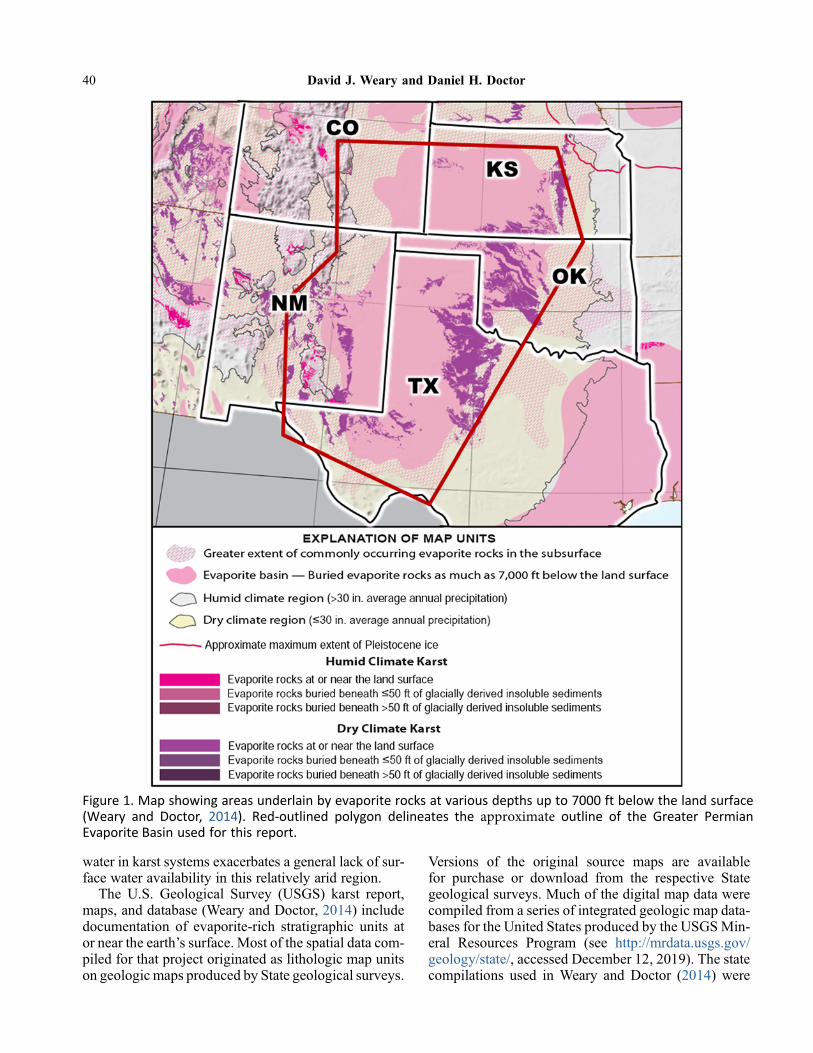
water in karst systems exacerbates a general lack of sur-face water availability in this relatively arid region.
The U.S. Geological Survey (USGS) karst report,maps, and database (Weary and Doctor, 2014) includedocumentation of evaporite-rich stratigraphic units ator near the earth’s surface. Most of the spatial data com-piled for that project originated as lithologic map unitson geologic maps produced by State geological surveys.
Versions of the original source maps are availablefor purchase or download from the respective Stategeological surveys. Much of the digital map data werecompiled from a series of integrated geologic map data-bases for the United States produced by the USGSMin-eral Resources Program (see http://mrdata.usgs.gov/geology/state/, accessed December 12, 2019). The statecompilations used in Weary and Doctor (2014) were
Figure�1.�Map�showing�areas�underlain�by�evaporite�rocks�at�various�depths�up�to�7000�ft�below�the�land�surface(Weary� and� Doctor,� 2014).� Red-outlined� polygon� delineates� the� BQQSPYJNBUF� outline� of� the� Greater� Permian�Evaporite�Basin�used�for�this�report.
40 David J. Weary and Daniel H. Doctor

data from the 2013Mineral Resources Program publica-tion and have since been revised and superseded (Hortonand others, 2017).
POTENTIALLY KARSTIC EVAPORITE-BEARING LITHOSTRATIGRAPHIC UNITS OFTHE GREATER PERMIAN EVAPORITE BASIN
In the classi!cation of potentially karstic rocksde!ned by Weary and Doctor (2014), lithostratigraphicmap units were designated as either carbonate orevaporite-bearing based on their component lithologiesas described in the various State geologic map compila-tions (U.S. Geological Survey, 2013). Because some ofthese units contain both carbonate and evaporite rocks,some units that contain signi!cant amounts of evaporiterocks were included in the carbonate classi!cation.These units are noted in the discussion to follow.Many of the map units in either the evaporite or carbon-ate groups are comprised ofmixed lithologies and signif-icant portions of them may be clastic, non-karstic rocks.
As a result of varying degrees of solutional porositywithin units of mixed lithologies, our designation ofevaporite-bearing karstic units may differ slightly fromthose of other workers in the GPEB region; for example,see the paper by Johnson (2021).
The Southern Part of the GreaterPermian Evaporite Basin
Lithostratigraphic units bearing evaporite rocks withthe potential for the development of karst features in thesouthern part of the GPEB (Figure 2) range in age fromPennsylvanian toHolocene (Table 1).Most of these unitsare Permian in age; however, there are some youngerevaporite-bearing deposits including the Upper JurassicMalone Formation and Pleistocene to Holocene alkali"ats, bolson, and caliche deposits.
In southeastern NewMexico (Figure 2, areas 1 and 2;Table 1), map units classi!ed as chie"y carbonates ratherthan evaporites (Weary and Doctor, 2014) include thePennsylvanian Panther Seep Formation; the PermianRustler, and San Andres Formations, undivided; theSan Andres Limestone and Glorieta Sandstone, undi-vided; and the Yeso Formation, Glorieta Sandstone,and San Andres Limestone, undivided. The PantherSeep Formation is described in the New Mexico Stategeologic map compilation as !ne-grained mixed clastic,limestone, and evaporite. The Rustler Formation and theSan Andres Formation are both described as carbonate,!ne-grained mixed clastic, and evaporite. The Yeso For-mation is described as sandstone, carbonate,!ne-grainedmixed clastic, and evaporite.
Northeastern New Mexico and thePalo Duro and Hardeman–Hollis Basins
In northeastern New Mexico and the Palo Duro andHardeman–Hollis Basins in northern Texas andOklahoma (Figure 2, areas 4–6), map units containingevaporite rocks range in age from Permian to Triassic
Figure 2. Map showing areas underlain by evaporiterocks (magenta, pink, and purple colors) at or nearthe land surface (Weary and Doctor, 2014), and themajor constituent basins in the Greater Permian Evap-orite Basin (GPEB). Red-outlined polygon delineates thearbitrary boundary of the GPEB for this report. Exagger-ated surface topography (blueish and brown tones) isgenerated from the USGS National Elevation Dataset(NED). Exaggerated subsurface basin topography (gray-shaded depressions) generated from unpublished esti-mates is compiled from multiple publicly availablesources.
Figure 3. Early stages of remediation of collapse into theHutchinson Salt Member of the Wellington Formation,near Hutchinson, Kansas. The Wellington Formationoccurs only in the subsurface in the Greater PermianEvaporite Basin, and is not represented among themap units in Weary and Doctor (2014). This collapseaffected major railroad and highway corridors. 2005photograph (D. Weary, USGS).
Evaporite Karst in the Greater Permian Evaporite Basin of Texas, New Mexico, Oklahoma, Kansas 41
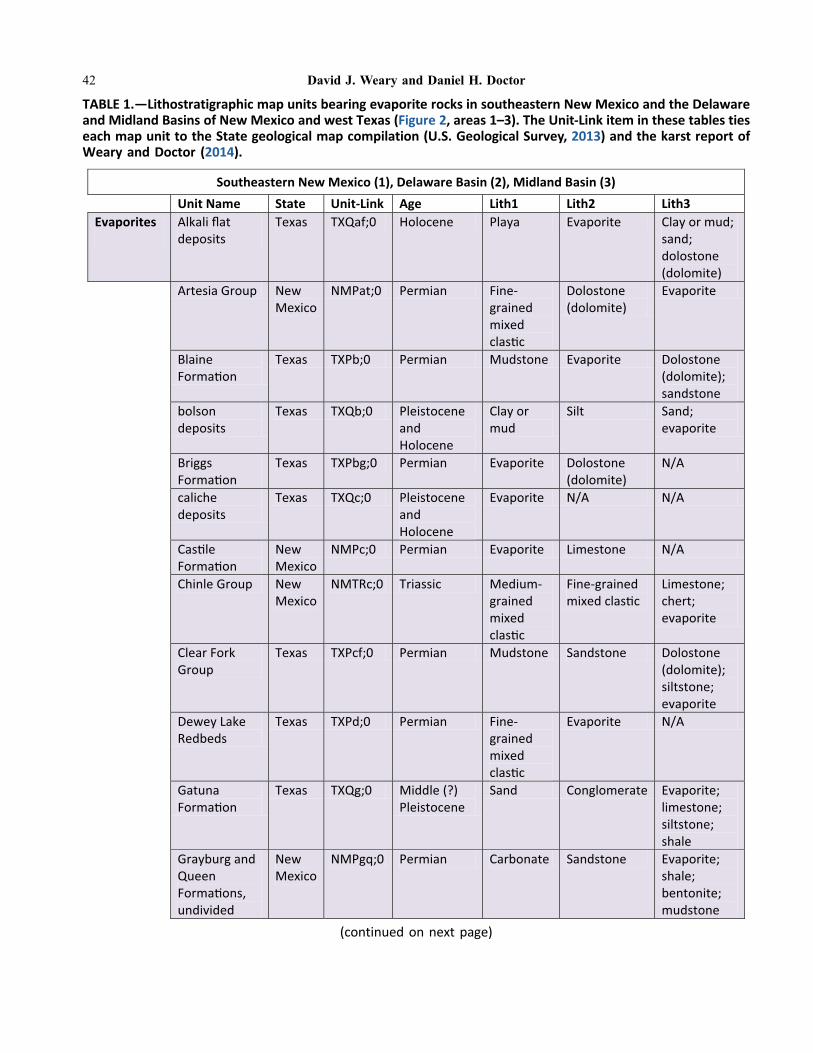
TABLE 1.—Lithostratigraphic map units bearing evaporite rocks in southeastern New Mexico and the Delawareand Midland Basins of New Mexico and west Texas (Figure 2, areas 1–3). The Unit-Link item in these tables tieseach map unit to the State geological map compilation (U.S. Geological Survey, 2013) and the karst report ofWeary and Doctor (2014).
Southeastern New Mexico (1), Delaware Basin (2), Midland Basin (3)
Unit Name State Unit-Link Age Lith1 Lith2 Lith3Evaporites Alkali flat
depositsTexas TXQaf;0 Holocene Playa Evaporite Clay or mud;
sand; dolostone (dolomite)
Artesia Group New Mexico
NMPat;0 Permian Fine-grained mixed clas!c
Dolostone (dolomite)
Evaporite
Blaine Forma!on
Texas TXPb;0 Permian Mudstone Evaporite Dolostone (dolomite); sandstone
bolson deposits
Texas TXQb;0 Pleistocene and Holocene
Clay or mud
Silt Sand; evaporite
Briggs Forma!on
Texas TXPbg;0 Permian Evaporite Dolostone (dolomite)
N/A
caliche deposits
Texas TXQc;0 Pleistocene and Holocene
Evaporite N/A N/A
Cas!le Forma!on
New Mexico
NMPc;0 Permian Evaporite Limestone N/A
Chinle Group New Mexico
NMTRc;0 Triassic Medium-grained mixed clas!c
Fine-grained mixed clas!c
Limestone; chert; evaporite
Clear Fork Group
Texas TXPcf;0 Permian Mudstone Sandstone Dolostone (dolomite); siltstone; evaporite
Dewey Lake Redbeds
Texas TXPd;0 Permian Fine-grained mixed clas!c
Evaporite N/A
Gatuna Forma!on
Texas TXQg;0 Middle (?) Pleistocene
Sand Conglomerate Evaporite; limestone; siltstone; shale
Grayburg and Queen Forma!ons, undivided
New Mexico
NMPgq;0 Permian Carbonate Sandstone Evaporite; shale; bentonite; mudstone
(continued on next page)
42 David J. Weary and Daniel H. Doctor
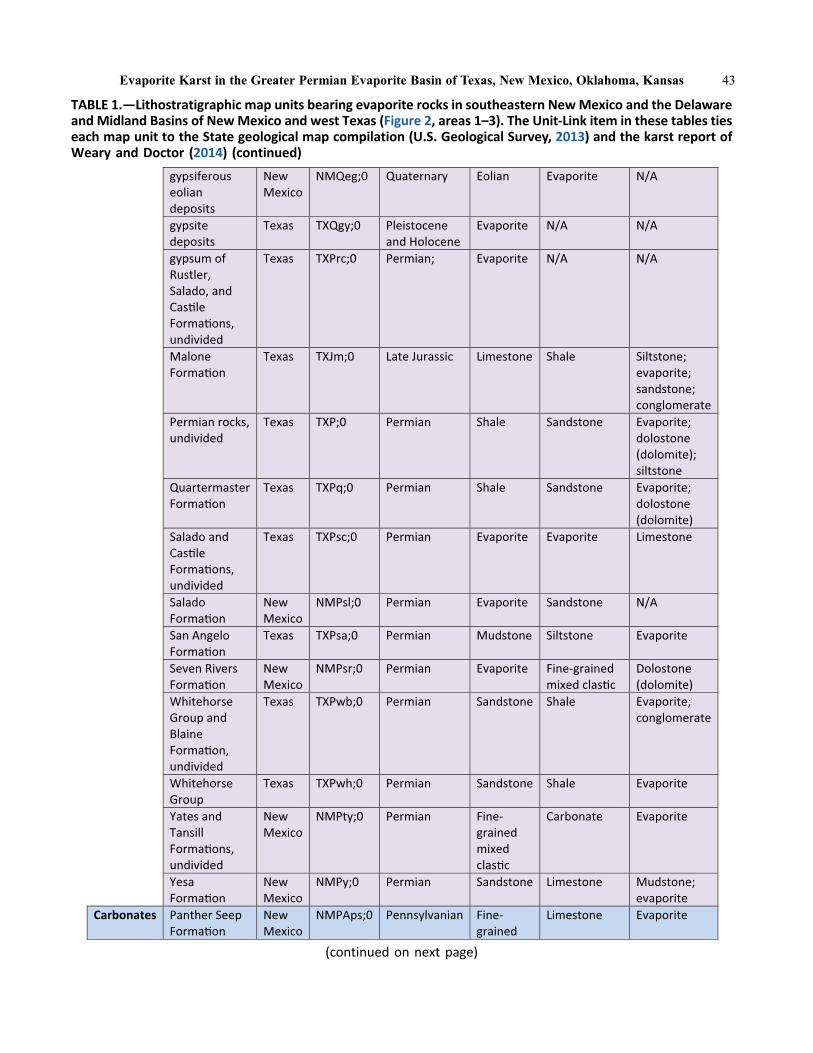
TABLE 1.—Lithostratigraphic map units bearing evaporite rocks in southeastern NewMexico and the Delawareand Midland Basins of NewMexico and west Texas (Figure 2, areas 1–3). The Unit-Link item in these tables tieseach map unit to the State geological map compilation (U.S. Geological Survey, 2013) and the karst report ofWeary and Doctor (2014) (continued)
gypsiferouseoliandeposits
NewMexico
NMQeg;0 Quaternary Eolian Evaporite N/A
gypsitedeposits
Texas TXQgy;0 Pleistoceneand Holocene
Evaporite N/A N/A
gypsum ofRustler,Salado, andCas!leForma!ons,undivided
Texas TXPrc;0 Permian; Evaporite N/A N/A
MaloneForma!on
Texas TXJm;0 Late Jurassic Limestone Shale Siltstone;evaporite;sandstone;conglomerate
Permian rocks,undivided
Texas TXP;0 Permian Shale Sandstone Evaporite;dolostone(dolomite);siltstone
QuartermasterForma!on
Texas TXPq;0 Permian Shale Sandstone Evaporite;dolostone(dolomite)
Salado andCas!leForma!ons,undivided
Texas TXPsc;0 Permian Evaporite Evaporite Limestone
SaladoForma!on
NewMexico
NMPsl;0 Permian Evaporite Sandstone N/A
San AngeloForma!on
Texas TXPsa;0 Permian Mudstone Siltstone Evaporite
Seven RiversForma!on
NewMexico
NMPsr;0 Permian Evaporite Fine-grainedmixed clas!c
Dolostone(dolomite)
WhitehorseGroup andBlaineForma!on,undivided
Texas TXPwb;0 Permian Sandstone Shale Evaporite;conglomerate
WhitehorseGroup
Texas TXPwh;0 Permian Sandstone Shale Evaporite
Yates andTansillForma!ons,undivided
NewMexico
NMPty;0 Permian Fine-grainedmixedclas!c
Carbonate Evaporite
YesaForma!on
NewMexico
NMPy;0 Permian Sandstone Limestone Mudstone;evaporite
Carbonates Panther SeepForma!on
NewMexico
NMPAps;0 Pennsylvanian Fine-grained
Limestone Evaporite
(continued on next page)
Evaporite Karst in the Greater Permian Evaporite Basin of Texas, New Mexico, Oklahoma, Kansas 43

(Table 2). The Triassic Chinle Group and the JurassicSan Rafael Group in New Mexico are chie"y clasticrocks, but also contain minor amounts of evaporitesand may be locally, marginally karstic.
All karstmap units in this region (Figure 2, areas 4–6),except for the SanAndres Formation and the SanAndresFormation and Glorieta Sandstone, undivided, in NewMexico were classi!ed as evaporite karst (Weary andDoctor, 2014). These two map units were classi!ed asa chie"y carbonate based on their lithologic descriptionin the State geologic map compilation (U.S. GeologicalSurvey, 2013) listing carbonate constituent in predomi-nance before evaporite.
Dalhart and Anadarko Basins
In the Dalhart and Anadarko Basins in New Mexico,Texas, Oklahoma, and Kansas (Figure 2, areas 7–9),map units containing evaporite rocks range in agefrom Permian to Holocene (Table 3). Most of these unitsare Permian in age; however, there are some youngerevaporite-bearing deposits including the Triassic ChinleGroup in New Mexico, and Pleistocene to Holocenecaliche deposits in Texas. The potentially karstic unitsin this region were classi!ed as evaporite-bearing ratherthan carbonate by Weary and Doctor (2014).
South Denver Basin, HugotonEmbayment, and the Salina Basin
In theDenverBasin,HugotonEmbayment, andSalinaBasin of NewMexico, Colorado, Oklahoma, andKansas(Figure 2, areas 10–12), map units containing evaporiterocks range in age from possibly Pennsylvanian to Juras-sic (Table 4). Most of these units are Permian in age;however, there are some younger evaporite-bearingdeposits including the Triassic Chinle Group in NewMexico; Mesozoic and Paleozoic rocks, undifferenti-ated, the Permian–Triassic Lykins Formation, and theJurassic Morrison and Ralston Creek Formations, undi-vided in Colorado. The potentially karstic units in thisregion were classi!ed as evaporite-bearing rather thancarbonate by Weary and Doctor (2014).
U.S. GEOLOGICAL SURVEYKARST MAP UPDATES
Future update and revision of the open-!le report onpotentially karstic rocks in the United States (Weary andDoctor, 2014) is planned. It will include re!nement in theclassi!cation of karst areas to re"ect known occurrencesof caves (e.g., Weary and Doctor, 2018) and the relativedensity of closed depressions at the land surface (Doctorand others, 2020, in press). Expansion of geographic
TABLE 1.—Lithostratigraphic map units bearing evaporite rocks in southeastern NewMexico and the Delawareand Midland Basins of NewMexico and west Texas (Figure 2, areas 1–3). The Unit-Link item in these tables tieseach map unit to the State geological map compilation (U.S. Geological Survey, 2013) and the karst report ofWeary and Doctor (2014) (continued)
mixedclas!c
RustlerForma!on
NewMexico
NMPr;0 Permian Carbonate Fine-grainedmixed clas!c
Evaporite
San AndresForma!on
NewMexico
NMPsa;0 Permian Carbonate Fine-grainedmixed clas!c
Evaporite
San AndresLimestone andGlorietaSandstone,undivided
NewMexico
NMPsg;0 Permian Fine-grainedmixedclas!c
Carbonate Evaporite
Yeso, Glorieta,and SanAndresForma!ons,undivided
NewMexico
NMPys;0 Permian Sandstone Carbonate Fine-grainedmixed clas!c;evaporite
44 David J. Weary and Daniel H. Doctor

TABLE 2.—Lithostratigraphic map units bearing evaporite rocks in northeastern NewMexico, the Palo Duro andHardeman–Hollis Basins in New Mexico, Texas, and Oklahoma (Figure 2, areas 4–6). The Unit-Link item in thesetables ties each map unit to the State geological map compilation (U.S. Geological Survey, 2013) and the karstreport of Weary and Doctor (2014).
Northeast New Mexico (4), Palo Duro Basin (5), Hardeman-Hollis Basin (6)
Unit Name State Unit-Link Age Lith1 Lith2 Lith3Evaporites Artesia Group New
MexicoNMPat;0 Permian Fine-grained
mixed clas!cDolostone(dolomite)
Evaporite
BlaineForma!on
Oklahoma OKPb;0 EarlyPermian
Evaporite Dolostone(dolomite)
Shale
BlaineForma!on
Texas TXPb;0 Permian Mudstone Evaporite Dolostone(dolomite);sandstone
calichedeposits
Texas TXQc;0 PleistoceneandHolocene
Evaporite N/A N/A
Chinle Group NewMexico
NMTRc;0 Triassic Medium-grainedmixed clas!c
Fine-grainedmixedclas!c
Limestone;chert;evaporite
Clear ForkGroup
Texas TXPcf;0 Permian Mudstone Sandstone Dolostone(dolomite);siltstone;evaporite
Dog CreekShale
Oklahoma OKPdc;0 EarlyPermian
Shale Sandstone Siltstone;dolostone(dolomite);evaporite
Elm ForkMember ofBlaineForma!on
Oklahoma OKPbe;0 EarlyPermian
Dolostone(dolomite)
Evaporite N/A
FlowerpotShale
Oklahoma OKPf;0 EarlyPermian
Shale Siltstone Dolostone(dolomite);evaporite;sandstone;conglomerate
Grayburg andQueenForma!ons,undivided
NewMexico
NMPgq;0 Permian Carbonate Sandstone Evaporite;shale;bentonite;mudstone
QuartermasterForma!on
Texas TXPq;0 Permian Shale Sandstone Evaporite;dolostone(dolomite)
QuartermasterForma!on andWhitehorse
Texas TXPqw;0 Permian Mixedclas!c/carbonate
Evaporite N/A
(continued on next page)
Evaporite Karst in the Greater Permian Evaporite Basin of Texas, New Mexico, Oklahoma, Kansas 45

coverage to include Guam and the islands of Rota andSaipan in the Commonwealth of Northern MarianaIslands is also planned.
Numerous comments and suggestions from represen-tatives of State geological surveys and academic karstexperts following the publication of the !rst report anddatabase (Weary and Doctor, 2014) were addressed.For example, modi!cations to the coverage for
Oklahoma and adjacent areas have been made basedon dialogue with Kenneth Johnson (Oklahoma Geolog-ical Survey). Map unit polygons based on earlier Stategeologic map compilations (USGS, 2013) will be up-dated to comply with the revised 2017 data (Hortonand others, 2017). We thank all of those who have pro-vided their feedback and suggestions for the improve-ment of the database.
TABLE 2.—Lithostratigraphic map units bearing evaporite rocks in northeastern New Mexico, the Palo Duroand Hardeman–Hollis Basins in New Mexico, Texas, and Oklahoma (Figure 2, areas 4–6). The Unit-Link item inthese tables ties each map unit to the State geological map compilation (U.S. Geological Survey, 2013) and thekarst report of Weary and Doctor (2014) (continued)
Group,undividedSan AngeloForma!on
Texas TXPsa;0 Permian Mudstone Siltstone Evaporite
San RafaelGroup
NewMexico
NMJsr;0 Jurassic Medium-grainedmixed clas!c
Fine-grainedmixedclas!c
Evaporite;limestone
Seven RiversForma!on
NewMexico
NMPsr;0 Permian Evaporite Fine-grainedmixedclas!c
Dolostone(dolomite)
Van VacterMember ofBlaineForma!on
Oklahoma OKPbv;0 EarlyPermian
Dolostone(dolomite)
Evaporite Shale
WhitehorseGroup
Oklahoma OKPwh;0 EarlyPermian
Sandstone Siltstone Dolostone(dolomite);evaporite;shale
WhitehorseGroup
Texas TXPwh;0 Permian Sandstone Shale Evaporite
Yates andTansillForma!ons,undivided
NewMexico
NMPty;0 Permian Fine-grainedmixed clas!c
Carbonate Evaporite
YesoForma!on
NewMexico
NMPy;0 Permian Sandstone Limestone Mudstone;evaporite
Carbonates San AndresForma!on
NewMexico
NMPsa;0 Permian Carbonate Fine-grainedmixedclas!c
Evaporite
San AndresLimestone andGlorietaSandstone,undivided
NewMexico
NMPsg;0 Permian Fine-grainedmixed clas!c
Carbonate Evaporite
46 David J. Weary and Daniel H. Doctor

TABLE 3.—Lithostratigraphicmap units bearing evaporite rocks in the Dalhart and Anadarko Basins inNewMexico,Texas, and Oklahoma (Figure 2, areas 7–9). The Unit-Link item in these tables ties each map unit to the State geo-logical map compilation (U.S. Geological Survey, 2013) and the karst report of Weary and Doctor (2014).
Dalhart Basin (7), Anadarko Basin West (8), Anadarko Basin East (9)
Unit Name State Unit- Age Lith1 Lith2 Lith3Evaporites Big Basin
Forma!onKansas KSPbd;0 Permian Sandstone Shale Siltstone;
dolostone(dolomite)
BlaineForma!on
Oklahoma OKPb;0 EarlyPermian
Evaporite Dolostone(dolomite)
Shale
BlaineForma!on
Texas TXPb;0 Permian Mudstone Evaporite Dolostone(dolomite);sandstone
caliche deposits Texas TXQc;0 PleistoceneandHolocene
Evaporite N/A N/A
Chinle Group NewMexico
NMTRc;0 Triassic Medium-grainedmixed clas!c
Fine-grainedmixedclas!c
Limestone;chert;evaporite
Cloud ChiefForma!on
Texas TXPcl;0 Permian Evaporite Shale Sandstone
Cloud ChiefForma!on
Oklahoma OKPcc;0 LatePermian
Shale Siltstone Sandstone;dolostone(dolomite);evaporite
Dog Creek Shale Oklahoma OKPdc;0 EarlyPermian
Shale Sandstone Siltstone;dolostone(dolomite);evaporite
El Reno Group Oklahoma OKPer;0 EarlyPermian
Shale Evaporite Dolostone(dolomite);sandstone;siltstone;conglomerate
Flowerpot Shale Oklahoma OKPf;0 EarlyPermian
Sandstone Siltstone Shale;evaporite;dolostone(dolomite)
MarlowForma!on
Oklahoma OKPm;0 EarlyPermian
Sandstone Siltstone Shale;evaporite;dolostone(dolomite)
NippewallaGroup
Kansas KSPwn;0 LatePermian
Siltstone Sandstone Shale;evaporite
Permian rocks,undi"eren!ated
Oklahoma OKPu;0 LatePermian toEarlyPermian
Shale Sandstone Siltstone;limestone;dolostone(dolomite);evaporite
QuartermasterForma!on andWhitehorseGroup,undivided
Texas TXPqw;0 Permian Mixedclas!c/carbonate
Evaporite N/A
(continued on next page)
Evaporite Karst in the Greater Permian Evaporite Basin of Texas, New Mexico, Oklahoma, Kansas 47

TABLE 3.—Lithostratigraphic map units bearing evaporite rocks in the Dalhart and Anadarko Basins in NewMexico,Texas, and Oklahoma (Figure 2, areas 7–9). The Unit-Link item in these tables ties each map unit to the State geo-logical map compilation (U.S. Geological Survey, 2013) and the karst report ofWeary and Doctor (2014) (continued)
Rush SpringsForma!on
Oklahoma OKPr;0 EarlyPermian
Sandstone Evaporite Dolostone(dolomite);shale
WeatherfordGypsum Bed ofRush SpringsForma!on
Oklahoma OKPrw;0 EarlyPermian
Evaporite Dolostone(dolomite)
N/A
WhitehorseGroup
Oklahoma OKPwh;0 EarlyPermian
Sandstone Siltstone Dolostone(dolomite);evaporite;shale
Carbonates N/A
TABLE 4.—Lithostratigraphic map units bearing evaporite rocks in the Denver Basin, Hugoton Embayment, andSalina Basin in New Mexico, Colorado, Oklahoma, and Kansas (Figure 2, areas 10–12). The Unit-Link item inthese tables ties each map unit to the State geological map compilation (U.S. Geological Survey, 2013) andthe karst report of Weary and Doctor (2014).
Denver Basin South (10), Hugoton Embayment (11), Salina Basin (12)
Unit Name State Unit-Link Age Lith1 Lith2 Lith3Evaporites Chinle Group New
MexicoNMTRc;0 Triassic Medium-
grainedmixedclas!c
Fine-grainedmixedclas!c
Limestone;chert;evaporite
Flowerpot Shale Oklahoma OKPf;0 Early Permian Shale Siltstone Dolostone(dolomite);evaporite;sandstone;conglomerate
LykinsForma!on
Colorado COTRPl;0 Triassic-Permian Siltstone Shale Limestone
LykinsForma!on andLyonsSandstone,undivided
Colorado COTRPll;0 Triassic-Permian Sandstone Mudstone Limestone
Mesozoic andPaleozoic rocks,undi"eren!ated
Colorado COMZPZ;0 Mesozoic- Pennsylvanian
Clas!c Evaporite N/A
Morrison andRalston CreekForma!ons,undivided
Colorado COJmr;0 Jurassic Mudstone Sandstone Limestone;evaporite
NippewallaGroup
Kansas KSPwn;0 Late Permian Shale;evaporite
Sandstone Shale;evaporite
Sumner Group Kansas KSPs;0 Late Permian Shale Limestone Siltstone;dolostone(dolomite);evaporite
Carbonates N/A
48 David J. Weary and Daniel H. Doctor

REFERENCES
Doctor, D.H., Jones, J., Wood, N., Falgout, J., andRapstine, N.I., 2020, Progress toward a preliminarykarst depression density map for the conterminousUnited States, in Land. L., Byle, M., and Kromhout,C., eds., Proceedings of the 16th MultidisciplinaryConference on Sinkholes and the Engineering andEnvironmental Impacts of Karst, April 20-24, 2020,San Juan, Puerto Rico, National Cave and KarstResearch Institute, in press.
Horton, J.D., San Juan, C.A., and Stoeser, D.B., 2017,The State GeologicMapCompilation (SGMC) geoda-tabase of the conterminous United States (ver. 1.1,August 2017): U.S. Geological Survey, Data Series1052, 46 p. https://doi.org/10.3133/ds1052.
Johnson, K.S., 2021, Overview of evaporite karst in theGreater Permian Evaporite Basin (GPEB) of TX, NM,OK, KS, and CO, in Johnson, K.S., Land, L., andDecker, D.D., eds., Evaporite karst in the Greater
Permian Evaporite Basin of Texas, New Mexico,Oklahoma, Kansas, and Colorado: OklahomaGeological Survey, Circular 113.
U.S. Geological Survey, 2013, Geologic maps of U.S.States: U.S. Geological Survey, Mineral ResourcesProgram, Mineral Resources Online Spatial Data,accessed August 8, 2013, at http://mrdata.usgs.gov/geology/state/.
Weary, D.J., and Doctor, D.H., 2014, Karst in the UnitedStates: A digital map compilation and database: U.S.Geological Survey, Open-File Report 2014–1156,23 p. http://dx.doi.org/10.3133/ofr20141156
Weary, D.J. and Doctor, D.J., 2018, A Preliminary MapShowing the Distribution of Solution Caves inCarbonate and Evaporite-Bearing Geologic Units inThe United States: Geological Society of America,Abstracts with Programs, Vol. 50, No. 6. http://dx.doi.org/10.1130/abs/2018AM-320651
Evaporite Karst in the Greater Permian Evaporite Basin of Texas, New Mexico, Oklahoma, Kansas 49


ABSTRACT.—The Greater Permian Evaporite Basin contains several majorevaporite units consisting of salt (halite), gypsum, and/or anhydrite. They are in-terbedded mainly with red-bed shales, siltstones, and sandstones, as well as dolo-mites and limestones. These rocks are readily identi!ed in outcrops, but it can be achallenge to recognize some of them in boreholes, unless they have been cored.However, data about these evaporites can be gleaned from the many petroleum testsdrilled in the region, providing geophysical logs have been run through the evapo-rite formations encountered in the wells. The current report describes common logsmade in petroleum tests, and their usefulness in identifying evaporite beds in thesubsurface, because identifying the evaporite beds in subsurface can be critical toestablishing karstic areas where they have been partly or totally dissolved.
INTRODUCTION
Geophysical logs, also known as electric logs or wire-line logs, record characteristics of the rocks and "uidsencountered in drilling of a borehole.Over the years, log-ging tools have been developed to measure electrical,acoustic, natural gamma ray, and stimulated radioactiveresponse of rocks and "uids, and these data help geolo-gists and engineers understand the lithology, porosity,and "uid content of rocks in the subsurface. Most wellsdrilled in the Greater Permian Evaporite Basin (GPEB)(Johnson, 2021) not only seek information about thepresence of oil and gas, but they can also provide infor-mation on the presence and character of evaporite units.Unfortunately, in some parts of the GPEB, logs only pro-vide information on rocks in the deeper subsurface(where oil and gas typically occur), because some oper-ators do not log shallower Permian strata that contain theevaporites.
Where evaporite units are logged, information can beobtained as to their lithology, distribution, and thickness.Geologists can then determine if subsurface evaporiteunits contain dissolution/collapse features, or if theymay be a present or future problem for drilling opera-tions. Drilling problems include the unexpected dropof drill bits and loss of drilling "uids in dissolution cavi-ties, as well as the potential for excessive boreholeenlargement caused by unexpected dissolution of salt
beds; hole enlargement can affect proper casing place-ment and/or cementing of casing, and if the dissolutioncavity becomes too large, it could lead to a collapse ofoverlying strata and formation of a sinkhole.
The following discussion of interpreting geophysicallogs in evaporite units is based on the literature, aswell asthe author’s experience in studying evaporites in the sub-surface in various parts of the GPEB and other evaporitebasins of the United States. I appreciate very much thereview and excellent suggestions of Philip Schenewerkand Bruce Heath to an early draft of this report. Theircomments and suggestions have been incorporated,and they greatly improve the accuracy and clarity ofthe !nal text.
The example logs shown here represent most of themajor evaporite units in the GPEB (Figure 1): some ofthe lithologies shownwith the logs are based upon cores,and some are interpretations based upon general knowl-edge of the lithology from nearby cores, outcrops, ordescriptions in the literature. Many books and articleshave been released on the interpretation of geophysicallogs, but this brief article is presented here in the hopethat geologists not familiar with using such logs in theGPEB will see that their use can be understood andcan greatly enhance the subsurface study of evaporites,as well as the recognition and delineation of karstfeatures.
Johnson, K. S., 2021, Identi!cation of Gypsum, Anhydrite, and Salt on Geophysical Logs in the Greater PermianEvaporite Basin, in Johnson, K. S.; Land, Lewis; and Decker, D. D. (eds.), Evaporite Karst in the GreaterPermian Evaporite Basin (GPEB) of Texas, New Mexico, Oklahoma, Kansas, and Colorado: OklahomaGeological Survey, Circular 113, p. 51–61.
0LMBIPNB�Geological�Survey�Circular�113,�2021
Identi!cation�of�Gypsum,�Anhydrite,�and�Salt�on�Geophysical�Logsin�the�Greater�Permian�Evaporite�Basin
Kenneth�S.�JohnsonRetired�Geologist,�Oklahoma�Geological�Survey,
Norman,�Oklahoma
51
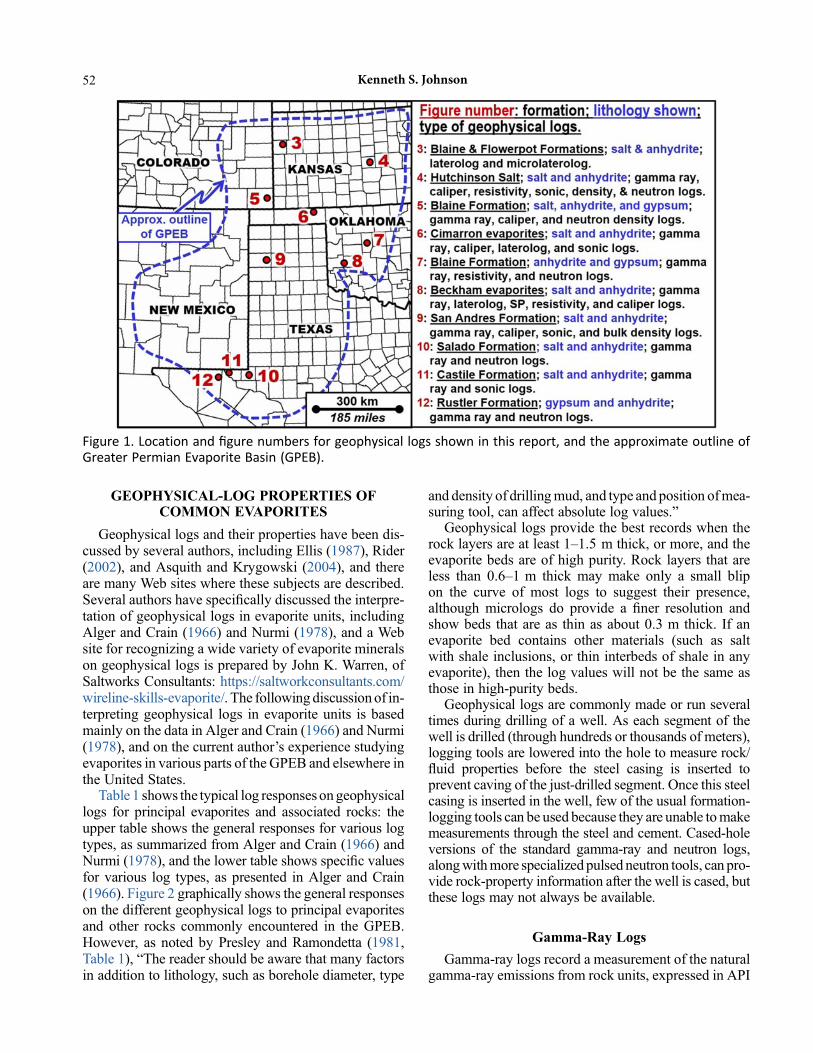
GEOPHYSICAL-LOG PROPERTIES OFCOMMON EVAPORITES
Geophysical logs and their properties have been dis-cussed by several authors, including Ellis (1987), Rider(2002), and Asquith and Krygowski (2004), and thereare many Web sites where these subjects are described.Several authors have speci!cally discussed the interpre-tation of geophysical logs in evaporite units, includingAlger and Crain (1966) and Nurmi (1978), and a Website for recognizing a wide variety of evaporite mineralson geophysical logs is prepared by John K. Warren, ofSaltworks Consultants: https://saltworkconsultants.com/wireline-skills-evaporite/. The followingdiscussion of in-terpreting geophysical logs in evaporite units is basedmainly on the data in Alger and Crain (1966) and Nurmi(1978), and on the current author’s experience studyingevaporites in various parts of the GPEB and elsewhere inthe United States.
Table 1 shows the typical log responses ongeophysicallogs for principal evaporites and associated rocks: theupper table shows the general responses for various logtypes, as summarized from Alger and Crain (1966) andNurmi (1978), and the lower table shows speci!c valuesfor various log types, as presented in Alger and Crain(1966). Figure 2 graphically shows the general responseson the different geophysical logs to principal evaporitesand other rocks commonly encountered in the GPEB.However, as noted by Presley and Ramondetta (1981,Table 1), “The reader should be aware that many factorsin addition to lithology, such as borehole diameter, type
and density of drillingmud, and type and position ofmea-suring tool, can affect absolute log values.”
Geophysical logs provide the best records when therock layers are at least 1–1.5 m thick, or more, and theevaporite beds are of high purity. Rock layers that areless than 0.6–1 m thick may make only a small blipon the curve of most logs to suggest their presence,although micrologs do provide a !ner resolution andshow beds that are as thin as about 0.3 m thick. If anevaporite bed contains other materials (such as saltwith shale inclusions, or thin interbeds of shale in anyevaporite), then the log values will not be the same asthose in high-purity beds.
Geophysical logs are commonly made or run severaltimes during drilling of a well. As each segment of thewell is drilled (through hundreds or thousands of meters),logging tools are lowered into the hole to measure rock/"uid properties before the steel casing is inserted toprevent caving of the just-drilled segment. Once this steelcasing is inserted in the well, few of the usual formation-logging tools can be used because they are unable tomakemeasurements through the steel and cement. Cased-holeversions of the standard gamma-ray and neutron logs,alongwithmore specialized pulsed neutron tools, can pro-vide rock-property information after the well is cased, butthese logs may not always be available.
Gamma-Ray Logs
Gamma-ray logs record a measurement of the naturalgamma-ray emissions from rock units, expressed in API
Figure 1. Location and !gure numbers for geophysical logs shown in this report, and the approximate outline ofGreater Permian Evaporite Basin (GPEB).
52 ,FOOFUI�4��+PIOTPO

(American Petroleum Institute) units. Gamma rays areemitted by rocks containing radioactive elements suchas uranium, thorium, and potassium-40 (40K, or K-40).All of these elements may be present in shales, and gen-erally to a lesser extent in sandstones. Shales typicallygenerate moderate to high gamma-ray emissions, chie"ybecause of the presence ofK-40,whereas clean sandstoneor carbonate formations have much lower gamma-rayemissions. Both radioactive and non-radioactive potas-sium commonly occur in sedimentary rocks, in mineralssuch as K-feldspars, biotite, muscovite, and illite.
K-40 is the main radioactive element associated withevaporite beds: 1) it is virtually absent from gypsum andanhydrite, which show very low gamma-ray emissions;2) it may be present in small to moderate amounts in salt(salt can contain some potassium from evaporatingPermian sea water), and thus most salt beds showsome gamma-ray emissions—particularly if there are
K-40-bearing shale inclusions in the salt; and 3) it isabundant in potash salts, such as sylvite and carnallite,which show very high gamma-ray emissions. Logsshowing potash salts are not included in this report;within the GPEB, potash salts are limited only to theCarlsbad potash district in Eddy and Lea Counties,southeast New Mexico. Gamma-ray logs are the onlylogs commonly run that record data through casing;therefore,manygeophysicalwell logswill record severaltypes of data below surface or intermediate casing in awell, but only the gamma-ray curvewill showdatawherethe upper part of the hole is cased—if the operator re-cords natural gamma radiation while raising the toolthrough the cased part of the hole.
Caliper Logs
Caliper logs are a measure of the diameter of the bore-hole. Permian rock units that are typically competent and
TABLE 1.—Two tables showing responses on geophysical logs for principal evaporites and associated rocks: datafrom Alger and Crain (1966), lower table, and Nurmi (1978), upper table. These rock properties and log re-sponses appear to be applicable to the evaporite sequences encountered in all parts of the GPEB. Upper tableshows general responses for various log types; lower table shows speci!c values for various log types.
Identi!cation of Gypsum, Anhydrite, and Salt on Geophysical Logs in the Greater Permian Evaporite Basin 53

Figure 2. Examples of general responses on geophysical logs to principal evaporites and associated rocks.
Figure 3. Geophysical logs and lithologic interpretation of the Blaine and upper Flowerpot Formations in theGeneralCrude Oil Co., Delia F. Adams No. 1, sec. 15,T. 12 S., R. 39W.,Wallace County, Kansas. On the laterolog, the gamma-ray curve shows a slightly higher radioactivity in salt than in anhydrite, and the resistivity curve shows a slightly lowerresistivity in salt than in anhydrite. The microlaterolog provides a sharp de!nition of the top and base of anhydritebeds on both the caliper and resistivity curves. On the microcaliper log, the hole has been enlarged considerably inthe salt units.
54 ,FOOFUI�4��+PIOTPO

well lithi!ed, such as gypsum, anhydrite, and carbonates,usually show only a small (if any) enlargement of theborehole. However, if rocks are soluble (such as salt),or if they cave into the wellbore (such as slightly lithi!edshale or friable sandstone), then the hole can be enlargedconsiderably beyond the diameter of the drill bit. At times,the hole enlargement is so great that the curve goes off-scale. It is possible that drilling mud can accumulate onthe side of the wellbore. This “mud cake” results whena permeable formation (i.e., sandstone), acting as a !lter,allows liquids to be squeezed out of the drilling mud andinto the formation, leaving behind a layer of mud solidsplastered on the wall of the borehole. A layer of “mudcake” decreases the size of the borehole.
Resistivity Logs
Resistivity logs measure the degree to which a rocklayer (and any contained "uids) resists the "ow of an
electrical current. Gypsum, anhydrite, and salt all offera very high resistance to an electric current, and there-fore, the curve is de"ected more signi!cantly than forother rocks in theGPEB. Inmost units in theGPEB, gyp-sum and anhydrite provide the greatest resistance to anelectric current, whereas salt units, if they contain shaleinclusions or thin shale interbeds, can offer somewhatless resistance. Shales have low resistance to an electriccurrent, and thus show little or no de"ection of the curve.Lateral resistivity logs (laterologs) increase the resolu-tion and de!nition of a rock layer and decrease the effectof adjacent beds; thus, they are very useful in the study ofevaporites.
Micrologs
Micrologs are pad-mounted resistivity logs, asdescribed above, except that they measure the rock/"uidproperties of a very small volume of material (only a few
Figure 4. Geophysical logs and core descriptions of the Hutchinson Salt in the AEC Test Hole No. 1, drilled by theAtomic Energy Commission in sec. 26, T. 19 S., R. 8 W., about 5 km NNE of the city of Lyons, in Rice County, Kansas(modi!ed from Walters, 1978). The large suite of logs includes gamma ray, caliper, resistivity, sonic, density,and neutron logs. Caliper log shows no hole enlargement in salt because of the use of salt-based drilling "uid(AEC wanted full recovery of salt cores). Sonic log shows faster transit time in anhydrite (!t ±50) than in salt(!t ±67). Density log shows lower speci!c gravity of salt (±2.1-2.2), compared to anhydrite (±2.9-3.0).
Identi!cation of Gypsum, Anhydrite, and Salt on Geophysical Logs in the Greater Permian Evaporite Basin 55

cubic inches) adjacent to the borehole wall, and thus aremuch more accurate and detailed for showing contactsbetween various rock layers and for showing rock layersthat are as thin as about 0.3 m. The design of the toolmeasurements may also yield a possible indication ofthe rock layer’s ability to transmit "uids. As above, gyp-sum and anhydrite have the greatest resistance to an elec-tric current, whereas salt beds, if they contain shaleinclusions or shale interbeds, show somewhat less resis-tance, and shales have low resistance.
Sonic Logs
Sonic logs record ameasure of the time that it takes, inmicroseconds ("s), for a sonic compressional wave totravel 1 foot (0.305 m) in the rock unit. The more com-pact the rock is, the higher the velocity of the soundwavetraveling through the rock, and therefore, the shorterthe time (!t) it takes to travel 1 foot. Sonic logs, if avail-able, are very good for differentiating between salt and
gypsum or anhydrite; the !t for salt is 67 "s/ft, whereasfor anhydrite, it is 50 "s/ft, and for gypsum, it is 52 "s/ft.Dolomites, limestones, and sandstones have!t values inthe same range as salt and gypsum or anhydrite, butshales typically have very high !t values.
Neutron Logs
Neutron logs, or neutron porosity index logs, record theresponse of the rock unit to bombardment by high-energyneutrons and primarily indicate the presence or absenceof hydrogen atoms in the rock and its "uids. As thesehigh-energy neutrons collide with atoms in the forma-tion, they are slowed down, and eventually may becaptured, by elements in the formation or its "uids.Depending on the tool design, the measurement is eithera count of the slowed neutrons that make it back to thedetector or the gamma rays that result from the capture ofthese neutrons. Older tools recorded neutron counts inAPI units, but in more modern tools, these counts are
Figure�5.�Geophysical�logs�and�lithologic�interpretation�in�two�wells�about�29�km�apart�in�Baca�County,�Colorado,�showing� salt� and� gypsum/anhydrite� beds� in� the� Blaine� Formation� (modi!ed� from� Askew,� 2013).� The� neutron�density� log�in�both�wells�shows�lower�density,�neutron-absorbing�gypsum�at�top�of�several�anhydrite�beds.�Also,�hole�on�the�left�is�enlarged�(on�caliper�log)�to�about�11�inches�in�salt,�but�is�about�8�inches�in�the�anhydrites.
56 ,FOOFUI�4��+PIOTPO
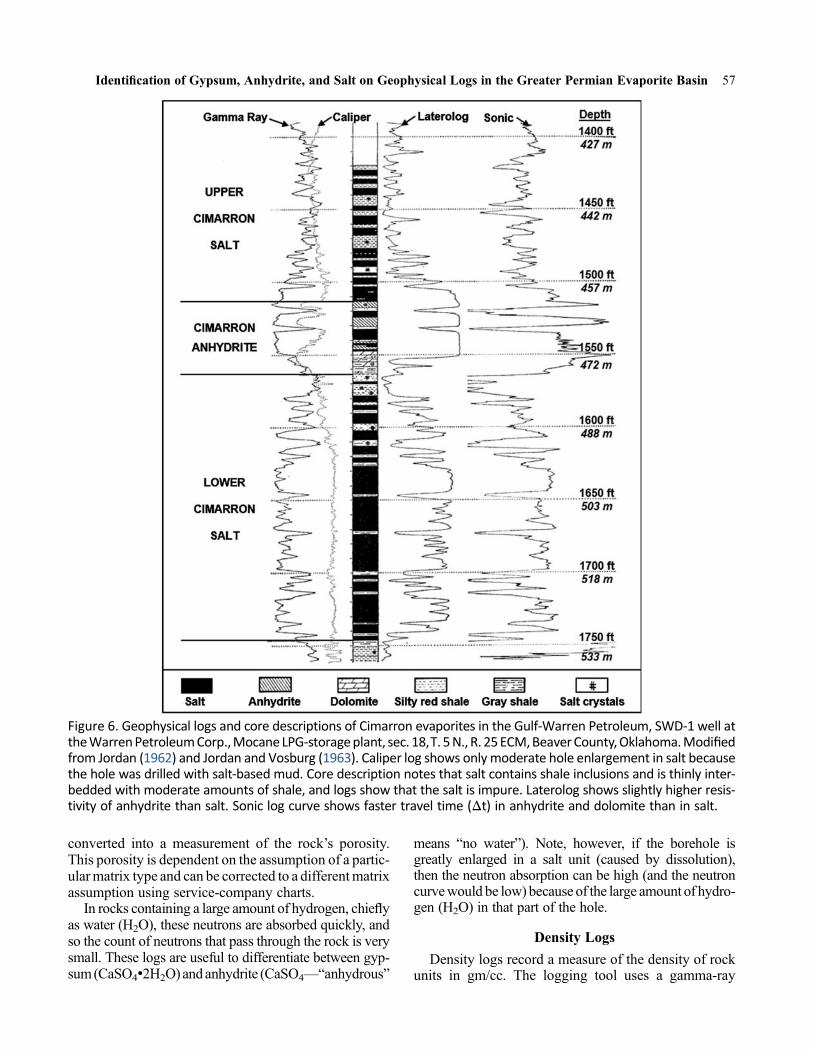
converted into a measurement of the rock’s porosity.This porosity is dependent on the assumption of a partic-ularmatrix type and can be corrected to a differentmatrixassumption using service-company charts.
In rocks containing a large amount of hydrogen, chie"yas water (H2O), these neutrons are absorbed quickly, andso the count of neutrons that pass through the rock is verysmall. These logs are useful to differentiate between gyp-sum(CaSO4•2H2O) andanhydrite (CaSO4—“anhydrous”
means “no water”). Note, however, if the borehole isgreatly enlarged in a salt unit (caused by dissolution),then the neutron absorption can be high (and the neutroncurvewould be low) because of the large amount of hydro-gen (H2O) in that part of the hole.
Density Logs
Density logs record a measure of the density of rockunits in gm/cc. The logging tool uses a gamma-ray
Figure 6. Geophysical logs and core descriptions of Cimarron evaporites in the Gulf-Warren Petroleum, SWD-1 well attheWarrenPetroleumCorp.,MocaneLPG-storageplant, sec. 18,T. 5N., R. 25ECM,BeaverCounty,Oklahoma.Modi!edfrom Jordan (1962) and Jordan and Vosburg (1963). Caliper log shows only moderate hole enlargement in salt becausethe hole was drilled with salt-based mud. Core description notes that salt contains shale inclusions and is thinly inter-bedded with moderate amounts of shale, and logs show that the salt is impure. Laterolog shows slightly higher resis-tivity of anhydrite than salt. Sonic log curve shows faster travel time (!t) in anhydrite and dolomite than in salt.
Identi!cation of Gypsum, Anhydrite, and Salt on Geophysical Logs in the Greater Permian Evaporite Basin 57
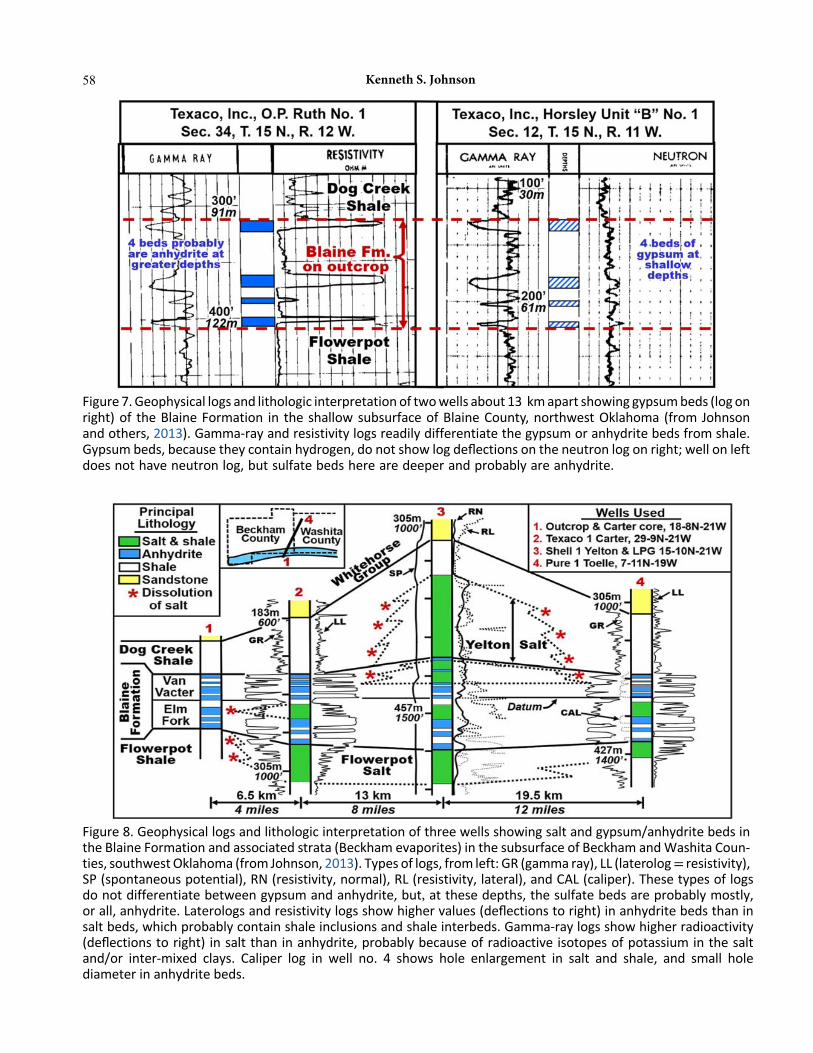
Figure 7. Geophysical logs and lithologic interpretation of twowells about 13 kmapart showing gypsumbeds (log onright) of the Blaine Formation in the shallow subsurface of Blaine County, northwest Oklahoma (from Johnsonand others, 2013). Gamma-ray and resistivity logs readily differentiate the gypsum or anhydrite beds from shale.Gypsum beds, because they contain hydrogen, do not show log de"ections on the neutron log on right; well on leftdoes not have neutron log, but sulfate beds here are deeper and probably are anhydrite.
Figure�8.�Geophysical�logs�and�lithologic�interpretation�of�three�wells�showing�salt�and�gypsum/anhydrite�beds�inthe�Blaine�Formation�and�associated�strata�(Beckham�evaporites)�in�the�subsurface�of�Beckham�and�Washita�Coun-ties,�southwest�Oklahoma�(from�Johnson,�2013).�Types�of�logs,�from�left:�GR�(gamma�ray),�LL�(laterolog�=�resistivity),�SP�(spontaneous�potential),�RN�(resistivity,�normal),�RL�(resistivity,�lateral),�and�CAL�(caliper).�These�types�of�logsdo�not�differentiate�between�gypsum�and�anhydrite,�but �at�these�depths,�the�sulfate�beds�are�probably�mostly,�or�all,�anhydrite.�Laterologs�and�resistivity�logs�show�higher�values�(de"ections�to�right)�in�anhydrite�beds�than�insalt�beds,�which�probably�contain�shale�inclusions�and�shale�interbeds.�Gamma-ray�logs�show�higher�radioactivity(de"ections�to�right)� in�salt�than� in�anhydrite,�probably�because�of�radioactive� isotopes�of�potassium� in�the�saltand/or� inter-mixed� clays.� Caliper� log� in�well� no.� 4� shows� hole� enlargement� in� salt� and� shale,� and� small� holediameter�in�anhydrite�beds.
58 ,FOOFUI�4��+PIOTPO

source pressed against the side of the borehole. The toolemits gamma rayswith a known energy level and recordsthe number of lower energy gamma rays returned to thetool because of collisions with electrons in the atomswithin the formation and its "uids. This count is a mea-sure of the electron density of the formation and is easilyconverted to a more useful standard bulk density in gm/cc. This bulk density can be used as is or can be convertedinto an estimation of the formation’s porosity. Commonevaporites in the GPEB are readily differentiated ondensity logs. Anhydrite (sp.gr. 2.96), the most commonform of sulfate rock at depths below 30 m or so, con-trasts greatly from salt (sp.gr. 2.165) and from gypsum(sp.gr. 2.32). The density of most of the nonevaporiterocks in the GPEB is about midway between anhydriteand salt.
SAMPLE GEOPHYSICAL LOGS SHOWINGCOMMON EVAPORITES
This part of the report shows a selection of ten sets ofgeophysical logs covering major evaporite units in dif-ferent parts of the GPEB (Figure 1), and how the logs
are interpreted for the evaporites they show. Most ofthe logs (Figures 3–12) were presented previously inthe literature, and only two (Figures 3, 11) were not.Four of the logs are accompanied by core descriptions,whereas the other six are accompanied by lithologic in-terpretations that are based upon general knowledge ofthe lithology from nearby cores, outcrops, or descrip-tions in the literature.
REFERENCES CITED
Alger, R.P., and Crain, E.R., 1966, De!ning evaporitedeposits with electrical well logs, in Rau, J.L., ed.,Second symposium on salt: Cleveland, Ohio, TheNorthern Ohio Geological Society, Inc., Vol. 2,p. 116-130. http://www.ross-crain.com/freepubs/1966-2%20De!ning%20Evaporite%20Deposites%20With%20Electrical%20Well%20Logs%20%20NOGS-SALT%20Alger-Crain.pdf
Askew, R.L., 2013, Distribution of the Permian BlaineFormation salt in the subsurface of the HugotonEmbayment area of Baca County, southeast Colorado:
Figure 9. Geophysical logs and core descriptions of part of the San Andres Formation in the DOE-Stone &Webster,No. 1 Mans!eld well drilled in northeastern Oldham County, Texas. Modi!ed from Ruppel and Hovorka (1983).Caliper log shows no hole enlargement in salt because of the use of salt-based drilling "uid. Sonic log (interval transittime) distinguishes between salt (!t= 67) and anhydrite (!t= 50). Bulk density log differentiates salt (±2.1) fromanhydrite (±2.9-3.0).
Identi!cation of Gypsum, Anhydrite, and Salt on Geophysical Logs in the Greater Permian Evaporite Basin 59

Rocky Mountain Association of Geologists, TheMountain Geologist, Vol. 50, No. 2, P. 65-75.
Asquith, G., and Krygowski, D, 2004, Basic well loganalysis (second edition): American Association ofPetroleumGeologists, AAPGMethods in ExplorationSeries 16, 244p. https://www.academia.edu/35430322/Basic_Well_Log_Analysis_Second_Edition_with_sections_by_Steven_Henderson_and_Neil_Hurley_AAPG_Methods_in_Exploration_Series_16
Eager, G.P., 1983, Core from the lower Dewey Lake,Rustler, and upper Salado Formations, CulbersonCounty, Texas, in Shaw, R.L., and Pollan, B.J., eds.,Permian Basin cores—a workshop: Permian BasinSection, S.E.P.M. Core Workshop #2, p. 273-283.
Ellis, D.V., 1987, Well logging for earth scientists: NewYork, Elsevier Science Publishing Co., Inc., 532 p.
Johnson, K.S., 1993, Dissolution of Permian Salado saltduring Salado time in the Wink area, Winkler County,Texas, inD.W.Love and others, eds., Carlsbad region,NewMexico andwest Texas: NewMexicoGeologicalSociety Guidebook, 44th Annual Field Conference(October 6–9, 1993), p. 211-218. https://www.researchgate.net/publication/268385405
Johnson, K.S., 2021, Overview of evaporite karst in theGreater Permian Evaporite Basin (GPEB) of TX, NM,OK, KS, and CO, in Johnson, K.S., Land, L.A., and
Figure 10. Geophysical logs and lithologic interpretationof the J.W. Starr, Pan Am Hendrick B#2, sec. 35, BlockB-5, PSL Survey, Winkler County, Texas, showing saltand anhydrite beds in the Salado Formation (modi!edfrom Johnson, 1993). This well is about 730 m south-east of Wink Sink no. 1. Neutron log here readily differ-entiates anhydrite (high values) from salt (lowervalues); normally, anhydrite and salt both have highneutron values, but because borehole probably isenlarged in salt units (caused by salt dissolution), thelarge amount of water in these parts of the hole causeshigh neutron absorption (lower neutron values).
Figure 11. Geophysical logs and lithologic interpretationof part of the Castile Formation in the Texaco Inc., LagoUnit No. 1, Loving County, Texas. Surprisingly, thegamma-ray log shows very slightly higher gamma radi-ation for anhydrite than for salt; this suggests that thesalt is of high purity, with no clay minerals or potashsalts (thus no radioactive isotopes of potassium). Soniclog readily differentiates anhydrite (!t= 50) from salt(!t= 67); also, it shows the presence of several thinlayers of anhydrite in the upper half of Halite II.
60 ,FOOFUI�4��+PIOTPO

Decker, D.D., eds., Evaporite karst in the GreaterPermianEvaporite Basin (GPEB) of Texas, NewMex-ico, Oklahoma, Kansas, and Colorado: OklahomaGeological Survey, Circular 113.
Johnson, K.S., Bangsund, W.J., and Hines, N.A., 2013,Gypsumkarst and potential risk in sitingwind turbines
in Blaine County, Oklahoma, in Land, L., Doctor,D.H., and Stephenson, J.B., eds., Sinkholes and theengineering and environmental impacts of karst–Proceedings of the thirteenthmultidisciplinary confer-ence, Carlsbad, NM, May 6 through 10, 2013:National Cave and Karst Research Institute, Carlsbad,NM, p. 151-159. http://scholarcommons.usf.edu/cgi/viewcontent.cgi?article=1123&context=sinkhole_2013
Jordan, L., 1962, LPG storage in Cimarron salt, BeaverCounty, Oklahoma: Oklahoma Geological Survey,Oklahoma Geology Notes, Vol. 22, No. 2, p. 23-26.http://ogs.ou.edu/docs/geologynotes/GN-V22N2.pdf
Jordan, L., and Vosburg, D.L., 1963, Permian salt andassociated evaporites in the Anadarko Basin of thewestern Oklahoma–Texas Panhandle region: Okla-homa Geological Survey, Bulletin 102, 76 p. http://ogs.ou.edu/docs/bulletins/B102.pdf
Nurmi, R.D., 1978, Use ofwell logs in evaporite sequen-ces, in Dean, W.E., and Schreiber, B.C., eds, Marineevaporites: Society of Economic Paleontologists andMineralogists, SEPM Short Course No. 4 held inOklahoma City, p. 144-176.
Presley, M.W., and Ramondetta, P.J., 1981, Hydrocar-bon potential of San Andres carbonates in the PaloDuroBasin—stratigraphic and facies analysis: inGus-tavson, T.C., and others, Geology and geohydrologyof the Palo Duro Basin, Texas Panhandle: TheUniversity of Texas at Austin, Bureau of EconomicGeology, Geological Circular 83–4, p. 59-63.
Rider, M., 2002, The geological interpretation of welllogs: Sutherland, Scotland, Rider-French Consulting,Ltd., 2nd edition, 280 p.
Rupple, S.C., and Hovorka, S.D., 1983, Stratigraphicsection along the northwestern margin of the PaloDuro Basin: core analysis of DOE–Stone andWebsterNo. 1 Mans!eld test well, Oldham County, Texas, inGustavson, T.C., and others, Geology and geohydrol-ogy of the Palo Duro Basin, Texas Panhandle: TheUniversity of Texas at Austin, Bureau of EconomicGeology, Geological Circular 83–4, p. 47-48 andplate II.
Walters, R.F., 1978, Land subsidence in central Kansasrelated to salt dissolution: Kansas Geological Survey,Bulletin 214, 82 p. http://www.kgs.ku.edu/Publications/Bulletins/214/index.html
Figure 12. Geophysical logs and core descriptions of theTexasgulf, Inc., sulphur-exploration core, sec. 5, PSLSurvey, Block 45, Culberson County, Texas (20 kmsouthwest of Orla), showing parts of the Dewey Lakeand Rustler Formations (modi!ed from Eager, 1983).Gamma-ray log shows higher radioactivity in mud-stones, probably because of radioactive isotopes ofpotassium in the clays, and in dolomite. Neutron logreadily differentiates hydrogen-bearing gypsum fromanhydrite.
Identi!cation of Gypsum, Anhydrite, and Salt on Geophysical Logs in the Greater Permian Evaporite Basin 61


ABSTRACT.—Sinkholes and other surface karst features are naturally occurringphenomena in regions underlain by soluble bedrock such as limestone or gypsum.The lower Pecos region of southeastern New Mexico and west Texas is particularlysusceptible to karst geohazards because of the widespread occurrence of Permianevaporites at or near the land surface. Sinkholes in this region occur over a broadspectrum of scales, ranging from less than one to several hundred meters in diame-ter, and are often associated with human activity such as solution mining or oil andgas operations. Depending on thickness and mechanical properties of the overbur-den, sinkholes may develop slowly as broad subsidence basins or rapidly by cata-strophic collapse. Sinkholes receive widespread news coverage when they form indensely populated parts of the country, such as Florida or Kentucky. When thesefeatures form in more sparsely populated regions, such as the desert southwest, theymay go unreported for long periods of time. Sinkholes and other evaporite-karstprocesses nevertheless pose a geohazard for the transportation and pipelinenetwork in southeastern New Mexico; their occurrence is sometimes dif!cult topredict, and remediation is often challenging and expensive.
INTRODUCTION
Evaporite-karst phenomena in the lower Pecos regionof southeastern New Mexico span over three degrees oflatitude, extending for more than 400 km from SantaRosa in the north to the state line south of Carlsbad,and beyond into west Texas (Figure 1). The presenceof soluble gypsum and halite bedrock in outcrop orin the subsurface throughout the Permian section(Figure 2) has resulted in manifestations of karst pro-cesses at a variety of scales, from small sinkholes andcaves to regional subsidence basins, and has signi!cantlyin"uenced the topography along the margins of the PecosRiver valley (Bachman, 1984; 1987; Land, 2003).Anthropogenic processes, such as solution mining, roadconstruction, and improperly cased or plugged oil andwater wells, have also accelerated and modi!ed theongoing natural evolution of the evaporite-karst land-scape (e.g., Johnson and others, 2003; Powers, 2003;Land andAster, 2009; Land andVeni, 2012; Land, 2013).
The Guadalupe Mountains region of southeasternNew Mexico and west Texas is world famous for itscaves formed in carbonate bedrock (e.g., Hill, 1987;Love and others, 1993; Palmer and Palmer, 2000;
Hose and Pisarowicz, 2000; Land and others, 2006,among a great many others), the most obvious examplebeing Carlsbad Cavern, one of three world heritage sitesin NewMexico (UNESCO, 2020). However, with a fewexceptions (Land and Burger, 2008), most limestonecaves in the Guadalupe Mountains are located abovethe regional water table and have little direct impacton societal infrastructure. Apart from tourism, the great-est human impact of carbonate karst phenomena insoutheastern New Mexico lies in the regional karsticaquifers formed in Permian limestones of the CapitanReef and Roswell Artesian Basin (Hiss, 1973; Welder,1983; Land and Newton, 2008; Land, 2016).Evaporite-karst features and processes, by contrast,have had a profound in"uence on the geomorphology,hydrology, economy, and infrastructure of the lowerPecos region.
SANTA ROSA AREA
The northernmost occurrences of karst phenomena inthe Pecos Valley are found in northern GuadalupeCounty, !25 km upstream from the town of SantaRosa, where the Pecos River "ows across outcrops of
Land, L., 2021, Evaporite Karst as a Transportation and Infrastructure Geohazard in the Lower Pecos Region,Southeastern New Mexico and West Texas, in Johnson, K. S.; Land, Lewis; and Decker, D. D. (eds.),Evaporite Karst in the Greater Permian Evaporite Basin (GPEB) of Texas, New Mexico, Oklahoma, Kansas,and Colorado: Oklahoma Geological Survey, Circular 113, p. 63–77.
0LMBIPNB�Geological�Survey�Circular�113,�2021
Evaporite�Karst�as�a�Transportation�and�Infrastructure�Geohazard�in�the�Lower�Pecos�Region,�Southeastern�New�Mexico�and�West�Texas
Lewis�LandNational�Cave�and�Karst�Research�Institute,�Carlsbad,�New�Mexico
63

the San Andres Formation and Artesia Group along thenorth "ank of Esteritos Dome (Figure 1; Trauger, 1972).Along this reach of the river, the Pecos loses water that is
undersaturated with respect to calcium carbonatethrough fractured and cavernous SanAndres limestones.Groundwater "ows southeast through these highly
Figure 1. Regional map of southeastern New Mexico and west Texas. Red !lled circles show relevant gypsum sink-holes, other evaporite-karst features, and other locationsmentioned in this report. BF=Burton Flats; BLNWR=BitterLake National Wildlife Refuge; BLSP=Bottomless Lakes State Park; CC=Carlsbad Cavern; CD=Chosa Draw;I&W=I&W brine well; LHS=Loco Hills Sinkhole; ND=Nash Draw; WIPP=Waste Isolation Pilot Plant. Red linesshow the Pecos Buckles, wrench faults extending SW-NE across the Pecos Slope.
64 Lewis Land
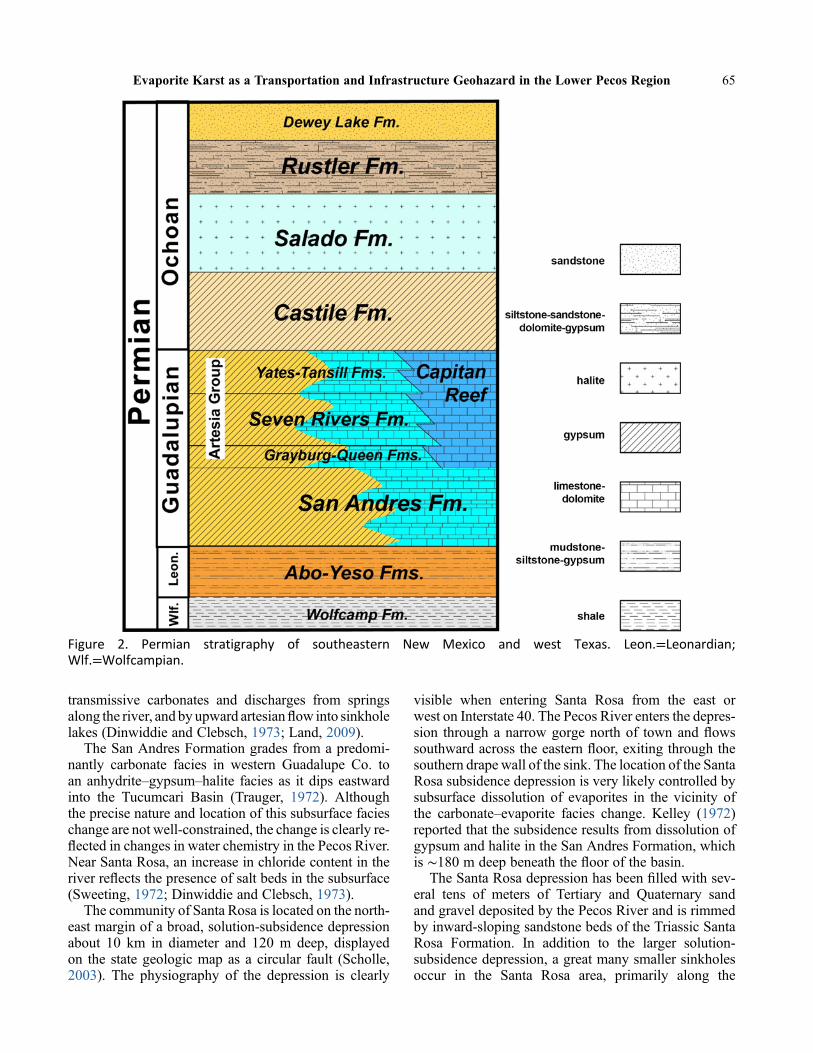
transmissive carbonates and discharges from springsalong the river, and by upward artesian"ow into sinkholelakes (Dinwiddie and Clebsch, 1973; Land, 2009).
The San Andres Formation grades from a predomi-nantly carbonate facies in western Guadalupe Co. toan anhydrite–gypsum–halite facies as it dips eastwardinto the Tucumcari Basin (Trauger, 1972). Althoughthe precise nature and location of this subsurface facieschange are not well-constrained, the change is clearly re-"ected in changes in water chemistry in the Pecos River.Near Santa Rosa, an increase in chloride content in theriver re"ects the presence of salt beds in the subsurface(Sweeting, 1972; Dinwiddie and Clebsch, 1973).
The community of Santa Rosa is located on the north-east margin of a broad, solution-subsidence depressionabout 10 km in diameter and 120 m deep, displayedon the state geologic map as a circular fault (Scholle,2003). The physiography of the depression is clearly
visible when entering Santa Rosa from the east orwest on Interstate 40. The Pecos River enters the depres-sion through a narrow gorge north of town and "owssouthward across the eastern "oor, exiting through thesouthern drape wall of the sink. The location of the SantaRosa subsidence depression is very likely controlled bysubsurface dissolution of evaporites in the vicinity ofthe carbonate–evaporite facies change. Kelley (1972)reported that the subsidence results from dissolution ofgypsum and halite in the San Andres Formation, whichis !180 m deep beneath the "oor of the basin.
The Santa Rosa depression has been !lled with sev-eral tens of meters of Tertiary and Quaternary sandand gravel deposited by the Pecos River and is rimmedby inward-sloping sandstone beds of the Triassic SantaRosa Formation. In addition to the larger solution-subsidence depression, a great many smaller sinkholesoccur in the Santa Rosa area, primarily along the
Figure 2. Permian stratigraphy of southeastern New Mexico and west Texas. Leon.=Leonardian;Wlf.=Wolfcampian.
Evaporite Karst as a Transportation and Infrastructure Geohazard in the Lower Pecos Region 65

northern and western margin of the basin.Where solublerocks in the San Andres are overlain by relatively thinsandstone beds of the Triassic Santa Rosa Formation,upward stoping and collapse have produced vertical-walled sinkholes of typical cenote morphology, suchas Blue Hole (Figure 1), although formed in siliciclasticrocks (Kelley, 1972; Land, 2009).
NORTHERN GYPKAP/ROSWELL BASIN
The Northern Gypkap (Gypsum Karst Project) refersto a vast and sparsely populated area in east-central NewMexico covering more than 20,000 km2, encompassingparts of Chaves, Lincoln, Guadalupe, DeBaca, and Tor-rance Counties (Figure 1). The region is bounded to thesouth by the Capitan Mountains batholith, and to thenorth by the Pedernal Hills, a late Paleozoic landmasscomposed of Precambrian granite, granite gneiss, andmetaquartzite that was later partially buried by youngersedimentary strata (Gonzalez and Woodward, 1972;Kottlowski, 1985). The Lincoln County Porphyry Beltlies to the west (Kelly, 1971), and the eastern marginis approximately de!ned by the Pecos River valley.Most of the region is underlain in outcrop or in theshallow subsurface by evaporitic facies of the SanAndres Formation and Artesia Group, and by the YesoFormation, which also contains evaporitic lithologies
(Figures 1 and 2; Weber and Kottlowski, 1959; Kelly,1971; Kelly and Kelly, 1972; Scholle, 2003).
The Northern Gypkap designation derives from aneffort by members of the Southwest Region of theNational Speleological Society to explore and map thegypsum karst of southeastern New Mexico (Eaton,1987). Gypsum bedrock in the region is host to dozensof caves, some with a surveyed length of more than 3 kmand a vertical extent exceeding 130 m (Figure 3; Forbesand Nance, 1997). Surface mapping and air photo inter-pretation indicate the presence of many thousands ofsinkholes in the area (Eaton, 1987; Belski, 1992;Lee, 1996).
The city of Roswell, the largest population center insoutheastern New Mexico, is located at the northernend of the Roswell Artesian Basin, one of themost inten-sively farmed areas in the state outside the Rio GrandeValley (Figure 1; Land and Newton, 2008; Land, 2009).
Communities in the Roswell Basin derive virtually allof their irrigation, industrial, and municipal drinkingwater from groundwater in a shallow alluvial aquiferand a karstic artesian aquifer formed in middle Permianlimestone of the San Andres Formation and overlyingcarbonates of the Artesia Group (Figure 2; Welder,1983; Land and Newton, 2008). Recharge to the artesianaquifer originates in the southern SacramentoMountains
Figure 3. Sinkhole entrance to Torgac Cave, formed in gypsum bedrock of the San Andres Formation, Lincoln Co.,NM.
66 Lewis Land

to thewest, and through solution-enlarged!ssures on thePecos Slope. In predevelopment times, groundwater dis-charged at the downgradient end of the regional aquifersystem from karst springs and gypsum cenotes at BitterLake National Wildlife Refuge and Bottomless LakesState Park. Since the inception of irrigated agriculturein the early 20th century, most of the downgradient"ow is now intercepted by hundreds of irrigation wellsin the Artesian Basin (Figures 1 and 4; Land, 2003;Land and Huff, 2010).
Human activity in the Gypkap region to the north, bycontrast, is represented only by isolated ranches andalmost uninhabited villages, such as Encino and Duran.Both this demographic disparity and the abundance ofgypsum-karst features in the Northern Gypkap are afunction of south to north facies changes that occurwithin the San Andres Formation and Artesia Group.
Regional stratigraphic models of the San Andresshow deposition of mixed carbonates and evaporitesoccurring over an extremely broad shelf of very lowrelief in east-central and southeastern New Mexicoand west Texas. The formation is comprised mostly ofcarbonates in southern NewMexico, where it is boundedto the southeast by a low-relief shelf margin on the north-ern "ank of the Delaware Basin (Silver and Todd, 1969;Elliott and Warren, 1989). The San Andres Formationbecomes increasingly evaporitic to the north and east(Kelley, 1971; Ward and others, 1986) and is correlativewith gypsum of the Blaine Formation in westernOklahoma. Similar facies changes occur in the overlyingArtesia Group (Land, 2003).
In the subsurface of the Roswell Artesian Basin car-bonate lithologies predominate, and the evaporitic com-ponent of the San Andres is represented primarily byintraformational solution-collapse breccias, known as“rubble zones,” created by dissolution of interbeddedevaporites by circulating groundwater. These brecciazones provide much of the groundwater storage capacityfor the artesian aquifer system (Motts and Cushman,1964; Welder, 1983). The Artesian Basin also includesa shallow alluvial aquifer formed from sediment depos-ited by the ancestral Pecos River. These deposits attaintheir greatest saturated thickness (!75 m) in subsidencebasins developed by dissolution of evaporites in theunderlying Permian bedrock (Lyford, 1973; Welder,1983). Evaporite-karst processes may thus be said tohave contributed directly to the civic water supply infra-structure, and by extension the prosperity of agriculturalcommunities in the Roswell Artesian Basin.
North of Roswell, shelfward facies change results in aSan Andres and Grayburg section that consists mostly ofgypsum, with relatively thin interbeds of dolomite orlimestone (Eaton, 1987; Forbes and Nance, 1997). Com-mon features in the Northern Gypkap area are thus sink-holes and gypsum caves with dolomite ceilings or "oors,rather than the extensive solution-collapse brecciasfound farther south in the Artesian Basin. These cavesare located above the regional water table, which isseveral hundred meters deep in much of the NorthernGypkap area, and do not provide signi!cant potentialfor storage of groundwater, other than as highly localizedperched aquifers. The limited water resources in this
Figure 4. West-east hydrostratigraphic pro!le of artesian aquifer in Roswell Artesian Basin. TU = tritium units.Groundwater at Bitter LakeNWRandBottomless Lakes SP is depleted in tritium, a result ofmixing of recent rechargewith premodern groundwater originating from the underlying Glorieta and Yeso Formations (Land and Huff, 2010).
Evaporite Karst as a Transportation and Infrastructure Geohazard in the Lower Pecos Region 67

region,�attributable�in�part�to�regional�facies�changes�that�occur�within�these�middle�Permian�units,�account�for�the�sparse�population�and�lack�of�economic�development�in�the�Northern�Gypkap�(Land,�2009).
Despite�the�lack�of�agricultural�potential,�in�the�past�two�decades� the�Northern�Gypkap� region�has�become�an� attractive� area� for� the�development�of�wind� farms.�Wind-farm�projects�may�involve�construction�and�instal-lation�of�more�than�a�hundred�individual�wind�turbines�and�may�occupy�several�tens�to�hundreds�of�square�kilo-meters�(Johnson�and�others,�2013).�Wind�farms�also�have�a�signi!cant�visual�impact�on�their�surroundings,�and�for�these�reasons�are�often�sited� in� remote,�sparsely�popu-lated,�and�undeveloped�areas� (Bangsund�and�Johnson,�2013).�The�Northern�Gypkap,�with� its� limited�popula-tion,� subdued� topography,� nearly� treeless� plains,� and�frequent� strong� winds,� provides� an� attractive� setting�for�wind-farm�projects.
Evaporite-karst� processes� pose� the�most� signi!cant�geohazard� for�wind-farm�development� in� the�Northern�Gypkap�region.�Spread�footings�are� the�most�common�type�of�foundation�for�an�individual�turbine,�with�a�foun-dation�width�of�15–22�m.�Turbines�have�relatively�low�dead� loads�but�high�overturning�moments.�Differential�settlement�of�even�a�few�centimeters�across�a�15-m�wide�turbine� foundation� can� cause� the� turbine� to� be� out� of�tolerance,� leading� to� tilting� or� toppling.� This� risk� is�signi!cant,�because�an�individual�wind�turbine�can�cost�two� to� !ve� million� dollars� (Bangsund� and� Johnson,�2013).�The� absence� of� surface� karst� features� does� not�necessarily� ensure� the� stability� of� a� site,� since� many�areas� in� the�Northern�Gypkap� are� covered�with� a� thin�veneer� of� alluvium,�masking� potential� cavities� in� the�shallow� subsurface.� Johnson� and� others� (2013)� report�that� the� hazard� diminishes� with� increasing� thickness�(>25�m)�of�insoluble�overburden.
DAM�FOUNDATIONS
Lake�McMillan,�located�!35�km�north�of�the�city�of�Carlsbad,�was�one�of�the�earliest�impoundments�on�the�Pecos�River�(Figure�1).�McMillan�dam�was�constructed�in�1893�to�provide�storage�of�irrigation�water�for�farmers�in�the�Carlsbad�area�at�a�time�when�geologic�assessments�of� dam� sites� were� rarely� conducted� (US� Bureau� of�Reclamation,� 1957).�Construction� of� dams� and� reser-voirs�on�karst�terrain�is�historically�known�to�include�a�high�element�of�risk.�Despite�highly�detailed�geological�and� geophysical� site� investigations,� the� possibility�for� dam� failure� cannot� be� entirely� eliminated� because�of� the�highly�random�and�unpredictable�distribution�of�solution� conduits� in� a� karst� environment� (Milanovic,�2002;�2011).�In�addition�to�the�risk�of�subsidence�or�col-lapse,�leakage�from�arti!cial�impoundments�in�karst�re-gions�is�globally�widespread�(e.g.,�Mohammadi,�2007).
Gypsum karst presents particular problems for damfoundations because of the highly soluble nature ofthat mineral. Once groundwater "ow beneath a dam isestablished, solution conduits can enlarge quickly,undermining the dam and diminishing storage capacityof the reservoir (Johnson, 2008; Johnson and others,2021). In addition to the risk of catastrophic failure,remediation of dam sites in gypsum karst terrain canbe very expensive and require years or decades of effort(e.g., Jarvis, 2003; Johnson and Wilkerson, 2013).
Lake McMillan is located within the evaporite faciesbelt of the middle Permian Seven Rivers Formation(Figure 2). Because of the soluble nature of the underly-ing gypsum bedrock, McMillan reservoir almost imme-diately began experiencing leakage problems throughsinkholes and solution channels formed in the lakebed, particularly along the eastern margin of the lake.Water "owed through karstic conduits in the SevenRivers gypsum and returned to the Pecos River throughdischarge from Major Johnson Springs, !5.6 km down-stream (Theis, 1938). East and southeast of the facieschange, the less soluble dolomite facies of the SevenRivers retard any signi!cant formation of solution chan-nels. In 1908–1909, a dike was constructed along thesoutheast shore of the lake, near the base of theMcMillanEscarpment, in an attempt to isolate the areas of worstsinkhole formation, with limited success. The dikewas extended in 1953–1954 along most of the easternshore to prevent water from reaching exposed sinkholesduring periods of high lake level. Occasionally, breakswould occur in the dikes causing lake water to inundatethe sinkholes. At these times, whirlpools were reportedin the lake, indicating that sediment cover over sinkholesin the lake bed had been disturbed. High rates of leakagewould occur for short periods of time, until the dikeswere repaired and sediment cover on the "oor of thelake restored (Cox, 1967; Land and Love, 2006).
Storage capacity of Lake McMillan steadilydecreased after the dam was constructed because ofdeposition of suspended sediment, and by the early1940s less than half of its original storage capacity re-mained. The possibility of dredging was considered,but soon discarded when it was realized that removalof the accumulated sediment would considerablyincrease leakage through karst !ssures in the gypsumbedrock underlying the lake. Fortunately, loss of storagecapacity decreased by the mid-1940s because a stand ofsalt cedar became established in bottom lands upstreamfrom Lake McMillan, acting as a baf"e for much of thesuspended sediment carried by the Pecos River (Cox,1967; Land and Love, 2006).
Consideration for construction of a new dam began asearly as 1905. The U.S. Bureau of Reclamation beganconstruction of Brantley Dam in 1984, and in 1991McMillan Dam was breached and Lake McMillan
68 Lewis Land
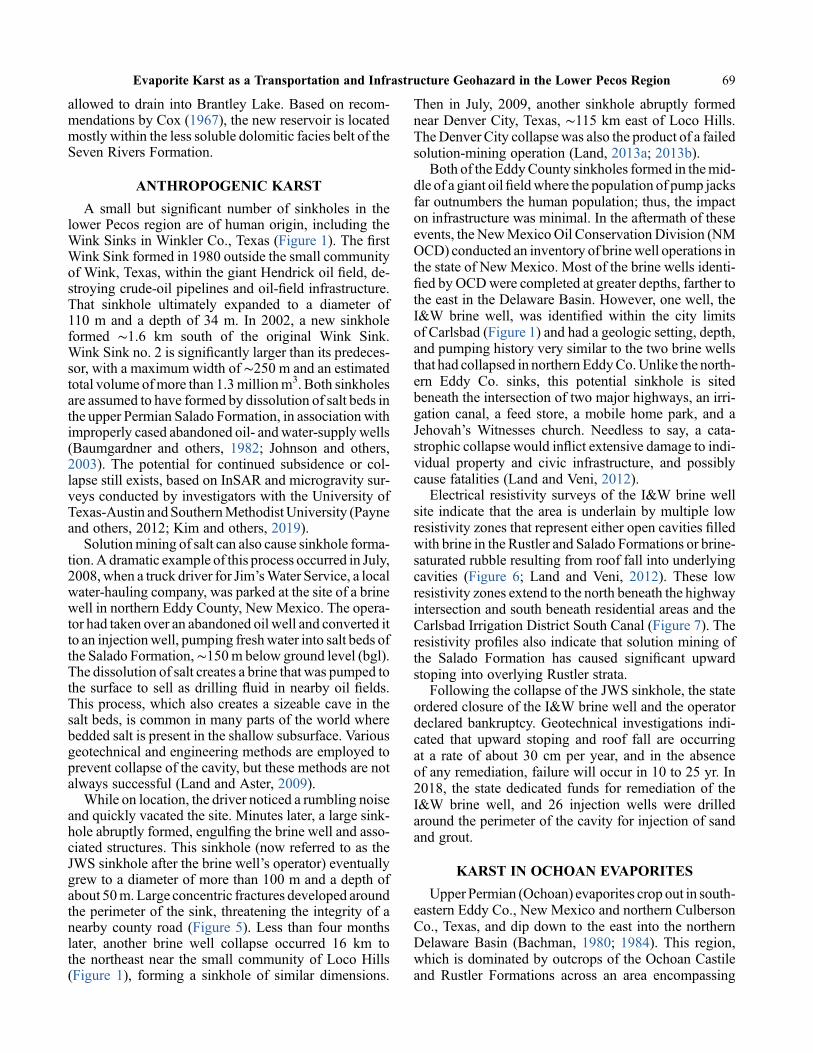
allowed to drain into Brantley Lake. Based on recom-mendations by Cox (1967), the new reservoir is locatedmostly within the less soluble dolomitic facies belt of theSeven Rivers Formation.
ANTHROPOGENIC KARST
A small but signi!cant number of sinkholes in thelower Pecos region are of human origin, including theWink Sinks in Winkler Co., Texas (Figure 1). The !rstWink Sink formed in 1980 outside the small communityof Wink, Texas, within the giant Hendrick oil !eld, de-stroying crude-oil pipelines and oil-!eld infrastructure.That sinkhole ultimately expanded to a diameter of110 m and a depth of 34 m. In 2002, a new sinkholeformed !1.6 km south of the original Wink Sink.Wink Sink no. 2 is signi!cantly larger than its predeces-sor, with a maximum width of !250 m and an estimatedtotal volume ofmore than 1.3millionm3. Both sinkholesare assumed to have formed by dissolution of salt beds inthe upper Permian Salado Formation, in association withimproperly cased abandoned oil- andwater-supply wells(Baumgardner and others, 1982; Johnson and others,2003). The potential for continued subsidence or col-lapse still exists, based on InSAR and microgravity sur-veys conducted by investigators with the University ofTexas-Austin andSouthernMethodist University (Payneand others, 2012; Kim and others, 2019).
Solutionmining of salt can also cause sinkhole forma-tion.A dramatic example of this process occurred in July,2008,when a truck driver for Jim’sWater Service, a localwater-hauling company, was parked at the site of a brinewell in northern Eddy County, NewMexico. The opera-tor had taken over an abandoned oil well and converted itto an injectionwell, pumping freshwater into salt beds ofthe Salado Formation,!150m below ground level (bgl).The dissolution of salt creates a brine that was pumped tothe surface to sell as drilling "uid in nearby oil !elds.This process, which also creates a sizeable cave in thesalt beds, is common in many parts of the world wherebedded salt is present in the shallow subsurface. Variousgeotechnical and engineering methods are employed toprevent collapse of the cavity, but these methods are notalways successful (Land and Aster, 2009).
While on location, the driver noticed a rumbling noiseand quickly vacated the site. Minutes later, a large sink-hole abruptly formed, engul!ng the brine well and asso-ciated structures. This sinkhole (now referred to as theJWS sinkhole after the brine well’s operator) eventuallygrew to a diameter of more than 100 m and a depth ofabout 50m.Large concentric fractures developed aroundthe perimeter of the sink, threatening the integrity of anearby county road (Figure 5). Less than four monthslater, another brine well collapse occurred 16 km tothe northeast near the small community of Loco Hills(Figure 1), forming a sinkhole of similar dimensions.
Then in July, 2009, another sinkhole abruptly formednear Denver City, Texas, !115 km east of Loco Hills.TheDenver City collapse was also the product of a failedsolution-mining operation (Land, 2013a; 2013b).
Both of the EddyCounty sinkholes formed in themid-dle of a giant oil!eldwhere the population of pump jacksfar outnumbers the human population; thus, the impacton infrastructure was minimal. In the aftermath of theseevents, the NewMexicoOil Conservation Division (NMOCD) conducted an inventory of brinewell operations inthe state of New Mexico. Most of the brine wells identi-!ed by OCDwere completed at greater depths, farther tothe east in the Delaware Basin. However, one well, theI&W brine well, was identi!ed within the city limitsof Carlsbad (Figure 1) and had a geologic setting, depth,and pumping history very similar to the two brine wellsthat had collapsed in northern EddyCo.Unlike the north-ern Eddy Co. sinks, this potential sinkhole is sitedbeneath the intersection of two major highways, an irri-gation canal, a feed store, a mobile home park, and aJehovah’s Witnesses church. Needless to say, a cata-strophic collapse would in"ict extensive damage to indi-vidual property and civic infrastructure, and possiblycause fatalities (Land and Veni, 2012).
Electrical resistivity surveys of the I&W brine wellsite indicate that the area is underlain by multiple lowresistivity zones that represent either open cavities !lledwith brine in the Rustler and Salado Formations or brine-saturated rubble resulting from roof fall into underlyingcavities (Figure 6; Land and Veni, 2012). These lowresistivity zones extend to the north beneath the highwayintersection and south beneath residential areas and theCarlsbad Irrigation District South Canal (Figure 7). Theresistivity pro!les also indicate that solution mining ofthe Salado Formation has caused signi!cant upwardstoping into overlying Rustler strata.
Following the collapse of the JWS sinkhole, the stateordered closure of the I&W brine well and the operatordeclared bankruptcy. Geotechnical investigations indi-cated that upward stoping and roof fall are occurringat a rate of about 30 cm per year, and in the absenceof any remediation, failure will occur in 10 to 25 yr. In2018, the state dedicated funds for remediation of theI&W brine well, and 26 injection wells were drilledaround the perimeter of the cavity for injection of sandand grout.
KARST IN OCHOAN EVAPORITES
Upper Permian (Ochoan) evaporites crop out in south-eastern Eddy Co., New Mexico and northern CulbersonCo., Texas, and dip down to the east into the northernDelaware Basin (Bachman, 1980; 1984). This region,which is dominated by outcrops of the Ochoan Castileand Rustler Formations across an area encompassing
Evaporite Karst as a Transportation and Infrastructure Geohazard in the Lower Pecos Region 69

!2800 km2, is commonly known as the gypsum plain(Hill, 1996; Stafford, 2017).
Extensive exposures of the Rustler Formation, one ofthe uppermost members of the Ochoan Series (Figure 2),occur east and west of US 285 south of the village ofMalaga, NM, where the unit is disrupted by numeroussmall diapirs and related sinks associated with dissolu-tion and/or "ow of the underlying Salado Formation(Kelley, 1971). The Rustler also crops out in Nash
Draw (Figure 1), a well-documented karst basin!30 km east of Carlsbad containing abundant sinkholes,small caves, and karst valleys, developed by dissolutionand erosion of soluble lithologies in the Rustler andunderlying Salado Formations (e.g., Lee, 1925; Robin-son and Lang, 1938; Vine, 1963; Bachman, 1981;Powers and others, 2006; Goodbar and others, 2020).
The Rustler Formation is a heterogeneous unit con-sisting of interbedded gypsum, mudstone, dolomite,
Figure 5. JWS sinkhole, about one month after initial collapse. County Road 117 is visible in the upper right corner.Two-track dirt roads converging on the sinkhole originally led to the brine well facility prior to the collapse.
Figure 6. Electrical resistivity pro!le across I&W brine well site. Low resistivity zones, shown in blue, indicate brine-!lled cavities or brine-saturated rubble. This line passes within 2m of the wellhead (Figure 7), crossing directly overthe subsurface cavity (A) excavated during solution-mining operations. Zones B, C, and D are interpreted to be addi-tional cavities or rubble zones that may be associated with solution-mining activity, but not connected to the mainvoid space (from Land and Veni, 2012, Figure 6D).
70 Lewis Land

and !ne sandstone (Bachman, 1984). The diversity oflithologies in"uences the types of karst features formedin the Rustler. Land and others (2018) observed thatmany small sinkholes formed in the lowermost LosMed-anos Member along US 285 were relatively shallow(<3 m deep), without deep roots, and attributed this phe-nomenon to layers of insoluble mudstone underlyingmore soluble gypsum beds. However, Decker and others(2020) identi!ed larger caves and sinkholes in theBurtonFlats area east of Carlsbad, formed in gypsum and dolo-mite beds of the upper Rustler Formation.
Sinkholes and caves in the Rustler are a geohazard forthe transportation and pipeline network in the oil!elds ofthe region (Land and others, 2018). Portions ofNMhigh-ways 31 and 128 extend across karst terrain in Nash
Draw, and much of US 285 between the village ofLoving and the state line is underlain by gypsum bedsof the lowerRustler Formation (Figure 1). Road improve-ments have been proposed, but as of this writing thatportion of the US 285 corridor consists of a two-lanehighwaywith narrow shoulders and abundant small sink-holes along the highway right of way (Land and others,2018). During periodswhen drilling activity in the regionis high, oil !eld traf!c along US 285 is extremely heavy,earning it the nickname, “the deadliest highway inAmerica” (Wolaver, 2019, personal communication).
The Salado Formation, the middle unit of the OchoanSeries, is very poorly exposed in outcrop because of itssoluble lithology, which is !90% halite (Kelley, 1971;Holt and others, 2006). Surface exposures of the Salado
Figure 7. Map showing locations of possible subsurface cavities in the Rustler and Salado Formations. Numberedlines show locations of resistivity surveys one through six. Line four passes within 2 m of the wellhead. Much of thearea outlined in solid yellow is probably underlain by a signi!cant cavity. Areas delimited by dashed yellow lines areinterpreted to represent additional cavities or rubble zones not connected to the main void space (from Land andVeni, 2012, Figure 9).
Evaporite Karst as a Transportation and Infrastructure Geohazard in the Lower Pecos Region 71
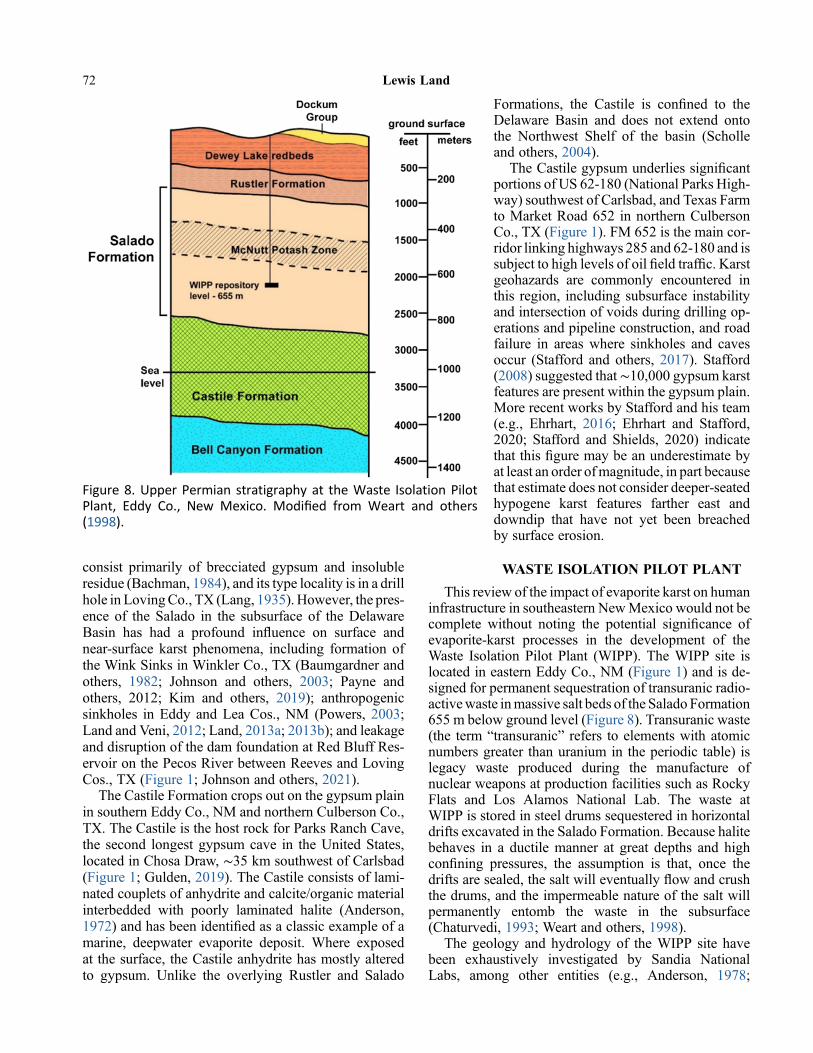
consist primarily of brecciated gypsum and insolubleresidue (Bachman, 1984), and its type locality is in a drillhole in LovingCo., TX (Lang, 1935). However, the pres-ence of the Salado in the subsurface of the DelawareBasin has had a profound in"uence on surface andnear-surface karst phenomena, including formation ofthe Wink Sinks in Winkler Co., TX (Baumgardner andothers, 1982; Johnson and others, 2003; Payne andothers, 2012; Kim and others, 2019); anthropogenicsinkholes in Eddy and Lea Cos., NM (Powers, 2003;Land and Veni, 2012; Land, 2013a; 2013b); and leakageand disruption of the dam foundation at Red Bluff Res-ervoir on the Pecos River between Reeves and LovingCos., TX (Figure 1; Johnson and others, 2021).
The Castile Formation crops out on the gypsum plainin southern Eddy Co., NM and northern Culberson Co.,TX. The Castile is the host rock for Parks Ranch Cave,the second longest gypsum cave in the United States,located in Chosa Draw, !35 km southwest of Carlsbad(Figure 1; Gulden, 2019). The Castile consists of lami-nated couplets of anhydrite and calcite/organic materialinterbedded with poorly laminated halite (Anderson,1972) and has been identi!ed as a classic example of amarine, deepwater evaporite deposit. Where exposedat the surface, the Castile anhydrite has mostly alteredto gypsum. Unlike the overlying Rustler and Salado
Formations, the Castile is con!ned to theDelaware Basin and does not extend ontothe Northwest Shelf of the basin (Scholleand others, 2004).
The Castile gypsum underlies signi!cantportions of US 62-180 (National Parks High-way) southwest of Carlsbad, and Texas Farmto Market Road 652 in northern CulbersonCo., TX (Figure 1). FM 652 is the main cor-ridor linking highways 285 and 62-180 and issubject to high levels of oil !eld traf!c. Karstgeohazards are commonly encountered inthis region, including subsurface instabilityand intersection of voids during drilling op-erations and pipeline construction, and roadfailure in areas where sinkholes and cavesoccur (Stafford and others, 2017). Stafford(2008) suggested that !10,000 gypsum karstfeatures are present within the gypsum plain.More recent works by Stafford and his team(e.g., Ehrhart, 2016; Ehrhart and Stafford,2020; Stafford and Shields, 2020) indicatethat this !gure may be an underestimate byat least an order ofmagnitude, in part becausethat estimate does not consider deeper-seatedhypogene karst features farther east anddowndip that have not yet been breachedby surface erosion.
WASTE ISOLATION PILOT PLANT
This review of the impact of evaporite karst on humaninfrastructure in southeastern NewMexico would not becomplete without noting the potential signi!cance ofevaporite-karst processes in the development of theWaste Isolation Pilot Plant (WIPP). The WIPP site islocated in eastern Eddy Co., NM (Figure 1) and is de-signed for permanent sequestration of transuranic radio-activewaste inmassive salt beds of the Salado Formation655 m below ground level (Figure 8). Transuranic waste(the term “transuranic” refers to elements with atomicnumbers greater than uranium in the periodic table) islegacy waste produced during the manufacture ofnuclear weapons at production facilities such as RockyFlats and Los Alamos National Lab. The waste atWIPP is stored in steel drums sequestered in horizontaldrifts excavated in the Salado Formation. Because halitebehaves in a ductile manner at great depths and highcon!ning pressures, the assumption is that, once thedrifts are sealed, the salt will eventually "ow and crushthe drums, and the impermeable nature of the salt willpermanently entomb the waste in the subsurface(Chaturvedi, 1993; Weart and others, 1998).
The geology and hydrology of the WIPP site havebeen exhaustively investigated by Sandia NationalLabs, among other entities (e.g., Anderson, 1978;
Figure 8. Upper Permian stratigraphy at the Waste Isolation PilotPlant, Eddy Co., New Mexico. Modi!ed from Weart and others(1998).
72 Lewis Land

Powers and others, 1978; Weart, 1983; Bachman, 1985;Powers, 1996 among a greatmany others). Nevertheless,as with all proposed radioactive waste disposal facilities,the WIPP site is controversial (e.g., Chaturvedi, 1993;Hill, 2003). Local residents in Carlsbad for the mostpart welcomed the facility, because construction andmaintenance ofWIPP are compatiblewith skills requiredfor work in the potash mines east of Carlsbad, an impor-tant component of the local economy (Weart and others,1998). However, as the site was developed it attractedmany protestors. Because WIPP is located !13 kmeast of Nash Draw, some workers have proposed thatkarstic conduits developed in the Rustler Formationand other soluble surface rocks might provide avenuesfor leakage of radioactivewaste to the surface, ultimatelycontaminating water resources in the Pecos River(Phillips, 1987; Hill, 2003). A complete discussion ofthe WIPP site is beyond the scope of this paper. How-ever, it is one of the few instances this author is awareof when the subject of karst became a volatile politi-cal topic.
CONCLUSIONS
Karst features formed in carbonate bedrock in south-eastern NewMexico have a global reputation. However,evaporite-karst processes and phenomena have had a fargreater human impact. Manifestations of evaporite karstare ubiquitous in the lower Pecos region and have had aprofound in"uence on the geology, hydrology, economy,and human infrastructure of southeastern New Mexicoand far west Texas.
REFERENCES CITED
Anderson, R.Y., Dean, W.E Jr., Kirkland, D.W., Snider,H.I., 1972, Permian varved Castile evaporitesequence, west Texas and New Mexico: GeologicalSociety of America, Bulletin, Vol. 83, p. 59-86.
Anderson, R.Y., 1978, Report to Sandia Laboratories ondeep dissolution of salt, northern Delaware Basin,New Mexico: Copy on !le in the Sandia WIPPCentral Files, Sandia National Laboratories,Albuquerque, NM as WPO29527-WPO29530.
Bachman, G.O., 1980, Regional geology and Cenozoichistory of the Pecos Region, southeastern NewMexico: US Geological Survey, Open File Report80-1099, 117 p.
Bachman, G.O., 1981, Geology of Nash Draw, EddyCounty, NM: US Geological Survey, Open-FileReport 81-31, 10 p.
Bachman, G.O., 1984, Regional geology of Ochoanevaporites, northern part of Delaware Basin: NewMexico Bureau of Mines and Mineral Resources,Circular 184, 22 p.
Bachman, G.O., 1985, Assessment of near-surface dis-solution at and near the Waste Isolation Pilot Plant(WIPP), southeastern New Mexico: Albuquerque(NM), Sandia National Laboratories, ContractorReport SAND84-7178, 33 p.
Bachman, G.O., 1987, Karst in evaporites in southeast-ernNewMexico:Albuquerque (NM), SandiaNationalLaboratories, Contractor Report SAND86-7078, 82 p.
Bangsund, W.J., Johnson, K.S., 2013, Evaluating karstrisk at proposed windpower projects, in: Land, L.,Doctor, D.H., and Stephenson, J.B., eds., Proceedingsof theThirteenthMultidisciplinaryConferenceonSink-holes and the Engineering and Environmental Impactof Karst, Carlsbad, New Mexico: National Cave andKarst Research Institute, Symposium 2, p. 27-36.
Baumgardner, R.W., Jr., Hoadley,A.D., Goldstein,A.G.,1982, Formation of the Wink Sink, a salt dissolutionand collapse feature, Winkler County, Texas: TheUniversity of Texas at Austin, Bureau of EconomicGeology, Report of Investigations 114, 38 p.
Belski, D., ed., 1992, GYPKAP Report volume #2:Southwestern Region of the National SpeleologicalSociety, Albuquerque (NM), 56 p.
Chaturvedi, L., 2003, WIPP-related geological issues,in: Love, D.W., Hawley, J.W., Kues, B.S., Adams,J.W., Austin, G.S., Barker, J.M., 1993, eds.: NewMexico Geological Society Guidebook 44, Carlsbadregion, New Mexico and west Texas, p. 331-338.
Cox, E.R., 1967, Geology and hydrology between LakeMcMillan and Carlsbad Springs, Eddy Co., NewMexico: US Geological Survey, Water-Supply Paper1828, 48 p.
Decker, D., Land, L., and Luke, B., 2021, Geophysicalcharacterization of playa lakes in the gypsum karst ofsoutheastern New Mexico and West Texas, USA, in:Johnson,K.S., Land, L., andDecker, D.D., eds., Evap-orite karst in the Greater Permian Evaporite Basin(GPEB) of Texas, New Mexico, Oklahoma, Kansas,and Colorado: Oklahoma Geological Survey,Circular 113.
Dinwiddie, G.A., and Clebsch, A., Jr., 1973, Waterresources of Guadalupe County, New Mexico: NewMexico Bureau of Mines and Mineral Resources,Hydrologic Report 3, 43 p.
Eaton, J., ed., 1987, GYPKAP 1987 Annual Report:Southwestern Region of the National SpeleologicalSociety, Alamogordo (NM), 35 p.
Elliott, L.A., Warren, J.K., 1989, Stratigraphy and depo-sitional environment of lower San Andres Formationin subsurface and equivalent outcrops: Chaves,Lincoln, and Roosevelt Counties, New Mexico:American Association of Petroleum Geologists,Bulletin 73, p. 1307-1325.
Evaporite Karst as a Transportation and Infrastructure Geohazard in the Lower Pecos Region 73

Ehrhart, J., 2016, Speleogenesis and delineation of meg-aporosity and karst geohazards through geologic cavemapping and LiDAR analyses associated with infra-structure in Culberson County, Texas: unpublishedMS thesis, Stephen F. Austin State University, Nacog-doches (TX), 159 p.
Ehrhart, J., and Stafford, K.W., 2021, Speleogeneticmodel of evaporite occurrences of the Gypsum Plainutilizing karst mapping and LiDAR analyses inCulberson County, Texas, USA, in Johnson, K.S.,Land, L., and Decker, D.D., eds., Evaporite karst inthe greater Permian Evaporite Basin (GPEB) of Texas,New Mexico, Oklahoma, Kansas, and Colorado:Oklahoma Geological Survey, Circular 113.
Forbes, J., Nance, R., 1997, Stratigraphy, sedimentol-ogy, and structural geology of gypsum caves in eastcentral New Mexico: Carbonates and Evaporites,Vol. 12, p. 64-72.
Goodbar, A.K., Powers, D.W., Goodbar, J.R., and Holt,R.M., 2020, Karst and sinkholes at Nash Draw, south-eastern New Mexico (USA), in Land, L., Kromhout,C., and Byle, M., eds, Proceedings of the SixteenthMultidisciplinary Conference on Sinkholes and theEngineering and Environmental Impact of Karst (!rstedition): National Cave and Karst Research Institute,Symposium 8, Carlsbad (NM), p. 287-298.
Gulden, B., 2019, World’s longest gypsum caves [Inter-net]: National Speleological Society, Long & DeepCaves [updated 2019 July 1; cited 2020 June 26].Available from: http://www.caverbob.com/gypcave.htm.
Hill, C.A., 1987, Geology of Carlsbad Cavern and othercaves in the Guadalupe Mountains, New Mexico andTexas: New Mexico Bureau of Mines and MineralResources, Bulletin 117, 150 p.
Hill, C.A., 1996, Geology of the Delaware Basin, Gua-dalupe, Apache and Glass Mountains: New Mexicoand West Texas: Permian Basin Section-SEPM,Publication 96-39, 480 p.
Hill, C.A., 2003. Intrastratal karst at theWIPP Site, south-eastern New Mexico, in Johnson, K.S., and Neal, J.T.,eds., Evaporite Karst and Engineering/EnvironmentalProblems in the United States: Oklahoma GeologicalSurvey, Circular 109, p. 197-209.
Hiss, W.L., 1973, Capitan aquifer observation well net-work, Carlsbad to Jal, New Mexico: New MexicoState Engineer, Technical Report 38, 76 p.
Holt, R.M., Powers, D.W., and Lowenstein, T.K., 2006,Halite depositional cycles in the upper PermianSalado Formation, in Land, L., Lueth, V., Raatz, B.,Boston, P., and Love, D., eds., Caves and Karst ofSoutheastern New Mexico: New Mexico GeologicalSociety, Guidebook 57, 78-80 p.
Hose, L.D., and Pisarowicz, J.A., eds., 2000. Thecaves of the Guadalupe Mountains Research Sympo-sium: Journal of Cave and Karst Studies, Vol. 2 (2),157 p.
Jarvis, T., 2003, The money pit: Karst failure of AnchorDam, Wyoming, in Johnson, K.S., Neal, J.T., eds.,Evaporite karst and engineering/environmental prob-lems in the United States: Oklahoma GeologicalSurvey, Circular 109, p. 271-278.
Johnson, K.S., 2008, Gypsum karst problems in con-structing dams in the USA: Environmental Geology,Vol. 53, No. 5, p. 945-950.
Johnson, K.S., Collins, E.W., and Seni, S.J., 2003,Sinkholes and land subsidence owing to salt dissolu-tion nearWink, Texas, and other sites inwestern Texasand New Mexico, in Johnson, K.S., and Neal, J.T.,eds., Evaporite karst and engineering/environmentalproblems in the United States: OklahomaGeological Survey, Circular 109, p. 183-195.
Johnson,K.S., andWilkerson, J.M., 2013,Gypsumkarstcauses relocation of proposed Cedar Ridge dam,Throckmorton County, Texas, in Land, L., Doctor,D.H., and Stephenson, J.B., eds., Proceedings of theThirteenthMultidisciplinary Conference onSinkholesand the Engineering and Environmental Impact ofKarst, Carlsbad, New Mexico: National Cave andKarst Research Institute, Carlsbad (NM), Symposium2, p. 133-139.
Johnson, K.S., Bangsund, W.J., and Hines, N.A., 2013,Gypsumkarst and potential risk in sitingwind turbinesin Blaine County, Oklahoma, in Land, L., Doctor,D.H., and Stephenson, J.B., eds., Proceedings of theThirteenthMultidisciplinary Conference onSinkholesand the Engineering and Environmental Impact ofKarst, Carlsbad, New Mexico: National Cave andKarst Research Institute, Carlsbad (NM), Symposium2, p. 151-159.
Johnson, K.S., Shoemaker, R.A., Charlton, J., andParker, C., 2021, Evaporite karst in the PermianRustler, Salado, and Castile Formations at Red BluffDamon the PecosRiver, Loving andReevesCounties,Texas, in Johnson, K.S., Land, L., and Decker, D.D.,eds., Evaporite karst in the Greater Permian EvaporiteBasin (GPEB) of Texas, New Mexico, Oklahoma,Kansas, and Colorado: Oklahoma GeologicalSurvey, Circular 113.
Kelley, V.C., 1971,Geology of the Pecos country, South-eastern New Mexico: New Mexico Bureau of Minesand Mineral Resources, Memoir 24. 78 p.
Kelley, V.C., 1972, Geology of the Santa Rosa area, inKelley, V.C., and Trauger, F.D., eds., East CentralNew Mexico: New Mexico Geological Society,Guidebook 23, p. 218-220.
74 Lewis Land

Kelley, V.C., Kelley, R.W., 1972, Road log of SantaRosa, Clines Corners, Encino, Duran, and Vaughncountry, in Kelley, V.C., and Trauger, F.D., eds.,East Central New Mexico: New Mexico GeologicalSociety, Guidebook 23, p. 56-64.
Kim, J.W., Lu, Z., and Kaufman, J., 2019, Evolution ofsinkholes over Wink, Texas, observed by high-resolution optical and SAR imagery: Remote Sensingof Environment, 222, p. 119-232.
Kottlowski, F.E., 1985, Shoreline facies of the YesoFormation in the northern Pedernal Hills, in Lucas,S.G., and Zidek, J., eds., Santa Rosa area-Tucumcariregion: New Mexico Geological Society, Guidebook36, p. 167-169.
Gonzalez, R.A., and Woodward, L.A., 1972, Petrologyand structure of Precambrian rocks of the PedernalHills, New Mexico, in Kelley, V.C., and Trauger,F.D., eds., East Central New Mexico: New MexicoGeological Society, Guidebook 23, p. 144-147.
Lang, W.B., 1935, Upper Permian formations of Dela-ware Basin of Texas and New Mexico. AmericanAssociation of Petroleum Geologists, Bulletin 19,p. 262-270.
Land, L., 2003, Evaporite karst and regional groundwater circulation in the lower Pecos Valley inJohnson, K.S., and Neal, J.T., eds, Evaporite karstand engineering/environmental problems in the UnitedStates: Oklahoma Geological Survey, Circular 109,p. 227-232.
Land, L., 2009, The impact of hypogenic processes onwater resources in the arid southwest: Examplesfrom the lower Pecos region of New Mexico, USA,in Stafford, K.W., Land, L., Veni, G., eds., Advancesin hypogene karst studies: National Cave and KarstResearch Institute, Symposium 1, p. 149-156.
Land, L., 2013a, Geophysical records of anthropogenicsinkhole formation in the Delaware Basin region,southeast New Mexico and west Texas, USA: Carbo-nates and Evaporites, Vol. 28 (1-2), p. 183-190.
Land, L., 2013b, Evaporite karst in the Permian Basinregion of west Texas and southeastern New Mexico:The human impact, in Land, L., Doctor, D.H., andStephenson, J.B., eds., Proceedings of the ThirteenthMultidisciplinary Conference on Sinkholes and theEngineering and Environmental Impact of Karst,Carlsbad, New Mexico: National Cave and KarstResearch Institute, Carlsbad (NM), Symposium 2,p. 113-121.
Land, L., 2016, Overview of fresh and brackish waterquality in NewMexico: NewMexico Bureau of Geol-ogy and Mineral Resources, Open-File Report 583:http://geoinfo.nmt.edu/publications/open!le/downloads/500-599/583/OFR-583_NM_BrackishHR.pdf
Land, L., Lueth, V., Raatz, B., Boston, P., and Love, D.,eds, 2006, Caves and Karst of Southeastern NewMexico: NewMexico Geological Society, Guidebook57, 344 p.
Land, L., and Love, D., 2006, Third Day Road Log, inLand, L., Lueth, V., Raatz, B., Boston, P., and Love,D., eds., 2006, Caves and Karst of SoutheasternNew Mexico: New Mexico Geological Society,Guidebook 57, p. 85-96.
Land, L., andBurger, P., 2008,Rapid recharge events in akarstic aquifer: An example from Lake of the WhiteRoses, Lechuguilla Cave, NM, inYuhr, L., Alexander,E.C. Jr., and Beck, B., eds., Proceedings of the Elev-enth Multidisciplinary Conference on Sinkholes andthe Engineering and Environmental Impacts of Karst,Tallahassee, Florida: ASCE Geotechnical SpecialPublication 183, p. 396-403.
Land, L., and Aster, R., 2009, Seismic recordings of ananthropogenic sinkhole collapse, inProceedings of theSymposium on the Application of Geophysics toEngineering and Environmental Problems: Environ-mental and Engineering Geophysical Society. 2009Annual Meeting, Fort Worth, Texas, p. 511-519.
Land, L., and Newton, B.T., 2008, Seasonal and long-term variations in hydraulic head in a karstic aquifer:Roswell Artesian Basin, New Mexico: Journal of theAmerican Water Resources Association, Vol. 44,p. 175-191.
Land, L., and Huff, G.F., 2010, Multi-tracer investiga-tion of groundwater residence time in a karstic aquifer:Bitter Lake National Wildlife Refuge, New Mexico,USA: Hydrogeology Journal, Vol. 18, p. 455-472.
Land, L., and Veni, G., 2012, Electrical resistivity sur-veys of anthropogenic karst phenomena, southeasternNew Mexico: New Mexico Geology, Vol. 34 (4),p. 117-125.
Land, L., Cikoski, C.K., and Veni, G., 2018, Sinkholesas transportation and infrastructure geohazards inmixed evaporite-siliciclastic bedrock, southeasternNew Mexico, in Sasowsky, I.D., Byle, M.J., andLand, L., eds., Proceedings of the FifteenthMultidisciplinary Conference on Sinkholes and theEngineering and Environmental Impact of Karst,Shepherdstown, WV: National Cave and KarstResearch Institute, Carlsbad (NM), Symposium 7,p. 367-377.
Lee, W.T., 1925, Erosion by solution and !ll, in Contri-butions to the geology of the United States, 1923-24:US Geological Survey, Bulletin 760C, p. 107-121.
Lee, J., ed., 1996, GYPKAP report volume 3, January1992-April 1996: Southwestern Region of theNational Speleological Society, Alamogordo (NM),68 p.
Evaporite Karst as a Transportation and Infrastructure Geohazard in the Lower Pecos Region 75
Lorenz, J.C., 2006, Assessment of the geological evi-dence for karst in the Rustler Formation at theWIPP site, in Land, L., Lueth, V., Raatz, B., Boston,P., andLove,D., eds., Caves andKarst of SoutheasternNew Mexico: New Mexico Geological Society,Guidebook 57, p. 243-252.
Love, D.W., Hawley, J.W., Kues, B.S., Adams, J.W.,Austin, G.S., and Barker, J.M., 1993, eds., Carlsbadregion, New Mexico and West Texas: New MexicoGeological Society, Guidebook 44, 357 p.
Lyford, F.P., 1973,Valley!ll in theRoswell-Artesia area,New Mexico: US Geological Survey, Open-FileReport 73-163, 26 p.
Milanovic, P., 2002, Subsidence hazards as a conse-quence of dam, reservoir and tunnel construction:International Journal of Speleology, Vol. 31 (1/4),p. 169-180.
Milanovic, P., 2011, Dams and reservoirs in karst, invan Beynen, P., ed., Karst Management: Springer,Dordrecht, p. 47-73.
Mohammadi, Z., 2007, Hydrogeological uncertainties indelineation of leakage at karst dam sites, Zagrosregion, Iran: Journal of Cave and Karst Studies, Vol.69 (3), p. 305-317.
Motts, W.S., and Cushman, R.L., 1964, An appraisal ofthe possibilities of arti!cial recharge to ground-watersupplies in part of the Roswell Basin, New Mexico:US Geological Survey, Water-Supply Paper 1785,86 p.
Paine, J.G., Buckley, S.M., Collins, E.W., and Wilson,C.R., 2012, Assessing collapse risk in evaporitesinkhole-prone areas usingmicrogravimetry and radarinterferometry: Journal of Environmental and Engi-neering Geophysics, Vol. 17 (2), p. 75-87.
Palmer, A.N., and Palmer, M.V., 2000, Hydrochemicalinterpretation of cave patterns in the GuadalupeMountains, New Mexico: Journal of Cave and KarstStudies, Vol. 62 (2), p. 91-108.
Phillips, R.H., 1987, The prospects for regional ground-water contamination due to karst landforms in Mesca-lero Caliche at the WIPP site near Carlsbad, NewMexico: unpublished PhD dissertation, Universityof Oregon, Eugene (OR), 341 p.
Powers, D.W., 1996, Tracing early breccia pipe studies,Waste Isolation Pilot Plant, southeasternNewMexico:A study of the documentation available and decision-making during the early years of WIPP: SandiaNational Laboratories, Report SAND94-0991, 53 p.
Powers, D.W., 2003, Jal sinkhole in southeastern NewMexico: Evaporite dissolution, drill holes, and thepotential for sinkhole development, in Johnson, K.S.,and Neal JT, eds., Evaporite Karst and Engineer-ing/Environmental Problems in the United States:
Oklahoma Geological Survey, Circular 109, p.219-226.
Powers, D.W., Lambert, S.J., Shaffer, S.E., Hill, L.R.,and Weart, W.D., eds, 1978, Geological characteriza-tion report, Waste Isolation Pilot Plant (WIPP) Site,Southeastern New Mexico: Sandia NationalLaboratories, Report SAND78-1596, Vol. 1-2.
Powers, D.W., and Owsley, D., 2003, Field survey ofevaporite karst along New Mexico Highway 128realignment routes, in Johnson, K.S., and Neal, J.T.,eds., Evaporite Karst and Engineering/EnvironmentalProblems in the United States: Oklahoma GeologicalSurvey: Circular 109, p. 233-240.
Powers, D.W., Beauheim, R.L., Holt, R.M., andHughes,D.L., 2006, Evaporite karst features and processes atNash Draw, Eddy County, New Mexico, in Land, L.,Lueth, V., Raatz, B., Boston, P., and Love, D., eds.,Caves and Karst of Southeastern New Mexico:New Mexico Geological Society, Guidebook 57,p. 253-266.
Robinson, T.W., and Lang, W.B., 1938, Geology andground-water conditions of the Pecos River valleyin the vicinity of Laguna Grande de la Sal, NewMexico: New Mexico State Engineer, 12th and 13th
Biennial Reports, p. 79-100.Robison, D.M., 2015, Successful Foundation Prepara-tions in Karst Bedrock of the Masonry Section ofWolf Creek Dam, in Doctor, D.H., Land, L., andStephenson, J.B., eds., Proceedings of the FourteenthMultidisciplinary Conference on Sinkholes and theEngineering and Environmental Impact of Karst, Ro-chester,Minnesota: National Cave andKarst ResearchInstitute, Carlsbad (NM), Symposium 5, p. 595-604.
Rogers, J.D., 2015, Hales Bar and the pitfalls of con-structing dams on karst, in Doctor, D.H., Land, L.,and Stephenson, J.B., eds., Proceedings of the Four-teenth Multidisciplinary Conference on Sinkholesand the Engineering and Environmental Impact ofKarst, Rochester, Minnesota: National Cave andKarst Research Institute, Carlsbad (NM), Symposium5, XIV.
Scholle, P.A., 2003, Geologic map of NewMexico: NewMexico Bureau of Geology and Mineral Resources,scale 1:500,000.
Scholle, P.A., Goldstein, R.H., and Ulmer-Scholle, D.S.,2004, Classic upper Paleozoic reefs and bioherms ofwest Texas and New Mexico: New Mexico Instituteof Mining and Technology, 166 p.
Silver, B.A., Todd, R.G., 1969, Permian cyclic strata,northern Midland and Delaware Basins, west Texasand southeastern NewMexico. American Associationof Petroleum Geologists, Bulletin, Vol. 53, p.2223-2251.
76 Lewis Land

Stafford, K.W., 2006, Gypsum karst of the Chosa Drawarea, in Land, L., Lueth, V., Raatz, B., Boston, P., andLove, D., eds., Caves and Karst of Southeastern NewMexico: NewMexico Geological Society, Guidebook57. p. 82-83.
Stafford, K.W., Rosales-Lagarde, L., and Boston, P.J.,2008, Castile evaporite karst potentialmap of theGyp-sum Plain, Eddy County, NewMexico and CulbersonCounty, Texas: A GIS methodological comparison:Journal of Cave and Karst Studies, Vol. 70 (1),p. 35-46.
Stafford, K.W., Brown, W.A., Ehrhart, J.T., Majzoub,A.F., andWoodard, J.D., 2017, Evaporite karst geoha-zards in the Delaware Basin, Texas: Review of tradi-tional karst studies coupled with geophysical andremote sensing characterization: International Journalof Speleology, Vol. 46 (2), p. 169-180.
Stafford, K.W., and Shields, J., 2021, Speleogenetic evo-lution of Castile karst manifestations of the DelawareBasin, west Texas and southeastern New Mexico,in Johnson, K.S., Land, L., and Decker, D.D., eds.,Evaporite karst in the greater Permian EvaporiteBasin (GPEB) of Texas, New Mexico, Oklahoma,Kansas, and Colorado: Oklahoma GeologicalSurvey, Circular 113.
Sweeting, M.M., 1972, Karst and solution phenomenain the Santa Rosa area, New Mexico, in Kelley, V.C.,and Trauger, F.D., eds., East Central New Mexico:New Mexico Geological Society, Guidebook 23,p. 168-170.
Theis, C.V., 1938, Origin of water at Major JohnsonSprings near Carlsbad, New Mexico: New MexicoState Engineer, 12th-13th Biennial Reports, 1934-1938, p. 251-252.
Trauger, FD., 1972, Ground water in east-centralNew Mexico, in Kelley, V.C., and Trauger, F.D.,eds., East Central New Mexico: New MexicoGeological Society, Guidebook 23, p. 201-207.
UNESCO. 2020, World heritage list [internet]. Paris(FR): United Nations Educational, Scienti!c and Cul-tural Organization [UNESCO]. [cited 2020-07-22].Available from: https://whc.unesco.org/en/list/
US Bureau of Reclamation, 1957, Summary of geologi-cal material, terminal storage for the Carlsbad project:US Bureau of Reclamation, Project DevelopmentDivision, Albuquerque Project Of!ce, open-!lereport, May 1957, 55 p.
Vine, J.D., 1963, Surface geology of the Nash Drawquadrangle, Eddy Co., New Mexico: US GeologicalSurvey, Bulletin 1141-B, 46 p.
Ward, R.F., Kendall, C.G., andHarris, P.M., 1986,UpperPermian (Guadalupian) facies and their associationwith hydrocarbons – Permian Basin, west Texas andNew Mexico: American Association of petroleumGeologists, Bulletin, Vol. 70, p. 239-262.
Weart, W.D., 1983, Summary evaluation of the WasteIsolation Pilot Plant (WIPP) site suitability: SandiaNational Laboratories, Report SAND83-0450, 31 p.
Weart,W.D., Rempe, N.T., and Powers, D.W., 1998, TheWaste Isolation Pilot Plant: Geotimes, October, 1998.
Weber, R.H., and Kottlowski, F.E., 1959, Gypsum re-sources of New Mexico: New Mexico Bureau ofMines and Mineral Resources, Bulletin 68, 68 p.
Welder, G.E., 1983, Geohydrologic framework of theRoswell Ground-Water Basin, Chaves and EddyCounties, New Mexico: New Mexico State Engineer,Technical Report 42, 28 p.
Evaporite Karst as a Transportation and Infrastructure Geohazard in the Lower Pecos Region 77


ABSTRACT.—Southeastern New Mexico is host to many karst features, includ-ing caves, swallets, sinkholes, solution tubes, and springs, which are at risk of com-promise by ongoing petroleum extraction. Playa lakes are shallow depressionsfound on gypsum bedrock in southeastern New Mexico and west Texas, and onQuaternary alluvial gravels in eastern New Mexico. These depressions are curiousin that some of them are obviously linked to underground conduits via surfaceopenings, whereas others have no such connections. These features could becover-collapse sinkholes that have !lled in with Quaternary windblown alluviumand soil, or they could be solutionally formed via pooling of rainwater, dissolutionof the gypsum and re-precipitation as the water evaporates, and subsequent de"a-tion of the unconsolidated gypsum by wind. In this study, we use !eld observationsand three complimentary geophysical methods (ground penetrating radar, electricalresistivity imaging, and surface-wave seismic) to make inferences about the sub-surface structure of these depressions and their relationship to the karst featureslocated in and around them. The speleogenetic model that we develop from thedata indicates that these playa lakes could well be karst features, as opposed to sur-face hydrologic features, and therefore should be treated the same way as otherkarst features in the region when determining the routing of linear infrastructureand the placement of resource-extraction-related pads and ponds.
INTRODUCTION
Background
Playa lakes are shallow, usually dry depressions foundin soils above gypsum bedrock in the Delaware Basin insoutheastern New Mexico and west Texas (Rustler andCastile Formations), the back-reef facies of the Guada-lupe Reef as far north as Vaughn and Santa Rosa, NewMexico (Seven Rivers Formation), and even on Quater-nary alluvial gravels in eastern New Mexico (OgallalaFormation). Many of these shallow depressions areonly visible because they either host an abundance ofsalt-tolerant plant life or, in some cases, no plant lifeat all. These depressions are curious in that some ofthem are obviously linked to underground conduits
(caves) via surface openings (swallets), whereas othershave no such features (Figure 1).
The Delaware Basin and back-reef facies of theCapitan Reef escarpment are currently undergoing rapidinfrastructure build-up as petroleum exploration, discov-ery, and exploitation escalate. It is necessary to determineif these features provide pathways from the surface to theaquifer, and if so, to make a case for avoiding them, ifpossible, during pipeline and well-pad construction,road building, power-line installation, and other infra-structure development (Bureau of Land Management,2015). Many karst features are already known in theregion, including caves, swallets, cover-collapse sink-holes, caprock-collapse sinkholes, solution tubes, andsprings. Currently, the recommended buffer for these
Decker, D. D.; Land, L.; and Luke, B., 2021, Geophysical Characterization of Playa Lakes in the Gypsum Karst ofSoutheastern New Mexico, USA, in Johnson, K. S.; Land, Lewis; and Decker, D. D. (eds.), Evaporite Karst in theGreater Permian Evaporite Basin (GPEB) of Texas, New Mexico, Oklahoma, Kansas, and Colorado: OklahomaGeological Survey, Circular 113, p. 79-92.
0LMBIPNB�Geological�Survey�Circular�113,�2021
Geophysical�Characterization�of�Playa�Lakes�in�the�Gypsum�Karst�of�Southeastern�New�Mexico,�USA
David�D.�DeckerSouthwest�Geophysical�Consulting,�LLC,�Albuquerque,�New�Mexico
Lewis�LandNational�Cave�and�Karst�Research�Institute,�Carlsbad,�New�Mexico
Barbara�LukeUniversity�of�Nevada,�Las�Vegas,�Las�Vegas,�Nevada
79
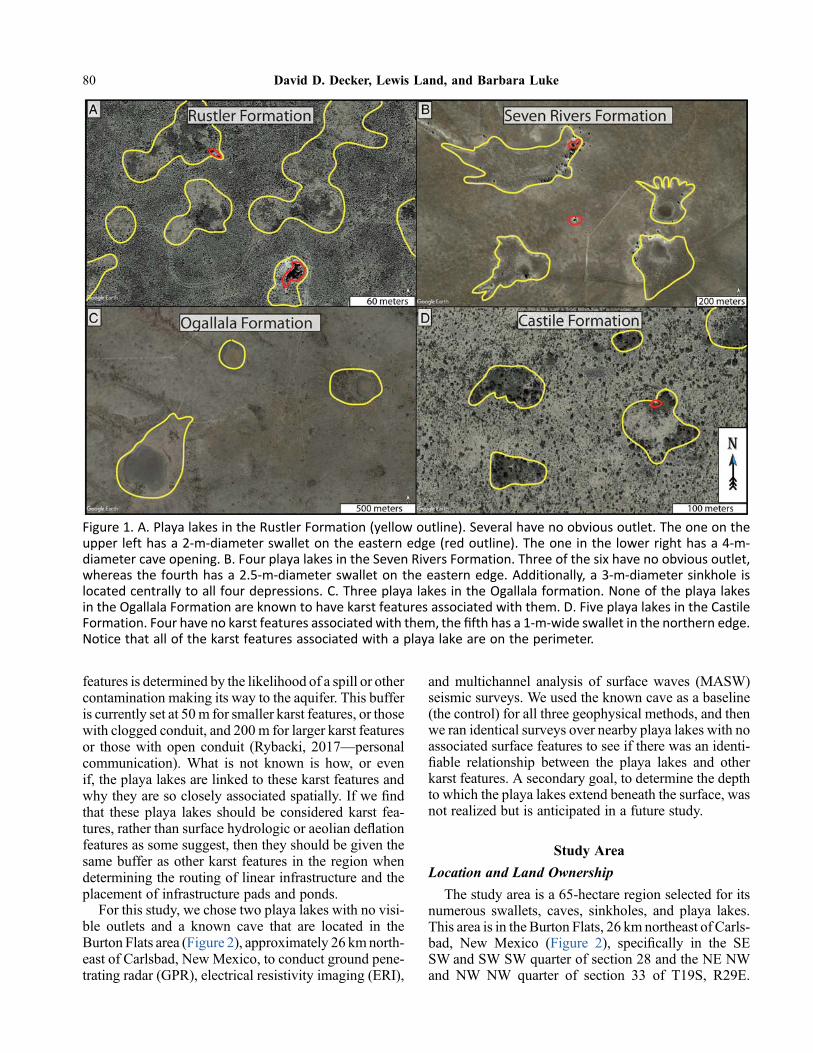
features is determined by the likelihood of a spill or othercontamination making its way to the aquifer. This bufferis currently set at 50m for smaller karst features, or thosewith clogged conduit, and 200 m for larger karst featuresor those with open conduit (Rybacki, 2017—personalcommunication). What is not known is how, or evenif, the playa lakes are linked to these karst features andwhy they are so closely associated spatially. If we !ndthat these playa lakes should be considered karst fea-tures, rather than surface hydrologic or aeolian de"ationfeatures as some suggest, then they should be given thesame buffer as other karst features in the region whendetermining the routing of linear infrastructure and theplacement of infrastructure pads and ponds.
For this study, we chose two playa lakes with no visi-ble outlets and a known cave that are located in theBurton Flats area (Figure 2), approximately 26 kmnorth-east of Carlsbad, New Mexico, to conduct ground pene-trating radar (GPR), electrical resistivity imaging (ERI),
and multichannel analysis of surface waves (MASW)seismic surveys. We used the known cave as a baseline(the control) for all three geophysical methods, and thenwe ran identical surveys over nearby playa lakes with noassociated surface features to see if there was an identi-!able relationship between the playa lakes and otherkarst features. A secondary goal, to determine the depthto which the playa lakes extend beneath the surface, wasnot realized but is anticipated in a future study.
Study Area
Location and Land Ownership
The study area is a 65-hectare region selected for itsnumerous swallets, caves, sinkholes, and playa lakes.This area is in the Burton Flats, 26 km northeast of Carls-bad, New Mexico (Figure 2), speci!cally in the SESW and SW SW quarter of section 28 and the NE NWand NW NW quarter of section 33 of T19S, R29E.
Figure 1. A. Playa lakes in the Rustler Formation (yellow outline). Several have no obvious outlet. The one on theupper left has a 2-m-diameter swallet on the eastern edge (red outline). The one in the lower right has a 4-m-diameter cave opening. B. Four playa lakes in the Seven Rivers Formation. Three of the six have no obvious outlet,whereas the fourth has a 2.5-m-diameter swallet on the eastern edge. Additionally, a 3-m-diameter sinkhole islocated centrally to all four depressions. C. Three playa lakes in the Ogallala formation. None of the playa lakesin the Ogallala Formation are known to have karst features associated with them. D. Five playa lakes in the CastileFormation. Four have no karst features associated with them, the !fth has a 1-m-wide swallet in the northern edge.Notice that all of the karst features associated with a playa lake are on the perimeter.
80 David D. Decker, Lewis Land, and Barbara Luke
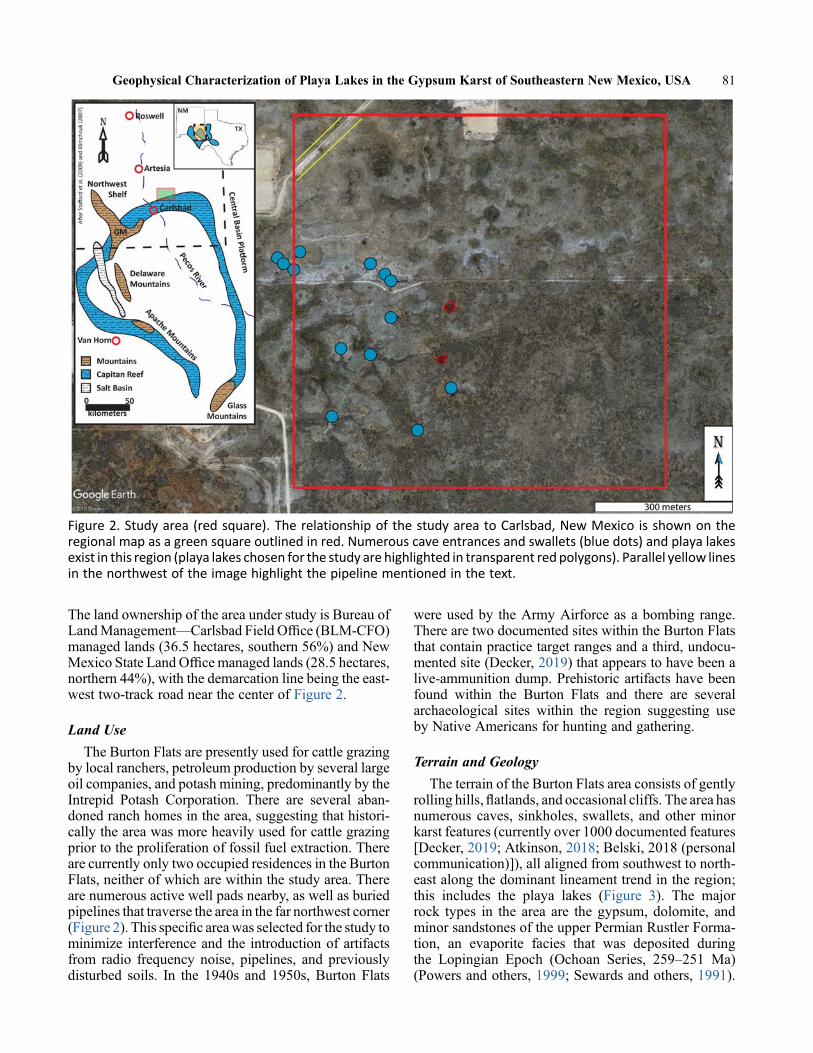
The land ownership of the area under study is Bureau ofLandManagement—Carlsbad Field Of!ce (BLM-CFO)managed lands (36.5 hectares, southern 56%) and NewMexico State Land Of!ce managed lands (28.5 hectares,northern 44%), with the demarcation line being the east-west two-track road near the center of Figure 2.
Land Use
The Burton Flats are presently used for cattle grazingby local ranchers, petroleum production by several largeoil companies, and potash mining, predominantly by theIntrepid Potash Corporation. There are several aban-doned ranch homes in the area, suggesting that histori-cally the area was more heavily used for cattle grazingprior to the proliferation of fossil fuel extraction. Thereare currently only two occupied residences in the BurtonFlats, neither of which are within the study area. Thereare numerous active well pads nearby, as well as buriedpipelines that traverse the area in the far northwest corner(Figure 2). This speci!c areawas selected for the study tominimize interference and the introduction of artifactsfrom radio frequency noise, pipelines, and previouslydisturbed soils. In the 1940s and 1950s, Burton Flats
were used by the Army Airforce as a bombing range.There are two documented sites within the Burton Flatsthat contain practice target ranges and a third, undocu-mented site (Decker, 2019) that appears to have been alive-ammunition dump. Prehistoric artifacts have beenfound within the Burton Flats and there are severalarchaeological sites within the region suggesting useby Native Americans for hunting and gathering.
Terrain and Geology
The terrain of the Burton Flats area consists of gentlyrolling hills,"atlands, and occasional cliffs. The area hasnumerous caves, sinkholes, swallets, and other minorkarst features (currently over 1000 documented features[Decker, 2019; Atkinson, 2018; Belski, 2018 (personalcommunication)]), all aligned from southwest to north-east along the dominant lineament trend in the region;this includes the playa lakes (Figure 3). The majorrock types in the area are the gypsum, dolomite, andminor sandstones of the upper Permian Rustler Forma-tion, an evaporite facies that was deposited duringthe Lopingian Epoch (Ochoan Series, 259–251 Ma)(Powers and others, 1999; Sewards and others, 1991).
Figure 2. Study area (red square). The relationship of the study area to Carlsbad, New Mexico is shown on theregional map as a green square outlined in red. Numerous cave entrances and swallets (blue dots) and playa lakesexist in this region (playa lakes chosen for the study are highlighted in transparent red polygons). Parallel yellow linesin the northwest of the image highlight the pipeline mentioned in the text.
Geophysical Characterization of Playa Lakes in the Gypsum Karst of Southeastern New Mexico, USA 81

The Rustler Formation consists, in descending order,of the Forty-Niner member (gypsum), the MagentaDolomite, the Tamarisk member (gypsum), the CulebraDolomite, and the Los Medanos member (halitic, gyp-siferous siliciclastics) (Goodbar, 2013; Powers andothers, 1999). Both the Magenta Dolomite and the Cu-lebraDolomite host shallow aquifers (Holt, 1997). In thestudy area, the local dip is to the southwest.
Caves in the Burton Flats are generally formed inthe Magenta Dolomite with horizontal entrances inblind arroyos. Occasionally, a caprock-collapse sinkholeopens directly into cave passage. These sinkholes aregenerally not associated with the playa lakes, whereasthe blind arroyos, horizontal cave entrances, and swalletsare nearly always on the edges of these playa lakes(Figures 1, 4). Some playa lakes in the region also exhibitsmall (usually less than 1 m diameter and 50 cm deep)closed swallets at or near the center of the playa lakein soil. A nearby area that has had the surface soilsremoved for installation of an impoundment pondexposed solutionally enlarged fractures, small conduits,and other epikarst features (Figure 4E). The Rustler For-mation is underlain by the Permian Salado Formation,
which is predominantly halite and is mined in this areaby the Intrepid Potash Corporation. Numerous aban-doned “wildcatter” drill holes are found throughoutthe Burton Flats which may intercept the Salado Forma-tion, allowing fresh meteoric water to in!ltrate and dis-solve the halite.
METHODS
Ground Penetrating Radar
Ground penetrating radar re"ection pro!les are cre-ated by the re"ection of radar energy from interfacesthat are created by differences in the dielectric constantbetween two types of material (e.g., rock and air), ordifferences in water saturation levels within similarmaterials (Conyers, 2014). These re"ection pro!les areinterpreted based on knowledge of the local geology,amount of recent rainfall in the area of interest, and otherfactors speci!c to the study. Depth of investigation andresolution are determined by several factors including,but not limited to, the center frequency of the antenna,soil moisture, and rock type.
Figure 3. Karst feature distribution. Black and white dots are known or suspected karst features including caves,sinkholes, and swallets. Orange lines are tectonic lineaments. Field area is the blue triangle in the upper-centralportion of the image. Note the tremendous number of white squares throughout the background image. Theseare all well pads, central tank batteries, or other fossil fuel extraction-related infrastructure. Background image:Google Earth. Image date: December 30, 2016. Image datum: WGS-84.
82 David D. Decker, Lewis Land, and Barbara Luke

AGeological Survey Systems Incorporated,D400HS350MHz, hyperstacking antenna, and SIR-4000 controlunit were used to image the top 2 m of the subsurface.A Juniper Systems Geode submeter global positioningsystem was used to georeference the radar pro!les col-lected. Radar controller settings for the GPR were: 95scans per second, 512 samples per scan, and 32 bitsper sample. A dielectric constant (!) of 14 was chosenbased on the soil type (moist gypsite) at the survey loca-tion, and a scan window of 55.4 nanoseconds was used,giving a survey depth of 2.2 m. A 10-m-long odometercalibration and a site-speci!c initialization were per-formed prior to collecting the radar re"ection pro!les.A boxcar background removal !lter set at 513 scanswas used to remove horizontal radar re"ections becauseour target was void space and irregular subsurface re-"ections. The software used for post data processingwas RADAN-7 version 7.5.18.02270. During process-ing, a high-pass !lter of 175 MHz and a low-pass !lterof 740 MHz were used to !lter out low and high fre-quency background noise, respectively. A logarithmic8-point range gain was used to enhance signal strengthat depth.
Electrical Resistivity Imaging
Electrical resistivity (ER) surveys are a common andeffective geophysical method for detection of subsurfacevoids (e.g., Land and Veni, 2012; Land, 2013; Land andAsanidze, 2015; Land and others, 2018). The basic oper-ating guideline for an ER survey involves generating adirect current between two metal electrodes implantedin the ground, while measuring the ground voltagebetween two other implanted electrodes. Given thecurrent "ow and voltage drop between the electrodes,differences in subsurface electrical resistivity can bedetermined and mapped. Modern resistivity surveysemploy an array of multiple electrodes connected withelectrical cable. Over the course of a survey, pairs of elec-trodes are activated by means of a switchbox and resis-tivity meter. The depth of investigation for a typical ERsurvey is approximately one-!fth the length of the arrayof electrodes.
Resistivity pro!les illustrate vertical and lateral varia-tions in subsurface resistivity. The presence of water orwater-saturated ground will strongly affect the resultsof a resistivity survey by indicating a low resistivityzone. Air-!lled caves or air-!lled pore space provide a
Figure 4. Karst features (Decker, 2019). A and B—Caprock-collapse sinkholes. C andD—Horizontal cave entrances onthe edges of playa lakes. E—Solution tube exposed by bulldozer (pole is 1.3 m in length for scale).
Geophysical Characterization of Playa Lakes in the Gypsum Karst of Southeastern New Mexico, USA 83

distinctive high resistivity signature, since air has near-in!nite resistivity, in contrast with the 10–15 orders ofmagnitude more conductive surrounding bedrock.
An Advanced Geosciences, Inc. SuperSting R8/IPelectrical resistivity system provided by the NationalCave and Karst Research Institute was used to collectresistivity data, employing a dipole–dipole array con!g-uration. All of the ER surveys conducted at Burton Flatsfor this project used a 56-electrode array at 2-m electrodespacing, for a target depth of investigation of approxi-mately 23 m.
ATopcon GR3 GPS instrument package was used tocollect survey-gradeGPS coordinates for each electrode.Elevation data collected during these surveys were usedto correct the resistivity data for variations in topography.Electrical resistivity data were processed and invertedusingEarthImager2D™ software. TheEarthImager soft-ware chooses a resistivity scale unique to each inversion,designed to highlight natural conditions in the subsur-face; thus, resistivity pro!les from a given survey areamay not have the same resistivity scale.
Multichannel Analysis of Surface Waves
The seismic testing followed the MASW method(Miller and others 1999; Park and others 1999; Xiaand others 1999). A surface-coupled linear array of geo-phones recorded ground vibrations generated in linewiththe sensors by a vertical impact source. The response isdominated by Rayleigh-type surface waves, whose am-plitudes are greatest at the ground surface near the sourceand decay with depth and with distance from the source.The wave transmission and decay pattern from eachsource impact are analyzed in the frequency domain us-ing processes of forward modeling and inversion to infera vertical layered pro!le of shear-wave velocity in thesubsurface. This one-dimensional pro!le is assignedspatially to the center point of the geophone group ana-lyzed. The measurement is duplicated, shifting sourceand sensor sets incrementally along the array so thatthe individual layered velocity pro!les can be mergedto create a two-dimensional vertical slice depictingshear-wave velocity beneath the array. Time-historydata were collected using a system provided by theUniversity of Nevada, Las Vegas that included aGeometrics Geode-based seismograph with 72 4.5-Hzvertical geophones coupled to the ground with spikes.The geophones were spaced 1.5 m apart to create a106.5-m-long array. A source consisting of a rubber-band assisted weight-drop type, trailer-mounted piston.Analysis was in roll-along mode, using 24-trace gathersand 6-m offset of source to nearest sensor. The sourcewas advanced in 3-m increments. All processing ofthe time histories, to include frequency-domain conver-sion, dispersion curve selection, inversion, and interpo-lation to develop the !nal shear-wave velocity image,
was completed using commercial software SurfSeisv.6 (Kansas Geological Survey).
Only one seismic array could be completed in the timeavailable because of the time- and labor-intensive natureof the data gathering, inclement weather (high winds andheavy rain), and equipment issues both related and unre-lated to the weather.
RESULTS
The control for this study was Owl Cave, which islocated on the west side of a small playa lake at the endof a 36-m-long blind arroyo. The entrance room of thecave is 5 m wide, 12 m deep, and 6 m tall (Figure 5).A 0.5-m-diameter hole in the "oor drops into a lowerlevel which, according to themap (Figure 6), corkscrewsdown to a mud-"oored room before pinching out. Theroof of the entrance room is only 1.5–2 m beneath thesurface at a point 1 m from the dripline. This locationwas chosen to maximize the returns from the GPR sinceit was not expected to see more than 2–2.5 m deep. Atthis location, the soilwas less than 5 cm in depth; gypsumbedrock composed the remainder.
Two playa lakes were chosen for the study, both inclose proximity to Owl Cave. The !rst (PL-01) waslocated 130 m east-northeast of Owl Cave. PL-01 is1 m deep and 23 m across at the location of the survey.The second (PL-02) was located 140m southeast of OwlCave. Topographically, this playa lakewas barely visibleat approximately 5–10 cm deep and was discernablemore by change in vegetation than its depth. PL-02was 25 m across at the location of the measurements.
Ground Penetrating Radar
This studywas conducted at the beginning of the localmonsoon season; therefore, the ground was wet butnot saturated. This condition provided the opportunityfor a larger than normal difference in dielectric constantbetween wet soils (14<!< 30) and cave passage(!= 1, that of air). The processed GPR data for OwlCave show negative amplitude re"ections directly abovethe cave as well as 20 m to the east, and another negativeamplitude re"ection 60 m to the west (Figure 7). Thesenegative amplitude re"ections indicate a change indielectric constant from high to low, and in this caseare consistent with changes in radar wave velocityfrommoist gypsum to air. However, since the noise "ooris between 1 and 1.5m in depth, we are likely only seeingthe very top of the cave or just the air-!lled fracturesdirectly above the cave roof rather than the cave itself.Further to the east, the radar energy is highly attenuatedby moist soil and clay in the bed of the small playa lakethat feeds Owl Cave.
At PL-02, there were high amplitude, negative radarre"ections just outside of and along the edges of the
84 David D. Decker, Lewis Land, and Barbara Luke

playa lake (black and white re"ections) that might indi-cate fractured rock. Lower amplitude returns (yellow)indicate a change in dielectric and most likely are wherethe moisture from the recent rains has in!ltrated into thesubsurface. This same moisture response is seen withinthe playa lake, along with minor attenuation of the signalbecause of clay and soil.
Ground penetrating radar survey was not conductedover PL-01 because of the amount of vegetation andthe local topographic relief.
Electrical Resistivity
High resistivity anomalies may represent either air-!lled void space in the subsurface (caves or potentialsinkholes) or brecciated/leached zones in gypsum bed-rock with air-!lled pore space (Land and Asanidze,2015). Laterally continuous layers of high or low resis-tivity may re"ect near-surface stratigraphy, such as gyp-sum or dolomite beds (generally higher resistivity), or
mudstone/shale layers (lower resistivity). Very near-surface low resistivity layers may indicate water-saturated !ne-grained sediment accumulated in surfacedepressions. In the case of Owl Cave, both of the voidspaces that underlie the array show up unequivocally,along with another possible cave to the west. The lowresistivity clays of the Owl Cave playa lake are visiblejust to the east at ground level (BF-1, Figure 8,upper panel).
PL-02 (BF-2 in Figure 8, lower panel) also shows thelow resistivity clay-rich playa "oor along with what weinterpret as a possible "uid "ow channel along the edgesand fractured or brecciated rock beneath, based on resis-tivity values that are high (22,000 Ohm-m), but not ashigh as Owl Cave (100,000 Ohm-m). We see a similarpattern, less pronounced, andwith lower overall resistiv-ity contrasts at PL-01 (Figure 9, upper panel). Resultsshow a possible "uid "ow conduit along the westernedge as well as the very low resistivity clays of the playa
Figure 5. Owl Cave entrance room. Dr. Lewis Land (left panel) and !eld assistants Michael Jones and David Brum-baugh (both panels) for scale. Left panel view is to the southwest. Right panel view is to the north.
Geophysical Characterization of Playa Lakes in the Gypsum Karst of Southeastern New Mexico, USA 85
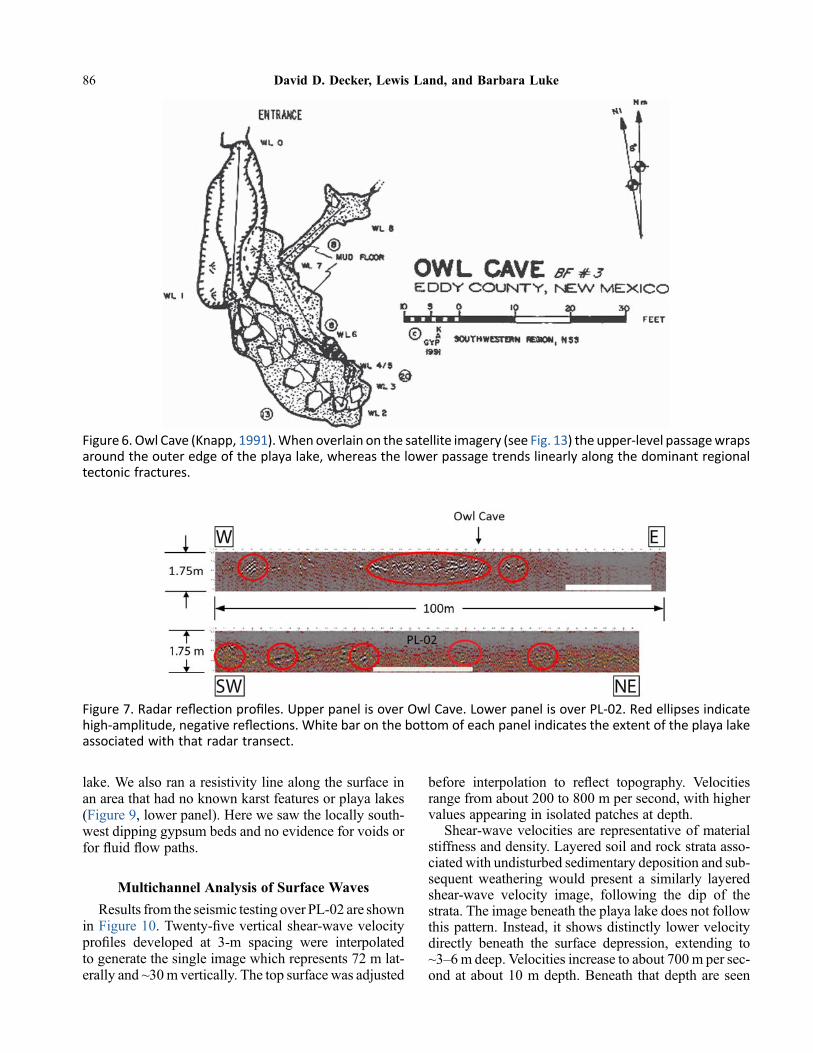
lake. We also ran a resistivity line along the surface inan area that had no known karst features or playa lakes(Figure 9, lower panel). Here we saw the locally south-west dipping gypsum beds and no evidence for voids orfor "uid "ow paths.
Multichannel Analysis of Surface Waves
Results from the seismic testing over PL-02 are shownin Figure 10. Twenty-!ve vertical shear-wave velocitypro!les developed at 3-m spacing were interpolatedto generate the single image which represents 72 m lat-erally and ~30m vertically. The top surface was adjusted
before interpolation to re"ect topography. Velocitiesrange from about 200 to 800 m per second, with highervalues appearing in isolated patches at depth.
Shear-wave velocities are representative of materialstiffness and density. Layered soil and rock strata asso-ciated with undisturbed sedimentary deposition and sub-sequent weathering would present a similarly layeredshear-wave velocity image, following the dip of thestrata. The image beneath the playa lake does not followthis pattern. Instead, it shows distinctly lower velocitydirectly beneath the surface depression, extending to~3–6m deep. Velocities increase to about 700m per sec-ond at about 10 m depth. Beneath that depth are seen
Figure 6. Owl Cave (Knapp, 1991).When overlain on the satellite imagery (see Fig. 13) the upper-level passagewrapsaround the outer edge of the playa lake, whereas the lower passage trends linearly along the dominant regionaltectonic fractures.
Figure 7. Radar re"ection pro!les. Upper panel is over Owl Cave. Lower panel is over PL-02. Red ellipses indicatehigh-amplitude, negative re"ections. White bar on the bottom of each panel indicates the extent of the playa lakeassociated with that radar transect.
86 David D. Decker, Lewis Land, and Barbara Luke

lateral velocity "uctuations consistent with disturbedground, possibly broken rock and uncemented matrixassociated with rock stoping/brecciation. The highestvelocities in the image appear beyond the edges of theplaya, perhaps beyond the zone of disturbance from a
breccia pipe. However, the velocity "uctuations arenot limited to the zone directly adjacent to the playa.
When interpreting the results of a surface-wave sur-vey, one should bear in mind that con!dence is highestat shallow depths, where the wave energy concentrates,
Figure 8. Upper panel: resistivity line BF-1 over Owl Cave. Lower panel: resistivity line BF-2 over PL-02. Notice thatthe color scales are different.
Figure 9. Upper panel: resistivity line BF-3 over PL-01. Lower panel: resistivity line BF-4 over local bedrock with nokarst features. Notice that the color scales are similar, but not the same. The panels show the strata dipping gentlytoward the southwest.
Geophysical Characterization of Playa Lakes in the Gypsum Karst of Southeastern New Mexico, USA 87

Figure 10. MASW results over PL-02.
Figure 11. Hypothesis 1. Progression of sinkhole development. A: Prekarst formation. B: Fracture or drill hole allowsfresh meteoric water to penetrate to the Salado Formation. C: Dissolution of halite begins. D–F: Stoping occurs. G:Void breaches surface forming sinkhole. H:Windblown deposits begin to !ll brecciated sinkhole. I: Playa lake forms.Not shown: secondary voids begin to form along and within the brecciated edge of the playa lake.
88 David D. Decker, Lewis Land, and Barbara Luke

and away from the ends of the array, where data densitydeclines.
DISCUSSION
Weconsider two hypotheses for the formation of theseplaya lakes. In the !rst (Figure 11), playa lakes areformed by dissolution at depth, possibly as deep as theSalado Formation. Voids are formed by this dissolutionand stope to the surface, where the newly created brecciapipes are slowly in!lled by aeolian and biological pro-cesses. Fractures formed by the collapse of the surfaceallow water in!ltration, which dissolves conduits andvoids in the gypsum bedrock along the edges of the playalakes forming the caves and swallets during a secondaryspeleogenetic episode. In this case, we would expect thegeophysical data to show a demarcation between theedge of the breccia pipe and the surrounding strata.
In the second hypothesis (Figure 12), playa lakes aresolutionally formed via pooling of rainwater in terrain-induced topographic low areas. Dissolution of gypsumat the surface within these areas begins when meteoric
water undersaturated in gypsum pools in these low spotsand is re-precipitated as a gypsite powder as the waterevaporates. Subsequent de"ation of the unconsolidatedgypsum by wind occurs, thereby preferentially makingthe area available for more rainwater collection, enhanc-ing the process. As dissolution at the surface progresses,voids and conduits already present in the subsurface aretruncated by the edges of the playa lake as it growsdeeper. In this case, we would expect to see no boundarybetween the playa lake proper and the surrounding strata,nor any brecciated material directly underneath.
When the results of the ERI and GPR data over OwlCave are studied, the void spaces (and fractures abovethem) stand out prominently, as do the clay-!lled por-tions of the associated playa lake. Alignment of the resis-tivity and radar pro!les with the satellite imagery andsuperimposed cave map (Figure 13) clearly demon-strates that mapped voids in the subsurface coincidewith resistivity and radar anomalies. The playa lake atthe east end of both pro!les displays as low resistivityand attenuated radar energy, as expected. We conductedpostprocessing of the ERI and GPR data before the cavemap became available to us; thus, the passage to the eastof the main conduit was unknownwhen the postprocess-ingwas done. This serendipitous sequence of events pro-vided excellent ground truth for the study area.
When the results of all threemethods are compared forPL-02 (Figure 14), consistent features are evidentthroughout all three pro!les. In the resistivity pro!le,high resistivity areas that are interpreted as fracturesexist near the edges of the playa lake (orange bars inFigure 14). Low resistivity areas near the surface are ver-i!ed clay-rich soil, whereas those that trend downwardfrom the surface of the playa lake are interpreted to behydrologic conduits that funnel water into the subsur-face. This same set of features can be seen in thePL-01 resistivity pro!le (Figure 9, upper panel). In theradar re"ection pro!le, the tops of these same featurescan be seen as negative amplitude radar returns. Thisis most likely caused by air- or soil-!lled fractures. Atthe surface of the playa lake, mild attenuation is occur-ring, consistent with the clay-rich soil. In the seismicshear-wave velocity pro!le, areas of low wave speed(blue) are consistent with the shallow !ne-grained soilsat the surface depression of the playa, and areas of highvelocity (yellow) are consistent with undisturbed bed-rock outside of the playa and discrete breakdown blocksbeneath the playa (Figure 14).
Based on these results, we propose the followingmodel for the formation of a playa lake: Dominant south-west to northeast tectonic trends in the region providepathways for meteoric water to percolate through thesubsurface to the Salado Formation, where it dissolvesthe soluble bedrock forming a void. This void then stopesupward forming a breccia pipe through the Rustler
Figure 12. Hypothesis 2. A: Slight topographic depres-sion in gypsum bedrock. B: Meteoric water !lls thedepression. C: Dissolution of gypsum (orange) occurs.D: As water evaporates or drains, gypsum is depositedas crust or dust and is de"ated by wind. E: The depres-sion becomes deeper (original surface denoted bydashed line). Not shown: voids already present in thesubsurface are truncated by the growing depression.Note: Unlike in hypothesis 1, there is no boundarybeneath the playa lake.
Geophysical Characterization of Playa Lakes in the Gypsum Karst of Southeastern New Mexico, USA 89
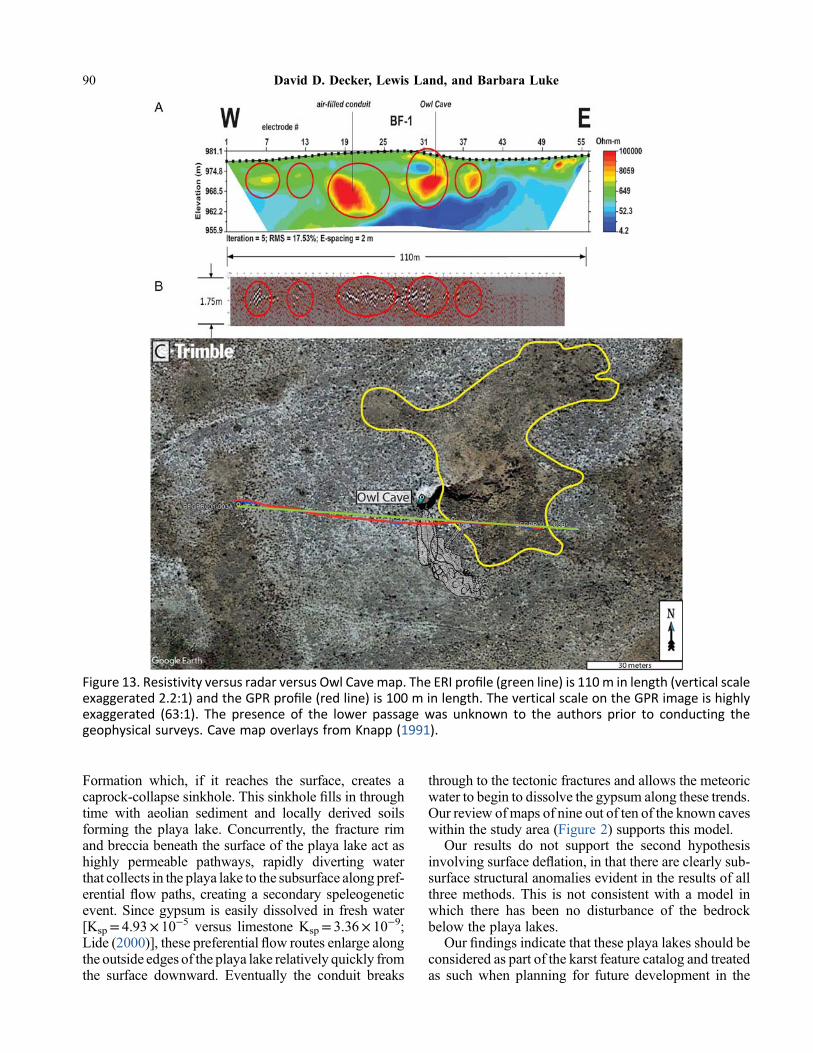
Formation which, if it reaches the surface, creates acaprock-collapse sinkhole. This sinkhole !lls in throughtime with aeolian sediment and locally derived soilsforming the playa lake. Concurrently, the fracture rimand breccia beneath the surface of the playa lake act ashighly permeable pathways, rapidly diverting waterthat collects in the playa lake to the subsurface along pref-erential "ow paths, creating a secondary speleogeneticevent. Since gypsum is easily dissolved in fresh water[Ksp= 4.93! 10!5 versus limestone Ksp= 3.36! 10!9;Lide (2000)], these preferential "ow routes enlarge alongthe outside edges of the playa lake relatively quickly fromthe surface downward. Eventually the conduit breaks
through to the tectonic fractures and allows the meteoricwater to begin to dissolve the gypsum along these trends.Our review ofmaps of nine out of ten of the known caveswithin the study area (Figure 2) supports this model.
Our results do not support the second hypothesisinvolving surface de"ation, in that there are clearly sub-surface structural anomalies evident in the results of allthree methods. This is not consistent with a model inwhich there has been no disturbance of the bedrockbelow the playa lakes.
Our !ndings indicate that these playa lakes should beconsidered as part of the karst feature catalog and treatedas such when planning for future development in the
Figure 13. Resistivity versus radar versus Owl Cavemap. The ERI pro!le (green line) is 110m in length (vertical scaleexaggerated 2.2:1) and the GPR pro!le (red line) is 100 m in length. The vertical scale on the GPR image is highlyexaggerated (63:1). The presence of the lower passage was unknown to the authors prior to conducting thegeophysical surveys. Cave map overlays from Knapp (1991).
90 David D. Decker, Lewis Land, and Barbara Luke

Burton Flats and other areas of gypsum bedrock thatsupport these features. Future planned research includesat least one of the authors visiting the interior of the caveswithin the study area to verify the maps and gain furtherinsight into the formation of these karst features. Addi-tionally, six pseudo three-dimensional resistivity surveysare planned south of the original study area where theBLM-CFO is considering implementing an Area of Crit-ical Environmental Concern (ACEC). This ACEC con-tains numerous small caves, swallets, and playa lakes.Each survey area will cover approximately 3.6 hectaresand extend to between 30 and 50 m in depth. Groundtruth of these results will include drilling selected highresistivity areas to test for the existence of voids.
SUMMARY
Three complimentary geophysicalmethodswere usedin this study. Results indicate distinct boundaries around,and the possibility of fractured rock beneath, the twoplaya lakes studied.
We interpret our results to indicate the soft soils of theplaya lake, disturbed bedrock, and possible minor voidspaces (fractures). High resistivity areas in the ERIimage for PL-02 correspond to highly re"ective (nega-tive amplitude) areas in the GPR image and low shear-wave velocity regions in the seismic image (all of whichare consistent with geologic disturbance below the playalake). Low resistivities and low velocities along theoutside edge of the playa lake may indicate hydrologic
Figure 14. PL-02 resistivity, radar, and seismic comparison. The ERI pro!le (yellow line) is 110m in length (no verticalexaggeration), the GPR pro!le (blue line) is 90 m in length (vertical scale exaggerated 63:1), and the MASW pro!le(orange line) is 72 m in length (no vertical exaggeration). The red transparent area on the satellite image shows thelocation of the playa lake.
Geophysical Characterization of Playa Lakes in the Gypsum Karst of Southeastern New Mexico, USA 91
conduits. These interpretations are consistent with thefractured perimeter and collapse rubble described inthe caprock-collapse sinkhole hypothesis which wouldindicate that the playa lakes in this study are karst relatedand should be protected accordingly.
ACKNOWLEDGEMENTS
We wish to thank the organizations that providedmonetary support, including the Robertson Association,the National Speleological Society, and the Cave Con-servancy Foundation. Additionally, we wish to thankthe organizations that provided material and personnelsupport, including theNational Cave andKarst ResearchInstitute, the University of Nevada, Las Vegas, theSandia Grotto of the National Speleological Society,and Southwest Geophysical Consulting, LLC.
REFERENCES CITED
Atkinson, G., 2018, unpublished data, New MexicoCave Survey Database.
Bureau of Land Management, 2015, Cave and karstresources management: BLM Manual H-8380-1,Denver, CO, 59 p.
Conyers, L.B., 2014, Interpreting ground penetratingradar for archaeology: Routledge Press, 220 pp.
Decker,D.D., 2019, unpublisheddata,SouthwestGeophys-ical Consulting, LLC, Cave and Karst Survey Database.
Goodbar, J.R., 2013, Solution mining and the protectionof karst groundwater supplies in Burton Flats, south-east New Mexico, USA, in Land, L., and Joop, M.,eds., 20thNational Cave andKarstManagement Sym-posium: National Cave and Karst Research Institute,Carlsbad (NM), p. 13-18.
Holt, R.M., 1997, Conceptual model for transportprocesses in the Culebra Dolomite Member, RustlerFormation: Sandia National Laboratories, SAND97-0194, p. 162.
Knapp, R., 1991, Burton Flats – Area #1, in Belski, D.,ed., Gypsum Karst Project, Vol. 2, p. 37-39.
Land, L., 2013, Geophysical records of anthropogenicsinkhole formation in the Delaware Basin region,
southeast New Mexico and west Texas, USA: Carbo-nates and Evaporites, Vol. 28 (1-2), p. 183-190.
Land, L., and Asanidze, L., 2015, Roll-along resistivitysurveys reveal karstic paleotopography developed onnear-surface gypsum bedrock, in Doctor, D.H., Land,L., and Stephenson, J.B., eds., Proceedings of theFourteenth Multidisciplinary Conference on Sink-holes and the Engineering and Environmental Impactof Karst, Rochester, Minnesota: National Cave andKarst Research Institute, Carlsbad (NM), Symposium5, p. 365-370.
Land, L., Cikoski, C.K., and Veni, G., 2018, Sinkholesas transportation and infrastructure geohazards inmixed evaporite-siliciclastic bedrock, southeasternNew Mexico, in Sasowsky, I.D., Byle, M.J., andLand, L., eds., Proceedings of the FifteenthMultidisci-plinary Conference on Sinkholes and the Engineeringand Environmental Impact of Karst, Shepherdstown,WV: National Cave and Karst Research Institute,Carlsbad (NM), Symposium 7, p. 367-377.
Land, L., and Veni, G., 2012, Electrical resistivity sur-veys of anthropogenic karst phenomena, southeasternNew Mexico: New Mexico Geology, Vol. 34 (4),p. 117-125.
Lide, D.R., 2000, Handbook of chemistry and physics:CRC Press, Vol. 81, Ch. 8, p. 112.
Miller, R.D., Xia, J., Park, C.B., and Ivanov, J.M.,1999, Multichannel analysis of surface waves tomap bedrock: The Leading Edge, Vol. 18 (12),p. 1392-1396.
Park, C., Miller, R.D., and Xia, J., 1999, Multi-channelanalysis of surface waves: Geophysics, Vol. 64 (3),p. 800-808.
Powers, D.W., and Holt, R.M., 1999, The Los MedanosMember of the Permian (Ochoan) Rustler Formation:New Mexico Geology, Vol. 21, No. 4, p. 97-103.
Sewards, T., Glenn, R., and Keil, K., 1991, Mineralogyof the Rustler Formation in theWIPP-19 Core: SandiaNational Laboratories, SAND87-7036, p. 98.
Xia, J., Miller, R.D., and Park, C.B., 1999, Estimation ofnear-surface shear-wave velocity by inversion ofRayleigh waves: Geophysics, Vol. 64 (3), p. 691-700.
92 David D. Decker, Lewis Land, and Barbara Luke

ABSTRACT.—Data from repeat airborne lidar topographic surveys, differentialGPS surveys, satellite radar interferometry, and older topographic maps suggestthat rapid land subsidence has been occurring for many years near two large(100- to 200-m diameter) sinkholes that formed in 1980 and 2002 in the HendrickOil Field near Wink, Texas. The sinkholes and surrounding subsiding area overliePermian bedded evaporite strata on the Central Basin platform on the eastern mar-gin of the Delaware Basin. Early investigations using interferograms constructedfrom synthetic aperture radar data acquired in 2007 and 2008 with the AdvancedLand Observation Satellite PALSAR L-band satellite-borne instrument identi!edlocal areas that were subsiding at rates reaching 26 cm/yr. These results focusedground-based microgravity surveys on areas where subsidence was occurring toidentify where shallow mass de!cits exist that would increase the likelihood offuture subsidence or collapse. We have quanti!ed ongoing and longer term eleva-tion change by comparing (1) digital elevation models (DEMs) constructed from ahigh-resolution airborne lidar survey "own in 2013 with lower resolution DEMsconstructed from U.S. Geological Survey photogrammetry-derived elevationsfrom 1968; (2) differential GPS measurements acquired during a 2015 microgravitysurvey with 2013 lidar-derived baseline elevations; and (3) elevations determinedfrom a second airborne lidar survey in 2017 with those determined from the 2013lidar survey. These comparisons reveal that total subsidence reaches 8.8 m over45 years in some areas. Maximum net rates of subsidence measured on the decadaltime scale are about 20 cm/yr. Differential GPS-derived elevations measured in2015 were as much as 0.91 m lower than 2013 lidar-derived elevations, yieldingmaximum subsidence rates of 61 cm/yr. Elevation loss between the 2013 and 2017airborne lidar surveys is as great as 2.8 m over nearly four years, yielding net ratesas high as 73 cm/yr. These recent rates are similar to those determined from radarinterferometry in other studies and are higher than the maximum decadal-scalerates, although the decadal rates could have been higher if subsidence began after1968 or if rates have varied over time.
INTRODUCTION
Sinkholes are a common geologic hazard in manyparts of the world (e.g., Beck, 1995; Johnson andNeal, 2003; Bell and others, 2005). In Texas, sinkholesare associated with dissolution of bedded Paleozoic saltbeneath the High Plains of the Texas panhandle andwithin the Permian basins of western Texas, limestonein central Texas, and shallow salt domes of eastern Texas
and the coastal plain (Fig. 1). Several geophysical andremote-sensing methods, including satellite radar inter-ferometry (InSAR), microgravity surveying, airbornelidar topographic surveying, and differential GPS meas-urements, offer noninvasive approaches to assessingsinkhole collapse risk by determining areal extent andrates of ground subsidence, identifying shallow massde!cits that could cause continued gradual subsidenceor sudden collapse, and characterizing sur!cial features
Paine, J. G.; Costard, Lucie; Andrews, John; Averett, Aaron; Saylam, Kutalmis; and Hupp, John, 2021, DeterminingAnnual to Decadal Subsidence Areas and Rates Using Airborne Lidar, GPS Surveys, and Topographic Maps at theWink Sinkholes, West Texas, in Johnson, K. S.; Land, Lewis; and Decker, D. D. (eds.), Evaporite Karst in theGreater Permian Evaporite Basin (GPEB) of Texas, New Mexico, Oklahoma, Kansas, and Colorado:Oklahoma Geological Survey, Circular 113, p. 93-103.
0LMBIPNB�Geological�Survey�Circular�113,�2021
Determining�Annual�to�Decadal�Subsidence�Areas�and�Rates�Using�AirborneLidar,�GPS�Surveys,�and�Topographic�Maps�at�the�Wink�Sinkholes,�West�Texas
Jeffrey�G.�Paine,�Lucie�Costard,�John�Andrews,�Aaron�Averett,�Kutalmis�Saylam,�and�John�Hupp�Bureau�of�Economic�Geology,�Jackson�School�of�Geosciences,
The�University�of�Texas�at�Austin,�Austin,�Texas
93

related to sinkhole formation. In this study, we built uponearlier subsidence studies in the vicinity of Wink, Texas(Fig. 1), that relied upon radar interferometry to identifycurrently subsiding areas and microgravity surveys toidentify areas underlain by shallow mass de!cits (Paineand others, 2012). This study employs repeat airbornelidar surveys andGPSmeasurements to ascertain groundmovement on the years scale and compares recent eleva-tion models with 1968 topography to estimate decadal-scale topographic change.
WINK SINKHOLES, PERMIAN BASIN
Two large sinkholes formed in June 1980 (WinkSink 1) andMay 2002 (WinkSink 2) near the communityof Wink (Fig. 1) in the Permian basin of western Texas(Baumgardner and others, 1982; Johnson, 1989; Collins,2000; Johnson and others, 2003; Paine and others, 2012).These sinkholes formed in the Hendrick Oil Field (dis-covered in 1926) at the western margin of the CentralBasin platform above the Permian Capitan Reefcomplex, which underlies Permian interbedded salt and
anhydrite�at�depths�of�400�to�670�m.�Wink�Sink�1,�formed�on�June�3,�1980,�measured�110�m�across�and�34�m�deep�at�the�time�of�collapse.�Over�time,�it�has�expanded�to�an�approximately�circular�outline� that� is�94–117�m�across�(as�of�2018)�and�is�elongated�to�the�northeast-southwest.�The�sinkhole�outline�encircles� the�Hendrick�No.�10-A,�a�780-m-deep�well� that�was�drilled� in�1928,�produced�oil� from� the� Tansill� and� Yates� formations� below� the�salt�section,�and�was�abandoned�in�1964�(Baumgardner�and�others,�1982).�Flow�of�unsaturated�water�from�above�or� below� the� salt� section,� possibly� through� natural� or�induced� fractures�or� the�borehole� itself,� is�cited�as� the�most� likely� cause� of� salt� dissolution� and� collapse� at�Wink�Sink�1�(Baumgardner�and�others,�1982;�Johnson�and�others,�2003).�Wink�Sink�2� formed�1.6�km� south�of�Wink�Sink� 1� on�May� 21,� 2002.�This� sinkhole� has�expanded� from� its�original� surface�width�of�137�m� to�an�oval�shape�with�widths� ranging�from�225� to�250�m�(as� of� 2018)� and� also� elongated� in� the� northeast-southwest�direction.�Both�Wink�sinkholes�have�an�elon-gation�ratio�of�1.1�to�1.2.�Wink�Sink�2�encircles�the�Gulf�WS-8,�a�water-supply�well�that�was�drilled�through�the
Figure 1. Map showing the location of the Wink sinkhole area, western Texas. Structural features in the Permianbasin include the Central Basin platform (CBP), the Midland Basin (MB), and the Delaware Basin (DB).
94 Jeffrey G. Paine et al.
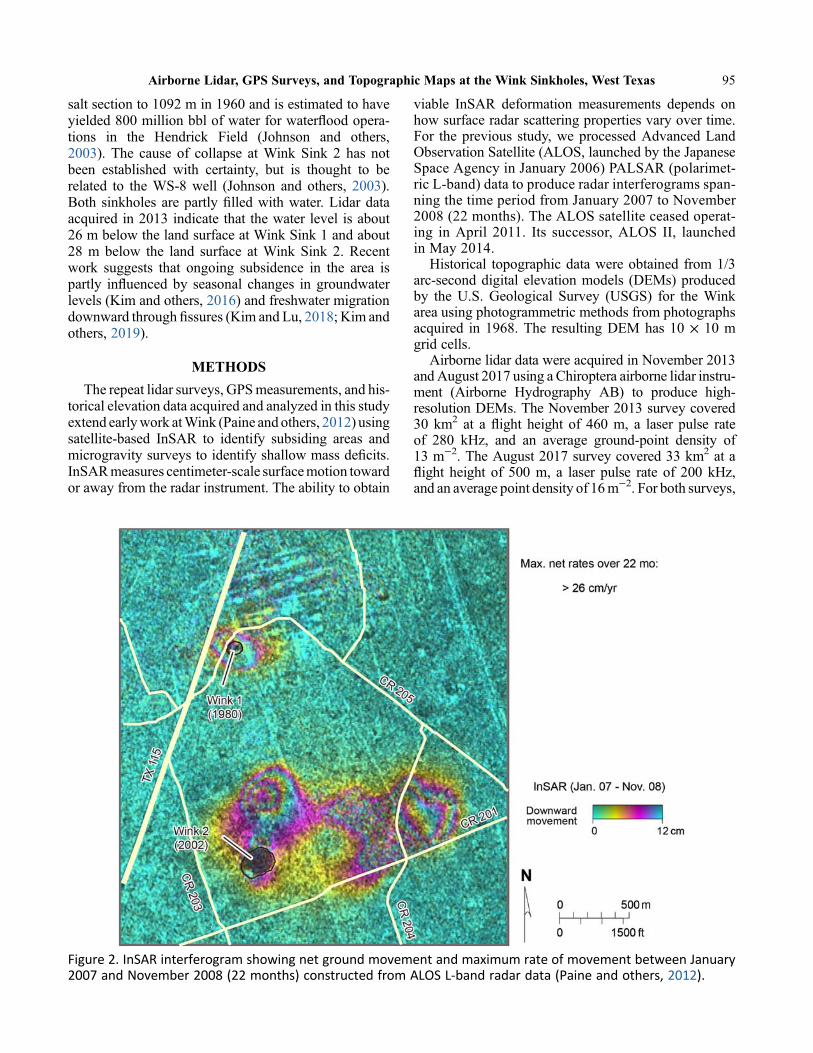
salt section to 1092 m in 1960 and is estimated to haveyielded 800 million bbl of water for water"ood opera-tions in the Hendrick Field (Johnson and others,2003). The cause of collapse at Wink Sink 2 has notbeen established with certainty, but is thought to berelated to the WS-8 well (Johnson and others, 2003).Both sinkholes are partly !lled with water. Lidar dataacquired in 2013 indicate that the water level is about26 m below the land surface at Wink Sink 1 and about28 m below the land surface at Wink Sink 2. Recentwork suggests that ongoing subsidence in the area ispartly in"uenced by seasonal changes in groundwaterlevels (Kim and others, 2016) and freshwater migrationdownward through !ssures (Kim and Lu, 2018; Kim andothers, 2019).
METHODS
The repeat lidar surveys, GPSmeasurements, and his-torical elevation data acquired and analyzed in this studyextend earlywork atWink (Paine and others, 2012) usingsatellite-based InSAR to identify subsiding areas andmicrogravity surveys to identify shallow mass de!cits.InSARmeasures centimeter-scale surfacemotion towardor away from the radar instrument. The ability to obtain
viable InSAR deformation measurements depends onhow surface radar scattering properties vary over time.For the previous study, we processed Advanced LandObservation Satellite (ALOS, launched by the JapaneseSpace Agency in January 2006) PALSAR (polarimet-ric L-band) data to produce radar interferograms span-ning the time period from January 2007 to November2008 (22 months). The ALOS satellite ceased operat-ing in April 2011. Its successor, ALOS II, launchedin May 2014.
Historical topographic data were obtained from 1/3arc-second digital elevation models (DEMs) producedby the U.S. Geological Survey (USGS) for the Winkarea using photogrammetric methods from photographsacquired in 1968. The resulting DEM has 10 ! 10 mgrid cells.
Airborne lidar data were acquired in November 2013andAugust 2017 using a Chiroptera airborne lidar instru-ment (Airborne Hydrography AB) to produce high-resolution DEMs. The November 2013 survey covered30 km2 at a "ight height of 460 m, a laser pulse rateof 280 kHz, and an average ground-point density of13 m!2. The August 2017 survey covered 33 km2 at a"ight height of 500 m, a laser pulse rate of 200 kHz,and an average point density of 16m!2. For both surveys,
Figure 2. InSAR interferogram showing net ground movement and maximum rate of movement between January2007 and November 2008 (22 months) constructed from ALOS L-band radar data (Paine and others, 2012).
Airborne Lidar, GPS Surveys, and Topographic Maps at the Wink Sinkholes, West Texas 95

GPS data from survey-area base stations and nearbyCon-tinuously Operating Reference Stations were combinedwith aircraft-based GPS and inertial navigation-systemdata to produce highly accurate instrument trajectoriesthat, when combined with laser orientation and travel-time information, allowed determination of absolutesurface re"ection positions accurate to within a few cm.Laser returns were binned to produce high-resolutionDEMs of the area using a 1 ! 1 m cell size.
Differential GPS-derived elevations were acquiredalong microgravity survey lines in May 2015 using aTrimble NetR9 base station and a Trimble R8 rover.Data were collected at 40-m intervals along the micro-gravity lines.
SHORT-TERM (MONTHS) SUBSIDENCE RATESFROM RADAR INTERFEROMETRY
We used InSAR during early work at Wink to detectrecent vertical movement over a large area surroundingthe 1980 and 2002 sinkholes. InSAR results focusedmore intensive !eld, geophysical, and subsurface inves-tigations on areas that showed evidence of recent subsi-dence. A representative radar interferogram of the Winkarea, constructed from satellite-based radar data acquiredon January 1, 2007 and November 23, 2008, depicts thenet change in surface elevation between those two dates(Fig. 2). Areas of notable subsidence are evident on anenlarged part of the interferogram in the vicinity ofWink Sinks 1 and 2. Subsidence areas generally matchthose determined from previous leveling surveys con-ducted by industry representatives and from a 1999reconnaissance topographic pro!le surveyed with anoptical level before the collapse ofWink Sink 2 (Collins,2000; Johnson and others, 2003). Maximum net subsi-dence rates for the 22-month period exceed 26 cm/yr.Recent intensive InSAR-based work using high repeatfrequency C-band radar data from the Sentinel-1A(launched in April 2014) and Sentinel-1B (launched inApril 2016) satellites, and higher frequency X-bandradar data from the terraSAR-X satellite (launchedJune 2010) (Kim and others, 2016; Kim and Lu, 2018;Kim and others, 2019) have further clari!ed the areasand rates of recent subsidence (at maximum ratesexceeding 50 cm/yr), established the dominantly verticalcomponent of elevation change, and have postulated fac-tors affecting subsidence including improperly pluggedwells, cracks in cement well casings, downward migra-tion of fresh water through !ssures, and drought.
ANNUALTO DECADAL RATES FROMLIDAR SURVEYS
Two airborne lidar surveys have been "own in theWink area to examine longer term (years to decades)subsidence in the Wink area. Lidar surveys produce
two main products: point clouds (with associated x-,y-, and z-coordinates) that represent the absolute locationof laser re"ection points on the ground surface(Fig. 3a), and DEMs constructed by binning all pointswithin each grid cell to produce a high-resolution eleva-tion model of the survey area (Fig. 3b). The !rst lidarsurvey was "own in November 2013 to examine mor-phology of the sinkholes and other subsiding areas,establish a topographic baseline for future monitoring,and provide an areally extensive elevation data set tosupport determining longer term subsidence throughcomparison with topographic data from the 1960s.The second lidar survey was "own in August 2017 toquantify ground movement over the nearly four yearsthat had elapsed since the 2013 survey.
The DEM constructed from the 2013 lidar surveydepicts a land surface that generally slopes from northto south, with a prominent topographic ridge that extendssouthward along the western edge ofWink Sinks 1 and 2(Fig. 4). Local topographic lows are found at and nearboth sinkholes within two extensive subsiding areasidenti!ed from the 2007–2008 InSAR data. A thirdInSAR anomaly, located in the southern part of the sur-vey area, has no associated topographic depression.
Figure 3. Perspective views of (a) point cloud and (b)high-resolution digital elevation model (DEM) con-structed from lidar data acquired near Wink Sink 2during the November 2013 airborne survey.
96 Jeffrey G. Paine et al.

Microgravity pro!les and GPS-based elevation meas-urements acquired in 2015 across this feature show noevidence of subsidence or presence of shallowmass def-icits thatmight indicate potential for future subsidence orcollapse.
The DEM constructed by the USGS from 1968 aerialphotography (Fig. 5) has signi!cantly lower resolutionthan the 2013 lidar-derived DEM, but depicts thesame general southerly slope and main topographicfeatures. Wink Sinks 1 and 2, which had yet to collapsein 1968, are absent from the older DEM, as are the largertopographic lows near them that are evident on the2013 DEM.
By assigning the DEMs to a common vertical datum,jointly georeferencing them as accurately as possible,and making minor adjustments in the area-wide
elevations to minimize apparent elevation changebeyond the obvious subsiding areas, we attempted toestimate net elevation change from 1968 to 2013 acrossthe survey area (Fig. 6). Net elevation change rangesfrom +13 to –28 m, but net change is near 0 m overthe majority of the study area. Apparent increases in ele-vation are limited to arti!cial structures (towers, tanks,and buildings) that were excluded from the 1968DEM, areas where land has been built up by !ll, andperhaps some natural eolian features. Small areas of ele-vation gain or loss are likely artifacts caused by featuresnot adequately captured at the lower resolution of the1968 DEM. The greatest loss of elevation is associatedwithWink Sink 1 (26 m from the 1968 ground surface tothe 2013 water level) and Wink Sink 2 (28 m to water),where sudden collapse in 1980 and 2002 dropped the
Figure 4. High-resolution (1-m grid cell) DEM of the Wink Sink area constructed from lidar data acquired in Novem-ber 2013. Superimposed on the DEM are the outlines of InSAR anomalies identi!ed from ALOS L-band radar dataacquired in January 2007 and November 2008.
Airborne Lidar, GPS Surveys, and Topographic Maps at the Wink Sinkholes, West Texas 97

land surface more than 30 m. Numerous other areas ofelevation loss are evident (features A through F, Fig. 6).Elevation loss between 1968 and 2013 across these fea-tures ranges from 1.6 m (feature F) to 8.8 m (feature E,the largest subsiding area east and northeast of WinkSink 2). Field investigations in May 2014 suggestedthat features A and B are likely to be pits excavated after1968. The remainder of the features appear to be causedby land subsidence. Maximum measured land-surfaceelevation loss is 8.8 m, representing an average annualsubsidence rate of 20 cm/yr between 1968 and 2013.Actual rates within this period could have been higherif subsidence began after 1968 or rates varied over time.
Topographic pro!les showing elevation change canbe constructed by differencing the elevation surfaces(Fig. 7). Pro!le E (Fig. 8) crosses feature E, the mostextensive subsidence feature identi!ed in the area(Fig. 6), from west-northwest to south-southeast.
Maximum land-surface elevation loss between 1968and 2013 is about 6.8 m along this line. Average ratesof subsidence over the 45 years elapsed between 1968and 2013 are 15 cm/yr, but actual rates during the periodcould have been higher.
The second lidar survey of the Wink area, acquired inAugust 2017 while also surveying the Imperial andMcCamey sinkholes in west Texas, shows the samegeneral features as those identi!ed in the 2013 survey.Subtracting the 2013 DEM from the 2017 DEM revealsbroad areas of relatively little elevation loss surroundingWink Sink 1 andWink Sink 2 (Fig. 7). Greater elevationloss occurred in the southeastern part of the survey area,where two foci of rapid subsidence are located along pro-!le DE oriented north-northwest to south-southeast neara closed segment of Winkler County Road 204 (Figs. 2,7, and 9). Elevation loss between 2013 and 2017 reachesas much as 1.25 m in the northern depression and 2.75 m
Figure 5. DEM of the Wink Sink area produced by the USGS using photogrammetric and land-surveying methodsfrom aerial photographs acquired in 1968. Cell resolution is 10 m.
98 Jeffrey G. Paine et al.
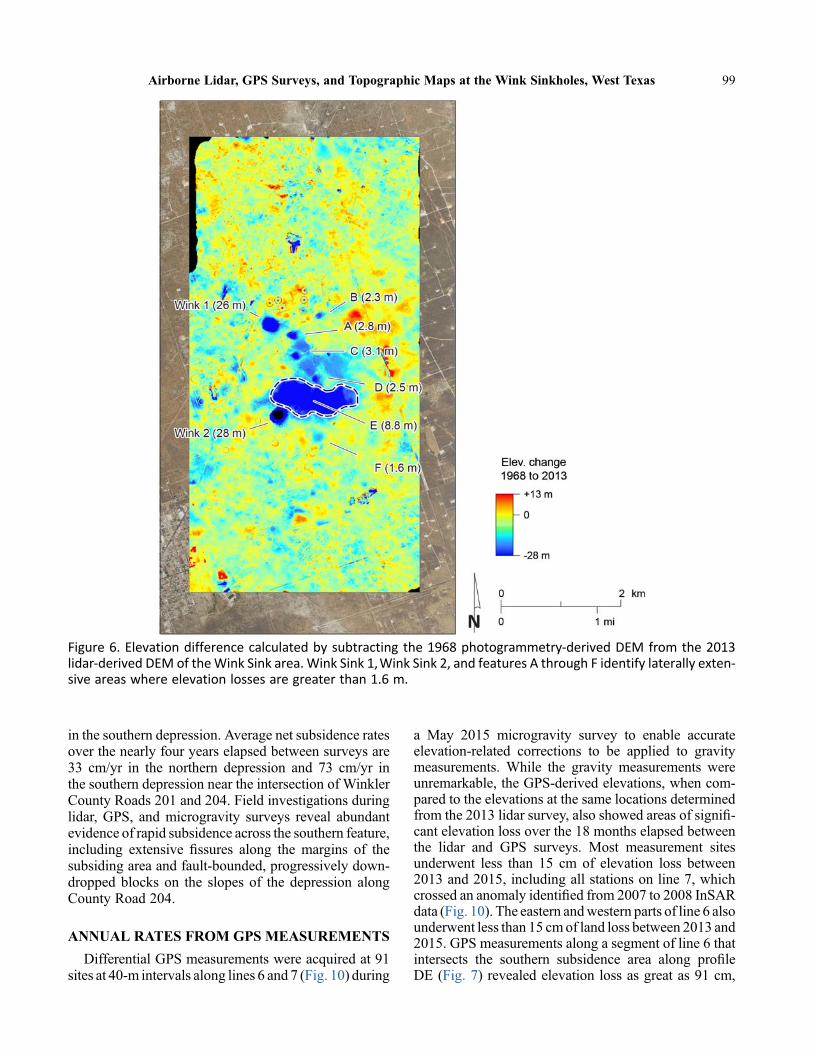
in the southern depression. Average net subsidence ratesover the nearly four years elapsed between surveys are33 cm/yr in the northern depression and 73 cm/yr inthe southern depression near the intersection of WinklerCounty Roads 201 and 204. Field investigations duringlidar, GPS, and microgravity surveys reveal abundantevidence of rapid subsidence across the southern feature,including extensive !ssures along the margins of thesubsiding area and fault-bounded, progressively down-dropped blocks on the slopes of the depression alongCounty Road 204.
ANNUAL RATES FROM GPS MEASUREMENTS
Differential GPS measurements were acquired at 91sites at 40-m intervals along lines 6 and 7 (Fig. 10) during
a May 2015 microgravity survey to enable accurateelevation-related corrections to be applied to gravitymeasurements. While the gravity measurements wereunremarkable, the GPS-derived elevations, when com-pared to the elevations at the same locations determinedfrom the 2013 lidar survey, also showed areas of signi!-cant elevation loss over the 18 months elapsed betweenthe lidar and GPS surveys. Most measurement sitesunderwent less than 15 cm of elevation loss between2013 and 2015, including all stations on line 7, whichcrossed an anomaly identi!ed from 2007 to 2008 InSARdata (Fig. 10). The eastern andwestern parts of line 6 alsounderwent less than 15 cmof land loss between 2013 and2015. GPS measurements along a segment of line 6 thatintersects the southern subsidence area along pro!leDE (Fig. 7) revealed elevation loss as great as 91 cm,
Figure 6. Elevation difference calculated by subtracting the 1968 photogrammetry-derived DEM from the 2013lidar-derived DEM of theWink Sink area. Wink Sink 1,Wink Sink 2, and features A through F identify laterally exten-sive areas where elevation losses are greater than 1.6 m.
Airborne Lidar, GPS Surveys, and Topographic Maps at the Wink Sinkholes, West Texas 99

Figure 7. Elevation difference and rates of change calculated by (left panel) subtracting the 1968 photogrammetry-derived DEM from the 2013 lidar-derived DEM and by (right panel) subtracting the 2013 DEM from the 2017 lidar-derived DEM of the Wink Sink area.
Figure 8. Elevation and elevation change between 1968 and 2013 along pro!le E (!g. 7).
100 Jeffrey G. Paine et al.
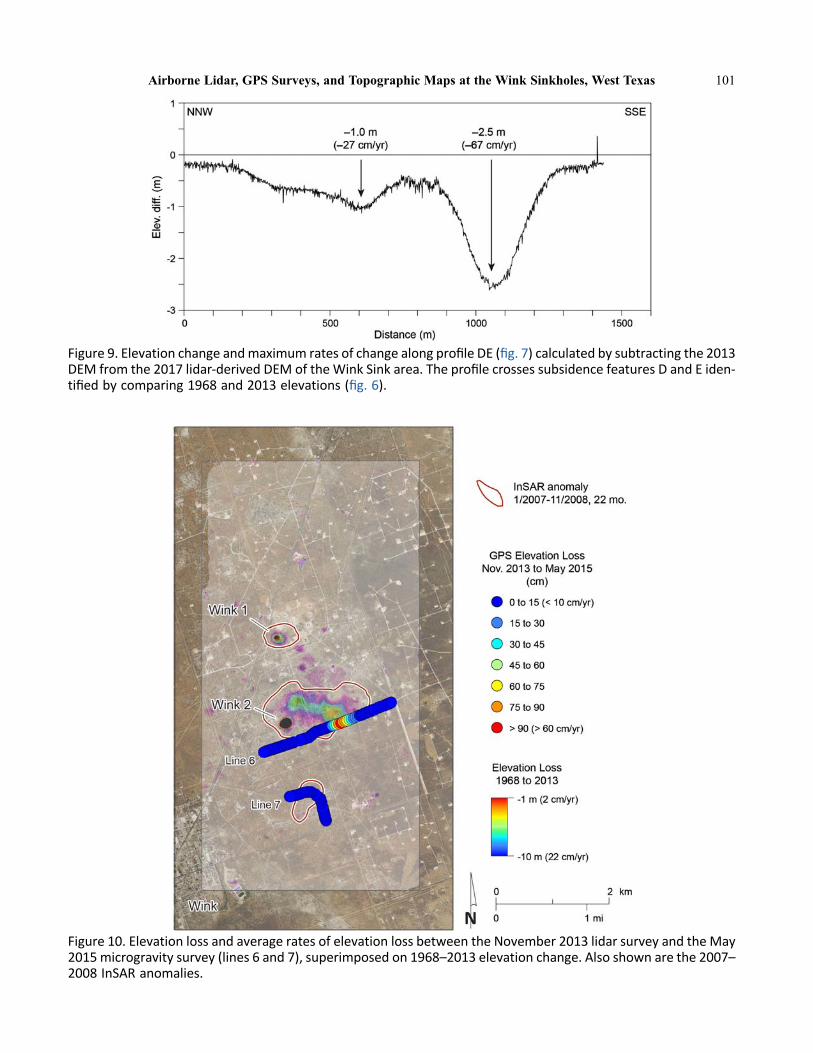
Figure 9. Elevation change andmaximum rates of change along pro!le DE (!g. 7) calculated by subtracting the 2013DEM from the 2017 lidar-derived DEM of the Wink Sink area. The pro!le crosses subsidence features D and E iden-ti!ed by comparing 1968 and 2013 elevations (!g. 6).
Figure 10. Elevation loss and average rates of elevation loss between the November 2013 lidar survey and the May2015 microgravity survey (lines 6 and 7), superimposed on 1968–2013 elevation change. Also shown are the 2007–2008 InSAR anomalies.
Airborne Lidar, GPS Surveys, and Topographic Maps at the Wink Sinkholes, West Texas 101

translating to an average maximum rate of subsidence of61 cm/yr. This value is similar to the maximum ratecalculated between the 2013 and 2017 lidar surveys aswell as the maximum subsidence rates reported fromrecent InSAR analysis (Kim and Lu, 2018; Kim andothers, 2019).
CONCLUSIONS
No matter the method employed, whether examiningelevation change over the short-term (months to a fewyears) using InSAR data, over the intermediate term(a few years) from InSAR, repeat lidar surveys, andGPS measurements, or over a longer term (a few deca-des) using elevations from historical topographicmaps, subsidence in the Wink Sink area has been easilydetectable and the subsidence rates are high. Historicalrates determined by comparing 1968 elevations with2013 elevations show net subsidence as great as 9 mover the 45-year period at an average rate of 20 cm/yr.That rate likely underestimates maximum subsidencerates over that period because subsidence might havebegun after 1968 (and thus occurred over a shorterperiod) and rates likely varied over time. Comparisonsof elevations determined from lidar surveys "own in2013 and 2017 revealed asmuch as 2.75mof subsidenceover nearly four years, translating to maximum subsi-dence rates of 73 cm/yr during that period. Elevationcomparisons from differential GPS measurements takenin 2015with lidar-derived elevations determined in 2013revealed elevation losses as great as 0.91 m at averagerates of 61 cm/yr, largely con!rming similar maximumrates determined from repeat lidar surveys and recentInSAR studies.
Given the high repeat frequency of current radar sat-ellites, the InSAR method provides a valuable tool formonitoring ground subsidence and detecting when sub-sidence rates change, which could be a precursor to sud-den collapse as occurred atWink Sinks 1 and 2. Baselineelevations over relatively large areas at high lateral (1 mor less) and vertical (a few cm) resolution, a prerequisitefor effective GPS and lidar-based elevation monitoring,are currently best accomplished through airborne lidarsurveying. Differential GPS measurements are laborintensive and site speci!c, but are necessary for groundveri!cation of lidar-derived elevations and can beextremely accurate. Continuous monitoring of criticalsites could be accomplished through installation of per-manent GPS monitoring sites, but cannot be achievedwith satellite-based radar or airborne lidar surveying.Each approach has advantages and disadvantages; allcan be helpful depending on the hazard, vulnerability,and lead time required for actions to mitigate the hazardto the public and to infrastructure.
ACKNOWLEDGMENTS
Wink investigations were supported by the State ofTexas Advanced Resource Recovery (STARR) geologichazards program at the Bureau of Economic Geology.J. Paine and L. Costard acquired GPS and microgravitydata during the May 2015 survey. 2013 and 2017 lidardatawere acquired andprocessed byBureau ofEconomicGeology staff A. Averett, J. Andrews, J. Hupp, andK. Saylam. Publication authorized by the Director,Bureau of Economic Geology, Jackson School of Geo-sciences, The University of Texas at Austin.
REFERENCES CITED
Baumgardner, R.W., Jr., Hoadley, A.D., and Goldstein,A.G., 1982, Formation of the Wink Sink, a salt disso-lution and collapse feature,WinklerCounty,Texas:TheUniversity of Texas at Austin, Bureau of EconomicGeology, Report of Investigations 114, 38 p.
Beck, B.F., editor, 1995, Karst Geohazards: Engineeringand environmental problems in karst terrane: Proceed-ings of the Fifth Multidisciplinary Conference onSinkholes and the Engineering and EnvironmentalImpact of Karst: Balkema, Rotterdam, 582 p.
Bell, F.G., Culshaw,M.G., andWaltham, T., 2005, Sink-holes and subsidence: karst and cavernous rocks inengineering and construction: Springer, Berlin,ISBN 3-540-20725-2, 383 p.
Collins, E.W., 2000, Reconnaissance investigation ofactive subsidence and recent formation of earth !s-sures near the 1980 Wink Sink in the Hendrick oil!eld, Winkler County, Texas (abstract): GeologicalSociety of America, South-Central Section, Abstractswith Programs, v. 32, no. 3, p. A-6.
Johnson, K.S., 1989, Development of the Wink Sink inWest Texas due to salt dissolution and collapse: Envi-ronmental Geology andWater Science, v. 14, p. 81-92.
Johnson, K.S., Collins, E.W., and Seni, S.J., 2003, Sink-holes and land subsidence owing to salt dissolutionnear Wink, West Texas, and other sites in westernTexas and New Mexico, in Johnson, K.S., and Neal,J.T., eds., Evaporite karst and engineering/environ-mental problems in the United States: OklahomaGeological Survey, Circular 109, p. 183-195.
Johnson, K.S., andNeal, J.T., eds., 2003, Evaporite karstand engineering/environmental problems in theUnited States: Oklahoma Geological Survey, Circular109, 353 p.
Kim, J., Lu, Z., 2018, Association between localizedgeohazards inWest Texas and human activities, recog-nized by Sentinel-1A/B satellite radar imagery: Scien-ti!c Reports, v. 8, 4727, 13 p.
102 Jeffrey G. Paine et al.

Kim, J.-W., Lu, Z., and Degrandpre, K, 2016, Ongoingdeformation of sinkholes in Wink, Texas, observedby time-series Sentinel-1A SAR interferometry(preliminary results): Remote Sensing, v. 8, no.313, 11 p.
Kim, J.-W., Lu, Z., and Kaufmann, J., 2019, Evolution ofsinkholes overWink,Texas, observedbyhigh-resolution
optical and SAR imagery: Remote Sensing of Envi-ronment, v. 222, no. 1, p. 119-132.
Paine, J.G., Buckley, S.M., Collins, E.W., and Wilson,C.R., 2012, Assessing collapse risk in evaporitesinkhole-prone areas usingmicrogravimetry and radarinterferometry: Journal of Environmental and Engi-neering Geophysics, v. 17, no. 2, p. 73-87.
Airborne Lidar, GPS Surveys, and Topographic Maps at the Wink Sinkholes, West Texas 103


ABSTRACT.—Two sinkholes in Wink, Texas (Wink Sinks #1, #2), collapsed in1980 and 2002, respectively. The area where the sinkholes are located in WinklerCounty, west Texas, is underlain by thick salt beds at depth of about !400 m.Anthropogenic activities related to oil and water production have been consideredas a primary cause of the sinkhole development and creation. Previous studies havesuggested that poor wellbore management, which failed to prevent the intrusion offreshwater and/or unsaturated saltwater into soluble rocks, resulted in the cavityformation, roof failure, and successive upward cavity migration. Interferometricsynthetic aperture radar (InSAR) measurements using Advanced Land ObservationSatellite Phased Array type L-band Synthetic Aperture Radar and TerraSAR-Ximages during 2007–2011 and 2015–2016 revealed !ne spatial details about theprogression of the existing sinkholes and neighboring regions. The immediatevicinities of both existing sinkholes are still subsiding, albeit at a decreasingrate, from !18 cm/yr in 2011 to about !8 cm/yr in 2016, possibly because ofthe gradual deposit of the debris from overlying rock formation into the cavity.However, an alarming rate of subsidence can be found !1 km east of WinkSink #2. The peak subsidence rate of this area ranged from !40 cm/yr during2007–2011 to more than 60 cm/yr during 2015–2016. Although the initial triggerof the subsidence feature over the area 1 km east of Wink #2 might be similar to thatof Wink Sinks #1 and #2 (i.e., poor borehole management, water-"ooding opera-tions in a karst environment), the recent expansion and accelerated subsidence maybe attributed to the severe drought in 2011. Continuous monitoring of the subsi-dence in the broader vicinity of the Wink sinkholes is needed for preventing futurecatastrophic outcomes of long-term developing geohazards to the area’s oil produc-tion facilities, infrastructure, and human safety.
INTRODUCTION
Sinkholes, depressions or holes caused by collapse ofland surface, are a major geohazard in karst environ-ments worldwide (Beck and Pearson, 1995; Johnsonand Neal, 2003; Gutie! rrez and others, 2014). Sinkholesare generally formed when evaporite, carbonate, or gyp-sum rocks in karst terrains dissolve because of chemicalor other processes that result in the development ofunderground cavities, failures of overlying sediments/rocks, upward cavity migration, and surface depressionand collapses.
Well-known sinkholes in the world can be found overthe coasts of the Dead Sea, northeastern Spain, the Neth-erlands, and North America (e.g., Baer and others, 2002;Galve and others, 2009; Chang and Hanssen, 2014;Paine and others, 2012; Jones and Blom, 2014; Kim
and others, 2016; Kim and Lu, 2018). In the UnitedStates, 48 out of 50 states have karst terrains withmost of the damaging sinkholes located along the GulfCoast states including Texas, Louisiana, and Florida,among others (Kuniansky and others, 2016).
Sinkholes can be induced by both natural processesand anthropogenic activities. Recent studies providedevidence that the vast majority of newly formed sink-holes are of anthropogenic origins, including aquiferexploitation and mining dewatering resulting in waterlevel decline, water impoundment and injection, andvegetation removal among others (Waltham and others,2005; Kim and others, 2019). Impacts caused by sink-hole activities include economic losses and damage toinfrastructure (Kuniansky and others, 2016). Becauseof the increasing demand forwater and energy resources,
Kim, Jin Woo;�and�Lu,�Zhong,�2021,�Sinkholes�in�Wink,�Texas,�Observed�by�Satellite�Radar�Imagery,�in�Johnson,K. S.; Land, Lewis; and Decker, D. D. (eds.), Evaporite Karst in the Greater Permian Evaporite Basin (GPEB) ofTexas, New Mexico, Oklahoma, Kansas, and Colorado: Oklahoma Geological Survey, Circular 113, p. 105–110.
0LMBIPNB�Geological�Survey�Circular�113,�2021
Sinkholes�in�Wink,�Texas,�Observed�by�Satellite�Radar�Imagery
Jin�Woo�Kim�and�Zhong�LuRoy�M.�Huf!ngton�Department�of�Earth�Sciences,
Southern�Methodist�University,�Dallas,�Texas
105
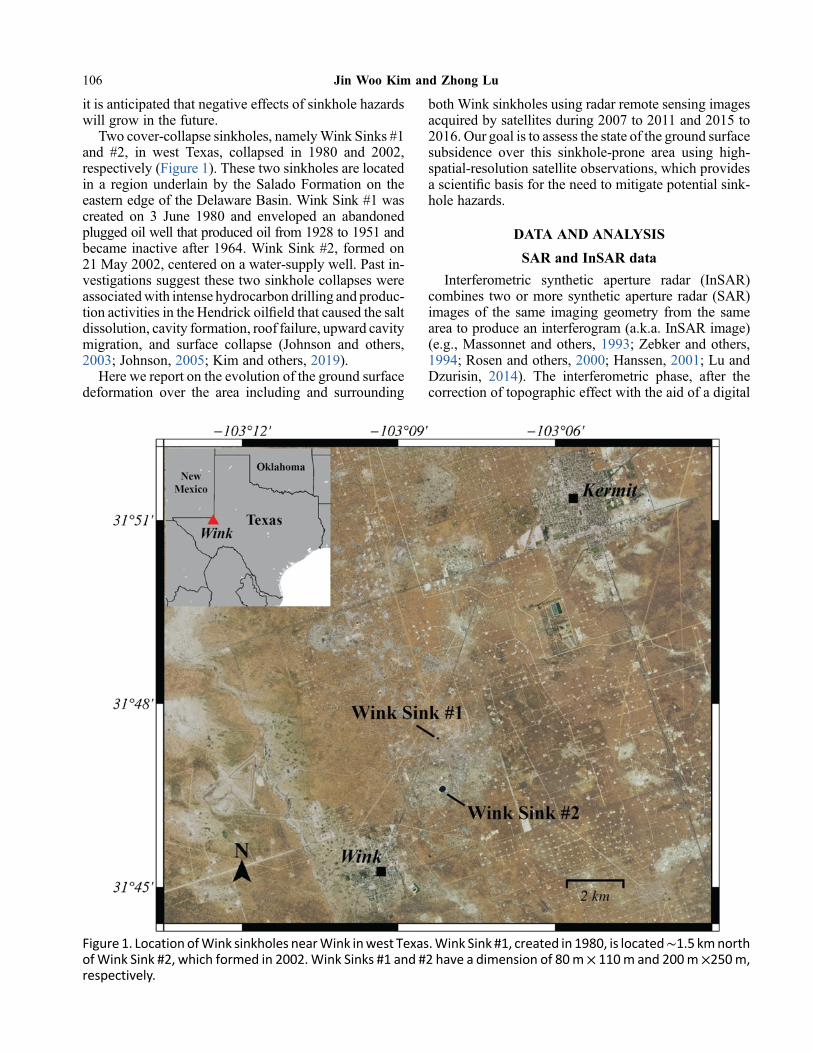
it is anticipated that negative effects of sinkhole hazardswill grow in the future.
Two cover-collapse sinkholes, namelyWink Sinks #1and #2, in west Texas, collapsed in 1980 and 2002,respectively (Figure 1). These two sinkholes are locatedin a region underlain by the Salado Formation on theeastern edge of the Delaware Basin. Wink Sink #1 wascreated on 3 June 1980 and enveloped an abandonedplugged oil well that produced oil from 1928 to 1951 andbecame inactive after 1964. Wink Sink #2, formed on21 May 2002, centered on a water-supply well. Past in-vestigations suggest these two sinkhole collapses wereassociatedwith intense hydrocarbon drilling and produc-tion activities in the Hendrick oil!eld that caused the saltdissolution, cavity formation, roof failure, upward cavitymigration, and surface collapse (Johnson and others,2003; Johnson, 2005; Kim and others, 2019).
Here we report on the evolution of the ground surfacedeformation over the area including and surrounding
both Wink sinkholes using radar remote sensing imagesacquired by satellites during 2007 to 2011 and 2015 to2016. Our goal is to assess the state of the ground surfacesubsidence over this sinkhole-prone area using high-spatial-resolution satellite observations, which providesa scienti!c basis for the need to mitigate potential sink-hole hazards.
DATA AND ANALYSIS
SAR and InSAR data
Interferometric synthetic aperture radar (InSAR)combines two or more synthetic aperture radar (SAR)images of the same imaging geometry from the samearea to produce an interferogram (a.k.a. InSAR image)(e.g., Massonnet and others, 1993; Zebker and others,1994; Rosen and others, 2000; Hanssen, 2001; Lu andDzurisin, 2014). The interferometric phase, after thecorrection of topographic effect with the aid of a digital
Figure 1. Location ofWink sinkholes nearWink inwest Texas.Wink Sink #1, created in 1980, is located!1.5 kmnorthofWink Sink #2, which formed in 2002.Wink Sinks #1 and #2 have a dimension of 80m! 110m and 200m!250m,respectively.
106 Jin Woo Kim and Zhong Lu
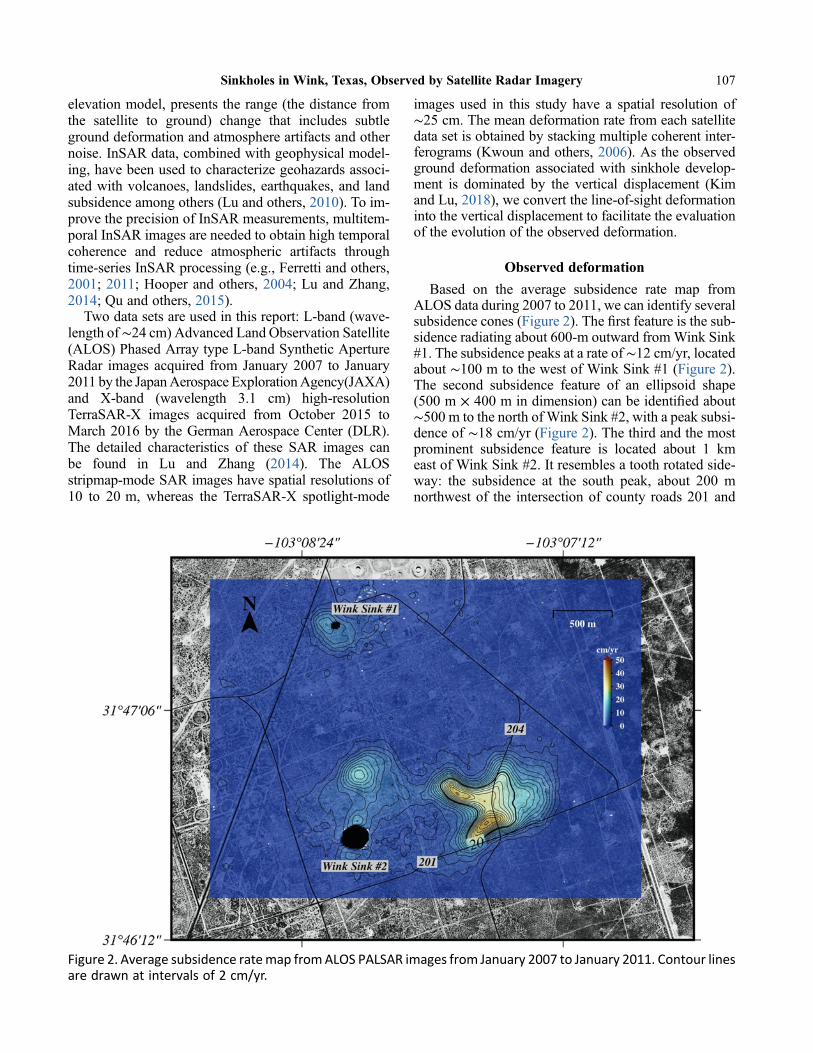
elevation model, presents the range (the distance fromthe satellite to ground) change that includes subtleground deformation and atmosphere artifacts and othernoise. InSAR data, combined with geophysical model-ing, have been used to characterize geohazards associ-ated with volcanoes, landslides, earthquakes, and landsubsidence among others (Lu and others, 2010). To im-prove the precision of InSAR measurements, multitem-poral InSAR images are needed to obtain high temporalcoherence and reduce atmospheric artifacts throughtime-series InSAR processing (e.g., Ferretti and others,2001; 2011; Hooper and others, 2004; Lu and Zhang,2014; Qu and others, 2015).
Two data sets are used in this report: L-band (wave-length of!24 cm) Advanced Land Observation Satellite(ALOS) Phased Array type L-band Synthetic ApertureRadar images acquired from January 2007 to January2011 by the JapanAerospace ExplorationAgency(JAXA)and X-band (wavelength 3.1 cm) high-resolutionTerraSAR-X images acquired from October 2015 toMarch 2016 by the German Aerospace Center (DLR).The detailed characteristics of these SAR images canbe found in Lu and Zhang (2014). The ALOSstripmap-mode SAR images have spatial resolutions of10 to 20 m, whereas the TerraSAR-X spotlight-mode
images used in this study have a spatial resolution of!25 cm. The mean deformation rate from each satellitedata set is obtained by stacking multiple coherent inter-ferograms (Kwoun and others, 2006). As the observedground deformation associated with sinkhole develop-ment is dominated by the vertical displacement (Kimand Lu, 2018), we convert the line-of-sight deformationinto the vertical displacement to facilitate the evaluationof the evolution of the observed deformation.
Observed deformation
Based on the average subsidence rate map fromALOS data during 2007 to 2011, we can identify severalsubsidence cones (Figure 2). The !rst feature is the sub-sidence radiating about 600-m outward fromWink Sink#1. The subsidence peaks at a rate of !12 cm/yr, locatedabout !100 m to the west of Wink Sink #1 (Figure 2).The second subsidence feature of an ellipsoid shape(500 m ! 400 m in dimension) can be identi!ed about!500 m to the north of Wink Sink #2, with a peak subsi-dence of !18 cm/yr (Figure 2). The third and the mostprominent subsidence feature is located about 1 kmeast of Wink Sink #2. It resembles a tooth rotated side-way: the subsidence at the south peak, about 200 mnorthwest of the intersection of county roads 201 and
Figure 2. Average subsidence ratemap fromALOS PALSAR images from January 2007 to January 2011. Contour linesare drawn at intervals of 2 cm/yr.
Sinkholes in Wink, Texas, Observed by Satellite Radar Imagery 107

204, was about 40 cm/yr, whereas it was 35 cm/yr at thenorth peak (Figure 2).
The subsidence rate map for 2015 to 2016 fromTerrraSAR-X images shows that the three subsidencefeatures as seen during 2007 to 2011 changed overtime to some degree (Figure 3). The subsidence ratesat the !rst feature (i.e., near Wink Sink #1) and the sec-ond feature (north ofWink Sink #2) reduced to 4 and 4–8cm/yr, respectively (Figure 3), and the extents of subsi-dence also shrank. However, the third and most promi-nent feature about 1 km east of Wink Sink #2 changedsigni!cantly. Therewere two distinct subsidence troughsin 2015 to 2016. The subsidence rate over the north peakreduced to about 26 cm/yr, whereas it increased to morethan 60 cm/yr over the south peak located on county road201, about 100 m west of the intersection of the countyroads 201 and 204 (Figure 3). It is obvious the peak sub-sidence increased inmagnitude from 2011 to 2015–2016and that the location of the peak subsidence migratedsouthward.
DISCUSSION AND CONCLUSION
The subsidence observed near the existing WinkSinks #1 and #2 suggests the underground cavity aroundeach was continuously !lled with debris from upper
formations. This void !lling process, called a suffusion,produced continuous surface subsidence over the newlyformed sinkholes in the early stage of each sinkhole’scollapse (Waltham and others, 2005; Kim and others,2019). The subsidence rates and dimensions surroundingWink Sinks #1 and #2 reduced over time, suggesting thetwo existing sinkholes stabilized as a consequence ofnearly fully !lled cavities (Waltham and others, 2005;Kim and others, 2019).
The double-peak subsidence feature about 1 km eastof Wink Sink #2 manifests as alarming sinkholes underdevelopment, with the peak subsidence reaching morethan 60 cm/yr during 2015 to 2016 near the intersectionof county roads 201 and 204. The triggering mechanismfor the observed subsidence has also been attributed todissolution of the Salado Formation around !400 mdeep, similar to the cause of collapses at Wink Sinks#1 and #2 (Paine and others, 2012; Kim and others,2016, 2019). There were numerous water wells andhydrocarbon-production wells, most of which havebeen inactive and abandoned. Inappropriate boreholemanagement, as judged by current more stringent stand-ards, could initiate the freshwater contact of the Saladolayer through unplugged boreholes, corroded pipes, orleaked casing and other engineering issues (Paine and
Figure 3. Average subsidence rate map from TerraSAR-X images from October 2015 to March 2016. Contour linesare drawn at intervals of 2 cm/yr.
108 Jin Woo Kim and Zhong Lu

others, 2012; Kim and others, 2016, 2019). In addition,intensive water-"ooding operations were used in thisarea for several decades from the 1970s to the 2000s(Kim and others, 2019), which could act as an importantcontributor to the rapid subsidence. Fractures in the aqui-fer and formations surrounding the salt layer created bypressurized "uid injection and long-term hydrocarbonproduction could have allowed freshwater to intrudeinto the Salado Formation, initiating the dissolutionprocess (Kim and others, 2019). The accelerated salt dis-solution could cause cavity formation, upward migra-tion, and the ground surface subsidence. Therefore, webelieve the combined effects of improper borehole man-agement andmassive water production were responsiblefor the development of the subsidence feature east ofWink Sink #2.
Inspecting the deformation over the double-peak sub-sidence feature east of Wink Sink #2 suggests that notonly did the rate of peak subsidence increase, but thatthe extent of the subsidence also expanded from2007–2011 to 2015–2016 (Figures 2 and 3). For exam-ple, the peak subsiding area was contained to the north ofcounty road 201 in 2007–2011, but expanded furthersouth of county road 201 in 2015 to 2016. Kim andothers (2019) attributed the accelerated subsidence atthe developing sinkholes to a combination of human-induced (hydrocarbon and water "ooding, etc.) andnatural perturbations (droughts) in the subsurface sur-rounding the Salado layer. In fact, a severe drought hitthe area in 2011, which was the worst in the past 30 yrin Texas (Kim and others, 2019). Because of decadalwater-"ooding operations that caused fractures in theformations surrounding the Salado Formation alongwith those formed during borehole drilling and realign-ment (Heithecker, 1932; Adams, 1944; Baumgardner andothers, 1982; Johnson, 1989; Kim and others, 2019), thearea already possessed awell-developed fracture system.The 2011 drought lowered groundwater levels, which inturn added overburden stress, and further compoundedsinkhole development vulnerability. The increasedeffective stress and internal erosion in the overlyinglayers can result in more rapid downward percolationof freshwater in aquifer systems into the underlyingsalt beds, causing the acceleration of the salt dissolutionand surface/subsurface subsidence (Linares and others,2017; Kim and others, 2019). Although the double-peak subsidence feature has not yet resulted in a collapseas witnessed at Wink Sinks #1 and #2, the acceleratedsubsidence represents a signi!cant potential geohazardin the area. Hence, continuous monitoring of the subsi-dence in the vicinity of theWink sinkholes using satelliteInSAR or other ground-based instruments is urgentlyneeded to prevent future catastrophic outcomes thatwill endanger the area’s oil production facilities, criticalinfrastructure, and human safety.
ACKNOWLEDGEMENTS
Thisworkwassupported inpartby theNASAEarthSur-face and Interior Program under Grants 80NSSC19K1491and NNX16AL10G and in part by the Shuler-FoscueEndowment at Southern Methodist University.
REFERENCES CITED
Adams, J.E., 1944, Upper Permian Ochoan Series ofDelaware Basin, west Texas and southeasternNew Mexico: American Association of PetroleumGeologists, Bulletin, v. 28, p. 1596-1625.
Baer, G., Schattner, U., Wachs, D., Sandwell, D.,Wdowinski, S., and Frydman, S., 2002, The lowestplace on Earth is subsiding – an InSAR (interferomet-ric synthetic aperture radar) perspective: GeologicalSociety of America, Bulletin, v. 114, no. 1, p. 12-23.
Baumgardner, R.W., Hoadley, A.D., and Goldstein,A.G., 1982, The Wink Sinks; a case history of evapo-rite dissolution and catastrophic subsidence: Forma-tion of the Wink Sink, a salt dissolution andcollapse feature, Winkler County, Texas: Bureau ofEconomic Geology, The University of Texas atAustin, Report of Investigations No. 114, 38 p.
Beck, B.F., and Pearson, F.M., 1995, Karst Geohazards:Engineering and environmental problems in karst ter-rane, in Proceedings of the Fifth MultidisciplinaryConference on Sinkholes and the Engineering andEnvironmental Impact of Karst, Gatlinburg, Tennes-see, 2–5 April 1995: Balkema, Rotterdam, 582 p.
Chang, L., and Hanssen, R.F., 2014, Detection of cavitymigration and sinkhole risk using radar interferomet-ric time series: Remote Sensing of Environment,v. 147, p. 56-64.
Ferretti, A., Prati, C., and Rocca, F., 2001, Permanentscatterers in SAR interferometry: IEEE Transactionson Geoscience and Remote Sensing, v. 39, p. 8-20.
Ferretti, A., Fumagalli, A., Novali, F., Prati, C., Rocca,F., and Rucci, A., 2011, A new algorithm for process-ing interferometric data-stacks: SqueeSAR: IEEETransactions on Geoscience and Remote Sensing,v. 49, no. 9, p. 3460-3470.
Galve, J. P., Gutiérrez, F., Remondo, J., Bonachea, J.,Lucha, P., and Cendrero, A., 2009, Evaluating andcomparing methods of sinkhole susceptibility map-ping in the Ebro Valley evaporite karst (NE Spain):Geomorphology, v. 111, no. 3/4, p. 160-172.
Gutiérrez, F., Parise, M., De Waele, J., and Jourde, H.,2014, A review on natural and human-induced geoha-zards and impacts in karst: Earth-Science Reviews,v. 138, p. 61-88.
Hanssen, R.F., 2001, Radar interferometry: data inter-pretation and error analysis: New York, Boston,
Sinkholes in Wink, Texas, Observed by Satellite Radar Imagery 109
Dordrecht, London, Moscow, Kluwer AcademicPublisher, 308 p.
Heithecker, R.E., 1932, Some methods of separating oiland water in west Texas !elds, and the disposal ofoil-!eld brines in the Hendrick Oil Field, Texas: USBureau of Mines, Report of Investigations 3173, 16 p.
Hooper, A., Zebker, H., Segall, B., and Kampes, B.,2004, A new method for measuring deformation onvolcanoes and other natural terrains using InSAR per-sistent scatterers: Geophysical Research Letters, v. 31,L23611, 5 p.
Johnson, K.S., 1989, Development of the Wink Sink inwest Texas, U.S.A., due to salt dissolution and col-lapse: Environmental Geology and Water Sciences,v. 14, no. 2, p. 81-92.
Johnson, K.S., and Neal, J. T., 2003, Evaporite karst andengineering/environmental problems in the UnitedStates: Oklahoma Geological Survey, Circular 109,353 p., ISSN 0078-4397.
Johnson,K.S., Collins,W.W., andSeni, S. J., 2003, Sink-holes and land subsidence due to salt dissolution nearWink,West Texas, and other sites inwestern Texas andNew Mexico: Oklahoma Geological Survey, Circular109, p.183–195.
Johnson, K.S., 2005, Subsidence hazards due to evapo-rite dissolution in the United States: EnvironmentalGeology, v. 48, p. 395-409.
Jones, C.E., and Blom, R.G., 2014, Bayou Corne, Loui-siana, sinkhole: Precursory deformation measured byradar interferometry: Geology, v. 42, no. 2, p. 111-114.
Kuniansky, E.L.,Weary,D.J., andKaufmann, J.E., 2016,The current status of mapping karst areas and avail-ability of public sinkhole-risk resources in karst ter-rains of the United States: Hydrogeology Journal,v. 24, p. 613-624.
Kim, J.W., Lu, Z., and Degrandpre, K., 2016, OngoingDeformation of Sinkholes in Wink, Texas, Observedby Time-Series Sentinel-1A SAR Interferometry(Preliminary Results): Remote Sensing, v. 8, no. 313,doi:https://doi.org/10.3390/rs8040313.
Kim, J.W., and Lu, Z., 2018, Association between local-ized geohazards in West Texas and human activities,recognized by Sentinel-1A/B satellite radar imagery:Scienti!c Reports, v. 8, no. 4727, doi:https://doi.org/10.1038/s41598-018-23143-6.
Kim, J.W., Lu, Z., and Kaufmann, J., 2019, Evolution ofsinkholes over Wink, Texas, observed by high-resolution optical and SAR imagery: Remote Sensingof Environment, v. 222, p. 119-132.
Kwoun, O., Lu, Z., Neal, C., and Wicks, C., 2006, Qui-escent deformation of the Aniakchak Caldera, Alaska,mapped by InSAR: Geology, v. 34, no. 1, p. 5-8.
Linares, R., Roqué, C., Gutiérrez, F., Zarroca, M.,Carbonel, D., Bach, J., and Fabregat, I., 2017, Theimpact of droughts and climate change on sinkholeoccurrence. A case study from the evaporite karst ofthe FluviaValley, NESpain: Science of the Total Envi-ronment, v. 579, p. 345-358.
Lu, Z., Dzurisin, D., Jung, H.S., Zhang, J.X., and Zhang,Y.H., 2010, Radar Image and Data Fusion for NaturalHazards Characterization: International Journal ofImage and Data Fusion, v. 1, p. 217-242.
Lu, Z., and Dzurisin, D., 2014, InSAR imaging ofAleutian volcanoes: monitoring a volcanic arc fromspace, Chichester, UK: Springer Praxis Books.Geophysical Sciences. ISBN 978-3-642-00347-9:390 p.
Lu, Z., and Zhang, L., 2014, Frontiers of Radar RemoteSensing: Photogrammetric Engineering and RemoteSensing, v. 80, no. 1, p. 5-13.
Massonnet, D., Rossi, M., Carmona, C., Adragna, F.,Peltzer, G., Feigl, K., and Rabaute, T., 1993, Thedisplacement !eld of the Landers earthquakemapped by radar interferometry: Nature, v. 364,p. 138-142.
Paine, J.G., Buckley, S.M., Collins, E.W., and Wilson,C.R., 2012, Assessing collapse risk in evaporitesinkhole-prone areas usingmicrogravimetry and radarinterferometry: Journal of Environmental and Engi-neering Geophysics, v. 17, no. 2, p. 75-87.
Qu, F.F., Lu, Z., Zhang, Q., Bawden, G.W., Kim, J.W.,Zhao, C.Y., and Qu,W., 2015,Mapping ground defor-mation over Houston-Galveston, Texas using Multi-temporal InSAR: Remote Sensing of Environment,v. 169, p. 290-306.
Rosen, P.A.,Hensley, S., Joughin, I.R., Li, F.K.,Madsen,S.N., Rodriguez, E., and Goldstein, R.M., 2000, Syn-thetic aperture radar interferometry: Proceedings ofthe IEEE, v. 88, no. 3, p. 333-382.
Shi, Y., Tang, Y.M., Lu, Z., Kim, J.W., and Peng, J.H.,2019, Subsidence of sinkholes in Wink, Texas from2007 to 2011 detected by time-series InSAR analysis:Geomatics, Natural Hazards and Risk, v. 10, no. 1,p.1125-1138, DOI: https://doi.org/10.1080/19475705.2019.1566786.
Waltham, T., Bell, F., and Culshaw, M., 2005, Sinkholesand subsidence: karst and cavernous rocks in engi-neering and construction: Berlin, Springer, ISBN3-540-20725-2, 383 p.
Zebker, H.A., Rosen, P.A., Goldstein, R.M., Gabriel, A.,and Werner, C.L., 1994, On the derivation of coseis-mic displacement !elds using differential radarinterferometry—the Landers earthquake: Journal ofGeophysical Research, 99:19617-19634.
110 Jin Woo Kim and Zhong Lu

ABSTRACT.—The�development�of�sinkholes�above�the�bedded�evaporite�depos-its�of�the�Permian�Basin�of�west�Texas�in�the�last�40�years�has�renewed�interests�in�understanding� these�geologic�hazards.�Speci!cally,� the�development�of� two� large�sinkholes� (90–300�m� in�diameter)�near� the� town�of�Wink� in�June�1980�and�May�2002,� as�well� as�other� “sag”� features�have�been� identi!ed� in� the� area.�Naturally�occurring�dissolution�of�subsurface�salts�near�Wink,�Texas,� likely�began�as�early�as�Laramide�time�and�recurred�through�the�Cenozoic,�driven�by�meteoric�"ushing�associated�with�regional�uplift.�However,� the�development�of� the�sinkhole� terrain�and�surface�collapse�features�of�the�Wink�Sinks�have�been�exacerbated�by�oil!eld-related�drilling�and�pumping�activities�over�the�past�100�years.�Additional�areas�of�“sag”,�where� the�surface� is�de"ated,�have�been� identi!ed�by�satellite-based� radar�interferometry�and�visual�observations�during�!eld�visits�to�the�Wink�Sinks.�These�sag�areas�show�no�surface�collapse�features�and�suggest�that�a�simple�brittle�failure�model�is�insuf!cient�to�wholly�describe�de"ation�in�the�area�surrounding�the�Wink�Sinks.�Here,�we�summarize� the�historical,�present,�and� the�possible� future�condi-tions�of�the�Wink�Sinks�with�data�commonly�collected�during�oil-�and�gas-drilling�operations.�Speci!cally,�we�evaluate�four�(4)�sets�of�data�collected�over�a�70-km2�
(~27�mi2)� area� surrounding� the�Wink�Sinks,� including�oil�well-plugging� reports,�water-supply� well� data,� anecdotal� reports� of� unusual� production� events,� and�produced-water�sample�analyses.
INTRODUCTION
Sinkholes are a common geologic hazard in manyparts of the world (e.g., Beck, 1995; Johnson andNeal, 2003). In Texas, sinkholes are associated with bed-ded Paleozoic salt beneath the High Plains of northernTexas and the Permian Basin of west Texas, limestonekarst in central Texas, and shallow salt domes of easternTexas and the Coastal Plain (Fig. 1). The development oftwo large sinkholes over evaporitic deposits near thecommunities of Wink and Kermit in west Texas overthe last 40 years highlights the need to determine thelocations and likelihood of salt dissolution-induced sub-sidence and collapse in sinkhole-prone areas. Thegrowth of the Wink Sinks is thought to be the result ofsalt breccia formation from freshwater circulation inthe Salado Salt that was later exacerbated by water cir-culating around a borehole opening forming a dissolu-tion cavity followed by successive roof collapseresulting in a breccia-!lled pipe that eventually reached
the surface (Baumgartner and others, 1982; Johnson,1989). These areas of “brittle” surface failure are whollyor partially surrounded by areas of “sag” where theground surface is de"ated, but no open-cavity sinkholehas developed. Here, noninvasive oil!eld-related meth-ods are used to examine the potential for the develop-ment of the near-surface cavities that, as yet, have noexpressed surface features. Using oil!eld-related data,including plugging reports, water-supply well histories,produced water analyses, and anecdotal well/productiondata, they provide ample geologic data to supplementmore technologically driven methods of interferometricsynthetic aperture radar (InSAR) and microgravimetrymeasurements taken at the Wink Sinks. Together, thesetechniques can quantify the potential for vertical groundmovement that may precede sinkhole collapse, and alsoquantify the extent andmagnitude of shallow-subsurfacede!cits that would indicate areas with signi!cant poten-tial for sinkhole-related subsidence or collapse.
Trentham, Robert C.; and Henderson, Miles A., 2021, Assessing Collapse Risk in Evaporite Sinkhole-Prone AreasUsingCommonlyAvailableOil FieldData in theArea of theWinks Sinks,Winkler County, Texas, in Johnson,K. S.;Land, Lewis; and Decker, D. D. (eds.), Evaporite Karst in the Greater Permian Evaporite Basin (GPEB) of Texas,New Mexico, Oklahoma, Kansas, and Colorado: Oklahoma Geological Survey, Circular 113, p. 111–124.
0LMBIPNB�Geological�Survey�Circular�113,�2021
Assessing�Collapse�Risk�in�Evaporite�Sinkhole-Prone�Areas�Using�Commonly�Available�Oil�Field�Data�in�the�Area�of�the�Winks�Sinks,�Winkler�County,�Texas
Robert�C.�Trentham�and�Miles�A.�HendersonDepartment�of�Geosciences,�University�of�Texas�Permian�Basin,�Odessa,�Texas
111

GEOLOGYAND HISTORICAL BACKGROUND
Two large sinkholes have formed in the PermianBasin of west Texas. Wink Sink 1 (WS1) formed inJune 1980 and Wink Sink 2 (WS2) formed in May2002 near the communities of Wink and Kermit inWinkler County Texas (Baumgardner and others, 1982;Johnson, 1989; Collins, 2000; Johnson and others,2003). These sinkholes formed above the HendrickField, originally discovered in 1926, along the westernmargin of the Central Basin Platform (Fig. 1) that produ-ces from the upper Permian shelf sand reservoirs in theYates and Tansill Formations, which lie immediatelyabove the Permian Capitan Reef complex (Fig. 2).Approximately 200–300 m of interbedded salts withminor shale and anhydrite comprising the upper PermianSalado Formation overlies the producing horizons of theTansill Formation at depths of ~400–670 m. Above the
Salado Formation is the late Permian Rustler and DeweyLake formations which are composed mostly of red bedsand shales. Permian strata are then overlain by the Teco-vas and Santa Rosa members of the Mesozoic DockumGroup composed of sands, silts, and shales. Near the sur-face is a variable section of Quaternary Alluvium withthicknesses related to salt dissolution associated withregional uplift and "ushing of meteoric-derived "uids.
Wink Sink 1, which formed rapidly on June 3, 1980,measured 110-m across and 34-m deep soon after thetime of collapse. Aerial photographs, taken in 2004,show that WS1 had an approximately circular outline94–117-m across elongated to the northeast–southwest(Fig. 3). Water present in the bottom ofWS1 is represen-tative of thewater table depth in theQuaternaryAlluvium(Fig. 3C). The Hendrick No. 10-A, a 780-m-deep welldrilled in 1928 and abandoned in 1964, which produced
Figure 1. Regionalmap of Texas. The outlines of theMidland Basin, the Delaware Basin, and the Val Verde Basin, andCentral Basin Platform (CBP) of the greater Permian Basin area are shown in orange and blue, respectively. The townof Wink is located on the edge of the Central Basin Platform in the sinkhole prone area above the Permian beddedsalt deposits. Modi!ed after Paine and others (2012).
112 Robert C. Trentham and Miles A. Henderson

oil from the Tansill and Yates Formations below the saltsection, was enveloped by the sinkhole (Baumgardnerand others, 1982). Wink Sink 1 has continued to grow,initially thru collapse of the roof, and then rim that re-sulted in the eventual development of slopes with anangle of repose, which suggests that the cavern beneaththe sink had been!lled and any later collapsing rimmate-rial began to form the slope. Following the initial sinkdevelopment, the area around the sink began to slowlysag without associated surface collapse, especially onthe west side of the sink. The development of concentrichorst and graben ring structures north, west, and south,and compression ridges perpendicular to the ring struc-tures suggesting movement toward the center as thematerial is slowly tilting inward to the sink suggestingcontinued dissolution beneath the sink area. Thisresponse is different from that seen on the east side ofthe sinkwhere there is a signi!cant sag area that continuesto develop and where the ring structures are absent. Thislong-term response suggests that the sag on the east sideof WS1 is responding in a manner similar to that in theWink Sag.
Since its opening,WS1 has not grown signi!cantly insize; however, surface elevation changes are observed asa series of concentric horst and graben structures thathave formed on the southwest, south, and southeast sidesof WS1 (Fig. 3B and 3D). These graben structures sug-gest ductile deformation of the near surface aroundWS1,with the near-surface units stepping down and tilting
inward toward the center of the sink. The outermostand largest of these horst and graben structures has amaximum offset of ~ 3 m from the outer horst into thegraben center, and the inner horst is ~1.5 m below theouter horst (Fig. 3D). These features developed rapidlyafter WS1 formed and continued movement has beenobserved from the 1990s until the present day. Addi-tional signs of surface movement surrounding WS1are observed as a series of compression ridges notedon the caliche oil !eld road immediately west of the sink-hole. These compression features occur where the coni-cal horst and graben structures are most pronounced,and the ground is shifting from all directions towardthe sinkhole. The result of this movement is a space issuein the near surface, and the compression ridges resultfrom the excess volume of material moving toward thesink (Fig. 3B). The sides of WS1 have stabilized overtime with material sloughed off the "anks of the sinkto create a stable, but steep, slope suggesting that thevoid space beneath the sink has been !lled prohibitingfurther collapse. The area immediately east of theWS1 along the north–south lease road dropped signi!-cantly following the opening of the sinkhole and the re-sulting sag area continued to sink at a reduced rate. To thewest, SH 115, ~180-m (600 ft) northwest of the sink hasshown no evidence of elevation change; however, a0.3-m (1ft) wide, 0.3-m (1ft) deep, and 30.5-m (100ft)long gap developed in the bar ditch of the road in2005. The sag area to the east of WS1 is where a watersupply well (Gulf Oil #11WS) is located southeast of thesink, andwhere the two oil storage tanks located ~300-m(1000 ft) east northeast of the sink had to be decommis-sionedwhen 0.3 m of tilt was identi!ed on the roof of thelarger tank. By 2005, the growth of the sag led to decom-missioning and removal of two oil storage tanks locatedto the northeast of WS1 because of the 0.3-m tilt acrossthe top of the larger of the two tanks (Fig. 4A and 4B).Within the past 20 years, the sag east–southeast of WS1has grown to encompass the location of the pluggedGulf#10-WS well, a water supply wells immediately east ofWS1 (Fig. 4C). Flow of unsaturated water from above orbelow the salt section, possibly through natural orinduced fractures, or through holes in the local bore-holes, is the most likely cause of salt dissolution and col-lapse at WS1 (Baumgardner and others, 1982; Johnsonand others, 2003). Wink Sink 1 is monitored and has notgrown further as noted during periodic !eld visits to con-!rm the surface geometry of WS1 and the surroundingarea. The model for the development ofWS1 is of an ini-tial brittle failure with rapid development of the sink fol-lowed by ductile failure/sag of the eastern margin of thesink and a continual falling into the center point ofthe south, west, and north sides within ~ 182 m (600 ft)of the sink. This suggests that the area beneath thesink and the immediate area around it is continuing to
Figure 2. Generalized stratigraphy of the Permian Basinin the vicinity of theWink Sinks. After Baumgartner andothers (1982).
Commonly Available Oil Field Data in the Area of the Winks Sinks, Winkler County, Texas 113

subside,�but�that�the�east�is�responding�differently�(duc-tile�failure)�from�the�north,�west,�and�south�which�seem�to�have�a�combination�of�brittle�and�ductile�failure.�The�sur-face�geometry�of�the�area�around�WS1�suggests�that�the�areas�>�180�m�on�the�south�west�and�north�are�stable�at�this� time.�Wink�Sink�2� formed�1.6�km� south�of�Wink�Sink� 1� on�May� 21,� 2002� (Fig.� 5).�Wink� Sink� 2� has�expanded� from� its�original� surface�diameter�of�137�m�to� an� oval� shape� with� widths� ranging� from� 225� to�325�m�with�elongation�in�the�northeast–southwest�direc-tion.�Wink�Sink�2�grew�so�rapidly� that�parts�of�almost�vertical� walls� would� fail� and� collapse� into� the� sink�(Fig.�5B�and�5C).�As�the�sink�grew,�there�was�little�evi-dence�of�a�‘bottom’�to�the�sink�as�sections�of�the�north�and�east�walls�would�almost�completely�disappear�below�the�water�table,�suggesting�that�WS2�had�a�much�larger�void� space� beneath� it� than�WS1.�Within� the� last� few
years, debris aprons have developed and stabilized alongparts of the north and east walls, suggesting that the voidspace beneath the sink has begun to !ll (Fig. 5D). It is notpossible at this time to estimate the size of the initial cav-ern. In recent years, an area on the south side ofWS2 hasseen accelerated growth of a sag, or slump, with thedevelopment of an associated debris apron which bearscontinued observation. Wink Sink 2 encircles the loca-tion of the former Gulf #8-WS, a water-supply wellthat was drilled through the salt section to a depth of1092 m in 1960 and is estimated to have yielded 800mil-lion bbl of water for water"ood operations from the Cap-itan Reef in the Hendrick Field (Johnson 1982, 2003).The cause of collapse at WS2 has not been determined,but it is thought to be related to the WS-8 well (Johnsonand others, 2003). Immediately afterWS2began to form,the Texas Railroad Commission, the petroleum industry
Figure 3. A) Oblique aerial view of Wink Sink 1. Arrow shows the axis of elongation. B) Same view as A, but withannotations showing the areas of movement outside of the sink. Arrows indicate the directions of surface move-ment that resulted in the development of a sag to the east of the sink and a graben structure to the west of the sink,and a pressure ridge to the west/northwest of the sink. C) View of Wink Sink 1 taken from the eastern side of thesink. The area is indicated as the orange box in A. D) Close up of the graben structure located to the west of the sink.The area is indicated in the orange box of B.
114 Robert C. Trentham and Miles A. Henderson

regulation agency in Texas, required that the operatorbegin plugging the producing wells within a quartermile radius of the sinkhole and the surface owner placeda 2.5-m (~ 8 ft) fence aroundWS2. A few years later, theinitial fence was engulfed by the sinkhole and a secondfence was constructed around the sinkhole. As the sink-hole continued to grow, the second fence partially col-lapsed into the sinkhole and a third fence encompassing
an� area� of� 0.5� km2� was� constructed� around� WS2.�Wink� Sink� 2,� now� almost� 20� years� old,� continues� to�grow,� and� the�west,� north,� and� east� sides� continue� to�exhibit�almost�vertical�walls�with�sections�spalling�off�from�these�sides�and�collapsing�into�the�sink�(Fig.�5C).�Within� the� past� 2� years,� this� activity� has� diminished,�and�slopes�have�begun�to�form�along�the�base�of�the�steep�cliffs,�suggesting�that�the�sink�is�entering�a�!ll�phase,�as�WS1� did.� Discussions� with� local� of!cials� and� !eld-workers� indicate� that� they�were�convinced�at� the� time�that�WS2�was�going� to�form� in� the�center�of� the�Wink�Sag�area.�As�with�WS1,�the�formation�of�WS2�was�sud-den�and�the�growth�was�rapid�in�an�area�where�there�was�no�evidence�of�pre-existing�surface�features�or�sag.�Over�the�past�decade,�the�elevation�on�the�north�and�west�sides�has�remain�stable;�however,�the�south�side�has�shown�a�signi!cant�drop�in�elevation,�and�the�east�side�has�shown�a�less�severe�drop.
About�a�decade�after�WS1�formed,�local�residents�and�oil�!eld�workers�began� to�notice�an�area�about�1.6-km�(1�mile)�east�of�the�eventual�location�of�WS2,�and�just�northwest�of�the�intersection�of�Winkler�County�Roads�201�and�204,�had�begun�to�sag�or�de"ate�(Fig.�6)�even-tually�leading�to�the�closure�of�CR�204,�and�relocation�of�many�of�the�oil�and�gas�pipelines�in�the�area.�This�area�is�called�the�“Wink�Sag”�by�local�residents�and�Hendrick�Field� workers.� A� series� of� surface� !ssures� forming�incomplete� concentric� elliptical� arcs� encircle� the�depressed�area�centering�on�the�area�of�the�greatest�ele-vation� change� (Fig.� 6).� The� surface�manifestations� of�these�fractures�typically�are�0.3�m�wide�and�1–3�m�deep�with� no� apparent� elevation� changes� across� the� frac-tures.�A�small�study�completed�in�2004�to�2005�to�eval-uate� the� extent� of� the� recently� developed� fractures�associated� with� the� Wink� Sag� (Burch� &� Trentham,�2007).�A�hand-held�GPS�unit�was�used� to� identify� the�location�of�the�larger�surface�fractures�identi!ed�around�the�Wink� Sag.�Two� concentric� elliptical� “rings”�were�partially� identi!ed� by� tracking� the� surface� fractures�around�the�Wink�Sag�to�the�east,�south,�and�west�of�the�sag� (Fig.�7).�These�surface� features�were�not� identi!ed�to� the�north�of� the� sag�area.�The� surface�expression�of�these�features�was�attributed�to�ductile�failure�in�the�sub-surface�salt�that�does�not�extend�to�the�north.�The�area�to�the�north�of�the�sag�has�the�potential�brittlely�fail�in�the�future.�Additional�partial�rings�continue�to�slowly�develop�to�the�south�of�the�Wink�Sag.�At�the�same�time,�several�compression� ridges� began� to� form� where� the� surface�was�more� competent� (caliche� roads� and� drilling� pads)�and� at� four� locations� older� abandoned� buried� oil� !eld�pipes� (~20.3-cm�diameter)�buckled�and� rose�above� the�ground� surface� up� to� the� heights� of� 1.5� m.� Similar�deformed�pipe�features�are�seen�around�WS1�and�WS2.
In�2006,�the�Apache�#1�well�on�the�eastern�margin�of�the�Sag�failed�and�was�plugged,�and�in�2010,�the�casing
Figure 4. A) Satellite image of the tank area locatednorth of WS1 from 2008. B) Satellite image of thetank area located to the north ofWS1 from2020. Noticetwo of the tanks have been removed. C) Plugged Gulf#10-WS well located on a horst structure to the southof WS1. The ground elevation has dropped approxi-mately 1.5 m (5 ft) from the top of the well casing.
Commonly Available Oil Field Data in the Area of the Winks Sinks, Winkler County, Texas 115

from theApache #3 secondwell collapsed/sheared in thesalt section suggesting possible collapse or shifting in thesubsurface. These wells were subsequently plugged andabandoned. What concerned the residents initially aboutthe Wink Sag was a !ssure, estimated at ~28-cm deep inplaces, 0.6-m wide, and ~60-m long that began to formthrough a power substation and exposed a gas line,whichprovided natural gas to the local homes, businesses, andWink Elementary School (Fig. 8). After the initial devel-opment of the !ssure, it slowly ceased to grow; however,the power substation continues to be monitored and thepipeline to Wink has been rerouted away from the sinks.Additional concentric arcs began to develop and havecontinued to develop on the west and south of the centerof the Sag. The rate of growth appears to be greatlyreduced in the past 10 years to the point where manyof the !ssures appear to be stable, although their locationrelative to the county roads and power lines continues tobe monitored.
Ackers and others (1930) presented evidence of natu-ral dissolution and collapse in the subsurface of theHendrick Field. Two examples of core recovered in1928 from the Southern Crude #T-88-P-1 Hendrickshow collapse in the “anhydrite section” (Fig. 9A), andfrom the Southern Crude #T-88-N-3, Sec 28, Blk 26,the well was 32˚ off vertical, showed 40˚ dip on bedsat 716 m (2350 ft) near the base of the Salado Formation(Fig. 9B). Highly deviated wells were common inHendrick Field and these cores were recovered to evalu-ate where andwhy the deviationwas occurring in the saltsection. These cores show that some of the dissolutionand collapse features present in the salt section werepresent prior to any oil and gas activities in the area.This dissolution was likely associated with tectonicuplift that affected the western Permian Basin beginningwith the Laramide Orogeny and continuing intermit-tently through Rio Grande Rifting and Basin and Rangeextension. These tectonic events had various effects on
Figure 5. A) Oblique aerial view of Wink Sink 2. A scarp has developed to the North of sink that is likely to collapseinto the sink in the near future. The circular features located around the sink are the surface earthen berm from the1930s drilling activity in the area. B) Annotated view of A showing the outlines of the earthen berms surroundingWS2. C)Nearly vertical wall that ismigrating toward the center of the sink. Photo shows the viewof the sink from thewestern edge. The orange box in B shows the location of C. D) Stabilized debris aprons showing the nearly verticalwalls of the sink have stabilized around a plugged well.
116 Robert C. Trentham and Miles A. Henderson
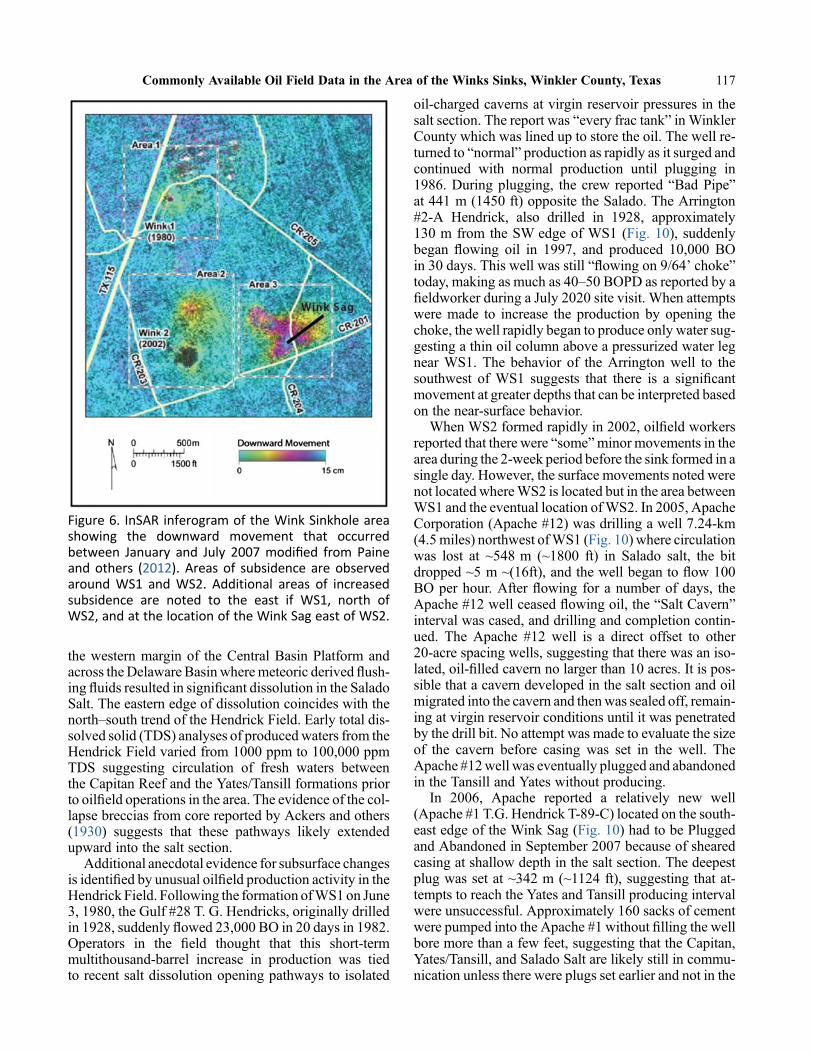
the western margin of the Central Basin Platform andacross theDelaware Basin wheremeteoric derived "ush-ing "uids resulted in signi!cant dissolution in the SaladoSalt. The eastern edge of dissolution coincides with thenorth–south trend of the Hendrick Field. Early total dis-solved solid (TDS) analyses of producedwaters from theHendrick Field varied from 1000 ppm to 100,000 ppmTDS suggesting circulation of fresh waters betweenthe Capitan Reef and the Yates/Tansill formations priorto oil!eld operations in the area. The evidence of the col-lapse breccias from core reported by Ackers and others(1930) suggests that these pathways likely extendedupward into the salt section.
Additional anecdotal evidence for subsurface changesis identi!ed by unusual oil!eld production activity in theHendrick Field. Following the formation ofWS1on June3, 1980, the Gulf #28 T. G. Hendricks, originally drilledin 1928, suddenly "owed 23,000 BO in 20 days in 1982.Operators in the !eld thought that this short-termmultithousand-barrel increase in production was tiedto recent salt dissolution opening pathways to isolated
oil-charged caverns at virgin reservoir pressures in thesalt section. The report was “every frac tank” in WinklerCounty which was lined up to store the oil. The well re-turned to “normal” production as rapidly as it surged andcontinued with normal production until plugging in1986. During plugging, the crew reported “Bad Pipe”at 441 m (1450 ft) opposite the Salado. The Arrington#2-A Hendrick, also drilled in 1928, approximately130 m from the SW edge of WS1 (Fig. 10), suddenlybegan "owing oil in 1997, and produced 10,000 BOin 30 days. This well was still “"owing on 9/64’ choke”today, making as much as 40–50 BOPD as reported by a!eldworker during a July 2020 site visit. When attemptswere made to increase the production by opening thechoke, the well rapidly began to produce only water sug-gesting a thin oil column above a pressurized water legnear WS1. The behavior of the Arrington well to thesouthwest of WS1 suggests that there is a signi!cantmovement at greater depths that can be interpreted basedon the near-surface behavior.
When WS2 formed rapidly in 2002, oil!eld workersreported that there were “some”minor movements in thearea during the 2-week period before the sink formed in asingle day. However, the surface movements noted werenot located whereWS2 is located but in the area betweenWS1 and the eventual location ofWS2. In 2005, ApacheCorporation (Apache #12) was drilling a well 7.24-km(4.5miles) northwest ofWS1 (Fig. 10) where circulationwas lost at ~548 m (~1800 ft) in Salado salt, the bitdropped ~5 m ~(16ft), and the well began to "ow 100BO per hour. After "owing for a number of days, theApache #12 well ceased "owing oil, the “Salt Cavern”interval was cased, and drilling and completion contin-ued. The Apache #12 well is a direct offset to other20-acre spacing wells, suggesting that there was an iso-lated, oil-!lled cavern no larger than 10 acres. It is pos-sible that a cavern developed in the salt section and oilmigrated into the cavern and thenwas sealed off, remain-ing at virgin reservoir conditions until it was penetratedby the drill bit. No attempt was made to evaluate the sizeof the cavern before casing was set in the well. TheApache #12well was eventually plugged and abandonedin the Tansill and Yates without producing.
In 2006, Apache reported a relatively new well(Apache #1 T.G. Hendrick T-89-C) located on the south-east edge of the Wink Sag (Fig. 10) had to be Pluggedand Abandoned in September 2007 because of shearedcasing at shallow depth in the salt section. The deepestplug was set at ~342 m (~1124 ft), suggesting that at-tempts to reach the Yates and Tansill producing intervalwere unsuccessful. Approximately 160 sacks of cementwere pumped into the Apache #1 without !lling the wellbore more than a few feet, suggesting that the Capitan,Yates/Tansill, and Salado Salt are likely still in commu-nication unless there were plugs set earlier and not in the
Figure 6. InSAR inferogram of the Wink Sinkhole areashowing the downward movement that occurredbetween January and July 2007 modi!ed from Paineand others (2012). Areas of subsidence are observedaround WS1 and WS2. Additional areas of increasedsubsidence are noted to the east if WS1, north ofWS2, and at the location of the Wink Sag east of WS2.
Commonly Available Oil Field Data in the Area of the Winks Sinks, Winkler County, Texas 117

available plug and abandonment report. Apache reportedanother well (Apache #3 T.G. Hendrick T-89-C) alsolocated on the southeast edge of the Wink Sag wasplugged and abandoned in August 2010 because ofsheared casing at a shallow depth of ~335 m (~1100 ft)in the Salt Section. The deepest plugs in the Apache#3 were set across the producing zone, and the shallowerplugs in the Apache #3 were set across the fresh water-producing interval. Before the casing collapse, the wellwas making 16 BOPD.
WATER ANALYSES
Produced waters were collected for the analysis ofTotal Dissolved Solids (TDS), pH, percent (%) oil cut,and resistivity from Apache Corporation wells at theUniversity of Texas Permian Basin. Locally, fresh wateris produced from both Quaternary alluvial deposits andthe Santa Rosa Member of the Dockum Group. TheOccidental Petroleum-operated El CapitanWater Supplywells, producing from the Capitan Reef, have histori-cally been capable of producing +/- 50,000 barrels of
water a day from each well, which is indicative of theproductive potential of the Capitan Reef. The CapitanReef water in this area is brackish with 7000 to12,000-ppm TDS and is used primarily for “make-up”water in San Andres and Grayburg water"oods else-where in the basin. Two water supply wells, drilled inthe 1950s, are aerially related to the Wink Sinks, andas a result, the location and history of all the water supplywells needed to be documented. Produced water analy-ses range in Total Dissolved Solids (TDS) from a fewthousand part per million (PPM) to 100,000 PPM. Thosewells with higher TDS suggest the potential for thedevelopment of holes in the casing opposite the salt sec-tion in some wells. Those wells with the lowest TDSssuggest artesian "ow from the Capitan Reef below theproductive Yates and into the salt section. Anecdotal evi-dence from unusual, multithousand barrels, short-termchanges in production in isolated wells suggests thatsalt dissolutionmay be opening isolated oil-charged cav-erns at virgin reservoir pressures in the salt section thatwere formed preoil production. Produced water from
Figure 7. Ellipse features identi!ed by GPS mapping of surface expression of large fractures surrounding the WinkSag. The fractures are easily traced to the south, southeast, and southwest of the sag area. Burch and Trentham(2007) interpret this surface expression as ductile failure in the subsurface where the surface features are identi!edand possible brittle failure possible in the future to the north where they are not identi!ed.
118 Robert C. Trentham and Miles A. Henderson
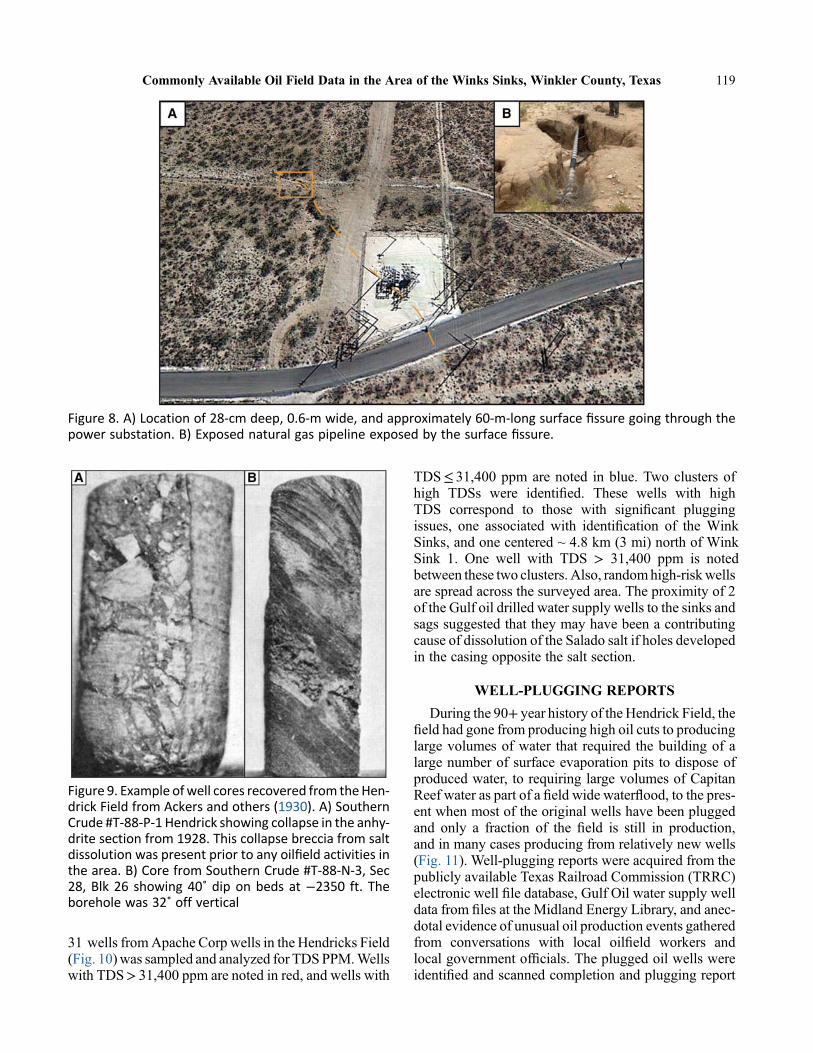
31 wells fromApache Corp wells in the Hendricks Field(Fig. 10)was sampled and analyzed for TDSPPM.Wellswith TDS> 31,400 ppm are noted in red, and wells with
TDS�!�31,400�ppm� are�noted� in�blue.�Two� clusters�of�high� TDSs� were� identi!ed.� These� wells� with� high�TDS� correspond� to� those� with� signi!cant� plugging�issues,� one� associated�with� identi!cation� of� the�Wink�Sinks,�and�one�centered�~�4.8�km�(3�mi)�north�of�Wink�Sink� 1.� One� well� with� TDS� >� 31,400� ppm� is� noted�between�these�two�clusters.�Also,�random�high-risk�wells�are�spread�across�the�surveyed�area.�The�proximity�of�2�of�the�Gulf�oil�drilled�water�supply�wells�to�the�sinks�and�sags�suggested�that�they�may�have�been�a�contributing�cause�of�dissolution�of�the�Salado�salt�if�holes�developed�in�the�casing�opposite�the�salt�section.
WELL-PLUGGING�REPORTS
During�the�90+�year�history�of�the�Hendrick�Field,�the�!eld�had�gone�from�producing�high�oil�cuts�to�producing�large�volumes�of�water� that� required� the�building�of�a�large�number�of�surface�evaporation�pits� to�dispose�of�produced�water,� to�requiring� large�volumes�of�Capitan�Reef�water�as�part�of�a�!eld�wide�water"ood,�to�the�pres-ent�when�most�of�the�original�wells�have�been�plugged�and� only� a� fraction� of� the� !eld� is� still� in� production,�and�in�many�cases�producing�from�relatively�new�wells�(Fig.�11).�Well-plugging�reports�were�acquired�from�the�publicly�available�Texas�Railroad�Commission�(TRRC)�electronic�well�!le�database,�Gulf�Oil�water�supply�well�data�from�!les�at�the�Midland�Energy�Library,�and�anec-dotal�evidence�of�unusual�oil�production�events�gathered�from� conversations� with� local� oil!eld� workers� and�local�government�of!cials.�The�plugged�oil�wells�were�identi!ed�and�scanned�completion�and�plugging�report
Figure 8. A) Location of 28-cm deep, 0.6-m wide, and approximately 60-m-long surface !ssure going through thepower substation. B) Exposed natural gas pipeline exposed by the surface !ssure.
Figure 9. Example ofwell cores recovered from theHen-drick Field from Ackers and others (1930). A) SouthernCrude #T-88-P-1 Hendrick showing collapse in the anhy-drite section from 1928. This collapse breccia from saltdissolution was present prior to any oil!eld activities inthe area. B) Core from Southern Crude #T-88-N-3, Sec28, Blk 26 showing 40˚ dip on beds at "2350 ft. Theborehole was 32˚ off vertical
Commonly Available Oil Field Data in the Area of the Winks Sinks, Winkler County, Texas 119
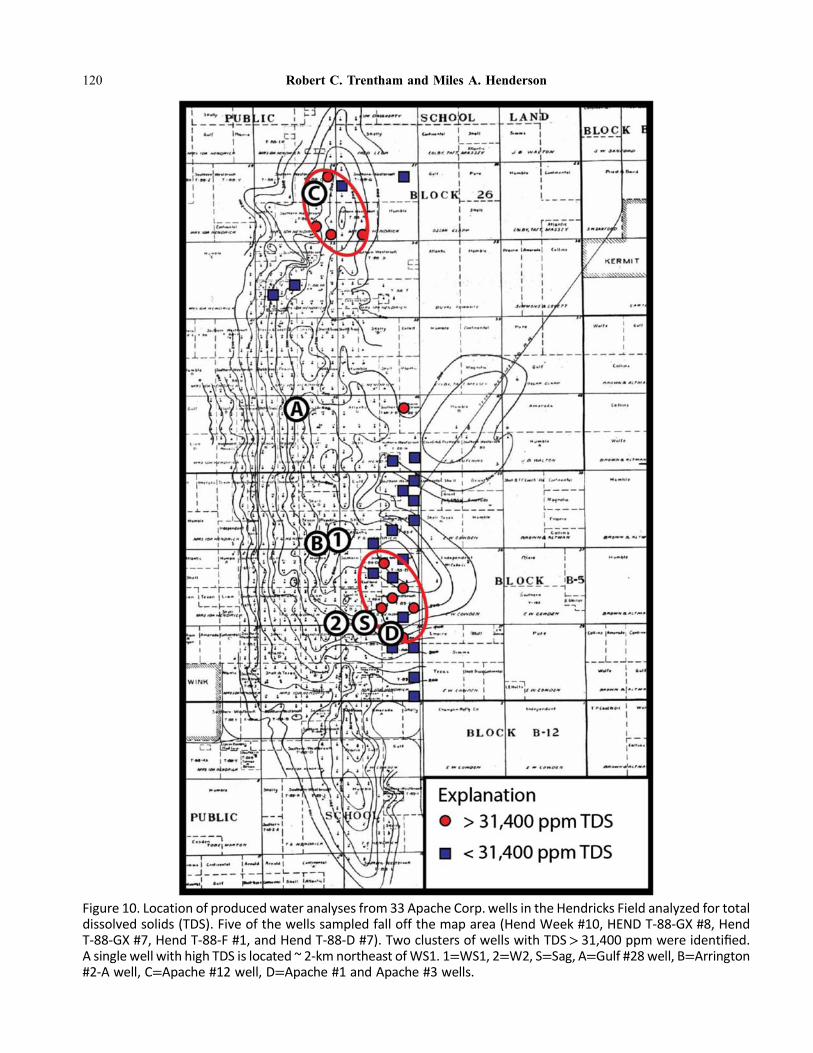
Figure 10. Location of produced water analyses from 33 Apache Corp.wells in the Hendricks Field analyzed for totaldissolved solids (TDS). Five of the wells sampled fall off the map area (Hend Week #10, HEND T-88-GX #8, HendT-88-GX #7, Hend T-88-F #1, and Hend T-88-D #7). Two clusters of wells with TDS> 31,400 ppm were identi!ed.A single well with high TDS is located ~ 2-km northeast ofWS1. 1=WS1, 2=W2, S=Sag, A=Gulf #28 well, B=Arrington#2-A well, C=Apache #12 well, D=Apache #1 and Apache #3 wells.
120 Robert C. Trentham and Miles A. Henderson

Figure 11. Approximate locations of wells in the Hendrick Field with bottom plugs set in or above the Salado Salt atdepths between 240 m (800 ft) and 520 m (1700 ft). Base map contoured on the top of the Tansill Formation fromAckers and others (1930). Contour interval is 50 ft.
Commonly Available Oil Field Data in the Area of the Winks Sinks, Winkler County, Texas 121

documents available for reviewwere evaluated. As com-pletion techniques have varied through time, the amountof cement used, whether the casing was cemented to sur-face or “tacked in” across the producing horizon wasnoted. In each case, as required by the former regulatorybody, the Texas Board of Water Engineers (TBWE) and
the current Texas Water Development Board (TWDB),the surface casing was cemented across the fresh-waterzone to depths of approximately 182 m (600 ft). Today,the TWDB requires cement to be circulated to surfaceallowing for effective isolation of the salt section fromthe produced "uids. In wells where cement was not
Figure 12. Locations of wells surrounding WS1, WS2, and the Wink Sag.
122 Robert C. Trentham and Miles A. Henderson
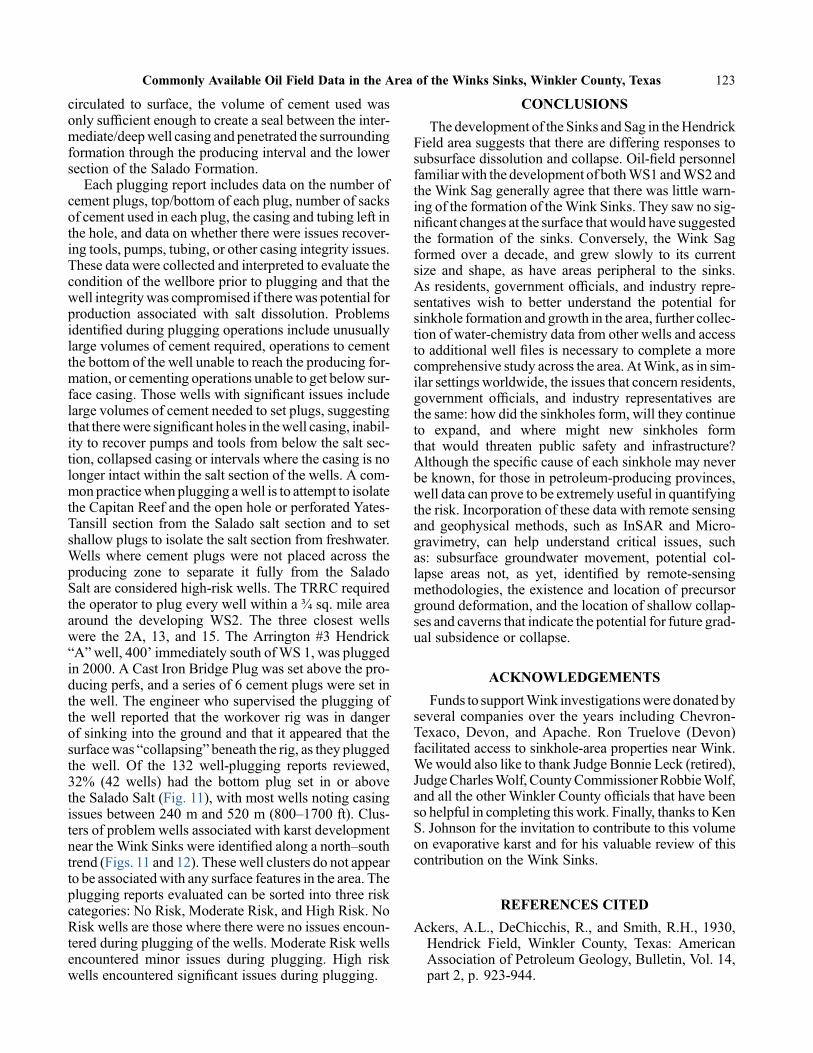
circulated to surface, the volume of cement used wasonly suf!cient enough to create a seal between the inter-mediate/deepwell casing and penetrated the surroundingformation through the producing interval and the lowersection of the Salado Formation.
Each plugging report includes data on the number ofcement plugs, top/bottom of each plug, number of sacksof cement used in each plug, the casing and tubing left inthe hole, and data on whether there were issues recover-ing tools, pumps, tubing, or other casing integrity issues.These data were collected and interpreted to evaluate thecondition of the wellbore prior to plugging and that thewell integritywas compromised if therewas potential forproduction associated with salt dissolution. Problemsidenti!ed during plugging operations include unusuallylarge volumes of cement required, operations to cementthe bottom of the well unable to reach the producing for-mation, or cementing operations unable to get below sur-face casing. Those wells with signi!cant issues includelarge volumes of cement needed to set plugs, suggestingthat therewere signi!cant holes in thewell casing, inabil-ity to recover pumps and tools from below the salt sec-tion, collapsed casing or intervals where the casing is nolonger intact within the salt section of the wells. A com-monpracticewhen plugging awell is to attempt to isolatethe Capitan Reef and the open hole or perforated Yates-Tansill section from the Salado salt section and to setshallow plugs to isolate the salt section from freshwater.Wells where cement plugs were not placed across theproducing zone to separate it fully from the SaladoSalt are considered high-risk wells. The TRRC requiredthe operator to plug every well within a ! sq. mile areaaround the developing WS2. The three closest wellswere the 2A, 13, and 15. The Arrington #3 Hendrick“A”well, 400’ immediately south ofWS 1, was pluggedin 2000. A Cast Iron Bridge Plug was set above the pro-ducing perfs, and a series of 6 cement plugs were set inthe well. The engineer who supervised the plugging ofthe well reported that the workover rig was in dangerof sinking into the ground and that it appeared that thesurfacewas “collapsing” beneath the rig, as they pluggedthe well. Of the 132 well-plugging reports reviewed,32% (42 wells) had the bottom plug set in or abovethe Salado Salt (Fig. 11), with most wells noting casingissues between 240 m and 520 m (800–1700 ft). Clus-ters of problem wells associated with karst developmentnear the Wink Sinks were identi!ed along a north–southtrend (Figs. 11 and 12). These well clusters do not appearto be associatedwith any surface features in the area. Theplugging reports evaluated can be sorted into three riskcategories: No Risk, Moderate Risk, and High Risk. NoRisk wells are those where there were no issues encoun-tered during plugging of the wells. Moderate Risk wellsencountered minor issues during plugging. High riskwells encountered signi!cant issues during plugging.
CONCLUSIONS
The development of the Sinks and Sag in theHendrickField area suggests that there are differing responses tosubsurface dissolution and collapse. Oil-!eld personnelfamiliarwith the development of bothWS1 andWS2andthe Wink Sag generally agree that there was little warn-ing of the formation of theWink Sinks. They saw no sig-ni!cant changes at the surface that would have suggestedthe formation of the sinks. Conversely, the Wink Sagformed over a decade, and grew slowly to its currentsize and shape, as have areas peripheral to the sinks.As residents, government of!cials, and industry repre-sentatives wish to better understand the potential forsinkhole formation and growth in the area, further collec-tion of water-chemistry data from other wells and accessto additional well !les is necessary to complete a morecomprehensive study across the area. AtWink, as in sim-ilar settings worldwide, the issues that concern residents,government of!cials, and industry representatives arethe same: how did the sinkholes form, will they continueto expand, and where might new sinkholes formthat would threaten public safety and infrastructure?Although the speci!c cause of each sinkhole may neverbe known, for those in petroleum-producing provinces,well data can prove to be extremely useful in quantifyingthe risk. Incorporation of these data with remote sensingand geophysical methods, such as InSAR and Micro-gravimetry, can help understand critical issues, suchas: subsurface groundwater movement, potential col-lapse areas not, as yet, identi!ed by remote-sensingmethodologies, the existence and location of precursorground deformation, and the location of shallow collap-ses and caverns that indicate the potential for future grad-ual subsidence or collapse.
ACKNOWLEDGEMENTS
Funds to supportWink investigationswere donatedbyseveral companies over the years including Chevron-Texaco, Devon, and Apache. Ron Truelove (Devon)facilitated access to sinkhole-area properties near Wink.We would also like to thank Judge Bonnie Leck (retired),JudgeCharlesWolf, CountyCommissionerRobbieWolf,and all the other Winkler County of!cials that have beenso helpful in completing this work. Finally, thanks toKenS. Johnson for the invitation to contribute to this volumeon evaporative karst and for his valuable review of thiscontribution on the Wink Sinks.
REFERENCES CITED
Ackers, A.L., DeChicchis, R., and Smith, R.H., 1930,Hendrick Field, Winkler County, Texas: AmericanAssociation of Petroleum Geology, Bulletin, Vol. 14,part 2, p. 923-944.
Commonly Available Oil Field Data in the Area of the Winks Sinks, Winkler County, Texas 123

Baumgardner, R.W., Jr., Hoadley, A.D., and Goldstein,A.G., 1982, Formation of the Wink Sink, a salt disso-lution and collapse feature, Winkler County, Texas:The University of Texas at Austin, Bureau ofEconomicGeology,Report of Investigations 114, 38p.
Beck, B.F., editor, 1995, Karst Geohazards: Engineeringand environmental problems in karst terrane: Proceed-ings of the Fifth Multidisciplinary Conference onSinkholes and the Engineering and EnvironmentalImpact of Karst, Balkema, Rotterdam, 582 pp.
Burch,M., and Trentham, R.C., 2007, Documentation ofsurface features associated with the continued devel-opment of the Wink Sag, Winkler County, Texas:West Texas Geological Society, Fall Symposium.
Collins, E.W., 2000, Reconnaissance investigation ofactive subsidence and recent formation of earth !s-sures near the 1980 Wink Sink in the Hendrick oil!eld, Winkler County, Texas (abstract): GeologicalSociety of America, South-Central Section, Abstractswith Programs, Vol. 32 (3), A-6.
Johnson, K.S., 1989, Development of the Wink Sink inWest Texas due to salt dissolution and collapse: Envi-ronmental Geology and Water Science, Vol. 14,p. 81-92.
Johnson, K.S., Collins, E.W., and Seni, S.J., 2003, Sink-holes and land subsidence owing to salt dissolutionnear Wink, West Texas, and other sites in westernTexas and New Mexico, in Johnson, K.S., and Neal,J.T., eds., Evaporite karst and engineering/environ-mental problems in the United States, OklahomaGeological Survey, Circular 109, p. 183-195.
Johnson, K.S., andNeal, J.T., eds., 2003, Evaporite karstand engineering/environmental problems in theUnited States: Oklahoma Geological Survey, Circular109, 353 p.
Paine, J.G., Buckley, S.M., Collins, E.W., and Wilson,C.R., 2012, Assessing collapse risk in evaporitesinkhole-prone areas usingmicrogravimetry and radarinterferometry: Journal of Environmental and Engi-neering Geophysics, Vol. 17, no. 2, p. 73-87.
124 Robert C. Trentham and Miles A. Henderson

Powers,DennisW.; andHolt, RobertM., 2021, EvaporiteDissolution and theWaste Isolation Pilot Plant (WIPP) in theNorthern�Delaware�Basin,�Southeastern�New�Mexico� in�Johnson,�K.�S.;�Land,�Lewis;�and�Decker,�D.�D.(eds.),�Evaporite�Karst�in�the�Greater�Permian�Evaporite�Basin�(GPEB)�of�Texas,�New�Mexico,�Oklahoma,�Kansas,�and�Colorado:�Oklahoma�Geological�Survey,�Circular�113,�p.�125–149.
0LMBIPNB�Geological�Survey�Circular�113,�2021
Evaporite�Dissolution�and�the�Waste�Isolation�Pilot�Plant�(WIPP)in�the�Northern�Delaware�Basin,�Southeastern�New�Mexico
Dennis�W.�Powers�and�Robert�M.�HoltDepartment�of�Geology�and�Geological�Engineering,�University�of�Mississippi,�
Oxford,�Mississippi
�"#453"$5��"T� B� TJUF� JO� CFEEFE� TBMU� GPS� EJTQPTJOH� USBOTVSBOJD�XBTUF� GSPN�6OJUFE�4UBUFT� EFGFOTF� QSPHSBNT � 8BTUF� *TPMBUJPO� 1JMPU� 1MBOU� 8*11� IBT� CFFO� JOUFOTJWFMZ�JOWFTUJHBUFE� GPS� OBUVSBM� QSPDFTTFT � JODMVEJOH� EJTTPMVUJPO � UIBU� NJHIU� BGGFDU� MPOH�UFSN�JTPMBUJPO�PG�UIFTF�XBTUFT��
%PXOXBSE� EJTTPMVUJPO� PG� UIF� FWBQPSJUF� TFRVFODF� XBT� DPOTJEFSFE� GSPN� UIF�CFHJOOJOH� PG� MPDBUJOH� UIF� 8*11� TJUF�� %JTTPMVUJPO� JOWFTUJHBUJPOT� FYQBOEFE� BOE�JOUFOTJmFE�XJUI�UIF�EJTDPWFSZ�JO�MBUF������PG�B�DPMMBQTF�DIJNOFZ�BLB�CSFDDJB�QJQF�JO�B�QPUBTI� NJOF� JO� UIF� BSFB� PG� 8*11�� "DSPTT� UIF� BSFB � WBSJPVT� TVSGBDF� EFQSFTTJPOT� BOE�TVCTVSGBDF� GFBUVSFT� TUSVDUVSBM� DIBOHFT � UIJDLFOJOH � BOE� UIJOOJOH� PG� UIF� FWBQPSJUF�TFRVFODF� XFSF� JEFOUJmFE�� -BUFSBM� EJTTPMVUJPO� XJUIJO� UIF� FWBQPSJUF� TFDUJPO� BOE� NPSF�MPDBMJ[FE�EJTTPMVUJPO�GSPN�CFMPX�XFSF�TVHHFTUFE�BT�NFDIBOJTNT�GPS�UIFTF�GFBUVSFT��'SPN�BCPVU� ����� UP� ���� � TPNF� PG� UIFTF� GFBUVSFT�XFSF� JOWFTUJHBUFE� JO� EFUBJM� CZ� HFPQIZTJDBM�UFDIOJRVFT � ESJMMJOH� BOE� DPSJOH � BOE� NBQQJOH� UP� EFUFSNJOF� JG� UIFZ� XFSF� JOEVDFE� CZ�EJTTPMVUJPO�� 4JHOJmDBOU� SFTPVSDFT� XFSF� EFWPUFE� UP� UIFTF� JOWFTUJHBUJPOT�� CZ� ���� �NPTU�IBE� CFFO� HFOFSBMMZ� SFTPMWFE � BOE� UIF�8*11� TJUF�XBT� OPU� GPVOE� UP� JODMVEF� EJTTPMVUJPO�GFBUVSFT�PS�QSPDFTTFT�DPOTJEFSFE�EFUSJNFOUBM�UP�MPOH�UFSN�XBTUF�JTPMBUJPO��
/BTI� %SBX� JT� B� NBKPS� LBSTU� GFBUVSF� XFTU� PG� UIF� 8*11� TJUF � BOE� LBSTU� XBT�QSPQPTFE� BU� 8*11� JO� ����� CBTFE� PO� B� NJDSP�HSBWJUZ� TVSWFZ�� "� TJHOJmDBOU� HSBWJUZ�BOPNBMZ�XBT�EFUFDUFE�BDSPTT�B�TVSGBDF�EFQSFTTJPO�PVUTJEF�PG�8*11��BO�FBSMJFS�ESJMM�IPMF�JO� UIF�EFQSFTTJPO�IBE� FODPVOUFSFE� DBWFSOPVT�QPSPTJUZ� JO�3VTUMFS� VOJUT��"OPUIFS� TVDI�HSBWJUZ� BOPNBMZ� JO� B� TVSGBDF� EFQSFTTJPO� PVUTJEF� PG� 8*11� XBT� ESJMMFE� XJUIPVU�FODPVOUFSJOH� DBWFSOPVT� QPSPTJUZ� PS� XBUFS� JOnPX�� -BDL� PG� HFPMPHJD� PS� IZESPMPHJD�FWJEFODF� GPS� LBSTU� XJUIJO� UIF�8*11� TJUF� JT� OPU� DPOTJEFSFE� CZ� TPNF� UP� CF� TJHOJmDBOU�FWJEFODF�UIBU�LBSTU�EPFT�OPU�FYJTU�BU�8*11 �BOE�JU�JT�OPU�DMFBS�UIBU�UIFSF�JT�B�SFBTPOBCMZ�GBMTJmBCMF�IZQPUIFTJT�PG�LBSTU��
1SJPS� UP�8*11 �3VTUMFS�'PSNBUJPO�NVETUPOFT�XFSF�CFMJFWFE� UP�CF�EJTTPMVUJPO�SFTJEVFT��8F�OPX�JOUFSQSFU�UIFTF�NVETUPOFT�BT�MBSHFMZ�GBDJFT�DIBOHFT�CBTFE�PO�EFUBJMFE�TUVEZ�PG�DPSFT �JOUFSQSFUBUJPO�PG�HFPQIZTJDBM�MPHT �BOE�NBQQJOH�JO�MBSHF�EJBNFUFS�TIBGUT��5IF�IZESPHFPMPHJDBM�DPODFQUVBM�NPEFM�PG�UIF�$VMFCSB�%PMPNJUF�.FNCFS�PG�UIF�3VTUMFS�XBT�SFWJTFE�VTJOH�UIFTF�EBUB��5IF�$VMFCSB�JT�UIF�NBJO�IZESPMPHJD�QBUIXBZ�GPS�SFMFBTFT�JO�GBJMVSF�TDFOBSJPT�GPS�8*11��
'SPN� FBSMZ� XPSL� GPS� 8*11� UP� NPSF� SFDFOU� BSUJDMFT� BTTFTTJOH� EJTTPMVUJPO �GFBUVSFT�IBWF�CFFO�BTTJHOFE�HFOFUJD�UFSNT�PS�BTTFSUFE�UP�CF�EJTTPMVUJPO�GFBUVSFT�XJUIPVU�EJSFDU�FWJEFODF�PG�EJTTPMVUJPO��8F�QSPWJEF�FWJEFODF�UIBU�DPOUSBEJDUT�B�EJTTPMVUJPO�PSJHJO�GPS�UXP�TVDI�GFBUVSFT�
&BSMZ�XPSL�XBT�OPU�NFBTVSFE�BHBJOTU�B�XFMM�EFmOFE�QFSGPSNBODF�TUBOEBSE�BOE�XBT� DPNNPOMZ� WFSZ� DPOTFSWBUJWF�� 5IF� QFSGPSNBODF� TUBOEBSE� MBUFS� FTUBCMJTIFE� JT� UIF�QSPCBCJMJUZ�PG�SFMFBTF�BU�UIF�8*11�CPVOEBSJFT�XJUIJO��� ����ZS��5IJT�TUBOEBSE�SFTVMUFE�JO�EFWFMPQJOH�UIF�NFBOT�PG�FWBMVBUJOH�QSPDFTTFT��NBOZ�FBSMZ�DPODFSOT�BCPVU�EJTTPMVUJPO�CFDBNF� JOTJHOJmDBOU� VOEFS� UIJT� TUBOEBSE�� "� QFSGPSNBODF� TUBOEBSE� JT� DSJUJDBM� GPS�FWBMVBUJOH�BOZ�LJOE�PG�GBDJMJUZ�XIFSF�HFPMPHJDBM�QSPDFTTFT�NBZ�CF�TJHOJmDBOU�
125
INTRODUCTION AND BACKGROUNDSTUDIES
Objectives
Salt (halite) is highly soluble in water, and this prop-erty was and is of great interest for the disposal of radio-active waste in a mined location in salt. Stability of overgeological time periods is expected. Although late Perm-ian salt beds in northern Delaware Basin have survivedover 250Ma, there is also clear evidence that some to allsalt has been removed, especially in the western part ofthe basin. Our objectives are to review the issues raisedabout dissolution at and near the location of Waste Iso-lation Pilot Plant (WIPP), extensive efforts to addressthose issues, and the general outcomes.
Concerns about, and perceptions and evaluations of,dissolution of evaporites affected locating, characteriz-ing, and assessing the performance of the current siteof theWIPP. Powers and Holt (2008) partially addressedsome lessons learned about dissolution. We review inmore detail the longer term and more extensive mannerin which dissolution affected investigations of theWIPPsite geology and hydrology. Through the course of locat-ing the site in 1975 to the current operations ofWIPP, ourunderstanding of dissolution morphed into signi!cantlydifferent conclusions about the processes of dissolution,extent, timing, and effects. Standards for performancewith respect to isolating the waste altered the approachto evaluating all factors related to WIPP performance.Dissolution is one process where our understandingand incorporation into performance assessment dramat-ically differ from early work.
We cannot address all assertions, suggestions, or rebut-tals about processes, locations, stratigraphic intervals,timing, and consequence of dissolution. Nevertheless,we are interested in the directions and outcomes ofWIPP activities as they developed in response to emerg-ing issues or concerns. We also present speci!c counters(with evidence) to two long-standing assertions aboutdissolution as examples of how additional data shouldresolve issues or perhaps reduce speculation.
The two most thorough (and underappreciated) re-views to date of dissolution are by Lambert (1983) andLorenz (2006a, b). Lambert undertook an extensivereview of various dissolution proposals as they wereunderstood at the timeWIPP began to explore the under-ground through shafts and drifts. In response to a requestby the US Environmental Protection Agency (EPA), Lor-enz reviewedwork related to karst andRustler dissolutionundergeneral headingof “karst in theRustler Formation.”
Bachman (1987) presents a succinct, but extensive,review of karst and dissolution in the region that is builton his many years of research into the topic.
Rechard (2000) provides an excellent, detailed reviewof the history of the WIPP project with respect to
regulations, laws governing WIPP, and performanceassessment, combinedwith the geological and hydrolog-ical aspects that more directly affected performance.Weart and Chu (1997) review broadly scienti!c issuesrelated to compliance with EPA standards; natural geo-logical processes, including dissolution, were regardedas not affecting the performance during the 10,000-yrregulatory period.
Much of the study of dissolution occurred in the initial15 yr of WIPP. Reports are less available as a conse-quence. A guide to the geotechnical literature of WIPP(~950 items) from 1972 to 1990 includes abstracts andsome annotations (Powers and Martin, 1993). We pro-vide URLs for certain documents that are availablethrough various sources.
The Waste Isolation Pilot Plant (WIPP) andDissolution Overview
WIPP is a geologic repository, located near Carlsbadin southeasternNewMexico (Fig. 1), formixed transura-nic waste from United States defense programs. Thename re"ects early history when it was proposed as a“pilot” plant to demonstrate safety for disposing radioac-tive waste in salt beds.
At the request of the Atomic Energy Agency (AEC),the National Academy of Sciences (NAS) reviewed op-tions for the disposal of radioactive waste, recommend-ing disposal in salt (NAS/NRC, 1957). A review of saltdeposits in the United States (Pierce and Rich, 1962) ledto selecting an existing salt mine near Lyons, Kansas, forexperiments and, presumably, disposal of radioactivewaste (e.g., Weart, 1979; Walker, 2006–2007). A signif-icant technical problemwas that some drill holes throughthe evaporites and into deeper aquifers created sinkholes.These drill holes were mainly saltwater disposal wellswhere injection of brines with H2S corroded casings,allowing the undersaturated (with respect to halite) in-jected brine to dissolve salt to such an extent that theoverlying rocks subsided or collapsed (e.g., Walters,1975). Improperly plugged and abandoned oil wells sim-ilarly led to subsidence as freshwater traveled downthrough salt beds into underlying oil production zones(Croxton, 2003). Technical problems and growing pub-lic objections led to abandoning the Kansas site in 1972(e.g., Walker, 2006–2007). Concern over effects fromboreholes through the evaporites carried over and wasincorporated into the task of locating the site now knownas WIPP.
After further review at the national scale, the focusturned to southeastern New Mexico and the salt bedsof the Delaware Basin (a part of the Permian Basin)(Fig. 1). Several early studies by the US GeologicalSurvey (USGS) included information about dissolutionof the salt beds in southeastern New Mexico (Bachman,1973, 1976, 1980, 1981; Jones and others, 1973).
126 Dennis W. Powers and Robert M. Holt

In 1974, Oak Ridge National Laboratories (ORNL)drilled two boreholes (AEC-7 and AEC-8) at an initialsite in southeastern New Mexico (Fig. 2, “old site”).The project was transferred to Sandia National Labora-tories (SNL) in Albuquerque, New Mexico, in 1975,under the administration of the Albuquerque of!ce ofthe Energy Research and Development Administration(ERDA; later redesignated Department of Energy[DOE]). A third drill hole (ERDA-6), drilled in mid-1975 at that location, encountered highly deformedevaporites (Anderson and Powers, 1978; Jones, 1981;SNL and USGS, 1983) and pressurized brine withH2S. The site did not meet one of the criteria—that theevaporites readily support mining along essentially hor-izontal beds—and was abandoned (Weart, 1979, 1983,1999). The search for another location as a possiblesite in southeastern New Mexico culminated in early1976 with the decision to investigate the current siteof the WIPP (Figs. 1, 2).
Enough evidence of the geology and hydrology atWIPP had accumulated from surface investigations(e.g., Powers and others, 1978) that an exploratory shaftand a ventilation shaft were begun in 1981 and com-pleted in 1982 (Black and others, 1983). A repository
level was selected, and the shafts were connected. Asthe underground area was developed, site characteriza-tion continued with geologic and hydrologic investiga-tions. The Land Withdrawal Act of 1992 transferredthe WIPP area to the US Department of Energy. TheAct was further revised in 1996, andWIPP was requiredto assess the performance of the site and its ability tomeet the criteria for isolation of the waste (US EPA,1996). US Environmental Protection Agency was desig-nated as the regulating agency for radioactive wasteunder theAct.As the focus turned to performance assess-ment, hydrologic studies were emphasized because themain failure scenario was identi!ed: borehole connec-tion of a pressurized brine reservoir, the disposal layer,and the overlying Culebra Dolomite. Many of the fea-tures, events, and processes that were prominent issuesin the early history ofWIPPwere found to be of little sig-ni!cance. The hydrology of the Culebra, number andanticipated state of boreholes through the repository inthe future, and the probability of pressurized brine reser-voirs atWIPP connected to the repository and/or Culebrabecame the impetus for most further investigations andanalysis (US DOE, 1996).
Some legal issues were resolved in 1999, allowing forthe !rst shipments of transuranic waste to be sent toWIPP and moved underground for disposal. Currently(August 2020), WIPP is disposing of defense-relatedmixed transuranic and waste. Construction has begunon a new shaft to provide additional ventilation. Therenewal permit for continuing disposal of hazardouswaste (https://wipp.energy.gov/2020-renewal-application.asp) is being reviewed by the NewMexico Environ-ment Department. Re-certi!cation applications weresubmitted in 5-yr increments beginning in 2004(US DOE, 2004, 2009, 2014), and EPA is reviewingthe most recent (2019) compliance recerti!cation appli-cation (US DOE, 2019) to continue disposal of radioac-tive waste (https://wipp.energy.gov/library/CRA/CRA%202019/index.html).
WIPP Location and General Geology
WIPP is located near the northern edge of the Dela-ware Basin, a major structural element of the PermianBasin in west Texas and southeastern New Mexico(Fig. 1). The maximum thickness of Phanerozoic sedi-ments is ~7,300 m (24,000 feet) (Hills, 1984); upperPermian evaporite rocks at the center of the WIPP siteare about 1,100 m (~3,600 ft) thick in the intervalfrom ~150 – 1,250 m (~500–4,100 feet) below groundlevel. The WIPP disposal layer is at a depth of ~650m (2150 feet) below ground level in the Permian SaladoFormation (Fig. 3).
There are three upper Permian evaporite-bearing for-mations (Fig. 3) at WIPP; all have been subjected to dis-solution in parts of the Delaware Basin. The Castile
Figure 1. Structural setting in the Permian Basin regionaround WIPP at end of Permian (modi!ed from Hills,1984). WIPP is located in the northern Delaware Basin.C = Carlsbad, H = Hobbs, O = Odessa, M = Midland,FtS = Ft. Stockton, M = Marathon, and P = Pecos.The Pecos River is represented by the blue dashed line.
Evaporite Dissolution and the Waste Isolation Pilot Plant (WIPP) 127

Formation at the base of this sequence consists of beds ofmainly halite and beds of mainly laminated anhydriteand carbonate. Informal nomenclature adapted fromAn-derson and others (1972) at theWIPP site has three mainbeds of laminated anhydrite/carbonate (A) and two bedsof mainly halite (H) (Fig. 3). These interbeds are morecomplicated east and southeast of WIPP; to the west,halite beds thin or disappear (e.g., Bachman, 1984),with the processes (dissolution or nondeposition) forthinning in some dispute (e.g., Anderson, 1978; Ander-son and others, 1978; Lambert, 1983; Bachman, 1984;Madsen and Raup, 1988). The Castile at the WIPP sitecenter is ~400m (~1,300 feet) thick. The Salado Forma-tion near the center ofWIPP is ~600 m (1970 feet) thick.The Salado is dominated by halite (~85%, Jones, 1972)with thinner sulfate interbeds (anhydrite, polyhalite).Some sulfate beds are really extensive and have beenenumerated as marker beds (e.g., MB 103; Jones andothers, 1960). The middle part of the Salado (McNuttpotash zone) is noted for its potash minerals, mainly
sylvite (KCl) with lesser langbeinite (K2Mg2(SO4)3).The disposal layer at WIPP is ~90 m (~300 ft) belowthe potash zone. The Rustler Formation is the upperevaporite-bearing unit. It is ~100 m (~330 ft) thick atWIPP and thickens eastward to more than 150 m(~500 feet) in the Delaware Basin at the depocenter.Five members have been named (Fig. 3). Each of thethree members that is not dolomite includes halite east-ward (e.g., Jones and others, 1973; Holt and Powers,1988; Powers and Holt, 2000). Permian to Triassic clas-tics (Dewey Lake Formation [aka Quartermaster Forma-tion] and Dockum Group [aka Chinle Group]) and thin,late Tertiary to Quaternary clastics (Gatuna Formation),pedogenic calcrete, a paleosol, and sur!cial dune sandoverlie the Rustler.
The northern Delaware Basin has been tilted ~1° tothe east, most recently mid-to-late Tertiary. From Trias-sic to late Tertiary, the area was mainly above sea leveland subject to nondeposition, erosion, and undetermineddissolution (e.g., Bachman, 1973, 1976, 1980). Some of
Figure 2. WIPP site relative to features noted with respect to dissolution. “old site” refers to the location initiallyexamined by USGS and ORNL; it was rejected after encountering deformed evaporites and pressurized brine withH2S. SSS = San Simon sink, BL = Bell Lake, SS = Slick “sink,” E10 = drillhole ERDA-10, Gnome = the site of ProjectGnome,W33 = WIPP-33,W14 = WIPP-14, BP = general location of known collapse chimneys, LP = Laguna Plata.
128 Dennis W. Powers and Robert M. Holt

the evaporite interval was deformed (e.g., Anderson,1978; Anderson and Powers, 1978; Jones, 1981; Bar-rows and others, 1983; Borns and others, 1983; Powersand others, 1996), partly in response to tilting.
Overall, the geology of theWIPP site is relatively pre-dictable and natural processes, by themselves, pose littleto no concern for isolating waste over the regulatoryperiod of 10,000 yr (e.g., Chu and Weart, 2000).
Knowledge that evaporites in southeastern NewMexico have been partially dissolved, with surfaceand subsurface manifestations, is not new. W.T. Lee(1925) visited northern Nash Draw and proposed a pro-cess of “erosion by solution and !ll” for the developmentof the draw. Robinson and Lang (1938) explored thegeology and hydrology of southern Nash Draw in sup-port of the burgeoning potash industry and de!ned theextent of the brine body at and above the top of Saladohalite. J.E. Adams (1944) developed the stratigraphicframework of the Ochoan evaporites and interpretedintervals of dissolution. These and other early investiga-tors deserve credit for understanding and interpreting
much of the geologic history prior to more recentinvestigations.
We begin with a focus on background and details ofevaporite dissolution related to site selection for theWIPP. Some of the interrelationships between differentaspects of dissolution have been simpli!ed or separated.Thus, deep dissolution could apply to collapse structures(“breccia pipes”) as well as the concept of deep lateral(intrastratal) dissolution and localized dissolution frombelow. Shallow dissolution can apply to karst as wellas the downward removal of halite from shallow forma-tions and the brine aquifer. They are separated herebecause they were separated and emphasized at somepoint in time.
Each topic follows an approximate format: broad his-tory of the topic as it developed with respect to WIPP,revisiting critical details of investigations or analysis,and the effects or conclusion of the topic. Becausesome topics developed concurrently, this is not describedand discussed chronologically.
EVAPORITE DISSOLUTION AND WIPP
Site Selection and Dissolution
Griswold (1977) summarized the initial criteria usedby the USGS and ORNL in 1972 to select an initial site(Fig. 2) in southeastern New Mexico for investigation.In brief, these criteria were
• A 3.24-km (2-mile) offset from any borehole throughthe evaporites and into underlying formations.
• High-purity salt< 914 m (<3000 feet) deep.• Minimum depth to salt of 305 m (1000 feet).• Avoid obvious mineral resources.At that time (1972–1974), dissolution was of little
concern; Jones and others (1973) had estimated it wouldbe tens of millions of years before dissolution wouldaffect proposed disposal levels.
After abandoning the initial site in 1975 because drillhole ERDA-6 encountered deformed strata and pressur-ized brine with H2S, criteria for selecting a new locationin southeastern New Mexico were modi!ed as well asexpanded. The location was expected to provide anarea of nearly 8 km2 (~3 miles2) that would include sur-face facilities and the area considered for radioactivewaste disposal. The main criteria (Griswold, 1977,p. 12) relevant to dissolution were
• Establishing a distance of 1 mi[le] [1.6 km] ormore from suberosion [dissolution; aka subrosionin some documents] of the top of the SaladoFormation.
• Avoid deep (through the evaporite beds) boreholeswithin 1 mile [1.6 km] of the area considered fordisposal.
Avoiding through-going boreholes was very restric-tive; Griswold (1977) summarized the factors that led
Figure 3. General stratigraphic column of evaporitesand overlying units at WIPP. Not to vertical scale.
Evaporite Dissolution and the Waste Isolation Pilot Plant (WIPP) 129

to reducing the borehole offset from 3.2 km (2 miles) to1.6 km (1 mile). The shape of the site was initially anirregular octagon with boundaries on the southeast andnortheast sides determined by existing through-goingboreholes (Fig. 4). Subrosion at the top of the Salado(as interpreted at the time) slightly impinged on theboundary to the west (Fig. 4). The total area under studyat the site location was ~79 km2 (~30 miles2).
The concern about dissolution (subrosion) at the topof the Salado in 1976 was that “regional and/or local dis-solution must not breach the repository while the wastesrepresent a signi!cant hazard to man” (Weart, 1979,p. 3). At that time, no performance criteria had been es-tablished, and an isolation period of 250,000 yr (~10half-lives of Pu-239) was “adopted as a conservativevalue in evaluating WIPP sites” (Weart, 1979, p. 3).The period covered by performance assessment was es-tablished in 1985 inAppendixC to Part 191 of 40CFR as10,000 yr.
Why was the initial focus on dissolution at the top ofthe Salado? The “brine aquifer” discovered in NashDraw (Robinson and Lang, 1938) was an importantfactor.
The Brine Aquifer and Dissolution of Upper Salado
Robinson andLang (1938, p. 86) noted that some pot-ash test wells in the northern end of Nash Draw (Fig. 1)encountered “a strong sodium chloride brine just abovethe salt of the Salado halite.” In their investigation ofgeology and groundwater in the southern end of NashDraw near Laguna Grande de la Sal, Robinson andLang (op. cit., plate 3) outlined an expanded area of theseencounters. The brine aquifer extended slightly north ofthe north end of Nash Draw, southwest across the PecosRiver, but it did not extend to the east and west sides ofNash Draw (Fig. 5). Robinson and Lang interpreted thebrine to be because of dissolution of upper Salado haliteand inferred that at least part of the formation of NashDraw was because of this dissolution.
To support Project Gnome, a 3-kiloton nuclear devicedetonated (1961) in the Salado southeast of Nash Draw(Figs. 2, 5), Vine (1963) mapped the geology of NashDraw. With the stratigraphy of the Rustler well estab-lished in a drill hole at the Gnome site, Vine mappedand discussed the relationships of the formations inNash Draw while recognizing that both Rustler andupper Salado salt were signi!cantly disturbed by disso-lution. Vine did not discuss the brine aquifer or hydrol-ogy of Nash Draw. Vine mapped few sinkholes, but theycan be related to sinkholes that are still evident. Vine didnot identify any features at the current WIPP site as evi-dence of solution and/or collapse.
The USGS conducted several studies of salt beds inNew Mexico prior to ORNL site investigations in
Figure�4.�Slight�impingement�of�the�edge�of�subrosion�(dissolution�at�top�of�Salado)�on�the�western�side�of�the�outer� zone� originally� established� as� this� current� site�was� located� in� 1975–1976.� The� subrosion� front�was�noted�(Griswold,�1977,�!gure�2) as “From�U.S.G.S.,�as�known� in� 1974.”� The� crude� octagonal� zones� of� that�time�developed� from�exclusion�distances� from�bore-holes�as�well�as�other�criteria.�The�red�land�withdrawal�boundary� was� later� established� by� legislation,� and�the� previous� zonation� became�moot.� (Adapted� from�Griswold,�1977,�!gure�2).
Figure 5. Approximate known extent of the brine aqui-fer (shaded light red) above Salado salt (Robinson andLang, 1938). The extent shown on thismap is somewhatgeneralized from Mercer (1983).
130 Dennis W. Powers and Robert M. Holt

1974. Jones and others (1973) prepared a summary report on the “Los Medanos” area that focused on the ini-tial ORNL site, but the study also covered the current WIPP location.
Jones and others observed that variable Salado thick-ness was because of deposition as well as dissolution, noting that in the western part of the area “percolating ground water has dissolved and removed some of it” (op. cit., p. 11). Jones and others (op. cit., figure 12) placed the edge of subrosion of the top of Salado halite west of the current site and well removed from the initial ORNL site. The hydrologic analysis noted that no wells were completed in the [Rustler] basal dissolution breccia zone, and the brine aquifer was not included in the analysis.
Jones and others (op. cit., p. 21) discounted the import of subrosion with respect to the initial site, explaining that “the whole situation appears to be highly stabilized and of long duration, with very little or practically no subrosion since the Pleistocene or, perhaps, even ear-lier.” Using a rate of salt removal of 15 cm (0.5 foot) per 1,000 yr (Bachman and Johnson, 1973), Jones and others (1973) inferred that at least 1 million yr would be required to reduce the upper Salado to residue. Because the preferred disposal intervals were in the lower Salado, Jones and others (op. cit., !gure 12) esti-mated that 25-30 Ma would be required to dissolve the Salado at the ORNL site down to the preferred disposal intervals. Most of the current WIPP site also fell into the same estimated time period to dissolve down to preferred disposal intervals.
Early in the exploration of the current WIPP site, sev-eral monitor wells were completed to observe in"ow from the Rustler-Salado contact, i.e., “brine aquifer” (Mercer and Orr, 1977; Mercer, 1983). In"ow was very limited, and the permeability of the zone was clearly very low. The top of the “brine aquifer” near the Pecos River was generally above an elevation of ~808 m amsl (~2650 feet) (Robinson and Lang, 1938). The ele-vation of the disposal layer at WIPP has an elevation of ~381 m amsl (~1250 feet). Without hundreds of meters relative drop in the brine discharge point, there is no threat to the disposal layer from top-down dissolution of the Salado.
Bachman (1980) concluded also that estimates of the age of Nash Draw were too young and that it was “impractical” to estimate rates of upper Salado dissolu-tion. Lambert (1983, p. 79) provides further discussion of arguments made about timing of dissolution and the inferred rates, pointing out the impossibility of determin-ing the dissolution front at differing times to obtain a reasonable way to estimate a rate, either vertical or horizontal.
The last monitor well (H-10) completed across the Rustler-Salado contact was drilled in 1979. Two other
boreholes were later tested across the interval (DOE-2:1984; H-16: 1987), but the intervals were not completedfor monitoring. The contact (i.e., brine aquifer) was notconsidered signi!cant at the WIPP site as a hydrologicunit by 1983 (e.g., Weart, 1983).
Collapse Chimneys (“Breccia Pipes”)
In late 1975, as the search for a new location forWIPPbegan, a report reachedWIPP that Mississippi ChemicalCorporation (now Intrepid Potash) had mined into acollapse feature under a surface domal structure (Hill C;Fig. 6) in northwestern Nash Draw. The history of the in-vestigations into this and related features for WIPP aredetailed by Powers (1996).
There are two sur!cial domes (Hills C andD) in north-eastern Nash Draw and two more (Hills A and B) nearbyinClaytonBasin.HillsA andCwere drilled and cored byWIPP to con!rm collapse and obtain details. Hill Bshows some brecciation at the surface. Hill D has noknown collapse and has been partially mined under. Athird known collapse breccia (Wills-Weaver) was drilled
Figure 6. Locations of surface domes and collapse chim-neys relative to WIPP. Hills A, B, C, and D are labeled byletter only. WW indicates the approximate location ofthe Wills-Weaver pipe. Modi!ed from Powers (1996).
Evaporite Dissolution and the Waste Isolation Pilot Plant (WIPP) 131

for potash resource evaluation (Snyder and Gard, 1982);it ismore distant fromWIPP. The collapse chimneys (akabreccia pipes) have a generally cylindrical or columnarvertical form. At depth, adjacent beds are tilted down-ward toward the collapse (Snyder and Gard, 1982).They are plugged with breccias of sulfate and halite atthe mine level. At the surface, Hills A and C show a cen-ter subsidence/collapse (Vine, 1960; Snyder and Gard,1982) with outward dips around the rim. Vine (1960)thought they might have formed because of dissolutionof Rustler anhydrite. The theory of dissolution frombelow by brine density "ow-through fractures andupward collapse was initially proposed by Anderson(1978). Bachman (1980) and Snyder and Gard (1982)modi!ed the explanation, involving collapse in theunderlying Capitan reef because of pressure reductionwhen the Pecos River incised the top of Capitan nearCarlsbad. All recognized that the sur!cial domal struc-ture was created by solution of upper Salado salt morebroadly,with the collapse breccia resistant to dissolution.
As a feature, collapse chimneys were initially treatedlike a possible “fatal"aw” should one be foundwhere therepositorywas to be located (see Powers andHolt, 2008).The investigations that followed over the next ~4 yrwereextensive.
Several geophysical techniques were applied to aknown collapse chimney to determine which had thebest likelihood of identifying such a feature. Resistivitysurveyswere foundmost suitable andwere subsequentlyapplied to the entire site area and beyond (see review inPowers, 1996). Several anomalies were detected andclassi!ed. The most signi!cant anomaly was in thenorthwest part of theWIPP site, andWIPP 13was drilledin 1978 to ~53 m (175 feet) into the Salado (SNL andUSGS, 1979) at the site of the anomaly. The drill holeencountered no evidence of brecciation or collapse.Other anomalies at the WIPP site that were drilledwere not collapse features (Powers, 1996).
Early in 1980, the collapse at Hill C was drilled andcored (WIPP-16; Snyder and Gard, 1982) to the approx-imate depth of the mine encounter to obtain verticalinformation and to determine if "uids or gasses mightbe present. Horizontal drilling and coring were then car-ried out into and through the breccia from the mine levelintercept. Hill Awas drilled and cored later in 1980 to adepth equivalent to the upper Capitan reef (WIPP 31;Snyder and Gard, 1982). One of three drill stem testsin this collapse breccia yielded enough "uid for an inter-pretation that permeability was 0.90mD (Mercer, 1982).These studies provided the direct evidence of origins andproperties regarding these collapse chimneys.
By 1982–1983, there was little sense that collapsechimneys existed at, or were a threat to, WIPP. Drillstem tests and the general hydrologic system indicatethat a feature such Hills A or C would not have been a
signi!cant threat to isolation, but treating them moreor less as a fatal "aw in the beginning might havemade such a defense dif!cult.
Later, however, Hill (2003, 2006) asserted that“Closer to WIPP are breccia pipes that extend to the sur-face, an example of which is Bell Lake Sink : : : ”. This iscovered more speci!cally in Localized Dissolution(below); Bell Lake “sink” is neither a breccia pipe, noris it closer to WIPP than Hill C, a real collapse chimney.
Deep Dissolution—Lateral or Stratabound
“Deep dissolution” entered the lexicon forWIPPwitha consultant report by Anderson (1978). Anderson wascontracted by SNL in 1977 to evaluate dissolution ratherbroadly. Anderson prepared extensive maps of strati-graphic intervals from the lower Castile upward to tryto identify speci!c locations or layers where dissolutionmight have occurred or could be occurring.
Anderson and Kirkland (1966) and Anderson andothers (1972) had proposed that mm-cm carbonate-sulfate laminae of the Castile were annual (varve) depos-its that could be correlated across long distances withinthe Delaware Basin. This was the initial basis for assum-ing or inferring that Castile salt beds were also depositedrelatively uniformly across the basin. ThickCastile halitebeds in the eastern part of the basin were correlated to“blanket breccia” in the western part of the basin (Ander-son and others, 1972, 1978). These breccias consist ofclasts mainly of carbonate-anhydrite laminae, com-monly cemented by sulfate. The volume of halite re-maining in the basin is about 50% of the volumeestimated to have been deposited, assuming halite wasdeposited across the entire basin. Some halite bedsdeeper in the sequence yielded larger percentagesremoved than for some higher halite intervals andsome higher (stratigraphically) halite beds apparentlyextend laterally across the margin of the lower halite,leading to the inference that dissolution could penetratelaterally into the evaporite sequence. Near the borderwith Texas south of WIPP, the “Big Sinks” area wasconsidered an example of such lateral dissolution andcollapse (Figs. 1, 2).
Anderson (1978) envisioned lateral deep dissolutionoccurring within the evaporite sequence (possibly alongthe Castile-Salado contact) and reaching the WIPP sitebefore surface-down dissolution could breach the dis-posal layer. Anderson (op cit., p. i) postulated that thislateral dissolution “will reach the site locality withinthe next few million years.”
ERDA-10 was drilled in 1977 at the location of Proj-ect Gnome as an early investigation of an area where theeffects of lateral dissolution along the Castile-Saladocontact (and elsewhere in the stratigraphic section)mightbe observable (SNL and D’Appolonia Consulting Engi-neers, 1983). The lower Salado as well as Castile was
Evaporite Dissolution and the Waste Isolation Pilot Plant (WIPP)132

cored; none of the cores were reported to show breccia-tion or residues after dissolution. A series of drill stemtests in Salado and Castile, including the reported con-tact, did not show enough "uid in"ow to determinehydraulic conductivities. This was the main test of thehypothesis, although cores and logs from boreholeDOE-2 (Mercer and others, 1987), which is adjacentto the WIPP site boundary, were later reviewed to evalu-ate whether “deep dissolution” had any part in evaporitedeformation at that location.
Anderson and others (1972, p. 70) also noted that“Beds of laminated anhydrite as thin as one foot[30 cm] thick within halite beds more than 50 ft(15.2 m) thick are also present as unbrecciated layerswithin correlative breccia units, involve approximatelythe same number of laminae, and maintain their identityand remain undisturbed within overlying and underlyingbreccia beds despite the removal of salt.” Anderson andothers (1972, p. 81) interpreted these thin undisturbedlaminated beds within brecciated beds as evidence that“ : : : withdrawal of halite was a very gentle process.”This explanation is dif!cult to support. Signi!cant haliteintervals were allegedly dissolved, creating breccias oflaminated anhydrite above and below an undisturbed,unbrecciated thin laminated anhydrite. An undisturbedbed over breccia can be taken as evidence of a synsedi-mentary event (see review in Holt and Powers, 1988,chapter 8). It seems much more likely that the undis-turbed bed indicates, at least, a synsedimentary originto the lower breccia. Robinson (1989) and Robinsonand Powers (1987) interpreted Castile breccias withina localized area of the western Delaware Basin as afan deposit adjacent to an area that was likely subaeriallyexposed. Signi!cant changes in the elevations of the baseof Castile and top of lower Castile anhydrite (Robinson,1989, !gures 29 and 30) at that location are along thetrend of the Huapache Monocline (Hayes, 1964) thatmay have reactivated approximately the time of deposi-tion of the lower Castile halite. Relative uplift of thesouthwestern side of the monocline could have beenthe cause of subaerial exposure. More generally, the“deepwater” depositional environment of the entire Cas-tile has been challenged (Hovorka, 1989; Kendall andHarwood, 1989; Anderson, 1993; Leslie and others,1993, 1996; Anderson and Kirkland, 1995; Hovorkaand others, 2007), and the suggestion that subaerialexposure created breccias along basin margins (e.g.,Robinson and Powers, 1987) is consistent with theselater re-evaluations of Castile deposition.
Much later, Salado pore pressures in the far !eld(away from mining disturbance at WIPP) were deter-mined to be at or very close to lithostatic pressurewith little "uid movement (Beauheim and Roberts,2002; Roberts and others, 1999; Holt and Powers,2011). Drill stem tests in the Salado (Mercer, 1987)
showed pressures indicating that the "uid would riseabove ground level (given enough time). Monitor wellsin the Rustler in a dolomite sandwiched by halite andwith halite-!lled fractures show pressure buildups thatare slow (little in"ow) but that exceed the normal hydro-static levels and are still rising after ~15 yr. Creep defor-mation and plastic behavior of salt transmit lithostatic ornear-lithostatic pressures to the "uids, little as they are,within the salt. It is unlikely that lateral deep dissolutionwithin the evaporite section is a viable mechanism with-out the following: a stiff permeable unit, a driving forcegreater than the "uid (hydrostatic) pressure within theevaporites, and a means of circulation (e.g., Johnson,1981; Holt and Powers, 2010).
Deep Dissolution—Localized or Point Dissolution
Anderson (1978) also considered localized dissolu-tion at the base of the evaporite section (base of Cas-tile/top of Delaware Mountain Group). Breccia pipesand San Simon sink around the northern margin of theDelaware Basin and mineralized collapses (“castiles”)in the southern Delaware Basin provided examples,although castiles are not associated with the Capitanreef/aquifer. Anderson noted a variety of surface topo-graphic depressions a well as structural depressions inthe evaporite-bearing rocks within the Delaware Basin,using the term “sinks” and inferring that localized disso-lution upward from the underlying Delaware MountainGroup (DMG) could be responsible.
The history of noting these sur!cial depressions andspeculating about their origin(s) predates Anderson(1978). As part of their groundwater study of southernLea County (NM), Nicholson and Clebsch (1961) notedsurface features (e.g., playas, lagunas, depressions, sinks)and “structural” features (e.g., San Simon Swale andsink) that were variously attributed to subsidence or col-lapse. We focus on two examples: Bell Lake “sink”(T24S, R33E; Fig. 2) and Laguna Plata (T20S, R32E;Fig. 2), because data are available to contrast with asser-tions or speculation about origins as dissolution features.
Bell Lake “Sink”
Bell Lake is a somewhat circular depression ~2-3 kmin diameter (Figs. 7a, b); a smaller depression (“Slicksink”) ~6.3 km southeast ofBell Lake has been discussedin similar terms. Gypsum dunes on the east side of eachdepression “ : : : can be taken to indicate two things: thatthe lakes are collapse depressions, the area of collapseproviding the conduit for the upward movement ofground water; and that the head in the pre-Tertiary rocksat one time was much higher than now” (Nicholson andClebsch, 1961, p. 47). They stated further that “there isno known source of gypsum near the surface in southernLea County” other than in these dunes.
133Dennis W. Powers and Robert M. Holt

Figure 7. A. Aerial view of Bell Lake (fromGoogle Earth, image date 11/2/2017). Approximate center point longitude-103.565 deg, latitude 32.235 deg. Outer irregular line approximates the position of the closed contour for 1097.28m amsl (3600 ft amsl); the inner closed contours are ~1088 m amsl. The square provides a common reference areafor !gures 7B and 7C. The dashed line shows the connection between geophysical logs in !gure 8.White squares, orrectangular patches, are pads for drill holes. B. Topography of Bell Lake depression (underlying image from TOPO!).C. Elevation (m amsl) of the top of Rustler Formation at Bell Lake and surrounding area. Contour interval is 5 m. Thebroad low of!715m amsl includes a large areawithout surface depressions and higher surface elevations. This areais a general depocenter with lower elevations and thicker intervals for the Rustler (e.g., Holt and Powers, 1988).
134 Dennis W. Powers and Robert M. Holt

Anderson (1978) included Bell Lake and Slick “sink”as possible examples of breccia pipes or collapsesbecause of deep dissolution. Anderson (1978, p. 46)suggested “that sulfate-rich waters rose up to the sinkthrough fractures at least as deep as the Rustler Forma-tion and perhaps deeper.”On a !eld trip in 1980, Ander-son remarked on !nding barite and celestite nodulesaround the Bell Lake playa (Chaturvedi, 1980, p.32).Anderson (1980, p. 113) also cited maps of Bell Lake(Widdicombe, 1979) as evidence of faulted or down-dropped Mescalero “caliche” and “Old Mescalerosoil” and suggested “ : : : that the sink is truly a collapsestructure rather than a de"ation feature.”
Bell Lake was surveyed by gravity as a “ : : : late-Wisconsin, solution-subsidence, collapse feature” (Bar-rows and others, 1983, p. 51), without the dissolvedlayer or interval being identi!ed. Barrows and others(1983, p. 51) noted that “ : : : topography is suf!cientto make the shape of the gravity anomaly dependenton the density used to make the Bouguer slab correc-tion.” After noting some possible variations in near sur-face materials, Barrows and others (1983, p. 51)concluded that “ : : : the gravity pro!les still indicatecomplex subsurface density structure. These may becomplex geologic structures, varying !ll on an irregularcollapse surface, or lateral density variations within rel-atively "at-lying strata.” It was recommended that addi-tional gravity surveys and multiple boreholes would beneeded investigate further.
Hill (e.g., 1993, 1996, 2003, 2006) reported isotopicanalyses (!34S, !13C, !18O, and 87Sr/86Sr variously ofbarite, celestite, selenite, and calcite at Bell Lake. Hill(primarily 1996) considered that 1) the sulfur and car-bon/oxygen isotopes were most representative of deeperanhydrites and/or pressurized brine reservoirs and2) strontium isotopes were similar to sur!cial pedogeniccalcretes. The Bell Canyon Formation (underlying theevaporites) was considered the most likely source forbarium. Hill (2003, 2006) stated that the isotopic results“ : : : supported Anderson’s (1980a [1980 here]) modelof deep-seated dissolution originating in theBell CanyonFormation.”
Aswith breccia pipes or collapse chimneys, by ~1983therewas no evidence of localized deep dissolution at theWIPP site. There have been no WIPP-directed activitiesfor further investigations of localized dissolution andcollapse. Borehole DOE-2, as previously noted, wasdrilled and cored in 1984 to evaluate deformation inthe Castile and overlying units, and it was determinedthat the changes in thickness and structure of the Castilethere were not produced by dissolution (Mercer andothers, 1987).
There are enough boreholes (six) from Bell Lake tocontradict assertions that it is a breccia pipe. The topof Rustler (Fig. 7c) does show some depression over a
large area including Bell Lake, Slick “sink”, and nearbyareas with higher topography. The Rustler thickensacross the same area, but the log cross section (Fig. 8)reveals that dolomite and sulfate beds remain near con-stant in thickness while the intervals with halite arethicker. This is within a larger depocenter for the Rustler(Holt, 1988; Holt and Powers, 1988; Powers and Holt,1990) where Rustler halite beds thicken considerably.
Sulfate is available from sources not considered byNicholson and Clebsch (1961) or later studies: NashDraw gypsum/gypsite and dunes at ~40 km (~25 miles);Castile outcrops at ~60 km (~37 miles); salt "ats of westTexas at ~140 km (~87 miles). White and others (2015)traced dust fromWhite Sands gypsummore than 100 km(62 miles) downwind from White Sands, showing thatsurface sources are possible. Strontium is found in theMescalero Paleosol (aka Mescalero caliche) (Brookinsand Lambert, 1988). Smith and others (2013) report223 mg/kg barium from the “A” layer from a sample13.2 km (8.2 miles) east-southeast of Bell Lake. It isnot known that these minerals observed by Andersonand analyzed by Hill are extensive enough to warrantan extraordinary source such as a breccia pipe and "uidscirculating from great depth to the surface.
Nicholson and Clebsch (1961, plate 1) show modernDockum potentiometric surface at ~ 76 m (~250 feet)below the base of !ll/top of Dockum in Bell Lake.Long-published freshwater equivalent heads for the Del-aware Mountain Group are well below surface levels atBell Lake (Mercer, 1983), even without lower potentio-metric surface because of high salinity (e.g., 140,000–160,000 mg/L chloride) known from nearby wells(Hiss, 1976). Dockum water has signi!cant sulfate andminor barium (Ewing and others, 2008). Both mayhave had higher potentiometric surfaces during pluvials;neither is necessary as a source of barium and sulfate, andwell data provide clear evidence that a collapse structureis not present.
Laguna Plata
Four shallow playas near the western boundary of LeaCountywere described byNicholson andClebsch (1961,p. 10) as having an irregular shape, "at bottom coveredwith halite and gypsum crystals, and a sand dune on theeast side. Nicholson and Clebsch also suggest that theseplayas may have originated as subsidence/collapse fea-tures, similar to San Simon Swale. The top of theDockum on the north side of Laguna Plata was notedas 6 m above the lake bed while potash drill holes inthe lake bed encountered top of Dockum at ~6 and~13 m (~20-43 feet) below the lake bed. This wasthought to indicate collapse because of dissolution ofunderlying evaporites, similar to Bell Lake and Slicksink. Nicholson and Clebsch (1961, plate 1) neithermapped a fault along the northern part of Laguna Plata
Evaporite Dissolution and the Waste Isolation Pilot Plant (WIPP) 135

nor extended contour lines (top of “red beds,” akaDockum or Chinle) south of Laguna Plata, presumablyfor lack of data. Their contours of the top of red bedsin southern Lea County show signi!cant relief thatshould be interpreted in light of the long period of pre-dominantly subaerial exposure of these Triassic beds(e.g., Bachman, 1976).
Jones and others (1973, p. 64) suggested that thesedepressions “ : : : are probably surface de"ation struc-tures resulting from erosion phenomena commonlyfound in arid regions.” Their evaluation found little orno solution in the underlying Rustler. Bachman (1976)considered these playa depressions to be de"ationfeatures.
These depressions are mentioned in the geologicalcharacterization report for WIPP (Powers and others,1978), and the implied origin is de"ation. Lambert’s(1983) review indicated mainly that mine workingsunder some of these depressions did not show strati-graphic effects of collapse. Lappin (1988) discusses dis-solution at length without referring to either thesedepressions or the work of Reeves and Temple.
Reeves and Temple (1986) described top-of-Rustlerelevation differences underlying Mound Lake (Lynnand Terry Counties, TX) and inferred that the formationhad been thinned by ~9m (~30 feet). They discussed pro-cesses at length, concluding that in!ltration was likelythe cause of salt removal to depress these units. Reevesand Temple (1986) listed 21 playas in the Texas panhan-dle and eastern New Mexico where “salt removed”ranged from 0 to 137 m (0–450 feet). Of the four lagunasin western Lea County, only Laguna Plata was listed ashaving salt removed (76 m; 250 feet). Reeves and Tem-ple (1986) provided no evidence for these estimates ofsalt removed for any lake other than Mound Lake. Tem-ple (1986) included speci!cs only forMoundLake (TX),Yellowhouse Lake (TX), and Cedar Lake (NM).
Wood and Osterkamp (1987), Osterkamp and Wood(1987), and Wood (2002) concluded that such playasdeveloped when a small surface depression was createdby erosion, then enlarged through sur!cial solution ofcalcretes. The underlying High Plains Aquifer was re-charged, carrying some solutes and !nes. Dunes arecommon on the east/southeast side of playas. These
Figure 8. A short geophysical log cross section through Bell Lake shows continuity of Rustler and upper Salado beds(no collapse) and modest thickening of the noncarbonate intervals of the Rustler because of thicker halite. Thenumber above the log is a shortened API #; the full API is 30-025-XXXXX. The log for 08365 has natural gammaon the left and acoustic travel time on the right. Other logs are gamma only. Horizontal dashed blue line is700 m above sea level. Vertical scale for each log is the same. Horizontal distance betweenwells is not represented.See Figure 7a for cross section and identi!cation of end point logs. Rustler members are abbreviated in a geologicalkey: LM = Los Medanos, CU = Culebra Dolomite, TM = Tamarisk, MG = Magenta Dolomite, FN = Forty-niner.
136 Dennis W. Powers and Robert M. Holt

authors did not involve halite dissolution at depth in theprocess, nor did Holliday and others (1996).
Reeves and Temple (1986, p. 939) concluded that the“ : : : evidence, combined with previous studies docu-menting salt-bed dissolution in areas surrounding aproposed high-level nuclear-waste repository site inDeaf Smith County, Texas, leads to serious questionsabout the rationale of using salt beds for nuclear-wastedisposal.”
Hill (1996, p. 295–296) suggested that these playasmay represent surface expressions of breccia pipes andinvoked the submarine channels or canyons throughthe underlying Capitan reef (Hiss, 1975) as a possiblepart of the process.
We question how major dissolution below LagunaPlata was claimed by Reeves and Temple without sup-porting evidence or reference. A possible source forthe claim is a Salado isopach map (Brokaw and others,1972, !gure 9), where the Salado thins ~100 m (~330feet) over Halfway oil !eld and between lagunas. Bro-kaw and others (1972, p. 46) note that “Within the shelfarea, local reductions in thickness [of Salado] are sharpover pre-Salado knolls or ‘highs’ at the Getty, Barber,Halfway, and other small oil!eldswhich appear as domal
features : : : ”. The reduced Salado thickness does notunderlie Laguna Plata, and Brokaw and others (1972)did not invoke dissolution to explain these fourdepressions.
The lagunas are of no apparent signi!cance to WIPPalthough they were peripherally mentioned during earlyregional studies and caused mention by Lambert (1983).We provide evidence to rebut speculation about their ori-gins by Reeves and Temple (1986) and Hill (1999).
The area of Laguna Gatuna and Laguna Plata wasexamined in detail for stability with respect to halite dis-solution (Powers, 2007) in support of a proposed site forsurface storage facilities under the Global NuclearEnergy Partnership (GNEP) program. Rustler and upperSalado elevations under most of Laguna Plata are abovetrends with eastward regional dips along the east side ofLaguna Plata and under Laguna Gatuna (Fig. 9).
Basin Dissolution Troughs
Maley and Huf!ngton (1953) identi!ed two troughsin the Delaware Basin by mapping the thickness of“!ll.” Many others have cited the same features, andsalt dissolution is important in discussions of origins.The central trough (commonly referred to as the
Figure 9. Elevation (m amsl) of the top of Rustler at Laguna Plata and nearby surface depressions. Contour interval10 m. Outlines of the closed contours for each depression are shown. Most of Laguna Plata overlies an area at orabove 800m amsl, with contours deepening along the eastern area. There is no evidence consistent with removal of76m of halite under Laguna Plata. Note some single well departures from trends have not been resolved as originalrecords reside at United States of!ces currently closed because of COVID 19. They do not detract from the conclu-sion. The green asterisk marks the approximate location for the GNEP investigation (Powers, 2007).
Evaporite Dissolution and the Waste Isolation Pilot Plant (WIPP) 137

Balmorhea-Loving trough)was considered in evaluatingdeep dissolution (e.g., Anderson, 1978; Lambert, 1983).The trough referred to as the Belding-San Simon trough(Hiss, 1975) along the eastern Delaware Basin marginincludes the San Simon Swale and sink and extendssouthward along the front of the Capitan reef into Texasand south of the Pecos River. Holt and Powers (1988)examined the changes in Rustler stratigraphy and struc-ture in the northernDelawareBasin and onto the adjacentCentral Basin Platform. They interpreted possible faultsalong this margin that may still have been active whenthe Dewey Lake was being deposited. Johnson (1993)separated out evidence of possible early dissolution ofSalado halites in the Wink, TX, area from later dissolu-tion and collapse in the trough along the reef margin.
Muchmore detail can be examined nowwith the largenumber of newer drill holes. Ewing and others (2012,!gures 4.2.1, 4.2.2, 4.2.3, and 4.2.4) showed structureon the top and base of Rustler that provides more detailthrough these two areas, although the data were morelimited in Texas by project restrictions. The elevation
of the top of Rustler clearly reveals the presence of thesetroughs as well as other features (Fig. 10). These andother data are being developed for further detailed inves-tigations of the stratigraphy, sedimentology, and postde-positional processes that have affected the evaporiteformations in southeastern NewMexico and west Texas.
Rustler Formation Dissolution
During the early history of WIPP, mudstone equiva-lents to halite intervals of the Rustler were interpretedas dissolution residues of original halite beds (e.g., Jonesand others, 1960; Vine, 1963; Griswold, 1977; Powersand others, 1978; Lambert, 1983; Bachman, 1984;Snyder, 1985). The underlying assumption (generallyunstated) was that these beds were originally depositedcontinuously across the basin from east to west (or atleast farther west than the WIPP site). In many earlyreports of the geology based on WIPP boreholes, theseintervals were summarized as “dissolution residue” inthe table of stratigraphic units (see discussion by Lorenz,2006, p. 28). Little signi!cance was attributed to the
Figure 10. Regional view of the elevation (m amsl) of the top of Rustler. The small black square indicates the positionof WIPP. This map was generated with 6212 data points. Contour interval is 50 m. The Belding–San Simon depres-sion along the eastern side of the Delaware Basin is also shown in some detail in Ewing and others (2012), althoughwith fewer data points. The Balmorhea–Loving trough of Maley and Huf!ngton (1953) is less well indicated in NewMexico, but the depression near Toyah (T on map) is clear. The contrast with earlier maps is in the detail now prac-tical with the vastly greater numbers ofwells that have been drilled sinceWIPPwork started (1975). Similar localizeddata sets will be examined for detailed study of Castile and Salado deposition, deformation, and dissolution.
138 Dennis W. Powers and Robert M. Holt

history of these mudstones relative to the suitability ofWIPP or WIPP performance until the early 2000s.Mercer (1983, p. 56) noted that Culebra Dolomitehydraulic properties “ : : : vary considerably from placeto place and appear to be related to the size and number offractures and openings” and related these fractures andopenings to Rustler and Salado dissolution. The hydro-logic model for "uid "ow for the Culebra DolomiteMember based on a geostatistical-based model ofhydraulic properties determined at individual wells(e.g., LaVenue, 1992; LaVenue and others, 1988) waslater revised to a model based on the relationship ofhydraulic properties to geological information (Holtand others, 2005; Powers and others, 2003; Beauheimand others, 2007) that did not assume or infer major Rus-tler dissolution. The origin of the mudstones became apart of the discussion around this new hydrogeologicalconceptual model (e.g., Burgess and others, 2008).
In 1984, wemapped theWIPPwaste handling shaft asit was being enlarged to its current diameter (~7 m) andcon!gured for waste handling (Holt and Powers, 1984).During that mapping, mudstone intervals of the Rustlerthat had previously been designated “dissolution resi-dues” were found to display sedimentary features highlyunlikely to have survived any signi!cant postdepositionalremoval of halite. That same year wemapped the exhaustshaft (Holt and Powers, 1986) with similar results.
These reports were met with considerable skepticism.Aworkshop was convened in 1985 by the New MexicoEnvironmental Evaluation Group (EEG) to discuss thegeology and hydrology of the Rustler related to WIPP,in part because of the conclusions in Holt and Powers(1984) that the primary sedimentary structures wereobserved while mapping the waste shaft. The introduc-tion to the report issued for this workshop (Chaturvedi,1987, p. 5) included the following statement: “Alsoneeded is an understanding of the recharge and dischargeareas for the Rustler, the mechanics and time of removalof salt from the Rustler (or a convincing hypothesis ofsyn-depositional processes of selective deposition ofsalt) : : : .”
Our comprehensive study of Rustler cores, outcrops,and geophysical logs for the Rustler provided additionalevidence of facies changes (Holt and Powers, 1988;Powers and Holt, 2000). This work had little effect onWIPP for some time. Precursors to performance assess-ment evaluated the difference: “The two differing inter-pretations [about the extent of deposition and dissolutionof Rustler halite] have little impact on WIPP perfor-mance, because, as summarized by Lappin (1988),extrapolation of themaximumdissolution rates indicatesno threat to the WIPP repository within 10,000 years”(Lappin and others, 1989).
In subsequent years, additional details were acquiredthrough drilling, hydrologic testing, log analysis, and
additional shaft mapping (e.g., Holt and Powers, 1990;Beauheim and Holt, 1990; Powers and Holt, 1999,2000). By the mid-1990s, Holt had recognized the rela-tionship between Culebra hydraulic parameters and geo-logic factors (e.g., depth/elevation andwhether the upperSalado had been dissolved) that could be estimated reli-ably between boreholes (Holt, 1997; Holt and Yarbor-ough, 2002; Holt and others, 2005; Beauheim andothers, 2007; Powers and others, 2003). Those relation-ships led to a different approach to estimating transmis-sivity in the Culebra (a revised hydrogeology conceptualmodel). Hart and others (2008) added factors for !llingsof Culebra vugs and for the areas where Culebra trans-missivity was signi!cantly lower because the Culebrawas bracketed by units with halite and also displayedhalite pore !llings (Powers and others, 2006b). Perfor-mance assessment was modi!ed by this revised concep-tual model.
A peer review panel conducted an intensive review in2008 (Burgess and others, 2008) of the geology, hydrol-ogy, and geochemistry related to "uid "ow in the Cule-bra. “The panel believes that the conclusions in the[Culebra conceptual model] from the integration of geol-ogy and hydrology are valid : : : ” (Burgess and others,2008, p. 23), while noting areas that could be improved.The panel also suggested that there could be bene!t fromexamining in more detail the relationship between theRustler mudstone-halite facies distribution and bothevaporite deformation and the development (geomor-phology) of Nash Draw.
WIPP continues to utilize this conceptual model ofCulebra hydrology, which has both empirical relation-ships and, at least some, acceptance of deposition asthe main cause of halite distribution in the Rustler.The new shaft under construction at WIPP will provideanother opportunity to examine this explanation.
Public comments to CRAs (2004, 2009, 2014) indi-cate that the discussion about Rustler dissolution hasgenerally morphed from whether mudstone-halite inter-vals are dissolution residues towhether karst is present inthe Rustler at WIPP and how karst would affect the per-formance assessment (search through https://www.epa.gov/radiation/certi!cation-and-recerti!cation-wipp).
Karst at WIPP
Vine (1963) is the !rst work set in the area of WIPPknown to us to use the word “karst.” Sinkholes, depres-sions, collapse features had all been recognized longbefore this (e.g., Lee, 1925), but “karst” was not associ-ated speci!cally with WIPP until 1982 (Barrows, 1982;Barrows and others, 1983; Barrows and Fett, 1985). Agravity survey at WIPP and beyond in 1980 was unableto resolve anomalies expected because of evaporitedeformation, but “It did indicate the degree and character
Evaporite Dissolution and the Waste Isolation Pilot Plant (WIPP) 139
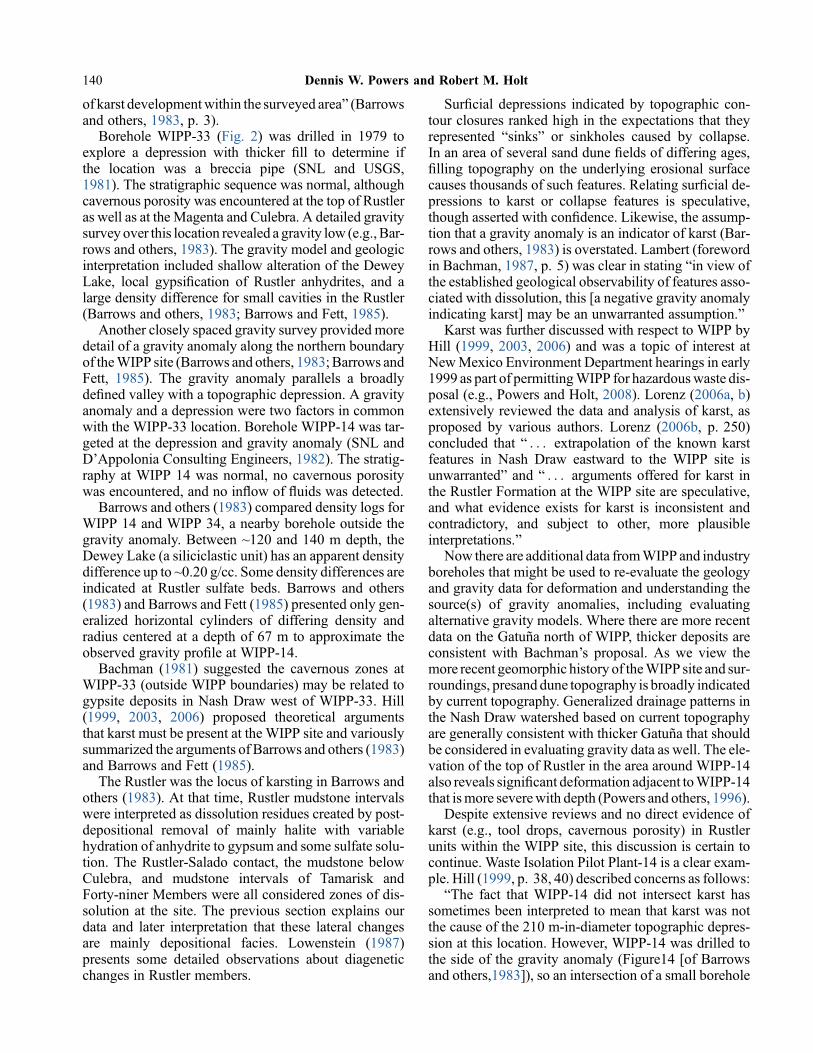
of karst developmentwithin the surveyed area” (Barrowsand others, 1983, p. 3).
Borehole WIPP-33 (Fig. 2) was drilled in 1979 toexplore a depression with thicker !ll to determine ifthe location was a breccia pipe (SNL and USGS,1981). The stratigraphic sequence was normal, althoughcavernous porosity was encountered at the top of Rustleras well as at the Magenta and Culebra. A detailed gravitysurvey over this location revealed a gravity low (e.g., Bar-rows and others, 1983). The gravity model and geologicinterpretation included shallow alteration of the DeweyLake, local gypsi!cation of Rustler anhydrites, and alarge density difference for small cavities in the Rustler(Barrows and others, 1983; Barrows and Fett, 1985).
Another closely spaced gravity survey provided moredetail of a gravity anomaly along the northern boundaryof theWIPP site (Barrows and others, 1983;Barrows andFett, 1985). The gravity anomaly parallels a broadlyde!ned valley with a topographic depression. A gravityanomaly and a depression were two factors in commonwith the WIPP-33 location. Borehole WIPP-14 was tar-geted at the depression and gravity anomaly (SNL andD’Appolonia Consulting Engineers, 1982). The stratig-raphy at WIPP 14 was normal, no cavernous porositywas encountered, and no in"ow of "uids was detected.
Barrows and others (1983) compared density logs forWIPP 14 and WIPP 34, a nearby borehole outside thegravity anomaly. Between ~120 and 140 m depth, theDewey Lake (a siliciclastic unit) has an apparent densitydifference up to ~0.20 g/cc. Some density differences areindicated at Rustler sulfate beds. Barrows and others(1983) and Barrows and Fett (1985) presented only gen-eralized horizontal cylinders of differing density andradius centered at a depth of 67 m to approximate theobserved gravity pro!le at WIPP-14.
Bachman (1981) suggested the cavernous zones atWIPP-33 (outside WIPP boundaries) may be related togypsite deposits in Nash Draw west of WIPP-33. Hill(1999, 2003, 2006) proposed theoretical argumentsthat karst must be present at the WIPP site and variouslysummarized the arguments of Barrows and others (1983)and Barrows and Fett (1985).
The Rustler was the locus of karsting in Barrows andothers (1983). At that time, Rustler mudstone intervalswere interpreted as dissolution residues created by post-depositional removal of mainly halite with variablehydration of anhydrite to gypsum and some sulfate solu-tion. The Rustler-Salado contact, the mudstone belowCulebra, and mudstone intervals of Tamarisk andForty-niner Members were all considered zones of dis-solution at the site. The previous section explains ourdata and later interpretation that these lateral changesare mainly depositional facies. Lowenstein (1987)presents some detailed observations about diageneticchanges in Rustler members.
Sur!cial depressions indicated by topographic con-tour closures ranked high in the expectations that theyrepresented “sinks” or sinkholes caused by collapse.In an area of several sand dune !elds of differing ages,!lling topography on the underlying erosional surfacecauses thousands of such features. Relating sur!cial de-pressions to karst or collapse features is speculative,though asserted with con!dence. Likewise, the assump-tion that a gravity anomaly is an indicator of karst (Bar-rows and others, 1983) is overstated. Lambert (forewordin Bachman, 1987, p. 5) was clear in stating “in view ofthe established geological observability of features asso-ciated with dissolution, this [a negative gravity anomalyindicating karst] may be an unwarranted assumption.”
Karst was further discussed with respect to WIPP byHill (1999, 2003, 2006) and was a topic of interest atNewMexico Environment Department hearings in early1999 as part of permittingWIPP for hazardouswaste dis-posal (e.g., Powers and Holt, 2008). Lorenz (2006a, b)extensively reviewed the data and analysis of karst, asproposed by various authors. Lorenz (2006b, p. 250)concluded that “ : : : extrapolation of the known karstfeatures in Nash Draw eastward to the WIPP site isunwarranted” and “ : : : arguments offered for karst inthe Rustler Formation at the WIPP site are speculative,and what evidence exists for karst is inconsistent andcontradictory, and subject to other, more plausibleinterpretations.”
Now there are additional data fromWIPP and industryboreholes that might be used to re-evaluate the geologyand gravity data for deformation and understanding thesource(s) of gravity anomalies, including evaluatingalternative gravity models. Where there are more recentdata on the Gatuna north of WIPP, thicker deposits areconsistent with Bachman’s proposal. As we view themore recent geomorphic history of theWIPP site and sur-roundings, presand dune topography is broadly indicatedby current topography. Generalized drainage patterns inthe Nash Draw watershed based on current topographyare generally consistent with thicker Gatuna that shouldbe considered in evaluating gravity data as well. The ele-vation of the top of Rustler in the area around WIPP-14also reveals signi!cant deformation adjacent toWIPP-14that ismore severewith depth (Powers and others, 1996).
Despite extensive reviews and no direct evidence ofkarst (e.g., tool drops, cavernous porosity) in Rustlerunits within the WIPP site, this discussion is certain tocontinue. Waste Isolation Pilot Plant-14 is a clear exam-ple. Hill (1999, p. 38, 40) described concerns as follows:
“The fact that WIPP-14 did not intersect karst hassometimes been interpreted to mean that karst was notthe cause of the 210 m-in-diameter topographic depres-sion at this location. However, WIPP-14 was drilled tothe side of the gravity anomaly (Figure14 [of Barrowsand others,1983]), so an intersection of a small borehole
140 Dennis W. Powers and Robert M. Holt
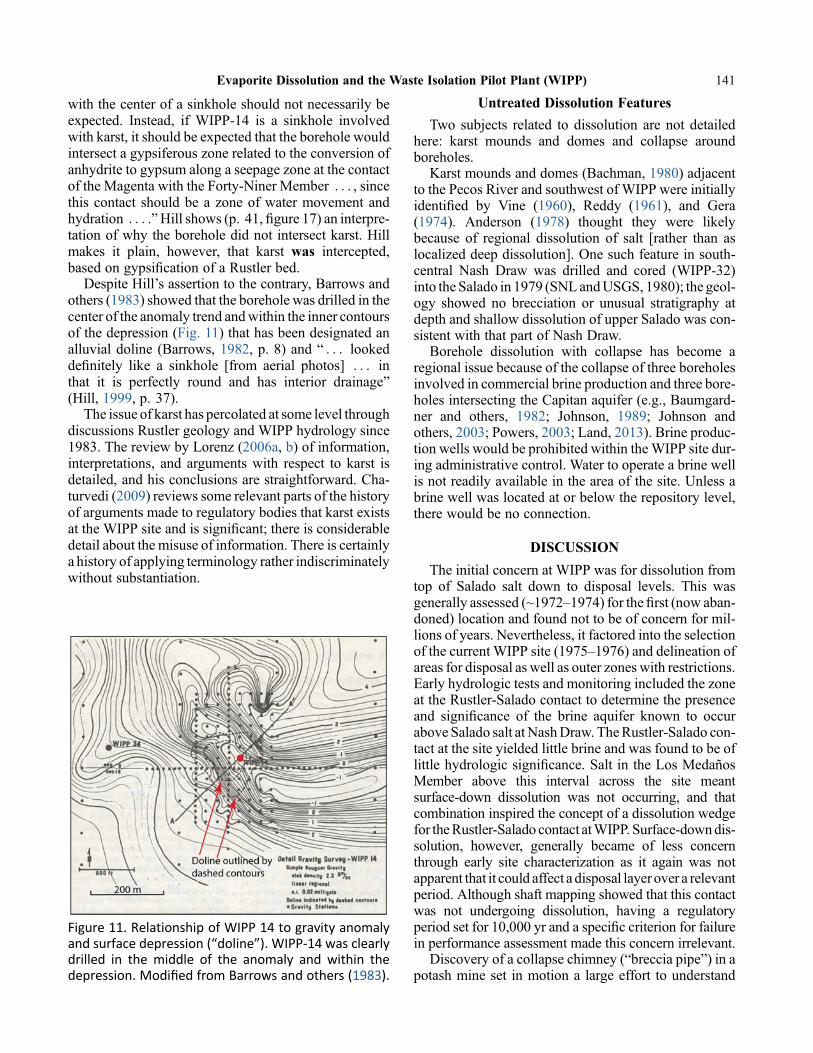
with the center of a sinkhole should not necessarily beexpected. Instead, if WIPP-14 is a sinkhole involvedwith karst, it should be expected that the borehole wouldintersect a gypsiferous zone related to the conversion ofanhydrite to gypsum along a seepage zone at the contactof the Magenta with the Forty-Niner Member : : : , sincethis contact should be a zone of water movement andhydration : : : .”Hill shows (p. 41, !gure 17) an interpre-tation of why the borehole did not intersect karst. Hillmakes it plain, however, that karst was intercepted,based on gypsi!cation of a Rustler bed.
Despite Hill’s assertion to the contrary, Barrows andothers (1983) showed that the borehole was drilled in thecenter of the anomaly trend andwithin the inner contoursof the depression (Fig. 11) that has been designated analluvial doline (Barrows, 1982, p. 8) and “ : : : lookedde!nitely like a sinkhole [from aerial photos] : : : inthat it is perfectly round and has interior drainage”(Hill, 1999, p. 37).
The issue of karst has percolated at some level throughdiscussions Rustler geology and WIPP hydrology since1983. The review by Lorenz (2006a, b) of information,interpretations, and arguments with respect to karst isdetailed, and his conclusions are straightforward. Cha-turvedi (2009) reviews some relevant parts of the historyof arguments made to regulatory bodies that karst existsat the WIPP site and is signi!cant; there is considerabledetail about the misuse of information. There is certainlya history of applying terminology rather indiscriminatelywithout substantiation.
Untreated Dissolution Features
Two subjects related to dissolution are not detailedhere: karst mounds and domes and collapse aroundboreholes.
Karst mounds and domes (Bachman, 1980) adjacentto the Pecos River and southwest of WIPP were initiallyidenti!ed by Vine (1960), Reddy (1961), and Gera(1974). Anderson (1978) thought they were likelybecause of regional dissolution of salt [rather than aslocalized deep dissolution]. One such feature in south-central Nash Draw was drilled and cored (WIPP-32)into the Salado in 1979 (SNLandUSGS, 1980); the geol-ogy showed no brecciation or unusual stratigraphy atdepth and shallow dissolution of upper Salado was con-sistent with that part of Nash Draw.
Borehole dissolution with collapse has become aregional issue because of the collapse of three boreholesinvolved in commercial brine production and three bore-holes intersecting the Capitan aquifer (e.g., Baumgard-ner and others, 1982; Johnson, 1989; Johnson andothers, 2003; Powers, 2003; Land, 2013). Brine produc-tion wells would be prohibited within theWIPP site dur-ing administrative control. Water to operate a brine wellis not readily available in the area of the site. Unless abrine well was located at or below the repository level,there would be no connection.
DISCUSSION
The initial concern at WIPP was for dissolution fromtop of Salado salt down to disposal levels. This wasgenerally assessed (~1972–1974) for the !rst (now aban-doned) location and found not to be of concern for mil-lions of years. Nevertheless, it factored into the selectionof the current WIPP site (1975–1976) and delineation ofareas for disposal as well as outer zones with restrictions.Early hydrologic tests and monitoring included the zoneat the Rustler-Salado contact to determine the presenceand signi!cance of the brine aquifer known to occurabove Salado salt at NashDraw. TheRustler-Salado con-tact at the site yielded little brine and was found to be oflittle hydrologic signi!cance. Salt in the Los MedanosMember above this interval across the site meantsurface-down dissolution was not occurring, and thatcombination inspired the concept of a dissolution wedgefor theRustler-Salado contact atWIPP. Surface-downdis-solution, however, generally became of less concernthrough early site characterization as it again was notapparent that it could affect a disposal layer over a relevantperiod. Although shaft mapping showed that this contactwas not undergoing dissolution, having a regulatoryperiod set for 10,000 yr and a speci!c criterion for failurein performance assessment made this concern irrelevant.
Discovery of a collapse chimney (“breccia pipe”) in apotash mine set in motion a large effort to understand
Figure 11. Relationship of WIPP 14 to gravity anomalyand surface depression (“doline”). WIPP-14 was clearlydrilled in the middle of the anomaly and within thedepression. Modi!ed from Barrows and others (1983).
Evaporite Dissolution and the Waste Isolation Pilot Plant (WIPP) 141

these features as well as to determine whether theymightexist at the site. Anomalies at the site were investigated(e.g., WIPP-13, WIPP-33) and determined not to bebreccia pipes. The known breccia pipes in the northernDelaware Basin were associated with the Capitan reef,which is not present at the site.With no evidence of brec-cia pipes at the site, concerns over their possible exis-tence at the site were minimal by 1983.
Deep dissolution as a wedge to undercut the WIPPdisposal area was directly tested by borehole ERDA-10. This testing did not !nd evidence of dissolutionresidues at Salado-Castile contact or in the Castile or evi-dence of "uid movement along the contact. The processwas estimated to take millions of years to reach WIPP,and de!ning the regulatory period rendered the hypoth-esis (of a deep dissolution wedge reaching WIPP) moot.Some of the original background assumptions aboutrates and extent of deep dissolution have been ques-tioned; the main proponent has also revised ideas aboutthe depositional extent of Castile halites (Anderson,1993; Anderson and Kirkland, 1995), which alters esti-mates of dissolution and rates.
Localized dissolution (deep) was mostly associatedwith speci!c features such as sur!cial depressions andchanges in halite thickness or elevation (Anderson,1978). None of these features were present in the currentboundaries of WIPP. A change in elevation of Saladobeds was found at a single potash drill hole within origi-nal outer zones on the northern side ofWIPP.DOE-2wasdrilled at this anomaly mainly to extract more informa-tion about expected evaporite deformation north of theWIPP site center. DOE-2 cores and logs provided evi-dence that the beds were deformed, not dissolvedfrom below.
Surface depressions or lagunas or lakes outside ofWIPP that were noted by Anderson (1978) have contin-ued to be designated as “sinks” or breccia pipes or as evi-dence of dissolution without providing subsurface data.Subsurface evidence for two examples contradicts suchassertions. It seems unlikely this will prevent such asser-tions where subsurface data are not available.
Basin troughs as dissolution features remain poorlyconstrained in timing and process because there are nocores to provide some critical evidence. The study byJohnson (1993) points the way to some differentiationof early removal of halite versus much more recent geo-logical events. We provide a more detailed look at thestructure of the top of Rustler here that compares withthe interpreted elevation of top and base of Rustler(Ewing and others, 2012) and faults as an indicator offuture enhancements of basin trough data.
Our ideas of depositional processes and dissolution ofthe Rustler have changed dramatically from early inves-tigations. The new shaft atWIPPwill provide yet anotheropportunity to check these ideas. Over time, these ideas
have been extended well beyondWIPP, and we continuedata analysis of the Rustler.
A surface gravity survey in the early 1980s acrossparts of northern WIPP, with detailed surveys of somespeci!c surface depressions, led to one exploratory drillhole (WIPP-14). No clear evidence of karst was found atthe location, but the drill hole data and location have beenextensively discussed. Arguments have been made thatkarst exists at WIPP and is signi!cant to the extent thatWIPP should no longer be certi!ed or continued. Thereseems to be no reasonably testable hypothesis of karst;any test without direct evidence is deemed unconvinc-ing. It wasn’t done at the right place or in the rightway, or karst is inherently dif!cult to intercept in a bore-hole. A hypothesis that is extremely dif!cult to falsifyleads us to believe that karst will continue to be raisedas an issue for future EPA recerti!cations and NMEDpermits for the continued operation of WIPP.
The original Anderson (1978) study provided aframework, although strongly oriented toward dissolu-tion as a potential explanation for many features, forinvestigating how dissolution might affect isolationof radioactive waste at WIPP. At the time, no regulatoryperiod for isolation had been established, and theassumed limits of 250,000 yr (~10 half-lives ofPu239) and an exposure point at Malaga Bend on thePecos River allowed great latitude in suggesting howdissolution might be important. In addition, availableborehole data were much more limited than they aretoday. It is highly likely that we or others will exploitthe data now available to examine some of the ideasand their validity. Basic assumptions about evaporitedeposition in the Delaware Basin, processes of dissolu-tion, and whether the physical conditions required toenable such processes have already been modi!edthrough time.
We echo Lorenz (2006a, b) and Chaturvedi (2009) inbeing disturbed by how features such as sink, sinkhole,collapse, alluvial dolines, etc., are simply asserted toexist with only the slimmest of circumstantial evidenceor how statements are taken out of context.We are mind-ful that karst does exist in the area and continue to exam-ine its manifestations (e.g., Powers, 2003; Powers andOwsley, 2003; Powers and others, 2006a; Goodbarand others, 2020).
FINALWORDS
Dissolution and the various perceptions, hypotheses,and assertions regarding its extent, timing, and signi!-cance to WIPP resulted in considerable expenditures oftime and resources in investigations. The investigationshave drawn signi!cant analysis by regulatory andoversight organizations including the New MexicoEnvironmental Evaluation Group, National Academy ofSciences panels, New Mexico Environment Department,
142 Dennis W. Powers and Robert M. Holt

andEnvironmental ProtectionAgency. Stakeholders havebeen active in reviewing and discussing dissolution.
By about the time WIPP was directly exploring thesite through shafts (~1983), most of these original issueswere reasonably settled. There was no evidence found ofbreccia pipes or localized deep dissolution at WIPP, andneither evidence of a dissolution wedge threateningWIPP at depth nor conditions for the process were obvi-ous. The various reports and studies were numerous,culminating mainly with the report of Lambert (1983).Neill and others (1983), for example, considered thesefeatures/processes not to be a threat to the repository.Lappin and others (1989) summarized preperformancelimits to the effects of these processes.
At this time, there is no speci!c concern expressed onthe part of regulating parties that dissolution processeswill affect continuing operations. The renewal applica-tion for the hazardous waste facility permit has been sub-mitted to the New Mexico Environment Department forreview. The compliance recerti!cation application 2019(CRA 2019) for continued disposal of defense-relatedtransuranic waste is being reviewed for completenessby the US Environmental Protection Agency. We fullyexpect that some concerns, most likely mainly aboutkarst, will continue to surface through stakeholdercomments.
Some issues possibly could have been avoided or ad-dressed easily with better and early understanding ofconditions (e.g., extremely low permeability, high "uidpressures) within the evaporite sequence. Newer data,such as we present for Bell Lake “sink” and LagunaPlata, should help modify a few pieces of the record.Continuing to work on Nash Draw helps us maintain asense of a differing hydrologic and geologic regime inthe vicinity of WIPP.
ACKNOWLEDGMENTS
A signi!cant part of our background work has beenfunded through WIPP, though not all. This publication,however, has not been funded by any WIPP agency orother source; it does not purport to represent any currentopinion or position of WIPP or those organizationsworking at WIPP. We acknowledge helpful reviews byKenneth S. Johnson and Anderson Ward; we absolvethem of responsibility for content or any errors.
REFERENCES CITED
Adams, J.E., 1944, Upper Permian Ochoan Series ofDelaware Basin, west Texas and southeast New Mex-ico: American Association of Petroleum Geologists,Bulletin, v. 28, p. 1596-1625.
Anderson, R.Y., 1978, Report to Sandia Laboratorieson deep dissolution of salt, Northern Delaware Basin,
NewMexico: Sandia National Laboratories, Albuquer-que, NM. https://wipp.energy.gov/library/cca/CCA_1996_References/Chapter%202/CREL4311.PDF
Anderson, R.Y., 1980, Field trip notes for salt dissolutionfeatures in the Delaware Basin, in Chaturvedi (1980),p. 112-129.
Anderson, R.Y., 1993, The Castile as a “nonmarine”evaporite, in Love, D.W., Hawley, J.W., and others,eds., Carlsbad region, New Mexico and west Texas:NewMexicoGeological Society, Forty-fourth AnnualField Conference, p. 12-13.
Anderson, R.Y., and Kirkland, D.W., 1966, Intrabasinvarve correlation: Geological Society of AmericaBulletin, v. 77, p. 241-256.
Anderson, R.Y., and Powers, D.W., 1978, Salt anticlinesin Castile-Salado evaporite sequence, northern Dela-ware Basin, inAustin, G.S., ed., Geology and mineraldeposits of Ochoan rocks in Delaware Basin and adja-cent areas: NewMexico Bureau ofMines andMineralResources, Circular 159, p. 79-84.
Anderson, R.Y, Kietzke, K.K., and Rhodes, D.J., 1978,Development of dissolution breccias, northern Dela-ware Basin, New Mexico and Texas, in Austin,G.S., ed., Geology and mineral deposits of Ochoanrocks in Delaware Basin and adjacent areas: NewMexico Bureau of Mines and Mineral Resources,Circular 159, p. 47-52.
Anderson, R.Y., Dean, W.E., Jr., Kirkland, D.W., andSnider, H.I., 1972, Permian Castile varved evaporitesequence, west Texas and New Mexico: GeologicalSociety of America Bulletin, v. 83, p. 59-86.
Bachman, G.O., 1973, Sur!cial features and late Ceno-zoic history in southeastern NewMexico: USGeolog-ical Survey, Open-File Report USGS-4339-8,Denver, CO.
Bachman, G.O., 1976, Cenozoic deposits of southeast-ern New Mexico and an outline of the history ofevaporite dissolution: Journal of Research of USGeological Survey, v. 4, p. 135-149.
Bachman, G.O., 1980, Regional geology and Cenozoichistory of Pecos region, southeastern New Mexico:US Geological Survey, Open-!le Report 80-1099,116 p.
Bachman, G.O., 1981, Geology of Nash Draw, EddyCounty, NM:USGeological Survey, Open-!le Report81-31, 10 p.
Bachman, G.O., 1984, Regional geology of Ochoanevaporites, northern part of Delaware Basin: NewMexico Bureau of Mines and Mineral Resources,Circular 184, 22 p.
Bachman, G.O., 1985, Assessment of near-surface dis-solution at and near the Waste Isolation Pilot Plant(WIPP), southeastern New Mexico: Albuquerque,
Evaporite Dissolution and the Waste Isolation Pilot Plant (WIPP) 143

NM, Sandia National Laboratories, SAND84-7178,33 p.
Bachman, G.O., 1987, Karst in evaporites in southeast-ern NewMexico: Albuquerque, NM, Sandia NationalLaboratories, SAND86-7078, 82 p.
Bachman, G.O., and Johnson, R.B., 1973, Stability ofsalt in the Permian salt basin of Kansas, Oklahoma,Texas, and New Mexico: US Geological Survey,Open-!le Report USGS-4339-4.
Barrows, L.J., 1982, WIPP geohydrology – the implica-tions of karst, in Chaturvedi, L, and Channelll, 1985,The Rustler Formation as a Transport Medium forContaminated Groundwater, Appendix A: EEG-32,Environmental Evaluation Group, Santa Fe, NM.
Barrows, L.J., and Fett, J.D., 1985, A high-precisiongravity survey in the Delaware Basin of southeasternNew Mexico: Geophysics, v. 50, no. 5, p. 825-833.
Barrows, L.J., Shaffer, S-E., Miller, W.B., and Fett, J.D.,1983, Waste Isolation Pilot Plant (WIPP) site gravitysurvey and interpretation: Sandia NationalLaboratories, Albuquerque, NM, SAND82-2922.
Baumgardner, R.W., Jr., Hoadley, A.D., and Goldstein,A.G., 1982, Formation of the Wink Sink, a salt disso-lution and collapse feature, Winkler County, Texas:Bureau of Economic Geology, University of Texasat Austin, Report of Investigation 114.
Beauheim, R.L., andHolt, R.M., 1990,Hydrogeology ofthe WIPP site, in Powers, D.W., Holt, R.M., Beau-heim, R.L., and Rempe, N., Geological andHydrolog-ical Studies of Evaporites in the Northern DelawareBasin for the Waste Isolation Pilot Plant (WIPP),New Mexico: Dallas Geological Society, GSA FieldTrip No. 14, p. 131-179.
Beauheim, R.L., and Roberts, R.M., 2002, Hydrologyand hydraulic properties of a bedded evaporite forma-tion: Journal of Hydrology, v. 259, p. 66-88.
Beauheim, R.L., Hassinger, B.W., and Klaiber, G.A.,1983, Basic data report for borehole Cabin Baby-deepening and hydrologic testing, Waste IsolationPilot Plant (WIPP) project, southeastern NewMexico:WTSD-TME-020, US Department of Energy, Albu-querque, NM. Successes and experiences of theWIPP project.
Beauheim, R.L., McKenna, S.A., Powers, D.W., andHolt, R.M., 2007, Geoscienti!c data collection andintegration for theWaste Isolation Pilot Plant: Linkageof Geoscienti!c Arguments and Evidence in Support-ing the Safety Case, Second AMIGO WorkshopProceedings, Toronto, Canada, 20-22 September2005, OECD NEA, p. 125-132 (ISBN 978-92-64-01966-9). https://www.researchgate.net/pro!le/Richard_Beauheim/publication/255277185_Geoscienti!c_data_collection_and_integration_for_the_Waste_Isolation_
Pilot_Plant/links/0f317535fd05fb9460000000/Geoscienti!c-data-collection-and-integration-for-the-Waste-Isolation-Pilot-Plant.pdfBlack, S.R., Newton, R.S., and Shukla, D.K., eds., 1983,Results of site validation experiments,Waste IsolationPilot Plant (WIPP) project, southeastern NewMexico:US Department of Energy, Albuquerque, NM, TME3177, v. I and II.
Brookins, D.G., andLambert, S.J., 1988,WIPP site stud-ies: secondary selenite veins in the Rustler Formationand Dewey Lake Red Beds: Materials Research Soci-ety Symposium Proceedings, v. 112, p. 233-241 (doi:https://doi.org/10.1557/PROC-112-233)
Chaturvedi, L., 1980, WIPP site and vicinity geological!eld trip: Environmental Evaluation Group EEG-7.http://www.sric.org/nuclear/eeg/1980_10_EEG07.pdf
Chaturvedi, L., 1987, ed., The Rustler Formation at theWIPP site: EEG-34, Environmental EvaluationGroup, Santa Fe, NM. http://www.sric.org/nuclear/eeg/1987_01_EEG-34.pdf
Chaturvedi, L., 2009, The karst and related issues at theWaste Isolation Pilot Plant: unpublished paper.(https://www.wipp.energy.gov/fctshts/Karst_Chaturvedi_062309.pdf)
Chu, M.S.Y., and Weart, W.D., 2000, Successes and ex-periences of the WIPP project: Sandia NationalLaboratories, Albuquerque, NM, SAND2000-2131C. https://www.osti.gov/servlets/purl/761878
Croxton, N.M., 2003, Subsidence on the Interstate 70 IRussell County, Kansas, related to salt dissolution –ahistory, in Johnson, K.S., and Neal, J.T., eds., Evapo-rite Karst and Engineering/Environmental Problemsin the United States: Oklahoma Geological Survey,Circular 109, p. 149-155.
Ewing, J.E., Jones, T.L., Yan, T, Vreugdenhil, A.M.,Fryar, D.G., Pickens, J.F., Gordon, K., Nicot, J-P.,Scanlon, B.R., Ashworth, J.B., and Beach, J., 2008,Final report groundwater availability model for theDockum aquifer: report for TexasWater DevelopmentBoard. (!nd at https://www.twdb.texas.gov/groundwater/models/gam/dckm/dckm.asp)
Ewing, J.E., Kelley, V.A., Jones, T.L., Yan, T., Singh, A.,Powers, D.W., Holt, R.M., and Sharp, J.M., 2012,Final groundwater availability model report for theRustler aquifer: report for Texas Water DevelopmentBoard. http://www.twdb.texas.gov/groundwater/models/gam/rslr/RSLR_GAM_Report.pdf
Gera, F., 1974, On the origin of the small hills in NashDraw and Clayton Basin, southeastern New Mexico:Oak Ridge National Laboratory, Oak Ridge, TN,ORNL Central Files No. 74-2-29.
Goodbar, A.K., Powers, D.W., Goodbar, J.R., and Holt,R.M., 2020, Karst and sinkholes at Nash Draw,
144 Dennis W. Powers and Robert M. Holt
southeastern New Mexico (USA), in Land, L.,Kromhout, C., and Byle, M.J., eds., Proceedings ofthe Sixteenth Multidisciplinary Conference on Sink-holes and the Engineering and Environmental Impactsof Karst (!rst ed.): National Cave and Karst ResearchInstitute, Carlsbad, NM, Symposium 8, p. 287-298.
Griswold, G.B., 1977, Site selection and evaluation stud-ies of theWaste Isolation Pilot Plant (WIPP), LosMed-anos, Eddy County, New Mexico: Sandia NationalLaboratories, Albuquerque, NM, SAND 77-0946.
Hill, C.A., 1993, Barite/celestite/selenite/calcite miner-alization at Bell Lake sink, Lea County, NewMexico,in Love, D.W., Hawley, J.W., and others, eds., Carls-bad region, New Mexico and West Texas: NewMexico Geological Society, Forty-fourth AnnualField Conference, p. 317-320.
Hill, C.A., 1996, Geology of the Delaware Basin, Gua-dalupe, Apache, and Glass Mountains, New Mexicoand west Texas: Permian Basin Section-SEPM Publi-cation No. 96-39.
Hill, C.A., 1999, Letter Report: Intrastratal karst at theWIPP site: unpublished report to SandiaNational Lab-oratories, 98 p.
Hill, C.A., 2003, Intrastratal karst at the Waste IsolationPilot Plant site, southeastern NewMexico, in Johnson,K.S., and Neal, J.T., eds., Evaporite Karst and Engi-neering/Environmental Problems in the United States:Oklahoma Geological Survey, Circular 109,p. 197-209.
Hill, C.A., 2006, Intrastratal karst at the Waste IsolationPilot Plant site, southeasternNewMexico, inLand, L.,and others, eds., Caves & Karst of Southeastern NewMexico, NM: Geological Society Fifty-seventhAnnual Field Conference Guidebook, p. 233-242.(reprint of Hill, 2003)
Hills, J.M., 1984, Sedimentation, tectonism, and hydro-carbon generation in Delaware basin, west Texas andsoutheastern New Mexico: American Association ofPetroleum Geologists, Bulletin, v. 68, p. 260-267.
Hiss,W.L., 1975, Stratigraphy and ground-water hydrol-ogy of the Capitan aquifer, southeastern New Mexicoand western Texas: unpublished Ph.D. Dissertation,University of Colorado, Boulder, 501 p.
Hiss, W.L., 1976, Chloride-ion concentration in groundwater in Permian Guadalupian rocks, southeast NewMexico and west Texas: New Mexico Bureau ofMines & Mineral Resources, Socorro, NM, ResourceMap 4.
Holliday, V.T., Hovorka, S.D., and Gustavson, T.C.,1996, Lithostratigraphy and geochronology of !llsin small playa basins on the Southern High Plains,United States: Geological Society of America Bulle-tin, v. 108, p. 953-965.
Holt, R.M., 1988, The depositional environments of thelate Permian Rustler Formation, in the vicinity of theWaste Isolation Pilot Plant (WIPP) site, southeasternNew Mexico: unpublished M.S. thesis, Universityof Texas at El Paso.
Holt, R.M., 1997, Conceptual model for transport pro-cesses in the Culebra Dolomite Member, Rustler For-mation: Sandia National Laboratories, Albuquerque,NM, SAND97-0194. https://www.osti.gov/servlets/purl/527459
Holt, R.M., andPowers,D.W., 1984,Geotechnical activ-ities in the waste handling shaft, Waste Isolation PilotPlant (WIPP) project, Southeastern New Mexico:Department of Energy, Carlsbad, NM, WTSD-TME 038.
Holt, R.M., andPowers,D.W., 1986,Geotechnical activ-ities in the exhaust shaft, Waste Isolation Pilot Plant:Department of Energy, Carlsbad, NM, DOE-WIPP86-008.
Holt, R.M., and Powers, D.W., 1988, Facies variabilityand post-depositional alteration within the RustlerFormation in the vicinity of the Waste Isolation PilotPlant, Southeastern New Mexico: Department ofEnergy, Carlsbad, NM, WIPP-DOE-88-004. https://wipp.energy.gov/library/cca/CCA_1996_References/Chapter%202/CREL2063.PDF
Holt, R.M., and Powers, D.W., 1990, Geological map-ping of the air intake shaft at the Waste Isolation PilotPlant: DOE/WIPP 90-051, U.S. Department ofEnergy, Carlsbad, NM. http://www.ntis.gov/search/product.aspx?ABBR=DE91017780
Holt, R.M., andPowers,D.W., 2010, Evaluation of halitedissolution at a radioactive waste disposal site, An-drews County, TX: Geological Society of AmericaBulletin, v. 122, p. 1989-2004, DOI: https://doi.org/10.1130/B30052.1.
Holt, R.M., and Powers, D.W., 2011, Synsedimentarydissolution pipes and the isolation of ancient bacteriaand cellulose:Geological Society ofAmericaBulletin,v. 123, p. 1513-1523, DOI:https://doi.org/10.1130/B30197.1.
Holt, R.M., and Yarborough, L., 2002, Analysis report,Task 2 of AP-088, Estimating base transmissivity!elds: ERMS# 523889, WIPP Records Center,Sandia National Laboratories, Carlsbad, NM.
Holt, R.M., Beauheim, R.L., and Powers, D.W., 2005,Predicting fractured zones in the Culebra Dolomite,in Faybishenko, B, Witherspoon, P.A., and Gale, J.,eds., Dynamics of Fluids and Transport in FracturedRock: AGU Geophysical Monograph Series, v. 162,p. 103-116.
Hovorka, S. D., 1989, Depth evolution of the DelawareBasin – Castile/Salado transition, in Harris, P.M, and
Evaporite Dissolution and the Waste Isolation Pilot Plant (WIPP) 145
Grover, G.A., eds., Subsurface and Outcrop Examina-tion of the Capitan shelf margin, Northern DelawareBasin: SEPM Core Workshop no. 13, p. 441-449.
Hovorka, S.D., Holt, R.M., and Powers, D.W., 2007,Depth indicators in Permian Basin evaporites, inSchreiber, B.C., Lugli, S., and Babel, M., Evaporitesthrough space and time: Geological Society, London,Special Publication 285, p. 335-364.
Johnson, K.S., 1981, Dissolution of salt on the east "ankof the Permian Basin in the southwestern USA: Jour-nal of Hydrology, v. 54, p. 75-93.
Johnson, K.S., 1989, Development of the Wink sink inwest Texas, USA, due to salt dissolution and collapse:Environmental Geology and Water Sciences, v. 14,p. 81-92.
Johnson, K.S., Collins, E.W., and Seni, S.J., 2003, Sink-holes and land subsidence owing to salt dissolutionnear Wink, west Texas, and other sites in westernTexas and New Mexico, in Johnson, K.S., and Neal,J.T., eds., Evaporite Karst and Engineering/Environ-mental Problems in the United States: OklahomaGeological Survey, Circular 109, p. 183-195.
Jones, C.L., 1972, Permian basin potash deposits, south-western United States, in Richter-Bernburg, G., ed.,Geology of saline deposits, UNESCO, p. 191-201.
Jones, C.L., 1981, Geologic data for borehole ERDA-6,Eddy County, New Mexico: US Geological Survey,Open-!le Report 81-468.
Jones, C.L, Bowles, C.G., and Bell, K.G., 1960, Experi-mental drill hole logging in potash deposits of theCarlsbad District, New Mexico: US GeologicalSurvey, Open-!le Report 60-84.
Jones, C.L., Cooley, M.E., and Bachman, G.O., 1973,Salt deposits of Los Medanos area, Eddy and LeaCounties, New Mexico: USGS-4339-7, USGeological Survey, Denver, CO.
Lambert, S.J., 1983, Dissolution of evaporites in andaround theDelaware Basin, southeasternNewMexicoand west Texas: SAND82-0461, Sandia NationalLaboratories, Albuquerque, NM.
Land, L., 2013, Evaporite karst in the Permian Basinregion of west Texas and southeastern New Mexico:The human impact, in Land, L., Doctor, D.H., andStephenson, B., eds., Proceedings of the 13th Multi-disciplinary Conference on Sinkholes and the Engi-neering and Environmental Impacts of Karst:National Cave and Karst Research Institute, Carlsbad,NM, p. 113-121.
Lappin, A.R., 1988, Summary of site-characterizationstudies conducted from 1983 through 1987 at theWaste Isolation Pilot Plant (WIPP) site, southeasternNew Mexico: SAND88-0157, Sandia National Labo-ratories, Albuquerque, NM.
Lappin, A.R., Hunter, R.L, Garber, D.P., and Davies,P.B., eds., 1989, Systems analysis, long-term radionu-clide transport, and dose assessments, Waste IsolationPilot Plant (WIPP), southeastern NewMexico; March1989: SAND89-0462, Sandia National Laboratories,Albuquerque, NM.
Lee, W.T., 1925, Erosion by solution and !ll, in Contri-butions to geography in the United States: U.S.Geological Survey, Bulletin 760-C, p. 107-121.
Leslie, A., Kendall, A., and Harwood, G., 1993, TheCastile Formation: a continuing paradox, in Love,D.W., Hawley, J.W., and others, eds., Carlsbad region,NewMexico andwest Texas: NewMexicoGeologicalSociety, Forty-fourth Annual Field Conference,p. 13-14.
Leslie, A.B., Kendall, A.C., Harwood, G.M., andPowers, D.W., 1996, Con"icting indicators of palaeo-depth during deposition of the Upper Permian CastileFormation, Texas and NewMexico, inKemp, A.E.S.,ed., Palaeoclimatology and Palaeoceanography fromLaminated Sediments: Geological Society, London,Special Publication 116, p. 79-92.
Lorenz, J.C., 2006a,Assessment of the potential for karstin the Rustler Formation at the WIPP site:SAND2005-7303, Sandia National Laboratories,Albuquerque, NM, 102 p.
Lorenz, J.C., 2006b, Assessment of the geological evi-dence for karst in the Rustler Formation at theWIPP site, in Land, L., and others, eds., Caves andKarst of Southeastern New Mexico: New MexicoGeological Society, Fifty-seventh Annual Field Con-ference Guidebook, p. 243-251.
Lowenstein, T.K., 1987. Post Burial Alternation of thePermian Rustler Formation Evaporites, WIPP Site,New Mexico: Textural Stratigraphic and ChemicalEvidence. EEG-36, NewMexico Health and Environ-ment Department, Santa Fe, New Mexico. (https://wipp.energy.gov/library/cca/CCA_1996_References/Chapter%202/CREL4001.PDF)
Madsen, B.M., and Raup, O.B., 1988, Characteristics ofthe boundary between the Castile and Salado Forma-tions near the western edge of the Delaware Basin,southeastern New Mexico: New Mexico Geology,v. 10, no. 1, p. 1-5, 9.
Mercer, J.W., 1982, Drill-stem tests, WIPP 31, in Snyderand Gard (1982), p. 67-69.
Mercer, J.W., 1983, Geohydrology of the proposedWaste Isolation Pilot Plant site, Los Medanos area,Southeastern New Mexico: US Geological Survey,Water-Resources Investigations Report 83-4016,Albuquerque, NM.
Mercer, J. W., 1987, Compilation of hydrologic datafrom drilling the Salado and Castile Formations near
146 Dennis W. Powers and Robert M. Holt

the Waste Isolation Pilot Plant (WIPP) site in south-eastern New Mexico: SAND86-0954, SandiaNational Laboratories, Albuquerque, NM.
Mercer, J.W., and Orr, B.R., 1977, Review and analysisof hydrogeologic conditions near the site of a potentialnuclear-waste repository, Eddy and Lea Counties,New Mexico: US Geological Survey, Open-!leReport 77-123.
Mercer, J.W., Beauheim, R.I., Snyder, R.P., and Fairer,G.M., 1987, Basic data report for drilling and hydro-logic testing of drillhole DOE-2 at the Waste IsolationPilot Plant (WIPP) site: SAND86-0611, SandiaNational Laboratories, Albuquerque, NM.
NAS/NRC, 1957, Disposal of radioactive wastes on land:National Academy of Sciences – National ResearchCouncil, Washington, D.C., Publication 519.
Neill, R.H., Channell, J.K., Chaturvedi, L., Little, M.S.,Rehfeldt, K., and Spiegler, P., 1983, Evaluation of thesuitability of the WIPP site: EEG-23, EnvironmentalEvaluation Group, Sant Fe, NM. https://wipp.energy.gov/library/cca/CCA_1996_References/Chapter%202/CREL3987.PDF
Nicholson, A., Jr., and Clebsch, A., Jr., 1961, Geologyand ground-water conditions in southern Lea County,New Mexico: State Bureau of Mines and MineralResources, Ground-Water Report 6, New MexicoInstitute of Mining and Technology, Socorro, NM.
Osterkamp, W.R., and Wood, W.W., 1987, Playa-lakebasins on the southern High Plains of Texas andNew Mexico: Part I. Hydrologic, geomorphic, andgeologic evidence for their development: GeologicalSociety of America, Bulletin, v. 99, p. 215-223.
Pierce, W.G., and Rich, E.I, 1962, Summary of rock saltdeposits in the United States as possible storage sitesfor radioactive waste materials: US GeologicalSurvey, Bulletin 1148, Washington, D.C.
Powers, D. W., 1996, Tracing early breccia pipe studies,Waste Isolation Pilot Plant, southeasternNewMexico:A study of the documentation available and decision-making during the early years of WIPP: SAND94-0991,SandiaNationalLaboratories,Albuquerque,NM.
Powers, D.W., 2003, Jal Sinkhole in Southeastern NewMexico: Evaporite dissolution, drillholes, and the poten-tial for sinkhole development, in Johnson, K.S., andNeal, J.T., eds., Evaporite Karst and Engineering/Envi-ronmental Problems in the United States: OklahomaGeological Survey, Circular 109, p. 219-226.
Powers, D.W., and Holt, R.M., 1990, Sedimentology ofthe Rustler Formation near the Waste Isolation PilotPlant (WIPP) site, in Powers, D.W., Holt, R.M., Beau-heim,R.L., andRempe,N., eds., 1990,Geological andHydrological Studies of Evaporites in the NorthernDelaware Basin for the Waste Isolation Pilot Plant
(WIPP): Geological Society of America (Dallas Geo-logical Society), Guidebook 14, p. 79-106.
Powers, D.W., and Holt, R.M., 1999, The Los MedanosMember of the PermianRustler Formation: NewMex-ico Geology, v. 21, no. 4, p. 97-103.
Powers, D.W., and Holt, R.M., 2000, The salt that wasn’tthere: mud"at facies equivalents to halite of the Perm-ian Rustler Formation, southeastern New Mexico:Journal of SedimentaryResearch, v. 70, no. 1, p. 29-36.
Powers, D.W., and Holt, R.M., 2008, Lessons from earlysite investigations at theWaste Isolation Pilot Plant, inRempe, N.T., ed., Deep Geologic Repositories: Geo-logical Society of America, Reviews in EngineeringGeology, v. XIX, p. 83-97, doi: https://doi.org/10.1130/2008.4019(09), March.
Powers, D.W., and Owsley, D., 2003, A !eld survey ofevaporite karst along NM 128 realignment routes, inJohnson, K.S., and Neal, J.T., eds., Evaporite Karstand Engineering/Environmental Problems in theUnited States: Oklahoma Geological Survey, Circular109, p. 233-240.
Powers, D.W., Beauheim, R.L., Holt, R.M., and Hughes,D.L., 2006a, Evaporite karst features and processes atNash Draw, Eddy County, New Mexico, in Land, L.,and others, eds., Caves & Karst of SoutheasternNew Mexico: New Mexico Geological Society, Fifty-seventh Annual Field Conference Guidebook,p. 253-266.
Powers, D.W., Holt, R.M., Beauheim, R.L., andMcKenna, S.A., 2003, Geological factors related tothe transmissivity of the Culebra Dolomite Member,Permian Rustler Formation, Delaware Basin, South-eastern New Mexico, in Johnson, K.S., and Neal,J.T., eds., Evaporite Karst and Engineering/Environ-mental Problems in the United States: OklahomaGeological Survey, Circular 109, p. 211-218.
Powers, D.W., Holt, R.M., Beauheim, R.L., and Ri-chardson, R.G., 2006b, Advances in depositionalmodels of the Permian Rustler Formation, southeast-ern New Mexico, in Caves & Karst of SoutheasternNewMexico, Land, L., and others, eds., NewMexicoGeological Society, Fifty-seventh Annual Field Con-ference Guidebook, p. 267-276.
Powers, D.W., Lambert, S.J., Shaffer, S-E., Hill, L.R.,and Weart, W.D., eds., 1978, Geological characteriza-tion report, Waste Isolation Pilot Plant (WIPP) site,southeastern New Mexico: SAND78-1596, v. I & II,about 1500 p., Sandia National Laboratories, Albu-querque, NM 87185.
Rechard, R.P., 2000, Historical background on perfor-mance assessment for the Waste Isolation Pilot Plant:Reliability Engineering and System Safety, v. 69,p. 5-46.
Evaporite Dissolution and the Waste Isolation Pilot Plant (WIPP) 147
Reddy, G.R., 1961, Geology of the Queen Lake domesnear Malaga, Eddy County, New Mexico: Unpub-lished M.S. thesis, University of New Mexico, Albu-querque, NM.
Reeves, C.C., Jr., and Temple, J.M., 1986, Permian saltdissolution, alkaline lake basins, and nuclear-wastestorage, southern High Plains, Texas and NewMexico: Geology, v. 14, p. 939-942.
Roberts, R.M., Beauheim, R.L., and Domski, P.S., 1999,Hydraulic testing of Salado Formation evaporites atthe Waste Isolation Pilot Plant site: !nal report:SAND98-2537, Sandia National Laboratories, Albu-querque, New Mexico.
Robinson, J.Q., 1989, A clastic evaporite deposit in thelower Castile Formation (Permian), Delaware Basin:Unpublished M.S. Thesis, University of Texas atEl Paso.
Robinson, J.Q., and Powers, D.W., 1987, A clasticdeposit within the lower Castile Formation, westernDelaware Basin, New Mexico, in Powers, D.W.,and James, W.C., eds., Geology of the westernDelaware Basin, west Texas and southeastern NewMexico: El Paso Geological Society, Guidebook 18,p. 69-79.
Robinson, T.W., and Lang, W.B., 1938, Geology andground-water conditions of the Pecos River valleyin the vicinity of Laguna Grande de la Sal, NewMex-ico: New Mexico State Engineer, 12th and 13th Bien-nial Reports, p. 79-100. (scanned version at https://wipp.energy.gov/library/cca/CCA_1996_References/Chapter%202/CREL4706.PDF)
Smith, D.B., Cannon, W.F., Woodruff, L.G., Solano,Federico, Kilburn, J.E., and Fey, D.L., 2013, Geo-chemical and mineralogical data for soils of the con-terminous United States: US Geological Survey,Data Series 801, 19 p., https://pubs.usgs.gov/ds/801/.Select Downloads, Appendix_3a_AHorizon_18Sept2013.xls. Line # 2851, sample C-326121.
SNL (Sandia National Laboratories) and D’AppoloniaConsulting Engineers, 1982, Basic data report fordrillhole WIPP 14 (Waste Isolation Pilot Plant –WIPP): SAND82-1783, Sandia National Laborato-ries, Albuquerque, NM.
SNL (Sandia National Laboratories) and D’AppoloniaConsulting Engineers, 1983, Basic data report fordrillhole ERDA-10 (Waste Isolation Pilot Plant –WIPP): SAND79-0271, Sandia National Laborato-ries, Albuquerque, NM.
SNL (Sandia National Laboratories) and USGS (USGeological Survey), 1979, Basic data report for drill-hole WIPP 13 (Waste Isolation Pilot Plant – WIPP):SAND79-0273, Sandia National Laboratories, Albu-querque, NM.
SNL (Sandia National Laboratories) and USGS (USGeological Survey), 1981, Basic data report for drill-hole WIPP 33 (Waste Isolation Pilot Plant – WIPP):SAND80-2011, Sandia National Laboratories, Albu-querque, NM.
SNL (Sandia National Laboratories) and USGS (USGeological Survey), 1983, Basic data report for drill-hole ERDA-6 (Waste Isolation Pilot Plant – WIPP):SAND79-0267, Sandia National Laboratories, Albu-querque, NM.
Snyder, R.P., and Gard, L.M., Jr., 1982, Evaluation ofbreccia pipes in southeastern New Mexico and theirrelation to the Waste Isolation Pilot Plant (WIPP)site, with section on Drill-stem tests: U.S. GeologicalSurvey Open-!le Report 82-968.
Temple, J.M., 1986, Permian salt dissolution related toalkaline lake basins, southern High Plains, Texas:Unpublished M.S. thesis, Texas Tech University,Lubbock TX, 87 p.
US DOE, 1996, Title 40 CFR Part 191 ComplianceCerti!cation Application: DOE/CAO 1996-2184,US Department of Energy, Carlsbad Field Of!ce,Carlsbad, NM.
USDOE, 2004, Title 40CFRPart 191ComplianceRecer-ti!cationApplication 2004 for theWaste Isolation PilotPlant: DOE/WIPP 2004-3231, US Department ofEnergy, Carlsbad Field Of!ce, Carlsbad, NM.
USDOE, 2009, Title 40CFRPart 191ComplianceRecer-ti!cationApplication 2009 for theWaste Isolation PilotPlant: DOE/WIPP 2009-342, US Department ofEnergy, Carlsbad Field Of!ce, Carlsbad, NM.
US DOE, 2014, Title 40 CFR Part 191 ComplianceRecerti!cation Application 2014 for the Waste Isola-tion Pilot Plant: DOE/WIPP 2014-3503, USDepartment of Energy, Carlsbad Field Of!ce, Carls-bad, NM.
US DOE, 2019, Title 40 CFR Part 191 ComplianceRecerti!cation Application 2019 for the Waste Isola-tion Pilot Plant: DOE/WIPP-19-3609, USDepartmentof Energy, Carlsbad Field Of!ce, Carlsbad, NM.
US EPA (Environmental Protection Agency), 1996,40 CFR Part 194: Criteria for the Certi!cation andRe-Certi!cation of the Waste Isolation Pilot Plant’sCompliance with the 40 CFR Part 191 Disposal Reg-ulations; Final Rule. Federal Register, Vol. 61, No. 28,pp. 5224-5245, February 9, 1996. Of!ce of Air andRadiation, Washington, D.C.
Vine, J.D., 1960, Recent domal structures in southeast-ern NewMexico: American Association of PetroleumGeologists, Bulletin, v. 44, p. 1903-1911.
Vine, J.D., 1963, Surface geology of the Nash DrawQuadrangle, Eddy county, NewMexico: U.S. Geolog-ical Survey, Bulletin 1141-B.
148 Dennis W. Powers and Robert M. Holt
Walker, J.S., 2006-2007, An ‘atomic garbage dump’ forKansas: The controversy over the Lyons radioactivewaste repository, 1970-1972: Kansas History: A Jour-nal of the Central Plains, v. 29, p. 266-285.
Weart, W.D., 1979, Evaluation of the proposed WIPPsite in southeast New Mexico: SAND79-1113C, San-dia National Laboratories, Albuquerque, NM. https://inis.iaea.org/collection/NCLCollectionStore/_Public/11/500/11500464.pdf
Weart,W.D., 1983, Summary evaluation of theWaste Iso-lation Pilot Plant (WIPP) site suitability: SAND83-0450, Sandia National Laboratories, Albuquerque,NM. https://wipp.energy.gov/library/cca/CCA_1996_References/Chapter%202/CREL4255.PDF
Weart, W.D., 1999, Perspectives of the science advisor totheWaste IsolationPilot Plant: SAND99-1600C,SandiaNational Laboratories, Albuquerque, NM. https://www.osti.gov/servlets/purl/13070-vcPpRG/webviewable/
Weart, W.D., and Chu, M.S.Y., 1997, Critical scienti!cissues in the demonstration of WIPP compliance with
EPA repository standards: SAND97-2851C, SandiaNational Laboratories, Albuquerque, NM. https://www.osti.gov/servlets/purl/562597
White, W.H., Hyslop, N.P., Trzepla, K., Yatkin, S.,Rarig, R.S., Jr., Gill, T.E., and Jin, L., 2015, Regionaltransport of a chemically distinctive dust: gypsumfrom White Sands, New Mexico (USA): AeolianResearch, v. 16, p. 1-10.
Widdicombe, R.E., 1979, Quaternary sur!cial featuresin the Delaware Basin, Eddy and Lea Counties,New Mexico: Unpublished M.S. thesis, Universityof New Mexico, Albuquerque, NM.
Wood, W.W., 2002, Role of ground water in geomor-phology, geology, and paleoclimate of the SouthernHigh Plains, USA: Ground Water, v. 40, p. 438-447.
Wood, W.W., and Osterkamp, W.R., 1987, Playa-lakebasins on the southern High Plains of Texas andNew Mexico: Part II. A hydrologic model andmass-balance arguments for their development: Geo-logical Society ofAmerica, Bulletin, v. 99, p. 224-230.
Evaporite Dissolution and the Waste Isolation Pilot Plant (WIPP) 149


ABSTRACT.—The speleogenetic evolution of Castile evaporite karst within theDelaware Basin of west Texas and southeastern New Mexico attests to a complexdiagenetic history of epigene and hypogene processes, commonly masked by vari-ably thick gypsic soils. Epigene karst phenomena present within the basin includekarren, sinkholes, vadose caves, phreatic caves, and solution–suffosion features.Hypogene karst phenomena include caves, intrastratal brecciation, evaporite calci-tization, and clustered sites of native sulfur oxidation. Because of the signi!cantgeohazards, these karst phenomena create for infrastructure and petroleum devel-opment throughout the region, and this manuscript attempts to provide an initialconceptual evolutionary model for speleogenesis within Castile evaporites basedon previous studies and spatial patterns of documented karst phenomena. Currentresearch suggests that hypogene karst development initiated during the Late Paleo-gene with the occurrence of regional tilting and elevated geothermal gradients.Epigene karsting and the development of the Gypsum Plain likely did not beginuntil the Late Neogene when uplift sur!cially exposed Bell Canyon strata in theDelaware Mountains, as well as Castile evaporites for the !rst time since Ochoandeposition. Wet, temperate climates of the Pleistocene sculpted the Gypsum Plain,as it is observed today, with more intense periods of karsting/surface denudationoccurring during glacial periods, with a reduction in solutional processes duringinterglacial periods. The Gypsum Plain continues to re-equilibrate from the climaticshift of the wet, temperate Pleistocene to the hot, arid conditions observed today.The eastward migration of the Pecos River throughout the Cenozoic has resulted inadditional continued evolution and karst development across the Gypsum Plain,observed today at a slower rate than in the past.
INTRODUCTION
Evaporite karst development in the Permian CastileFormation of west Texas and southeastern New Mexicoexhibits a complex speleogenetic history evidenced bythe widespread, diverse karst features documentedacross the Gypsum Plain (Castile Formation outcropregion). The development of new and existing featurescontinues today across the arid region, resulting in anever-changing landscape of increasing complexity. Sig-ni!cant geohazard challenges associated with publicinfrastructure as well as industry operations within thearea are posed by this karst development (e.g., Majzouband others, 2017; Morris and others, 2021; Stafford andothers, 2017; Woodard and others, 2021). Since approx-imately 2014, advances in nonconventional petroleum
extraction have resulted in widespread oil and gas devel-opment throughout the interior of the Delaware Basin,including signi!cant exploration and development thatmust contend with karst in Castile evaporites. This rapidincrease in oil!eld activity has led to the need to betterunderstand the associated processes and relationshipsof karst within the Castile Formation, fueling recentresearch efforts to better understand the temporal andspatial development of local phenomena.
Karst manifestations include both extensive epigene(e.g., Stafford and others, 2008a) and hypogene (e.g.,Stafford and others, 2018) components in Castile evap-orites. Epigene karst phenomena include 1) sur!cialweathering producing complex karren; 2) developmentof gypsic soils and associated solution–suffusion caves;3) epigene vadose caves and solution sinkholes;
Stafford, Kevin W.; and Shields, Jessica, 2021, Speleogenetic Evolution of Castile Karst Manifestations of theDelaware Basin, West Texas and Southeastern New Mexico, in Johnson, K. S.; Land, Lewis; and Decker, D. D.(eds.), Evaporite Karst in the Greater Permian Evaporite Basin (GPEB) of Texas, New Mexico, Oklahoma,Kansas, and Colorado: Oklahoma Geological Survey, Circular 113, p. 151–163.
0LMBIPNB�Geological�Survey�Circular�113,�2021
Speleogenetic�Evolution�of�Castile�Karst�Manifestationsof�the�Delaware�Basin,�West�Texas�and�Southeastern�New�Mexico
Kevin�W.�Stafford�and�Jessica�ShieldsDepartment�of�Geology,�Stephen�F.�Austin�State�University,�Nacogdoches,�Texas
151
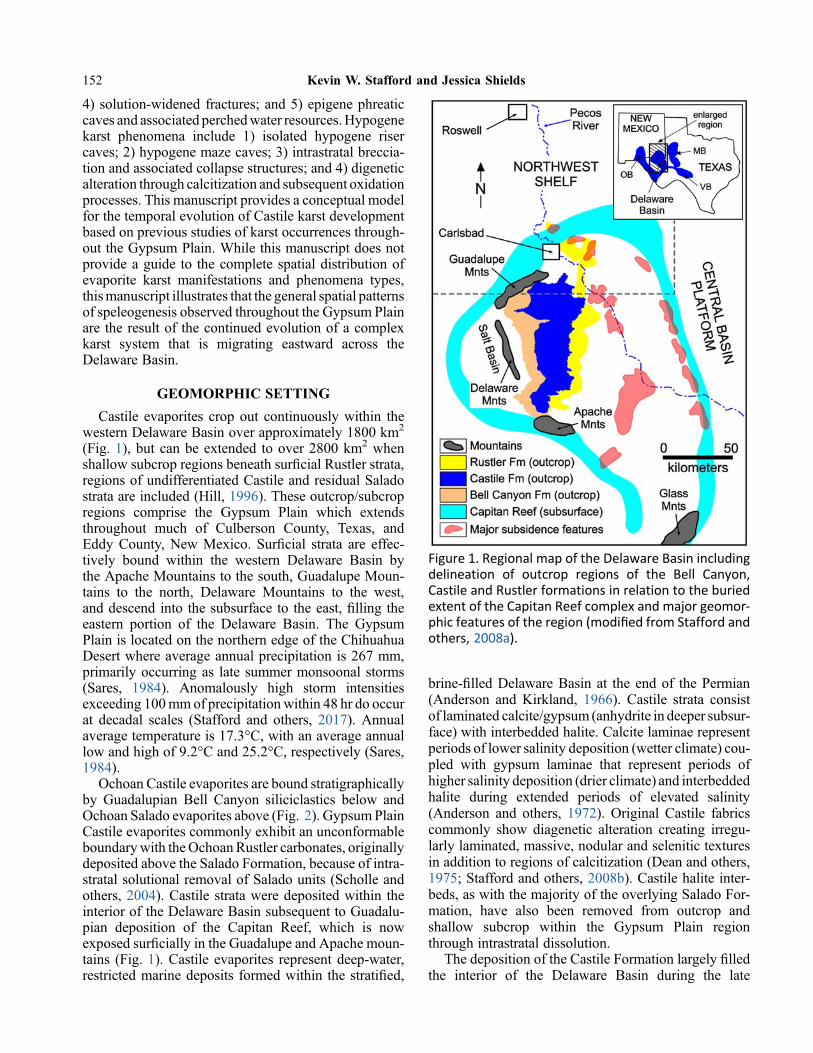
4) solution-widened fractures; and 5) epigene phreaticcaves and associated perchedwater resources.Hypogenekarst phenomena include 1) isolated hypogene risercaves; 2) hypogene maze caves; 3) intrastratal breccia-tion and associated collapse structures; and 4) digeneticalteration through calcitization and subsequent oxidationprocesses. This manuscript provides a conceptual modelfor the temporal evolution of Castile karst developmentbased on previous studies of karst occurrences through-out the Gypsum Plain. While this manuscript does notprovide a guide to the complete spatial distribution ofevaporite karst manifestations and phenomena types,thismanuscript illustrates that the general spatial patternsof speleogenesis observed throughout the Gypsum Plainare the result of the continued evolution of a complexkarst system that is migrating eastward across theDelaware Basin.
GEOMORPHIC SETTING
Castile evaporites crop out continuously within thewestern Delaware Basin over approximately 1800 km2
(Fig. 1), but can be extended to over 2800 km2 whenshallow subcrop regions beneath sur!cial Rustler strata,regions of undifferentiated Castile and residual Saladostrata are included (Hill, 1996). These outcrop/subcropregions comprise the Gypsum Plain which extendsthroughout much of Culberson County, Texas, andEddy County, New Mexico. Sur!cial strata are effec-tively bound within the western Delaware Basin bythe Apache Mountains to the south, Guadalupe Moun-tains to the north, Delaware Mountains to the west,and descend into the subsurface to the east, !lling theeastern portion of the Delaware Basin. The GypsumPlain is located on the northern edge of the ChihuahuaDesert where average annual precipitation is 267 mm,primarily occurring as late summer monsoonal storms(Sares, 1984). Anomalously high storm intensitiesexceeding 100mmof precipitation within 48 hr do occurat decadal scales (Stafford and others, 2017). Annualaverage temperature is 17.3°C, with an average annuallow and high of 9.2°C and 25.2°C, respectively (Sares,1984).
Ochoan Castile evaporites are bound stratigraphicallyby Guadalupian Bell Canyon siliciclastics below andOchoan Salado evaporites above (Fig. 2). Gypsum PlainCastile evaporites commonly exhibit an unconformableboundarywith theOchoanRustler carbonates, originallydeposited above the Salado Formation, because of intra-stratal solutional removal of Salado units (Scholle andothers, 2004). Castile strata were deposited within theinterior of the Delaware Basin subsequent to Guadalu-pian deposition of the Capitan Reef, which is nowexposed sur!cially in the Guadalupe and Apache moun-tains (Fig. 1). Castile evaporites represent deep-water,restricted marine deposits formed within the strati!ed,
brine-!lled Delaware Basin at the end of the Permian(Anderson and Kirkland, 1966). Castile strata consistof laminated calcite/gypsum (anhydrite in deeper subsur-face) with interbedded halite. Calcite laminae representperiods of lower salinity deposition (wetter climate) cou-pled with gypsum laminae that represent periods ofhigher salinity deposition (drier climate) and interbeddedhalite during extended periods of elevated salinity(Anderson and others, 1972). Original Castile fabricscommonly show diagenetic alteration creating irregu-larly laminated, massive, nodular and selenitic texturesin addition to regions of calcitization (Dean and others,1975; Stafford and others, 2008b). Castile halite inter-beds, as with the majority of the overlying Salado For-mation, have also been removed from outcrop andshallow subcrop within the Gypsum Plain regionthrough intrastratal dissolution.
The deposition of the Castile Formation largely !lledthe interior of the Delaware Basin during the late
Figure 1. Regional map of the Delaware Basin includingdelineation of outcrop regions of the Bell Canyon,Castile and Rustler formations in relation to the buriedextent of the Capitan Reef complex and major geomor-phic features of the region (modi!ed from Stafford andothers, 2008a).
152 Kevin W. Stafford and Jessica Shields

Permian—a total thickness of the Castile deposits rangedfrom 470 to 600 m (Hill, 1996). Subsequently, the lateOchoan deposition of the Salado and Rustler formationscapped the region, including the surrounding shelf andplatform environments—600–800 mof Salado andRus-tler strata were deposited on top of Castile evaporites(Hill, 1996). This stratal capping provided regionallow permeability seals that promoted isolation, develop-ment, and accumulation of petroleum resources in theregion (Scholle and others, 2004). At the end of theOchoan, the deposition of Dewey Lake Redbeds markedthe !nal closure of the Delaware Basin at the transitionfrom Permian to Triassic deposition. The Dewey LakeFormation records a transition from subaqueous to sub-aerial deposition and includes mixed siliciclastic depos-its associated with the transition to "uvial, continentaldepositional regimes—this was coupled with the !nalassimilation of Pangea (Hill, 1996).
Throughout the Mesozoic and Cenozoic, the PermianBasin was largely subaerially exposed, thus, beginning~250 million years in which the region was dominatedby weathering, continental deposition/erosion, and dia-genetic alteration of buried Permian strata. During thelate Triassic, thick sequences of continental deposits(Chinle Group) were deposited unconformably on topof Dewey Lake Redbed deposits that had been erodedin the early to middle Triassic (Hill, 1996)—this deposi-tion created a regional sag across the Permian Basin. TheJurassic marked an extended period of erosion followingthe breakup of Pangea and opening of the Gulf ofMexico, but a marine transgression introduced Creta-ceous deposition (CoxFormation) to the region,markingthe !nal stage of signi!cant sedimentation within theDelaware Basin region (Hill, 1996).
Late Cretaceous-to-early Paleogene compressionassociated with the Laramide Orogeny induced stratal
tilting of 3 to 5° to the east/northeast and uplifted theDel-aware Basin region above sea level (Dickenson, 1980).Paleogene igneous activity, including dike emplace-ment, associated with the Trans-Pecos magmatic prov-ince elevated the regional geothermal gradient, butlikely did not induce signi!cant regional deformation(Hentz and Henry, 1989). Most regional brittle deforma-tion is likely associated with Basin and Range extensionin the early Neogene (Hentz and Henry, 1989), whichmanifests in the Gypsum Plain as conjugate joint/faultsets oriented at ~N75°E and ~N15°W (Nance, 1993).Since the Neogene, the region has remained tectonicallystable. Throughout the Cenozoic, the Pecos River hasmoved from west to east, creating a slowly migratingpotentiometric low that has continued to in"uencegroundwater "ow patterns within the Delaware Basin(Stafford and others, 2009).
In the Quaternary, weathering and surface denudationdominated the geomorphic evolution of the GypsumPlain. Glacial/interglacial periods induced climate "uc-tuations that increased/decreased erosion rates, respec-tively (Hill, 1996). The results of climate shift fromwet, temperate regimes of the Pleistocene to the dry,arid environment of today dominate the current land-scape (Bachman, 1980). Modern rates of weathering,and sur!cial karst development, are considerably lowtoday with reported average surface denudation ratesof 30 cm/kyr for theGypsumPlain (Stafford, 2013). Cur-rently, the Castile Formation thins to a solutional marginon the western edge of the Gypsum Plain, but reaches amaximum thickness of 480 m in the subsurface of theeastern Delaware Basin (Kelley, 1971).
EVAPORITE KARST MANIFESTATIONS
Castile evaporite karst manifestations within the Gyp-sumPlain are diverse andwidespread. Original estimates
Figure 2. Simpli!ed stratigraphic section from the Northwestern Shelf to the Delaware Basin showing the generalrelationship between Guadalupian and Ochoan units. Note that units of interest are color-coded tomatch outcropsshown in Figure 1 (modi!ed from Scholle and others, 2004).
Speleogenetic Evolution of Castile Karst Manifesta-tions 153

by Stafford and others (2008c) suggested that approxi-mately 10,000 gypsum karst features existed withinthe region. More recent studies indicate that this is likelya signi!cant underestimate of total karst development(Ehrhart and Stafford, 2021), without consideration ofdeeper karst phenomena that occur within subsurfaceCastile evaporites east and downdip of the GypsumPlain. Karst development can be subdivided into generalclasses of hypogene and epigene within the GypsumPlain as detailed below; however, there is signi!cantoverprinting of multiple phases of speleogenesis thatoccurs within these systems. The Pecos River has pro-vided a slowly migrating potentiometric low for thelast 60 million years to fuel upward "ow of con!nedto semicon!ned "uids. It appears probable that muchof the hypogene development is at least partially coupledto the eastern migration of the Pecos River across theDelaware Basin since the early Paleogene (Staffordand others, 2009).
Castile Hypogene Karst Manifestations
Hypogene karst development within the Castile For-mation includes hypogene caves and solution-widenedfractures, brecciation, and diagenetic alternation ofhost rock. Hypogene karst development has been docu-mentedmost extensively along thewesternmargin of theGypsum Plain (Stafford and others, 2018) where surfacedenudation has signi!cantly thinned the Castile Forma-tion and placed the underlying contact with the BellCanyon in close proximity with the land surface. How-ever, Castile hypogene karst development has beendocumented throughout the entire Delaware Basin asevidenced by subsidence features (Fig. 1) and void inter-ception proximal to the underlying Bell Canyon contactduring drilling activities.
Intrastratal dissolution coupled with subsequent col-lapse is the most common and widespread evidence ofhypogene karst within the Gypsum Plain. Fluids origi-nating from the underlying Bell Canyon Formationhave induced hypogene void development at the baseof the Castile Formation. In many instances, these voidsare suf!ciently large that overlying strata cannot be sup-ported and thus collapse occurs enabling ascending"uids to migrate through collapse zones vertically. Theresulting breccia pipes are commonly hundreds ofmetersin diameter and vertical depth (Kirkland and Evans,1976). While brecciated zones and breccia pipes arecommon in the Gypsum Plain, these features have alsobeen documented throughout the Delaware Basin wherethey extend vertically through the overlying Salado andRustler formations (Anderson and others, 1978). Manytopographic highs within the GypsumPlain are the resultof differential weathering of breccia pipes (Fig. 3A).Commonly, these breccia pipes preserve remnants ofPermian strata of the Rustler and Dewey Lake
formations as well as Cretaceous Cox strata whichwere piped downward into upward stoping collapsestructures (Shields, 2018). In addition, brecciated Castilestrata (Fig. 3B) commonly form resistant highs, as sec-ondary sulfate and calcite cements have reduced localpermeability within these structures.
Similar to breccia pipes, blanket breccias and solutionsubsidence troughs within the Gypsum Plain attest to in-trastratal dissolution along planar surfaces, most com-monly associated with the solution of Castile haliteinterbeds (Anderson and Kirkland, 1980). Blanket brec-cias are commonly limited to a few decimeters in thick-ness, but may extend laterally over hundreds of meters,whereas solution subsidence troughs manifest as steep-walled valleys that geomorphically present as solutiongrabens. Blanket breccias commonly extend laterallyto breccia pipes and attest to the lateral migration ofascending "uids along more soluble zones (Staffordand others, 2008b). All documented manifestations ofintrastratal brecciation within the Gypsum Plain increasesigni!cantly in abundance westward across the Castileoutcrop area, indicating that intrastratal dissolution ismost intense proximal to the underlying Bell Canyoncontact. However, evidence of intrastratal brecciationis found throughout the entire region indicating thatthe process is widespread and likely continues to occurtoday in the subsurface east of the Gypsum Plain.
Hypogene caves have been most abundantly docu-mented throughout the western Gypsum Plain (Ehrhartand Stafford, 2021), with most caves formed as singleor simple riser structures that exhibit variable degreesof epigene overprinting as a result of surface denudationinduced breaching. Crystal Cave and the nearby GazelleCave (Fig. 3E) are typical examples of this single risermorphology: Crystal and Gazelle caves have surveyeddepths of 93 m and 60 m, respectively, and consistlargely of single passages with multiple dome pits thatexhibit the classic suite of hypogene morphological fea-tures identi!ed by Klimchouk (2007). Cave explorationterminates at the current water table in Crystal Cave andin breakdown in Gazelle Cave (Stafford and others,2008a). Similar, single-riser caves have been docu-mented throughout the Gypsum Plain including suchfeatures as Fissure Cave (Fig. 3F) and Wiggley Cavediscussed elsewhere in this publication (Ehrhart andStafford, 2021). Isolated, vuglike caves have been docu-mented in rare instances within the Gypsum Plain thatattest to localized hypogene dissolution in poorly frac-tured sulfates.
Locally, complex hypogene maze caves have alsobeen documented within the Gypsum Plain, includingfeatures, such as Dead Bunny Hole (Stafford and others,2008a) and Black Dog Cave (Shields, 2018). Thesedo not generally manifest as the classic rectilinear,hypogene maze caves seen elsewhere in the world
154 Kevin W. Stafford and Jessica Shields
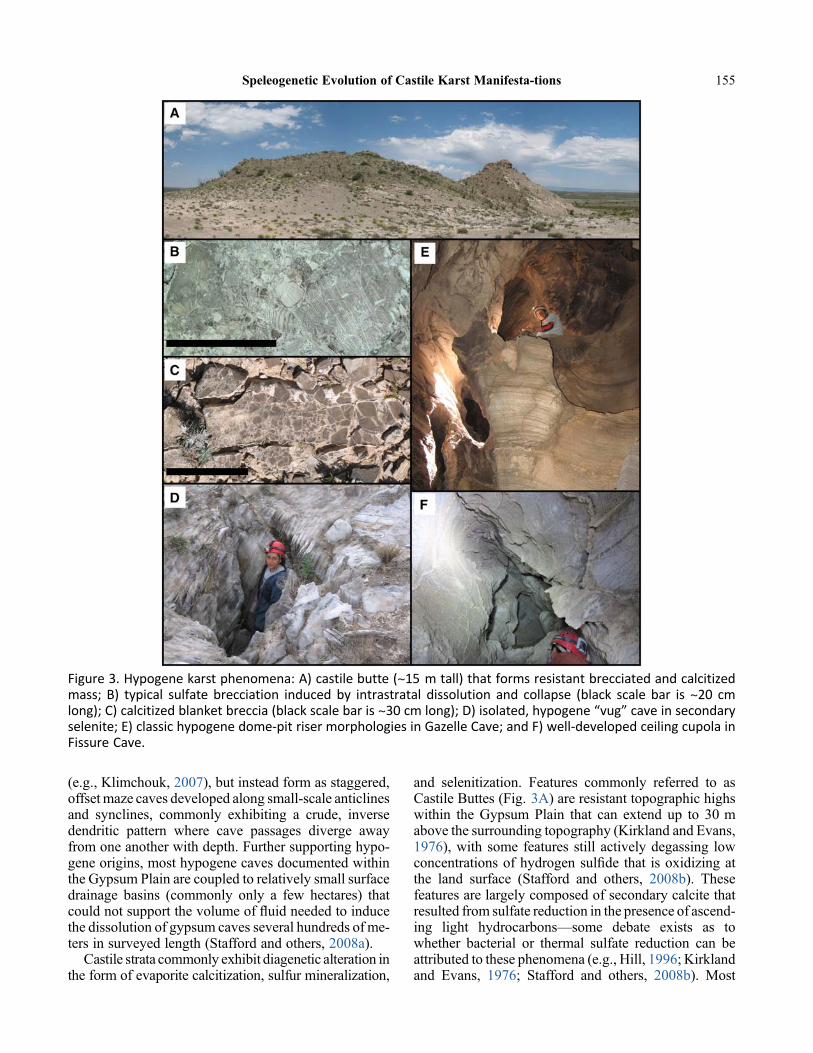
(e.g., Klimchouk, 2007), but instead form as staggered,offset maze caves developed along small-scale anticlinesand synclines, commonly exhibiting a crude, inversedendritic pattern where cave passages diverge awayfrom one another with depth. Further supporting hypo-gene origins, most hypogene caves documented withinthe Gypsum Plain are coupled to relatively small surfacedrainage basins (commonly only a few hectares) thatcould not support the volume of "uid needed to inducethe dissolution of gypsum caves several hundreds of me-ters in surveyed length (Stafford and others, 2008a).
Castile strata commonly exhibit diagenetic alteration inthe form of evaporite calcitization, sulfur mineralization,
and selenitization. Features commonly referred to asCastile Buttes (Fig. 3A) are resistant topographic highswithin the Gypsum Plain that can extend up to 30 mabove the surrounding topography (Kirkland and Evans,1976), with some features still actively degassing lowconcentrations of hydrogen sul!de that is oxidizing atthe land surface (Stafford and others, 2008b). Thesefeatures are largely composed of secondary calcite thatresulted from sulfate reduction in the presence of ascend-ing light hydrocarbons—some debate exists as towhether bacterial or thermal sulfate reduction can beattributed to these phenomena (e.g., Hill, 1996; Kirklandand Evans, 1976; Stafford and others, 2008b). Most
Figure 3. Hypogene karst phenomena: A) castile butte (~15 m tall) that forms resistant brecciated and calcitizedmass; B) typical sulfate brecciation induced by intrastratal dissolution and collapse (black scale bar is ~20 cmlong); C) calcitized blanket breccia (black scale bar is ~30 cm long); D) isolated, hypogene “vug” cave in secondaryselenite; E) classic hypogene dome-pit riser morphologies in Gazelle Cave; and F) well-developed ceiling cupola inFissure Cave.
Speleogenetic Evolution of Castile Karst Manifesta-tions 155
commonly, sulfate calcitization is observed proximal tothe underlying Bell Canyon Formation contact wheremineral alteration occurs with little disturbance to origi-nal depositional structure; however, calcitization is mostcommonly found associated with zones of brecciationwhere breccia pipes and blanket breccias (Fig. 3C)are partially to completely calcitized (Stafford andothers, 2008b).
Outcrop and shallow subcrop occurrences of calciti-zation are commonly coupled with globular, lenticular,and/or linear occurrences of massive selenite (Staffordand others, 2008b). Subsurface calcitized masses aregenerally associated with sulfur ore deposits whichhave been economically mined in the past (Hentz andHenry, 1989). During evaporite calcitization, whichwas fueled by ascending light hydrocarbons from theunderlying Bell Canyon Formation, anoxic conditionsresulted in the emplacement of native sulfur in and prox-imal to the alteration zone. As subsequent surface denu-dation proceeded, oxic, meteoric water invaded thesubsurface enabling oxidation of sulfur bodies into sec-ondary selenite masses (Fig. 3D). It is probable that theprocess of selenitization is both a hypogene and epigeneprocess where some meteoric water is delivered down-ward along preferential "ow paths, whereas other oxicwaters ascend from the underlying Bell Canyon Forma-tion as a result of proximal groundwater recharge asso-ciated with the Delaware Mountains east of the GypsumPlain. The oxidation of native sulfur to form selenite hasbeen supported by isotope analyses and rare, isolatedcrystals of native sulfur preserved within selenite masses(Stafford and others, 2008b).
It has long been assumed that hypogene processes arestill active in the Delaware Basin (e.g., Hill, 1996; Staf-ford and others, 2008a), but that the active sites of hypo-gene dissolution are occurring east of the Gypsum Plainwhere Castile strata are more deeply buried and isolatedfrom surface processes. This has been supported by thedevelopment of large subsidence troughs (Fig. 1) !lledwith thick Quaternary sediments proximal to the currentlocation of the PecosRiver (Stafford and others, 2009) aswell as the increased occurrence of native sulfur withincalcitized masses beneath sur!cial exposures of RustlerStrata as compared to the dominance of selenite associ-ated with calcitized masses within the Gypsum Plain(Hentz and Henry, 1989).
Recently, Stafford and others (2018) have identi!edthat hypogene processes are still active as uncon!nedmanifestationswithin thewestern portion of theGypsumPlain as two general variants: solution-widened !ssuresand brecciated zones with dissolution enhanced by con-densation corrosion and artesian discharge features. Fis-sures and high permeability zones within breccia pipescommonly exhibit localized ridges and domal structures(i.e., features reminiscent of tumuli but morphologically
distinct) at the land surface that are composed of porous,secondary gypsite precipitates. These ridges preventoverland "ow from actively migrating into these highpermeability features. Instead, these features act as vent-ing structures formoisture-laden convective "ow towardthe land surface, which induces solution widening anddeposits secondary gypsum at the land surface becauseof high evaporation rates in the arid environment (Staf-ford and others, 2018).
Stafford and others (2018) also documented that dur-ing decadal-scale anomalous precipitation events,groundwater levels can rise to suf!cient height to createartesian conditions in the western Gypsum Plain. Allo-genic recharge from the Delaware Mountains into theunderlying Bell Canyon siliciclastics results in the reac-tivation of relict hypogene karst features; thus, hypogenecaves that had been breached by surface denudationand exhibit variable degrees of epigene overprintingact as ephemeral artesian springs. In addition, proximalto the Delaware River, the elevated hydraulic gradientcontinues to induce intrastratal dissolution by artesianwaters during these anomalous periods of increasedgroundwater recharge. These regions exhibit differentialsettling and compaction after hydraulic gradients recede,attesting to buoyant lift and dissolution by artesian "uids(Stafford and others, 2018).
Castile Epigene Karst Manifestations
Epigene karst development within the Gypsum Plainoccurs as sur!cial weathering, solutional cave develop-ment, and solution-enhanced suffosion features. Inaddition, most hypogene karst manifestations exhibitsome degree of epigene overprinting, inevitable, becausehypogene features that can be physically investigatedmust be exposed and/or breached by surface denudation.Gypsic soils ranging from less than a decimeter to morethan 10-m-thick mantle the vast majority of the GypsumPlain, with exposedCastile bedrock comprising less than8% of the total surface area (Stafford, 2013). Much ofthis thick soil mantling obscures the extent of karstdevelopment and is the result of the climatic shift fromhumid, temperate conditions of the Pleistocene to thedry, arid climate of today (Hill, 1996).
The dominant geomorphic features of the GypsumPlain are sinkholes (Fig. 4A), which manifest as:1) deeply incised, arroyolike, solutional sinkholes;2) near-vertical, collapse sinkholes; and 3) shallow,barely perceptible surface depressions. Stafford andothers (2008c) noted that 55% of the sinkholes withintheGypsumPlain are the result of collapse into solutionalvoids (commonly hypogene caves) and 45% of the sink-holes are formed by solutional processes associatedwith overland "ow. Therefore, it is probable that approx-imately half of the sinkhole manifestations documentedwithin the Gypsum Plain are coupled with sur!cial
156 Kevin W. Stafford and Jessica Shields

breaching of hypogene caves, whereas the other half areassociated with focused, meteoric recharge. Recentgeophysical studies using resistivity analyses in theGyp-sum Plain have indicated that far more sinkholes existwithin the Gypsum Plain than previous recognized,but that many of these features have been completely in-!lled with gypsic soil and show no (or minimal) surfaceexpression. These sinkholes are sites of increasedgroundwater in!ltration and pose signi!cant geohazardrisk because of differential compaction (Stafford andothers, 2017; Woodard and others, 2021).
At the interface between gypsic soils and underlyingbedrock, hummocky solution surfaces are common withabundant macroconduits that rarely coalesce to produce
organized "ow. These soil/bedrock interfaces are similarto rundkarren in carbonate terrains, but are more subduedwithin the Gypsum Plain (Fig. 4B). In well-fractured bed-rock, solutional-widening is common, which createsfeatures reminiscent of grikes that extend from bedrockinto overlying indurated soils, commonly creating verticalpiping structures. On exposed bedrock, various karrenmorphologies are common, with spitzkarren, rillenkarren,and kaminitizas generally dominating—these karrenforms also commonly develop on highly indurated gyp-site. Locally, gypsum tumuli (Fig. 4E) occur in clustersof !ve-to-ten features within an area of several squaremeters—the largest tumuli documented are less than150 cm in diameter and 40 cm tall (Stafford, 2013).
Figure 4. Epigene karst phenomena: A) elliptical sinkhole developing in thick gypsic soils (note person for scale on farside of sinkhole); B) irregular, hummocky surface between castile bedrock and variably thick gypsic soils; C) typical,epigene vadose cave passage; D) large-diameter, epigene phreatic cave passage; E) typical gypsum tumuli (note rockhammer for scale at center of picture); and F) large soil chamber within solution–suffosion cave.
Speleogenetic Evolution of Castile Karst Manifesta-tions 157

Purely epigene caves, not including hypogene cavesmodi!ed by epigene processes, tend to be relativelysmall and linear. Most epigene caves are coupled witha relatively large solutional sinkhole and associateddrainage area and exhibit vadose morphologies. Thesevadose epigene caves are generally less than a fewtens ofmeters in length at widths large enough for humanentry (Fig. 4C). They are generally developed along asingle fracture plane to create a near-linear cave orthey are developed along a series of conjugate fractureswith sharp, angular passage junctions (Stafford andothers, 2008a). Vadose epigene caves abruptly decreasein average height and width away from the insurgenceand commonly contain abundant organic debris coatingall wall surfaces with centimeter-scale scallops, suggest-ing that most of these features recharge large volumes ofhigh velocity water during monsoonal storms. Epigenevadose caves tend to be widely spread across the Gyp-sum Plain and do not exhibit the clustering of featurescommonly observed with hypogene karst developmentin the region. Classic examples of vadose epigene caveswithin the Gypsum Plain include Dead East and Zombiecaves as described by Stafford and others (2008a) andNikad Cave and JC Gypsum Hole described by Ehrhartand Stafford (2021).
Epigene phreatic caves are much less common in theGypsum Plain, but have been documented in close prox-imity to theDelawareRiverwhere it appears that shallowperched aquifer zones exist which are decoupled fromdeeper groundwater "ow paths. These caves tend toform elliptical passages (Fig. 4D) that are commonlycoated with thick mud deposits which likely armorbedrock from dissolution and enable meteoric watersto traverse greater distance before becoming saturated(Ehrhart and Stafford, 2021). Most phreatic caves aresubhorizontal with gentle dips away from insurgences—all thus far documented eventually sump, but nearbysprings (within a few hundred meters) in incised arroyosare likely connected to these localized shallow aquifersystems. Most of these phreatic caves contain troglobiticfauna, including observed but undocumented cray!shand amphipods, indicating that these are not ephemeralphreatic features but instead are persistent, water-!lledconduits. Examples of phreatic gypsum caves includeBrantley Stream Cave (Stafford and others, 2008a)and Death Tube Cave (Ehrhart and Stafford, 2021).
While originally considered relatively insigni!cant,suffusion caves within the indurated gypsum are nowrecognized as a signi!cant component of the GypsumPlain karst system and appear to be common and wide-spread. Unlike true suffusion caves, these “pipingstructures” in the Gypsum Plain are formed through acombination of dissolution and piping of insoluble resi-due within indurated gypsic soils (Morris and other,2021). Suffosion caves are generally small, elliptical,
subhorizontal caves that connect to epigene or hypogenecaveswhere insoluble fractions that aremobilized can betransported—gypsic soils in the region commonly con-tainmore than 70% soluble gypsum content. Commonly,these soil caves exhibit intermittent collapse and arecommonly related to shallow catastrophic failures dueto the inability of indurated soils to structurally supportvoids. Recent work in the Gypsum Plain (e.g., Ehrhartand Stafford, 2021; Morris and others, 2021; Staffordand others, 2017) has identi!ed numerous examples ofthese solution–suffosion caves with some extendingtens of meters in length that include isolated soil cham-bers several meters in diameter and height (Fig. 4F).Examples of these soil caves include the upper passagesof Death Tube Cave (Ehrhart and Stafford, 2021),Quill Soil Cave (Shields, 2018), and Mousey Hole(Ehrhart, 2016).
SPELEOGENETIC EVOLUTION OF THEGYPSUM PLAIN
The speleogenetic evolution of the Castile Formationis a long and complex series of processes resulting frommultiple phases of overprinting and the general eastwardmigration of processes as surface denudation erodes theupdip margin of the Delaware Basin. After Permiandeposition, there is no signi!cant evidence to suggestthat Castile strata were exposed to hypogene or epigenekarst processes until the Cenozoic; however, postdepo-sitional diagenetic alterations would have included, ata minimum, dehydration of gypsum to anhydrite. Thisdehydration would have induced localized buckling,endokinetic !ssuring, and sulfate fabric alteration(Dean and others, 1975). Minor solutional porositywithin the Castile Formation may have existed early inthe diagenetic history because of dewatering duringanhydrite conversion. Some researchers have suggestedthat during the Triassic, upper Ochoan strata wereexposed to subaerial weathering as evidenced by theunconformable contact between the Dewy Lake Forma-tion and overlying Triassic deposits (Hill, 1996), butthere is no evidence that Castile strata were subjectedto the near-surface processes at this time, but insteadwere isolated in a general sag across the entire PermianBasin (Hill, 1996). Throughout the Mesozoic, Castileand overlying Salado strata were likely stable and exhib-ited little alteration beyond localized phenomena associ-ated with burial compaction and mineral dehydration.
In the late Cretaceous to early Paleogene, Laramidecompression and crustal shortening elevated "uid pres-sures within the Delaware Basin and uplifted the regionbeyond the Stable Platform Phase that introduced minorCretaceous deposition across the Permian Basin (Keith,1982). By the late Paleogene (Fig. 5A), the region hadbeen uplifted approximately 1600 m (Hill, 1996) andthe ancestral Pecos River was beginning to migrate
158 Kevin W. Stafford and Jessica Shields

eastward from the western margin of the buried Dela-ware Basin (Stafford and others, 2009; Thomas,1972). Near the end of the Paleogene, Laramide com-pression shifted to Basin and Range extension, whichinduced gentle regional tilting of the Delaware Basin
toward the east, accompanied by elevated geothermalgradients and igneous dyke emplacement in associationwith Trans-Pecos volcanism (Ernst, 2014; Hentz andHenry, 1989). Although published information is notavailable in regards to historical hydrocarbonmaturation
Figure 5. Conceptual model of speleogenetic evolution of Castile evaporite karst: A) Late Paleogene regional upliftprior to initiation of major karst development; B) Early Neogene initiation of hypogene karst associated withregional tilting, elevated thermal gradients and updip migration of basinal "uids; C) Middle Neogene signi!cantuplift and exposure of updip margins of Ochoan strata with regional geothermal maxima accelerating hypogenekarst development; D) Late Neogene development of the Salt Flat Graben exposes Bell Canyon strata, increasinggroundwater recharge that promotes artesian hypogene karst, whereas the development of the Gypsum Plain in-troduces epigene karst processes to Castile strata; and E) Pleistocene glacial/interglacial periods promote eastwardmigration of Gypsum Plain and hypogene karst development.
Speleogenetic Evolution of Castile Karst Manifesta-tions 159

and geothermal gradients, it is probable that this latePaleogene volcanic phase was the catalyst for initiatinghydrocarbon maturation in pre-Ochoan strata of theDelaware Basin.
In the Early Neogene (Fig. 5B), hypogene dissolutionlikely initiated at the lower contact with the Bell CanyonFormation as Laramide-induced, elevated"uid pressuresmigrated updip along the actively uplifting western mar-gin of the Delaware Basin (Hill, 1996). By the MiddleNeogene (Fig. 5C), because of uplift (~2000 m at thistime) and tilting as a result of Basin and Range deforma-tion, updip portions of Ochoan sequences were exposed(DuChene and Cunningham, 2006). Exposure at thistime would have reduced con!nement pressures ofOchoan strata, whereas transient heating associatedwith Basin and Range extension likely reached its maxi-mum (Kirkland, 2014). Therefore, it is probable thatupward migration of light hydrocarbons into the CastileFormation began fueling evaporite calcitization and sul-fur ore emplacement in the Middle Neogene (Hentz andHenry, 1989), primarily along advancing brecciatedzones. By the Late Neogene (Fig. 5D), hypogene karst,including intrastratal dissolution of halite interbeds anddevelopment of breccia pipes, blanket breccias, andhypogene caves, was already well-developed in thewestern Delaware Basin, with brine density convectionwithin brecciated zones accelerating hypogene dissolu-tion (Anderson and Kirkland, 1980; Kirkland, 2014).
Evidence for signi!cant regional hypogene karstdevelopment in the Late Neogene is supported byresearch conducted in the carbonate caves of the Guada-lupe Mountains (Kirkland, 2014; Polyak and others,1989). It is probable that hypogene development withinthe Castile Formation also accelerated at this timebecause of the same tectonic and geothermal regimes,the two regions, were exposed to. In the GuadalupeMountains, researchers have shown that signi!cant epi-sodes of increased cave enlargement occurred during thelate Miocene to early Pliocene, coupled with elevatedgeothermal gradients and Rio Grande rifting (Polyakand others, 1998; Polyak and Provencio, 2000).
By the end of the Late Neogene, the Salt Flat Grabenformed as the most eastern extent of Basin and RangeDeformation, which left pre-Ochoan siliciclasticsexposed in the Delaware Mountains (Duchene and Cun-ningham, 2006). The DelawareMountains subsequentlybecame recharge loci for Delaware Mountain Groupstrata, including theBell Canyon Formation, introducingthe migration of oxic waters down-dip, beneath Castilestrata (Kirkland and Evans, 1976; Lindsey, 1998).Recharge created artesian conditions to promote moreintense hypogene karsting along the western margin ofthe developing Gypsum Plain and provided oxic watersto covert sulfur ore bodies into selenite in the updipregions of Castile strata (Stafford and others, 2008b).
By the end of the Neogene, the Gypsum Plain had devel-oped, although further west than its current position, andepigene karst development began in sur!cially exposedCastile evaporites. It is probable that at this time, some ofthe larger breccia pipes were becoming resistant topo-graphic highs, having incorporated collapse materialfrom upper Ochoan and Cretaceous material withinthe breccia pipe cores (Shields, 2018).
Throughout the Pleistocene (Fig. 5E), surface denu-dation dominated the evolving Gypsum Plain as itmigrated eastward, whereas hypogene karst was contin-uously fed by a combination of ascending, anoxicbasinal "uids and descending oxic meteoric "uids re-charged through the updip exposure of the Bell CanyonFormation. Karst development through the Pleistocenewas episodic, with increased solutional intensity duringglacial periods and decreased solution intensity duringinterglacials (Harris, 1985; Bachman, 1984). The major-ity of epigene caves observed today were likely formedat this time. Similarly, breaching and epigene overprint-ing of documented hypogene caves likely occurred dur-ing the Pleistocene (Shields, 2018), with hypogenefeatures becoming ephemeral artesian springs duringwet glacial periods that promoted the development ofmany of the large arroyos in the region today.
The shift from wet, temperate climate of the Pleisto-cene to dry, arid climate of theHolocenemarked the tran-sition to the modern geomorphic system that wecurrently recognize as the Gypsum Plain (Hill, 1996).This shift resulted in widespread formation of gypsicsoils and in!lling of many sinkholes that would havebeen active karst interface features in the Pleistocene.While solution rates are likely much lower today thanduring the Pleistocene, karst processes are still active(Stafford, 2013). Active recharge during monsoonalevents continues to modify epigene caves and surfacekarren. Light hydrocarbons still ascend and byproductsof calcitization which can be observed degassing fromsome calcitized regions (Stafford and others, 2008b).Hypogene caves are still forming in response to thepotentiometric low of major "uvial bodies, primarilythe Pecos River (Stafford and others, 2009). Other areasshow continued hypogene development associated withanomalous episodes of high precipitation that induceephemeral artesian conditions on the western marginof the Gypsum Plain (Stafford and others, 2018).
Currently, the Gypsum Plain appears to be in a state ofmild disequilibrium where many karst features wereplugged by heavy sedimentation and soil developmentduring the Pleistocene–Holocene climate shift (Morris,2018). Solution–suffosion features demonstrate wellthe current reactivation of karst features that have likelybeen inactive for many millennia. Effectively, currentkarst development within the Gypsum Plain re"ectsthe perpetual eastward migration of the western
160 Kevin W. Stafford and Jessica Shields
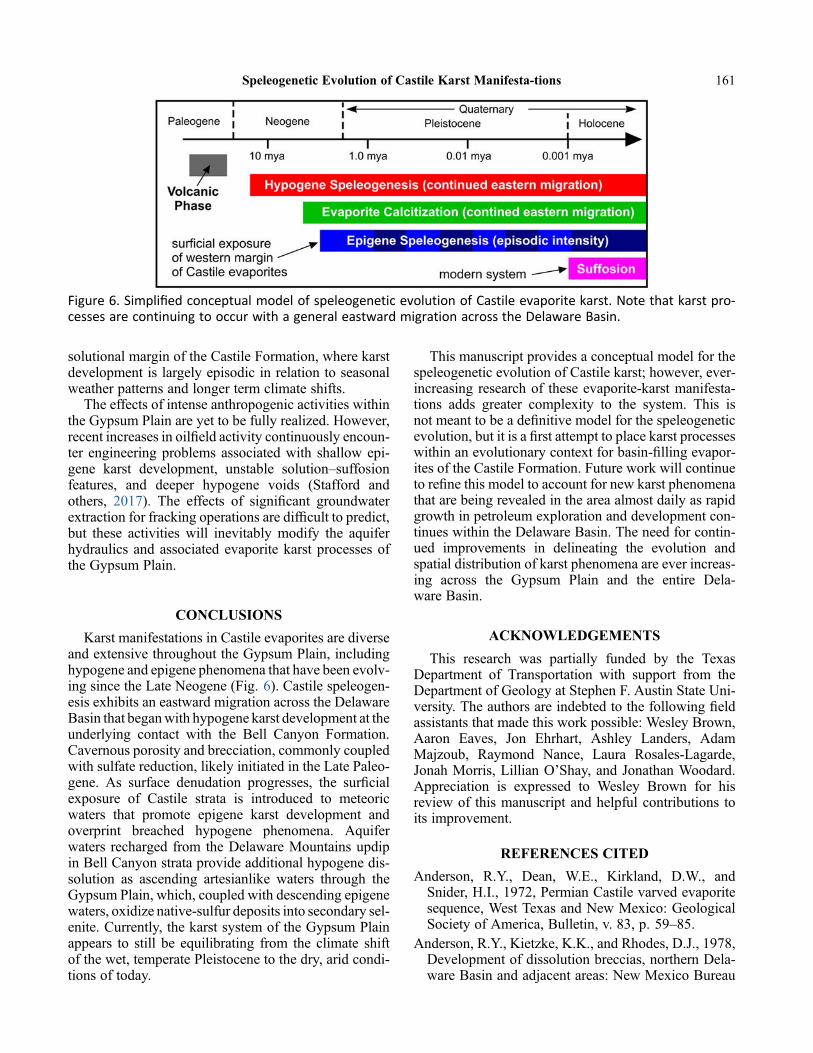
solutional margin of the Castile Formation, where karstdevelopment is largely episodic in relation to seasonalweather patterns and longer term climate shifts.
The effects of intense anthropogenic activities withinthe Gypsum Plain are yet to be fully realized. However,recent increases in oil!eld activity continuously encoun-ter engineering problems associated with shallow epi-gene karst development, unstable solution–suffosionfeatures, and deeper hypogene voids (Stafford andothers, 2017). The effects of signi!cant groundwaterextraction for fracking operations are dif!cult to predict,but these activities will inevitably modify the aquiferhydraulics and associated evaporite karst processes ofthe Gypsum Plain.
CONCLUSIONS
Karst manifestations in Castile evaporites are diverseand extensive throughout the Gypsum Plain, includinghypogene and epigene phenomena that have been evolv-ing since the Late Neogene (Fig. 6). Castile speleogen-esis exhibits an eastward migration across the DelawareBasin that beganwith hypogene karst development at theunderlying contact with the Bell Canyon Formation.Cavernous porosity and brecciation, commonly coupledwith sulfate reduction, likely initiated in the Late Paleo-gene. As surface denudation progresses, the sur!cialexposure of Castile strata is introduced to meteoricwaters that promote epigene karst development andoverprint breached hypogene phenomena. Aquiferwaters recharged from the Delaware Mountains updipin Bell Canyon strata provide additional hypogene dis-solution as ascending artesianlike waters through theGypsum Plain, which, coupled with descending epigenewaters, oxidize native-sulfur deposits into secondary sel-enite. Currently, the karst system of the Gypsum Plainappears to still be equilibrating from the climate shiftof the wet, temperate Pleistocene to the dry, arid condi-tions of today.
This manuscript provides a conceptual model for thespeleogenetic evolution of Castile karst; however, ever-increasing research of these evaporite-karst manifesta-tions adds greater complexity to the system. This isnot meant to be a de!nitive model for the speleogeneticevolution, but it is a !rst attempt to place karst processeswithin an evolutionary context for basin-!lling evapor-ites of the Castile Formation. Future work will continueto re!ne this model to account for new karst phenomenathat are being revealed in the area almost daily as rapidgrowth in petroleum exploration and development con-tinues within the Delaware Basin. The need for contin-ued improvements in delineating the evolution andspatial distribution of karst phenomena are ever increas-ing across the Gypsum Plain and the entire Dela-ware Basin.
ACKNOWLEDGEMENTS
This research was partially funded by the TexasDepartment of Transportation with support from theDepartment of Geology at Stephen F. Austin State Uni-versity. The authors are indebted to the following !eldassistants that made this work possible: Wesley Brown,Aaron Eaves, Jon Ehrhart, Ashley Landers, AdamMajzoub, Raymond Nance, Laura Rosales-Lagarde,Jonah Morris, Lillian O’Shay, and Jonathan Woodard.Appreciation is expressed to Wesley Brown for hisreview of this manuscript and helpful contributions toits improvement.
REFERENCES CITED
Anderson, R.Y., Dean, W.E., Kirkland, D.W., andSnider, H.I., 1972, Permian Castile varved evaporitesequence, West Texas and New Mexico: GeologicalSociety of America, Bulletin, v. 83, p. 59–85.
Anderson, R.Y., Kietzke, K.K., and Rhodes, D.J., 1978,Development of dissolution breccias, northern Dela-ware Basin and adjacent areas: New Mexico Bureau
Figure 6. Simpli!ed conceptual model of speleogenetic evolution of Castile evaporite karst. Note that karst pro-cesses are continuing to occur with a general eastward migration across the Delaware Basin.
Speleogenetic Evolution of Castile Karst Manifesta-tions 161

of Mines and Mineral Resources, Bulletin 159,Socorro, NM, p. 47–52.
Anderson, R.Y., and Kirkland, D W., 1966, Intrabasinvarve correlation: Geological Society of America,Bulletin, v. 77, p. 241–256.
Anderson, R.Y., and Kirkland, D.W., 1980, Dissolutionof salt deposits by brine density "ow: Geology, v. 8,p. 66–69.
Bachman, G.O., 1980, Regional geology and Cenozoichistory of the Pecos Region, southeastern NewMexico: US Geological Survey, Open File Report80-1099, 117 p.
Dean, W.E., Davies, G.R., and Anderson, R.Y., 1975,Sedimentological signi!cance of nodular and lami-nated anhydrite: Geology, v. 3, p. 367–372.
Dickenson, W.R., 1981, Plate tectonic evolution of thesouthern Cordillera: Arizona Geological Society,Digest, v. 14, p. 113–135.
DuChene, H.R., and Cunningham, K.I., 2006, Tectonicin"uences on speleogenesis in the Guadalupe Moun-tains, New Mexico and Texas, in Land, L., Lueth,V.W., Raatz, W., Boston, P., and Love, D.L., eds.,Caves and karst of southeastern New Mexico:New Mexico Geological Society, Annual FieldConference, p. 211–218.
Ehrhart, J., 2016, Speleogenesis and delineation of meg-aporosity and karst geohazards through geologic cavemapping and LiDAR analyses associated with infra-structure in Culberson County, Texas: unpublishedMS thesis, Stephen F. Austin State University, 159 p.
Ehrhart, J.T., and Stafford, K.W., 2021, Speleogeneticmodel of evaporite occurrences of the Gypsum Plainutilizing karst mapping and LiDAR analyses in Cul-berson County, Texas, USA, in Johnson, K.S.,Land, L., and Decker, D.D., eds., Evaporite karst inthe Greater Permian Evaporite Basin (GPEB) ofTexas, New Mexico, Oklahoma, Kansas, and Colo-rado: Oklahoma Geological Survey, Circular 113.
Ernst, R.E., 2014, Large igneous provinces: CambridgeUniversity Press, 653 p.
Harris, A.H., 1985, Late Pleistocene vertebrate paleo-ecology of the west: University of Texas Press, 293 p.
Hentz, T.F., and Henry, C.D., 1989, Evaporite-hostednative sulfur in Trans-Pecos Texas: relation to latephase Basin and Range deformation: Geology,v. 17, p. 400–403.
Hill, C.A., 1996, Geology of the Delaware Basin, Gua-dalupe, Apache and Glass Mountains: New Mexicoand west Texas: Midland, Permian Basin Section ofthe SEPM, 480 p.
Keith, S.B., 1982, Paleoconvergence rates determinedfrom K2O/SiO2 ratios in magmatic rocks and their
application to Cretaceous and tertiary tectonic patternsin southwesternNorthAmerica: Geological Society ofAmerica, Bulletin, v. 93, p. 524–532.
Kelley,V.C., 1971,Geology of the PecosCountry, south-eastern New Mexico: New Mexico Bureau of Minesand Mineral Resources, Memoir 24, 78 p.
Kirkland, D.W., 2014, Role of hydrogen sul!de in theformation of cave and karst phenomena in the Guada-lupe Mountains and western Delaware Basin,New Mexico and Texas: National Cave and KarstResearch Institute, Special Paper 2, 77 p.
Kirkland, D.W., and Evans, R., 1976, Origin of lime-stone buttes, GypsumPlain, CulbersonCounty, Texas:American Association of Petroleum Geologists, Bul-letin, v. 60, p. 2005–2018.
Klimchouk, A., 2007, Hypogene speleogenesis: hydro-geological and morphometric perspective: NationalCave and Karst Research Institute, Carlsbad, NM,Special Paper No. 1, 106 p.
Lindsey, R.F., 1998, Meteoric recharge, displacement ofoil columns and the development of residual oil inter-vals in the Permian Basin, inDeMis, W.D., and Nelis,M.K., eds., The search continues into the 21st century:West Texas Geological Society, p. 271–273
Majzoub, A., Stafford, K.W., Brown,W.A., and Ehrhart,J.T., 2017, Characterization and delineation of gyp-sum karst geohazards using 2-D electrical tomogra-phy, Culberson County, Texas, USA: Journal ofEnvironmental and Engineering Geophysics, v. 22,n. 4, p. 441–420.
Morris, J., 2018, Physical and chemical controls on suf-fosion development in gypsic soil, Culberson County,Texas: unpublishedMS thesis, Stephen F. Austin StateUniversity, 60 p.
Morris, J., Stafford, K., and Farrish, K., 2021, Physicaland chemical controls on suffosion development ingypsic soil, west Texas, in Johnson, K.S., Land, L.,and Decker, D.D., eds., Evaporite karst in the GreaterPermian Evaporite Basin (GPEB) of Texas, NewMex-ico, Oklahoma, Kansas, and Colorado: OklahomaGeological Survey, Circular 113.
Nance, R., 1993, Application of the standard tabletmethod to a study of denudation in gypsumkarst, ChosaDraw, southeasternNewMexico: unpublishedMSThe-sis, University of Northern Colorado, Greely, CO, 82 p.
Polyak,V.J.,McIntosh,W.C., Guven,N., and Provencio,P., 1998, Age and origin of Carlsbad Caverns andrelated caves from 40Ar/39Ar of alunite: Science, v.249, p. 1919–1922.
Polyak, V., and Provencio, P.P., 2000, Summary of thetiming of sulfuric-acid speleogenesis for Guadalupecaves based on ages of alunite: Journal of Cave andKarst Studies, v. 62, n. 2, p. 72–74.
162 Kevin W. Stafford and Jessica Shields
Sares, S.W., 1984, Hydrologic and geomorphic devel-opment of a low relief evaporite karst drainage basin,southeastern New Mexico: unpublished MS Thesis,University of New Mexico, Albuquerque, NM,123 p.
Scholle, P.A., Goldstein, R.H., and Ulmer-Scholle, D.S.,2004, Classic upper Paleozoic reefs and bioherms ofwest Texas and New Mexico: Socorro, New MexicoInstitute of Mining and Technology: 166 p.
Shields, J., 2018, Speleogenetic evolution and geologicremote sensing of the Gypsum Plain, Eddy County,New Mexico: unpublished MS Thesis, Stephen F.Austin State University, 161 p.
Stafford, K.W., 2013, Evaporite karst and hydrogeologyof the Castile Formation: Culberson County, Texasand Eddy County, New Mexico, in Land, L., Doctor,D.H., and Stephenson, J.B., eds., Proceedings of the13th Multidisciplinary Conference on Sinkholes andthe Engineering and Environmental Impacts of Karst:National Cave and Karst Research Institute, Carlsbad,NM, Symposium 2, p. 123–131.
Stafford, K.W., Brown,W., Ehrhart, J.,Majzoub, A., andWoodard, J., 2017, Evaporite karst geohazards in theDelaware Basin, Texas: review of traditional karststudies coupled with geophysical and remote sensingcharacterization: International Journal of Speleology,v. 46, n. 2, p. 169–180.
Stafford, K.W., Ehrhart, J.T., Majzoub, A., Shields, J.,and Brown, W., 2018, Uncon!ned hypogene evapo-rite karst: west Texas and southeastern New Mexico,USA: International Journal of Speleology, v. 47, n. 3,p. 293–305.
Stafford, K.W., Land, L., Klimchouk, A, and Gary, M.,2009, The Pecos River hypogene speleogenetic prov-ince: a basin-scale karst paradigm for easternNew Mexico and west Texas, in Stafford, K.W.,Land, L., and Veni, G., eds., Advances in hypogenekarst studies: National Cave and Karst ResearchInstitute, Carlsbad, NM, Symposium 1, p. 121–135.
Stafford, K.W., Nance, R., Rosales-Lagarde, L., andBoston, P.J., 2008a, Epigene and hypogene karst man-ifestations of the Castile Formation: Eddy County,New Mexico and Culberson County, Texas, USA:International Journal of Speleology, v. 37, n. 2,p. 83–98.
Stafford, K.W., Rosales-Lagarde, L., and Boston, P.J.,2008c, Castile evaporite karst potential map of theGypsum Plain, Eddy County, New Mexico and Cul-bersonCounty, Texas: AGISmethodological compar-ison: Journal of Cave and Karst Studies, v. 70, n. 1,p. 35–46.
Stafford, K.W,Ulmer-Scholle, D., and Rosales-Lagarde,L., 2008b, Hypogene calcitization: evaporite diagen-esis in the western Delaware Basin: Carbonates andEvaporites, v. 23, n. 2, p. 89–103.
Woodard, J., Brown, W., and Stafford, K., 2021, Geo-physical delineation of megaporosity and "uid migra-tion pathways for geohazard characterization withinthe Delaware Basin, Culberson County, Texas, inJohnson,K.S., Land, L., andDecker, D.D., eds., Evap-orite karst in the Greater Permian Evaporite Basin(GPEB) of Texas, New Mexico, Oklahoma, Kansas,and Colorado: Oklahoma Geological Survey,Circular 113.
Speleogenetic Evolution of Castile Karst Manifesta-tions 163


ABSTRACT.—In the Gypsum Plain of southwestern New Mexico and westTexas, suffosion processes have encouraged road failure through dissolution andtransport in gypsic soils; however, no prior research has been conducted withinthe Delaware Basin in regard to these processes. These phenomena were evaluatedin both !eld and laboratory settings to assess the parameters of suffosion develop-ment associated with Ranch to Market (RM) 652 in Culberson County, Texas,where infrastructure extends across Castile and Rustler strata. Field studies simu-lated sur!cial ponding in various gypsic soils and correlated suffosion potentialwith soil composition and thickness. Soluble fractions of gypsic soils were delin-eated through geochemical analyses, further expanding upon the soil descriptionspublished in the Culberson County Soil Survey, a third-order soil survey (SoilSurvey Staff, 2013). Suffosion modeling replicated processes observed in the !eldthrough repeated in!ltration of Dellahunt and Elcor soils—soil piping and subsi-dence were induced within suffosion models. Lineaments inferred as solutionalfractures were delineated using color-infrared (CIR) images to determine regionalsuffosion potential. Results obtained from this research were used to form a con-ceptual model of suffosion development to better mitigate damage imposed oninfrastructure in evaporite-karst terrains. Regions with thick, heterogeneous soilsof low-to-moderate gypsum content (10–70%) and moderate fracture densities(100–800 m/km2) are optimal for suffosion development. This model should beconsidered for future infrastructure projects in not only for the Gypsum Plain,but also for other arid environments with signi!cant evaporite karst and gyp-sic soils.
INTRODUCTION
In northern Culberson County, Texas, dissolution ofindurated gypsite (gypsic soil) and gypsum bedrockhas caused substantial damage to infrastructure, primar-ily in the form of road failures (Stafford and others,2017). The Gypsum Plain of southeastern New Mexicoand west Texas (Fig. 1) is well recognized for extensiveepigene and hypogene karst development, but suffosionprocesses have become a growing concern related togeohazards in recent years (Stafford and others, 2017).Large sections of Ranch to Market (RM) 652 and otherinfrastructure within the region have been subjected toroad base failure as suffosion piping transports saturated"uids and sediments into underlying karst, predominantly
during brief, intense precipitation events. Suffosion iscapable of operating at rapid rates in gypsite (Stafford,2016) and its in"uence on anthropogenic and environ-mental regimes may not immediately manifest at thesurface. No dedicated studies have been previously con-ducted of suffosion processes in the Gypsum Plain andit is imperative that methods are developed to evaluatesuffosion potential for future construction projects, asthis region is one of the most abruptly developing petro-leum sectors with intense infrastructure usage in NorthAmerica (Stafford and others, 2017).
Suffosion features are developed by transport ofsaturated, unconsolidated sediments through soil piping(White, 1988). Laminar transport of !ne material
Morris, Jonah; Stafford, Kevin; and Farrish, Kenneth, 2021, Physical and Chemical Controls on SuffosionDevelopment in Gypsic Soil, West Texas, in Johnson, K. S.; Land, Lewis; and Decker, D. D. (eds.), EvaporiteKarst in the Greater Permian Evaporite Basin (GPEB) of Texas, New Mexico, Oklahoma, Kansas, andColorado: Oklahoma Geological Survey, Circular 113, p. 165–176.
0LMBIPNB�Geological�Survey�Circular�113,�2021
Physical�and�Chemical�Controls�on�Suffosion�Developmentin�Gypsic�Soil,�West�TexasJonah�Morris�and�Kevin�Stafford
Department�of�Geology,�Stephen�F.�Austin�State�University,�Nacogdoches,�Texas
Kenneth�FarrishDivision�of�Environmental�Science,�Stephen�F.�Austin�State�University,�Nacogdoches,�Texas
165

through adjacent sediments initiates classic soil piping—pipes spread and connect with underlying karst (Gunn,2004). Changes in the water table and rapid groundwater"ow can induce collapse by transporting sedimentsthrough karsti!ed formations and undermining overly-ing strata (Palmer, 2007). Flooding of low relief areaspromotes subsidence by transporting soil through verti-cal pipes and fracture zones (White, 1988). Solutionalfractures are important for evaporite karst development(White, 1988) and discharge from underlying karst mayalso cause "ooding (Palmer, 2007). In!ltration throughthick unconsolidated or allogenic material can inducesuffosion depressions (Ford and Williams, 2007),whereas sink collapse is less probable in thin soils or bed-rock (Palmer, 2007). Suffosion processes commonlyin"uence the development of existing karst features andinduce cover collapse proximal to infrastructure in karstenvironments (Ford and Williams, 2007).
In the Gypsum Plain, soil caves develop from suffo-sion (Fig. 2) and dissolution of soluble minerals(Stafford and others, 2017). Some soil caves can be lat-erally extensive and contain isolated chambers severalmeters in diameter. Preferential "ow through indurated
soils and evaporite dissolution of the soluble fractionform lateral and vertical soil pipes associated with bed-rock solutional conduits and fractures at depth (Staffordand others, 2017). Ascending "uids from Guadalupianaquifers migrate through fractured Castile evaporites(Stafford and others, 2017) and some hypogene featuresexhibit artesianlike discharge following prolongedprecipitation that can be masked by sur!cial depositssusceptible to suffosion (Stafford and others, 2018).
Parameters related to suffosion development in gyp-site were evaluated in this study along approximately35 km of RM 652 starting at the intersection of US62/180 to the west in Culberson County, Texas (Fig. 1).This study area was investigated as a proxy for suffosiongeohazard development within the greater region asRM 652 bisects the entire Gypsum Plain from west toeast. Field-based analyses included in!ltration testing
Figure 1. Study area outlined in black box with generallocation of Guadalupian and Ochoan strata in theDelaware Basin region and associated geomorphologyand sur!cial hydrology (modi!ed from Stafford andothers, 2018). Figure 2. Suffosion features present in theGypsumPlain
including cross-sectional models on right and !eld ex-amples on left: (A) sediments are funneled into anopen cover-collapse sinkhole and transported throughkarsti!ed gypsum bedrock; (B) lateral soil-pipingtransports sediments through gypsite macropores;(C) sediments are transported into solutional fractureswidened by gypsite/gypsum dissolution.
166 Jonah Morris and Kevin Stafford and Kenneth Farrish
coupled with suffosion characterization, including lab-based and remote-sensing analyses. Physical suffosionmodeling and chemical analyses of representative gyp-site samples were conducted in the laboratory. GIS anal-yses focused on spatial delineation of evaporite karst andfractures proximal to in!ltration sites. Regional suffo-sion potential in the Gypsum Plain may be quanti!edwith an application of the methods introduced below.
GEOLOGIC SETTING
Situated between theDelawareMountains to thewest,Rustler Hills to the east, Guadalupe Mountains to thenorth, and Apache Mountains to the south, the GypsumPlain is a low relief region that forms the central andwestern parts of the Delaware Basin (Fig. 1). The Dela-ware Basin formed during the late Paleozoic due to reac-tivation of Precambrian basement faults and uplift of theCentral Basin Platform during the Ouachita Orogeny(Hill, 1996). Precipitation ranges from 20 to 40 cmyear-1—most occurs during late summer, intense stormevents (Hill, 1996). The Gypsum Plain crops out over~2,600 km2 as Ochoan strata, primarily the Castile For-mation (Kirkland and Evans, 1976). Castile evaporitesare Late Permian, deep-water, strati!ed basin deposits(Kendall and Harwood, 1989; Stafford, 2013) thatformed as open marine circulation ceased in the Dela-ware Basin during the late Guadalupian (Hill, 1996).Castile strata are conformable with the underlying BellCanyon Formation, unconformable with the overlyingSalado Formation, and do not extend beyond the basinmargins (Hill, 1996). The Castile Formation is massiveto laminated gypsum/anhydrite interbedded with halitewith extensive intrastratal solutional removal withinthe western outcrop region (Henrickson and Jones,1952; Hill, 1996). Castile evaporites increase in thick-ness from west to east, reaching 480 m thick in the sub-surface (Kelley, 1971; Stafford and others, 2008a) withstrata dipping 3–5 degrees northeast as a result of pasttectonism (Hill, 1996).
Evaporite karst development is promoted by high sul-fate and halide solubility (Stafford and others, 2008b)which commonly leads to subsidence, intrastratal col-lapse, and brecciation. Gypsum solubility (2.531 g L-1
at 20°C) is four orders of magnitude greater than calcite(1.5 mg L-1), with more rapid solution kinetics in gyp-sum than in anhydrite (Klimchouk, 1996). Rock volumeincreases, as anhydrite converts to gypsum; most maturegypsum rocks in near-surface exposures originate fromhydration of anhydrite, whereas sulfate mineral transi-tions promote the development of endokinetic !ssuring(Klimchouk, 1996). Anhydrite dominates at depth(>450m),whereas gypsum ismost common near the sur-face (Klimchouk, 1996). Past and present evaporite dis-solution affects the entire Delaware Basin, creating acomplex speleogenetic history for the region (Hill, 1996).
Stafford and others (2017) classi!ed Castile karst fea-tures into the following: intrastratal dissolution, hypo-gene caves, hypergene caves, and suffosion caves.
Guadalupian siliciclastics provide groundwater thatascends through Castile evaporites and encourageshypogene speleogenesis (Stafford and others, 2018). In-trastratal dissolution forms brecciated structures throughhypogene processes coupledwith subsequent collapse ofevaporite strata (Stafford and others, 2008c). Hypergenecaves are small, laterally limited features with openingsthat decrease in average cross-sectional area within shortdistances beyond surface interfaces (Stafford and others,2017). Suffosion caves are generally too small for humanentry (Stafford and others, 2008c), but large soil cham-bers have been documented that formwhen connected tolarger voids in gypsum bedrock (Stafford and others,2017). Both natural and anthropogenic sources inducepreferential soil piping in the Gypsum Plain (Staffordand others, 2017). The largest karst features of theCastileFormation developed through hypogene processes atthe boundary of the Bell Canyon Aquifer, but most fea-tures exhibit variable degrees of epigene overprinting(Stafford and others, 2008b).
Surface drainage is perennial near the Pecos River,semiperennial near the Black River, and ephemeral atcreeks and arroyos (Hill, 1996). The Pecos River "owsacross the Delaware Basin’s backreef, reef, and basinstrata, and its tributaries—the Black and Delawarerivers—are contained within the interior of the DelawareBasin (Hill, 1996). The Gypsum Plain’s only perennialchannel is the Delaware River, but petroleum and ranch-ing operations commonly draw from water sources pro-vided by Quaternary alluvial deposits throughout theregion (Stafford and others, 2018). Flash "oods are com-monly channeled into arroyos during intense storms(Stafford and others, 2018) and transmitted into thesubsurface through evaporite karst interface features(Hill, 1996).
Subsequent to intense precipitation, breached hypo-gene karst and subsidence valleys overlying fracturedbedrock exhibit artesianlike discharge at decadal inter-vals (Stafford and others, 2018). These conditions arepromoted, as recharge to the underlying Bell CanyonAquifer raises the potentiometric surface within theCastile Formation, exceeding the land surface as artesiandischarge (Stafford and Faulkner, 2016). Infrastructurein areas with artesianlike discharge are subjected to con-siderable damage, as gypsum laminae are leached fromunderlying bedrock and overlying gypsic soils are satu-rated (Stafford and others, 2018).
GYPSIC SOILS
The western outcrop region of the Castile Formationweathers into a dull, gray–white gypsum soil (gypsite) inthe Gypsum Plain (Hill, 1996). Gypsite is composed of
Physical and Chemical Controls on Suffosion De-velopment in Gypsic Soil, West Texas 167

gypsum and/or anhydrite mixed with insoluble sedi-ments (McGregor, 1954); deposits form as chemicalsediments in semiarid-to-arid climates (Arakel andMcConchie, 1982). Gypsiferous soils result from bothphysical and chemical vadose diagenesis of existinggypsum strata with subaerial exposure (Arakel andMcConchie, 1982). Gypsic crusts develop on exposedbedrock because of repeated gypsum dissolution andreprecipitation (Stafford and others, 2008b). The changefrom a cold, humid climate in the Pleistocene to the pres-ent arid climate has resulted in the Gypsum Plain’scurrent soil distribution (Hill, 1996; Stafford and others,2017). Humid conditions brought alluvium to the base ofthe Delaware Basin; terrace alluvium accumulated in thePecos River Valley and soil horizons developed in thedrier periods (Hill, 1996). Flooding of the Pecos Riverand its tributaries has distributed graveled alluviumthroughout the region (Hill, 1996). These alluvial andgypsic soils overlie bedrock in several areas and rangefrom decimeters to several meters thick (Stafford andothers, 2017).
In an extensive, third-order survey, Soil Survey Staff(2013) classi!ed soils varying in gypsum content withtextures ranging from graveled alluvium to gypsiferousloam and !ne sand throughout the Gypsum Plain(Fig. 3). Soil horizons that contain high gypsum contentare generally thin, whereas low-to-moderate gypsumcontent is common in thick, heterogeneous soil pro!les.The Bissett-Rock Outcrop Complex (BID) consists of65% Bissett soils (Lithic Ustic Haplocalcids) weathered
from graveled limestone residuum and 25% limestonerock outcrops in areas with 3–16% slopes. The Bissett-Rock Outcrop Complex (BIE) in areas with 10–30%slopes has a similar composition of 65% Bissett soilsand 30% limestone rock outcrops. The Culberspeth–Chilicotal Complex (CVC) consists of 65% Culberspethsoils (Calcic Petrocalcids) weathered from graveledalluvium/colluvium and 30% Chilicotal soils (UsticHaplocalcids)weathered fromgraveled limestone pedise-diment in areas with 1–8% slopes—this complex islocated at the western margin of the study area proximalto BID and BIE complexes. Monohans (MHA) soils(Typic Calcigypsids) form from calcareous and gypsifer-ous alluvium in areas with 0–2% slopes and are proximalto the Delaware River with Walkerwells (WAB) soils(Usti"uventic Haplocambids) derived from alluvial de-posits of gypsum and sandstone—gypsum content variesfrom0 to 40%.These soils constitute about 6%of the totalstudy area.
The remaining 94% of the study area is dominated bygypsiferous loams. Dellahunt (DEB) soils (Ustic Calci-gypsids) weather from alluvial deposits of gypsum andsandstone in areas with 0–5% slopes, and Elcor (ELC/ELE) soils (Lithic Haplogypsids) weather from gypsumresiduum in areas with 1–30% slopes. The Dellahunt–Neimahr–Joberanch Complex (DNB) consists of 30%Dellahunt soils, 25% Neimahr soils (Lithic Ustic Haplo-cambids), and 25% Joberanch soils (Ustic Petrogypsids),all of which are weathered from alluvial deposits ofgypsum and sandstone. The Elcor–Dellahunt–Pokorny
Figure 3. Soil map of the detailed soil units derived from the Culberson County Soil Survey (Soil Survey Staff, 2013):BID (Bissett-Rock Outcrop Complex); BIE (Bissett-Rock Outcrop Complex); CVC (Culberspeth–Chilicotal Complex);DEB (Dellahunt Silt Loam); DNB (Dellahunt–Neimahr–Joberanch Complex); ELC (Elcor Gypsiferous Loam); ELE (ElcorGypsiferous Loam); EPA (Elcor–Dellahunt–Pokorny Complex); EPE (Elcor–Pokorny–Hollomex–Walkerwells Com-plex); HPC (Hollebeke–Pokorny Complex); MHA (Monohans Fine Sandy Loam); and WAB (Walkerwells Silty ClayLoam).
168 Jonah Morris and Kevin Stafford and Kenneth Farrish

Complex (EPA) consists of 35% Elcor soils, 30% Della-hunt soils, and 25% Pokorny soils (Ustic Petrogypsids)in areas with 0–2% slopes. The Elcor–Pokorny-Hollomex–Walkerwells Complex (EPE) forms in areaswith 0–30% slopes and consists of 30% Elcor soils,30% Pokorny soils, 15% Hollomex soils (Ustic Haplo-gypsids), and 15% Walkerwells soils. The Hollebeke–Pokorny Complex (HPC) consists of 45% Hollebekesoils (Ustic Petrogypsids) and 35% Pokorny soils inareas with 1–8% slopes. Undifferentiated gypsiferousloams of the Elcor, Dellahunt, and/or Pokorny soil seriescontain 60–90%, 0–10%, and 0–95% gypsum content,respectively. However, these soils are undifferentiatedas complexes in the soil mapping in ~ 53% of the studyarea and are effectively inseparable in the third-orderCulberson County Soil Survey, where map units aremostly associations and complexes, with some coassoci-ations and undifferentiated groups. This variation in sol-uble fractions inhibits the development of suffosionmodels for the region from existing soil delineationsbased on soluble content and complicates geoengineer-ing throughout the region, as soil classi!cation is toobroadly characterized.
METHODOLOGY
Combined !eld and laboratory methodologies weredeveloped to evaluate suffosion processes in the Gyp-sum Plain. Field studies quanti!ed conditions associatedwith sur!cial ponding and in!ltration in variable gypsitedeposits. Laboratory analyses identi!ed the compositionof soluble fractions and composition of gypsic soils.Physical suffosion modeling was designed to replicatesuffosion processes observed in !eld conditions withinvariable mediums and temporally through repeated in!l-tration analyses. Delineation of fractures, sur!cial karstmanifestations, and regional suffosion potential wereconducted through GIS analyses for correlation ofobserved suffosion phenomena.
Beginning at the intersection of US 62/180, !eld anal-yses were conducted at 25 locations along the !rst~35 km of RM652within the Castile outcrop area. Fieldanalyses were conducted over a 3-day period withoutprior precipitation for more than 28 days, and in!ltrationrates weremeasured alongwith soil electrical conductiv-ity, moisture, and temperature. At each site, three Turf-Tec in!ltration rings were installed into gypsite depositswithin the right-of-way of RM 652 but distal to the roadin minimally disturbed soils—triplicate in!ltration anal-yses were conducted at each in!ltration ring site and allin!ltration rates were averaged for analyses. GroLineHI98331ECTester andExtechM0750 soil moistureme-ters were used to collect electrical conductivity/temper-ature and moisture data, respectively. Soil electricalconductivity, moisture, and temperature were measuredat each in!ltration ring both before and after in!ltration
testing. In!ltration rates were correlated with soil classi-!cations designated by USDA (2013) soil surveys. Soilelectrical conductivity was assessed between unsatu-rated and saturated conditions.
Geochemical analyses were conducted on representa-tive soil samples to delineate soluble fractions (Stafford,2017). Analysis samples were extracted from well-mixed soils, oven dried at 40°C until no mass changeswere observed to prevent dehydration of gypsum toanhydrite and dissolved in deionized water for 24 hrwith shaker-induced agitation—sample mass was lim-ited to 0.5 g to ensure complete dissolution of solubleminerals (e.g., sulfate minerals) in 250 mL of deionizedwater. Major cations/anions and TDS were determinedfrom !ltered solutions with ICP-MS (Inductively Cou-pledPlasmaMass Spectrometry) at the StephenF.AustinState University—Soil, Plant, and Water Analysis Lab-oratory; acid titrations were conducted with a MettlerToledo EasyPlus Titrator to determine carbonate/bicar-bonate concentrations. Geochemical analyses identi!edthree major soil variants based largely on sulfate content(Fig. 4): 1) low sulfate content; 2) moderate sulfate con-tent; and 3) high sulfate content.
Suffosionmodelingwas conductedwith bulk samplesgathered from !eld Sites 4 and 20. Both gypsite samplesare classi!ed by the USDA (2013) as part of the Elcor–Dellahunt–PokornyComplex (EPA)—these soils consti-tute 94%of the study area. EPA soils are undifferentiatedwith gypsum contents that range from 0 to 95%, thusconsiderable variation exists among soils (Fig. 5).Sites 4 and 20 soils contain 10% and 80% gypsum con-tent, respectively—Site 4 samples represent the Della-hunt soil series with low gypsum content (10%) and
Figure 4. Solubility values of gypsite samples collectedfrom !eld in!ltration sites. Filled circles and dashed linerepresent HCO3
+ concentrations, whereas squares andsolid line represent SO4
2+.
Physical and Chemical Controls on Suffosion De-velopment in Gypsic Soil, West Texas 169

Site 20 samples represent the Elcor soil series with highgypsum content (>70%).
Physical in!ltration modeling was conducted withgypsite that was homogenously mixed and sieved(2 mm) before being packed into butyrate cylinders10 cm in height and 5 cm in diameter—tubes !lledwith homogenous soil were percussion-packed with a1.5 kg cylinder dropped 20 times from height of approx-imately 30 cm. Filled cylinders were placed in verticalpositions and connected to individual water reservoirsby polyethylene tubing to simulate vadose "uid migra-tion induced by sur!cial ponding (Fig. 6). Water "owwas restricted to a maximum rate of 1 mL/s, allowing100 mL of deionized water to in!ltrate through sampleswith minimal mechanical mass removal. Fluids andmobilized sediments were gravity-drained through acentral exit point 1 mm in diameter into collectioncontainers. Dissolved solids, insoluble sediments andsuffosion models were oven-dried at 40°C until nomass change was measured, removing soil moisturewithout converting gypsum to anhydrite. Drying of
sediment-packed columns between in!ltration analyseswas performed to simulate !eld conditions wheresoils are saturated during monsoonal rain events andsubsequently dried because of high evaporation in thenatural arid environment. Soil mass and volume ofsuffosion models were measured prior and subsequentto in!ltration—sediments removed from the systemwere weighed after the oven-drying phase. Three itera-tions of this process were conducted with 18 replicatesamples for each soil type (i.e.,Dellahunt andElcor soils).
Raster images with 50 cm resolution were used tomap lineaments interpreted as fractures in gypsum bed-rock/soil to de!ne potential regions of increased suffo-sion potential within the study area. Feature selectionincluded lineaments de!ned by linear vegetative growth(Stafford, 2018) and dismissed features related to anthro-pogenic activity (i.e., buried utility cables, roads, andfences). Lineament orientations and lengths were calcu-lated in ArcGIS and rose diagrams were generatedin GeoRose to evaluate spatial variability of fractureintensity. Lineament densities were calculated as line
Figure 5. Piper diagram of gypsite samples collected from !eld in!ltration sites—the point designated by the grayarrow is representative of the Dellahunt soil series and the point designated by the black arrow is representative ofthe Elcor soil series. Larger points indicate greater TDS (Total Dissolved Solids) values.
170 Jonah Morris and Kevin Stafford and Kenneth Farrish

densities in ArcGIS. LiDAR (Light Detection andRanging) data of sinkhole delineation conducted byEhrhart (2016) were coupled with mapped lineamentsand used to examine suffosion potential correlatedwith karst conduits in soils associated with in!ltration!eld sites. Ehrhart (2016) delineated natural sinkholeswith depths greater than 10 cm using LiDAR datawith a horizontal resolution of 30 cm and vertical reso-lution of 10 cm—anthropogenic features were manuallyremoved from the data set. Sinkhole densities were cal-culated as kernel densities in ArcGIS.
RESULTS AND DISCUSSION
Suffosion potential was measured according to physi-cal and chemical parameters evaluated in representativesamples of gypsic soil. Field analyses demonstrated therelationship between suffosion potential and soil thick-ness/type. Geochemical delineation of gypsic soils fur-ther characterized the broad soil descriptions publishedin the third-order Culberson County Soil Survey (Soil
Survey Staff, 2013). Suffosion modeling correlated suf-fosion potential with the soluble/insoluble fractions ofgypsite. Fracture and sinkhole delineationswere coupledwith soil thickness to analyze suffosion potential on aregional scale.
Field Analyses
Field in!ltration sites were located within the follow-ing USDA (2013) designated soil types: two sites inDEB; three sites in DNB; four sites in ELC; two sitesin ELE; 11 sites in EPA; one site in HPC; one site inMHA; and one site in WAB (Fig. 3). Soils that containthe Elcor, Dellahunt, and/or Pokorny series dominate thestudy area—these gypsiferous loams constitute ~94% oftotal area. The highest (4.7 mm min-1) and lowest(0.5 mm min-1) in!ltration rates were measured fromDEB and MHA soils, respectively. DEB soils are mod-erate alkaline silt loams formed from gypsum rock andsandstone, whereas MHA soils are moderate alkaline!ne sands derived from calcareous and gypsiferous allu-vium (Soil Survey Staff, 2013). The remaining sites(88%) shared an average in!ltration rate of ~1.4 mmmin-1. Moderate-to-high in!ltration rates were observedin thick, heterogeneous soil mixtures, whereas in!ltra-tion was limited in thin, !ne soils overlying bedrock.Indurated gypsite promoted horizontal in!ltration, as"u-ids came into contact with underlying gypsic cements,and heterogeneous soils allowed vertical in!ltration inthe absence of high soluble fractions. At Site 11, activesuffosionwas induced as several liters ofwater in!ltratedthrough a previously unknown macropore during in!l-tration testing, forming a “whirlpool”, as sedimentswere "ushed into the subsurface, whereas other in!ltra-tion rings within 1 m exhibited slow in!ltration rates,thus indicating the potential for extreme local heteroge-neity of suffosion phenomena and permeability.Suffosion geohazards are more probable in thick,heterogeneous soils that promote moderate in!ltration.
Soil electrical conductivity and moisture values werelowprior to in!ltration, ranging from0.0 to 0.25mScm-1
and 0 to 10%, respectively. Most soil moisture readingsincreased beyond 20% during in!ltration and all soilelectrical conductivity readings surpassed 0.25 mS cm-1
(Fig. 7). These increases indicate that in!ltrated "uidsreached near saturation with respect to sulfate in gypsitedeposits and that soluble ions were quickly mobilized.Areas where soil moisture increased beyond 40% exhib-ited gypsite compositions with signi!cant clay contentthat favored soil swelling over vertical in!ltration. Adirect correlation exists between soil electrical conduc-tivity andmoisture throughout the study area, suggestingthat moisture content is directly associated with claycontent—organic content is extremely low in most soilseries within the Gypsum Plain.
Figure 6. Diagram of suffosion modeling and sediment/solute removal: light-gray in the top left cylinder repre-sents water, medium-gray in the bottom left cylinderrepresents unsaturated gypsite, dark-gray in thebottom right cylinder represents saturated gypsite,and dark grey in bottom right trapezoid represents sed-iment and saturated "uids transported out of the sys-tem as sediment/solute.
Physical and Chemical Controls on Suffosion De-velopment in Gypsic Soil, West Texas 171

Geochemical Analyses
Over 70% of soluble fractions in most soils within thestudy area are composed of gypsum, but some chlorideand carbonate minerals are present (Fig. 5). In general,chloride and carbonate ions in the study area are mostconcentrated near the surface due to dissolution and ver-tical transport of calcium sulfates into deeper soils or spe-leogenetic features. Calcium sulfates are also leached atdepth when coupled with karst features. TDS (Total Dis-solved Solids) of soils indicate solubilities exceeding80% within the region with greater concentrations ofsoluble fractions at depth.
Soils in the study area can be grouped into three clas-si!cations based on their geochemical compositions: "u-vial deposits, graveled alluvium, and gypsiferous loams.Sediments deposited by the Delaware River ("uvial de-posits) exhibit the lowest soluble sulfate composition(<10%) and total solubility as a result of "ooding andsurface "ow through unconsolidated deposits. Graveledalluviums at the western and eastern edges of RM 652also have low solubilities and greater chloride/carbonate(>50%) concentrations—these soils are weathered fromlimestone soil parent materials transported by the BlackRiver. Gypsiferous loams contain the highest concentra-tions of calcium sulfates (>50%), but varying amounts ofchloride and carbonate minerals were present. Greaterconcentrations of carbonate/chloride ions are generallyin gypsiferous loams with thick soil pro!les that areproximal to "uvial deposits. Mixing of alluvial and gyp-sic soils forms heterogeneous mixtures that promotein!ltration and dissolution of soluble fractions (gyp-sum). Soils with almost 100% calcium sulfate composi-tions appear to be derived in situ from underlyinggypsum bedrock and form as thin, indurated gypsitethat reduces in!ltration and ion mobilization.
Suffosion Modeling
In general, suffosion models exhibited considerableincreases in bulk density between initial conditionsand the !rst iteration of in!ltration—Dellahunt modelsincreased in density by ~12% and Elcor modelsincreased by ~11%. Dellahunt models transportedgreater amounts of sediment than Elcor models, butgreater consolidation was observed in samples fromElcor soils. Porosities increased (1%) in Dellahunt mod-els, as in!ltration was repeated, whereas Elcor modelsdecreased (3%) in porosity with repeated in!ltration.
During the !rst in!ltration iteration, Dellahunt andElcor suffosion models exhibited consolidation andmass removal as deionizedwater "owed through the sys-tem (Fig. 8). Some dissolved soluteswere removed fromthe system with insoluble fractions, but most were redis-tributed during in!ltration and cemented around grainsafter oven-drying, occluding pore space. Consolidationcontinued in Dellahunt models with replicate in!ltrationanalyses producing little decrease in porosity, indicat-ing that microconduits formed during the subsequentiterations—mass removal decreased because of second-ary grain cementation. Minimal increase in consolida-tion paired with decreased porosity indicates that"uids were not able to readily migrate through Elcormodels during the replicate in!ltrations, as permeabilitywas reduced. Precipitated gypsum removed initial poros-ity, as models were dried.
Dellahunt soil permeability decreased with repeatedin!ltration modeling, but soils developed connected mi-cropores coupled with cemented horizons that restrictedvertical "uid "ow as a result of relocation and precipita-tion of gypsum. This was evident from increased poros-ity and decreased consolidation between in!ltrationiterations and observable microconduits, which wouldprovide inception horizons for suffosion piping. In!ltra-tion ceased because of consolidation and gypsum repre-cipitation after repeated iteration modeling in Elcorsoils. Increased consolidation removed porosity betweeninsoluble grains; reprecipitation removed secondaryporosity formed by dissolution in the initial iteration.
Modeling demonstrated that suffosion processesare dependent on geochemical variations in gypsite.Dellahunt soils were more effective than Elcor soils intransporting sediment through suffosion processes.Dissolution of soluble fractions promotes soil pipe for-mation, but adequate insoluble material is needed tostructurally support conduit permeability. In addition,excessive evaporite content reduces porosity, as sulfatesare redistributed around insoluble grains and conduits inrepeated wetting/drying phases as is common in aridenvironments. Although suffosion processes are encour-aged in gypsite with low-to-moderate soluble fractions,Elcor samples experienced considerable, rapid consoli-dation and re"ected compositions that favor general
Figure 7. Values of soil electrical conductivity and soilmoisture both prior (circles) and subsequent (squares)to in!ltration studies. The trend line re"ects the aver-age increase of soil electrical conductivity, as sulfatesaturation increases (r2=0.80).
172 Jonah Morris and Kevin Stafford and Kenneth Farrish

subsidence. Geohazards related to suffosion most likelyresult from a combination of both processes, but modelsindicate that the development of macropores withinindurated gypsite is essential for continued suffosionand the development of potential geohazards.
GIS Analyses
Suffosion features in the Gypsum Plain occur througha combination of physical piping of unconsolidated sed-iment and dissolution of soluble soil fractions, but soilpipes are not the sole mechanisms of creating suffosion
geohazards; fractures and sinkholes coupled to soilstransport sediment into underlying karst as well(Fig. 2) by providing outlets for removal of insolublesediments and saturated waters. Overland "ow duringintense precipitation "ushes gypsite into void spacesprovided by solutional fractures and conduits in gypsumbedrock which form the dominant coupling mechanismfor enhanced suffosion development within the GypsumPlain. Solutional fractures at the contact between gyp-sum bedrock and gypsic soils have commonly been cor-related with suffosion features proximal to infrastructurein Castile evaporites (Ehrhart, 2016).
Stafford and others (2017) demonstrated that GISstudies can correlate vegetative growth patterns andavailable moisture content in evaporite karst environ-ments through CIR (Color InfraRed) and NDVI (Nor-malized Difference Vegetation Index) analyses. In thisarid environment, linear vegetative growth near fracturesin thin soil indicate regions of greater moisture "ux—fracture delineation is more dif!cult in soils with greaterthicknesses and more uniform soil in!ltration (Staffordand others, 2017). In total, 1,159 lineaments weremapped with general orientations at NW–SE and N–Swithin the study area (Fig. 9). An N–S lineament trendis dominant in the westernmost section of the studyarea, whereas NW–SE trends are observed to the east;similar fracture trends have been observed in cavesand subsurface conduits (Stafford and others, 2008c),indicating that these lineaments accurately re"ect localbrittle deformation.
LiDAR analyses (Ehrhart, 2016) identi!ed the loca-tions of ~ 4,539 natural sinks within the study area—sinkholes are the most prevalent karst landform of theCastile outcrop region (Stafford and others, 2008c)
Figure 8. Results of suffosion modeling with Dellahunt(n=12) and Elcor (n=18) soil models. The left columnshows the results of the initial iteration and the rightcolumn shows the results of the !nal iteration. Whiteboxes represent the Dellahunt soil series, whereasgray boxes represent the Elcor soil series—median val-ues of each data set are indicated by the horizontal lineand averages are indicated by the “x” mark.
Figure 9. Orientations of lineaments (n=1159) delin-eated as solutional fractures proximal to RM 652.
Physical and Chemical Controls on Suffosion De-velopment in Gypsic Soil, West Texas 173
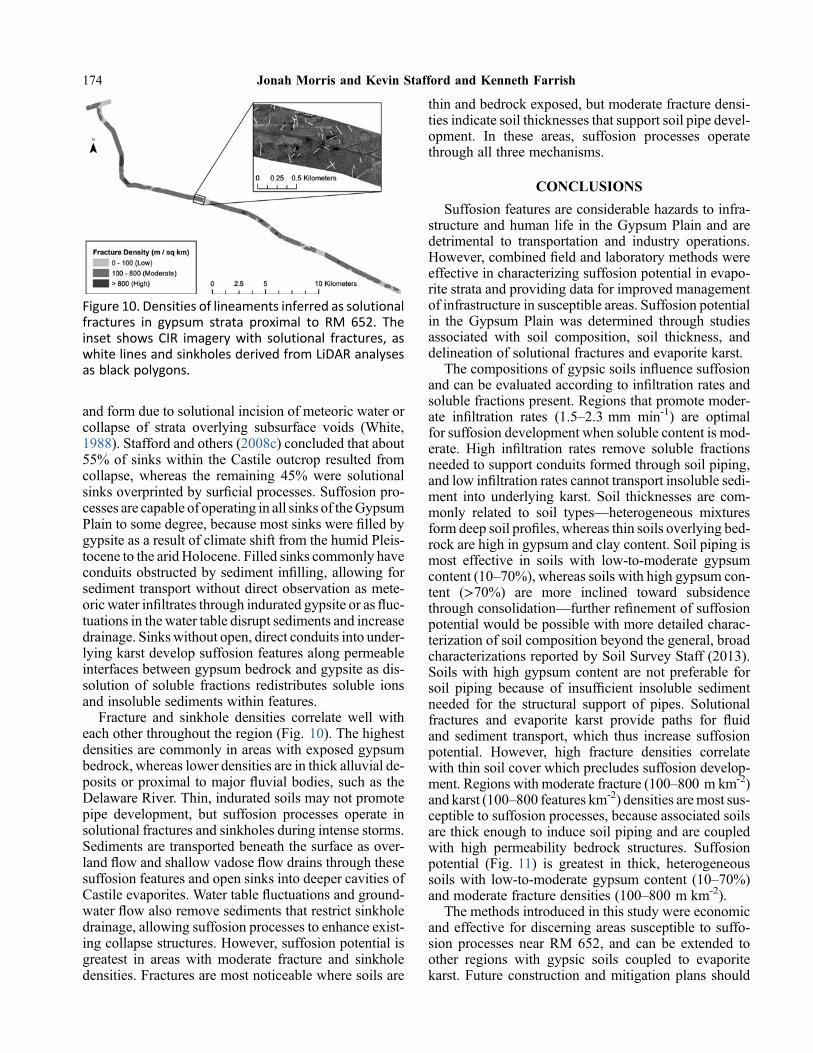
and form due to solutional incision of meteoric water orcollapse of strata overlying subsurface voids (White,1988). Stafford and others (2008c) concluded that about55% of sinks within the Castile outcrop resulted fromcollapse, whereas the remaining 45% were solutionalsinks overprinted by sur!cial processes. Suffosion pro-cesses are capable of operating in all sinks of theGypsumPlain to some degree, because most sinks were !lled bygypsite as a result of climate shift from the humid Pleis-tocene to the arid Holocene. Filled sinks commonly haveconduits obstructed by sediment in!lling, allowing forsediment transport without direct observation as mete-oric water in!ltrates through indurated gypsite or as "uc-tuations in the water table disrupt sediments and increasedrainage. Sinks without open, direct conduits into under-lying karst develop suffosion features along permeableinterfaces between gypsum bedrock and gypsite as dis-solution of soluble fractions redistributes soluble ionsand insoluble sediments within features.
Fracture and sinkhole densities correlate well witheach other throughout the region (Fig. 10). The highestdensities are commonly in areas with exposed gypsumbedrock, whereas lower densities are in thick alluvial de-posits or proximal to major "uvial bodies, such as theDelaware River. Thin, indurated soils may not promotepipe development, but suffosion processes operate insolutional fractures and sinkholes during intense storms.Sediments are transported beneath the surface as over-land "ow and shallow vadose "ow drains through thesesuffosion features and open sinks into deeper cavities ofCastile evaporites. Water table "uctuations and ground-water "ow also remove sediments that restrict sinkholedrainage, allowing suffosion processes to enhance exist-ing collapse structures. However, suffosion potential isgreatest in areas with moderate fracture and sinkholedensities. Fractures are most noticeable where soils are
thin and bedrock exposed, but moderate fracture densi-ties indicate soil thicknesses that support soil pipe devel-opment. In these areas, suffosion processes operatethrough all three mechanisms.
CONCLUSIONS
Suffosion features are considerable hazards to infra-structure and human life in the Gypsum Plain and aredetrimental to transportation and industry operations.However, combined !eld and laboratory methods wereeffective in characterizing suffosion potential in evapo-rite strata and providing data for improved managementof infrastructure in susceptible areas. Suffosion potentialin the Gypsum Plain was determined through studiesassociated with soil composition, soil thickness, anddelineation of solutional fractures and evaporite karst.
The compositions of gypsic soils in"uence suffosionand can be evaluated according to in!ltration rates andsoluble fractions present. Regions that promote moder-ate in!ltration rates (1.5–2.3 mm min-1) are optimalfor suffosion development when soluble content is mod-erate. High in!ltration rates remove soluble fractionsneeded to support conduits formed through soil piping,and low in!ltration rates cannot transport insoluble sedi-ment into underlying karst. Soil thicknesses are com-monly related to soil types—heterogeneous mixturesform deep soil pro!les, whereas thin soils overlying bed-rock are high in gypsum and clay content. Soil piping ismost effective in soils with low-to-moderate gypsumcontent (10–70%), whereas soils with high gypsum con-tent (>70%) are more inclined toward subsidencethrough consolidation—further re!nement of suffosionpotential would be possible with more detailed charac-terization of soil composition beyond the general, broadcharacterizations reported by Soil Survey Staff (2013).Soils with high gypsum content are not preferable forsoil piping because of insuf!cient insoluble sedimentneeded for the structural support of pipes. Solutionalfractures and evaporite karst provide paths for "uidand sediment transport, which thus increase suffosionpotential. However, high fracture densities correlatewith thin soil cover which precludes suffosion develop-ment. Regions with moderate fracture (100–800 m km-2)and karst (100–800 features km-2) densities aremost sus-ceptible to suffosion processes, because associated soilsare thick enough to induce soil piping and are coupledwith high permeability bedrock structures. Suffosionpotential (Fig. 11) is greatest in thick, heterogeneoussoils with low-to-moderate gypsum content (10–70%)and moderate fracture densities (100–800 m km-2).
The methods introduced in this study were economicand effective for discerning areas susceptible to suffo-sion processes near RM 652, and can be extended toother regions with gypsic soils coupled to evaporitekarst. Future construction and mitigation plans should
Figure 10. Densities of lineaments inferred as solutionalfractures in gypsum strata proximal to RM 652. Theinset shows CIR imagery with solutional fractures, aswhite lines and sinkholes derived from LiDAR analysesas black polygons.
174 Jonah Morris and Kevin Stafford and Kenneth Farrish
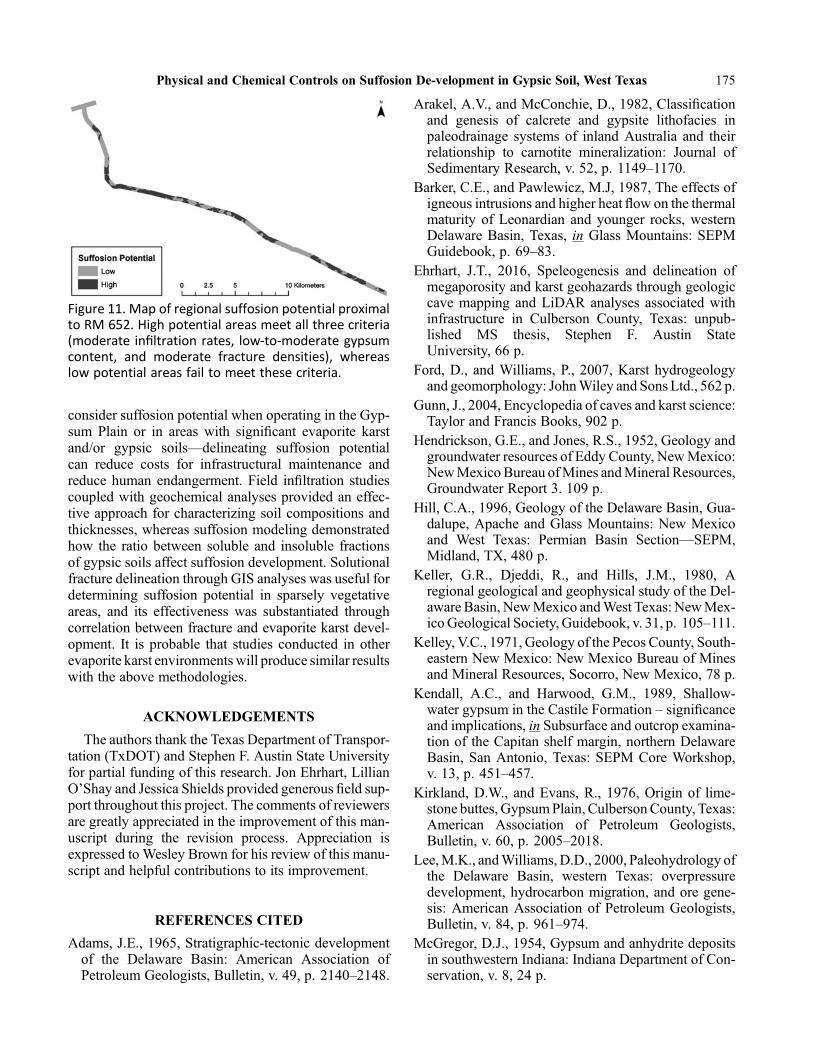
consider suffosion potential when operating in the Gyp-sum Plain or in areas with signi!cant evaporite karstand/or gypsic soils—delineating suffosion potentialcan reduce costs for infrastructural maintenance andreduce human endangerment. Field in!ltration studiescoupled with geochemical analyses provided an effec-tive approach for characterizing soil compositions andthicknesses, whereas suffosion modeling demonstratedhow the ratio between soluble and insoluble fractionsof gypsic soils affect suffosion development. Solutionalfracture delineation through GIS analyses was useful fordetermining suffosion potential in sparsely vegetativeareas, and its effectiveness was substantiated throughcorrelation between fracture and evaporite karst devel-opment. It is probable that studies conducted in otherevaporite karst environments will produce similar resultswith the above methodologies.
ACKNOWLEDGEMENTS
The authors thank the Texas Department of Transpor-tation (TxDOT) and Stephen F. Austin State Universityfor partial funding of this research. Jon Ehrhart, LillianO’Shay and Jessica Shields provided generous !eld sup-port throughout this project. The comments of reviewersare greatly appreciated in the improvement of this man-uscript during the revision process. Appreciation isexpressed to Wesley Brown for his review of this manu-script and helpful contributions to its improvement.
REFERENCES CITED
Adams, J.E., 1965, Stratigraphic-tectonic developmentof the Delaware Basin: American Association ofPetroleum Geologists, Bulletin, v. 49, p. 2140–2148.
Arakel, A.V., and McConchie, D., 1982, Classi!cationand genesis of calcrete and gypsite lithofacies inpaleodrainage systems of inland Australia and theirrelationship to carnotite mineralization: Journal ofSedimentary Research, v. 52, p. 1149–1170.
Barker, C.E., and Pawlewicz, M.J, 1987, The effects ofigneous intrusions and higher heat "ow on the thermalmaturity of Leonardian and younger rocks, westernDelaware Basin, Texas, in Glass Mountains: SEPMGuidebook, p. 69–83.
Ehrhart, J.T., 2016, Speleogenesis and delineation ofmegaporosity and karst geohazards through geologiccave mapping and LiDAR analyses associated withinfrastructure in Culberson County, Texas: unpub-lished MS thesis, Stephen F. Austin StateUniversity, 66 p.
Ford, D., and Williams, P., 2007, Karst hydrogeologyand geomorphology: JohnWiley and Sons Ltd., 562 p.
Gunn, J., 2004, Encyclopedia of caves and karst science:Taylor and Francis Books, 902 p.
Hendrickson, G.E., and Jones, R.S., 1952, Geology andgroundwater resources of Eddy County, NewMexico:NewMexicoBureau ofMines andMineral Resources,Groundwater Report 3. 109 p.
Hill, C.A., 1996, Geology of the Delaware Basin, Gua-dalupe, Apache and Glass Mountains: New Mexicoand West Texas: Permian Basin Section—SEPM,Midland, TX, 480 p.
Keller, G.R., Djeddi, R., and Hills, J.M., 1980, Aregional geological and geophysical study of the Del-aware Basin, NewMexico andWest Texas: NewMex-icoGeological Society, Guidebook, v. 31, p. 105–111.
Kelley, V.C., 1971, Geology of the Pecos County, South-eastern New Mexico: New Mexico Bureau of Minesand Mineral Resources, Socorro, New Mexico, 78 p.
Kendall, A.C., and Harwood, G.M., 1989, Shallow-water gypsum in the Castile Formation – signi!canceand implications, in Subsurface and outcrop examina-tion of the Capitan shelf margin, northern DelawareBasin, San Antonio, Texas: SEPM Core Workshop,v. 13, p. 451–457.
Kirkland, D.W., and Evans, R., 1976, Origin of lime-stone buttes, GypsumPlain, CulbersonCounty, Texas:American Association of Petroleum Geologists,Bulletin, v. 60, p. 2005–2018.
Lee,M.K., andWilliams,D.D., 2000, Paleohydrology ofthe Delaware Basin, western Texas: overpressuredevelopment, hydrocarbon migration, and ore gene-sis: American Association of Petroleum Geologists,Bulletin, v. 84, p. 961–974.
McGregor, D.J., 1954, Gypsum and anhydrite depositsin southwestern Indiana: Indiana Department of Con-servation, v. 8, 24 p.
Figure 11. Map of regional suffosion potential proximalto RM 652. High potential areas meet all three criteria(moderate in!ltration rates, low-to-moderate gypsumcontent, and moderate fracture densities), whereaslow potential areas fail to meet these criteria.
Physical and Chemical Controls on Suffosion De-velopment in Gypsic Soil, West Texas 175

Palmer, A.N., 2007, Cave geology: Cave Books, 454 p.Soil Survey Staff (USDA). 2013. Soil survey of Culber-son County, Texas: Natural Resources ConservationService.
Stafford, K.W., 2013, Evaporite karst and hydrogeologyof the Castile Formation: Culberson County, Texasand Eddy County, New Mexico, in Land, L., Doctor,D.H., and Stephenson, J.B., eds., Proceedings of the13th Multidisciplinary Conference on Sinkholes andthe Engineering and Environmental Impacts of Karst:National Cave and Karst Research Institute, Carlsbad,NM., Symposium 2, p. 123–131.
Stafford, K.W., 2016, 2016 karst geohazard characteri-zation of RM 652: phase two of karst developmentand geohazards associated with RM 652 in CulbersonCounty, Texas: Report to El Paso District Of!ce ofTexas Department of Transportation, 94 p.
Stafford, K.W., 2017, 2017 karst geohazard characteri-zation of RM 652: phase three of karst developmentand geohazards associated with RM 652 in CulbersonCounty, Texas: Report to El Paso District Of!ce ofTexas Department of Transportation, 45 p.
Stafford, K.W., 2018, 2018 karst geohazard characteri-zation of RM 652: phase four of karst developmentand geohazards associated with RM 652 in CulbersonCounty, Texas: Report to El Paso District Of!ce ofTexas Department of Transportation, 21 p.
Stafford, K.W., Rosales-Lagarde, L., and Ulmer-Scholle, D., 2008a, Hypogene calcitization: evaporitediagenesis in the western Delaware Basin: Carbonatesand Evaporites, v. 23, p. 89–103.
Stafford, K.W., Boston, P.J., and Rosales-Lagarde, L.,2008b, Castile evaporite karst potential map of theGypsum Plain, Eddy County, New Mexico and Cul-berson County, Texas: a GIS methodological compar-ison: Journal Cave and Karst Studies, v. 70, no. 1,p. 83–98.
Stafford, K.W., Boston, P., and Rosales-Lagarde, L.,2008c, Epigene and hypogene gypsum karst manifes-tations of the Castile Formation: Eddy County, NewMexico and Culberson County, Texas, USA: Interna-tional Journal of Speleology, v. 37, p. 83–98.
Stafford, K.W., and Faulkner, M.S., 2016, Engineeringgeohazards in hypogene evaporite karst, Castile For-mation, West Texas, in Chaves, T., and Reeling, P.,eds., Proceedings of DeepKarst 2016. Origins, resour-ces, and management of hypogene karst: NationalCave and Karst Research Institute, Carlsbad, NewMexico, Symposium 6, p. 131-132.
Stafford, K.W., Brown, W.A., Ehrhart, J.T., Majzoub,A.F., andWoodard, J.D., 2017, Evaporite karst geoha-zards in the Delaware Basin, Texas: review of tradi-tional karst studies coupled with geophysical andremote sensing characterization: International Journalof Speleology, v. 46, p.169–180.
Stafford, K.W., Brown,W., Ehrhart, J.,Majzoub, A., andShields, J., 2018, Uncon!ned hypogene evaporitekarst: West Texas and southeastern New Mexico,USA: International Journal of Speleology, v. 47,p. 293–305.
White, W.B., 1988, Geomorphology and hydrology ofkarst terrains: Oxford University Press, 464 p.
176 Jonah Morris and Kevin Stafford and Kenneth Farrish

ABSTRACT.—Differential dissolution of gypsum within the Delaware Basinposes a signi!cant threat to infrastructure that society depends on. The studyarea is located in Culberson County, Texas, and traverses a distance of approxi-mately 54 kilometers along RM 652 within the Gypsum Plain, which is situatedon the northern margin of the Chihuahua Desert, and includes outcrops of Castileand Rustler strata that host karst geohazards. Regions of karst geohazard potentialhave been surveyed proximal to the study area in evaporites throughout the CastileFormation outcrop; minimal hazards, in comparison to the Castile Formation, havebeen documented in the Rustler Formation. A TR-5 OhmMapper capacitively-coupled resistivity (CCR) meter was used to acquire resistivity data for geohazardcharacterization. This study utilized a traditional dipole–dipole array, with an elec-trode spacing of 2.5 meters between receivers and a transmitter offset of 2.5 meters.This geometric con!guration, combined with medium analyzed, allowed for resis-tivity readings to be recorded up to approximately 5 meters deep. Data acquisitionwas recorded with the OhmMapper attached to a vehicle moving at approximately3 kilometers per hour and transmitting and receiving once per second (approxi-mately 1 meter per sample). Resistivity data was processed using AGI’s EarthIm-ager 2D inversion software. Capacitively coupled resistivity has shown to beeffective in locating karst geohazards in the shallow subsurface.
INTRODUCTION
The Delaware Basin of west Texas and southeasternNew Mexico is the northern most extension of the Chi-huahuan Desert and is often referred to as the GypsumPlain (Hill, 1996). Throughout theGypsumPlain, signif-icant karst-geohazard manifestations have proven to bedetrimental for infrastructure maintenance. The researcharea, Ranch to Market (RM) 652, is a 54-kilometer sec-tion of roadway located on the northeastern edge of Cul-berson County, Texas (Fig. 1). The dominant outcropwithin the study area is the evaporitic Castile Formation,with moderate outcrop exposures of the Rustler Forma-tion in the eastern part of the study area (Fig. 2). Signi!-cant amounts of sur!cial karst phenomena commonlydevelop throughout the evaporite Castile Formation.Subsequent geohazards form from karsting, often char-acterized as sinkholes, solution conduits, and subsidencefeatures (Stafford and others, 2008).
Karst features that have substantial cover may not beeasily identi!ed by traditional mapping techniques, sat-ellite imagery, or aerial photos (Neukum and others,2010). Because of the length of the study area, a nonin-vasive, capacitively coupled resistivity technique wasused to locate the shallow karst phenomena beneathasphalt pavement without sur!cial expressions. Thismethod has been proven in numerous studies to be a reli-able technique in locating near-surface karst manifesta-tions,with similar studies being conducted in Florida andEurope (e.g., Garman and Purcell, 2004; Vadillo andothers, 2012; Samyn and others, 2014).
Known areas of signi!cant road failure, and the abun-dance of karst geohazard surface expressions, justi!edimaging this section of roadway in Culberson County,Texas. A continuous electrical resistivity survey wasconducted for approximately 54 kilometers on the west-bound lane of RM 652. Six sites exhibiting geophysicalanomalies that were veri!ed through excavation are
Woodard, Jonathan; Brown,Wesley; and Stafford, Kevin, 2021, Geophysical Delineation of Megaporosity and FluidMigration Pathways for Geohazard Characterization within the Delaware Basin, Culberson County, Texas, inJohnson, K. S.; Land, Lewis; and Decker, D. D. (eds.), Evaporite Karst in the Greater Permian Evaporite Basin(GPEB) of Texas, New Mexico, Oklahoma, Kansas, and Colorado: Oklahoma Geological Survey, Circular113, p. 177–187.
0LMBIPNB�Geological�Survey�Circular�113,�2021
Geophysical�Delineation�of�Megaporosity�and�Fluid�Migration�Pathways�forGeohazard�Characterization�within�the�Delaware�Basin,�Culberson�County,�Texas
Jonathan�Woodard,�Wesley�Brown,�and�Kevin�StaffordDepartment�of�Geology,�Stephen�F.�Austin�State�University,
Nacogdoches,�Texas
177

presented in thismanuscript to demonstrate the practical-ity and ef!ciency of using a continuous, alternatingcurrent (AC), resistivity method to image near-surfacekarst phenomena.
GEOLOGIC SETTING
The Delaware Basin of west Texas and southeasternNewMexico (Fig. 2) was a restricted Permian evaporiteintracratonic basin outlined by a 600–700 kilometer reefcomplex (Hill, 1996). During Late Mississippian andEarly Permian time, the convergence of Laurasia andGondwana resulted in the formation of Pangea. Subse-quent block faulting along Precambrian zones of weak-ness formed the Permian Basin, which is structurallysubdivided into the Midland Basin, Central Basin Plat-form, and Delaware Basin. Increased sediment loadingaided in further separating the Delaware Basin fromthe Central Basin Platform (Adams, 1962). Subsidencein the Pennsylvanian-Early Permian dominated thedepositional environment throughout the Permian,which caused the Delaware Basin to experience deep-water deposition until the end of Guadalupian time(Ross, 1981). During Guadalupian time, carbonatesformed the rim of the Delaware Basin margin and silici-calsticmaterial was deposited into the deep basin. Exten-sive reef growth encircled the Delaware Basin duringOchoan time, which restricted "ow of open-marinewaters, by closure of the Hovey Channel, creating adeep saline lake and conditions conducive for evaporitedeposition. While the Castile Formation is restricted tothe Delaware Basin, subsequent deposition of Saladoand Rustler formations capped the entire region, includ-ing surrounding basins (Scholle and others, 2004).
Throughout the early Mesozoic, the Delaware Basinwas tectonically inactive and relatively stable. This tec-tonic quiescence ended during the late Mesozoic whenthe Laramide Orogeny caused regional uplift and tiltingof the basin strata approximately 3–5° to the east-north-east. Following the Laramide Orogeny, a change fromcompression to extension occurred within the region,leading to the Basin and Range Phase, which is subdi-vided into three stages that affected the Delaware Basin:Transition Stage, Main Uplift Stage, and QuaternaryStage. Block faulting on thewestern side of theDelawareBasin during the Transition Stage is responsible forthe down-drop of the Salt Basin (Hill, 1996). Duringthe Main Uplift Stage, a shift of maximum stress, fromeast-northeast to west-northwest, formed northeast-trending, graben-boundary faults in the basin (Hentzand Henry, 1989). Throughout the Quaternary Stage,border faults continued to be active, with continuedmovement along the Salt Basin Quaternary faults(Hill, 1996).
Climate change within the Delaware Basin has had aprofound impact on the modern geomorphic nature ofthe Gypsum Plain, as the climate shifted from cooland wet in the Pleistocene to dry and arid in the Holo-cene. Today, the average precipitation ranges from 20to 40 cm, with an average annual temperature of 24°Cand average summertime high of 40°C. Rainfall typically
Figure 1. Geographic location of the study area; RM 652is black line that stretches across the northeastern cor-ner of Culberson County, Texas.
Figure 2. Map showing geographic orientation of theDelaware Basinwith respect to Texas. The general studyarea is identi!ed by the gray box, and primary geologicfeatures of the region are outlined (modi!ed afterStafford and others, 2008).
178 Jonathan Woodard, Wesley Brown, and Kevin Stafford
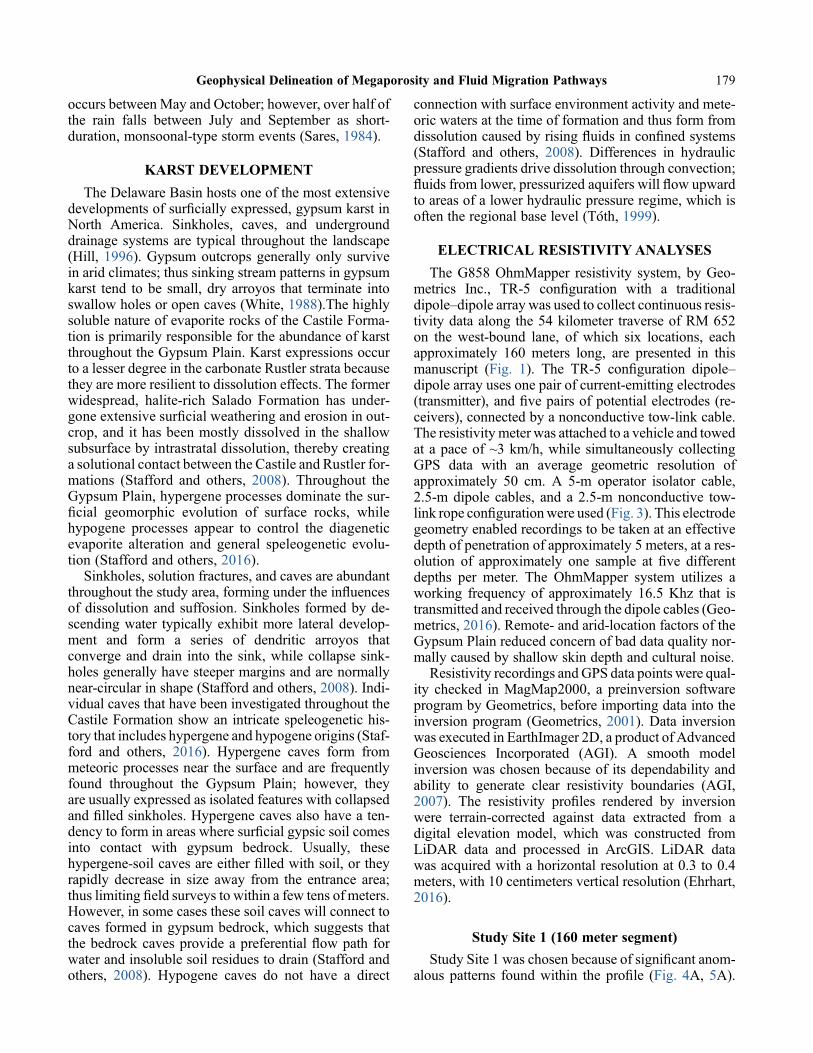
occurs between May and October; however, over half ofthe rain falls between July and September as short-duration, monsoonal-type storm events (Sares, 1984).
KARST DEVELOPMENT
The Delaware Basin hosts one of the most extensivedevelopments of sur!cially expressed, gypsum karst inNorth America. Sinkholes, caves, and undergrounddrainage systems are typical throughout the landscape(Hill, 1996). Gypsum outcrops generally only survivein arid climates; thus sinking stream patterns in gypsumkarst tend to be small, dry arroyos that terminate intoswallow holes or open caves (White, 1988).The highlysoluble nature of evaporite rocks of the Castile Forma-tion is primarily responsible for the abundance of karstthroughout the Gypsum Plain. Karst expressions occurto a lesser degree in the carbonate Rustler strata becausethey are more resilient to dissolution effects. The formerwidespread, halite-rich Salado Formation has under-gone extensive sur!cial weathering and erosion in out-crop, and it has been mostly dissolved in the shallowsubsurface by intrastratal dissolution, thereby creatinga solutional contact between the Castile and Rustler for-mations (Stafford and others, 2008). Throughout theGypsum Plain, hypergene processes dominate the sur-!cial geomorphic evolution of surface rocks, whilehypogene processes appear to control the diageneticevaporite alteration and general speleogenetic evolu-tion (Stafford and others, 2016).
Sinkholes, solution fractures, and caves are abundantthroughout the study area, forming under the in"uencesof dissolution and suffosion. Sinkholes formed by de-scending water typically exhibit more lateral develop-ment and form a series of dendritic arroyos thatconverge and drain into the sink, while collapse sink-holes generally have steeper margins and are normallynear-circular in shape (Stafford and others, 2008). Indi-vidual caves that have been investigated throughout theCastile Formation show an intricate speleogenetic his-tory that includes hypergene and hypogene origins (Staf-ford and others, 2016). Hypergene caves form frommeteoric processes near the surface and are frequentlyfound throughout the Gypsum Plain; however, theyare usually expressed as isolated features with collapsedand !lled sinkholes. Hypergene caves also have a ten-dency to form in areas where sur!cial gypsic soil comesinto contact with gypsum bedrock. Usually, thesehypergene-soil caves are either !lled with soil, or theyrapidly decrease in size away from the entrance area;thus limiting !eld surveys to within a few tens of meters.However, in some cases these soil caves will connect tocaves formed in gypsum bedrock, which suggests thatthe bedrock caves provide a preferential "ow path forwater and insoluble soil residues to drain (Stafford andothers, 2008). Hypogene caves do not have a direct
connection with surface environment activity and mete-oric waters at the time of formation and thus form fromdissolution caused by rising "uids in con!ned systems(Stafford and others, 2008). Differences in hydraulicpressure gradients drive dissolution through convection;"uids from lower, pressurized aquifers will "ow upwardto areas of a lower hydraulic pressure regime, which isoften the regional base level (Toth, 1999).
ELECTRICAL RESISTIVITYANALYSES
The G858 OhmMapper resistivity system, by Geo-metrics Inc., TR-5 con!guration with a traditionaldipole–dipole array was used to collect continuous resis-tivity data along the 54 kilometer traverse of RM 652on the west-bound lane, of which six locations, eachapproximately 160 meters long, are presented in thismanuscript (Fig. 1). The TR-5 con!guration dipole–dipole array uses one pair of current-emitting electrodes(transmitter), and !ve pairs of potential electrodes (re-ceivers), connected by a nonconductive tow-link cable.The resistivity meter was attached to a vehicle and towedat a pace of ~3 km/h, while simultaneously collectingGPS data with an average geometric resolution ofapproximately 50 cm. A 5-m operator isolator cable,2.5-m dipole cables, and a 2.5-m nonconductive tow-link rope con!gurationwere used (Fig. 3). This electrodegeometry enabled recordings to be taken at an effectivedepth of penetration of approximately 5 meters, at a res-olution of approximately one sample at !ve differentdepths per meter. The OhmMapper system utilizes aworking frequency of approximately 16.5 Khz that istransmitted and received through the dipole cables (Geo-metrics, 2016). Remote- and arid-location factors of theGypsum Plain reduced concern of bad data quality nor-mally caused by shallow skin depth and cultural noise.
Resistivity recordings andGPS data points were qual-ity checked in MagMap2000, a preinversion softwareprogram by Geometrics, before importing data into theinversion program (Geometrics, 2001). Data inversionwas executed in EarthImager 2D, a product of AdvancedGeosciences Incorporated (AGI). A smooth modelinversion was chosen because of its dependability andability to generate clear resistivity boundaries (AGI,2007). The resistivity pro!les rendered by inversionwere terrain-corrected against data extracted from adigital elevation model, which was constructed fromLiDAR data and processed in ArcGIS. LiDAR datawas acquired with a horizontal resolution at 0.3 to 0.4meters, with 10 centimeters vertical resolution (Ehrhart,2016).
Study Site 1 (160 meter segment)
Study Site 1 was chosen because of signi!cant anom-alous patterns found within the pro!le (Fig. 4A, 5A).
Geophysical Delineation of Megaporosity and Fluid Migration Pathways 179

Road failure and water ponding commonly occur aboveareas indicated to be collapse and/or void features;deeper resistivity surveys were required to further char-acterize collapse features. However, interpretations of“Cave 1” were con!rmed through !eld-check excava-tion, and other anomalous signatures that correspondedto its pattern were interpreted to be similar features(Fig. 6A). Traditionally, caves are de!ned by their abil-ity to allow for human entry; however, this study extendsthe de!nition of caves to even include features that arejust large enough to allow the passage of a substantialamount of sediment and "uid. This “Cave 1” featurewas approximately 30 cm tall, 2 meters wide, and par-tially !lled with water-saturated soil and void space tra-versing directly under the roadway. Surface runoff at thesite "ows to the northeast; surface expressions on thesouthern road margin collect runoff and sediment trans-porting it under the roadway.
Study Site 2 (160 meter segment)
Study Site 2 was selected for excavation to con!rmanomalous patterns seen in pro!le (Fig. 4B) and signi!-cant water ponding during the monsoonal season.Differential dissolution of gypsic soil, used as originalroadbase material during construction, resulted in !lledsink features and preferential soil piping under and alongthe survey path (Fig. 5B). Through !eld excavations, in-terpretations of this !lled sink were veri!ed, along withmany soil-piping features (Fig. 6B). This resistivitymethod was able to document many !lled sink geoha-zards that do not have sur!cial expression connectingdirectly to subsurface conduits that would otherwisereveal their presence. These sites represent areas of pref-erential ponding and increased in!ltration, leading toincreased dissolution of the gypsic soil road base.
Study Site 3 (160 meter segment)
Study Site 3 was selected for !eld evaluations so thatanthropogenic enhancement effects could be included inroad failure characterization. The resistivity pro!le alongthis segment indicated signi!cant void space (Fig. 4C).
This anomaly occurred proximal to a “toe wall” (i.e.,concrete-reinforced vertical barrier at the margin of theroad) that was designed to direct water away from theroadway and to maintain infrastructure stability, whichwas veri!ed by site excavation (Fig. 5C). A large conduit,approximately 11 cm in diameter, was uncovered at anapproximate depth of 1.5 m in the trench (Figure 6C).During excavation, substantial water and sedimentdrained through this solution conduit in the gypsum bed-rock as !eld excavations were underway, indicating anextensive dissolution network beneath the road at depth.Anomalous patterns, such as the ones identi!ed at StudySite 3, were seen on resistivity pro!les in areas associatedwith “toewalls” and drainage-retention berms throughoutthe study.
Study Site 4 (160 meter segment)
Brecciation is common within the Castile Formation,and resistivity pro!les at Study Site 4 show signi!cantanomalous patterns where analyses pass through a road-cut within a breccia pipe (Fig. 5D; Fig.7A). This studysite was located on a topographic high and descendeddown-slope perpendicular to the margin of the exposedbreccia pipe, which likely extends through the entirethickness of the Castile Formation. These features aregenerally recemented after collapse and most oftenexhibit low permeability conditions within the brecciacore; but they frequently possess higher permeabilitycharacteristics on their outer margins (Fig. 6D). Brecci-ation within the study area seems to be a result ofintrastratal dissolution of evaporites by hypogenicspeleogenesis, where a void was formed at depth andstoped upward (Stafford and others, 2008; Figure 9A).
Study Site 5 (160 meter segment)
Study Site 5 exhibited a resistivity pro!le that con-tained signi!cant soil piping anomalous patterns thatmatched previously excavated locations (Fig. 5E;Fig. 7B). As the roadway was elevated substantially inthis location during construction, the resistivity pro!ledoes not penetrate deep enough to identify a soil/rock
Figure 3. Diagram of OhmMapper TR-5 resistivity meter con!guration used and electrode geometries. This imageshows a TR5 con!guration, with a transmitter (Tx) and !ve receivers (Rx) that allow for !ve depths of investigationwhile continuously collecting resistivity data along a single traverse.
180 Jonathan Woodard, Wesley Brown, and Kevin Stafford

Figure 4. Resistivity inversion pro!les displayed at a 2:1 vertical to horizontal scale. (A) Site 1 inverted and interpreted section. RMS error= 9.60%,iteration= 5 (black dashed line is the soil–rock contact, black arrows are solution conduits, brown polygons are leached zones, and gray polygon isCave 1); (B) Site 2 inverted and interpreted section. RMS error= 9.13%, iteration= 6 (black solid arrows are solution conduits, black dashed arrowsare soil piping, and brown polygons are !lled sinks); C) Site 3 inverted and interpreted section. RMS error= 9.33%, iteration= 5 (black dashed lineis soil–rock contact, black arrows are solution conduits, red lines are fractured rock, brown polygon is !lled sink, and gray polygons are cave locations).
GeophysicalD
elineationof
Megaporosity
andFluid
Migration
Pathw
ays181
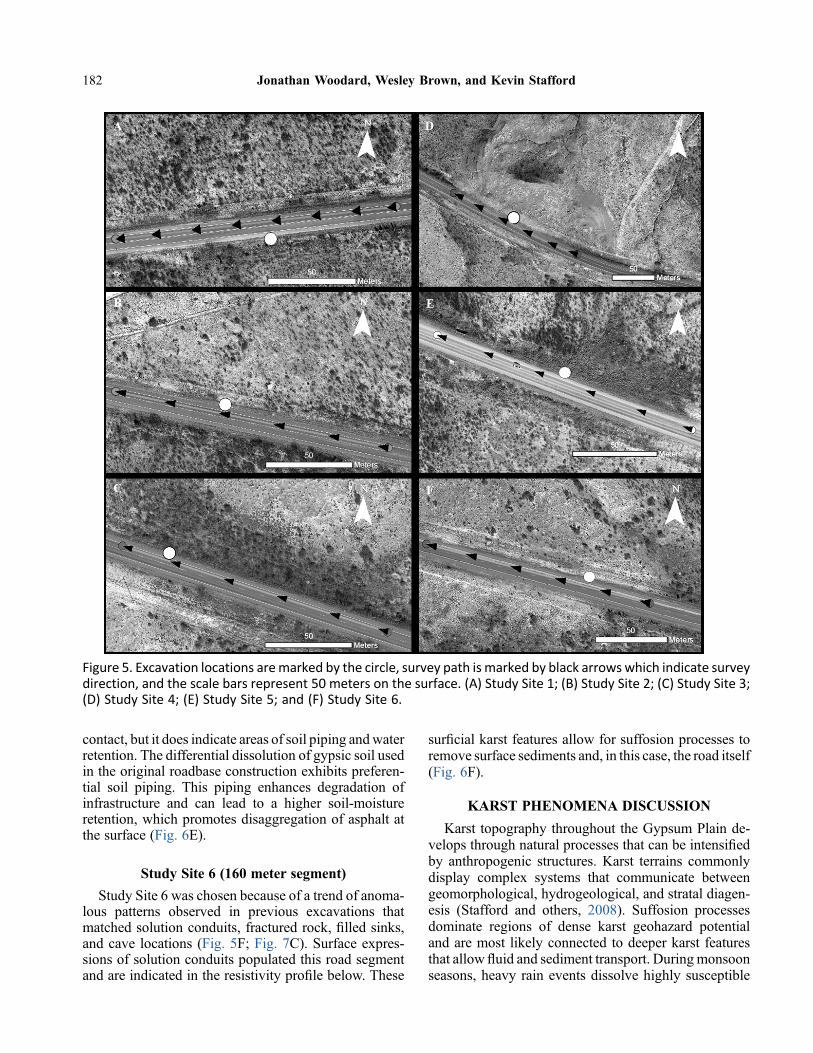
contact, but it does indicate areas of soil piping andwaterretention. The differential dissolution of gypsic soil usedin the original roadbase construction exhibits preferen-tial soil piping. This piping enhances degradation ofinfrastructure and can lead to a higher soil-moistureretention, which promotes disaggregation of asphalt atthe surface (Fig. 6E).
Study Site 6 (160 meter segment)
Study Site 6 was chosen because of a trend of anoma-lous patterns observed in previous excavations thatmatched solution conduits, fractured rock, !lled sinks,and cave locations (Fig. 5F; Fig. 7C). Surface expres-sions of solution conduits populated this road segmentand are indicated in the resistivity pro!le below. These
sur!cial karst features allow for suffosion processes toremove surface sediments and, in this case, the road itself(Fig. 6F).
KARST PHENOMENA DISCUSSION
Karst topography throughout the Gypsum Plain de-velops through natural processes that can be intensi!edby anthropogenic structures. Karst terrains commonlydisplay complex systems that communicate betweengeomorphological, hydrogeological, and stratal diagen-esis (Stafford and others, 2008). Suffosion processesdominate regions of dense karst geohazard potentialand are most likely connected to deeper karst featuresthat allow "uid and sediment transport. Duringmonsoonseasons, heavy rain events dissolve highly susceptible
Figure 5. Excavation locations aremarked by the circle, survey path is marked by black arrows which indicate surveydirection, and the scale bars represent 50 meters on the surface. (A) Study Site 1; (B) Study Site 2; (C) Study Site 3;(D) Study Site 4; (E) Study Site 5; and (F) Study Site 6.
182 Jonathan Woodard, Wesley Brown, and Kevin Stafford

evaporite rocks and widen solution fractures in gypsumbedrock. This solutional widening leads to greater suffo-sion piping rates of gypsic soil and induces failures,along with subsidence, under the margins and traversepath of the road within the study area.
Anthropogenically enhanced karst features are largelybecause of traditional road-construction techniquesduringinfrastructure development and subsequent maintenancestages. In areas along the road, complex resistivity pro!lescorrelatedwell with areas containing a concrete “toewall”and retention-berm emplacement, despite their purpose to
redirect"owaway from the thoroughfare. Insteadofmain-taining roadway integrity, these practices caused water topreferentially in!ltrate into the highly soluble, gypsicroad-base materials, dissolving the high gypsic content,allowing for focused "ow paths to form and increase per-meability. This gradual increase in "ow, coupled withheavy traf!c, can accelerate dissolution of gypsum bed-rock and suffosion, causing void geohazards to manifest,leading to collapse and road failure.
In survey locations such as Study Site 2 and Study Site5, where the road has been elevated with gypsic soil !ll,
Figure 6. (A) Photo of “Cave 1” at Study Site 1 partially !lled with soil and extending directly beneath RM 652;(B) photo of !lled sink feature along with preferential soil piping at Study Site 2 outlined by the white dashed lines;(C) photo of solution conduit likely enhanced by anthropogenic structures is indicated by the black arrow at StudySite 3; (D) photo of brecciation at Study Site 4 exhibiting pathways of preferential "uid "ow throughout collapsefeature; (E) photo of roadway failure along survey path induced by soluble nature of gypsic road base at Study Site 5;and (F) photo of a solution conduit expressed at Study Site 6; features such as this express themselves along theroadway as a result of dissolution and suffosion.
Geophysical Delineation of Megaporosity and Fluid Migration Pathways 183
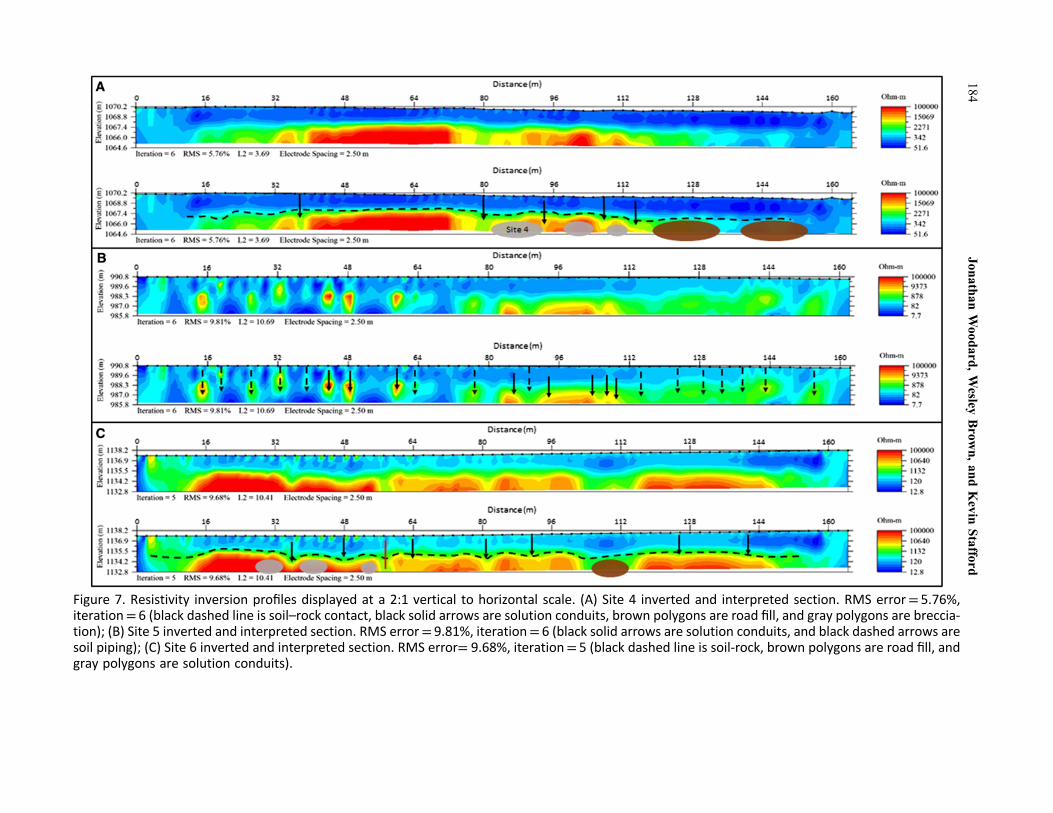
Figure 7. Resistivity inversion pro!les displayed at a 2:1 vertical to horizontal scale. (A) Site 4 inverted and interpreted section. RMS error= 5.76%,iteration= 6 (black dashed line is soil–rock contact, black solid arrows are solution conduits, brown polygons are road !ll, and gray polygons are breccia-tion); (B) Site 5 inverted and interpreted section. RMS error= 9.81%, iteration= 6 (black solid arrows are solution conduits, and black dashed arrows aresoil piping); (C) Site 6 inverted and interpreted section. RMS error= 9.68%, iteration= 5 (black dashed line is soil-rock, brown polygons are road !ll, andgray polygons are solution conduits).
184Jonathan
Woodard,
Wesley
Brow
n,and
Kevin
Stafford

the soil–rock contact is not seen in resistivity pro!les.However, signi!cant piping and frequent sinks are foundin areas where gypsic roadbase is abundant. These fea-tures lead to an increase in subsidence that can be seenon the surface, especially during rain events when waterponding occurs. Pro!les containing greater gypsic soil
than bedrock tend to have lower resistivity readings,but this is most likely because of soil water retention,which continues to weaken the road above it.
Surveys containing soil–rock contact layers showsigns of signi!cant dissolution and degradation of gyp-sum bedrock. Study Sites 1, 3, and 6 contain signature
Figure 8. Maps of the study area illustrating the spatial density of karst phenomena delineated by “CCR”methodsand the geologic formations associated with karsting. The density was measured by calculating the occurrence ofindividual geohazards per square kilometer. Top) Contains the beginning of the study area where RM 652 intersectsUS highway 62/180 and ends at TxDOT referencemilemarker 17.Bottom) beginswith TxDOT referencemilemarker17 and ends at TxDOT reference mile marker 34.
Geophysical Delineation of Megaporosity and Fluid Migration Pathways 185

anomalies that match surface expressions of fracturedgypsum bedrock that are solutionally widening. Thesefractures enable greater "uid migration, contributing toproximal suffusion processes and formation of cavesunder the roadway. At Study Site 1, the excavation loca-tion was on the opposite side of the road from the inter-preted resistivity pro!le, which was chosen to illustratekarst-feature communication under the road through anetwork of passageways.
Zones of brecciation are common throughout theCastile Formation; however, they vary in their origin.Blanket breccias frequently occur laterally over wide re-gions as thin layers, while breccia pipes are verticallyextensive but laterally limited (Stafford and others,2008). A roadcut at Study Site 4 exposes a brecciapipe that is represented as a topographic high, withabrupt changes in resistivity occurring along themarginsof the roadcut. While the cores of these features appearwell-cemented, high permeability appears to be domi-nant along the margin of breccia pipes. Further dissolu-tion and collapse of brecciated zone margins will lead toincreased piping and fracturing, allowing for a perpetu-ating cycle of increased dissolution at these locationsalong RM 652.
The karst-density distribution along the study areavaries according to geologic properties of shallow rocksand anthropogenic enhancements perpetuating suffusionand dissolution. These destructive geologic features pre-dominate on the western side of the study area, where theCastile Formation crops out (Fig. 8). Individual geoha-zards delineated through “CCR”methods aremost likelyunderestimated, compared with the total amount of ex-isting features. Therefore, a statistical analysis was exe-cuted based on hazard density to achieve amore accuraterepresentation of geohazard occurrences. Karst develop-ment typically suggests a fractal pattern where position-ing of large-scale phenomena perpetually repeats atsmaller scales (Stafford and others, 2016).
CONCLUSION
Karst features pose a signi!cant threat to infrastruc-ture within the Delaware Basin. The 54-kilometer-longsegment of RM 652 that traverses Culberson Countyis experiencing severe degradation because of differen-tial compaction and dissolution of soluble soil/rock in thesubsurface, preferential piping of roadbase material, andgeneral suffosion processes. Furthermore, traditionalengineering techniques used to control surface-waterdrainage have enhanced the formation of karst in thestudy area. Numerous karst surface expressions havebeen surveyed along the study area and in adjacent pri-vate properties (Ehrhart, 2016). Large sinks, solutionalfractures, and caves are forming a network of conduitsthroughout the study area, which enhance subsurface"uid "ow along with road failure. Field excavations
con!rm capacitively coupled resistivity to be a success-ful noninvasive method in locating signi!cant karst fea-tures, while being a cost-effective and time-ef!cientmethod to cover long distances. These 2D resistivity sur-veys, along with hydrogeologic knowledge of the area,were crucial in interpretation and characterization of thestudy area.
The use of noninvasive, geophysical methods to char-acterize subsurface phenomena, such as karst, should beused to aid in development and maintenance of infra-structure. This method can provide insight into signi!-cant problems in the subsurface that could otherwiseremain undetected and cause catastrophic failure and!nancial burden.
ACKNOWLEDGMENTS
This research was partially funded by the TexasDepartment of Transportation (TxDOT), with supportfrom the Department of Geology at Stephen F. AustinState University. The authors are thankful for the gener-ous !eld assistance of individuals that made this workpossible: Aaron Eaves, Adam Majzoub, and NikoWelch. Appreciation is expressed to Melinda Faulknerfor her review of this manuscript and helpful contribu-tions to its improvement.
REFERENCES CITED
Adams, J.E., 1962, Foreland Pennsylvanian rocks ofTexas and eastern New Mexico, in Branson, C.C.,ed., Pennsylvanian system in the United States:American Association of Petroleum Geology, Tulsa,OK, p. 372-384.
AGI, 2007, Instruction Manual for EarthImager 2DResistivity and IP Inversion Software: Austin, TX,Advanced Geosciences, Inc., 139 p.
Ehrhart, J.T., 2016, Speleogenesis and delineation ofmegaporosity and karst geohazards through geologiccave mapping and LiDAR analyses associated withinfrastructure inCulbersonCounty, Texas: unpublishedMS thesis, Stephen F. Austin State University, 148 p.
Garman, K.M., and Purcell, S.F., 2004, Applications forCapacitively Coupled Resistivity Surveys in Florida:The Leading Edge, Vol. 23, No. 7, p. 697-698.
Geometrics, 2001, Geometrics Operation Manual:OhmMapper TR1, 29005-01, Rev. F. 134 p.
Geometrics, 2016,OhmMapper:<http://www.geometrics.com/geometrics-products/geometrics-electro-magnetic-products/ohm-mapper>. Accessed December 13, 2016.
Hentz T.F., and Henry, C.D., 1989, Evaporite-hostednative sulfur in Trans-Pecos Texas: Relation tolate-phase Basin and Range deformation: Geology,Vol. 17, p. 400-403.
186 Jonathan Woodard, Wesley Brown, and Kevin Stafford

Hill, C.A., 1996, Geology of the Delaware Basin,Guadalupe, Apache andGlassMountains: NewMexicoand West Texas: Permian Basin Section – SEPM,Midland, TX, 480 p.
Neukum, C., Grutzner, C., Azzam, R., and Reicherter,K., 2010, Mapping buried karst features withcapacitive-coupled resistivity system (CCR) andground penetrating radar (GPR): Advances inResearch in Karst Media, p. 429-434.
Ross, C.A., 1981, Pennsylvanian and Early Permian his-tory of the Marathon Basin, West Texas, in Pearson,B.T., ed., Marathon-Marfa region of West Texas:Permian Basin Section – SEPM, Guidebook 81-20,p. 135-144.
Samyn, K., Mathieu, F., Bitri, A., Nachbaur, A., andClosset, L., 2014, Integrated geophysical approachin assessing karst presence and sinkhole susceptibilityalong "ood-protection dykes of the Loire River,Orléans, France: Engineering Geology, Vol. 183,p. 170-194.
Sares, S.W., 1984, Hydrologic and geomorphic develop-ment of a low relief evaporite karst drainage basin,southeast New Mexico: unpublished MS thesis,University of New Mexico, 123 p.
Scholle, P.A., Goldstein, R.H., and Ulmer-Scholle, D.S.,2004, Classic Upper Paleozoic reefs and bioherms of
West Texas andNewMexico: NewMexico Institute ofMining and Technology, Socorro, NM, 166 p.
Stafford, K., Nance, R., Rosales-Lagarde, L., and Bos-ton, P., 2008, Epigene and hypogene gypsum karstmanifestations of theCastile Formation: EddyCounty,New Mexico and Culberson County, Texas, USA:International Journal of Speleology, Vol. 37, p. 83-98.
Stafford, K.W., Brown,W., Ehrhart, J.,Majzoub, A., andWoodard, J., 2016, 2016 Karst Geohazard Characteri-zation of RM 652: Phase Two of Karst Developmentand Geohazards Associated with RM 652 in Culber-son County, Texas: Report to El Paso District Of!ceof Texas Department of Transportation, 94 p.
Toth, J., 1999, Groundwater as a geologic agent andoverview of the causes, processes, andmanifestations:Hydrogeology Journal, Vol. 7, p. 1-14.
Vadillo, I., Benavente, J., Neukum, C., Grutzner, C.,Carrasco, F., Azzam, R., Linán, C., and Reicherter,K., 2012, Surface geophysics and borehole inspectionas an aid to characterizing karst voids and vadose ven-tilation patterns (Nerja research site, S. Spain): Journalof Applied Geophysics, doi: https://doi.org/10.1016/j.jappgeo.2012.03.006.
White, W.B., 1988, Geomorphology and hydrology ofkarst terrains: Oxford University Press, New York,464 p.
Geophysical Delineation of Megaporosity and Fluid Migration Pathways 187


ABSTRACT.—The Gypsum Plain of the Delaware Basin hosts approximately1800 km2 of Castile Formation outcrop with extensive evaporite-karst develop-ment. Karst studies on the distribution and speleogenetic evolution of Castile stratabegan within the last decade with ever-increasing data resolution. This study com-bines physical !eld surveys with the analyses of high-resolution (~30-cm accuracy)LiDAR data to create a karst model across the region. The idealized model con-siders speleogenesis (hypogene and epigene), density of karst features, lithology,and connection between the local hydrostratigraphy and regional hydrogeology.Field studies involved physical mapping of 20 km2 of the Gypsum Plain fromthe Castile’s western outcrop to where it dips into the subsurface to the east, includ-ing the documentation of sur!cally expressed karst phenomena and mapping of allenterable caves for morphological assessment. Hypogene and epigene caves aresur!cally expressed across the region and indicate that many caves have beenaffected by multistage epigenetic development or multistage hypogenetic develop-ment with epigenetic overprinting. LiDAR data were processed to create digital-elevation models (DEM) and to determine the effectiveness/accuracy of !eldsurveys compared to remote-sensing techniques. Previous works in the area deter-mined that remote sensing preserved roughly 36% of all karstic features foundthrough physical !eld surveys. However, because of the advancements inremote-sensing accuracy, this study determined that on average, LiDAR analysisallows for the identi!cation of almost seven times more karstic features than phys-ical surveys over a given area.
INTRODUCTION
The Gypsum Plain of west Texas hosts a plethora ofkarstic exposures that haveonly recently been investigatedin detail within the last decade (Stafford, 2008a, b).The area has been affected by signi!cant dissolutionthroughout geologic history which has resulted in theformation of a highly karstic and cavernous landscape.The larger and more famous carbonate caves of theCapitan Formation, such as Carlsbad Caverns andLechuguillaCave to the north, have been extensively stud-ied because of their largely complex and expansive cavesystems. The widespread evaporite karst of the PermianGypsum Plain has traditionally been overlooked and gen-erally understudied. This is despite the fact that karst fea-tures of the Delaware Basin provide some of the mostprominent displays of gypsum karst in North America.
Within the Delaware Basin, the primary formation thathosts cavernous porosity is the soluble gypsum andanhydrite of the Castile Formation. Because of the highlysoluble nature, the Castile Formation has undergone asigni!cant amount of dissolution for deposition and con-tains extensive cave and karst features (Stafford andothers, 2008b). The caves found within the Castile For-mation formed by both epigene and hypogene processes;however, understanding the timing of when each disso-lution process affected the Castile can be dif!cult, asmany hypogene caves have been heavily overprintedby epigene processes. Throughout the Castile, karst fea-tures vary from sur!cial karren, sinkholes, and solutionbreccias to large complex caves that have been affectedbymultiple processes (Stafford, 2008a). The objective ofthis study is to improve evaporate-karst characterizationwithin the Delaware Basin by creating an idealized karst
Ehrhart, Jon T.; and Stafford, Kevin, 2021, SpeleogeneticModel of Evaporite-Karst Occurrences of theGypsumPlainUsingKarstMapping and LiDARAnalyses in Culberson County, Texas, USA, in Johnson, K. S.; Land, Lewis; andDecker, D. D. (eds.), Evaporite Karst in the Greater Permian Evaporite Basin (GPEB) of Texas, New Mexico,Oklahoma, Kansas, and Colorado: Oklahoma Geological Survey, Circular 113, p. 189–200.
0LMBIPNB�Geological�Survey�Circular�113,�2021
Speleogenetic�Model�of�Evaporite-Karst�Occurrences�of�the�Gypsum�PlainUsing�Karst�Mapping�and�LiDAR�Analyses�in�Culberson�County,�Texas,�USA
Jon�T.�Ehrhart�and�Kevin�W.�StaffordDepartment�of�Geology,�Stephen�F.�Austin�State�University,
Nacogdoches,�Texas
189

model.�This�model�provides�a�look�at�the�variability�in�speleogenetic�evolution�and� the�hydrologic� framework�that�exists�across�the�Gypsum�Plain�in�relation�to�the�geo-morphic�landscape.
Study�AreaLocated�in�the�Delaware�Basin,�the�study�area�sits�atop�
an�extremely�large�depocenter�where�over�a�billion�years�of�the�rock�record�is�preserved,�ranging�from�the�1.3�by�old�Precambrian�basement� to� the� less� than�10,000�ybp�Holocene�sediments� (Hill,�1996).�The�Delaware�Basin�is� bound� on� its� periphery� by� a� series� of� exposed� reef�structures:� to� the� west� by� the� Apache�Mountains,� to�the�north�by�the�Guadalupe�Mountains,�to�the�south�by�the�Glass�Mountains,�and�to�the�east�by�the�Central�Basin�Platform.�The�large�Gypsum�Plain�that�encompasses�the�area� is�primarily�blanketed�by� the�Ochoan�Castile�and�Rustler� deposits� at� the� surface� (Fig.�1).� Speci!cally,�this� study� focuses� on� the� northern� part� of� Culberson�County,� Texas,� extending� ~35� km� south� of� the� New�Mexico�border�and�50�km�west�to�east�across�the�Castile�outcrop� region,� encompassing� the� region� of�Ranch� to
Market Road (RM) 652 (Fig. 1). The study area wasselected as a representative subsection of the GypsumPlain to investigate the variations in karst developmentin line with stratal dip that trends west to east.
Physiographically, the study area is located on theeastern edge of the Basin and Range province and north-ern edge of the Chihuahuan Desert. The Trans-Pecosregion is primarily a desert/semiarid environment withscant precipitation, rapid evaporation, moderate winters,and afternoon showers in spring months. The GypsumPlain receives less than 300 mm of precipitation peryear (Beuchner, 1950), where average temperature isless variable than the rainfall, with mean summer tem-peratures ranging from 24°C to 30°C; however, temper-atures can reach upwards of 38°C.
Geologic Setting
Late Permian sequences in the Delaware Basin aredivided into two main series: Guadalupian Series(271–260 mya) and Ochoan Series (260–251 mya)(Adams, 1965) (Fig. 2). The Guadalupian Series repre-sents deposition of a thick, clastic, basin-!lling facieswith approximately 900–1200 m of total sediment(Hills, 1984). During this time, the periphery of thebasin was dominated by reef growth where the reef crestrose approximately 500 m above the basin "oor. Thecentral part of the basin was dominated by sandstonesand siltstones, the marginal areas by limestone deposits,and the backreef formed evaporite lagoons (Adams,1965). Continued subsidence provided accommodationspace for the central basin formations such as theCherry Canyon, Brushy Canyon, and Bell Canyon tobe deposited. These formations represent the clastic-dominated, primarily terrigenous, sediments thatwere deposited during episodic sea-level "uctuationsduring the Guadalupian when shelf environmentswere subaerially exposed (Scholle and others, 2004).In the closing stages of the Guadalupian, the PermianBasin became relatively tectonically stable and
Figure 1. Regional map displaying the generalized loca-tion of Permian strata outcropswithin theGypsumPlainand study area outlined (modi!ed from Stafford andothers, 2008a).
Figure 2. Stratigraphic section from the Shelf (North) toDelaware Basin (South) of lithologic units within thestudy area (adapted from Scholle and others, 2004).
190 Jon T. Ehrhart and Kevin W. Stafford

carbonate sedimentation was terminated (Adams,1965). Scholle and others (2004) postulate that this islargely due the increased basin restriction that begannear the end of the Guadalupian.
Following the Guadalupian, Ochoan evaporite forma-tions were deposited (260–251mya). Although there aremany controversial aspects regarding the exact deposi-tional mechanisms that affected the Delaware Basin atthe onset of the Ochoan (Kirkland, 2003), it is widelyaccepted that continual restriction of evaporite seasfrom the open ocean resulted in deposition of the !rstphase of evaporite !lling within the Delaware Basin.This closure marks the onset of Ochoan time and thecommencement of Castile Formation deposition, whichreaches approximately 550 m in thickness in the north-ern basin (Scholle and others, 2004). TheCastile consistsof millimeter-scale interbedded laminae of gypsum,anhydrite, organicmatter, and calcite. Interbedded layershave been interpreted as varves and represent seasonalsalinity "uxes (Scholle and others, 2004). The distinctcharacteristic of large-scale laterally continual lamina-tions and a lack of shallow water sedimentary structuressuggest that the Castile was deposited in deep waterthat ultimately !lled the entire basin (Scholle and others,2004).
The Castile Formation grades conformably into theSalado which extends far beyond the margins of theDelaware Basin and crosses the Guadalupian reef andshelf facies forming an unconformity boundary (Kelley,1971; Hill, 1996). The Salado Formation contains lami-nated halite, anhydrite, sylvite, other evaporites, andminor amounts of siliciclastic material, but does notgenerally appear in outcrop throughout the DelawareBasin because of its highly soluble nature (Scholle andothers, 2004). Rustler strata cap Salado deposits andmark the !nal evaporite sequence deposited during theOchoan. During this time, sea-level incursion and subse-quent transgressions and regressions deposited cycliclayers of large-scale limestone–dolomite and anhydrite–gypsum deposits (Hill, 1996).
Following Ochoan time, the Delaware Basin began toshift from a marine sedimentation depocenter to a posi-tive area dominated by clastic sedimentation. During thelate Cretaceous to early Tertiary, the Laramide Orogenypermanently uplifted the region above the sea level (Hill,1996), tilting the Delaware Basin eastward approxi-mately 3–5° and elevating it 1.2 km above the sea levelon the western side, where it remains today (Horak,1985). Subsequent to the Laramide uplift, Basin andRange extension commenced and lasted from 30 myato present, producing conjugate jointing and fault setsoriented approximately N75E and N15W throughouttheGypsumPlain (Nance, 1993).Many of the karstic de-velopments within the Gypsum Plain have been a prod-uct of these conjugate fractures as well as Quaternary
climate change. During the middle-to-late Pleistocene,the climate in the Delaware Basin alternated betweendrier and warmer periods to colder and moister periods(Hill, 1996). Today, the Gypsum Plain has transitionedback into an arid, dry climate. However, because ofthe highly soluble nature of the Gypsum Plain, the cur-rent landscape displays many geomorphic traces of itspreviously wetter history.
METHODOLOGY
To characterize karst evolution across the GypsumPlain, traditional cave surveys were coupled withremote-sensing analyses to investigate the spatial distri-bution of karst features and to assess the hydrogeologicalcontrols on speleogenesis. Spatial analyses of solutionalconduits were accomplished through traditional cavemapping, overland surface mapping, and the analysesof remote-sensing LiDAR data (Light Detection andRanging). Data collection and analyses were focusedproximal to roads within the study area in conjunctionwith a large geohazard characterization project by theTexas Department of Transportation. Traverse-basedsurveys were conducted across the Gypsum Plain fromwest to east in northern Culberson County. The surveyarea ran along a 55-km stretch of RM652 within100 m of the right of way. The 13.1 km2 of total surfacesurvey was conducted at 20-m traverse spacing, and allkarst features identi!ed greater than 10 cm in diameterwere recorded and classi!ed in the !eld. All caves dis-covered large enough for human entry were enteredand mapped using standard cave surveying techniques.Morphometric features and lithologic variations werenoted within surface surveys and cave maps to assistin speleogenesis assessment.
LiDAR data used for this study included approxi-mately 20 km2 of data acquired in approximately 300-m wide swaths along RM652 in northern CulbersonCounty. Data have an average horizontal resolution of~30 cm and vertical resolution of 10 cm for bare earthLiDAR returns. From these data, the delineation of sink-holes was accomplished through the processing of “!ll-difference” digital elevation models (DEMs) to identifyareas topographically lower than the surrounding landsurface. All sinkhole features less than 10 cm in depthwere removed, as they fell below the resolution of data.However, depressions associated with roadway con-struction and other man-made features such as pondswere also identi!ed through LiDAR processing; theseanthropogenic/nonkarst features were removed manu-ally. Final data reduction resulted in a map that containsnatural sinkholes (i.e., karst features) as determined byLiDAR analyses. Density plots were calculated basedon some features per square kilometer to interpret lateralvariability in regional karst development.
Speleogenetic Model of Evaporite-Karst Occurrences of the Gypsum Plain 191
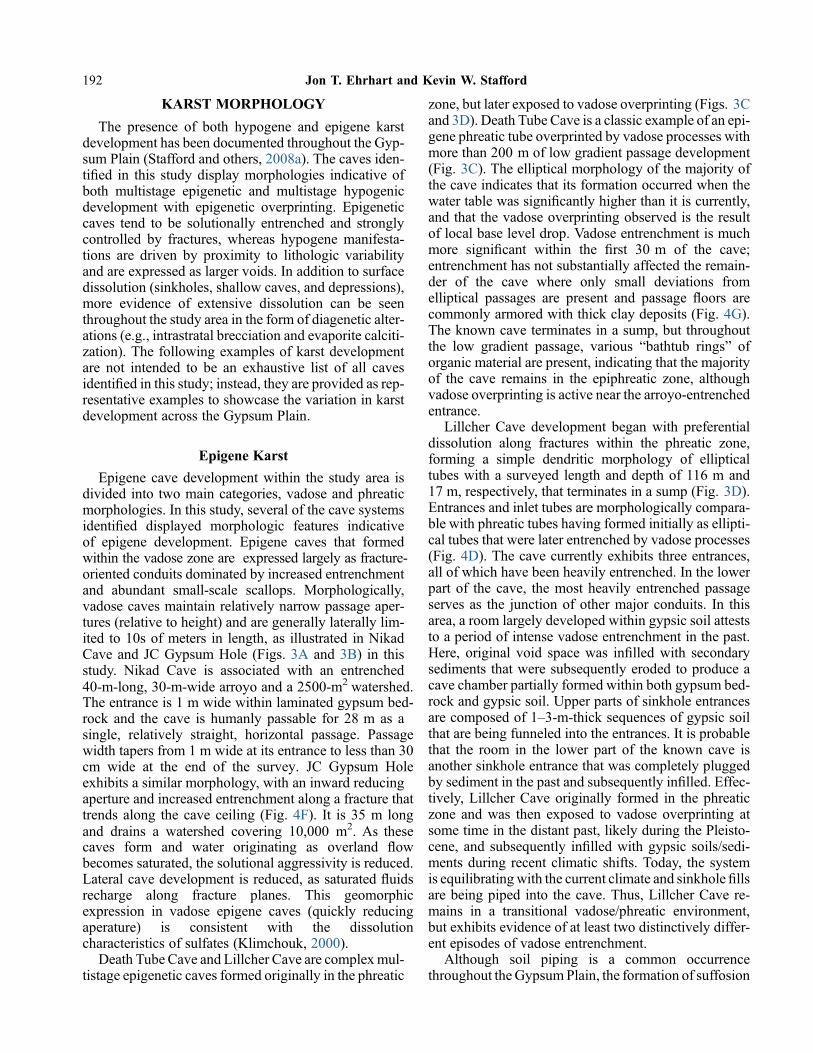
KARST�MORPHOLOGY
The� presence� of� both� hypogene� and� epigene� karst�development�has�been�documented�throughout�the�Gyp-sum�Plain�(Stafford�and�others,�2008a).�The�caves�iden-ti!ed� in� this� study�display�morphologies� indicative�of�both� multistage� epigenetic� and� multistage� hypogenic�development�with� epigenetic� overprinting.� Epigenetic�caves� tend� to� be� solutionally� entrenched� and� strongly�controlled� by� fractures,�whereas� hypogene�manifesta-tions� are� driven� by� proximity� to� lithologic� variability�and�are�expressed�as�larger�voids.�In�addition�to�surface�dissolution�(sinkholes,�shallow�caves,�and�depressions),�more� evidence� of� extensive� dissolution� can� be� seen�throughout�the�study�area�in�the�form�of�diagenetic�alter-ations�(e.g.,�intrastratal�brecciation�and�evaporite�calciti-zation).�The� following�examples�of�karst�development�are� not� intended� to� be� an� exhaustive� list� of� all� caves�identi!ed�in�this�study;�instead,�they�are�provided�as�rep-resentative�examples�to�showcase�the�variation�in�karst�development�across�the�Gypsum�Plain.
Epigene�Karst
Epigene� cave�development�within� the� study� area� is�divided� into� two�main�categories,�vadose�and�phreatic�morphologies.�In�this�study,�several�of�the�cave�systems�identi!ed� displayed� morphologic� features� indicative�of� epigene� development.� Epigene� caves� that� formed�within the vadose zone are �expressed�largely�as�fracture-oriented�conduits�dominated�by�increased�entrenchment�and� abundant� small-scale� scallops.� Morphologically,�vadose�caves�maintain� relatively�narrow�passage�aper-tures�(relative�to�height)�and�are�generally�laterally�lim-ited� to�10s�of�meters� in� length,�as� illustrated� in�Nikad�Cave�and� JC�Gypsum�Hole� (Figs.�3A�and�3B)� in� this�study.� Nikad� Cave� is� associated� with� an� entrenched40-m-long,�30-m-wide�arroyo�and�a�2500-m2�watershed.�The�entrance�is�1�m�wide�within�laminated�gypsum�bed-rock� and� the� cave� is�humanly� passable� for� 28�m� as� a�single,� relatively� straight,� horizontal� passage.� Passage�width�tapers�from�1�m�wide�at�its�entrance�to�less�than�30�cm� wide� at� the� end� of� the� survey.� JC� Gypsum� Hole�exhibits�a�similar�morphology,�with�an�inward�reducing�aperture�and�increased�entrenchment�along�a�fracture�that�trends� along� the� cave� ceiling� (Fig.�4F).� It� is�35�m� long�and� drains� a� watershed� covering� 10,000� m2. AT these�caves� form� and� water� originating� as� overland� "ow�becomes�saturated,�the�solutional�aggressivity�is�reduced.�Lateral�cave�development� is� reduced,�as�saturated�"uids�recharge� along� fracture� planes.� This� geomorphic�expression� in� vadose� epigene� caves� (quickly� reducing�aperature)� is� consistent� with� the� dissolution�characteristics�of�sulfates�(Klimchouk,�2000).
Death�Tube�Cave�and�Lillcher�Cave�are�complex�mul-tistage�epigenetic�caves�formed�originally�in�the�phreatic
zone, but later exposed to vadose overprinting (Figs. 3Cand 3D). Death Tube Cave is a classic example of an epi-gene phreatic tube overprinted by vadose processes withmore than 200 m of low gradient passage development(Fig. 3C). The elliptical morphology of the majority ofthe cave indicates that its formation occurred when thewater table was signi!cantly higher than it is currently,and that the vadose overprinting observed is the resultof local base level drop. Vadose entrenchment is muchmore signi!cant within the !rst 30 m of the cave;entrenchment has not substantially affected the remain-der of the cave where only small deviations fromelliptical passages are present and passage "oors arecommonly armored with thick clay deposits (Fig. 4G).The known cave terminates in a sump, but throughoutthe low gradient passage, various “bathtub rings” oforganic material are present, indicating that the majorityof the cave remains in the epiphreatic zone, althoughvadose overprinting is active near the arroyo-entrenchedentrance.
Lillcher Cave development began with preferentialdissolution along fractures within the phreatic zone,forming a simple dendritic morphology of ellipticaltubes with a surveyed length and depth of 116 m and17 m, respectively, that terminates in a sump (Fig. 3D).Entrances and inlet tubes are morphologically compara-ble with phreatic tubes having formed initially as ellipti-cal tubes that were later entrenched by vadose processes(Fig. 4D). The cave currently exhibits three entrances,all of which have been heavily entrenched. In the lowerpart of the cave, the most heavily entrenched passageserves as the junction of other major conduits. In thisarea, a room largely developed within gypsic soil atteststo a period of intense vadose entrenchment in the past.Here, original void space was in!lled with secondarysediments that were subsequently eroded to produce acave chamber partially formed within both gypsum bed-rock and gypsic soil. Upper parts of sinkhole entrancesare composed of 1–3-m-thick sequences of gypsic soilthat are being funneled into the entrances. It is probablethat the room in the lower part of the known cave isanother sinkhole entrance that was completely pluggedby sediment in the past and subsequently in!lled. Effec-tively, Lillcher Cave originally formed in the phreaticzone and was then exposed to vadose overprinting atsome time in the distant past, likely during the Pleisto-cene, and subsequently in!lled with gypsic soils/sedi-ments during recent climatic shifts. Today, the systemis equilibratingwith the current climate and sinkhole !llsare being piped into the cave. Thus, Lillcher Cave re-mains in a transitional vadose/phreatic environment,but exhibits evidence of at least two distinctively differ-ent episodes of vadose entrenchment.
Although soil piping is a common occurrencethroughout theGypsumPlain, the formation of suffosion
192 Jon T. Ehrhart and Kevin W. Stafford

caves is the least documented occurrences of karst in thearea. These caves form as small-to-large-scale sedimentpiping features and can exhibit much larger passages andspatial extent than previously thought. Filled sinks thatare actively opening through suffusion (like those seen
in Lillcher Cave) are not uncommon. The upper passageof Death Tube Cave formed along the bedrock/gypsicsoil contactwhich acts as a signi!cant differential perme-ability horizon. This horizontal contact is intercepted byvertical fractures that follow a similar trend to the lower
Figure 3. Simpli!ed cave maps that represent typical epigene vadose (3A: Nikad and 3B: JC Gypsum Hole), epigenephreatic (3D: Lillcher and 3C: Death Tube), and hypogene (3F: Wiggley and 3E: Fissure) developments that weresurveyed across the study area in both plan and pro!le views. Parts of Lillcher and Death Tube caves are suffosionfeatures as represented in tan color in plan and pro!le views; blue indicates water at time of survey.
Speleogenetic Model of Evaporite-Karst Occurrences of the Gypsum Plain 193

Figure 4. Epigenetic and hypogenetic morphological features found throughout the study area: (A) large hypogenedome (Fissure Cave); (B) soil suffosion chamber (Upper Death Tube Cave); (C) brecciated zone (Breccia Pipe);(D) phreatic tube overprinted by entrenchment (Lillcher Cave); (E) cupolas in relict passage (Fissure Cave); (F) epi-gene vadose entrenchment (JC Gypsum Hole Cave); and (G) elliptical phreatic tube (Death Tube Cave) Note: blackand white bars represent 50 cm.
194 Jon T. Ehrhart and Kevin W. Stafford

passage where suffosion products are being piped into. Itis likely that this 40-m-long soil cave formed duringback"ooding events when "uids are injected laterallyalong the gypsum/soil contact at the entrance and verti-cally from fractures connecting soil and bedrock parts ofthe cave. Fluidization of partially lithi!ed sediments re-sulted in upward stoping and soil cave formation (Fig. 4B)in the upper chamber of Death Tube Cave. A series of25-cm-diameter inlet piping tubes in the soil cave ceilingfollow a fracture and appear to have formed as small-scale piping features during normal precipitation events.
The examples above represent greater complexity ofepigene cave development than has been previouslydocumented in the Castile Formation. Signi!cant epi-gene cave development within the phreatic zone hasnot been previously reported. In addition, prior to thisstudy, extensive suffosion caves were unreported inthis region. However, current research suggests that suf-fosion caves may extremely be common and can reach asigni!cant size, provided that there is a suf!cient outletfor the removal of insoluble clastic particles, eitherthrough a cave conduit as described above, or throughhighly fractured media.
Hypogene Karst
In contrast to epigene cave development, hypogeniccaves form in semicon!ned systems based on pressureand density gradients and are not directly associatedwith sur!cial processes during formation. As suggestedby Klimchouk (2007), the identi!cation of hypogenekarst can be dif!cult because of the nature of their origin;hypogene caves can only be explored by cavers after theyhave been breached or decoupled from the environmentin which they formed and commonly exhibit epigeneticoverprinting. The primary criteria for identifying thesehypogenetic features are the caves morphologicalexpression and hydrostratigraphic position (Klimchouk,2007). Hypogene caves likely comprise more than halfof the total cave development throughout the GypsumPlain, but sur!cial expression through surface denuda-tion breaching is spatially limited (Stafford and others,2008b). Although hypogenic caves are common acrossthe Gypsum Plain, they are somewhat atypical of mostreported hypogene manifestations (e.g., Klimchouk,2007) in that complex maze caves are largely undocu-mented. Instead, single riser features are most prevalent.
In this study, several of the cave systems identi!eddisplayed morphologic features indicative of hypogenedevelopment. Fissure and Wiggley caves are typicalhypogene features of the Gypsum Plain with morpholo-gies composed primarily of large, single, ascending pas-sages with numerous cupolas, ceiling channels, anddomeswhich are indicative of ascending "uids (Figs. 3Eand 3F). These cave examples occur on the western edgeof the Gypsum Plain where the contact with underlying
Bell�Canyon�clastics�is�less�than�60�m.�Although�they�are�not� the�most� extensive� hypogene� caves� known� in� the�Castile�Formation,� they�share�similar�morphologic�and�hydrostratigraphic�characteristics� to�much�larger�hypo-genetic�caves�found�within�the�area�(Stafford�and�others,�2008a).
Wiggley� Cave,� similar� to� Border� Cave� in� the�proximal�region�(TSS,�2016),�is�189�m�long,�49�m�deep,�and�gives�access�to�a�lower�level�lake�room.�The�cave�is�heavily�entrenched�by�vadose�overprinting�which�forms�a�meandering�canyonlike�passage�that�ranges�from�2�m�tall�near�the�entrance�to�over�15�m�tall�in�the�lower�parts.�The�ceiling�of�Wiggley�Cave�remains�level�for�extended�sections�as�an�elliptical�tube�with�common�cupolas�con-nected�by�an�undulating�ceiling�channel.�In�several�sec-tions,� small� pits� occur� which� correlate� directly� with�larger�ceiling�domes�and�show�consistent�morphologies�of�upward�migrating�"uids�along�the�ceiling�with�subse-quent�vadose�"oor�entrenchment.�The�lowest�cave�part�descends�from�a�dome�pit�into�a�lake�room�of�inde!nite�depth�and�approximately�20�m� in�diameter.�Anecdotal�reports� from�divers�of�other� similar� lake� rooms� in� the�area� indicated� that� these� features�can�extend�more� than�40�m� deep.�Wiggley� Cave�was� formed� by� ascending�"uid�sourced�from�the�underlying�Bell�Canyon�Aquifer�as� a� large� dissolution� chamber� formed� near� the� Bell�Canyon� and� Castile� contact.� In� addition� to� the� lake�room,� the�cave�exhibits�a�single�riser� tube� that�follows�fracture�planes.�Once�the�surface�was�breached,�vadose�entrenchment� signi!cantly�overprinted� the� cave� and� it�currently�has�an�associated�watershed�of�approximately�60,000�m2.
Fissure�Cave� has� a� surveyed� length� of� 116�m� and�depth� of� 17�m� (Fig.�3E),� forming� a� multilevel� and�fracture-controlled� hypogene� cave� that� is� moderately�overprinted�by�vadose�entrenchment.�At�Fissure�Cave’s�inception,� fractures� provided� pathways� for� ascending�"uids�with�preferential� lateral�migration� along� soluble�gypsum� laminae.� Lower� level� passages� contain� large�domes�and�abundant�cupolas.�The�majority�of�ceilings�and�walls�are�completely�smooth�from�ascending�waters�in�a�sluggish�"ow�regime�(Fig.�4E).�In�upper�parts�of�the�cave,�large�domes�extend�more�than�5�m�as�vertical�risers�(Fig.�4A)� and� it� is� probable� that� the� entrance� pit�was�simply�the�tallest�of�these�domes�and�!rst�to�be�breached�by�denudation.�The�cave�exhibits�minimal�vadose�over-printing� in� the� entrance� region�which� is�comparable� to�the�associated�small�drainage�area�of�less�than�3000�m2.�The�lower�parts�of�the�cave�exhibit�solutionally�widened�fractures�too�small�for�human�passage,�but�likely�connect�to�additional�hypogene�chambers�or�conduits,�and�poten-tially� a� base-level� lake� similar� to�Wiggley�Cave.�Both�Fissure�and�Wiggley�caves�exhibit�vastly�different�mor-phologies�when�compared�to�their�epigene�counterparts.�However,� because� of� current� epigene� overprinting,� the
Speleogenetic Model of Evaporite-Karst Occurrences of the Gypsum Plain 195

recognition of speci!c morphometric features and analy-ses of the hydrogeologic environmentwere critical criteriaassessed in determining speleogenesis.
In addition to cave development, the diageneticalteration/dissolution of host strata is common in theDelawareBasin. Intrastratal dissolution commonly resultsin large-scale collapse horizons containing “blanket-dissolution breccias” in the Delaware Basin (Andersonand others, 1972). Lateral dissolution breccia forms, ashalite interbeds are dissolved and overlying gypsum can-not be supported and collapses. Dissolution breccias canbe traced across the basin and have been correlated withstill present halite interbeds located in the subsurface inthe eastern Delaware Basin (Anderson and others,1978). In addition to lateral dissolution, vertical dissolu-tion can form breccia pipes where ascending "uids drivedissolution through density convection. As void space iscreated at depth, overlying strata collapse into voids andupward stoping proceeds vertically, as additional dissolu-tion and collapse enhance vertical brecciation (Fig. 4C)(Anderson and Kirkland, 1980).
SPELEOGENETIC MODEL OF THEGYPSUM PLAIN
Karst development varies from west to east across theGypsum Plain in the direction of regional dip and stratalthickening. As shown in Fig. 5, this variation is presentin the case of geomorphological differences, karst den-sity (both epigene and hypogene), and proximity to dif-fering lithologies. Along thewestern edge of theGypsumPlain, the Castile Formation thins to nonexistence alongthe updip solutional margin. Moving from west to east,the Castile Formation progressively increases in thick-ness, as the unit dips into the subsurface, and is armoredby overlying strata that prevent denudation.
Caves in the western Gypsum Plain, where the BellCanyon is relatively close to the land surface, are typi-cally expressed as hypogene caves with variable epigeneoverprinting. Because of the Laramide uplift, stratadips 3–5° east/northeast in the Delaware Basin (Leeand Williams, 2000) and groundwater recharge intobasin clastics beneath Castile evaporites quickly shiftsto a con!ned system with elevated hydraulic pressure.Locally, gypsum strata thickness in the western GypsumPlain ranges from over 100 to 0 m where Bell Canyonoutcrops and groundwater recharge occurs. However,valleys and topographic lows within the Gypsum Plainare commonly lower than surface exposures of BellCanyon clastics, creating potentiometric lows withinthe system toward which con!ned "uids migrate. It islikely that potentiometric pressures are elevated in thewestern part of the study area where overland "owrecharge into Bell Canyon clastics is the most intensebecause of the Delaware Mountains watershed. Conse-quently, hypogene caves are commonly documented
throughout the western "ank of the Gypsum Plain(Fig. 5). This is not to say that hypogene caves do notform further east; instead, it suggests that hypogene karstdevelopment is simply more aggressive in the westernparts. It is probable that there is signi!cant hypogene dis-solution at the lower boundary of Castile strata through-out the region and hypogene caves simply appear morecommon in the west because of a greater incidence ofbreaching.
In addition to hypogene cave development, the pres-ence of vertical breccia pipes further suggests the pres-ence of signi!cant upward "uid migration throughoutthe region. Lee and Williams (2000) suggest that thesebrecciated zones result from solutionally aggressivewaters sourced from the Bell Canyon Aquifer that riseby density convection to create signi!cant void space.The collapse of these deep-seated caverns then stopetoward the land surface (Anderson and others, 1978).Unlike the hypogenetic caves, breccia pipes are sur!-cially expressed throughout the study area as resistanttopographic highs; they are sur!cial manifestations ofdeep-seated collapses that have stoped upward. Consis-tentwith brecciated zones found in the study area, similarpipes have been documented to extend through the entirethickness of the Castile Formation in the central Dela-ware Basin (Hill, 1996). These breccia pipes supportthe concept that hypogene speleogenesis is active acrossthe Gypsum Plain, but it is focused on the Bell Canyon/Castile contact. Because the Castile evaporites semicon-!ne the underlying clastic aquifers, hypogene karstdevelopment remains isolated from epigene karst untilhypogene features are breached by surface denudationand transition into an epigene environment.
Relatively shallow epigene karst is widespreadthroughout the Gypsum Plain but most common in theeastern parts of the study area, where epigene processeshave not been captured by breached hypogene caves.Breached hypogene caves that exhibit accelerated epige-netic overprinting are most common in the western partof the study area. In the central and eastern part of theGypsum Plain, no shallow sur!cial expressions of epi-gene karst connected to larger hypogene occurrenceswere identi!ed. Thus, these fracture driven caves are ver-tically restricted and display typical reducing aperturesand moderate entrenchment commonly associated withpure epigene evaporite caves formed in the vadosezone (Fig. 5). However, moving even further east acrossthe study area, caves are expressed as multistage epige-netic caves formed within both the vadose and phreaticzones. The occurrence of epigenic caves formed withinthe phreatic zone indicates that perched aquifers andmore complex groundwater systems exist within theCastile Formation than previously recognized. It is prob-able that independent shallowgroundwater systems havedeveloped throughout the eastern region of the study
196 Jon T. Ehrhart and Kevin W. Stafford

area to accommodate local groundwater recharge and todirect it toward the Delaware River.
Suffosion cave occurrences are much more commonin the central and eastern parts of the study area and areusually associated with epigenetic caves (Fig. 5). Bed-rock conduits provide pathways for soil removal fromthe system, but are small enough to limit "ow andincrease residence time of soil"uids. Increased residencetime promotes the dissolution of the gypsic soil fractionresulting in the development of soil caves that are ahybrid of dissolution and suffosion processes; theseoccurrences create relatively large soil chambers anddomes with smooth walls. To the west, located nearhypogene occurrences, soil caves are highly subdued.Hypogene caves in this area have the ability to rechargewaters rapidly after breaching and the water residencetime in soil is greatly reduced, as it "ows quickly throughthe breached system. The suffosion process typicallyrequires in!lling of sinks or draping of sediments overpre-existing caves or solutionally widened fractures.Breached hypogene caves that have been exposed to
epigene processes receive little or no in!lling becauseof their ability to quickly transport sediments into thesubsurface, resulting in less in!lling and less suffosion.
In addition to variations in speci!c karst features fromwest to east, the overall density of features varies as well.Most sur!cially expressed karst identi!ed by either !eldsurvey or LiDAR analyses are located within the CastileFormation (Fig. 5). Karstic occurrences drop dramati-cally beyond Castile outcrops within the study area.The Bell Canyon contains no known karst features, asit is predominantly a siliciclastic unit. Karst featureswithin the Rustler Formation are subdued, as this unitis primarily composed of limestone/dolomite and isless soluble than the Castile. LiDAR analyses revealedsigni!cantly more karst features than surface surveys,because shallow !lled sinks coupled with denser vegeta-tion can preclude the identi!cation of subtle karst fea-tures in the !eld; however, features identi!ed throughLiDAR analyses have been systematically checkedand all !eld veri!cations indicate that extremely shallowand/or sur!cially small features are true karst features.
Figure 5. Idealizedmodel of karst development across the GypsumPlain (Pbc= Bell Canyon Formation, Pcs= CastileFormation, Pru= Rustler Formation, Qal=Quaternary Alluvium); top graph displays the frequency of surface karstmanifestations per square kilometer identi!ed by surface surveys (red) and LiDAR analyses (blue); middle diagramdisplays the cross-sectional relationship between Castile Formation and its bounding formations. Lower diagramsdisplay a representation of the variability in karst development type (i.e., hypogene/epigene) across the study area.
Speleogenetic Model of Evaporite-Karst Occurrences of the Gypsum Plain 197
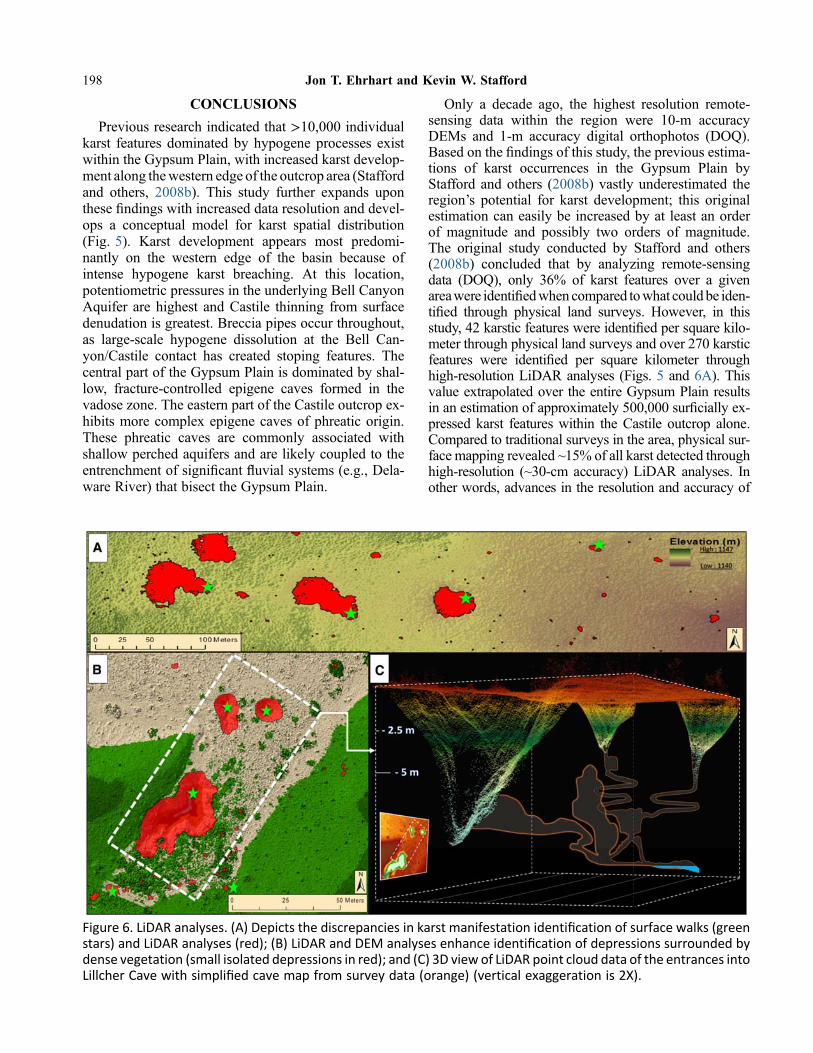
CONCLUSIONS
Previous research indicated that >10,000 individualkarst features dominated by hypogene processes existwithin the Gypsum Plain, with increased karst develop-ment along thewestern edge of the outcrop area (Staffordand others, 2008b). This study further expands uponthese !ndings with increased data resolution and devel-ops a conceptual model for karst spatial distribution(Fig. 5). Karst development appears most predomi-nantly on the western edge of the basin because ofintense hypogene karst breaching. At this location,potentiometric pressures in the underlying Bell CanyonAquifer are highest and Castile thinning from surfacedenudation is greatest. Breccia pipes occur throughout,as large-scale hypogene dissolution at the Bell Can-yon/Castile contact has created stoping features. Thecentral part of the Gypsum Plain is dominated by shal-low, fracture-controlled epigene caves formed in thevadose zone. The eastern part of the Castile outcrop ex-hibits more complex epigene caves of phreatic origin.These phreatic caves are commonly associated withshallow perched aquifers and are likely coupled to theentrenchment of signi!cant "uvial systems (e.g., Dela-ware River) that bisect the Gypsum Plain.
Only a decade ago, the highest resolution remote-sensing data within the region were 10-m accuracyDEMs and 1-m accuracy digital orthophotos (DOQ).Based on the !ndings of this study, the previous estima-tions of karst occurrences in the Gypsum Plain byStafford and others (2008b) vastly underestimated theregion’s potential for karst development; this originalestimation can easily be increased by at least an orderof magnitude and possibly two orders of magnitude.The original study conducted by Stafford and others(2008b) concluded that by analyzing remote-sensingdata (DOQ), only 36% of karst features over a givenareawere identi!edwhencompared towhat couldbe iden-ti!ed through physical land surveys. However, in thisstudy, 42 karstic features were identi!ed per square kilo-meter through physical land surveys and over 270 karsticfeatures were identi!ed per square kilometer throughhigh-resolution LiDAR analyses (Figs. 5 and 6A). Thisvalue extrapolated over the entire Gypsum Plain resultsin an estimation of approximately 500,000 sur!cially ex-pressed karst features within the Castile outcrop alone.Compared to traditional surveys in the area, physical sur-face mapping revealed ~15% of all karst detected throughhigh-resolution (~30-cm accuracy) LiDAR analyses. Inother words, advances in the resolution and accuracy of
Figure 6. LiDAR analyses. (A) Depicts the discrepancies in karst manifestation identi!cation of surface walks (greenstars) and LiDAR analyses (red); (B) LiDAR and DEM analyses enhance identi!cation of depressions surrounded bydense vegetation (small isolated depressions in red); and (C) 3D view of LiDAR point cloud data of the entrances intoLillcher Cave with simpli!ed cave map from survey data (orange) (vertical exaggeration is 2X).
198 Jon T. Ehrhart and Kevin W. Stafford

remote-sensing data indicate that LiDAR is almost seventimes more effective at identifying sur!cial karst manifes-tations when compared to physical land surveys.
In addition to the increased accuracy of remote-sensing data collection in recent years, LiDAR hasbecome much more ef!cient in its ability to be manipu-lated to reveal features that would otherwise be missedwhen doing physical surface surveys. Karstic featuresthat are either shallow, small in diameter, or surroundedby vegetation can now be identi!ed with ease and theirassociated drainage basins can be more easily assessed(Figs. 6A and 6B).
One of the most important factors of LiDAR analyseswithin this study is its ability to detect open conduits intothe subsurface. Karst depressions identi!ed throughDEM analyses may or may not contain open conduitsinto the subsurface. Depressions identi!ed by DEManalyses were reinvestigated using LiDAR point cloud3D and cross-sectional views. If the 3D views were in-terpreted to contain open conduits into the subsurface,as shown in Fig. 6C, these caves were "agged to beinvestigated andmapped during!eldwork. The rapid ad-vancements in remote-sensing technologies are enablinga better visualization of karstic surface and subsurfacerelationships. The ability to speci!cally detect and targetkarst features with signi!cantly increased ef!ciencyopens the door to conducting karst studies and under-standing regional speleology on a much larger scalethan traditional survey methods. Identifying the exactscale, location, and quantity of deep-seated hypogenecaves was outside of the scope of this research; it iscertain that, within the subsurface, the number of karstoccurrences that have yet to be exposed is signi!cantlyhigher than current estimates indicate, and will surelyprovide for exciting research in the future.
ACKNOWLEDGEMENTS
This research was partially funded by the TexasDepartment of Transportation with support from theDepartment of Geology at Stephen F. Austin State Uni-versity. The authors are indebted to the following !eldassistants that made this work possible: Ashley Landers,Adam Majzoub, Lillian O’Shay, Jessica Shields, andNikota Welch. Appreciation is expressed to WesleyBrown for his review of this manuscript and helpful con-tributions to its improvement.
REFERENCES CITED
Adams, J.E., 1965, Stratigraphic-Tectonic Developmentof Delaware Basin: American Association of Petro-leumGeologists, Bulletin, v. 49, no. 11, p. 2140–2148.
Anderson, R.Y., Dean, W.E., Kirkland, D.W., andSnider, H.I., 1972, Permian Castile varved evaporite
sequence, West Texas and New Mexico: GeologicalSociety of America, Bulletin, v. 83, p. 59–85.
Anderson, R.Y., Kietzke, K.K., and Rhodes, D.J., 1978,Development of Dissolution Breccias, Northern Del-aware Basin, New Mexico and Texas: New MexicoBureau of Mines and Mineral Resources, Circular159, p. 47-52.
Anderson, R.Y., and Kirkland, D.W., 1980, Dissolutionof salt deposits by brine density "ow: Geology, v. 8,p. 66–69.
Buechner, K.H., 1950, Life History, Ecology, and Rangeof The PronghornAntelope in Trans-Pecos Texas: TheUniversity of Notre Dame, The American MidlandNaturalist. v. 52, no. 2. 266 p.
Hill, C.A., 1996, Geology of the Delaware Basin, Guada-lupe, Apache, and Glass Mountains, New Mexico andWest Texas: Society of Economic Paleontologists andMineralogists, Permian Basin Section, Publicationno. 96-39, 480 p.
Horak, R.L., 1985, Trans-Pecos tectonism and its affectson the Permian Basin, in Dickerson, P.W., andMuelberger, W.R., eds., Structure and Tectonics ofTrans-Pecos Texas: Midland, Texas, West TexasGeological Society, p. 81–87.
Kelley, V.C., 1971, Geology of the Pecos Country,Southeastern New Mexico: New Mexico Bureau ofMines andMineral Resources, Socorro, NewMexico,Memoir 24, 75 p.
Klimchouk, A.B., 2000, Speleogenesis under deep-seated and con!ned setting, in Klimchouk, A., Ford,D.C., Palmer, A.M., andDreybrodt,W. (eds.), Speleo-genesis: Evolution of Karst Aquifers: NationalSpeleological Society, Huntsville, p. 244-260.
Klimchouk, A.B., 2007, Hypogene Speleogenesis: Hy-drogeological and Morphogenetic Perspective:National Cave and Karst Research Institute, SpecialPaper no. 1, Carlsbad, NM, 106 p.
Kirkland, D.W., 2003, An explanation for the varves ofthe Castile evaporites (upper Permian), Texas andNewMexico, USA: Sedimentology, v. 50, p. 899–920.
Lee, MK., and Williams D.D., 2000, Paleohydrology ofthe Delaware Basin, western Texas: overpressuredevelopment, hydrocarbon migration, and ore gene-sis: American Association of Petroleum Geologists,Bulletin, v. 84, no. 7, p. 961–974.
Nance R., 1993, Application of the standard tabletmethod to a study of denudation in gypsum karst,Chosa Draw, southeastern New Mexico: unpublishedM.S. Thesis, University ofNorthernColorado,Greely,CO, 82 p.
Scholle, P.A., Goldstein R.H., and Ulmer-Scholle D.S.,2004, Classic upper Paleozoic reefs and bioherms ofwest Texas and New Mexico: New Mexico Institute
Speleogenetic Model of Evaporite-Karst Occurrences of the Gypsum Plain 199

of Mining and Technology, Socorro, NM, Open-!leReport 504, 166 p.
Stafford, K.W., Nance, R., Rosales-Lagarde, L., andBoston, P., 2008a, Epigene and hypogene gypsumkarst manifestations of the Castile Formation: EddyCounty, New Mexico and Culberson County, Texas,USA: International Journal of Speleology, v. 37,p. 83–98.
Stafford K.W., Rosales-Lagarde L., and Boston P.J.,2008b, Castile evaporite karst potential map of theGypsum Plain, Eddy County, New Mexico and
Culberson County, Texas: a GISmethodological com-parison: Journal of Cave and Karst Studies, v. 70,no. 1, p. 35–46.
Stafford, K.W., Ulmer-Scholle, D., and Rosales-Lagarde, L., 2008c,Hypogene calcitization: Evaporitediagenesis in the western Delaware Basin: Carbonatesand Evaporites, v. 23, p. 89–103.
Texas Speleological Survey, 2016, WallsMap: TexasSpeleological Survey proprietary karst database.Texas Speleological Survey, Austin, Texas.
200 Jon T. Ehrhart and Kevin W. Stafford

ABSTRACT.—Traditional characterization of karsted terrains involves costly!eld studies that require months, if not years, of physical !eld mapping anddata collection to complete. This characterization process may be made more ef!-cient by the preliminary identi!cation of areas of interest through careful analysisof geologic maps. Karst features of the Gypsum Plain of southeastern New Mexicoand West Texas range from decimeters to tens of meters in scale, requiring highlydetailed maps in order for this preliminary analysis technique to be of use. How-ever, maps of the area currently available feature little to no detail of lithologicvariability or mineralization. Advances in remote-sensing technologies allow forthe production of geologic maps through an increased ability for mineral identi!-cation from satellite imagery, most commonly based on hyperspectral data. How-ever, commercially available hyperspectral sensors offer extremely low spatialresolution compared to 50-cm resolution multispectral data available, as well asbeing more costly and dif!cult to process. The following novel approach to delin-eating detailed lithologic variability of a landscape may be employed through theperformance of a maximum likelihood classi!cation of color-infrared imagery.WorldView-2 satellite imagery was used in this study for its high 50-cm spatialresolution, to provide a more ef!cient and cost-effective method of karst identi!-cation and lithologic characterization for use in research and natural resource man-agement. Based on comparison with control points acquired in the !eld andextensive a priori knowledge of the study area, results were deemed highly accurateand are currently being used to aid in ongoing karst studies.
INTRODUCTION
Traditional characterization of karsted terrains entailsthe costly, time-consuming process of physical !eldmapping to identify and collect data concerning landscapefeatures. Consequentially, remote-sensing methodolo-gies are actively being pursued as a more cost-effectivemeans of resource management. The Gypsum Plain ofsoutheastern New Mexico and West Texas is the siteof extensive karst development within Permian evapo-rite facies, hosting variable karst manifestations rangingin scale from millimeters to kilometers (Stafford,2008a). Speci!c features are commonly associatedwith unique lithologies or topographic features, allow-ing for preliminary identi!cation through the use of sur-!cial geologic maps. However, existing geologic mapsof the area have poor resolution, featuring the general
expected lithology with little detail and no variation inmineralogy (Fig. 1). Advances in satellite imaging tech-nology have allowed for the possibility of land mappingand feature extraction to be performed by image classi-!cation of raster cells based on their correspondingradiometric properties, commonly reducing the needfor extensive groundwork whereas allowing for coverageof greater areas (Hamideh, 2014).
Commonly, hyperspectral data are used in studiesconcerning the delineation of surface geologic materialsbecause of increased spectral resolution and some avail-able channels with extremely narrow bandwidths, allow-ing for greater accuracy in the identi!cation of speci!cmineral types (Harris and others, 2011). However, com-mercially available hyperspectral sensors lack re!nedspatial resolutions necessary in the identi!cation of smallkarst features and lithologic variability (less than a few
Shields, Jessica; and Stafford, Kevin, 2021, A Novel Approach to Delineating Lithologic Variability of a KarstedLandscape Using CIR Imagery and GIS Analyses, Eddy County, New Mexico, in Johnson, K. S.; Land,Lewis; and Decker, D. D. (eds.), Evaporite Karst in the Greater Permian Evaporite Basin (GPEB) of Texas,New Mexico, Oklahoma, Kansas, and Colorado: Oklahoma Geological Survey, Circular 113, p. 201–212.
0LMBIPNB�Geological�Survey�Circular�113,�2021
A�Novel�Approach�to�Delineating�Lithologic�Variability�of�a�Karsted�LandscapeUsing�CIR�Imagery�and�GIS�Analyses,�Eddy�County,�New�Mexico
Jessica�Shields�and�Kevin�W.�StaffordDepartment�of�Geology,�Stephen�F.�Austin�State�University,
Nacogdoches,�Texas
201

m2 in size) across a landscape, whereas commerciallyavailable, multispectral sensors offer increased spatialresolutions of 50 cm or less (Fig. 2). The Gypsum Plainconsists primarily of evaporite and carbonate facies with
little vegetation, as it is located in the semiarid, south-western United States. Top-of-atmosphere re"ectancevalues of themain lithogroups (e.g., sulfates, carbonates,and siliciclastics) present exhibit a signi!cant enough
Figure 1. Traditional geology map of the study area created on a small scale of 1:500,000 (adapted from Green andJones, 1997).
Figure 2. Primary satellite sensors offering commercially available imagery data and corresponding relevant tech-nical speci!cations (adapted from Harris and others, 2011).
202 Jessica Shields and Kevin W. Stafford
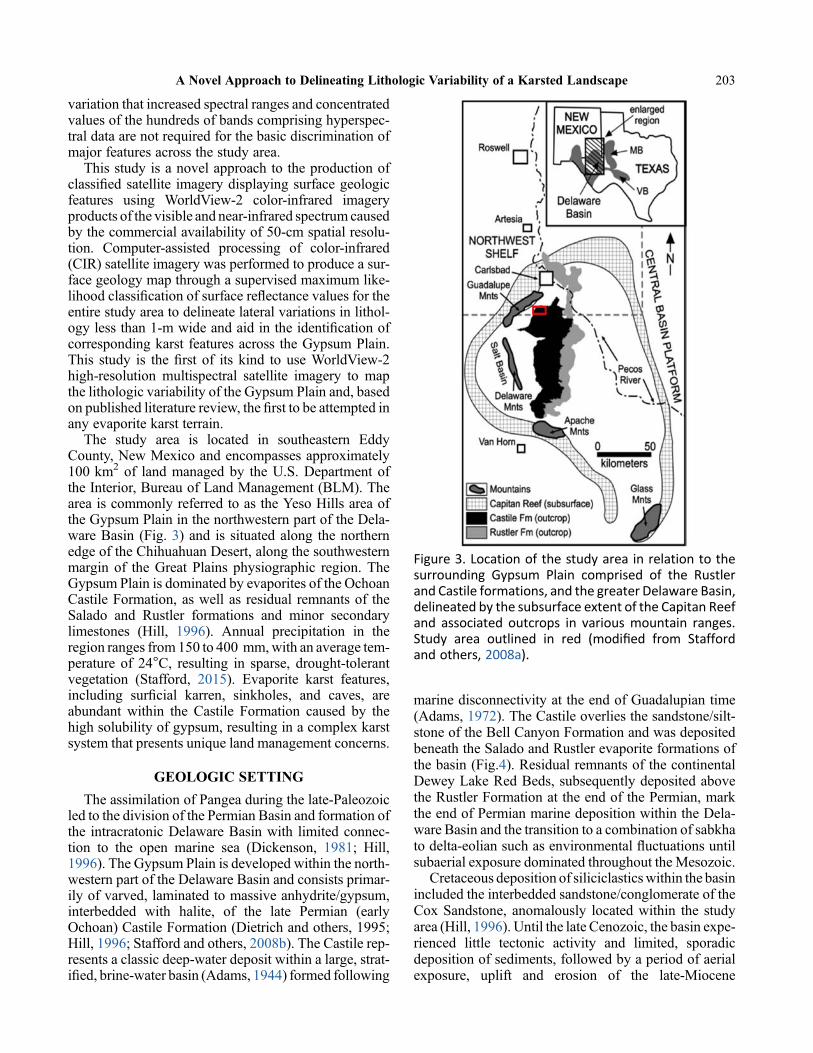
variation that increased spectral ranges and concentratedvalues of the hundreds of bands comprising hyperspec-tral data are not required for the basic discrimination ofmajor features across the study area.
This study is a novel approach to the production ofclassi!ed satellite imagery displaying surface geologicfeatures using WorldView-2 color-infrared imageryproducts of the visible and near-infrared spectrum causedby the commercial availability of 50-cm spatial resolu-tion. Computer-assisted processing of color-infrared(CIR) satellite imagery was performed to produce a sur-face geology map through a supervised maximum like-lihood classi!cation of surface re"ectance values for theentire study area to delineate lateral variations in lithol-ogy less than 1-m wide and aid in the identi!cation ofcorresponding karst features across the Gypsum Plain.This study is the !rst of its kind to use WorldView-2high-resolution multispectral satellite imagery to mapthe lithologic variability of the Gypsum Plain and, basedon published literature review, the !rst to be attempted inany evaporite karst terrain.
The study area is located in southeastern EddyCounty, New Mexico and encompasses approximately100 km2 of land managed by the U.S. Department ofthe Interior, Bureau of Land Management (BLM). Thearea is commonly referred to as the Yeso Hills area ofthe Gypsum Plain in the northwestern part of the Dela-ware Basin (Fig. 3) and is situated along the northernedge of the Chihuahuan Desert, along the southwesternmargin of the Great Plains physiographic region. TheGypsum Plain is dominated by evaporites of the OchoanCastile Formation, as well as residual remnants of theSalado and Rustler formations and minor secondarylimestones (Hill, 1996). Annual precipitation in theregion ranges from 150 to 400 mm,with an average tem-perature of 24!C, resulting in sparse, drought-tolerantvegetation (Stafford, 2015). Evaporite karst features,including sur!cial karren, sinkholes, and caves, areabundant within the Castile Formation caused by thehigh solubility of gypsum, resulting in a complex karstsystem that presents unique land management concerns.
GEOLOGIC SETTING
The assimilation of Pangea during the late-Paleozoicled to the division of the Permian Basin and formation ofthe intracratonic Delaware Basin with limited connec-tion to the open marine sea (Dickenson, 1981; Hill,1996). The Gypsum Plain is developed within the north-western part of the Delaware Basin and consists primar-ily of varved, laminated to massive anhydrite/gypsum,interbedded with halite, of the late Permian (earlyOchoan) Castile Formation (Dietrich and others, 1995;Hill, 1996; Stafford and others, 2008b). The Castile rep-resents a classic deep-water deposit within a large, strat-i!ed, brine-water basin (Adams, 1944) formed following
marine disconnectivity at the end of Guadalupian time(Adams, 1972). The Castile overlies the sandstone/silt-stone of the Bell Canyon Formation and was depositedbeneath the Salado and Rustler evaporite formations ofthe basin (Fig.4). Residual remnants of the continentalDewey Lake Red Beds, subsequently deposited abovethe Rustler Formation at the end of the Permian, markthe end of Permian marine deposition within the Dela-ware Basin and the transition to a combination of sabkhato delta-eolian such as environmental "uctuations untilsubaerial exposure dominated throughout the Mesozoic.
Cretaceous deposition of siliciclasticswithin the basinincluded the interbedded sandstone/conglomerate of theCox Sandstone, anomalously located within the studyarea (Hill, 1996). Until the late Cenozoic, the basin expe-rienced little tectonic activity and limited, sporadicdeposition of sediments, followed by a period of aerialexposure, uplift and erosion of the late-Miocene
Figure 3. Location of the study area in relation to thesurrounding Gypsum Plain comprised of the Rustlerand Castile formations, and the greater Delaware Basin,delineated by the subsurface extent of the Capitan Reefand associated outcrops in various mountain ranges.Study area outlined in red (modi!ed from Staffordand others, 2008a).
A Novel Approach to Delineating Lithologic Variability of a Karsted Landscape 203

associated with the formation of the western Rio GrandeRift (Kirkland, 2014). Therefore, surface exposureswithin the Gypsum Plain consist of the following lithol-ogies: gypsum, calcite (limestone), dolomite (dolostone),siliciclastics (sandstone and conglomerates), gypsicsoils, and weathering byproducts of all lithologies.
Gypsum, the most common bedrock in the study area,promotes extensive karst development because of itshigh solubility (2.53 g/L) combinedwith near-linear solu-tion kinetics. Whereas, most bedrock in the study area iscovered by a thin, secondary gypsic crust (Fig. 5A) anda variety of sur!cial karren occur in areas of exposedbedrock, including: rillenkarren (Fig. 5B), spitzkarren(Fig. 5D), kamenitzas, and tumuli. Karren may cropout across a few mm2 to m2 in area, but is generally
Figure 5. Common sur!cial karst manifestations within lithologies of interest across the study area: A) gypsic crustprecipitate commonly deposited across a large part of the study area; B) rillenkarren formed on Castile gypsum;C) small-scale closed sinkhole formed caused by subsurface collapse within alluvium; D) spitzkarren formed on Cas-tile gypsum; E) open sinkhole containing the entrance to Green Moss Cave formed within the Castile gypsum; andF) closed sinkhole formed within alluvium acting as host to a dense cluster of grasses native to the Gypsum Plain.
Figure 4. Major lithologic units of the Delaware Basindeposited during the middle-to-late-Permian with thedominant karst-bearing unit, the Castile Formation,highlighted in grey (adapted from Scholle and others,2004).
204 Jessica Shields and Kevin W. Stafford

limited in size. Sinkholes are proli!c, appearing as thedominant geomorphic karst manifestation and rangingin average size from decimeters to tens ofmeters in diam-eter. Filled sinkholes formed either by collapse of subsur-face features or by transport of sediment manifest asclosed depressions (Fig. 5C). Open sinkholes (Fig. 5E)are generally connected to solutional conduits or cave en-trances and may range from shallow, elliptical depres-sions to laterally elongated, incised arroyos. Sinkholesare commonly associatedwithpartial to complete in!llingby alluvium deposits and associated dense vegetationbecause of the higher moisture content available in theseunconsolidated !ll materials (Fig. 5F). Caves and solu-tional conduits are widespread and commonly fracturecontrolled, ranging from small isolated features to com-plex forms that may signi!cantly extend, both laterallyand vertically (Stafford and others, 2008a). For a generalreview of hydrologically active karst manifestationswithin theGypsumPlain, see Stafford and others (2008a).
Karst mounds, paleokarst erosional remnants formedby the collapse and in!ll of strata overlying subsurfacekarst voids (Bachman, 1980), sporadically occur acrossthe Gypsum Plain, including several mounds that havebeen identi!ed in the eastern part of this study area. Karstmounds represent areas of cavernous porosity within theCastile gypsum and overlying Salado salts that under-went collapse in the past and experienced in!lling byoverlying strata that subsequently created topographichighs by differential weathering of surrounding gypsumduring more recent surface denudation (Bachman, 1980;Hill, 1996). Karst mounds are generally less than 100 min diameter with a low relief of 3–9 m (Hill, 1996).Steep-sided hills composed of Rustler strata (Fig. 6A)are found clustered along the periphery of the easternhalf of the study area, at an average height and diameterof 5 m. K Hill (Fig. 6B) provides a more complex exam-ple of these paleokarst phenomena and consists of karsticslump debris from the Rustler Formation, in addition torotated and down dropped blocks of theDewey Lake andCox formations, creating an erosional positive reliefstructure approximately 18-m high in the central partof the study area (Crawford, 1993). The Cox, DeweyLake Red Beds, and Rustler formations within the studyarea solely manifest as karst mounds and have not beenidenti!ed in situ at any localities.
Areas of the Gypsum Plain have undergone signi!-cant mineralogic diagenesis resulting in calcitized evap-orites, which generally manifest as isolated masses at theland surface or laterally extensive surface horizons.Ascending light hydrocarbons, likely methane, reducedcalcium sulfate to limestone throughout the Ochoanevaporites via eitherBacterial SulfateReduction or Ther-mal Sulfate Reduction (Stafford and others, 2008c; Kirk-land and Evans, 1976). Isolated limestone buttes, alsoknown as “Castile Buttes” (Fig. 6C), crop out across
the Gypsum Plain as a product of differential weatheringof these calcitized zones, creating topographic highsranging from a few m2 to tens of thousands of m2 inarea, and a maximum height of 40 m (Kirkland andEvans, 1976; Stafford and others, 2008c). Laterallyextensive limestone sheets are present as residual brec-ciated clasts at the surface or as intact linear sheets dip-ping into the subsurface, generally where surroundinggypsum has been dissolved leaving less soluble calci-tized residuum. Limestone sheets may range from afew decimeters to up to 2 m in thickness and can cropout over thousands of m2 (Stafford and others, 2008a).Float of secondary limestone, small clasts of brecciatedrock displaced by surface processes, may be localized toareas where the limestone is exposed at the surface ormay coverwide areas of the landscape. Calcitization pro-cesses and mineral conversion of associated sulfur-oredeposits have also produced secondary selenite occur-rences through near-surface oxidation which manifestas linear features, fracture !llings, and lenticular masses(Stafford, 2008c).
MULTISPECTRAL IMAGERY DATA SET ANDCHARACTERIZATION
The use of remote-sensing data to discriminatebetween and identify sur!cial lithologies for the purpose
Figure 6. Karst mounds and areas exhibiting secondarycalcitization: A) karst mounds (delineated with dashedwhite lines) primarily consisting of Rustler strata; B) KHill, the largest karstmound in the study area consistingof Rustler, Dewey Lake RedBeds and Cox strata; D) smallCastile butte located within the study area consisting ofbrecciated Castile gypsum that has been calcitized.
A Novel Approach to Delineating Lithologic Variability of a Karsted Landscape 205

of geologic mapping is a well-established practice (Vander Meer and others, 2012). A variety of optical sensordata are available for this purpose, featuring varyingspectral and spatial ranges and resolutions appropriatefor different purposes and methodologies (Fig. 2).Today, hyperspectral data are most commonly employedin regional bedrock characterization because of greaterspectral resolution and range allowing for increased abil-ity and accuracy for identifying earth materials, such asmineral groups and lithotypes, across lithologically var-iable landscapes for the purpose of mineral mappingand exploration (Harris and others, 2011; Kruse, 2015;Van derMeer and others, 2012).However, limited spatialresolution of commercially/publicly available data fromhyperspectral sensors prevents small-scale outcrops andfeatures from being discernible across an image, makingit unsuited for the identi!cation of small lithologicchanges associated with karst features such as thosepresent within the study area investigated and greaterGypsum Plain. Hyperspectral imagery data are also dif-!cult to obtain and process, costly, and exhibit greatredundancy in data (Kruse, 2015). Currently, the highestresolution, commercially available hyperspectral data is30-m Hyperion satellite-borne data or that obtained viaunmanned aerial vehicles (UAVs) equipped with a cam-era capable of collecting hyperspectral data. The use ofUAVs in conjunction with hyperspectral cameras posetheir own set of problems, including the high cost ofboth the platform and camera, time and possible travelrequired for collection of data and the ability of theuser to operate the UAVeffectively, to name a few. Con-versely, multispectral data are less expensive/ commonlyfree, less redundant and widely publicly available inincreased spatial resolutions of up to 50 cm or less.
Karstic features targeted by this study generally occuron the centimeters to meter scale and associated sur!ciallithologic variability is common over short lateral distan-ces; therefore, more re!ned spatial resolution wasrequired for lithologic mapping for improved naturalresource management. As shown in Fig. 2, of commer-cial imagery available for purchase, WorldView-2 satel-lite imagery features the highest multispectral resolutionavailable at 0.5 m (Harris and others, 2011). Tradition-ally, CIR imagery is used to differentiate vegetationhealth across a target area through the use of band ration-ing techniques (Wolf, 2010; Hamideh and others, 2014).However, the geologic remote-sensing community hastraditionally used visible-to-near-infrared imagery forlithologic and structural mapping. In addition, workingwith a limited number of bands such as only those pres-ent within CIR data sets reduces extraneous data redun-dancy brought on by the overlap of adjacent channels ineach sensor (van der Meer and others, 2012).
WorldView-2 CIR satellite imagery, acquired on Sep-tember 27, 2016, was purchased by Stephen F. Austin
State University, Department of Geology for use inthis study, chosen for its 50-cm spatial resolution of gen-erated products. Orthorecti!cation and radiometric cor-rections were performed prior to purchase and imageryacquisition, including a dark offset subtraction andnonuniformity correction (Updike and Comp, 2010).Atmospheric corrections were performed, includingconversion of raw digital numbers to top-of-atmospherespectral radiance, and subsequently top-of-atmospherere"ectance usingArcGIS 10.2 following the process out-lined by Updike and Comp (2010).
IMAGE CLASSIFICATION
Before performing image classi!cation, a controlpoint database was established for all documented sur!-cial lithology types and karst features present within thestudy area. Ten, 1-km2 grids divided into traverse linesspaced at 50-m intervals were randomly selected acrossthe study area and systematically mapped to developdetailed representative maps of lithologic and geomor-phic variability. Based upon data collected through !eldmapping of each gridded control site, combined with apriori knowledge of the area and known geology, tenunique sample classes were established for image anal-yses comprising the majority of the surface lithologiesand features within the study area: 1) alluvium; 2) algalcrust; 3) sur!cial gypsite precipitates; 4) dense vegeta-tion manifesting commonly as bushes one-quarter toseveral m2 in area; 5) calcitized breccia zones or "oat;6) exposed Castile gypsum bedrock; 7) residual Coxstrata; 8) residual Dewey Lake Red Beds strata; 9) resid-ual Rustler strata; and 10) surface bodies of water. Sub-sequent to !eld mapping, additional areas suspected ofrepresenting each of the ten established classes were sys-tematically identi!ed across the entirety of the study areato evaluate feature class variability using Google EarthPro. Locations of identi!ed features were recorded andphysically veri!ed in the !eld to supplement !eld dataattained from detailed physical mapping of gridded sites.Once veri!ed for accuracy, GPS coordinates were estab-lished for 106 control points representing each lithologyor lithologic feature of interest across the entire studyarea, not including bushes/large vegetation features(Fig. 7). These control points were used to create train-ing samples and establish re"ectance values of the cor-responding CIR raster cells. Vegetation-related controlpoints were established directly within the originalCIR imagery products to account for the temporalchange associated with vegetation life cycle and actualphysical existence of features both on the ground andwithin the image.
Computer-assisted processingwas employed via Arc-GIS for Desktop 10.2 software to produce a MaximumLikelihood Classi!cation (MLC) of the CIR imageryacquired for use within this study. Based on the control
206 Jessica Shields and Kevin W. Stafford
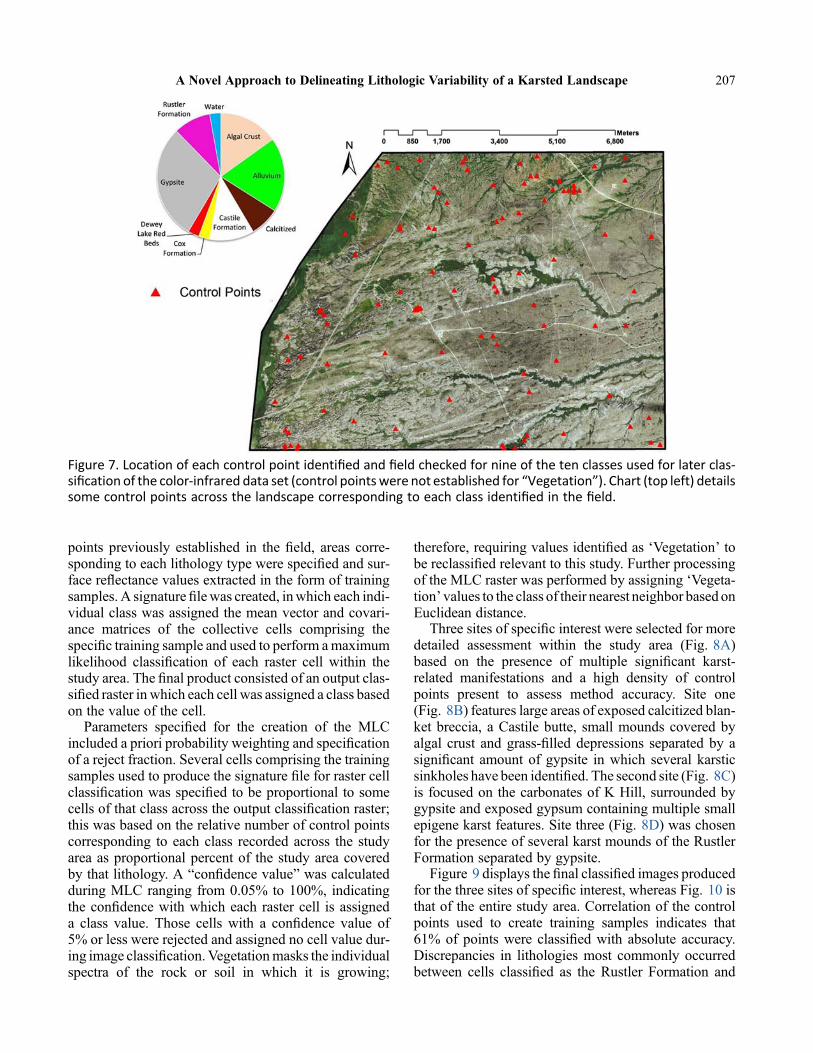
points previously established in the !eld, areas corre-sponding to each lithology type were speci!ed and sur-face re"ectance values extracted in the form of trainingsamples. A signature !le was created, inwhich each indi-vidual class was assigned the mean vector and covari-ance matrices of the collective cells comprising thespeci!c training sample and used to perform amaximumlikelihood classi!cation of each raster cell within thestudy area. The !nal product consisted of an output clas-si!ed raster in which each cell was assigned a class basedon the value of the cell.
Parameters speci!ed for the creation of the MLCincluded a priori probability weighting and speci!cationof a reject fraction. Several cells comprising the trainingsamples used to produce the signature !le for raster cellclassi!cation was speci!ed to be proportional to somecells of that class across the output classi!cation raster;this was based on the relative number of control pointscorresponding to each class recorded across the studyarea as proportional percent of the study area coveredby that lithology. A “con!dence value” was calculatedduring MLC ranging from 0.05% to 100%, indicatingthe con!dence with which each raster cell is assigneda class value. Those cells with a con!dence value of5% or less were rejected and assigned no cell value dur-ing image classi!cation.Vegetationmasks the individualspectra of the rock or soil in which it is growing;
therefore, requiring values identi!ed as ‘Vegetation’ tobe reclassi!ed relevant to this study. Further processingof the MLC raster was performed by assigning ‘Vegeta-tion’ values to the class of their nearest neighbor based onEuclidean distance.
Three sites of speci!c interest were selected for moredetailed assessment within the study area (Fig. 8A)based on the presence of multiple signi!cant karst-related manifestations and a high density of controlpoints present to assess method accuracy. Site one(Fig. 8B) features large areas of exposed calcitized blan-ket breccia, a Castile butte, small mounds covered byalgal crust and grass-!lled depressions separated by asigni!cant amount of gypsite in which several karsticsinkholes have been identi!ed. The second site (Fig. 8C)is focused on the carbonates of K Hill, surrounded bygypsite and exposed gypsum containing multiple smallepigene karst features. Site three (Fig. 8D) was chosenfor the presence of several karst mounds of the RustlerFormation separated by gypsite.
Figure 9 displays the !nal classi!ed images producedfor the three sites of speci!c interest, whereas Fig. 10 isthat of the entire study area. Correlation of the controlpoints used to create training samples indicates that61% of points were classi!ed with absolute accuracy.Discrepancies in lithologies most commonly occurredbetween cells classi!ed as the Rustler Formation and
Figure 7. Location of each control point identi!ed and !eld checked for nine of the ten classes used for later clas-si!cation of the color-infrared data set (control pointswere not established for “Vegetation”). Chart (top left) detailssome control points across the landscape corresponding to each class identi!ed in the !eld.
A Novel Approach to Delineating Lithologic Variability of a Karsted Landscape 207
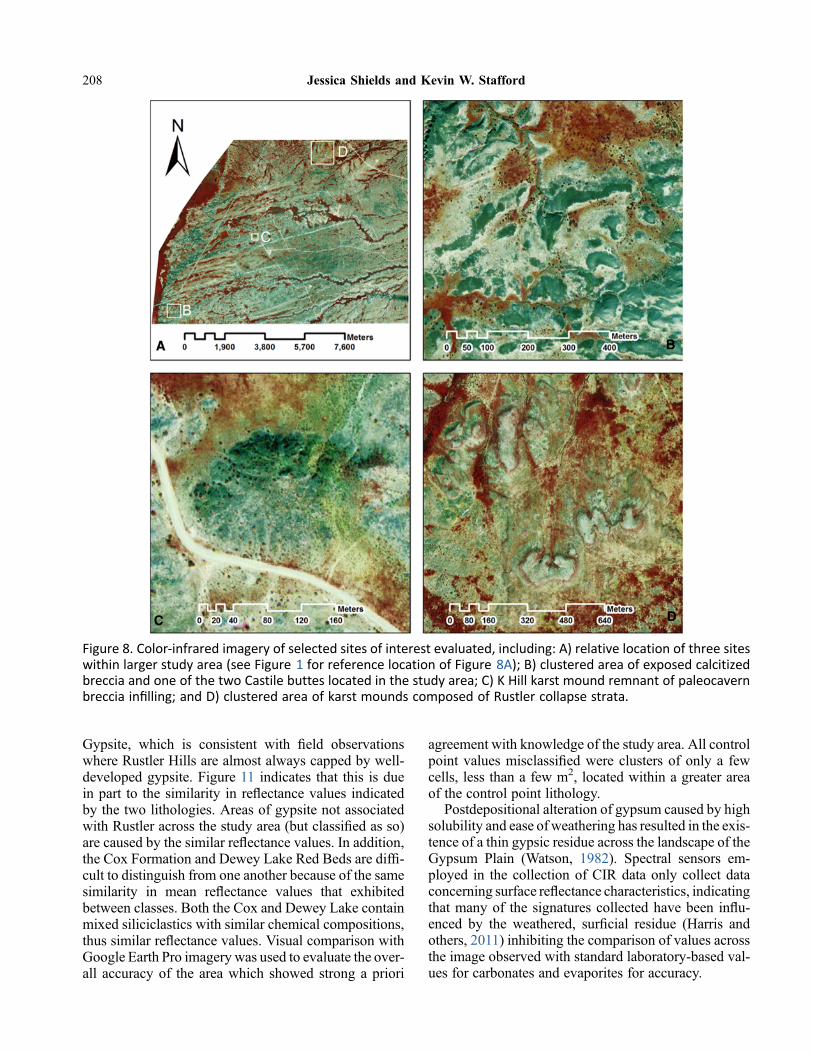
Gypsite, which is consistent with !eld observationswhere Rustler Hills are almost always capped by well-developed gypsite. Figure 11 indicates that this is duein part to the similarity in re"ectance values indicatedby the two lithologies. Areas of gypsite not associatedwith Rustler across the study area (but classi!ed as so)are caused by the similar re"ectance values. In addition,the Cox Formation and Dewey Lake Red Beds are dif!-cult to distinguish from one another because of the samesimilarity in mean re"ectance values that exhibitedbetween classes. Both the Cox and Dewey Lake containmixed siliciclastics with similar chemical compositions,thus similar re"ectance values. Visual comparison withGoogle Earth Pro imagery was used to evaluate the over-all accuracy of the area which showed strong a priori
agreement with knowledge of the study area. All controlpoint values misclassi!ed were clusters of only a fewcells, less than a few m2, located within a greater areaof the control point lithology.
Postdepositional alteration of gypsum caused by highsolubility and ease of weathering has resulted in the exis-tence of a thin gypsic residue across the landscape of theGypsum Plain (Watson, 1982). Spectral sensors em-ployed in the collection of CIR data only collect dataconcerning surface re"ectance characteristics, indicatingthat many of the signatures collected have been in"u-enced by the weathered, sur!cial residue (Harris andothers, 2011) inhibiting the comparison of values acrossthe image observed with standard laboratory-based val-ues for carbonates and evaporites for accuracy.
Figure 8. Color-infrared imagery of selected sites of interest evaluated, including: A) relative location of three siteswithin larger study area (see Figure 1 for reference location of Figure 8A); B) clustered area of exposed calcitizedbreccia and one of the two Castile buttes located in the study area; C) K Hill karst mound remnant of paleocavernbreccia in!lling; and D) clustered area of karst mounds composed of Rustler collapse strata.
208 Jessica Shields and Kevin W. Stafford

CONCLUSIONS
Surface geologic maps created through the classi!ca-tion of spectral re"ectance values across a landscape viasatellite imagery are a more ef!cient approach to thecharacterization of the lithologic variability within thekarsted landscape of the Gypsum Plain of the DelawareBasin than traditional methods commonly employed.Results of this study enabled ef!cient and largely effec-tive geologic mapping of the entire 100-km2 study area
(Fig. 11), which could be extended throughout the entireGypsum Plain and is currently being used for improveddelineation of likely regions of more intense karst devel-opment, including caves and paleokarst features. Highspatial resolution is especially important in the creationof such products, resulting in the use of multispectraldata rather than hyperspectral data in this study basedon current technology of commercially available data.Based on the training sample values and classi!cation
Figure 9. Final maximum likelihood classi!cation rasters produced for each of the three areas of interest fromFigures 2–7: A) relative location of three sites within larger study area (see Figure 1 for reference locationof Figure 9A); B) clustered area of exposed calcitized breccia and one of the two Castile buttes located in the studyarea; C) K Hill karst mound remnant of paleocavern breccia in!lling; and D) clustered area of karst mounds com-posed of Rustler collapse strata.
A Novel Approach to Delineating Lithologic Variability of a Karsted Landscape 209

Figure 10. Final lithologic surface map of the study area based on themaximum likelihood classi!cation performed.
Figure 11. Graph displaying the mean re"ectance value of each band for the corresponding class’ training samples.Note distinct re"ectance values for most sample classes.
210 Jessica Shields and Kevin W. Stafford

parameters used, the methods employed in this studyproduced a more accurate representation of the studyarea based on comparison with control points, GoogleEarth Pro imagery and familiarity with the area, thantraditional, published geologic maps of the region indi-cate (Fig. 1).
Differences in control point values and classi!ed cellvalues were the product of extremely similar re"ectancevalues across multiple bands of the CIR imagery causedby similar chemical composition of actual or constantlyassociated lithologies andwere almost always individualto small clusters of cells located in a greater area of thecorrect lithology; the confusion between Rustler andgypsite lithologies, where gypsite thinly mantles Rustlerstrata, being the exception. The use of such remotelysensed map products as those developed in this studyallows for targeted survey and identi!cation of karst fea-tures, rather than methodical surveys that commonlytake months to years of !eld observations to complete,thus increasing !eld ef!ciencies and reducing potentialassessment costs.
The creation of surface geologic maps via less expen-sive, less time-consuming processes such as satelliteimage classi!cation for the characterization and use inidenti!cation of geologic variability across a karstedlandscape is useful to entities such as the Bureau ofLand Management or other agencies for a more ef!cientapproach to natural resourcemanagement. Greater avail-ability and decreased cost of multispectral data than thatof hyperspectral, as well as simpli!ed pre- and postclas-si!cation image processing allows for the use of pro-posed methods by a greater community and lower skilland experience levels with remote sensing. As technol-ogies increase, hyperspectral imagery analyses willlikely be used for even greater accuracy (especially ofcells pertaining to Rustler/gypsite and Cox/DeweyLake issues) of remotely sensed geologic mappingwithin the Gypsum Plain and similar arid environments,but currently, commercially available, satellite-basedhyperspectral imagery resolution is too poor. New andrapidly advancing UAV technologies will providesigni!cant opportunities for improved geologic charac-terization within complex karst systems such as theGypsum Plain in the near future, but likely require a sig-ni!cantly higher cost to be obtained, as well as all issuespreviously speci!ed.
REFERENCES CITED
Adams, J.E., 1944, Upper Permian Ochoa series ofDelaware Basin, West Texas and southeastern NewMexico: American Association of Petroleum Geolo-gists, Bulletin, v 28, p. 1596–1625.
Adams, J.E., 1972, Semi-cyclicity in the Castile anhy-drite, in Elam, J.G., and Chuber, S., eds., Cyclic
sedimentation in the Permian Basin: West Texas Geo-logical Society, Special Publication 72-60, p.196–202.
Bachman, G.O., 1980, Regional Geology and CenozoicHistory of the Pecos Region, Southeastern NewMexico: US Geological Survey, Open-File Reportno. 80-1099, 117 p.
Crawford, J.E., 1993, K Hill and the Yeso Hills seleniteoccurrence, in Love, D.W., Hawley, J.W., Kues, B.S.,Adams, J.W., Austin, G.S.&Barker, J.M., eds., Cyclicsedimentation in the Permian Basin: New MexicoGeological Society, Guidebook, v. 44, p. 8–10.
Dickenson, W.R., 1981, Plate tectonic evolution of thesouthern Cordillera: Arizona Geological SocietyDigest, v. 14, p. 113–135.
Dietrich, J.W., Owen, D.E., Shelby, C.A., & Barnes,V.E., 1983, Geologic atlas of Texas, Van Horn- ElPaso sheet: University of Texas Bureau of EconomicGeology, v.36, 1 p.
Green, G.N., and Jones, G.E., 1997, The Digital Geo-logic Map of New Mexico in ARC/INFO Format:U.S. Geological Survey Open-File Report 97-0052,9 p.
Harris, J., Wickert, L., Lynds, T., Behnia, P., Rainbird,R., Grunsky, E., McGregor, R., and Schetselaar, E.,2011, Remote Predictive Mapping 3. Optical RemoteSensing - A Review for Remote Predictive GeologicalMapping in Northern Canada: Geoscience Canada,v. 38, no. 2, p. 49–84.
Hamideh, N., Beecham, S., Anderson, S., and Nagler, P.,2014, High spatial resolution WorldView-2 imageryfor mapping NDVI and its relationship to TemporalUrban Landscape Evapotranspiration Factors: Journalof Remote Sensing, v.6, p. 580–602.
Hill, C.A., 1996, Geology of the Delaware Basin, Gua-dalupe, Apache and Glass Mountains: New Mexicoand West Texas: Midland, Permian Basin Section ofthe SEPM, Publication 96-39, 480 p.
Kirkland, D.W., 2014, Role of hydrogen sul!de in theformation of cave and karst phenomena in the Guada-lupe Mountains and western Delaware Basin, NewMexico and Texas: National Cave and KarstResearch Institute, Special Paper 2, 77 p.
Kirkland, D.W., and Evans, R., 1976, Origin of lime-stone buttes, GypsumPlain, CulbersonCounty, Texas:American Association of Petroleum Geologists, Bul-letin, v. 60, p. 2005–2018.
Kruse, F.A., 2015, Integrated visible and near-infrared,shortwave infrared, and longwave infrared full-rangehyperspectral data analysis for geologic mapping:Journal of Applied Remote Sensing, v. 9, no. 1,p. 096005-1–096005-17.
Stafford, K.W., 2015, Evaluation of Existing GeologicConditions along RM 652: Initial Characterization
A Novel Approach to Delineating Lithologic Variability of a Karsted Landscape 211
of Karst Geohazards Associated with RM 652 inCulberson County, Texas: Texas Department ofTransportation, p. 1–71.
Stafford, K.W., Nance, R., Rosales-Lagarde, L., andBoston, P.J., 2008a, Epigene and hypogene karst man-ifestations of the Castile Formation: Eddy County,New Mexico and Culberson County, Texas, USA:International Journal of Speleology, v. 37, n. 2,p. 83–98.
Stafford, K.W., Rosales-Lagarde, L., and Boston, P.J.,2008c, Castile evaporite karst potential map of theGypsum Plain, Eddy County, New Mexico and Cul-bersonCounty, Texas: AGISmethodological compar-ison: Journal of Cave and Karst Studies, v. 70, n. 1,p. 35–46.
Stafford, K.W., Ulmer-Scholle, D., and Rosales-Lagarde, L., 2008b, Hypogene calcitization: evaporitediagenesis in the western Delaware Basin: Carbonatesand Evaporites, v. 23, n. 2, p. 89–103.
Updike, T., and Comp, C., 2010, Radiometric use ofWorldView-2 imagery: Digital Globe TechnicalNote, p. 17.
Van der Meer, F.D., van der Werff, H.M., van Ruiten-beek, F.J., Hecker, C.A., Bakker, W.H., Noomen,M.F., van derMeijde,M., Carranza, E.J.M., de Smeth,J.B., Woldai, T., 2012, Multi- and hyperspectral geo-logic remote sensing: A review: International Journalof Applied Earth Observation and Geoinformation,v.14, no. 1, p. 112–128.
Watson, A., 1982, The origin, nature and distribution ofgypsum crusts in deserts: unpublished Ph.D. disserta-tion,WolfsonCollege,University ofOxford, England,669 p.
Wolf, A., 2010, Using WorldView 2 VIS-NIR MSIImagery to Support Land Mapping and FeatureExtraction Using Normalized Difference IndexRatios: International Society forOptics and Photonics,p. 8390.
212 Jessica Shields and Kevin W. Stafford
Johnson, Kenneth S.; Shoemaker, Richard A.; Charlton, John; and Parker, Cris, 2021, Evaporite Karst in the PermianRustler, Salado, and Castile Formations at Red Bluff Dam on the Pecos River, Loving and Reeves Counties, Texas,in Johnson, K. S.; Land, Lewis; and Decker, D. D. (eds.), Evaporite Karst in the Greater Permian Evaporite Basin(GPEB) of Texas, New Mexico, Oklahoma, Kansas, and Colorado: Oklahoma Geological Survey, Circular 113,p. 213–232.
0LMBIPNB�Geological�Survey�Circular�113,�2021
Evaporite�Karst�in�the�Permian�Rustler,�Salado,�and�Castile�Formationsat�Red�Bluff�Dam�on�the�Pecos�River,�Loving�and�Reeves�Counties,�Texas
Kenneth�S.�JohnsonRetired�Geologist,�Oklahoma�Geological�Survey,
Norman,�Oklahoma
Richard�A.�ShoemakerRetired�Engineer,�HDR�Engineering,�Inc.,
Buena�Vista,�Colorado
John�CharltonHDR�Engineering,�Denver,�Colorado
Cris�ParkerHDR�Engineering,�Austin,�Texas
213
"#453"$5��3FE�#MVGG�%BN�BOE�3FTFSWPJS �MPDBUFE�PO�UIF�1FDPT�3JWFS�CFUXFFO�-PWJOH�BOE�3FFWFT�$PVOUJFT�JO�XFTU�5FYBT �IBT�CFFO�MPTJOH�XBUFS�TJODF�JNQPVOENFOU�CFHBO�JO�FBSMZ������NBJOMZ� EVF� UP� TFFQBHF� UISPVHI� FWBQPSJUF�LBSTU� GFBUVSFT� CFOFBUI� UIF� EBN�� 8BUFS� GMPXT�UISPVHI�DPMMBQTF�TUSVDUVSFT�BOE�CSFDDJBUFE�LBSTU�[POFT�JO�UIF�1FSNJBO�BHF�3VTUMFS�'PSNBUJPO �XIJDI� JT� UIF� CFESPDL� CFOFBUI�NPTU� QBSUT� PG� UIF� EBN � BOE� UISPVHI�2VBUFSOBSZ� EFQPTJUT� PG�XFBLMZ�UP�TUSPOHMZ�DFNFOUFE�TBOE�BOE�HSBWFM�UIBU�MPDBMMZ�MJF�CFUXFFO�UIF�CBTF�PG�UIF�EBN�BOE�CFESPDL�� *O� UIF� 3FE� #MVGG� BSFB � UIF� 3VTUMFS� 'PSNBUJPO� DPOTJTUT� NBJOMZ� PG� JOUFSCFEEFE�EPMPNJUF �HZQTVN �BOE�TIBMF �BOE� JU�QSPCBCMZ�BMTP�DPOUBJOFE�TPNF� MBZFST�PG�TBMU� IBMJUF� UIBU�IBWF�CFFO�EJTTPMWFE�CZ�HSPVOE�XBUFS��5IF�EBN�IBT�VOEFSHPOF�UISFF�HSPVUJOH�QSPHSBNT��UIF�NPTU�SFDFOU�CFJOH�DPNQMFUFE�JO�%FDFNCFS��������
3PDLT� JO� UIF�3VTUMFS�BOE�PWFSMZJOH�%FXFZ�-BLF�'PSNBUJPOT�BU�3FE�#MVGG� BSF� MBSHFMZ�CSFDDJBUFE �NBJOMZ�EVF�UP�EJTTPMVUJPO�PG�TBMU�BOE�HZQTVN�XJUIJO�UIF�3VTUMFS�'PSNBUJPO�BOE�JO�UIF�VOEFSMZJOH�1FSNJBO�4BMBEP�BOE�$BTUJMF�'PSNBUJPOT��5IF�IJHI�TPMVCJMJUZ�PG�UIFTF�FWBQPSJUFT�FOBCMFT�LBSTU�GFBUVSFT �TVDI�BT�EJTTPMVUJPO�DIBOOFMT �DBWJUJFT �TJOLIPMFT �CSFDDJBT �BOE�DPMMBQTF�TUSVDUVSFT � UP� GPSN� SFBEJMZ� JO� HZQTVN� BOE� TBMU � BOE� UIJT� DBO� SFTVMU� JO� TMPX� TVCTJEFODF� PS�TVEEFO�DPMMBQTF�PG�PWFSMZJOH�TUSBUB���
$PMMBQTF�CSFDDJBT�BSF�FYQPTFE�JO�UIF�3VTUMFS�BOE�%FXFZ�-BLF�'PSNBUJPOT�JO�UIF�EBN�BOE�TQJMMXBZ�BSFB �BOE�BMTP�PDDVS�CFOFBUI�QBSUT�PG�UIF�EBN�JUTFMG��"T�TFFQBHF�GSPN�UIF�SFTFSWPJS�GMPXT� JO� BOE� BSPVOE� UIF�CSFDDJB � JU� DBO� GVSUIFS�EJTTPMWF� UIF� HZQTVN�BOE�EPMPNJUF�CMPDLT� UP�FOIBODF�LBSTU�GFBUVSFT�UIBU�BMMPX�FWFO�NPSF�DJSDVMBUJPO�PG�HSPVOE�XBUFS��*O�HFOFSBM �HZQTVN�LBSTU� JT� BO� JNQPSUBOU� GBDUPS� JO� BOZ� EBN�T� BCJMJUZ� PS� JOBCJMJUZ� UP� IPME�XBUFS � CFDBVTF� EBNT�CVJMU�VQPO�HZQTVN�LBSTU�HFOFSBMMZ�FYQFSJFODF�BU�MFBTU�TPNF�MPTT�PG�SFTFSWPJS�XBUFS��
5IF�MPTT�PG�XBUFS�GSPN�UIF�SFTFSWPJS�JT�NBJOMZ�EVF�UP�UIF�GPMMPXJOH����EJTTPMVUJPO�PG�TBMU� BOE�PS� HZQTVN� CFET� JO� UIF� 3VTUMFS � 4BMBEP � BOE� $BTUJMF� 'PSNBUJPOT�� �� DPMMBQTF� BOE�DIBPUJD�EJTSVQUJPO�PG�HZQTVN�BOE�EPMPNJUF�VOJUT�JO�UIF�3VTUMFS�'PSNBUJPO����EFWFMPQNFOU�PG�LBSTU� GFBUVSFT� XJUIJO� UIF� HZQTVN� BOE� EPMPNJUF� VOJUT� BOE� DPMMBQTFE� CMPDLT� PG� UIF� 3VTUMFS�'PSNBUJPO�� BOE� �� QSPCBCMF� TFFQBHF� UISPVHI�2VBUFSOBSZ� TBOET� BOE� HSBWFMT � DIJFGMZ� CFOFBUI�UIF�OPSUIFBTU�TJEF�PG�UIF�EBN�

INTRODUCTION
This�study�examines�the�regional�and�local�geologic�setting�of�the�Permian-age�Rustler�Formation�and�asso-ciated� rocks� in� the�Delaware�Basin�of�west�Texas�and�southeast�New�Mexico�(Figs.�1,�2)�and�how�these�rocks�relate�to�leakage�problems�at�Red�Bluff�Dam�on�the�Pecos�River� in�west� Texas.� The� Rustler� Formation� and� the�underlying�Salado�and�Castile�Formations�are�character-ized�by�an�abundance�of�soluble�gypsum�and�salt�beds�that�locally�are�partly�or�totally�dissolved�to�produce�col-lapse� structures,� chaotic� features,�and�breccia� in� rocks�that�immediately�underlie�Red�Bluff�Dam�and�Reservoir.�
The�study�embraces�the�area�around�the�small�commu-nity�of�Red�Bluff�and�the�Red�Bluff�Dam,�located�in�Lov-ing�and�Reeves�Counties,�Texas,�as�well�as�areas�farther�east�in�Loving�County,�where�the�Rustler�and�underlying�formations� are� not� as� extensively� dissolved� and� dis-rupted�as� they�are�beneath� the�dam.�The�study�focuses�on��1)�the�dissolution�of�salt�and�gypsum�in�the�Rustler
and underlying formations; 2) the regional and local dis-tribution, thickness, and structure of the Rustler Forma-tion; and 3) the effects that dissolution and collapse of theRustler Formation have on the loss of water beneath RedBluff Dam.
This report is part of a larger drilling and testing studycarried out by HDR Engineering, Inc. (HDR), to estab-lish a grouting program that will eliminate, or at leastminimize, loss of lake water through breccia, throughgypsum- and dolomite-karst features, and through Qua-ternary deposits that underlie the dam (Charlton andothers, 2021). The dam and reservoir are owned andoperated by Red Bluff Water Power Control Districtfor water supply, irrigation, !ood control, and recreationpurposes. Appreciation is expressed to Dr. Lewis Land,geologist with the National Cave and Karst ResearchInstitute, for his review and constructive comments onan early draft of this report.
Figure 1. Generalized stratigraphic column for the Rus-tler Formation and overlying and underlying strata inthe vicinity of Red Bluff Reservoir (modi!ed fromPowers and Holt, 1999; Ewing and others, 2012).
Figure 2. Delaware Basin map and structural crosssection showing thick accumulation of Permian andolder sedimentary rocks. Dewey Lake, Rustler, Salado,and Castile Formations (green) are thinner to thewest, largely because of dissolution of salt beds withinthese formations. These evaporite formations overlieolder, nonevaporite Permian formations (blue) through-out the Delaware Basin.
214 Kenneth S. Johnson, Richard A. Shoemaker, John Charlton and Cris Parker

Literature Search
The surface geology of the dam and reservoir areawas originally mapped and described by Komie(1952) and subsequently mapped by AGRA (1994).Also, a regional, generalized map was prepared by theTexas Bureau of Economic Geology (Ei!er, 1976).
Regional studies of salt deposits in the DelawareBasin include those of Pierce and Rich (1962), Snider(1966), Johnson and Gonzales (1978), Ege (1985),and Hill (1996). Regional studies of gypsum and anhy-drite deposits in the Delaware Basin include those ofWithington (1962), Snider (1966), Anderson and others(1972), Johnson and others (1989), and Hill (1996).
Regional studies of evaporite dissolution andkarst fea-tures in the Delaware Basin include those by Maley andHuf"ngton (1953), Olive (1957), Johnson and Gonzales(1978), Lambert (1983), Bachman (1984), Hill (1996,2003), Martinez and others (1998), Johnson (2003a),Land (2013), Stafford (2013), and Stafford and Nance(2018). Studies of the hydrogeologyof theRustler aquiferinclude those of Ashworth (1990), Boghici and VanBroekhoven (2001), and Ewing and others (2012). Thestudy by Ewing and others (2012) was conducted to doc-ument the development of a three-dimensional ground-water model for the Rustler Aquifer in west Texas andsoutheast New Mexico: this report is especially valuablebecause it includes excellent maps showing the regionalstructure and thickness of the Rustler Formation through-out Loving and northern Reeves Counties.
Cores of the Rustler Formationwithin 25miles of RedBluff Dam are described by Vine (1963), Eager (1983),and Hentz and others (1989).
Field Studies
During "eld studies in May 2012, we examined out-crops of the Culebra Dolomite and collapsed gypsumblocks of theRustler Formation, aswell as chaotic blocksof red shales and siltstones of theDeweyLakeFormation.These collapsed blocks show a high degree and random-ness of collapse, disruption, and disorientation of rockunits in the vicinity of the dam. Based upon "eld studiesand examination of previous reports, we recommendedthe drilling of"ve additional cores (ReferenceBoreholes,RB–1 to RB–5) to establish a framework of the dolomite,gypsum, and other rock units that extend down as muchas 200 feet beneath the dam and spillway. This drillingprogram was approved by the Red Bluff Water PowerControl District and completed late in July 2012. Thedrilling was performed by Cutting Edge Core Drillingof Elgin, Texas, and John Charlton logged the boreholes.
Geophysical-log Study
Study of the subsurface distribution, thickness, andstructure of gypsum beds in the area required examining
the geophysical logs of 46 oil and gas tests, most ofwhich were drilled within 6 miles of the dam. Logs ofsome wells drilled as much as 25 miles east of thedam were also examined to determine the amount anddistribution of salt and gypsum layers in the Rustler,Salado, and Castile Formations where they have notbeen dissolved. Recognition of gypsum beds and asso-ciated rock types on geophysical logs is well established(Alger and Crain, 1966; Nurmi, 1978; Johnson, 2021).Of special value for the current geophysical-log studywas the regional subsurface investigation of the stratig-raphy of the Castile, Salado, and Rustler Formations bySnider (1966).
Three factors that limit the full usefulness of geophys-ical logs in the vicinity of Red Bluff Dam are 1) many ofthe logs do not show information about rock formationsin boreholes at depths shallower than about 1,000 feet(the depth at which intermediate casing is commonlyset); 2) although some of the well logs record informa-tion about rock units as shallow as 10–100 feet belowthe land surface, many of these wells have only a singlelog (such as only a gamma-ray log), and it can be dif"cultto interpret the types of rock when only a single log isavailable; and 3) because of the collapse and chaoticnature of rocks in the Rustler and Salado Formationsnear the dam, it can be dif"cult to correlate speci"crock units from one well to another and to identify thetop and bottom of the Rustler on the geophysical logs.
RESULTS OF STUDY
Main results of this study are divided into the follow-ing discussions: 1) main types of rocks in the area; 2) dis-solution of gypsum and salt; 3) the regional character ofthe Rustler and underlying formations; 4) the local char-acter of the Rustler Formation; and 5) other local rocksand deposits in the vicinity of the dam.
Main Rocks and Deposits in the Red Bluff Area
Permian sedimentary rocks that crop out in the RedBluff area are mainly dolomite and gypsum, alongwith layers of red-brown shale, siltstone, and sandstone—all of which were deposited in the central part of theDelaware Basin (Figs. 1, 2). The bedrock formation atthe dam is the Rustler Formation, and it contains all ofthese rock types. In addition, thick deposits of salt(halite) and gypsum/anhydrite (gypsum and/or anhy-drite) are present in the underlying Salado and CastileFormations beneath the dam and farther to the east, atdepths of several hundred to several thousand feet belowthe land surface (Figs. 3, 4). In the Red Bluff Dam area,most of these salt beds, and some of the gypsum/anhy-drite beds, have been dissolved from the Rustler, Salado,and Castile Formations in Late Tertiary and Quaternary
Evaporite Karst in the Permian Rustler, Salado, and Castile Formations 215

times (Ewing, 2012), resulting in collapse and disruptionof Rustler strata.
Permian shales, siltstones, and sandstones typicallyare not as hard and competent as the interbedded gyp-sum/anhydrite and dolomite, and they tend to weathermore readily in outcrops. Most of these clastic sedimen-tary rocks are red brown in color, although some are gray,brown, and tan.
Sur"cialmaterials overmuch of theRedBluff area areQuaternary-age deposits of sand, clay, and conglomer-ate. These sediments were laid down as alluvium byPecosRiver and its tributaries. In addition, there are localdeposits of gypsite, which is an unconsolidated, earthyvariety of gypsum that commonly is intermixed withclay, dirt, and sand. Gypsite is not a hard rock, like gyp-sum, and it is not a part of the dissolution and water-lossproblem at Red Bluff Dam.
Breccias are also locally present as a rubble of largeand small chaotic blocks of rock that here result fromdissolution of underlying rocks (salt or gypsum). Thesecollapse breccias have fallen into underlying cavities orcaves, and the original cavity could have been tens oreven hundreds of feet below the resultant breccia.
Collapse breccias here can consist of chaotic blocks orfragments of gypsum, dolomite, shale, siltstone, andsandstone: the void spaces between these blocks canbe air- or water-"lled, or they are "lled with clay, silt,or sand that has been washed into the voids.
Dissolution of Gypsum and Salt
Gypsum and salt are evaporite rocks, and they arereadily dissolved by groundwater—as long as the wateris not saturated with calcium sulfate (for gypsum disso-lution) or sodium chloride (for salt dissolution). In fact,gypsum and salt are, respectively, about 150 and 7,500timesmore soluble than limestone or dolomite (Martinezand others, 1998). Such high solubilities enable subsur-face dissolution channels and sinkholes to form in evap-orite rocks in a matter of only days, weeks, or years, andthis can result in slow subsidence or catastrophic col-lapse of overlying strata (Fig. 4). Most of the dissolutionof salt and gypsum in the Rustler, Salado, and CastileFormations in the region occurred during Late Tertiaryand Quaternary times (Ewing and others, 2012), and itcertainly is still going on.
Figure 3. Stratigraphic cross section of Rustler, Salado, and Castile Formations in Loving and Reeves Counties, Texas(modi!ed from Snider, 1966). Numbering of wells (1–7) is unique to this cross section.
216 Kenneth S. Johnson, Richard A. Shoemaker, John Charlton and Cris Parker

Gypsum is a moderately soluble rock. It is susceptibleto being partially or totally dissolved by groundwaterand to developing “karst features,” such as caves, sink-holes, and underground water courses (Johnson, 1996,2003a, 2008a; Stafford, 2013; Stafford and Nance,2018). Gypsum and/or anhydrite are abundant in theRustler, Salado, and Castile Formations, and they under-lie all parts of the Red Bluff Dam area (Fig. 4). Gypsumalso crops out near the dam, in the spillway area andlocally in the impoundment area just upstream of thedam. It is also very likely that gypsum crops out inmany areas that are inundated by the reservoir. Smallamounts of gypsum also occur as intergranular gypsum,as gypsiferous cement, and as thin veins in some of theRustler dolomite, shale, siltstone, and sandstone units inthe Red Bluff area (AGRA, 1994; HDRReference Bore-holes). Intergranular gypsum, gypsiferous cement, andgypsum veins can be dissolved locally and can allowsmall-scale seepage, but their contribution to waterloss is not considered very high.
Salt is a highly soluble rock. It is signi"cant to thisstudy because the Salado andCastile Formations containabundant subsurface salt beds in the area; the RustlerFormation probably also contained salt beds in theRed Bluff area, and it still contains salt farther east inLoving County (Fig. 3). Local dissolution of these saltbeds has caused extensive collapse structures in theRustler and overlying Dewey Lake Formations in the
vicinity�of�Red�Bluff�Dam� (Fig.�4)�and� in�most�of� the�western�half�of�the�Delaware�Basin.
Exposed�collapse�structures,�formed�by�dissolution�of�salt�and/or�gypsum�in�the�Red�Bluff�area,�contain�broken�fragments,�or�breccia,�of�Rustler�and�Dewey�Lake�strata,�and�the�chaotic�nature�of�this�rock�enhances�groundwater�circulation�and�dissolution�of� the�gypsum� immediately�below�the�dam.�Several�exposures�of�large-scale�collapse�breccia�are�in�the�dam�and�spillway�area,�and�small-scale�collapse�breccia�is�present�in�several�of�the�HDR�Refer-ence�Borehole�cores�'JH���.
Gypsum�karst�is�an�important�factor�in�a�dam’s�ability�to�hold�water.�Dams�built�upon�gypsum�karst�generally�experience� some� loss� of� reservoir�water,� and� this� can�even�result�in�collapse�and�failure�of�the�dam�(Johnson,�2008b).�Where�gypsum�karst� is�present�beneath�a�dam,�water� can� penetrate� and� enlarge� the� karst� features� and�may�escape�from�the�reservoir.�Several�articles�and�books�have�been�published�on�properties�of�dam� foundations�built�upon�gypsum�deposits� (James�and�Lupton,�1978;�James� and� Kirkpatrick,� 1980;� Chen� and� Wu,� 1983;�Milanovic,� 2000,� 2018;� Fell,� 2005;� Johnson,� 2008b;�Cooper�and�Gutiérrez,�2013;�Milanovic and others, 2019).
Several� examples� of� gypsum-karst� problems� and�dams�in�the�United�States�are�McMillan�Dam�(New�Mex-ico),�Quail�Creek�Dike� (Utah),�Upper�Mangum�Dam�(Oklahoma),�Anchor�Dam�(Wyoming),�and�Horsetooth�and�Carter� Lake�Dams� (Colorado)� (Johnson,� 2008b).
Figure 4. Generalized structural cross section A–B showing dissolution of salt in the Salado and Castile Formationsbeneath the Rustler and Dewey Lake Formations in Loving and Reeves Counties, Texas. Based upon data in Snider(1966), Martinez and others (1998), !eld investigations, and Figure 3 of this report.
Evaporite Karst in the Permian Rustler, Salado, and Castile Formations 217

McMillan Dam, on the Pecos River upstream of Carls-bad, NM, experienced leakage into gypsum-karst fea-tures in the Seven Rivers Formation during its entirelife, from 1908 to 1991 (Cox, 1967). Quail CreekDike failed in 1989 in part because of !ow of waterthrough an undetected gypsum-karst unit beneath anearth-"ll embankment (James and others, 1989; O’NeillandGourley, 1991; Payton andHansen, 2003). The long-studied Upper Mangum Dam was abandoned beforeconstruction, because of extensive gypsum karst in theabutments and impoundment area (Johnson, 2003b).Anchor Dam, built in 1960, has signi"cant drainage ofwater from the reservoir because of earth "ssures, sink-holes, and gypsum karst that underlie the impoundmentarea (Jarvis, 2003). Horsetooth and Carter Lake Reser-voirs, built upon gypsum-bearing strata in the 1940s,developed sinkholes and seepage loss of water in the1980s and 1990s (Pearson, 2002).
Regional Character of the Rustler andUnderlying Formations
The Rustler Formation consists of interbedded dolo-mite, limestone, gypsum, anhydrite, shale, siltstone, and
sandstone (Ewing and others, 2012). Salt is locally pres-ent in the Rustler to the east, in eastern Loving Countyand beyond, but it is probably all removed by dissolutionin the Red Bluff area. Salt has also been described in theRustler in the northern Delaware Basin, near the WasteIsolation Pilot Plant (WIPP) site (Powers and others,2006). Regional subsurface studies just east of thedam show that theRustler now consists of gypsum/anhy-drite, dolomite/limestone, shale, and some beds of salt(Fig. 3). Because of dissolution of salt and gypsum inthe Rustler, Salado, and Castile Formations, most ofthe Salado, Rustler, and Dewey Lake strata in westernLoving County and northern Reeves County are dis-rupted and brecciated (Fig. 4).
The Rustler Formation in Loving, Reeves, and Cul-berson Counties is subdivided into "ve members(Figs. 1, 5). Because of lateral variation in depositionof the Rustler Formation, all the members are not readilyrecognized in all parts of the region. The Magenta andCulebraDolomites are generallywidespread, and locallythey are limestones or dolomitic limestones. Gypsum oranhydrite is fairly widespread in the Rustler, but thesebeds aremore discontinuous than the dolomites. Becauseof dissolution of Salado salts, Rustler strata are highly
Figure 5. Stratigraphic cross section showing regional cores of the Rustler Formation from Culberson County, TX(south), to Eddy County, NM (north), and all !ve of the HDR Reference Boreholes (RB–1 through RB–5) at Red BluffDam. Numbering of wells (1–8) is unique to this cross section.
218 Kenneth S. Johnson, Richard A. Shoemaker, John Charlton and Cris Parker
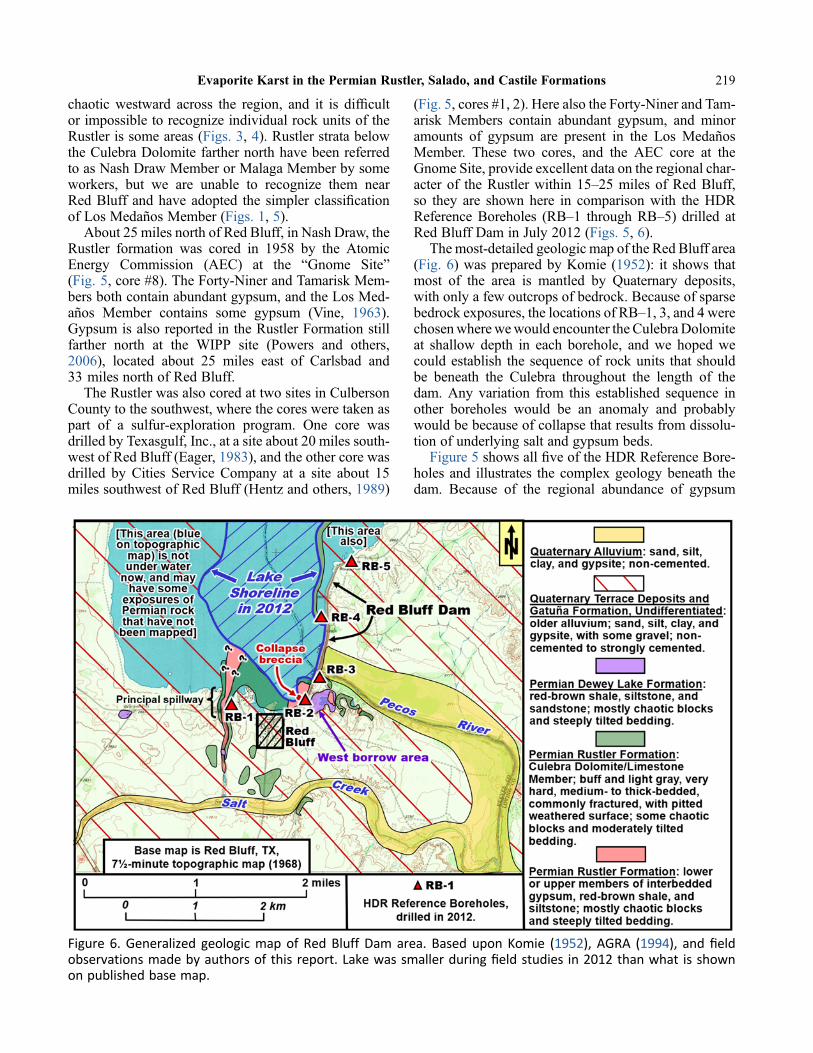
chaotic westward across the region, and it is dif"cultor impossible to recognize individual rock units of theRustler is some areas (Figs. 3, 4). Rustler strata belowthe Culebra Dolomite farther north have been referredto as Nash Draw Member or Malaga Member by someworkers, but we are unable to recognize them nearRed Bluff and have adopted the simpler classi"cationof Los Medanos Member (Figs. 1, 5).
About 25 miles north of Red Bluff, in Nash Draw, theRustler formation was cored in 1958 by the AtomicEnergy Commission (AEC) at the “Gnome Site”(Fig. 5, core #8). The Forty-Niner and Tamarisk Mem-bers both contain abundant gypsum, and the Los Med-anos Member contains some gypsum (Vine, 1963).Gypsum is also reported in the Rustler Formation stillfarther north at the WIPP site (Powers and others,2006), located about 25 miles east of Carlsbad and33 miles north of Red Bluff.
The Rustler was also cored at two sites in CulbersonCounty to the southwest, where the cores were taken aspart of a sulfur-exploration program. One core wasdrilled by Texasgulf, Inc., at a site about 20 miles south-west of Red Bluff (Eager, 1983), and the other core wasdrilled by Cities Service Company at a site about 15miles southwest of Red Bluff (Hentz and others, 1989)
(Fig. 5, cores #1, 2). Here also the Forty-Niner and Tam-arisk Members contain abundant gypsum, and minoramounts of gypsum are present in the Los MedanosMember. These two cores, and the AEC core at theGnome Site, provide excellent data on the regional char-acter of the Rustler within 15–25 miles of Red Bluff,so they are shown here in comparison with the HDRReference Boreholes (RB–1 through RB–5) drilled atRed Bluff Dam in July 2012 (Figs. 5, 6).
The most-detailed geologic map of the Red Bluff area(Fig. 6) was prepared by Komie (1952): it shows thatmost of the area is mantled by Quaternary deposits,with only a few outcrops of bedrock. Because of sparsebedrock exposures, the locations of RB–1, 3, and 4 werechosenwhere wewould encounter the Culebra Dolomiteat shallow depth in each borehole, and we hoped wecould establish the sequence of rock units that shouldbe beneath the Culebra throughout the length of thedam. Any variation from this established sequence inother boreholes would be an anomaly and probablywould be because of collapse that results from dissolu-tion of underlying salt and gypsum beds.
Figure 5 shows all "ve of the HDR Reference Bore-holes and illustrates the complex geology beneath thedam. Because of the regional abundance of gypsum
Figure 6. Generalized geologic map of Red Bluff Dam area. Based upon Komie (1952), AGRA (1994), and !eldobservations made by authors of this report. Lake was smaller during !eld studies in 2012 than what is shownon published base map.
Evaporite Karst in the Permian Rustler, Salado, and Castile Formations 219

above the Culebra, and the paucity of gypsum below, weinterpret that gypsum blocks in the collapse brecciadrilled in RB–2 were dropped down from the overlyingTamarisk (and perhaps the Forty-Niner) Member. Thechaotic nature of the geology beneath parts of the damin this cross section af"rms the complexity documentedby AGRA (1994, see their Fig. 4.3, modi"ed here as ourFig. 7).
A structure-contour map on top of Anhydrite I in thelower part of the Castile Formation (Fig. 8) shows thatstrata below the dissolution zone near Red Bluff dipgently to the east at about 90 feet per mile, or a dip ofabout 1º. All strata above this datum should also dipgently to the east across the area, except for the effectof dissolution of overlying salts (and gypsum/anhydrite)in the upper Castile, and in the Salado and Rustler For-mations. Dissolution of these evaporites has causedconsiderable collapse and brecciation of the Saladoand Rustler Formations, making it dif"cult to correlaterock layers or formation contacts in the immediate vicin-ity of Red Bluff Dam. Geophysical logs used to prepareFigure 8 are listed in Table 1 and were numbered on themap for simplicity.
A regional map showing structural contours on top ofthe Rustler Formation (Fig. 9) demonstrates how com-plex the structure is above the Castile Formation. Themap, compiled from geophysical logs by Ewing andothers (2012), shows sharp changes in elevation of thetop of theRustler within relatively short distances (a sim-ilarly complex structure map was prepared by Hiss,1976). For example, instead of a gentle regional dip ofabout 90 feet per mile to the east (as in Fig. 8), the topof the Rustler in north-central Loving County plungesdown at least 600 feet to the west within a distance ofabout 2 miles into a dissolution trough. And west ofthis trough the dip of the Rustler top is quite irregularthroughout Loving and Reeves Counties. The cause ofthe dissolution trough and the irregularity of the Rustlerstructure is mainly dissolution of salt in the Salado For-mation, and secondarily is dissolution of salt in the Cas-tile and Rustler Formations (Figs. 3, 4). Most of the saltdissolution here probably occurred in Late Tertiary andQuaternary times (Ewing and others, 2012), but someSalado salt was also being dissolved at other places asearly as during Salado time (Johnson, 1993; Holt andPowers, 2010). Complexity and structural chaos of
Figure 7. Conceptual cross section along Red Bluff Dam alignment, based upon historic borehole logs and excava-tions (modi!ed fromAGRA, 1994,!gure 4.3). The complex geology of the dam foundation (particularly on left side ofdiagram) is mainly because of dissolution of underlying salt and gypsum layers, and resultant collapse and breccia-tion of overlying strata. Rustler bedrock in the right half of the cross section is probably as complex as in the left half.
220 Kenneth S. Johnson, Richard A. Shoemaker, John Charlton and Cris Parker
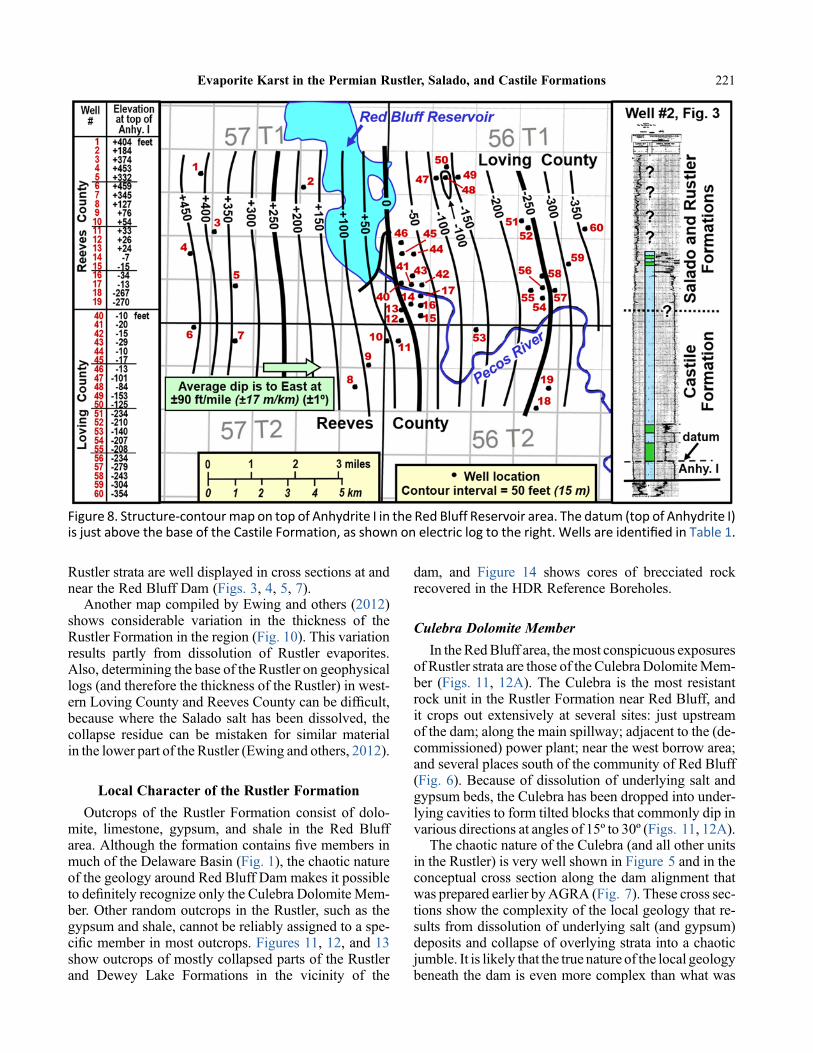
Rustler strata are well displayed in cross sections at andnear the Red Bluff Dam (Figs. 3, 4, 5, 7).
Another map compiled by Ewing and others (2012)shows considerable variation in the thickness of theRustler Formation in the region (Fig. 10). This variationresults partly from dissolution of Rustler evaporites.Also, determining the base of the Rustler on geophysicallogs (and therefore the thickness of the Rustler) in west-ern Loving County and Reeves County can be dif"cult,because where the Salado salt has been dissolved, thecollapse residue can be mistaken for similar materialin the lower part of the Rustler (Ewing and others, 2012).
Local Character of the Rustler Formation
Outcrops of the Rustler Formation consist of dolo-mite, limestone, gypsum, and shale in the Red Bluffarea. Although the formation contains "ve members inmuch of the Delaware Basin (Fig. 1), the chaotic natureof the geology around Red Bluff Dam makes it possibleto de"nitely recognize only the Culebra Dolomite Mem-ber. Other random outcrops in the Rustler, such as thegypsum and shale, cannot be reliably assigned to a spe-ci"c member in most outcrops. Figures 11, 12, and 13show outcrops of mostly collapsed parts of the Rustlerand Dewey Lake Formations in the vicinity of the
dam, and Figure 14 shows cores of brecciated rockrecovered in the HDR Reference Boreholes.
Culebra Dolomite Member
In theRedBluff area, themost conspicuous exposuresof Rustler strata are those of the Culebra DolomiteMem-ber (Figs. 11, 12A). The Culebra is the most resistantrock unit in the Rustler Formation near Red Bluff, andit crops out extensively at several sites: just upstreamof the dam; along the main spillway; adjacent to the (de-commissioned) power plant; near the west borrow area;and several places south of the community of Red Bluff(Fig. 6). Because of dissolution of underlying salt andgypsum beds, the Culebra has been dropped into under-lying cavities to form tilted blocks that commonly dip invarious directions at angles of 15º to 30º (Figs. 11, 12A).
The chaotic nature of the Culebra (and all other unitsin the Rustler) is very well shown in Figure 5 and in theconceptual cross section along the dam alignment thatwas prepared earlier byAGRA (Fig. 7). These cross sec-tions show the complexity of the local geology that re-sults from dissolution of underlying salt (and gypsum)deposits and collapse of overlying strata into a chaoticjumble. It is likely that the true nature of the local geologybeneath the dam is even more complex than what was
Figure 8. Structure-contour map on top of Anhydrite I in the Red Bluff Reservoir area. The datum (top of Anhydrite I)is just above the base of the Castile Formation, as shown on electric log to the right. Wells are identi!ed in Table 1.
Evaporite Karst in the Permian Rustler, Salado, and Castile Formations 221

TABLE 1.—Oil and gas wells used to compile structure-contour map on top of Castile Formation Anhydrite I(Fig. 8). Well numbers (1–66) assigned by authors. API numbers are unique identi!ers for each well drilled inthe United States. Wells 61–66 are east of area in Figure 8, but were useful in identifying undissolved salt andgypsum layers.
222 Kenneth S. Johnson, Richard A. Shoemaker, John Charlton and Cris Parker

Figure 9. Structure-contour map on top of Rustler Formation (from Ewing and others, 2012). Structure is highlycomplex, mainly because of dissolution of salt beds in the underlying Salado Formation. Regional dip near Red BluffReservoir should be to the east at ±90 feet per mile (see Fig. 8). Rustler is chaotically dropped at least 600 feet(±180 m), from 2,600 feet down to less than 2,000 feet, in a major dissolution trough (dashed red line in centerof map). Red shaded area in west is outcrop of Rustler Formation, according to Ewing and others (2012).
Figure 10. Thicknessmap of the Rustler Formation (modi!ed fromEwing and others, 2012). Colors are areas of equalthickness, in 100s of feet (30m). Thickness is highly variable, mainly because of dissolution of salt beds in the under-lying Salado Formation and resultant collapse of the Rustler Formation. Locally, the Rustler thins abruptly by 200 to400 feet (61-122 m), from 601 to 700 feet down to 301–400 feet, in a major dissolution trough (dashed red line incenter of map). Red shaded area in west is outcrop of Rustler Formation, according to Ewing and others (2012).
Evaporite Karst in the Permian Rustler, Salado, and Castile Formations 223

shownbyAGRA (Fig. 7). The geology of Permian rocksbeneath the Quaternary deposits on the right-hand(northeast) side of Figure 7 is probably as complex asit is beneath the left-hand (southwest) side, but therewere not enough deep boreholes to show this whenthat cross section was prepared.
The Culebra appears to be little disturbed and nearlyhorizontal, at several places, including: at the decommis-sioned power plant (Figs. 11A, 11B); in the main spill-way just north of the spillway gates; and south of thecommunity of Red Bluff—but these are the exceptions.In places the Culebra is a true dolomite, whereas else-where it is a dolomitic limestone or even a limestone(hence, our occasional use of the term “dolomite/limestone”).
In the Red bluff area, the Culebra commonly is buff,yellowish-gray or olive-gray, very hard, medium- tothick-bedded, "ne-grained dolomite or dolomitic lime-stone. It locally contains inclusions of gypsum and cal-cite (Komie, 1952). In places it contains vugs and otherpore spaces, because of dissolution of preexisting saltand/or gypsum originally deposited within the dolomite;this is similar to observations farther north at the WIPP
Site, about 25 miles east of Carlsbad, NM (Powers andothers, 2006). The Culebra is 35–55 feet thick in Refer-ence Boreholes 1, 3, and 4 (Fig. 5) and is approximately55 feet thick in local outcrops examined by Komie(1952). Where it is much thinner than 55 feet nearRed Bluff Dam, this undoubtedly results from local ero-sion, dissolution, or collapse of some of the unit.
Being a somewhat water-soluble rock, the Culebramay locally be karstic and contain small or large solutioncavities or passageways. Also, there are places where theCulebra is fractured or jointed (Fig. 11A), and these frac-tures can be pathways through which water can travel.Therefore, where the Culebra is fractured or karstic, itmay contain openings that allow water to exit the reser-voir and pass under the dam.
Gypsum
The second most conspicuous rock in the Rustler inthe Red Bluff area is gypsum. Gypsum here is white,light- to medium-gray, or can even have a reddish hue(caused by iron oxides). In some places it is massive,and elsewhere it is thin-bedded. Regionally, gypsum is
Figure 11. Views of Culebra Dolomite at Red Bluff Dam. A) Nearly horizontal Culebra, Rustler, and Quaternary strataat decommissioned power plant of dam. Culebra here contains two sets of fractures that are: 1) vertical and 2) dipabout 45° down to the left (east-southeast). B) Close-up of upper part of Figure 11A, showing contorted bedding inRustler shale between Culebra Dolomite and Quaternary sediments. C) Tilted block of Culebra Dolomite dips to thesouth at 20°. D) Tilted block of Culebra Dolomite (300 feet north of Figure 11C) dips to the west at 30°.
224 Kenneth S. Johnson, Richard A. Shoemaker, John Charlton and Cris Parker

present in the Forty-Niner, Tamarisk, and Los MedanosMembers of the Rustler Formation (Fig. 5), and the sameis probably true in the Red Bluff area. However, the cha-otic nature of the Rustler beneath and near the dam(Figs. 4, 5, 7)makes it dif"cult to assignmost of the gyp-sum beds or blocks to a particular member of the RustlerFormation. Komie (1952) reports that the thickness ofindividual gypsum units exposed in the area rangesfrom 8 to 27 feet, whereas RB–1 through RB–5 encoun-tered gypsum units (or blocks) 3–22 feet thick (Fig. 5).Some of the gypsumunits in theReferenceBoreholes areprobably collapsed blocks andmay not represent the truethickness of the gypsum before its collapse. Examples ofcollapse blocks or fragments of gypsum are shown inFigures 12D, 13, and 14.
The most dramatic example of collapse breccia in theRed Bluff area is exposed on the south shore of the lake,just upstream of Red Bluff Dam station 1,500 (Figs. 13,14A–C). At this site, chaotic blocks of gypsum arerandomly oriented in an area that extends at least 200feet in a N 30º E direction and at least 110 feet in a N60º W direction: this collapse breccia, normally coveredby lake water, was visible in 2012 because of an
exceptionally� low� lake� level� and,� unfortunately,�may�not�be�visible�when�lake�levels�rise.�The�bedding�in�vari-ous�blocks�of�gypsum�and�other�rock�types�here�dips�at�angles� of� 20º� to� 90º� in� all� directions,� and� individual�exposed�blocks�are�1–27�feet�across�(Fig.�13).
Collapse�blocks�here�result�from�dissolution�of�under-lying�beds�of�salt�(and�probably�also�some�gypsum)�and�chaotic�collapse�of�the�Rustler�Formation�to�form�a�col-lapse�breccia.�The�gypsum�blocks�may�be�part�of�any�of�the� Rustler� members� (Forty-Niner,� Tamarisk,� or� Los�Medanos�Members),�but�they�are�so�jumbled�up�that�their�true�stratigraphic�position�cannot�be�determined.�The�full�thickness�or�depth�of�this�collapse�breccia�is�not�known,�but�RB–2�(intentionally�drilled�in�the�collapse�breccia)�remained�in�breccia�to�its�total�depth�of�200�feet�(Figs.�5,�14A–C).�This�area�of�collapse�breccia�is�adjacent�to�an�“area� of� surfacing� seepage”� just� downstream� of� the�dam,� as� noted� by� AGRA� (1994)� in� UIFJS� Figure� 2.1�and� as�described�in�UIFJS�Table�4.1.
Additional� evidence� of� collapse� breccia� at,� and�beneath,�the�dam�was�presented�by�AGRA�(Fig.�7).�Bor-ings�and�other�interpretations�by�AGRA�show�areas�of�col-lapse�breccia�(AGRA�called�them�“collapse�structures”)
Figure 12. Views of collapse features near Red Bluff Dam. A) Tilted block of Culebra Dolomite dips to the west at 15°in dam spillway. B) View looking southwest over west borrow area, which contains many collapsed blocks of DeweyLake Formation overlain by Quaternary conglomerate (in background). C) Collapsed block of Dewey Lake Formationredbeds (shale and siltstone) that dip to the southeast at 60° in west borrow area. D) Collapsed block of gypsum inRustler Formation dips to the south-southwest at 65°, just east of the west borrow area.
Evaporite Karst in the Permian Rustler, Salado, and Castile Formations 225

almost continuously on the left side of Figure 7, betweendamstations 800 and2,650: this part of the dam is adjacentto the collapse breccia described above, just upstream ofdam station 1,500 (HDR RB–2; Figs. 5, 6, 13, 14A–C).
Gypsum is a moderately water-soluble rock—muchmore soluble than dolomite or limestone—and thus it isthe most karstic rock in outcrops and shallow subsur-face in the Red Bluff area. Some of the typical karst fea-tures, such as sinkholes and caves, are not evident inlocal outcrops, but there certainly are underground cav-ities and openings within, or adjacent to, gypsum layersor collapsed blocks. This is evident because of themany notations about a “cavity” or “void,” 1–3 feethigh, in the logs of boreholes and grout holes drilledbeneath, or adjacent to, the dam (Reed and Associates,1978). Similar cavities or voids are also noted in de-scriptions of HDR’s RB–1 through RB–5 and groutholes drilled in the current grouting program (Charltonand others, 2021).
Karst features in gypsum may be a signi"cant sourceof water loss beneath Red Bluff Dam. Because of the
local� abundance� of� gypsum,� its� moderate� solubility,�and�the�chaotic�nature�of�gypsum�blocks�in�the�area,�there�are�ample�opportunities�for�water�to�seep�down�to,�and�into,�any�cracks,�cavities,�or�other�openings�in�(or�adja-cent�to)�the�gypsum.�And�because�of�gypsum’s�solubility,�water�that�is�unsaturated�with�respect�to�calcium�sulfate�will� further�dissolve� the�gypsum�and�may�enlarge�any�openings� in� the� rock,� thus� enhancing� and� increasing�the�!ow�of�water�over�time.
Shale,�Siltstone,�and�SandstoneShale,� along�with� siltstone� and� sandstone,�make� up�
the�remainder�of�rocks�locally�present�in�the�Rustler�For-mation.�These�rocks�or�sediments�are�rarely�seen�in�local�outcrops �but�have�been�drilled�and�cored�in�many�of�the�boreholes�in�the�dam�foundation�(Reed�and�Associates,�1978).�They�are�described�as�shale,�clay,�siltstone,�and/or�sandstone�that�are�in�various�colors,�including�tan,�red,�brown,�gray,�dark�gray,�and�olive�gray.�These� types�of�sedimentary�rocks�are�present�in�all�members�of�the�Rus-tler� Formation� in� the� region� (except� the�Culebra� and
Figure 13. Views of collapse breccia near station 1,500 of Red Bluff Dam. A) Collapse breccia, exposed along southshore of lake during low water level, covers an area of 200 by 110 feet, and was drilled to a depth of 200 feet in theHDR RB–2 core. B) View, looking south, of collapse breccia consisting of gypsum and other rocks in blocks 1–27 feetacross. C) Another view, looking north, of same collapse breccia with blocks of gypsum and other rocks. D) Anotherview, looking north, of same collapse breccia showing strike direction of strata in individual blocks of rock that dip inall directions at angles of 20° to 90°.
226 Kenneth S. Johnson, Richard A. Shoemaker, John Charlton and Cris Parker

Magenta Dolomite Members), but, because of the cha-otic nature of the Rustler in the Red Bluff area, inmost cases it is impossible to assign these rocks to anyparticular member.
One outcrop where a shale unit can be reliably as-signed is at the Power Plant (Figs. 11A, 11B). At thissite, several feet of contorted shale in the Rustler Forma-tion directly overlies the Culebra Dolomite and thereforeis part of the Tamarisk Member. The highly contortedbedding within this shale probably results from dissolu-tion of preexisting gypsum and/or salt layers that wereinterbedded with, or were directly beneath, the shale.
Other�Local�Rocks�and�DepositsOther� rocks� and� deposits� near� and� beneath� Red�
Bluff� Dam� are� 1)� the� Salado� and� Castile� Formations�that�underlie�the�Rustler;�2)�the�Dewey�Lake�Formation�that�overlies�the�Rustler;�and�3)�Quaternary�deposits�that�blanket�and�overlie�Permian�rocks�in�most�of�the�area.
Salado�and�Castile�Formations
Beneath� the�Rustler�Formation�are� the�salt�and�gyp-sum/anhydrite� units� of� the� Salado� and�Castile� Forma-tions� (Figs.�1,� 3–5).� They� are� not� exposed� anywhere
Figure�14.�Brecciated�rock�in�NX�cores�(about�2.15�inches�in�diameter)�drilled�in�collapse�breccia�near�station�1,500�of�Red�Bluff�Dam�(borehole�HDR�RB–2)�and�at�northeast�end�of�dam�(borehole�HDR�RB–�).�A)�A�2-foot-long�box�of�core�(depth,�70.5�to�80.5�feet)�from�RB–2�contains�large�blocks�of�gypsum,�as�well�as�small-scale�brecciated�rock�(outlined� in�red).�B)�Small-scale�brecciated�rock�in�core�from�RB–2� includes�angular�fragments�of�gypsum,�dolo-mite,�and�shale�recemented�in�a�matrix�of�red-brown�mudstone�(marker�is�78.0�feet�deep).�C)�Similar�small-scale�breccia�in�core�from�RB–2�(marker�is�161.0�feet�deep).�D)�Similar�small-scale�breccia�in�core�from�RB–��(marker�is�196.0�feet�deep).
Evaporite Karst in the Permian Rustler, Salado, and Castile Formations 227

within perhaps 10 miles of the dam, but they have a pro-found in!uence on the local geology, at and near the dam.Because of dissolution of salt and gypsum/anhydritewithin these formations (Fig. 4), the Rustler Formationhas been chaotically disrupted, and it is very dif"cult torecognize individual Rustler rock units in outcrops orcorrelate them in the many boreholes that have beendrilled—the one exception being the Culebra Dolomite,which is conspicuous in outcrops and is generally recog-nizable in boreholes. Because of extensive dissolutionwithin the Salado, it is also very dif"cult to recognizethe top and base of the formation near the dam(Fig. 3), and therefore only units in the Castile Forma-tion are clearly recognizable.
Dewey Lake Formation
The Dewey Lake Formation, which directly overliesthe Rustler Formation regionally, as well as at and nearthe dam (Figs. 1, 3–6), is mostly reddish-brown shaleand siltstone (Figs. 12B–C). It is the youngestPermian-age formation in the Delaware Basin. TheDewey Lake is poorly exposed in the vicinity of thedam, but it has a reported thickness of about 110 feet innearby parts of Loving County (Komie, 1952); hedescribed the scattered exposures of DeweyLake, locatedsome 3–5 miles north of the dam, as “remnants interredas "ll in tremendous sinkholes” (Komie, 1952, p. 17).
Exposures of theDeweyLakeFormation near the dam(Fig. 6) are located: 1) in the west borrow area; 2) in asmall area about 0.3 mile south of the main spillway;and 3) in a quarry located about 1.25 miles west of thecommunity of Red Bluff. In each of these locations,Dewey Lake strata are highly disrupted and chaotic asa result of dissolution of underlying salt and gypsum/anhydrite units.
The west borrow area (shale was excavated here forthe core of the dam) is a substantial area of collapse con-taining numerous exposures of chaotic blocks of DeweyLake redbeds that dip at moderate to steep angles in var-ious directions (Figs. 12B–C). Although these expo-sures were not originally recognized as Dewey Lakestrata by Komie (1952), they were later recognized byAGRA (1994), and we agree with the AGRA interpreta-tion. It is possible that some of the collapse features inthe west borrow area are connected with the collapsebreccia of Rustler gypsum blocks northwest of dam sta-tion 1,500, inasmuch as these collapse areas are only acouple of hundred feet apart, on opposite sides of thedam (Fig. 6).
The small collapse block of reddish-brown shale andsiltstone, located about 0.3 mile south of the main spill-way (Fig. 6), is believed to be an exposure of the DeweyLake Formation. It has all the lithologic characteristics ofthe Dewey Lake, and the 20-foot-wide block dips at anangle of 70º.
The third known local exposure of Dewey Lake stratais in a quarry, or pit, about 1.25 miles west of the RedBluff community. At this site, one exposure of DeweyLake redbeds dips toward S 30º E at an angle of about40º. The Dewey Lake here is overlain unconformablyby Quaternary sediments.
Quaternary Deposits
Quaternary deposits include a variety of sands, silts,clays, gravels, and other sediments laid down in rivers,streams, and lakes or ponds that covered Permian bed-rock during the Quaternary Period. They includepresent-day alluvium along the banks and !oodplainsof Pecos River and Salt Creek, as well as terrace depositsand the Gatuna Formation. These sediments are nonce-mented to strongly cemented, and they mantle, overlie,and conceal the great complexity that exists in the Rus-tler and other bedrock formations at most places near thedam (Figs. 6, 7, 11A–B). Aside from Pecos River andSalt Creek alluvium, the other Quaternary deposits arenot differentiated on the geologic map (Fig. 6).
It is likely that some of the seepage, particularly on thenortheast side of the dam, is !owing through the weaklyto strongly cemented layers of Quaternary silt, sand, andconglomerate (Fig. 7). AGRA (1994, p. 27) reports thatshallow groundwater is found in boreholes all along thetoe of the dam along its northeast extent, andmuch of thewater appears to be following !ow paths under the coreand cutoff trench of the dam. This results in shallow-water or surface seepage at points downstream of thedam at several places between dam stations 4,000 and7,000 (AGRA, 1994, see their Figure 2.1).
Gypsite, a Quaternary deposit, is an earthy variety ofgypsum that forms by precipitation of gypsum crystals inlakes or ponds whose water is supersaturated with cal-cium sulfate that has been weathered and eroded fromnearby Permian gypsums. It is a noncemented depositthat typically contains clay, silt, and/or sand washedinto the lake or pondduring precipitation.Gypsite depos-its in the area are up to 10–20 feet thick. Gypsite is noparticular problem, as far as loss of water fromRed BluffReservoir. It may be present in the foundation on thenortheast side of the dam (on the right side of Fig. 7),but it would be interspersed with layers of noncementedsand, silt, and clay, and should be no more of a problemthan any of the sands with which it is associated.
CONCLUSION: LOSS OF WATER BENEATHRED BLUFF DAM
Themain causes of water loss beneath Red Bluff Damappear to be because of the following: 1) dissolution ofsalt and/or gypsum beds in the Rustler, Salado, andCastile Formations; 2) collapse and chaotic disruptionof gypsum, dolomite, and other rocks in the Rustler
228 Kenneth S. Johnson, Richard A. Shoemaker, John Charlton and Cris Parker

Formation; 3) development of karst features within thegypsum and dolomite units and collapsed blocks ofthe Rustler Formation; and 4) probable seepage throughQuaternary sands and gravels, chie!y beneath the north-east side of the dam.
Dissolution of salt and/or gypsum in the Rustler, Sal-ado, and Castile Formations has led to subsidence andcollapse of overlying strata—particularly in the RustlerFormation (Figs. 4, 7). As a result, the Rustler and over-lying Dewey Lake Formations have been chaoticallydropped into underground solution cavities to form sev-eral collapse breccias, such as the one observed justnorthwest of dam station 1,500 (Figs. 13, 14A–C),and other collapse features at various places adjacentto the dam, in the spillway, and in the west borrowarea (Figs. 11, 12). Such chaotic brecciation has con-torted and fractured the Culebra Dolomite and themany gypsum beds in the Rustler (Fig. 7), opening upnumerous pathways for water to seep through the brec-cia. Movement of groundwater through the fractures andbreccia zones, and through other areas underlain by gyp-sum, causes karst development in the water-solublerocks, and this further enables water to !ow beneaththe dam.
The main area for this water loss appears to be on thesouthwest side of the dam, between stations 800 and2,650, producing surface seepage that !ows throughthe west borrow area and into the Pecos River. It isalso possible that similar breccia zones, karst features,and !ow paths underlie the northeast side of the dam,but data are inconclusive at this time. Beneath the north-east side of the dam, the weakly to strongly cementedsands and gravels (Fig. 7) apparently are permeableenough to allow lake water to seep under the dambetween dam stations 4,000 and 7,000, and this waterthen surfaces and !ows through the east borrow areaand into the Pecos River.
REFFERENCES CITED
AGRA, 1994, RedBluff Damgeotechnical investigationand piezometer installation project, Red Bluff, Texas:unpublished report submitted to HDR Engineering,Inc., Austin, TX, fromAGRAEarth&Environmental,Inc., El Paso, TX, as AGRA E&E Job No. E94-4067,35 p., plus Appendices A–G.
Alger, R.P., and Crain, E.R., 1966, De"ning evaporitedeposits with electric well logs, in Rau, J.L., ed., Sec-ond symposium on salt: Cleveland, Northern Ohio,Geological Society, Vol. 2, p. 116-130. http://www.ross-crain.com/freepubs/1966-2%20De"ning%20Evaporite%20Deposites%20With%20Electrical%20Well%20Logs%20%20NOGS-SALT%20Alger-Crain.pdf
Anderson, R.Y., Dean, W.E., Jr., Kirkland, D.W., andSnider, H.I., 1972, Permian Castile varved evaporite
sequence, west Texas and New Mexico: GeologicalSociety of America Bulletin, Vol. 83, p. 59-86.https://www.wipp.energy.gov/library/CRA/2009_CRA/references/Others/Anderson_et_al_1972_Permian_Castile.pdf
Ashworth, J.B., 1990, Evaluation of ground-water re-sources in parts of Loving, Pecos, Reeves, Ward,and Winkler Counties, Texas: Texas Water Develop-ment Board, Report 317, 51 p. http://www.twdb.texas.gov/publications/reports/numbered_reports/doc/R317/R317.pdf
Bachman, G.O., 1984, Regional geology of Ochoanevaporites, northern part of Delaware Basin: NewMexico Bureau of Mines and Mineral Resources, Cir-cular 184, 22 p. https://geoinfo.nmt.edu/publications/monographs/circulars/downloads/184/Circular-184.pdf
Boghici, R., andVanBroekhoven,N.G., 2001,Hydroge-ology of the Rustler aquifer, Trans-Pecos Texas, inMace, R.E., Mullican, W.F., III, and Angle, E.S.,eds., Aquifers of west Texas: Texas Water Develop-ment Board Report 356, p. 207-225. https://www.twdb.texas.gov/publications/reports/numbered_reports/doc/R356/Ch15_Rustler.pdf
Charlton, J., Ostrowsky, J., Shoemaker, R.A., and John-son, K.S., 2021, Design and implementation of a groutprogram in an evaporite-karst foundation, Red BluffDam, Loving andReevesCounties, Texas, in Johnson,K.S., Land, L., andDecker, D.D., eds., Evaporite karstin the Greater Permian Evaporite Basin (GPEB) ofTexas, New Mexico, Oklahoma, Kansas, and Colo-rado: Oklahoma Geological Survey, Circular 113.
Chen, F., and Wu, M, 1983, Investigation of the engi-neering properties of a dam foundation containinggypsum seams: Rock Mechanics and Rock Engineer-ing, Vol. 16, No. 4, p. 275-280.
Cooper, A.H., Gutiérrez, F., 2013, Dealing with gypsumkarst problems: hazards, environmental issues, andplanning, in Shroder, J., ed. In chief, Frumkin, A.,ed., Treatise on Geomorphology: Academic Press,San Diego, CA, Vol. 6, Karst Geomorphology, pp.451–462. https://www.researchgate.net/publication/262373474
Cox, E.R., 1967, Geology and hydrology between LakeMcMillan and Carlsbad Springs, Eddy, County, NewMexico: U.S. Geological Survey, Water-Supply Paper1828, 48 p. https://pubs.usgs.gov/wsp/1828/report.pdf
Eager, G.P., 1983, Core from the lower Dewey Lake,Rustler, and upper Salado Formations, CulbersonCounty, Texas, in Shaw, R.L., and Pollan, B.J., eds.,Permian Basin cores—a workshop: Permian BasinSection, S.E.P.M. Core Workshop #2, p. 273-283.
Ege, H.R., 1985, Maps showing distribution, thickness,and depth to salt deposits of the United States: U.S.
Evaporite Karst in the Permian Rustler, Salado, and Castile Formations 229

Geological Survey, Open-File Report 85–28, 11 p.,map scale, 1:2,500,000. https://pubs.er.usgs.gov/publication/ofr8528
Ei!er, G.K., Jr., Geologic Atlas of Texas, Pecos Sheet:Texas Bureau of Economic Geology, scale 1:250,000.
Ewing, J.E., Kelley, V.A, Jones, T.L., Yan, T, Singh, A.,Powers, D.W., Holt, R.M., and Sharp, J.M., 2012,Groundwater availability model report for the Rustleraquifer: Texas Water Development Board, Draft FinalReport, about 400 p. https://www.twdb.texas.gov/groundwater/models/gam/rslr/RSLR_GAM_Report.pdf
Fell, R., 2005, Geotechnical engineering of dams: A.A.Balkema, Leiden, New York, 912 p.
Hentz, T.F., Price, J.G., and Gutierrez, G.N., 1989,Geologic occurrence and regional assessment ofevaporite-hosted native sulfur, Trans-Pecos Texas:Texas Bureau of Economic Geology, Report of Inves-tigations No. 184, 70 p.
Hill, C.A., 1996, Geology of the Delaware Basin, Gua-dalupe, Apache, and Glass Mountains, New Mexicoand west Texas: Society of Economic Paleontologistsand Mineralogists, Permian Basin Section, Publica-tion No. 96–39, 480 p.
Hill, C.A., 2003, Intrastratal karst at the Waste IsolationPilot Plant site, southeastern New Mexico, in K.S.Johnson and J.T. Neal, eds., Evaporite karst and engi-neering/ environmental problems in the United States:Oklahoma Geological Survey Circular 109, p. 197-209. http://ogs.ou.edu/docs/circulars/C109.pdf
Hiss, W.L., 1976, Structure of the Permian Ochoan Rus-tler Formation, southeast New Mexico and westTexas: NewMexico Bureau ofMines andMineral Re-sources, Resource Map 7, scale 1:500,000. https://geoinfo.nmt.edu/publications/maps/resource/downloads/7/RM-7.pdf
Holt, R.M., andPowers,D.W., 2010, Evaluation of halitedissolution at a radioactive waste disposal site, An-drews County, Texas: Geological Society of AmericaBulletin, v. 122, p. 1989-2004.
James, A.N., and Lupton, A.R.R., 1978, Gypsum andanhydrite in foundations of hydraulic structures: Geo-technique, Vol. 28, No. 3, p. 249-272.
James, A.N., and Kirkpatrick, I.M., 1980. Design offoundations of dams containing soluble rocks andsoils: Quarterly Journal of Engineering Geology,Vol. 13, p. 189-198.
James, R.L., Catanach, R.B., O’Neill, A.L., and VonThun, J.L., 1989, Investigation of the cause of QuailCreek Dike failure: Unpublished report of the Inde-pendent Review Team to Norman H. Bangerter, Gov-ernor of Utah, 155 p.
Jarvis, T., 2003, The money pit: karst failure of AnchorDam, Wyoming, in K.S. Johnson and J.T. Neal, eds.,
Evaporite karst and engineering/environmental prob-lems in the United States: Oklahoma GeologicalSurvey Circular 109, p. 271–278. http://ogs.ou.edu/docs/circulars/C109.pdf
Johnson, K.S., 1993, Dissolution of Permian Salado saltduring Salado time in the Wink area, Winkler County,Texas, inD.W. Love and others, eds., Carlsbad region,NewMexico andwest Texas: NewMexicoGeologicalSociety Guidebook, 44th Annual Field Conference(October 6–9, 1993), p. 211-218. https://www.researchgate.net/publication/268385405
Johnson, K.S., 1996, Gypsum karst in the United States,in A. Klimchouk and others, eds., Gypsum karst of theworld: International Journal of Speleology, v. 25, nos.3–4, p. 183-193. https://scholarcommons.usf.edu/ijs/vol25/iss3/13/
Johnson, K.S., 2003a, Evaporite-karst problems in theUnited States, in K.S. Johnson and J.T. Neal, eds.,Evaporite karst and engineering/environmental prob-lems in the United States: Oklahoma GeologicalSurvey Circular 109, p. 1-20. http://ogs.ou.edu/docs/circulars/C109.pdf
Johnson, K.S., 2003b, Gypsum karst and abandonmentof the Upper Mangum Damsite in southwestern Okla-homa, in K.S. Johnson and J.T. Neal, eds., Evaporitekarst and engineering/environmental problems inthe United States: Oklahoma Geological Survey Cir-cular 109, p. 85-94. http://ogs.ou.edu/docs/circulars/C109.pdf
Johnson, K.S., 2008a, Evaporite-karst problems andstudies in the USA: Environmental Geology, Vol.53, No. 5, p. 937-943. https://www.researchgate.net/publication/225519191
Johnson, K.S., 2008b, Gypsum-karst problems in con-structing dams in the USA: Environmental Geology,Vol. 53, No. 5, p. 945-950. https://www.researchgate.net/publication/226513928
Johnson, K.S., 2021, Identi"cation of gypsum, anhy-drite, and salt on geophysical logs in theGreater Perm-ian Evaporite Basin, in Johnson, K.S., Land, L., andDecker, D.D., eds., Evaporite karst in the GreaterPermian Evaporite Basin (GPEB) of Texas, NewMex-ico, Oklahoma, Kansas, and Colorado: OklahomaGeological Survey, Circular 113.
Johnson, K.S., and Gonzales, S., 1978, Salt deposits inthe United States and regional characteristics impor-tant for storage of radioactive wastes: prepared forUnion Carbide Corp., Nuclear Division, Oak RidgeNational Laboratory, Of"ce of Waste Isolation,Y/OWI/SUB-7414/1, 188 p. Also available from:Oklahoma Geological Survey, Open-File Report 18-2018. http://www.ou.edu/content/dam/ogs/documents/data/OF18-2018.pdf
230 Kenneth S. Johnson, Richard A. Shoemaker, John Charlton and Cris Parker

Johnson, K.S., Gonzales, S., and Dean,W.E., 1989, Dis-tribution and geologic characteristics of anhydrite de-posits in the United States, in W. E. Dean and K. S.Johnson, eds., Anhydrite deposits of the United Statesand characteristics of anhydrite important for storageof radioactive wastes: U.S. Geological Survey Bulle-tin 1794, p. 9–90. https://pubs.usgs.gov/bul/1794/report.pdf
Komie, K.E., 1952, Geology of Red Bluff Lake area,Loving and Reeves Counties, Texas: unpublishedM.S. Thesis, The University of Texas, 73 p.
Lambert, S.J., 1983, Dissolution and evaporites in andaround theDelaware Basin, southeasternNewMexicoand west Texas: Sandia National Laboratory, Albu-querque, New Mexico, SAND 82–0461. https://pdfs.semanticscholar.org/19b4/e083b9d9d611677ef0860ac31ca4a764286f.pdf?
Land, L., 2013, Evaporite karst in the Permian Basinregion of west Texas and southeastern New Mexico:the human impact, in Land, L., Doctor, D.H., and Ste-phenson, J.B., eds., Sinkholes and the engineering andenvironmental impacts of karst–Proceedings of thethirteenth multidisciplinary conference, Carlsbad,NM, May 6 through 10, 2013: National Cave andKarst Research Institute, Carlsbad, NM, p. 113-121.http://scholarcommons.usf.edu/cgi/viewcontent.cgi?article=1119&context=sinkhole_2013
Maley, V.C, and Huf"ngton, R.M., 1953, Cenozoic "lland evaporite solution in the Delaware Basin, Texasand New Mexico: Geological Society of America,Bulletin, v. 64, p. 539-546.
Martinez, J.D., Johnson, K.S., and Neal, J.T., 1998,Sinkholes in evaporite rocks: American Scientist,v. 86, No. 1 (January–February), p. 38-51. https://www.researchgate.net/publication/250968543
Milanovic, P.T., 2000, Geologic engineering in karst:Zebra Publishing Ltd., Belgrade, Yugoslavia, 347 p.
Milanovic, P.T., 2018, Engineering karstology of damsand reservoirs: CRC Press, Taylor and FrancisGroup, Boca Raton, FL, 356 p.
Milanovic, P.T., 2019,Maksimovich, N., andMeshcher-iakova, O, 2019, Dams and reservoirs in evaporites:Springer Nature Switzerland, 156 p.
Nurmi, R.D., 1978, Use of well logs in evaporite sequen-ces, in Dean, W.E., and Schreiber, B.C., eds, Marineevaporites: Society of Economic Paleontologists andMineralogists, SEPM Short Course No. 4 held inOklahoma City, p. 144-176.
O’Neill, A.L., and Gourley, C., 1991, Geologic perspec-tives and cause of the Quail Creek Dike failure:Bulletin of Association of Engineering Geologists,Vol. 27, No. 2, p. 127-145.
Olive,W.W., 1957, Solution-subsidence troughs, CastileFormation of Gypsum Plain, Texas and New Mexico:Geological Society of America, Bulletin, Vol. 68,p. 351-358.
Payton, C.C., and Hansen, M.N., 2003, Gypsum karst insouthwesternUtah: failure and reconstruction ofQuailCreek Dike, inK.S. Johnson and J.T. Neal, eds., Evap-orite karst and engineering/environmental problems inthe United States: Oklahoma Geological Survey Cir-cular 109, p. 293-303. http://ogs.ou.edu/docs/circulars/C109.pdf
Pearson, R.M., 2002, Gypsum karst of the Lykins For-mation and effects for Colorado Front Range waterprojects; Horsetooth andCarter LakeReservoirs: Geo-logical Society of America, Abstracts with Programs,Vol. 34, No. 6, p. 216.
Pierce,W.G., and Rich, E.I., 1962, Summary of rock saltdeposits in the United States as possible storage sitesfor radioactive waste materials: U.S. Geological Sur-vey, Bulletin 1148, 91 p. https://pubs.er.usgs.gov/publication/b1148
Powers, D.W., and Holt, R.M., 1999, The Los MedanosMember of the Permian (Ochoan) Rustler Formation:New Mexico Bureau of Geology & Mineral Resour-ces, New Mexico Geology, Vol. 21, No. 4, p. 97-103. https://geoinfo.nmt.edu/publications/periodicals/nmg/21/n4/nmg_v21_n4_p97.pdf
Powers, D.W., Holt, R.M., Beauheim, R.L., andRichardson, R.G., 2006, Advances in depositionalmodels of the Permian Rustler Formation, southeast-ern NewMexico, in Land, L., Lueth, V.W., Raatz, W.,Boston, P., and Love, D.W., eds., Caves & karst ofsoutheastern New Mexico: New Mexico GeologicalSociety, Fall Field Conference, Guidebook 57,p. 267-276. https://www.wipp.energy.gov/library/CRA/2009_CRA/references/Others/Powers_et_al_2006_Advances_in_Depositional_Models.pdf
Reed, E.L., &Associates, 1978, Inspection and groutingRed Bluff Dam, Pecos River, Reeves and LovingCounties, Texas: unpublished report prepared forRed BluffWater Power Control District, Pecos, Texas,20 p. plus illustrations, boreholes and grouting re-cords, and water analyses.
Snider, H.I., 1966, Stratigraphy and associated tectonicsof the Upper Permian Castile–Salado–Rustler evapo-rite complex, Delaware Basin, west Texas and south-east New Mexico: unpublished Ph.D. dissertation,University of New Mexico, Socorro, NM, 196 p.
Stafford, K.W., 2013, Evaporite karst and hydrogeologyof the Castile Formation: Culberson County, Texas,and Eddy County, New Mexico, in Land, L., Doctor,D.H., and Stephenson, J.B., eds., Sinkholes and the
Evaporite Karst in the Permian Rustler, Salado, and Castile Formations 231

engineering and environmental impacts of karst–Proceedings of the thirteenthmultidisciplinary confer-ence, Carlsbad, NM, May 6 through 10, 2013:National Cave and Karst Research Institute, Carlsbad,NM, p. 123-131. https://pdfs.semanticscholar.org/fa26/e653bc2c3ae95007f83dde9a1d4eab38211d.pdf
Stafford, K.W., and Nance, R.G., 2018, Evaporite karstof west Texas: Delaware Basin, in Stafford, K.W., andVeni, G., eds., Hypogene karst of Texas: Texas Spele-ological Survey, Monograph 3, p. 36-50. https://www
.texasspeleologicalsurvey.org/PDF/Hypogene_Karst_of_Texas.pdf
Vine, J.D., 1963, Surface Geology of the Nash DrawQuadrangle, Eddy County, New Mexico: U.S. Geo-logical Survey, Bulletin 1141–B, 46 p. https://pubs.er.usgs.gov/publication/b1141B
Withington, C.F., 1962, Gypsum and anhydrite in theUnited States, exclusive of Alaska and Hawaii: U.S.Geological Survey, Mineral Investigations ResourceMap MR–33.
232 Kenneth S. Johnson, Richard A. Shoemaker, John Charlton and Cris Parker

Design and Implementation of a Grout Program in an Evaporite-KarstFoundation, Red Bluff Dam, Loving and Reeves Counties, Texas
John CharltonHDR Engineering, Denver, Colorado
Jenn OstrowskyUtah State University, Logan, Utah
Richard A. ShoemakerRetired Engineer, HDR Engineering, Inc., Buena Vista, Colorado
Kenneth S. JohnsonRetired Geologist, Oklahoma Geological Survey, Norman, Oklahoma
ABSTRACT.—Red Bluff Dam is a high-hazard, 9000-ft-long embankment damlocated in west Texas on the Pecos River. The dam and the reservoir it impounds areowned and operated by the Red Bluff Water Power Control District and provideirrigation water for seven irrigation districts in the area. Construction of thedam began in late 1934 and was completed in 1936 under the engineering super-vision of the Public Works Administration. Impoundment of the reservoir began inlate 1936. Soon after initial !lling of the reservoir, extensive seepage was notedat various locations along the toe and on the downstream slope of the dam. TheDistrict performed grouting operations in 1973 and 1978 to address seepagethrough multiple zones of the foundation.
The geology of the site includes the Permian-age Rustler Formation (dolomite,gypsum, and shale at the site) and Quaternary deposits of weakly to strongly ce-mented sand, gravel, and clay. Extensive collapse structures, resulting from disso-lution of layers of evaporites (salt and/or gypsum) in the underlying Rustler,Salado, and Castile Formations, exist within the dam foundation. Site investiga-tions were performed in 2012 and 2013 that included geologic mapping, coredrilling, and piezometer installation. Data from these investigations, combinedwith existing data from previous grouting operations and site investigations,were used to develop a comprehensive geologic model of the site and to designan effective grouting program aimed at mitigating the most critical seepage zones.
The grout program was designed, and contract documents were prepared basedon data from previous studies and grouting programs, as well as the 2012 and 2013site investigations. The grout program criteria were to provide optimal groutingof the dam foundation while protecting the embankment dam. Grouting beganin February of 2014 with The Judy Company as the contractor and was completedin January of 2015. This paper presents details of the grout program, geologic con-ditions encountered during grouting, revisions of the grout program based on !eldconditions to maximize the effectiveness of the foundation grouting, and the use ofdata from the grout program to develop additional treatment measures for ongoingseepage mitigation for the dam.
Charlton, J.; Ostrowsky, J.; Shoemaker, R. A.; and Johnson, K. S., 2021, Design and Implementation of a GroutProgram in an Evaporite-Karst Foundation, Red Bluff Dam, Loving and Reeves Counties, Texas, in Johnson,K. S.; Land, Lewis; and Decker, D. D. (eds.), Evaporite Karst in the Greater Permian Evaporite Basin (GPEB)of Texas, NewMexico, Oklahoma, Kansas, and Colorado: OklahomaGeological Survey, Circular 113, p. 233–245.
Oklahoma Geological Survey Circular 113, 2021
233

INTRODUCTION
Red Bluff Dam is an existing ‘Large’, ‘High’ hazarddam located in Texas on the Pecos River within the RioGrande River Basin, approximately six miles south ofthe New Mexico state line (Figure 1). The maximumheight of the dam at the river is 106 ft and, at the currentreservoir conservation pool elevation of 2828.2 ft(NAVD88), the reservoir contains nearly 146,000 ac-ftof water. The 9200-ft-long dam and reservoir it im-pounds are owned and operated by the Red Bluff WaterPower Control District (the District) in Pecos, Texas, andprovide irrigation water for seven irrigation districts inReeves, Loving, Ward, and Pecos Counties.
Construction of the dam began in late 1934 under theengineering supervision of the Public Works Adminis-tration. The damwas completed in late 1936, and in early1937 a large !ood "lled the reservoir to its original con-servation pool capacity (approximately 310,000 ac-ft).Soon after this rapid initial "lling of the reservoir, exten-sive seepage was noted at various locations along the toeand on the downstream slope of the dam. And so beganthe 77-yr-long history of monitoring seepage and grout-ing the foundation of Red Bluff Dam.
Aside from overtopping, because of inadequate spill-way capacity, internal erosion or “piping” from seepagethrough or beneath earthen embankments is the mostcommon cause of dam failures. Experience has shownthat adverse seepage and piping conditions can be dif"-cult to detect.When seepage and piping conditions reachthe point where detection is "nally made, the failuremechanism is often advanced to a stage that leaves littleor no time to implement remedial measures.
The geology beneath Red Bluff Dam is very complex,and major portions of the dam are founded on rockformations that are composed of water-soluble mineralsand rocks (gypsum, anhydrite, limestone, dolomite). Thecomplex foundation and long-term seepage conditions(and near failure of the dam in 1973) increase the poten-tial for a catastrophic failure and release of the reservoirat any time, and likely with little or no advance warning.Periodic “maintenance” grouting of the dam’s founda-tion will need to be performed by the District as partof the regular operation and maintenance plan for theremainder of the dam’s useful life.
HDR Engineering, Inc. (HDR) has served as theDistrict’s consultant for various projects at Red BluffDam since early 1994. Most recently (since 2009)HDR has been working with the District on dam safetyupdate projects that were necessitated by a dam safetyand security inspection of the project conducted onFebruary 26, 2008 by the Texas Commission on Envi-ronmental Quality (TCEQ) Dam Safety Program staff(see references) and by Texas dam safety rule changesthat became effective on January 1, 2009. Those projectshave consisted of a study to update the hydrology and
hydraulics� (H&H)� and� to� assess� the� overall� spillway�capacity:� dam-breach� analyses,� including� downstream�inundation�mapping;�preparation�of�an�emergency�action�plan;�documentation�of�required�operation�and�mainte-nance�procedures�for�the�project;�and�continuing�efforts�to� record� and� interpret� instrumentation� readings� at�the�dam.
The� foundation� grouting� work� addressed� by� this�report�was�not�mandated�by�TCEQ�Dam�Safety;�how-ever,� TCEQ� has� advised� the� District� that� reservoir�impoundment� above� the� spillway’s� concrete� over!ow�crest� (against� the� 15-ft�tall� radial� gates)� should� not� be�done�until�work�is�performed�to�reduce�foundation�seep-age� at� the� dam.� In� fact,� the�District� recently� hired� a�contractor� to� “lock”� the� spillway� gates� in� the� fully�opened�position�by�installing�steel�brackets�in�the�side-walls�of�each�spillway�bay�to�prevent�closing�the�gates.�If� in� the� future� the�District�decides� to� rehabilitate� and�begin�using�the�gates�again,�the�resulting�maximum�con-servation� pool� capacity� of� the� reservoir�would� nearly�double�to�286,000�ac-ft.
The�grouting�work�undertaken�in�2014�was�actually�the�third�grouting�program�completed�at� the�dam.�The�"rst�program�was� conducted� in�1973,� after� subsidence�was�discovered�along�a�major� section�of� the�upstream� shell�of�the�dam.�This�work�was�followed�by�a�second�program�in�1978.�The� results�of� the�"rst� two�grouting�programs�have�been�documented�in�reports�prepared�in�1974�and�1978�by�Ed�L.�Reed�&�Associates� (1978). In additionto�the�1973�and�1978�grouting�programs,�AGRA�Earth�and� Environmental� completed� piezometer� installations�and� a� review� of� all� grouting� and� construction� data� to�develop�a�geologic�pro"le�of�the�dam�(AGRA,�1994).
SITE�GEOLOGY
Bedrock� in� the�Red�Bluff�area�consists�of�dolomite,�dolomitic�limestone,�and�gypsum,�along�with� layers�of�red-brown� shale,� siltstone,� and� sandstone.�At� the�dam�(Figure�2),�Permian�strata�relevant�to�the�dam�foundation�include�the�following:�shale�and�siltstone�of�the�Dewey�Lake� Formation;� dolomite,� dolomitic� limestone,� and�gypsum,�along�with�layers�of�red-brown�shale,�siltstone,�and� sandstone� of� the� Rustler� Formation;� and� deeper�underground�are�beds�of�salt�and�gypsum/anhydrite� in�the�Castile�and�Salado�Formations.�Dissolution�of�these�salt�beds,�and�some�of�the�gypsum/anhydrite�beds�from�the�Rustler,�Salado,�and�Castile�Formations,�has�resulted�in� collapse� and� disruption� of� overlying� Rustler� and�Dewey�Lake�strata.�Large�breccia/collapse�zones�have�completely� displaced� and� rotated� blocks� of� Dewey�Lake� and� Rustler� strata.� The� breccia/collapse� zones�can�consist�of�blocks�of�gypsum,�dolomite,�shale,�silt-stone,�and�sandstone.�Much�of�the�space�between�blocks�is�"lled�with�clay�that�has�been�washed�into,�and�depos-ited�in,�the�spaces.�The�cross�section�in�Figure�3,�based
234 John Charlton and others

Figure 1. Plan view of the Red Bluff Dam showing 2014 grouted zones 1, 2, and 4.
Design
andIm
plementation
ofaGrout
Program
inan
Evaporite-K
arstFoundation
235

Figure 2. Generalized structural cross section A—B through Red Bluff Dam showing dissolution of salt in the Saladoand Castile Formations beneath the Rustler and Dewey Lake Formations in Loving and Reeves Counties, Texas. TheRustler Formation contains soluble gypsum beneath the dam. From Johnson and others (2021).
Figure 3. Conceptual cross section along Red Bluff Dam alignment, based upon historic borehole logs and excava-tions (modi!ed from AGRA, 1994, Figure 4.3). The complex geology of the dam foundation (particularly on the leftside of the diagram) is mainly due to dissolution of underlying salt and gypsum layers, and resultant collapse andbrecciation of overlying strata. Rustler bedrock in the right half of the cross section is probably as complex as in theleft half. All materials between original land surface and base of core trench were removed during construction ofthe dam. Also shown are zones 1, 2, and 4 for the grout program of 2014 to 2015 (Figures 4, 5, 6, 7).
236 John Charlton and others

upon data available in 1994, shows the great complexityof the geology at the dam that resulted from dissolutionof underlying salt and gypsum and chaotic collapse ofoverlying strata.
Some of the youngest sediments in the area, theTertiary Gatuna Formation and Quaternary terrace de-posits and alluvium, consist of sand, silt, clay and gravel,with zones of variably cemented sands and gravels that insome zones are very hard andwell cemented, while otherzones contain soft silt and clay. These locally derivedmaterials were deposited in depressions caused by disso-lution of evaporites of theRustler and Salado Formationsaswell as surface erosional features. Still younger depos-its of sand (some windblown), silt, clay, and gravel arewidespread and vary in thickness across the area wherethe Gatuna or Rustler deposits have been eroded and re-deposited.
GROUT PROGRAM PHASED APPROACH
In early 2012, the District decided that since groutingat the dam was last performed back in 1978, amaintenance-grouting program should be developedfor the dam’s foundation. HDR Engineering, Inc. wassubsequently instructed to prepare a scope of work forthe development of the new grouting program. HDREngineering, Inc. developed a three-phased approachfor this program. The objective of the approach was tobuild on previous grouting programs at the dam throughupdated technologies, instrumentation data analysis, re-taining specialized expertise, and using lessons learnedfrom similar projects to develop a targeted, cost-effectivegrouting program for the foundation and abutments ofthe dam. The three phases were as follows:
1. Phase 1 – Review of existing geologic literature,aerial photographs, oil and gas well logs, previousgrouting data, existing borehole data, and instru-mentation readings. Conduct a detailed, multi-day !eld reconnaissance. Develop regional andlocal geologic models to be used to prepare recom-mendations for a Phase 2 exploratory drilling andtesting program at targeted areas in the dam foun-dation and abutments.
2. Phase 2 – Perform exploratory drilling, water-pressure testing and geophysical surveys, whichwould be used to re!ne the local geologic modelinto a site-speci!c model of the dam’s foundationand abutments.
3. Phase 3 – Prepare contract documents, technicalspeci!cations, and design drawings for a targeted,cost-effective grouting program. Bids would thenbe solicited from pre-quali!ed geotechnical spe-cialty contractors to perform the grouting.
During the Phase 1 !eld reconnaissance performed in2012, it was determined that the drilling of geologic ref-erence borings on the order of 150 to 200 ft deep in the
vicinity of the dam would greatly enhance the under-standing of the site geology. Sites for four proposed200-ft deep borings were selected at locations acrossthe dam site that were believed to have a high probabilityof encountering the “typical” stratigraphic sequence, asexpected in the region, based upon the review of existinggeologic literature, oil and gaswell logs, and informationobtained during the !eld reconnaissance. A !fth boringsite was selected to investigate the depth and character-istics of amajor geologic collapse feature upstreamof thedam in the vicinity of the 1973 subsidence event. The ref-erence borings were completed in August of 2012.
Given the complexity of the local geology, it becameapparent after Phases 1 and 2 that additional drilling andwater pressure testing (Phase 3) would have limitationsin better de!ning the complex and variable dam founda-tion. Signi!cant funds could have been spent by theDistrict to conduct a Phase 3 exploration program thatwould not provide suf!cient data to assist in better under-standing the dam foundation and appropriate groutingdesign. Therefore, on completion of Phases 1 and 2, itwas HDR’s recommendation that Phase 3 be eliminatedand the District consider proceeding directly into thegrouting program. The District concurred with this planand also felt that having a grouting contractor on-sitewas a prudent course of action, should problems developduring drilling and water pressure testing. Phase 3 thenbecame the design and bidding phase again.
GROUT PROGRAM DESIGN
HDR and the District identi!ed two speci!c needs toassist with the design of the grouting program: (1) theneed to conduct a formal, 1-day potential-failure-modeanalysis (PFMA) to classify modes from high to lowprobability and prioritize areas of the foundation forgrouting; and (2) the need to install additional piezome-ters in the dam and foundation.
Given the seepage history at Red Bluff Dam, thePFMAwas limited to seepage-related mechanisms thatcould potentially initiate dam failure and/or completeor partial loss of the reservoir. In a geologic environmentcomprised of soluble evaporite rocks and karst features,undetected erosion and chemical processes may be atwork in the foundation that could adversely impact sup-port of the dam and seepage control in the foundation.The objectives of the PFMA for Red Bluff Dam were(1) to assist in identifying and prioritizing speci!c zonesof the dam’s foundation to be grouted in light of potential!nancial constraints; and (2) determine the need for,and location of, additional piezometers to provide pre-and post-grouting data for evaluating the effectivenessof the grouting program.
The installation of 11 new piezometers in the dam andfoundation at Stations 10+50, 54+00, and 71+00 wascompleted in July of 2013. These piezometers proved
Design and Implementation of a Grout Program in an Evaporite-Karst Foundation 237
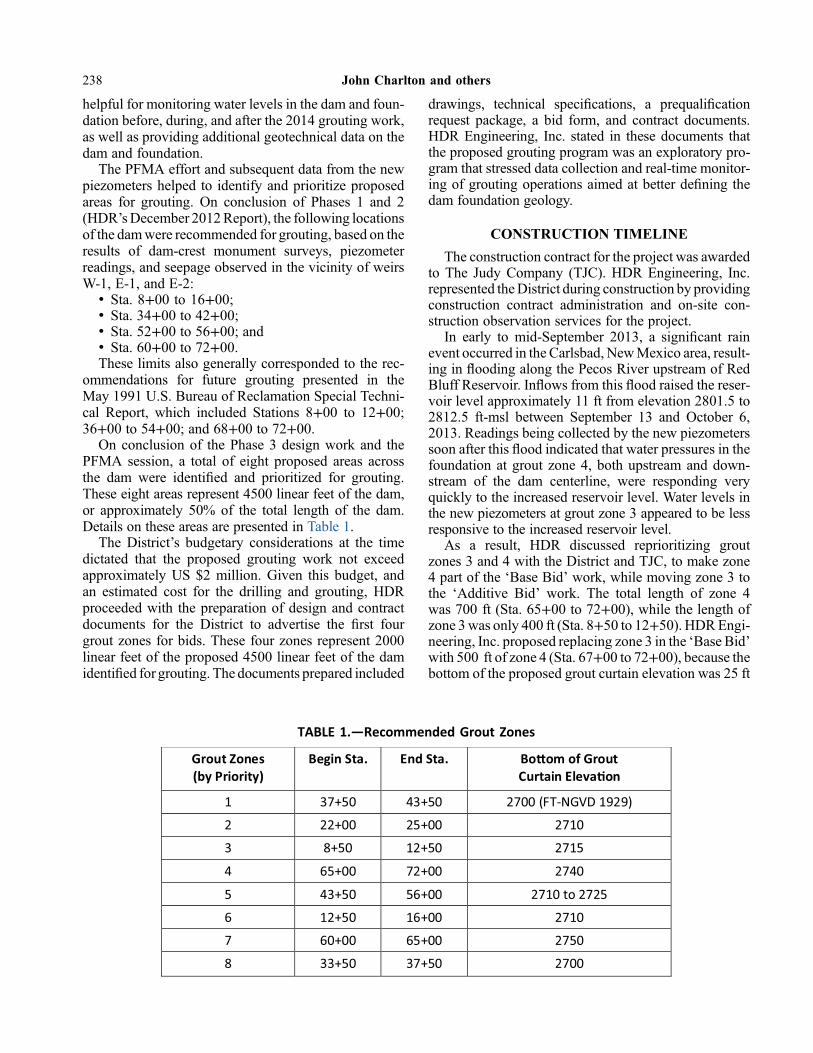
helpful for monitoring water levels in the dam and foun-dation before, during, and after the 2014 grouting work,as well as providing additional geotechnical data on thedam and foundation.
The PFMA effort and subsequent data from the newpiezometers helped to identify and prioritize proposedareas for grouting. On conclusion of Phases 1 and 2(HDR’sDecember 2012Report), the following locationsof the damwere recommended for grouting, based on theresults of dam-crest monument surveys, piezometerreadings, and seepage observed in the vicinity of weirsW-1, E-1, and E-2:
• Sta. 8+00 to 16+00;• Sta. 34+00 to 42+00;• Sta. 52+00 to 56+00; and• Sta. 60+00 to 72+00.These limits also generally corresponded to the rec-
ommendations for future grouting presented in theMay 1991 U.S. Bureau of Reclamation Special Techni-cal Report, which included Stations 8+00 to 12+00;36+00 to 54+00; and 68+00 to 72+00.
On conclusion of the Phase 3 design work and thePFMA session, a total of eight proposed areas acrossthe dam were identi!ed and prioritized for grouting.These eight areas represent 4500 linear feet of the dam,or approximately 50% of the total length of the dam.Details on these areas are presented in Table 1.
The District’s budgetary considerations at the timedictated that the proposed grouting work not exceedapproximately US $2 million. Given this budget, andan estimated cost for the drilling and grouting, HDRproceeded with the preparation of design and contractdocuments for the District to advertise the !rst fourgrout zones for bids. These four zones represent 2000linear feet of the proposed 4500 linear feet of the damidenti!ed for grouting. The documents prepared included
drawings, technical speci!cations, a prequali!cationrequest package, a bid form, and contract documents.HDR Engineering, Inc. stated in these documents thatthe proposed grouting program was an exploratory pro-gram that stressed data collection and real-time monitor-ing of grouting operations aimed at better de!ning thedam foundation geology.
CONSTRUCTION TIMELINE
The construction contract for the project was awardedto The Judy Company (TJC). HDR Engineering, Inc.represented theDistrict during construction by providingconstruction contract administration and on-site con-struction observation services for the project.
In early to mid-September 2013, a signi!cant rainevent occurred in the Carlsbad, NewMexico area, result-ing in "ooding along the Pecos River upstream of RedBluff Reservoir. In"ows from this "ood raised the reser-voir level approximately 11 ft from elevation 2801.5 to2812.5 ft-msl between September 13 and October 6,2013. Readings being collected by the new piezometerssoon after this "ood indicated that water pressures in thefoundation at grout zone 4, both upstream and down-stream of the dam centerline, were responding veryquickly to the increased reservoir level. Water levels inthe new piezometers at grout zone 3 appeared to be lessresponsive to the increased reservoir level.
As a result, HDR discussed reprioritizing groutzones 3 and 4 with the District and TJC, to make zone4 part of the ‘Base Bid’ work, while moving zone 3 tothe ‘Additive Bid’ work. The total length of zone 4was 700 ft (Sta. 65+00 to 72+00), while the length ofzone 3was only 400 ft (Sta. 8+50 to 12+50). HDREngi-neering, Inc. proposed replacing zone 3 in the ‘Base Bid’with 500 ft of zone 4 (Sta. 67+00 to 72+00), because thebottom of the proposed grout curtain elevation was 25 ft
TABLE 1.—Recommended Grout Zones
Grout Zones (by Priority)
Begin Sta. End Sta. Bo!om of Grout Curtain Eleva"on
1 37+50 43+50 2700 (FT-NGVD 1929)
2 22+00 25+00 2710
3 8+50 12+50 2715
4 65+00 72+00 2740
5 43+50 56+00 2710 to 2725
6 12+50 16+00 2710
7 60+00 65+00 2750
8 33+50 37+50 2700
238 John Charlton and others

shallower in zone 4 compared to zone 3. The ‘AdditiveBid’work then became grout zone 3 and 200 ft of zone 4(Sta. 65+00 to 67+00).
Drilling and grouting began on February 3, 2014.During the course of the work, it became apparent thatthe original contract period of 195 days for substantialcompletion (July 16, 2014), plus 30 days for !nal com-pletion, was not going to be suf!cient. The Districtgranted several contract extensions over the course ofthe project. A major rain event and subsequent "oodingseverely impacted the project site beginning on Septem-ber 19, 2014. The spillway engaged at the dam for the!rst time since 1987, which blocked both access roadsto the dam until October 12, 2014. As a result of the"ood, the District temporarily suspended work for30 days from September 19 to October 18, 2014.
The grouting project was completed on December 18,2014, 350 days after Notice to Proceed. In the end, 1570linear feet (LF) of dam was grouted under the Phase 4program instead of the 2000 linear feet that was plannedduring design and bidding. This included
• 640 LF of zone 1 (Sta. 37+10 to 43+50);• 360 LF of zone 2 (Sta. 21+60 to 25+20); and• 570 LF of zone 4 (Sta. 67+00 to 72+70).The location of the three grouted zones on the 1994
AGRA geologic pro!le is presented in Figure 1.
GROUT PROGRAM IMPLEMENTATION
Construction began with the drilling of exploratoryborings in zone 2 and installation of multi-port sleevepipe (MPSP) standpipes in the embankment to justbelow (approximately 6 in. below) the embankment/foundation interface. The contractor’s initial plan wasto install standpipes and begin grouting in zone 2, thenbegin operations in zone 1 while work in zone 2 contin-ued, and !nally begin work in zone 4 after zones 2 and 1were completed. As drilling and grouting progressed,the lessons learned with each hole were incorporatedto adjust the drilling, MPSP standpipe installation, andgrouting methods. The overall goal during work ineach zone became reducing borehole collapse problemsto allow grouting of the foundation treatment zone usingthe most cost-effective and ef!cient process available.The Judy Company recorded grout-take rates, pressure,and grout-mix properties for all grouting operations. Inaddition, TJC geologists logged core from exploratoryborings, cuttings from rotary and sonic drilling, andrecorded the injection pressure and pumping rate forall water pressure (Lugeon) tests for each grout stage.These efforts allowed the grouting program to be inves-tigatory as well as remedial. Discussions on the condi-tions encountered in each grout zone and key issuesare presented below in chronological order of the grout-ing by the contractor.
Grout Zone 2 (Sta. 21+60 to 25+50) Conditions/Issues Encountered During Grouting
The dam foundation strata in the 360 linear feet ofzone 2 consist primarily of dolomite (Rustler Formation)(some gypsum at the southern extent of the zone), with acover of sedimentary material (Gatuna and/or recentalluvium) of variable thickness (Figure 4). The dolomitevaries in strength from very hard to soft, with these hardto soft zones interbedded, and it is also intensely frac-tured. The top elevation of the dolomite is inconsistent,and two low areas are present that extend from Station22+40 to 23+20 and Station 24+00 to 25+20. Theselow areas in the top of the Rustler may be a result of col-lapse due to dissolution of underlying evaporites, erosionof the surface prior to deposition of the Gatuna, or both.The overlying Gatuna/recent alluvium sediments consistof silt, clay, !ne- to coarse-grained sand, gravel, and var-iably cemented sand and gravel conglomerate.
During initial drilling and grouting in zone 2, the damfoundation conditions presented challenges to MPSPinstallation, drilling, and grouting. The speci!ed drillingand grouting methods were modi!ed to more effectivelyinject grout into the foundation as described in the fol-lowing paragraphs.
Throughout most of zone 2, the speci!ed drilling andgrouting procedure consisted of drilling, at an inclinationof 15 degrees, through the embankment using rotarysonic equipment and installing the MPSP standpipe intowhat was identi!ed as the foundation material directlybelow the bottom of the embankment, followed by grav-ity grouting of the embankment/foundation interface.Following installation of the standpipe, drilling pro-ceeded below the embankment with an initial protectivedownstage grouting zone, at low pressure, of up to 20 ftdirectly below the embankment interface. Drilling thencontinued to the design depth of 152 ft below the topof the dam, followed by upstage grouting of the openhole. Using this speci!ed method, the contractor experi-enced several issues, as described below:
• During production drilling below the MPSP stand-pipe, nearly all grout holes that were left open werelater found to be unstable. Below the bottom ofembankment, and above sound rock (CulebraDolomite), the sur!cial Gatuna Formation wasunstable and contributed to (a) the frequent col-lapse of grout holes; (b) successive re-drilling;(c) ineffective injection of grout; (d) dif!cultpacker placement during water pressure testingand grouting; and (e) lost tooling. This contributedto delays to TJC’s work schedule. With continuedre-drilling and the use of downstage grouting inmany of the holes, the grout holes were eventuallyheld open and grouted to closure.
• As an attempt to combat the problem of collapsingholes, the MPSP standpipe installation was
Design and Implementation of a Grout Program in an Evaporite-Karst Foundation 239

modi!ed so that the pipe would be extended belowthe bottom of the embankment and through the var-iable Gatuna sediments into what was interpreted assound, intact rock (typically Culebra Dolomite).While this procedure reduced borehole stabilityproblems in theGatuna, further grout-hole instabilityissues occurred in areas of intensely fractured, soft,and decomposed bedrock. Grouting was completedwith several iterations of re-drilling and downstagere-grouting, eventually achieving closure.
• In response to collapsing hole conditions, the con-tractor attempted to drill steel casing to total depth,and grout from the bottom of this casing, progres-sively pulling up casing and grouting in 10- to 20-ftstages. This proved to be effective for the mostpart, but progress was slow. In areas where verysoft foundation conditions were encountered (e.g.,unconsolidated, soil-like deposits in the Gatuna),material would migrate into the hole as the casingwas extracted,making it very dif!cult to grout effec-tively. Seating packers just below the bottom of thesteel casing for pressure testing and grouting wasalso problematic.
• Areas in zone 2 that accepted high grout quantitieswere found in both the sur!cial Gatuna Formationand dolomite bedrock. The areas of high grout takeare presented in Table 2.
• An evaluation of the geologic cross section andgrout-take data reveals that the Gatuna Formationtook roughly 36% of the total grout used in zone2. The dolomite bedrock took the remaining 64%.
• Review of the grout-take data indicates an approxi-mate 85% reduction in grout takes from primary totertiary order holes as presented in Table 3.
Grout Zone 2, Key Observations
• Foundation materials in zone 2, including both thesur!cial Gatuna Formation and weathered CulebraDolomite bedrock, were found to be problematicin maintaining an open hole during both down-stage and upstage grouting. Extending the bottomof the MPSP standpipe through the softer Gatunadeposits to the top of bedrock reduced boreholestability issues within the Gatuna. Groutingthrough ports in the standpipe from the interfacezone at the bottom of the embankment to the topof bedrock proved to be the most effective meansof grouting the Gatuna Formation.
• The variable nature of the foundation geology wascon!rmed.
• Areas in the foundation that accepted higher groutquantities were generally characterized as: (a) dolo-mitic bedrock (Culebra) within subsidence zones;
Figure 4. Zone 2 geologic pro!le, based on grout program data (from The Judy Company, 2015).
240 John Charlton and others

and (b) the in-!lled, sur!cial deposit (Gatuna) over-lying subsidence zones.
• Awell-cemented, hard conglomerate layer caps theGatuna in zone 2 and mostly de!nes the bottom ofthe original cutoff trench excavation.
• Unconsolidated sediments beneath this conglomer-ate layer comprise the majority of the Gatuna.
• Grout injection quantities decreased from primary-to tertiary-order holes, indicating zone2approachedclosure and may generally be considered a success-ful grouting program.
Grout Zone 1 (Sta. 37+10 to 43+50) Conditions/Issues Encountered During Grouting
The dam foundation across zone 1 consists of gypsumand dolomite (dolomitic limestone) of the RustlerFormation, sporadic cover of Gatuna conglomerate andsediments, and alluvial sands and clay (Figure 5). Thedolomite varies from a yellowish-brown (intenselyweathered) to gray dolomite. Gypsum underlies thedolomite from Station 39+50 to 40+70 at elevationsranging from 2705 to 2710 ft-msl. At approximatelyStation 41+20, the elevation of the top of the gypsumabruptly changes to elevation 2730 to as high as elevation2750 ft-msl. The gypsum unit persists to the northernextent of zone 1 at Station 43+50. It is not fully under-stood if the gypsum noted from Station 39+50 to 40+70and that observed from Station 41+20 to 43+50 are thesame unit, with the southern extent of the gypsum at alower elevation due to a subsidence/collapse feature.
Overlying the foundation bedrock from Station37+10 to 39+50 is alluvial material consisting of pre-dominantly !ne-grained sand with limited zones of
coarse-grained sand to cobble-sized material at thebase of the sequence (from Station 38+20 to 39+30).The sand is capped by a layer of black, moderately stiffto stiff clay fromStation 37+10 to 39+50. The black claywas observed intermittently through the rest of zone 1.The origin of this clay layer is not understood.
Drilling and grouting were accomplished in zone 1with installation of the MPSP at the base of the embank-ment and extended to the top of sound rock, as modi!edin zone 2.
Areas in zone 1 that accepted high grout quantitieswere generally found in the gray dolomitic limestoneand near the contact of the yellow dolomitic limestoneand tan dolomite at the north end of the zone. These spe-ci!c areas are presented in Table 4.
Evaluation of the geologic cross section and grout-take data indicates that of the total grout injected atzone 1, the gray dolomitic limestone took approximately57%of the total grout, the gypsum15%, the tan dolomite14.5%, the yellow dolomitic limestone 13%, and thesand and gravel 0.5%. This indicates the majority of thegrout was injected into the dolomitic rock mass in stratathat are heavily fractured and weathered.
Review of the grout data presented in Table 5shows an approximate 72% reduction in grout takefrom primary- to tertiary-order holes.
Grout Zone 1, Key Observations
• Foundation materials in zone 2, including both thesur!cial Gatuna Formation and Culebra Dolomitebedrock, were found to be problematic in maintain-ing an open hole during downstage and upstagegrouting. The extension of the MPSP system intosound bedrock in zone 1 minimized boreholestability issues in overlying material.
• The largest grout takes were in the dolomitic lime-stone and gypsum. The alluvium encountered fromStation 37+10 to 39+50 did not take signi!cantgrout quantities.
• The Gatuna is limited in thickness and extent whencompared to zone 2.
• Grout injection quantities decreased from primary-to tertiary-order holes, indicating that zone 1approached closure and may be considered a suc-cessful grouting program.
TABLE 2.—Zone 2 – Summary of High Grout-Take Areas
Sta"ons Eleva"on (ft-msl) Geologic Descrip"on
21+60 to 22+80 2740–2770 Culebra Dolomite
24+00 to 24+60 2740–2770 Gatuña Forma!on
24+00 to 25+20 2710–2740 Dolomite within subsidence zone
TABLE 3.—Zone 2 – Summary of Average GroutTakes per Foot*
Hole Order
Total Grout Takes
Gal/# Sacks/#
Primary/ Exploratory 16.2 1.00
Secondary 5.6 0.33
Ter!ary 2.7 0.14
*Modified from Table 3, The Judy Company (2015).
Design and Implementation of a Grout Program in an Evaporite-Karst Foundation 241

Grout Zone 4 (Sta. 67+00 to 72+70) ConditionsEncountered During Grouting
Foundation conditions along zone 4 can be dividedinto two segments: (1) in the south segment (Figure 6),Station 64+60 to 70+40 consists of tan dolomitic lime-stone bedrock of the Rustler Formation, covered by theGatuna Formation that ranges in thickness from 35 togreater than 60 ft; and (2) the north segment (Figure 7),from Station 70+40 to the north limit of zone 4 at
Figure 5. Zone 1 geologic pro!le, based on grout program data (from The Judy Company, 2015).
TABLE 4.—Zone 1 – Summary of High Grout-Take Areas*
Sta"ons Eleva"ons (#) Geologic Descrip"on
37+30 to 37+90 2700–2720 Gray Dolomi!c Limestone
38+70 to 39+10 2720–2740 Contact of Gray Dolomi!c Limestone, Tan Dolomite, Clay, and Gravel.
39+30 to 39+90 2730–2750 Gray Dolomi!c Limestone
42+10 to 42+50 2740–2760 Contact of Yellow Dolomi!c Limestone and Tan Dolomite
*Informa!on from The Judy Company (2015).
TABLE 5.—Zone 1 – Summary of Average Grout Takesper Foot
Hole Order
Total Grout Takes
Gal/# Sacks/#
Primary/Exploratory 18.8 1.11
Secondary 12.3 0.71
Ter!ary 5.2 0.28
242 John Charlton and others

Figure 6. Zone 4 geologic pro!le (south segment), based on grout program data (from The Judy Company, 2015).
Figure 7. Zone 4 geologic pro!le (north segment), based on grout program data (from The Judy Company, 2015).
Design and Implementation of a Grout Program in an Evaporite-Karst Foundation 243

Station 72+70, consists of gypsum and overlying clay(with gypsum stringers), and minimal, laterally incon-sistent Gatuna cover. Interpretation of the drilling logsplaces the Gatuna below the gypsum from Station70+70 to 71+60. This interpretation would indicatethat a very large subsurface channel has been in-!lledwith Quaternary detritus. Most notable in zone 4 isthe system of large voids from approximately Station71+60 to Station 72+70, near the northern extent ofzone 4 (Figure 7).
In zone 4, the grout-line layout was modi!ed, withconsideration given to the remaining contract funds atthe time and expediting drilling and grouting operations.Based on continued borehole instability issues at zone 2,and the absence of evidence in zones 1 and 2 that sub-vertical fractures act as integral seepage paths, a decisionwas made to use a single row of vertical grout holes inzone 4. The !nal spacing included primary holes on40-ft centers, secondary holes on 20-ft centers, tertiaryholes on 10-ft centers, and quaternary holes on 5-ft cen-ters. Multi-port sleeve pipe standpipes were extendedinto the foundation to full design depth (117 ft belowtop of the dam), with sleeve-ports spaced 2.5 ft alongthe standpipe in the foundation zone for pressure testingand grout injection. Grout isolation bags were installedon the standpipes at the embankment/foundation inter-face and at prominent geologic contacts in the founda-tion, as determined by the contractor’s geologist in the!eld. There were typically no more than three isolationbags on any one individual standpipe.
The most notable grout takes in zone 4 were concen-trated at the north end (Sta. 71+80 to 72+70) (Figure 7).This portion of zone 4 is characterized by gypsum, largevoids, and clay with gypsum stringers. This zone may bewithin a large subsidence feature !lled with a weatheredgypsum blocks from younger, previously overlyinggypsumbeds, entrained clay, andmore recent in!ll mate-rial in solution features that have historic connectionwith surface water. Other areas throughout zone 4 thataccepted high grout quantities were also characterized
by subsidence and dissolution features. These areasare presented in Table 6.
By evaluating the geologic cross section and grout-take data, it is estimated that the gypsum took roughly54%, the Gatuna 25%, the tan dolomite 17%, and theclay about 3% of the total grout injected in zone 4.Worthnote is that 54% of the grout injected in zone 4 went intogypsum, a rock that is characterized dissolution due toseepage action; the amount of some of the grout takessuggests the presence of large voids and signi!cant seep-age pathways in this foundation material.
In review of the grouting data presented in Table 7,there was an approximate 47% reduction in grout takesfrom primary- to tertiary-order holes. However, grouttakes increased signi!cantly in quaternary-order holes,indicating the presence of large voids and/or seepagepathways in these areas.
CONCLUSIONS
• The modi!ed full-depth, ported MPSP systeminstalled in vertical borings and single-row groutcurtain layout proved to be partially effectivewithinthe zone 4 treatment zone. There were reducedissues with grouting operations that were related
TABLE 6.—Zone 4 – Summary of High Grout-Take Areas*
Sta"ons Eleva"ons (#) Geologic Descrip"ons
6735–6780 2740–2790 Dissolu!on Features; Weathered Dolomite; Gatuña
6840–6905 2740– 2790 Dissolu!on Features; Weathered Dolomite; Gatuña
6920–7000 2740–2800 Dissolu!on Features; Weathered Dolomite; Gatuña
7075–7115 2740–2785 Dissolu!on Features; Weathered Dolomite; Gatuña; Clay/Gypsum
7180–7270 2740–2800 Dissolu!on Features; Clay and Gypsum
*Informa!on from The Judy Company (2015).
TABLE 7.—Zone 4 – Summary of Average GroutTakes per Foot*
Hole Order
Total Grout Takes
Gal/# Sacks/#
Primary/Exploratory 27.1 1.9
Secondary 20.3 1.4
Ter!ary 15.1 1.0
Quaternary 29.5 2.1
*Modified from Table 3, The Judy Company (2015).
244 John Charlton and others
to borehole stability when compared to zones 1and 2.
• There was a reduction in grout takes from primary-to tertiary-order holes, and then an increase in aver-age grout take for quaternary-order holes. This wasobserved primarily in the gypsum at the northernend of zone 4, as well as within some quaternaryholes drilled into the Gatuna Formation.
• Areas in the foundation described as subsidence ordissolution features were characterized by highgrout takes, indicating potential seepage pathways.High amounts of grout were accepted by the weath-ered dolomite underlying the subsidence or dissolu-tion features and the in!lling sur!cial deposit.
• Grout injection quantities generally decreased fromprimary- to tertiary-order holes, indicating that zone4 may have been approaching closure. However,grout takes increased or remained comparable totertiary holes with the addition of quaternary holesin areas that had high grout take in tertiary holes.The grout takes seem to indicate that the zone 4grouting program was mostly successful, with theexception of the north end (Sta. 71+80 to 72+70)of the zone, where multiple quaternary holes weredrilled and took large quantities of the thickest groutmixes (D and E).
REFERENCES
AGRA, 1994, Red Bluff Dam geotechnical investiga-tion and piezometer installation project, Red Bluff,Texas: unpublished report submitted to HDR Engi-neering, Inc., Austin, TX, from AGRA Earth &Environmental, Inc., El Paso, TX, as AGRA E&EJob No. E94-4067, 35 p., plus Appendices A–G.
Johnson, K.S., Shoemaker, R.A., Charlton, J., andParker, C., 2021, Evaporite karst in the PermianRustler, Salado, and Castile Formations at Red BluffDamon the PecosRiver, Loving andReevesCounties,Texas, in Johnson, K.S., Land, L., and Decker, D.D.,eds., Evaporite karst in the Greater Permian EvaporiteBasin (GPEB) of Texas, New Mexico, Oklahoma,Kansas, and Colorado: Oklahoma GeologicalSurvey, Circular 113.
Reed, E.L., & Associates, 1978, Inspection and groutingRed Bluff Dam, Pecos River, Reeves and LovingCounties, Texas: unpublished report prepared for RedBluff Water Power Control District, Pecos, Texas,20 p. plus illustrations, boreholes and grouting records,and water analyses.
The Judy Company, 2015, Foundation grouting project,RedBluffDamTexas: unpublished report submitted toHDR Engineering, Inc., Austin, TX, from The JudyCompany, Inc., Kansas City, Kansas.
Design and Implementation of a Grout Program in an Evaporite-Karst Foundation 245


Johnson,Kenneth S., 2021, PermianBlaine and SanAndres Formations ofWesternOklahoma and PaloDuroBasin ofTexas: Their Correlation and Evaporite Karst, in Johnson, K. S.; Land, Lewis; and Decker, D. D. (eds.), EvaporiteKarst in the Greater Permian Evaporite Basin (GPEB) of Texas, New Mexico, Oklahoma, Kansas, and Colorado:Oklahoma Geological Survey, Circular 113, p. 247–277.
247
0LMBIPNB�Geological�Survey�Circular�113,�2021
Permian�Blaine�and�San�Andres�Formations�of�Western�Oklahomaand�Palo�Duro�Basin�of�Texas:�Their�Correlation�and�Evaporite�Karst
Kenneth�S.�JohnsonRetired�Geologist,�Oklahoma�Geological�Survey,
Norman,�Oklahoma
"#453"$5��5IF�1FSNJBO�#MBJOF�'PSNBUJPO�PVUDSPQT�PG�XFTUFSO�0LMBIPNB�BSF�B�TFSJFT�PG�HZQTVN �EPMPNJUF �BOE�TIBMF�VOJUT� UIBU�DBO�CF�DPSSFMBUFE�EJSFDUMZ� JOUP� UIF�4BO�"OESFT�'PSNBUJPO� JO� UIF�1BMP�%VSP� #BTJO� PG� OPSUI�DFOUSBM� 5FYBT�� 5IJT� XBT� GJSTU� FTUBCMJTIFE� EVSJOH� FYUFOTJWF� TUVEJFT� JO� UIF�TVCTVSGBDF�PG� UIF�1BMP�%VSP�#BTJO � BOE� UIF� DVSSFOU�QBQFS� BGGJSNT� UIJT� DPSSFMBUJPO�XJUI�B� TFSJFT�PG���HFPMPHJD�DPMVNOT�JO�NBKPS�BSFBT�PG�UIF�UXP�TUBUF�SFHJPO��#FE�CZ�CFE�DPSSFMBUJPO�PG�HZQTVN�CFET�JO�UIF�#MBJOF�BOE�4BO�"OESFT�'PSNBUJPOT�TIPXT�UIBU�JOEJWJEVBM�CFET�DBO�CF�USBDFE�JO�PVUDSPQT�PWFS�BO�BSFB�BCPVU� ���� LN�OPSUI�TPVUI� BOE� BT�NVDI� BT� ���� LN� FBTU�XFTU�� UIFTF� JOEJWJEVBM� CFET� BMTP� FYUFOE� JO�TVCTVSGBDF�UP�UIF�XFTU�BOE�OPSUI�BOPUIFS�DPVQMF�IVOESFE�LJMPNFUFST �PS�TP �BOE�UIVT�UIFZ�IBWF�B�HSFBU�BSFBM�FYUFOU��8IFSF�UIFTF�TBNF�TUSBUB�BSF�JO�TVCTVSGBDF�JO�UIF�"OBEBSLP�BOE�1BMP�%VSP�#BTJOT �TVMGBUF�CFET�BSF�DPNNPOMZ�BOIZESJUF �OPU�HZQTVN �BOE�NPEFSBUFMZ�UIJDL�UP�UIJDL�CFET�PG�TBMU�IBMJUF�PWFSMJF�TPNF�PG� UIF�HZQTVN�BOIZESJUF�CFET�� *O�CPUI�PVUDSPQT�BOE� JO� TVCTVSGBDF � TPMVCMF�HZQTVN�BOIZESJUF�BOE�TBMU�BSF�MPDBMMZ�PS�FYUFOTJWFMZ�EJTTPMWFE �MFBEJOH�UP�UZQJDBM�LBSTU�EFWFMPQNFOU�JO�UIF�FWBQPSJUF�CFET�
*O�PVUDSPQT �UIF�#MBJOF�'PSNBUJPO�JO�JUT�UZQF�BSFB�#MBJOF�$PVOUZ �JO�OPSUIXFTU�0LMBIPNB�JT�BCPVU����N�UIJDL �BOE�DPOTJTUT�PG�UISFF�QSJODJQBM�HZQTVN�CFET��JO�TPVUIXFTU�0LMBIPNB �UIF�#MBJOF�JT�BCPVU����UP����N�UIJDL �BOE�DPOTJTUT�PG�OJOF�QSJODJQBM�HZQTVN�CFET �NPTU�PG�UIF�BEEJUJPOBM�HZQTVNT�CFJOH� JO� UIF�VQQFS�QBSU� PG� UIF� GPSNBUJPO�� BOE� TUJMM� GBSUIFS� UP� UIF� TPVUIXFTU � JO�OPSUI�DFOUSBM�5FYBT �BEEJUJPOBM�HZQTVN�CFET�BU�UIF�CBTF�BOE�UIF�UPQ�PG�UIF�GPSNBUJPO�TXFMM�JUT�UIJDLOFTT�UP�NPSF�UIBO�����N�HJWJOH�SJTF�UP�UIFTF�PVUDSPQT�CFJOH�DBMMFE�UIF�i#MBJOF�PG�5FYBTw��*O�NPTU�BSFBT �JOEJWJEVBM�HZQTVN�BOIZESJUF�CFET�PG�UIF�#MBJOF�PS�4BO�"OESFT�BSF���UP���N�UIJDL��UIF�EPMPNJUF�CFET�SBOHF�GSPN�MFTT�UIBO���N�UP�BMNPTU���N�UIJDL �BOE�UIF�TIBMFT�BSF�HFOFSBMMZ���UP���N�UIJDL�
4BMU�LBSTU�IBT�B�QSPGPVOE�FGGFDU�PO�1FSNJBO�BOE�PWFSMZJOH�TUSBUB�JO�UIF�SFHJPO��*O�TVCTVSGBDF �TVCTUBOUJBM�BNPVOUT�PG�TBMU�BSF�QSFTFOU�JO�UIF�#MBJOF�'PSNBUJPO�BOE�BTTPDJBUFE�TUSBUB�JO�UIF�"OBEBSLP�#BTJO�PG�0LMBIPNB �BOE�JO�UIF�4BO�"OESFT�'PSNBUJPO�JO�UIF�1BMP�%VSP�#BTJO��5IFTF�UIJDL�TBMU�VOJUT�BSF�QBSUJBMMZ�PS�UPUBMMZ�EJTTPMWFE�JO�NPTU�QMBDFT�XIFSF�UIFZ�BSF�BU�EFQUIT�PG�MFTT�UIBO�BCPVU�����UP�����N��5IJT�IBT�QSPEVDFE�NBOZ�DPMMBQTF�TUSVDUVSFT�BOE�SFMBUFE�GFBUVSFT�XIFSF�UIF�TBMU�IBT�CFFO�EJTTPMWFE�JO�CPUI�UIF�"OBEBSLP�BOE�1BMP�%VSP�#BTJOT�JO�UIF�QBTU��&WJEFODF�UIBU�TBMU�EJTTPMVUJPO�JT�BO�PO�HPJOH�QSPDFTT�JT�UIF�QSFTFODF�PG�OVNFSPVT�TBMU�TQSJOHT�BOE�TBMU� GMBUT� MPDBUFE�PO�PVUDSPQT�PG�UIF�#MBJOF�BOE�BTTPDJBUFE�TUSBUB�PO�UIF�GMBOLT�PG�UIF�"OBEBSLP�#BTJO �BOE�PO�UIF�FBTU�TJEF�PG�UIF�1BMP�%VSP�#BTJO�JO�TPVUIXFTU�0LMBIPNB�BOE�OPSUI�DFOUSBM�5FYBT�
(ZQTVN�LBSTU�JT�XJEFTQSFBE�JO�UIF�#MBJOF�'PSNBUJPO�PG�XFTUFSO�0LMBIPNB�BOE�OPSUI�DFOUSBM�5FYBT�� JU� JT�CFTU�EFWFMPQFE�XIFSF� UIF�#MBJOF�DPOTJTUT�NBJOMZ�PG� UIJDL�HZQTVN�CFET� JOUFSCFEEFE�XJUI�UIJO�TIBMFT��8FTUFSO�0LMBIPNB�BOE�OPSUI�DFOUSBM�5FYBT�BSF�BNPOH�UIF�CFTU�BSFBT�JO�UIF�6OJUFE�4UBUFT�GPS� UIF� TUVEZ� PG� HZQTVN� LBSTU � JODMVEJOH� DBWFT � TJOLIPMFT � TQSJOHT � EJTBQQFBSJOH� TUSFBNT � BOE� LBSTU�BRVJGFST��0LMBIPNB�IBT� B� UPUBM� PG� ���� SFDPSEFE� HZQTVN� DBWFT� JO� UIF�#MBJOF �XJUI� ���� JO�OPSUIXFTU�0LMBIPNB�BOE����JO�TPVUIXFTU�0LMBIPNB��*O�KVTU�UIF�1BMP�%VSP�#BTJO�QPSUJPO�PG�OPSUI�DFOUSBM�5FYBT �

INTRODUCTION
In good exposures or shallow cores, the PermianBlaine Formation is a series of cyclic rock units, whereineach cycle consists of (in ascending order) dolomite,gypsum (or anhydrite), red–brown shale, and thengreen–gray shale leading to the next overlying cycle;in the deeper subsurface, salt (halite)may also be presentabove the gypsum/anhydrite unit. However, in someareas, mainly in southwest Oklahoma and north-centralTexas, gypsum and salt beds are partially or totally miss-ing because of dissolution, or Blaine strata may havecollapsed because of dissolution of interbedded orunderlying gypsum and/or salt beds. As a result ofthis dissolution of evaporites, as well as facies changes,wherein dolomite or gypsum beds “disappear” laterallyby grading into shales, there has been some uncertaintyin regional correlations over the years.
To establish regional correlations, geologic columnsare herein shown for 6 sites or areas in the Anadarkoand Palo Duro Basins depicting the stratigraphy of theBlaine and San Andres Formations and associated strata(Fig. 1). In compiling these 6 geologic columns, theauthor relied on detailed studies based on core dataand/or excellent outcrops in three areas: 1) northwestOklahoma (Fay and others, 1962; Fay, 1964; Johnson,2019c); 2) southwest Oklahoma (Scott and Ham, 1957;Johnson, 1967, 1990a, 1990b, 2019b); and 3) north-central Texas (Pendery, 1963; Jones, 1971; Hovorkaand Granger, 1988; Johnson, 2019a). These three areasare in the central part of the Greater Permian EvaporiteBasin (GPEB), as de!ned by Johnson (2021).
Appreciation is expressed to Dr. Susan D. Hovorka,geologist with the Texas Bureau of Economic Geology,for her review and constructive comments on an earlydraft of this report.
CORRELATION OF BLAINE ANDSAN ANDRES FORMATIONS
In western Oklahoma and north-central Texas, theBlaine is a group of gypsum beds that can be conve-niently grouped together, and thus, the top and base ofthe Blaine Formation are not the same throughout theAnadarko and Palo Duro Basins. In addition, a differentnomenclature for gypsum and dolomite units has devel-oped in different areas, because correlation or equiva-lence of units was not established until long after alocal nomenclature had been developed in each area.
Where� !rst� named� and� described� in� Blaine� County,�northwest� Oklahoma,� the� Blaine� Formation� is� about�30�m� thick�and�consists�of� three�main�gypsum�beds.� In�southwest�Oklahoma,� the�Blaine� is�50–60�m� thick�and�consists� of� nine� gypsum� beds;� the� base� of� the�Blaine�here�is�the�same�gypsum�unit�as�in�northwest�Oklahoma�(but�with� a� different� name),� and� some� closely� spaced�gypsum�beds�(not�present� in�northwest�Oklahoma)�are�embraced� in� the� upper� part� of� the�Blaine� Formation.�Similarly,� some� gypsum� beds� both� above� and� below�the�Blaine�of�southwest�Oklahoma�are� included�within�the� “Blaine� of�Texas,”�where� the� total� thickness� is� as�much�as�150�m.
Blaine and San Andres evaporites and associated red-beds (the underlying Flowerpot and overlying DogCreek Shales) of Oklahoma and north-central Texas
Figure�1.�Map�of�western�Oklahoma�and�Texas�Panhan-dle�showing�the�Anadarko�and�Palo�Duro�Basins�and�thelocation�of�6�geologic�columns�that�depict�the�stratigra-phy�and�correlation�of�the�Blaine�and�San�Andres�For-mations.� Locations�on�map:�1)�Blaine�County� (Fig.�3);2) TPVtheast� Beckham� County� (Fig.� 4);� 3)� OPStheastBeckham�County� (Fig.�5);�4)�Harmon�County� (Fig.�6);5) Childress� County� (Fig.� 7);� and� 6)� Swisher� County(Fig.�8).
248 Kenneth�S.�JohnsonUIF�i#MBJOF�PG�5FYBTw�IBT�B�UPUBM�PG�����SFDPSEFE�HZQTVN�DBWFT��&YUFOTJWF�LBSTU�JO�UIF� HZQTVN� BOE� EPMPNJUF� PG� UIF� #MBJOF� 'PSNBUJPO� IBT� QSPEVDFE� BO� JNQPSUBOU�BRVJGFS � XIFSF� TVMGBUF�SJDI� HSPVOE� XBUFS� JT� QSPEVDFE� GPS� JSSJHBUJPO� JO� CPUI�TPVUIXFTU�0LMBIPNB�BOE�OPSUI�DFOUSBM�5FYBT��

are�located�in�the�central�part�of�the�GPEB,�and�are�the�lateral� equivalents� of� San� Andres� carbonates,� which�are�far�to�the�south�and�west�(Presley,�1981,�cross�section�B–B´).�The� lateral�gradation�of� the�San�Andres�carbo-nates� into� the� San�Andres/Blaine� evaporites� from� the�south� to� the�north�and�northeast� is�as� follows:�1)�from�the�Midland� Basin,� the� thick� San� Andres� carbonates�grade� into� the� thick�San�Andres�evaporite�sequence�of�the� Palo�Duro� Basin;� 2)� farther� north� and� east,� only�the�middle�gypsum�and�dolomite�units�of�the�San�Andres�persist� into� the�Blaine� Formation� of� southwest�Okla-homa,�whereas�evaporites�in�the�lower�and�upper�parts�of�the�San�Andres�grade�into�shales�and�salts�of�the�Flow-erpot� and� Dog� Creek� Formations,� respectively;� and�3) still� farther� northeast,� the� uppermost� gypsum� bedsof� the� Blaine� in� southwest� Oklahoma� grade� laterallyinto�Dog�Creek� shales,� and� only� three�main� gypsumbeds�persist�into�the�Blaine�of�northwest�Oklahoma.
The�Blaine�Formation�of�western�Oklahoma�is�equiv-alent�to�the�middle�division�and�unit�5�of�the�lower�divi-sion�of�the�San�Andres�Formation�in�the�Palo�Duro�Basin�(Fig.�2).�This�correlation�was�partly�shown�in�the�cross�sections�by�Presley�(1981b)�and�McGookey�and�others�(1988),�and�was�most�clearly�demonstrated�and� stated�in�Fracasso�and�Hovorka�(1986,�p.�28)�and�in�Figure�4�of�Hovorka�and�Granger�(1988).�The�current�paper�con-tains�geologic�columns�of�the�Blaine�and/or�San�Andres�Formations�in�6�areas�in�western�Oklahoma�and�the�Palo�Duro�Basin�(Fig.�1),�af!rming�equivalence�of� the�gyp-sum�(or�anhydrite)�and�dolomite�beds�from�one�area�to�another.�The�region�containing�gypsum�outcrops�of�the�Blaine� Formation� in� Oklahoma� and� Kansas,� and� the�“Blaine�of�Texas,”�extends�at�least�600�km�north–south,�and�as�much�as�200�km�east–west.�The�full�extent�of�trac-ing�individual�gypsum/anhydrite�beds�of�the�Blaine�For-mation�westward� into� the�subsurface�of� the�Oklahoma�Panhandle,�Kansas,�and�Colorado�is�not�yet�fully�estab-lished,�but�individual�beds�probably�extend�another�cou-ple�of�hundred�kilometers�to�the�west�and�north.
Blaine�Formation�in�Blaine�County,Northwest�Oklahoma�(Fig.�3)
The� Blaine� Formation� is� named� for� exposures� in�Blaine� County,� Oklahoma� (Gould,� 1902,� 1905),� and�more�recent�comprehensive�studies�of�the�Blaine�Forma-tion�in�that�area�were�carried�out�by�Fay�and�others�(1962)�and�Fay�(1964).�Geologic�column�1,�representing�the�for-mation�in�Blaine�County,�is�given�in�Figure�3:�here,�Fay�considered�the�Blaine�as�all�strata�from�the�Cedar�Springs�Dolomite�Bed,�at�the�base,�through�the�Shimer�Gypsum�Member� at� the� top.�Throughout�northwest�Oklahoma,�the� three�main�gypsum�beds� are� the�Medicine�Lodge,�Nescatunga,�and�Shimer�Beds,�whereas� the�King!sher�Creek�Bed�is�relatively�thin,�or�even�absent.�The�Blaine�Formation�is�25–30�m�thick�in�Blaine�County�and�most
parts of northwestOklahoma.All strata below theWhite-horse Group that are shown in Figure 3 are in the El RenoGroup (Fay and others, 1962; Fay, 1964).
While proposing the term “Blaine” in northwest Okla-homa, Gould (1902) also proposed the name “Greer”Formation, western division, for a series of (what hethought were younger) thick gypsum and shale stratain Greer County of southwest Oklahoma: hence, a sepa-rate nomenclature was established for the formation andfor individual beds in the two different parts of the State.Subsequent work by Sawyer (1924) and Gould (1924)identi!ed a broad syncline in Permian rocks of westernOklahoma—the Anadarko syncline (now called theAnadarko Basin)—and established that the “Blaine”
Figure 2. Geologic column showing general correlationof Blaine Formation and associated strata in southwestOklahoma with San Andres Formation units in the PaloDuro Basin of the Texas Panhandle. Based upon datapresented in geologic columns 1–6 in this report.
Permian Blaine and San Andres Formations of Western Oklahoma and Palo Duro Basin of Texas 249

Blaine Formation in Southeast Beckham County,Southwest Oklahoma (Fig. 4)
The Blaine Formation in southwest Oklahoma origi-nally included all strata from the base of the ChaneyGypsum to the top of the Mangum Dolomite (Gould,1902, 1905). Scott and Ham (1957) carried out the !rstdetailed study and mapping of the Blaine in this area andestablished the present-day, basic stratigraphic frame-work of the Blaine Formation in southwest Oklahoma:they placed the thin Kiser and Chaney Gypsum Bedsand associated thick shales in the underlying FlowerpotShale, and the two thick gypsum beds that they identi!edabove theMangumDolomitewere named theVanVacterMember of the Blaine Formation. Johnson (1967) rec-ommended dividing theBlaine into theVanVacterMem-ber (to include the Mangum Dolomite), above, and the
Figure 4. Geologic column 2, showing Blaine Formationand associated strata in outcrops and shallow subsur-face of southeast Beckham County, Oklahoma. Com-posite column derived from: outcrop data in Scottand Ham (1957; measured sections 6, 7, 8, and 15);description of Carter core by Johnson (1967, p. 226–229); and !nal nomenclature by Johnson (1990a).
Figure�3.�Geologic�column�1,�showing�outcrops�of�BlaineFormation�and�associated�strata�in�Blaine�County,�Okla-homa�(on�right),�which�is�a�composite�of�two�measuredsections:�Fay�and�others� (1962,�measured�section�XI),and�Fay�(1964,�measured�section�21).�Also�shown�(onleft)�are�the�names�of�the�same�beds�in�southwest�Okla-homa:�correlation�of�Guthrie�and�Acme�Dolomites�areprobable,�but�not�proven.
and�“Greer”�were� equivalent�units.�The�name� “Blaine�Formation”� was� subsequently� applied� in� both� areas,�but� the� separate� and�dual�nomenclature� for� individual�gypsum� and� dolomite� beds� had� been� established� and�was�retained.�Subsequent�subsurface�study�of�geophys-ical� logs� throughout� the�Anadarko� Basin� has� proved�equivalence�of�the�various�beds�and�members�in�the�two�areas,� and� the� equivalent� OBNFT� in� southwest� Okla-homa�are�shown�on� the� left�side�of�Figure�3.�Although�not�de!nite,� it� is� likely� that� the�Watonga�and�Southard�Dolomites�of�Blaine�County�are�equivalent�to�the�persis-tent�Acme�and�Guthrie�Dolomites,�respectively,�of�south-west�Oklahoma�and�north-central�Texas.
250 Kenneth S. Johnson
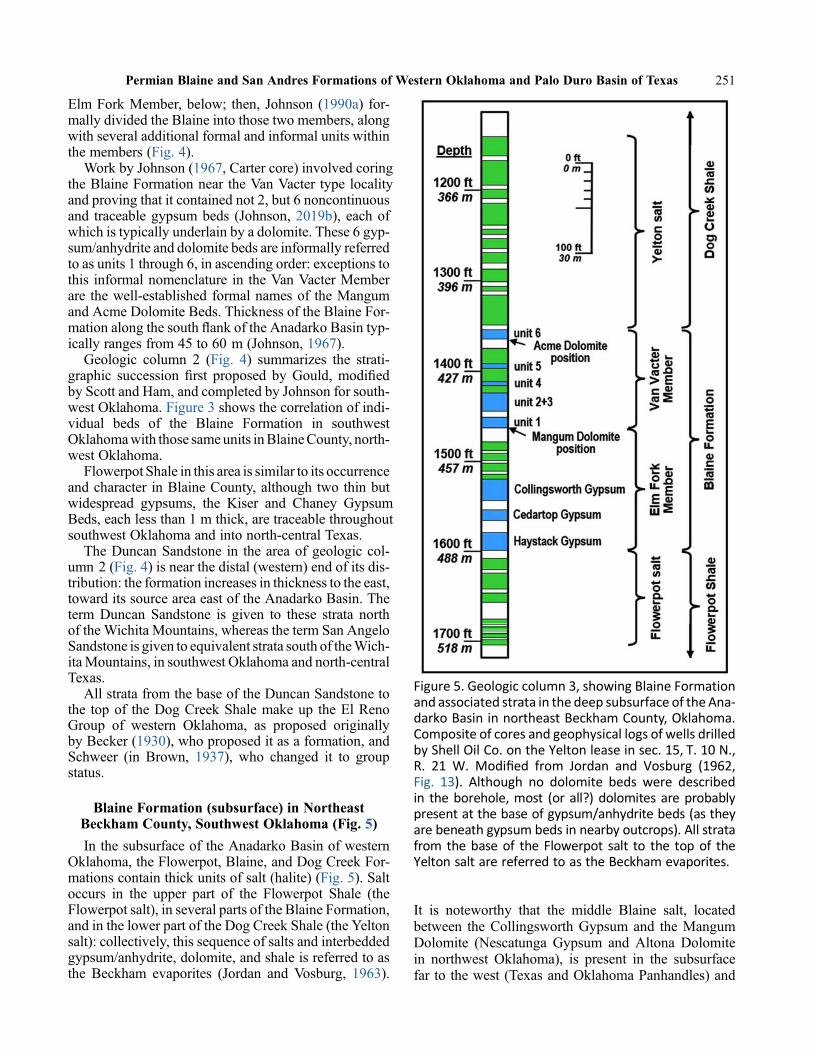
Elm�Fork�Member,�below;� then,� Johnson� (1990a)� for-mally�divided�the�Blaine�into�those�two�members,�along�with�several�additional�formal�and�informal�units�within�the�members�(Fig.�4).
Work�by�Johnson�(1967,�Carter�core)�involved�coring�the�Blaine�Formation�near� the�Van�Vacter� type� locality�and�proving�that�it�contained�not�2,�but�6�noncontinuous�and� traceable�gypsum�beds� (Johnson,�2019b),�each�of�which�is�typically�underlain�by�a�dolomite.�These�6�gyp-sum/anhydrite�and�dolomite�beds�are�informally�referred�to�as�units�1�through�6,�in�ascending�order:�exceptions�to�this� informal�nomenclature� in� the�Van�Vacter�Member�are� the�well-established� formal�names�of� the�Mangum�and�Acme�Dolomite�Beds.�Thickness�of�the�Blaine�For-mation�along�the�south�"ank�of�the�Anadarko�Basin�typ-ically�ranges�from�45�to�60�m�(Johnson,�1967).
Geologic� column� 2� (Fig.� 4)� summarizes� the� strati-graphic� succession� !rst� proposed� by�Gould,�modi!ed�by�Scott�and�Ham,�and�completed�by�Johnson�for�south-west�Oklahoma.�Figure�3�shows�the�correlation�of�indi-vidual� beds� of� the� Blaine� Formation� in� southwest�Oklahoma�with�those�same�units�in�Blaine�County,�north-west�Oklahoma.
Flowerpot�Shale�in�this�area�is�similar�to�its�occurrence�and�character� in�Blaine�County,�although� two� thin�but�widespread� gypsums,� the� Kiser� and� Chaney� Gypsum�Beds,�each�less�than�1�m�thick,�are�traceable�throughout�southwest�Oklahoma�and�into�north-central�Texas.
The�Duncan�Sandstone� in� the�area�of�geologic�col-umn�2�(Fig.�4)�is�near�the�distal�(western)�end�of�its�dis-tribution:�the�formation�increases�in�thickness�to�the�east,�toward�its�source�area�east�of�the�Anadarko�Basin.�The�term�Duncan� Sandstone� is� given� to� these� strata� north�of�the�Wichita�Mountains,�whereas�the�term�San�Angelo�Sandstone�is�given�to�equivalent�strata�south�of�the�Wich-ita�Mountains,�in�southwest�Oklahoma�and�north-central�Texas.
All�strata�from�the�base�of�the�Duncan�Sandstone�to�the� top�of� the�Dog�Creek�Shale�make�up� the�El�Reno�Group� of� western� Oklahoma,� as� proposed� originally�by�Becker�(1930),�who�proposed�it�as�a�formation,�and�Schweer� (in�Brown,� 1937),�who� changed� it� to� group�status.
Blaine�Formation�(subsurface)�in�Northeast�Beckham�County,�Southwest�Oklahoma�(Fig.�5)In� the�subsurface�of� the�Anadarko�Basin�of�western�
Oklahoma,�the�Flowerpot,�Blaine,�and�Dog�Creek�For-mations�contain�thick�units�of�salt�(halite)�(Fig.�5).�Salt�occurs� in� the� upper� part� of� the� Flowerpot� Shale� (the�Flowerpot�salt),�in�several�parts�of�the�Blaine�Formation,�and�in�the�lower�part�of�the�Dog�Creek�Shale�(the�Yelton�salt):�collectively,�this�sequence�of�salts�and�interbedded�gypsum/anhydrite,�dolomite,�and�shale�is�referred�to�as�the�Beckham� evaporites� (Jordan� and�Vosburg,� 1963).
It is noteworthy that the middle Blaine salt, locatedbetween the Collingsworth Gypsum and the MangumDolomite (Nescatunga Gypsum and Altona Dolomitein northwest Oklahoma), is present in the subsurfacefar to the west (Texas and Oklahoma Panhandles) and
Figure 5. Geologic column 3, showing Blaine Formationand associated strata in the deep subsurface of the Ana-darko Basin in northeast Beckham County, Oklahoma.Composite of cores and geophysical logs of wells drilledby Shell Oil Co. on the Yelton lease in sec. 15, T. 10 N.,R. 21 W. Modi!ed from Jordan and Vosburg (1962,Fig. 13). Although no dolomite beds were describedin the borehole, most (or all?) dolomites are probablypresent at the base of gypsum/anhydrite beds (as theyare beneath gypsum beds in nearby outcrops). All stratafrom the base of the Flowerpot salt to the top of theYelton salt are referred to as the Beckham evaporites.
Permian Blaine and San Andres Formations of Western Oklahoma and Palo Duro Basin of Texas 251

to� the� north� (western� Kansas� and� eastern� Colorado).�Based� upon� cores,� and� interpretation� of� geophysical�logs� of� petroleum� tests� in� the� subsurface� of� northeast�Beckham� County,� the� gypsum/anhydrite� beds� in� the�Blaine�Formation� part� of� the�Beckham� evaporites� are�readily� correlated� with� those� same� beds� in� outcrops�and�cores�about�20�km�to�the�south�(Fig.�4),�on�the�south�"ank�of�the�Anadarko�Basin.�Where�the�Blaine�Forma-tion� contains� salt� beds� in� the� deep�Anadarko�Basin,� it�ranges�from�50�to�75�m�thick�(Johnson,�1967).
The�Shell�Oil�Co.�No.�1–LPG�Yelton�well�was�drilled�in�1953�for�underground�storage�of�Liqui!ed�Petroleum�Gas� in� a� single� dissolution� cavity� created� in� the� salts�between� Van� Vacter� anhydrite� unit� 2+3� and� unit� 6�(Fig.�5).�Cores�of�a�part�of� the�Yelton�salt� in� that�well�are� described� as� consisting� of� coarse-crystalline� salt,�with� thin� (average,� 18� cm� thick)� interbeds� of� brown�shale� that� comprise� about� 20%� of� the� unit� (Jordan,�1959;� Jordan� and� Vosburg,� 1963).� No� description� is�provided� GPS� the� salt� unit� in� the� Blaine� Formation� in�the�No.�1–LPG�Yelton�core,�but�it�may�be�similar�in�char-acter�to�the�Yelton�salt.
Dolomites�at�the�base�of�anhydrite�units�of�the�Blaine�Formation�in�original�descriptions�of�the�No.�1–LPG�Yel-ton�cores�are�not�mentioned,�but�it�is�reasonable�to�expect�that�such�dolomite�units,�so�widespread�in�outcrops�to�the�south�(especially�the�normally�thick�Mangum�and�Acme�Dolomites),�persist�into�the�subsurface�nearby,�and�just�were�not�recognized�in�the�core�examination.
Blaine�Formation�in�Harmon�County,Southwest�Oklahoma�(Fig.�6)
Nomenclature�for�the�maximum�development�of�the�Flowerpot,�Blaine,�and�Dog�Creek�Formations�in�south-west�Oklahoma�is�shown�in�Figure�6;�these�strata,�along�with� the� underlying� Duncan/San� Angelo� Sandstone,�make� up� the�El�Reno�Group� in� southwest�Oklahoma�(Scott� and� Ham,� 1957;� Johnson,� 1967,� 1990a).� The�San�Angelo�Sandstone�in�Harmon�and�Jackson�Counties�is�equivalent�to�the�Duncan�Sandstone�on�the�north�side�of�the�Wichita�Uplift�(Fig.�4).�The�geologic�column�for�Harmon�County�(Fig.�6)�is�representative�of�the�Blaine�Formation�and�associated�strata�in�the�Hollis–Hardeman�Basin,�which� is� the�eastern�extension�of� the�Palo�Duro�Basin�of�Texas.�Thickness�of� the�Blaine�Formation� in�this� area� ranges� from� about� 55� to� 60�m� (Johnson,�1967,�2019b).
Strata�from�the�Chaney�Gypsum�Bed�up�through�the�Mangum� Dolomite� Bed� are� extensively� exposed� in�southwest�Oklahoma,�and�they�have�been�easily�recog-nized�and�correlated�throughout�the�area.�However,�gyp-sum�beds�of�the�Van�Vacter�Member�are�another�story:�the�thick�gypsum�units�are�poorly�exposed�in�most�areas�(largely� because� of� partial� or� total� dissolution� and/or�collapse),�and�were�not�recognized�as�6�noncontinuous
stratigraphic units until cores and detailed stratigraphictests were obtained (Johnson, 1967, 1990a, 2019b).We now know that each of the 9main gypsum bedsmak-ing up the Blaine Formation in southwest Oklahoma isunderlain by a dolomite bed at most sites. Conspicuousand mappable gypsums and dolomites in the Elm ForkMember have each been named, whereas the gypsumsand dolomites in the Van Vacter Member are given aninformal status (i.e., gypsum unit 1, dolomite unit 2, gyp-sum unit 2, etc.), with the exception of the Mangum andAcme Dolomite Beds, which are readily recognizedin outcrops and are correlated throughout southwestOklahoma and north-central Texas.
Figure 6. Geologic column 4, showing Blaine Formationand associated strata in outcrops and subsurface ofHarmon County, Oklahoma. Composite column derivedfrom data in Johnson (1967, 1989, 2019b), based onoutcrops, cores, and geophysical logs.
252 Kenneth S. Johnson

Blaine�Formation�in�Childress�County,North-Central�Texas�(Fig.�7)
Comprehensive� study� of� cores� and� outcrops� in� the�Jonah� Creek–Salt� Creek� area� of� northwest� Childress�County,� Texas,�was� carried� out� by�me� in� cooperation�with�the�U.S.�Army�Corps�of�Engineers�(Tulsa�District)�in�the�early�1970s�to�determine�the�source�of�salt-water�contamination� in� this� part� of� the� Prairie� Dog� Town�Fork�Red�River�drainage�(Johnson,�1981,�2019a).�Results�of�this�study�show�a�great�similarity�of�the�stratigraphy�of�the�Blaine�and�Dog�Creek�Formations�in�this�area�(Fig.�7)�to� the�same�units� in�southwest�Oklahoma� (Fig.�6).�The�main�difference�is�inclusion�of�an�upper�dolomite/gypsum�unit�(unit�7)�at�the�top�of�the�Van�Vacter�Member�of�the�Blaine�Formation.�The�thickness�of�the�Blaine�Formation�in�Childress�County�is�about�60�to�nearly�70�m,�where�it�lacks� salt� interbeds:� it� is� about� 75m� thick� where� it
contains salt in the subsurface of Motley County, justto the southwest (Johnson, 2019a).
Addition of thick gypsum beds at the top and bottomof the Blaine Formation is a long-standing treatment ofthe formation in Texas: gypsum and dolomite beds in theupper Flowerpot and lower Dog Creek of southwestOklahoma increase in thickness and abundance to thesouth and west into north-central Texas, and thesebeds are commonly included inwhat is called the “Blaineof Texas” (Roth, 1945; Pendery, 1963; Jones, 1971;Johnson, 2018). In fact, the 1:250,000-scale geologicmaps of north-central Texas (the Plainview, Lubbock,Big Springs, and San Angelo sheets of the GeologicAtlas of Texas, published by the Texas Bureau of Eco-nomic Geology) show the “Blaine of Texas” embracesall strata from the top of the San Angelo Sandstone tothe base of the Whitehorse Group. With this expandedconcept of the Blaine (top of San Angelo to base ofWhitehorse), the thickness of the “Blaine of Texas”ranges from about 150 to almost 215 m in areas southof Childress County (Jones, 1971).
All strata in north-central Texas from the base of theSan Angelo Sandstone to the top of the Dog Creek Shale(base of Whitehorse Group) were placed in the PeaseRiver Group by Roth (1945), and this has been followedby Pendery (1963), Jones (1971), Hentz and Brown(1987), and others working in the area. Therefore, thePease River Group of Texas is equivalent to the ElReno Group of western Oklahoma.
Stratigraphically equivalent units in the San AndresFormation in the Palo Duro Basin are shown on theleft side of geologic column 5 (Fig. 7). This correlationof beds was most clearly demonstrated and stated inFracasso and Hovorka (1986, p. 28) and in Figure 4 ofHovorka and Granger (1988), and is supported by myown work in correlating the Blaine Formation on geo-physical logs from southwest Oklahoma into the PaloDuro Basin. Correlation of the base of the lower SanAndres unit 5 with the base of the Haystack Gypsum(or Gypsum Creek Dolomite) is unquestionable, as iscorrelation of the base of the middle San Andres(M-1) with the base of the VanVacterMember (theMan-gumDolomite Bed). Correlation of the base of the upperSan Andres (the Pi [!] marker bed) with shale betweenunits 6 and 7 of the Van Vacter Member is highly proba-ble, although it may, after more detailed work, be provento be equivalent to the shale below theAcmeDolomite orperhaps above gypsum unit 7 of the Van Vacter.
San Andres Formation in Swisher County,North Texas (Fig. 8)
Geologic column 6 (Fig. 8) is representative of partsof the lower, middle, and upper SanAndres Formation incores that were drilled by the U.S. Department of Energyin the late 1970s and early 1980s at 10 locations in the
Figure 7. Geologic column 5, showing Blaine Formationand associated strata in outcrops and shallow subsur-face of northwest Childress County, Texas (on right).Composite column based on outcrops and cores, asshown in Johnson (2019a, plate 7). Also shown (onleft) are the names of the same beds in the San AndresFormation in subsurface of the Palo DuroBasin in north-east Swisher County (Fig. 8); salt beds in Swisher Countyare omitted here to simplify correlations.
Permian Blaine and San Andres Formations of Western Oklahoma and Palo Duro Basin of Texas 253

Palo Duro Basin: the cores were drilled as part of a pro-gram to evaluate the potential for developing a nuclear-waste repository deep underground in salt beds of theSan Andres Formation. Illustrated in Figure 8 is theDOE–Gruy Federal D.M. Grabbe No. 1, drilled in north-east Swisher County, Texas, in 1981; lithology of thiscore is reproduced from McGowan (1981, Plate 1).
Originally,�the�San�Andres�Formation�in�the�Palo�Duro�Basin�was�informally�divided�into�just�lower�and�upper�divisions,� but� in� later� work� (Fracasso� and� Hovorka,�1986;�Hovorka� and�Granger,�1988),� the� lower�part� of�the�upper�division�was�separated�out�as�the�middle�San�Andres� (Fig.�8).�The�Blaine�Formation�part�of� the�San�Andres�here�is�about�85�m�thick.
Although�detailed�correlation�of�some�individual�gyp-sum/anhydrite� and� dolomite� beds� within� the� Blaine�Formation� breaks� down� westward� across� the� Palo�Duro�Basin,� there� is� unquestioned� equivalence� of� the�base�of�lower�San�Andres�unit�5�to�the�base�of�the�Blaine�Formation� in� southwest� and� northwest�Oklahoma.� In�addition,� the� base� of� the� middle� San� Andres� in� the�Palo�Duro�Basin�is�de!nitely�equivalent�to�the�Mangum�Dolomite� in� southwest� Oklahoma� and� to� the� Altona�Dolomite� in�northwest�Oklahoma.�In�addition,� there� is�a�high�probability�that�the�base�of�the�upper�San�Andres�(the�Pi�[!]�marker�bed)�is�equivalent�to�the�shale�belowVan�Vacter�Member�unit�7�in�Childress�County,�Texas,�and� is�stratigraphically�close� to� the�Acme�Dolomite� in�southwest� Oklahoma� and� the� Watonga� Dolomite� in�northwest�Oklahoma.
The�Pi�(!)�marker�bed�is�a�persistent�rock�layer�in�the�upper� part� of� the� San� Andres� Formation� throughout�southeast�New�Mexico� (Pitt� and� Scott,� 1981),� and� it�has� been� traced� eastward� across� the�Palo�Duro�Basin�to� the� shallow� subsurface� of� north-central� Texas�(Ramondetta,� 1982;� Fracasso� and� Hovorka,� 1986;�Hovorka�and�Granger,�1988).�The�Pi�marker�has�been�described� in� various� areas� as� a� siltstone� bed� (Pit� and�Scott,� 1981)� or� a� siltstone� and� !ne� sandstone� bed�(Fracasso�and�Hovorka,�1886).�Its�value�is�that�on�geo-physical� logs� it� is�a�sharp,�high-gamma-ray�peak�at� the�base�of�the�upper�San�Andres�Formation:�1)�it�can�be�cor-related�over�great�distances�from�southeast�New�Mexico�to�the�eastern�Palo�Duro�Basin;�2)�it�is�essentially�equiva-lent� to� the� top� of� the� Blaine� Formation� in� southwest�Oklahoma;�and�3)�it�is�probably�equivalent�to�strata�just�above�the�Watonga�Dolomite�in�northwest�Oklahoma.
EVAPORITE�KARST�IN�BLAINE�ANDSAN�ANDRES�FORMATIONS
Salt�and�gypsum�beds� in� the�Blaine�Formation�and�associated� strata� in�western�Oklahoma�have�been�dis-solved�naturally� at�many� places,� and� the� same� is� true�for�salt�and�gypsum�beds�in�the�San�Andres�Formation�in�the�Palo�Duro�Basin�of�Texas.�Fresh�ground�water�cir-culates�down�to�salt�and�gypsum�in�these�formations,�dis-solves�some�or�all�of�the�evaporites,�and�produces�karst�features,�such�as�sinkholes,�collapse�structures,�breccia�pipes,� caves,� natural� bridges,� disappearing� streams,�and�salt�springs.�In�some�places,�dissolution�is�not�highly�focused:� instead,�and� it�removes�gypsum�or�salt�some-what�uniformly�over�moderate-to-large�areas,�producing
Figure 8. Geologic column 6, showing the San AndresFormation (on left) in the subsurface of the PaloDuro Basin in northeast Swisher County, Texas. Basedon core descriptions of the D.O.E.–Gruy Federal, D.M.Grabbe No. 1 well, shown in McGowan (1981, plate 1),and correlations of Hovorka and Granger (1988). Alsoshown (on right) are the names of the same bedsand formations in Childress County, Texas, and south-west Oklahoma.
254 Kenneth S. Johnson

sheetlike dissolution of the evaporite with, perhaps, littledisturbance of overlying strata, except for subsidence orsettling.
The process for dissolution of evaporites was dis-cussed by Johnson (1981) with reference to salt dissolu-tion, but the guidelines also apply to gypsum dissolution.He stated that ground water in contact with salt or gyp-sum will dissolve some of the rock, providing that thewater is not already saturated with NaCl or CaSO4,respectively (Fig. 9). For extensive dissolution to occur,it is necessary for the resulting brine to be removed fromthe evaporite rock, or else the brine becomes saturatedand the dissolution process stops. Four basic require-ments for dissolution of salt or gypsum are: 1) a depositof salt or gypsum against which, or throughwhich, watercan "ow; 2) a supply of water unsaturated with NaCl orCaSO4, respectively; 3) an outlet whereby the resultingbrine can escape; and 4) energy, such as a hydrostatichead or density gradient, to cause water to "ow throughthe system (Johnson, 1981). When all four requirementsare met, dissolution of salt or gypsum can be quite rapid,in terms of geologic time. A brief discussion on thedevelopment of sinkholes in North America was givenby Martinez and others (1998).
Recent discussions of widespread evaporite karst inthe Blaine Formation and associated strata in westernOklahoma are presented by Johnson (2003a, 2013),
and in the San Andres Formation in the Palo Duro Basinby Gustavson and others (1980a, 1980b, 1982) andSimpkins and others (1981). The current report willshow examples of salt karst and gypsum karst in thislarge region.
Salt Karst
WesternOklahoma and the Texas Panhandle contain athick sequence of salt-bearing evaporites in the BlaineFormation and associated strata and in the San AndresFormation (Fig. 10). The Oklahoma occurrences havebeen mapped and described by Jordan and Vosburg(1963), Johnson (1967, 1976), and Johnson and Gon-zales (1978). Similar thick deposits of salt in the San An-dres Formation in the Palo Duro Basin are described andshown on maps and cross sections by Presley (1981a,1981b, 1987), Ramondetta (1982), Fracasso and Hov-orka (1986),McGookey and others (1988), andHovorka(1990). These thick salt units typically are partially ortotally dissolved where they are at depths of less thanabout 200 to 300 m. Evidence that salt dissolution isan on-going process is the presence of numerous saltsprings and salt "ats located on outcrops of the Blaineand associated strata on the "anks of the Anadarko Basinin Oklahoma (Ward, 1961; Johnson, 2019c, 2019d), andon the east side of the Palo Duro Basin in north-central
Figure�9.�Schematic�diagram�showing�circulation�of�fresh�water�and�brine�in�areas�of�salt�dissolution�in�westernOklahoma�and�north-central�Texas�(modi!ed�from�Johnson,�1981 �����B).
Permian Blaine and San Andres Formations of Western Oklahoma and Palo Duro Basin of Texas 255

Texas (Ward, 1961; Johnson, 1981, 2019a; Richter andKreitler, 1986).
Below are discussions of salt karst in the Blaine For-mation and associated strata in areas a, b, and c in Okla-homa (Fig. 11). These are followed by discussions of saltkarst in the SanAndres Formation of Texas in: 1) the PaloDuro Basin and 2) a separate study in the east Palo DuroBasin area.
Area a
In area a, the deep Anadarko Basin preserves a thicksequenceof salt-bearing evaporites in theBlaineFormation
and�associated�strata�(Fig.�5)�that�are�partly�dissolved�where�they�extend�to�shallower�depths�of�the�basin�(Fig.�12):�these�salt-bearing�units�are�(in�ascending�order)� the�Flowerpot�salt,�Blaine�Formation,�and�Yelton�salt—which�collectively�are�referred�to�as�the�Beckham�evaporites�(Jordan�and�Vos-burg,� 1963).� The� Beckham� evaporites� are� up� to� 250�m�thick� in�eastern�Beckham�County,�along� the�axis�of� the�basin,� and� the� salt� units� tend� to� be� dissolved� at� depths�less�than�about�200–300�m.
Normally,�outcropping�strata�in�the�Anadarko�Basin�dip�at�an�angle�of�less�than�one�degree�(less�than�10�m/km)�toward� the� axis� of� the� basin.�However,� dissolution� of�salt�has�resulted�in�some�collapse�structures,�and�in�those
Figure 10. Stratigraphic nomenclature of Upper Permian and younger strata in western Oklahoma and Texas Pan-handle, showing main salt units in green (modi!ed from Johnson, 1976). Some workers have placed the Glorieta,San Angelo, and Duncan Sandstones in the Leonardian Series.
256 Kenneth S. Johnson

basin,�and�overlying�strata�have�collapsed�into�the�salt-karst�cavities�(Fig.�12,�lower�cross�section).�The�thick-ness,�distribution,�and� sharp� termination�of� the�Yelton�salt�at�its�dissolution�limits�have�been�mapped�by�Jordan�and�Vosburg�(1963)�and�Johnson�(1963,�1967).�Collapse�structures�and�disturbed�bedding�in�outcropping�Cloud�Chief,�Doxey,�and�Elk�City�strata�that�overlie�the�disso-lution�zone�have�been�well�documented�in�!eld�studies�by�Smith� (1964),�Richardson� (1970),�Zabawa� (1976),�Moussavi-Harami�(1977),�Suneson�(2012),�and�Johnson�(2013).�Whereas�strata�overlying� the�Yelton�salt�along�and�near�the�axis�of�the�Anadarko�Basin�are�still�essen-tially�"at� lying�(dips�of� less� than�one�degree),�chaotic-bedding� features� are� common� to� the� north� and� south,�where�the�Yelton�salt�has�been�dissolved�and�overlying�strata�have�collapsed.
Area�bArea�b,�referred�to�as�the�Canute–Burns�Flat�area�in�
Johnson�(2013),�is�an�excellent�area�to�examine�dissolu-tion�of�the�Yelton�salt�and�resultant�subsidence�and�col-lapse�of�overlying�strata�(Fig.�13).�Here,�the�Yelton�salt�is� typically� 50–70�m� thick,� but� it� thins� sharply� to� the�north� and� east� because� of� dissolution,� and� is� totally�missing�within� several� kilometers.�As� a� result� of� salt�dissolution,� there� is� a� signi!cant� difference� in� the�attitude�(dip)�of�outcropping�rocks�in�the�area�underlain�by� the�Yelton,� as� compared� to�nearby� areas�where� the�Yelton� is� totally� dissolved.� Mapping� of� the� surface�geology� here� by� Richardson� (1970)� showed� that�outcrops� above� the� Yelton� are� essentially� horizontal,�whereas�his�study,�and� that�of�Johnson�(2013),�showed�that� Permian� strata� overlying� the� salt-dissolution� area�typically� dip� erratically� at� angles� of� 5–30°,� and� that�Cretaceous�and�Permian�strata�in�the�same�area�occur�as�scattered�chaotic�collapse�blocks�or�breccia�pipes� (Fig.�14):� breccia� pipes� here� are� cylindrical� or� irregular�columns�of�broken�rock�(rubble)�that�have�dropped�into�deep-seated,� salt-dissolution� cavities.� Disruption� of�outcropping�strata�because�of�Yelton-salt�dissolution�on�the�north�"ank�of� the�Anadarko�Basin� is�also�shown� in�Figure�12�(lower�cross�section).
Cretaceous� strata� once� covered� the� area,� but� have�now� been� entirely� removed� by� erosion,� except�where�they� have� been� preserved� in� breccia� pipes� as� down-dropped� blocks� of� limestone� and� sandstone� (Suneson,�2012;� Johnson� 2013) (Fig.� 14B).� These� breccia� pipes�typically�are�less�than�0.4�hectare�(1�acre)�in�size,�and�it�appears�that�Cretaceous�strata�have�dropped�some�50�m,�or� more,� and� are� now� juxtaposed� against� various�Permian�formations�on�the�north�"ank�of�the�Anadarko�Basin.
Area�cArea�c�refers�to�a�cross�section�(Figs.�11,�15)�from�the�
deep�Anadarko�Basin�to�the�northern�shelf�where�cores
Figure�11.�Map�of�Anadarko�Basin�in�western�Oklahomaand�Texas�Panhandle�showing�areas�underlain�by,�anddissolution�limits�of,�the�Flowerpot,�Blaine,�and/or�Yel-ton�salts�(modi!ed�from�Johnson,�2013).�Also�shown�arethree�areas�and�cross�sections�of�salt�dissolution�in�Okla-homa�that�are�discussed�in�this�report�(areas�a,�b,�and�c).
areas�underlain�by�salt�karst�the�overlying�strata�have�sub-sided,�settled,�or�collapsed�into�the�underground�cavities�(Fig.�12,� lower� cross� section).�This�has� resulted� in�dis-turbed�bedding�in�outcropping�rocks,�and�locally�Permian�rocks�dip�at�angles�of�up�to�30°,�or�more.�Disturbed�bed-ding�and�collapse� structures�caused�by� salt�karst� in� the�Oklahoma�part�of�the�Anadarko�Basin�can�be�seen�in�out-crops�of�overlying�Permian�units�(the�Cloud�Chief,�Doxey,�and�Elk�City�Formations),�as�represented�in�the�lower�cross�section�in�Figure�12,�and�as�breccia�pipes�and�other�col-lapse�features�of�Cretaceous�rocks�at�scattered� locations�on�the�north�"ank�of�the�Anadarko�Basin�(see�“Area�b”�and�“Area�c,”�below).
The�Yelton�salt� is� the�youngest�salt�unit� in� the�Ana-darko�Basin,�and�it�ranges�in�depth�from�about�200�m�to�nearly�400�m�along�and�near� the�axis�of� the�Anadarko�Basin�(Jordan�and�Vosburg,�1963;�Johnson,�1963,�1967).�This�salt�is�partly�or�totally�dissolved�on�the�"anks�of�the
Permian Blaine and San Andres Formations of Western Oklahoma and Palo Duro Basin of Texas 257
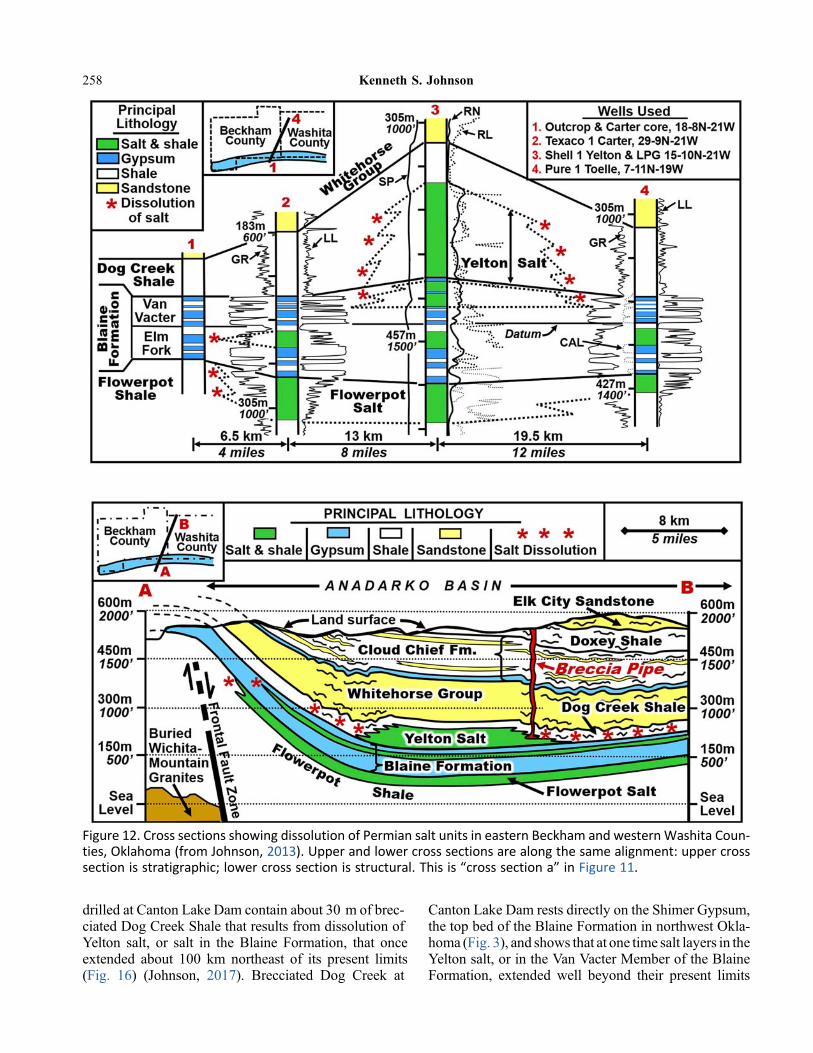
drilled�at�Canton�Lake�Dam�contain�about�30�m�of�brec-ciated�Dog�Creek�Shale�that�results�from�dissolution�of�Yelton� salt,� or� salt� in� the�Blaine� Formation,� that� once�extended� about� 100� km� northeast� of� its� present� limits�(Fig.� 16)� (Johnson,� 2017).� Brecciated� Dog� Creek� at
Canton Lake Dam rests directly on the Shimer Gypsum,the top bed of the Blaine Formation in northwest Okla-homa (Fig. 3), and shows that at one time salt layers in theYelton salt, or in the Van Vacter Member of the BlaineFormation, extended well beyond their present limits
Figure 12. Cross sections showing dissolution of Permian salt units in eastern Beckham and westernWashita Coun-ties, Oklahoma (from Johnson, 2013). Upper and lower cross sections are along the same alignment: upper crosssection is stratigraphic; lower cross section is structural. This is “cross section a” in Figure 11.
258 Kenneth S. Johnson

in the deep parts of the basin. Further evidence of the pre-vious presence of these salts are the large areas contain-ing scattered collapse blocks of Cretaceous rocks in
Washita,� Custer,� and� Dewey� Counties� (Fig.� 15),� as�mapped� or� described� by�Stanley� (2002),� Johnson� and�others�(2003),�Fay�(2010),�Suneson�(2012),�and�Johnson�(2013,�2017).
Breccia�cored�at�Canton�Lake�Dam�consists�of�angular�fragments� of� shale,� siltstone,� sandstone,� dolomite,� and�gypsum� that� range� in�size� from�about�0.5�cm� to�15�cm�across,� and� are� surrounded� by,� and� recemented� in,� a�matrix�of� clay,� shale,�or� sandstone� (Fig.�17)� (Johnson�2017).�Many�cores�were�drilled�at� the�dam�site�during�three�phases�of�investigation,�and�breccia�was�reported�in� the� lower�part�of� the�Dog�Creek� in�virtually�all� the�cores.� The� brecciated� zone� is� about� 15�m� below� the�land�surface�at�the�dam�site.�If�karst�or�collapse�features�are�present�nearer�to�the�land�surface�at�the�dam,�they�are�now�masked�by�Quaternary�deposits�or�the�earthen�dam�itself:� however,� photographs� (taken� during� dam� con-struction�in�1946)�of�excavations�show�that�upper�Dog�Creek� strata� appear� to� be� disrupted� and� undulate� as�much�as�6–9�m�within� short�distances,�and� these� look�like� subsidence,� collapse,� and� sinkhole� features� that�would�result�from�dissolution�and�collapse�of�underlying�Dog�Creek�strata�(Johnson,�2017).
It� is� likely� that� a�moderate� amount� of� bedded� salt�(either�Yelton� salt� or� salts� in� the�Van�Vacter�Member�of� the�Blaine� Formation)� originally� existed� in� a� large�area�of�Washita,�Custer,�and�Dewey�Counties,�reaching�all�the�way�to�Canton�Lake�Dam�area.�That�salt�was�dis-solved�by�ground�water,� resulting� in� fracturing,� subsi-dence,� and� brecciation� of� interbedded� and� overlying�strata:� this� produced� layers� of� brecciated� Dog� Creek�Shale,�as�were� cored�at�Canton�Lake�Dam,�as�well�as�breccia�pipes� that�preserve�Cretaceous�collapse�blocks�elsewhere�in�the�Anadarko�Basin.
Figure 13.Map showing thickness of Yelton salt (green),and the area of salt dissolution and collapse of overlyingstrata in the Canute–Burns Flat area of northwestWashita County, Oklahoma. Cretaceous collapse struc-tures are mostly less than 0.4 hectare (1 acre). FromJohnson (2013, 2017). This is “area b” in Figure 11.
Figure 14. Collapse structures because of dissolution of the Yelton salt in the Anadarko Basin, where Permian strataunaffected by salt dissolution normally dip at angles of less than 1°. A) Large masses of Permian strata (Doxey Shalehere) are tilted and dip at angles of up to 30° where salt dissolution occurred beneath a large area: masses are up to2–4 hectares (5–10 acres). B) Other collapse features are breccia pipes or chimneys, where blocks of Cretaceouslimestone and sandstone drop down in areas generally less than 0.4 hectare (1 acre), and are juxtaposedwith Perm-ian outcrops.
Permian Blaine and San Andres Formations of Western Oklahoma and Palo Duro Basin of Texas 259

Palo Duro Basin
Johnson (1976) made a study of the thickness, depth,and distribution of Permian salt deposits in the Texas
Panhandle and western Oklahoma to determine if theregion might contain an area suitable for the under-ground disposal of high-level radioactive wastes: he rec-ommended that, of the three basins studied (Anadarko,Palo Duro, and Dalhart Basins), parts of the Palo DuroBasin appeared to have salt deposits most likely tomeet the criteria for hosting a radioactive-waste reposi-tory. The U.S. Department of Energy then contracted (in1977) with the Bureau of Economic Geology (BEG) atThe University of Texas at Austin, along with severalengineering and consulting !rms, to conduct extensivegeologic and hydrologic studies related to salt depositsin the Palo Duro Basin.
In 1987, the U.S. Congress amended the NuclearWaste Policy Act to focus only on the Yucca MountainSite in Nevada, and further study of Palo Duro Basin as apotential repository site ceased. However, a wealth ofinformation was obtained and published by BEG onthe Permian salt deposits of the Palo Duro Basin duringtheir studies, and one of the major foci was on the geol-ogy and dissolution phenomena of salts in the SanAndres Formation. Among those reports are Gustavson(1979, 1982, 1986a), Gustavson and others (1980a,1980b, 1982), Presley (1980, 1981a, 1981b), Simpkinsand others (1981), Collins (1984), Goldstein and Collins(1984), and Gustavson and Finley (1985).
Maps showing distribution of the SanAndres salts, andareaswhere those salts are partly or totally dissolved,wereprepared by Presley (1981a), and are simpli!ed here inFigure 18. Salt is abundant in the San Andres Formation.Net salt thickness ranges from about 15 to 120 m in thelower SanAndres, and from about 30 to 90 m in the upperSan Andres. The top of these salts is about 900 m belowthe land surface in the south (deep) part of the Palo DuroBasin, and it rises to depths as shallow as 150–330 m inthe east and north parts of the basin (Presley, 1981a): at
Figure 15.Map of northwest Oklahoma showing: 1) axisof the Anadarko Basin (AB); 2) areas still underlain bythe Yelton salt (green); 3) location of Shell Oil Co. Yeltonwells (see also Figs. 5, 12); 4) areas with multiple brec-cia pipes and collapse blocks of Cretaceous rocks inWashita, Custer, and Dewey Counties (red); 5) CantonLake, where breccia was encountered in Permian strataduring dam construction; and 6) location of crosssection C–C’ (see Fig. 16), which is “cross section c”in Figure 11. From Johnson (2017).
Figure 16. Cross section C–C’ from axis of Anadarko Basin (left) to the northern shelf area (right). Permian salt units,still present in the deep subsurface, are dissolved at shallower depths, causing brecciation and collapse of overlyingstrata. Breccia pipes (schematically located) locally reach the present land surface and contain collapse blocks ofPermian and Cretaceous strata. Cores at Canton Lake Dam (right side of cross section) contain collapse breccia (seeFig. 17) resulting from dissolution of Yelton or Blaine salt beds, previously present in the area. Location of “crosssection c” shown in Figures 11 and 15. From Johnson (2017).
260 Kenneth S. Johnson

these shallow depths, ground-water dissolution of salt oc-curs (Fig. 9), and the San Andres and overlying strata arefractured, disrupted, and chaotically dropped. Collapsefeatures above San Andres dissolution zones includebreccias, breccia pipes, faults, sinkholes, and complexfolds (Gustavson and others, 1980b).
Cross sections by Presley (1981a, b) (Figs. 19, 20)show clearly the dissolution of San Andres salts asthey rise from 900-m depths in the deep Palo Duro Basinto shallower depths on the east and north margins of thebasin (see location of cross sections in Fig. 18). Both arestratigraphic cross sections, with the datum being the topof the San Andres Formation, or equivalent strata at thetop of the Blaine Formation, or gypsum/anhydrite in the
lower�part�of�the�Dog�Creek�Shale.�Salts�in�the�upper�San�Andres�and�unit�5�of�the�lower�San�Andres�(Fig.�19)�are�dissolved� in� eastern�Armstrong�County—and� parts� of�Briscoe,�Hall,�and�Motley�Counties�(Fig.�18).�The�upper�San�Andres�salt�is�about�280�m�(800� ft)�deep,�and�well�preserved,�in�wells�#19�and�#22�(Fig.�19);�but�these�salts�are�dissolved�about�30�km�to�the�east,�where�they�would�be�about�150�m�(500�feet)�deep�in�well�#43.�In�addition,�in�a�similar�manner,�the�remaining�salts�in�the�lower�San�Andres� are� all� dissolved� at� depths� of� about� 150�m�(between�wells�#31�and�#9),�within�a�distance�of�about�35�km�(Fig.�19).
Another�cross�section�(Fig.�20)�extends�from�the�deep�Palo�Duro�Basin�on�the�south,�up�over�the�Oldham�Nose
Figure�17.�Three�boxes�containing�4�m� (13� feet)�of�core� from�borehole�BL–3,�drilled�on� left�spillway�abutment�of� Canton� Lake� Dam� in� Blaine� County,� Oklahoma.� Top� of� core� is� 40.2�m� (132.0� feet)� deep,� and� bottom� is44.2�m�(145.0�feet)�deep.�Core�shows�brecciated�Dog�Creek�Shale,�with�fragments�of�shale,�siltstone,�dolomite,and�gypsum�that�are�recemented�in�a�matrix�of�clay,�shale,�and�sandstone.�Rock�is�brecciated�because�of�collapseresulting�from�dissolution�of�underlying�salt�in�the�Yelton�salt,�and/or�salts�in�the�upper�part�of�the�Blaine�Formation(see�SJHIU�TJEF�PG�Fig.�16).�From�Johnson�(2017).
Permian Blaine and San Andres Formations of Western Oklahoma and Palo Duro Basin of Texas 261
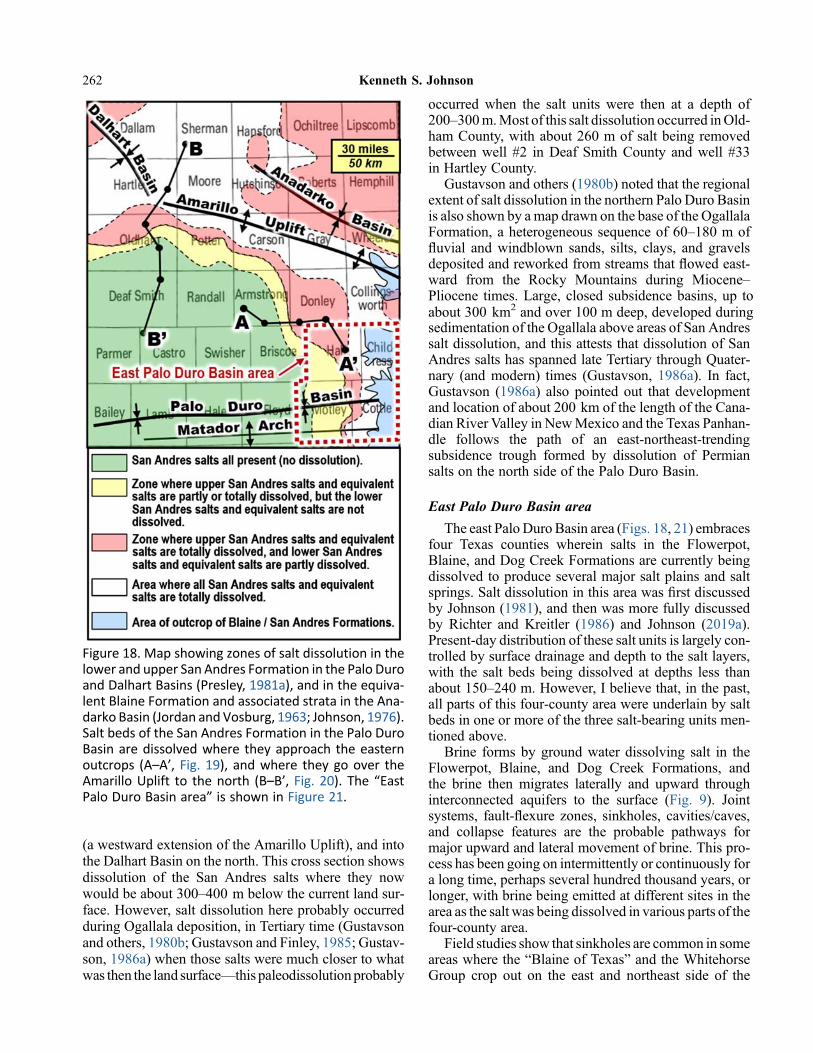
(a westward extension of the Amarillo Uplift), and intothe Dalhart Basin on the north. This cross section showsdissolution of the San Andres salts where they nowwould be about 300–400 m below the current land sur-face. However, salt dissolution here probably occurredduring Ogallala deposition, in Tertiary time (Gustavsonand others, 1980b; Gustavson and Finley, 1985; Gustav-son, 1986a) when those salts were much closer to whatwas then the land surface—this paleodissolutionprobably
occurred�when� the� salt� units�were� then� at� a� depth� of�200–300�m.�Most�of�this�salt�dissolution�occurred�in�Old-ham�County,�with�about�260�m�of� salt�being� removed�between�well�#2� in�Deaf�Smith�County� and�well�#33�in�Hartley�County.
Gustavson�and�others�(1980b)�noted�that�the�regional�extent�of�salt�dissolution�in�the�northern�Palo�Duro�Basin�is�also�shown�by�a�map�drawn�on�the�base�of�the�Ogallala�Formation,�a�heterogeneous� sequence�of�60–180�m�of�"uvial� and�windblown� sands,� silts,� clays,� and� gravels�deposited�and�reworked�from�streams�that�"owed�east-ward� from� the� Rocky� Mountains� during� Miocene–Pliocene� times.�Large,� closed� subsidence�basins,�up� to�about�300�km2�and�over�100�m�deep,�developed�during�sedimentation�of�the�Ogallala�above�areas�of�San�Andres�salt�dissolution,�and� this�attests� that�dissolution�of�San�Andres�salts�has�spanned� late�Tertiary� through�Quater-nary� (and�modern)� times� (Gustavson,� 1986a).� In� fact,�Gustavson� (1986a)� also� pointed� out� that� development�and�location�of�about�200�km�of�the�length�of�the�Cana-dian�River�Valley�in�New�Mexico�and�the�Texas�Panhan-dle� follows� the� path� of� an� east-northeast-trending�subsidence� trough� formed� by� dissolution� of� Permian�salts�on�the�north�side�of�the�Palo�Duro�Basin.
East�Palo�Duro�Basin�areaThe�east�Palo�Duro�Basin�area�(Figs.�18,�21)�embraces�
four� Texas� counties� wherein� salts� in� the� Flowerpot,�Blaine,�and�Dog�Creek�Formations�are�currently�being�dissolved� to�produce�several�major�salt�plains�and�salt�springs.�Salt�dissolution�in�this�area�was�!rst�discussed�by�Johnson�(1981),�and� then�was�more�fully�discussed�by�Richter� and�Kreitler� (1986)� and� Johnson� (2019a).�Present-day�distribution�of�these�salt�units�is�largely�con-trolled�by�surface�drainage�and�depth�to�the�salt�layers,�with� the� salt� beds� being� dissolved� at� depths� less� than�about�150–240�m.�However,�I�believe�that,�in�the�past,�all�parts�of�this�four-county�area�were�underlain�by�salt�beds�in�one�or�more�of�the�three�salt-bearing�units�men-tioned�above.
Brine� forms�by�ground�water�dissolving� salt� in� the�Flowerpot,� Blaine,� and� Dog� Creek� Formations,� and�the� brine� then�migrates� laterally� and� upward� through�interconnected� aquifers� to� the� surface� (Fig.� 9).� Joint�systems,� fault-"exure� zones,� sinkholes,� cavities/caves,�and� collapse� features� are� the� probable� pathways� for�major�upward�and�lateral�movement�of�brine.�This�pro-cess�has�been�going�on�intermittently�or�continuously�for�a�long�time,�perhaps�several�hundred�thousand�years,�or�longer,�with�brine�being�emitted�at�different�sites�in�the�area�as�the�salt�was�being�dissolved�in�various�parts�of�the�four-county�area.
Field�studies�show�that�sinkholes�are�common�in�some�areas�where� the�“Blaine�of�Texas”�and� the�Whitehorse�Group� crop� out� on� the� east� and� northeast� side� of� the
Figure 18. Map showing zones of salt dissolution in thelower and upper San Andres Formation in the Palo Duroand Dalhart Basins (Presley, 1981a), and in the equiva-lent Blaine Formation and associated strata in the Ana-darko Basin (Jordan and Vosburg, 1963; Johnson, 1976).Salt beds of the San Andres Formation in the Palo DuroBasin are dissolved where they approach the easternoutcrops (A–A’, Fig. 19), and where they go over theAmarillo Uplift to the north (B–B’, Fig. 20). The “EastPalo Duro Basin area” is shown in Figure 21.
262 Kenneth S. Johnson

Palo�Duro�Basin,�and�these�can�have�an�adverse�impact�on�highways�and�other�construction�and�cultural�features�in� the� area� (Simpkins� and� others,� 1981;� Gustavson,�1986b).�For�example,�Simpkins�and�others�(1981)�iden-ti!ed�more� than� 400� sinkholes� and� undrained� depres-sions� on� aerial� photographs� in� Hall� County� alone:�these� sinkholes� are�up� to�100�m�wide� and�15�m�deep.�In�addition,�they�recognized�11�active�fractures�and�faults�that�they�associate�with�salt�dissolution�and�collapse.
Gypsum�Karst
An�overview�of�processes�and�distribution�of�gypsum�karst�throughout�the�United�States�was�given�by�Johnson�(1996),�but�western�Oklahoma�and�north-central�Texas�are�among�the�best�regions�in�the�United�States�for�the�study� of� gypsum� karst,� including� caves,� sinkholes,�springs,�disappearing� streams,� and�karst� aquifers.�The�region� containing� gypsum� outcrops� of� the� Blaine�Formation�and�the�“Blaine�of�Texas”�extends�about�600�km�north–south�and�as�much�as�200�km�east–west�(part�of�which� is� shown� in�Fig.� 22).�Karst� features� are� best�developed� where� the� Blaine� is� mainly� thick� gypsum�beds� with� thin� shale� interbeds.� Early� development� of�porosity� in� the�Blaine� occurs� chie"y� in� dolomite� beds�and� in� the� lower� part� of� each� overlying� gypsum� unit;�locally,�dolomite�porosity�is�so�extensive�that�the�rock�is
IPOFZDPNCFE� and� has� only� a� skeletal� framework�supporting� the� voids� (Johnson,� 2003a).� Therefore,�gypsum� cavities� are� most� common� at� and� near� the�contact� with� underlying� dolomites.� In� places,� the�cavities� are� developed� along� local� joints,� fractures,�and� bedding� planes� in� the� gypsum� (Fig.� 23A),� but�there�are�no�known�regional�orientation�patterns.
Examples�of�gypsum�karst,�caves,�and� local�dissolu-tion/collapse�structures�are�given�in�Figure�23.�Figure�23A�shows�the�preferential�early�dissolution�of�gypsum�along�joints� and� bedding� planes:� such� openings� are� enlarged�because�of�further�dissolution�by�through-"owing�waters,�and�by�abrasion,�because�of�sand,�gravel,�and�other�mate-rials�being�carried�in�the�waters.�Figure�23B�indicates�the�size�of�some�of�the�sinkholes�that�can�lead�into�local�caves�and� underground�water� courses.� Figures�23C� and� 23D�show�collapse�structures�and� tight� folds� that� result� from�dissolution�of� salt�and�gypsum� in� the�Blaine�Formation�and�underlying�strata�in�the�shallow�subsurface�along�Prai-rie�Dog�Town�Fork�Red�River�in�Texas.�Figures�23E�and�23F�are�interior�views�of�two�caves�in�the�Blaine�Formation�of�southwestern�Oklahoma.
Both�gypsum�and�dolomite�beds�of�the�Blaine�Forma-tion�are�commonly�karstic�in�outcrops�and�shallow�sub-surface�of�western�Oklahoma�and�north-central�Texas.�Gypsum� beds� in� the� Blaine� Formation� typically� are�3–9�m� thick� throughout� the� region.�Dolomite� beds� in
Figure 19. Regional stratigraphic cross section A–A’ showing transition of part of the San Andres Formation to theBlaine Formation in the Palo Duro Basin (modi!ed from Presley, 1981b); depths are in feet. Salt beds of the SanAndres in the Palo Duro Basin are all dissolved where they approach the eastern outcrops in north-central Texas.Location of cross section shown in Figure 18.
Permian Blaine and San Andres Formations of Western Oklahoma and Palo Duro Basin of Texas 263

the�Blaine�of�western�Oklahoma�typically�are�less�than���m� thick,�but� locally�reach�2�m:� in�Texas,� they�are� typi-cally� 1–3� m� thick,� and� locally� are� almost� 5� m� thick�(Pendery,�1963;�Jones,�1971).�Most�karst�features�in�the�Blaine� Formation� are� developed� in� the� gypsum� beds,�but�in�southwest�Oklahoma�and�north-central�Texas,�the�dolomite�beds�are�also�karstic�and,�along�with�the�gypsum�beds,�are�signi!cant�sources�of�irrigation�water.
Below� are� examples�of�gypsum�karst� in� the�Blaine�Formation,�including:�1)�development�of�caves;�2)�aqui-fers;�and�3)�problems�in�siting�of�dams.
Gypsum�Caves�in�Blaine�Formation
Gypsum�caves�are�widespread�and�quite�common�in�the�Blaine�Formation�of�western�Oklahoma�and�north-central� Texas.�Oklahoma� has� a� total� of� 201� recorded�caves� in� the�Blaine� (Table� 1),�with� 152� in� northwest�Oklahoma�and�49� in� southwest�Oklahoma.� In� just� the�Palo�Duro�Basin�part�of�north-central�Texas,�the�“Blaine�of� Texas”� has� a� total� of� 106� recorded� gypsum� caves�(Table�1);� there�are�another�16�recorded�gypsum�caves�farther� south� in�King� and� Stonewall� Counties,� Texas�(Johnson,�2018).
Discussions of gypsum caves in the Blaine of westernOklahoma are by Myers and others (1969), S. Bozeman(1987, 2002), Johnson (1989, 1990b, 2003a, 2011,2018), Bozeman and Bozeman (2002), J. Bozeman(2003), Christenson and others (2003), Miller and others(2003), and Tarhule and others (2003). Most studies ofgypsum caves in the Blaine Formation in Oklahomahave been carried out by members of the Central Okla-homa Grotto (COG), chie"y by members John and SueBozeman of Oklahoma City. The major outlet for COGresearch is in 21 volumes of Oklahoma Underground, ajournal they publish intermittently (see “Publications/News” and then “Oklahoma Underground Publications”on their website: http://okcavers.com/). In addition, onthe COG website is an interesting movie/slide showon “Western Oklahoma Gypsum Caves” that gives toursand discussions of several major caves, including Ala-baster Caverns and D.C. Jester Cave.
Discussions of gypsum karst and caves in north-central Texas are by McGregor and others (1963),Reddell and Russell (1963), Galegar and DeGeer (1969),Brown (1987), Elliott and Veni (1994), and Johnson(2018). The Texas Speleological Association (TSA) isthe major source of data on caves in Texas: The Texas
Figure 20. Regional stratigraphic cross section B–B’ showing transition of the San Andres Formation in the Palo DuroBasin (right) to the Blaine Formation in theDalhart Basin (modi!ed fromPresley, 1981a); depths are in feet. Salt bedsof the San Andres in the deep Palo Duro Basin are all dissolved where they approach, and extend over, the OldhamNose/Amarillo Uplift. Location of cross section shown in Figure 18.
264 Kenneth S. Johnson

Caver is published quarterly by TSA, and copies areavailable online at: https://www.cavetexas.org/TSA/TC_Online/ Below are brief discussions of !ve cavesin western Oklahoma and north-central Texas: AlabasterCaverns, Selman Cave, D.C. Jester Cave, EstellineSpring, and Walkup Cave (Fig. 22).
Alabaster Caverns. Alabaster Caverns State Park(Figs. 22, 24) hosts the best-known cave in Oklahoma ornorth-central Texas (Myers and others, 1969; Central
Oklahoma Grotto, 1985; Johnson, 2011, 2018). Thisnorthwest Oklahoma cave is 1,873 m long: it is the19th longest gypsum cave in the United States, and the66th longest gypsum cave in the world (Table 2). Caverndevelopment is almost wholly in the Medicine LodgeGypsum Bed, and the cave has a maximum width of18 m and a maximum height of 15 m.
The main passage consists of three sections, each ofnearly equal length (Fig. 24): 1) a collapse sectionnear the entrance; 2) a middle section with domes in
Figure 21. Generalized map, columnar section, and cross section showing evaporites and salt-dissolution zones inBlaine Formation and associated strata in East Palo Duro Basin area of north-central Texas (from Johnson, 2019a).Original lateral extent of each salt unit (and extent of dissolution zones) is uncertain. Location of East PaloDuro Basinarea shown in Figure 18.
Permian Blaine and San Andres Formations of Western Oklahoma and Palo Duro Basin of Texas 265

Geologic�data�on�the�Selman�Cave�System,�summa-rized�by�Bozeman�(2002,�2003),�shows�that�cave�devel-opment�is�nearly�restricted�to�the�thick�Medicine�Lodge�and�Nescatunga�Gypsum�Beds�and�the�intervening�shale.�The�main�passageway�consists�of�wide,�high�tunnels�with�a�meandering�stream�underfoot.�It�contains�a�breakdown-boulder�room�18�m� tall,�and�several�domes�up� to�12�m�high,�along�with�some�passages�that�require�stooping�or�crawling.�With�a� length�of�4,794�m� (Table�2),� it� is� the�19th�longest�gypsum�cave�in�the�world�and�the�3rd�longest�gypsum�cave�in�the�United�States�(after�D.C.�Jester�Cave�[below],�and�Parks’�Ranch�Cave�in�New�Mexico);�there�are�more�than�25�separate�entrances�to�the�cave�system.
D.C.�Jester�Cave.� Jester�Cave,� located� in�Greer�County,�southwest�Oklahoma�(Figs.�22,�25,�26),� is� the�longest�gypsum�cave�in�the�United�States,�and�also�the�8th� longest� gypsum� cave� in� the� world� (Table� 2).� The�main� passage� is� 2,413� m� long,� but� its� many� known�side�passages�are�a�total�of�7,652�m�long:�thus,�the�total�length�of�cave�system�is�10,065�m.�This�brief�discussion�is�based�largely�on�the�comprehensive�report�by�Boze-man�(1987),�and�shorter�reports�on�the�geology�by�John-son�(1989,�1990b,�2003a,�2018).
Almost�all�parts�of� the�main�cave�are� formed� in� the�5-m-thick� gypsum� unit� 1� of� the�Van�Vacter�Member(Figs.� 23E,�25).� Instead�of� the�passages�being�mainlylong�and�straight,�they�typically�are�angulate,�with�sharpbends�and�some�broad,�sweeping�curves�(Fig.�26).�Manyof� the�passages�are�elliptical� in�cross�section,�althoughthey�are�quite�variable.�The�main�passage�typically�is�6–15�m�wide�and�1.5–6�m�high;�side�passages�typically�are1.5–3� m� wide� and� 0.6–3� m� high.� The� alignment� ofvarious� segments� of� Jester� Cave� suggests� the� cave’s"ow�may�be�controlled�by�several�sets�of�joints�or�frac-tures;� the�main�segments�are�oriented�between�N10ºWand�N30ºW,�with�other�cave�segments�oriented�N60ºE,N30ºE,�and�N60ºW.�Karst�in�the�area�is�extensive,�andthere�are�more�than�70�separate�known�entrances�to�JesterCave.
Estelline� Spring.� Estelline� Spring� is� a� unique�cave/sinkhole/spring:�it�is�a�major�salt-water�spring�issu-ing�from�a�sinkhole�in�the�alluvium�of�Prairie�Dog�Town�Fork�Red�River,�about�1.6�km�east�of�the�town�of�Estel-line,�in�north-central�Texas�(Figs.�21,�22,�27).�The�few�published� data� on� Estelline� Spring� are� contained� in�Ward� (1961),�Galegar� and�DeGeer� (1969),�Gustavson�and�others�(1982),�and�Johnson�(2018).�A�special�study�of�this�sinkhole�was�carried�out�by�the�U.S.�Army�Corps�of�Engineers� (USACE),� because� it�was� the� source� of�high-salinity� brine� (a� "ow� of� 127� L/sec� that� released�450�metric�tons�of�salt�per�day)�that�degraded�the�quality�of�water� in� the�Red�River� system� farther� downstream�(Galegar�and�DeGeer,�1969).
Figure�22.�Map�of�western�Oklahoma�and�north-centralTexas�showing�outcrops�of�Blaine�Formation,�four�gyp-sum�caves�and�one�spring�described�in�this�report,�andgeneral� strike� and�dip�of�Blaine� Formation� (modi!edfrom�Johnson,�2018).
the�roof;�and�3)�a�channel�section�at�the�end.�The�collapse�section�is�characterized�by�large�gypsum,�shale,�and�sel-enite� boulders� that� have� fallen� from� the� roof.�At� the�beginning� of� this� section,� the� Rotunda� (the� largest�room� in� the� cave)� extends� from� the�Flowerpot� Shale,�on� the�"oor,� all� the�way� through� the�Medicine�Lodge�Gypsum,�and�ends�at�the�base�of�the�Nescatunga�Gypsum�Bed.� In� the�middle� section,� the� ceiling� contains�many�domes,�and�at�the�land�surface�in�this�section�is�a�cluster�of�sinkholes�that�funnel�rainwater�down�into�the�cave.�In�the�channel�section,�the�roof,�walls,�and�"oor�of�the�cave�are�smooth�and�well-polished,�showing�how�abrasion�by�the�underground�stream�helped�form�the�cavern.
Selman�Cave.� The�Selman�Cave�System�(Fig.�22)�became�an�outdoor�living�laboratory�and�!eld�station�in�1998�when�about�130�ha�(325�acres)�of�land�was�acquired,�through� donation� and� purchase,� by� the� University� of�Central�Oklahoma�(UCO)�to�establish�the�Selman�Living�Laboratory� (SLL).� Located� in� northwest� Oklahoma,�about�16�km�southwest�of� the� town�of�Freedom,� it�has�been� used� for�UCO� classes� and� research� on� ecology,�mammalogy,� ornithology,� plant� taxonomy,� freshwater�biology,� entomology,�mycology,� and� herpetology.�The�website�for�the�SLL�is:�https://sites.uco.edu/cms/sll/
266 Kenneth S. Johnson

SCUBA�divers�determined�the�shape,�depth,�and�vol-ume�of� the� brine-!lled� cavity� (Fig.�27).�The� cavity� is�about�11,038�m3,�and�they�measured�the�cavity�to�a�depth�of�38�m,�where�they�reached�a�small,�unpassable�opening�about�0.6�by�0.9�m�wide;�beyond� this�point,� the�cavity�extends� to� an� unknown� size� and� depth� (Galegar� and�DeGeer,�1969).�Based�upon�my�own�studies�of�the�local�geology�around�Estelline�Spring,�carried�out�on�behalf�of�the�USACE,�I�believe�that�the�two�dolomite�units�in�the�cavity�(Fig.�27)�are�the�Hollis�Dolomite�(below)�and�the�Guthrie�Dolomite�(above).
To�stop� the�"ow�of�brine� from�Estelline�Spring,� the�USACE� built� an� impervious,� circular� dike� around� the�spring� in�1963.�The�dike,�104�m� in�diameter� and�3�m�high,� completely� suppressed� "ow� from� the� spring�when�water�within� the� dike� rose� and� imposed� a� head
Figure�23.�Gypsum�karst,�sinkholes,�and�caves�in�western�Oklahoma�and�north-central�Texas�(from�Johnson,�2018).A) Karst�in�Cloud�Chief�Gypsum�(Late�Guadalupian)�in�western�Oklahoma,�with�dissolution�most�pronounced�alongjoints�(vertical�here)�and�bedding�planes�(horizontal�here).�B)�Gypsum�sinkhole�in�Blaine�Formation,�southwest�Okla-homa.�C� ��D)�Dissolution�of� salt� and� gypsum� causes� collapse�block� (C)�and� tight� fold� (D)� in�Blaine� Formation�along�Prairie�Dog�Town�Fork�Red�River,Texas.�E)�Interior�of�D.C.�Jester�Cave�in�unit�1�of�the�Blaine�Formation,�GreerCounty,�Oklahoma.�F)� Interior�of�Cascade�Spring�Cave,�Blaine�Formation,� in�Greer�County,�Oklahoma.�Photos�Athrough�D�by�the�author;�E�and�F�by�John�and�Sue�Bozeman.
TABLE 1.—Number of recorded gypsum caves inBlaine Formation of western Oklahoma and north-central Texas. Oklahoma data provided by Sue andJohn Bozeman, Central Oklahoma Grotto, OklahomaCity, in July, 2015; Texas data from Texas Speleologi-cal Survey (2019 [list updated November 22, 2016]).
Permian Blaine and San Andres Formations of Western Oklahoma and Palo Duro Basin of Texas 267
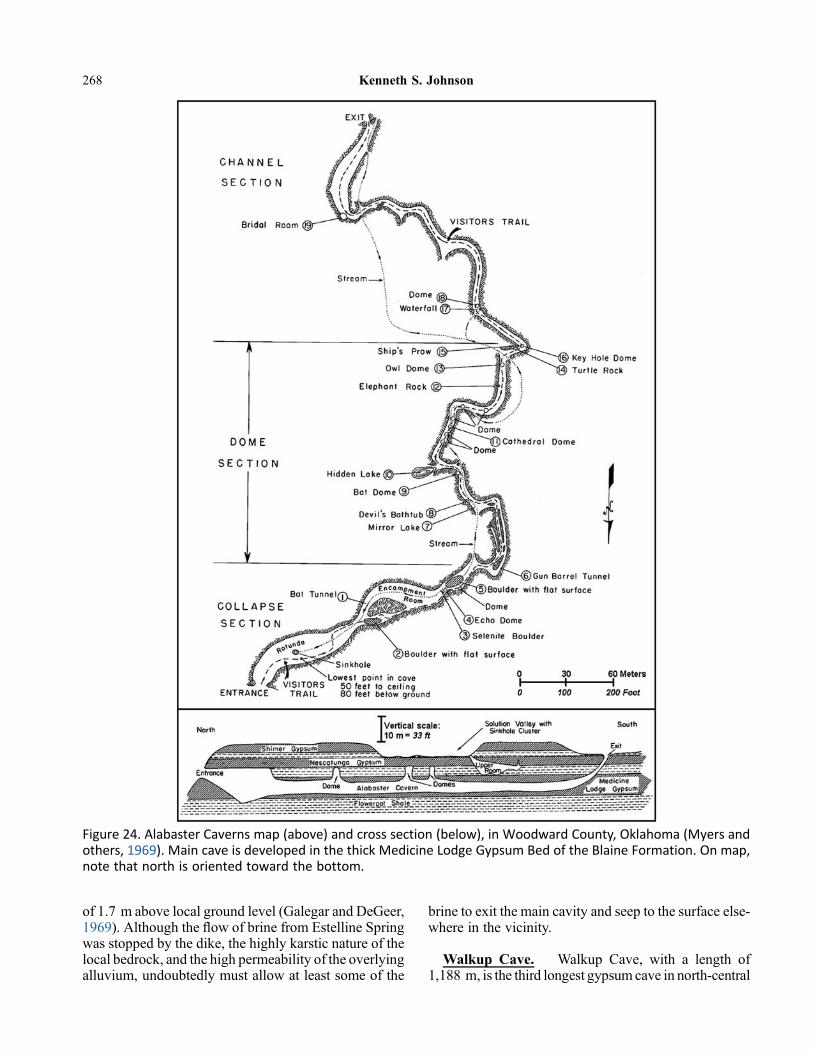
of 1.7 m above local ground level (Galegar and DeGeer,1969). Although the "ow of brine from Estelline Springwas stopped by the dike, the highly karstic nature of thelocal bedrock, and the high permeability of the overlyingalluvium, undoubtedly must allow at least some of the
brine to exit the main cavity and seep to the surface else-where in the vicinity.
Walkup Cave. Walkup Cave, with a length of1,188 m, is the third longest gypsum cave in north-central
Figure 24. Alabaster Caverns map (above) and cross section (below), in Woodward County, Oklahoma (Myers andothers, 1969). Main cave is developed in the thick Medicine Lodge Gypsum Bed of the Blaine Formation. On map,note that north is oriented toward the bottom.
268 Kenneth S. Johnson

Texas, and the 93rd longest gypsum cave in the world(Table 2). Good sources of information about WalkupCave are Reddell and Russell (1963), Brown (1987),and Elliott and Jorden (in Elliott and Veni, 1994,p. 211–212); these are summarized by Johnson(2018). Location of the cave is shown in Figure 22,and a map of the cave is shown in Figure 28.
Walkup�Cave� captures�water� from� a� stream� to� the�north,�and�funnels�it�to�the�south,�through�the�cave�sys-tem,�and�into�the�Pease�River.�Water�entering�the�Main�Entrance� travels� about� 110�m� and� reaches� Division�Room�(or�“Decision”�Room),�where�the�passage�divides:�the�right�branch� is�a�small�crawlway� leading�to�a�large�sink�with�multiple� entrances,� beyond�which� there� are�two� short� caves—Boulder� Passage� and� Short� Cave;�the� left� (main)� branch� from�Division�Room� starts� out�as� a� passage� that� is� 3–3.5� m� wide� and� 2–3� m�high,� and� it� continues� as� a� fairly� open� system� for� the�next�several�hundred�meters.�Near� the�south�end�of� the�cave,�it�makes�a�complex� loop� that�crosses�under� itself�(lower�left�part�of�Fig.�28);� the� loop,�about�90�m� long,�forms�the�Big�Room,�with�the�lower�part�of�the�loop�being�about�4�m�below�the�upper.
Blaine�Aquifer�in�Southwest�Oklahoma�andNorth-Central�Texas
Karstic�conditions�in�the�Blaine�Formation�make�it�an�aquifer�in�parts�of�southwest�Oklahoma�and�north-central�Texas.�Because�of�the�high�total�dissolved�solids�(TDS)�in�the�water,�it�is�unacceptable�as�drinking�water,�but�is�extensively�used�for�irrigation.�Discussions�of�the�Blaine�aquifer�in�parts�of�Harmon,�Jackson,�and�Greer�Counties�of�southwest�Oklahoma�are�by�Schoff�(1948),�Steele�and�Barclay�(1965),�Johnson�(1990b,�2003a,�2019b),�Runkle�and�McLean�(1995),�Runkle�and�others�(1997),�and�Os-born�and�Eckenstein�(1997).�In�southwest�Oklahoma,�the�Blaine�is�largely�"ushed�of�its�salt�(NaCl)�content,�and�it�provides� irrigation�water� for� cotton,�wheat,� and� other�crops� that� can� tolerate� a� moderate-to-high� calcium-sulfate�(CaSO4)�content.
Water� in� the�Blaine�aquifer� in�southwest�Oklahoma�has�a�TDS�generally�ranging�from�1,500�to�6,000�mg/L,
TABLE 2.—Gypsum caves in the Blaine Formation ofwestern Oklahoma and north-central Texas that areamong the longest caves in the world (from Bob Gul-den, www.caverbob.com “world [sic] longest gypsumcaves” compiled July 01, 2019).
Figure 25. D.C. Jester Cave, Greer County, Oklahoma. Schematic cross section shows that cave is developed in gyp-sum bed 1 of the Van Vacter Member of the Blaine Formation (after Bozeman, 1987; Johnson, 1990b).
Permian Blaine and San Andres Formations of Western Oklahoma and Palo Duro Basin of Texas 269

salt is still present in theBlaine Formation and associatedstrata in parts of this area (Fig. 21), the produced ground-water is suitable mainly for salt-tolerant crops, livestock,and selected industrial use: the salt content of waters inthe Blaine is discussed by Richter and Kreitler (1986).TDS exceeds drinking-water standards in 97% of sam-ples tested by Hopkins and Muller (2011), and themedian TDS concentration of all samples is 2,835 mg/L.Although the median TDS here is lower than in south-west Oklahoma, the relatively higher salt content meansthat this water is generally classi!ed as slightly saline:the salt content is the main factor limiting use of thewater. Karstic conditions exist in the “Blaine of Texas”all the way from Wheeler County on the north to FisherCounty on the south (Hopkins and Muller, 2011), a dis-tance of about 120 km. However, almost all the waterpumped from the Blaine aquifer in north-central Texas(about 98%) comes from wells in only four counties inthe northern part of the aquifer: Childress, Collings-worth, Hardeman, and Cottle Counties (see Fig. 22 forlocation of two of these counties).
Figure�26.�D.C.� Jester�Cave,�Greer�County,�Oklahoma.Simpli!ed�map�shows�surveyed�passages�and�main�en-trances�(after�Bozeman,�1987;�Johnson,�1990b).
and�averaging�about�3,100�mg/L�(Johnson,�2019b),�and�only� at� a� few� places� are� chloride� concentrations� high�enough�to�damage�crops.�Permeability�in�the�aquifer�is�attained�by�extensive�dissolution�and�porosity� in�some�of� the�dolomite�beds,� as�well� as� cavernous� conditions�in�some�of�the�gypsum�beds.�Irrigation�wells,�in�an�area�of� about�2,500�km2,� typically� are�15–100�m�deep� and�commonly� yield� 1,000–8,000� L/min.� Because� of� the�importance� of� this� aquifer� in� the� area,� a� recharge-demonstration�project�was�carried�out�to�show�the�feasi-bility�and�effectiveness�of�recharging�the�Blaine�aquifer�with� surface� runoff� (Osborn� and� Eckenstein,� 1997).�Recharge�was�accomplished�by�intercepting�surface�run-off� and� channeling� that�water,� by� gravity� "ow,� down�wells�or�sinkholes,�and�into�cavities�in�the�aquifer.
The�Blaine� aquifer� in�north-central�Texas� has�been�described�by�Runkle�and�McLean� (1995),�Runkle�and�others�(1997),�and�Hopkins�and�Muller�(2011).�Because
Figure 27. Cross section of brine-!lled cave beneath Es-telline Spring, Hall County, Texas: based upon divers us-ing SCUBA gear (after Galegar and DeGeer, 1969). Atdepth of 38 m, cave diameter is less than 1 m; totaldepth unknown.
270 Kenneth S. Johnson

In�the�early�1990s,�the�U.S.�Army�Corps�of�Engineers,�Oklahoma�Water�Resources�Board,�and�citizens�of�Man-gum�launched�a�!nal�investigation.�In�1999,�I�was�asked�to�evaluate�the�geologic/karst�data,�based�on�all�previous�data�and�the�results�of�coring�and�pressure�testing�of�!ve�new� boreholes� (each� 40–60�m� deep)� drilled� along� the�proposed�dam� alignment� in�1995� and� 1999� (Fig.�29).�This� !nal� assessment� (Johnson,� 2003b)� showed� that�open� cavities,� clay-!lled� cavities,� and� other� karst� fea-tures�are�abundant� in�and�near� the�abutments,�and� that�"uid�losses�(in�each�3-m�interval�that�was�pressure�tested)�ranged�from�60� to�250�L/min� in�most�tests,�and�in�one�borehole�the�losses�were�1,600–5,300�L/min.�The�!nal�borehole,�BH-1-99,�was�drilled� in� the�stream�valley:� it�encountered�cavities�and�vugs�in�each�of�each�of�the�gyp-sum�and�dolomite�beds,�and�the�drill�rig�lost�circulation�from� a� depth� of� 7.5�m� to� the� bottom� of� the� hole—indicating� the�presence� of� one� or� several� cavities� that�could� accept� a� large� amount� of�water.� BH-1-99� then�drilled�into�a�0.6-m-high�cavity�at�the�top�of�the�Flower-pot�salt,�and,�at�a�depth�of�39�m,�entered�an�artesian�zone�that�caused�salt�water�to�"ow�up�through�the�borehole�to�the�land�surface�(Johnson,�2003b).
As�a�result�of�this�!nal�set�of�studies,� it�was�recom-mended� to�abandon� the�Upper�Mangum�Damsite,�and
Gypsum-Karst�Problems�in�Siting�of�Upper�Mangum�DamEngineering-geology�assessment�of�the�initially�pro-posed�Upper�Mangum�Damsite�in�an�area�of�gypsum�karst�in�the�Blaine�Formation�in�Greer�County,�southwest�Oklahoma,�showed�that�the�site�is�unsuitable�and�should�be�abandoned�(Johnson,�2003b,�2008).�This�damsite,�about�14�km�west�of�Mangum�on�the�Salt�Fork�Red�River�(Fig.�29),�had�been�investigated�and�evaluated�by�the�U.S.�Bureau�of�Reclamation�since�1937,�in�hopes�of�providing�water�for�irrigation,�"ood�control,�and�recreation.�The�Blaine�Formation�here�is�about�60�m�of�gypsum,�with�thin�interbeds�of�dolomite�and�shale:�nearby�outcrops�show�abundant�karst�features,�such�as�caves,�sinkholes�(Fig.�23B),�disappearing�streams,�and�springs.�Extensive�karst�features�in�the�area�should�have�terminated�the�project�early�on,�but�the�topography�was�so�attractive�along�this�stretch�of�Salt�Fork�Red�River:�both�proposed�abutments�are�high�and�form�a�narrow�water�gap�between�them,�and�thus,�the�size�(length)�of�the�dam�would�be�quite�small.�In�all�early�studies,�it�was�realized�that�karstic�foundation�conditions�were�marginal,�at�best,�but�it�was�always�hoped�that�an�engineering�solution�could�be�found�to�resolve�these�problems.
Permian Blaine and San Andres Formations of Western Oklahoma and Palo Duro Basin of Texas 271
Figure�����8BMLVQ�$BWF �)BSEFNBO�$PVOUZ �5FYBT �TIPXJOH�GMPPS�QMBO�BGUFS�5FYBT�4QFMFPMPHJDBM�4VSWFZ �VOQVCMJTIFE�EBUB.

seek�a�more�suitable�site�farther�east�on�Salt�Fork�Red�River,�where�bedrock�for�the�dam�and�the�impoundment�area�would�be�completed� in� the�underlying�Flowerpot�Shale� (Johnson,� 2003c).� The� newly� proposed� Lower�Mangum�Damsite� is� just�3�km� southwest�of�Mangum:�it�is�outside�of�the�area�of�gypsum�karst�in�the�Blaine�For-mation,�and�is�beyond�(east�of)�the�dissolution�limits�of�the�Flowerpot�salt.
REFERENCES�CITEDBecker,�C.M.,�1930,�Structure�and�stratigraphy�of�south-western Oklahoma: American Association of Petro-leum Geologists, Bulletin, Vol. 14, p.47-55.
Bozeman, J., 2003, Exploration of western Oklahomagypsum caves, in K.S. Johnson and J.T. Neal, eds.,Evaporite karst and engineering/environmental prob-lems in the United States: Oklahoma Geological
Survey Circular 109, p. 57-64. http://ogs.ou.edu/docs/circulars/C109.pdf
Bozeman, S. (ed.), 1987, The D.C. Jester Cave System:Central Oklahoma Grotto, Oklahoma City, OklahomaUnderground, Vol. 14, 56 p.
Bozeman, S. (ed.), 2002, The Selman Cave System:Central OklahomaGrotto, OklahomaCity,Oklahoma,Oklahoma Underground, Vol. 20, 44 p.
Bozeman, J, and Bozeman, S., 2002, Speleology of gyp-sum caves in Oklahoma: Carbonates and Evaporites,Vol. 17, No. 2, p. 107-113.
Brown,K., 1987.WalkupCave revisited.TheTexasCaver,Vol. 32, No. 4, p. 76-79, 85. http://www.karstportal.org/FileStorage/Texas_Caver/1987-v32-n04.pdf
Brown, O.E., 1937, Unconformity at base ofWhitehorseformation, Oklahoma: American Association ofPetroleumGeologists, Bulletin, Vol. 21, p.1534-1553.
Figure 29. Schematic cross section along alignment of proposed Upper Mangum Dam, looking downstream(Johnson, 2003b). Although the topography was favorable at the site, extensive karst features (interpretive caves,cavities, !ssures, and sinkholes shown here) in gypsum, dolomite, and salt led to its abandonment.
272 Kenneth S. Johnson

Central OklahomaGrotto, 1985, The Caves of AlabasterCaverns State Park: Central Oklahoma Grotto, Okla-homa City, Oklahoma Underground, Vol. 12, 23 p.
Christenson, S, Hayes, C., Hancock, E., andMcLean, J.,2003, Correlating the location of a cave passage ingypsum karst to a highway right-of-way using acave radio: in K.S. Johnson and J.T. Neal, eds., Evap-orite karst and engineering/environmental problems inthe United States: Oklahoma Geological Survey Cir-cular 109, p. 65-70. http://ogs.ou.edu/docs/circulars/C109.pdf
Collins, E.W., 1984, Styles of deformation in PermianStrata, Texas Panhandle: The University of Texas atAustin, Bureau of EconomicGeology,Geological Cir-cular 84–4, 32 p.
Elliott, W.R., and Veni, G., eds., 1994, The Caves andKarst of Texas: AGuidebook for the 1994 Conventionof the National Speleological Society with Emphasison the South-Western Edwards Plateau: Huntsville,Alabama, National Speleological Society, 342 p.
Fay, R.O., 1964, The Blaine and related formations ofnorthwestern Oklahoma and southern Kansas: Okla-homa Geological Survey, Bulletin 98, 238 p. http://ogs.ou.edu/docs/bulletins/B98.pdf
Fay, R.O., 2010, Preliminary geologic map of the FossReservoir 30’ X 60’ quadrangle, Beckham, Custer,Dewey, Ellis, and Roger Mills Counties, Oklahoma:Oklahoma Geological Survey, Oklahoma GeologicalQuadrangle Map OGQ–78A. Scale 1:100,000.http://ogs.ou.edu/docs/OGQ/OGQ-78A-color.pdf
Fay, R.O.; Ham, W.E.; Bado, J.T.; and Jordan, L., 1962,Geology and mineral resources of Blaine County,Oklahoma: Oklahoma Geological Survey, Bulletin89, 252 p. http://ogs.ou.edu/docs/bulletins/B89.pdf
Fracasso, M.A., and Hovorka, S.D., 1986, Cyclicity inthe Middle Permian San Andres Formation, PaloDuro Basin, Texas Panhandle: The University ofTexas at Austin, Bureau of EconomicGeology, Reportof Investigations No. 156, 48 p.
Galegar, W.C., and DeGeer, M.W., 1969, Measuringsubsurface spring "ow with radiotracers: Proceedingsof the American Society of Civil Engineers, Vol.95,No. SA6, p. 1097-1103.
Goldstein, A.G., and Collins, 1984, Deformation ofPermian strata overlying a zone of salt dissolutionand collapse in the Texas Panhandle: Geology, Vol.12, No. 5, p. 314-317.
Gould, C.N., 1902,General geology ofOklahoma:Okla-homa Department of Geology and Natural History,Biennial Report No. 2, p. 17–74
Gould, C.N., 1905, Geology and water resources ofOklahoma: U.S. Geological Survey, Water SupplyPaper 148, p. 39–71.
Gould, C.N., 1924, A new classi!cation of the Permianredbeds of southwestern Oklahoma: American Asso-ciation of Petroleum Geologists, Bulletin, Vol. 8,p. 322-341.
Gustavson, T.C., 1979, Salt dissolution, in Dutton, A.P.,and others, 1979, Geology and geohydrology of thePalo Duro Basin, Texas Panhandle: The Universityof Texas at Austin, Bureau of Economic Geology,Geological Circular 79–3, p. 87-93.
Gustavson, T.C., 1980, Rates of salt dissolution, inGus-tavson, T.C., and others, 1980, Geology and geohy-drology of the Palo Duro Basin, Texas Panhandle:The University of Texas at Austin, Bureau ofEconomic Geology, Geological Circular 80–7,p. 71–75.
Gustavson, T.C., 1982, Structural control of major drain-age elements surrounding the Southern High Plains,in Gustavson, T.C., and others, 1982, Geology andgeohydrology of the Palo Duro Basin, Texas Panhan-dle: The University of Texas at Austin, Bureau ofEconomic Geology, Geological Circular 82–7,p. 176–182.
Gustavson, T.C., 1986a, Geomorphic development of theCanadian River Valley, Texas Panhandle: an exampleof regional salt dissolution and subsidence: GeologicalSociety of America, Bulletin, Vol. 97, p. 459-472.
Gustavson, T.C., ed., 1986b, Geomorphology and Qua-ternary stratigraphy of the Rolling Plains, Texas Pan-handle: The University of Texas at Austin, Bureau ofEconomic Geology, Guidebook 22, 97p.
Gustavson, T.C., and Finley, R.J., 1985, Late Cenozoicgeomorphic evolution of the Texas Panhandle andnortheast New Mexico—Case studies of structuralcontrols on regional drainage development: TheUniversity of Texas at Austin, Bureau of EconomicGeology, Report of Investigations No. 148, 42 p.
Gustavson, T.C., Finley, R.J., and Baumgardner, R.W.,Jr., 1980a, Preliminary rates of slope retreat and saltdissolution along the eastern Caprock Escarpmentof the Southern High Plains and in the Canadian RiverValley, inGustavson, T.C., and others, 1980, Geologyand geohydrology of the Palo Duro Basin, Texas Pan-handle: The University of Texas at Austin, Bureau ofEconomic Geology, Geological Circular 80–7,p. 76-82.
Gustavson, T.C., Finley, R.J., and McGillis, K.A.,1980b, Regional dissolution of Permian salt in theAnadarko, Dalhart, and Palo Duro Basins of the TexasPanhandle: The University of Texas at Austin, Bureauof Economic Geology, Report of Investigations No.106, 40 p.
Gustavson, T.C., Simpkins, W.W., Alhades, A., andHoadley, A., 1982, Evaporite dissolution and
Permian Blaine and San Andres Formations of Western Oklahoma and Palo Duro Basin of Texas 273

development of karst features on the Rolling Plains ofthe Texas Panhandle: Earth Surface Processes andLandforms, Vol. 7, p. 545-563.
Hentz, T.F., and Brown, L.F., Jr., 1987, Geologic atlas ofTexas, Wichita Falls–Lawton sheet: The University ofTexas at Austin, Bureau of Economic Geology, scale1:250,000.
Hopkins, J., and Muller, C., 2011, Water quality in theBlaine Aquifer: Texas Water Development Board,Report 376, 40 p. http://www.twdb.texas.gov/publications/reports/numbered_reports/doc/R376_Blaine.pdf
Hovorka, S.D., 1990, Sedimentary processes controllinghalite deposition, Permian Basin, Texas: unpublishedPh.D. Dissertation, The University of Texas at Austin,393 p.
Hovorka, S.D., and Granger, P.A., 1988, Subsurface tosurface correlation of Permian evaporites—San An-dres–Blaine–Flowerpot relationships, Texas Panhan-dle, in W.A. Morgan and J. A. Babcock, eds.,Permian rocks of the Midcontinent: MidcontinentSEPM, Special Publication No. 1, p. 137-159.
Johnson, K.S., 1963, Salt in the El Reno Group (Perm-ian), Elk City area, Beckham and Washita Counties,Oklahoma: University of Oklahoma, Biennial Geo-logical Symposium, 8th, Proceedings, p. 79–92.https://www.researchgate.net/publication/306374740
Johnson, K.S., 1967, Stratigraphy of the Permian BlaineFormation and associated strata in southwestern Okla-homa: unpublished Ph.D. Dissertation, University ofIllinois, 247 p.
Johnson, K.S., 1976, Evaluation of Permian salt depositsin the Texas Panhandle and western Oklahoma forunderground storage of radioactive wastes: unpub-lished report submitted to UnionCarbide Corporation,Oak RidgeNational Laboratories, Of!ce ofWaste Iso-lation,Y/OWI/Sub–4494/1, 73 p.Also available from:Oklahoma Geological Survey, Open-File Report 19–2018. http://www.ou.edu/content/dam/ogs/documents/data/OF19-2018.pdf
Johnson, K.S., 1981, Dissolution of salt on the east "ankof the PermianBasin in the southwesternU.S.A.: Jour-nal ofHydrology,Vol. 54, p. 75-93. https://www.researchgate.net/publication/245098253
Johnson, K.S., 1989, Geology of Jester Cave: NSSNews, National Speleological Society, Huntsville,AL, Vol. 47, No. 1, p. 11-17. https://www.researchgate.net/publication/307970029
Johnson, K.S., 1990a, Standard outcrop section of theBlaine Formation and associated strata in southwesternOklahoma: Oklahoma Geological Survey, OklahomaGeology Notes, Vol. 50, p. 144-168. http://www.ogs.ou.edu/pubsscanned/NOTES/GN-V50N5.pdf
Johnson, K.S., 1990b, Hydrogeology and karst ofthe Blaine gypsum–dolomite aquifer, SouthwesternOklahoma: Oklahoma Geological Survey SpecialPublication 90–5, 31 p. http://ogs.ou.edu/docs/specialpublications/SP90-5.pdf
Johnson, K.S., 1996, Gypsum karst in the United States:International Journal of Speleology, Vol. 25, No. 3–4,p. 183-193. !le:///C:/Users/ksjoh/Downloads/GypsumkarstintheUnitedStates.pdf
Johnson, K.S., 2003a, Evaporite karst in the PermianBlaine Formation and associated strata of westernOklahoma, in K.S. Johnson and J.T. Neal, eds., Evap-orite karst and engineering/environmental problems inthe United States: Oklahoma Geological Survey, Cir-cular 109, p. 41-55. http://ogs.ou.edu/docs/circulars/C109.pdf
Johnson, K.S., 2003b, Gypsum karst and abandonmentof the Upper Mangum Damsite in southwestern Okla-homa, in K.S. Johnson and J.T. Neal, eds., Evaporitekarst and engineering/environmental problems in theUnited States: Oklahoma Geological Survey Circular109, p. 85-94. http://ogs.ou.edu/docs/circulars/C109.pdf
Johnson, K.S., 2003c, Gypsum karst as a major factor inthe design of the proposed Lower Mangum Dam insouthwestern Oklahoma, in K.S. Johnson and J.T.Neal, eds., Evaporite karst and engineering/environ-mental problems in the United States: OklahomaGeological Survey Circular 109, p. 95-111. http://ogs.ou.edu/docs/circulars/C109.pdf
Johnson, K.S., 2008, Gypsum-karst problems in con-structing dams in the USA: Environmental Geology,Vol. 53, No. 5, p. 945-950. https://www.researchgate.net/publication/226513928
Johnson, K.S., 2011, Alabaster Caverns State Park:Oklahoma City Geological Society, Shale Shaker,Vol. 62, No. 2, p. 108-112. https://www.researchgate.net/publication/306373810
Johnson, K.S., 2013, Salt karst and collapse structures inthe Anadarko Basin of Oklahoma and Texas, in L.Land, D.H. Doctor, and J.B. Stephenson, eds., Sink-holes and the engineering and environmental impactsof karst–Proceedings of the thirteenth multidisciplin-ary conference, Carlsbad, NM, May 6 through 10,2013: National Cave and Karst Research Institute,Carlsbad, NM, p. 103-112. http://scholarcommons.usf.edu/cgi/viewcontent.cgi?article=1118&context=sinkhole_2013
Johnson, K.S., 2017, Evaporite karst and collapse brec-cia in Permian strata, Canton Lake Dam, BlaineCounty, Oklahoma: Oklahoma Geological Survey,Oklahoma Geology Notes, Vol. 76, No. 3, p. 5-18.http://ogs.ou.edu/docs/geologynotes/GN-V76N3.pdf
274 Kenneth S. Johnson

Johnson, K.S., 2018, Gypsum caves of north Texas andwestern Oklahoma, in Stafford, K.W., and Veni, G.,eds., Hypogene karst of Texas: Texas SpeleologicalSurvey, Monograph 3, p. 111-122. https://www.texasspeleologicalsurvey.org/PDF/Hypogene_Karst_of_Texas.pdf
Johnson, K.S., 2019a, Salt in Permian Flowerpot,Blaine, and Dog Creek Formations is dissolved to cre-ate salt plains in Childress, Hall, Cottle, and MotleyCounties, Texas, and northern Harmon County, Okla-homa: Oklahoma Geological Survey, Open-FileReport OF1–2019, 34 p. http://www.ou.edu/content/dam/ogs/documents/data/OF1-2019.pdf
Johnson, K.S., 2019b, Blaine aquifer in the Hollis Basinof southwest Oklahoma: structure-contour map andstratigraphic/hydrologic data: Oklahoma GeologicalSurvey, Geologic Map GM-45, scale 1:125,000.http://ou.edu/content/dam/ogs/documents/GMs/GM-45%20map.pdf
Johnson, K.S., 2019c, Geology of salt plains on the Ci-marron River in northwest Oklahoma: Big Salt Plain,Little Salt Plain, Salt Creek Canyon, and Okeene SaltPlain: Oklahoma Geological Survey, Open-FileReport OF2–2019, 50 p. http://www.ou.edu/content/dam/ogs/documents/data/OF2-2019.pdf
Johnson, K.S., 2019d, Geologic studies, natural-brineemissions, and hourglass-selenite crystals at GreatSalt Plains on Salt Fork Arkansas River, NorthwestOklahoma: Oklahoma Geological Survey, Open-FileReport OF3–2019, 29 p. http://www.ou.edu/content/dam/ogs/documents/data/OF3-2019.pdf
Johnson, K.S., 2021, Overview of evaporite karst in theGreater Permian Evaporite Basin (GPEB) of TX, NM,OK, KS, and CO, in Johnson, K.S., Land, L.A., andDecker, D.D., eds., Evaporite karst in the GreaterPermianEvaporite Basin (GPEB) of Texas, NewMex-ico, Oklahoma, Kansas, and Colorado: OklahomaGeological Survey, Circular 113.
Johnson, K.S., and Gonzales, S., 1978, Salt deposits inthe United States and regional characteristics impor-tant for storage of radioactive waste: prepared forUnion Carbide Corp., Nuclear Division, Oak RidgeNational Laboratory, Of!ce of Waste Isolation,Y/OWI/SUB-7414/1, 188 p. Also available from:Oklahoma Geological Survey, Open-File Report 18–2018. http://www.ou.edu/content/dam/ogs/documents/data/OF18-2018.pdf
Johnson, K.S., Stanley, T.M., and Miller, G.W., 2003,Geologic map of the Elk City 30’ X 60’ quadrangle,Beckham, Custer, Greer, Harmon, Kiowa, RogerMills, and Washita Counties, Oklahoma: OklahomaGeological Survey,OklahomaGeological QuadrangleMap OGQ–44. Scale 1:100,000. http://ogs.ou.edu/docs/OGQ/OGQ-44-color.pdf
Jones, J.O., 1971, The Blaine Formation of North Texas:unpublished Ph.D. Dissertation, University of Iowa,173 p.
Jordan, L, 1959, Underground storage in salt, Elk CityField: OklahomaGeological Survey, OklahomaGeol-ogy Notes, Vol. 19, No. 2, p. 32-34. http://ogs.ou.edu/docs/geologynotes/GN-V19N2.pdf
Jordan, L.; and Vosburg, D.L., 1963, Permian salt andassociated evaporites in the Anadarko Basin of thewestern Oklahoma–Texas Panhandle region: Okla-homa Geological Survey, Bulletin 102, 76 p. http://ogs.ou.edu/docs/bulletins/B102.pdf
Looney, J., 2011, The history of Oklahoma caves: Amer-ican Spelean History Association, The Journal of Spe-leanHistory, Vol. 45, No. 1, p. 10-25. http://caves.org/section/asha/issues/139.pdf
McGookey, D.A., Gustavson, T.C., and Hoadley, A.D.,1988, Regional structural cross sections, mid-Permianto Quaternary strata, Texas Panhandle and easternNew Mexico: Distribution of evaporites and areas ofevaporite dissolution and collapse: The Universityof Texas at Austin, Bureau of Economic Geology,Cross Sections, CS0008, 17 p., 12 cross sections.
Martinez, J.D., Johnson, K.S., andNeal, J.T. 1998, Sink-holes in evaporite rocks: American Scientist, Vol. 86,No. 1 (January–February), p. 38-51. https://www.researchgate.net/publication/250968543
McGowen, J.H., 1981, Depositional sequences andassociated sedimentary diagenetic facies: an ongoinginvestigation of salt-bearing core, Swisher County,Texas, in Gustavson, T.C., and others, 1981, Geologyand geohydrology of the Palo Duro Basin, Texas Pan-handle: The University of Texas at Austin, Bureau ofEconomic Geology, Geological Circular 81–3, p. 90-92 and plate 1.
McGregor, D.R., Pendery, E.C., and McGregor, D.L.,1963, Solution caves in gypsum, north-central Texas:Journal of Geology, Vol. 71, p. 108-115.
Miller, G., Dewers, T., and Tarhule, A., 2003, Laser posi-tioning and three-dimensional digital mapping of gyp-sum karst, western Oklahoma: in K.S. Johnson andJ.T. Neal, eds., Evaporite karst and engineering/envi-ronmental problems in the United States: OklahomaGeological Survey Circular 109, p. 71-75. http://ogs.ou.edu/docs/circulars/C109.pdf
Moussavi-Harami, R., 1977, Areal geology of Cordellarea, central Washita County, Oklahoma: unpublishedMS Thesis, University of Oklahoma, 76 p.
Myers, A.J., Gibson, A.M., Glass, B.P., and Patrick,C.R., 1969,Guide toAlabaster Cavern andWoodwardCounty, Oklahoma: Oklahoma Geological Survey,Guidebook 15, 38 p. http://ogs.ou.edu/docs/guidebooks/GB15.pdf
Permian Blaine and San Andres Formations of Western Oklahoma and Palo Duro Basin of Texas 275
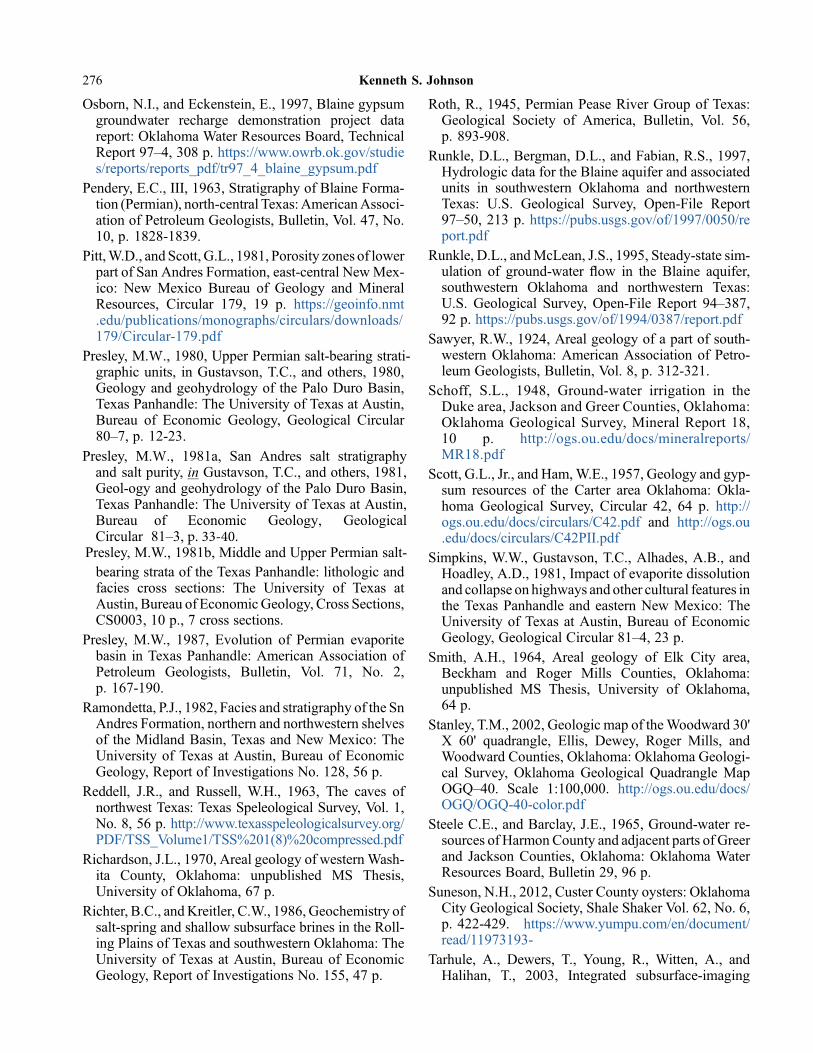
Osborn, N.I., and Eckenstein, E., 1997, Blaine gypsumgroundwater recharge demonstration project datareport: Oklahoma Water Resources Board, TechnicalReport 97–4, 308 p. https://www.owrb.ok.gov/studies/reports/reports_pdf/tr97_4_blaine_gypsum.pdf
Pendery, E.C., III, 1963, Stratigraphy of Blaine Forma-tion (Permian), north-central Texas:AmericanAssoci-ation of Petroleum Geologists, Bulletin, Vol. 47, No.10, p. 1828-1839.
Pitt,W.D., and Scott, G.L., 1981, Porosity zones of lowerpart of San Andres Formation, east-central NewMex-ico: New Mexico Bureau of Geology and MineralResources, Circular 179, 19 p. https://geoinfo.nmt.edu/publications/monographs/circulars/downloads/179/Circular-179.pdf
Presley,�M.8.,�1980,�Upper�Permian�salt-bearing�strati-graphic units, in Gustavson, T.C., and others, 1980,Geology and geohydrology of the Palo Duro Basin,Texas Panhandle: The University of Texas at Austin,Bureau of Economic Geology, Geological Circular80–7, p. 12-23.
Presley,� M.8.,� 1981a,� San� Andres� salt� stratigraphy�and� salt�purity,�in�Gustavson,�T.C.,�and�others,�1981,�Geol-ogy�and�geohydrology�of� the�Palo�Duro�Basin,�Texas�Panhandle:�The�University�of�Texas�at�Austin,�Bureau� of� Economic� Geology,� Geological�Circular� 81–3,�Q��������
�Presley,�M.W.,�1981b,�Middle�and�Upper�Permian�salt-bearing strata of the Texas Panhandle: lithologic andfacies cross sections: The University of Texas atAustin, Bureau of EconomicGeology, Cross Sections,CS0003, 10 p., 7 cross sections.
Presley, M.W., 1987, Evolution of Permian evaporitebasin in Texas Panhandle: American Association ofPetroleum Geologists, Bulletin, Vol. 71, No. 2,p. 167-190.
Ramondetta, P.J., 1982, Facies and stratigraphy of the SnAndres Formation, northern and northwestern shelvesof the Midland Basin, Texas and New Mexico: TheUniversity of Texas at Austin, Bureau of EconomicGeology, Report of Investigations No. 128, 56 p.
Reddell, J.R., and Russell, W.H., 1963, The caves ofnorthwest Texas: Texas Speleological Survey, Vol. 1,No. 8, 56 p. http://www.texasspeleologicalsurvey.org/PDF/TSS_Volume1/TSS%201(8)%20compressed.pdf
Richardson, J.L., 1970, Areal geology of western Wash-ita County, Oklahoma: unpublished MS Thesis,University of Oklahoma, 67 p.
Richter, B.C., andKreitler, C.W., 1986, Geochemistry ofsalt-spring and shallow subsurface brines in the Roll-ing Plains of Texas and southwestern Oklahoma: TheUniversity of Texas at Austin, Bureau of EconomicGeology, Report of Investigations No. 155, 47 p.
Roth, R., 1945, Permian Pease River Group of Texas:Geological Society of America, Bulletin, Vol. 56,p. 893-908.
Runkle, D.L., Bergman, D.L., and Fabian, R.S., 1997,Hydrologic data for the Blaine aquifer and associatedunits in southwestern Oklahoma and northwesternTexas: U.S. Geological Survey, Open-File Report97–50, 213 p. https://pubs.usgs.gov/of/1997/0050/report.pdf
Runkle, D.L., andMcLean, J.S., 1995, Steady-state sim-ulation of ground-water "ow in the Blaine aquifer,southwestern Oklahoma and northwestern Texas:U.S. Geological Survey, Open-File Report 94–387,92 p. https://pubs.usgs.gov/of/1994/0387/report.pdf
Sawyer, R.W., 1924, Areal geology of a part of south-western Oklahoma: American Association of Petro-leum Geologists, Bulletin, Vol. 8, p. 312-321.
Schoff, S.L., 1948, Ground-water irrigation in theDuke area, Jackson and Greer Counties, Oklahoma:Oklahoma Geological Survey, Mineral Report 18,10 p. http://ogs.ou.edu/docs/mineralreports/MR18.pdf
Scott, G.L., Jr., and Ham,W.E., 1957, Geology and gyp-sum resources of the Carter area Oklahoma: Okla-homa Geological Survey, Circular 42, 64 p. http://ogs.ou.edu/docs/circulars/C42.pdf and http://ogs.ou.edu/docs/circulars/C42PII.pdf
Simpkins, W.W., Gustavson, T.C., Alhades, A.B., andHoadley, A.D., 1981, Impact of evaporite dissolutionand collapse on highways and other cultural features inthe Texas Panhandle and eastern New Mexico: TheUniversity of Texas at Austin, Bureau of EconomicGeology, Geological Circular 81–4, 23 p.
Smith, A.H., 1964, Areal geology of Elk City area,Beckham and Roger Mills Counties, Oklahoma:unpublished MS Thesis, University of Oklahoma,64 p.
Stanley, T.M., 2002, Geologic map of theWoodward 30'X 60' quadrangle, Ellis, Dewey, Roger Mills, andWoodward Counties, Oklahoma: Oklahoma Geologi-cal Survey, Oklahoma Geological Quadrangle MapOGQ–40. Scale 1:100,000. http://ogs.ou.edu/docs/OGQ/OGQ-40-color.pdf
Steele C.E., and Barclay, J.E., 1965, Ground-water re-sources of Harmon County and adjacent parts of Greerand Jackson Counties, Oklahoma: Oklahoma WaterResources Board, Bulletin 29, 96 p.
Suneson, N.H., 2012, Custer County oysters: OklahomaCity Geological Society, Shale Shaker Vol. 62, No. 6,p. 422-429. https://www.yumpu.com/en/document/read/11973193-
Tarhule, A., Dewers, T., Young, R., Witten, A., andHalihan, T., 2003, Integrated subsurface-imaging
276 Kenneth S. Johnson
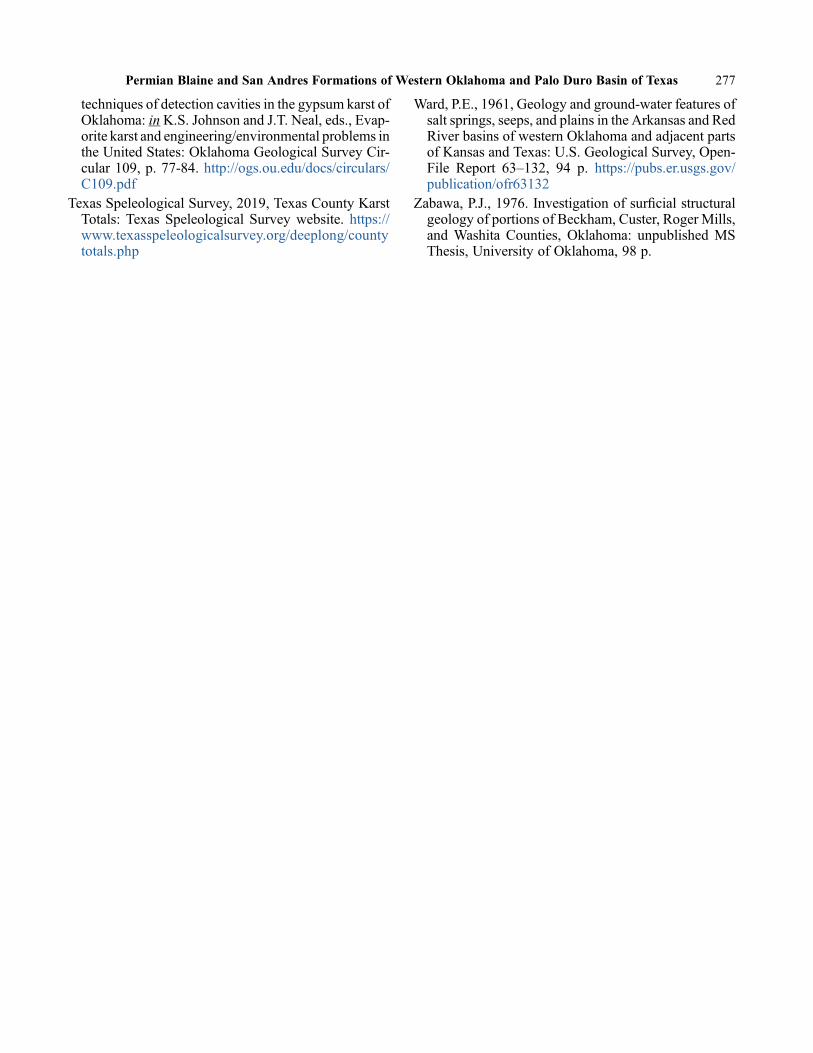
techniques of detection cavities in the gypsum karst ofOklahoma: inK.S. Johnson and J.T. Neal, eds., Evap-orite karst and engineering/environmental problems inthe United States: Oklahoma Geological Survey Cir-cular 109, p. 77-84. http://ogs.ou.edu/docs/circulars/C109.pdf
Texas Speleological Survey, 2019, Texas County KarstTotals: Texas Speleological Survey website. https://www.texasspeleologicalsurvey.org/deeplong/countytotals.php
Ward, P.E., 1961, Geology and ground-water features ofsalt springs, seeps, and plains in the Arkansas and RedRiver basins of western Oklahoma and adjacent partsof Kansas and Texas: U.S. Geological Survey, Open-File Report 63–132, 94 p. https://pubs.er.usgs.gov/publication/ofr63132
Zabawa, P.J., 1976. Investigation of sur!cial structuralgeology of portions of Beckham, Custer, Roger Mills,and Washita Counties, Oklahoma: unpublished MSThesis, University of Oklahoma, 98 p.
Permian Blaine and San Andres Formations of Western Oklahoma and Palo Duro Basin of Texas 277


ABSTRACT.—Two�notable�sinkholes�have�formed� in� the�past�63�yr�because�of�gypsum�karst� in� the�Permian�Blaine�Formation�of�western�Oklahoma.�The�Delhi�Sinkhole,� located� in�Beckham�County,� southwest�Oklahoma,� formed� in� 2011:� it�was�originally�12�m�wide�and�12�m�deep�and�eventually�reached�a�diameter�of�18�m. The�Watonga�Sinkhole,�located�in�Blaine�County,�northwest�Oklahoma,�formedin�1957:�it�reached�a�diameter�of�14�m�and�a�depth�of�5.2�m.�Both�sinkholes�formedin� open�!elds�where� about� 15� to� 30�m� of�Quaternary� terrace� deposits� and� dunesands� overlie� the� gypsum� beds.� The� Blaine� Formation� consists� of� multiplegypsum�beds,� about�3� to�6�m� thick,� interbedded�with� shale�beds,�1–10�m� thick,and�thin�dolomites.�Total�thickness�of�the�formation�is�about�60�m�in�the�southwestpart�of� the�State�and�about�30�m� in� the�northwest.
INTRODUCTION
Permian� gypsum� crops� out� extensively� in� western�Oklahoma,�and�locally,�the�gypsum�contains�sinkholes,�caves,�disappearing�streams,�and�other�typical�karst�fea-tures.�The�most�extensive�of�these�gypsum�outcrops�are�in�the�Blaine�Formation,�which�is�widespread�in�both�the�southwest� and� northwest� parts� of� the� State� (Fig.� 1).�Although�karst�features�are�common�in�outcrops�of�the�Blaine� Formation,� historic� development� of� sinkholes�is� rare:�when�sinkholes�do� form,� it�causes�concern� for�local� citizens,� and� can� even� garner� regional� and�state-wide� interest.� The� current� paper� describes� two�gypsum-karst�sinkholes�that�formed�in�the�Blaine�For-mation� of�western�Oklahoma:� 1)� the�Delhi� Sinkhole,�which�formed�in�2011�near�the�town�of�Delhi,�in�Beck-ham�County,�southwest�Oklahoma��and�2)�the�Watonga�Sinkhole�(formerly�the�“Foley�sink”),�which�formed�in�1957�near�the�town�of�Watonga,�in�Blaine�County,�north-west�Oklahoma� (Fig.� 1).� These� surface� sinks� reached�18� and� 15�m�wide,� respectively,� and� fortunately,� they�both� formed� in� plowed� farmland,� so� there� were� no�deaths,�injuries,�or�loss�of�infrastructure.
The�Blaine�Formation�consists�of�a�series�of�white�gyp-sum� beds,� commonly� 3–6m� thick,� interbedded� with�redbed� shales� and� siltstones� that� typically� are� 1–10�m�thick;�each�of� the�gypsum�beds� is�commonly�underlain�by�a�dolomite�bed� that� is�1�cm� to�more� than�1�m� thick�(Fig.� 2).� Total� thickness� of� the� Blaine� Formation� in
Figure 1. Map of western Oklahoma showing: 1) loca-tion of Delhi and Watonga Sinkholes, 2) outcrops ofthick gypsum beds in the Blaine Formation, 3) outcropsof clastic strata equivalent to the Blaine Formation,4) axis of Anadarko Basin in outcropping Permian strata,and 5) axis of Wichita Uplift.
Johnson, Kenneth S., 2021, Delhi Sinkhole and Watonga Sinkhole Caused by Gypsum Karst in the Permian BlaineFormation of Western Oklahoma, in Johnson, K. S.; Land, Lewis; and Decker, D. D. (eds.), Evaporite Karst in theGreater Permian Evaporite Basin (GPEB) of Texas, New Mexico, Oklahoma, Kansas, and Colorado: OklahomaGeological Survey, Circular 113, p. 279–284.
0LMBIPNB�Geological�Survey�Circular�113,�2021
Delhi�Sinkhole�and�Watonga�Sinkhole�Caused�by�Gypsum�Karst�in�the�Permian�Blaine�Formation�of�Western�Oklahoma
Kenneth�S.�JohnsonRetired�Geologist,�Oklahoma�Geological�Survey,�Norman,�Oklahoma
279

outcrops is about 60 m in southwestOklahoma and about30 m in northwest Oklahoma. Nomenclature for the indi-vidual gypsum and dolomite beds of the Blaine differs insouthwest and northwest Oklahoma, because they wereoriginally thought to be two different formations: itwas not until the early 1920s that it was realized thatthey were outcrops of the same formation on the northand south "anks of the then-newly recognized AnadarkoBasin, but the dual nomenclature for beds in the BlaineFormation was retained (summarized in Johnson,2021b). All gypsum beds in the upper part of the VanVacter Member of southwest Oklahoma grade laterally
into� shales� in� the� subsurface� of� the�Anadarko� Basin,�and�these�shales�comprise�the�lower�part�of�the�Dog�Creek�Shale�on�the�north�"ank�of�the�basin.
Appreciation�is�expressed�to�TGS,�the�Houston-based�company�with� the� largest�online�well-log�database,�for�permission� to� access� their�!les�of�geophysical� logs�of�petroleum�tests�in�the�area�north�of�Delhi.�Data�obtained�from� those� logs�aided�me� in�establishing� the�character�and�distribution�of�the�Blaine�and�Flowerpot�Formations�in� that�area.�An�earlier� report�by� Johnson� (2003b)�de-scribes�gypsum�karst�in�the�Blaine�Formation�throughout�western� Oklahoma,� and� recent� overviews� of� gypsum�caves� in� the� Blaine� Formation� of�western� Oklahoma�are�presented�by�Bozeman�(2003)�and�Johnson�(2018).
DELHI�SINKHOLE,�BECKHAM�COUNTY,�SOUTHWEST�OKLAHOMA
The� Delhi� Sinkhole� formed� on,� or� just� before,�Novem-ber�16,�2011,�in�a�cultivated�!eld�about�1.8�km�north�of�the�small�community�of�Delhi,�in�south-central�Beckham�County�(Figs.�3,�4).�Larger� towns� in� the�area�are� Sayre,� about� 12� km� north� of� the� sink,� and� Erick,�about�17�km�to�the�west.�The�location�of�the�sink�is�185�m�north�and�23�m�east�of�the�SW�corner�of�sec.�6,�T.�8�N.,�R.�23�W.�(35°11’29.99”�N,�99°40’36.74”�W).�At�the�time� the� sink� formed,� it�was� referred� to� as� the� “Sayre�Sink”�in�some�of�the�press�releases.�The�Delhi�Sinkhole�was� originally� 12� m� wide� and� 12� m� deep,� but� by�October,�2012,� it�had�expanded� to�a�diameter�of�about�15�m�(Fig.�3B):�by�early�in�2020,�it�reached�about�18�m�wide�and�the�sides�had�partly�caved�in,�thus,�partially�!ll-ing�the�sinkhole.
Formation� of� the� Delhi� Sinkhole� undoubtedly� is�caused� by� dissolution� of� gypsum� beds� in� the� upper�part�of�Blaine�Formation� (in� the�Van�Vacter�Member)(Fig.� 5).�Unfortunately,� there� are� no� borehole� records�available� at�or�near� the� sink,� so� the�precise�depth�and�size� of� the�underground�gypsum� cavity� are�unknown.�At� the� sinkhole,� the�Blaine� Formation� is�mantled� by�an�unknown� thickness� (probably�about�15� to�20�m)�of�Quaternary� terrace� deposits� and� dune� sands,� so� it� is�impossible�to�determine�which�gypsum�beds�are�present�in�the�shallow�subsurface.�I�assume�that�the�main�cavity�is�developed� in� the� thicker�gypsum�unit�1�and/or�units�2+3�of�the�Van�Vacter�Member,�because�the�land�surface�originally�collapsed�to�a�depth�of�12�m.�The�underlying�Flowerpot�salt� is�present� to� the�north,� in� the�Anadarko�Basin�(Fig.�5),�but�there�are�no�data�to�suggest�that�the�Flowerpot� salt� extends� beneath� the� Delhi� Sinkhole.�The� original� 12-m� diameter� of� the� sink� is� consistent�with�those�forming�over�gypsum�cavities�(see�Watonga�Sinkhole,�below),�whereas�sinkholes�forming�because�of�salt�dissolution�and�collapse� typically�have�a�diameter�of� about� 100� m,� or� more� (see� Johnson,� 2021a,� for
Figure 2. Geologic columns showing stratigraphy andcorrelation of gypsumbeds of Blaine Formation in Beck-ham and Blaine Counties, Oklahoma (modi!ed fromJohnson, 2021b). Stratigraphic datum is Mangum andAltona Dolomites. Gypsum units 2 through 6 in Beck-ham County grade laterally into the Dog Creek Shalebetween Beckham and Blaine Counties.
280 Kenneth S. Johnson

!eld study of these extensive Blaine Formation outcropsinwhat he called the “ErickArea,” and he observed sink-holes, natural bridges, and caves throughout the area.Murphey (1958, p. 55) stated: “Caves vary in size andlength throughout the [Erick] area, the largest being 15to 20 feet [4.6 to 6.1 m] from "oor to ceiling. The lengthof caves varies from a few hundred yards [meters] tomore than a mile [1.6 km], the longest being JesterCaves.” The presence of underground cavities and caveswas further attested by Murphey (1958, p. 55): “Water
Figure�3.�Photos�of�Delhi�Sinkhole� in�Beckham�County,�southwest�Oklahoma.� A)�Ground� view� of� sink� shortly�after�formation�on,�or� just�before,�November�16,�2011;�sink�was� about� 12�m�wide� and� 12�m�deep.�B)�Google�Earth�view�of�sinkhole� in�October�2012;�sink�was�about�15�m� wide.� C)� Ground� view� of� sinkhole� in� July� 2016�shows� that� the� sides� have� partly� caved� in,� partially�!lling�the�sink.�Sink�is�OPX�(early�2020)�about�18�m�wide.
descriptions� of� numerous� salt-dissolution� sinkholes� in�the�Greater�Permian�Evaporite�Basin��(1&#).
Gypsum�karst� is�widespread� in�outcrops� just� to� the�south�and�southwest�of�Delhi.�Murphey�(1958)�made�a
Figure 4. Geologic map of Delhi area, Beckham County,Oklahoma, showing Delhi Sinkhole and two wells usedin cross section A–B, which is shown in Figure 5. LowerBlaine and upper Blaine are, respectively, the Elm Forkand Van Vacter Members of the Blaine Formation. Mapmodi!ed from Johnson and others (2003).
Delhi Sinkhole and Watonga Sinkhole Caused by Gypsum Karst in the Permian Blaine Formation 281

wells�drilled�in�this�area�often�record�drops�of�the�drill�bit�in�excess�of�6�feet�[1.8�m].�This�is�due�to�penetration�of�an�underground� channel.”� Murphey� also� noted� that� the�Erick�Area�contains�clay-�or�sand-!lled�cracks,�crevices,�and�cavities�that�formed�by�dissolution�of�gypsum,�fol-lowed�by�deposition�of�the�clay�or�sand�from�water�"ow-ing�through�the�void�spaces.�He�stated�(p.�60)�that�“this�phenomenon�is�noticeable�in�all�gypsum�outcrops�in�this�area.”�The�Delhi�area,�including�the�Delhi�Sinkhole�and�nearby�lands�covered�by�terrace�deposits�and�dune�sands,�are�underlain�at�shallow�depths�(about�3�to�20�m�deep)�by�these�same�karstic�gypsum�beds�that�crop�out�extensively�just�several�kilometers�to�the�south�(Fig.�4).
The�presence�of�topographic�depressions�elsewhere�in�the�Delhi�area�suggests� that� there�may�be�earlier�sink-holes� that�are�now� largely�masked�by� terrace�deposits�and�dune�sand.�Examination�of�the�Delhi�1:24,000-scale�topographic�map� (contour� interval� about� 3�m)� shows�more�than�30�closed�depressions�within�about�3�km�of�the� Delhi� Sinkhole.� Admittedly,� terrace� deposits� and�dune� sands� commonly� contain� closed� depressions�formed� as�wind� blowouts,� but� it� is� also� possible� that�some�of� these�depressions�may�be� the� sites�of� earlier,�gypsum-karst�sinkholes� that�now�are�partly,�or�mostly,
!lled� in� by�wind-blown� sands.� Terrace� deposits� here�are�an�excellent�aquifer,�and�they�can�provide�a�good�sup-ply�of�fresh�water�that�percolates�down�and�dissolves�the�gypsum.
The� Beckham� County� Fault� Zone,� as� shown� in�Figure�5,�is�a�normal�fault�or�fault�zone�in�Permian�rocks�that� overlie� a� deep-seated� basement� fault.� Ham� and�others�(196�,�Plates�I�and�II)�mapped�an�east–west�base-ment�fault�along�the�south�side�of�secs.�31�and�32,�T.�9�N.,� R.� 23� W.,� about� 1� to� 2� km� north� of� the� Delhi�Sinkhole.�The�top�of�basement�rock�here�drops�down�to�the�north�about�600�m�across�the�fault�(from�about�-770�m� elevation� to� about� -1,370�m),� and� this� fault� is� also�transmitted� up� through� overlying� Permian� strata.�Johnson�(1995)�noted� the�following:�1)�about�50�faults�or�"exures�have�been�mapped� in� the�Blaine�Formation�and�associated�strata� in�southwest�Oklahoma;�2)�many,�or�most�of� the� surface� structures� are�known� to�overlie�similar,� deep-seated� structures;� and� 3)� all� surface�faults�are�presumed�to�be�normal,�inasmuch�as�the�several�fault�planes� that�can�be�observed� are�normal� and�have�dips�of�about�60�to�65°.�Therefore,�the�Beckham�$ounty�Fault�Zone�is�shown�here�as�a�normal�fault,�with�a�throw�of�between�30�and�60�m�in�the�Blaine�Formation.
Figure� 5.� Cross� section� A–B� through� the� Delhi� Sinkhole� in� Beckham� County,� southwest� Oklahoma,� showing�probable�sinkhole�con!guration�and�IZQPUIFUJDBM�caves� in� the�Blaine�Formation;� lower�Blaine�and�upper�Blaine�are,�respectively,�the�Elm�Fork�and�Van�Vacter�Members�of�the�Blaine�Formation.�Size�of�sinkhole�is�exaggerated�horizontally.�Location�of�cross�section�shown�in�Figure�4.
282 Kenneth S. Johnson

WATONGA�SINKHOLE,�BLAINE�COUNTY,�NORTHWEST�OKLAHOMA
Fay� (1958)�described�a�similar�sinkhole� that� formed�on�December� 10,� 1957,� about� 5� km� northwest� of� the�town� of�Watonga,� in�Blaine�County,� northwest�Okla-homa�(Fig.�6),�on�land�owned�by�Mrs.�Anna�Foley:�he�also�mentioned�three�older�sinkholes�located�about�225�m� northeast� of� the� herein-named� Watonga� Sinkhole�(previously�referred�to�by�Fay�as�the�“Foley�sink”).�The�location�of�the�sink�is�228�m�north�and�172�m�east�of�the�SW�corner�of�sec.�2,�T.�16�N.,�R.�12�W.�(35°53’12.57”�N,�98°27’10.50”�W).�The�depression� reached�about�14�m� wide� and� 5.2� m� deep� (Fig.� 7),� with� large� cracks�parallel� to� the� edge� of� the� hole,� but� it� is� now� largely�!lled� in� by� the� landowner.� The� sink� formed� in�Quaternary�terrace�deposits�and�dune�sands,�about�30�m�above� the�Shimer�Gypsum�Bed�at� the� top�of� the�Blaine�Formation� (Fig.� 8).�The� Shimer� Gypsum� is� typically�5–6�m� thick� in� the�area.�Quaternary� deposits� here� are�sand� and� gravel� of�unknown� thickness,� but� probably�as� much� as� 20–30� m� thick:� terrace� deposits� here�unconformably� overlie� Permian� strata,� which� could�include� some� of� the�Dog�Creek�Shale�that�overlies�the�Shimer� Gypsum.� Terrace� deposits� are� an� excellent�aquifer�in�the�area,�and�thus�can�provide�a�good�supply�of�fresh�water�for�gypsum�dissolution.
Fay�(1958)�concluded�(and�I�concur)�that�dissolution�occurred� in� the�Shimer�Gypsum�Bed,�and� that� the�Wa-tonga� Sinkhole� and� other� nearby� collapse� structures�occurred� above� underground� cavities� in� the� Shimer.�The� Shimer� Gypsum� contains� caves� and� natural�springs�in�Roman�Nose� State� Park,� located� just� 5� km�north� of�Watonga� Sinkhole.� Although� dissolution� of�salt� is� the� cause� of� some� sinkholes� in� the� Greater�Permian�Evaporite�Basin� (Johnson,�2021a),� there� is�no�evidence�of�salt�in�the�Dog�Creek,�Blaine,�or�underlying�Flowerpot� strata� in� the�area:� the� nearest� salt� in� any� of�these� formations� is� about� 50� km� to� the� southwest,�where�the�Flowerpot�salt�is�present�(Jordan�and�Vosburg,�1963,�Plate�III,�Map�B).�In�addition� to� the� sinkholes�on�Foley� land,� Fay� also� noted� that� several� reports� in� the�local�Watonga�newspaper�mentioned�former�sinks�having�formed� in� the�general�area.�No� additional� studies� have�been� carried� out� to� better� understand� the� Watonga�Sinkhole�or�other�sinks�in�the�area.
Figure 6. Geologic map ofWatonga area, Blaine County,Oklahoma, showing Watonga Sinkhole and cross sec-tion C–D, which is shown in Figure 8. Map modi!edfrom Fay (2010).
Figure�7.�A)�Closeup�view�of�half�of�Watonga�Sinkhole�in�Blaine�County,�Oklahoma� (from�Fay,�1958).�Woman� is�standing�at�rim�of�sinkhole,�and�man�is�standing�in�bot-tom�of�sinkhole,�about�5.2�m�deep.�B)�Same�photo�as�above,�with�rim�of�sinkhole�marked�by�dotted�white�line.
Delhi Sinkhole and Watonga Sinkhole Caused by Gypsum Karst in the Permian Blaine Formation 283

REFERENCES CITED
Bozeman, J., 2003, Exploration of western Oklahomagypsum caves, in Johnson, K.S., and Neal, J.T.,eds., Evaporite karst and engineering/environmentalproblems in the United States: OklahomaGeological Survey, Circular 109, p. 57-64. http://ogs.ou.edu/docs/circulars/C109.pdf
Fay, R.O., 1958, A recent sink hole in central BlaineCounty, Oklahoma: Oklahoma Geology Notes, Vol.18, No. 3, p. 58-64.
Fay, R.O., 2010, Preliminary geologic map of the Wa-tonga 30’X60’ quadrangle, Blaine, Caddo, Canadian,Custer, Dewey, and King!sher Counties, Oklahoma:Oklahoma Geological Survey, Oklahoma GeologicQuadrangle OGQ–77A, scale, 1:100,000. http://ogs.ou.edu/docs/OGQ/OGQ-77A-color.pdf
Ham, W.E., Denison, R.E., and Merritt, C.A., 1964,Basement rocks and structural evolution of southernOklahoma: Oklahoma Geological Survey, Bulletin95, 302 p. http://ogs.ou.edu/docs/bulletins/B95.pdf(text only, no plates)
Johnson, K.S., 1995, Surface structures in Permian strataof southwestern Oklahoma as indicators of deep-seated structures, in Johnson, K.S., ed., Structuralstyles in the southernMidcontinent, 1992 symposium:Oklahoma Geological Survey, Circular 97, p. 288-292. http://ogs.ou.edu/docs/circulars/C97.pdf; Re-printed in 1996: Swindler, D.L., and Williams, C.P.,compilers, Transactions of the 1995 AAPG Mid-Continent Section meeting, Tulsa, Oklahoma: TulsaGeological Society, p. 135–139.
Johnson, K.S., 2003, Evaporite karst in the PermianBlaineFormation and associated strata of western Oklahoma,in Johnson, K.S., and Neal, J.T., eds., Evaporite karstand engineering/environmental problems in the UnitedStates: Oklahoma Geological Survey, Circular 109,p. 41-55. http://ogs.ou.edu/docs/circulars/C109.pdf
Johnson, K.S., 2018, Gypsum caves of north Texas andwestern Oklahoma, in Stafford, K.W., and Veni, G.,eds., Hypogene karst of Texas: Texas SpeleologicalSurvey, Monograph 3, p. 111-122. https://www.texasspeleologicalsurvey.org/PDF/Hypogene_Karst_of_Texas.pdf
Johnson, K.S., 2021a, Overview of evaporite karst in theGreater Permian Evaporite Basin (GPEB) of TX, NM,OK, KS, and CO, in Johnson, K.S. Land, L., andDecker, D.D., eds., Evaporite karst in the GreaterPermian Evaporite Basin (GPEB) of Texas, NewMex-ico, Oklahoma, Kansas, and Colorado: OklahomaGeological Survey, Circular 113.
Johnson, K.S., 2021b, Permian Blaine and San AndresFormations of western Oklahoma and Palo DuroBasin of Texas: their correlation and evaporite karst:in Johnson, K.S., Land, L., and Decker, D.D., eds.,Evaporite karst in the Greater Permian EvaporiteBasin (GPEB) of Texas, New Mexico, Oklahoma,Kansas, and Colorado: Oklahoma GeologicalSurvey, Circular 113.
Johnson, K.S., Stanley, T.M., and Miller, G.W., 2003,Geologic map of the Elk City 30’ x 60’ Quadrangle,Beckham, Custer, Greer, Harmon, Kiowa, RogerMills, and Washita Counties, Oklahoma: OklahomaGeological Survey, Oklahoma Geologic QuadrangleMap OGQ–44, scale 1:100,000. http://ogs.ou.edu/docs/OGQ/OGQ-44-color.pdf
Jordan,L., andVosburg,D.L., 1963,Permian salt and asso-ciated evaporites in the Anadarko Basin of the westernOklahoma–Texas Panhandle region: Oklahoma Geo-logical Survey, Bulletin 102, 76 p. http://ogs.ou.edu/docs/bulletins/B102.pdf (text only, no plates)
Murphey, C.W., 1958, Areal geology of the Erick Area,Beckham and Greer Counties, Oklahoma: unpub-lished MS thesis, University of Oklahoma, Norman,Oklahoma, 102 p.
Figure� 8.� Cross� section� $–%� through� the�Watonga� Sinkhole� in� Blaine� County,� northwest�Oklahoma,� showing�probable� groundwater�movement,�possible� caves,� and� collapse�of�overlying� strata� into� a� cavity� formed� in� theShimer�Gypsum�Bed�at�the�top�of�the�Blaine�Formation�(modi!ed�from�Fay,�1958).�Size�of�sinkhole�is�exaggeratedhorizontally.�Location�of�cross�section�is�shown�in�Figure�6.
284 Kenneth S. Johnson
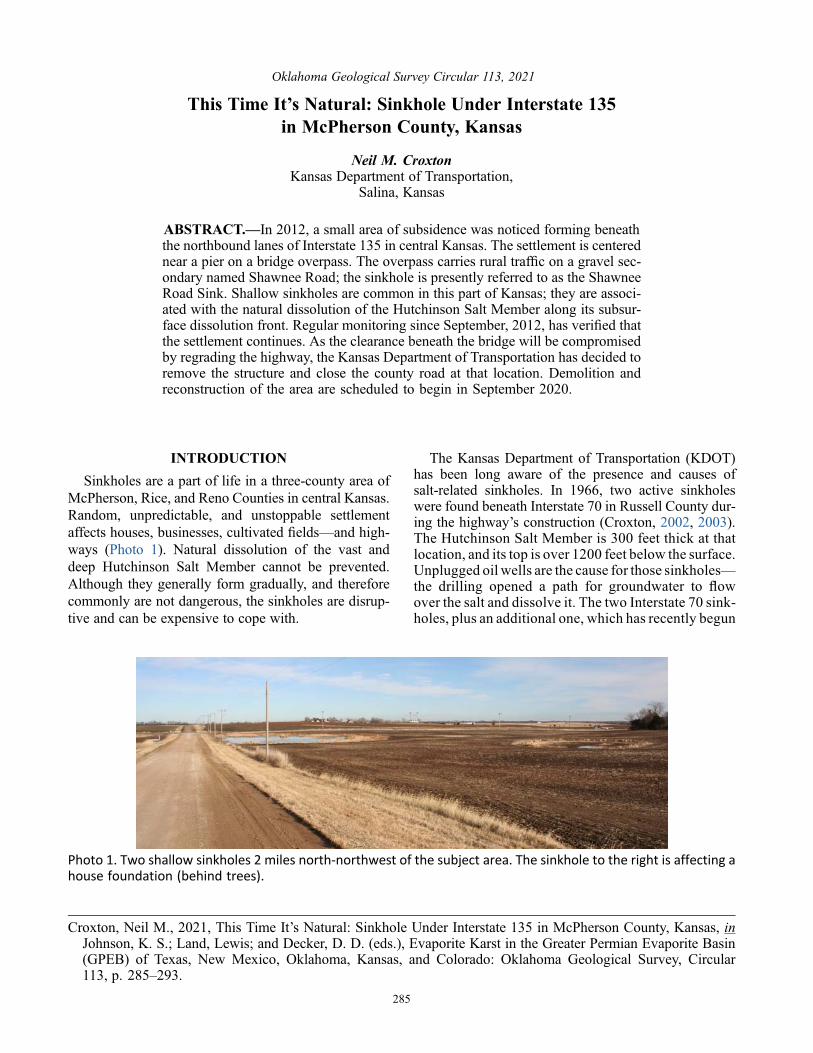
INTRODUCTION
Sinkholes are a part of life in a three-county area ofMcPherson, Rice, and Reno Counties in central Kansas.Random, unpredictable, and unstoppable settlementaffects houses, businesses, cultivated !elds—and high-ways (Photo 1). Natural dissolution of the vast anddeep Hutchinson Salt Member cannot be prevented.Although they generally form gradually, and thereforecommonly are not dangerous, the sinkholes are disrup-tive and can be expensive to cope with.
The Kansas Department of Transportation (KDOT)has been long aware of the presence and causes ofsalt-related sinkholes. In 1966, two active sinkholeswere found beneath Interstate 70 in Russell County dur-ing the highway’s construction (Croxton, 2002, 2003).The Hutchinson Salt Member is 300 feet thick at thatlocation, and its top is over 1200 feet below the surface.Unplugged oil wells are the cause for those sinkholes—the drilling opened a path for groundwater to "owover the salt and dissolve it. The two Interstate 70 sink-holes, plus an additional one, which has recently begun
Photo 1. Two shallow sinkholes 2 miles north-northwest of the subject area. The sinkhole to the right is affecting ahouse foundation (behind trees).
Croxton, Neil M., 2021, This Time It’s Natural: Sinkhole Under Interstate 135 in McPherson County, Kansas, inJohnson, K. S.; Land, Lewis; and Decker, D. D. (eds.), Evaporite Karst in the Greater Permian Evaporite Basin(GPEB) of Texas, New Mexico, Oklahoma, Kansas, and Colorado: Oklahoma Geological Survey, Circular113, p. 285–293.
0LMBIPNB�Geological�Survey�Circular�113,�2021
This�Time�It’s�Natural:�Sinkhole�Under�Interstate�135in�McPherson�County,�Kansas
Neil�M.�CroxtonKansas�Department�of�Transportation,
Salina,�Kansas
ABSTRACT.—In�2012,�a�small�area�of�subsidence�was�noticed�forming�beneath�the�northbound�lanes�of�Interstate�135�in�central�Kansas.�The�settlement�is�centered�near�a�pier�on�a�bridge�overpass.�The�overpass�carries�rural�traf!c�on�a�gravel�sec-ondary�named�Shawnee�Road;�the�sinkhole�is�presently�referred�to�as�the�Shawnee�Road�Sink.�Shallow�sinkholes�are�common�in�this�part�of�Kansas;�they�are�associ-ated�with�the�natural�dissolution�of�the�Hutchinson�Salt�Member�along�its�subsur-face�dissolution�front.�Regular�monitoring�since�September,�2012,�has�veri!ed�that�the�settlement�continues.�As�the�clearance�beneath�the�bridge�will�be�compromised�by�regrading�the�highway,�the�Kansas�Department�of�Transportation�has�decided�to�remove� the� structure� and� close� the� county� road� at� that� location.�Demolition� and�reconstruction�of� the�area�are�scheduled� to�begin� in�September�2020.
285

moving again, continue to cause headaches for KDOT,50 years later.
The sinkholes inMcPherson, Rice, andReno countiesare caused by the natural dissolution of this same saltunit. Small sinkholes regularly develop under highwaysin this area. Such sinkholes are monitored by performingperiodic surveys along the length of the highway, and !llis added as needed to maintain an acceptable pro!le.Typically, the rate of settlement is not constant, and yearsof movement can be interrupted by a period of relativestability. After many years—commonly at least 10 yearsand up to 25 years—the settlement stops altogether.
Seismic re"ection surveys by the Kansas GeologicalSurvey since the 1980s have increased our understandingof the process that causes the sinkholes. Such a survey in2006 helped the agency plan the alignment of a four-lanehighway, changing the location of an overpass on K-61near the town of Inman. But the Geology Section ofthe Kansas DOT realizes that subsidence in this area isa risk that has the potential to damage infrastructure.
The author would like to thank the following individ-uals for their assistance with this paper: George Edmon-son, KDOT Maintenance Supervisor; Jeff Geist, P.G.,KDOT Engineering Geologist; Kyle Halverson, P.G.,KDOT Chief Geologist; Greg Ludvigson, PhD, KansasGeological Survey; Scott Otipoby—KDOT GraphicDesign Supervisor; andLynnWatney, PhD,KansasGeo-logical Survey.
GEOLOGY OF THE PROJECT
NorthernMcPhersonCounty is underlain by the exten-sive, Permian-age Wellington Formation. This unit isover 500 feet thick at the sinkhole location, and the upperpart is marine shale that is approximately 10 feet belowthe surface at the site. It consists of red and gray shale,with thin irregular limestone and siltstone beds.
Also within the Wellington Formation, 150–200 feetbelow the land surface, is theHutchinson SaltMember. Itis composed of halite with an unusually small amount ofinterbedded shale impurities—on average, only about20%. This member was formed from evaporites depos-ited in the northeast arm of a sea located during the Mid-dle PermianPeriod (Drawing 1). Cycles of encroachmentand evaporation across 37,000 square miles of what isnow central and south-central Kansas left salt over500 feet thick at the center of the basin (Drawing 2).In northern McPherson County, the Hutchinson SaltMember originally measured nearly 200 feet thick.
Uplift and tilting during the late Permian or early Tri-assic periods were centered in the Missouri Ozarks andcaused a westward structural dip of the older rocks incentral and eastern Kansas (Merriam, 1963). This tiltingof the Wellington Formation and subsequent erosionhave brought the salt close enough to the surface thatgroundwater is actively dissolving its eastern edge(Drawing 3). This dissolution front extends north-south
Drawing 1. Middle Permian geography, after Dott and Batten (1981).
286 Neil M. Croxton

through McPherson County (Drawing 4) and is respon-sible for the formation of the broad north-south valleybetween McPherson and Wichita. Natural dissolutionof the salt has resulted in the formation of countless shal-low sinkholes throughout McPherson, Rice, and RenoCounties.
Where bedrock is near the surface, as it is at the inter-state bridge, subsidence is caused by the slow downwardmovement of intact blocks of the shale that overlies thesalt bed. Whereas the collapse material just above thedissolving salt may be jumbled, shallower beds can evi-dently maintain strength to bridge the void, at least for awhile. The collapse is therefore expressed only by theseupper beds sagging slightly (Drawing 5). This is what webelieve is occurring at the Shawnee Road Sink.
THE BRIDGE AND THE INVESTIGATION
In early 2012, the Highway Maintenance Supervisorfor the Lindsborg area noticed a depression on Interstate135 immediately south of the Shawnee Road overpass,which is located 6 miles south of the McPherson/SalineCounty line, near milepost 71 (Drawing 6). Being famil-iar with these types of sinkholes, KDOT Maintenancenoti!ed staff surveyors; surveys began that fall andhave continued every six months since. Surveys arerun along each lane of the interstate and along the hand-rail and centerline of the bridge.
Drawing 2. Isopach lines showing thickness, in feet, ofthe Hutchinson Salt Member, after Walters (1978).
Drawing 3. Generalized section across central Kansas, showing structural dip to west. Vertical exaggeration 100x.After Walters (1978).
Drawing 4. Thickness of the Hutchinson Salt Membershowing eastern dissolution front, Interstate 135, andShawnee Road Sink (X).
This Time It’s Natural: Sinkhole Under Interstate 135 in McPherson County, Kansas 287

The bridge on Shawnee Road was built in 1968 as partof the original interstate project. It is a three-pier structurewith concrete girders (Photo 2). The pier foundation isspread footings bearing on the shallow Wellington For-mation shale. Abutments are supported by steel piling.Shawnee Road is an unpaved county road and carriesvery low traf!c—probably less than 20 vehicles a day.
By 2016, subsidence had increased enough that thebridge was obviously being affected. Both railings hadnoticeable dips (Photo 3). There was a signi!cant lowarea along the south railing over the northbound lanes.After rains, this area held water (Photo 4); the mainte-nance supervisor noted that he could have ice-skatedon the deck during the winter. KDOT knows from expe-rience that concrete bridges will deform plastically if thesubsidence below it is slow. For the time being, KDOTwas not worried about the integrity of the bridge.
At least as concerning as the bridge, however, was theeffect on the interstate roadbed beneath it. The north-boundpavement had dropped 4 inches in 4 years, in addi-tion to the unknown amount of subsidence that occurredbefore monitoring began. Avisible and growing depres-sion was now noticeable when driving just south of thebridge (Photo 5). Eventually, the area would need to berebuilt, to preserve visibility and prevent standing waterduring heavy rain. Adding !ll to the roadbed is impossi-ble if there is a bridge overhead, because a vertical clear-ance beneath that bridge must be maintained. If thebridge is sinking, too, then the road cannot be raised.Shawnee Road had KDOT’s attention.
In January 2017, the Geology Section of the KDOTwas asked to conduct a drilling investigation in the vicin-ity of the bridge and sinkhole. A total of 23 power-augersoundings and one core hole were completed (Photos 6,7, 8). A contour map on the top of the shale was created(Drawing 7), showing that the subsidence was centeredjust north of the east pier. The bedrock appears to havedropped about 5 feet, although the bridge has not movednearly that much. The original bridge foundation geol-ogy logs from 1967were consulted and a top-of-bedrockmap created from those soundings. From that investiga-tion, which was not as extensive, it does appear that theshale has dropped about 4 feet near the east pier.Why thebridge itself does not re"ect an equally severe a drop isnot known.
Recovered cores showed no unusual weathering ofthe shale, nor was there any indication of void spaces(Photo 9). The only interesting feature of the rock coreswas the many high-angle and vertical fractures. This isunusual and may be an indication of the stresses withinthe blockof bedrock that is settling into the void.Our reportto the State Bridge Of!ce in Topeka explained the mecha-nism by which the sinkhole was forming and noted thatthe settlement would likely continue into the near future.
At about this time, KDOT contracted with the engi-neering department of Kansas State University to analyzethe stresses within the bridge. That report concluded thatsome parts of the structure were being stressed beyond itsdesign. Reinforcing the bridge was possible but was not along-term solution if the subsidence continued.
Drawing 5. Generalized section of salt dissolution and subsidence along the eastern limits of the Hutchinson Mem-ber. We believe that subsurface dissolution of salt is also happening at Shawnee Road.
288 Neil M. Croxton

THE PROJECT
Both lanes of the interstate continued to settle (Draw-ing 8). In April, 2019, KDOT of!cials met to discusswhat to do about the bridge. Chief Geologist Kyle
Halverson summarized the history of the site, explainedthe geology, and concluded by recommending the bridgebe removed. In May, a project was created. Plans weredeveloped to detail the removal of the bridge and part
Drawing 6. Map of central Kansas, showing the location of the Shawnee Road Sink (star).
Photo 2. The Shawnee Road bridge in 2020, looking north.
This Time It’s Natural: Sinkhole Under Interstate 135 in McPherson County, Kansas 289
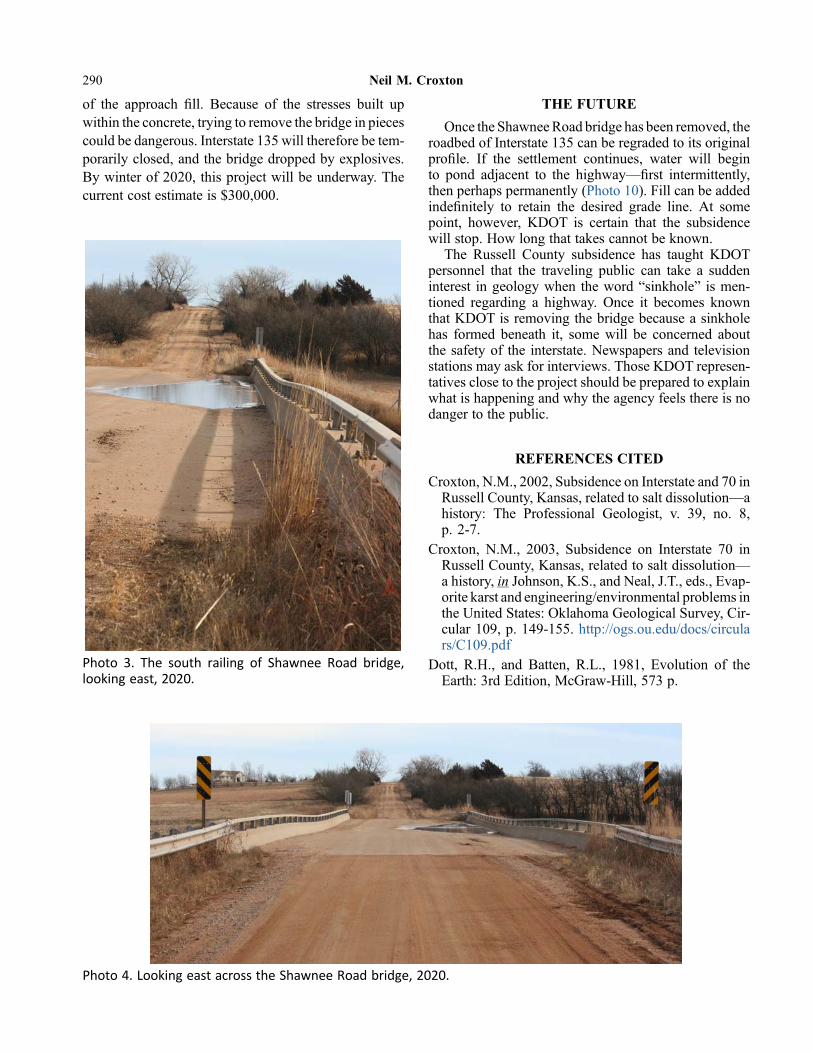
of the approach !ll. Because of the stresses built upwithin the concrete, trying to remove the bridge in piecescould be dangerous. Interstate 135 will therefore be tem-porarily closed, and the bridge dropped by explosives.By winter of 2020, this project will be underway. Thecurrent cost estimate is $300,000.
THE FUTURE
Once the ShawneeRoad bridge has been removed, theroadbed of Interstate 135 can be regraded to its originalpro!le. If the settlement continues, water will beginto pond adjacent to the highway—!rst intermittently,then perhaps permanently (Photo 10). Fill can be addedinde!nitely to retain the desired grade line. At somepoint, however, KDOT is certain that the subsidencewill stop. How long that takes cannot be known.
The Russell County subsidence has taught KDOTpersonnel that the traveling public can take a suddeninterest in geology when the word “sinkhole” is men-tioned regarding a highway. Once it becomes knownthat KDOT is removing the bridge because a sinkholehas formed beneath it, some will be concerned aboutthe safety of the interstate. Newspapers and televisionstations may ask for interviews. Those KDOT represen-tatives close to the project should be prepared to explainwhat is happening and why the agency feels there is nodanger to the public.
REFERENCES CITED
Croxton, N.M., 2002, Subsidence on Interstate and 70 inRussell County, Kansas, related to salt dissolution—ahistory: The Professional Geologist, v. 39, no. 8,p. 2-7.
Croxton, N.M., 2003, Subsidence on Interstate 70 inRussell County, Kansas, related to salt dissolution—a history, in Johnson, K.S., and Neal, J.T., eds., Evap-orite karst and engineering/environmental problems inthe United States: Oklahoma Geological Survey, Cir-cular 109, p. 149-155. http://ogs.ou.edu/docs/circulars/C109.pdf
Dott, R.H., and Batten, R.L., 1981, Evolution of theEarth: 3rd Edition, McGraw-Hill, 573 p.
Photo 3. The south railing of Shawnee Road bridge,looking east, 2020.
Photo 4. Looking east across the Shawnee Road bridge, 2020.
290 Neil M. Croxton
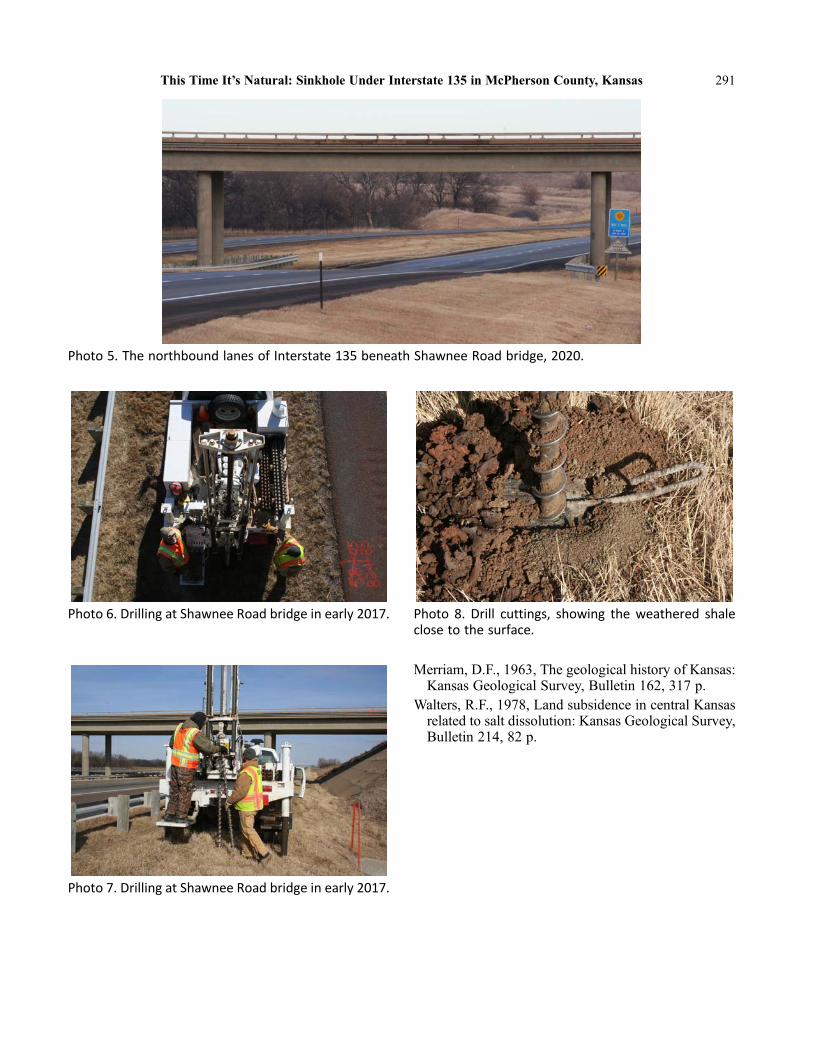
Merriam, D.F., 1963, The geological history of Kansas:Kansas Geological Survey, Bulletin 162, 317 p.
Walters, R.F., 1978, Land subsidence in central Kansasrelated to salt dissolution: Kansas Geological Survey,Bulletin 214, 82 p.
Photo 5. The northbound lanes of Interstate 135 beneath Shawnee Road bridge, 2020.
Photo 6. Drilling at Shawnee Road bridge in early 2017.
Photo 7. Drilling at Shawnee Road bridge in early 2017.
Photo 8. Drill cuttings, showing the weathered shaleclose to the surface.
This Time It’s Natural: Sinkhole Under Interstate 135 in McPherson County, Kansas 291

Drawing 8. Interpolated contour map in feet of subsi-dence at Shawnee Road sink, based on pavementelevations between September 2012 and September2019. Bridge footprint is outlined in green.
Drawing 7. Contour map on the top of bedrock at the Shawnee Road sink, based on drill soundings in 2017.Elevations in feet above sea level. Bridge footprint is outlined in white.
Photo 9. The recovered cores. Notice both the goodrecovery and fractured rock.
292 Neil M. Croxton

Photo 10. The northbound lanes at Shawnee Roadbridge in 2020. If settlement continues, water will beginto pond in the ditches here.
This Time It’s Natural: Sinkhole Under Interstate 135 in McPherson County, Kansas 293


�"#453"$5��5IF�(ZQTVN�)JMMT� JO�#BSCFS�$PVOUZ �,BOTBT � JT� LOPXO� UP�IBWF�LBSTU� GFBUVSFT � TVDI� BT� DBWFT� BOE� TJOLIPMFT�� 5IJT� TUVEZ� DSFBUFE� UXP� QSFEJDUJWF�NPEFMT�GPS�LBSTU�GFBUVSFT��'FBUVSFT�UIBU�XFSF�QSFWJPVTMZ�JEFOUJmFE�XFSF�VTFE�UP�BJE�JO� UIF� DSFBUJPO� PG� B� QSFEJDUJWF�NPEFM � BMPOH� XJUI� -JHIU� %FUFDUJPO� BOE� 3BOHJOH�-J%"3� BOE� "EWBODFE� 4QBDFCPSOF� 5IFSNBM� &NJTTJPO� BOE� 3FnFDUJPO�3BEJPNFUFS�"45&3�JNBHFSZ��0OMZ�POF�QSJWBUFMZ�PXOFE�SBODI�JO�#BSCFS�$PVOUZ�XBT� VTFE� GPS� UIJT� TUVEZ� CFDBVTF� PG� UJNF� DPOTUSBJOUT�� 5IF� QSFEJDUJWF�NPEFMT� GPS�LBSTU� GFBUVSFT� XJMM� CF� VTFGVM� GPS� GVUVSF� FYQMPSBUJPO� PG� LBSTU� GFBUVSFT� PO� UIJT�QSPQFSUZ�� 6OEFSTUBOEJOH� UIF� EJTUSJCVUJPO� BOE� PDDVSSFODF� PG� LBSTU� GFBUVSFT� XJMM�IFMQ�MBOEPXOFST�NJUJHBUF�SJTL �TVDI�BT�DPMMBQTF�MFBEJOH�UP�TUSVDUVSBM�EBNBHF�BOE�BRVJGFS�DPOUBNJOBUJPO��
5IFTF�LBSTU�GFBUVSF�QSFEJDUBCJMJUZ�NPEFMT�FODPNQBTT�UIF�VTF�PG�UIF�&43*�"SD.BQ� TPGUXBSF�QMBUGPSN��5IF�EBUB� GPS� UIJT�NPEFM� DPOTJTU�PG� TMPQF�BOE�BTQFDU �OFBSFTU� OFJHICPS� FMFWBUJPO � /PSNBMJ[FE� %JGGFSFODF� 7FHFUBUJPO� *OEFY� /%7* �MBOE� DPWFS�MBOE� VTF � EJTUBODF� UP� HFPNPSQIJD� GFBUVSFT � TVCTVSGBDF� HFPMPHZ � BOE�PUIFS�BUUSJCVUFT�DBMDVMBUFE�JO�"SD.BQ��0UIFS�TPGUXBSF�QMBUGPSNT�XFSF�BMTP�VTFE�JO�UIF� DSFBUJPO� PG� UIFTF� NPEFMT� <.JDSPDPNQVUFS� %JHJUBM� &MFWBUJPO� .PEFMT�.JDSP%&. � 4ZTUFN� GPS� "VUPNBUFE� (FPTDJFOUJmD� "OBMZTFT� 4"("� (*4 � BOE�&OWJSPONFOU� GPS�7JTVBMJ[JOH�*NBHFT�&/7*� GPS� JNBHFSZ�BOBMZTJT>��5P�UFTU� UIFTF�NPEFMT � GFBUVSFT� XFSF� JEFOUJmFE� VTJOH� UIF� TJOL�mMM� GVODUJPO� JO� "SD.BQ� PO�IJMMTIBEF� MBZFST� HFOFSBUFE� GSPN� -J%"3� EBUB�� 'JFME� WBMJEBUJPO� PG� UIFTF� NPEFMT�TVDDFTTGVMMZ�JEFOUJmFE�����PG�UIF�WBMJEBUJPO�QPJOUT�BT�IBWJOH�LBSTU�GFBUVSFT �BT�XFMM�BT� ��� BEEJUJPOBM� QPJOUT� JO�IJHI�QSPCBCJMJUZ� BSFBT� UIBU�XFSF� WJTJUFE��"� UPUBM� PG� ���BEEJUJPOBM�QPJOUT� B����� JODSFBTF� JO� UIF�LBSTU�EBUBCBTF�XFSF�BEEFE� UP� UIF�LBSTU�JOWFOUPSZ� GPS� UIF�QSPQFSUZ��5IF�GVUVSF�VTF�PG� UIJT�NPEFM�XJMM� MJLFMZ�CF� MJNJUFE�UP�#BSCFS� $PVOUZ � ,BOTBT�� IPXFWFS � UIF� UFDIOJRVFT� BOE� BQQSPBDIFT� VTFE� CZ� UIFTF�UXP� NPEFMT� NBZ� CF� VTFGVM� JO� DSFBUJOH� GVUVSF� QSFEJDUJWF� NPEFMT� JO� PUIFS� LBSTU�BSFBT�
INTRODUCTION
The Gypsum Hills of Barber County, Kansas, hosts avariety of karst features (Gauvey, 2019). Understandingthe distribution and occurrence of karst features will helplandowners mitigate risk (e.g., collapse leading to struc-tural damage, dam failures, and aquifer contamination).The goals of this study comprised 1) create a predictive
model for karst features using Geographic InformationSystems (GIS) and remote sensing; 2) create a karst-hazard map using GIS and the predictive model; and3) re!ne the geologic constraints that lead to karst forma-tion in the study area. The karst predictive model willalso be useful for future exploration of features in BarberCounty, such as caves, which may contain rare or threat-ened organisms.
Kelner, G.M.; Gauvey, K.L.; and Sumrall, J.B., 2021, Karst Feature Predictability Models Within Barber County,Kansas, in Johnson, K. S.; Land, Lewis; and Decker, D. D. (eds.), Evaporite Karst in the Greater PermianEvaporite Basin (GPEB) of Texas, New Mexico, Oklahoma, Kansas, and Colorado: Oklahoma GeologicalSurvey, Circular 113, p. 295–304.
0LMBIPNB�Geological�Survey�Circular�113,�2021
Karst�Feature�Predictability�Models�Within�Barber�County,�Kansas
G.M.�KelnerDepartment�of�Geosciences,�Fort�Hays�State�University,�Hays,�Kansas
K.L.�GauveyDepartment�of�Earth�and�Planetary�Sciences,�The�University�of
Tennessee�at�Knoxville,�Knoxville,�Tennessee
J.B.�SumrallDepartment�of�Geosciences,�Fort�Hays�State�University,�Hays,�Kansas
295
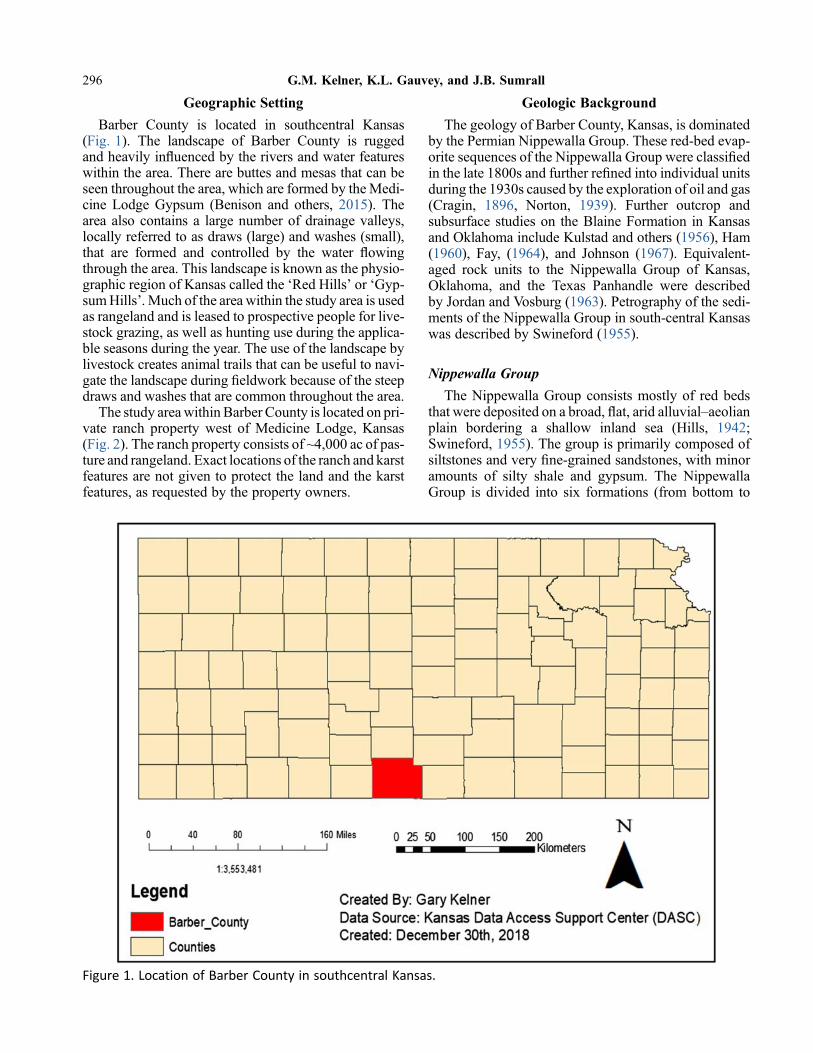
Geographic Setting
Barber County is located in southcentral Kansas(Fig. 1). The landscape of Barber County is ruggedand heavily in!uenced by the rivers and water featureswithin the area. There are buttes and mesas that can beseen throughout the area, which are formed by theMedi-cine Lodge Gypsum (Benison and others, 2015). Thearea also contains a large number of drainage valleys,locally referred to as draws (large) and washes (small),that are formed and controlled by the water !owingthrough the area. This landscape is known as the physio-graphic region of Kansas called the ‘Red Hills’ or ‘Gyp-sumHills’. Much of the area within the study area is usedas rangeland and is leased to prospective people for live-stock grazing, as well as hunting use during the applica-ble seasons during the year. The use of the landscape bylivestock creates animal trails that can be useful to navi-gate the landscape during "eldwork because of the steepdraws and washes that are common throughout the area.
The study areawithin Barber County is located on pri-vate ranch property west of Medicine Lodge, Kansas(Fig. 2). The ranch property consists of ~4,000 ac of pas-ture and rangeland. Exact locations of the ranch and karstfeatures are not given to protect the land and the karstfeatures, as requested by the property owners.
Geologic Background
The geology of Barber County, Kansas, is dominatedby the Permian Nippewalla Group. These red-bed evap-orite sequences of the Nippewalla Group were classi"edin the late 1800s and further re"ned into individual unitsduring the 1930s caused by the exploration of oil and gas(Cragin, 1896, Norton, 1939). Further outcrop andsubsurface studies on the Blaine Formation in Kansasand Oklahoma include Kulstad and others (1956), Ham(1960), Fay, (1964), and Johnson (1967). Equivalent-aged rock units to the Nippewalla Group of Kansas,Oklahoma, and the Texas Panhandle were describedby Jordan and Vosburg (1963). Petrography of the sedi-ments of the Nippewalla Group in south-central Kansaswas described by Swineford (1955).
Nippewalla Group
The Nippewalla Group consists mostly of red bedsthat were deposited on a broad, !at, arid alluvial–aeolianplain bordering a shallow inland sea (Hills, 1942;Swineford, 1955). The group is primarily composed ofsiltstones and very "ne-grained sandstones, with minoramounts of silty shale and gypsum. The NippewallaGroup is divided into six formations (from bottom to
Figure 1. Location of Barber County in southcentral Kansas.
296 G.M. Kelner, K.L. Gauvey, and J.B. Sumrall

top): Harper Sandstone, Salt Plain Formation, CedarHills Sandstone, Flowerpot Shale, Blaine Formation,and Dog Creek Shale. The Dog Creek Shale is com-monly grouped with the Blaine Formation, as it liesbetween the uppermost gypsum of the Blaine and thebase of the Whitehorse sandstone.
The Blaine Formation consists of about 50 ft of mas-sive gypsums, thin dolomites, and brown–red shale.The formation is exposed in Barber, Comanche, andKiowa Counties, and is divided into four members: indescending order, they are the Haskew Gypsum, ShimerGypsum, Nescatunga Gypsum, and Medicine LodgeGypsum (Norton, 1939). The Dog Creek Shale, com-monly grouped with the Blaine Formation, has a thick-ness of from 14 to 53 ft (Moore and others, 1951). TheDog Creek Shale consists of thin beds of dark-red siltyshale, brown–red and green–gray siltstone, and very"ne-grained sandstone, dolomite, dolomitic and gypsif-erous sandstone, and gypsum (Swineford, 1955). TheHaskew Gypsum, the upper member of the Blaine For-mation, consists of less than 1 ft of gypsum; it is under-lain by about 5 ft of brown–red shale (Moore and others,1951). The underlying Shimer Gypsum consists of a13–23 ft bed of massive gypsum that overlies approxi-mately 1 ft of dolomite (Moore and others, 1951).
Beneath the Shimer, or its underlying dolomite, is about8 ft of red shale, and then the Nescatunga Gypsum,which is about 5 ft thick (Moore and others, 1951).Beneath the Nescatunga is 8 ft of red shale, and thenthe Medicine Lodge Gypsum: this is the lowest gypsumin this sequence and is the thickest bed of gypsum inKansas, measuring up to more than 30 ft (Moore andothers, 1951). The Medicine Lodge Gypsum gradesdown into 1 ft of oolitic/pellitic dolomite called theCedar Springs Dolomite (Fay, 1964). Below the Medi-cine Lodge Gypsum or its underlying dolomite is theFlowerpot Shale.
GIS andRemote SensingApplied toKarst Prediction
Field-mapping karst features take a longer amount oftime than using the previous data collected from topo-graphic maps (Hubbard, 2003). Morphometry, whichis de"ned as the measurement and analysis of the shapeof earth’s landforms (Bates and Jackson, 1987), is usefulfor grouping similar landforms together when mappingkarst features (Hyland, 2005; Ford andWilliams, 1989).The use of Airborne Laser Swath Mapping (ALSM) hasbeen shown to not be a useful way to map karst featuresunless a large amount of aerial photography was beingused (Seale and others, 2007). Ground-truthing some-times produces features that must be incorporated intodata sets from "eld mapping (Siart and others, 2009).
Many different tools within the ArcMap softwareplatform can be used in conjunction to create karst fea-ture predictabilitymodels. The nearest neighbor distancetool is the most useful when creating predictability mapswhen the sinkholes are more clustered and the densitymodel is more useful when the sinkholes are dispersed(Galve and others, 2009). The understanding of whatcontrols sinkhole collapse is needed to better createpredictability maps for the future and the NormalizedDifference Vegetation Index (NDVI) can assist withthat understanding (Yilmaz, 2007). The creation of akarst feature predictability model in ArcMap is madeconsiderably easier by combining multiple variables inkarst feature prediction, such as the Digital ElevationModel (DEM), satellite imagery as well as elevation,slope, aspect, ground-truthing in the "eld, and the dis-tance to the drainage feature (Theilen-Willige, 2014;Ozdemir, 2016; andKresic, 2013). One of themost com-monmethods to predict karst features is using the Logis-tic Regression tool within ArcMap (Ozdemir, 2016).
When classifying karst features inArcMap, sediment-"lled depressions that were created using the sink-"lltool were separated from vegetation and bare rock byselecting them as a surface class when looking at the var-iables for karst features (Siart and others, 2009). Usingthe Topographic Position Index (TPI) to calculate theelevation difference between a point on a DEM andthe neighboring pixel is an emerging way to detect karst
Figure 2. Location of the study area within BarberCounty, Kansas.
Karst Feature Predictability Models Within Barber County, Kansas 297

features (Doctor and Young, 2013). Creating nestedpolygons in ArcMap, which are polygons that overlap,represents complex depressions or more than one sink-hole when classifying karst features (Angel and others,2004). If a complex depression had an innermost poly-gon, then it would be classi"ed as a singular depressionwhen creating karst feature predictability maps (Angeland others, 2004).
The organizations that use remote-sensing technol-ogy have ranged from the National Aeronautics andSpace Administration (NASA) to the private citizen(Siegal and Gillespie, 1980). Delineating features onthe earth’s surface is made considerably easier by theuse of remote sensing and Light Detection and Ranging(LiDAR). Reconditioning LiDAR using the watershedanalysis tool within ArcMap is one method to detectkarst features (Doctor and Young, 2013). Multiple soft-ware programs can be used when needed to assist in ter-rain analysis and recognition, such as System forAutomated Geoscienti"c Analyses (SAGA) GIS andMicrocomputer Digital Elevation Models (MicroDEM)(Schillaci and others, 2015).
Study Objectives
The objectives of this study are to 1) create a predic-tive model for karst features using Geographic Informa-tion Systems (GIS) and remote sensing; 2) create a karsthazard map using GIS and the predictive model; and3) re"ne the geologic constraints that lead to karst forma-tion in the study area. This work is built upon researchprojects by: Gauvey and Sumrall (2018), Sumrall andGauvey (2018), Gauvey and Sumrall (2019), Gauveyand others (2019) and a master’s thesis by Gauvey(2019). The reader is encouraged to explore these mate-rials for more information on the exact controls of spe-leogenesis within Barber County, Kansas.
METHODS AND RESULTS
Multiple software systems were used for this study.The primary software platform used was ArcMap ver-sion 10.7.1 by Environmental Systems Research Insti-tute (ESRI). This program aided in the map creationand data analysis for this research. Some of the othersoftware platforms used as needed were MicroDEM,SAGA GIS, and Minnesota Department of Natural Re-sources (MNDNR) GPS. The software program ENVI5.1 (32 bit) was used for remote-sensing analysis ofthe imagery used for this research. It is noted that forthe maps of output and validation and all maps thatshow the location of karst features on the property, roadsand other detailed landscape features were purposefullyremoved in ArcMap to protect the location of thesefeatures.
Data Collection and Conditioning
The start of this study "rst consisted of gathering datafor Barber County, Kansas. These data came from mul-tiple online sources: the Kansas Data Access SupportCenter (DASC), the United States Geological Survey(USGS), the United States Department of Agriculture(USDA), and the National Aeronautics and SpaceAdministration (NASA). These data sets included topo-graphic maps, geologic maps, infrastructure features,land-usemaps, digital elevationmodels (DEM), Landsatand ASTER Imagery, and Light Detection and Ranging(LiDAR) data.
After the datawere collected from the various sources,multiple conditioning steps were needed before the pre-dictive models could be created. This included the crea-tion of a geodatabase for "le storage and manipulation,digitization of nonelectronic maps (geologic maps),geographic coordinate system reprojection, andmosaick-ing imagery and DEM raster "les to cover the study area.Further conditioning of DEM and LiDAR imageryincluded various functions conducted in ArcMap, includ-ing slope, aspect, hillshade, Normalized Difference Veg-etation Index (NDVI), and Sink-Fill calculations. Theseattributes thatwere calculatedwithinArcMapwere storedwithin the geodatabase for later use in the creation of thepredictive models.
Creation of Predictive Models
Two predictive models were created in this study totest the in!uence of various features on karst prediction.These two models were used to create a re"ned predic-tion model for "eld validation. The "rst model was anon-normalized model that did not account for variationin scale between predictive variables. This model isreferred to as the non-normalized model. The secondmodel was normalized and weighted with researcheroptimization to determine the most appropriate weight-ings of predictive class variables. Both models used thefollowing attributes for the prediction of karst features:elevation, slope, aspect, and NDVI. The non-normalizedmodel also used distance to roads, distance to hydrologicfeatures, surface geology, and land use in addition tothese features. The normalized/weightedmodel used dis-tance to the geologic contact between the Blaine andWhitehorse Formations and ASTER Geology calcula-tions (Sabin’s Ratio; Ourhzif and others, 2019) in addi-tion to the shared attributes.
Non-normalized Model
This predictivemodel was created using the raster cal-culator tool function within the ArcMap Toolbox, whichallowed the user to performmathematical functions withmultiple layers. The model consisted of the geographiclayers that were identi"ed as being important in surface
298 G.M. Kelner, K.L. Gauvey, and J.B. Sumrall

karst expression. Conditional functions were used,because this categorizes the output of the variables beinginputted into the raster calculator. The output of this ras-ter calculator tool will be the result of the karst featureprediction model.
The "rst step to create the non-normalized modelincluded creating Conditional Function #1, whichinvolved elevations of known karst features. ConditionalFunction #1 calculated the elevation range of the karstfeatures for the study area. This was done using the fol-lowing conditional function:
Con!!“DEM Section” > low elevation"& !“DEM Section”
< High elevation"", “DEM Section”"= outelevationrange Section
The output of this expression creates the elevationrange from the lowest elevation to the highest elevationas shown by the DEM which is already in the GISsoftware.
The next step in the creation of the non-normalizedmodeled was writing Conditional Function #2, whichincorporated land-use data for karst features. Condi-tional Function #2 used the USDA land-use data. Theclass of land use that was identi"ed as important for karstfeature formation was grass/pasture land. ConditionalFunction #2 was the following:
Con!“LandUse USDA”, “outelevationrange Section”, ‘ ‘,
“CLASS NAME = ‘Grass=Pasture’ “"= outelevationLandUse Section
This function calculated the intersection between ele-vation ranges of karst features and grass/pasture landcover. This intersection outputwould be used as the inputfor the next step of the model.
The next step of creating the non-normalized modelwas writing Conditional Function #3. This function cal-culated the intersection between the previous Condi-tional Function #2 and the distance from streams andfarm roads. This calculation attempted to identify karstfeatures associated with surface water and/or collapse.Conditional Function #3 was the following:
Con!!“ farm roads euclidean distance”, < 4828.03"& !“ hydrology euclidean distance”, < 4828.03",“ outelevationLandUse Section”"= outelevationdistance section
These results identi"ed the intersection between ele-vation, land use, the distance from roads as well, and thedistance from surface water features for potential karstfeatures. The values above were miles converted to me-ters for use in the ArcMap system.
The next step of creating the non-normalized modelwas writing Conditional Function #4. This functionidenti"ed the intersection of karst features within a spe-ci"c aspect direction and slopewith a certain degreewiththe previous Conditional Function #3 output. Condi-tional Function #4 was the following:
Con!!“DEM Slope”, < 50"& !“ outelevationdistance section”,> 0",Con!!“DEM aspect”,> 135"&!“DEM aspect”,< 225",“outelevationdistance section”, 0""= outraster section
The results of this calculation showed the intersectionof elevation, land use, distances from the roads andhydrologic features, and the aspect/slopeof the landscape.
The "nal step of creating the non-normalized modelwas writing Conditional Function #5. Conditional Func-tion #5 calculated the intersection of the previous outputswith the NDVI and local geology for karst features. Con-ditional Function #5 was the following:
Con!!“ geology units raster” >= geo unit raster number"& !“ geology units raster”,># geo unit raster number",Con!!“ ndvi month section”,> 1"& !“ ndvi month section”,< 400",“ outraster section”, 0""
After the initial run of this model, Functions 2 through5 had to be executed again with the land-use classchanged in Function 2 to deciduous forest, becausethis model could only accommodate one land-use classat a time. This second run was then added to the "rst out-put (Fig. 3).
Normalized and Weighted Model
The Normalized and Weighted Model used similarinput layers; however, additional variables were calcu-lated in addition to those used in the non-normalizedmodel. These additional variables included the distanceto the geologic contact between the Blaine and White-horse Formations and ASTER Geology calculations(Sabin’s Ratio). First, the distance to the geologic contactwas calculated using nested buffers of 10 m around thedigitized contact vector "le within ArcMap. The buffersclosest to the geologic contact were given values of 10,and lower values were given as the distance from thecontact increased. These nested buffers were convertedfrom vector "les to raster "les to be used in the raster cal-culator. This was based on a hypothesis that the geologiccontact is an important factor in speleogenesis withinBarber County (Gauvey, 2019).
Karst Feature Predictability Models Within Barber County, Kansas 299
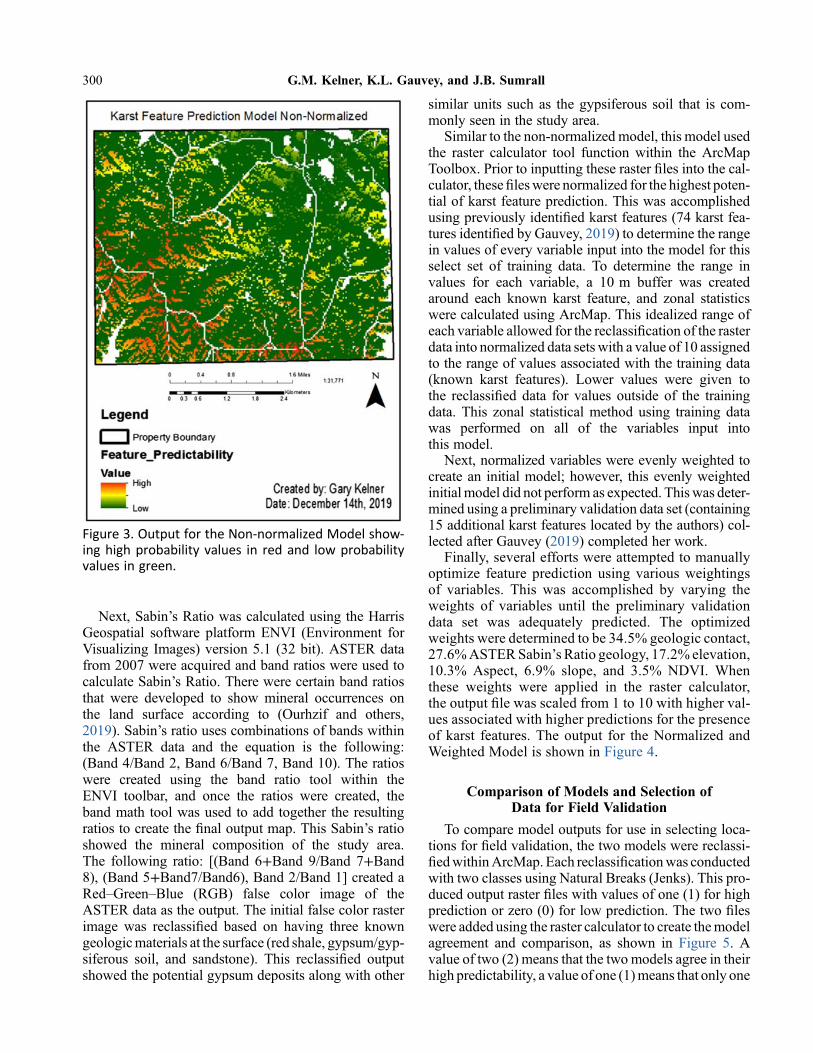
Next, Sabin’s Ratio was calculated using the HarrisGeospatial software platform ENVI (Environment forVisualizing Images) version 5.1 (32 bit). ASTER datafrom 2007 were acquired and band ratios were used tocalculate Sabin’s Ratio. There were certain band ratiosthat were developed to show mineral occurrences onthe land surface according to (Ourhzif and others,2019). Sabin’s ratio uses combinations of bands withinthe ASTER data and the equation is the following:(Band 4/Band 2, Band 6/Band 7, Band 10). The ratioswere created using the band ratio tool within theENVI toolbar, and once the ratios were created, theband math tool was used to add together the resultingratios to create the "nal output map. This Sabin’s ratioshowed the mineral composition of the study area.The following ratio: [(Band 6+Band 9/Band 7+Band8), (Band 5+Band7/Band6), Band 2/Band 1] created aRed–Green–Blue (RGB) false color image of theASTER data as the output. The initial false color rasterimage was reclassi"ed based on having three knowngeologicmaterials at the surface (red shale, gypsum/gyp-siferous soil, and sandstone). This reclassi"ed outputshowed the potential gypsum deposits along with other
similar units such as the gypsiferous soil that is com-monly seen in the study area.
Similar to the non-normalized model, this model usedthe raster calculator tool function within the ArcMapToolbox. Prior to inputting these raster "les into the cal-culator, these"leswere normalized for the highest poten-tial of karst feature prediction. This was accomplishedusing previously identi"ed karst features (74 karst fea-tures identi"ed by Gauvey, 2019) to determine the rangein values of every variable input into the model for thisselect set of training data. To determine the range invalues for each variable, a 10 m buffer was createdaround each known karst feature, and zonal statisticswere calculated using ArcMap. This idealized range ofeach variable allowed for the reclassi"cation of the rasterdata into normalized data sets with a value of 10 assignedto the range of values associated with the training data(known karst features). Lower values were given tothe reclassi"ed data for values outside of the trainingdata. This zonal statistical method using training datawas performed on all of the variables input intothis model.
Next, normalized variables were evenly weighted tocreate an initial model; however, this evenly weightedinitial model did not perform as expected. Thiswas deter-mined using a preliminary validation data set (containing15 additional karst features located by the authors) col-lected after Gauvey (2019) completed her work.
Finally, several efforts were attempted to manuallyoptimize feature prediction using various weightingsof variables. This was accomplished by varying theweights of variables until the preliminary validationdata set was adequately predicted. The optimizedweights were determined to be 34.5% geologic contact,27.6%ASTERSabin’s Ratio geology, 17.2% elevation,10.3% Aspect, 6.9% slope, and 3.5% NDVI. Whenthese weights were applied in the raster calculator,the output "le was scaled from 1 to 10 with higher val-ues associated with higher predictions for the presenceof karst features. The output for the Normalized andWeighted Model is shown in Figure 4.
Comparison of Models and Selection ofData for Field Validation
To compare model outputs for use in selecting loca-tions for "eld validation, the two models were reclassi-"edwithinArcMap. Each reclassi"cationwas conductedwith two classes using Natural Breaks (Jenks). This pro-duced output raster "les with values of one (1) for highprediction or zero (0) for low prediction. The two "leswere added using the raster calculator to create themodelagreement and comparison, as shown in Figure 5. Avalue of two (2) means that the twomodels agree in theirhigh predictability, a value of one (1)means that only one
Figure 3. Output for the Non-normalized Model show-ing high probability values in red and low probabilityvalues in green.
300 G.M. Kelner, K.L. Gauvey, and J.B. Sumrall

model has a high prediction value, and a value of zero (0)means that the two models agree in a low predictability.
To select locations for "eld validation, a combinationof visual assessment of land cover and sink "lls usinghillshade derived from LiDAR was used. Thousandsof points were identi"ed by the sink-"ll function; how-ever, when correlationwith agreement of high predictionof models was applied, 91 features were viable for vali-dation. These 91 features were visually assessed usingQuickbird Imagery of the area, and 50 features wereselected based on ease of access, location on the prop-erty, and other factors such as the presence of manmadefeatures that were mistakenly identi"ed by the sink-"llfunction.
Field Validation
Fifty points were selected for "eld validation of thesetwo models (Fig. 6). Each point was visited during aweekend of "eldwork in November 2019. A softwarepackage called Avenza Maps® was used on cell phonesand "eld tablets. This mapping software used georefer-enced PDFs created in ArcMap to help locate the valida-tion points. A total of 26 points of those identi"ed of the50 points were "eld veri"ed as hosting karst features(52% accuracy). In addition to validating these points,12 additional features were located using the model
output in real time on Avenza Maps®. This was accom-plished using the model agreement output overlain onthe hillshade to investigate areas that were not identi"edusing the sink-"ll function. The total number of pointsthat were "eld validated using these approaches was38 (Fig. 7).
DISCUSSION AND CONCLUSIONS
Based on "eld validation results, these models con-tribute signi"cantly to the identi"cation of unknownkarst features on this property; however, the develop-ment of these models is limited to this speci"c studylocation. The methods that were used by the two modelscould easily be replicated in other areas of BarberCounty, Kansas. It is highly unlikely that these modelswould be useful in their current form for other gypsumareas of the world. This does not mean that these modelsdo not contribute to our understanding of karst predictionin gypsum karst regions. Instead, the concepts of thesemodels can be modi"ed and individually tailored forother gypsum areas for karst prediction.
Figure 4. Output for the Normalized and WeightedModel showing high probability values in red and lowprobability values in green.
Figure 5. Model agreement for the prediction of fea-tures. A value of two (2) is an agreement of the twomodels of high probability, a value of zero (1) meansthat onemodel predicted high probabilities, and a valueof zero (0) means that both models agree in a lowprobability.
Karst Feature Predictability Models Within Barber County, Kansas 301

The identi"cation of karst features without thesepredictive models proved to be time consuming andincredibly challenging. Gauvey (2019) identi"ed 74 karst
features during 8 months of "eldwork to collect data.The validation of points identi"ed in this study occurredover a weekend of "eldwork in November and identi"ed51% additional features to the known karst inventory onthis vast property. This method has been incredibly suc-cessful for locating karst features for this property, andthere exists future use of the model on the current prop-erty. It is possible that other karst features exist that thesink-"ll function would not identify (e.g., caves withouta sinkhole entrance), so future work could focus on theother regions that these models predict to have highprobabilities of karst features.
After "eld validation, the models were analyzed todetermine what resulted in their failed prediction, espe-cially because most of the points that were negative wereclustered in the northwestern-to-north-central part of theproperty (Fig. 8). This was concerning, because obvi-ously, all of the landscape attributes that favor karstdevelopment were present in this area. It was also impor-tant to note that additional points were not able to beidenti"ed outside of the sink-"ll points in this negativeregion, meaning that a signi"cant amount of "eldworkwas conducted without "nding any other karst featuresin this part of the property. In the "eld, it became appar-ently obvious why there were no karst features; the bed-rock geology (more importantly, the contact between the
Figure 6. Field validation investigation points identi!edby themodel agreement applied to the sink-!ll function.
Figure 7. All of the points (38 totally) were identi!ed orveri!ed using the models during !eld validation.
Figure 8. Field-veri!ed points (yellow) and investigatepoints (red) determined using sink-!ll function andmodels. There were no veri!ed points in the north-west-to-north-central part of the property.
302 G.M. Kelner, K.L. Gauvey, and J.B. Sumrall

Blaine and Flowerpot Formations) was not where it wasmapped by the Kansas Geological Society’s detailedgeologic map. Instead, a sandstone unit (either the CedarHills Sandstone or the Whitehorse Sandstone) and Qua-ternary Loess were present in this part of the property.The gypsum of the Blaine Formation, which is essentialfor karst formation, was either 1) covered by this insolu-ble material, essentially masking its expression on thesurface, or 2) removed by surface erosion. Detailed geo-logic mapping must be conducted to determine the strat-igraphic placement of the sandstone identi"ed in this partof the property, which is beyond the scope of this paper.
When combining themistake in surface geology at thelocal scale with the sensitivity of the sink-"ll functionin identifying enclosed sinks of nonkarst origin, themodels were actually more accurate than the validationwould suggest. If the correct localized geologywas inputinitially into both models, then the northwest-to-north-central part of the property would have receivedextremely low values resulting from the underlying geol-ogy and lack of the geologic contact. This is obviously alimitation of this study; however, detailed "eld mappingof the localized geology will be the focus of future stud-ies that are currently beyond the scope of this study.
ACKNOWLEDGEMENTS
Funding for the research conducted was partially pro-vided by the Fort Hays State University Graduate Schol-arly Experience Grant as well as the Kansas MiniViewGrant, which assisted in the purchase of aerial imagery.Funding provided to assist in the presentation of thisresearch at the 2019 Geological Society of AmericaMeeting in Phoenix Arizona was provided by the Geo-logical Society of America South Central Division Stu-dent Travel Grant. A special thanks to Dr. Jay Simms forthis grant.
Many thanks to Jonathan Camelo, Britta Coleman,Elizabeth Emerson, Nathan Feldcamp, and Alex Lyles.Thank you very much for your assistance with the col-lection of "eld data for this project. Appreciation is ex-pressed to Dr. Richard Lisichenko for his review of thismanuscript and helpful comments.
REFERENCES CITED
Angel, J.C., Nelson, D.O., and Panno, S.V., 2004, Com-parison of a new GIS-based technique and a manualmethod for determining sinkhole density: An examplefrom Illinois’ sinkhole plain: Journal of Cave andKarst Studies, Vol. 66(1), p. 9-17.
Bates, R.L., and Jackson, J.A., 1987, Glossary of geol-ogy: American Geological Institute, Alexandria, Vir-ginia, 788 p.
Benison, K.C., Zambito IV, J.J., and Knapp, J., 2015,Contrasting siliciclastic–evaporite strata in subsurfaceand outcrop: an example from the PermianNippewallaGroup of Kansas, USA. Journal of SedimentaryResearch, Vol. 85(6), p. 626-645.
Campbell, C.L., 1963, Permian evaporites between theBlaine and Stone Corral Formations: unpublishedMS thesis, University of Kansas, Lawrence, KS, 73 p.
Cragin, F.W., 1896, The Permian System inKansas: Col-orado College Studies, Vol. 6, p. 1-48.
Doctor, D.H., and Young, J.A., 2013. An evaluation ofautomated GIS tools for delineating karst sinkholesand closed depressions from 1-meter LIDAR-deriveddigital elevation data, in Land, L., Doctor, D.H., andStephenson, J.B., eds., Sinkholes and the Engineeringand Environmental Impacts of Karst: Proceedingsof the Thirteenth Multidisciplinary Conference:National Cave and Karst Research Institute, Sympo-sium 2, p. 49-58.
Fay, R.O., 1964, The Blaine and related formations ofnorthwestern Oklahoma and southern Kansas: Okla-homa Geological Survey, Bulletin 98, 238 p.
Ford, D.C., and Williams, P.W., 1989, Karst geomor-phology and hydrology: London, Unwin Hyman,601 p.
Galve, J.P., Gutiérrez, F., Remondo, J., Bonachea, J.,Lucha, P., and Cendrero, A., 2009, Evaluating andcomparing methods of sinkhole susceptibility map-ping in the Ebro Valley evaporite karst (NE Spain):Geomorphology, Vol. 111(3-4), p. 160-172.
Gauvey, K.L., Sumrall, J.B., and Kelner, G.M., 2019,The petrographic controls on gypsum karst speleogen-esis in south central Kansas: Geological Society ofAmerica, Annual meeting, Phoenix, Arizona, Pro-gram with Abstracts.
Gauvey,K., 2019,Gypsumkarst speleogenesis inBarberCounty, Kansas of the Permian Blaine Formation:unpublished MS thesis, Fort Hays State University,Hays, Kansas, 131 p.
Gauvey, K.L., and Sumrall, J.B., 2018, Gypsum karstreconnaissance in Barber County, Kansas of the Perm-ian Blaine Formation: Geological Society of America,Abstracts with Programs, Vol.50, no.6.
Gauvey, K.L., and Sumrall, J.B., 2019, Gypsum karstspeleogenesis in south-central Kansas: GeologicalSociety of America, Abstracts with Programs,Vol.51, no.2.
Ham, W.E., 1960, Middle Permian evaporites in south-western Oklahoma: 21st International GeologicalCongress, Norden, Report Part 12, p. 138-151.
Hills, J.M., 1942, Rhythm of Permian seas–a paleogeo-graphic study: American Association of PetroleumGeologists, Bulletin, Vol. 26, p. 217-255.
Karst Feature Predictability Models Within Barber County, Kansas 303

Hubbard, Jr., D.A., 2003, Use of regional sinkhole map-ping for sinkhole susceptibility maps, in Beck, B.F.,ed., Sinkholes and the Engineering andEnvironmentalImpacts ofKarst, Huntsville, AL:American Society ofCivil Engineers, Ninth Multidisciplinary Conference,p. 61-71.
Hyland, S.E., 2005, Analysis of sinkhole susceptibilityand karst distribution in the northern Shenandoah Val-ley, Virginia: implications for low impact develop-ment (LID) site suitability models: unpublished MSthesis, Virginia Tech, Blacksburg, VA, 56 p.
Johnson, K.S., 1967, Stratigraphy of the Permian BlaineFormation and associated strata in southwestern Okla-homa: unpublished PhD dissertation, University ofIllinois, Champaign-Urbana, IL, 247 p.
Jordan, L., and Vosburg, D.L., 1963, Permian salt andassociated evaporites in the Anadarko Basin of thewestern Oklahoma–Texas Panhandle Region: Okla-homa Geological Survey, Bulletin 102, 76 p.
Kresic, N., 2013, Water in karst: management, vulnera-bility, and restoration: New York, McGraw-Hill,608 p.
Kulstad, R.O., Fairchild, P., and McGregor, D., 1956,Gypsum in Kansas: Kansas Geological Survey, Bulle-tin 113, 110 p.
Malone, D.J., 1962, Stratigraphic relations and structuralsigni"cance of the Blaine Formation in the subsurfaceof southwestern Kansas: unpublished MS thesis,University of Wichita, Wichita, KS, 72 p.
McKee, E.D., Oriel, S.S., and others, 1967a, Paleotec-tonic investigations of the Permian System of theUnited States: US Geological Survey, ProfessionalPaper 515, 271 p.
McKee, E.D.; Oriel, S.S., and others, 1967b, Paleotec-tonic maps of the Permian System: USGeological Sur-vey,MiscellaneousGeologic InvestigationsMap I-450.
Merriam, D.F., 1958, Preliminary regional structuralcontour map on top of the Stone Corral Formation(Permian) in Kansas: Kansas Geological Survey, Oiland Gas Investigations 17, map.
Moore, R.C.; and others., 1951, TheKansas rock column:Kansas Geological Survey, Bulletin 89, p. 1-132.
Norton, G.H., 1939, Permian red beds of Kansas: Amer-ican Association of Petroleum Geologists, Bulletin,Vol. 23, p. 1751-1819.
Ourhzif, Z.; Algouti, A.; and Hadach, F., 2019, Litho-logical mapping using Landsat 8 OLI and ASTERmultispectral data in Imini-Ounilla District SouthHigh Atlas of Marrakech: International Archives of
the Photogrammetry, Remote Sensing & SpatialInformation Sciences, XLII-2/W13, 1255–1262https://doi.org/10.5194/isprs-archives-XLII-2-W13-1255-2019, 2019
Ozdemir, A., 2016, Sinkhole susceptibility mapping us-ing logistic regression in Karapınar (Konya, Turkey):Bulletin of Engineering Geology and the Environ-ment, Vol. 75(2), p.681-707.
Rascoe, B., Jr., 1968, Permian System in the westernMid-Continent: The Mountain Geologist, Vol. 5,p. 127-138.
Rascoe, B., Jr., and Baars, D.L., 1972, The Permian Sys-tem, inGeologic atlas of the RockyMountain Region:Rocky Mountain Association of Geologists, Denver,CO, p. 143-165.
Schillaci, C., Braun, A., and Kropá!ek, J., 2015, 2.4. 2.Terrain analysis and landform recognition. Geomor-phological Techniques (Online Edition).
Schumaker, R.D., 1966, Regional study ofKansas Perm-ian evaporite formations: unpublished MS thesis,Wichita State University, Wichita, KS, 87 p.
Seale, L.D., Florea, L.J., Vacher, H.L., and Brinkmann,R., 2008, Using ALSM to map sinkholes in the urban-ized covered karst of Pinellas County, Florida—1,methodological considerations: Environmental Geol-ogy, Vol. 54(5), p. 995-1005.
Siart, C., Bubenzer, O., and Eitel, B., 2009, Combiningdigital elevation data (SRTM/ASTER), high resolu-tion satellite imagery (Quickbird) andGIS for geomor-phological mapping: A multi-component case studyonMediterranean karst in central Crete: Geomorphol-ogy, Vol. 112(1-2), p.106-121.
Siegal, B.S., and Gillespie, A.R., eds., 1980, Remotesensing in geology: New York, John Wiley, 702 p.
Sumrall, J.B., and Gauvey, K.L., 2018, Sinkhole mor-phology from the Blaine Formation of Barber County,Kansas: Geological Society of America, Abstracts andPrograms, Vol. 50, no. 6.
Swineford, A., 1955, Petrography of Upper Permianrocks in south-central Kansas: KansasGeological Sur-vey, Bulletin 111, 179 p.
Theilen-Willige, B., Malek, H., Charif, A., El Bchari, F.,and Chaïbi, M., 2014, Remote sensing and GIS con-tribution to the investigation of karst landscapes inNW-Morocco: Geosciences, Vol. 4(2), p. 50-72.
Yilmaz, I., 2007, GIS-based susceptibility mapping ofkarst depression in gypsum: a case study from Sivasbasin (Turkey): Engineering Geology, Vol. 90(1-2),p. 89-103.
304 G.M. Kelner, K.L. Gauvey, and J.B. Sumrall

INTRODUCTION
Evaporite deposits are sediments that form because ofthe precipitation of salts out of evaporating water. Theprimary evaporite rocks are gypsum, anhydrite, andhalite. Most evaporite rocks are highly soluble and dis-solve by simple ionic dissolution. Karst is a landscapeunderlain by soluble rock that has dissolved producingkarst landforms such as sinkholes, caves, and springs.Evaporite-karst features can form rapidly in a matterof weeks because of the high solubility, whereascarbonate-karst features typically take centuries todevelop (Johnson, 1996). Gypsum deposits are foundin 32 of the 48 conterminous United States and underlieapproximately 35–40%of the land area (Johnson, 1992).Much of the United States midcontinent is composed ofMid-Permian red beds and evaporites as subsurface andsurface deposits (Walker, 1967). These evaporites arewidely distributed in the United States and most containkarst features (Fig. 1). Quinlan and others (1986) give anoverview of evaporite karst in the United States, andWhite (1988) provides a good overview of karst pro-cesses in evaporite rocks.
The landscape of south-central Kansas is dominatedby red cedar trees, buttes,mesas, and canyons. The buttesare capped by pale blue-gray gypsum/anhydrite, andtheir slopes consist of highly friable red mudstone and!ne red sandstone (Benison and others, 2015). Theunderlying evaporites and associated red beds create atopography that does not !t the conventional portrayalof the Great Plains landscape of Kansas. This physio-graphic region, called the Gypsum Hills, is located in
Clark, Comanche, Barber, and Harper Counties of Kan-sas and is referred to as the Gypsum Hills. The GypsumHills is aptly named because of the vast natural gypsumdeposits in the area. The National GypsumMine in Bar-ber County mines theMedicine Lodge Gypsummemberof the Permian Blaine Formation (Benison and others2015). The Gypsum Hills is also referred to as the RedHills due to the iron-oxide-rich soil, and the land inthis region is mostly used as open rangeland.
The Kansas Geological Survey lists the south-centralregion of Kansas containing over 200 caves, yet therehave been no documented karst studies in south-centralKansas (Young and Beard, 1993). The objective of this
Figure 1. Subsurface evaporite deposits distribution inthe western part of United States (modi!ed from Doc-tor and Weary, 2014).
Gauvey, Kaitlyn L.; and Sumrall, Jonathan B., 2021, GypsumKarst in South-Central Kansas, in Johnson, K. S.; Land,Lewis; and Decker, D. D. (eds.), Evaporite Karst in the Greater Permian Evaporite Basin (GPEB) of Texas,New Mexico, Oklahoma, Kansas, and Colorado: Oklahoma Geological Survey, Circular 113, p. 305–317.
0LMBIPNB�Geological�Survey�Circular�113,�2021
Gypsum�Karst�in�South-Central�Kansas
Kaitlyn�L.�Gauvey�and�Jonathan�B.�SumrallDepartment�of�Geosciences,�Fort�Hays�State�University,
Hays,�Kansas
ABSTRACT.—Field� reconnaissance� examining� the� Permian�Blaine� Formation�and�the�karst�features�within�those�rocks�was�conducted�on�two�ranches�in�Barber�County,�Kansas.�Karst�features�are�developed�dominantly� in�gypsum�and� include�caves,� sinkholes,� losing� streams,� springs,� and� other� sur!cial� karst� features.�The�Blaine�Formation�is�known�as�a�signi!cant�karst�unit�in�Oklahoma;�however,�little�work� has� been� conducted� in�Kansas.�The� thickness� of� the� various� facies� of� the�Blaine�Formation� thins� from�Oklahoma� into�Kansas� from�27� to�15�meters� thick�(90–50�feet).�This�study�documents�the�local�distribution�of�karst�features�and�de-termines� the� controls� on� formation,� distribution,� and� surface� expression� in� the�Blaine�Formation.
305

study is to locate and document the local distribution ofkarst features in Barber County, Kansas to further under-stand the mechanism of gypsum karst formation withinthe Permian Blaine Formation (Fig 2). This study alsoseeks to understand distribution and surface expressionof karst features.
GEOLOGIC SETTING
Themidcontinent ofNorthAmerica contains extensivePangean red beds and evaporites, which include the Nip-pewalla, Quartermaster, Opeche, Chugwater, Spear!sh,and Goose Egg strata (Tomlinson, 1916; Mudge, 1967;Walker, 1967; Holdoway, 1978; Turner, 1980; Glennie,1987; Nance, 1988; Golonka and Ford, 2000; Benisonand Goldstein, 2000, 2001; Zharkov and Chumakov,2001; Roscher and Schneider, 2006; Benison and others,2015; Johnson, 2021). These evaporiteswere deposited inthe Greater Permian Evaporite Basin (GPEB), extendingfrom west Texas and southeast NewMexico into westernOklahoma, western Kansas, and southeastern Colorado(Johnson, 2021). InKansas, themid-PermianNippewallaGroup was deposited in a series of basins (SyracuseBasin, the Hugoton Embayment of the Anadarko Basin,the Cimarron Basin, the Salina Basin, and the SedgwickBasin) bounded by the Las Animas Arch to theWest, andthe Nemaha Anticline to the east (Fig. 2) (Merriam, 1962;Maughan, 1967; Mudge, 1967; Holdoway, 1978).
The Nippewalla Group contains alternating beddedevaporites (mainly gypsum), red-bed mudstones,
siltstones, and sandstones in outcrop. Much of theNippewalla Group is found in the subsurface reachingthicknesses greater than 150 m. Sur!cial outcrops insouth-central Kansas and northwestern Oklahoma arethinner due to halite dissolution (Benison and Goldstein,2001; Benison and others, 2015). TheNippewalla Groupis divided into six formations listed in ascending order:the Harper Sandstone, Salt Plain Formation, FlowerpotShale, Cedar Hills Sandstone, Blaine Formation, andDog Creek Formation (Fig. 3). Erosion and halite
Figure 2. (Left) Aerial photo of the study area shown in red. TheMedicine Lodge river runs from the northwest extentof themapping area into the small town ofMedicine Lodge in the east. (Right) Map depicting the structural geologyof Kansas. Barber County is located in the south-central region (red). The Hugoton embayment of the AnadarkoBasin is located to the West, the Pratt anticline plunges to the south, and the Sedgwick basin is located to theeast. Modi!ed from Merriam, 1962.
Figure 3. Simpli!ed stratigraphy of the study area (afterNorton, 1939).
306 Kaitlyn L. Gauvey and Jonathan B. Sumrall

dissolution have altered the surface exposures so drasti-cally that correlating core with outcrops by lithologicalassociation and/or thickness is problematic (Benison andothers, 2015). Sur!cial outcrops of the NippewallaGroup in south-central Kansas total 284 m thick; how-ever, the six formations are relatively similar to oneanother in lithologies, and thickness estimates in the!eldarea of Kansas and Oklahoma are controversial becauseof the previously mentioned issues (Holdoway, 1978;Benison 1997a, b; Benison and others, 2015).
Mid-Permian evaporite karst has been intensivelystudied in western Oklahoma and Texas (Jordan andVosburg, 1963; McGregor and others, 1963; Myersand others, 1969, Johnson, 1972, 1981, 1986, 1990a,1990b, 1991, 2003, 2021; Gustavson and others,1982; Bozeman, 1987; Runkle and Johnson, 1988, Hov-orka and Granger, 1988; Bozeman and Bozeman, 2002).Earlier studies dealing with south-central Kansas are byMerriam andMann (1957) andYoung and Beard (1993).Merriam andMann (1957) discuss notable solution sub-sidence and collapse features in the Gypsum Hills (mostnotably the natural bridges). Young and Beard (1993)propose a simplistic model for Kansas gypsum speleo-genesis, where solutionally enlarged joints pirate surfacewater into conduits that extend into nearby canyons, butthey did not list any quantitative data or evidence forthese claims.
The Greater Permian Evaporite Basin is the site fordeposition of the Permian Blaine Formation. There aretwo prominent gypsum cave systems in Oklahoma: J.C.Jester Cave is located in southwestern Oklahoma, andAlabasterCavernsofNorthwesternOklahoma (Bozeman,1987; Bozeman and Bozeman, 2002; Bozeman, 2003;Johnson, 1992, 2018). J.C. Jester Cave is one of the lon-gest gypsumcaves in thewestern hemisphere (6.25Miles)(Bozeman, 1987). Alabaster caverns are a collection ofcaves in Alabaster Caverns State Park. Caves in thisregion form in the basal gypsum bed of the Blaine Forma-tion (Johnson, 1996, 2018).
The climate of the region has transitioned into an aridto semiarid desert within the last 10,000 years (Hill,1996). The region has a humid subtropical climatewith hot, humid summers averaging 35°C and cold,dry winters averaging –5 °C (NOAA, 2018). The aver-age annual precipitation is 737 mm (29 inches) with theUS average of 990 mm (39 inches) of rain per year(NOAA, 2018).
PERMIAN BLAINE FORMATION OFBARBER COUNTY
Divisions of the Blaine
The Blaine Formation consists of about 15 meters ofmassive gypsums, thin dolomites, and brown-red shalesin south-central Kansas and thickens up to 27 meters in
northern Oklahoma (Fay, 1964). Anhydrite, instead ofgypsum, is ordinarily present in the Blaine where theunit is more than 10–60 m below the land surface (John-son, 1992). The Blaine Formation is exposed in Barber,Comanche, and Kiowa Counties of Kansas and isdivided into four members in descending order: the Has-kew Gypsum, Shimer Gypsum, Nescatunga Gypsum,and Medicine Lodge Gypsum (Norton, 1939) (Fig. 3).The Blaine Formation extends fromKansas across west-ern Oklahoma and into the Texas Panhandle, making itone of themost extensive and easily traced formations ofthe Permian red beds.
The Haskew Gypsum is the upper member of theBlaine Formation and consists of 0.30 meters (<1ft)of gypsum and 1.5 meters (5 ft) of brown-red shale(Fig. 3). In south-central Kansas, most of the gypsumhas been removed by dissolution (Moore and others,1951). The Shimer GypsumMember underlies the Has-kew Member and consists of 4–7 meters (13–23 ft) ofmassive gypsum overlying one foot of dolomite; how-ever, much of the gypsum has been removed by disso-lution (Moore and others, 1951). The NescatungaGypsum Member consists 1.5 meters of gypsumbetween 8 feet of red shale. The Nescatunga and ShimerGypsum beds are not present in Barber County (Mooreand others, 1951).
The Medicine Lodge Gypsum Member, named afterthe city of Medicine Lodge in Barber County, is thethickest bed of gypsum in the study area, measuringup to 9 meters (30 feet) (Moore and others, 1951). TheMedicine Lodge Gypsum is underlain by 0.30 meterof oolitic/pellitic dolomite called the Cedar SpringsDolomite (Fay, 1964). The Cedar Springs Dolomitegrades from an oolitic dolomite into a light gray, !ne-grained, non-fossiliferous, dolomitized mudstone (Fay,1964). The base of the mudstone contains dolomitizedpelletoid grains that grade upward into coarse-graineddolomite rhombs with an increase in anhydrite content(Holdoway, 1978). Benison and others (2015) describea 0.15 m thick carbonate unit as the Microcodium-richCedar Springs Dolomite at the base of the Blaine forma-tion. X-ray diffraction (XRD) and petrographic observa-tions by Benison and others (2015) indicated there is nodolomite in this member. The Cedar Springs Dolomitewas shown to be composed of subequal parts of calcitecrystals (attributed to the Microcodium) and gypsum/anhydrite, with detrital quartz and hematite-rich silt(Benison and others, 2015).
The underlying Flowerpot Shale consists of 55metersof friable, red-brown gypsiferous shale and thin layers ofgreen-gray silty shale with a few thin beds of sandstoneand siltstone (Bayne and others, 1968; Johnson, 1992).The formation is cut by intersecting veins of satin spargypsum (Bayne and others, 1968). Selenite crystalsand satin spar veins are commonly found in eroded
Gypsum Karst in South-Central Kansas 307

hillsides. Outcrops are restricted to Barber and Coman-che Counties (Moore and others, 1951).
Deposition of the Blaine
South-central Kansas was situated between 0°S and5°S latitude during the mid-Permian (Golonka andothers, 1994). The depositional environments of theNip-pewalla Group were a series of extremely acid salineephemeral lakes, mud"ats, sand"ats, paleosols, andeolian dunes (Benison and others, 1998, 2013; Benisonand Goldstein, 2001; Sweet and others, 2013; Foster andothers, 2014). The most direct chronological analysis bymagnetostratigraphy of the Nippewalla Group, the DogCreek Shale Formation, suggests deposition during theLeonardian and Guadalupian (276–267 Ma) (Fosterand others, 2014).
In central Oklahoma, the Blaine Formation containsbivalve-rich dolomite beds; however, in Kansas, theonly carbonates reported are dolomitized mudstones orMicrocodium-rich calcretes (Fay, 1964; Benison andothers, 2001). Fay (1964) indicates a 0.30 m of lightgray oolitic/pelletic dolomite bed at the base of theMedicine Lodge Gypsum. Benison and others (2001)do not identify an oolitic/pelletic dolomudstone, but aMicrocodium-rich calcrete located in the red siliciclas-tics that do not contain dolomite.
STRUCTURAL AND DIAGENETIC HISTORY
Barber County lies on the southern extent of the PrattAnticline (Fig. 2). The Pratt Anticline is a post-Mississippian extension of the Central Kansas upliftand separates the Hugoton Embayment from the Sedg-wick Basin (Merriam, 1962). Cretaceous-aged strataunconformably overlie Permian-aged strata because ofthe post-Mississippian uplift and subsequent erosionof Triassic and Jurassic-aged strata during the Creta-ceous (Western Interior Seaway) (McLaughlin, 1942;Merriam, 1955; Merriam, 1957). Quaternary glacial de-posits unconformably overlie Cretaceous-aged strata.Post-Pleistocene glacial and associated "uvial depositsmark a stark change in climate (Norton, 1939).
In the subsurface, the Nippewalla Group containsmassively bedded and displacive halite, whereas sur!-cial outcrops of the Permian Nippewalla Group haveundergone late-stage dissolution of halite cement (Beni-son and others, 2015). Gypsum/anhydrite caprocks andslope-forming siliciclastics are clues to past halitecement in the siliciclastics (Benison and others, 2015).Surface section measurements in central Kansas revealdepositional and early diagenetic halite, such as pseudo-morphs after displacive and chevron halite. Collapsestructures in south-central Kansas are evidence of disso-lution of bedded halite close to the surface.
KARST FORMATION IN SOUTH-CENTRALKANSAS
Young and Beard (1993) documented 205 cavesfound in Barber County. These caves were reported tobe found within or near the walls of canyons, andmany of the steep-walled canyons represent unroofedcaves. The large dendritic canyons were interpreted tobe relict caves that were subsequently unroofed as sur-face denudation and valley erosion took place. South-central Kansas was known for natural bridges thatform by the solution of Permian gypsum (Merriamand Mann, 1957; Young and Beard, 1993; Benisonand others, 2015). Many of the famed natural bridgeshave since collapsed. The Sun City Natural Bridgewas themost signi!cant natural bridge inBarber County;it measured 55 feet long (Jewett, 1935), and collapsedin 1962.
MATERIALS AND METHODS
Site Descriptions
Two privately owned ranches located west of Medi-cine Lodge were used in this study. Property ownershave asked not to have their exact geographic locationrevealed for privacy. Speci!c cave locations have beenremoved to protect these features. Property One islocated south of US Highway 160 and includes16 km2 (4,000 acres) ofmostly open rangeland. Bedrockat Property One is mantled with a thin veneer (0.15 m) ofclayey loams. Property Two is located north of USHigh-way 160 and includes over 28 km2 (7,000 acres) ofmostly open range pasture land. The bedrock at PropertyTwo is highlymantledwith sandy loam andmarks a starkcontrast to the thinly mantled Property One just 10 kilo-meters (6 mi) southeast.
Field Methods
Rock sampling and cave surveying were conducted inthe summer of 2018. Previous exploration and documen-tation of south-central Kansas have been done by mem-bers of the Kansas Speleological Society (KSS);however, the KSS has not explored south of Highway160 (Property One). Rock samples were collected fromkey outcrops within caves to distinguish petrographiccontrols on passage morphology. Twelve samples wereobtained from the cave ceiling (proto-channels),“ledges,” and wall (Fig. 4). These bulk samples werelarge enough to create one- by two-inch thin sectionsand leave enough material for mineralogical and geo-chemical analyses.
Most cave and karst features located were surveyedusing standard cave survey techniques as documentedby Dasher (1994). Plan sketches and cross sections ofeach cave were created to document cave passage
308 Kaitlyn L. Gauvey and Jonathan B. Sumrall

morphology and passage orientation. The locations ofkarst features were documented with a handheld GlobalPositioning System (GPS) unit, recorded as UTM coor-dinates, and stored in a relational database to be usedwithin a Geographical Information System (GIS) to gen-erate maps. Georeferenced LiDAR Data were used tocorrect erroneous points (Access, 2011).
Laboratory Methods
Twelve samples were made into standard thin sec-tions. Cave “ledge” samples were stained with alizarinred-S to distinguish the presence of dolomite and calcite(Dickson, 1966). Samples were powdered for XRD us-ing a low-speed dental drill and sieved through 250 !m,125 !m, and 63 !m sieves for routine qualitative evalu-ation of mineral components. Bulk mineralogy was ana-lyzed for mineralogy using a Rigaku diffractometer withCu K" radiation and internal quartz standard.
RESULTS
Field Results
Field reconnaissance identi!ed 62 karst features,including 18 open sinkholes (i.e., caves or smaller solu-tional conduits that connect directly to sinkholes),9 !lled sinkholes, 14 caves with no associated sinkhole,and 13 springs. Ten of the 18 sinkholes contained cavesthat were large enough for humans to enter. Caves weredeveloped at the geologic contact between the MedicineLodge GypsumMember and the Flowerpot Shale. Filledsinkholes were generally found in the sandy loam man-tled material on Property Two. Sinkhole complexes andassociated caves were primarily on Property One wherethe gypsum is exposed or thinly mantled. Cave passagelength measures 78 m (256 ft) with vertical extents of4 m (14 ft). The average cave volume was 35.25 m3
(1,245 ft3) with the average cave area being 104 m2
(1,119 ft2). Cave entrances are found at the geologiccontact between theMedicine LodgeGypsum and Flow-erpot Shale,within sinkholes, or near canyonwalls. Caveentrances are formedmainly by cover/ceiling collapse orcliff retreat.
Cave Morphology
On both properties, cave entrances are found nearcover-collapse sinkholes or where surface denudationhas breached the cave. Entrances typically contain a solu-tionally enlarged fracture in the gypsum. Cave passagesfollow joint sets, andwhere these joint setsmeet, passagesextend vertically, in some cases up to 4 meters (14 ft)(Fig. 5). Passages are generally short (ranging from to1.5 to 78 m), straight to slightly sinuous, and are orientedalong joints that have sharp, orthogonal bends at joint in-tersections. Several caves are “through-caves” that haveonly two entrances (one collection sink and one resur-gence) (Jennings 1971; Klimchouk, 1996b).
Passages morphologies are commonly controlled bybedding planes between the Medicine Lodge Gypsumand the Flowerpot Shale (Fig. 4). Tube-shaped proto-conduits or “ceiling channels” form in the MedicineLodge Gypsum Member, measure 0.3–0.6 meters indiameter, and follow ceiling joints (Fig. 4). Carbonateledges occur between the Medicine Lodge Gypsumand the Flowerpot Shale. The ledges form resistantbeds that protrude out into the cave passage (Fig. 4).The underlying Flowerpot Shale is friable and containsabundant satin spar gypsum stringers, masses of selenitegypsum, and laminations of bleached-gray shale. TheFlowerpot Shale portionof the cave passage is commonlywider than the passage developed in overlying strata.
Active water seeps are commonly seen at the contactbetween the carbonate ledge and the Flowerpot Shale,
Figure 4. Cave passage morphologies. Left (A) shows 1) Proto-channel, 2) Cave Ledge, 3) Cave wall. Right (B) depicts1) Proto-channel (tube-shaped), 2) Cave Ledge, 3) Cave wall.
Gypsum Karst in South-Central Kansas 309

and most caves contain standing pools of water year-round. Scallops were observed on gypsum passage wallsand on recent breakdown blocks.
Sinkhole Morphology
Solutional sinks form atop the buttes andmesaswithinthe Medicine Lodge Gypsum. Sinkholes on PropertyOne are expressed far differently than those on PropertyTwo. On Property Two, sinkholes are highly mantledwith a sandy aggregate mantle creating an easily identi-!able depression. On Property One, the bedrock isexposed with a thin veneer of loamy soil, creating sink-hole complexes that are not easily identi!ed as sinkholesdue to their dendritic shape (Fig. 6). Sinkhole complexesform in the upper valley, where slightly mantled materialis funneled into solutionally enlarged surface joints(Fig. 7). Joints pirate surface water into sinkholes andsurface fractures. Surface water is directed into cavesystems, where they "ow through the caves into the ero-sional valleys below.
PETROGRAPHIC AND MINERALOGICRESULTS
Cave Ceiling
The base of the Medicine Lodge Gypsum is a host forceiling channel formation. Megascopically, the gypsumis soft, buff to gray, and microcrystalline. Anhedral
secondary granular gypsum replacement crystals areabundant in all cave ceiling/proto-channel samples(Fig. 8A). These crystals range in size from 0.05 to5 mm. Subhedral to anhedral gypsum laths measuringup to 2 mm are scattered throughout (Fig. 8A). Anhedraldolomite inclusions are present measuring up to 2 mm(Fig. 8A). Patchy iron oxide staining is common; how-ever, anhydrite was not identi!ed in any of the samples.
Cave “Ledge”
Megascopically, the carbonate layer is dark graymud-stone. The “ledge” lithology ranges from dolomicrite tolaminated peloidal dolomicrite (Fig. 8B). The matrix iscomposed of anhedral dolomite crystals measuring up to1 mm and composes> 90% of the samples. These crys-tals are sucrosic near the base and progressively increasein secondary granular gypsum and iron oxides are mov-ing stratigraphically upward. Euhedral dolomite cementsmeasuring up to 1 mm commonly !ll pores. Staining in-dicates the presence of dolomite, which is con!rmed byXRD analysis.
Cave Wall
Megascopically, the cave wall is composed of red tobleached gray shale interbedded with satin spar stringersand selenite crystals. Samples were obtained frommore-indurated shale units within the cave passage. Samplingwas biased because of poor induration and friability.
Figure 5. A) and B) Ceiling channel in Medicine Lodge Gypsum following ceiling fracture. C) Ceiling channel in theMedicine Lodge Gypsum following a ceiling fracture. Scallops are observed on the wall. D) Joint set intersection intheMedicine Lodge Gypsum that extends 14- feet vertically. E) Joint set intersectionwherewater is seeping into thecave toward a standing pool of water. Scallops are observed on the walls.
310 Kaitlyn L. Gauvey and Jonathan B. Sumrall

In thin section, secondary granular gypsum composes> 90% of the bulk mineralogy. Subhedral satin spar gyp-sum laths measuring up to 2 mm are found. Subhedral toanhedral dolomites (1 mm) are found. Euhedral anhy-drite ghosts are replaced with secondary granular gyp-sum (Fig. 8C). Insoluble iron oxides commonly !llfractures.
DISCUSSION
In this region of Barber County, cave formation isprimarily dependent on the geologic contact betweenthe Medicine Lodge Gypsum and Flowerpot Shale.Solutionally enlarged joints observed on the surfacefollow the same trend as fractures seen in cave passages
Figure 7. Various sinkholes in Barber County. A) Sinkhole complex in a thicker sandy loam-mantled sinkhole complex.These sinkholes do not have bedrock exposed in the bottoms. B) Slightly mantled sinkhole complex with exposedbedrock. Mantled material is a clayey loam. C) Exposed bedrock covers collapse sinkhole. The mantle material hasbeen stripped by surface erosion by the adjacent stream. There is a cave entrance in the bottom of this sinkhole thatfeeds a stream passage.
Figure 6. Sinkhole complexes in the two regions of the study area. A) Northern portion of the study area wheremantle material is thicker and produces more distinct sinkholes. Notice the two generations of sinkholes. The !rstgeneration represents collapse and reworking to form a dendritic pattern. The second generation represents recentcollapse because of mining activities in the area. B) Southern portion of the study area whenmantle material is thinor lacking. Sinkholes are less noticeable, so their locations have been circled.
Gypsum Karst in South-Central Kansas 311
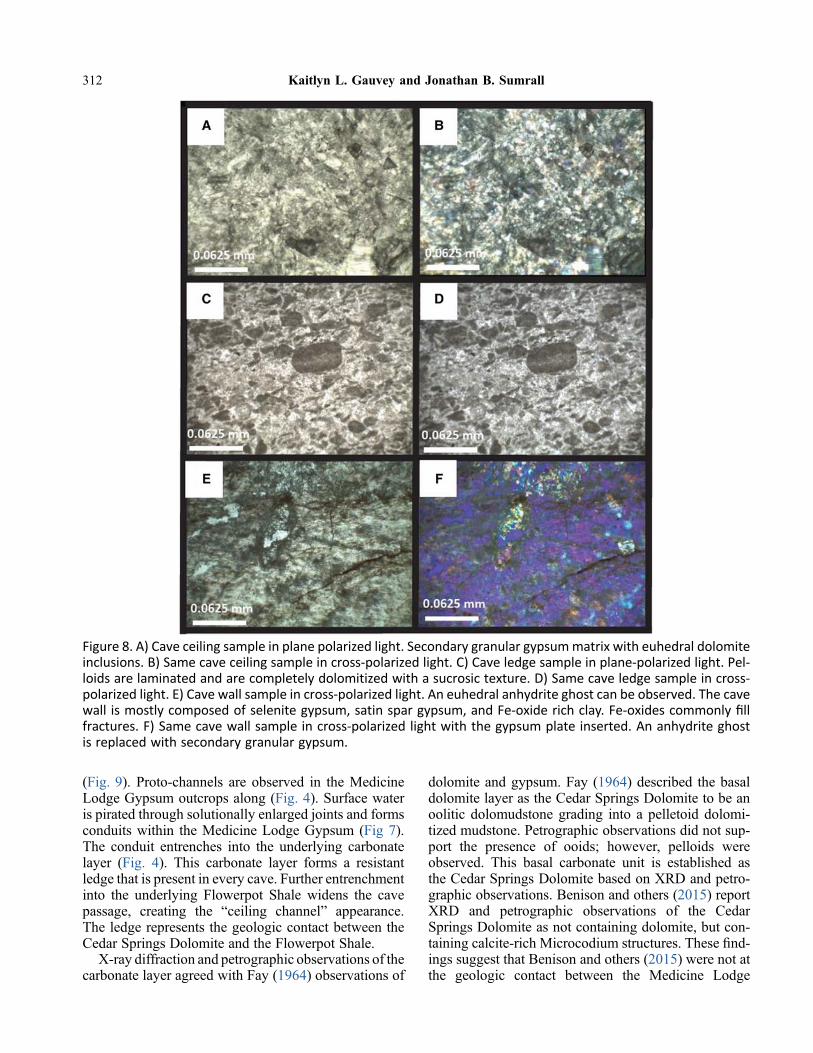
(Fig. 9). Proto-channels are observed in the MedicineLodge Gypsum outcrops along (Fig. 4). Surface wateris pirated through solutionally enlarged joints and formsconduits within the Medicine Lodge Gypsum (Fig 7).The conduit entrenches into the underlying carbonatelayer (Fig. 4). This carbonate layer forms a resistantledge that is present in every cave. Further entrenchmentinto the underlying Flowerpot Shale widens the cavepassage, creating the “ceiling channel” appearance.The ledge represents the geologic contact between theCedar Springs Dolomite and the Flowerpot Shale.
X-ray diffraction and petrographic observations of thecarbonate layer agreed with Fay (1964) observations of
dolomite and gypsum. Fay (1964) described the basaldolomite layer as the Cedar Springs Dolomite to be anoolitic dolomudstone grading into a pelletoid dolomi-tized mudstone. Petrographic observations did not sup-port the presence of ooids; however, pelloids wereobserved. This basal carbonate unit is established asthe Cedar Springs Dolomite based on XRD and petro-graphic observations. Benison and others (2015) reportXRD and petrographic observations of the CedarSprings Dolomite as not containing dolomite, but con-taining calcite-rich Microcodium structures. These !nd-ings suggest that Benison and others (2015) were not atthe geologic contact between the Medicine Lodge
Figure 8. A) Cave ceiling sample in plane polarized light. Secondary granular gypsummatrix with euhedral dolomiteinclusions. B) Same cave ceiling sample in cross-polarized light. C) Cave ledge sample in plane-polarized light. Pel-loids are laminated and are completely dolomitized with a sucrosic texture. D) Same cave ledge sample in cross-polarized light. E) Cave wall sample in cross-polarized light. An euhedral anhydrite ghost can be observed. The cavewall is mostly composed of selenite gypsum, satin spar gypsum, and Fe-oxide rich clay. Fe-oxides commonly !llfractures. F) Same cave wall sample in cross-polarized light with the gypsum plate inserted. An anhydrite ghostis replaced with secondary granular gypsum.
312 Kaitlyn L. Gauvey and Jonathan B. Sumrall
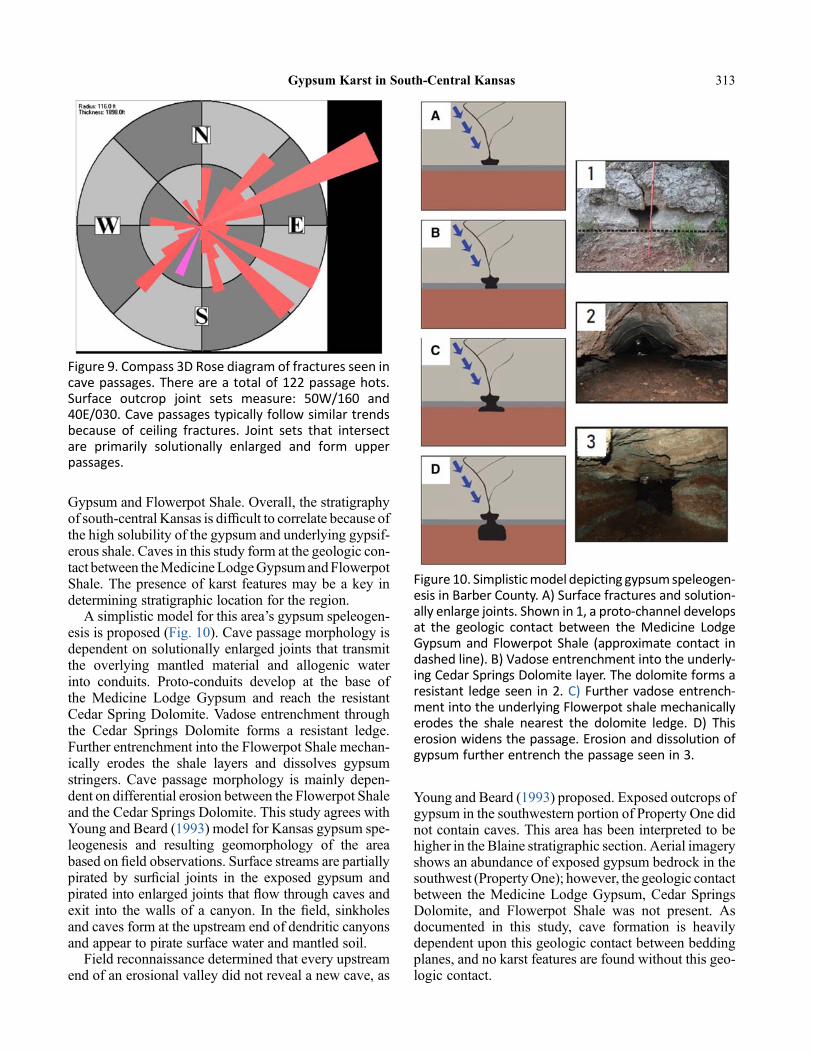
Gypsum and Flowerpot Shale. Overall, the stratigraphyof south-central Kansas is dif!cult to correlate because ofthe high solubility of the gypsum and underlying gypsif-erous shale. Caves in this study form at the geologic con-tact between theMedicineLodgeGypsumandFlowerpotShale. The presence of karst features may be a key indetermining stratigraphic location for the region.
A simplistic model for this area’s gypsum speleogen-esis is proposed (Fig. 10). Cave passage morphology isdependent on solutionally enlarged joints that transmitthe overlying mantled material and allogenic waterinto conduits. Proto-conduits develop at the base ofthe Medicine Lodge Gypsum and reach the resistantCedar Spring Dolomite. Vadose entrenchment throughthe Cedar Springs Dolomite forms a resistant ledge.Further entrenchment into the Flowerpot Shale mechan-ically erodes the shale layers and dissolves gypsumstringers. Cave passage morphology is mainly depen-dent on differential erosion between the Flowerpot Shaleand the Cedar Springs Dolomite. This study agrees withYoung and Beard (1993) model for Kansas gypsum spe-leogenesis and resulting geomorphology of the areabased on !eld observations. Surface streams are partiallypirated by sur!cial joints in the exposed gypsum andpirated into enlarged joints that "ow through caves andexit into the walls of a canyon. In the !eld, sinkholesand caves form at the upstream end of dendritic canyonsand appear to pirate surface water and mantled soil.
Field reconnaissance determined that every upstreamend of an erosional valley did not reveal a new cave, as
Young and Beard (1993) proposed. Exposed outcrops ofgypsum in the southwestern portion of Property One didnot contain caves. This area has been interpreted to behigher in the Blaine stratigraphic section. Aerial imageryshows an abundance of exposed gypsum bedrock in thesouthwest (PropertyOne); however, the geologic contactbetween the Medicine Lodge Gypsum, Cedar SpringsDolomite, and Flowerpot Shale was not present. Asdocumented in this study, cave formation is heavilydependent upon this geologic contact between beddingplanes, and no karst features are found without this geo-logic contact.
Figure 9. Compass 3D Rose diagram of fractures seen incave passages. There are a total of 122 passage hots.Surface outcrop joint sets measure: 50W/160 and40E/030. Cave passages typically follow similar trendsbecause of ceiling fractures. Joint sets that intersectare primarily solutionally enlarged and form upperpassages.
Figure 10. Simplisticmodel depicting gypsumspeleogen-esis in Barber County. A) Surface fractures and solution-ally enlarge joints. Shown in 1, a proto-channel developsat the geologic contact between the Medicine LodgeGypsum and Flowerpot Shale (approximate contact indashed line). B) Vadose entrenchment into the underly-ing Cedar Springs Dolomite layer. The dolomite forms aresistant ledge seen in 2. C) Further vadose entrench-ment into the underlying Flowerpot shale mechanicallyerodes the shale nearest the dolomite ledge. D) Thiserosion widens the passage. Erosion and dissolution ofgypsum further entrench the passage seen in 3.
Gypsum Karst in South-Central Kansas 313

Remnant caves, or shelter caves bordering the ero-sional valleys, are relatively small and contain thesame features as a larger cave (i.e., the geologic contactbetween the Medicine Lodge Gypsum, CarbonateLedge, and Flowerpot Shale). These caves likely repre-sent larger caves that have been lost to cliff retreat. Thisprocess is evident by the large boulders found on thevalley "oors that are composed of Medicine LodgeGypsum.
Sinkhole complexes form in the upper valley wheremantled material is funneled into solutionally enlargedsurface joints (Figs. 6, 7). Joints pirate surface waterand soil into sinkholes and surface fractures. Surfacewater is directed into cave systems and"ows into the val-leys below through these caves. These karst featuresappear to be hydrologically connected.
CONCLUSION
This survey of caves and karst landforms adds signif-icantly to the basic knowledge of the geology of thisregion. Field observations indicate cave formation isdependent on (1) the geologic contact between the Perm-ian Blaine Formation and the underlying FlowerpotShale, (2) the amount and type of sur!cial mantle mate-rial, and (3) solutionally enlarged fractures that enablewater "ow.
Surface fractures pirate surfacewater into solutionallyenlarged joints or insurgences. Solutionally enlargedjoints are necessary for enlargement of solutional sinksor conduits. Proto-conduits form at the base of the Med-icine Lodge Gypsum and entrench into the underlyingcarbonate layer. Resistant carbonate ledges underlyingthe Medicine Lodge Gypsum were determined to bethe Cedar Springs Dolomite, as described by Fay(1964). Further entrenchment into the underlying Flow-erpot Shale widens the passage by mechanical erosionand dissolution of satin spar gypsum stringers.
Various sinkhole morphologies were formed by theamount and type sur!cial mantle material. PropertyOne was slightly mantled with a thin, clayey loam,whereas Property Twowas highlymantled with a thickersandy loam. These sinkhole complexes form in theexposed gypsum bedrock near the top of valleys andare commonly associated with cave entrances.
Petrologic and XRD observations con!rm the pres-ence of dolomite and inclusions of gypsum within thecarbonate layer. This carbonate layer was interpretedto be the Cedar Springs Dolomite as described by Fay(1964). Ooids and Microcodium structures were notobserved as described by Fay (1964) and Benison andothers (2015). Petrographic observations within samplesof the cave wall con!rm the replacement of anhydrite bygypsum.
The distribution of karst features is controlled bystratigraphy and surface denudation. Insurgent caves
entrances are found where bedrock is thinly mantledand are commonly associated with sinkhole complexesthat remove mantled material, whereas resurgent caveentrances occur in valley walls. Caves preferentiallyform at the geologic contact between the MedicineLodge Gypsum and Flowerpot Shale and contain similarpassage morphologies (i.e., proto-conduits, carbonateledges, widened cave wall). Stratigraphy is dif!cult todetermine because of fast rate of erosion of gypsumand shale beds; however, the presence of karst featuresat this geologic contact can aid in determiningstratigraphy.
It is hoped that this investigation of the caves and karstof Barber County is a valuable addition to the limited lit-erature in this region and also that it can act as a founda-tion for much- needed further investigation. Futureresearch, including dye tracing, shallow geophysicalexploration, sinkhole distribution, and petrographic con-trols on speleogenesis, will build upon this research.
ACKNOWLEDGMENTS
We would like to thank Dr. James Murowchick fromthe University of Missouri-Kansas City for analyzingsamples used in this study. We would also like to thankthe property owners; without their guidance, my vehiclewould have remained in a pasture.
REFERENCES CITED
Access, K.D., 2011, Support Center. 2015. State ofKansas GIS Data Access and Support Center.
Bayne, C.K., Goebel, E.D., Jewett, J.M., O’Connor,HG., Swineford, A., and Zeller, D.E., 1968, The strat-igraphic succession in Kansas: Kansas GeologicalSurvey, Bulletin 189, 81 p.
Benison, K.C., 1997a, Field descriptions of sedimentaryand diagenetic features in red beds and evaporites ofthe Nippewalla Group (middle Permian), Kansasand Oklahoma: Kansas Geological Survey, OpenFile Report 97-21, 62 p.
Benison, K.C., 1997b, Acid lake and groundwaterdeposition and diagenesis in Permian red bed-hostedevaporites, midcontinent, U.S.A.: unpublished Ph.D.dissertation, The University of Kansas, Lawrence,KS, 480 p.
Benison, K.C., 2013, Acid saline "uid inclusions: exam-ples from modern and Permian extreme lake systems:Geo"uids, Vol. 13, p. 579-593.
Benison, K.C., and Goldstein, R.H., 2000, Sedimentol-ogy of ancient saline pans: an example from the Perm-ian Opeche Shale, Williston Basin, North Dakota,USA: Journal of Sedimentary Research, Vol. 70,p. 159-169.
314 Kaitlyn L. Gauvey and Jonathan B. Sumrall

Benison, K.C., and Goldstein, R.H., 2001, Evaporitesand siliciclastics of the Permian Nippewalla Groupof Kansas, USA: a case for non-marine depositionin saline lakes and saline pans: Sedimentology, Vol.48, p. 165-188.
Benison, K.C., and Goldstein, R.H., 2002, Recognizingacid lakes and groundwater in the rock record: Sedi-mentary Geology, Vol. 151, p. 177-185.
Benison, K.C., Goldstein, R.H., Wopenka, B., Burruss,R.C., and Pasteris, J.D., 1998, Extremely acid Permianlakes and groundwaters in North America: Nature,Vol. 392, p. 911-914.
Benison, K.C., Zambito, J.J., Soreghan, G.S., Soreghan,M.J., Foster, T.M., and Kane, M.J., 2013, Permian redbeds and evaporites of the Amoco Rebecca K. Boundscore, Greely County, Kansas: implications for scienceand industry, inDubois,M.K.,Watney,W.L., andToll-efson, J., eds., Mid-Continent Core Workshop: fromSource to Reservoir to Seal: Mid-Continent Section,American Association of Petroleum Geologists,Kansas Geological Survey, p. 9-14.
Benison, K.C., Zambito, J.J., and Knapp, J., 2015, Con-trasting siliciclastic-evaporite strata in subsurface andoutcrop: An example from the Permian NippewallaGroup of Kansas, U.S.A.: Journal of SedimentaryResearch, doi: https://doi.org/10.2110/jsr.2015.43
Bozeman, S., ed., 1987, The D.C. Jester Cave system:Central Oklahoma Grotto, Oklahoma City, OK, Okla-homa Underground, Vol. 14, 56 p.
Bozeman, J., 2003, Exploration of western Oklahomagypsum caves, in Johnson, K.S., and Neal, J.T.,eds., Evaporite karst and engineering/environmentalproblems in the United States: Oklahoma GeologicalSurvey, Circular 109, p. 57-64. http://ogs.ou.edu/docs/circulars/C109.pdf
Bozeman, J., andBozeman, S., 2002, Speleology of gyp-sum caves in Oklahoma: Carbonates and Evaporites,Vol. 17, No. 2, p. 107-113.
Compass, http://fountainware.com/compass/ Accessed5/9/2018
Dasher, G. R., 1994. On Station. Huntsville, Alabama35810-4431, USA: National Speleology Society, Inc.
Fay, R.O., 1964 The Blaine and related formations ofnorthwestern Oklahoma and southern Kansas: Okla-homa Geological Survey, Bulletin 98, 238 p.
Foster, T.M., Soreghan, G.S., Soreghan, M.J., Benison,K.C., and Elmore, R.D., 2014, Climatic and palaeo-geographic signi!cance of aeolian sediment in theMiddle Permian Dog Creek Shale (MidcontinentU.S.A.): Palaeogeography, Palaeoclimatology, Palae-oecology, Vol. 402, p. 12-29.
Glennie, K.W., 1987, Desert sedimentary environments,present and past: a summary: Sedimentary Geology,Vol. 50, p. 135-165.
Golonka, J., Ross, M.I. and Scotese, C.R., 1994, Phan-erozoic paleogeographic and paleoclimatic modelingmaps, in Embry, A.F., Beauchamp, B. and Glass,D.J., eds, Pangea: Global Environments and Resour-ces: Canadian Society of PetroleumGeologists, Mem-oir 17, p. 1-47.
Golonka, J., and Ford, D., 2000, Pangean (LateCarboniferous–Middle Jurassic) paleoenvironmentand lithofacies: Palaeogeography, Palaeoclimatology,Palaeoecology, Vol. 161, p. 1-34.
Gustavson, T.C., Finley, R.J., and McGillis, K.A., 1980,Regional dissolution of Permian salt in the Anadarko,Dalhart, and PaloDuroBasins of the Texas Panhandle:Texas Bureau of Economic Geology, Report of Inves-tigations 106, 40 p.
Holdoway, K.A., 1978, Deposition of evaporites andred beds of the Nippewalla Group, Permian, westernKansas: Kansas Geological Survey, Bulletin 215,43 p.
Hovorka, S.D., and Granger, A., 1988, Subsurface tosurface correlation of Permian evaporites – San An-dres – Blaine – Flowerpot relationships, Texas Pan-handle, in Morgan, W.A., and Babcock, J.A., eds.,Permian rocks of the Midcontinent: Society ofEconomic Paleontologists and Mineralogists, SpecialPaper 1, p. 137-159.
Jewett, J.M., 1935, Some measurements at the Sun CityNatural Bridge: KansasAcademy of Science, Transac-tions, Vol. 38, p. 189-190.
Johnson, K.S., 1972, Northwest Oklahoma; Book 2 ofGuidebook for geologic !eld trips inOklahoma: Okla-homa Geological Survey, Educational Publication 3,42 p.
Johnson, K.S., 1981, Dissolution of salt on the east "ankof the PermianBasin in the southwesternU.S.A.: Jour-nal of Hydrology, Vol. 54, p. 75-93.
Johnson, K.S., 1986, Hydrogeology and recharge of agypsum-dolomite karst aquifer in southwestern Okla-homa, U.S.A., in Gunay, G., and Johnson, I.V., eds.,Karst water resources; Proceedings of the Interna-tional Symposium onKarst Water Resources, Ankara,Turkey, July 7–19, 1985: International Associationof Hydrological Sciences, Publication No. 161,p. 343-357.
Johnson, K.S., 1990a, Hydrogeology and karst of theBlaine gypsum-dolomite aquifer, southwestern Okla-homa: Oklahoma Geological Survey, Special Publica-tion 90–5, 31 p.
Gypsum Karst in South-Central Kansas 315

Johnson, K.S., 1990b, Standard outcrop section of theBlaine Formation and associated strata in southwest-ern Oklahoma: Oklahoma Geology Notes, Vol. 50.144-168.
Johnson, K.S., 1991, Guidebook for geologic !eld tripsin Oklahoma: Northwest Oklahoma: Oklahoma Geo-logical Survey, Educational Publication 3, 42 p.
Johnson, K.S.,1992, Evaporite karst in the PermianBlaine Formation and associated strata in westernOklahoma,USA, inBack,W., Herman, J.S., and PalocH., eds., Hydrogeology of selected karst regions: Ver-lagHeinzHeisse PublishingCo., Hannover, Germany,International Association Hydrogeologists, Vol. 13,p. 405-420.
Johnson, K.S., 1996, Gypsum karst in the United States:International Journal of Speleology, Vol. 25, Nos. 3-4,p. 183-193, https://doi.org/10.5038/1827-806X.25.3.13.
Johnson, K.S., 2003, Evaporite karst in the PermianBlaine Formation and associated strata of westernOklahoma, in Johnson, K.S., and Neal, J.T., eds.,Evaporite karst and engineering/environmental prob-lems in the United States: Oklahoma GeologicalSurvey, Circular 109, p. 41-55. http://ogs.ou.edu/docs/circulars/C109.pdf
Johnson, K.S., 2018, Gypsum caves of north Texas andwestern Oklahoma, in Stafford, K.W., and Veni, G.,eds., Hypogene karst of Texas: Texas SpeleologicalSurvey, Monograph 3, p. 111-122. https://www.texasspeleologicalsurvey.org/PDF/Hypogene_Karst_of_Texas.pdf
Johnson, K.S., 2021, Overview of evaporite karst in theGreater Permian Evaporite Basin (GPEB) of TX, NM,OK, KS, and CO, in Johnson, K.S., Land, L., andDecker, D.D., eds., Evaporite karst in the GreaterPermianEvaporite Basin (GPEB) of Texas, NewMex-ico, Oklahoma, Kansas, and Colorado: OklahomaGeological Survey, Circular 113.
Jordan, L., and Vosburg, D.L., 1963, Permian Salt andAssociated Evaporites in the Anadarko Basin of theWestern Oklahoma–Texas Panhandle Region: Okla-homa Geological Survey, Bulletin 102, 76 p.
McGregor, D.R., Pendry, E.C., and McGregor, D.L.,1963, Solution caves in gypsum, north-central Texas:Journal of Geology, Vol. 71, p. 108-115.
McLaughlin, T.G., 1942, Geology and ground-water re-sources of Morton County, Kansas: Kansas Geologi-cal Survey, Bulletin 40, p. 1-126.
Merriam, D.F., 1955, Jurassic rocks in Kansas: Ameri-can Association of Petroleum Geologists, Bulletin,Vol. 39, p, 31-46.
Merriam, D.F., 1957, Subsurface correlation and strati-graphic relation of rocks of Mesozoic age in Kansas:
Kansas Geological Survey, Oil and Gas Investigations14, p. 1-25.
Merriam, D.F., 1962, History of Precambrian studies inKansas: Kansas Academy of Science, Transactions,Vol. 65, No. 4, p. 433-447.
Merriam, D.F., and Mann, C. J., 1957, Sinkholes andrelated geologic features in Kansas: Kansas Academyof Science, Transactions, Vol. 60, No. 3, p. 207-243.
Mudge, M.R., 1967, Central Midcontinent region, inMcKee, E.D., and Oriel, S.S., eds., Paleotectonic in-vestigations of the Permian System in the UnitedStates: US Geological Survey, Professional Paper515, p. 97-128.
Moore, R.C., Frye, J.C., Jewett, J.M., Wallace, L., andO’Connor, H.G., 1951, The Kansas rock column:Kansas Geological Survey, Bulletin 89, 132 p.
Myers, A.J., Gibson, A.M., Glass, B.P., and Patrick,C.R., 1969,Guide toAlabaster Cavern andWoodwardCounty, Oklahoma: Oklahoma Geological Survey,Guidebook 15, 38 p.
Nance, H.S., 1988, Inter!ngering of evaporites and redbeds: an example from theQueen/GrayburgFormation,Texas: Sedimentary Geology, Vol. 56, p. 357-381.
NOAA, 2018, National Oceanic and AtmosphericAdministration, National Centers for EnvironmentalInformation, Climate at a Glance, http://www.ncdc.noaa.gov/cag/ (accessed March 6, 2018).
Norton, G.H., 1939, Permian red beds of Kansas: Amer-ican Association of Petroleum Geologists, Bulletin,Vol. 23, p. 1751-1819.
Quinlan, J.F., Smith, R.A., and Johnson, K.S., 1986,Gypsum karst and salt karst of the United States ofAmerica, in Atti Symposio Internationale sul Car-sismo Nelle Evaporiti (Proceedings, InternationalSymposium on Karst in Evaporites), Palermo, Italy,October 27–30, 1985: Le Grotte d’Italia (4), v. 13,p. 73-92.
Runkle, D.L., and Johnson, K.S., 1988, Hydrogeologicstudy of a gypsum-dolomite karst aquifer in south-western Oklahoma and adjacent parts of Texas,U.S.A., in Karst hydrogeology and karst engineeringprotection: Geological Publishing House, Beijing,China, Proceedings of the IAH 21st Congress, Guilin,China, Vol. 21, Part 2, p. 400-405.
Sweet, A.C., Soreghan, G.S., Sweet, D.E., Soreghan,M.J., and Madden, A.S., 2013, Permian dust in Okla-homa: source and origin for Middle Permian (Flower-pot–Blaine) red beds in western tropical Pangaea:Sedimentary Geology, Vol. 284–285, p. 181-196.
Tomlinson, C.W., 1916, The origin of red beds: a studyof the conditions of origin of the Permo-Carboniferousand Triassic red beds of the western United States:Journal of Geology, Vol. 24, p. 28–253.
316 Kaitlyn L. Gauvey and Jonathan B. Sumrall

Turner, P., 1980, Continental red reds: NewYork, Elsev-ier, Developments in Sedimentology 29, 562 p.
Walker, T.R., 1967, Formation of red beds inmodern andancient deserts: Geological Society of America, Bul-letin, Vol. 78, p. 353-368.
White, W.B., 1988, Geomorphology and Hydrology ofKarst Terrains, New York, Oxford University Press,464 p
White, W.B., 1988, Geomorphology and hydrology ofkarst terrains:NewYork,OxfordUniversityPress, 464p.
Young, J., and Beard, J., 1993, Caves in Kansas: KansasGeological Survey, Educational Series 9, 48 p.
Zharkov,M.A., and Chumakov, N.M., 2001, Paleogeog-raphy and sedimentation settings during Permian–Triassic reorganizations in biosphere: Stratigraphyand Geological Correlation, Vol. 9, p. 340-363.
Gypsum Karst in South-Central Kansas 317


INTRODUCTION
In late July, 2013, a large sinkhole formed in WallaceCounty, western Kansas, about 9 mi north of the town ofWallace, and 12 mi north–northeast of Sharon Springs(Fig. 1). This sink, informally referred to in the past asthe “Wallace,” the “Sharon Springs,” or the “WallaceCounty”Sinkhole, is herein named the “WallaceSinkhole”
after the nearest town. The sinkhole developed in an areaof sparse drilling for oil and gas or irrigation water, butin an area underlain by Permian-age salt beds in theFlowerpot and Blaine Formations at a depth of about2,300–2,400 ft. These Permian salt beds are known tobe naturally dissolved extensively in parts of westernKansas (Campbell, 1963; Schumaker, 1966; Holdoway,1978), and thus, dissolution of these salts, and creation of
Johnson, Kenneth S., 2021, Salt Dissolution and the Wallace Sinkhole in the Sharon Springs–Wallace Area, WallaceCounty, Western Kansas, in Johnson, K. S.; Land, Lewis; and Decker, D. D. (eds.), Evaporite Karst in the GreaterPermian Evaporite Basin (GPEB) of Texas, NewMexico, Oklahoma,Kansas, andColorado: OklahomaGeologicalSurvey, Circular 113, p. 319–335.
319
0LMBIPNB�Geological�Survey�Circular�113,�2021
Salt�Dissolution�and�the�Wallace�Sinkhole�in�theSharon�Springs–Wallace�Area,�Wallace�County,�Western�Kansas
Kenneth�S.�JohnsonRetired�Geologist,�Oklahoma�Geological�Survey,
Norman,�Oklahoma
"#453"$5��4BMU� CFET� JO� UIF�1FSNJBO�'MPXFSQPU� BOE�#MBJOF�'PSNBUJPOT� BSF� FYUFOTJWFMZ�EJTTPMWFE�JO�QBSUT�PG�XFTUFSO�,BOTBT �BOE�UIJT�IBT�SFTVMUFE�JO�EFWFMPQNFOU�PG�B�OVNCFS�PG�TJOLIPMFT�JO�UIF�SFHJPO��5IF�DVSSFOU�TUVEZ�PG�FWBQPSJUF�LBSTU�JO�UIF�4IBSPO�4QSJOHTo8BMMBDF�BSFB� JO� 8BMMBDF� $PVOUZ� GPDVTFT� PO� UIF� EJTUSJCVUJPO � UIJDLOFTT � EFQUI � TUSVDUVSF � BOE�EJTTPMVUJPO�PG�UIFTF�UXP�TBMU�VOJUT �BOE�PO�UIFJS�SFMBUJPOTIJQ�UP�EFWFMPQNFOU�PG�UIF�8BMMBDF�4JOLIPMF �GPSNFE�JO�+VMZ ����� �BOE�GJWF�FBSMJFS�GPSNFE�TJOLIPMFT��UIF�4NPLZ�#BTJO�$BWF�JO �UIF�0ME�.BJE�T�1PPM �BOE�UISFF�TJOLT�JO�#SBETIBX�%SBX �OFBS�UIF�8BMMBDF�4JOLIPMF�
4BMU�CFET� JO� UIF�BSFB�QSPCBCMZ�BSF�NPTUMZ�EJTQMBDJWF�IBMJUF� UIBU�EFWFMPQFE�XJUIJO�B�SFEEJTI�CSPXO�NVETUPOF�NBUSJY��5IF�'MPXFSQPU�TBMU�JT�UZQJDBMMZ�����UP�BMNPTU�����GU�UIJDL�JO�NPTU�PG� UIF�BSFB �CVU� JO� UIF�XFTU� JU� JT�EJTTPMWFE�BOE�BMM�PWFSMZJOH�TUSBUB�BSF�ESPQQFE�EPXO�BCPVU�����������GU�BDSPTT�B�TBMU�EJTTPMVUJPO�GSPOU��4BMU�UIBU�PDDVST�JO�UIF�NJEEMF�PG�UIF�#MBJOF�'PSNBUJPO�UZQJDBMMZ�SBOHFT�GSPN����UP����GU�UIJDL�JO�UIF�FBTU�IBMG�PG�UIF�BSFB �CVU�JT�NPTUMZ�EJTTPMWFE�BOE�NJTTJOH�JO�UIF�XFTU��"MUIPVHI�NPTU�PG�UIF�TBMU�EJTTPMVUJPO�PDDVSSFE�TPNFUJNF�CFUXFFO�-BUF�$SFUBDFPVT�BOE�5FSUJBSZ�UJNF �JU�JT�TUJMM�IBQQFOJOH�MPDBMMZ��
4USVDUVSBM�NBQQJOH� PG� UIF� BSFB� TIPXT� B� SFHJPOBM� EJQ� PG� TUSBUB� UP� UIF� OPSUI� BU� MFTT�UIBO� �� � CVU� UXP� OFXMZ� JEFOUJGJFE� GBVMUT� JOUFSSVQU� UIJT� QBUUFSO� BOE� BQQFBS� UP� CF� SFMBUFE�UP�SFDFOU�TJOLIPMF�EFWFMPQNFOU��5IF�EFQUI�UP�UIF�TBMU�SBOHFT�GSPN�BCPVU�� ����UP�� ����GU�JO�UIF� BSFB � BOE� JU� BQQFBST� UIBU� GBVMUT� BOE�PS� GSBDUVSFT� JO� PWFSMZJOH� TUSBUB� BSF� BMMPXJOH� GSFTI�HSPVOE�XBUFS� UP� DJSDVMBUF� EPXO� UP� UIF� TBMUT� BOE� MPDBMMZ� DBVTF� UIFJS� EJTTPMVUJPO�� 8IFO� B�EJTTPMVUJPO� DBWJUZ� JO� UIF� TBMU� CFDPNFT� UPP� MBSHF � UIF� SPPG� PG� UIF� DBWJUZ� DPMMBQTFT�� UIJT�BMMPXT� PWFSMZJOH�SPDLT� UP�ESPQ� JOUP� UIF� DBWJUZ� BOE� GPSN�B� DPMMBQTF�CSFDDJB�PS�CSFDDJB�QJQF�UIBU�DBO�SFBDI�UIF�MBOE�TVSGBDF�BT�B�TJOLIPMF�UIBU�UZQJDBMMZ�IBT�B�EJBNFUFS�PG�BCPVU�����GU�
5IF�8BMMBDF�4JOLIPMF�IBT�B�EJBNFUFS�PG�BCPVU�����GU�BOE�PSJHJOBMMZ�JU�XBT�BCPVU����GU�EFFQ�� 'PSUVOBUFMZ � JU� GPSNFE� JO� QBTUVSF� MBOE � BOE� UIFSF�XFSF� OP� JOKVSJFT� PS� JOGSBTUSVDUVSF�EBNBHF�� "U� UIJT� TJUF � UIF� NJEEMF� #MBJOF� TBMU� JT� BCPVU� � ���� GU� EFFQ � BOE� UIF� VOEFSMZJOH�'MPXFSQPU� TBMU� JT� BCPVU� � ���� GU� EFFQ�� 5IJT� JT� RVJUF� EFFQ� GPS� EJTTPMVUJPO� UP� PDDVS � CVU� JU�BQQFBST�UIBU�POF�PG�UIF�OFXMZ�NBQQFE�GBVMUT�FYUFOET�UP�UIF�TJOLIPMF�BOE�NBZ�CF�B�QBUIXBZ�GPS� GSFTI�XBUFS� UP�SFBDI�BOE�EJTTPMWF� UIF�TBMU��.PTU�PG� UIF�PUIFS�TJOLIPMFT� JO� UIF�BSFB�NBZ�IBWF�B�TJNJMBS�PSJHJO�

a deep-seated cavity that collapsed,was initially believedto be responsible.
Preliminary studies by Lynn Watney of the KansasGeological Survey (KGS), and early statements by RexBuchanan, then-Director of KGS, showed a belief thatthe sinkhole resulted from collapse into a salt-dissolutioncavity, and I concur with this early interpretation of saltkarst. To evaluate this hypothesis, I undertook a studyof salt deposits in the Sharon Springs–Wallace area toshow the distribution, thickness, depth, structure, anddissolution of the salt beds, and to relate these data tothe location and probable cause of the Wallace Sinkholeand !ve other sinkholes in the area.
Earlier regional and local studies have providedvaluableinformation for the current study. Primary investigationsof several salt units in western Kansas were conductedby Campbell (1963), Schumaker (1966), and Holdoway
(1978):�they�prepared�maps�showing�the�thickness�and�dis-tribution�of�the�salt�units,�and�their�data�also�show�the�gen-eral�dissolution�limits�of�each�of�the�salts.�General�studies�or�summaries�of�sinkholes�and�collapse� features� in�western�Kansas�were�made�by�Johnson�(1901),�Schoewe,�(1949),�Merriam� and�Mann� (1957),�Merriam� (1963,�Appendix�D),�and�Macfarlane�and�Wilson� (2006).�Speci!c� reports�on� sinkholes� in�Wallace�County� are� by�Moore� (1926a,�b),�Russell�(1929),�Elias�(1931),�Frye�(1950),�and�Merriam�and�Mann�(1957).
As�far�as�rock�terminology�used�in�this�report:�1)�“salt”�in�all�cases� is�halite�(NaCl);�2)� the� term�“anhydrite”� is�used,�although�in�some�areas,�the�rock�may,�in�fact,�be�gypsum;�and�3)� the�word�“shale”� refers� to�shale,�or� to�a�mix� of� shale,� siltstone,�mudstone,� and� perhaps� even�some� sand�� shale� is� probably� dominant,� but� the� true�and�complete�lithology�JT�uncertain.
Figure 1. Location ofWallace Sinkhole and !ve other sinkholes in the Sharon Springs–Wallace area,Wallace County,Kansas. Base map is USGS 1:100,000-scale topographic maps for the Sharon Springs and Goodland quadrangles:both maps prepared in 1985.
320 Kenneth S. Johnson
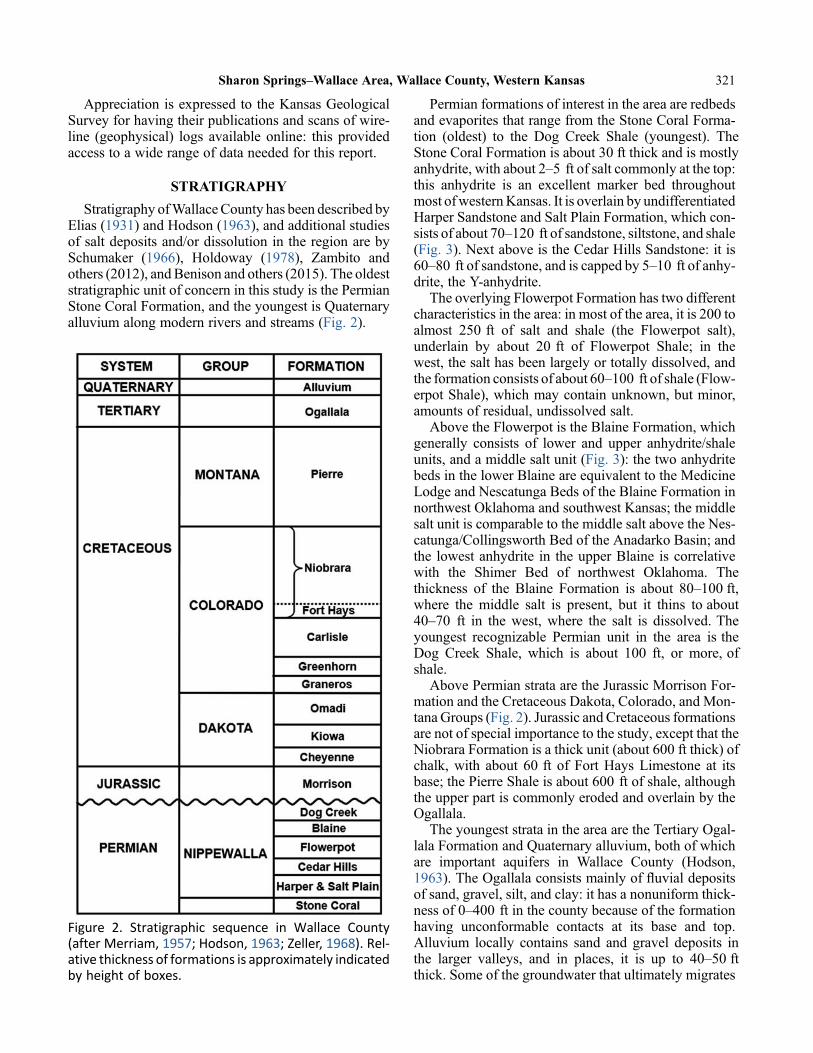
Appreciation is expressed to the Kansas GeologicalSurvey for having their publications and scans of wire-line (geophysical) logs available online: this providedaccess to a wide range of data needed for this report.
STRATIGRAPHY
Stratigraphy ofWallaceCounty has been described byElias (1931) and Hodson (1963), and additional studiesof salt deposits and/or dissolution in the region are bySchumaker (1966), Holdoway (1978), Zambito andothers (2012), andBenison and others (2015). The oldeststratigraphic unit of concern in this study is the PermianStone Coral Formation, and the youngest is Quaternaryalluvium along modern rivers and streams (Fig. 2).
Permian�formations�of�interest�in�the�area�are�redbeds�and�evaporites�that�range�from�the�Stone�Coral�Forma-tion� (oldest)� to� the�Dog�Creek� Shale� (youngest).� The�Stone�Coral�Formation�is�about�30�ft�thick�and�is�mostly�anhydrite,�with�about�2–5� ft�of�salt�commonly�at�the�top:�this� anhydrite� is� an� excellent�marker� bed� throughout�most�of�western�Kansas.�It�is�overlain�by�undifferentiated�Harper�Sandstone�and�Salt�Plain�Formation,�which�con-sists�of�about�70–120� ft�of�sandstone,�siltstone,�and�shale�(Fig.�3).�Next�above�is�the�Cedar�Hills�Sandstone:�it�is�60–80� ft�of�sandstone,�and�is�capped�by�5–10� ft�of�anhy-drite,�the�Y-anhydrite.
The�overlying�Flowerpot�Formation�has�two�different�characteristics�in�the�area:�in�most�of�the�area,�it�is�200�to�almost� 250� ft� of� salt� and� shale� (the� Flowerpot� salt),�underlain� by� about� 20� ft� of� Flowerpot� Shale;� in� the�west,�the�salt�has�been�largely�or�totally�dissolved,�and�the�formation�consists�of�about�60–100� ft�of�shale�(Flow-erpot�Shale),�which�may�contain�unknown,�but�minor,�amounts�of�residual,�undissolved�salt.
Above�the�Flowerpot�is�the�Blaine�Formation,�which�generally� consists� of� lower� and� upper� anhydrite/shale�units,�and�a�middle�salt�unit�(Fig.�3):�the�two�anhydrite�beds�in�the�lower�Blaine�are�equivalent�to�the�Medicine�Lodge�and�Nescatunga�Beds�of�the�Blaine�Formation�in�northwest�Oklahoma�and�southwest�Kansas;�the�middle�salt�unit�is�comparable�to�the�middle�salt�above�the�Nes-catunga/Collingsworth�Bed�of�the�Anadarko�Basin;�and�the� lowest�anhydrite� in� the�upper�Blaine� is�correlative�with� the� Shimer� Bed� of� northwest� Oklahoma.� The�thickness� of� the�Blaine� Formation� is� about� 80–100�ft,�where� the�middle� salt� is� present,� but� it� thins� to�about�40–70� ft� in� the�west,�where� the� salt� is� dissolved.�The�youngest� recognizable� Permian� unit� in� the� area� is� the�Dog� Creek� Shale,�which� is� about� 100� ft,� or�more,�of�shale.
Above�Permian�strata�are�the�Jurassic�Morrison�For-mation�and�the�Cretaceous�Dakota,�Colorado,�and�Mon-tana�Groups�(Fig.�2).�Jurassic�and�Cretaceous�formations�are�not�of�special�importance�to�the�study,�except�that�the�Niobrara�Formation�is�a�thick�unit�(about�600�ft�thick)�of�chalk,�with� about� 60� ft�of�Fort�Hays�Limestone� at� its�base;�the�Pierre�Shale�is�about�600� ft�of�shale,�although�the�upper�part�is�commonly�eroded�and�overlain�by�the�Ogallala.
The�youngest�strata�in�the�area�are�the�Tertiary�Ogal-lala�Formation�and�Quaternary�alluvium,�both�of�which�are� important� aquifers� in� Wallace� County� (Hodson,�1963).�The�Ogallala�consists�mainly�of�"uvial�deposits�of�sand,�gravel,�silt,�and�clay:�it�has�a�nonuniform�thick-ness�of�0–400� ft�in�the�county�because�of�the�formation�having� unconformable� contacts� at� its� base� and� top.�Alluvium� locally� contains� sand� and� gravel� deposits� in�the� larger� valleys,� and� in� places,� it� is� up� to� 40–50�ft�thick.�Some�of�the�groundwater�that�ultimately�migrates
Figure 2. Stratigraphic sequence in Wallace County(after Merriam, 1957; Hodson, 1963; Zeller, 1968). Rel-ative thickness of formations is approximately indicatedby height of boxes.
Sharon Springs–Wallace Area, Wallace County, Western Kansas 321

two� salt� units� to� be� 212� and� 38� ft� thick,� respectively�(Fig.�3),�and� the�well� log� is� representative�of� the� salt-bearing� Flowerpot–Blaine� sequence� throughout� the�area.� The� depth� to� the� salts� in� the� Adams� well� is�2,310� ft� to� the�middle�Blaine� salt,� and�about�2,385� to�the�Flowerpot�salt.
Dissolution�of�salt�units�in�the�area�appears�to�always�start�with�removal�of�the�youngest�(uppermost)�salt,�the�middle�Blaine�salt,�and�then�progresses�down�to�partial�and�then�total�removal�of�salt�in�the�Flowerpot�(Fig.�4).�The� location�of�wells�used� in�Figure�4,�as�well�as� the�Adams�well� and� the�other� cross� sections� discussed� in�the�report,�is�shown�in�Figure�5.
Widespread�natural�dissolution�of�salt�beneath�non-soluble� strata� results� in� interstratal� karst,� and� this� can�be� characterized� as� sheetlike� dissolution.�An� example�of�this�is�widespread�removal�in�the�past�of�the�Flowerpot�salt�in�the�western�part�of�the�study�area�(Fig.�6),�accom-panied�by�settling�or�subsidence�of�overlying�rock�over�a�fairly�large�area.�In�contrast�to�such�widespread�salt�dis-solution,�present-day�dissolution�occurs�mainly�where�an� underground� cavity� is� created� in� a� relatively� small�area:�overlying�rock�then�collapses�chaotically�into�the�cavity,� resulting� in� a� collapse� breccia� or� breccia� pipe�that�can�reach�the�land�surface�as�a�sinkhole�several�hun-dred�feet�wide.
There� are� no� known� cores� of� the� salt� units� in� the�Sharon� Springs–Wallace� area,� and� thus� the� lithology�shown�in�illustrations�of�this�report�is�based�upon�inter-pretation�of�geophysical�logs.�However,�there�are�several�reports�in�the�region�that�are�based�upon�examination�of�cores�of�Permian�rocks,�including�salts�in�the�Flowerpot�and� Blaine� Formations.� Holdoway� (1978)� describes�cores� of� the�Atomic� Energy�Commission� (AEC)� test�hole�5�in�Wichita�County,�about�30�mi�south–southeast�of�Sharon�Springs,�and�both�Zambito�and�others�(2012)�and� Benison� and� others� (2015)� describe� cores� from�Amoco’s�Rebecca�K.�Bounds� #1�well� (RKB�well)� in�Greeley�County,�about�30�mi�south–southwest�of�Sharon�Springs.�These�two�reports�provide�valuable�information�about� the�petrology�of� the� salt�units.� In�addition,�both�Schumaker�(1966)�and�Holdoway�(1978)�have�provided�excellent�maps�and�cross�sections�of�the�Flowerpot�salt�and�Blaine�Formation� throughout�western�Kansas:� the�current� report� provides� more-detailed� data� on� these�rock�units�in�the�Sharon�Springs–Wallace�area�of�Wallace�County.
Flowerpot�SaltThe�Flowerpot�salt�underlies�most�of�the�study�area,�
but�is�largely�or�totally�removed�by�sheetlike�dissolution�in�the�west�(Fig.�6).�Both�Schumaker�(1966)�and�Holdo-way�(1978)�show�that�the�Sharon�Springs–Wallace�area�is� near� the� limits� of� the� Flowerpot� salt,� and� that� it� is�mostly� or� totally� dissolved� farther� to� the�west.� In� the
Figure�3.�Geophysical� log�and� interpretive� lithology�ofpart� of� the� General� Crude� Oil� Co.,� Delia� F.� AdamsNo.�1�well,�located�2�mi�(3.2�km)�south�of�the�WallaceSinkhole.�The�well�is�located�in�C�NE�NE,�sec.�15,�T.�12�S.,R. 39�W.,�and�is�the�closest�borehole�log�to�the�WallaceSinkhole.
down�to�dissolve�Permian�salt�beds�certainly�must�have�its�origin�in�these�two�aquifers.
SUBSURFACE�SALT�UNITS�AND�DISSOLUTION
Salt�units�in�the�Sharon�Springs–Wallace�area�are�in�the�Permian�Flowerpot�and�Blaine�Formations.�The�Gen-eral�Crude�Oil�Co.,�Delia�F.�Adams�No.�1�well,�drilled�about�2�mi�south�of�the�Wallace�Sinkhole,�shows�these
322 Kenneth S. Johnson

current�study�area,�the�Flowerpot�salt�typically�is�200�to�almost� 240� ft� thick,� where� fully� developed,� and� its�thickness�drops�off�sharply�(in�places�within�just�1�or�2�miMFT)� at� the� dissolution� front,� beyond� which� the�Flowerpot�Shale� contains� little� or� no� recognizable� salt�(Figs.�4,�6).�Typically,�where� the�Flowerpot�salt� is�well�developed,� about� 20–30� ft� of� shale� (Flowerpot� Shale)�separates�the�salt�from�the�underlying�Y-anhydrite�of�the�Cedar�Hills�Sandstone� (Figs.� 3,� 4);� farther�west,� these�20–30� ft�of�shale�are� included�with� the�overlying,�salt-de!cient�strata�as�the�Flowerpot�Shale.
The�best�petrologic�descriptions�of�the�Flowerpot�salt�in�the�region�are�based�on�cores�from�the�AEC�#5�and�the�RKB� wells.� Flowerpot� salt� in� the� AEC� #5� well� is�described�as�“!ne�to�coarse�crystals�of�halite,�intimately�associated� with� red,� anhydritic,� silty� mudstone.� The�halite�is�not�bedded,�but�several�thin�beds�of�mudstone�and� anhydrite� occur� within� the� sequence�: : :Halite� in�some�parts�of� the�Flower�pot� [sic],�especially� lower� in�the�section,�appears�to�have�grown�within�the�sediments,�displacing� soft,� silty�mud� as� it� grew�: : :During� halite�growth,�clay-size�impurities�were�displaced�and�became�concentrated�around�grain�margins”�(Holdoway,�1978).
In cores of the RKB well, the Flowerpot “consistsalmost exclusively of displacive halite within areddish-orange mudstone matrix with varying ratio ofhalite to siliciclastics” (Zambito and others, 2012). “Dis-placive halite” is described byBenison and others (2015)as “a lithology in which red siliciclastic mudstone orsandstone hosts randomly oriented halite crystals,”and they note that displacive halite is the dominantform of salt in the RKB core. Examples of salt fromthe RKB well, with varying degrees of red clastics, areshown in Figure 7: I assume that salts in the SharonSprings–Wallace area are similar to the range of displa-cive salts shown in the RKB core.
Therefore, based upon descriptions of the nearestFlowerpot salt cores, those in the AEC and RKB wells,I assume that the Flowerpot salt in the Sharon Springs–Wallace area is an impure, displacive salt with varyingamounts of reddish-brown clay and silt. Where the saltis largely or totally dissolved, the Flowerpot sequencehas been compressed, caused by the loss of salt andthe weight of the overlying rock column, and the remain-ing shale is only a fraction of the original thickness of thesalt unit.
Figure 4. Stratigraphic cross section showing dissolution of uppermost salts just north of Sharon Springs (“SP” onLocationMap). Between wells C and B, salt is dissolved in the middle part of the Blaine Formation, and in the upperpart of the Flowerpot salt; and between wells B and A, all the remaining Flowerpot salt is dissolved.
Sharon Springs–Wallace Area, Wallace County, Western Kansas 323

Benison and others (2015) conducted experiments todetermine semiquantitatively how much rock volumeand thickness was lost by dissolution of salts in theRKB core. They took six displacive-salt samples, threefrom the Blaine and three from the Flowerpot, and dis-solved them. The salt samples were similar to thoseshown in Figures 7B, C, and D. Sample thicknessesthat they used ranged from 5 to 26.7 vertical centimeters(2–10.5 vertical inches) of core, and aggregated a total1.1 m (3.6 ft). The amount of rock lost to dissolutionby height (thickness) ranged from 53.2 to 88.0%, andaveraged 74.2%; the amount of rock lost to dissolutionby mass ranged from 68.2 to 95.1%, and averaged85.5%. The authors noted that samples with a highsalt-to-clastics ratio had a higher loss of rock thicknessand mass, whereas those with a low salt-to-clastics ratiohad a lower, but still signi!cant, loss of rock thicknessand mass.
Inasmuch as deep-subsurface dissolution of salt, suchas in the Sharon Springs–Wallace area, occurs under aheavy overburden of overlying rocks (generally2,000–2,500-ft deep), I assume that much of the porespace caused by salt dissolution is closed (compressedand squashed), and that a loss-of-rock percentage at
Figure 5. Map showing location of well logs used in thisreport, and thosewell logs that are used in other !guresin the Sharon Springs–Wallace area. Also shown areknown sinkholes, faults, and the approximate dissolu-tion front for the Flowerpot salt (green line).
Figure�6.�Map�showing�thickness�of�the�Flowerpot�salt�inthe�Sharon�Springs–Wallace�area.
depth� would� be� somewhere� between� the� height� and�mass�data�reported�by�Benison�and�others�(2015).�I�sus-pect�that�with�the�compaction,�the�loss�of�rock�thickness�after�dissolution�of�displacive�salt�in�the�Sharon�Springs–Wallace� area� probably� averages� somewhere� near� the�midpoint�of� their� two�data�sets� (height�and�mass�data),�namely�about�80%,�and�that�dissolution�of�the�displacive�salt�reduces�the�remaining�clastic�sequence,�on�average,�to�about�20%�of�the�thickness�of�the�original�salt�unit.
Examination�of� the� thickness�of�Flowerpot�strata� in�Figure�4�supports�my�assumption�that,�in�general,�disso-lution� of� displacive� salt� in� the� study� area� reduces� the�thickness� of� the� remaining� Flowerpot� clastic�material�to�about�20%�of�the�thickness�of�the�original,�undissolved�salt�unit.�In�well�C�(Fig.�4),�the�Flowerpot�salt�is�174�ft�thick,�which�would�compress�to�174x0.2=34.8� ft�upon�dissolution,�and�the�Flowerpot�Shale�at�its�base�is�about�26�ft�thick:�therefore,�the�total�thickness�of�postdissolu-tion�Flowerpot�clastics�in�well�C�would�be�about�60.8� ft.�In� well� B,� some� of� the� Flowerpot� salt� is� dissolved,�and� the� remaining� 125� ft� of� salt� would� compress� to�125x0.2=25� ft:�the�Flowerpot�Shale�at�its�base�is�about�35� ft�thick,�and�thus,�the�total�thickness�of�postdissolu-tion�Flowerpot�clastics�in�well�B�would�be�about�60� ft.�In�well�A,�all�the�salt�is�dissolved,�and�the�total�thickness
324 Kenneth S. Johnson

of�the�Flowerpot�Shale�here�is�57� ft.�Therefore,�in�well�A,�where� all� salt� is� dissolved,� the� Flowerpot� Shale� (57�ft�thick)�is�about�as�thick�as�the�proposed�postdissolution�thickness�of�Flowerpot�clastics� in�well�C� (60.8� ft)�and�in�well�B�(60� ft).�In�other�parts�of�the�study�area,�where�it�seems�that�the�salt�is�missing,�and�the�thickness�of�the�residual�Flowerpot�Shale�is�more�than�20%�of�the�thick-ness�of�the�Flowerpot�salt�farther�to�the�east,�I�assume�that�not�all�of�the�salt�is�dissolved—but�the�residual�salt�is�not�recognizable�on�geophysical�logs.
Middle�Blaine�Formation�SaltThe� total� thickness� of� the� Blaine� Formation� in� the�
study� area� generally� ranges� from� about� 75� to� 100� ft�thick�in�the�east,�and�is�less�than�50�ft�thick�throughout�much�of� the�west� (Fig.� 8).� The� formation� consists� of�lower� and� upper� anhydrite/shale� units,� and� a� middle�salt� unit�(Figs.� 3,� 4).� Salt� in� the�middle� of� the�Blaine�typically� ranges� from�35� to�50�ft� thick� in� the� east�half�of�the�study�area,� and� is�mostly� dissolved� and�missing�in� the� west� (Fig.� 9):� there�are,�however,� two� outlying�sites�of�residual� salt� in� the�west,�where� the� salt�unit� is�20�and�39�ft�thick.
The�middle�Blaine� salt� is� the� shallowest� salt� in� thearea,� and� apparently� is� always� the� !rst� salt� to� be� dis-solved.� In� addition� to� the� large� area� of� sheetlike,� total�dissolution�in�the�west,�there�are�several�locations�in�the�east�where� all� the� salt� is� removed,� despite� being� sur-rounded�by�areas�of�relatively� thick�middle�Blaine�salt.�This�shows�that�there�are�some�processes�whereby�salt-dissolving�water� is� able� to� percolate/migrate� down� to�the� salt� to� the� east� of� the�main� dissolution� front,� and�similarly,�it�is�evident�that�all�salt�is�not�removed�to�the�west� of� the� main� dissolution� front� (see� residual� salt�masses�in�R.�41�W.,�Fig.�9).
Salt� in� the�middle�of� the�Blaine�Formation� is�wide-spread� in� the� northern� half� of� the� Greater� Permian
Evaporite Basin, as de!ned by Johnson (2021a). It isdocumented in the Anadarko Basin and eastern PaloDuro Basin (Johnson, 2021b), in Baca County, southeastColorado (Askew, 2013), over the Las Animas Arch ineast-central Colorado (Berry, 2018), and in western Kan-sas (Holdoway, 1978;Zambito andothers, 2012;Benisonand others, 2015). This salt unit overlies the Nescatunga/Collingsworth Bed, and underlies the Shimer Bed/Van
Figure�7.�Photos�of�salt�cores�from�the�RKB�well,�about�30�mi�(50�km)�south–southwest�of�the�town�of�Sharon�Springs�(from�Benison�and�others,�2015).�A)�Bedded�salt�in�the�upper�anhydrite/shale�unit�of�the�Blaine�Formation;�high-purity�salt,�with�minor�hematite.�B)�Displacive�salt�near�the�top�of�the�middle�Blaine�salt;�it�has�a�high�salt-to-clasticsratio.�C)�Displacive�salt� in�the� lower�part�of�the�middle�Blaine�salt;� it�has�a�NPSF�typical�salt-to-clastics�ratio.�D)�Displacive�salt�in�undifferentiated�Harper�Sandstone�and�Salt�Plain�Formation;�it�has�a�low�salt-to-clastics�ratio.
Figure 8. Map showing thickness of the Blaine Forma-tion in the Sharon Springs–Wallace area.
Sharon Springs–Wallace Area, Wallace County, Western Kansas 325

9-ft�thickness�estimated�for�the�compressed,�postdissolu-tion�middle�Blaine�salt�in�well�C.
The�Blaine�Formation�should�be�about�60–70-ft�thick�where�all�the�middle�Blaine�salt�has�been�dissolved,�and�the� overlying� beds� have� merely� settled� down� intact�(Fig.�4,�wells�A�and�B).�However,�in�some�wells�where�the�middle�Blaine�salt�has�been�dissolved,�the�Blaine�For-mation�is�abnormally�thin�(less�than�60�ft�thick�in�parts�of�the�northwest,�as�shown�in�Fig.�8),�and�some�anhydrite�beds�appear�to�be�thin�or�missing.�This�can�result�from�brecciation,�collapse,�and�disruption�of�Blaine�anhydrite�beds� above� a� dissolution� zone� (dissolution� of� salt� in�either� the� Blaine� or� the� Flowerpot),� so� that� the� well�was� drilled� through� a� chaotic� interval� where� one� or�more�of� the�disrupted�anhydrite�beds� is�not�penetrated�in�the�borehole.�A�good�example�of�this�is�shown�in�Fig-ure�10,�where�the�Blaine�Formation�is�only�27�ft�thick�in�the�Natural�Gas�Drilling�Co.,�Burk�No.�1,�and�it�appears�that�only�two�of�the�six�anhydrite�beds�were�penetrated�in�the�borehole�(the�other�anhydrite�beds�having�been�dis-rupted� and� broken� up,� or� removed� by� dissolution—at�least�they�were�not�penetrated�in�the�borehole).
Timing�of�Salt�DissolutionDissolution�of� the�Flowerpot�and�Blaine� salts� in� the�
Sharon� Springs–Wallace area occurred at least � sometime�after�deposition�of� the�Fort�Hays�Limestone�at� the�base� of� the�Late�Cretaceous�Niobrara�Formation.�This�is�af!rmed�by�examination�of�two�wells�drilled�on�either�side�of�the�dissolution�front�of�the�Flowerpot�salt�(Fig.�10).�The� combined� thickness� of� the� Flowerpot� and� Blaine�Formations�is�296� ft�in�the�Burk�23-1�well,�on�the�right,�whereas�it�is�reduced�to�120� ft�in�the�Burk�No.�1�well�on�the�left:�therefore,�the�thickness�of�these�two�formations�is�reduced�by�176� ft�as�a�result�of�salt�dissolution�and�brec-ciation.�Using�the�Stone�Coral�as�a�stratigraphic�datum,�we�see�that�all�of�the�marker�beds�above�the�Blaine�Formation�in�these�two�wells�are�dropped�by�about�170� ft�across�the�dissolution�front,�basically�the�same�as�the�reduced�thick-ness�of�the�Flowerpot�and�Blaine�Formations.
All�strata�between�the�top�of�the�Blaine�and�the�base�of�the�Niobrara�are�essentially�of�equal� thickness�on�both�sides�of� the�dissolution� front,�and� therefore,� the�dissolu-tion� did� not� occur� XIJMF� these� strata� were� being�deposited:� that� is,� not� prior� to� deposition� of� the� lower�Niobrara.� If� dissolution� had� occurred� before� Niobrara�time,� then�one�or�several�of� the�pre-Niobrara� formations�would�be�thicker�to�the�west,�as�it,�or�they,�accumulated�a�greater� thickness� by� !lling� in� the� resulting� depression.�The� lack�of� shallower,� recognizable�marker�beds� in� the�upper� Niobrara,� Pierre,� or� Ogallala� Formations� in� the�study� area� makes� it� impossible� to� say� more� precisely�when�this�dissolution�occurred,�except�that�it�began�after�deposition�of�the�Fort�Hays�Limestone,�and�is�still�going�on�today.
Figure�9.�Map�showing�thickness�of�salt-bearing�stratain� the�middle�of� the�Blaine� Formation� in� the� SharonSprings–Wallace�area.
Vacter�unit�1:�nomenclature�for�these�individual�beds�in�the�Blaine�Formation�is�well�established�in�the�Anadarko�Basin�of�western�Oklahoma�(Johnson,�2021b).
The�middle�Blaine� salt�probably�consists�mainly�of�displacive� halite,� similar� to� what� is� described� in� the�Flowerpot�salt,�and�similar� to�what� is�described� in� the�RKB� well� (Fig.� 7).� Benison� and� others� (2015)� also�describe� the� presence� of� several� bedded� (high-purity)�salt� layers� in� the�middle�and�upper�units�of�Blaine,�so�it�is�possible�that�some�of�the�middle�Blaine�salt�in�the�study�area�is�also�bedded�salt�(Fig.�7A).
Dissolution�of�the�middle�Blaine�salt�is�shown�in�Fig-ure�4.�In�well�C,�the�middle�Blaine�consists�of�28� ft�of�salt�overlain�by�about�3� ft�of�shale.�Assuming�the�same�losses�in�height�(thickness)�and�mass�because�of�salt�dissolution�as�in�the�RKB�well�(described�above�for�the�Flowerpot�salt),�the�compaction�of�clastics�in�well�C�after�dissolu-tion�of�displacive�salt�would�reduce�the�thickness�of�the�clastic�sequence� to�about�20%�of� the�original�salt�unit.�Therefore,�the�middle�Blaine�salt�in�well�C�would�com-press�to�28x0.2=5.6� ft�of�shale,�and,�added�to�the�3� ft�of�shale� above� that� salt,� the� postdissolution� thickness� of�these�strata�should�be�almost�9�ft� thick.�In�wells�A�and�B,�just�4.5�and�2�mi�to�the�west,�respectively,�the�middle�unit�lacks�salt�and�is�about�11�ft�thick:�close�to�the�nearly
326 Kenneth S. Johnson

Similar results are observed elsewhere across the dis-solution front in the area, supporting the fact that all, or atleast most, dissolution of the Flowerpot and Blaine salts
here�occurred�after�deposition�of� the�Fort�Hays�Lime-stone.� In�comparing� two�wells� in�secs.�2�and�10,�T.�14�S.,�R.�41�W.,�again�using� the�Stone�Coral�as� the�strati-graphic�datum,�the�thickness�of�the�Flowerpot�and�Blaine�Formations,� combined,� is� reduced� from� 330� to� 160� ft�across� the�dissolution� front:�a�reduction�of�170� ft.�The�top�of�the�Blaine�Formation�drops�170� ft�across�the�dis-solution�front�and�the�several�marker�beds�(the�same�as�shown� in�Fig.�10)�above� the�Blaine�drop�about�200� ft.�Inasmuch�as�the�thickness�of�all�strata�between� the�top�of�the�Blaine�and�the�base�of�the�Niobrara�increases�by�only�30� ft�across� the�dissolution�zone,� it� suggests� that�most� of� the� salt� dissolution� occurred� after� Fort�Hays�deposition;� perhaps� 30� ft� of� salt-dissolution-induced�subsidence�may�have�occurred�sometime�between�depo-sition�of�the�Blaine�and�the�start�of�Niobrara�deposition�in�that�part�of�the�area.
Other�studies� in�western�Kansas�provide�similar� re-sults�on� the� timing�of�dissolution�of� salt� and� collapse�of� overlying� strata� into� sinkholes� or� large� subsidence�troughs.� In�general,� the�major�dissolution�and�collapse�occurred�after�deposition�of�early�Late�Cretaceous�strata�(after�Dakota� or� Fort�Hays/Niobrara� deposition),� and�before�or�during�deposition�of�the�Tertiary�Ogallala�For-mation� (Macfarlane� and�Wilson,� 2006).� This� also� in-cludes� studies� in� Hamilton� County� of� the� Coolidge�and� Devil’s� Hole� Sinks� and� the� Little� Bear� Fault�(McLaughlin,� 1943),� and� in� Meade� County� of� the�Crooked�Creek�and�Fowler�Faults�(Gutentag�and�others,�1981).
Timing� of� salt� dissolution� in� the� Sharon� Springs–Wallace�area�apparently� is�not� the�same�as�dissolution�of�these�same�salts�about�35�mi�farther�west�in�Colorado.�Berry� (2018)� examined� results� of� a� seismic� survey� in�parts�of�Cheyenne�and�Kiowa�Counties�and�concluded�that�dissolution�of�the�middle�Blaine�salt�(therein�referred�to�as�“upper�Blaine�halite”)�occurred�mainly�before�Ta-loga�deposition�(Late�Permian),�and�that�dissolution�of�the�Flowerpot�salt�(therein�referred�to�as�“lower�Blaine�halite”)�occurred�in�post-Taloga�time,�but�before�deposi-tion�of�the�Dakota�Formation�(that�is,�well�before�Nio-brara�deposition).
In�Baca�County,�southeast�Colorado,�Askew� (2013)�showed� that� a� series� of� parallel� zones� of� salt-thins� in�the�middle�Blaine� salt� are� aligned� along� a� northeast–southwest� trend� that�overlies� similarly�oriented,�deep-seated� faults� radiating� from� an� Ancestral� Apishapa�High.� He� could� only� conclude� that� salt� dissolution�occurred�in�post-Triassic�time,�but�he�suggested�that�Ter-tiary�tectonism�in�that�area�could�have�reactivated�these�deep-seated�faults,�and�that�this�could�have�provided�ver-tical�pathways,�whereby�near-surface�fresh�water�in�the�Dakota�and�Ogallala�aquifers�could�migrate�down�to�the�Blaine�salt�and�cause�its�dissolution.
Figure 10. Stratigraphic cross section showing twowells, about 9,000-ft (±2,750 m) apart, in the southeastpart of T. 12 S., R. 41 W., where about 176 ft (54 m) ofBlaine and Flowerpot salts have been dissolved; datumis top of Stone Coral anhydrite. All strata between theBlaine Formation and the lower Niobrara are uniformlydropped about 170 ft (52 m) across the salt-dissolutionfront, indicating that salt dissolution occurred at leastafter early Niobrara (Late Cretaceous) time.
Sharon Springs–Wallace Area, Wallace County, Western Kansas 327

STRUCTURAL GEOLOGY
The structural geology of strata below the Flowerpotand Blaine salts in the Sharon Springs–Wallace area isrelatively simple: theY-anhydrite, a short distance belowthe Flowerpot salt, dips gently to the north at about12–25 ft/mi (about one-eighth to one-fourth of 1°), inter-rupted by two herein-identi!ed faults (Fig. 11). There areno soluble salts beneath the Y-anhydrite, except for2–5 ft of salt commonly at the top of the Stone Coral:therefore, this structural datum should accurately repre-sent the structure of Permian strata, excluding the effectsof dissolution of Flowerpot and Blaine salts.
Mapping the structure at the top of the Blaine Forma-tion, however, presents a different, more complicatedpicture (Fig. 12). The top of the Blaine generally dipsto the north at about the same rate as the Y-anhydrite,but the simple north dip is interrupted at numerous placesby subsidence and collapse into dissolution zones devel-oped in the Flowerpot and middle Blaine salts. The mostconspicuous structural feature in the Blaine Formation isin the west, where the top of the Blaine is generallydropped about 150–200 ft across the Flowerpot salt-dissolution zone. This drop is similar to the amount ofthinning of the Flowerpot–Blaine sequence across the
dissolution front, and clearly results entirely (or almostentirely) from salt dissolution.
Structural cross sections are presented at two placesthat show displacement of Permian strata across thetwo newly identi!ed faults: the Sharon Springs Fault,just east of Sharon Springs (Figs. 11, 12, 13), and theRuggles Draw Fault Zone in the north part of the studyarea (Figs. 11, 12, 14).
The Sharon Springs Fault has a throw (down to thenorth) of about 82 ft on top of the Y-anhydrite, and athrow of 113 ft (down to the north) on top of the BlaineFormation, on the basis of two wells that are less than1 mi apart (Fig. 13). Most of the difference in throwbetween the two datum beds is caused by dissolutionof the middle Blaine salt, inasmuch as the total thicknessof the Blaine decreases by 38 ft on the downthrown(north) side. The orientation of the Sharon Springs Faultis unknown at the site of this cross section, but it is
Figure 11. Structure map showing elevation of top ofthe Y-anhydrite in the Sharon Springs–Wallace area.
Figure 12. Structure map showing elevation of top ofthe Blaine Formation in the Sharon Springs–Wallacearea. Also shown is the approximate dissolution frontfor the Flowerpot salt (green line). Ruggles Draw FaultZone in north is downthrown to the south (see Fig. 11),except in southeast part of T. 11 S., R. 40W., where dis-solution of Flowerpot and middle Blaine salts hascaused the top of the Blaine to locally be downthrownto the north (see Fig. 14).
328 Kenneth S. Johnson

about 1 mi apart and that straddle the fault zone: thesewells are about 1 mi west of the north-trending RugglesDraw, the nearest surface feature that is named. The crosssection shown in Figure 14A is complex, and parts of itare dif!cult, or impossible, to explain. The Stone Coral isdropped down to the south, with a throw of about 27 ft,and the Y-anhydrite is also down on the south with athrow of about 107 ft. However, the top of the BlaineFormation is raised up on the south by about 85 ft. Inaddition, the Cedar Hills Sandstone appears to be miss-ing in the F & M well, on the south.
The facts noted above cannot be explained by a singlefault separating the two wells, and therefore, a secondcross section (Fig. 14B) is presented to more reasonablyshow the probable faulting between the twowells. In thiscross section, the well logs are eliminated to simplify thedrawing, but the lithology and depths are the same as inFigure 14A. By showing two faults (faults “a” and “b”)between the two wells, it is possible to explain the ambi-guities in Figure 14A.
Both faults in the fault zone are normal, downthrownto the south (on the left) in strata below the Flowerpot.However, because of dissolution of the Flowerpot saltbetween the two wells, the Blaine Formation has beendropped down about 85 ft on the north (on the right),and this makes the upper part of fault “a” appear to bea reverse fault in the Blaine Formation and overlyingstrata. Fault “a” cuts the F & M well at, or near, thetop of the Cedar Hills Sandstone, thus explaining theabsence of the Cedar Hills in that well: it also explains107 ft of throwof theY-anhydrite. Fault “b” is necessary,because it shows 27 ft of throw of the Stone Coralbetween the two wells. It is possible that some of theFlowerpot salt is present in the block between the twofaults, but it is certainly mostly gone in the Pickrellwell on the north. I believe that this second cross section(Fig. 14B) more accurately shows conditions betweenthe two wells, although it is not clear if the RugglesDraw Fault Zone is a fault zone (multiple faults) else-where in the area.
As with the Sharon Springs Fault, the orientation ofthis Ruggles Draw Fault Zone is unknown at the siteof Figure 14. However, inasmuch a series of four sink-holes, located about 6mi to the east, have a striking align-ment of about S 80° E (Fig. 15), it is reasonable to drawthe fault zone with that same orientation and have itextended through the area of the Wallace Sinkhole andthe other 3 sinks in Bradshaw Draw.
In addition, the Ruggles Draw Fault Zone may extendstill farther east, with a slight shift to an east–west orien-tation, reaching the area of three wells in the northwestpart of T. 12 S., R. 38W.: here, although the Y-anhydritedoes not appear to be offset (Fig. 11), the top of theBlaineis dropped down to the north by 27 ft (Fig. 12), and thethickness of the middle Blaine salt (Fig. 9) decreases
Figure� 13.� Structural� cross� section� showing� Sharon�Springs�Fault�between�two�wells� in�southwest�part�of�T.� 13� S.,�R.� 39�W.� Throw� is� 82� ft� (25�m)� at� top�of� Y-anhydrite,� and,� EVF� UP� dissolution� of� the� middle�Blaine�salt,�is�113� ft�(34�m)�at�top�of�Blaine�Formation.
possible� that� it� ties� in�with� the� Smoky�Basin�Cave-in�(a� sinkhole)� to� the� east.� A� fault� was� exposed� in� the�wall�of� this�sink,�according� to�both�Russell�(1929)�and�Elias�(1931),�and�for�this�reason,�I�have�chosen�to�draw�the�fault�with�an�orientation�of�S�80°�E�and�have�it�inter-sect�with�the�Smoky�Basin�Cave-in�(Figs.�11,�12);�the�sug-gested�orientation�of�this�fault�is�further�justi!ed�by�the�following�discussion�of�the�Ruggles�Draw�Fault�Zone.
The�Ruggles�Draw�Fault�Zone�is�downthrown�to�the�south�in�strata�beneath�the�Flowerpot�Shale,�as�well�as�in�strata�above�the�Flowerpot�in�most�of�the�area.�However,�in�a�limited�area,�in�the�southeast�part�of�T.�11�S.,�R.�40�W.,� the�Blaine�Formation� is�downthrown� to� the�north,�caused�by�dissolution�of� the�Flowerpot� salt� (Figs.�12,�14).�To� explain� this� complex� situation,� two� structural�cross� sections� are� presented� across� the�Ruggles�Draw�Fault�Zone� (Figs.�14A,�14B),�using� two�wells� that�are
Sharon Springs–Wallace Area, Wallace County, Western Kansas 329

sharply�to�the�north,�from�35� ft�to�0�and�5� ft�in�a�distance�of�less�than�half�a�mile.�Although�actual�fault(s)�may�not�be�present�in�this�eastern-most�section�of�the�fault�zone,�joints�and/or�fractures�in�the�Ruggles�Draw�zone�may�be�pathways�for�meteoric�water�to�reach,�and�dissolve,�the�middle�Blaine�salt.
If�I�am�correct�in�the�orientation�of�the�Sharon�Springs�and�Ruggles�Draw�Faults,�then�it�is�likely�that�5�sinkholes�(Wallace,�Sink�1,�Sink�2,�Sink�3,�and�Smoky�Basin�cave-in)�are�the�result�of�groundwater�percolating�down�faults,
fault zones, or associated joints and fractures, creatingdissolution cavities in the Blaine and/or Flowerpot salts,resulting in collapse and development of the sinkholes.In addition, water percolating down joints and/or frac-tures at the east end of the Ruggles Draw Fault Zoneis likely the cause of dissolution of the middle Blainesalt in two wells in sec. 4 and 5, T. 12 S., R. 38 W.
In addition to the 2 fault systems identi!ed in the cur-rent study, Elias (1931, p. 40) stated that he observedmany !ssures in outcrops of the Niobrara in Wallace
Figure 14. Structural cross sections A and B showing Ruggles Draw Fault Zone between twowells in southeast part ofT. 11 S., R. 40W. A) Simpli!ed cross section with well logs showing throw is 107 ft (33 m) at top of Y-anhydrite, and86 ft (26 m) (reversed throw) at top of Blaine Formation. This cross section, as drawn, is complex and impossible toexplain. B) More reasonable cross section, without geophysical logs, showing a fault zone with two normal faults,downthrown on the left (south), but dissolution of the Flowerpot salt between the two wells causes the BlaineFormation and younger strata to be downthrown on the right (north) of both faults. Fault “a” cuts the F & Mwell at, or near, the top of the Cedar Hills Sandstone, explaining why, in the F & M well, the Cedar Hills is missing,andwhy the interval between the Y-anhydrite and Stone Coral is so thin. Some Flowerpot salt may be present in thedown-dropped block between the two faults.
330 Kenneth S. Johnson

County.He postulated that these!ssures could have beenpathways for groundwater to circulate down and dis-solve soluble rock.
SINKHOLES INSHARON SPRINGS–WALLACE AREA
Wallace County has 6 known sinkholes in the SharonSprings–Wallace area. Three of the sinks, the WallaceSinkhole, Smoky Basin Cave-in, and Sink 1, haveformed since the year 1900, whereas the other three,Old Maid’s Pool, Sink 2, and Sink 3, formed at earlier,unknown times. The several reports that have discussedWallace County sinkholes in the past are by Moore(1926a, b), Russell (1929), Elias (1931), Frye (1950),Merriam and Mann (1957), and Merriam (1963).
Wallace�SinkholeOn� July�31,�2013,� a� large� sinkhole�was�discovered�
near�the�center�of�the�northwest�quarter�of�sec.�2,�T.�12�S.,�R.,�39�W.,�about�9�mi�north�of�the�town�of�Wallace,�in�Bradshaw�Draw�(Figs.�1,�15,�16).�This�newly�named�Wallace�Sinkhole� had� already� reached� about� 200� ft� in�diameter�and�about�90�ft�deep�by� that� time� (Figs.�16A,�16B),�and�the�bottom�of�the�sinkhole�was�dry—no�pond-ing�of�water�in�the�bottom.�Although�it�occurred�in�pas-ture�land�and�caused�no�injuries�or�infrastructure�damage,�it� caused�quite� a� stir� and�drew� statewide� interest.�The�sinkhole� became� a� local� attraction� for� several� days,�with�many�people�coming�to�see�the�new�phenomenon.�Because� of� the� potential� danger,� fencing� was� soon�erected�around� the� sink� to�protect�visitors.�A� series�of�concentric� fractures� developed� around� the� south� side
Figure 15. Location ofWallace Sinkhole and three earlier sinkholes in secs. 1 and 2,T. 12 S., 39W., in BradshawDraw,Wallace County, Kansas. These sinkholes are roughly aligned along the compass direction of S 80°E. A) Map is the1979 USGS 1:24,000-scale topographic map of Harris Draw East, and a small part of Harris Draw West. B) Aerialphotograph of same area from Google Earth, dated October 6, 2014.
Sharon Springs–Wallace Area, Wallace County, Western Kansas 331
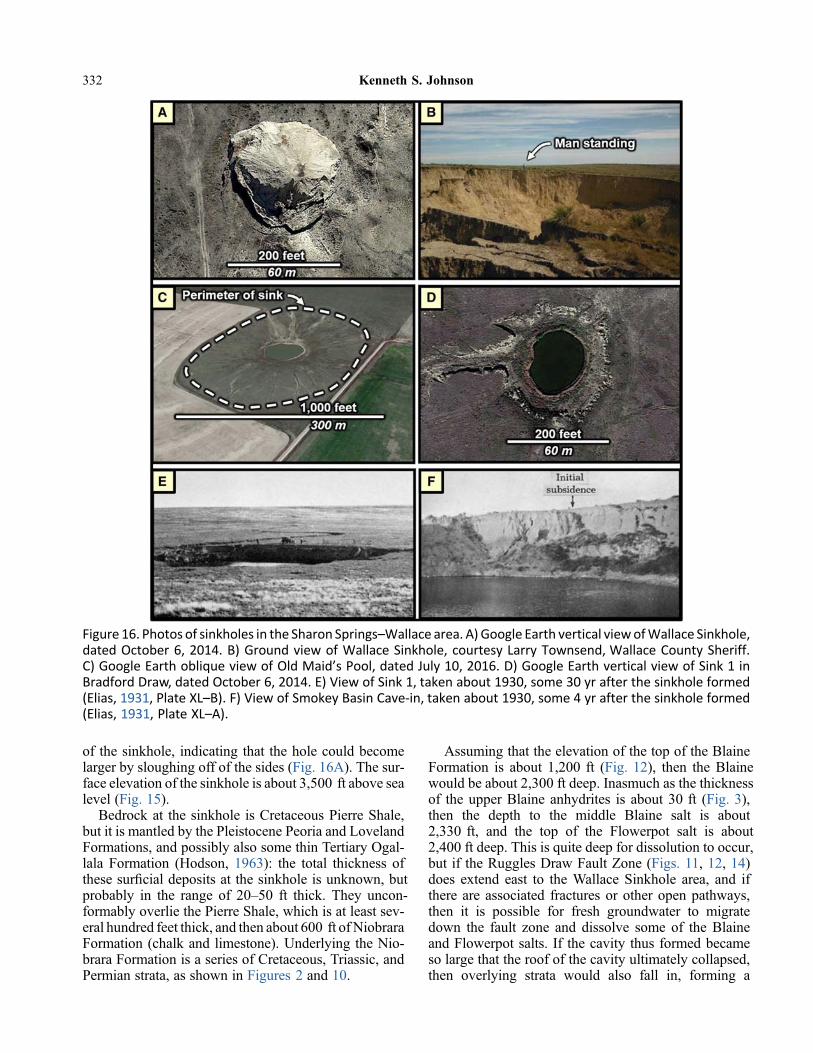
of� the�sinkhole,� indicating� that� the�hole�could�become�larger�by�sloughing�off�of�the�sides�(Fig.�16A).�The�sur-face�elevation�of�the�sinkhole�is�about�3,500� ft�above�sea�level�(Fig.�15).
Bedrock�at� the� sinkhole� is�Cretaceous�Pierre�Shale,�but�it�is�mantled�by�the�Pleistocene�Peoria�and�Loveland�Formations,�and�possibly�also�some�thin�Tertiary�Ogal-lala�Formation� (Hodson,� 1963):� the� total� thickness� of�these�sur!cial�deposits�at� the�sinkhole� is�unknown,�but�probably� in� the� range� of� 20–50� ft� thick.�They� uncon-formably�overlie�the�Pierre�Shale,�which�is�at�least�sev-eral�hundred�feet�thick,�and�then�about�600� ft�of�Niobrara�Formation� (chalk�and� limestone).�Underlying� the�Nio-brara�Formation�is�a�series�of�Cretaceous,�Triassic,�and�Permian�strata,�as�shown�in�Figures�2�and�10.
Assuming�that�the�elevation�of�the�top�of�the�Blaine�Formation� is� about� 1,200� ft� (Fig.�12),� then� the�Blaine�would�be�about�2,300�ft�deep.�Inasmuch�as�the�thickness�of� the�upper�Blaine� anhydrites� is� about�30� ft� (Fig.�3),�then� the� depth� to� the� middle� Blaine� salt� is� about�2,330� ft,� and� the� top� of� the� Flowerpot� salt� is� about�2,400�ft�deep.�This�is�quite�deep�for�dissolution�to�occur,�but� if� the�Ruggles�Draw�Fault�Zone� (Figs.�11,�12,�14)�does� extend� east� to� the�Wallace�Sinkhole� area,� and� if�there� are� associated� fractures�or�other�open�pathways,�then� it� is� possible� for� fresh� groundwater� to� migrate�down� the� fault� zone� and� dissolve� some� of� the�Blaine�and�Flowerpot�salts.� If� the�cavity� thus� formed�became�so�large�that�the�roof�of�the�cavity�ultimately�collapsed,�then� overlying� strata� would� also� fall� in,� forming� a
Figure 16. Photos of sinkholes in the Sharon Springs–Wallace area. A) Google Earth vertical viewofWallace Sinkhole,dated October 6, 2014. B) Ground view of Wallace Sinkhole, courtesy Larry Townsend, Wallace County Sheriff.C) Google Earth oblique view of Old Maid’s Pool, dated July 10, 2016. D) Google Earth vertical view of Sink 1 inBradford Draw, dated October 6, 2014. E) View of Sink 1, taken about 1930, some 30 yr after the sinkhole formed(Elias, 1931, Plate XL–B). F) View of Smokey Basin Cave-in, taken about 1930, some 4 yr after the sinkhole formed(Elias, 1931, Plate XL–A).
332 Kenneth S. Johnson

collapse�breccia�or�breccia�pipe�that�reached�the�land�sur-face�as�the�Wallace�Sinkhole.
The�size�of�the�sinkhole�requires�that�at�least�some�of�the�Flowerpot�salt�has�been�dissolved�beneath�the�Wal-lace�Sinkhole.�Inasmuch�as�the�depth�of�the�surface�sink�reached� at� least�90� ft,� and� the� thickness�of� the�middle�Blaine� salt�was�originally�only�about�35–40� ft� thick� in�the�area� (Figs.�3,�9),�dissolution�of�all� the�Blaine�salts�alone� could� not� form� a� cavity� high� enough� to� create�the�90-ft-deep�sinkhole.�Therefore,�a�signi!cant�amount�of�the�Flowerpot�salt�must�have�been�dissolved�locally,�despite�the�fact�that�more�than�200� ft�of�salt�is�still�present�in�all�the�wells�surrounding�the�sinkhole�(Fig.�6).
Of�additional� interest� in� this�area� is� the� thinning�and�absence�of�the�middle�Blaine�salt�about�4�mi�east�of�the�Wallace�Sinkhole,� in�secs.�4�and�5,�T.�12�S.,�R.�38�W.(Fig.�9).�In�wells�that�are�less�than�half�a�mile�apart,�the�salt�unit� thins�from�35� ft�on� the�south,� to�0�and�5� ft�on�the�north.�This�abrupt�thinning�(dissolution)�of�the�middle�Blaine�salt�occurs�along�a�further�extension,�at�S�80°�E,�of� the�Ruggles�Draw�Fault�Zone� that�apparently�passes�through�the�Wallace�Sinkhole.�The�thickness�of�the�Flow-erpot�salt�is�quite�similar�in�these�three�wells�(Fig.�6),�and�thus,� salt� dissolution� has� only� reached� down� to� the�middle�Blaine�salt:�collapse�of�a�cavity�only�about�35� ft�high� in� the� Blaine� Formation� here� apparently� is� not�enough� to� form� a� breccia� pipe� that� reaches� up� to� the�current�land�surface�(i.e.,�no�sinkhole�here).
Other�SinkholesSeveral� other� sinkholes� are� present� in� the� Sharon�
Springs–Wallace�area,�and�they�are�likely�to�have�been�formed� by� dissolution� of� subsurface� salt� beds� in� the�Blaine�and/or�Flowerpot�Formations.�These�additional�sinks� are� Smokey� Basin� Cave-in,� Old� Maid’s� Pool,�and�Sinks�1,�2,�and�3�in�Bradshaw�Draw.
Smoky�Basin�Cave-inThe�Smoky�Basin�Cave-in� developed� on�March� 9,�
1926,�on�the�south�side�of�Smoky�Hill�River�on�the�sec-tion� line�between� secs.�33�and�34,�T.�13�S.,�R.�39�W.(Figs.�1,� 16F).� Shortly� after� the� collapse,� Moore�(1926a,� b)� described� the� dimensions� as� 250� by� 350�ft�wide,�and�a�depth,�estimated�by�early�visitors,�of�300–500� ft� (this�depth� seems� extreme� and�unreasonable� to�me).�Water�then�ponded�in�the�sinkhole,�and,�as�an�indi-cation�of�the�great�size�of�the�underground�cavity�that�col-lapsed� to� form� the� sinkhole,� Moore� (1926a)� stated�“Systematic�soundings�[of�the�pond]�showed�a�gradual�increase� in� depth� of� the� water� to� about� 50� feet,� and�then� in� the�middle�part�of� the�depression�a�practically�vertical-sided� hole� in� which� the� depth� of� water� was�165�to�170�feet.�The�computed�volume�of�the�depression�is�approximately�1.5�million�cubic� feet.”�Both�Russell
(1929)�and�Elias�(1931)�noted�that�a�fault�was�exposed�in�the�wall�of�the�sink,�and�Russell�described�it�as�a�nor-mal�fault�with�a�throw�of�50� ft.
Early� views� on� the� origin� of�Smoky�Basin�Cave-in�attributed�it�to��1)�dissolution�of�chalk�in�the�Cretaceous�Niobrara� Formation,� with� subsequent� collapse� of� the�roof�(Moore,�1926a,�b;�Elias,�1931;�Frye,�1950;�Merriam�and�Mann,�1957),�and�2)�voids�being�created�in�the�Nio-brara� during� deformation� along� tensional� fault� planes�(Russell,�1929).
It�is�certain�that�the�Smoky�Basin�Cave-in�results�from�dissolution�of�salt�in�Blaine�and�Flowerpot�Formations.�The� middle� Blaine� salt,� locally� about� 45� ft� thick,� is�completely�missing� in� three�nearby�wells:�2�mi� to� the�west,�3�mi� to� the� east–southeast,� and� about�3.5�mi� to�the� south–southeast� (Fig.�9).�Although� there� is�no�evi-dence�of� the�Flowerpot�salt�(locally�about�225�ft� thick)�being�dissolved�in�those�same�three�wells,�or�elsewhere�within�about�4�mi�of�the�Cave-in�(Fig.�6),�it�is�certainly�likely� that� if� the�Blaine� salt� is� dissolved� locally,� then�some�of�the�upper�Flowerpot�salt�could�also�be�dissolved�locally.�Dissolution�of�the�middle�Blaine�salt,�and�a�sig-ni!cant�part�(or�all?)�of�the�Flowerpot�salt,� is� the�most�likely� explanation� for� the� origin� of� the� Smoky�Basin�Cave-in,� inasmuch� as� the� great� amount� of� collapse�(soundings�of�up�to�170� ft�in�the�middle�of�the�pool)�is�too�much�to�result�from�dissolution�of�the�middle�Blaine�salt�alone.�Based�on�data�from�nearby�wells,�the�top�of�the�middle�Blaine�salt�in�the�Smoky�Basin�Cave-in�would�be�about�1,950� ft�deep,� and� the� top�of� the�Flowerpot� salt�about�2,025�ft�deep.
Old�Maid’s�PoolOld�Maid’s�Pool,� located� in� the�northeast�corner�of�
sec.�30,�T.�12�S.,�R.�40�W.�(Figs.�1,�16C),�is�a�broad,�cir-cular� depression� that� now� measures� about� 1,000� by�1,500� ft�wide,� and� is� at� least�60� ft� from� the� rim�down�to�a�permanent�pool�of�water.�Moore�(1926b)�described�it�as�a�“nearly�circular�depression�over�eighty�feet�in�max-imum� depth,� approximately� three� eights� of� a�mile� in�diameter�at�the�rim�and�holding�at�the�bottom�a�perma-nent� small� lake� about� three� hundred� feet� wide.”� He�believed�that�the�origin�of�this�sinkhole�and�the�Smokey�Basin�Cave-in� is� undoubtedly� the� same,� but� that�Old�Maid’s�Pool�formed�perhaps�several�scores�or�even�hun-dreds�of�years� earlier:� therefore,�Moore� attributed� this�sinkhole�to�dissolution�of�chalk�in�the�Niobrara�Forma-tion,�and�ultimate�collapse�of�the�cavity’s�roof.
It�is�likely�that�dissolution�of�salt�in�the�Blaine�Forma-tion�and�some�(or�all?)�of�the�Flowerpot�salt�is�the�cause�of�Old�Maid’s�Pool.�The�middle�Blaine�salt�is�missing�in�most�of� the� area� around� this� sinkhole,�with� a� residual�patch�of�20� ft�of�salt� in�a�well� located�about�2.5�mi� to�the�west� (Fig.�9),�and� the� regional�dissolution� front�of�the� Flowerpot� salt� (the� “0”� thickness� line)� appears� to
Sharon Springs–Wallace Area, Wallace County, Western Kansas 333

be�about�2�or�3�mi�to�the�west�and�south�of�the�sinkhole�(Fig.�6).�Dissolution�of�the�middle�Blaine�salt,�and�a�sig-ni!cant�part�(or�all?)�of� the�Flowerpot�salt,� is� the�most�likely� explanation� for� the� origin� of� the� Old� Maid’s�Pool.�Data� from� a� nearby�well� indicate� that� the� top� of�the�middle� Blaine� salt� would� be� about� 2,300� ft� deep,�and� the� top� of� the� Flowerpot� salt� would� be� about�2,350�ft�deep.
Sinks�1,�2,�and�3Sinks�1,�2,�and�3�are�located�in�Bradshaw�Draw,�in�secs.�
1�and�2,�T.�12�S.,�R.�39�W.�(Figs.�1,�15,�16).�These�sinks,�along�with�the�Wallace�Sinkhole,�are�aligned�at�about�S�80° E.�Sink 1 was described by Russell �(1929) as�being�a� steep-sided�hole,�only�about�10� ft�wide�20�yr�earlier,�with�a�deep�pool�in�the�bottom:�he�noted�that�it�had�enlarged�gradually�in�the�20�yr�prior�to�1929.�It�has�continued�to�enlarge,� and� at�present� the� sinkhole� is� about�200�ft� in�diameter� (Fig.�16D).�Elias� (1931)� also�mentioned�Sink�1:�he�stated�that�it�originated�about�1900,�and�he�included�a�photo�of�the�sink�as�of�about�1930,�wherein�the�sink�ap-pears�to�be�about�150�ft�wide�(Fig.�16E).
Sinks�2�and�3� (Fig.�15)�are�even�more�brie"y�men-tioned�than�Sink�1�by�Russell�(1929)�and�Elias�(1931).�Both�sinks�are�undated,�but�clearly�are�older�than�Sink�1:�they�have�dry�bottoms,�and�their�walls�are�only�mod-erately�steep,�because�of�prolonged�erosion.
The�origin�of�Sinks�1,�2,�and�3�was�considered�to�be�dissolution� cavities� in� the� Niobrara� chalk� by� Elias�(1931),�or�because�of�voids�created�by�tensional�faulting�in�the�Niobrara�by�Russell�(1929).�Because�of�the�align-ment�of�these�sinks,�Elias�suggested�that�they�are�possi-bly� arranged� along� a� fault,� whereby� groundwater� is�circulating� in,� and� dissolving,� the� chalk� at� a� depth� of�about�500� ft.
Based�upon�current�research,�however,�it�is�likely�that�Sinks�1,�2,�and�3�were�formed�in�the�same�way�as�the�Wal-lace�Sinkhole:�collapse�of�overlying�strata�caused�by�dis-solution�of�soluble�material�in�the�middle�Blaine�salt�and�part� (or� all?)� of� the�Flowerpot� salt� along� the�Ruggles�Draw�Fault�Zone.� Inasmuch� as� the� surface� elevations�of� the�3�sinks�averages�about�3,400� ft� (Fig.�15),�some�100� ft� lower� than� the�Wallace� Sinkhole,� the� depth� to�the�middle�Blaine� salt� at� the� 3� sinks�would� be� about�2,230� ft,� and� to� the� top� of� the� Flowerpot� salt� about�2,300� ft.�These�sinks,� including� the�Wallace�Sinkhole,�are�along�the�possible�eastward�extension�of�the�Ruggles�Draw�Fault�Zone�(Figs.�11,�12,�14),�and�thus,�they�could�have�been�formed�by�fresh�water�migrating�down�open�fault�and/or�fracture�planes�and�dissolving�the�salt.
REFERENCES�CITEDAskew,�R.L.,�2013,�Distribution�of�the�Permian�Blaine�Formation� salt� in� the� subsurface� of� the� Hugoton
Embayment area of Baca County, southeast Colorado:Rocky Mountain Association of Geologists, TheMountain Geologist, Vol. 50, No. 2, p. 65-75.
Benison, K, Zambito, J.J, and Knapp, J.P., 2015, Con-trasting siliciclastic-evaporite strata in subsurfaceand outcrop: An example from the Permian Nippe-walla Group of Kansas, U.S.A.: Journal of Sedimen-taryResearch,Vol. 85,No. 6, p. 626-645. https://www.researchgate.net/publication/275214596
Berry, H.D., 2018, Dissolution of Permian salt, Las Ani-mas Arch, Colorado: unpublished MS thesis,University of Louisiana at Lafayette, 96 p.
Campbell, C. L., 1963, Permian evaporites between theBlaine and Stone Corral Formations: unpublishedMSthesis, University of Kansas, 73 p.
Elias, M.K., 1931, The geology ofWallace County, Kan-sas: Kansas Geological Survey, Bulletin 18, 254 p.http://www.kgs.ku.edu/Publications/Bulletins/18/index.html
Frye, J.C., 1950, Origin of Kansas Great Plains depres-sions: Kansas Geological Survey, Bulletin 86, Part 1,p. 1-20. http://www.kgs.ku.edu/Publications/Bulletins/86_1/index.html
Gutentag, E.D., Lobmeyer, D.H., and Slagle, S.E., 1981,Geohydrology of southwestern Kansas: Kansas Geo-logical Survey, Irrigation Series 7, 73 p. http://www.kgs.ku.edu/Publications/Bulletins/IRR7/index.html
Hodson,W.G., 1963, Geology and ground-water resour-ces of Wallace County, Kansas: Kansas GeologicalSurvey, Bulletin 161, 108 p. http://www.kgs.ku.edu/General/Geology/Wallace/index.html
Holdoway, K.A., 1978, Deposition of evaporites and redbeds of the Nippewalla Group, Permian, western Kan-sas: Kansas Geological Survey, Bulletin 215, 43 p.http://www.kgs.ku.edu/Publications/Bulletins/215/index.html
Johnson, K.S., 2021a, Overview of evaporite karst in theGreater Permian Evaporite Basin (GPEB) of TX, NM,OK, KS, and CO, in Johnson, K.S., Land, L., andDecker, D.D., eds., Evaporite karst in the GreaterPermian Evaporite Basin (GPEB) of Texas, NewMex-ico, Oklahoma, Kansas, and Colorado: OklahomaGeological Survey, Circular 113.
Johnson, K.S., 2021b, Permian Blaine and San AndresFormations of western Oklahoma and Palo Duro Basinof Texas: their correlation and evaporite karst, in John-son, K.S., Land, L., and Decker, D.D., eds., Evaporitekarst in theGreater PermianEvaporiteBasin (GPEB)ofTexas, New Mexico, Oklahoma, Kansas, and Colo-rado: Oklahoma Geological Survey, Circular 113.
Johnson, W.D., 1901, The High Plains and their utiliza-tion: US Geological Survey, 21st Annual Report, Part4, p. 601-741.
334 Kenneth S. Johnson

Macfarlane, P.A., andWilson, B.B., 2006, Enhancementof the bedrock-surface-elevation map beneath theOgallala portion of the High Plains Aquifer, westernKansas: Kansas Geological Survey, Technical Series20, 28 p. http://www.kgs.ku.edu/Publications/Bulletins/TS20/ts20.pdf
McLaughlin, T.G., 1943, Geology and ground-water re-sources of Hamilton and Kearny Counties, Kansas:Kansas Geological Survey, Bulletin 49, 220 p.http://www.kgs.ku.edu/General/Geology/Hamilton/index.html
Merriam, D.F., 1963, The geologic history of Kansas:Kansas Geological Survey, Bulletin 162, 317 p.http://www.kgs.ku.edu/Publications/Bulletins/162/index.html
Merriam D.F., and Mann, C.J., 1957, Sinkholes andrelated geologic features in Kansas: Kansas Academyof Science, Transactions, Vol. 60, No. 3, p. 207-243.https://digital.lib.usf.edu/SFS0054165/00001
Moore, R.C., 1926a, Note of subsidence near SharonSprings, Wallace County, Kansas: Kansas GeologicalSurvey, Bulletin 11, p. 95-96. http://www.kgs.ku.edu/Publications/Bulletins/11/05_salt.html
Moore, R.C., 1926b, The subsidence near SharonSprings, Kansas: Science, Vol. 64, No. 1649,p. 130-131.
Russell, W.L., 1929, Local subsidence in western Kan-sas: American Association of Petroleum Geologists,Bulletin, Vol. 13, No. 6, p. 606-609.
Schoewe, W.H., 1949, The geography of Kansas, part 2,physical geography (geology): Kansas Academy ofSciences, Transactions, Vol. 52, No. 3, p. 261-333.
Schumaker, R.D., 1966, Regional study ofKansas Perm-ian evaporite formations: unpublished MS thesis,Wichita State University, Wichita, Kansas, 87 p.
Zambito, J.J., Benison, K.C., Foster, T.M., Soreghan,G.S., Soreghan, M.J., and Kane, M., 2012, Lithostra-tigraphy of Permian red beds and evaporites in the Re-becca K. Bounds core, Greeley County, Kansas:Kansas Geological Survey, Open-File Report 2012–15, 45 p. http://www.kgs.ku.edu/Publications/OFR/2012/OFR12_15/KGS_OF_2012-15.pdf
Zeller, D.E., 1968, The stratigraphic succession in Kan-sas: Kansas Geological Survey, Bulletin 189, 81 p.http://www.kgs.ku.edu/Publications/Bulletins/189/index.html
Sharon Springs–Wallace Area, Wallace County, Western Kansas 335


ABSTRACT.—The�Permian�Flowerpot�salt�has�been�dissolved�beneath�the�Great�Plains�Reservoirs�in�southeast�Colorado,�and�this�has�resulted� in�10�large,�natural�depressions� that�are�now�being�used� to�store�water� in�four�major�reservoirs.�Indi-vidual�depressions�range�from�0.6�to�5.0�mi2.�The�four�major�reservoirs,�and�several�smaller�ones,�are�fed�by�canals�developed� in� the� late�1800s� to� tap� the�nearby�Ar-kansas�River;�the�stored�water�is�then�used�for�irrigation,�wildlife,�and�recreational�purposes.�The�Flowerpot�salt,�part�of�a�red-bed�and�evaporite�sequence,�is�generally�200–245�ft� thick�and�about�1,800–2,000�ft�deep� in� the�northeast�part�of� the�study�area;�however,� it� thins�sharply�and� is�mostly�dissolved� to� the�southwest,�across�a�major�salt-dissolution�front.�The�timing�of�salt�dissolution�is�not�known,�but�prob-ably�started�during�or�after�Late�Cretaceous�time,�and�persisted�until�the�late�Pleis-tocene�or�Holocene�Epochs.�Structure�mapping�on�marker�beds�below�and�above�the�Flowerpot�salt�also�shows� the�effect�of�salt�dissolution:� the� lower�marker�bed�dips�gently�across�the�site�of�the�dissolution�front�without�being�affected,�whereas�the�upper�marker�bed� shows�what�appears� to�be�a� fault� that� is�offset�100–200� ft�across� the�dissolution� front.
INTRODUCTION
Prehistoric dissolution of the Permian Flowerpot saltin southeast Colorado has created several large, naturaldepressions at the earth’s surface that are now being usedto store water, mainly for irrigation, but also for wildlifeand recreational purposes. The focus of the current studyis an area called theGreat Plains Reservoirs (GPR) that islocated in the Queens State Wildlife Area and embracesparts of Kiowa, Prowers, and Bent Counties, Colorado(Figs. 1, 2). A series of four major reservoirs, and severalsmaller ones, were formed in the late 1800s when theGreat Plains Water Company constructed a series of ca-nals to carry water from the Arkansas River into thesedepressions (Newell, 1901, p. 240–243). At the startingpoint of the canal system, water enters the Fort LyonCanal about 3 mi northwest of La Junta, Colorado,and eventually !ows through several additional canalsto supply water to the various reservoirs in the GPR.La Junta is about 50 mi WSW of the GPR. The Canalsand reservoirs are currently managed by the Amity
Mutual Irrigation Co., located in Holly, Colorado, andthe U.S. Bureau of LandManagement. The GPR systemof canals and reservoirs is reportedly the most extensiveproject of its kind in the west.
The four major reservoirs have Cheyenne names:Neegronda (“Big Water”), Neesopah (“Black Water”),Neenoshe (“Standing Water”), and Neeskah (“WhiteWater”)—which is also called “Queens.” Water depthsin the major reservoirs, at capacity, reportedly rangefrom 13 to 25 ft, and sometimes one or several ofthem may be dry. Water levels !uctuate, because theyare "lled during the winter and during !oods on the Ar-kansas River, and the water may be drawn down duringSpring and Summer irrigation. Three of the major reser-voirs are formed by "lling of two-to-four adjacent de-pressions: when water levels are low, we can see thatNeeskah, Neenoshe, and Neesopah Reservoirs comprisetwo, three, and four separate natural-subsidence depres-sions, respectively. But whenwater levels are high, theseseparate, natural depressions are "lled to over!owing,
Johnson, Kenneth S., 2021, Dissolution of the Permian Flowerpot Salt Beneath the Great Plains Reservoirs, QueensState Wildlife Area, in Kiowa, Prowers, and Bent Counties, Southeast Colorado, in Johnson, K. S.; Land, Lewis;and Decker, D. D. (eds.), Evaporite Karst in the Greater Permian Evaporite Basin (GPEB) of Texas, NewMexico,Oklahoma, Kansas, and Colorado: Oklahoma Geological Survey, Circular 113, p. 337–346.
0LMBIPNB�Geological�Survey�Circular�113,�2021
Dissolution�of�the�Permian�Flowerpot�SaltBeneath�the�Great�Plains�Reservoirs,�Queens�State�Wildlife�Area,�
in�Kiowa,�Prowers,�and�Bent�Counties,�Southeast�ColoradoKenneth�S.�Johnson
Retired�Geologist,�Oklahoma�Geological�Survey,Norman,�Oklahoma
337

STRATIGRAPHY
Strata of interest in this study are all of Permian age,and range from the Stone Corral, at the bottom, to anunnamed marker bed above the Dog Creek Shale atthe top (Fig. 3). These strata are characterized as a“red-bed and evaporite sequence” in the Leonardianand Guadalupian Series. An excellent description ofthese same strata, in a core drilled about 40 mi to theENE of the GPR, is given by Zambito and others(2012); this core is from the Amoco Production Com-pany, Rebecca K. Barnes No. 1, drilled in sec. 17,T. 18 S., R. 42 W., Greeley County, Kansas.
The� Stone� Corral� in� the� study� area� is� typically30–40� ft�of�anhydrite,�and�it�is�a�regionally�correlatable�rock�unit�in�eastern�Colorado�and�western�Kansas;�it�is�equivalent� to� the�Cimarron� anhydrite� farther� south� in�western�Oklahoma�and�north�Texas.�The�Stone�Corral�is� overlain� by� 175–200� ft� of�mostly� shale,�mudstone,�and�sandstone�of�the�Salt�Plain,�Harper,�and�Cedar�Hills�Formations,�in�ascending�order.�At�the�top�of�the�Cedar�Hills� Sandstone� is� the� persistent� Y-anhydrite,� which�typically�is�15–30�ft�thick.
Figure�1.�Map�of�Colorado� showing� location�of�GreatPlains�Reservoirs�study�area�in�parts�of�Kiowa,�Prowers,and�Bent�Counties.
and� the� smaller,�depression-"lled� lakes�merge� into� the�three�larger�reservoirs.
Europeans�who�settled�the�area�in�the�late�1800s�saw�the�value�of�natural�depressions� in� the�area�for�storage�of�water�for�irrigation,�but�the�origin�of�the�depressions�was�unknown.�Study�of�geophysical� (electric)� logs�of�petroleum� tests� in� the� area�has� answered� the�question�of� the�origin�of� these�depressions.�A� thick�sequence�of�salt� (halite),�generally�200–245� ft� thick�and�now�about�1,800–2,000� ft� below� the� land� surface,� is� present� in�the� Permian� Flowerpot� Formation� just� north� and� east�of� the� depressions:� however,�most� of� this� Flowerpot�salt�has�been�dissolved� from� the�Flowerpot�Formation�beneath�the�depressions,�and�this�has�resulted�in�subsi-dence� and� collapse� of� all� overlying� strata,� until� the�collapse� features� reached� the� land� surface� as� natural�depressions.
Appreciation�is�expressed�to�Dr.�Lewis�Land,�geolo-gist�with�the�National�Cave�and�Karst�Research�Institute,�for�his� review�and�constructive�comments�on�an�early�draft�of�this�report;�and�to�Mr.�Terry�Howland�and�Mr.�Colin� Thompson,� with� Amity�Mutual� Irrigation� Co.,�for�their�review�of�information�about�the�canals,�the�res-ervoirs,�and� the�history�of� the�project.�Appreciation� is�also�expressed�to�the�Colorado�Oil�&�Gas�Commission,�of� the�Colorado�Department�of�Natural�Resources,� for�having�scans�of�geophysical� logs�available�online:� this�provided�access�to�the�log�data�needed�for�this�study.
Figure 2. Map of the Great Plains Reservoirs area show-ing the following: 1) location of well logs used in thisreport; 2) well logs shown in other !gures in the report(Figures 3 and 5); 3) line of cross section in Figure 9;4) arti!cial reservoirs at near capacity; 5) county lines;and 6) the approximate limits of Flowerpot salt (greenlines), which is mainly present in the northeast part ofthe area.
338 Kenneth S. Johnson
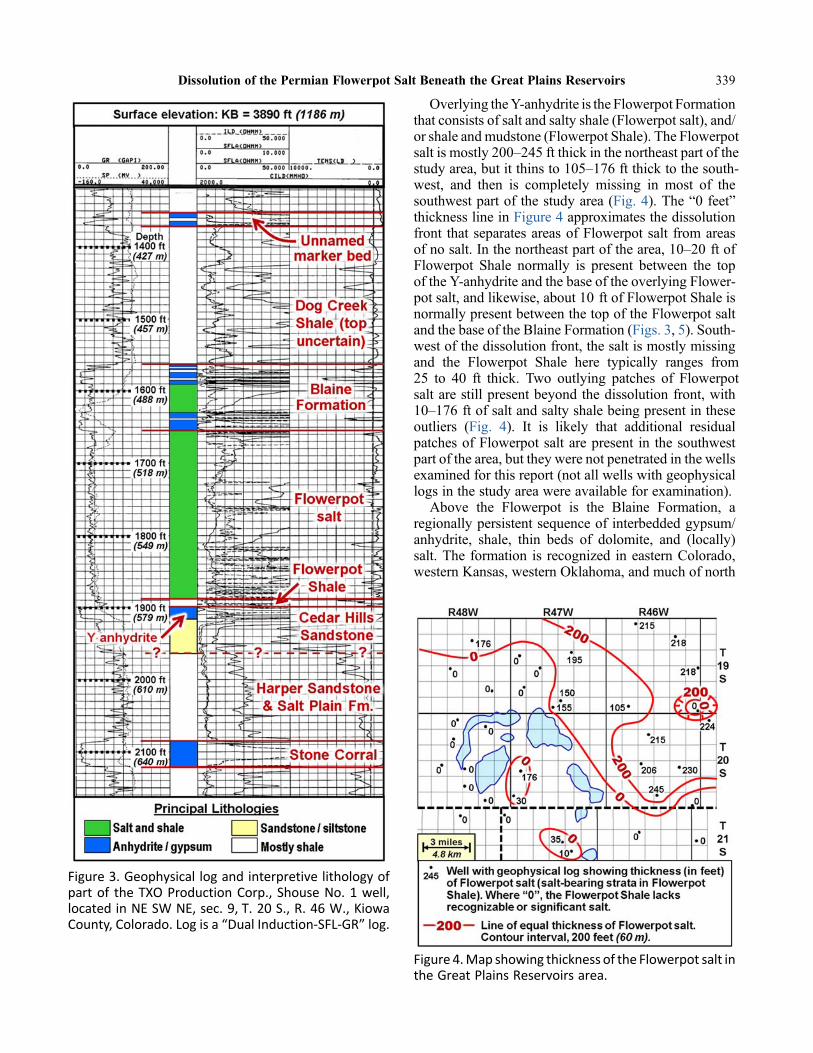
Overlying�the�Y-anhydrite�is�the�Flowerpot�Formation�that�consists�of�salt�and�salty�shale�(Flowerpot�salt),�and/or�shale�and�mudstone�(Flowerpot�Shale).�The�Flowerpot�salt�is�mostly�200–245�ft�thick�in�the�northeast�part�of�the�study�area,�but�it�thins�to�105–176�ft�thick�to�the�south-west,� and� then� is� completely�missing� in�most� of� the�southwest�part�of� the�study�area� (Fig.�4).�The�“0� feet”�thickness�line�in�Figure�4�approximates�the�dissolution�front� that� separates�areas�of�Flowerpot� salt� from�areas�of�no�salt.�In�the�northeast�part�of�the�area,�10–20� ft�of�Flowerpot� Shale� normally� is� present� between� the� top�of�the�Y-anhydrite�and�the�base�of�the�overlying�Flower-pot�salt,�and�likewise,�about�10� ft�of�Flowerpot�Shale�is�normally�present�between�the�top�of�the�Flowerpot�salt�and�the�base�of�the�Blaine�Formation�(Figs.�3,�5).�South-west�of�the�dissolution�front,�the�salt�is�mostly�missing�and� the� Flowerpot� Shale� here� typically� ranges� from�25� to� 40� ft� thick.� Two� outlying� patches� of� Flowerpot�salt�are�still�present�beyond� the�dissolution� front,�with�10–176� ft�of�salt�and�salty�shale�being�present�in�these�outliers� (Fig.� 4).� It� is� likely� that� additional� residual�patches�of�Flowerpot� salt�are�present� in� the� southwest�part�of�the�area,�but�they�were�not�penetrated�in�the�wells�examined�for�this�report�(not�all�wells�with�geophysical�logs�in�the�study�area�were�available�for�examination).
Above� the� Flowerpot� is� the� Blaine� Formation,� a�regionally�persistent�sequence�of� interbedded�gypsum/anhydrite,� shale,� thin� beds� of� dolomite,� and� (locally)�salt.�The� formation� is� recognized� in�eastern�Colorado,�western�Kansas,�western�Oklahoma,�and�much�of�north
Figure 3. Geophysical log and interpretive lithology ofpart of the TXO Production Corp., Shouse No. 1 well,located in NE SW NE, sec. 9, T. 20 S., R. 46 W., KiowaCounty, Colorado. Log is a “Dual Induction-SFL-GR” log.
Figure 4.Map showing thickness of the Flowerpot salt inthe Great Plains Reservoirs area.
Dissolution of the Permian Flowerpot Salt Beneath the Great Plains Reservoirs 339

Texas:�it�is�equivalent�to�part�of�the�San�Andres�Forma-tion� in�much� of�Texas� and� eastern�New�Mexico.�The�thickness� of� the�Blaine� Formation� ranges� from� 40� to�100� ft�in�the�northeast�part�of�the�study�area�and�about�30–55� ft� in� the� southwest.�The� two� anhydrite� beds� in�the� lower�part�of� the�Blaine� (Figs.�3,�5)�are�equivalent�to� the�Medicine�Lodge�and�Nescatunga�Gypsum�Beds�of� northwest�Oklahoma,� and� the� lowest� of� the� upper�Blaine�anhydrite�beds�(Fig.�3)�is�equivalent�to�the�Shimer�Gypsum� Bed� of� northwest� Oklahoma.� Between� the�lower-�and�upper-anhydrite�parts�of� the�Blaine�Forma-tion� is� the� middle� Blaine� salt� (Fig.� 3):� this� salt� is�15–40�ft� thick�at�places� in� the�eastern� two-thirds�of�Ts.�19–21�S.,�R.�46�W.,�but�is�missing�(because�of�dissolu-tion)�farther�west,�where�that�interval�is�represented�only�by�shale�(Fig.�5).
Overlying� the� Blaine� Formation� is� the�Dog� Creek�Shale,�which�consists�predominantly�of�shale�and�mud-stone.�The� top� to� the�Dog�Creek� is�not�conspicuous� in�well�logs�of�the�study�area,�so�the�thickness�of�the�forma-tion� here� is� unknown.� About� 180–200� ft� above� the�Blaine/Dog�Creek�contact�is�a�persistent�pair�of�unnamed�anhydrite� beds,� each� typically� 5–10� ft� thick� and� sepa-rated� by� about� 5� ft� of� shale.� These� anhydrite� beds�have�been�called�“Day�Creek”�in�Kansas�(Zambito�and�others,� 2012),� but�my� studies� from�west�Texas� to� the�Texas�Panhandle�area�suggest�that�they�are�the�Alibates�beds,�and�thus�are�equivalent�to�the�Rustler�Formation;�perhaps,�they�are�evaporites�correlative�with�the�Culebra�and�Magenta�Dolomites�in�the�Rustler�of�west�Texas�and�southeast�New�Mexico;�McGillis� and� Presley� (1981)�discuss� the�Alibates� Formation� as� being� two� beds� of
Figure 5. Stratigraphic cross section showing dissolution of Flowerpot salt across the main dissolution front.Between wells C and B, the upper part of the Flowerpot salt is dissolved; and between wells B and A, all the re-maining Flowerpot salts are dissolved.
340 Kenneth S. Johnson
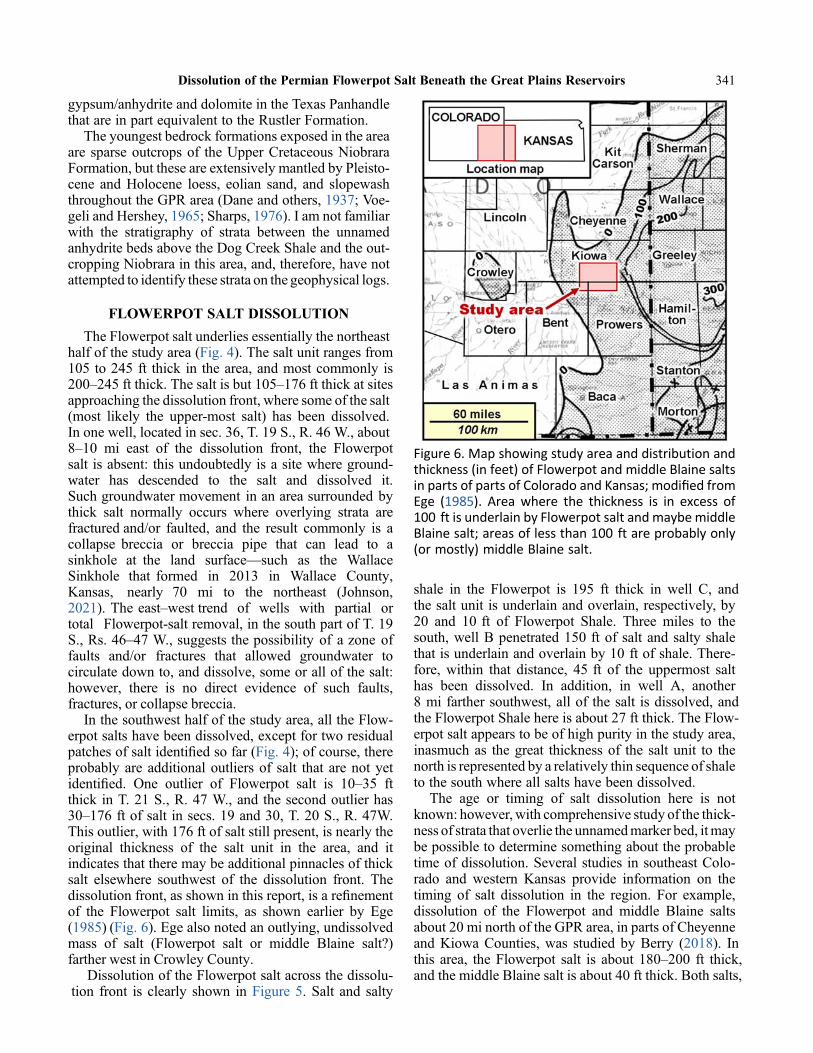
gypsum/anhydrite�and�dolomite�in�the�Texas�Panhandle�that�are�in�part�equivalent�to�the�Rustler�Formation.
The�youngest�bedrock�formations�exposed�in�the�area�are� sparse�outcrops�of� the�Upper�Cretaceous�Niobrara�Formation,�but�these�are�extensively�mantled�by�Pleisto-cene� and�Holocene� loess,� eolian� sand,� and� slopewash�throughout�the�GPR�area�(Dane�and�others,�1937;�Voe-geli�and�Hershey,�1965;�Sharps,�1976).�I�am�not�familiar�with� the� stratigraphy� of� strata� between� the� unnamed�anhydrite�beds�above�the�Dog�Creek�Shale�and�the�out-cropping�Niobrara�in�this�area,�and,�therefore,�have�not�attempted�to�identify�these�strata�on�the�geophysical�logs.
FLOWERPOT�SALT�DISSOLUTION
The�Flowerpot�salt�underlies�essentially�the�northeast�half�of�the�study�area�(Fig.�4).�The�salt�unit�ranges�from�105� to�245� ft� thick� in� the�area,�and�most�commonly� is�200–245�ft�thick.�The�salt�is�but�105–176�ft�thick�at�sites�approaching�the�dissolution�front,�where�some�of�the�salt�(most� likely� the� upper-most� salt)� has� been� dissolved.�In�one�well,�located�in�sec.�36,�T.�19�S.,�R.�46�W.,�about�8–10� mi� east� of� the� dissolution� front,� the� Flowerpot�salt� is�absent:� this�undoubtedly� is�a�site�where�ground-XBter� has� descended� to� the� salt� and� dissolved� it.�Such�groundwater�movement� in�an�area�surrounded�by�thick� salt� normally� occurs� where� overlying� strata� are�fractured�and/or� faulted,� and� the� result� commonly� is� a�collapse� breccia� or� breccia� pipe� that� can� lead� to� a�sinkhole� at� the� land� surface—such� as� the� Wallace�Sinkhole� that� formed� in� 2013� in� Wallace� County,�Kansas,� nearly� 70� mi� to� the� northeast� (Johnson,�2021).�The�east–west�trend� of� wells� with� partial� or�total� Flowerpot-salt�removal,�in�the�south�part�of�T.�19�S.,�Rs.�46–47�W.,�suggests� the�possibility� of� a�zone� of�faults� and/or� fractures� that� allowed� groundwater� to�circulate�down� to,�and�dissolve,�some�or�all�of� the�salt:�however,� there� is� no� direct� evidence� of� such� faults,�fractures,�or�collapse�breccia.
In�the�southwest�half�of�the�study�area,�all�the�Flow-erpot�salts�have�been�dissolved,�except�for�two�residual�patches�of�salt�identi"ed�so�far�(Fig.�4);�of�course,�there�probably� are� additional�outliers�of� salt� that� are�not�yet�identi"ed.� One� outlier� of� Flowerpot� salt� is� 10–35� ft�thick� in�T.�21�S.,�R.�47�W.,�and� the�second�outlier�has�30–176� ft�of�salt� in�secs.�19�and�30,�T.�20�S.,�R.�47W.�This�outlier,�with�176�ft�of�salt�still�present,�is�nearly�the�original� thickness� of� the� salt� unit� in� the� area,� and� it�indicates�that�there�may�be�additional�pinnacles�of�thick�salt� elsewhere� southwest� of� the� dissolution� front.� The�dissolution�front,�as�shown�in�this�report,�is�a�re"nement�of� the� Flowerpot� salt� limits,� as� shown� earlier� by� Ege�(1985) (Fig.�6).�Ege�also�noted�an�outlying,�undissolved�mass� of� salt� (Flowerpot� salt� or� middle� Blaine� salt?)�farther�west�in�Crowley�County.
Dissolution�of�the�Flowerpot�salt�across�the�dissolu-tion� front� is� clearly� shown� in�Figure�5.�Salt� and� salty
Figure�6.�Map�showing�study�area�and�distribution�andthickness�(in�feet)�of�Flowerpot�and�middle�Blaine�saltsin�parts�of�parts�of�Colorado�and�Kansas;�modi!ed�fromEge� (1985).�Area�where� the� thickness� is� in� excess�of100� ft�is�underlain�by�Flowerpot�salt�and�maybe�middleBlaine�salt;�areas�of�less�than�100� ft�are�probably�only(or�mostly)�middle�Blaine�salt.
shale� in� the� Flowerpot� is� 195� ft� thick� in�well�C,� and�the�salt�unit� is�underlain�and�overlain,� respectively,�by�20� and� 10� ft� of� Flowerpot� Shale.� Three�miles� to� the�south,�well�B�penetrated�150� ft�of� salt�and� salty� shale�that� is�underlain�and�overlain�by�10� ft�of�shale.�There-fore,�within� that� distance,� 45� ft� of� the� uppermost� salt�has� been� dissolved.� In� addition,� in� well� A,� another�8�mi� farther�southwest,�all�of� the�salt� is�dissolved,�and�the�Flowerpot�Shale�here�is�about�27�ft�thick.�The�Flow-erpot�salt�appears�to�be�of�high�purity�in�the�study�area,�inasmuch� as� the�great� thickness�of� the� salt�unit� to� the�north�is�represented�by�a�relatively�thin�sequence�of�shale�to�the�south�where�all�salts�have�been�dissolved.
The� age� or� timing� of� salt� dissolution� here� is� not�known:�however,�with�comprehensive�study�of�the�thick-ness�of�strata�that�overlie�the�unnamed�marker�bed,�it�may�be�possible�to�determine�something�about�the�probable�time�of�dissolution.�Several� studies� in� southeast�Colo-rado� and�western�Kansas� provide� information� on� the�timing� of� salt� dissolution� in� the� region.� For� example,�dissolution� of� the� Flowerpot� and�middle� Blaine� salts�about�20�mi�north�of�the�GPR�area,�in�parts�of�Cheyenne�and�Kiowa�Counties,�was� studied� by�Berry� (2018).� In�this� area,� the�Flowerpot� salt� is� about�180–200� ft� thick,�and�the�middle�Blaine�salt�is�about�40�ft�thick.�Both�salts,
Dissolution of the Permian Flowerpot Salt Beneath the Great Plains Reservoirs 341

generally��2,200–2,500�ft��deep,��are��locally��dissolved.�Berry� examined� results� of� a� seismic� survey� and� con-cluded�that�dissolution�of�the�middle�Blaine�salt�(therein�referred� to� as� “upper�Blaine� halite”)� occurred�mainly�before�Taloga�deposition�(Late�Permian),�and�that�dissolu-tion�of� the�Flowerpot� salt� (therein� referred� to�as�“lower�Blaine�halite”)�occurred� in�post-Taloga� time,�but�before�deposition�of�the�early�Late�Cretaceous�Dakota�Formation.�
Surface� evidence� of� fossil� sinkholes� in� Prowers�County,�about�20�mi�southeast�of�GPR,�was�described�by�Dane�and�Pierce�(1934).�Three�roughly�circular�sinks,�100–200� ft�in�diameter,�contain�brecciated�blocks�of�the�Late�Cretaceous�Niobrara�Formation�(Hayes�Limestone�and�Smokey�Hill�Members)�in�sec.�6,�T.�22�S.,�R.�44�W.�My�examination�of�geophysical�well�logs�in�the�vicinity�of�thPse�sinks�shows�the�following:�1)�Flowerpot�salt�is�not�present�in�this�area �and�2)�the�middle�Blaine�salt�is�50�ft�thick,�at�a�depth�of�1,450�ft�just�0.6�mi�south�of�the�sinks,� and� is� thinner� or� absent� in� several� other� wells�within�several�miles�of�the�sinks.�I�assume�that�the�Flow-erpot�salt�was�not�deposited�here,�because�if�it�had�been,�and�is�now�dissolved,�then�the�middle�Blaine�salt�should�also�be�gone�in�all�the�local�wells:�the�middle�Blaine�salt�would�be�above�any�Flowerpot�salt,�and�it�should�have�been� dissolved�"rst� by�descending�waters.� I� conclude�that� local�dissolution�of� the�middle�Blaine� salt� caused�these�sinkholes,�and�that�the�time�of�dissolution�was�at�least�during�or�after�Late�Cretaceous�time.
Farther� south,� in� Baca� County,� Colorado,� Askew�(2013)�showed�that�a�series�of�parallel�zones�of�salt-thins�in�the�middle�Blaine�salt�are�aligned�along�a�northeast–southwest� trend� that�overlies� similarly�oriented,�deep-seated� faults� radiating� from� an� Ancestral� Apishapa�High.�The�Flowerpot�salt� is�absent� in� this�area,�as� it� is�in� the� Prowers� County� area� described� above,� so� the�only�salt�unit�available�for�dissolution�is�the�60-ft-thick�middle� Blaine� salt,� present� at� depths� of� about� 700–1,200� ft.�Askew�concluded�that�salt�dissolution�occurred�in�post-Triassic�time,�but�he�suggested�that�Tertiary�tec-tonism� in� the� area� could� have� reactivated� these� deep-seated�faults,�and�that�this�could�have�provided�vertical�pathways� whereby� near-surface� fresh� water� in� the�Dakota� and�Ogallala� aquifers� could�migrate� down� to�the�middle�Blaine�salt�and�cause�its�dissolution.
Studies� in�western�Kansas�have�also�provided�some�results�on�the�timing�of�dissolution�of�salt—mainly�the�Flowerpot� salt.�General� studies�or� summaries�of� sink-holes� and� collapse� features� in� western� Kansas� were�made� by� Johnson� (1901),� Schoewe,� (1949),�Merriam�and�Mann� (1957),�Merriam� (1963,�Appendix�D),� and�Macfarlane�and�Wilson�(2006).�In�general,�the�major�dis-solution�and�collapses�occurred�after�deposition�of�early�Late�Cretaceous�strata� (after�Dakota�or�Fort�Hays/Nio-brara� deposition),� and� before� or� during� deposition� of�the�Tertiary�Ogallala�Formation�(Macfarlane�and�Wilson,
2006).�Their�conclusions�are�based�on�the�following�stud-ies:�1)�study�of�the�Coolidge�and�Devil’s�Hole�Sinks�and�the�Little�Bear�Fault�in�Hamilton�County�(McLaughlin,�1943)� and�2)� study�of� the�Crooked�Creek� and�Fowler
Figure 7. Structure-contour map showing elevation oftop of the Y-anhydrite in the Great Plains Reservoirsarea.
Figure 8. Structure-contour map showing elevation oftop of the Blaine Formation in the Great Plains Reser-voirs area.
342 Kenneth S. Johnson

Faults in Meade County (Gutentag and others, 1981).Similar resultswere observed in a study of salt dissolutionand sinkholes in the Sharon Springs–Wallace area ofWallace County (Johnson, 2021).
It appears, therefore, that most of the salt dissolutionin southeast Colorado and western Kansas began duringor after Late Cretaceous time, and that certainly is possi-ble in the GPR area. Regardless of when dissolutionstarted in this area, it seems likely that it continued untilat least the late Pleistocene, or perhaps even the Holo-cene Epoch. Such late-stage (late Pleistocene/Holocene)dissolution is indicated by the major depressions stillbeing present: they would likely have been "lled andcovered by windblown or sheetwash sediment if the cur-rent depressions had formed at a much earlier time. Inaddition, it is even likely that salt is still being dissolvedin the GPR area today.
STRUCTURAL GEOLOGY
The structural geology, based upon mapping of twoexcellent marker beds, shows the results of salt dissolu-tion on local structure. A contour map on top of theY-anhydrite (Fig. 7), just below the Flowerpot Forma-tion, shows that the subsalt strata dip gently to the north-east at about 10–30 ft/mi (about one-ninth to one-thirdof one degree). There are no soluble salts beneath theY-anhydrite, so this structure map should be fairly
representative�of�underlying�strata� for� the�next�several�hundred�to,�perhaps,�several�thousand�feet.
The� structure-contour� map� on� top� of� the� Blaine�Formation,�however,�presents� a� totally�different,�more�complicated�situation�(Fig.�8).�The�Blaine�Formation�is�directly� above� the�Flowerpot�Formation,� and� thus�dis-solution�and� removal�of� some�200–245� ft�of� salt�have�caused�collapse�and�settlement�of�the�Blaine�Formation�into�the�dissolution�cavities.�Northeast�of�the�dissolution�front,�the�Blaine�dips�gently�to�the�north�at�10–30� ft/mi�(about�one-ninth�to�one-third�of�1°),�except�for�the�sev-eral�places�along�the�south�side�of�T.�19�S.,�Rs.�46–47�W.,�were�some�or�all�of�the�Flowerpot�salt�is�missing.�How-ever,�to�the�southwest,�the�top�of�the�Blaine�Formation�drops�sharply�across� the�northwest-trending�dissolution�front,�and�here�the�formation�dips�gently�to�the�northeast�at�the�same�rate�of�about�10–30� ft/mi.�If�one�were�to�look�only�at�contours�on�top�of�the�Blaine�Formation,�and�not�at�the�presence�and�absence�of�underlying�Flowerpot�salt,�one�would� probably� conclude� that� a� signi"cant� fault,�with�a� throw�of�100� to�more� than�200� ft,�separates� the�northeast�and�southwest�parts�of�the�study�area.�A�nota-ble�exception�to�the�gentle�northeast�dip�in�the�southwest�is�the�anomalous�high�of�2,368� ft�for�the�top�of�the�Blaine�in�sec.�19,�T.�20�S.,�R.�47�W.�This�anomaly�results�from�the�176-ft-thick�mass�of�undissolved�Flowerpot�salt�that�underlies�the�Blaine�at�this�site�(Fig.�4).
Figure 9. Schematic structural cross section showing: 1) Flowerpot salt dissolution front; 2) possible con!gurationof overlying strata; and 3) relationship of Neenoshe Reservoir and other major reservoirs to salt dissolution andcollapse in the Great Plains Reservoirs area.
Dissolution of the Permian Flowerpot Salt Beneath the Great Plains Reservoirs 343

ORIGIN�OF�THE�GREAT�PLAINS�RESERVOIRS
The�main�area�of�Flowerpot�salt�removal,�just�south-west�of�the�dissolution�front,�is�the�location�of�the�large,�natural�depressions� that�are�now�arti"cial� reservoirs�of�the�GPR.�Clearly,�these�natural�depressions�were�caused�by�dissolution�of�the�Flowerpot�salt�southwest�of�the�dis-solution� front� (Fig.� 9).�Dissolution� caused� foundering�and� collapse� of� all� overlying� strata,� until� the� collapse�eventually�reached�the�current�land�surface.�The�collapse�probably� was� not� uniform� in� timing� and� distribution�across� the� area,� and� thus� some� areas� have� subsided�more—and� also� more� recently—than� adjacent� areas:�this�created�the�scattered�natural�depressions�in�the�pres-ent�landscape.�It�is�possible,�and�even�likely,�that�addi-tional�patches�of� residual�Flowerpot�salt� remain� in� the�immediate�area�of� the� reservoirs,�but�sparse�drilling� in�T. 20�S.,�R.�47�W.,�makes�it�impossible�to�know.�Thereare�at�least�two�known�patches�of�residual�salt�southwestof�the�dissolution�front.�The� timing�of� this�collapse,�asmentioned�above,�is�uncertain,�but�it�probably�occurredbetween�Late�Cretaceous�and�late�Pleistocene/Holocenetime.�It�certainly�was�prior�to�settlement�of�the�area�in�thelate�1800s,�as�there�are�no�historic�reports�of�subsidenceor�collapse�in�the�GPR�area.
.PTU�of� the�major� reservoirs� in� the�GPR�have�been�developed�by�!ooding�of�two�or�more�adjacent�natural�depressions.�Examination�of�aerial�photos�of� the�area,�when�the�reservoirs�were�at�low�levels,�reveals�that�three�of�the�four�major�reservoirs�occupy�multiple�depressions�(Fig.�10).�A�photo�taken�in�1987�shows�the�reservoirs�at�near�capacity,�and�does�not�indicate�the�number�or�shape�of� individual� depressions.� However,� another� photo,�taken�in�2001,�shows�four�separate�depressions�in�Nee-sopah�Reservoir,�three�in�Neenoshe�Reservoir,�and�two�in�Neeskah�Reservoir.�A�"nal�photo�in�2016�shows�the�same�multiple� depressions� for� those� three� reservoirs,�and�also�shows� that�Neegronda�Reservoir� results� from�the�"lling�of�a�single�depression.
A�total�of�10�natural�depressions�are�used�to�impound�water�in�the�four�major�reservoirs,�and�the�perimeters�of�these� depressions� can� be� outlined� from� aerial� photos�(Fig.�11).�Neegronda�Reservoir�occupies�one� immense�depression,� whereas� the� other� three� major� reservoirs�occupy�two-to-four�contiguous�depressions.�The�approx-imate�size�of� individual�depressions� ranges�from�0.6� to�5.0�mi2� (Table�1),�making�them�some�of�the�larger�salt-dissolution/collapse� features� in� the� region.� I� could� not�"nd�data�on� the� true�depth�of� the�depressions,�although�water�depths�in�the�reservoirs,�when�full,�reportedly�range�from�13�to�25� ft.
In�addition�to�the�four�major�reservoirs,�there�are�some�smaller�reservoirs�that�are�part�of�the�GPR.�Mud�Lake,�King�Reservoir,�and�Thurston�Reservoir�are�within� the�current� study� area,� and� several� other� small� reservoirs�are� just� to� the� south.� All� of� these� reservoirs� appear
also to be natural depressions that are fed by the exten-sive GPR canal system. Study of the 1:24,000-scaletopographic maps of areas southwest of the Flowerpotsalt dissolution front shows that there aremanymore nat-ural depressions that most likely are collapse features re-sulting from salt dissolution: admittedly, some of them
Figure 10. Aerial photographs of Great Plains Reservoirsshowing outline of major reservoirs at near capacity(white lines), and actual reservoirs at various times ofphotography (photos from Google Earth). Photo Ashows reservoirs at near-capacity; photo B showssmaller reservoirs, which occupy separate natural de-pressions; and photo C shows even smaller reservoirsoccupying natural depressions.
344 Kenneth S. Johnson
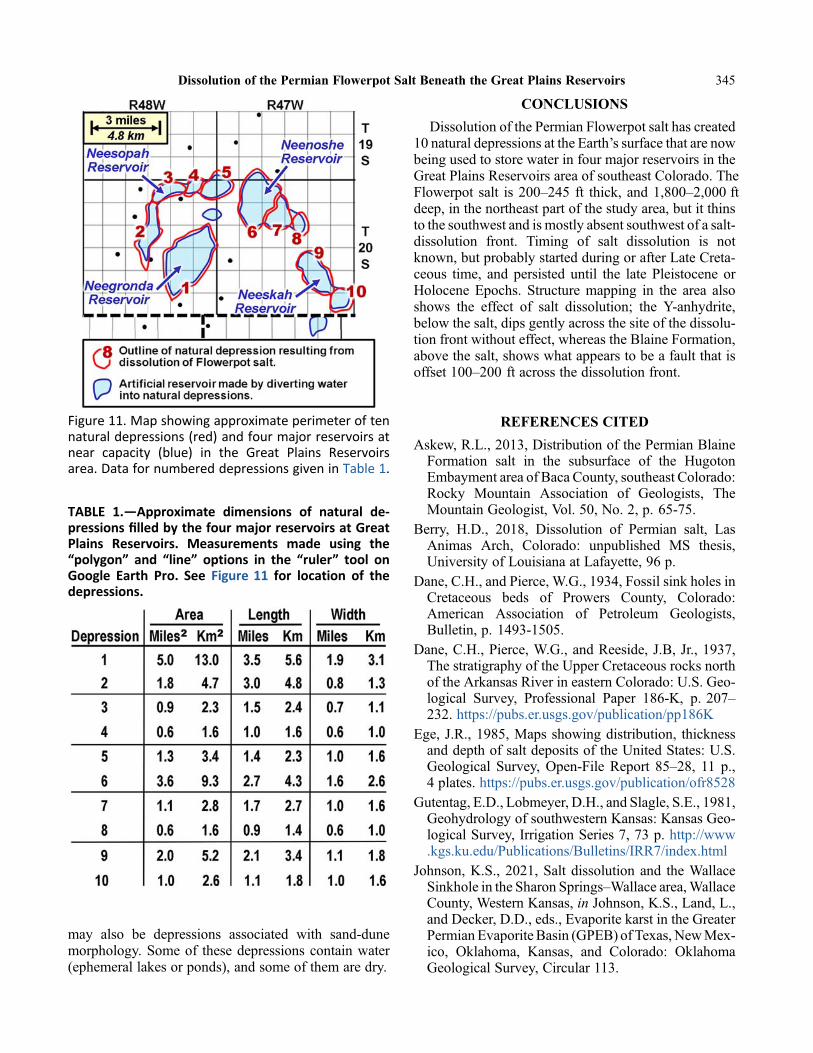
may also be depressions associated with sand-dunemorphology. Some of these depressions contain water(ephemeral lakes or ponds), and some of them are dry.
CONCLUSIONS
Dissolution�of�the�Permian�Flowerpot�salt�has�created�10�natural�depressions�at�the�Earth’s�surface�that�are�now�being�used�to�store�water�in�four�major�reservoirs�in�the�Great�Plains�Reservoirs�area�of�southeast�Colorado.�The�Flowerpot� salt� is�200–245� ft� thick,� and�1,800–2,000�ft�deep,�in�the�northeast�part�of�the�study�area,�but�it�thins�to�the�southwest�and�is�mostly�absent�southwest�of�a�salt-dissolution� front.� Timing� of� salt� dissolution� is� not�known,�but�probably�started�during�or�after�Late�Creta-ceous� time,� and� persisted� until� the� late�Pleistocene� or�Holocene�Epochs.�Structure�mapping� in� the� area� also�shows� the� effect� of� salt� dissolution;� the� Y-anhydrite,�below�the�salt,�dips�gently�across�the�site�of�the�dissolu-tion�front�without�effect,�whereas�the�Blaine�Formation,�above�the�salt,�shows�what�appears�to�be�a�fault�that�is�offset�100–200� ft�across�the�dissolution�front.
REFERENCES�CITEDAskew,�R.L.,�2013,�Distribution�of�the�Permian�BlaineFormation salt in the subsurface of the HugotonEmbayment area of Baca County, southeast Colorado:Rocky Mountain Association of Geologists, TheMountain Geologist, Vol. 50, No. 2, p. 65-75.
Berry, H.D., 2018, Dissolution of Permian salt, LasAnimas Arch, Colorado: unpublished MS thesis,University of Louisiana at Lafayette, 96 p.
Dane, C.H., and Pierce, W.G., 1934, Fossil sink holes inCretaceous beds of Prowers County, Colorado:American Association of Petroleum Geologists,Bulletin, p. 1493-1505.
Dane, C.H., Pierce, W.G., and Reeside, J.B, Jr., 1937,The stratigraphy of the Upper Cretaceous rocks northof the Arkansas River in eastern Colorado: U.S. Geo-logical Survey, Professional Paper 186-K, p. 207–232. https://pubs.er.usgs.gov/publication/pp186K
Ege, J.R., 1985, Maps showing distribution, thicknessand depth of salt deposits of the United States: U.S.Geological Survey, Open-File Report 85–28, 11 p.,4 plates. https://pubs.er.usgs.gov/publication/ofr8528
Gutentag, E.D., Lobmeyer, D.H., and Slagle, S.E., 1981,Geohydrology of southwestern Kansas: Kansas Geo-logical Survey, Irrigation Series 7, 73 p. http://www.kgs.ku.edu/Publications/Bulletins/IRR7/index.html
Johnson, K.S., 2021, Salt dissolution and the WallaceSinkhole in the Sharon Springs–Wallace area,WallaceCounty, Western Kansas, in Johnson, K.S., Land, L.,and Decker, D.D., eds., Evaporite karst in the GreaterPermian Evaporite Basin (GPEB) of Texas, NewMex-ico, Oklahoma, Kansas, and Colorado: OklahomaGeological Survey, Circular 113.
Figure 11. Map showing approximate perimeter of tennatural depressions (red) and four major reservoirs atnear capacity (blue) in the Great Plains Reservoirsarea. Data for numbered depressions given in Table 1.
TABLE 1.—Approximate dimensions of natural de-pressions !lled by the four major reservoirs at GreatPlains Reservoirs. Measurements made using the“polygon” and “line” options in the “ruler” tool onGoogle Earth Pro. See Figure 11 for location of thedepressions.
Dissolution of the Permian Flowerpot Salt Beneath the Great Plains Reservoirs 345

Johnson, W.D., 1901, The High Plains and their utiliza-tion: US Geological Survey, 21st Ann. Report, Part 4,p. 9–488. https://pubs.usgs.gov/ar/21-4/report.pdf
Macfarlane, P.A., andWilson, B.B., 2006, Enhancementof the bedrock-surface-elevation map beneath theOgallala portion of the High Plains Aquifer, westernKansas: Kansas Geological Survey, Technical Series20, 28 p. http://www.kgs.ku.edu/Publications/Bulletins/TS20/ts20.pdf
McGillis, K.A., and Presley, M.W., 1981, Tansill, Sal-ado, and Alibates Formations: Upper Permian evapo-rate/carbonate strata of the Texas Panhandle: TheUniversity of Texas at Austin, Bureau of EconomicGeology, Geological Circular 81–8, 31 p.
McLaughlin, T.G., 1943, Geology and ground-water re-sources of Hamilton and Kearny Counties, Kansas:Kansas Geological Survey, Bulletin 49, 220 p.http://www.kgs.ku.edu/General/Geology/Hamilton/index.html
Merriam, D.F., 1963, The geologic history of Kansas:Kansas Geological Survey, Bulletin 162, 317 p.http://www.kgs.ku.edu/Publications/Bulletins/162/index.html
Merriam D.F., and Mann, C.J., 1957, Sinkholes andrelated geologic features in Kansas: Kansas Academy
of Science, Transactions, Vol. 60, No. 3, p. 207-243.https://digital.lib.usf.edu/SFS0054165/00001
Newell, F.H., 1901, Report of progress of stream meas-urements for the calendar year 1899: U.S. GeologicalSurvey, 21st Ann. Report, Part 4, p. 601-741. https://pubs.usgs.gov/ar/21-4/report.pdf
Schoewe, W.H., 1949, The geography of Kansas, part 2,physical geography (geology): Kansas Academy ofSciences, Transactions, Vol. 52, No. 3, p. 261-333.
Sharps, J.A., 1976, Geologic map of the Lamar quadran-gle, Colorado and Kansas: U.S. Geological Survey,Miscellaneous Investigations Series Map I–944, scale1:250,000. https://ngmdb.usgs.gov/Prodesc/proddesc_9832.htm
Voegeli, P.T., and Hershey, L.A., 1965, Geology andground-water resources of Prowers County, Colorado:U.S. Geological Survey, Water Supply Paper 1772,101 p. https://pubs.er.usgs.gov/publication/wsp1772
Zambito, J.J., Benison, K.C., Foster, T.M., Soreghan,G.S., Soreghan, M.J., and Kane, M., 2012, Lithostra-tigraphy of Permian red beds and evaporites in the Re-becca K. Bounds core, Greeley County, Kansas:Kansas Geological Survey, Open-File Report 2012–15, 45 p. http://www.kgs.ku.edu/Publications/OFR/2012/OFR12_15/KGS_OF_2012-15.pdf
346 Kenneth S. Johnson


![genetic variation of norway spruce (picea abies [l.] karst ...](https://static.fdokumen.com/doc/165x107/633d6582b988f9753c06267d/genetic-variation-of-norway-spruce-picea-abies-l-karst-.jpg)